HAL Id: hal-01603709 https://hal.archives-ouvertes.fr/hal-01603709 Submitted on 5 Jun 2020 HAL is a multi-disciplinary open access archive for the deposit and dissemination of sci- entific research documents, whether they are pub- lished or not. The documents may come from teaching and research institutions in France or abroad, or from public or private research centers. L’archive ouverte pluridisciplinaire HAL, est destinée au dépôt et à la diffusion de documents scientifiques de niveau recherche, publiés ou non, émanant des établissements d’enseignement et de recherche français ou étrangers, des laboratoires publics ou privés. Distributed under a Creative Commons Attribution - ShareAlike| 4.0 International License The EVOLTREE repository centre. A central access point for reference material and data of forest genetic resources Michael Stierschneider, Stephan Gaubitzer, Schmidt Johanna, Otto Weichselbaum, Dieter Kopecky, Antoine Kremer, Silvia Fluch, Eva Maria Sehr To cite this version: Michael Stierschneider, Stephan Gaubitzer, Schmidt Johanna, Otto Weichselbaum, Dieter Kopecky, et al.. The EVOLTREE repository centre. A central access point for reference material and data of forest genetic resources. Evolution of trees and forest communities, PG Edition, 175 p., 2016, 978-2-9519296-3-9. hal-01603709

Welcome message from author
This document is posted to help you gain knowledge. Please leave a comment to let me know what you think about it! Share it to your friends and learn new things together.
Transcript
HAL Id: hal-01603709https://hal.archives-ouvertes.fr/hal-01603709
Submitted on 5 Jun 2020
HAL is a multi-disciplinary open accessarchive for the deposit and dissemination of sci-entific research documents, whether they are pub-lished or not. The documents may come fromteaching and research institutions in France orabroad, or from public or private research centers.
L’archive ouverte pluridisciplinaire HAL, estdestinée au dépôt et à la diffusion de documentsscientifiques de niveau recherche, publiés ou non,émanant des établissements d’enseignement et derecherche français ou étrangers, des laboratoirespublics ou privés.
Distributed under a Creative Commons Attribution - ShareAlike| 4.0 InternationalLicense
The EVOLTREE repository centre. A central accesspoint for reference material and data of forest genetic
resourcesMichael Stierschneider, Stephan Gaubitzer, Schmidt Johanna, Otto
Weichselbaum, Dieter Kopecky, Antoine Kremer, Silvia Fluch, Eva Maria Sehr
To cite this version:Michael Stierschneider, Stephan Gaubitzer, Schmidt Johanna, Otto Weichselbaum, Dieter Kopecky,et al.. The EVOLTREE repository centre. A central access point for reference material and dataof forest genetic resources. Evolution of trees and forest communities, PG Edition, 175 p., 2016,978-2-9519296-3-9. �hal-01603709�

EVOLUTION OF TREESas drivers of terrestrial biodiversity
A EUROPEAN RESEARCH GROUP
linking
Evolution
Genomics GEcology
enetics
EEE
e
Ec
GEGGEv
eneti E ology cEEcGGenomics
voluEEc
linking
A EUROPEAN RESEARCH GROUP
enetics ology
enomics
volution
linking
A EUROPEAN RESEARCH GROUP
as drivUTION OF
trial biodiveserrers of tas drivOLEV TREES
ersitytrial biodivUTION OF
Dolores Abarca
Sally N. Aitken
Florian J. Alberto
Ricardo Alía
Catherine Bastien
Thomas Bataillon
Egbert Beuker
Gil Bohrer
Thomas Boivin
Aurore Bontemps
Roland Brandl
Katharina Bräutigam
Jon R. Bridle
Christian Brochmann
Carlo Calfapietra
Malcolm M. Campbell
Bastien Castagneyrol
Stephen Cavers
María-Teresa Cervera
Jean-Louis Churin
Cyrille Conord
François Courbet
Pierre-Emmanuel Courty
Hendrik Davi
Paolo De Angelis
Carmen Díaz-Sala
Marion Durand-Gillmann
François Ehrenmann
Bruno Fady
Mario Fernández Fraga
Silvia Fluch
Carl G. Fossdal
Alain Franc
Stephan Gaubitzer
Julie Gauzere
Sophie Gerber
Cindy Gidoin
Richard Gomulkiewicz
Santiago C. González-Martínez
Delphine Grivet
M. Ángeles Guevara
Felix Gugerli
Frédéric Guillaume
Jessica Gurevitch
José Gutiérrez Marcos
Heikki Hänninen
Stephanie Hayes
Hervé Jactel
Øystein Johnsen
Marie-Joe Karam
David F. Karnosky
Etienne K. Klein
Hans-Peter Koelewijn
Annegret Kohler
Dieter Kopecky
Jan Kowalczyk
Antoine Kremer
Anna Kuparinen
Jessy Labbé
Clément Lafon-Placette
Hadrien Lalagu ̈eMałgorzata Latałowa
François Le Tacon
François Lefèvre
Thomas Lenormand
Yunan Lin
Benoit Marçais
Francis Martin
Jan Matras
Stéphane Maury
Franco Miglietta
Marie Mirouze
Ran Nathan
Sylvie Oddou-Muratorio
Christophe Orazio
Martina Peter
Christian Pichot
Karin Pritsch
Kermit Ritland
Juan J. Robledo-Arnuncio
Alistair Rogers
Antje Rohde
Ophélie Ronce
Outi Savolainen
Johanna Schmidt
Hilke Schröder
Silvio Schueler
Federico Sebastiani
Eva Maria Sehr
Marinus J.M. Smulders
Christoph Sperisen
Michael Stierschneider
Steven H. Strauss
Nathaniel R. Street
Matthew James Tallis
Gail Taylor
Mari Mette Tollefsrud
Sara Torre
Inge van Halder
Giovanni G. Vendramin
Marc Villar
Kelly J. Vining
Willem O. van der Knaap
Otto Weichselbaum
Ross Whetten
Sam Yeaman
Mario Zabal-Aguirre
Jing Zhang
Birgit Ziegenhagen
Martin Ziehe
AUTHORS
Photos: Fotolia, Bioversity, EFIATLANTIC, EVOLTREE.
Citation: Antoine Kremer, Stephanie Hayes and Santiago C. González-Martínez, Editors (2016). Evolution of Trees and Forest Communities: Ten Years of the EVOLTREE network. Document prepared by the EVOLTREE network. PG Edition - Bordeaux.192 pages
ED. IEFC ISBN : 978-2-9519296-3-9
To find out more about EVOLTREE and how to get involved in its activities
or make the use of its services,please consult the website:
www.evoltree.eu
1
ONTENTSC
AUTHORS........................................................................................................Cover 2
FOREWORD................................................................................................................2
INTRODUCTION ........................................................................................................3
EVOLTREE INFRASTRUCTURES, RESOURCES AND INITIATIVES ......4
Intensive Study Sites (ISS)......................................................................................6
Repository Centre .................................................................................................10
eLab.......................................................................................................................15
Training.................................................................................................................20
TreeType ...............................................................................................................23
RESEARCH HIGHLIGHTS: SCIENCE THAT MATTERS..............................26
Potential for evolutionary responses to climate change -
evidence from tree populations ..............................................................................27
Epigenetic regulation of adaptive responses of forest tree species
to the environment ................................................................................................45
Large-scale longitudinal gradients of genetic diversity: a meta-analysis across
six phyla in the Mediterranean basin ........................................................................61
Effect of poplar genotypes on mycorrhizal infection and secreted enzyme
activities in mycorrhizal and non-mycorrhizal roots ..............................................................75
Molecular footprints of local adaptation in two Mediterranean conifers ...................88
Community genetics in the time of next‐generation molecular technologies..........105
Long-distance gene flow and adaptation of forest trees to rapid climate change...........115
Considering evolutionary processes in adaptive forestry............................................133
The transcriptome of Populus in elevated CO2 reveals increased anthocyanin
biosynthesis during delayed autumnal senescence. .....................................................150
Late Quaternary history of North Eurasian Norway spruce (Picea abies)and Siberian spruce (Picea obovata) inferred from macrofossils,
pollen and cytoplasmic DNA variation...........................................................................164
EVOLTREE PARTNERS........................................................................................175
22
OREWORD
EVOLTREE is ten years old this year (2016); but the idea of a
European network in forest genetics dates well back before
2006. All current forest research involving genetics or
genomics is transnational and it has become progressively apparent
that better coordination of efforts and means is necessary if these
issues are to be adequately addressed on a European level.
The forest genetics research community had felt the same need for a
long time, but did not make the most of European Union funding
opportunities at the beginning of the eighties.
It is unfortunate that pan-European initiatives, such as the comparison
of provenances in plantations in the fifties and sixties, were not
coordinated on a long-lasting scale in order to be able to answer
current questions on assisted migration.
This historic reference highlights the necessity of coordinating
research on forest genetics on a European level. The example of
provenance tests is a past illustration of current needs in terms of
means sharing in the field of genomics, the accessibility of as much
biological and electronic resources as possible and the coordination
of research efforts.
It is EVOLTREE’s aim to rise up to this challenge. And since its creation
ten years ago, this aim has been reaffirmed from year to year. We wish
to celebrate the tenth anniversary by sharing the knowledge and
results that we have accumulated during this period.
This book contains a selection of ten articles from the 165 listed on the
Web of Science, which have been funded either by the EVOLTREE
network of by other EVOLTREE initiatives, such as FORESTTRAC. It
also describes the main physical and electronic infrastructures and
other resources and initiatives, from which the forest genetics research
community, in particular the network’s present members can benefit.
ANTOINE KREMER EVOLTREE Network Coordinator
NTRODUCTION
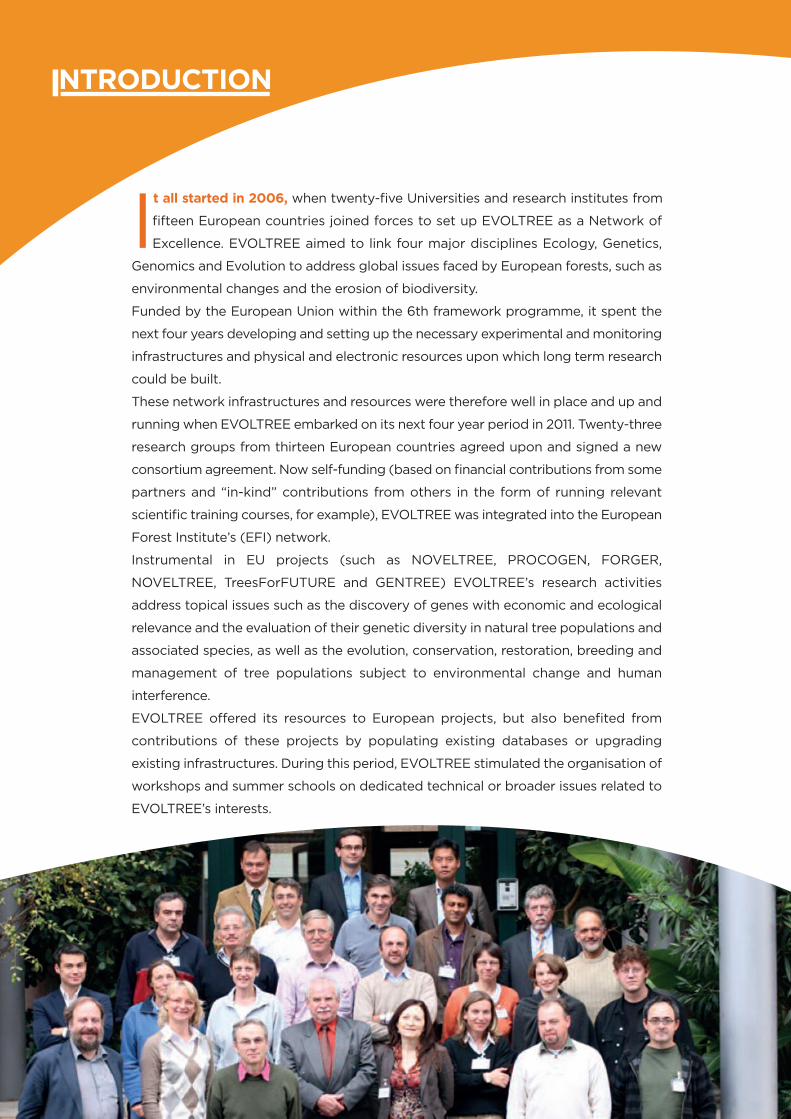
It all started in 2006, when twenty-five Universities and research institutes from
fifteen European countries joined forces to set up EVOLTREE as a Network of
Excellence. EVOLTREE aimed to link four major disciplines Ecology, Genetics,
Genomics and Evolution to address global issues faced by European forests, such as
environmental changes and the erosion of biodiversity.
Funded by the European Union within the 6th framework programme, it spent the
next four years developing and setting up the necessary experimental and monitoring
infrastructures and physical and electronic resources upon which long term research
could be built.
These network infrastructures and resources were therefore well in place and up and
running when EVOLTREE embarked on its next four year period in 2011. Twenty-three
research groups from thirteen European countries agreed upon and signed a new
consortium agreement. Now self-funding (based on financial contributions from some
partners and “in-kind” contributions from others in the form of running relevant
scientific training courses, for example), EVOLTREE was integrated into the European
Forest Institute’s (EFI) network.
Instrumental in EU projects (such as NOVELTREE, PROCOGEN, FORGER,
NOVELTREE, TreesForFUTURE and GENTREE) EVOLTREE’s research activities
address topical issues such as the discovery of genes with economic and ecological
relevance and the evaluation of their genetic diversity in natural tree populations and
associated species, as well as the evolution, conservation, restoration, breeding and
management of tree populations subject to environmental change and human
interference.
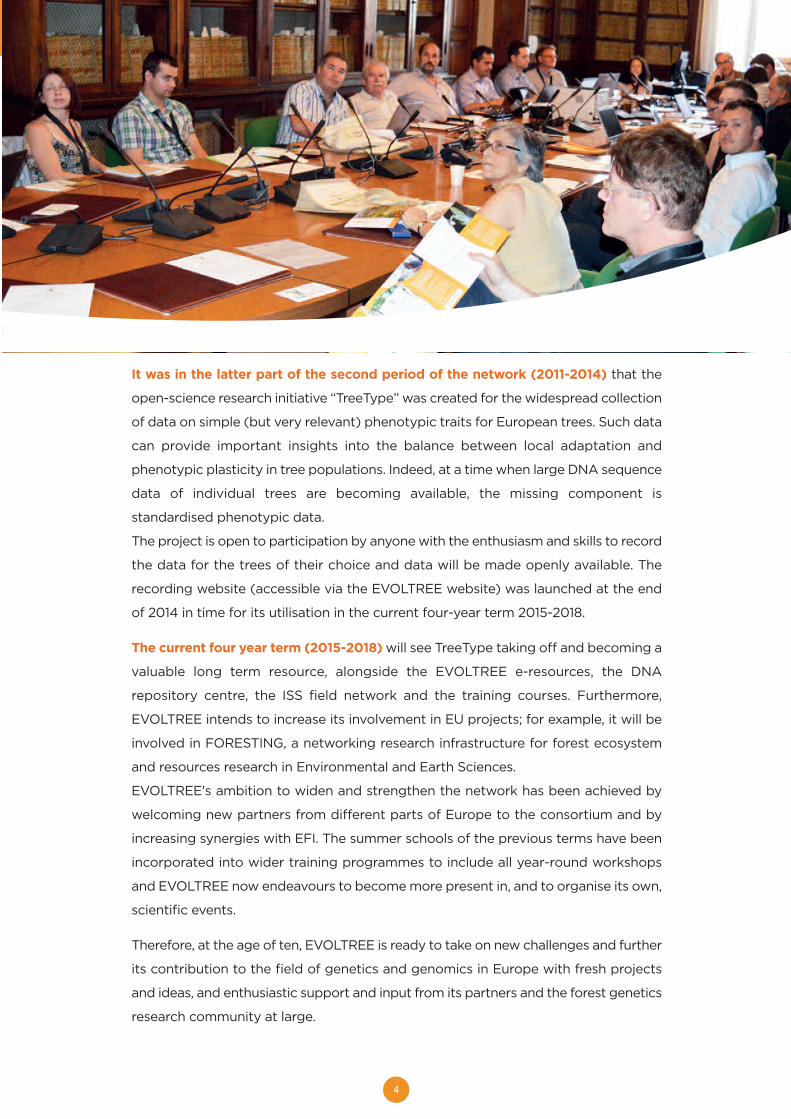
EVOLTREE offered its resources to European projects, but also benefited from
contributions of these projects by populating existing databases or upgrading
existing infrastructures. During this period, EVOLTREE stimulated the organisation of
workshops and summer schools on dedicated technical or broader issues related to
EVOLTREE’s interests.
4
It was in the latter part of the second period of the network (2011-2014) that the
open-science research initiative “TreeType” was created for the widespread collection
of data on simple (but very relevant) phenotypic traits for European trees. Such data
can provide important insights into the balance between local adaptation and
phenotypic plasticity in tree populations. Indeed, at a time when large DNA sequence
data of individual trees are becoming available, the missing component is
standardised phenotypic data.
The project is open to participation by anyone with the enthusiasm and skills to record
the data for the trees of their choice and data will be made openly available. The
recording website (accessible via the EVOLTREE website) was launched at the end
of 2014 in time for its utilisation in the current four-year term 2015-2018.
The current four year term (2015-2018) will see TreeType taking off and becoming a
valuable long term resource, alongside the EVOLTREE e-resources, the DNA
repository centre, the ISS field network and the training courses. Furthermore,
EVOLTREE intends to increase its involvement in EU projects; for example, it will be
involved in FORESTING, a networking research infrastructure for forest ecosystem
and resources research in Environmental and Earth Sciences.
EVOLTREE's ambition to widen and strengthen the network has been achieved by
welcoming new partners from different parts of Europe to the consortium and by
increasing synergies with EFI. The summer schools of the previous terms have been
incorporated into wider training programmes to include all year-round workshops
and EVOLTREE now endeavours to become more present in, and to organise its own,
scientific events.
Therefore, at the age of ten, EVOLTREE is ready to take on new challenges and further
its contribution to the field of genetics and genomics in Europe with fresh projects
and ideas, and enthusiastic support and input from its partners and the forest genetics
research community at large.

EVOLTREE infrastructures, resources and initiatives
6
Background and objectives of the ISS infrastructureThe recent revolution in high throughput technologies andmethods in genetics has drastically changed the researchperspectives and practices in ecology and evolutionarysciences. The availability of large genetic datasets, for abroad range of species far beyond the few so-called“model species”, together with the development ofappropriate analytical tools, has transformed the genomesof living forms into immeasurable sources of informationon the ecological and evolutionary processes that shapedbiodiversity, at different spatial and temporal scales.
A side effect of this revolution has been the emergence ofcommon tools and methods shared by different branchesof life sciences that had previously tended to diverge, suchas genomics, population genetics, quantitative genetics,functional ecology and community ecology. All theseinterconnected disciplines were represented withinEVOLTREE.
The EVOLTREE scientific community recognised theconsiderable advance in forest genetics and ecologybased on these tools and methods. However, the projectsthat followed these different lines of research wereconducted independently from each other, highlightingthe need for shared experimental infrastructures. By usingshared infrastructures it is possible to accumulate geneticinformation from trees and their associated species withenvironmental data and other information of interestcollected in different projects. They also help to addressthe effects of ecological processes and human activitieson forest systems on the relevant spatial scales.
Furthermore, the EVOLTREE scientists were convincedthat innovative knowledge integration across disciplines
often occurs a posteriori and does not always result froma priori planning. Thus, setting up adequate tools forsharing the information acquired by different researchgroups within the same experimental field sites seemed tobe a priority.
INTENSIVE STUDY SITES
F. LEFÈVRE1, C. PICHOT1, E. BEUKER2, J. KOWALCZYK3,J. MATRAS3, M. ZIEHE4, M. VILLAR5, M. PETER6,F. GUGERLI6, C. ORAZIO7, R. CORDERO7, R. ALIA8, I. VANHALDER9, S. C. GONZÁLEZ-MARTÍNEZ9, A. KREMER9.
1 URFM, INRA, 84914 Avignon, France; 2 LUKE, 58450 Punkaharju, Finland; 3 Dept. of Silviculture and Genetics of Forest Trees, IBL, 05-090 Raszyn,Poland; 4 Dept. of Forest Genetics and Forest Tree Breeding, University ofGoettingen, 37077 Goettingen, Germany; 5 AGPF, INRA, 45075 Orléans, France;6 WSL Swiss Federal Research Institute, 8903 Birmensdorf, Switzerland; 7 EFIATLANTIC, 33610 Cestas, France; 8 CIFOR, INIA, 28040 Madrid, Spain; 9 BIOGECO, INRA, University of Bordeaux, 33612 Cestas, France.
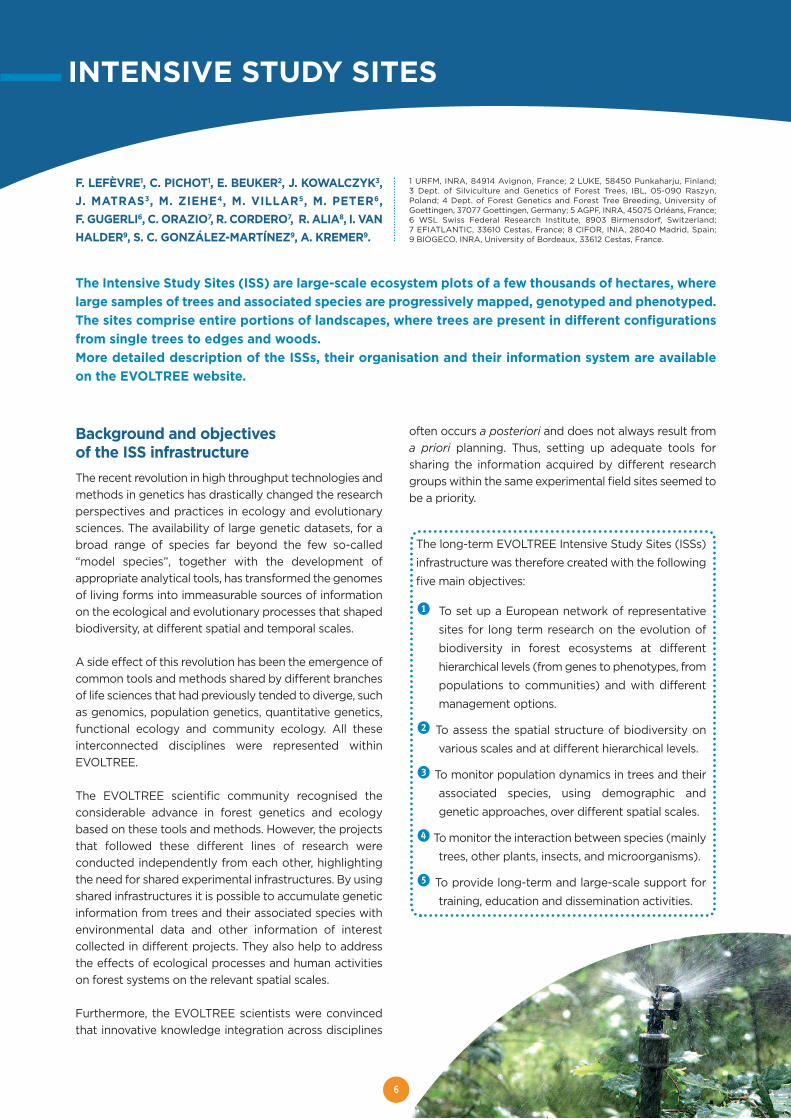
The Intensive Study Sites (ISS) are large-scale ecosystem plots of a few thousands of hectares, wherelarge samples of trees and associated species are progressively mapped, genotyped and phenotyped.The sites comprise entire portions of landscapes, where trees are present in different configurationsfrom single trees to edges and woods. More detailed description of the ISSs, their organisation and their information system are availableon the EVOLTREE website.
The long-term EVOLTREE Intensive Study Sites (ISSs)
infrastructure was therefore created with the following
five main objectives:
1 To set up a European network of representative
sites for long term research on the evolution of
biodiversity in forest ecosystems at different
hierarchical levels (from genes to phenotypes, from
populations to communities) and with different
management options.
2 To assess the spatial structure of biodiversity on
various scales and at different hierarchical levels.
3 To monitor population dynamics in trees and their
associated species, using demographic and
genetic approaches, over different spatial scales.
4To monitor the interaction between species (mainly
trees, other plants, insects, and microorganisms).
5 To provide long-term and large-scale support for
training, education and dissemination activities.
7
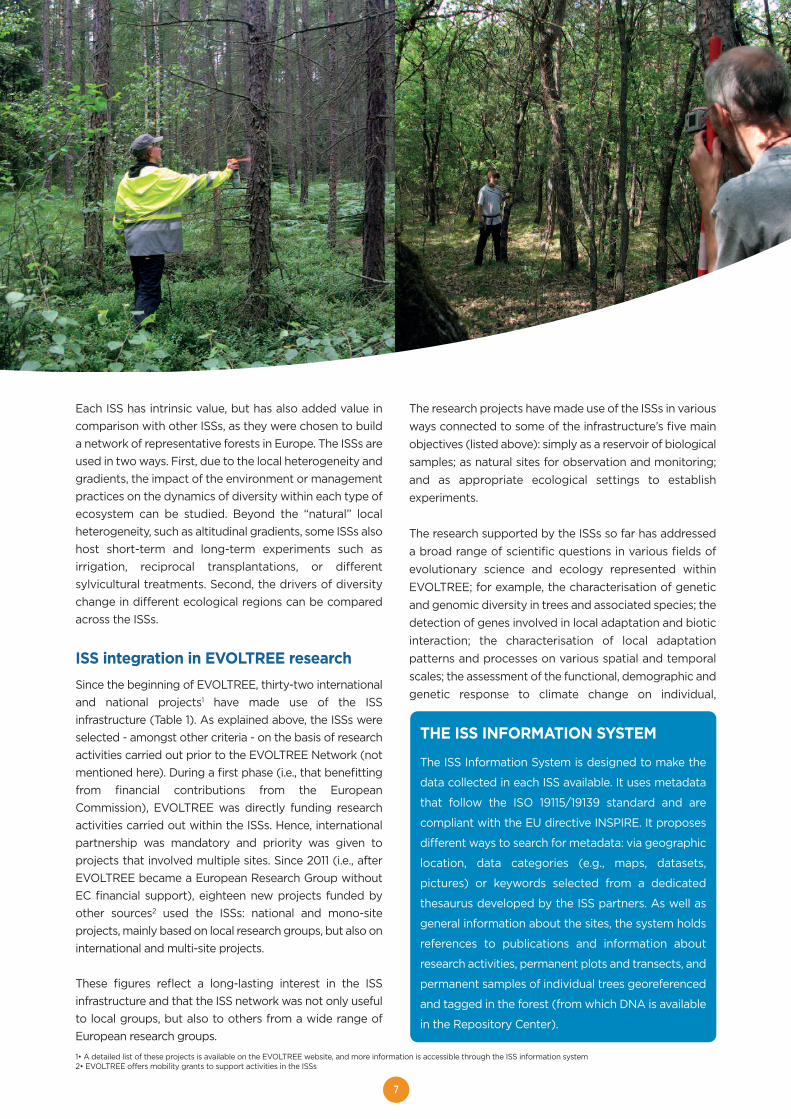
Each ISS has intrinsic value, but has also added value incomparison with other ISSs, as they were chosen to builda network of representative forests in Europe. The ISSs areused in two ways. First, due to the local heterogeneity andgradients, the impact of the environment or managementpractices on the dynamics of diversity within each type ofecosystem can be studied. Beyond the “natural” localheterogeneity, such as altitudinal gradients, some ISSs alsohost short-term and long-term experiments such asirrigation, reciprocal transplantations, or differentsylvicultural treatments. Second, the drivers of diversitychange in different ecological regions can be comparedacross the ISSs.
ISS integration in EVOLTREE researchSince the beginning of EVOLTREE, thirty-two internationaland national projects1 have made use of the ISSinfrastructure (Table 1). As explained above, the ISSs wereselected - amongst other criteria - on the basis of researchactivities carried out prior to the EVOLTREE Network (notmentioned here). During a first phase (i.e., that benefittingfrom financial contributions from the EuropeanCommission), EVOLTREE was directly funding researchactivities carried out within the ISSs. Hence, internationalpartnership was mandatory and priority was given toprojects that involved multiple sites. Since 2011 (i.e., afterEVOLTREE became a European Research Group withoutEC financial support), eighteen new projects funded byother sources2 used the ISSs: national and mono-siteprojects, mainly based on local research groups, but also oninternational and multi-site projects.
These figures reflect a long-lasting interest in the ISSinfrastructure and that the ISS network was not only usefulto local groups, but also to others from a wide range ofEuropean research groups.
The research projects have made use of the ISSs in variousways connected to some of the infrastructure’s five mainobjectives (listed above): simply as a reservoir of biologicalsamples; as natural sites for observation and monitoring;and as appropriate ecological settings to establishexperiments.
The research supported by the ISSs so far has addresseda broad range of scientific questions in various fields ofevolutionary science and ecology represented withinEVOLTREE; for example, the characterisation of geneticand genomic diversity in trees and associated species; thedetection of genes involved in local adaptation and bioticinteraction; the characterisation of local adaptationpatterns and processes on various spatial and temporalscales; the assessment of the functional, demographic andgenetic response to climate change on individual,
THE ISS INFORMATION SYSTEM
The ISS Information System is designed to make the
data collected in each ISS available. It uses metadata
that follow the ISO 19115/19139 standard and are
compliant with the EU directive INSPIRE. It proposes
different ways to search for metadata: via geographic
location, data categories (e.g., maps, datasets,
pictures) or keywords selected from a dedicated
thesaurus developed by the ISS partners. As well as
general information about the sites, the system holds
references to publications and information about
research activities, permanent plots and transects, and
permanent samples of individual trees georeferenced
and tagged in the forest (from which DNA is available
in the Repository Center).
1• A detailed list of these projects is available on the EVOLTREE website, and more information is accessible through the ISS information system2• EVOLTREE offers mobility grants to support activities in the ISSs
8
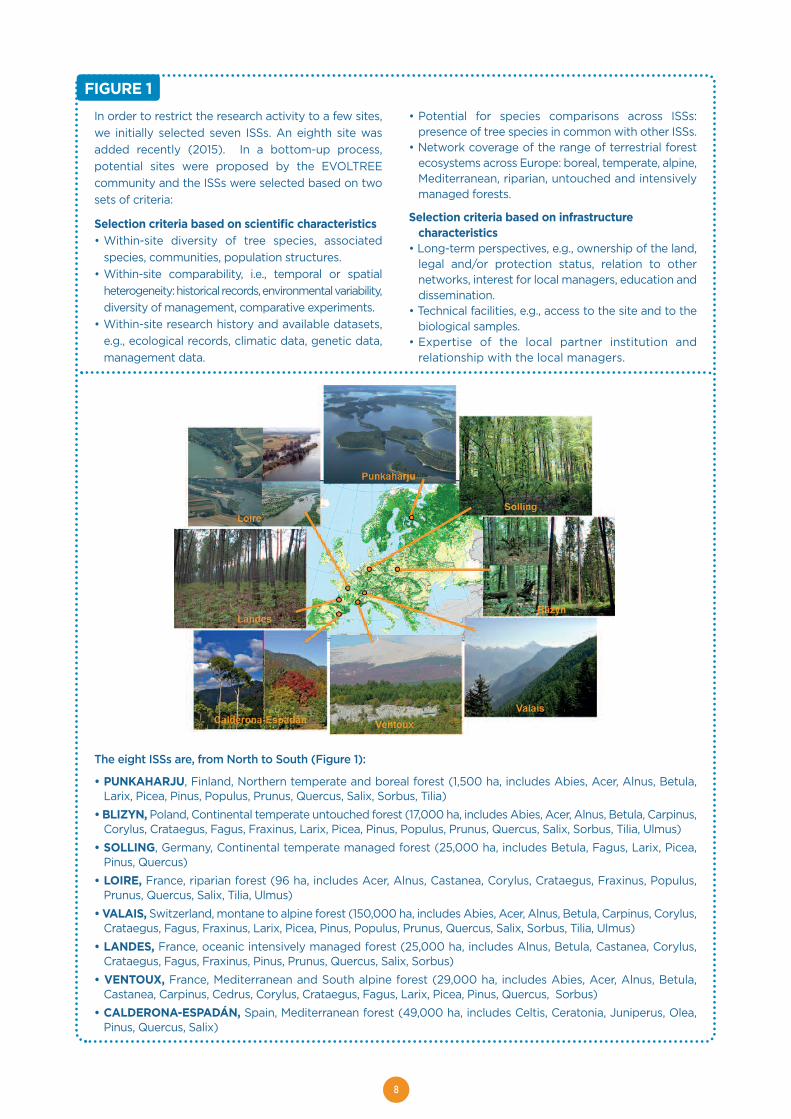
FIGURE 1 In order to restrict the research activity to a few sites,we initially selected seven ISSs. An eighth site wasadded recently (2015). In a bottom-up process,potential sites were proposed by the EVOLTREEcommunity and the ISSs were selected based on twosets of criteria:
Selection criteria based on scientific characteristics• Within-site diversity of tree species, associated
species, communities, population structures.• Within-site comparability, i.e., temporal or spatial
heterogeneity: historical records, environmental variability,diversity of management, comparative experiments.
• Within-site research history and available datasets,e.g., ecological records, climatic data, genetic data,management data.
• Potential for species comparisons across ISSs:presence of tree species in common with other ISSs.
• Network coverage of the range of terrestrial forestecosystems across Europe: boreal, temperate, alpine,Mediterranean, riparian, untouched and intensivelymanaged forests.
Selection criteria based on infrastructurecharacteristics
• Long-term perspectives, e.g., ownership of the land,legal and/or protection status, relation to othernetworks, interest for local managers, education anddissemination.
• Technical facilities, e.g., access to the site and to thebiological samples.
• Expertise of the local partner institution andrelationship with the local managers.
The eight ISSs are, from North to South (Figure 1):
• PUNKAHARJU, Finland, Northern temperate and boreal forest (1,500 ha, includes Abies, Acer, Alnus, Betula,Larix, Picea, Pinus, Populus, Prunus, Quercus, Salix, Sorbus, Tilia)
• BLIZYN, Poland, Continental temperate untouched forest (17,000 ha, includes Abies, Acer, Alnus, Betula, Carpinus,Corylus, Crataegus, Fagus, Fraxinus, Larix, Picea, Pinus, Populus, Prunus, Quercus, Salix, Sorbus, Tilia, Ulmus)
• SOLLING, Germany, Continental temperate managed forest (25,000 ha, includes Betula, Fagus, Larix, Picea,Pinus, Quercus)
• LOIRE, France, riparian forest (96 ha, includes Acer, Alnus, Castanea, Corylus, Crataegus, Fraxinus, Populus,Prunus, Quercus, Salix, Tilia, Ulmus)
• VALAIS, Switzerland, montane to alpine forest (150,000 ha, includes Abies, Acer, Alnus, Betula, Carpinus, Corylus,Crataegus, Fagus, Fraxinus, Larix, Picea, Pinus, Populus, Prunus, Quercus, Salix, Sorbus, Tilia, Ulmus)
• LANDES, France, oceanic intensively managed forest (25,000 ha, includes Alnus, Betula, Castanea, Corylus,Crataegus, Fagus, Fraxinus, Pinus, Prunus, Quercus, Salix, Sorbus)
• VENTOUX, France, Mediterranean and South alpine forest (29,000 ha, includes Abies, Acer, Alnus, Betula,Castanea, Carpinus, Cedrus, Corylus, Crataegus, Fagus, Larix, Picea, Pinus, Quercus, Sorbus)
• CALDERONA-ESPADÁN, Spain, Mediterranean forest (49,000 ha, includes Celtis, Ceratonia, Juniperus, Olea,Pinus, Quercus, Salix)

9
population and community levels; and the modeling ofadaptive processes and responses to managementpractices. The ISSs also support projects developingmultidisciplinary approaches with other scientific fields,including environmental and social sciences.
What will the future bring?The use of the ISSs as a research infrastructure has comeof age. Beyond its role in supporting national researchprojects, the ISS infrastructure will continue to strengthenthe long-lasting integration of research in the field of forestgenetics and genomics on the pan-European level, e.g., viathe H2020 research and innovation project GENTREE3
“Optimising the management and sustainable use of forestgenetic resources in Europe” (2016-2020). Moreover,projects linking the ISSs with other long-term researchinfrastructures on forest ecology are underway, thusproviding wider integration of multi-disciplinaryknowledge on forest ecosystems on a pan-European scale.
An innovative use of the infrastructure is planned in theparticipative project TreeType4, in which citizens,
researchers or forest managers can contribute tocollecting phenotypic data on individual trees, aiming tocharacterise the phenotypic variation in the forest. Thesedata will then be analysed by the scientists to provideinformation on the genetic basis of traits and create adatabase for future research. This initiative will alsosupport training and dissemination activities by providingeasy-to-use protocols and tools to study adaptation in thewild that can be used as educational materials.
One of the major challenges for the future will be toassemble and share the extensive knowledge, results andoriginal data that have been generated in the ISSsthroughout the years. This contribution to “Open Science”will be facilitated by the regularly updated ISS informationsystem (see Box) leading to the publication of datasets indata papers for the benefit of scientific progress.
ISS COORDINATIONA Framework of Agreement defines the organisation ofthe ISSs, data and metadata supply and access policy.Each ISS has a local coordinator in charge of managingthe ISS Information System and facilitating researchactivities, by interacting with local managers or helpingwith local logistics. In order to be able to access theinfrastructure resources (data, samples, experiments),partners must accept the Agreement and contact theISS coordinator before submitting the project.
Number of projects conducted in the ISS since the beginning of EVOLTREE
Mono-site Multi-siteprojects projects
EVOLTREE Phase I (2006-2010)International partnership 3 10EVOLTREE Phase II (2011-current)International partnership 3 4National partnership 11 0TOTAL (2006-current)International partnership 6 14National partnership 11 0
TABLE 1
3• Project website not yet available, see http://cordis.europa.eu/project/rcn/200286_en.html4• www.treetype.org/, see specific review in this volume
All photos: EVOLTREE partners
10
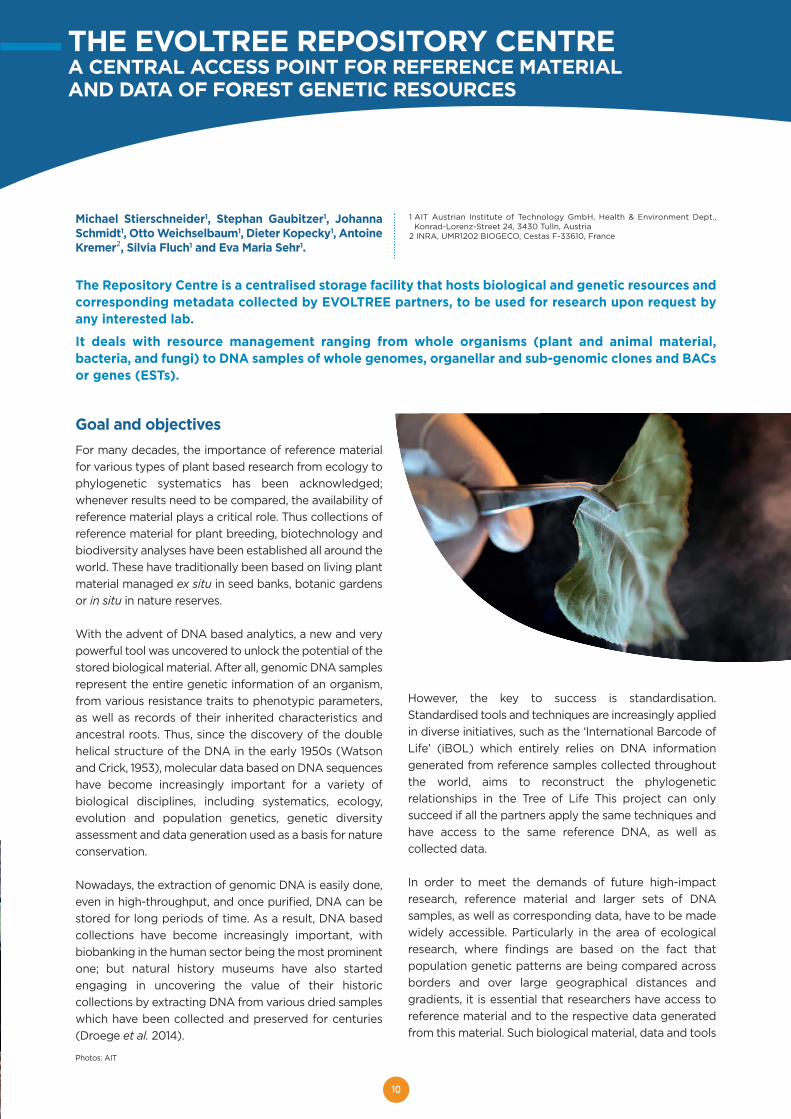
Goal and objectivesFor many decades, the importance of reference materialfor various types of plant based research from ecology tophylogenetic systematics has been acknowledged;whenever results need to be compared, the availability ofreference material plays a critical role. Thus collections ofreference material for plant breeding, biotechnology andbiodiversity analyses have been established all around theworld. These have traditionally been based on living plantmaterial managed ex situ in seed banks, botanic gardensor in situ in nature reserves.
With the advent of DNA based analytics, a new and verypowerful tool was uncovered to unlock the potential of thestored biological material. After all, genomic DNA samplesrepresent the entire genetic information of an organism,from various resistance traits to phenotypic parameters,as well as records of their inherited characteristics andancestral roots. Thus, since the discovery of the doublehelical structure of the DNA in the early 1950s (Watsonand Crick, 1953), molecular data based on DNA sequenceshave become increasingly important for a variety ofbiological disciplines, including systematics, ecology,evolution and population genetics, genetic diversityassessment and data generation used as a basis for natureconservation.
Nowadays, the extraction of genomic DNA is easily done,even in high-throughput, and once purified, DNA can bestored for long periods of time. As a result, DNA basedcollections have become increasingly important, withbiobanking in the human sector being the most prominentone; but natural history museums have also startedengaging in uncovering the value of their historiccollections by extracting DNA from various dried sampleswhich have been collected and preserved for centuries(Droege et al. 2014).
THE EVOLTREE REPOSITORY CENTREA CENTRAL ACCESS POINT FOR REFERENCE MATERIAL AND DATA OF FOREST GENETIC RESOURCES
Michael Stierschneider1, Stephan Gaubitzer1, JohannaSchmidt1, Otto Weichselbaum1, Dieter Kopecky1, AntoineKremer², Silvia Fluch1 and Eva Maria Sehr1.
1 AIT Austrian Institute of Technology GmbH, Health & Environment Dept.,Konrad-Lorenz-Street 24, 3430 Tulln, Austria
2 INRA, UMR1202 BIOGECO, Cestas F-33610, France
The Repository Centre is a centralised storage facility that hosts biological and genetic resources andcorresponding metadata collected by EVOLTREE partners, to be used for research upon request byany interested lab.
It deals with resource management ranging from whole organisms (plant and animal material,bacteria, and fungi) to DNA samples of whole genomes, organellar and sub-genomic clones and BACsor genes (ESTs).
However, the key to success is standardisation.Standardised tools and techniques are increasingly appliedin diverse initiatives, such as the ‘International Barcode ofLife’ (iBOL) which entirely relies on DNA informationgenerated from reference samples collected throughoutthe world, aims to reconstruct the phylogeneticrelationships in the Tree of Life This project can onlysucceed if all the partners apply the same techniques andhave access to the same reference DNA, as well ascollected data.
In order to meet the demands of future high-impactresearch, reference material and larger sets of DNAsamples, as well as corresponding data, have to be madewidely accessible. Particularly in the area of ecologicalresearch, where findings are based on the fact thatpopulation genetic patterns are being compared acrossborders and over large geographical distances andgradients, it is essential that researchers have access toreference material and to the respective data generatedfrom this material. Such biological material, data and tools
Photos: AIT
11
are needed in a standardised and freely accessible way inorder to guarantee comparability of research results acrossEurope. When dealing with forest trees, sample collectionis a laborious and time-consuming task, involving longtrips to remote areas, as well as dangerous or difficultsituations when accessing the material (e.g., tree climbing,shooting down twigs); therefore, the sharing of thismaterial and generated data leads to more economicaland time saving research.
In view of this, one objective of the EVOLTREE networkwas to build up a centralised and standardised storage andmanagement facility, known as the Repository Centre. Bystoring research material at one physical site, the aim wasto generate high impact in forest research in the disciplinesof ecology, genetics, genomics and evolution, not only inEurope and during the course of the project, but also asan international reference site for forest genetic resources.
Description of the facilityThe Repository Centre gathers together all the available anddispersed research material in one reliable site and providesopen-access to a continuously growing data-set. This highquality material is available to and provided by EVOLTREEpartners and researchers outside the network.
Due to the huge number of samples which were alreadyavailable at the EVOLTREE partner sites, specialequipment for storing, managing and tracing material,together with a database for storage of all thecorresponding (meta-) data, were prerequisites for thephysical installation of the Repository Centre. Theinstallation process for creating flexible and highly reliableworkflows for DNA extraction, quality control and long-term storage at the Repository Centre laboratory wasinitiated in 2006. The goal was to have genomic DNA ofpopulations, e.g., from the EVOLTREE Intensive StudySites (Lefèvre et al. page 6, this book) as well as genebank collections extracted and stored following the sameextraction procedures. ESTs had to be available in theform of single clones, as well as spotted on micro arrays,in order to conduct large scale expression profiling innatural populations of non-model species. The mostimportant features were guaranteed sample integrity,standardised quality of material and data, and sustainableand easy access to the material. To fulfil theserequirements, a modular -20°C/-80°C fully automatedstorage system with a capacity for 11,230 microtiter platesat -20°C (Universal Store US-450; Nexus Biosystems) and1,000 microtiter plates at -80°C was installed (BioBankTM;Thermo Scientific).
The storage system comes with online monitoring andlogging of the temperature status and includes an internalalarm system via SMS in case of any temperature failures.The redundant refrigeration systems are assembled
outsidethebuilding; eachsystem being able tohold the set temperature withoutthe second one. Barcoded, heat sealed microtiter plates are stored on bluebarcoded trays (6 plates/tray) which are positionedrandomly within a shelf system. A rail-based robotic armstores or retrieves the plates on request and plates withinthe trays can be rearranged by a separate plate pickingmodule under freezing conditions to prevent needlesssample thawing. Plate picking and re-insertion is loggedby a database system
AutomationTo manage and distribute several thousand DNA resources,a high level of lab automation is required to guaranteefailure-free sample and data handling, combined with highthroughput and high quality. A newly introduced laboratorydata management system, called Material Administrationand Preparation System (MAPSTM) serves as the backboneof the quality management system (Kopecky et al. 2012). Itconsists of a database which holds information about thelab processes and a web-based user interface for viewingand editing this information. Once the initial necessaryExcel-based provider data has been imported into thesystem, the whole workflow being undertaken in thelaboratory at the time (DNA extraction, electrophoresisimages, PCR results, storage positions, DNA
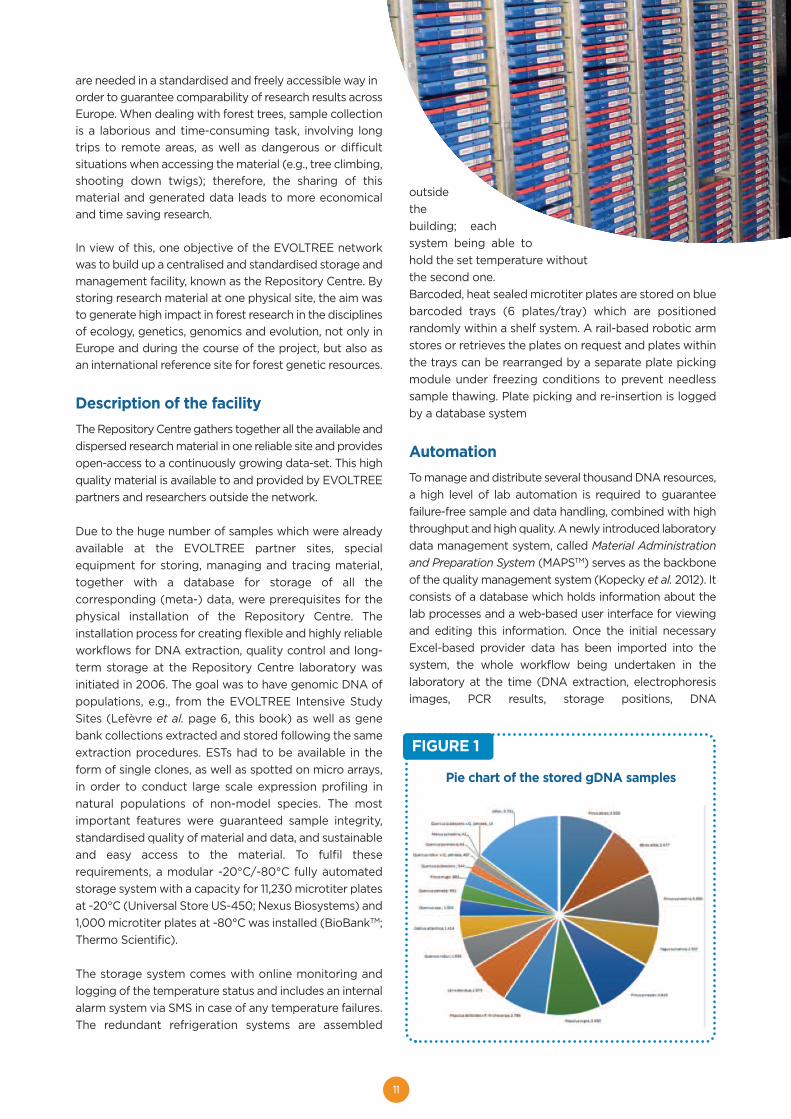
FIGURE 1
Pie chart of the stored gDNA samples
12
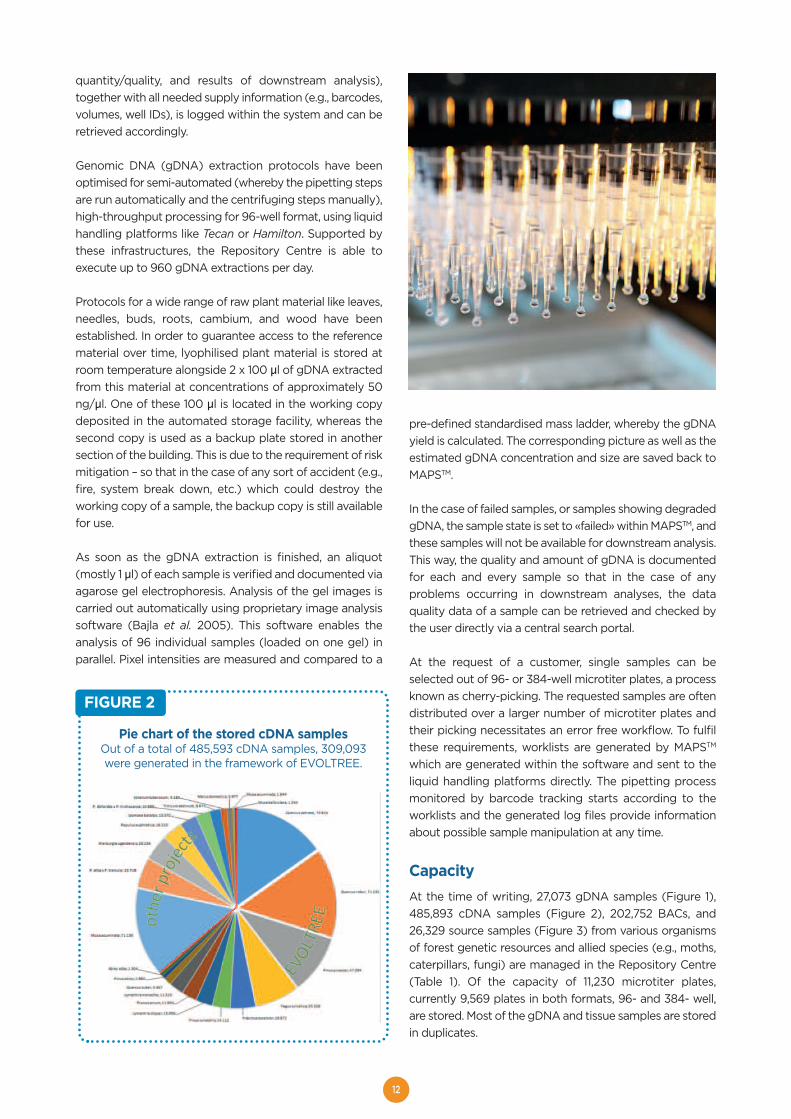
quantity/quality, and results of downstream analysis),together with all needed supply information (e.g., barcodes,volumes, well IDs), is logged within the system and can beretrieved accordingly.
Genomic DNA (gDNA) extraction protocols have beenoptimised for semi-automated (whereby the pipetting stepsare run automatically and the centrifuging steps manually),high-throughput processing for 96-well format, using liquidhandling platforms like Tecan or Hamilton. Supported bythese infrastructures, the Repository Centre is able toexecute up to 960 gDNA extractions per day.
Protocols for a wide range of raw plant material like leaves,needles, buds, roots, cambium, and wood have beenestablished. In order to guarantee access to the referencematerial over time, lyophilised plant material is stored atroom temperature alongside 2 x 100 µl of gDNA extractedfrom this material at concentrations of approximately 50ng/µl. One of these 100 µl is located in the working copydeposited in the automated storage facility, whereas thesecond copy is used as a backup plate stored in anothersection of the building. This is due to the requirement of riskmitigation – so that in the case of any sort of accident (e.g.,fire, system break down, etc.) which could destroy theworking copy of a sample, the backup copy is still availablefor use.
As soon as the gDNA extraction is finished, an aliquot(mostly 1 µl) of each sample is verified and documented viaagarose gel electrophoresis. Analysis of the gel images iscarried out automatically using proprietary image analysissoftware (Bajla et al. 2005). This software enables theanalysis of 96 individual samples (loaded on one gel) inparallel. Pixel intensities are measured and compared to a
pre-defined standardised mass ladder, whereby the gDNAyield is calculated. The corresponding picture as well as theestimated gDNA concentration and size are saved back toMAPSTM.
In the case of failed samples, or samples showing degradedgDNA, the sample state is set to «failed» within MAPSTM, andthese samples will not be available for downstream analysis.This way, the quality and amount of gDNA is documentedfor each and every sample so that in the case of anyproblems occurring in downstream analyses, the dataquality data of a sample can be retrieved and checked bythe user directly via a central search portal.
At the request of a customer, single samples can beselected out of 96- or 384-well microtiter plates, a processknown as cherry-picking. The requested samples are oftendistributed over a larger number of microtiter plates andtheir picking necessitates an error free workflow. To fulfilthese requirements, worklists are generated by MAPSTM
which are generated within the software and sent to theliquid handling platforms directly. The pipetting processmonitored by barcode tracking starts according to theworklists and the generated log files provide informationabout possible sample manipulation at any time.
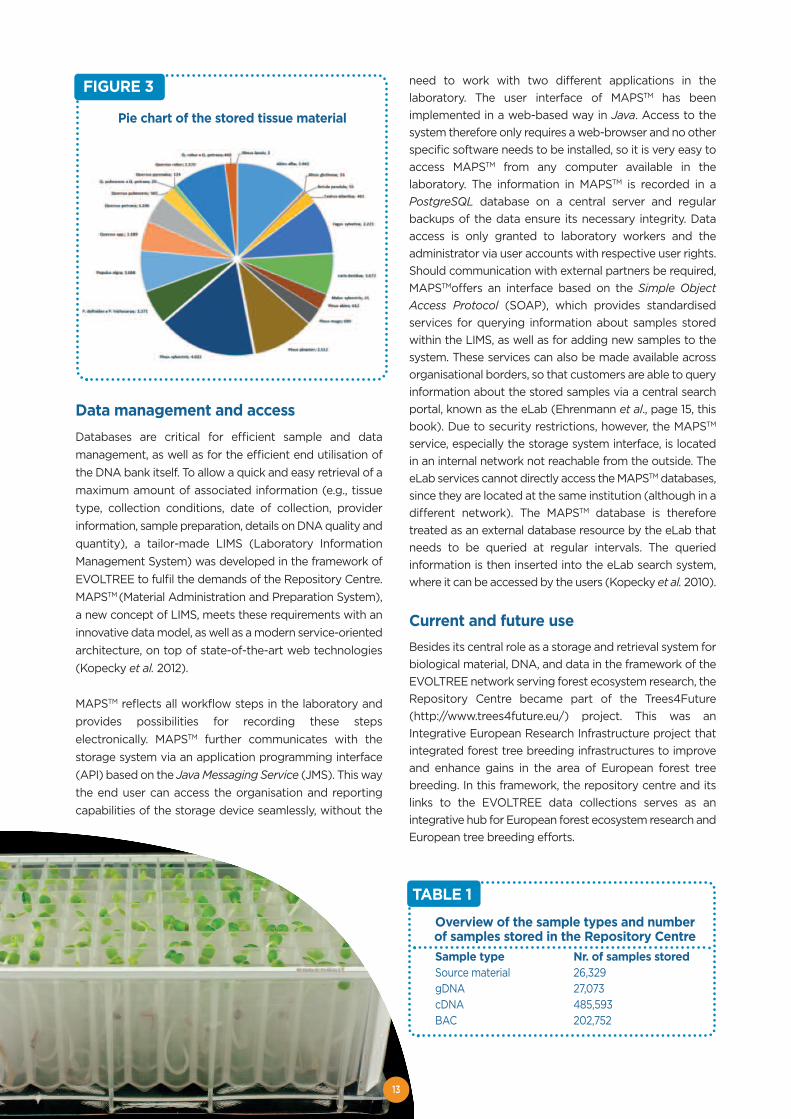
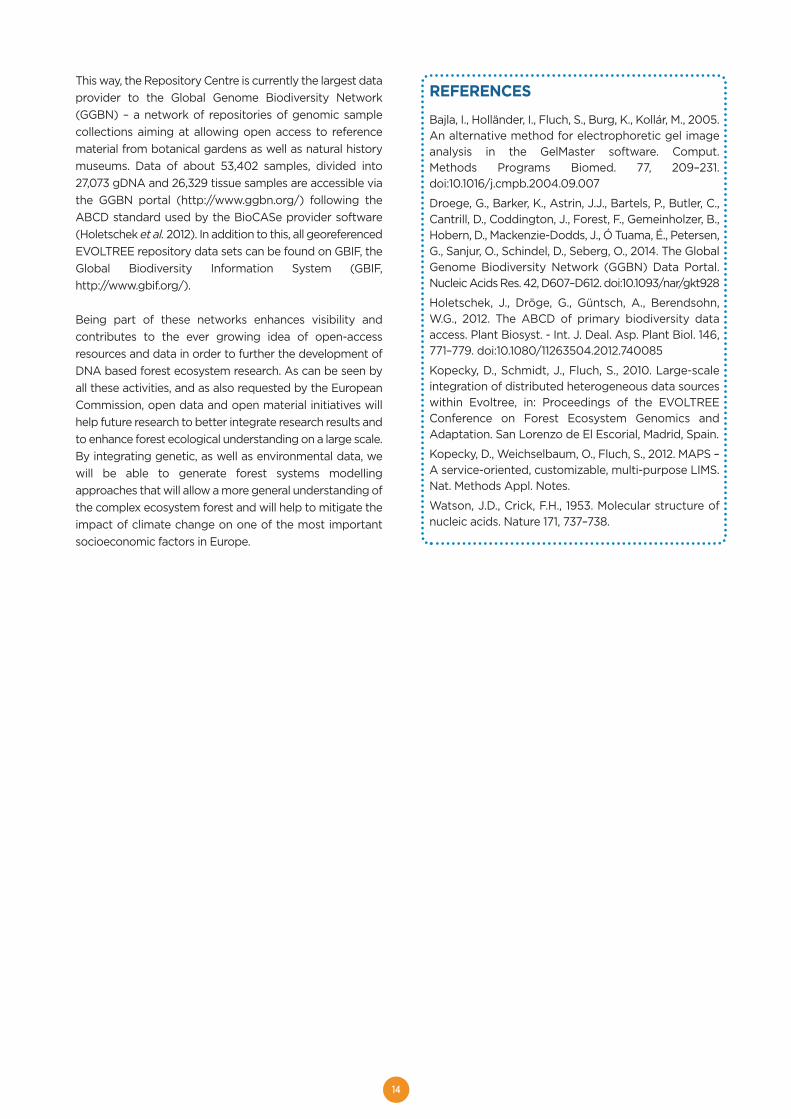
CapacityAt the time of writing, 27,073 gDNA samples (Figure 1),485,893 cDNA samples (Figure 2), 202,752 BACs, and26,329 source samples (Figure 3) from various organismsof forest genetic resources and allied species (e.g., moths,caterpillars, fungi) are managed in the Repository Centre(Table 1). Of the capacity of 11,230 microtiter plates,currently 9,569 plates in both formats, 96- and 384- well,are stored. Most of the gDNA and tissue samples are storedin duplicates.
FIGURE 2
Pie chart of the stored cDNA samplesOut of a total of 485,593 cDNA samples, 309,093 were generated in the framework of EVOLTREE.
13
Data management and access Databases are critical for efficient sample and datamanagement, as well as for the efficient end utilisation ofthe DNA bank itself. To allow a quick and easy retrieval of amaximum amount of associated information (e.g., tissuetype, collection conditions, date of collection, providerinformation, sample preparation, details on DNA quality andquantity), a tailor-made LIMS (Laboratory InformationManagement System) was developed in the framework ofEVOLTREE to fulfil the demands of the Repository Centre.MAPSTM (Material Administration and Preparation System),a new concept of LIMS, meets these requirements with aninnovative data model, as well as a modern service-orientedarchitecture, on top of state-of-the-art web technologies(Kopecky et al. 2012).
MAPSTM reflects all workflow steps in the laboratory andprovides possibilities for recording these stepselectronically. MAPSTM further communicates with thestorage system via an application programming interface(API) based on the Java Messaging Service (JMS). This waythe end user can access the organisation and reportingcapabilities of the storage device seamlessly, without the
need to work with two different applications in thelaboratory. The user interface of MAPSTM has beenimplemented in a web-based way in Java. Access to thesystem therefore only requires a web-browser and no otherspecific software needs to be installed, so it is very easy toaccess MAPSTM from any computer available in thelaboratory. The information in MAPSTM is recorded in aPostgreSQL database on a central server and regularbackups of the data ensure its necessary integrity. Dataaccess is only granted to laboratory workers and theadministrator via user accounts with respective user rights.Should communication with external partners be required,MAPSTMoffers an interface based on the Simple ObjectAccess Protocol (SOAP), which provides standardisedservices for querying information about samples storedwithin the LIMS, as well as for adding new samples to thesystem. These services can also be made available acrossorganisational borders, so that customers are able to queryinformation about the stored samples via a central searchportal, known as the eLab (Ehrenmann et al., page 15, thisbook). Due to security restrictions, however, the MAPSTM
service, especially the storage system interface, is locatedin an internal network not reachable from the outside. TheeLab services cannot directly access the MAPSTM databases,since they are located at the same institution (although in adifferent network). The MAPSTM database is thereforetreated as an external database resource by the eLab thatneeds to be queried at regular intervals. The queriedinformation is then inserted into the eLab search system,where it can be accessed by the users (Kopecky et al. 2010).
Current and future useBesides its central role as a storage and retrieval system forbiological material, DNA, and data in the framework of theEVOLTREE network serving forest ecosystem research, theRepository Centre became part of the Trees4Future(http://www.trees4future.eu/) project. This was anIntegrative European Research Infrastructure project thatintegrated forest tree breeding infrastructures to improveand enhance gains in the area of European forest treebreeding. In this framework, the repository centre and itslinks to the EVOLTREE data collections serves as anintegrative hub for European forest ecosystem research andEuropean tree breeding efforts.
Overview of the sample types and number of samples stored in the Repository CentreSample type Nr. of samples storedSource material 26,329gDNA 27,073cDNA 485,593BAC 202,752
TABLE 1
FIGURE 3
Pie chart of the stored tissue material
14
This way, the Repository Centre is currently the largest dataprovider to the Global Genome Biodiversity Network(GGBN) – a network of repositories of genomic samplecollections aiming at allowing open access to referencematerial from botanical gardens as well as natural historymuseums. Data of about 53,402 samples, divided into27,073 gDNA and 26,329 tissue samples are accessible viathe GGBN portal (http://www.ggbn.org/) following theABCD standard used by the BioCASe provider software(Holetschek et al. 2012). In addition to this, all georeferencedEVOLTREE repository data sets can be found on GBIF, theGlobal Biodiversity Information System (GBIF,http://www.gbif.org/).
Being part of these networks enhances visibility andcontributes to the ever growing idea of open-accessresources and data in order to further the development ofDNA based forest ecosystem research. As can be seen byall these activities, and as also requested by the EuropeanCommission, open data and open material initiatives willhelp future research to better integrate research results andto enhance forest ecological understanding on a large scale.By integrating genetic, as well as environmental data, wewill be able to generate forest systems modellingapproaches that will allow a more general understanding ofthe complex ecosystem forest and will help to mitigate theimpact of climate change on one of the most importantsocioeconomic factors in Europe.
REFERENCES
Bajla, I., Holländer, I., Fluch, S., Burg, K., Kollár, M., 2005.An alternative method for electrophoretic gel imageanalysis in the GelMaster software. Comput.Methods Programs Biomed. 77, 209–231.doi:10.1016/j.cmpb.2004.09.007
Droege, G., Barker, K., Astrin, J.J., Bartels, P., Butler, C.,Cantrill, D., Coddington, J., Forest, F., Gemeinholzer, B.,Hobern, D., Mackenzie-Dodds, J., Ó Tuama, É., Petersen,G., Sanjur, O., Schindel, D., Seberg, O., 2014. The GlobalGenome Biodiversity Network (GGBN) Data Portal.Nucleic Acids Res. 42, D607–D612. doi:10.1093/nar/gkt928
Holetschek, J., Dröge, G., Güntsch, A., Berendsohn,W.G., 2012. The ABCD of primary biodiversity dataaccess. Plant Biosyst. - Int. J. Deal. Asp. Plant Biol. 146,771–779. doi:10.1080/11263504.2012.740085
Kopecky, D., Schmidt, J., Fluch, S., 2010. Large-scaleintegration of distributed heterogeneous data sourceswithin Evoltree, in: Proceedings of the EVOLTREEConference on Forest Ecosystem Genomics andAdaptation. San Lorenzo de El Escorial, Madrid, Spain.
Kopecky, D., Weichselbaum, O., Fluch, S., 2012. MAPS –A service-oriented, customizable, multi-purpose LIMS.Nat. Methods Appl. Notes.
Watson, J.D., Crick, F.H., 1953. Molecular structure ofnucleic acids. Nature 171, 737–738.
15
Background and objectives of the eLabWhile some of the portal databases existed beforehand,most of the web applications corresponding to thedatabases were constructed in the first four years of theEVOLTREE network. These have been continuouslyupdated and populated ever since by the memberlaboratories which host the databases and carry out thisactivity as part of their ‘in-kind’ contribution to the network.
The portal databases are connected through astandardised, HTTP transmittable interface (TAPIR -www.tdwg.org/activities/tapir/), so that queries can bemade within the whole set of databases.
Given the number of tree species studied throughoutEurope, it was decided to “virtually” subdivide the eLabinto three major portals corresponding to the three majorbotanical forest tree families that are studied: the QuercusPortal (for species belonging to the Fagaceae family), thePinus Portal (for the Pinaceae family), and the PopulusPortal (for species belonging to Salicaceae). Dependingon their field of interest, users can therefore enter thesystem and make queries via three channels:
• The individual database for queries targeting well-focused information.
• The eLab for an overall search across all the databases.Access via the eLab research engine is recommended ifusers do not know where - e.g., in which database - theinformation of interest is located.
• One of the family portals, for data corresponding to aparticular species, or genera, of the Fagaceae, theSalicaceae, or the Pinaceae family. Databases concerningspecies not belonging to these families can be directlyaccessed via the eLab.
The individual databasesPassport, phenotypic, genetic and genomic datacorresponding to different research units (genes,individuals, populations, species) were stored in separatedatabases, some of which existed before the launch of thenetwork. At the beginning of EVOLTREE it was decided tokeep the decentralized structure of the databases and toconnect them via an interoperable interface in order tobenefit from the already existing resources and thecontributions of different partners.
Table 1 provides a summary of the content of the largestand most completed individual databases. All databasescan be accessed individually and queries can be madeinternally without using the overall research engine of theeLab. A few databases offer some additional features andin some cases provide internal data analysis ; for example,genetic or QTL maps can be compared using Cmap. GD2is dynamically linked with EUFGIS (http://portal.eufgis.org/),the georeferenced database of forest conservation unitscoordinated by EUFORGEN. The database connection is
EVOLTREE ELAB - AN INFORMATION SYSTEMFOR FOREST GENETICS
F. EHRENMANN1, S. GLAUBITZER2, D. KOPECKY2,J. SCHMIDT2, S. FLUCH2, E. MARIA SEHR2,A. KREMER1.
1 INRA, UMR1202 BIOGECO, Cestas F-33610, France; 2 AIT Austrian Institute ofTechnology GmbH, Health & Environment Dept., Konrad-Lorenz-Straße 24,3430 Tulln, Austria.* These authors contributed equally to the construction of the eLab and its components.
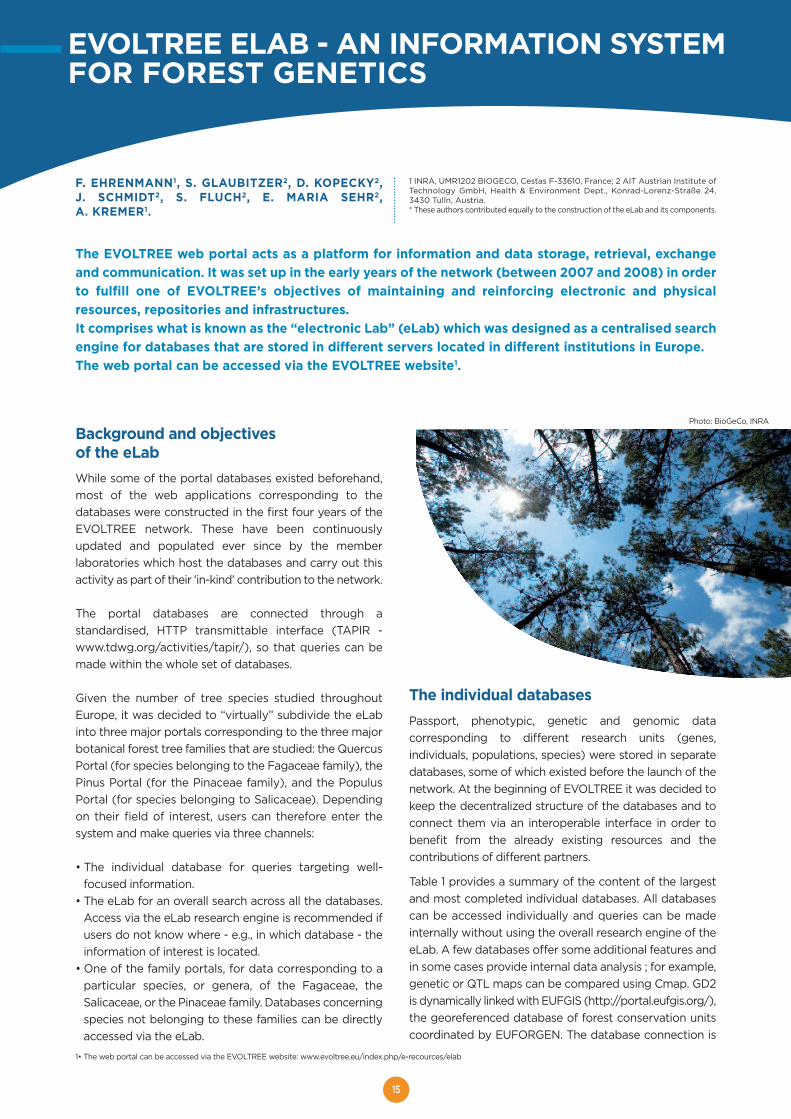
The EVOLTREE web portal acts as a platform for information and data storage, retrieval, exchangeand communication. It was set up in the early years of the network (between 2007 and 2008) in orderto fulfill one of EVOLTREE’s objectives of maintaining and reinforcing electronic and physicalresources, repositories and infrastructures.It comprises what is known as the “electronic Lab” (eLab) which was designed as a centralised searchengine for databases that are stored in different servers located in different institutions in Europe. The web portal can be accessed via the EVOLTREE website1.
1• The web portal can be accessed via the EVOLTREE website: www.evoltree.eu/index.php/e-recources/elab
Photo: BioGeCo, INRA
16
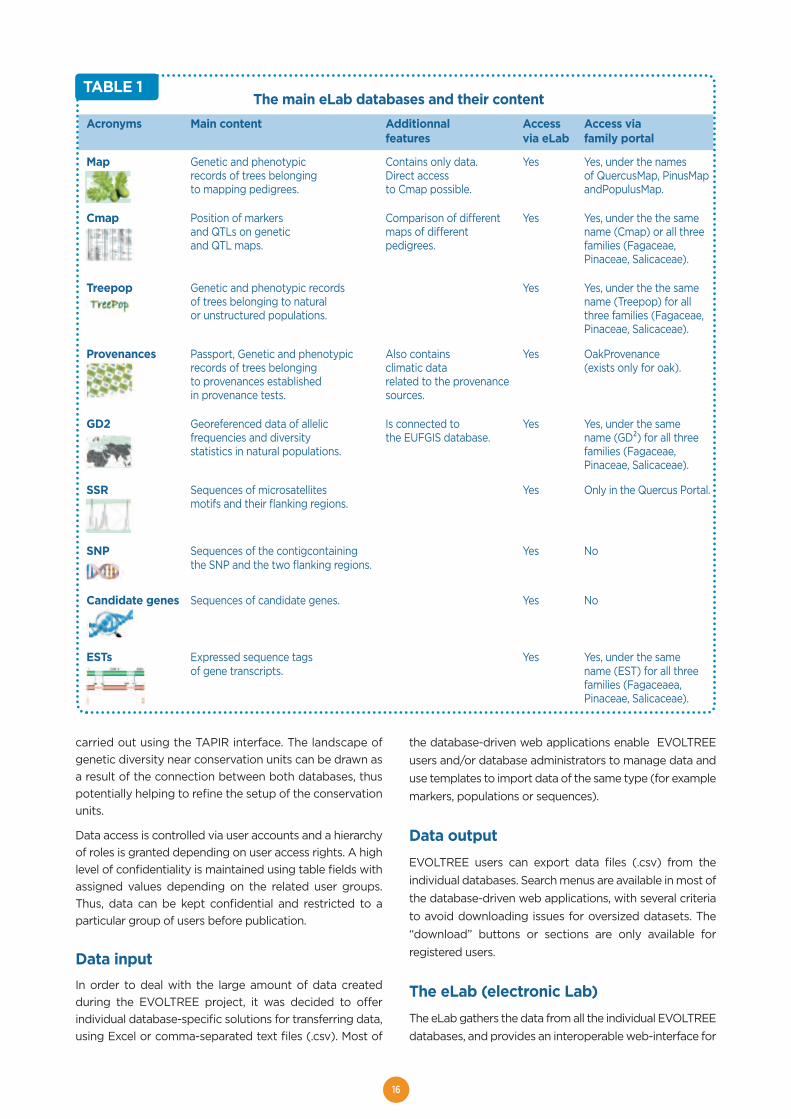
TABLE 1 The main eLab databases and their content
Acronyms Main content Additionnal Access Access via features via eLab family portal
Map Genetic and phenotypic Contains only data. Yes Yes, under the namesrecords of trees belonging Direct access of QuercusMap, PinusMap to mapping pedigrees. to Cmap possible. andPopulusMap.
Cmap Position of markers Comparison of different Yes Yes, under the the same and QTLs on genetic maps of different name (Cmap) or all three and QTL maps. pedigrees. families (Fagaceae,
Pinaceae, Salicaceae).
Treepop Genetic and phenotypic records Yes Yes, under the the same of trees belonging to natural name (Treepop) for all or unstructured populations. three families (Fagaceae,
Pinaceae, Salicaceae).
Provenances Passport, Genetic and phenotypic Also contains Yes OakProvenance records of trees belonging climatic data (exists only for oak).to provenances established related to the provenance in provenance tests. sources.
GD2 Georeferenced data of allelic Is connected to Yes Yes, under the samefrequencies and diversity the EUFGIS database. name (GD²) for all threestatistics in natural populations. families (Fagaceae,
Pinaceae, Salicaceae).
SSR Sequences of microsatellites Yes Only in the Quercus Portal.motifs and their flanking regions.
SNP Sequences of the contigcontaining Yes Nothe SNP and the two flanking regions.
Candidate genes Sequences of candidate genes. Yes No
ESTs Expressed sequence tags Yes Yes, under the sameof gene transcripts. name (EST) for all three
families (Fagaceaea, Pinaceae, Salicaceae).
TABLE 1
carried out using the TAPIR interface. The landscape ofgenetic diversity near conservation units can be drawn asa result of the connection between both databases, thuspotentially helping to refine the setup of the conservationunits.
Data access is controlled via user accounts and a hierarchyof roles is granted depending on user access rights. A highlevel of confidentiality is maintained using table fields withassigned values depending on the related user groups.Thus, data can be kept confidential and restricted to aparticular group of users before publication.
Data inputIn order to deal with the large amount of data createdduring the EVOLTREE project, it was decided to offerindividual database-specific solutions for transferring data,using Excel or comma-separated text files (.csv). Most of
the database-driven web applications enable EVOLTREEusers and/or database administrators to manage data anduse templates to import data of the same type (for examplemarkers, populations or sequences).
Data outputEVOLTREE users can export data files (.csv) from theindividual databases. Search menus are available in most ofthe database-driven web applications, with several criteriato avoid downloading issues for oversized datasets. The“download” buttons or sections are only available forregistered users.
The eLab (electronic Lab)The eLab gathers the data from all the individual EVOLTREEdatabases, and provides an interoperable web-interface for
17
users to make queries against the data. Thus, the eLabfunctions as a clearinghouse mechanism enhancing theexchange of information and data throughout the differentmember labs of EVOLTREE. The relevant data parts ofevery database were defined when a new database wasbeing integrated into the eLab.
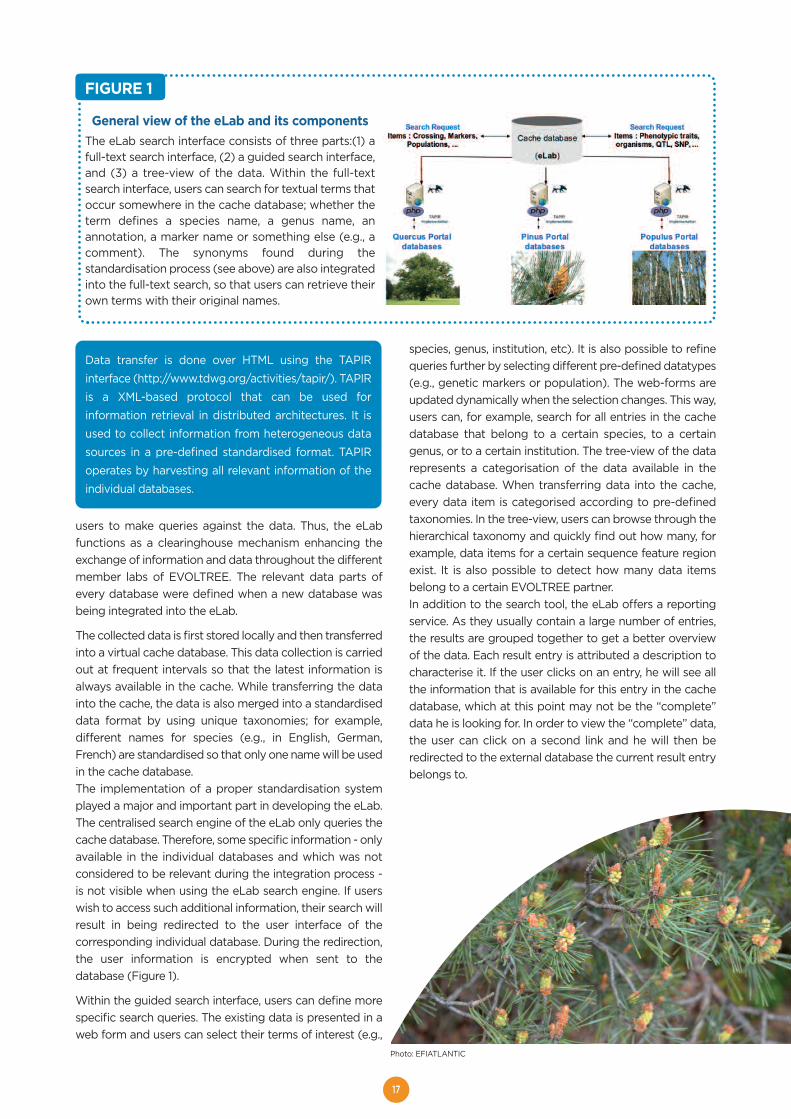
The collected data is first stored locally and then transferredinto a virtual cache database. This data collection is carriedout at frequent intervals so that the latest information isalways available in the cache. While transferring the datainto the cache, the data is also merged into a standardiseddata format by using unique taxonomies; for example,different names for species (e.g., in English, German,French) are standardised so that only one name will be usedin the cache database.The implementation of a proper standardisation systemplayed a major and important part in developing the eLab.The centralised search engine of the eLab only queries thecache database. Therefore, some specific information - onlyavailable in the individual databases and which was notconsidered to be relevant during the integration process -is not visible when using the eLab search engine. If userswish to access such additional information, their search willresult in being redirected to the user interface of thecorresponding individual database. During the redirection,the user information is encrypted when sent to thedatabase (Figure 1).
Within the guided search interface, users can define morespecific search queries. The existing data is presented in aweb form and users can select their terms of interest (e.g.,
species, genus, institution, etc). It is also possible to refinequeries further by selecting different pre-defined datatypes(e.g., genetic markers or population). The web-forms areupdated dynamically when the selection changes. This way,users can, for example, search for all entries in the cachedatabase that belong to a certain species, to a certaingenus, or to a certain institution. The tree-view of the datarepresents a categorisation of the data available in thecache database. When transferring data into the cache,every data item is categorised according to pre-definedtaxonomies. In the tree-view, users can browse through thehierarchical taxonomy and quickly find out how many, forexample, data items for a certain sequence feature regionexist. It is also possible to detect how many data itemsbelong to a certain EVOLTREE partner.In addition to the search tool, the eLab offers a reportingservice. As they usually contain a large number of entries,the results are grouped together to get a better overviewof the data. Each result entry is attributed a description tocharacterise it. If the user clicks on an entry, he will see allthe information that is available for this entry in the cachedatabase, which at this point may not be the “complete”data he is looking for. In order to view the “complete” data,the user can click on a second link and he will then beredirected to the external database the current result entrybelongs to.
Data transfer is done over HTML using the TAPIRinterface (http://www.tdwg.org/activities/tapir/). TAPIRis a XML-based protocol that can be used forinformation retrieval in distributed architectures. It isused to collect information from heterogeneous datasources in a pre-defined standardised format. TAPIRoperates by harvesting all relevant information of theindividual databases.
FIGURE 1
General view of the eLab and its componentsThe eLab search interface consists of three parts:(1) afull-text search interface, (2) a guided search interface,and (3) a tree-view of the data. Within the full-textsearch interface, users can search for textual terms thatoccur somewhere in the cache database; whether theterm defines a species name, a genus name, anannotation, a marker name or something else (e.g., acomment). The synonyms found during thestandardisation process (see above) are also integratedinto the full-text search, so that users can retrieve theirown terms with their original names.
Photo: EFIATLANTIC
18
FIGURE 2
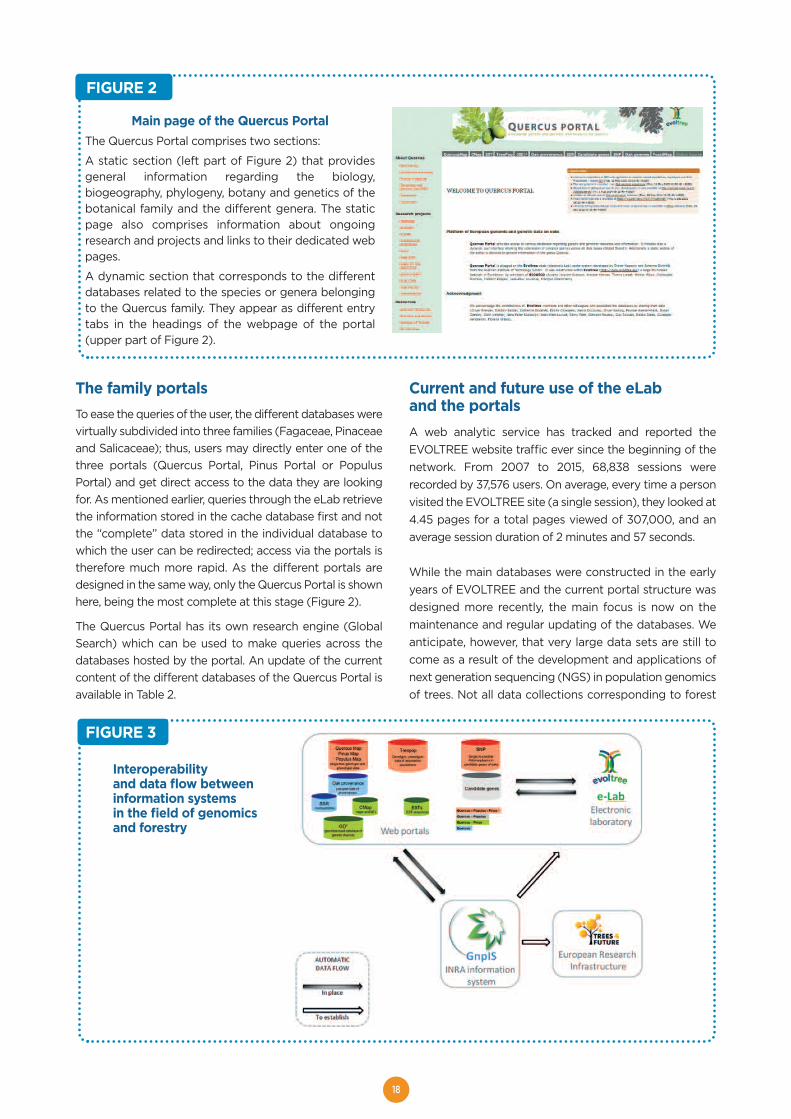
Main page of the Quercus PortalThe Quercus Portal comprises two sections:
A static section (left part of Figure 2) that providesgeneral information regarding the biology,biogeography, phylogeny, botany and genetics of thebotanical family and the different genera. The staticpage also comprises information about ongoingresearch and projects and links to their dedicated webpages.
A dynamic section that corresponds to the differentdatabases related to the species or genera belongingto the Quercus family. They appear as different entrytabs in the headings of the webpage of the portal(upper part of Figure 2).
FIGURE 3
Interoperabilityand data flow betweeninformation systemsin the field of genomicsand forestry
The family portalsTo ease the queries of the user, the different databases werevirtually subdivided into three families (Fagaceae, Pinaceaeand Salicaceae); thus, users may directly enter one of thethree portals (Quercus Portal, Pinus Portal or PopulusPortal) and get direct access to the data they are lookingfor. As mentioned earlier, queries through the eLab retrievethe information stored in the cache database first and notthe “complete” data stored in the individual database towhich the user can be redirected; access via the portals istherefore much more rapid. As the different portals aredesigned in the same way, only the Quercus Portal is shownhere, being the most complete at this stage (Figure 2).
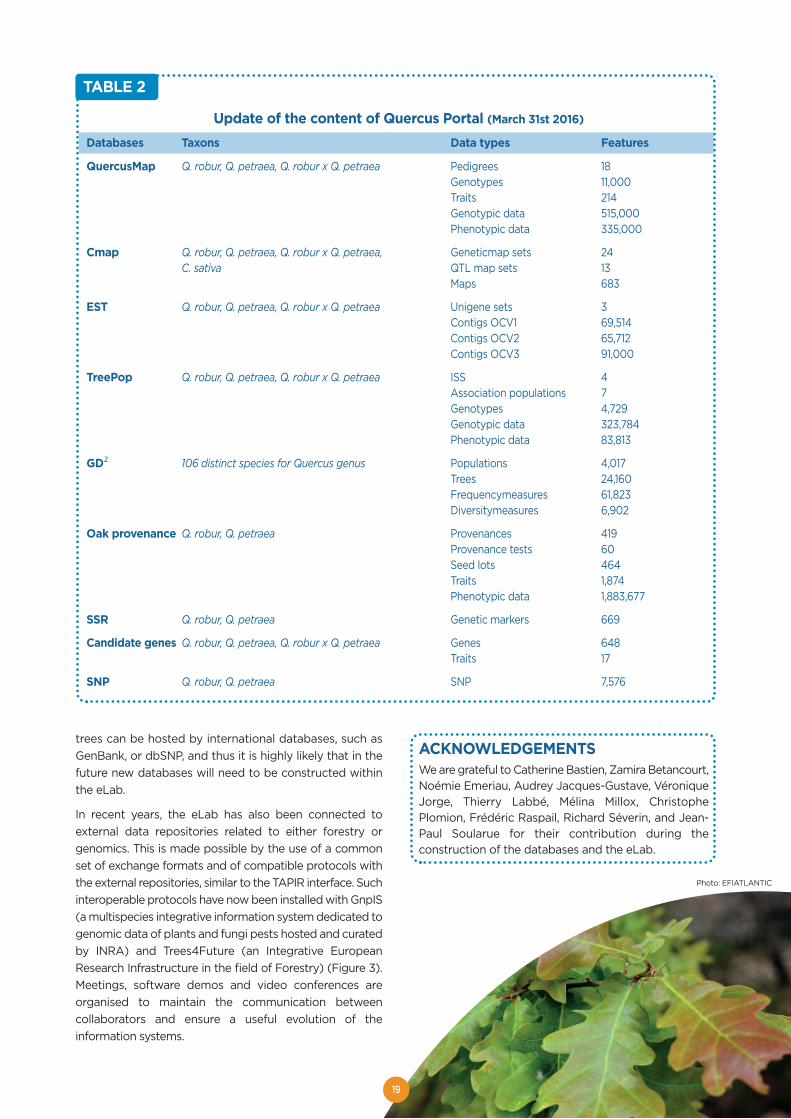
The Quercus Portal has its own research engine (GlobalSearch) which can be used to make queries across thedatabases hosted by the portal. An update of the currentcontent of the different databases of the Quercus Portal isavailable in Table 2.
Current and future use of the eLab and the portalsA web analytic service has tracked and reported theEVOLTREE website traffic ever since the beginning of thenetwork. From 2007 to 2015, 68,838 sessions wererecorded by 37,576 users. On average, every time a personvisited the EVOLTREE site (a single session), they looked at4.45 pages for a total pages viewed of 307,000, and anaverage session duration of 2 minutes and 57 seconds.
While the main databases were constructed in the earlyyears of EVOLTREE and the current portal structure wasdesigned more recently, the main focus is now on themaintenance and regular updating of the databases. Weanticipate, however, that very large data sets are still tocome as a result of the development and applications ofnext generation sequencing (NGS) in population genomicsof trees. Not all data collections corresponding to forest
19
trees can be hosted by international databases, such asGenBank, or dbSNP, and thus it is highly likely that in thefuture new databases will need to be constructed withinthe eLab.
In recent years, the eLab has also been connected toexternal data repositories related to either forestry orgenomics. This is made possible by the use of a commonset of exchange formats and of compatible protocols withthe external repositories, similar to the TAPIR interface. Suchinteroperable protocols have now been installed with GnpIS(a multispecies integrative information system dedicated togenomic data of plants and fungi pests hosted and curatedby INRA) and Trees4Future (an Integrative EuropeanResearch Infrastructure in the field of Forestry) (Figure 3).Meetings, software demos and video conferences areorganised to maintain the communication betweencollaborators and ensure a useful evolution of theinformation systems.
Update of the content of Quercus Portal (March 31st 2016)
Databases Taxons Data types Features
QuercusMap Q. robur, Q. petraea, Q. robur x Q. petraea Pedigrees 18Genotypes 11,000Traits 214Genotypic data 515,000Phenotypic data 335,000
Cmap Q. robur, Q. petraea, Q. robur x Q. petraea, Geneticmap sets 24C. sativa QTL map sets 13
Maps 683
EST Q. robur, Q. petraea, Q. robur x Q. petraea Unigene sets 3Contigs OCV1 69,514Contigs OCV2 65,712Contigs OCV3 91,000
TreePop Q. robur, Q. petraea, Q. robur x Q. petraea ISS 4Association populations 7Genotypes 4,729Genotypic data 323,784Phenotypic data 83,813
GD² 106 distinct species for Quercus genus Populations 4,017Trees 24,160Frequencymeasures 61,823Diversitymeasures 6,902
Oak provenance Q. robur, Q. petraea Provenances 419Provenance tests 60Seed lots 464Traits 1,874Phenotypic data 1,883,677
SSR Q. robur, Q. petraea Genetic markers 669
Candidate genes Q. robur, Q. petraea, Q. robur x Q. petraea Genes 648Traits 17
SNP Q. robur, Q. petraea SNP 7,576
TABLE 2
ACKNOWLEDGEMENTSWe are grateful to Catherine Bastien, Zamira Betancourt,Noémie Emeriau, Audrey Jacques-Gustave, VéroniqueJorge, Thierry Labbé, Mélina Millox, ChristophePlomion, Frédéric Raspail, Richard Séverin, and Jean-Paul Soularue for their contribution during theconstruction of the databases and the eLab.
Photo: EFIATLANTIC
Transfer of knowledge within Evoltree _and beyondDuring the initial, EC-supported phase (2006-2010), everypartner was invited to suggest training courses that wouldfit the scope of Evoltree research in a broad sense. Theorganisation of a course was financially supported by thenetwork's own funds so that expenses, e.g., for invitedteachers, could be covered.
In EVOLTREE’s second phase as a European ResearchGroup (2011 onwards), it was agreed that partners couldoffer training courses as in-kind contribution, an alternativeto direct monetary support of the network activities. As aconsequence of this formal change, the types of trainingopportunities broadened so that excursions, workshops,existing courses from within the curriculum of a university,etc. could be integrated into the programme.
As a great benefit of the resources available within thenetwork during both phases, all participants from theEVOLTREE partner institutions can be reimbursed for theirexpenses up to a pre-defined limit., these training coursesare not only open to students from registered EVOLTREEpartners, but also to interested students from outside thenetwork (at their own costs). This way, it is possible tofoster cross-disciplinary education and to establish orstrengthen contacts between complementary fields ofresearch.
Wide-ranging expertise for a variety of studentsA multitude of disciplines are represented within theEVOLTREE partnership. Hence, training could greatlybenefit from this broad range of expertise of leadingscientists in their field within the consortium. Tocomplement this competence in the training programme,EVOLTREE partners invited lecturers from a variety of
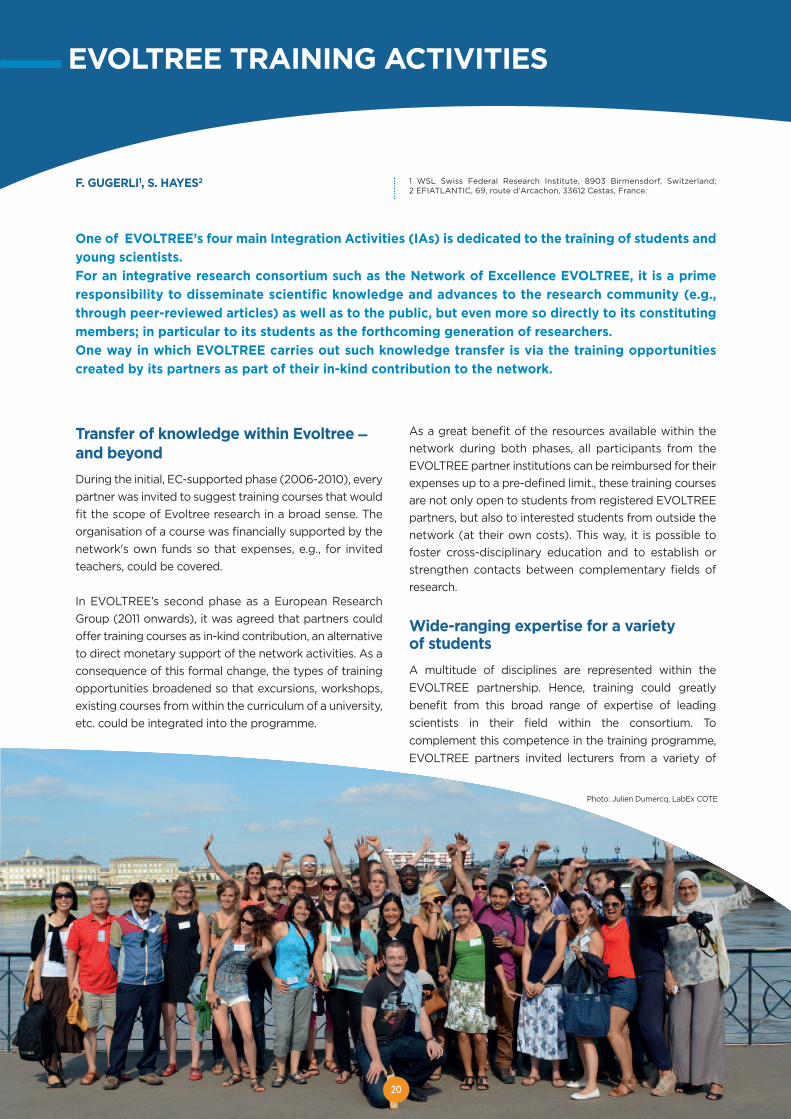
EVOLTREE TRAINING ACTIVITIES
F. GUGERLI1, S. HAYES2 1 WSL Swiss Federal Research Institute, 8903 Birmensdorf, Switzerland; 2 EFIATLANTIC, 69, route d'Arcachon, 33612 Cestas, France.
One of EVOLTREE’s four main Integration Activities (IAs) is dedicated to the training of students andyoung scientists. For an integrative research consortium such as the Network of Excellence EVOLTREE, it is a primeresponsibility to disseminate scientific knowledge and advances to the research community (e.g.,through peer-reviewed articles) as well as to the public, but even more so directly to its constitutingmembers; in particular to its students as the forthcoming generation of researchers. One way in which EVOLTREE carries out such knowledge transfer is via the training opportunitiescreated by its partners as part of their in-kind contribution to the network.
Photo: Julien Dumercq, LabEx COTE
20
21
disciplines and institutions for these training courses, whichalso contributed to the exchange of knowledge among theresearchers involved.
An appealing outcome of the training programme was tosee that not only young students of forest ecology, e.g., atPhD or post-graduate levels, took advantage of theopportunities to learn about new techniques, types ofanalyses, or concepts, but that established scientists alsoparticipated in the training events and could thus learn from_ and at the same time actively contribute with their ownbackground to _ the training offered by their colleagues.
Over the years, the EVOLTREE training programme hasaccumulated an immense breadth of topics covered in thevarious courses (Table. 1). Students have been able to, forexamples, learn about fundamental analytical tools inpopulation genetics, take first steps towards effectivelyusing the bioinformatic toolbox, debate about conceptualissues of the coalescent theory, obtain insights into andperform meta-analyses, attempt to detect genomicsignatures of adaptation, or discuss ecologicalconsequences of global change on forest ecosystems.
OutlookThe EVOLTREE community will continue to offer trainingopportunities that cover the entire breadth of EVOLTREEresearch and competence _ and beyond. Benefiting fromestablished courses or taking the opportunity fordeveloping new teaching components, both researchersand their students of EVOLTREE partner organisations willbe able to take part in the transfer of expertise andknowledge to the forthcoming generation of scientists inthe fields of genetics, genomics, and ecology of forestecosystems. These opportunities will also foster theintegration of the European research laboratories takingpart. Such personal contacts are fundamental andconstitute a pre-requisite for continued integrative andinterdisciplinary research.
AN INSIDER'S VIEW
Participating in an EVOLTREE training course has
benefited many students over the past ten years.
Students have appreciated the opportunities given by
the network, be it the many topics explored within the
various courses, or the depth and competence of the
teaching in a particular course. This positive attitude is
not only reflected by the often high numbers of
participants, but also by respective feedback.
In their course feedback, participants have stated: "This
course was beneficial for me and fulfilled my
expectations. It was a good experience to learn
interdisciplinary in approaching ecological problems.
The necessity to combine natural, social and civil
sciences to better understand the biodiversity loss and
conservation was largely developed during the course."
and "(...), a perfect place to forget about daily and
mundane preoccupations and dedicate one’s mind to
the acquisition of new scientific skills". Such responses
are great motivation for continuing our commitment to
teaching our students and to dedicate time and
resources towards these activities.
Photo: Patricia Gonzalez Diaz
22
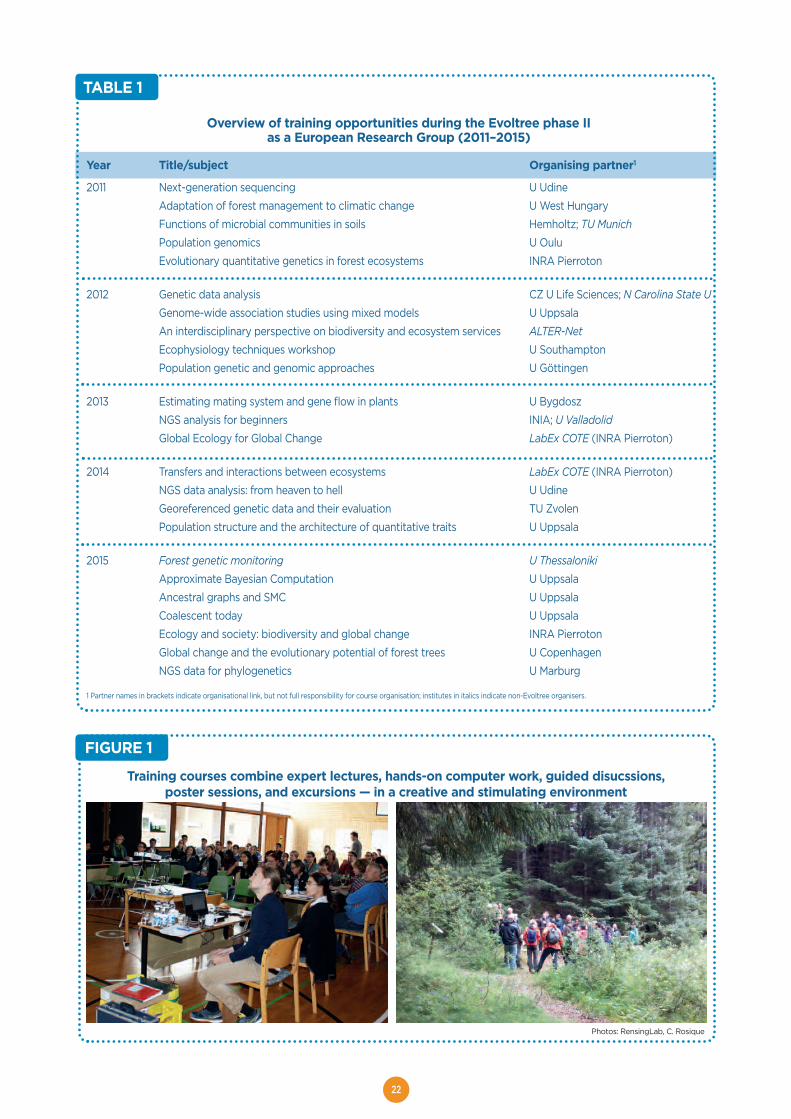
Overview of training opportunities during the Evoltree phase II as a European Research Group (2011–2015)
Year Title/subject Organising partner1
2011 Next-generation sequencing U UdineAdaptation of forest management to climatic change U West HungaryFunctions of microbial communities in soils Hemholtz; TU MunichPopulation genomics U OuluEvolutionary quantitative genetics in forest ecosystems INRA Pierroton
2012 Genetic data analysis CZ U Life Sciences; N Carolina State UGenome-wide association studies using mixed models U UppsalaAn interdisciplinary perspective on biodiversity and ecosystem services ALTER-NetEcophysiology techniques workshop U SouthamptonPopulation genetic and genomic approaches U Göttingen
2013 Estimating mating system and gene flow in plants U BygdoszNGS analysis for beginners INIA; U ValladolidGlobal Ecology for Global Change LabEx COTE (INRA Pierroton)
2014 Transfers and interactions between ecosystems LabEx COTE (INRA Pierroton)NGS data analysis: from heaven to hell U UdineGeoreferenced genetic data and their evaluation TU ZvolenPopulation structure and the architecture of quantitative traits U Uppsala
2015 Forest genetic monitoring U ThessalonikiApproximate Bayesian Computation U UppsalaAncestral graphs and SMC U UppsalaCoalescent today U UppsalaEcology and society: biodiversity and global change INRA PierrotonGlobal change and the evolutionary potential of forest trees U CopenhagenNGS data for phylogenetics U Marburg
1 Partner names in brackets indicate organisational link, but not full responsibility for course organisation; institutes in italics indicate non-Evoltree organisers.
TABLE 1
FIGURE 1
Training courses combine expert lectures, hands-on computer work, guided disucssions, poster sessions, and excursions — in a creative and stimulating environment
Photos: RensingLab, C. Rosique
Background and objectivesIn an era when information from the genome is accessibleas never before, the collection of standardised phenotypicdata has become a limiting factor (Neale & Kremer, 2011).These data are essential if we are to establish therelationships between genes, phenotypes and naturalselection in response to environmental drivers. For a widevariety of reasons, including breeding, climate changemitigation and conservation, we need to know how thegenetic diversity observed in wild populations istranslated, via the phenotype, into selectively relevantvariation and how this reacts to the environment (in thebroadest sense).
From individual genomes to populations and to species,most trees maintain very high levels of genetic diversityand, as a life history characteristic, have developedefficient mechanisms for dispersing that variation acrossspatially and temporally variable landscapes. Phenotypicdata collected from experimental trial settings, whilstessential for establishing the genetic basis for traits,represents observation of unselected progeny and isalways compromised by a lack of exposure to the home
site environment, where genotypes may perform quitedifferently. To harness the power of new genomictechniques to understand selection and adaptation in treespecies, we must now take observation of plantphenotypes into the wild.
Analysing quantitative phenotypic data from wildpopulations is challenging, but the application ofappropriate methodological approaches can help todisentangle plasticity and local adaptation, in particular ifphenotypic data from the same trees are collected atdifferent time points or if molecular marker data iscollected from the same trees (e.g., Castellanos et al. 2015).For example, Phillimore et al. (2012) showed that the slopeof phenology on temperature through time will be due tomean plasticity plus any association between this traitvalues and temperature, that is, adaptive microevolution,and that these two components can be separated usingspaciotemporal data collected in a citizen study similar toTreeType.
Another interesting use of phenotypic data collected inwild populations is the study of trade-offs among traits,which could either favour or prevent adaptation to the new
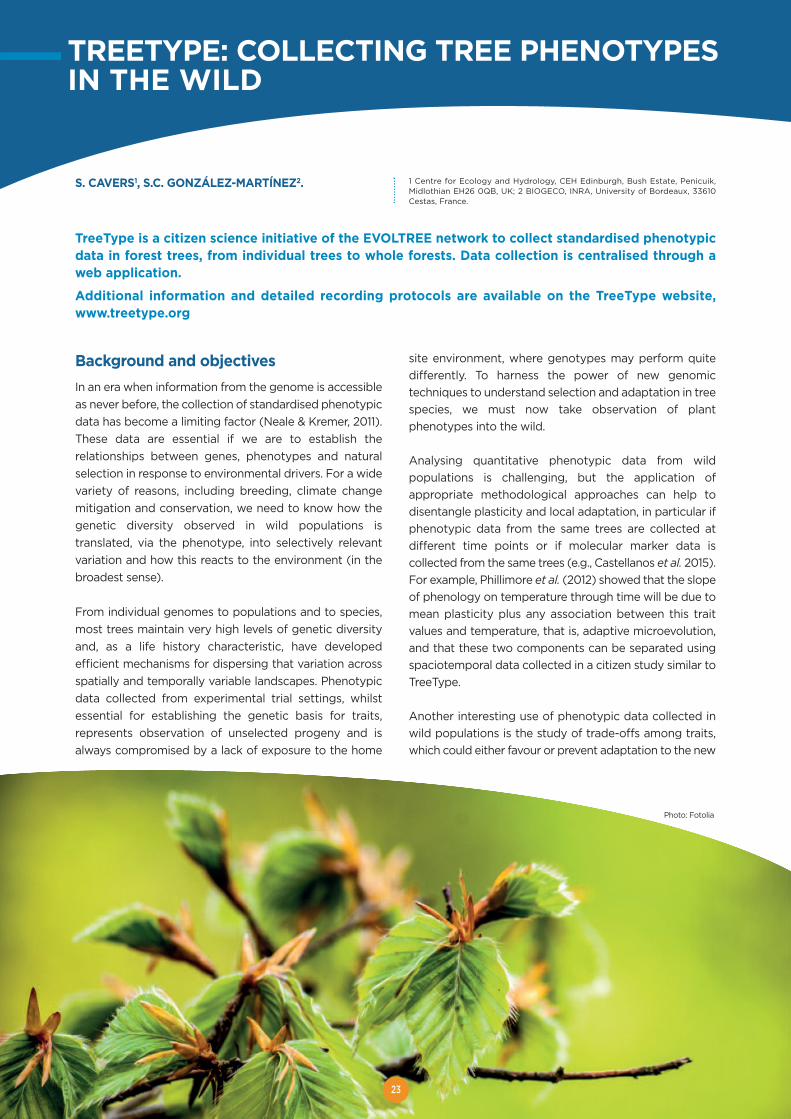
TREETYPE: COLLECTING TREE PHENOTYPESIN THE WILD
S. CAVERS1, S.C. GONZÁLEZ-MARTÍNEZ2. 1 Centre for Ecology and Hydrology, CEH Edinburgh, Bush Estate, Penicuik,Midlothian EH26 0QB, UK; 2 BIOGECO, INRA, University of Bordeaux, 33610Cestas, France.
TreeType is a citizen science initiative of the EVOLTREE network to collect standardised phenotypicdata in forest trees, from individual trees to whole forests. Data collection is centralised through aweb application.
Additional information and detailed recording protocols are available on the TreeType website,www.treetype.org
23
Photo: Fotolia

environments expected under impending climate change.Finally, the phenology and reproduction data collected byTreeType will increase our understanding of the interplayof demography and genetics for adaptation of forest treesto local environments.
Project constructionFollowing a period of consultation with experts within theEVOLTREE network, it was decided that measurementsshould be taken on a set of four basic traits as a minimum(diameter, number of fruits, average seed mass, and age)and where possible this should be extended with theaddition of up to 8 additional characters.
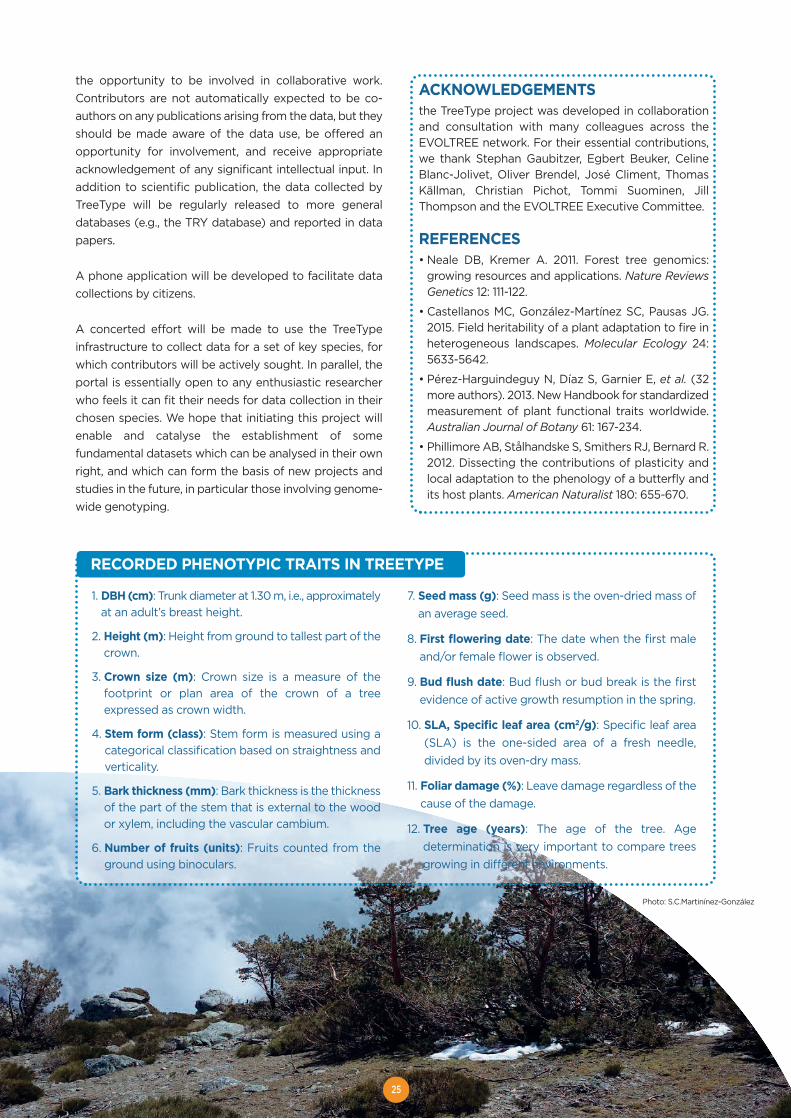
The essence of the selection was to try to cover a rangeof general categories, of importance to adaptation indifferent ways, namely growth, reproduction, phenologyand defence. In each, a simple trait was identified thatcould both be recorded reliably by specialists and non-specialists alike. Protocols for each identified trait weredesigned based on internationally agreed standards suchas Perez-Harguindeguy et al. (2013). Recorders are askedto target a set of at least five trees growing from open-pollinated naturally dispersed seed, although it is madeclear that any record of any tree is welcome. A basic setof environmental data for each tree is requested alongwith a photograph, when possible.
What will the future bring?The coordinators of TreeType are following an open-access principle. Therefore, any data collected through theTreeType project will be made freely available, subject onlyto users contacting the TreeType managers to confirmtheir interest and intentions. Any use of the data forpublications or reports will make a clear reference to theproject and those TreeType contributors who have beendirectly involved in the collection of relevant data will have
24
STRUCTURE AND FUNCTIONTreeType is structured as an openly-accessible, web-based data entry portal available at www.treetype.org,via which datasets for individual trees or in bulk viaspreadsheets can be entered. A core set of species hasbeen selected, to get the platform under way, but newusers have the option to suggest and vote for newspecies to be included in the portal and these will thenbe added once a sufficient critical mass of interest isdemonstrated. For each species, a ‘leader’ will beidentified who will promote and guide the collectionof data including optimising the protocols for thatspecies. Across all species, however, the project willaim to collect data on the same general set of traits,as well as locally-specific environmental data.
INGREDIENTS FOR SUCCESSThe TreeType project was conceived using the ‘citizenscience’ model, connecting a wide range of actors,from amateur naturalists to researchers, across thegeographic ranges of target tree species and providingthe infrastructure necessary for concerted datacollection. Such approaches are now widespread andhave been successfully deployed to gather data inmany scientific fields, notably on phenology (e.g.,Nature’s Calendar, Track-a-tree).
When it works, citizen science has the great advantagesof enabling data collection on a wide geographic scaleat low cost. However, a number of critical factors mustbe taken into account to achieve success.
• Firstly, data quality depends on a careful selection oftraits; they must be good indicators of the adaptiveprocess in the wild, but at the same time easy tomeasure for the non-specialist.
• Secondly, a robust, simple platform for data collectionis needed to promote participation.
• Finally, determined coordination, ensuring continualsteering and promotion of the project is essential tosee data collection through from project initiation tocompletion.
If these elements can be got right, then there is greatpotential to generate datasets of intrinsic value, as wellas a resource on which to build future projects.
Photo: Fotolia
25
the opportunity to be involved in collaborative work.Contributors are not automatically expected to be co-authors on any publications arising from the data, but theyshould be made aware of the data use, be offered anopportunity for involvement, and receive appropriateacknowledgement of any significant intellectual input. Inaddition to scientific publication, the data collected byTreeType will be regularly released to more generaldatabases (e.g., the TRY database) and reported in datapapers.
A phone application will be developed to facilitate datacollections by citizens.
A concerted effort will be made to use the TreeTypeinfrastructure to collect data for a set of key species, forwhich contributors will be actively sought. In parallel, theportal is essentially open to any enthusiastic researcherwho feels it can fit their needs for data collection in theirchosen species. We hope that initiating this project willenable and catalyse the establishment of somefundamental datasets which can be analysed in their ownright, and which can form the basis of new projects andstudies in the future, in particular those involving genome-wide genotyping.
ACKNOWLEDGEMENTSthe TreeType project was developed in collaborationand consultation with many colleagues across theEVOLTREE network. For their essential contributions,we thank Stephan Gaubitzer, Egbert Beuker, CelineBlanc-Jolivet, Oliver Brendel, José Climent, ThomasKällman, Christian Pichot, Tommi Suominen, JillThompson and the EVOLTREE Executive Committee.
REFERENCES• Neale DB, Kremer A. 2011. Forest tree genomics:
growing resources and applications. Nature ReviewsGenetics 12: 111-122.
• Castellanos MC, González-Martínez SC, Pausas JG.2015. Field heritability of a plant adaptation to fire inheterogeneous landscapes. Molecular Ecology 24:5633-5642.
• Pérez-Harguindeguy N, Díaz S, Garnier E, et al. (32more authors). 2013. New Handbook for standardizedmeasurement of plant functional traits worldwide.Australian Journal of Botany 61: 167-234.
• Phillimore AB, Stålhandske S, Smithers RJ, Bernard R.2012. Dissecting the contributions of plasticity andlocal adaptation to the phenology of a butterfly andits host plants. American Naturalist 180: 655-670.
RECORDED PHENOTYPIC TRAITS IN TREETYPE
1. DBH (cm): Trunk diameter at 1.30 m, i.e., approximatelyat an adult’s breast height.
2. Height (m): Height from ground to tallest part of thecrown.
3. Crown size (m): Crown size is a measure of thefootprint or plan area of the crown of a treeexpressed as crown width.
4. Stem form (class): Stem form is measured using acategorical classification based on straightness andverticality.
5. Bark thickness (mm): Bark thickness is the thicknessof the part of the stem that is external to the woodor xylem, including the vascular cambium.
6. Number of fruits (units): Fruits counted from theground using binoculars.
7. Seed mass (g): Seed mass is the oven-dried mass ofan average seed.
8. First flowering date: The date when the first maleand/or female flower is observed.
9. Bud flush date: Bud flush or bud break is the firstevidence of active growth resumption in the spring.
10. SLA, Specific leaf area (cm2/g): Specific leaf area(SLA) is the one-sided area of a fresh needle,divided by its oven-dry mass.
11. Foliar damage (%): Leave damage regardless of thecause of the damage.
12. Tree age (years): The age of the tree. Agedetermination is very important to compare treesgrowing in different environments.
Photo: S.C.Martinínez-González

26
Research highlights: science that matters
27
POTENTIAL FOR EVOLUTIONARY RESPONSESTO CLIMATE CHANGE -EVIDENCE FROM TREE POPULATIONS
Florian J. Alberto1,2, Sally N. Aitken3, Ricardo Alía4,Santiago C. González-Martínez4, Heikki Hänninen5,Antoine Kremer2, François Lefèvre6, Thomas Lenormand7,Sam Yeaman3,8, Ross Whetten9, Outi Savolainen1
1 Department of Biology and Biocenter Oulu, University of Oulu, Oulu, FIN-90014 Finland
2 INRA, UMR1202 Biodiversité Gènes et Communautés, Cestas, F-33610, Franceand Université de Bordeaux, UMR1202 Biodiversité Gènes et Communautés,Talence, F-33410, France
3 Department of Forest and Conservation Sciences and Centre for ForestConservation Genetics, University of British Columbia, Vancouver, BC V6T 1Z4,Canada
4 Department of Forest Ecology and Genetics, INIA - Forest Research Centre,E-28040 Madrid, Spain
5 Department of Biosciences, University of Helsinki, Helsinki, FIN-00014 Finland6 INRA, UR629 Ecologie des Forêts Méditerranéennes, URFM, Avignon,
F-84914, France7 Centre d’Ecologie Fonctionnelle et Evolutive, CNRS, Université de Montpellier,
UMR 5175, Montpellier F-34293, France8 Institute of Biology, Université de Neuchâtel, Neuchâtel, CH-2000,
Switzerland9 Department of Forestry & Environmental Resources, NC State University
Raleigh NC 27695-8008, USA.
Corresponding Author:Outi SavolainenDepartment of Biology and Biocenter Oulu FIN-90014 University of [email protected]
IntroductionPopulations can respond to environmental changethrough phenotypic plasticity, by moving to a new areacorresponding to environmental conditions they areadapted to, by genetically adapting to the new conditions,or by combinations of these responses (Aitken et al.2008). Most attention has been paid to range expansionor contraction (Chen et al. 2011, Parmesan, 2006), typicallyusing models that assume the species are genetically
homogenous. The potential for genetic responses has
often been neglected, for instance in the IPCC reports
(IPCC, 2001, IPCC, 2007), even if it is well known that
evolutionary changes, i.e. genetic responses, have
historically accompanied changes in climate (Davis &
Shaw, 2001). Further, it is also now understood that the
rate of adaptation required by climate change varies
among geographic regions (Loarie et al. 2009). Modeling
work on the potential of populations and species to
Evolutionary responses are required for tree populations to be able to track climate change. Resultsof two hundred years of common garden experiments show that most forest trees have evolved localadaptation, as evidenced by the adaptive differentiation of populations in quantitative traits,reflecting environmental conditions of population origins. Based on patterns of quantitative variationfor 19 adaptation related traits studied in 59 tree species (mostly temperate and boreal species fromthe Northern hemisphere), we found that genetic differentiation between populations and clinalvariation along environmental gradients were very common (respectively 90% and 78% of cases).Thus, responding to climate change will likely require that the quantitative traits of populations againmatch their environments. We examine what kind of information is needed for evaluating the potential to respond, and whatinformation is already available. We review the genetic models related to selection responses, andwhat is known currently about the genetic basis of the traits. We address special problems to befound at the range margins, and highlight the need for more modeling to understand specific issuesat southern and northern margins. We need new common garden experiments, for less known species.For extensively studied species, new experiments are needed outside the current ranges. Improvinggenomic information will allow better prediction of responses. Competitive and other interactionswithin species and interactions between species deserve more consideration. Despite the longgeneration times, the strong background in quantitative genetics and growing genomic resourcesmake forest trees useful species for climate change research. The greatest adaptive response isexpected when populations are large, have high genetic variability, selection is strong, and there isecological opportunity for establishment of improved genotypes.
Key words: quantitative genetics, adaptive traits, natural selection, local adaptation, phenotypic plasticity,provenance trials, conifers.
Tables S1, S2 and S3, along with the corresponding supporting information legends and references, can bedownloaded here: http://onlinelibrary.wiley.com/wol1/doi/10.1111/gcb.12181/suppinfo
Published in Global Change Biology (2013) 19: 1645-1661, with doi:10.1111/gcb.12181
28
respond genetically to recent climate change is advancing(see Franks & Hoffmann, 2012, Hoffmann & Sgrò, 2011,Shaw & Etterson, 2012 for recent reviews). The immediateresponses via phenotypic plasticity have also beenconsidered in the context of climate change (Nicotra et al.2010).Here we examine the importance of and potential forgenetic responses to climate change in forest treepopulations. Trees are ecologically key species in manyterrestrial ecosystems, including boreal and temperateforests in Europe and North America. Their response toclimate change can substantively impact the globalcarbon cycle. Local adaptation (Kawecki & Ebert, 2004)is more common in trees than in some other plant species.Tree species are adapted, to the current climate, and theyare thus potentially greatly influenced by the rapidchanges in climate (Savolainen et al. 2007). The longgeneration times are a challenge for research, but treesalso provide some advantages for these studies, asdescribed below. First, adaptation to climate change will depend onphenotypic traits relevant in the new environments, suchas timing of growth and drought or cold tolerance. Thereis an extraordinary wealth of information on thequantitative genetics and population differentiation oftrees for these traits, based on 250 years of forestrycommon garden experiments, known as provenance trials(Langlet, 1971, Morgenstern, 1996), and on extensive treebreeding experience. Secondly, the demographic history since the last glacialmaximum has been reconstructed for several tree speciesby combining phylogeographic and palynologicalapproaches with coalescent-based studies of populationdemography (Cheddadi et al. 2006, Eckert et al. 2010,Heuertz et al. 2006, Magri et al. 2006, McLachlan et al.2005, Parducci et al. 2012, Petit et al. 2002, Soltis et al.2006). Rates of past adaptation of trees to climatechanges can be inferred from these studies (Hendry &Kinnison, 1999). The increasing knowledge of themolecular basis of quantitative trait variation (see Neale& Kremer, 2011 for references) can improve predictivemodels (see e.g., Wilczek et al. 2010). This body ofbackground information allows us to examine the potentialfor adaptation in natural conditions better than in manyother organisms. For instance, in butterflies, studies ofresponses to climate change have relied nearly exclusivelyon examining molecular marker variation (Hill et al. 2011).Trees have very long generation times, but they sharepopulation genetic characteristics with other outcrossingplants and animals with high levels of gene flow and largeeffective population sizes (Petit & Hampe, 2006). Trees arehighly fecund, and may rapidly increase their populationsizes. Because they are sessile, they generally have goodtolerance of a range of environmental conditions and largeplastic responses. There are ecologically and commerciallyimportant trees with large continuous distributions, suchas Picea abies, Pinus contorta, and Pinus sylvestris, but also
species with small, fragmented distributions moresusceptible to genetic drift. The dispersal capacity of treespecies will play a crucial role in their potential foradaptation. Hybridization between closely related treespecies can also influence their adaptive capacity out oftheir current range, as it has been shown in otherorganisms (Hoffmann & Sgrò, 2011, Olson-Manning et al.2012 and references therein). The focus of this review is on predicting evolutionaryresponses, with as much evolutionary, genetic, andecological realism as possible. We examine the modelsneeded for prediction, starting with the simplest modelsof evolution in individual populations, and continuing tomore complex and more realistic models involving multiplepopulations in heterogeneous environments. We discusswhat data are needed for realistic prediction of geneticresponses, what information is already available, and whatadditional information we need in terms of new models,new data, or new analyses of existing data (Lindner et al.2010). Quantitative genetic models of evolutionaryresponse deal with traits that will confer adaptation tofuture environments. While it is not easy to predict whattraits will be most important in the future, it is reasonableto examine traits related to climate, such as the timing ofgrowth and reproduction (Hänninen & Tanino, 2011, Rohde& Bhalerao, 2007) or cold and drought tolerance(Niinemets, 2010).
Evolution in one isolated population A single population: the breeder’s equation
According to the breeder’s equation, the simplest modelgoverning response to directional selection on a singletrait, the response in a large population with no gene flowdepends on the strength of selection, on the amount ofgenetic variation, and its ratio to total phenotypic variation(heritability; (see Falconer & Mackay, 1996). If there is nogenetic variation, any change in phenotype in a novelenvironment inducing directional selection would be dueto phenotypic plasticity alone. Forest tree populationsharbor considerable genetic variability in manyquantitative traits (Cornelius, 1994, Howe et al. 2003,Morgenstern, 1996) as well as at the DNA level (Savolainen& Pyhäjärvi, 2007). While tree breeders can control theintensity of selection and predict responses in breedingpopulations, it is much more difficult to make suchpredictions in the wild. Environmental variances will behigher, and heritabilities generally lower (Conner et al.2003). Methods for estimating heritabilities in the wild areimproving because of much better estimates ofrelatedness and improved methods (Ritland, 1996,Sillanpää, 2011), and will be of critical importance tounderstanding responses to climate change. Assessing the strength of directional selection is ademanding task, as we do not even know exactly whichtraits are most important for fitness, and the longevity of
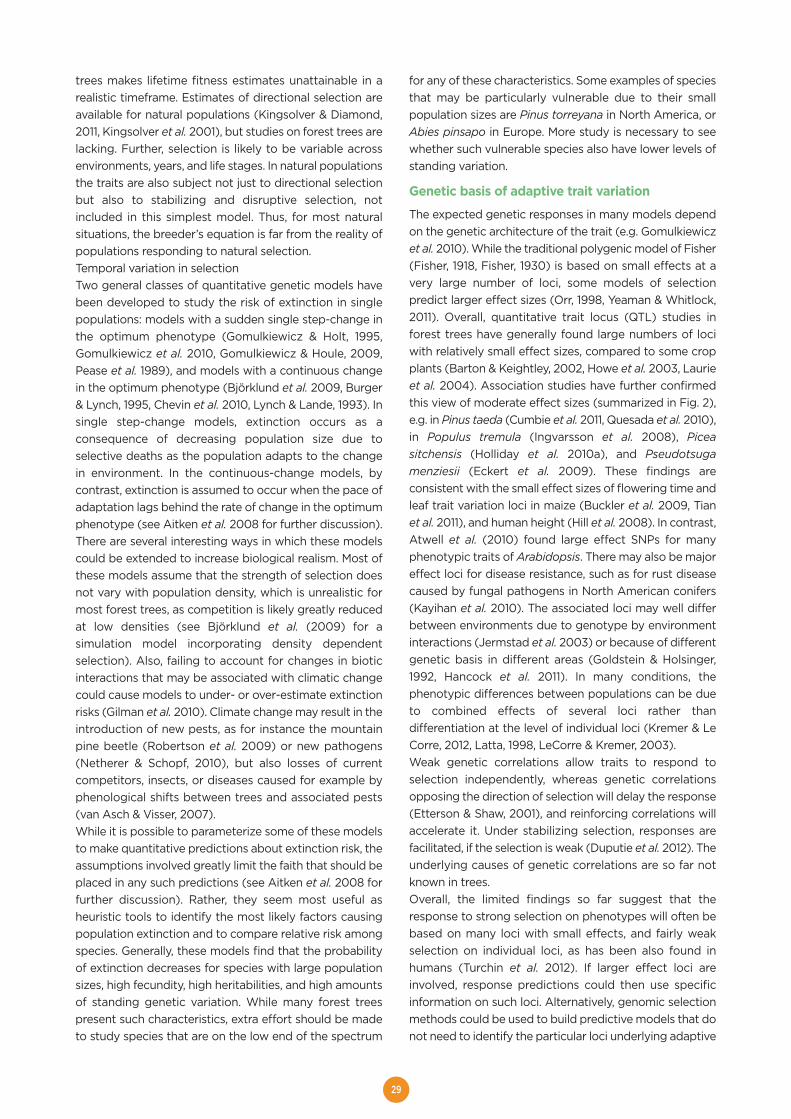
29
trees makes lifetime fitness estimates unattainable in arealistic timeframe. Estimates of directional selection areavailable for natural populations (Kingsolver & Diamond,2011, Kingsolver et al. 2001), but studies on forest trees arelacking. Further, selection is likely to be variable acrossenvironments, years, and life stages. In natural populationsthe traits are also subject not just to directional selectionbut also to stabilizing and disruptive selection, notincluded in this simplest model. Thus, for most naturalsituations, the breeder’s equation is far from the reality ofpopulations responding to natural selection.Temporal variation in selectionTwo general classes of quantitative genetic models havebeen developed to study the risk of extinction in singlepopulations: models with a sudden single step-change inthe optimum phenotype (Gomulkiewicz & Holt, 1995,Gomulkiewicz et al. 2010, Gomulkiewicz & Houle, 2009,Pease et al. 1989), and models with a continuous changein the optimum phenotype (Björklund et al. 2009, Burger& Lynch, 1995, Chevin et al. 2010, Lynch & Lande, 1993). Insingle step-change models, extinction occurs as aconsequence of decreasing population size due toselective deaths as the population adapts to the changein environment. In the continuous-change models, bycontrast, extinction is assumed to occur when the pace ofadaptation lags behind the rate of change in the optimumphenotype (see Aitken et al. 2008 for further discussion).There are several interesting ways in which these modelscould be extended to increase biological realism. Most ofthese models assume that the strength of selection doesnot vary with population density, which is unrealistic formost forest trees, as competition is likely greatly reducedat low densities (see Björklund et al. (2009) for asimulation model incorporating density dependentselection). Also, failing to account for changes in bioticinteractions that may be associated with climatic changecould cause models to under- or over-estimate extinctionrisks (Gilman et al. 2010). Climate change may result in theintroduction of new pests, as for instance the mountainpine beetle (Robertson et al. 2009) or new pathogens(Netherer & Schopf, 2010), but also losses of currentcompetitors, insects, or diseases caused for example byphenological shifts between trees and associated pests(van Asch & Visser, 2007).While it is possible to parameterize some of these modelsto make quantitative predictions about extinction risk, theassumptions involved greatly limit the faith that should beplaced in any such predictions (see Aitken et al. 2008 forfurther discussion). Rather, they seem most useful asheuristic tools to identify the most likely factors causingpopulation extinction and to compare relative risk amongspecies. Generally, these models find that the probabilityof extinction decreases for species with large populationsizes, high fecundity, high heritabilities, and high amountsof standing genetic variation. While many forest treespresent such characteristics, extra effort should be madeto study species that are on the low end of the spectrum
for any of these characteristics. Some examples of speciesthat may be particularly vulnerable due to their smallpopulation sizes are Pinus torreyana in North America, orAbies pinsapo in Europe. More study is necessary to seewhether such vulnerable species also have lower levels ofstanding variation.
Genetic basis of adaptive trait variation
The expected genetic responses in many models dependon the genetic architecture of the trait (e.g. Gomulkiewiczet al. 2010). While the traditional polygenic model of Fisher(Fisher, 1918, Fisher, 1930) is based on small effects at avery large number of loci, some models of selectionpredict larger effect sizes (Orr, 1998, Yeaman & Whitlock,2011). Overall, quantitative trait locus (QTL) studies inforest trees have generally found large numbers of lociwith relatively small effect sizes, compared to some cropplants (Barton & Keightley, 2002, Howe et al. 2003, Laurieet al. 2004). Association studies have further confirmedthis view of moderate effect sizes (summarized in Fig. 2),e.g. in Pinus taeda (Cumbie et al. 2011, Quesada et al. 2010),in Populus tremula (Ingvarsson et al. 2008), Piceasitchensis (Holliday et al. 2010a), and Pseudotsugamenziesii (Eckert et al. 2009). These findings areconsistent with the small effect sizes of flowering time andleaf trait variation loci in maize (Buckler et al. 2009, Tianet al. 2011), and human height (Hill et al. 2008). In contrast,Atwell et al. (2010) found large effect SNPs for manyphenotypic traits of Arabidopsis. There may also be majoreffect loci for disease resistance, such as for rust diseasecaused by fungal pathogens in North American conifers(Kayihan et al. 2010). The associated loci may well differbetween environments due to genotype by environmentinteractions (Jermstad et al. 2003) or because of differentgenetic basis in different areas (Goldstein & Holsinger,1992, Hancock et al. 2011). In many conditions, thephenotypic differences between populations can be dueto combined effects of several loci rather thandifferentiation at the level of individual loci (Kremer & LeCorre, 2012, Latta, 1998, LeCorre & Kremer, 2003).Weak genetic correlations allow traits to respond toselection independently, whereas genetic correlationsopposing the direction of selection will delay the response(Etterson & Shaw, 2001), and reinforcing correlations willaccelerate it. Under stabilizing selection, responses arefacilitated, if the selection is weak (Duputie et al. 2012). Theunderlying causes of genetic correlations are so far notknown in trees. Overall, the limited findings so far suggest that theresponse to strong selection on phenotypes will often bebased on many loci with small effects, and fairly weakselection on individual loci, as has been also found inhumans (Turchin et al. 2012). If larger effect loci areinvolved, response predictions could then use specificinformation on such loci. Alternatively, genomic selectionmethods could be used to build predictive models that donot need to identify the particular loci underlying adaptive
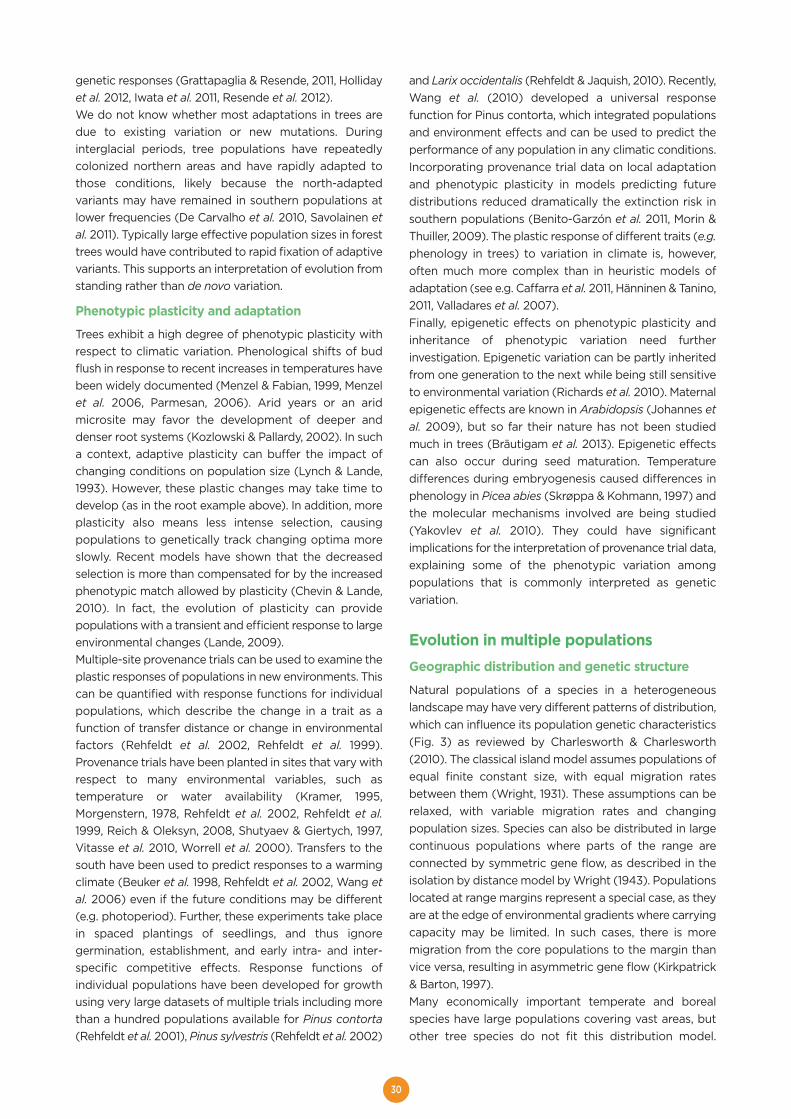
30
genetic responses (Grattapaglia & Resende, 2011, Hollidayet al. 2012, Iwata et al. 2011, Resende et al. 2012).We do not know whether most adaptations in trees aredue to existing variation or new mutations. Duringinterglacial periods, tree populations have repeatedlycolonized northern areas and have rapidly adapted tothose conditions, likely because the north-adaptedvariants may have remained in southern populations atlower frequencies (De Carvalho et al. 2010, Savolainen etal. 2011). Typically large effective population sizes in foresttrees would have contributed to rapid fixation of adaptivevariants. This supports an interpretation of evolution fromstanding rather than de novo variation.
Phenotypic plasticity and adaptation
Trees exhibit a high degree of phenotypic plasticity withrespect to climatic variation. Phenological shifts of budflush in response to recent increases in temperatures havebeen widely documented (Menzel & Fabian, 1999, Menzelet al. 2006, Parmesan, 2006). Arid years or an aridmicrosite may favor the development of deeper anddenser root systems (Kozlowski & Pallardy, 2002). In sucha context, adaptive plasticity can buffer the impact ofchanging conditions on population size (Lynch & Lande,1993). However, these plastic changes may take time todevelop (as in the root example above). In addition, moreplasticity also means less intense selection, causingpopulations to genetically track changing optima moreslowly. Recent models have shown that the decreasedselection is more than compensated for by the increasedphenotypic match allowed by plasticity (Chevin & Lande,2010). In fact, the evolution of plasticity can providepopulations with a transient and efficient response to largeenvironmental changes (Lande, 2009).Multiple-site provenance trials can be used to examine theplastic responses of populations in new environments. Thiscan be quantified with response functions for individualpopulations, which describe the change in a trait as afunction of transfer distance or change in environmentalfactors (Rehfeldt et al. 2002, Rehfeldt et al. 1999).Provenance trials have been planted in sites that vary withrespect to many environmental variables, such astemperature or water availability (Kramer, 1995,Morgenstern, 1978, Rehfeldt et al. 2002, Rehfeldt et al.1999, Reich & Oleksyn, 2008, Shutyaev & Giertych, 1997,Vitasse et al. 2010, Worrell et al. 2000). Transfers to thesouth have been used to predict responses to a warmingclimate (Beuker et al. 1998, Rehfeldt et al. 2002, Wang etal. 2006) even if the future conditions may be different(e.g. photoperiod). Further, these experiments take placein spaced plantings of seedlings, and thus ignoregermination, establishment, and early intra- and inter-specific competitive effects. Response functions ofindividual populations have been developed for growthusing very large datasets of multiple trials including morethan a hundred populations available for Pinus contorta(Rehfeldt et al. 2001), Pinus sylvestris (Rehfeldt et al. 2002)
and Larix occidentalis (Rehfeldt & Jaquish, 2010). Recently,Wang et al. (2010) developed a universal responsefunction for Pinus contorta, which integrated populationsand environment effects and can be used to predict theperformance of any population in any climatic conditions.Incorporating provenance trial data on local adaptationand phenotypic plasticity in models predicting futuredistributions reduced dramatically the extinction risk insouthern populations (Benito-Garzón et al. 2011, Morin &Thuiller, 2009). The plastic response of different traits (e.g.phenology in trees) to variation in climate is, however,often much more complex than in heuristic models ofadaptation (see e.g. Caffarra et al. 2011, Hänninen & Tanino,2011, Valladares et al. 2007). Finally, epigenetic effects on phenotypic plasticity andinheritance of phenotypic variation need furtherinvestigation. Epigenetic variation can be partly inheritedfrom one generation to the next while being still sensitiveto environmental variation (Richards et al. 2010). Maternalepigenetic effects are known in Arabidopsis (Johannes etal. 2009), but so far their nature has not been studiedmuch in trees (Bräutigam et al. 2013). Epigenetic effectscan also occur during seed maturation. Temperaturedifferences during embryogenesis caused differences inphenology in Picea abies (Skrøppa & Kohmann, 1997) andthe molecular mechanisms involved are being studied(Yakovlev et al. 2010). They could have significantimplications for the interpretation of provenance trial data,explaining some of the phenotypic variation amongpopulations that is commonly interpreted as geneticvariation.
Evolution in multiple populationsGeographic distribution and genetic structure
Natural populations of a species in a heterogeneouslandscape may have very different patterns of distribution,which can influence its population genetic characteristics(Fig. 3) as reviewed by Charlesworth & Charlesworth(2010). The classical island model assumes populations ofequal finite constant size, with equal migration ratesbetween them (Wright, 1931). These assumptions can berelaxed, with variable migration rates and changingpopulation sizes. Species can also be distributed in largecontinuous populations where parts of the range areconnected by symmetric gene flow, as described in theisolation by distance model by Wright (1943). Populationslocated at range margins represent a special case, as theyare at the edge of environmental gradients where carryingcapacity may be limited. In such cases, there is moremigration from the core populations to the margin thanvice versa, resulting in asymmetric gene flow (Kirkpatrick& Barton, 1997). Many economically important temperate and borealspecies have large populations covering vast areas, butother tree species do not fit this distribution model.
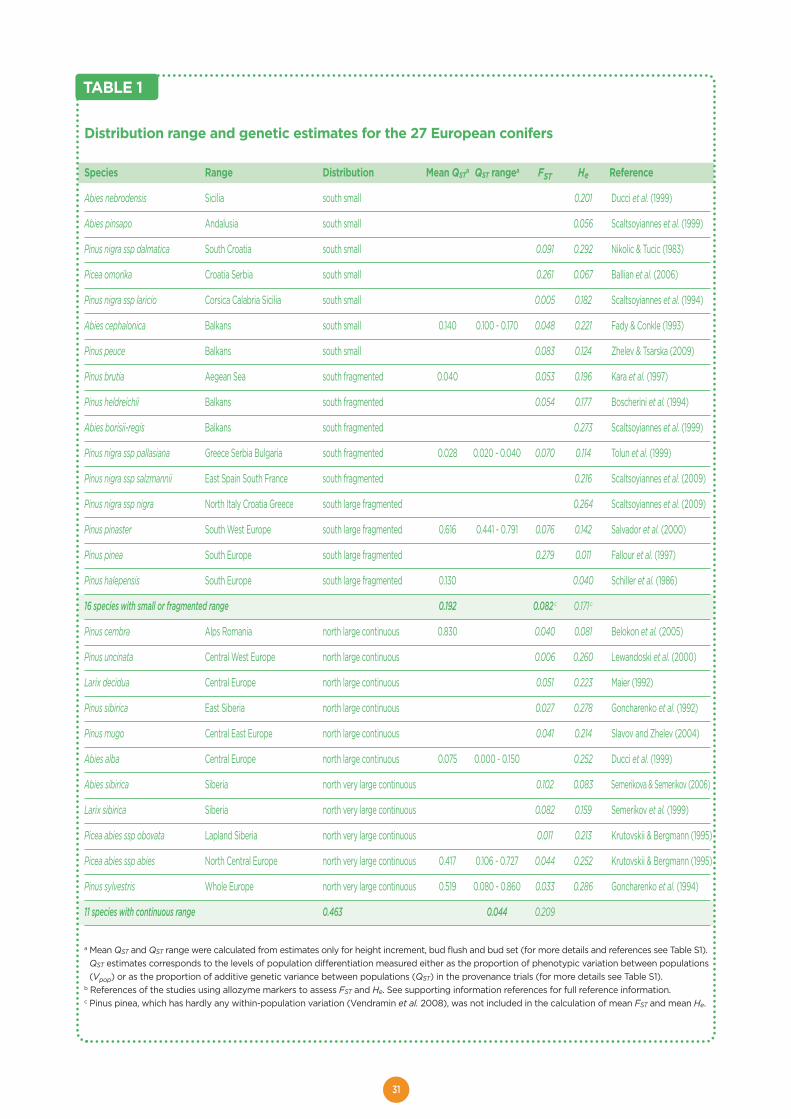
31
Distribution range and genetic estimates for the 27 European conifers
Species Range Distribution Mean QSTa QST rangea FST He Reference
Abies nebrodensis Sicilia south small 0.201 Ducci et al. (1999)
Abies pinsapo Andalusia south small 0.056 Scaltsoyiannes et al. (1999)
Pinus nigra ssp dalmatica South Croatia south small 0.091 0.292 Nikolic & Tucic (1983)
Picea omorika Croatia Serbia south small 0.261 0.067 Ballian et al. (2006)
Pinus nigra ssp laricio Corsica Calabria Sicilia south small 0.005 0.182 Scaltsoyiannes et al. (1994)
Abies cephalonica Balkans south small 0.140 0.100 - 0.170 0.048 0.221 Fady & Conkle (1993)
Pinus peuce Balkans south small 0.083 0.124 Zhelev & Tsarska (2009)
Pinus brutia Aegean Sea south fragmented 0.040 0.053 0.196 Kara et al. (1997)
Pinus heldreichii Balkans south fragmented 0.054 0.177 Boscherini et al. (1994)
Abies borisii-regis Balkans south fragmented 0.273 Scaltsoyiannes et al. (1999)
Pinus nigra ssp pallasiana Greece Serbia Bulgaria south fragmented 0.028 0.020 - 0.040 0.070 0.114 Tolun et al. (1999)
Pinus nigra ssp salzmannii East Spain South France south fragmented 0.216 Scaltsoyiannes et al. (2009)
Pinus nigra ssp nigra North Italy Croatia Greece south large fragmented 0.264 Scaltsoyiannes et al. (2009)
Pinus pinaster South West Europe south large fragmented 0.616 0.441 - 0.791 0.076 0.142 Salvador et al. (2000)
Pinus pinea South Europe south large fragmented 0.279 0.011 Fallour et al. (1997)
Pinus halepensis South Europe south large fragmented 0.130 0.040 Schiller et al. (1986)
16 species with small or fragmented range 0.192 0.082 c 0.171 c
Pinus cembra Alps Romania north large continuous 0.830 0.040 0.081 Belokon et al. (2005)
Pinus uncinata Central West Europe north large continuous 0.006 0.260 Lewandoski et al. (2000)
Larix decidua Central Europe north large continuous 0.051 0.223 Maier (1992)
Pinus sibirica East Siberia north large continuous 0.027 0.278 Goncharenko et al. (1992)
Pinus mugo Central East Europe north large continuous 0.041 0.214 Slavov and Zhelev (2004)
Abies alba Central Europe north large continuous 0.075 0.000 - 0.150 0.252 Ducci et al. (1999)
Abies sibirica Siberia north very large continuous 0.102 0.083 Semerikova & Semerikov (2006)
Larix sibirica Siberia north very large continuous 0.082 0.159 Semerikov et al. (1999)
Picea abies ssp obovata Lapland Siberia north very large continuous 0.011 0.213 Krutovskii & Bergmann (1995)
Picea abies ssp abies North Central Europe north very large continuous 0.417 0.106 - 0.727 0.044 0.252 Krutovskii & Bergmann (1995)
Pinus sylvestris Whole Europe north very large continuous 0.519 0.080 - 0.860 0.033 0.286 Goncharenko et al. (1994)
11 species with continuous range 0.463 0.044 0.209
a Mean QST and QST range were calculated from estimates only for height increment, bud flush and bud set (for more details and references see Table S1).QST estimates corresponds to the levels of population differentiation measured either as the proportion of phenotypic variation between populations(Vpop) or as the proportion of additive genetic variance between populations (QST) in the provenance trials (for more details see Table S1).
b References of the studies using allozyme markers to assess FST and He. See supporting information references for full reference information.c Pinus pinea, which has hardly any within-population variation (Vendramin et al. 2008), was not included in the calculation of mean FST and mean He.
TABLE 1
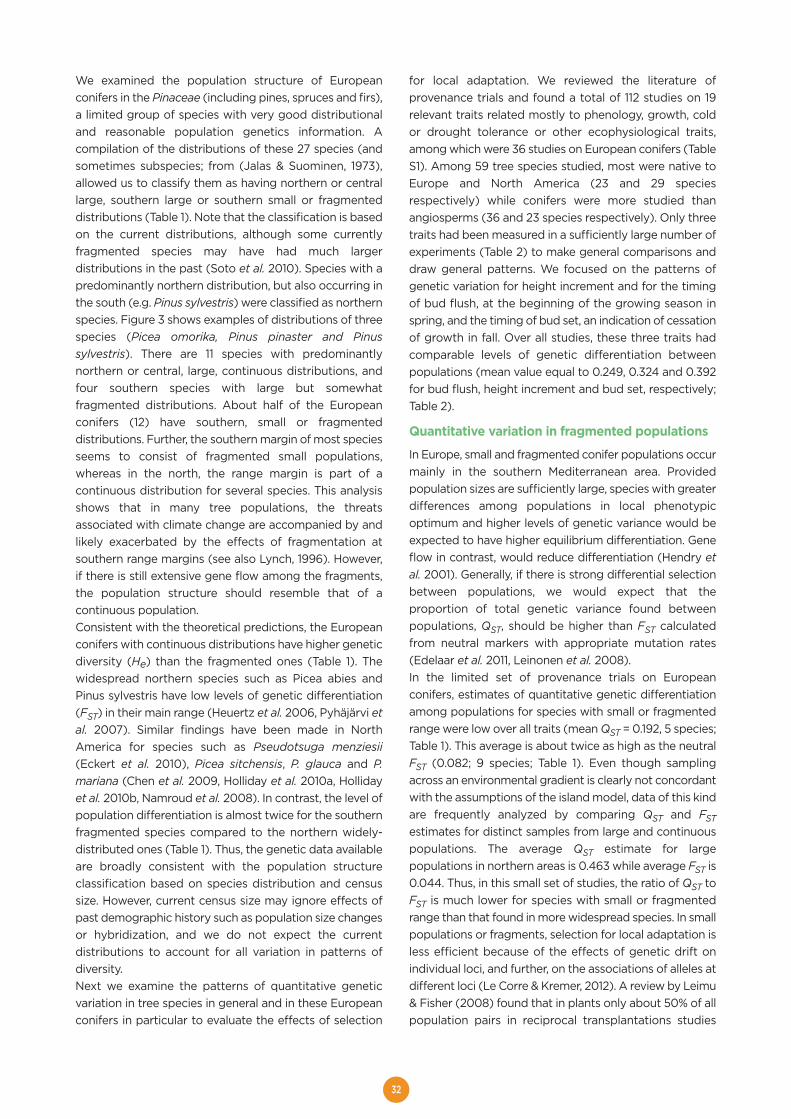
32
We examined the population structure of Europeanconifers in the Pinaceae (including pines, spruces and firs),a limited group of species with very good distributionaland reasonable population genetics information. Acompilation of the distributions of these 27 species (andsometimes subspecies; from (Jalas & Suominen, 1973),allowed us to classify them as having northern or centrallarge, southern large or southern small or fragmenteddistributions (Table 1). Note that the classification is basedon the current distributions, although some currentlyfragmented species may have had much largerdistributions in the past (Soto et al. 2010). Species with apredominantly northern distribution, but also occurring inthe south (e.g. Pinus sylvestris) were classified as northernspecies. Figure 3 shows examples of distributions of threespecies (Picea omorika, Pinus pinaster and Pinussylvestris). There are 11 species with predominantlynorthern or central, large, continuous distributions, andfour southern species with large but somewhatfragmented distributions. About half of the Europeanconifers (12) have southern, small or fragmenteddistributions. Further, the southern margin of most speciesseems to consist of fragmented small populations,whereas in the north, the range margin is part of acontinuous distribution for several species. This analysisshows that in many tree populations, the threatsassociated with climate change are accompanied by andlikely exacerbated by the effects of fragmentation atsouthern range margins (see also Lynch, 1996). However,if there is still extensive gene flow among the fragments,the population structure should resemble that of acontinuous population.Consistent with the theoretical predictions, the Europeanconifers with continuous distributions have higher geneticdiversity (He) than the fragmented ones (Table 1). Thewidespread northern species such as Picea abies andPinus sylvestris have low levels of genetic differentiation(FST) in their main range (Heuertz et al. 2006, Pyhäjärvi etal. 2007). Similar findings have been made in NorthAmerica for species such as Pseudotsuga menziesii(Eckert et al. 2010), Picea sitchensis, P. glauca and P.mariana (Chen et al. 2009, Holliday et al. 2010a, Hollidayet al. 2010b, Namroud et al. 2008). In contrast, the level ofpopulation differentiation is almost twice for the southernfragmented species compared to the northern widely-distributed ones (Table 1). Thus, the genetic data availableare broadly consistent with the population structureclassification based on species distribution and censussize. However, current census size may ignore effects ofpast demographic history such as population size changesor hybridization, and we do not expect the currentdistributions to account for all variation in patterns ofdiversity. Next we examine the patterns of quantitative geneticvariation in tree species in general and in these Europeanconifers in particular to evaluate the effects of selection
for local adaptation. We reviewed the literature ofprovenance trials and found a total of 112 studies on 19relevant traits related mostly to phenology, growth, coldor drought tolerance or other ecophysiological traits,among which were 36 studies on European conifers (TableS1). Among 59 tree species studied, most were native toEurope and North America (23 and 29 speciesrespectively) while conifers were more studied thanangiosperms (36 and 23 species respectively). Only threetraits had been measured in a sufficiently large number ofexperiments (Table 2) to make general comparisons anddraw general patterns. We focused on the patterns ofgenetic variation for height increment and for the timingof bud flush, at the beginning of the growing season inspring, and the timing of bud set, an indication of cessationof growth in fall. Over all studies, these three traits hadcomparable levels of genetic differentiation betweenpopulations (mean value equal to 0.249, 0.324 and 0.392for bud flush, height increment and bud set, respectively;Table 2).
Quantitative variation in fragmented populations
In Europe, small and fragmented conifer populations occurmainly in the southern Mediterranean area. Providedpopulation sizes are sufficiently large, species with greaterdifferences among populations in local phenotypicoptimum and higher levels of genetic variance would beexpected to have higher equilibrium differentiation. Geneflow in contrast, would reduce differentiation (Hendry etal. 2001). Generally, if there is strong differential selectionbetween populations, we would expect that theproportion of total genetic variance found betweenpopulations, QST, should be higher than FST calculatedfrom neutral markers with appropriate mutation rates(Edelaar et al. 2011, Leinonen et al. 2008).In the limited set of provenance trials on Europeanconifers, estimates of quantitative genetic differentiationamong populations for species with small or fragmentedrange were low over all traits (mean QST = 0.192, 5 species;Table 1). This average is about twice as high as the neutralFST (0.082; 9 species; Table 1). Even though samplingacross an environmental gradient is clearly not concordantwith the assumptions of the island model, data of this kindare frequently analyzed by comparing QST and FSTestimates for distinct samples from large and continuouspopulations. The average QST estimate for largepopulations in northern areas is 0.463 while average FST is0.044. Thus, in this small set of studies, the ratio of QST toFST is much lower for species with small or fragmentedrange than that found in more widespread species. In smallpopulations or fragments, selection for local adaptation isless efficient because of the effects of genetic drift onindividual loci, and further, on the associations of alleles atdifferent loci (Le Corre & Kremer, 2012). A review by Leimu& Fisher (2008) found that in plants only about 50% of allpopulation pairs in reciprocal transplantations studies
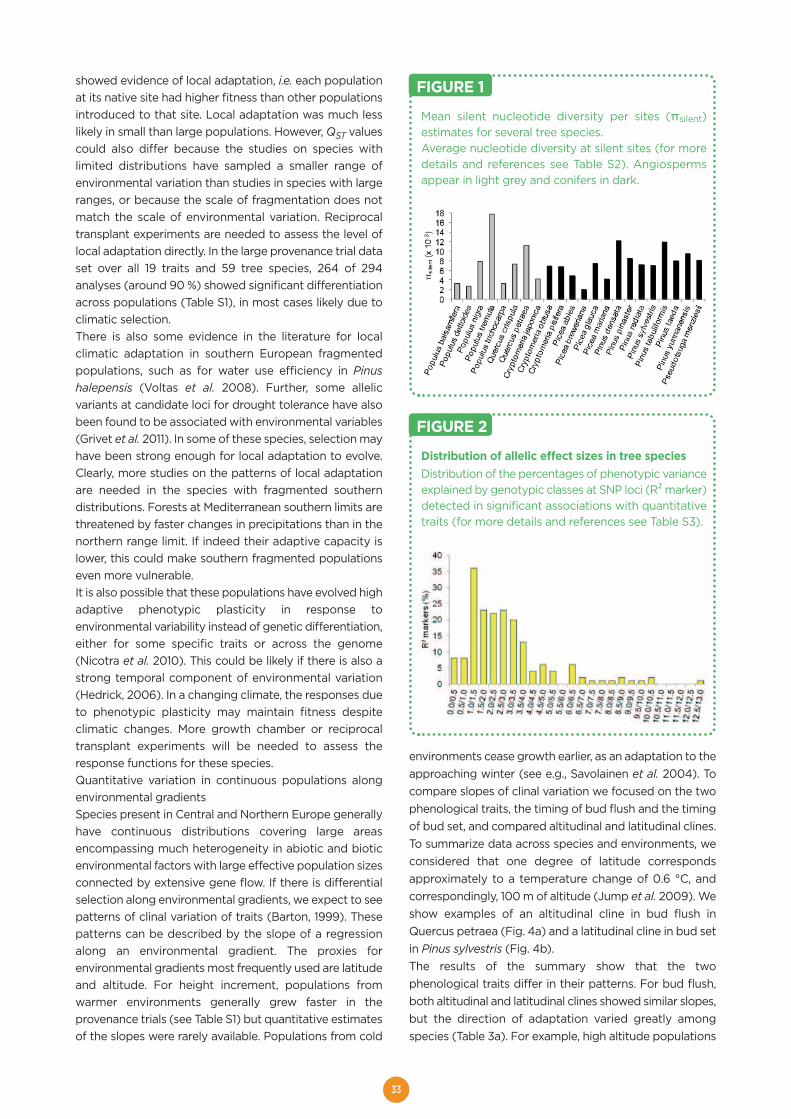
33
showed evidence of local adaptation, i.e. each populationat its native site had higher fitness than other populationsintroduced to that site. Local adaptation was much lesslikely in small than large populations. However, QST valuescould also differ because the studies on species withlimited distributions have sampled a smaller range ofenvironmental variation than studies in species with largeranges, or because the scale of fragmentation does notmatch the scale of environmental variation. Reciprocaltransplant experiments are needed to assess the level oflocal adaptation directly. In the large provenance trial dataset over all 19 traits and 59 tree species, 264 of 294analyses (around 90 %) showed significant differentiationacross populations (Table S1), in most cases likely due toclimatic selection. There is also some evidence in the literature for localclimatic adaptation in southern European fragmentedpopulations, such as for water use efficiency in Pinushalepensis (Voltas et al. 2008). Further, some allelicvariants at candidate loci for drought tolerance have alsobeen found to be associated with environmental variables(Grivet et al. 2011). In some of these species, selection mayhave been strong enough for local adaptation to evolve.Clearly, more studies on the patterns of local adaptationare needed in the species with fragmented southerndistributions. Forests at Mediterranean southern limits arethreatened by faster changes in precipitations than in thenorthern range limit. If indeed their adaptive capacity islower, this could make southern fragmented populationseven more vulnerable. It is also possible that these populations have evolved highadaptive phenotypic plasticity in response toenvironmental variability instead of genetic differentiation,either for some specific traits or across the genome(Nicotra et al. 2010). This could be likely if there is also astrong temporal component of environmental variation(Hedrick, 2006). In a changing climate, the responses dueto phenotypic plasticity may maintain fitness despiteclimatic changes. More growth chamber or reciprocaltransplant experiments will be needed to assess theresponse functions for these species. Quantitative variation in continuous populations alongenvironmental gradientsSpecies present in Central and Northern Europe generallyhave continuous distributions covering large areasencompassing much heterogeneity in abiotic and bioticenvironmental factors with large effective population sizesconnected by extensive gene flow. If there is differentialselection along environmental gradients, we expect to seepatterns of clinal variation of traits (Barton, 1999). Thesepatterns can be described by the slope of a regressionalong an environmental gradient. The proxies forenvironmental gradients most frequently used are latitudeand altitude. For height increment, populations fromwarmer environments generally grew faster in theprovenance trials (see Table S1) but quantitative estimatesof the slopes were rarely available. Populations from cold
environments cease growth earlier, as an adaptation to theapproaching winter (see e.g., Savolainen et al. 2004). Tocompare slopes of clinal variation we focused on the twophenological traits, the timing of bud flush and the timingof bud set, and compared altitudinal and latitudinal clines.To summarize data across species and environments, weconsidered that one degree of latitude correspondsapproximately to a temperature change of 0.6 °C, andcorrespondingly, 100 m of altitude (Jump et al. 2009). Weshow examples of an altitudinal cline in bud flush inQuercus petraea (Fig. 4a) and a latitudinal cline in bud setin Pinus sylvestris (Fig. 4b). The results of the summary show that the twophenological traits differ in their patterns. For bud flush,both altitudinal and latitudinal clines showed similar slopes,but the direction of adaptation varied greatly amongspecies (Table 3a). For example, high altitude populations
Mean silent nucleotide diversity per sites (πsilent)estimates for several tree species.Average nucleotide diversity at silent sites (for moredetails and references see Table S2). Angiospermsappear in light grey and conifers in dark.
FIGURE 1
Distribution of allelic effect sizes in tree species Distribution of the percentages of phenotypic varianceexplained by genotypic classes at SNP loci (R²marker)detected in significant associations with quantitativetraits (for more details and references see Table S3).
FIGURE 2
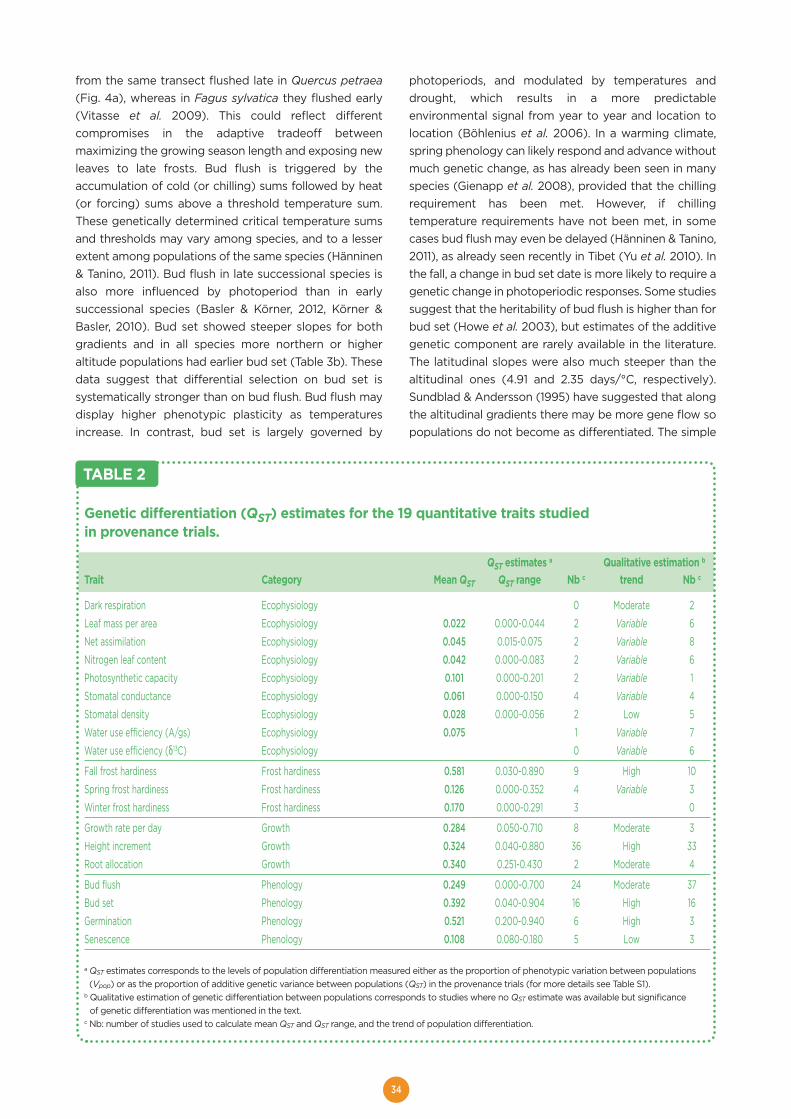
34
Genetic differentiation (QST) estimates for the 19 quantitative traits studiedin provenance trials.
QST estimates a Qualitative estimation b
Trait Category Mean QST QST range Nb c trend Nb c
Dark respiration Ecophysiology 0 Moderate 2Leaf mass per area Ecophysiology 0.022 0.000-0.044 2 Variable 6Net assimilation Ecophysiology 0.045 0.015-0.075 2 Variable 8Nitrogen leaf content Ecophysiology 0.042 0.000-0.083 2 Variable 6Photosynthetic capacity Ecophysiology 0.101 0.000-0.201 2 Variable 1Stomatal conductance Ecophysiology 0.061 0.000-0.150 4 Variable 4Stomatal density Ecophysiology 0.028 0.000-0.056 2 Low 5Water use efficiency (A/gs) Ecophysiology 0.075 1 Variable 7Water use efficiency (δ13C) Ecophysiology 0 Variable 6
Fall frost hardiness Frost hardiness 0.581 0.030-0.890 9 High 10Spring frost hardiness Frost hardiness 0.126 0.000-0.352 4 Variable 3Winter frost hardiness Frost hardiness 0.170 0.000-0.291 3 0
Growth rate per day Growth 0.284 0.050-0.710 8 Moderate 3Height increment Growth 0.324 0.040-0.880 36 High 33Root allocation Growth 0.340 0.251-0.430 2 Moderate 4
Bud flush Phenology 0.249 0.000-0.700 24 Moderate 37Bud set Phenology 0.392 0.040-0.904 16 High 16Germination Phenology 0.521 0.200-0.940 6 High 3Senescence Phenology 0.108 0.080-0.180 5 Low 3
a QST estimates corresponds to the levels of population differentiation measured either as the proportion of phenotypic variation between populations(Vpop) or as the proportion of additive genetic variance between populations (QST) in the provenance trials (for more details see Table S1).
b Qualitative estimation of genetic differentiation between populations corresponds to studies where no QST estimate was available but significanceof genetic differentiation was mentioned in the text.
c Nb: number of studies used to calculate mean QST and QST range, and the trend of population differentiation.
TABLE 2
from the same transect flushed late in Quercus petraea(Fig. 4a), whereas in Fagus sylvatica they flushed early(Vitasse et al. 2009). This could reflect differentcompromises in the adaptive tradeoff betweenmaximizing the growing season length and exposing newleaves to late frosts. Bud flush is triggered by theaccumulation of cold (or chilling) sums followed by heat(or forcing) sums above a threshold temperature sum.These genetically determined critical temperature sumsand thresholds may vary among species, and to a lesserextent among populations of the same species (Hänninen& Tanino, 2011). Bud flush in late successional species isalso more influenced by photoperiod than in earlysuccessional species (Basler & Körner, 2012, Körner &Basler, 2010). Bud set showed steeper slopes for bothgradients and in all species more northern or higheraltitude populations had earlier bud set (Table 3b). Thesedata suggest that differential selection on bud set issystematically stronger than on bud flush. Bud flush maydisplay higher phenotypic plasticity as temperaturesincrease. In contrast, bud set is largely governed by
photoperiods, and modulated by temperatures anddrought, which results in a more predictableenvironmental signal from year to year and location tolocation (Böhlenius et al. 2006). In a warming climate,spring phenology can likely respond and advance withoutmuch genetic change, as has already been seen in manyspecies (Gienapp et al. 2008), provided that the chillingrequirement has been met. However, if chillingtemperature requirements have not been met, in somecases bud flush may even be delayed (Hänninen & Tanino,2011), as already seen recently in Tibet (Yu et al. 2010). Inthe fall, a change in bud set date is more likely to require agenetic change in photoperiodic responses. Some studiessuggest that the heritability of bud flush is higher than forbud set (Howe et al. 2003), but estimates of the additivegenetic component are rarely available in the literature.The latitudinal slopes were also much steeper than thealtitudinal ones (4.91 and 2.35 days/°C, respectively).Sundblad & Andersson (1995) have suggested that alongthe altitudinal gradients there may be more gene flow sopopulations do not become as differentiated. The simple
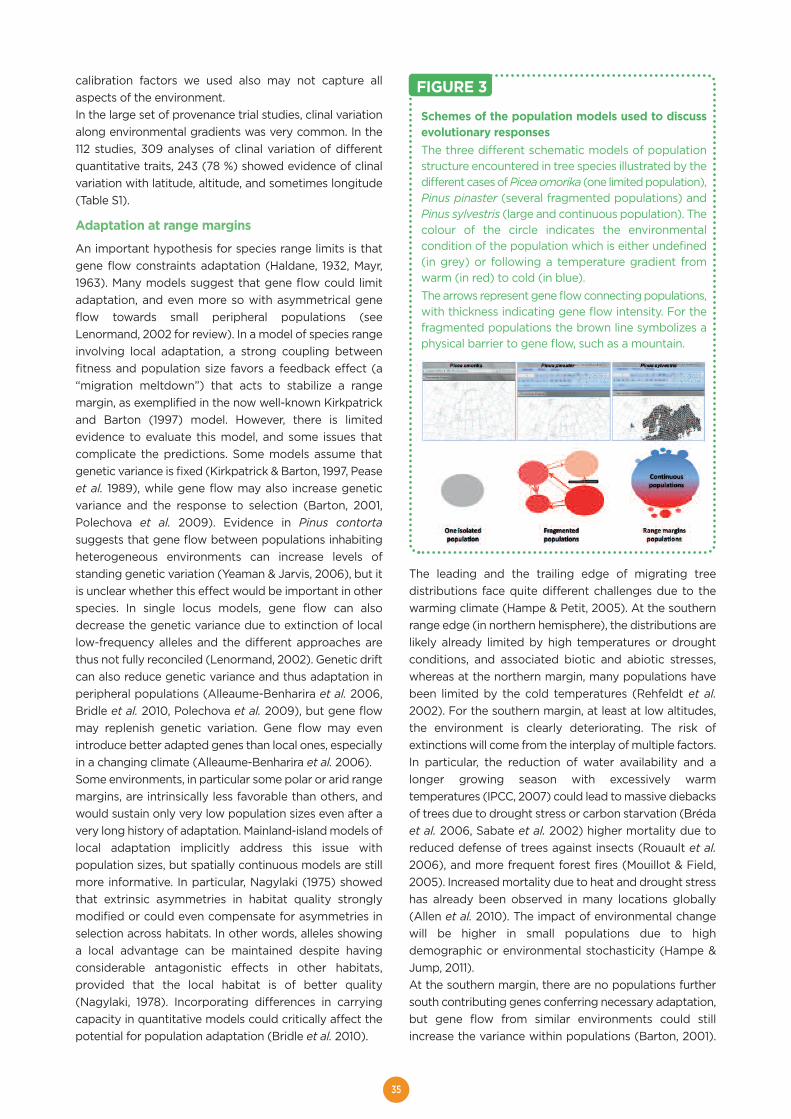
35
calibration factors we used also may not capture allaspects of the environment.In the large set of provenance trial studies, clinal variationalong environmental gradients was very common. In the112 studies, 309 analyses of clinal variation of differentquantitative traits, 243 (78 %) showed evidence of clinalvariation with latitude, altitude, and sometimes longitude(Table S1).
Adaptation at range margins
An important hypothesis for species range limits is thatgene flow constraints adaptation (Haldane, 1932, Mayr,1963). Many models suggest that gene flow could limitadaptation, and even more so with asymmetrical geneflow towards small peripheral populations (seeLenormand, 2002 for review). In a model of species rangeinvolving local adaptation, a strong coupling betweenfitness and population size favors a feedback effect (a“migration meltdown”) that acts to stabilize a rangemargin, as exemplified in the now well-known Kirkpatrickand Barton (1997) model. However, there is limitedevidence to evaluate this model, and some issues thatcomplicate the predictions. Some models assume thatgenetic variance is fixed (Kirkpatrick & Barton, 1997, Peaseet al. 1989), while gene flow may also increase geneticvariance and the response to selection (Barton, 2001,Polechova et al. 2009). Evidence in Pinus contortasuggests that gene flow between populations inhabitingheterogeneous environments can increase levels ofstanding genetic variation (Yeaman & Jarvis, 2006), but itis unclear whether this effect would be important in otherspecies. In single locus models, gene flow can alsodecrease the genetic variance due to extinction of locallow-frequency alleles and the different approaches arethus not fully reconciled (Lenormand, 2002). Genetic driftcan also reduce genetic variance and thus adaptation inperipheral populations (Alleaume-Benharira et al. 2006,Bridle et al. 2010, Polechova et al. 2009), but gene flowmay replenish genetic variation. Gene flow may evenintroduce better adapted genes than local ones, especiallyin a changing climate (Alleaume-Benharira et al. 2006). Some environments, in particular some polar or arid rangemargins, are intrinsically less favorable than others, andwould sustain only very low population sizes even after avery long history of adaptation. Mainland-island models oflocal adaptation implicitly address this issue withpopulation sizes, but spatially continuous models are stillmore informative. In particular, Nagylaki (1975) showedthat extrinsic asymmetries in habitat quality stronglymodified or could even compensate for asymmetries inselection across habitats. In other words, alleles showinga local advantage can be maintained despite havingconsiderable antagonistic effects in other habitats,provided that the local habitat is of better quality(Nagylaki, 1978). Incorporating differences in carryingcapacity in quantitative models could critically affect thepotential for population adaptation (Bridle et al. 2010).
The leading and the trailing edge of migrating treedistributions face quite different challenges due to thewarming climate (Hampe & Petit, 2005). At the southernrange edge (in northern hemisphere), the distributions arelikely already limited by high temperatures or droughtconditions, and associated biotic and abiotic stresses,whereas at the northern margin, many populations havebeen limited by the cold temperatures (Rehfeldt et al.2002). For the southern margin, at least at low altitudes,the environment is clearly deteriorating. The risk ofextinctions will come from the interplay of multiple factors.In particular, the reduction of water availability and alonger growing season with excessively warmtemperatures (IPCC, 2007) could lead to massive diebacksof trees due to drought stress or carbon starvation (Brédaet al. 2006, Sabate et al. 2002) higher mortality due toreduced defense of trees against insects (Rouault et al.2006), and more frequent forest fires (Mouillot & Field,2005). Increased mortality due to heat and drought stresshas already been observed in many locations globally(Allen et al. 2010). The impact of environmental changewill be higher in small populations due to highdemographic or environmental stochasticity (Hampe &Jump, 2011).At the southern margin, there are no populations furthersouth contributing genes conferring necessary adaptation,but gene flow from similar environments could stillincrease the variance within populations (Barton, 2001).
Schemes of the population models used to discussevolutionary responses The three different schematic models of populationstructure encountered in tree species illustrated by thedifferent cases of Picea omorika (one limited population),Pinus pinaster (several fragmented populations) andPinus sylvestris (large and continuous population). Thecolour of the circle indicates the environmentalcondition of the population which is either undefined(in grey) or following a temperature gradient fromwarm (in red) to cold (in blue). The arrows represent gene flow connecting populations,with thickness indicating gene flow intensity. For thefragmented populations the brown line symbolizes aphysical barrier to gene flow, such as a mountain.
FIGURE 3
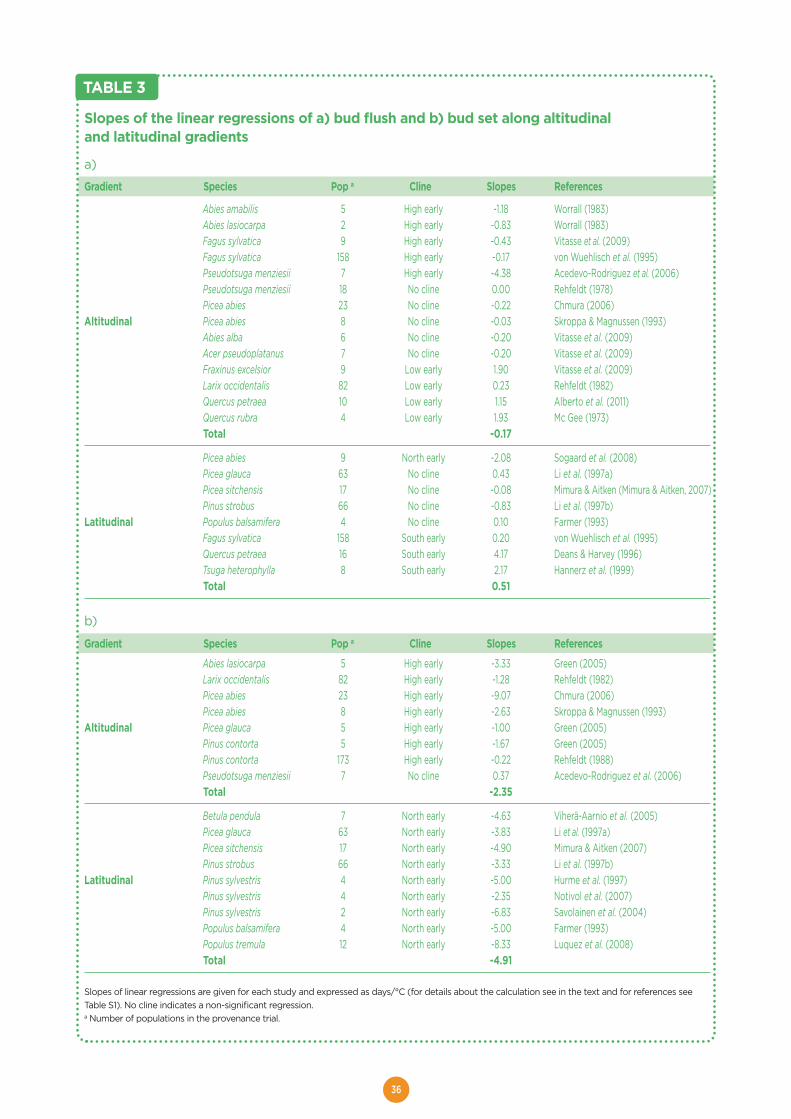
36
Slopes of the linear regressions of a) bud flush and b) bud set along altitudinaland latitudinal gradients
a)
Gradient Species Pop a Cline Slopes References
Abies amabilis 5 High early -1.18 Worrall (1983)Abies lasiocarpa 2 High early -0.83 Worrall (1983)Fagus sylvatica 9 High early -0.43 Vitasse et al. (2009)Fagus sylvatica 158 High early -0.17 von Wuehlisch et al. (1995)Pseudotsuga menziesii 7 High early -4.38 Acedevo-Rodriguez et al. (2006)Pseudotsuga menziesii 18 No cline 0.00 Rehfeldt (1978)Picea abies 23 No cline -0.22 Chmura (2006)
Altitudinal Picea abies 8 No cline -0.03 Skroppa & Magnussen (1993)Abies alba 6 No cline -0.20 Vitasse et al. (2009)Acer pseudoplatanus 7 No cline -0.20 Vitasse et al. (2009)Fraxinus excelsior 9 Low early 1.90 Vitasse et al. (2009)Larix occidentalis 82 Low early 0.23 Rehfeldt (1982)Quercus petraea 10 Low early 1.15 Alberto et al. (2011)Quercus rubra 4 Low early 1.93 Mc Gee (1973)Total -0.17
Picea abies 9 North early -2.08 Sogaard et al. (2008)Picea glauca 63 No cline 0.43 Li et al. (1997a)Picea sitchensis 17 No cline -0.08 Mimura & Aitken (Mimura & Aitken, 2007)Pinus strobus 66 No cline -0.83 Li et al. (1997b)
Latitudinal Populus balsamifera 4 No cline 0.10 Farmer (1993)Fagus sylvatica 158 South early 0.20 von Wuehlisch et al. (1995)Quercus petraea 16 South early 4.17 Deans & Harvey (1996)Tsuga heterophylla 8 South early 2.17 Hannerz et al. (1999)Total 0.51
b)
Gradient Species Pop a Cline Slopes References
Abies lasiocarpa 5 High early -3.33 Green (2005)Larix occidentalis 82 High early -1.28 Rehfeldt (1982)Picea abies 23 High early -9.07 Chmura (2006)Picea abies 8 High early -2.63 Skroppa & Magnussen (1993)
Altitudinal Picea glauca 5 High early -1.00 Green (2005) Pinus contorta 5 High early -1.67 Green (2005)Pinus contorta 173 High early -0.22 Rehfeldt (1988)Pseudotsuga menziesii 7 No cline 0.37 Acedevo-Rodriguez et al. (2006)Total -2.35
Betula pendula 7 North early -4.63 Viherä-Aarnio et al. (2005) Picea glauca 63 North early -3.83 Li et al. (1997a)Picea sitchensis 17 North early -4.90 Mimura & Aitken (2007)Pinus strobus 66 North early -3.33 Li et al. (1997b)
Latitudinal Pinus sylvestris 4 North early -5.00 Hurme et al. (1997)Pinus sylvestris 4 North early -2.35 Notivol et al. (2007)Pinus sylvestris 2 North early -6.83 Savolainen et al. (2004)Populus balsamifera 4 North early -5.00 Farmer (1993)Populus tremula 12 North early -8.33 Luquez et al. (2008)Total -4.91
Slopes of linear regressions are given for each study and expressed as days/°C (for details about the calculation see in the text and for references seeTable S1). No cline indicates a non-significant regression. a Number of populations in the provenance trial.
TABLE 3
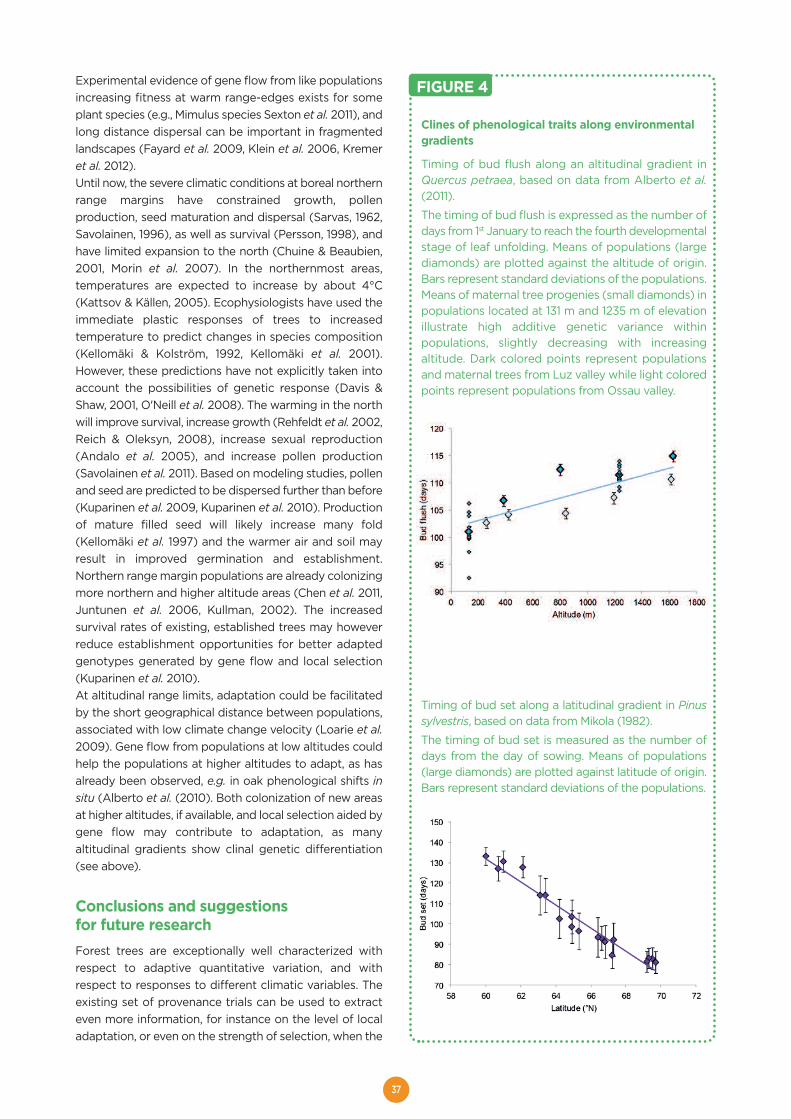
37
Experimental evidence of gene flow from like populationsincreasing fitness at warm range-edges exists for someplant species (e.g., Mimulus species Sexton et al. 2011), andlong distance dispersal can be important in fragmentedlandscapes (Fayard et al. 2009, Klein et al. 2006, Kremeret al. 2012). Until now, the severe climatic conditions at boreal northernrange margins have constrained growth, pollenproduction, seed maturation and dispersal (Sarvas, 1962,Savolainen, 1996), as well as survival (Persson, 1998), andhave limited expansion to the north (Chuine & Beaubien,2001, Morin et al. 2007). In the northernmost areas,temperatures are expected to increase by about 4°C(Kattsov & Källen, 2005). Ecophysiologists have used theimmediate plastic responses of trees to increasedtemperature to predict changes in species composition(Kellomäki & Kolström, 1992, Kellomäki et al. 2001).However, these predictions have not explicitly taken intoaccount the possibilities of genetic response (Davis &Shaw, 2001, O'Neill et al. 2008). The warming in the northwill improve survival, increase growth (Rehfeldt et al. 2002,Reich & Oleksyn, 2008), increase sexual reproduction(Andalo et al. 2005), and increase pollen production(Savolainen et al. 2011). Based on modeling studies, pollenand seed are predicted to be dispersed further than before(Kuparinen et al. 2009, Kuparinen et al. 2010). Productionof mature filled seed will likely increase many fold(Kellomäki et al. 1997) and the warmer air and soil mayresult in improved germination and establishment.Northern range margin populations are already colonizingmore northern and higher altitude areas (Chen et al. 2011,Juntunen et al. 2006, Kullman, 2002). The increasedsurvival rates of existing, established trees may howeverreduce establishment opportunities for better adaptedgenotypes generated by gene flow and local selection(Kuparinen et al. 2010). At altitudinal range limits, adaptation could be facilitatedby the short geographical distance between populations,associated with low climate change velocity (Loarie et al.2009). Gene flow from populations at low altitudes couldhelp the populations at higher altitudes to adapt, as hasalready been observed, e.g. in oak phenological shifts insitu (Alberto et al. (2010). Both colonization of new areasat higher altitudes, if available, and local selection aided bygene flow may contribute to adaptation, as manyaltitudinal gradients show clinal genetic differentiation(see above).
Conclusions and suggestionsfor future researchForest trees are exceptionally well characterized withrespect to adaptive quantitative variation, and withrespect to responses to different climatic variables. Theexisting set of provenance trials can be used to extracteven more information, for instance on the level of localadaptation, or even on the strength of selection, when the
Clines of phenological traits along environmentalgradients
Timing of bud flush along an altitudinal gradient inQuercus petraea, based on data from Alberto et al.(2011).
The timing of bud flush is expressed as the number ofdays from 1st January to reach the fourth developmentalstage of leaf unfolding. Means of populations (largediamonds) are plotted against the altitude of origin.Bars represent standard deviations of the populations.Means of maternal tree progenies (small diamonds) inpopulations located at 131 m and 1235 m of elevationillustrate high additive genetic variance withinpopulations, slightly decreasing with increasingaltitude. Dark colored points represent populationsand maternal trees from Luz valley while light coloredpoints represent populations from Ossau valley.
Timing of bud set along a latitudinal gradient in Pinussylvestris, based on data from Mikola (1982).
The timing of bud set is measured as the number ofdays from the day of sowing. Means of populations(large diamonds) are plotted against latitude of origin.Bars represent standard deviations of the populations.
FIGURE 4
38
data sets are further analyzed. Long-term estimates of thestrength of selection, in particular in natural conditions,would be very valuable for providing parameter rangeestimates for the prediction models. New reciprocaltransplant experiments are needed for commercially less-important species, which may be most threatened, butwhich are under-represented in existing provenance trials.Furthermore, the present provenance trials ignore thelikely important early fitness components of germinationand establishment – these components also need to bestudied (as is being done in herbaceous plants (Huang etal. 2010, Stanton-Geddes et al. 2012). The new experimentsshould include field sites at and beyond existing rangemargins. Experiments in controlled growth chambers canalso help identify those abiotic aspects of temperature andmoisture regimes to which populations are locallyadapted, and to generate climatic regimes analogous tothose predicted for the coming century. The role of plasticity and its interaction with naturalselection is just starting to be explored in the climatechange context (Chevin et al. 2010) – provenance trials canalso provide more information on these aspects. Theextent and significance of adaptive phenotypic plasticityis still debated (Valladares et al. 2007), and experimentalstudies on range margins are still few (Angert, 2009,Stanton-Geddes et al. 2012). Wang’s (2010) universalresponse function approach could be used as amechanistic model to predict population responses. Commercially less-important species are poorlyrepresented in previously established common gardens,whether they have narrow or wide distributions. Thespecies with smaller ranges are especially vulnerable. Arethese species locally adapted to climate? Do these specieshave limited adaptive potential due to their historicallysmall effective population sizes? While many importantboreal and temperate species in the northern hemisphere(and some eucalypts or tropical acacias) have beenextensively studied, there is much less information onsubtropical or tropical species, which are outside thescope of this review. These species will also be affected bythe changing climate, through both abiotic and manycomplex biotic factors. Most of the studies on quantitative traits have beenconducted in spaced, reasonably well-tended provenancetrial experiments. Within or between species interactions,such as competition or diseases have largely been ignored.Many between-species interactions depend on thesynchronous timing of events in the different species. Evenbefore any evolutionary responses, phenotypic responseswill affect such biotic interactions (Gilman et al. 2010, Yang& Rudolf, 2010). During the past decade phenologicalshifts have been already observed between trees and pestpopulations (Desprez-Loustau et al. 2010, Gordo & Sanz,2010, van Asch et al. 2007, Visser & Holleman, 2001).Much of the information on northern trees has been
accumulated through decades of field experiments.Combining genomic tools with results from the
quantitative and ecological approaches can significantlyaid in predicting selection responses to climate change(for crop plants, see Morrell et al. 2012). Genomic studieswill allow researchers to examine the geographical patternof alleles conferring adaptation – are they globallyoccurring alleles with varying frequencies or very localizedones? Coupled with studies at the quantitative trait level,genomic surveys will aid in assessing the prospects foradaptation at the level of the population. Furthermore, thecontribution of epigenetic and maternal effects tophenotypic variation needs to be assessed.This review has pointed to several areas wheremanagement and breeding can possibly contribute tomaintenance of populations. An evaluation of such optionsis beyond the scope of this review (see e.g. McLachlan etal. 2007).In conclusion, the concordant patterns of current localadaptation among tree populations in numerous northernspecies in Europe and North America show that selectionhas repeatedly established such patterns. Populationsfacing the largest evolutionary challenges are at the rangemargins, but the northern and southern (or higher andlower latitude) margins face quite different limitations.Better data and models are thus necessary to evaluateaccurately whether natural selection, and migration, mayagain allow evolutionary responses for populations tosufficiently match their new climates.
AcknowledgementsWe acknowledge support from the project FoResTTraCFP7 – 244096 and thank Martin Lascoux and Matti Salmelafor comments on the manuscript. Jouni Mikola kindlyprovided access to the original raw data related to Figure4b. F.A. thanks the University Joseph Fourier of Grenoblefor providing opportunity to work on the manuscriptduring the last stages of the redaction. SCG-M and RAwere funded by RTA2010-00120-C02-01 and AdapTree(funded by Genome Canada and Genome BC) supportedS.N.A. and S.Y. during the preparation and publication ofthis manuscript.
REFERENCESAcevedo-Rodriguez R, Vargas-Hernandez JJ, Lopez-Upton J, Mendoza JV (2006) Effect of geographic originand nutrition on shoot prenology of Mexican Douglas-Fir(Pseudotsuga sp.) seedlings. Agrociencia, 40, 125-137.
Aitken SN, Yeaman S, Holliday JA, Wang TL, Curtis-McLane S (2008) Adaptation, migration or extirpation:climate change outcomes for tree populations.Evolutionary Applications, 1, 95-111.
Alberto F, Bouffier L, Louvet JM, Lamy JB, Delzon S,Kremer A (2011) Adaptive responses for seed and leafphenology in natural populations of sessile oak along analtitudinal gradient. Journal of Evolutionary Biology, 24,1442-1454.
39
Alberto F, Niort J, Derory J, Lepais O, Vitalis R, Galop D,Kremer A (2010) Population differentiation of sessile oakat the altitudinal front of migration in the French Pyrenees.Molecular Ecology, 19, 2626-2639.Alleaume-Benharira M, Pen IR, Ronce O (2006)Geographical patterns of adaptation within a species'range: interactions between drift and gene flow. Journal ofEvolutionary Biology, 19, 203-215.Allen CD, Macalady AK, Chenchouni H et al. (2010) Aglobal overview of drought and heat-induced treemortality reveals emerging climate change risks for forests.Forest Ecology and Management, 259, 660-684.Andalo C, Beaulieu J, Bousquet J (2005) The impact ofclimate change on growth of local white sprucepopulations in Quebec Forest Ecology and Management,205, 169-182.Angert AL (2009) The niche, limits to species'distributions, and spatiotemporal variation in demographyacross the elevation ranges of two monkeyflowers.Proceedings of the National Academy of Sciences, 106,19693-19698.Atwell S, Huang YS, Vilhjalmsson BJ et al. (2010) Genome-wide association study of 107 phenotypes in Arabidopsisthaliana inbred lines. Nature, 465, 627-631.Barton N (2001) Adaptation at the edge of a species'range. In: Integrating genetics and ecology in a spatialcontext. (eds Silvertown J, Antonovics J) pp 365-392.London, Blackwell.Barton NH (1999) Clines in polygenic traits. GeneticalResearch, 74, 223-236.Barton NH, Keightley PD (2002) Understanding quantitativegenetic variation. Nature Reviews Genetics, 3, 11-21.Basler D, Körner C (2012) Photoperiod sensitivity of budburst in 14 temperate forest tree species. Agricultural andForest Meteorology, 165, 73-81.Benito-Garzón M, Alia R, Robson TM, Zavala MA (2011)Intra-specific variability and plasticity influence potentialtree species distributions under climate change. GlobalEcology and Biogeography, 766-778.Beuker E, Valtonen E, Repo T (1998) Seasonal variation inthe frost hardiness of Scots pine and Norway spruce in oldprovenance experiments in Finland. Forest Ecology andManagement, 107, 87-98.Björklund M, Ranta E, Kaitala V, Bach LA, Lundberg P,Stenseth NC (2009) Quantitative trait evolution andenvironmental change. PLoS ONE, 4, e4521.Bréda N, Huc R, Granier A, Dreyer E (2006) Temperateforest trees and stands under severe drought: a review ofecophysiological responses, adaptation processes andlong-term consequences. Annals of Forest Science, 63,625-644.Bridle JR, Polechova J, Kawata M, Butlin RK (2010) Why isadaptation prevented at ecological margins? New insightsfrom individual-based simulations. Ecology Letters, 13,485-494.Bräutigam K, Vining KJ, Lafon-Placette C et al. (2013)Epigenetic regulation of adaptive responses of forest treespecies to the environment. Ecology and Evolution, 3, n/a-n/a.Buckler ES, Holland JB, Bradbury PJ et al. (2009) TheGenetic Architecture of Maize Flowering Time. Science,325, 714-718.
Burger R, Lynch M (1995) Evolution and extinction in achanging environments - a quantitative genetic analysis.Evolution, 49, 151-163.
Böhlenius H, Huang T, Charbonnel-Campaa L, Brunner AM,Jansson S, Strauss SH, Nilsson O (2006) CO/FT regulatorymodule controls timing of flowering and seasonal growthcessation in trees. Science, 312, 1040-1043.
Caffarra A, Donelly A, Chuine I (2011) Modelling the timingof Betula pubescens budburst. II. Integrating the complexeffects of photoperiod into process-based models ofbudburst. Climate Research, 46, 159-170.
Charlesworth B, Charlesworth D (2010) Elements ofevolutionary genetics, Greenwood Village, Co., Roberts &Co.
Cheddadi R, Vendramin GG, Litt T et al. (2006) Imprintsof glacial refugia in the modern genetic diversity of Pinussylvestris. Global Ecology and Biogeography, 15, 271-282.
Chen IC, Hill JK, Ohlemuller R, Roy DB, Thomas CD (2011)Rapid range shifts of species associated with high levelsof climate warming. Science, 333, 1024-1026.
Chen J, Källman T, Gyllenstrand N, Lascoux M (2009) Newinsights on the speciation history and nucleotide diversityof three boreal spruce species and a Tertiary relict.Heredity, 104, 3-14.
Chevin L-M, Lande R (2010) When do adaptive plasticityand genetic evolution prevent extinction of a density-regulated population? Evolution, 64, 1143-1150.
Chevin L-M, Lande R, Mace GM (2010) Adaptation,plasticity, and extinction in a changing environment:towards a predictive theory. PLoS Biology, 8, e1000357.
Chmura DJ (2006) Phenology differs among Norwayspruce populations in relation to local variation in altitudeof maternal stands in the Beskidy Mountains. New Forests,32, 21-31.
Chuine I, Beaubien EG (2001) Phenology is a majordeterminant of tree species range. Ecology Letters, 4, 500-510.
Conner JK, Franks R, Stewart C (2003) Expression foaddtive genetic variances and covariances for wild radishfloral traits: comparison between field and greenhouseenvironments Evolution, 57, 487-495.
Cornelius J (1994) Heritabilities and additive geneticcoefficients of variation in forest trees. Canadian Journalof Forest. Research, 24, 372-379.
Cumbie WP, Eckert AJ, Wegrzyn JL, Whetten R, Neale DB,Goldfarb B (2011) Association genetics of carbon isotopediscrimination, height, and foliar nitrogen in a naturalpopulation of Pinus taeda L. Heredity, 107, 105-114.
Davis MB, Shaw RG (2001) Range shifts and adaptiveresponses to quaternary climate changes. Science, 292,673-679.
De Carvalho D, Ingvarsson PK, Joseph J et al. (2010)Admixture facilitates adaptation from standing variationin the European aspen (Populus tremula L.), a widespreadforest tree. Molecular Ecology, 19, 1638-1650.
Deans JD, Harvey FJ (1996) Frost hardiness of 16 Europeanprovenances of sessile oak growing in Scotland. Forestry,69, 5-11.
Desprez-Loustau ML, Vitasse Y, Delzon S, Capdevielle X,Marcais B, Kremer A (2010) Are plant pathogenpopulations adapted for encounter with their host? A case
40
study of phenological synchrony between oak and anobligate fungal parasite along an altitudinal gradient.Journal of Evolutionary Biology, 23, 87-97.
Duputie A, Massol F, Chuine I, Kirkpatrick M, Ronce O (2012)How do genetic correlations affect species range shifts ina changing environment? Ecology Letters, 15, 251-259.
Eckert AJ, Bower AD, Wegrzyn JL et al. (2009)Asssociation genetics of Coastal Douglas Fir (Pseudotsugamenziesii var. menziesii, Pinaceae). I. Cold-fardiness relatedtraits. Genetics, 182, 1289-1302.
Eckert AJ, van Heerwaarden J, Wegrzyn JL, Nelson CD,Ross-Ibarra J, Gonzalez-Martinez SC, Neale DB (2010)Patterns of population structure and environmentalassociations to aridity across the range of Loblolly Pine(Pinus taeda L., Pinaceae). Genetics, 185, 969-982.
Edelaar P, Burraco P, Gomez-Mestre I (2011) Comparisonsbetween Q(ST) and F(ST)-how wrong have we been?Molecular Ecology, 20, 4830-4839.
Etterson JR, Shaw RG (2001) Constraint to adaptiveevolution in response to global warming. Science, 294,151-154.
Falconer DS, Mackay TFC (1996) Introduction toquantitative genetics, Harlow, UK, Longman.
Farmer RE (1993) Latitudinal variation in height andphenology of balsam poplar. Silvae Genetica, 42, 148-153.
Fayard J, Klein EK, Lefevre F (2009) Long distancedispersal and the fate of a gene from the colonizationfront. Journal of Evolutionary Biology, 22, 2171-2182.
Fisher RA (1918) The correlation between relatives on thesupposition of Mendelian inheritance. Transactions of theRoyal Society of Edinburgh, 52, 399-433.
Fisher RA (1930) The genetical theory of natural selection,Oxford, Oxford Univ. Press.
Franks SJ, Hoffmann AA (2012) Genetics of ClimateChange Adaptation. Annual Review of Genetics, 46,185-208.
Gienapp P, Teplitsky C, Alho JS, Mills JA, Merilä J (2008)Climate change and evolution: disentanglingenvironmental and genetic responses. Molecular Ecology,17, 167-178.
Gilman SE, Urban MC, Tewksbury J, Gilchrist GW, Holt RD(2010) A framework for community interactions underclimate change. Trends in Ecology & Evolution, 25, 325-331.
Goldstein DB, Holsinger KE (1992) Maintenance ofpolygenic variation in spatially structured populations:roles for local mating and genetic redundancy. Evolution,46, 412-429.
Gomulkiewicz R, Holt RD (1995) When does evolution bynatural selection prevent extinction. Evolution, 49, 201-207.
Gomulkiewicz R, Holt RD, Barfield M, Nuismer SL (2010)Genetics, adaptation, and invasion in harsh environments.Evolutionary Applications, 3, 97-108.
Gomulkiewicz R, Houle D (2009) Demographic andgenetic constraints on evolution. American Naturalist, 174,218-229.
Gordo O, Sanz JJ (2010) Impact of climate change onplant phenology in Mediterranean ecosystems. GlobalChange Biology, 16, 1082-1106.
Grattapaglia D, Resende MDV (2011) Genomic selection inforest tree breeding. Tree Genetics & Genomes, 7, 241-255.
Green DS (2005) Adaptive strategies in seedlings of threeco-occurring, ecologically distinct northern coniferous treespecies across an elevational gradient. Can. J. For. Res., 35,910-917.
Grivet D, Sebastiani F, Alía R et al. (2011) Molecularfootprints of local adaptation in two Mediterraneanconifers. Molecular Biology and Evolution, 28, 101-116.
Haldane JBS (1932) The causes of evolution, London,Longmans.
Hampe A, Jump AS (2011) Climate Relicts: Past, Present,Future. Annual Review of Ecology, Evolution, andSystematics, 42, 313-333.
Hampe A, Petit RJ (2005) Conserving biodiversity underclimate change: the rear edge matters. Ecology Letters, 8,461-467.
Hancock AM, Brachi B, Faure N et al. (2011) Adaptation toclimate across the Arabidopsis thaliana genome. Science,334, 83-86.
Hannerz M, Aitken SN, King JN, Budge S (1999) Effects ofgenetic selection for growth on frost hardiness in westernhemlock. Canadian Journal of Forest Research-RevueCanadienne De Recherche Forestiere, 29, 509-516.
Hedrick PW (2006) Genetic polymorphism inheterogeneous environments: the age of genomics.Annual Review of Ecology Evolution and Systematics, 37,67-93.
Hendry AP, Day T, Taylor EB (2001) Population mixing andthe adaptive divergence of quantitative traits in discretepopulations: A theoretical framework for empirical tests.Evolution, 55, 459-466.
Hendry AP, Kinnison MT (1999) Perspective: The pace ofmodern life: Measuring rates of contemporarymicroevolution. Evolution, 53, 1637-1653.
Heuertz M, De Paoli E, Källman T et al. (2006) Multilocuspatterns of nucleotide diversity, linkage disequilibrium anddemographic history of Norway spruce (Picea abies (L.)Karst). Genetics, 174, 2095-2105.
Hill JK, Griffiths HM, Thomas CD (2011) Climate change andevolutionary adaptations at species' range margins. AnnualReview of Entomology, 56, 143-159.
Hill WG, Goddard ME, Visscher PM (2008) Data and theorypoint to mainly additive genetic variance for complextraits. PLoS Genetics, 4, e1000008.
Hoffmann AA, Sgrò CM (2011) Climate change andevolutionary adaptation. Nature, 470, 479-485.
Holliday JA, Ritland K, Aitken SN (2010a) Widespread,ecologically relevant genetic markers developed fromassociation mapping of climate-related traits in Sitkaspruce (Picea sitchensis). New Phytologist, 188, 501-514.
Holliday JA, Wang T, Aitken S (2012) Predicting AdaptivePhenotypes From Multilocus Genotypes in Sitka Spruce(Picea sitchensis) Using Random Forest. G3:Genes|Genomes|Genetics, 2, 1085-1093.
Holliday JA, Yuen M, Ritland K, Aitken SN (2010b)Postglacial history of a widespread conifer producesinverse clines in selective neutrality tests. MolecularEcology, 19, 3857-3864.
Howe GT, Aitken SN, Neale DB, Jermstad KD, Wheeler NC,Chen THH (2003) From genotype to phenotype:unraveling the complexities of cold adaptation in foresttrees. Canadian Journal of Botany, 81, 1247-1266.
41
Huang X, Schmitt J, Dorn L et al. (2010) The earliest stagesof adaptation in an experimental plant population: strongselection on QTLS for seed dormancy. Molecular Ecology,19, 1335-1351.Hurme P, Repo T, Pääkkönen T, Savolainen O (1997)Climatic adaptation of bud set and frost hardiness in Scotspine (Pinus sylvestris L.). Can. J. For. Res., 27, 716-523.Hänninen H, Tanino K (2011) Tree seasonality in a warmingclimate. Trends in Plant Science, 16, 312-416.Ingvarsson PK, Garcia MV, Luquez V, Hall D, Jansson S(2008) Nucleotide polymorphism and phenotypicassociations within and around the phytochrome B2 locusin European aspen (Populus tremula, Salicaceae). Genetics,178, 2217-2226.IPCC (2001) The Scientific Basis In: Climate Change 2001.(eds Houghton JT, Ding Y, Griggs DJ, Noguer M, Van DerLinden PJ, Dai X, Maskell K, Johnsson CA) pp 881.Cambridge, Cambridge University Press.IPCC (2007) Contribution of Working Group II to theFourth Assessment Report of the Intergovernmental Panelon Climate Change. In: Climate Change 2007: Impacts,Adaptation and Vulnerability. Canmbridge and New York,Cambridge University Press.Iwata H, Hayashi T, Tsumura Y (2011) Prospects forgenomic selection in conifer breeding: a simulation studyof Cryptomeria japonica. Tree Genetics Genomes.Jalas J, Suominen T (1973) Atlas Floreae Europaea.Coniferales.Jermstad KD, Bassoni DL, Jech KS, Ritchie GA, WheelerNC, Neale DB (2003) Mapping of quantitative trait locicontrolling adaptive traits in coastal Douglas Fir. III.Quantitative trait loci-by-environment interactions.Genetics, 165, 1489-1506.Johannes F, Porcher E, Teixeira FK et al. (2009) Assessingthe impact of transgenerational epigenetic variation oncomplex traits. PLoS Genetics, 5, e1000530.Jump AS, Matyas C, Penuelas J (2009) The altitude-for-latitude disparity in the range retractions of woodyspecies. Trends in Ecology & Evolution, 24, 694-701.Juntunen V, Neuvonen S, Sutinen R (2006) Männynpuurajan muutokset viimeisen 400 vuoden aikana jametsänraja-puuraja vaihettumisvyöhykkeen ikärakenne.Metlan työraportteja, 25, 25-32.Kattsov VM, Källen E (2005) Future climate change:modeling and scenarios for the Arctic. In: Arctic ClimateImpact Assessment - scientific report. pp 100-150.Cambridge, UK, Cambridge Univ. Press.Kawecki TJ, Ebert D (2004) Conceptual issues in localadaptation. Ecology Letters, 7, 1225-1241.Kayihan GC, Nelson CD, Huber DA, Amerson HV, White TL,Davis JM (2010) Clonal evaluation for fusiform rust diseaseresistance: effects of pathogen virulence and diseaseescape. Canadian Journal of Forest Research, 40, 1042-1050.Kellomäki S, Kolström M (1992) Simulation of tree speciescomposition and organic matter accumulation in Finnishboreal forests under changing climatic conditions.Vegetatio, 102, 47-68.Kellomäki S, Rouvinen I, Peltola H, Strandman H,Steinbrecher R (2001) Impact of global warming on thetree species composition of boreal forests in Finland andeffects on emission of isoprenoids. Global Change Biology,7, 531-544.
Kellomäki S, Väisänen H, Kolström T (1997) Modelcomputatons on the effects of elevating temperature andatmosphere CO2 on the regeneration of Scots pine at tetimber line in Finland. Climatic Change, 37, 683-708.
Kingsolver JG, Diamond SE (2011) Phenotypic selection innatural populations: what limits directional selection?American Naturalist, 177, 346-357.
Kingsolver JG, Hoekstra HE, Hoekstra JM et al. (2001) Thestrength of phenotypic selection in natural populations.American Naturalist, 157, 245-261.
Kirkpatrick M, Barton NH (1997) Evolution of a species'range. American Naturalist, 150, 1-23.
Klein EK, Lavigne C, Gouyon PH ( 2006) Mixing ofpropagules from discrete sources at long distance:comparing a dispersal tail to an exponential. BMCEcology, 6.
Kozlowski T, Pallardy S (2002) Acclimation and adaptiveresponses of woody plants to environmental stresses. TheBotanical Review, 68, 270-334.
Kramer K (1995) Phenotypic plasticity of the phenology of7 European tree species in relation to climate warming.Plant Cell and Environment, 18, 93-104.
Kremer A, Le Corre V (2012) Decoupling of differentiationbetween traits and their underlying genes in response todivergent selection. Heredity, 108, 375-385.
Kremer A, Ronce O, Robledo-Arnuncio JJ et al. (2012)Long-distance gene flow and adaptation of forest trees torapid climate change. Ecology Letters, 15, 378-392.
Kullman L (2002) Rapid recent range-margin rise of treeand shrub species in the Swedish Scandes. Journal ofEcology, 90, 68-77.
Kuparinen A, Katul G, Nathan R, Schurr FM (2009)Increases in air temperature can promote wind-drivendispersal and spread of plants. Proceedings Royal SocietyB, 276, 3081-3087.
Kuparinen A, Savolainen O, Schurr FM (2010) Increasedmortality can promote evolutionary adaptation of foresttrees to climate change. Forest Ecology and Management,259, 1003-1008.
Körner C, Basler D (2010) Phenology Under GlobalWarming. Science, 327, 1461-1462.
Lande R (2009) Adaptation to an extraordinaryenvironment by evolution of phenotypic plasticity andgenetic assimilation. Journal of Evolutionary Biology, 22,1435-1446.
Langlet O (1971) Two hundred years of genecology. Taxon,20, 653-721.
Latta RG (1998) Differentiation of allelic frequencies atquantitative trait loci affecting locally adaptive traits.American Naturalist, 151, 283-292.
Laurie CC, Chasalow SD, LeDeaux JR et al. (2004) Thegenetic architecture of response to long-term artificialselection for oil concentration in the maize kernel.Genetics, 168, 2141-2155.
Le Corre V, Kremer A (2012) The genetic differentiation atquantitative trait loci under local adaptation. MolecularEcology, 21, 1548-1566.
LeCorre V, Kremer A (2003) Genetic variability at neutralmarkers, quantitative trait loci and trait in a subdividedpopulation under selection. Genetics, 164, 1205-1219.
42
Leimu R, Fischer M (2008) A meta-analysis of localadaptation in plants. PLoS ONE, 3, e4010.Leinonen T, O'Hara RB, Cano JM, Merila J (2008)Comparative studies of quantitative trait and neutralmarker divergence: a meta-analysis. Journal ofEvolutionary Biology, 21, 1-17.Lenormand T (2002) Gene flow and the limits to naturalselection. Trends Ecol. Evol., 17, 183-189.Li P, Beaulieu J, Bousquet J (1997a) Genetic structure andpatterns of genetic variation among populations in easternwhite spruce. Can. J. For. Res., 27, 19-198.Li P, Beaulieu J, Daoust G, Plourde A (1997b) Patterns ofadaptive genetic variation in eastern white pine (Pinusstrobus) from Quebec. Canadian Journal of ForestResearch-Revue Canadienne De Recherche Forestiere, 27,199-206.Lindner M, Maroschek M, Netherer S et al. (2010) Climatechange impacts, adaptive capacity, and vulnerability ofEuropean forest ecosystems. Forest Ecology andManagement, 259, 698-709.Loarie SR, Duffy PB, Hamilton H, Asner GP, Field CB,Ackerly DD (2009) The velocity of climate change. Nature,462, 1052-1055.Luquez V, Hall D, Albrectsen BR, Karlsson J, Ingvarsson P,Jansson S (2008) Natural phenological variation in aspen(Populus tremula): the SwAsp collection. Tree Genetics &Genomes, 4, 279-292.Lynch M (1996) A quantitative-genetic perspective onconservation issues. In: Conservation genetics. Casehistories from nature. (eds Avise JC, Hamrick JL) pp 471-501. New York, Chapman and Hall.Lynch M, Lande R (1993) Evolution and extinction inresponse to environmental change. In: Biotic interactionsand global change. (eds Kareiva PM, Kingsolver JG, HueyRB) pp 234-250. Sunderland, Mass., Sinauer.Magri D, Vendramin GG, Comps B et al. (2006) A newscenario for the Quaternary history of European beechpopulations: palaeobotanical evidence and geneticconsequences. New Phytologist, 171, 199-221.Mayr E (1963) Animal species and evolution Cambridge,Mass., Harvard Univ. Press.McGee CE (1973) Is variation in budbreak of Red oak theresult of heredity or environment? In: Tree Improvementand Genetics Proceedings - Southern Forest TreeImprovement Conference. pp. 185-189.McLachlan JS, Clark JS, Manos PS (2005) Molecularindicators of tree migration capacity under rapid climatechange. Ecology, 86, 2088-2098.McLachlan JS, Hellmann JJ, Schwartz MW (2007) Aframework for debate of assisted migration in an era ofclimate change. Conservation Biology, 21, 297-302.Menzel A, Fabian P (1999) Growing season extended inEurope. Nature, 397, 659-659.Menzel A, Sparks TH, Estrella N et al. (2006) Europeanphenological response to climate change matches thewarming pattern. Global Change Biology, 12, 1969-1976.Mikola J (1982) Bud-set phenology as an indicator ofclimatic adaptation of Scots pine in Finland. Silva Fennica,16, 178-184.Mimura M, Aitken SN (2007) Adaptive gradients andisolation-by-distance with postglacial migration in in Piceasitchensis. Heredity, 98, 224-232.
Morgenstern EK (1978) Range-wide variation of blackspruce. Canadian Journal of Forest Research, 8, 463-473.
Morgenstern EK (1996) Geographic variation in foresttrees: genetic basis and application of knowledge insilviculture, Vancouver, B. C., UBC Press.
Morin X, Augspurger C, Chuine I (2007) Process-basedmodeling of species' distributions: What limits temperatetree species' range boundaries? Ecology, 88, 2280-2291.
Morin X, Thuiller W (2009) Comparing niche- and process-based models to reduce prediction uncertainty in speciesrange shifts under climate change. Ecology, 90, 1301-1313.
Morrell PL, Buckler ES, Ross-Ibarra J (2012) Cropgenomics: advances and applications. Nature ReviewsGenetics, 13, 85-96.
Mouillot F, Field CB (2005) Fire history and the globalcarbon budget: a 1 degrees x 1 degrees fire historyreconstruction for the 20th century. Global ChangeBiology, 11, 398-420.
Nagylaki T (1975) Conditions for existence of clines.Genetics, 80, 595-615.
Nagylaki T (1978) Clines with asymmetric migrationGenetics, 88, 813-827.
Namroud MC, Beaulieu J, Juge N, Laroche J, Bousquet J(2008) Scanning the genome for gene single nucleotidepolymorphisms involved in adaptive populationdifferentiation in white spruce. Molecular Ecology, 17,3599-3613.
Neale DB, Kremer A (2011) Forest tree genomics: growingresources and applications. Nature Reviews Genetics, 12,111-122.
Netherer S, Schopf A (2010) Potential effects of climatechange on insect herbivores in European forests-Generalaspects and the pine processionary moth as specificexample. Forest Ecology and Management, 259, 831-838.
Nicotra AB, Atkin OK, Bonser SP et al. (2010) Plantphenotypic plasticity in a changing climate. Trends in PlantScience, 15, 684-692.
Niinemets U (2010) Responses of forest trees to single andmultiple environmental stresses from seedlings to matureplants: Past stress history, stress interactions, tolerance andacclimation. Forest Ecology and Management, 260, 1623-1639.
Notivol E, Garcia-Gil MR, Alia R, Savolainen O (2007)Genetic variation of growth rhythm traits in the limits of alatitudinal cline in Scots pine. Canadian Journal of ForestResearch-Revue Canadienne De Recherche Forestiere, 37,540-551.
O'Neill GA, Hamann A, Wang TL (2008) Accounting forpopulation variation improves estimates of the impact ofclimate change on species' growth and distribution.Journal of Applied Ecology, 45, 1040-1049.
Olson-Manning CF, Wagner MR, Mitchell-Olds T (2012)Adaptive evolution: evaluating empirical support fortheoretical predictions. Nature Reviews Genetics, 13, 867-877.
Orr HA (1998) The population genetics of adaptation: thedistribution of factors fixed during adaptive evolution.Evolution, 52, 935-949.
Parducci L, Jorgensen T, Tollefsrud MM et al. (2012) GlacialSurvival of Boreal Trees in Northern Scandinavia. Science,335, 1083-1086.
43
Parmesan C (2006) Ecological and evolutionary responsesto recent climate change. Annual Review of Ecology,Evolution and Systematics., 37, 637-669.
Pease CM, Lande R, Bull JJ (1989) A model of populationgrowth, dispersal and evolution in a changingenvironment. Ecology, 70, 1657-1664.
Persson B (1998) Will climate change affect the optimalchoice of Pinus sylvestris provenances. Silva Fennica, 32,121-128.
Petit RJ, Brewer S, Bordacs S et al. (2002) Identificationof refugia and post-glacial colonisation routes of Europeanwhite oaks based on chloroplast DNA and fossil pollenevidence. Forest Ecology and Management, 156, 49-74.
Petit RJ, Hampe A (2006) Some evolutionaryconsequences of being a tree. Annual Review of EcologyEvolution and Systematics, 37, 187-214.
Polechova J, Barton N, Marion G (2009) Species' range:adaptation in space and time. American Naturalist, 174,E186-E204.
Pyhäjärvi T, García-Gil MR, Knürr T, Mikkonen M,Wachowiak W, Savolainen O (2007) Demographic historyhas influenced nucleotide diversity in European Pinussylvestris populations. Genetics, 177, 1713-1724.
Quesada T, Gopal V, Cumbie WP et al. (2010) Associationmapping of quantitative disease resistance in a naturalpopulation of Loblolly Pine (Pinus taeda L.). Genetics, 186,677-686.
Rehfeldt GE (1978) Genetic differentiation of Douglas firpopulations from the northern Rocky Mountains. Ecology,59, 1264-1270.
Rehfeldt GE (1982) Differentiation of Larix occidentalispopulations from the northern Rocky Mountains. SilvaeGenetica, 31, 13-19.
Rehfeldt GE (1988) Ecological genetics of Pinus contortafrom the Rocky mountains (USA): a synthesis. SilvaeGenet., 37, 131-135.
Rehfeldt GE, Jaquish BC (2010) Ecological impacts andmanagement strategies for western larch in the face ofclimate-change. Mitigation and Adaptation Strategies forGlobal Change, 15, 283-306.
Rehfeldt GE, Tchebakova NM, Parfenova YI, Wykoff WR,Kuzmina NA, Milyutin LI (2002) Intraspecific responses toclimate in Pinus sylvestris. Global Change Biology, 8, 912-929.
Rehfeldt GE, Wykoff WR, Ying CC (2001) Physiologicplasticity, evolution, and impacts of a changing climate onPinus contorta. Climatic Change, 50, 355-376.
Rehfeldt GE, Ying CC, Spittlehouse DL, Hamilton DA (1999)Genetic responses to climate change in Pinus contorta:niche breadth, climate change, and reforestation.Ecological Monographs, 69, 375-407.
Reich PB, Oleksyn J (2008) Climate warming will reducegrowth and survival of Scots pine except in the far north.Ecology Letters, 11, 588-597.
Resende MFR, Munoz P, Acosta JJ et al. (2012)Accelerating the domestication of trees using genomicselection: accuracy of prediction models across ages andenvironments. New Phytologist, 193, 617-624.
Richards CL, Bossdorf O, Verhoeven KJF (2010)Understanding natural epigenetic variation. NewPhytologist, 187, 562-564.
Ritland K (1996) Marker-based method for inferencesabout quantitative inheritance in natural populations.Evolution, 50, 1062-1073.
Robertson C, Nelson TA, Jelinski DE, Wulder MA, Boots B(2009) Spatial-temporal analysis of species rangeexpansion: the case of the mountain pine beetle,Dendroctonus ponderosae. Journal of Biogeography, 36,1446-1458.
Rohde A, Bhalerao RP (2007) Plant dormancy in theperennial context. Trends Plant Sci., 15, 217-223.
Rouault G, Candau JN, Lieutier F, Nageleisen LM, MartinJC, Warzee N (2006) Effects of drought and heat on forestinsect populations in relation to the 2003 drought inWestern Europe. Annals of Forest Science, 63, 613-624.
Sabate S, Gracia CA, Sanchez A (2002) Likely effects ofclimate change on growth of Quercus ilex, Pinushalepensis, Pinus pinaster, Pinus sylvestris and Fagussylvatica forests in the Mediterranean region. ForestEcology and Management, 162, 23-37.
Sarvas R (1962) Investigations on the flowering and seedcrop of Pinus sylvestris. Communicationes InstitutiForestalia Fennica, 53.4, 1-198.
Savolainen O (1996) Pines beyond the polar circle:adaptation to stress conditions. Euphytica, 92, 139-145.
Savolainen O, Bokma F, Garcia-Gil R, Komulainen P, RepoT (2004) Genetic variation in cessation of growth and frosthardiness and consequences for adaptation of Pinussylvestris to climatic changes. Forest Ecology andManagement, 197, 79-89.
Savolainen O, Kujala ST, Sokol C et al. (2011) Adaptivepotential of northernmost tree populations to climatechange, with emphasis on Scots pine (Pinus sylvestris L.).Journal of Heredity, 102, 526-536.
Savolainen O, Pyhajarvi T, Knurr T (2007) Gene flow andlocal adaptation in trees. Annual Review of EcologyEvolution and Systematics, 38, 595-619.
Savolainen O, Pyhäjärvi T (2007) Genomic diversity inforest trees. Current Opinion in Plant Biology, 10, 162-167.
Sexton JP, Strauss SY, Rice KJ (2011) Gene flow increasesfitness at the warm edge of a species’ range. Proceedingsof the National Academy of Sciences, 108, 11704-11709.
Shaw RG, Etterson JR (2012) Rapid climate change andthe rate of adaptation: insight from experimentalquantitative genetics. New Phytologist, 195, 752-765.
Shutyaev AM, Giertych M (1997) Height growth variationin a comprehensive Eurasian provenance experiment ofPinus sylvestris L. Silvae Genetica, 46, 332-349.
Sillanpää MJ (2011) On statistical methods for estimatingheritability in wild populations. Molecular Ecology, 20,1324-1332.
Skroppa T, Magnussen S (1993) Provenance variation inshoot growth components of Norway spruce. SilvaeGenetica, 42, 111-120.
Skrøppa T, Kohmann K (1997) Adaptation to localconditions after one generation in Norway spruce. ForestGenetics, 4, 171-177.
Sogaard G, Johnsen O, Nilsen J, Junttila O (2008) Climaticcontrol of bud burst in young seedlings of nineprovenances of Norway spruce. Tree Physiology, 28, 311-320.
44
Soltis DE, Morris AB, McLachlan JS, Manos PS, Soltis PS(2006) Comparative phylogeography of unglaciatedeastern North America. Molecular Ecology, 15, 4261-4293.
Soto A, Robledo-Arnuncio JJ, González-Martínez SC,Smouse PE, Alía R (2010) Climatic niche and neutralgenetic diversity of the six Iberian pine species: aretrospective and prospective view. Molecular Ecology, 19,1396-1409.
Stanton-Geddes J, Shaw RG, Tiffin P (2012) Interactionsbetween Soil Habitat and Geographic Range LocationAffect Plant Fitness. PLoS ONE, 7, e36015.
Sundblad LG, Andersson B (1995) No difference in frosthardiness between high and low altitude Pinus sylvestris(L) offspring. Scandinavian Journal of Forest Research,10, 22-26.
Tian F, Bradbury PJ, Brown PJ et al. (2011) Genome-wideassociation study of leaf architecture in the maize nestedassociation mapping population. Nature Genetics, 43,159-162.
Turchin MC, Chiang CWK, Palmer CD, Sankararaman S,Reich D, Hirschhorn JN, Genetic Invest A (2012) Evidenceof widespread selection on standing variation in Europe atheight-associated SNPs. Nature Genetics, 44, 1015-1019.
Valladares F, Gianoli E, Gomez JM (2007) Ecological limitsto plant phenotypic plasticity. New Phytologist, 176,749-763.
van Asch M, Tienderen PH, Holleman LJM, Visser ME(2007) Predicting adaptation of phenology in response toclimate change, an insect herbivore example. GlobalChange Biology, 13, 1596-1604.
van Asch M, Visser ME (2007) Phenology of forestcaterpillars and their host trees: The importance ofsynchrony. Annual Review of Entomology, 52, 37-55.
Wang T, Hamann A, Yanchuk A, O'Neill GA, Aitken SN(2006) Use of response functions in selecting lodgepolepine populations for future climates. Global ChangeBiology, 12, 2404-2416.
Wang TL, O'Neill GA, Aitken SN (2010) Integratingenvironmental and genetic effects to predict responses oftree populations to climate. Ecological Applications, 20,153-163.
Vendramin GG, Fady B, Gonzalez-Martinez SC et al. (2008)Genetically depauperate but widespread: The case of anemblematic mediterranean pine. Evolution, 62, 680-688.
Vihera-Aarnio A, Hakkinen R, Partanen J, Luomajoki A,Koski V (2005) Effects of seed origin and sowing time ontiming of height growth cessation of Betula pendulaseedlings. Tree Physiology, 25, 101-108.
Wilczek AM, Burghardt LT, Cobb AR, Cooper MD, WelchSM, Schmitt J (2010) Genetic and physiological bases for
phenological responses to current and predicted climates.Philosophical Transactions of the Royal Society B-Biological Sciences, 365, 3129-3147.
Visser ME, Holleman LJM (2001) Warmer springs disruptthe synchrony of oak and winter moth phenology.Proceedings of the Royal Society of London Series B-Biological Sciences, 268, 289-294.
Vitasse Y, Bresson CC, Kremer A, Michalet R, Delzon S(2010) Quantifying phenological plasticity to temperaturein two temperate tree species. Functional Ecology, 24, 1211-1218.
Vitasse Y, Delzon S, Bresson CC, Michalet R, Kremer A(2009) Altitudinal differentiation in growth and phenologyamong populations of temperate-zone tree speciesgrowing in a common garden. Canadian Journal of ForestResearch, 39, 1259-1269.
Voltas J, Chambel M, Prada M, Ferrio J (2008) Climate-related variability in carbon and oxygen stable isotopesamong populations of Aleppo pine grown in common-garden tests. Trees-Structure and Function, 22, 759-769.
vonWuehlisch G, Krusche D, Muhs HJ (1995) Variation intemperature sum requirement for flushing of beechprovenances. Silvae Genetica, 44, 343-346.
Worrall J (1983) Temperature - bud-burst relationships inAmabilis and Subalpine fir provenance tests replicated atdifferent elevations. Silvae Genetica, 32, 203-209.
Worrell R, Cundall EP, Malcolm DC, Ennos RA (2000)Variation among seed sources of silver birch in Scotland.Forestry, 73, 419-435.
Wright S (1931) Evolution in Mendelian populations.Genetics, 16, 97-159.
Wright S (1943) Isolation-by-distance. Genetics, 28, 114-138.
Yakovlev IA, Fossdal CG, Johnsen O (2010) MicroRNAs,the epigenetic memory and climatic adaptation in Norwayspruce. New Phytologist, 187, 1154-1169.
Yang LH, Rudolf VHW (2010) Phenology, ontogeny andthe effects of climate change on the timing of speciesinteractions. Ecology Letters, 13, 1-10.
Yeaman S, Jarvis A (2006) Regional heterogeneity andgene flow maintain variance in a quantitative trait withinpopulations of lodgepole pine. Proceedings of the RoyalSociety B-Biological Sciences, 273, 1587-1593.
Yeaman S, Whitlock MC (2011) The genetic architecture ofadaptation under migration-selection balance. Evolution,65, 1897-1911.
Yu H, Luedeling E, Xu J (2010) Winter and spring warmingresult in delayed spring phenology on the Tibetan PlateauProceedings of the National Academy of Sciences of theUnited States of America, 107, 22151-22156.
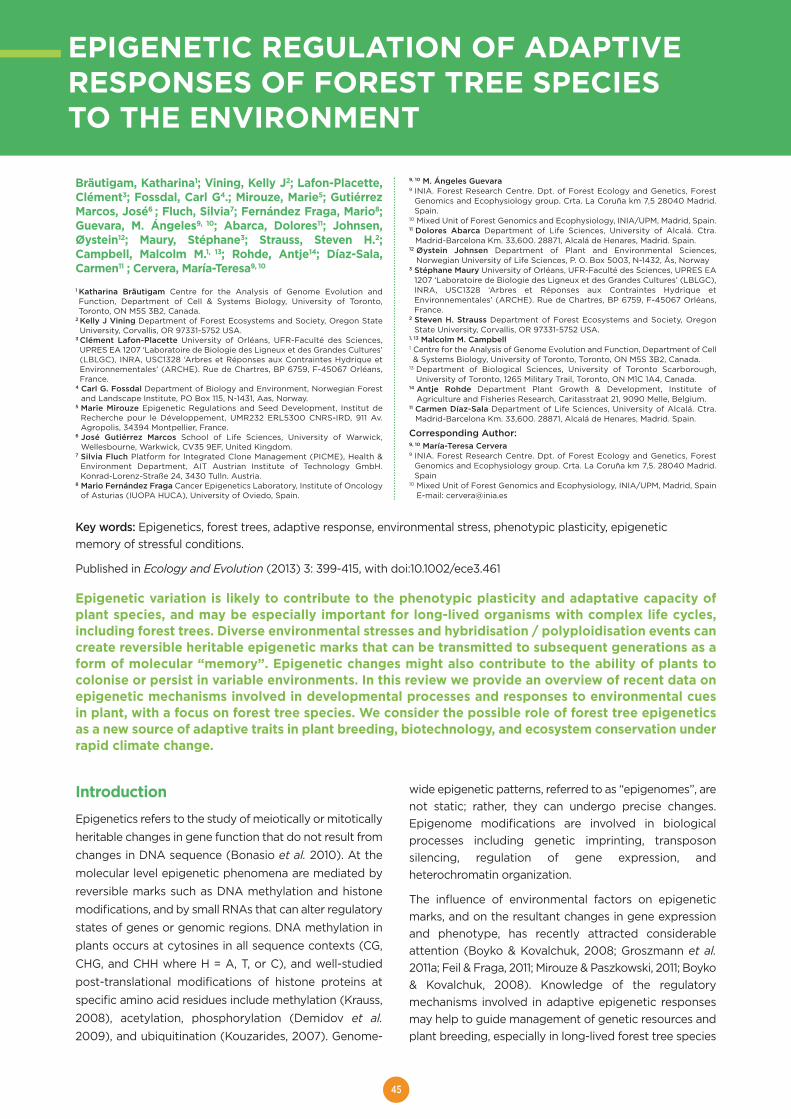
45
IntroductionEpigenetics refers to the study of meiotically or mitoticallyheritable changes in gene function that do not result fromchanges in DNA sequence (Bonasio et al. 2010). At themolecular level epigenetic phenomena are mediated byreversible marks such as DNA methylation and histonemodifications, and by small RNAs that can alter regulatorystates of genes or genomic regions. DNA methylation inplants occurs at cytosines in all sequence contexts (CG,CHG, and CHH where H = A, T, or C), and well-studiedpost-translational modifications of histone proteins atspecific amino acid residues include methylation (Krauss,2008), acetylation, phosphorylation (Demidov et al.2009), and ubiquitination (Kouzarides, 2007). Genome-
wide epigenetic patterns, referred to as “epigenomes”, arenot static; rather, they can undergo precise changes.Epigenome modifications are involved in biologicalprocesses including genetic imprinting, transposonsilencing, regulation of gene expression, andheterochromatin organization.
The influence of environmental factors on epigeneticmarks, and on the resultant changes in gene expressionand phenotype, has recently attracted considerableattention (Boyko & Kovalchuk, 2008; Groszmann et al.2011a; Feil & Fraga, 2011; Mirouze & Paszkowski, 2011; Boyko& Kovalchuk, 2008). Knowledge of the regulatorymechanisms involved in adaptive epigenetic responsesmay help to guide management of genetic resources andplant breeding, especially in long-lived forest tree species
EPIGENETIC REGULATION OF ADAPTIVERESPONSES OF FOREST TREE SPECIESTO THE ENVIRONMENT
Bräutigam, Katharina1; Vining, Kelly J2; Lafon-Placette,Clément3; Fossdal, Carl G4.; Mirouze, Marie5; GutiérrezMarcos, José6 ; Fluch, Silvia7; Fernández Fraga, Mario8;Guevara, M. Ángeles9, 10; Abarca, Dolores11; Johnsen,Øystein12; Maury, Stéphane3; Strauss, Steven H.2;Campbell, Malcolm M.1, 13; Rohde, Antje14; Díaz-Sala,Carmen11 ; Cervera, María-Teresa9, 10
1 Katharina Bräutigam Centre for the Analysis of Genome Evolution andFunction, Department of Cell & Systems Biology, University of Toronto,Toronto, ON M5S 3B2, Canada.
2 Kelly J Vining Department of Forest Ecosystems and Society, Oregon StateUniversity, Corvallis, OR 97331-5752 USA.
3 Clément Lafon-Placette University of Orléans, UFR-Faculté des Sciences,UPRES EA 1207 ‘Laboratoire de Biologie des Ligneux et des Grandes Cultures’(LBLGC), INRA, USC1328 ‘Arbres et Réponses aux Contraintes Hydrique etEnvironnementales’ (ARCHE). Rue de Chartres, BP 6759, F-45067 Orléans,France.
4 Carl G. Fossdal Department of Biology and Environment, Norwegian Forestand Landscape Institute, PO Box 115, N-1431, Aas, Norway.
5 Marie Mirouze Epigenetic Regulations and Seed Development, Institut deRecherche pour le Développement, UMR232 ERL5300 CNRS-IRD, 911 Av.Agropolis, 34394 Montpellier, France.
6 José Gutiérrez Marcos School of Life Sciences, University of Warwick,Wellesbourne, Warkwick, CV35 9EF, United Kingdom.
7 Silvia Fluch Platform for Integrated Clone Management (PICME), Health &Environment Department, AIT Austrian Institute of Technology GmbH.Konrad-Lorenz-Straße 24, 3430 Tulln. Austria.
8 Mario Fernández Fraga Cancer Epigenetics Laboratory, Institute of Oncologyof Asturias (IUOPA HUCA), University of Oviedo, Spain.
9, 10 M. Ángeles Guevara9 INIA. Forest Research Centre. Dpt. of Forest Ecology and Genetics, Forest
Genomics and Ecophysiology group. Crta. La Coruña km 7,5 28040 Madrid.Spain.
10 Mixed Unit of Forest Genomics and Ecophysiology, INIA/UPM, Madrid, Spain.11 Dolores Abarca Department of Life Sciences, University of Alcalá. Ctra.
Madrid-Barcelona Km. 33,600. 28871, Alcalá de Henares, Madrid. Spain.12 Øystein Johnsen Department of Plant and Environmental Sciences,
Norwegian University of Life Sciences, P. O. Box 5003, N-1432, Ås, Norway 3 Stéphane Maury University of Orléans, UFR-Faculté des Sciences, UPRES EA
1207 ‘Laboratoire de Biologie des Ligneux et des Grandes Cultures’ (LBLGC),INRA, USC1328 ‘Arbres et Réponses aux Contraintes Hydrique etEnvironnementales’ (ARCHE). Rue de Chartres, BP 6759, F-45067 Orléans,France.
2 Steven H. Strauss Department of Forest Ecosystems and Society, OregonState University, Corvallis, OR 97331-5752 USA.
1, 13 Malcolm M. Campbell1 Centre for the Analysis of Genome Evolution and Function, Department of Cell& Systems Biology, University of Toronto, Toronto, ON M5S 3B2, Canada.
13 Department of Biological Sciences, University of Toronto Scarborough,University of Toronto, 1265 Military Trail, Toronto, ON M1C 1A4, Canada.
14 Antje Rohde Department Plant Growth & Development, Institute ofAgriculture and Fisheries Research, Caritasstraat 21, 9090 Melle, Belgium.
11 Carmen Díaz-Sala Department of Life Sciences, University of Alcalá. Ctra.Madrid-Barcelona Km. 33,600. 28871, Alcalá de Henares, Madrid. Spain.
Corresponding Author:9, 10 María-Teresa Cervera 9 INIA. Forest Research Centre. Dpt. of Forest Ecology and Genetics, Forest
Genomics and Ecophysiology group. Crta. La Coruña km 7,5. 28040 Madrid.Spain
10 Mixed Unit of Forest Genomics and Ecophysiology, INIA/UPM, Madrid, SpainE-mail: [email protected]
Epigenetic variation is likely to contribute to the phenotypic plasticity and adaptative capacity ofplant species, and may be especially important for long-lived organisms with complex life cycles,including forest trees. Diverse environmental stresses and hybridisation / polyploidisation events cancreate reversible heritable epigenetic marks that can be transmitted to subsequent generations as aform of molecular “memory”. Epigenetic changes might also contribute to the ability of plants tocolonise or persist in variable environments. In this review we provide an overview of recent data onepigenetic mechanisms involved in developmental processes and responses to environmental cuesin plant, with a focus on forest tree species. We consider the possible role of forest tree epigeneticsas a new source of adaptive traits in plant breeding, biotechnology, and ecosystem conservation underrapid climate change.
Key words: Epigenetics, forest trees, adaptive response, environmental stress, phenotypic plasticity, epigeneticmemory of stressful conditions.
Published in Ecology and Evolution (2013) 3: 399-415, with doi:10.1002/ece3.461
46
where changes in allele frequency are expected to occurvery slowly. This review provides a brief overview of recentdata on epigenetic mechanisms involved in developmentalprocesses and responses to environmental cues in forestspecies, as well as the implications of forest treeepigenetics to adaptation as a possible new source ofbeneficial traits for plant breeding and conservation inecosystems responding to climate change.
Factors driving epigenetic regulationin plantsEpigenetic regulation in plant development
Epigenetic regulation plays important roles in multipleaspects of plant development. Two distinct roles of thisregulation can be distinguished, depending on whetherthey concern developmentally regulated genes ortransposable elements (TEs). In developmentallyregulated genes, epigenetic marks allow switches in geneexpression in response to developmental transitionsand/or environmental cues. After sexual reproduction,uniparental expression of parental alleles, imprinting, isassociated with discrete differentially methylated regions(DMRs) that act in a genome context-independent manner(Gutierrez-Marcos et al. 2006; Jullien et al. 2006; Haun etal. 2007).
A well-characterised example of epigenetic control duringpostembryonic development is vernalisation, thephenomenon of cold temperature-induced competenceto flower (Chouard, 1960; Schmitz & Amasino, 2007). InArabidopsis thaliana, regulation of FLOWERING LOCUS C(FLC) gene expression during vernalisation illustrates howenvironmental cues are perceived and translated intoepigenetic marks that affect plant development (Bastow,2004; Heo, 2011; Kim & Sung, 2012).
The epigenetic marks of many loci involved in plantdevelopment are normally erased or reset at eachgeneration following meiosis, thus preventing theestablishment of new “epialleles” (alleles whose expressionis conditioned by their epigenetic status). On the otherhand, stable, i.e. heritable, epialleles can occur naturallyand might confer specific phenotypes. Examples in plantsinclude floral symmetry in Linaria that is influenced byDNA methylation levels at the CYCLOIDEA locus (Cubaset al. 1999) and absence of ripening in tomato, that isassociated with hypermethylation at the Colorless non-ripening locus (Manning et al. 2006). Stable epialleles arepotential targets for selection in evolutionary processes,or in applied plant breeding. More examples will contributeto a better understanding of their origin, their stability, andthe role they might play in selection.
In contrast to the transient nature of many developmentalepigenetic marks, those affecting TEs are more stable(Slotkin & Martienssen, 2007; Bourc'his & Voinnet, 2010;Lisch & Slotkin, 2011) and the mobility of TEs is observed
when these marks are alleviated in mutants affected in theepigenetic machinery (Mirouze et al. 2009; Tsukahara etal. 2009; Ito et al. 2011). However, during development,transcription of activated TEs in hypomethylated gametecompanion cells are thought to produce small RNAs thatmigrate into the germ cell and direct the silencingmachinery to TEs. Hence, at each new generation, the“immune system” against transposons is perpetuated butalso readjusted to prevent potential genome invasion ofnew mobile elements (Lisch & Slotkin, 2011). Given theabundance of TEs in tree genomes, they should beconsidered as potential sources of epigenetic variationpotentially affecting regulation of nearby genes.
The importance of developmentally-related epigeneticmodification has been underscored recently by itspotential involvement in hybrid vigor. Hybrid vigor, alsoknown as heterosis, describes the superior performanceof hybrid progeny over their parents in traits like biomassand seed production or stress resistance. Various modelsexplaining heterotic effects at single loci have beenproposed, including dominance, overdominance, andpseudo-overdominance, while interactions between genes(epistasis) have been considered as well (Birchler et al.2010). The molecular mechanisms causing non-additivegene expression in hybrids have been the focus of studiesin rice and A. thaliana, and epigenetic regulation hasrecently been associated with heterosis (Ha et al. 2009;He, 2010; Groszmann et al. 2011a; Groszmann, 2011b). Inhybrids, a number of short interfering RNAs (siRNAs) werefound to accumulate to non-additive levels which in turncan lead to changes in DNA methylation and geneexpression, thus contributing to hybrid vigor (Groszmannet al. 2011a, Groszmann et al. 2011b). Given thepreponderance of hybrids in many plant taxa, includingprominent tree genera like Populus, the putativeinvolvement of epigenetics in heterosis is of great interest.
Epigenetic regulation in plant environmentalresponses
Various environmental signals and stresses can inducepersistent changes in epigenetic modifications, therebycreating a flexible “memory” system for short orprolonged periods of time (Kvaalen & Johnsen, 2008;Chinnusamy & Zhu, 2009; Jablonka & Raz, 2009; Whittleet al. 2009). Environmental conditions have an impact ona number of different epigenetic marks and mechanisms,including DNA methylation and histone modifications, oron frequencies of homologous recombination andgenomic rearrangements (Bond & Finnegan, 2007;Chinnusamy & Zhu, 2009; Feil & Fraga, 2011; Hauser et al.2011; Mirouze & Paszkowski, 2011). For example, changesin genome-wide DNA methylation patterns in response tobiotic and abiotic stress treatments (pathogen, herbivore,high salt, low nutrients) occur in asexually reproduceddandelions (Taraxacum officinale). Notably, altered DNAmethylation patterns were transmitted to the non-stressed
47
progeny in this species and the potential role of stress-induced epigenetic inheritance in evolution has beendiscussed (Verhoeven et al. 2010). The involvement of ahistone variant (H2A.Z) was found to mediate short-termadaptation to temperature change in A. thaliana (Kumar &Wigge, 2010), and cold stress-induced hypomethylationand transposition of a TE (Tam-3) has been observed inAntirrhinum (Hashida et al. 2006).
Epigenetic recombinant inbred lines (epiRILs) haveemphasised the relationship between response toenvironmental conditions and epigenetic phenomena. InA. thaliana, epiRILs have nearly identical genomes butdisplay diverse mosaic epigenomes with variant DNAmethylation patterns (Johannes et al. 2009; Reinders et al.2009). The range of pathogen sensitivity/resistance withinone isogenic epiRIL population exhibited 60% of the rangeof pathogen responses observed in natural, geneticallyvarying A. thaliana accessions (Reinders et al. 2009). In thecontext of environmental challenges, such epigeneticmodifications may be thought of as relatively “plastic” yetheritable marks that allow for rapid responses andadaptations and, at the same time, might avoid excessivegenetic diversification (Boyko & Kovalchuk, 2008; Lira-Medeiros et al. 2010).
Epigenetic control in forest tree speciesRelationship between epigenetic and phenotypicplasticity
Forest trees are long-lived organisms with complex lifecycles, which must contend with a variable environmentover their long lifetimes (Rohde & Junttila, 2008). The longgeneration times impose limits on natural selection underrapidly changing climate conditions (Rehfeldt et al. 1999;Rehfeldt et al. 2002). Consequently, trees must be highlyadaptable, displaying a wide range of phenotypes as afunction of their environments, known as phenotypicplasticity (Nicotra et al. 2010). Phenotypic plasticity is likelyto be of great importance for both individual trees andforest populations over near- and long-term timescales.Despite this, knowledge of the extent and underlyingmechanisms of phenotypic plasticity in response to avariety of stress responses and developmental traits intrees is rudimentary (Rohde, 2009; Lira-Medeiros et al.2010; Neale & Kremer, 2011).
In addition to the genetic component, epigenetic variationhas been suggested to contribute to the phenotypicplasticity and adaptive potential of individuals andpopulations (Bossdorf et al. 2008; Jablonka & Raz, 2009;Herrera & Bazaga, 2010; Lira-Medeiros et al. 2010; Richardset al. 2012). Insight into epigenetic variation, and itsrelationship to phenotypic plasticity, will contribute to theunderstanding of adaptive plant responses, and mighthelp to evaluate the risk of long-lived species to bothshort-term and long-term fluctuations in the environment.Moreover, understanding the interplay between
epigenetics and adaptation should enhance theunderstanding of evolutionary trajectories, as naturalselection also directly targets the proportion ofphenotypic variation that is shaped by epigeneticphenomena (Bossdorf et al. 2008; Herrera & Bazaga,2010).
Epigenetic and phenotypic variation in naturalpopulations, ecotypes and species
Despite the substantial impact that epigenetics might havein determining environmental compatibility, relatively fewstudies have investigated the extent of natural epigeneticvariation and its relationship to phenotypic variation andadaptation potential (Cervera et al. 2002; Bossdorf et al.2008; Jablonka & Raz, 2009; Marfil et al. 2009; Herrera &Bazaga, 2010; Lira-Medeiros et al. 2010; Paun et al. 2010).Among the different epigenetic mechanisms that arepotentially involved in transgenerational inheritance andnatural epigenetic variation, DNA methylation representsthe most-studied modification (Akimoto et al. 2007;Jablonka & Raz, 2009; Herrera & Bazaga, 2010; Lira-Medeiros et al. 2010; Paun et al. 2010; Verhoeven et al.2010). Two of the few published studies in higher plantsthat considered the interplay between genetic, epigenetic,as well as and phenotypic variation and environmentalfactors, focused on a perennial violet species (Violacazorlensis) and orchids of the Dactylorhiza majaliscomplex (Herrera, 1990; Herrera & Bazaga, 2010; Paun etal. 2010). The studies detected coordinated genetic-epigenetic adaptive differentiation, indicating theinvolvement of epigenetic processes in adaptation andevolution by influencing primary phenotypic diversity.
In tree species, natural variation in epigenetic marks andthe relation to phenotypic traits is still an under-exploredarea. Insight into the role of epigenetics in determining treephenotype should identify key elements in the control ofgrowth traits and contribute to the understanding ofevolutionary capacity of tree species (Grattapaglia et al.2009; Thumma et al. 2009; Lira-Medeiros et al. 2010). Inkeeping with this, evidence for the correlation betweentree form and epigenetics is emerging. Trees of the whitemangrove (Laguncularia racemosa) can occur naturally incontrasting habitats and can exhibit striking differences inmorphological traits (Lira-Medeiros et al. 2010). Tree-likeappearance was documented in a riverside habitat withabundant fresh water and nutrient supply whereas in anearby salt marsh habitat mangrove plants werecharacterised by abnormal growth and shrub-likemorphology. Notably, despite morphologicaldissimilarities, analysis of DNA nucleotide sequences andmethylation patterns detected greater epigenetic thangenetic variation within and between populations incontrasting environments, which indicates that epigeneticvariation in natural populations plays an important role inlong-term adaptation to different environments (Lira-Medeiros et al. 2010).
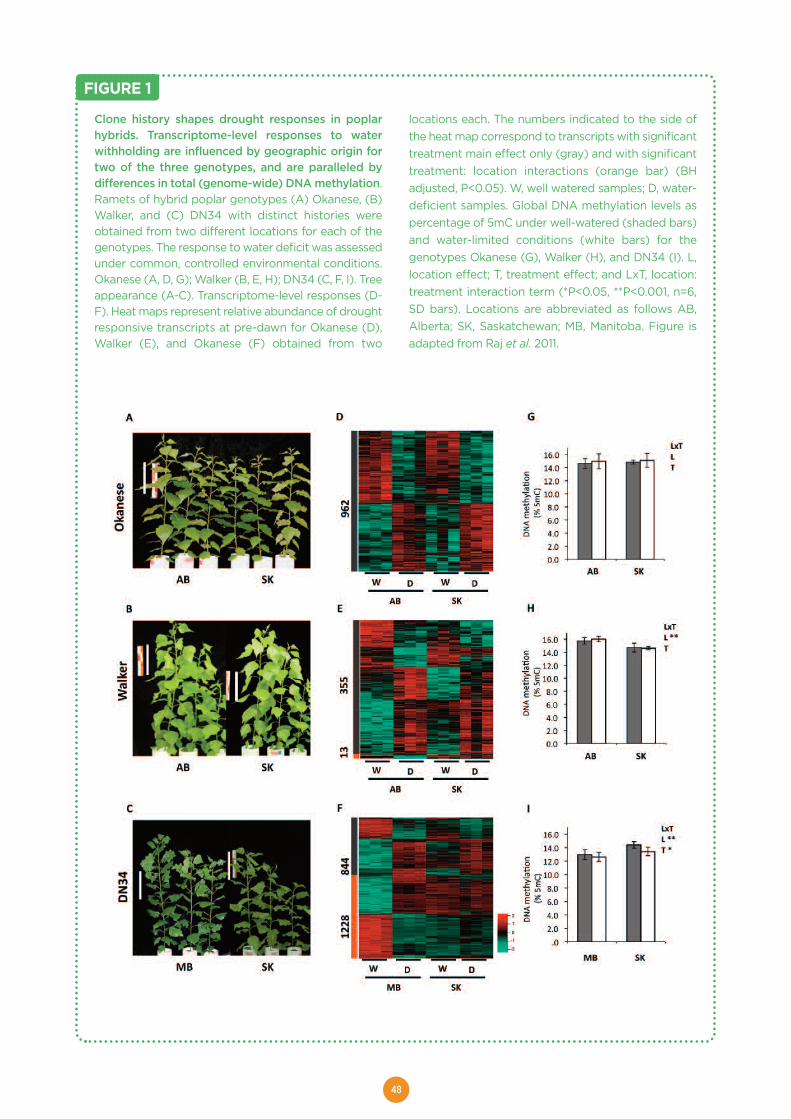
48
FIGURE 1
Clone history shapes drought responses in poplarhybrids. Transcriptome-level responses to waterwithholding are influenced by geographic origin fortwo of the three genotypes, and are paralleled bydifferences in total (genome-wide) DNA methylation.Ramets of hybrid poplar genotypes (A) Okanese, (B)Walker, and (C) DN34 with distinct histories wereobtained from two different locations for each of thegenotypes. The response to water deficit was assessedunder common, controlled environmental conditions.Okanese (A, D, G); Walker (B, E, H); DN34 (C, F, I). Treeappearance (A-C). Transcriptome-level responses (D-F). Heat maps represent relative abundance of droughtresponsive transcripts at pre-dawn for Okanese (D),Walker (E), and Okanese (F) obtained from two
locations each. The numbers indicated to the side ofthe heat map correspond to transcripts with significanttreatment main effect only (gray) and with significanttreatment: location interactions (orange bar) (BHadjusted, P<0.05). W, well watered samples; D, water-deficient samples. Global DNA methylation levels aspercentage of 5mC under well-watered (shaded bars)and water-limited conditions (white bars) for thegenotypes Okanese (G), Walker (H), and DN34 (I). L,location effect; T, treatment effect; and LxT, location:treatment interaction term (*P<0.05, **P<0.001, n=6,SD bars). Locations are abbreviated as follows AB,Alberta; SK, Saskatchewan; MB, Manitoba. Figure isadapted from Raj et al. 2011.
49
The lasting impact of previous environmental history on atree’s capacity to respond to a current environmentalstimulus has recently been explored in Populus (Raj et al.2011). Poplar trees are frequently propagated vegetativelythrough stem cuttings of branches containing dormantbuds, generating genetically identical individuals or rametsof the same genotype. Clonally propagated poplar treescan be planted in different geographic locations, thusgiving rise to populations of genetically identical rametsthat are characterised by their own local environment andhistory. To study the lasting effect of clone history oncurrent plant performance, cuttings of the same genotypewere obtained from different geographic locations andgrown under common environmental conditions, afterwhich the transcriptome response to an importantenvironmental stress, drought, was studied. Notably,differences in transcript abundance patterns in responseto drought that were based on differences in geographicorigin of clonally propagated trees were detected in twoof the three investigated genotypes. These transcriptome-level patterns were paralleled by differences ingenome-wide DNA methylation. Genotypes with thelongest time since establishment and last commonpropagation showed the most pronounced location-specific patterns in transcriptome response and DNAmethylation indicating a possible epigenomic basis forclone history-dependent transcriptome divergence (Fig.1).These findings underline the importance of epigeneticmechanisms related to the adaptation of long-livedspecies like poplar trees to the local environment (Raj etal. 2011).
The direct response of six hybrid poplar genotypes towater deficit revealed a relationship between epigeneticmarks and the genotypic variability of phenotypicplasticity (Gourcilleau et al. 2010). Genotypic variation forboth DNA methylation and traits related to biomassproductivity was observed in hybrids (Populus deltoids xP. nigra), and a positive correlation was established amongthese variables in well-watered conditions (Fig.2). Whilepoplar genotypes showed reduced growth in water deficitconditions, a significant genotype effect was observed forDNA methylation variations. This suggests that DNAmethylation could participate in the fine-tuning of geneexpression in poplar during water stress (Plomion et al.2006; Bogeat-Triboulot et al. 2007; Bonhomme et al.2009; Wilkins et al. 2009; Gourcilleau et al. 2010;Hamanishi & Campbell, 2011).
The potential link between natural epigenetic variation andphenotypic variability observed in trees is furthersupported by studies in ecotypes and individualpopulations of specific herbaceous plant species (Cerveraet al. 2002; Marfil et al. 2009). Highly conserved DNAmethylation patterns were detected within an A. thalianaecotype (Ler) while clear DNA methylation differencesexisted between ecotypes that did not correlate withnucleotide sequence variation, but with their flowering
time (Cervera et al. 2002). Furthermore, variation in thefloral phenotype of individuals from a single naturalpopulation of a wild hybrid potato (Solanum ruiz-lealii)were found to correlate with distinct DNA methylationpatterns but not with DNA sequence variation (Marfil etal. 2009).
Most studies assessing epigenetic variation in naturalpopulations, ecotypes or species focused on the extent ofepigenetic variability and paid less attention to thefunctional consequences. Indication for a functional linkbetween a specific epigenetic mark at a specific positionin the genome and variation in a quantitative trait wasdiscovered by analysing polymorphisms in an associationpopulation and a full-sib family of eucalypt (Eucalyptusnitens; Thumma et al. 2009). Making use of the low linkagedisequilibrium in populations of forest trees, variation incellulose content was linked to polymorphisms within agene potentially involved in cellulose synthesis anddeposition (functional polymorphisms). The COBRA-likegene EnCOBL4A was strongly associated with a QTLregion for cellulose content and fine mapping revealed asignificant association with a SNP in exon 5. Notably, allelicexpression imbalance was linked to allele-specific cytosinemethylation upstream of this SNP in a full-sibling family. Aheritable epigenetic polymorphism is thus likely toinfluence phenotypic variation in cellulose content;however, further functional analyses are required (Thummaet al. 2009). The findings suggest that epigeneticvariations might contribute to quantitative trait variation(Thumma et al. 2009), and it has been suggested that thisphenomenon might be common (Johannes et al. 2008;Reinders et al. 2009; Thumma et al. 2009; Long et al. 2011).
To date, some prominent, shared observations haveemerged from the few studies of natural epigeneticvariation and phenotypic plasticity. These studiesestablished that a) epigenetic variation occurs in naturalpopulations, ecotypes and species, b) this variation cancorrelate with naturally occurring phenotypic variation,and c) there is a potential role for epigenetic variation inadaptation and potentially in evolution. Despite thecommonalities that have emerged from these studies,many questions remain unresolved. For example, isepigenetic variation in natural populations a wide-spreadphenomenon? Moreover, the key molecular mechanismsinvolved and how they are regulated remain to bedetermined. Finally, it is unclear to what extent epiallelesarise and how stable they are when considered in anevolutionary context (Bossdorf et al. 2008; Herrera &Bazaga, 2010; Lira-Medeiros et al. 2010; Paun et al. 2010).Answers to such questions might also contribute to abetter understanding of the adaptive capability of long-lived forest trees that might help to assess theirsusceptibility to rapidly changing environments(Grattapaglia et al. 2009).
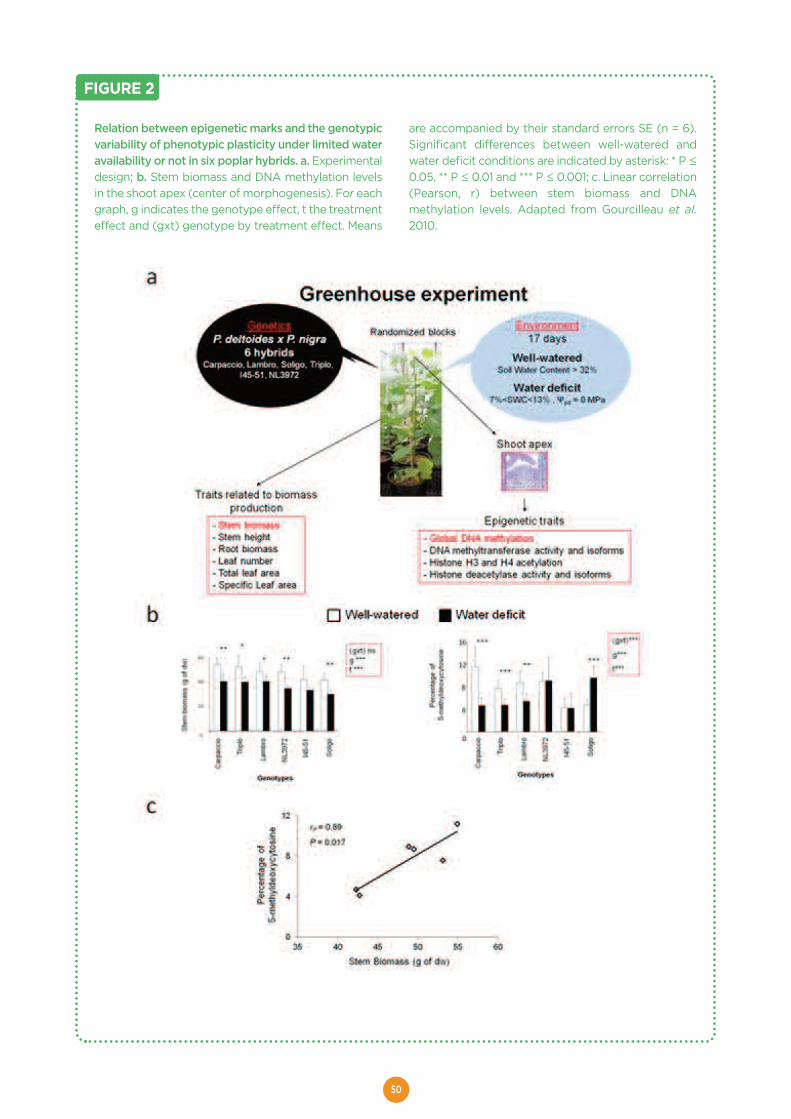
50
FIGURE 2
Relation between epigenetic marks and the genotypicvariability of phenotypic plasticity under limited wateravailability or not in six poplar hybrids. a. Experimentaldesign; b. Stem biomass and DNA methylation levelsin the shoot apex (center of morphogenesis). For eachgraph, g indicates the genotype effect, t the treatmenteffect and (gxt) genotype by treatment effect. Means
are accompanied by their standard errors SE (n = 6).Significant differences between well-watered andwater deficit conditions are indicated by asterisk: * P ≤0.05, ** P ≤ 0.01 and *** P ≤ 0.001; c. Linear correlation(Pearson, r) between stem biomass and DNAmethylation levels. Adapted from Gourcilleau et al.2010.
51
Epigenetic plasticity in growth and development
During their relatively long lifespans, trees must makedevelopmental adjustments while retaining flexibility tomatch and synchronise growth and development withprevailing environmental conditions. Epigeneticmechanisms are proposed to contribute to such flexibleadjustments by generating transmittable and reversiblemarks that constitute temporary “memory” systems(Boyko & Kovalchuk, 2008; Kvaalen & Johnsen, 2008;Yakovlev et al. 2010; Jaskiewicz et al. 2011). Tissue-, organ-, and species-specific differences in DNA methylationlevels are well known (Fraga et al. 2002a; Fraga et al.2002b; Valledor et al. 2007; Monteuuis et al. 2009;Santamaria et al. 2009; Rodriguez Lopez et al. 2010;Valledor et al. 2010; Vining et al. 2012; Lafon-Placette et al.2012). Changes in epigenetic marks were found toaccompany morphological and physiological changes intrees in a wide variety of processes, including ageing,phase change, organ maturation, and bud set or burst(Fraga et al. 2002a; Fraga et al. 2002b; Santamaria et al.2009; Valledor et al. 2010).
Bud dormancy is a vital adaptation to seasonal changes,and release and induction of bud dormancy are complexprocesses that largely determine length of the growthseason, and thereby affect annual tree productivity.Regulation of bud burst integrates endogenous andexogenous signals such as hormone levels, day length,light quality and temperature (Santamaria et al. 2009) andinvolves substantial changes in gene expression andepigenetic modifications (Ruttink et al. 2007; Rohde,2009; Santamaria et al. 2009). In apical buds of a chestnut(Castanea sativa), a decrease in global DNA methylationlevel and concomitant increase in acetylation of histone 4was observed during bud burst when conditions werefavorable for active growth. The opposite pattern (i.e., DNAhypermethylation and lower histone acetylation levels),indicative of more repressive chromatin states, wasdetected during bud set when environmental conditionswere less favorable for growth (Santamaria et al. 2009).The observed coordinated changes in DNA methylationand histone modifications are predicted to alter the controlof gene expression to shape the processes of bud burstand bud set (Santamaria et al. 2009).
Ageing and maturation are characterised by alteredpatterns of cell differentiation and organ formationprocesses, and the potential role of DNA methylation inmaturation has been studied in some tree species (Fragaet al. 2002a; Fraga et al. 2002b; Valledor et al. 2007;Monteuuis et al. 2009). For example, studies in radiata pine(Pinus radiata) support the involvement of DNAmethylation in this process. Changes in global DNAmethylation levels of up to 25% during maturation havebeen reported in this species (Fraga et al. 2002a; Fraga etal. 2002b). In juvenile plants without flowering capability,young needle tissue was characterised by a markedly
lower extent of DNA methylation than correspondingtissues in adult trees with reproductive ability. Regardinghistone modifications, decreased levels of euchromatin-associated marks, such as histone 4 acetylation andspecific histone methylation (trimethylation of histone 3on lysine 4 or H3K4me3) have been measured in matureneedles when compared with juvenile ones (Valledor et al.2010). Moreover, the observed increase in DNAmethylation levels from juvenile to mature plants inmeristematic tissue could be directly linked to phasechange. Conversely, an increase in the degree of treereinvigoration by serial grafting, measured by the recoveryof morphogenetic competence, was accompanied by adecrease in global level of DNA methylation inmeristematic tissue, thus pointing towards plasticity ofDNA methylation marks during ageing and maturation.The degree of DNA methylation, as well as additionalbiochemical characteristics, were proposed to serve assuitable markers for ageing and reinvigoration in pine(Fraga et al. 2002a; Fraga et al. 2002b). However,differences between species and experimental systemsmight exist. In another conifer, Larix laricina, age-relatedchanges in foliar traits were observed, while differences inDNA methylation levels between juvenile and maturescions could not be detected in DNA from whole needles(Greenwood et al. 1989).
In angiosperms, heteroblastic tree species like Acaciamangium with distinct leaf morphologies of juvenile andmature stages provide excellent systems to study ageing.Small but significant differences between microshootswith juvenile (pinnate) and mature (phyllode) morphologywere observed in this acacia species when analysingglobal DNA methylation levels in physiologically activeapical buds of in vitro grown plant material. Here, thedegree of DNA methylation was higher in juvenile than inmature tissue, and might be influenced by in vitro cultureconditions (see Epigenetic and phenotypic plasticity inartificial system) in addition to maturation-relatedprocesses (Baurens et al. 2004; Monteuuis et al. 2009).Taken together, the aforementioned studies establish aclear relationship between DNA methylation levels andmaturation for some tissue types and species in woodyplants (Fraga et al. 2002a; Fraga et al. 2002b; Baurens etal. 2004; Valledor et al. 2007; Monteuuis et al. 2009).Observed differences might be attributable to differencesin taxonomy, tissue type (meristematic vs. differentiated)or experimental system (in vitro, field conditions) andmight also reflect underlying mechanistic differences inthe relationship between ageing and epigenetic marks(Fraga et al. 2002b; Monteuuis et al. 2009). Furthermore,the data indicate that DNA methylation patterns are notstatic and can exhibit remarkable dynamics and plasticityduring development and seasonal changes (Fraga et al.2002b; Valledor et al. 2007; Monteuuis et al. 2009).
Evidence for the remarkable dynamics and plasticity ofepigenetic modification in tree species is growing.
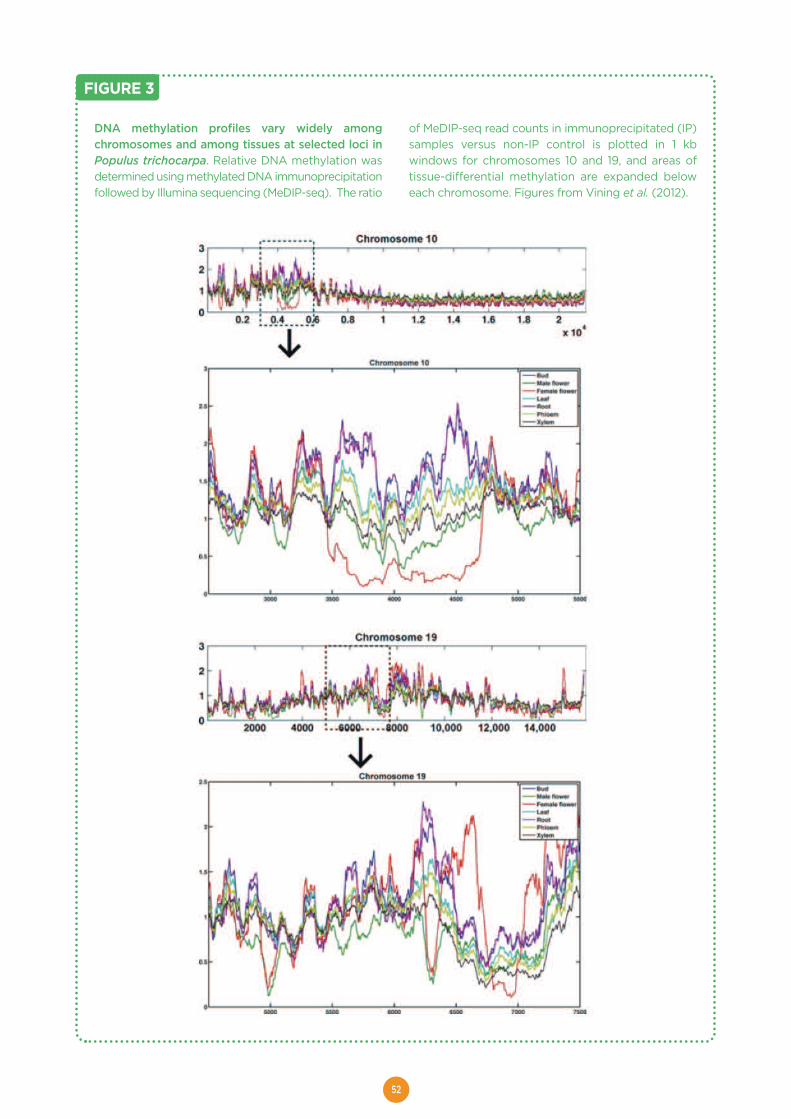
52
FIGURE 3
DNA methylation profiles vary widely amongchromosomes and among tissues at selected loci inPopulus trichocarpa. Relative DNA methylation wasdetermined using methylated DNA immunoprecipitationfollowed by Illumina sequencing (MeDIP-seq). The ratio
of MeDIP-seq read counts in immunoprecipitated (IP)samples versus non-IP control is plotted in 1 kbwindows for chromosomes 10 and 19, and areas oftissue-differential methylation are expanded beloweach chromosome. Figures from Vining et al. (2012).
53
Genome-level comparative analysis of cytosinemethylation among differentiated poplar tissues revealedhighly heterogeneous DNA methylation profiles amongchromosomes, and a number of cases of tissue-specificmethylation (Fig.3; Vining et al. 2012), many of themassociated with gene bodies or promoters. Although abroadly similar chromosome methylation and geneexpression profile was observed in poplar when comparedto A. thaliana and other plant species, significantdifferences were also detected. For example, only in poplarwas gene body (i.e., the entire gene from the transcriptionstart site to the end of the transcript) methylationassociated with greater repression of gene expression thanwas promoter methylation. In addition, Vining et al. (2012)observed a distinctive pattern of transposon and genebody methylation for male catkins compared to othertissues, including female catkins. Recently, analysis of themethylome of open chromatin in poplar meristematic cellsfound that 74% of poplar gene models had gene bodymethylation, and its intensity, as well as cytosine context,varied depending on gene size, redundancy in the genome(presence of paralogs), and extent of tissue-specific geneexpression (Lafon-Placette et al. 2012).
Plasticity in tree epigenetic modification has also beenobserved in conifer species, specifically as it relates tophenology. Phenology responses of seedlings that wereproduced in warm or cold years vary within the samestands (Kohmann & Johnsen, 1994). In Norway spruce, atemperature-dependent epigenetic “memory” from thetime of embryo development, which thereafter influencesthe timing of bud phenology and gene expression, hasbeen discovered (Skrøppa & Johnsen, 2000; Johnsen etal. 2005; Yakovlev et al. 2010). Colder-than-normalconditions during embryogenesis and seed developmentadvance the timing, whereas temperatures above normaldelay the onset of these adaptive processes, and thealtered performance is long lasting in the progeny. Thisphenomenon was initially discovered when ecotypes fromnorthern Norway were transferred to a southern seedorchard where they produced progenies with a phenologysimilar to that of southern ecotypes (Johnsen et al. 1996;Skrøppa & Johnsen, 2000). Notably, differences in daylength and temperature applied during pollen formationdid not affect the progeny performance. Differences in thefemale flowering environment did affect progenyperformance. The temperature during zygoticembryogenesis and seed maturation shifted thedevelopmental program of the seeds, resulting insignificant phenotypic changes, with the effect lasting aslong as over 20 years (Skrøppa & Johnsen, 2000; Skrøppaet al. 2010; Yakovlev et al. 2010). The traits that are affectedinclude the timing of dehardening and bud burst in thespring; leader shoot growth cessation in the summer andbud set and cold acclimation in the autumn. All processesare thus advanced or delayed as influenced by the
temperature during reproduction in progeny with identicalgenetic background. Similar effects have been observedin progeny from white spruce (Picea glauca × Piceaengelmannii) crosses, Scots pine, Larix spp. and longleafpine (Dormling & Johnsen, 1992; Greenwood & Hutchison,1996; Stoehr et al. 1998; Webber et al. 2005) but there islack of information regarding this phenomenon inangiosperm trees (Rohde & Junttila, 2008). In birch(Betula pendula), a small-scale study within a populationrevealed a close genetic relationship between trees thathad established in a year of similar temperature (Kelly etal. 2003).
The importance of plastic epigenetic modification onphenology in conifer species extends beyond theindividual to encompass the ecosystem. Epigenetic effectstaking place during zygote development may createphenotypic diversity at the local community level, iftemperature varies considerably amongst successivegenerations. This is particularly important as phenologytraits are strongly genetically differentiated.
The molecular mechanism behind this striking epigenetic“memory” phenomenon is not yet clear, but transcriptionalchanges have been implicated (Johnsen et al. 2005;Yakovlev et al. 2010; Yakovlev et al. 2011). In progeny thatdiffer epigenetically, transcriptional analysis revealed thatseedlings from full-sib families produced at differentembryogenesis temperatures under long and short dayconditions differed. Suppressive subtracted cDNA librariesrevealed considerable differences in their transcriptomes.MicroRNA pathway genes DICER-LIKE1 (PaDCL1), DICER-LIKE 2 (PaDCL2) and SUPPRESSOR OF GENE SILENCING3-LIKE (PaSGS3), as well as transposon-related genes, hadaltered transcript abundance in epigenetically-differentprogeny with phenotypic differences in bud burst and budset (Yakovlev et al. 2011). Norway spruce contains a set ofconserved miRNAs as well as a large proportion of novelnon-conserved miRNAs involved in temperature-dependent epigenetic “memory”. Most of the miRNAswere targeted to previously unknown genes, or genes withno known function. The expression of seven conservedand nine novel miRNAs showed significant differences intranscript levels in progenies showing distinct epigeneticdifference in bud set, but not in the progeny from a non-responding family without differences in bud set, makingthem excellent candidate miRNAs. The altered transcriptabundance of specific miRNAs suggests their putativeparticipation in epigenetic regulation (Yakovlev et al.2010). This epigenetic phenomenon is not only generatedin controlled Norway spruce crosses, but such epitypescan also be produced by somatic embryogenesis (Kvaalen& Johnsen, 2008). Genetically identical plants generatedat different temperatures by zygotic embryogenesisexpressed a difference in timing of terminal bud formationthat was equivalent to a 4-6° latitudinal ecotypicdifference.
54
The “memory” effects acting on phenological traits lastedfor more than 20 years after germination and affectedlong-term growth under field conditions (Skrøppa et al.2007). Notably, there was absence of any geneticsegregation distortion in the progeny, strongly supportingthat this “memory”, affecting the climatic adaptation inthis species, is indeed an epigenetic phenomenon(Besnard et al. 2008). Thus distinct epitypes can beproduced from the same genotype in Norway spruce, aprocess not well documented in other tree species so far.In view of rapid climate change, strategies to increasediversity for selection might be of prime importance forsurvival of species within their current geographicdistribution, and therefore, this epigenetic “memory”mechanism is likely of evolutionary significance and hasobvious practical implications.
Epigenetic and phenotypic plasticity in artificialsystems
While epigenetic phenomena are clearly important fortrees in a natural context, they also could be of greatconsequence during specific tree production processesintegrated into the wood products chain. Long generationtimes and the out-crossing habit of a number of foresttrees can make it difficult to rapidly propagate materialand maintain valuable genotypes under natural conditions.Tissue culture can provide alternative means to keepdesirable genotypes by vegetative propagation and toquickly produce commercial quantities of regenerants;therefore, micropropagation is widely used in forestry. Ithas been observed, however, that tissue culture canintroduce variation in regenerated plants. This somaclonalvariation, can result in subtle to drastic phenotypicvariation and has been found to be attributable to geneticor epigenetic variations (e.g. reviewed in Kaeppler et al.2000; Miguel & Marum, 2011). Somaclonal variation(heritable across mitotic and meiotic cell divisions) hasbeen considered both beneficial and disadvantageous(Jaligot et al. 2000; Kaeppler et al. 2000; Schellenbaumet al. 2008), and a number of studies have focused onelucidating underlying mechanisms (Kaeppler et al. 2000;Rival et al. 2008; Schellenbaum et al. 2008; RodriguezLopez et al. 2010).
A well-studied example for somaclonal variants and theirrelation to epigenetic marks in a tree species is themantled phenotype in somatic-embryo-derived oil palm(Elaeis guineensis). This phenotypic variant, found in aboutfive percent of regenerants, is characterised by abnormalinflorescence development and has been associated withglobal DNA hypomethylation, but not to changes ingenomic structure or nucleotide sequence (Jaligot et al.2000; Rival et al. 2008). The exact mechanisms involvedin generating somaclonal variants like the mantledphenotype remain largely unresolved. Ongoing studies ofthis phenomenon might help to better understandmechanisms of epigenetic responses to tissue-culture-induced stresses (Kaeppler et al. 2000; Rival et al. 2008).
It has also been observed that the ability to generatemature somatic embryos from cultured tissue candecrease as a culture ages and that somaclonal variationcan increase with culture age (Phillips et al. 1994; Valledoret al. 2007; Krizova et al. 2009). In addition to othermechanisms, changes in DNA methylation wereconsidered to contribute to the reduction of embryonicpotential or organogenic potential in tissue culture andgrafting procedures (Fraga et al. 2002b; Valledor et al.2007). A detailed analysis of genetic and epigeneticvariation in relation to callus age reports interestingplasticity in cocoa plants (Theobroma cacao) regeneratedby somatic embryogenesis. Genetic variation wasinvestigated using single sequence repeat (SSR) markers,and epigenetic variability was assessed by methylation-sensitive amplified polymorphism (MSAP), a method todetect genome-wide but anonymous DNA methylationpatterns. Contrary to predictions, after an initial increase,a decrease in both genetic and epigenetic divergencebetween leaves of regenerants and the ortet plant wasobserved after the culture had reached an age of about 10weeks (Rodriguez Lopez et al. 2010). One possibleinterpretation of the findings suggests a link betweenstable DNA methylation patterns and repression of denovo mutations during somatic embryogenesis(Rodriguez Lopez et al. 2010).
For many plant species, different physiological anddevelopmental stages of diverse tissue explant types havebeen associated with distinct epigenetic characteristics, inparticular DNA methylation (Fraga et al. 2002a; Fraga etal. 2002b; Monteuuis et al. 2009; Santamaría et al. 2009;Rodríguez López et al. 2010; Valledor et al. 2010). Forexample, some DNA methylation patterns and levels,characteristics of the source tissue used to start an in vitroculture, were retained in regenerants in acacia and cocoa(Monteuuis et al. 2009; Rodríguez López et al. 2010). Thishighlights the plasticity of DNA methylation marks undertissue culture conditions. Transitions from juvenile to adultphase are frequently accompanied by reduction or loss ofmorphogenetic ability in woody species (see Epigeneticplasticity in growth and development). Concomitant withmaturation of pine needles, changes in epigenetic markswere measured when compared to immature needles. Thisfinding could be in accordance with a less permissive andreprogrammable chromatin state and could account inpart for the reduced organogenic capacity of explantsfrom mature needles.
Generation of somaclonal genetic and epigenetic variantsas well as plasticity in DNA methylation are widelydocumented outcomes of plant regeneration in tissueculture (Kaeppler et al. 2000; Marfil et al. 2009). Studyingunderlying mechanisms might be of relevance for basicresearch and applications in plant propagation such as theunderstanding of differentiation and dedifferentiationprocesses or the selection of appropriate in vitro cultureconditions (Kaeppler et al. 2000; Marfil et al. 2009;Rodriguez Lopez et al. 2010).
55
Strategic and technical approachesto study epigenetic processesSelection of appropriate systems
Different methods have been used in model plants toanalyse epigenetic variation independently of geneticvariation. These have included treatment withdemethylating agents, analysis of natural epimutations,and study of DNA methylation-deficient mutants.Epigenetic recombinant inbred lines (epiRILs) have beendeveloped in A. thaliana (Johannes et al. 2009; Reinderset al. 2009) using isogenic lines (wild types and mutantlines) differing only in the level and distribution of DNAmethylation (see Epigenetic regulation in plantenvironmental responses). These lines represent apowerful tool to identify specific epigenomic regions thatare associated with the observed phenotypic variationthrough epiQTL mapping approaches that are based onmethylation sensitive markers. The epiQTL mappingapproach requires the establishment of multiple plantgenerations, and may be difficult to apply to tree speciesthat require a significant amount of time to reach sexualmaturation.
To discern genetic and epigenetic effects, clonallypropagated plants or systems that are characterized byreduced genetic variation, such as stone pine (Pinuspinea), represent ideal study subjects. To separateheritable from non-heritable epigenetic variation (resultingfrom developmental plasticity in response to differentenvironments) it is necessary to study, when available,clonally propagated genotypes, the progeny of differentnatural populations or maternal families in a commonenvironment, and to use the resemblance of epigeneticpatterns among relatives as an indication of epigeneticinheritance (Bossdorf et al. 2008).
Technical approaches
A wide variety of techniques have been developed tostudy epigenetic patterns and modifications. Histonemodifications can be analysed by chromatinimmunoprecipation (ChIP) using antibodies that recognisespecific histone modifications, followed by eithermicroarray hybridisation (ChIP on chip) or by nextgeneration sequencing (ChIP-Seq; Ku et al. 2011). DNAmethylation at the genome level, the DNA methylome, canbe investigated by methylated DNA immunoprecipitation(meDIP) or by bisulfite treatment of the DNA followed byhybridisation to a microarray, or by next generationsequencing (BS-Seq; Ku et al. 2011; Krueger et al. 2012;Cokus et al. 2008). Additionnally direct detection ofmethylated residues using DNA synthesis technologiesbased on variable polymerase kinetics depending on thechemical modification of the template nucleotide (e.g. 5-methylcytosine vs. cytosine) represents a novel methodto directly detect DNA methylation (Flusberg et al. 2010).
Next generation sequencing technologies enable mappingof epigenetic modifications at single base resolution. Thenature and large amount of data generated by suchtechnologies will demand new approaches in data analysistechniques. Inference of the methylation status of bisulfite-treated DNA by BS-Seq can be challenging as the dataobtained do not exactly match the reference sequence.Consequently, both DNA strands must be consideredseparately, and methylation at a specific site can be apercentage rather than a total presence or absence.Nevertheless, a number of tools have been developed tofacilitate these analyses and are now available forapplication to tree epigenomes (Chen et al. 2010; Lim etal. 2010; Krueger et al. 2012).
ConclusionMany questions remain about the mechanisms and rolesof epigenetic processes in enabling rapid adaptation ofplants to their environment, especially in forest trees.Recently, genome-wide studies of chromatin-boundproteins and epigenetic marks in Drosophila melanogasterand in A. thaliana have substantially revised ourunderstanding of chromatin (Roudier et al. 2011; VanSteensel, 2011). The dogma of an uncompacted,transcriptionally-active euchromatin versus a compacted,silent heterochromatin is likely to be an oversimplificationof the real chromatin architecture. It appears thatchromatin might be composed of several types differingin their epigenetic marks as well as in their nuclearlocalisation and chromatin-associated proteins. Thesetypes could favor or prevent association with transcriptionfactors, thus defining gene expression patterns. Whetherthese chromatin types exist in perennial species is notknown, and the stability of these chromatin types in long-living organisms is to be established. Similarly, themaintenance of these types during clonal and in vitroculture propagation will give important clues about theeffect of these biotechnologies on gene expressioncontrol.
It has been observed that the induction of alternativeepigenetic states not only triggers the formation of newepialleles but also promotes the movement of DNAtransposons and retroelements that are very abundant inplant genomes (Mirouze & Paszkowski, 2011). However,mechanisms counteracting accumulation of inducedepialleles must also be in place, because otherwise wewould be “constantly confronted with the inheritance ofenvironmentally-induced phenotypic variation” (Richards,2006). Additionally, in large genomes, such as those ofconifer [with C estimates of DNA content ranging from 17to 30 Gbp for pines and spruces of which more than 68%are attributed to repeated DNA (Rake et al. 1980; Ohri &Khoshoo, 1986)], cytosine methylation is implicated ingenomic compartmentalisation, i.e., non-coding highlyrepeated sequences get separated from low-copy
56
sequence and transcriptionally active regions. Thedifferential methylation of genic and non-genic regionsobserved across plant taxa, may be involved in decreasingtranscriptional ‘noise’ (Rabinowicz et al. 2005). In largegenomes, epigenetic mechanisms might be moreprominent, as a means to control the repetitive parts ofthe genome. This might render their entire genomes moreamenable to epigenetic regulation.
From an economic and ecological point of view, it isimportant to integrate information on epigenetic controlof environmental and developmental processes in bothforest resources management and breeding. Inquantitative genetic studies, estimates of genetic varianceover the total phenotypic variance are typically used toassess the heritability of a trait. Akin to other geneticcharacters, variance in epigenetic characters willcontribute to genetic variance and/or phenotypic variance,but might go undetected in some studies, or might beconfounded with normal Mendelian-based quantitativeinheritance (Kalisz & Purugganan, 2004). Epigeneticeffects may thus inflate the true genetic variation in traits.As a consequence, the genetic clines observed for manyphenology traits, even in common garden experiments,may reflect more local adaptation than DNA sequence-based genetic differences among populations.
Recent developments show that both energy efficiencyand energy homeostasis, which are integral parts of yield,have an epigenetic component that can be directed andstabilised by artificial selection (i.e. selective breeding; DeBlock & Van Lijsebettens, 2011). These findings open newpossibilities for engineering plant metabolism andimproving complex traits. For example, in addition to theunintended genetic and epigenetic variation imparted byin vitro-manipulation, it may be considered and utilised asa means to amplify or release epigenetic variation of valueto breeding programs Transgenic perturbation ofepigenetic mechanisms might have similar effects;however, testing such effects using a transgenic approachwith forest trees at a scale relevant to application andecological variation are, at present, constrained bygovernment regulations (Viswanath et al. 2012).
Genome perturbation, including epigenetic components,might be important for increasing the raw material foradaptive evolution under severe stress (Kalisz &Purugganan, 2004; Rapp & Wendel, 2005). Rapp &Wendel (2005) suggest that a population bottleneck,while reducing genetic diversity, might simultaneouslycreate epigenetic novelty. In contrast to genetic alleles,epialleles might react more quickly to environmentalchange, be reversible, and persist for only a fewgenerations (Kalisz & Purugganan, 2004). If a new epiallelewere to cause a mild phenotype through alteration of geneexpression, it might experience less strong selection thana loss-of-function sequence mutation (Kalisz &Purugganan, 2004) and thus enable rapid, yet fine-tuned,
trait modifications. The significance of epialleles in wildpopulations will depend on their frequency and stability(Rohde & Junttila, 2008).
The analysis of the epigenetic processes in an ecologicalcontext, known as “ecological epigenetics” is set totransform our understanding of the way in whichorganisms function on the landscape. Forest trees offerexcellent opportunities to examine some of the mostcompelling questions of ecological epigenetics (Bossdorfet al. 2008), particularly those related to the interplaybetween epigenetic variation and phenotypic variation innatural populations, and the role of epigenetic variation inevolutionary processes. Ecological epigenetics couldreadily address such questions by capitalising on theadvantageous features of forest trees, including their long-lifespans, their dominance of many ecosystems, their widegeographical distribution, and their life histories, especiallyreproductive traits like clonal propagation. Analysis of theepigenetics of forest tree species will significantly improveour understanding of the mechanisms underlying naturalphenotypic variation, and the responses of organisms toenvironmental change, and may thereby inform efforts tomanage and breed tree species to help them cope withenvironmental stresses.
AcknowledgementsThe preparation of this review was supported by fundingfrom the FP7 UE projects FORESTTRAC (2440096-FP7)and ProCoGen (289841-FP7).
The authors are very grateful to Susana Ferrándiz forhelping with the preparation of the manuscript.
Conflict of interestAll authors disclose any potential source of conflict ofinterest or relationship (financial or otherwise) that mightbe perceived as influencing an author’s objectivity.
REFERENCESAkimoto K, Katakami H, Kim HJ, Ogawa E, Sano CM, WadaY, Sano H (2007) Epigenetic inheritance in rice plants.Annals of Botany, 100, 205-217.Bastow R, Mylne JS, Lister C, Lippman Z, Martienssen RA,Dean C (2004) Vernalization requires epigenetic silencingof FLC by histone methylation. Nature 427, 164-167.Baurens FC, Nicolleau J, Legavre T, Verdeil JL, MonteuuisO (2004) Genomic DNA methylation of juvenile andmature Acacia mangium micropropagated in vitro withreference to leaf morphology as a phase change marker.Tree Physiology, 24, 401-407.Besnard G, Acheré V, Jeandroz S, Johnsen Ø, FaivreRampant P, Baumann R, Müller-Starck G, Skrøppa T, JMFavre (2008) Does maternal environmental conditionduring reproductive development induce genotypicselection in Piceaabies?. Annals of Forest Science, 65, 109.
57
Birchler JA, Yao H, Chudalayandi S, Vaiman D, Vieti RA(2010) Heterosis. The Plant Cell, 22, 2105-2112.
Bogeat-Triboulot MB, Brosché M, Renaut J, Jouve L, LeThiec D, Fayyaz P, Vinocur B, Witters E, Laukens K,Teichmann T, Altman A, Hausman JF, Polle A, KangasjärviJ, Dreyer E (2007) Gradual soil water depletion results inreversible changes of gene expression, protein profiles,ecophysiology, and growth performance in Populuseuphratica, a poplar growing in arid regions. PlantPhysiology, 143, 876-892.
Bonasio R, Tu S, Reinberg D (2010) Molecular Signals ofEpigenetic States. Science, 330, 612-616.
Bond DM, Finnegan EJ (2007) Passing the message on:inheritance of epigenetic traits. Trends in Plant Science, 12,211-216.
Bonhomme L, Monclus R, Vincent D, Carpin S, LomenechAM, Plomion C, Brignolas F, Morabito D (2009) Leafproteome analysis of eight Populus x euramericanagenotypes: genetic variation in drought response and inwater-use efficiency involves photosynthesis-relatedproteins. Proteomics, 9, 4121-4142.
Bossdorf O, Richards CL, Pigliucci M (2008) Epigeneticsfor ecologists. Ecology, Letters, 11, 106-115.
Bourc'his D, Voinnet O (2010) A Small-RNA Perspectiveon Gametogenesis, Fertilization, and Early ZygoticDevelopment. Science, 330, 617-622.
Boyko A, Kovalchuk I (2008) Epigenetic control of plantstress response. Environmental and MolecularMutagenesis, 49, 61-72.
Cervera MT, Ruiz-Garcia L, Martínez-Zapater JM (2002)Analysis of DNA methylation in Arabidopsis thaliana basedon methylation-sensitive AFLP markers. MolecularGenetics and Genomics, 268, 543-552.
Chen PY, Cokus SJ, Pellegrini MBS (2010) Seeker: precisemapping for bisulfite sequencing. BMC Bioinformatics, 11,203.
Chinnusamy V, Zhu JK (2009) Epigenetic regulation ofstress responses in plants. Current Opinion in PlantBiology, 12, 133-139.
Chouard P (1960) Vernalization and its relations todormancy. Annual Review of Plant Physiology, 11, 191-238.
Cokus S J, Feng S, Zhang X, Chen Z, Merriman B,Haudenschild CD, Pradhan S, Nelson SF, Pellegrini M,Jacobsen SE (2008) Shotgun bisulphite sequencing of theArabidopsis genome reveals DNA methylation patterning.Nature, 452, 215-219.
Cubas P, Vincent, C, Coen, E (1999) An epigeneticmutation responsible for natural variation in floralsymmetry. Nature, 401, 157-161.
De Block M, Van Lijsebettens M (2011) Energy efficiencyand energy homeostasis as genetic and epigeneticcomponents of plant performance and crop productivityCurrent Opinion in Plant Biology, 14, 275-282.
Demidov D, Hesse S, Tewes A, Rutten T, Fuchs J, AshtiyaniRK, Lein S, Fischer A, Reuter G, Houben A (2009) Aurora1phosphorylation activity on histone H3 and its cross-talkwith other post-translational histone modifications inArabidopsis. The Plant Journal, 59, 221-230.
Dormling I, Johnsen Ø (1992) Effects of the parentalenvironment on full-sib families of Pinus sylvestris.Canadian Journal of Forest Research, 22, 88-100.
Feil, R, Fraga MF (2011) Epigenetics and the environment:emerging patterns and implications. Nature ReviewsGenetics, 13, 97-109.Flusberg BA, Webster DR, Lee JH, Travers KJ, Olivares, EC,Tyson AC, Korlach J, Turner, SW (2010) Direct detection ofDNA methylation during single-molecule, real-timesequencing. Nature Methods, 7, 461-465. Fraga MF, Canal MJ, Rodriguez R (2002a) Phase-changerelated epigenetic and physiological changes in Pinusradiata D. Don. Planta, 215, 672-678.Fraga MF, Rodriguez R, Canal MJ (2002b) Genomic DNAmethylation-demethylation during aging and reinvigorationof Pinus radiata. Tree Physiology, 22, 813-816.Gourcilleau D, Bogeat-Triboulot MB, Le Thiec D, Lafon-Placette C, Delaunay A, El-Soud WA, Brignolas F, Maury S(2010) DNA methylation and histone acetylation:genotypic variations in hybrid poplars, impact of waterdeficit and relationships with productivity. Annals of ForestScience, 67, 208Grattapaglia D, Plomion C, Kirst M, Sederoff RR (2009)Genomics of growth traits in forest trees. Current Opinionin Plant Biology, 12, 148-156.Greenwood MS, Hopper CA, Hutchison KW (1989)Maturation in larch: I. Effect of age on shoot growth, foliarcharacteristics, and DNA methylation. Plant Physiology,90, 406-412.Greenwood MS, Hutchison KW (1996) Genetic after effectsof increased temperature in Larix. In: Hom J, Birdsey R,O’Brian K eds. Proceedings of the 1995 Meeting of theNorthern Global Change Program. Radnor: USDA ForestService report 56-62.Groszmann, M, Greaves IK, Albert N, Fujimoto R, HelliwellCA, Dennis. ES, Peacock WJ (2011a) Epigenetics in plants-vernalisation and hybrid vigour. Biochimica et BiophysicaActa, 1809, 427-437.Groszmann M, Greaves IK, Albertyn ZI, Scofield GN,Peacock WJ, Dennis ES (2011b) Changes in 24-nt siRNAlevels in Arabidopsis hybrids suggest an epigeneticcontribution to hybrid vigor. Proceedings of the NationalAcademy of Sciences of the United States of America, 108,2617-2622.Gutierrez-Marcos JF, Costa LM, Dal Prà M, Scholten S,Kranz E, Perez P, Dickinson HG (2006) Epigeneticasymmetry of imprinted genes in plant gametes. NatureGenetics, 38, 876-878.Ha M, Lu J, Tian L, Ramachandran V, Kasschau KD, CapmanEJ, Carrington JC, Chen X, Wang XJ, Chen ZJ (2009) SmallRNAs serve as a genetic buffer against genomic shock inArabidopsis interspecific hybrids and allopolyploids.Proceedings of the National Academy of Sciences of theUnited States of America, 106, 17835-17840.Hamanishi ET, Campbell MM (2011) Genome-wideresponses to drought in forest trees. Forestry, 84, 273-283.Hashida S N, Uchiyama T, Martin C, Kishima Y, Sano Y,Mikami T (2006) The temperature-dependent change inmethylation of the Antirrhinum transposon Tam3 iscontrolled by the activity of its transposase. Plant Cell, 18,104-118.Haun WJ, Laoueille-Duprat S, O'Connell MJ, Spillane C,Grossniklaus U, Phillips AR, Kaeppler SM, Springer NM(2007) Genomic imprinting, methylation and molecularevolution of maize Enhancer of zeste (Mez) homologs. ThePlant Jorunal, 49, 325-337.
58
Hauser M, Aufsatz W, Jonak C, Luschnig C (2011)Transgenerational epigenetic inheritance in plants.Biochimica et Biophysica Acta, 1809, 459-468.He G, Zhu X, Elling AA, Chen L, Wang X, Guo L, Liang M,He H, Zhang H, Chen F, Qi Y, Chen R, Deng XW (2010)Global epigenetic and transcriptional trends among tworice subspecies and their reciprocal hybrids. Plant Cell, 22,17-33.Heo JB, Sung S (2011) Vernalization-mediated epigeneticsilencing by a long intronic noncoding RNA. Science, 331,76-79.Herrera CM (1990) The adaptedness of the floralphenotype in a relict endemic, hawkmoth-pollinated violet.2. Patterns of variation among disjunct populations.Biological Journal of the Linnean Society, 40, 275-291.Herrera CM, Bazaga P (2010) Epigenetic differentiationand relationship to adaptive genetic divergence in discretepopulations of the violet Viola cazorlensis. New Phytologist,187, 867-876.Ito H, Gaubert H, Bucher E, Mirouze M, Vaillant I,Paszkowski J (2011) An siRNA pathway preventstransgenerational retrotransposition in plants subjected tostress. Nature, 472, 115-119.Jablonka E, Raz G (2009) Transgenerational epigeneticinheritance: prevalence, mechanisms, and implications forthe study of heredity and evolution. The Quarterly Reviewof Biology, 84: 131-176.Jaligot E, Rival A, Beule T, Dussert S, Verdeil JL (2000)Somaclonal variation in oil palm (Elaeis guineensis Jacq.):the DNA methylation hypothesis. Plant Cell Reports, 19,684-690.Jaskiewicz M, Conrath U, Peterhansel C (2011) Chromatinmodification acts as a memory for systemic acquiredresistance in the plant stress response. EMBO Reports, 12,50-55.Johannes F, Colot V, Jansen RC (2008) Epigenomedynamics: a quantitative genetics perspective. NatureReviews Genetics, 9, 883-890.Johannes F, Porcher E, Teixeira FK, Saliba-Colombani V,Simon M, Agier N, Bulski A, Albuisson J, Heredia F, AudigierP, Bouchez D, Dillmann C, Guerche P, Hospital F, Colot V(2009) Assessing the impact of transgenerationalepigenetic variation on complex traits. PLoS Genetics, 5,e1000530Johnsen Ø, Skrøppa T, Junttila O, Dæhlen OG (1996Influence of the female flowering environment on autumnfrost-hardiness of Picea abies progenies. Theoretical andApplied Genetics, 92, 797-802.Johnsen Ø, Fossdal CG, Nagy N, Molmann J, Dælen OG,Skrøppa T (2005) Climatic adaptation in Picea abiesprogenies is affected by the temperature during zygoticembryogenesis and seed maturation. Plant, Cell &Environment, 28, 1090-1102.Jullien PE, Kinoshita T, Ohad N, Berger F (2006)Maintenance of DNA methylation during the Arabidopsislife cycle is essential for parental imprinting. The Plant Cell,18, 1360-1372. Kaeppler SM, Kaeppler HF, Rhee Y (2000). Epigeneticaspects of somaclonal variation in plants. Plant MolecularBiology, 43, 179-188.Kalisz S, Purugganan MD (2004) Epialleles via DNAmethylation: consequences for plant evolution. Trends inEcology Evolution, 19, 309-314.
Kelly CK, Chase MW, De Bruijn A, Fay MF, Woodward FI(2003) Temperature-based population segregation inbirch. Ecology Letters, 6, 87-89.
Kim DH, Sung S (2012) Environmentally coordinatedepigenetic silencing of FLC by protein and long noncodingRNA components. Current Opinion in Plant Biology, 15, 51-56.
KohmannK, Johnsen Ø (1994) The timing of bud-set inseedlings of Picea abies from seed crops of a cool versusa warm summer. Silvae Genetica, 43, 328-332.
Kouzarides T (2007) Chromatin modifications and theirfunction. Cell, 128, 693-705.
Krauss V (2008) Glimpses of evolution: heterochromatichistone H3K9 methyltransferases left its marks behind.Genetica, 133, 93-106.
Krizova K, Fojtova M, DepickerA, Kovarik A (2009) Cellculture-induced gradual and frequent epigeneticreprogramming of invertedly repeated tobacco transgeneepialleles. Plant Physiology, 149, 1493-1504.
Krueger F, Kreck B, Franke A, Andrews SR (2012) DNAmethylome analysis using short bisulfite sequencing data.Nature Methods, 9, 145-151.
Ku CS, Naidoo N, Wu M, Soong R (2011) Studying theepigenome using next generation sequencing. Journal ofMedical Genetics, 48,721-30.
Kumar SV, Wigge PA (2010) H2A.Z-containing nucleosomesmediate the thermosensory response in Arabidopsis. Cell,140, 136-47.
Kvaalen H, Johnsen Ø (2008) Timing of bud set in Piceaabies is regulated by a memory of temperature duringzygotic and somatic embryogenesis. New Phytologist, 177,49-59.
Lafon-Placette C, Faivre-Rampant P, Delaunay A, Street N,Brignolas F, Maury S (2012) Methylome of DNase Isensitive chromatin in Populus trichocarpa shoot apicalmeristematic cells: a simplified approach revealingcharacteristics of gene-body DNA methylation in openchromatin state. New Phytologist, in press. doi:10.1111/nph.12026.
Lim SJ, Tan TW, Tong JC (2010) Computationalepigenetics: the new scientific paradigm. Bioinformation,4, 331-337.
Lira-Medeiros CF, Parisod C, Fernandes RA, Mata CS,Cardoso MA, Ferreira PC (2010) Epigenetic variation inmangrove plants occurring in contrasting naturalenvironment. PLoS One, 5, e10326.
Lisch DR, Slotkin RK (2011) Strategies for silencing andescape: the ancient struggle between transposableelements and their hosts. International review of cell andmolecular biology, 292, 119-152.
Long Y, Xia W, Li R, Wang J, Shao M, Feng J, King GJ, MengJ (2011) Epigenetic QTL mapping in Brassica napus.Genetics, 189, 1093-102.
Manning K, Tör M, Poole M, Hong Y, Thompson AJ, KingGJ, Giovannoni JJ, Seymour GB (2006) A naturallyoccurring epigenetic mutation in a gene encoding an SBP-box transcription factor inhibits tomato fruit ripening.Nature Genetics, 38, 948-952.
Marfil CF, Camadro EL, Masuelli RW (2009) Phenotypicinstability and epigenetic variability in a diploid potato ofhybrid origin, Solanum ruiz-lealii. BMC Plant Biology, 9, 21.
59
Miguel C, Marum L (2011) An epigenetic view of plant cellscultured in vitro: somaclonal variation and beyond. Journalof Experimental Botany, 62, 3713-3725.Mirouze M, Reinders J, Bucher E, Nishimura T,Schneeberger K, Ossowski S, Cao J, Weigel D, PaszkowskiJ, Mathieu O (2009) Selective epigenetic control ofretrotransposition in Arabidopsis. Nature, 461, 427-430. Mirouze M, Paszkowski J (2011) Epigenetic contribution tostress adaptation in plants. Current Opinion in PlantBiology, 14, 267-274.Monteuuis O, Baurens FC, Goh DKS, Doulbeau S, VerdeilJL (2009) DNA methylation in Acacia mangium in vitroand ex-vitro buds, in relation to their within-shoot position,age and leaf morphology of the shoot. Silvae Genetica, 58,287-292.Neale DB, Kremer A (2011) Forest tree genomics: growingresources and applications. Nature Reviews Genetics, 12,111-122.Nicotra AB, Atkin OK, Bonser SP, Davidson AM, FinneganEJ, Mathesius U, Poot P, Purugganan MD, Richards CL,Valladares F, van Kleunen M. (2010) Plant phenotypicplasticity in a changing climate. Trends in Plant Science, 15,684-692.Ohri D, Khoshoo TN (1986) Genome size in gymnosperms.Plant Systematics and Evolution, 153, 119-132. Paun O, Bateman RM, Fay MF, Hedren M, Civeyrel L, ChaseMW (2010) Stable epigenetic effects impact adaptation inallopolyploid orchids (Dactylorhiza: Orchidaceae).Molecular Biology and Evolution, 27, 2465-2473.Phillips RL, Kaeppler SM, Olhoft P (1994) Genetic instabilityof plant tissue cultures: breakdown of normal controls.Proceedings of the National Academy of Sciences of theUnited States of America, 91, 5222-5226.Plomion C, Lalanne C, Claverol S, Meddour H, Kohler A,Bogeat-Triboulot MB, Barre A, Le Provost G, Dumazet H,Jacob D, Bastien C, Dreyer E, de Daruvar A, Guehl JM,Schmitter JM, Martin F, Bonneu M (2006) Mapping theproteome of poplar and application to the discovery ofdrought-stress responsive proteins. Proteomics, 6, 6509-6527.Rabinowicz PD, Citek R, Budiman MA, Nunberg A, BedellJA, Lakey N, O'Shaughnessy AL, Nascimento LU,McCombie WR, Martienssen RA (2005) Differentialmethylation of genes and repeats in land plants. GenomeResearch, 15, 1431-1440.Raj S, Bräutigam K, Hamanishi ET, Wilkins O, Schroeder W,Mansfield SD, Plant AL, Campbell MM (2011) Clone historyshapes Populus drought responses. Proceedings of theNational Academy of Sciences of the United States ofAmerica, 108, 12521-12526.Rake AV, Miksche JP, Hall RB, Hansen KM (1980) DNAreassociation kinetics of four Conifers. Canadian Journalof Genetics and Cytology, 22, 69-79.Rapp RA, Wendel JF (2005) Epigenetics and plantevolution. New Phytologist, 168, 81-91.Rehfeldt GE, Ying CC, Spittlehouse DL, Hamilton DA (1999)Genetic responses to climate in pinus contorta: nichebreadth, climate change, and reforestation. EcologicalMonographs, 69, 375-407.Rehfeldt GE, Tchebakova NM, Parfenova YI, Wykoff WR,Kuzmina NA, Milyutin LI (2002) Intraspecific responses toclimate in Pinus sylvestris. Global Change Biology, 8, 912-929.
Reinders J, Wulff BBH, Mirouze M, Mari-Ordonez A, DappM, Rozhon W, Bucher E, Theiler G, Paszkowski J. (2009)Compromised stability of DNA methylation andtransposon immobilization in mosaic Arabidopsisepigenomes. Genes & Development, 23, 939-950.
Richards EJ (2006) Inherited epigenetic variation -revisiting soft inheritance. Nature Reviews Genetics, 7, 395-401.
Richards CL, Verhoeven KJF, Bossdorf O (2012)Evolutionary significance of epigenetic variation. In:Wendel JF, Greilhuber J, Dolezel J, Leitch IJ (eds.), Plantgenome diversity Volume I. Springer, Vienna. pp 257-274.
Rival A, Jaligot E, Beule T, Finnegan EJ (2008) Isolationand expression analysis of genes encoding MET, CMT, andDRM methyltransferases in oil palm (Elaeis guineensisJacq.) in relation to the 'mantled' somaclonal variation.Journal of Experimental Botany, 59, 3271-3281.
Rodriguez Lopez CM, Wetten AC, Wilkinson MJ (2010)Progressive erosion of genetic and epigenetic variation incallus-derived cocoa (Theobroma cacao) plants. NewPhytologist, 186, 856-868.
Rohde A, Junttila O (2008) Remembrances of an embryo:long-term effects on phenology traits in spruce. NewPhytologist, 177, 2-5.
Rohde A (2009) Bud set - a landmark of the seasonalgrowth cycle in poplar. In: Gusta LV, Wisniewski ME, TaninoKK, eds. Plant Cold Hardiness. Cambridge, MA: CABI, 91-98.
Roudier F, Ahmed I, Bérard C, Sarazin A, Mary-Huard T,Cortijo S, Bouyer D, Caillieux E, Duvernois-Berthet E, Al-Shikhley L, Giraut L, Després B, Drevensek S, Barneche F,Dèrozier S, Brunaud V, Aubourg S, Schnittger A, Bowler C,Martin-Magniette ML, Robin S, Caboche M, Colot V (2011)Integrative epigenomic mapping defines four mainchromatin states in Arabidopsis. EMBO Journal, 30, 1928-1938.
Ruttink T, Arend M, Morreel K, Storme V, Rombauts S,Fromm J, Bhalerao RP, Boerjan W, Rohde A (2007) Amolecular timetable for apical bud formation and dormancyinduction in poplar. The Plant Cell, 19, 2370-2390.
Santamaria ME, Hasbun R, Valera MJ (2009) AcetylatedH4 histone and genomic DNA methylation patterns duringbud set and bud burst in Castanea sativa. Journal of PlantPhysiology, 166, 1360-1369.
Schellenbaum P, Mohler V, Wenzel G, Walter B (2008)Variation in DNA methylation patterns of grapevinesomaclones (Vitis vinifera L.). BMC Plant Biology, 8, 78.
Schmitz RJ, Amasino RM (2007) Vernalization: a model forinvestigating epigenetics and eukaryotic gene regulationin plants. Biochimica et Biophysica Acta, 1769, 269-275.
Schull GH (1946) Hybrid seed corn. Science, 103, 547-550.
Skrøppa T, Johnsen Ø (2000) Patterns of adaptivegenetic variation in forest tree species; the reproductiveenvironment as an evolutionary force in Picea abies. InForest Genetics and Sustainability (ed. C. Mátyás), pp. 49-58. Kluwer Academic Publications, Dordrecht, TheNetherlands.
Skrøppa T, Kohmann K, Johnsen Ø, Steffenrem A,Edvardsen ØM (2007) Field performance and early testresults of offspring from two Norway spruce seedorchards containing clones transferred to warmer climates.Canadian Journal of Forest Research, 37, 515-522.
60
Skrøppa T, Tollefsrud M, Sperisen C, Johnsen Ø (2010)Rapid change in adaptive performance from onegeneration to the next in Picea abies-Central Europeantrees in a Nordic environment. Tree Genetics & Genomes,6, 93-99.
Slotkin RK, Martienssen RA (2007) Transposable elementsand the epigenetic regulation of the genome. NatureReviews Genetics, 8, 272-285.
Stoehr MU, L’Hirondelle SJ, Binder WD, Webber JE (1998)Parental environment after effects on germination, growth,and adaptive traits in selected spruce families. CanadianJournal of Forest Research, 28, 418-426.
Thumma BR, Matheson BA, Zhang D, Meeske C, Meder R,Downes GM, Southerton SG (2009) Identification of a Cis-acting regulatory polymorphism in a Eucalypt COBRA-likegene affecting cellulose content. Genetics, 183, 1153-1164.
Tsukahara S, Kobayashi A, Kawabe A, Mathieu O, Miura A,Kakutani T (2009). Bursts of retrotranspositionreproduced in Arabidopsis. Nature, 461, 423-426.
Valledor L, Hasbún R, Meijón M (2007) Involvementof DNA methylation in tree development andmicropropagation. The Plant Cell Tissue and Organ Culture,91, 75-86.
Valledor L, Meijon M, Hasbun R, Jesus Canal M, RodriguezR (2010) Variations in DNA methylation, acetylated histoneH4, and methylated histone H3 during Pinus radiata needlematuration in relation to the loss of in vitro organogeniccapability. Journal of Plant Physiology, 167, 351-357.
Van Steensel B (2011) Chromatin: constructing the bigpicture. The EMBO Journal, 30, 885-1895.
Verhoeven KJ, Jansen JJ, van Dijk PJ, Biere A (2010)Stress-induced DNA methylation changes and theirheritability in asexual dandelions. New Phytologist, 185,1108-1118.
Vining KJ, Pomraning KR, Wilhelm LJ, Priest HD, PellegriniM, Mockler TC, Freitag M, Strauss SH (2012) Dynamic DNAcytosine methylation in the Populus trichocarpa genome:tissue-level variation and relationship to gene expression.BMC Genomics, 13, 27.
Viswanath V, Albrechtsen BR, Strauss SH (2012) Globalregulatory burden for field testing of genetically modifiedtress. Tree Genetics & Genomes, 8, 221-226.
Webber J, Ott P, Owens J, Binder W (2005) Elevatedtemperature during reproductive development affectscone traits and progeny performance in Picea glauca -engelmannii complex. Tree Physiology, 25, 1219-1227.
Whittle CA, Otto SP, Johnston MO, Krochko JE (2009)Adaptive epigenetic memory of ancestral temperatureregime in Arabidopsis thaliana. Botany, 87, 650-657.
Wilkins O, Waldron L, Nahal H, Provart NJ, Campbell MM(2009) Genotype and time of day shape the Populusdrought response. The Plant Journal, 60, 703-715.
Yakovlev IA, Fossdal CG, Johnsen Ø (2010) MicroRNAs,the epigenetic memory and climatic adaptation in Norwayspruce. New Phytologist, 187, 1154-1169.
Yakovlev IA, Asante DKA, Fossdal CG, Junttila O, JohnsenØ (2011) Differential gene expression related to anepigenetic memory affecting climatic adaptation inNorway spruce. Plant Science, 180, 132-139.
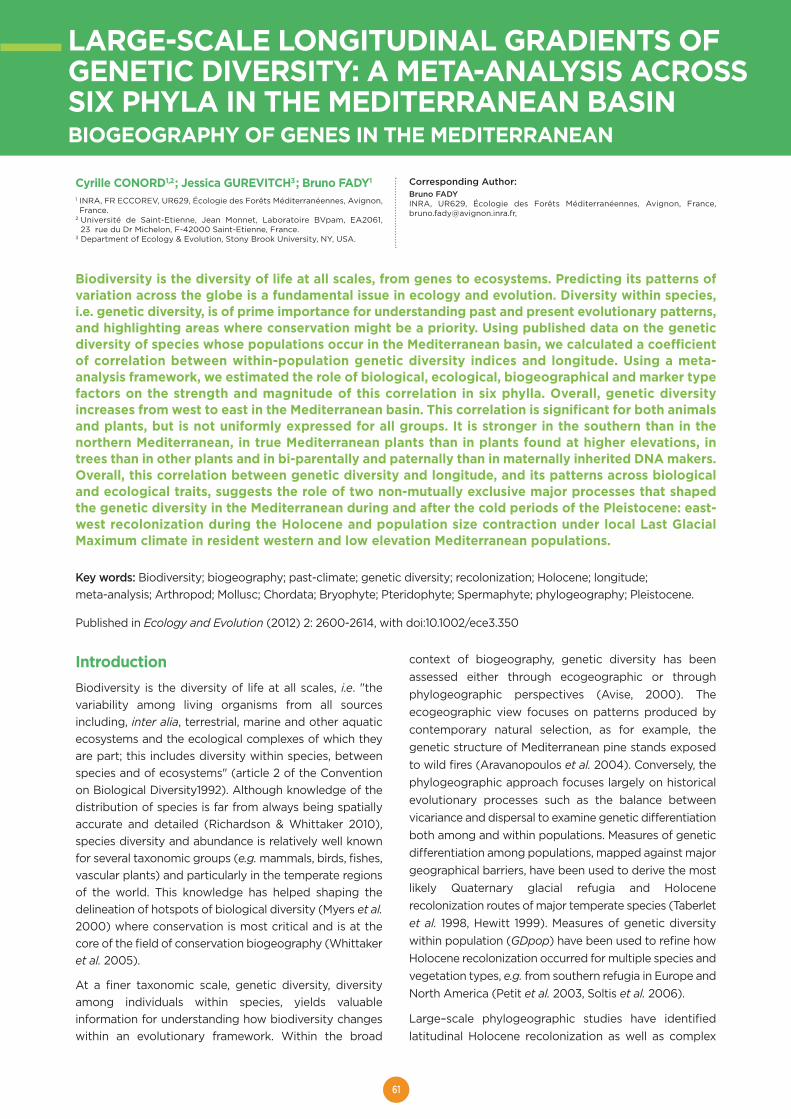
61
LARGE-SCALE LONGITUDINAL GRADIENTS OFGENETIC DIVERSITY: A META-ANALYSIS ACROSSSIX PHYLA IN THE MEDITERRANEAN BASINBIOGEOGRAPHY OF GENES IN THE MEDITERRANEAN
Cyrille CONORD1,2; Jessica GUREVITCH3; Bruno FADY1
1 INRA, FR ECCOREV, UR629, Écologie des Forêts Méditerranéennes, Avignon,France.
2 Université de Saint-Etienne, Jean Monnet, Laboratoire BVpam, EA2061,23 rue du Dr Michelon, F-42000 Saint-Etienne, France.
3 Department of Ecology & Evolution, Stony Brook University, NY, USA.
Corresponding Author:Bruno FADYINRA, UR629, Écologie des Forêts Méditerranéennes, Avignon, France,[email protected],
IntroductionBiodiversity is the diversity of life at all scales, i.e. "thevariability among living organisms from all sourcesincluding, inter alia, terrestrial, marine and other aquaticecosystems and the ecological complexes of which theyare part; this includes diversity within species, betweenspecies and of ecosystems" (article 2 of the Conventionon Biological Diversity1992). Although knowledge of thedistribution of species is far from always being spatiallyaccurate and detailed (Richardson & Whittaker 2010),species diversity and abundance is relatively well knownfor several taxonomic groups (e.g. mammals, birds, fishes,vascular plants) and particularly in the temperate regionsof the world. This knowledge has helped shaping thedelineation of hotspots of biological diversity (Myers et al.2000) where conservation is most critical and is at thecore of the field of conservation biogeography (Whittakeret al. 2005).
At a finer taxonomic scale, genetic diversity, diversityamong individuals within species, yields valuableinformation for understanding how biodiversity changeswithin an evolutionary framework. Within the broad
context of biogeography, genetic diversity has beenassessed either through ecogeographic or throughphylogeographic perspectives (Avise, 2000). Theecogeographic view focuses on patterns produced bycontemporary natural selection, as for example, thegenetic structure of Mediterranean pine stands exposedto wild fires (Aravanopoulos et al. 2004). Conversely, thephylogeographic approach focuses largely on historicalevolutionary processes such as the balance betweenvicariance and dispersal to examine genetic differentiationboth among and within populations. Measures of geneticdifferentiation among populations, mapped against majorgeographical barriers, have been used to derive the mostlikely Quaternary glacial refugia and Holocenerecolonization routes of major temperate species (Taberletet al. 1998, Hewitt 1999). Measures of genetic diversitywithin population (GDpop) have been used to refine howHolocene recolonization occurred for multiple species andvegetation types, e.g. from southern refugia in Europe andNorth America (Petit et al. 2003, Soltis et al. 2006).
Large–scale phylogeographic studies have identifiedlatitudinal Holocene recolonization as well as complex
Biodiversity is the diversity of life at all scales, from genes to ecosystems. Predicting its patterns ofvariation across the globe is a fundamental issue in ecology and evolution. Diversity within species,i.e. genetic diversity, is of prime importance for understanding past and present evolutionary patterns,and highlighting areas where conservation might be a priority. Using published data on the geneticdiversity of species whose populations occur in the Mediterranean basin, we calculated a coefficientof correlation between within-population genetic diversity indices and longitude. Using a meta-analysis framework, we estimated the role of biological, ecological, biogeographical and marker typefactors on the strength and magnitude of this correlation in six phylla. Overall, genetic diversityincreases from west to east in the Mediterranean basin. This correlation is significant for both animalsand plants, but is not uniformly expressed for all groups. It is stronger in the southern than in thenorthern Mediterranean, in true Mediterranean plants than in plants found at higher elevations, intrees than in other plants and in bi-parentally and paternally than in maternally inherited DNA makers.Overall, this correlation between genetic diversity and longitude, and its patterns across biologicaland ecological traits, suggests the role of two non-mutually exclusive major processes that shapedthe genetic diversity in the Mediterranean during and after the cold periods of the Pleistocene: east-west recolonization during the Holocene and population size contraction under local Last GlacialMaximum climate in resident western and low elevation Mediterranean populations.
Key words: Biodiversity; biogeography; past-climate; genetic diversity; recolonization; Holocene; longitude;meta-analysis; Arthropod; Mollusc; Chordata; Bryophyte; Pteridophyte; Spermaphyte; phylogeography; Pleistocene.
Published in Ecology and Evolution (2012) 2: 2600-2614, with doi:10.1002/ece3.350
62
patterns of post-glaciation dispersal from refugia atlandscape to regional scales as the major drivers of geneticdiversity in the Northern Hemisphere (e.g., Petit et al.2003, Brewer et al. 2002, Liepelt et al. 2009, for Europe).Phylogeographic studies at large scales have not oftenconsidered longitude as a potentially important ecologicaldriver, even though refugia are distributed longitudinallyin southern Europe (Stewart et al. 2010). In theMediterranean basin, longitudinal trends are potentially animportant factor in determining genetic diversity becauseof how the geography of southern Europe and theMediterranean region is shaped. The Mediterranean Sea isa strong barrier to latitudinal movements of terrestrialspecies but also to longitudinal movements from onepeninsula to the other in Europe, with potentially strongimpacts in shaping contemporary biodiversity structures.Unveiling longitudinal patterns of diversity in theMediterranean would be of great interest because, quotingfrom Atkinson et al. (2007), “longitudinal processesrepresent the raw material on which later latitudinalprocesses work” in Europe. The purpose of the presentstudy is to examine whether longitudinal patterns ofgenetic diversity are important in the Mediterraneanregion and southern Europe across a large range of taxa.Such patterns may reveal a different perspective on post-glaciation colonization at large geographic and taxonomicscales.
In the same manner that a gene tree only depicts a verysmall part of the phylogenetic history of lineage, thepopulation genetic structure of species can only representa small slice of the history of a whole region or biome.Whether they have followed the ecogeographical or thephylogeographical approach, many empirical studies ofpopulation genetic structure provide GDpop estimates.Gathering and comparing the wealth of informationcontained in these empirical studies, using a properstatistical framework, represents an excellent opportunityto meet the challenge of testing processes determininggenetic diversity patterns at regional scale or biome-wide,such as for the Mediterranean. We used meta-analysis todocument and test the existence of cross-taxa longitudinalpatterns of genetic diversity in the Mediterranean basin.No previous studies have examined genetic differentiationwithin and across populations at large geographic scalesusing the powerful statistical tools of meta-analysis.
Biogeographic genetic analyses have mostly focused onpopulation structure and differentiation rather than onwithin-population diversity because genetic variation atneutral markers is not expected to respond toenvironmental effects (but see, e.g., Petit et al. 2003).Strong spatial gradients of neutral genetic differentiationare thus only expected as a consequence of historicaleffects such as directional dispersal during rangeexpansions from refugia during global warming periods,which leads to marked population structure (Petit et al.2003). However, because demographic changes can
impact GDpop (Young et al. 1996), strong gradients ofGDpop can also be expected as an indirect response toclinal environmental effects, such as past climates.
GDpop is of fundamental importance in ecology andevolution because it is correlated with populationdemographic rates and, in numerous circumstances, withtheir potential for evolutionary adaptive change (Le Corre& Kremer 2003). GDpop is therefore important foridentifying regions where evolutionary potential is eitherparticularly low or high, thus providing insights forconservation strategies and planning (Schwartz et al.2007). GDpop can be estimated in various ways, but theapproaches fall within two general categories: “richness”(total amount of diversity, e.g. allelic richness, haplotypicrichness) and “equitability” (the way diversity is distributedamong samples, e.g. heterozygosity, Shannon’s index,percentage of polymorphic loci). Whereas equitabilitymeasures are more sensitive to higher-frequency allelesand how they are distributed within populations, richnessmeasures respond more to the presence and quantity ofrare alleles. Thus, the two measures are neededconcurrently to document and test for demographicevents such as bottlenecks and expansions.
The Mediterranean basin is a hotspot of species diversity(Myers et al. 2000), and also a world region of unusuallyhigh GDpop (see Fady 2005 for conifers). Vascular plantsare structured into regional hotspots of species diversityand endemism (Médail & Quézel 1997) oftencorresponding to glacial refugia (Médail & Diadéma 2009).The northern Mediterranean basin is made of south-northoriented peninsulas identified as independent Quaternaryglacial refugia and starting points of Holocenerecolonization for Europe (Hewitt 1999; Petit et al. 2003).The shoreline of the southern Mediterranean basin is moreor less linear, without major peninsulas. Its western part,North Africa, is also recognized as a refugial zone (e.g.Cheddadi et al. 2009, Guzmán & Vargas 2009).
Two major causes can be hypothesized for longitudinaltrends of GDpop, if such trends can be demonstrated, fornatural populations in the Mediterranean (both in southernEurope and North Africa). First, longitudinal trends couldresult from genetic drift due to long distance dispersal andfounder effects during Holocene recolonization fromrefugia (e.g., from eastern Mediterranean refugia as in thetree Pinus halepensis, Grivet et al. 2009, or in the waspAndricus quercustozae, Rokas et al. 2003, from westernMediterranean refugia as in the tree Pinus sylvestris,Soranzo et al. 2000). However, both uni-directionalrecolonization patterns appear less likely than multi-refugium recolonization patterns (Taberlet et al. 1998). Thesecond cause for longitudinal trends in this region couldbe genetic drift due to decreasing effective populationsize, given the existence of a climate of increasing severityfrom east to west in the Mediterranean during the lastglacial cycle, particularly the Last Glacial Maximum (LGM)
63
21 000 years before present (van Andel 2002; Wu et al.2007). There is also evidence of climatic instability overthe North-Atlantic Ocean leading to several extremecooling events over the Iberian Peninsula during the lastglacial cycle (Sánchez-Goñi et al. 2002). The potentialeffect of such past climate trends on GDpop wasdescribed for gallwasps (Atkinson et al. 2007) and trees(Fady & Conord 2010).
Looking at patterns across multiple levels of biodiversityprovides a framework to understand processes beyondthe idiosyncrasy of case studies. Here, using a meta-analytical framework, we tested the existence of alongitudinal trend of within-population genetic diversity inthe Mediterranean basin at multiple taxonomic levels in thetree of life. For each population genetic study we retrievedfrom the literature, we calculated a correlation coefficientbetween longitudinal coordinates and genetic diversity.We examined data on populations in the Arthropods,Mollusks, Chordata, Bryophytes, Pteridophytes, andSpermaphytes. Previous studies of genetic diversity atlarge spatial scales have generally focused on far smallertaxonomic groups (e.g., Riddle et al. 2000, vertebratesfrom Baja California, North America; Petit et al. 2003, treesfrom Europe; Kadereit et al. 2005, dicots from theMediterranean basin).
We hypothesized that we would detect a west-east trendof increasing genetic diversity across all taxa if thedemographic (and thus genetic) clinal imprint left by theclimate of the last glacial cycle on resident populations inrefugia was stronger than the imprints left by theincongruent Holocene recolonization patterns of differentspecies from different refugia (Taberlet et al. 1998). Incontrast, if recolonization from disparate refugia acrossmultiple taxa is the dominant signal for current patterns ofGDpop, we would not expect to find such a longitudinalimprint across taxa. Refugia have been identified in manydifferent parts of the region. For example, Médail &Diadéma (2009) in their analysis of plant genetic patternsin the Mediterranean found that out of 52 refugiaidentified, 33 were in the western Mediterranean and 19 inthe eastern Mediterranean (non-significantly differentfrom an equal distribution in each zone). At species level,we expected different trends depending on where refugiawere located. We expected that this trend would beweaker for studies using GDpop measures giving higherweight to frequent alleles because rare alleles are morelikely to disappear with recolonization and bottleneckevents than do frequent alleles.
We also predicted that, depending on their position in thetree of life, the different taxa would respond differently tolongitude. We expected that their responses woulddepend on: – their life-history traits (low versus high mobility);– their bioclimatic requirements (particularly in plants,
depending on their over-wintering abilities and their
temperature requirements, and thus their sensitivity tolocal glacial climate); and
– their location within distribution areas (islands versuscontinents and southern versus northern Mediterranean,for which demographic effects and migrationpossibilities are different).
Material and methods1. Gathering data from published sources
We collected published population genetic studies ofterrestrial plant and animal species whose distributionswere at least partially found within the Mediterraneanbasin, from endemic to widespread. For this, we searchedthe Web of Knowledge between for references publishedbetween Jan. 1980 and Oct. 2009. We used the followingsearch expressions: 'population genetics', 'phylogeo*','genetic diversit*', 'Mediterr*' and individual Mediterraneancountry names. We also examined the references includedin all retrieved publications for additional references.
2. Defining the geographic zone of interestand population sample size
From these papers, we selected all populations withGDpop estimates that were included within theMediterranean basin. We used the delineation of theMediterranean basin defined by Olson et al. (2001) whichis the standard currently used by the World Wildlife Fund(WWF) to define the world eco-regions. We used ageographic information system (GIS) for selecting amongpublished studies which population to allocate to thatgeographic envelope and to further qualify populations ascontinental versus insular and northern versus southernMediterranean.
3. Constructing a database of GDpop estimates
We explain in details in Supplementary Material I how weconstructed our database. The list of published studiesused is referenced in Supplementary Material II.
4. Raw data analysis and calculation of effect-sizes
No published paper we retrieved had testing for acorrelation between longitude and GDpop as its primarygoal. We used the raw data from these studies to correlatethe longitudinal position of each population with itsGDpop. The statistics we used was the Pearson product-moment correlation coefficient.
The populations tested are not located on a straitlongitudinal line but rather span a small latitudinal gradient(which reaches its maximum in each of the Mediterraneanpeninsulas). Also, not all organisms remained in the closevicinity of their glacial refugia after Holocene warming(receding edge populations may have moved farther awayfrom refugia than rear edge populations or endemicspecies, Jump et al. 2009). Thus in order to account forthe effect of latitude, we calculated a partial correlationcoefficient which measured the degree of association of
64
GDpop with longitude while latitude was held constant.Partial correlation coefficients in meta-analysis representthe relationship between the independent and thedependent variable while controlling for other factors(Rosenthal & DiMatteo 2001, Keef & Roberts 2004). In ourcase, the controlling factor was always the same, latitude.
The partial correlation coefficients were transformed usingFisher's Z-transformation and used as effect-sizes: Z =0.5*ln(1+r/1-r), where r is the partial correlation coefficient.Finally, effect-sizes (Z-transformed partial correlationcoefficients) were weighted by the inverse of theirasymptotic variance (see Aloe & Becker 2009 forweighting partial coefficients in meta-analysis) which wascalculated as Vz = 1/(n-3), where n is the number ofsampled populations in the source study. Finally, summary-effects (Zr) were computed as the weighted mean of theindividual effect sizes using a fixed-effect meta-analysismodel. We chose a fixed-effect model (Borenstein et al.2009) because we were interested in testing primaryfactors affecting GDpop that acted in a similar way acrossall species and were expressed non-randomly across thewhole Mediterranean basin.
Because data in our primary dataset are not allindependent (several papers in our dataset address thesame species), we tested the effect of non-independenceon Type I error rates as well as on the precision ofsummary-effects (Hartung et al. 2008) using severalmethods (see Supplementary Material III). As theredundancy of our raw data affected neither the directionof the relationship between GDpop and longitude nor itssignificance, we decided to use the entire dataset in thefollowing meta-analyses and to not perform any statisticaltreatment to reduce redundancy.
Data processing, effect-size computations as well assensitivity analyses were done using R packages plyr v0.1.9(Wickham 2011), MAc v1.1 (Del Re & Hoyt 2010) and customscripts for sensitivity analyses (available upon request),under R v2.11 (http://www.r-project.org/), whereas themeta-analysis procedure was performed with MetaWin(Rosenberg et al. 2000).
Exploring moderatorsof the summary-effects1. Moderators related to primary study design
Effect of the sampling geographical rangein the primary studiesIf we hypothesize a general and homogeneous link ofGDpop with longitude (supposing that longitude is a proxyfor the same phenomenon for all species/studies), then wemay expect that the wider the range of populationsampling across the Mediterranean basin in the primarystudies was, the greater the probability of detecting apositive mean effect-size Zr would be. Also, Zr might beaffected by the position of the range within the
Mediterranean basin. We tested these relationships byregressing each Zr and their corresponding longitudinalspan calculated as the absolute value of the difference indegrees of longitude between the easternmost and thewesternmost populations and each Zr and theircorresponding mean longitudinal coordinate.
Choice of genetic marker and GDpop metricThe choice of the genetic marker may impact the sign ofthe correlation between GDpop and geography becausethey may reflect different processes acting at differentspatial and time scales (ecological vs evolutionary). Theymay also reflect different demographic histories via theirdifferent effective population size or sex-relatedtransmission. Discrepancies have classically been found byphylogeographers between the nuclear and themitochondrial DNA (Petit & Vendramin 2007). We thustested marker type effects by categorizing themdepending on their inheritance type (male, female or bi-parental inheritance) which may be related to an effect ofdispersal ability. Because foundation events or distance torefugia may be imprinted differently on the different typesof GDpop measures (see the Fagus sylvatica example inComps et al. 2001), we tested metric type effects bycategorizing GDpop measures as either 'equitability' or'richness' measures (see introduction).
2. Biogeographic effect (north vs south,continents vs islands)
We tested biogeographic effects by categorizing theeffect-sizes as either northern or southern Mediterranean,and as either from continents or islands.
3. Plant species biological attributesand ecological requirements
There may be a strong confounding effect betweentaxonomy and marker type in our general dataset.Specifically, cpDNA effects may be due to the type ofDNA used or to traits specific to plants as this type of DNAis not present in animals. Thus, we used the part of ourdataset restricted to plants to retest for marker typeeffects on overall trends and also to test for the imprint ofbiological attributes and ecological requirements onGDpop in the Mediterranean.
Along with demographic processes, many life history traitscan be responsible more or less deterministically for spatialGDpop differences. For example, generation time is a lifehistory trait that will moderate the imprint of pastdemographic events on the measured GDpop. As a firstgeneral and very coarse proxy of those traits, we usedtaxonomy and we characterized all species by their family,class and kingdom names.
For each plant species, we also recorded several biologicaland ecological attributes using information from Quézel &Médail (2003), Pignatti (1982), Rameau et al. (2008) aswell as the Telabotanica web database (www.tela-botanica.org/ consulted in April 2009). We coded the
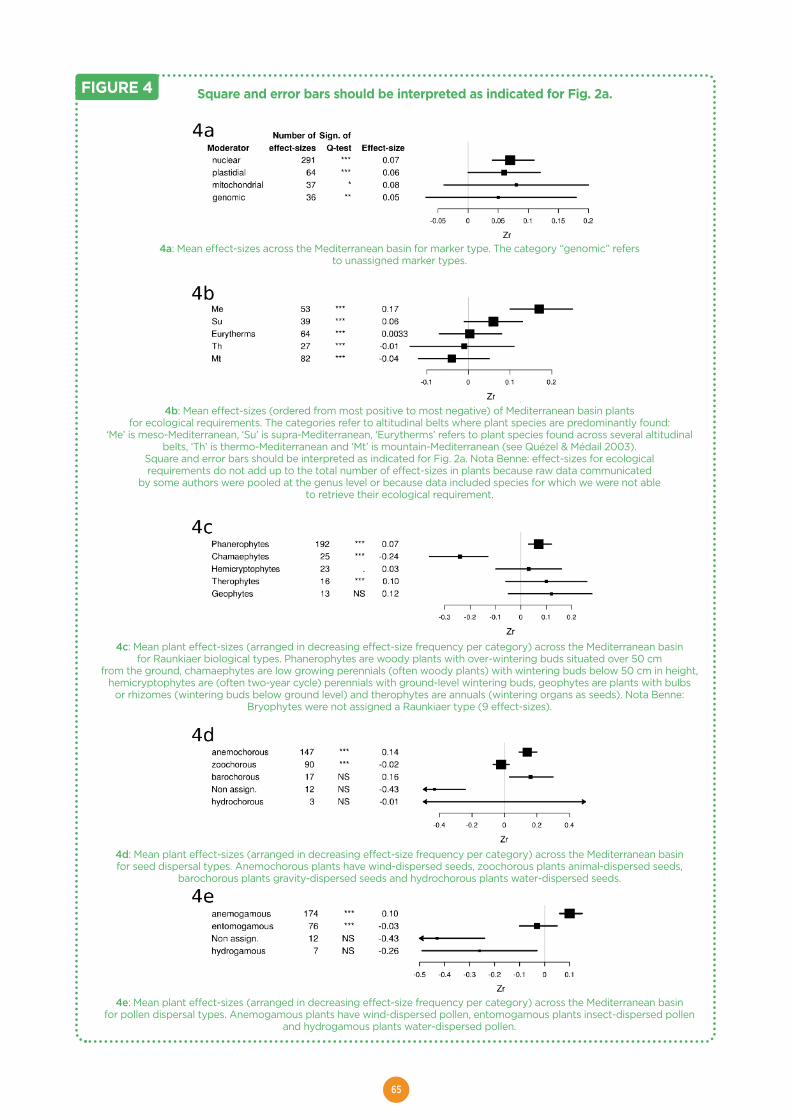
65
FIGURE 4 Square and error bars should be interpreted as indicated for Fig. 2a.
4a: Mean effect-sizes across the Mediterranean basin for marker type. The category “genomic” refersto unassigned marker types.
4b: Mean effect-sizes (ordered from most positive to most negative) of Mediterranean basin plantsfor ecological requirements. The categories refer to altitudinal belts where plant species are predominantly found:
‘Me’ is meso-Mediterranean, ‘Su’ is supra-Mediterranean, ‘Eurytherms’ refers to plant species found across several altitudinalbelts, ‘Th’ is thermo-Mediterranean and ‘Mt’ is mountain-Mediterranean (see Quézel & Médail 2003).
Square and error bars should be interpreted as indicated for Fig. 2a. Nota Benne: effect-sizes for ecologicalrequirements do not add up to the total number of effect-sizes in plants because raw data communicated
by some authors were pooled at the genus level or because data included species for which we were not ableto retrieve their ecological requirement.
4c: Mean plant effect-sizes (arranged in decreasing effect-size frequency per category) across the Mediterranean basinfor Raunkiaer biological types. Phanerophytes are woody plants with over-wintering buds situated over 50 cm
from the ground, chamaephytes are low growing perennials (often woody plants) with wintering buds below 50 cm in height,hemicryptophytes are (often two-year cycle) perennials with ground-level wintering buds, geophytes are plants with bulbs
or rhizomes (wintering buds below ground level) and therophytes are annuals (wintering organs as seeds). Nota Benne:Bryophytes were not assigned a Raunkiaer type (9 effect-sizes).
4d: Mean plant effect-sizes (arranged in decreasing effect-size frequency per category) across the Mediterranean basinfor seed dispersal types. Anemochorous plants have wind-dispersed seeds, zoochorous plants animal-dispersed seeds,
barochorous plants gravity-dispersed seeds and hydrochorous plants water-dispersed seeds.
4e: Mean plant effect-sizes (arranged in decreasing effect-size frequency per category) across the Mediterranean basinfor pollen dispersal types. Anemogamous plants have wind-dispersed pollen, entomogamous plants insect-dispersed pollen
and hydrogamous plants water-dispersed pollen.
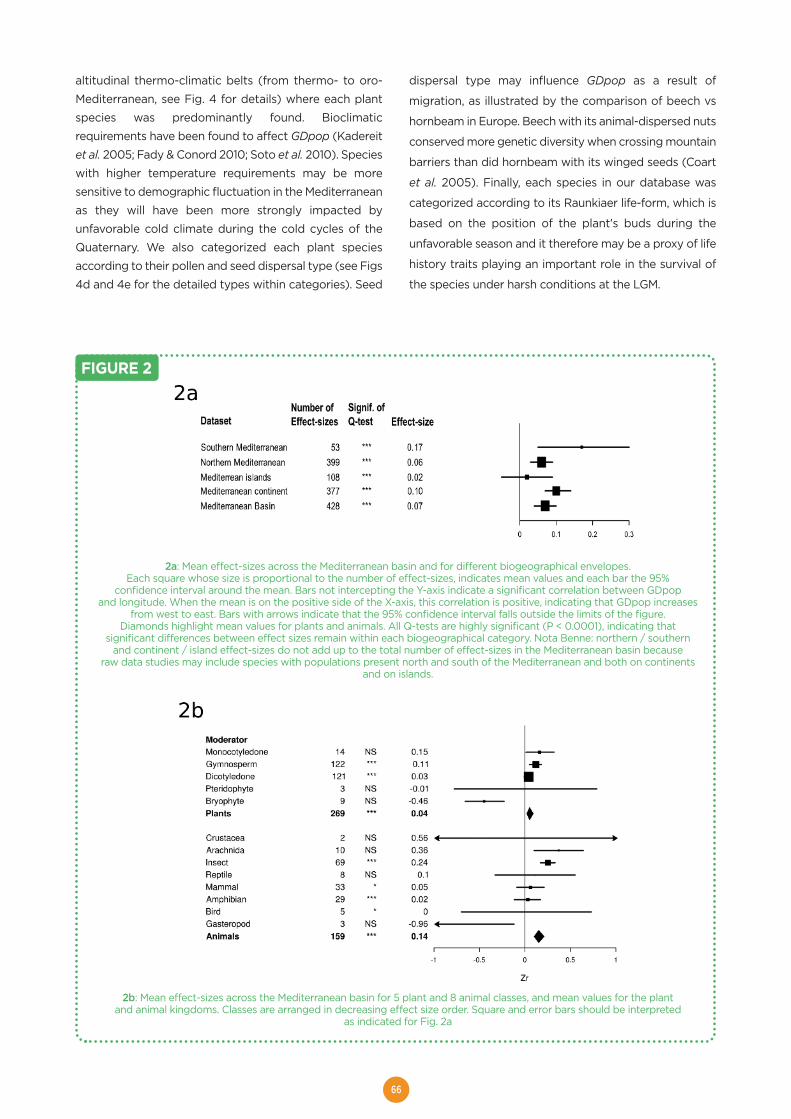
66
altitudinal thermo-climatic belts (from thermo- to oro-
Mediterranean, see Fig. 4 for details) where each plant
species was predominantly found. Bioclimatic
requirements have been found to affect GDpop (Kadereit
et al. 2005; Fady & Conord 2010; Soto et al. 2010). Species
with higher temperature requirements may be more
sensitive to demographic fluctuation in the Mediterranean
as they will have been more strongly impacted by
unfavorable cold climate during the cold cycles of the
Quaternary. We also categorized each plant species
according to their pollen and seed dispersal type (see Figs
4d and 4e for the detailed types within categories). Seed
dispersal type may influence GDpop as a result of
migration, as illustrated by the comparison of beech vs
hornbeam in Europe. Beech with its animal-dispersed nuts
conserved more genetic diversity when crossing mountain
barriers than did hornbeam with its winged seeds (Coart
et al. 2005). Finally, each species in our database was
categorized according to its Raunkiaer life-form, which is
based on the position of the plant's buds during the
unfavorable season and it therefore may be a proxy of life
history traits playing an important role in the survival of
the species under harsh conditions at the LGM.
FIGURE 2
2b: Mean effect-sizes across the Mediterranean basin for 5 plant and 8 animal classes, and mean values for the plantand animal kingdoms. Classes are arranged in decreasing effect size order. Square and error bars should be interpreted
as indicated for Fig. 2a
2a: Mean effect-sizes across the Mediterranean basin and for different biogeographical envelopes.Each square whose size is proportional to the number of effect-sizes, indicates mean values and each bar the 95%
confidence interval around the mean. Bars not intercepting the Y-axis indicate a significant correlation between GDpopand longitude. When the mean is on the positive side of the X-axis, this correlation is positive, indicating that GDpop increases
from west to east. Bars with arrows indicate that the 95% confidence interval falls outside the limits of the figure.Diamonds highlight mean values for plants and animals. All Q-tests are highly significant (P < 0.0001), indicating that
significant differences between effect sizes remain within each biogeographical category. Nota Benne: northern / southernand continent / island effect-sizes do not add up to the total number of effect-sizes in the Mediterranean basin because
raw data studies may include species with populations present north and south of the Mediterranean and both on continentsand on islands.
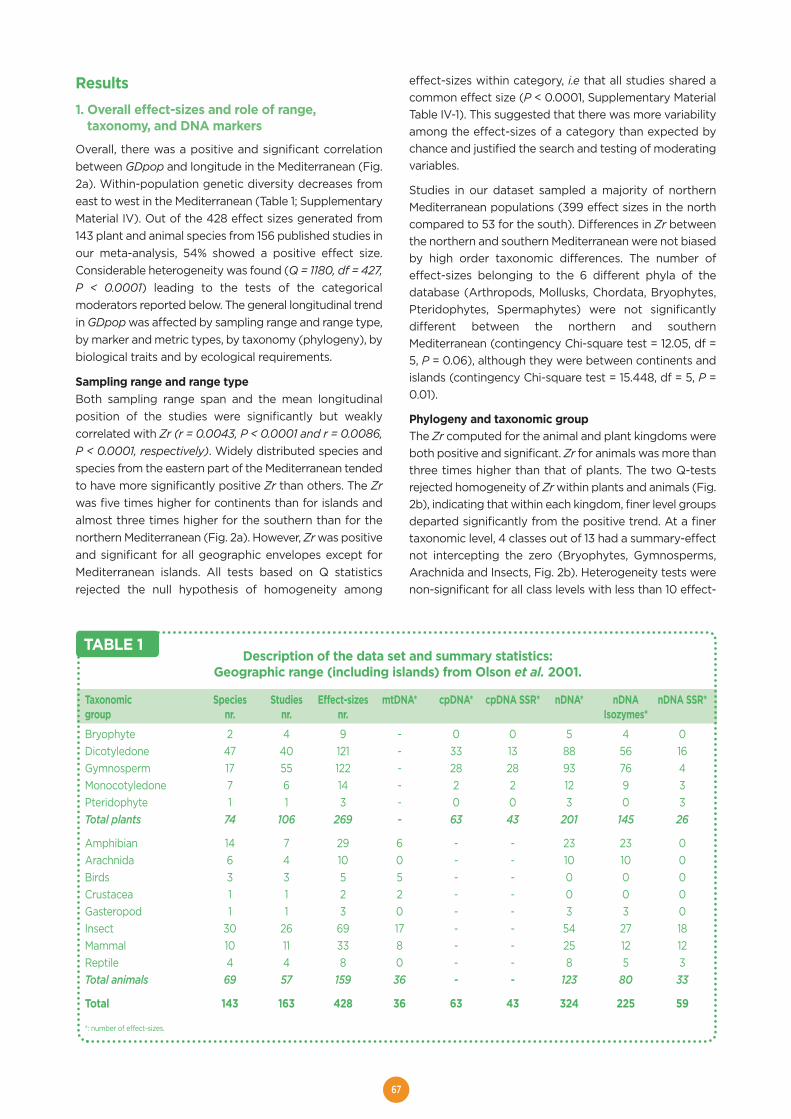
67
Results1. Overall effect-sizes and role of range,
taxonomy, and DNA markers
Overall, there was a positive and significant correlationbetween GDpop and longitude in the Mediterranean (Fig.2a). Within-population genetic diversity decreases fromeast to west in the Mediterranean (Table 1; SupplementaryMaterial IV). Out of the 428 effect sizes generated from143 plant and animal species from 156 published studies inour meta-analysis, 54% showed a positive effect size.Considerable heterogeneity was found (Q = 1180, df = 427,P < 0.0001) leading to the tests of the categoricalmoderators reported below. The general longitudinal trendin GDpop was affected by sampling range and range type,by marker and metric types, by taxonomy (phylogeny), bybiological traits and by ecological requirements.
Sampling range and range typeBoth sampling range span and the mean longitudinalposition of the studies were significantly but weaklycorrelated with Zr (r = 0.0043, P < 0.0001 and r = 0.0086,P < 0.0001, respectively). Widely distributed species andspecies from the eastern part of the Mediterranean tendedto have more significantly positive Zr than others. The Zrwas five times higher for continents than for islands andalmost three times higher for the southern than for thenorthern Mediterranean (Fig. 2a). However, Zr was positiveand significant for all geographic envelopes except forMediterranean islands. All tests based on Q statisticsrejected the null hypothesis of homogeneity among
effect-sizes within category, i.e that all studies shared acommon effect size (P < 0.0001, Supplementary MaterialTable IV-1). This suggested that there was more variabilityamong the effect-sizes of a category than expected bychance and justified the search and testing of moderatingvariables.
Studies in our dataset sampled a majority of northernMediterranean populations (399 effect sizes in the northcompared to 53 for the south). Differences in Zr betweenthe northern and southern Mediterranean were not biasedby high order taxonomic differences. The number ofeffect-sizes belonging to the 6 different phyla of thedatabase (Arthropods, Mollusks, Chordata, Bryophytes,Pteridophytes, Spermaphytes) were not significantlydifferent between the northern and southernMediterranean (contingency Chi-square test = 12.05, df =5, P = 0.06), although they were between continents andislands (contingency Chi-square test = 15.448, df = 5, P =0.01).
Phylogeny and taxonomic groupThe Zr computed for the animal and plant kingdoms wereboth positive and significant. Zr for animals was more thanthree times higher than that of plants. The two Q-testsrejected homogeneity of Zr within plants and animals (Fig.2b), indicating that within each kingdom, finer level groupsdeparted significantly from the positive trend. At a finertaxonomic level, 4 classes out of 13 had a summary-effectnot intercepting the zero (Bryophytes, Gymnosperms,Arachnida and Insects, Fig. 2b). Heterogeneity tests werenon-significant for all class levels with less than 10 effect-
Description of the data set and summary statistics:Geographic range (including islands) from Olson et al. 2001.
Taxonomic Species Studies Effect-sizes mtDNA* cpDNA* cpDNA SSR* nDNA* nDNA nDNA SSR*group nr. nr. nr. Isozymes*
Bryophyte 2 4 9 - 0 0 5 4 0Dicotyledone 47 40 121 - 33 13 88 56 16Gymnosperm 17 55 122 - 28 28 93 76 4Monocotyledone 7 6 14 - 2 2 12 9 3Pteridophyte 1 1 3 - 0 0 3 0 3Total plants 74 106 269 - 63 43 201 145 26
Amphibian 14 7 29 6 - - 23 23 0Arachnida 6 4 10 0 - - 10 10 0Birds 3 3 5 5 - - 0 0 0Crustacea 1 1 2 2 - - 0 0 0Gasteropod 1 1 3 0 - - 3 3 0Insect 30 26 69 17 - - 54 27 18Mammal 10 11 33 8 - - 25 12 12Reptile 4 4 8 0 - - 8 5 3Total animals 69 57 159 36 - - 123 80 33
Total 143 163 428 36 63 43 324 225 59
*: number of effect-sizes.
TABLE 1
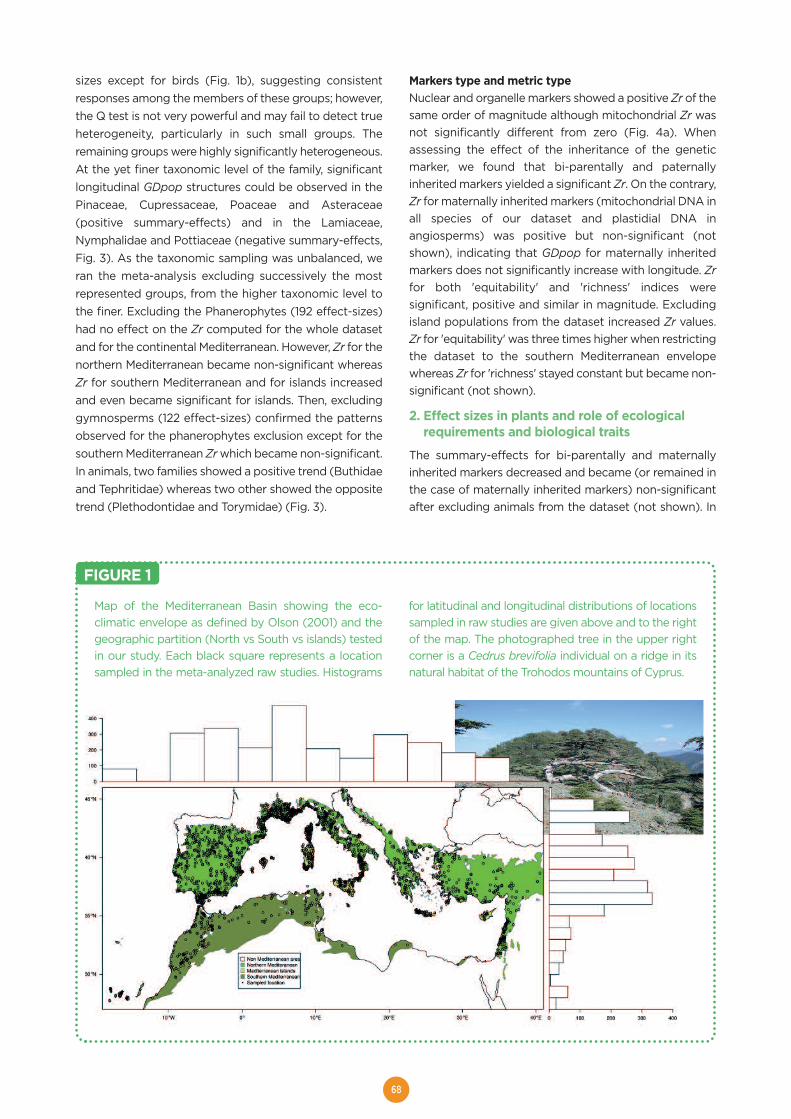
68
sizes except for birds (Fig. 1b), suggesting consistentresponses among the members of these groups; however,the Q test is not very powerful and may fail to detect trueheterogeneity, particularly in such small groups. Theremaining groups were highly significantly heterogeneous.At the yet finer taxonomic level of the family, significantlongitudinal GDpop structures could be observed in thePinaceae, Cupressaceae, Poaceae and Asteraceae(positive summary-effects) and in the Lamiaceae,Nymphalidae and Pottiaceae (negative summary-effects,Fig. 3). As the taxonomic sampling was unbalanced, weran the meta-analysis excluding successively the mostrepresented groups, from the higher taxonomic level tothe finer. Excluding the Phanerophytes (192 effect-sizes)had no effect on the Zr computed for the whole datasetand for the continental Mediterranean. However, Zr for thenorthern Mediterranean became non-significant whereasZr for southern Mediterranean and for islands increasedand even became significant for islands. Then, excludinggymnosperms (122 effect-sizes) confirmed the patternsobserved for the phanerophytes exclusion except for thesouthern Mediterranean Zr which became non-significant.In animals, two families showed a positive trend (Buthidaeand Tephritidae) whereas two other showed the oppositetrend (Plethodontidae and Torymidae) (Fig. 3).
Markers type and metric typeNuclear and organelle markers showed a positive Zr of thesame order of magnitude although mitochondrial Zr wasnot significantly different from zero (Fig. 4a). Whenassessing the effect of the inheritance of the geneticmarker, we found that bi-parentally and paternallyinherited markers yielded a significant Zr. On the contrary,Zr for maternally inherited markers (mitochondrial DNA inall species of our dataset and plastidial DNA inangiosperms) was positive but non-significant (notshown), indicating that GDpop for maternally inheritedmarkers does not significantly increase with longitude. Zrfor both 'equitability' and 'richness' indices weresignificant, positive and similar in magnitude. Excludingisland populations from the dataset increased Zr values.Zr for 'equitability' was three times higher when restrictingthe dataset to the southern Mediterranean envelopewhereas Zr for 'richness' stayed constant but became non-significant (not shown).
2. Effect sizes in plants and role of ecologicalrequirements and biological traits
The summary-effects for bi-parentally and maternallyinherited markers decreased and became (or remained inthe case of maternally inherited markers) non-significantafter excluding animals from the dataset (not shown). In
FIGURE 1
Map of the Mediterranean Basin showing the eco-climatic envelope as defined by Olson (2001) and thegeographic partition (North vs South vs islands) testedin our study. Each black square represents a locationsampled in the meta-analyzed raw studies. Histograms
for latitudinal and longitudinal distributions of locationssampled in raw studies are given above and to the rightof the map. The photographed tree in the upper rightcorner is a Cedrus brevifolia individual on a ridge in itsnatural habitat of the Trohodos mountains of Cyprus.
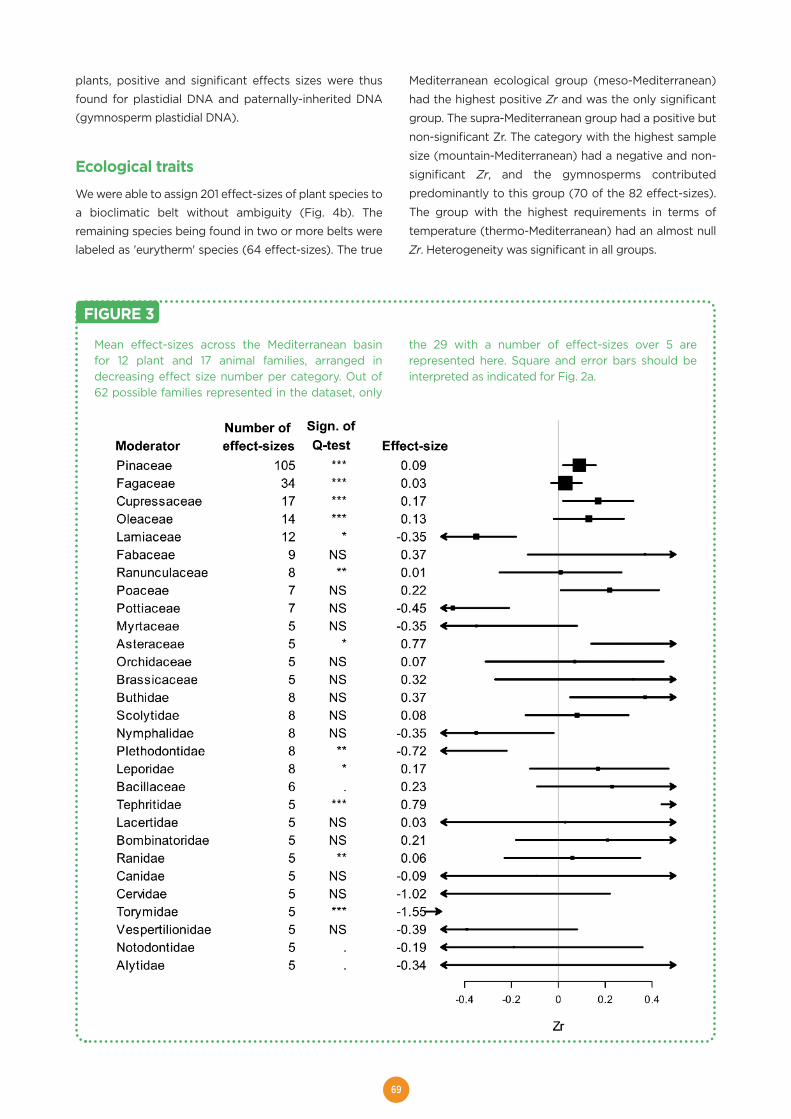
69
plants, positive and significant effects sizes were thus
found for plastidial DNA and paternally-inherited DNA
(gymnosperm plastidial DNA).
Ecological traitsWe were able to assign 201 effect-sizes of plant species to
a bioclimatic belt without ambiguity (Fig. 4b). The
remaining species being found in two or more belts were
labeled as 'eurytherm' species (64 effect-sizes). The true
Mediterranean ecological group (meso-Mediterranean)
had the highest positive Zr and was the only significant
group. The supra-Mediterranean group had a positive but
non-significant Zr. The category with the highest sample
size (mountain-Mediterranean) had a negative and non-
significant Zr, and the gymnosperms contributed
predominantly to this group (70 of the 82 effect-sizes).
The group with the highest requirements in terms of
temperature (thermo-Mediterranean) had an almost null
Zr. Heterogeneity was significant in all groups.
FIGURE 3
Mean effect-sizes across the Mediterranean basinfor 12 plant and 17 animal families, arranged indecreasing effect size number per category. Out of62 possible families represented in the dataset, only
the 29 with a number of effect-sizes over 5 arerepresented here. Square and error bars should beinterpreted as indicated for Fig. 2a.
70
Biological traitsPhanerophytes (trees and shrubs) represented around 2/3of the plants in our dataset and showed a positive andsignificant Zr (Fig. 4c). Among them, gymnosperms hada positive Zr (see above). Dicots among phanerophytesshowed a contrasting pattern depending on thegeographic envelope: at Mediterranean basin level, theeffect was positive but non-significant; whereas it wasstrongly positive for the continental group (0.10 [0.04;0.16]95% CI, N = 65) and strongly negative for islands (-0.56 [-0.71;-0.40] 95% CI, N = 17). Contrasting with the othermoderator analyses, the southern group yielded anegative trend while the northern showed a positive one.Chamaephytes (low growing perennials with over-wintering buds below 50 cm) were the only groupshowing a negative (although non-significant) Zr.
Seed dispersal mode affected Zr values: Anemochorous(wind-dispersed, contributing to more than half of theeffect sizes) and barochorous (gravity-dispersed) plantsshowed a significant and positive Zr while zoochorous(animal-dispersed) plants had a non-significant Zr (Fig.4d). Pollen dispersal type also affected Zr values. Althoughcalculated from a small sample size, the hydrogamous(water-dispersed pollen) plants showed a homogeneousnegative trend (Fig. 4e) whereas entomogamous (insect-dispersed pollen) species had a non-significant Zr andanemogamous (wind-dispersed pollen) species had apositive and significant Zr.
DiscussionOrganization of genetic diversity in Europe mostly followslatitudinal routes of recolonization dating from theHolocene (Petit et al. 2003). In the Mediterranean,although a latitudinal imprint exists, our analysisdemonstrates the existence of an overall longitudinalimprint on genetic diversity. Using a meta-analysis on 143plant and animal species, we found that overall within-population genetic diversity of plants and animalsincreases significantly from West to East in theMediterranean basin, both in southern Europe and in NorthAfrica, and for continental but not for island species. Thelongitudinal trend was not found in all taxonomic groups,however. This result broadens the evidence provided byFady & Conord (2010) beyond tree species to include suchtaxonomic groups as arthropods, well-represented in thedataset, gymnosperms, and monocots. Other well-represented groups including dicots, mammals andamphibians do not follow the trend. Several poorlyrepresented groups such as gastropods and bryophytesdemonstrate a significant opposite trend, or no trend(reptiles and ferns).
What are the processes that shaped currentgenetic diversity longitudinally across theMediterranean basin?Trying to detect events / processes responsible forlongitudinal imprints on genetic diversity in the
Mediterranean may be challenging. The effects of olderevents such as divergence/diversification linked tovicariance during Pliocene (Blondel & Aronson, 1999;erection of geographical barriers) may coincide with thatof younger events such as Last Glacial Maximumdemographic bottlenecks, Holocene colonization events,admixture from secondary contact (Petit et al. 2003) orhybridization with closely related species (Papageorgiouet al. 2008).However, it can be assumed that many currentMediterranean species have remained closer to theirglacial refugia than their European counterparts and thuscarry imprints (however attenuated) that commonlyaffected glacial refugia. A meta-analysis, using a fixed-effect model, precisely makes this assumption (Borensteinet al. 2009). It thus assumes that a common set of driversaffected GDpop across species along a longitudinalgradient in the Mediterranean basin. By analyzing theeffect of moderators on summary-effect sizes, our goalwas to discuss the most parsimonious explanations forsuch a trend.
Effect of past climate on resident populationsor effect of recolonization on genetic diversityin the MediterraneanBiological and life history traits:We show that both plants and animals display a trend ofincreasing GDpop from west to east in the Mediterranean.We expected that, on average, the trend would be duemore to migration effects (recolonization patterns) inmobile or high gene flow organisms, and more to localclimatic effects in sessile or low gene flow organisms. Withperhaps a difference in intensity between the two trends,that due to migration being less pronounced because ofhigh gene flow and recurrent genetic exchange betweenpopulations blurring post recolonization foundationeffects. Our data show that reality may be more complexbecause both highly mobile (insects) and more sessile(arachnids) animals showed trends similar in direction andmagnitude. In arachnids, a group only comprisingscorpions from the southern part of the Mediterraneanbasin in our dataset, the effect could be related to localpast climate effects. The pattern shown by insects couldreveal a link between their contemporary genetic structureand the mirrored structure of the plants they exploit.Recent studies have indeed illustrated the link betweenlevels of diversity in keystone organisms such as trees andin their phytophagous associated organisms (Crutsingeret al. 2006, Whitham et al. 2006). The relationship has alsobeen shown to hold true from local to region-wide scales(Bangert et al. 2006). Our work is certainly the first fortrees and insects, indicating a clear common pattern ofcongruent GDpop at continental scale.
The absence of significant trend in mobile vertebrategroups such as birds, amphibians and mammals couldreflect the coexistence of multiple Holocene recolonizationroutes from multiple refugia among species. For example,
71
in two species of rodents from the genus Apodemus, LGMsurvival had two very different outcomes, with A. flavicollisdisappearing from the Iberian Peninsula whereas A.sylvaticus survived only there. The subsequent Holocenerecolonization of Europe by these two currently sympatricspecies left two diverging imprints on genetic diversity(Michaux et al. 2005). In yet another species of rodent, theshrew Crocidura russula, refugial populations were locatedin North Africa from which western European Holocenepopulations derive (Cosson et al. 2005). As for the bankvole, Clethrionomys glareolus, most of its HoloceneEuropean range was recolonized from central Europeanrefugia although Mediterranean refugia existed(Deffontaine et al. 2005). In this group of mammals, theexception may be the rule in terms of LGM survival andHolocene recolonization, which is indicated by a non-significant trend of genetic diversity in our meta-analysis.
The only plant type (sensu Raunkiaer) displaying anegative trend in GDpop was the chameaphytes. Becauseof their ground level overwintering buds, chamaephytesare better suited to resist cold snowy winters than drywinters (Taulavuori et al. 2011). Snow may in fact bebeneficial to their overwintering, thus potentially keepinglarger populations during the LGM in the western than inthe eastern Mediterranean.
The positive trend found in phanerophytes (i.e. woodyplants having buds at least 50cm above the ground)overlaps with that of wind-dispersed species and mayreflect both local demographic effects under LGM climateand long distance Holocene recolonization. Seed dispersalby gravity, however, does not allow for rapid and long-range dispersal. Thus, the positive trend found in gravitydispersed plant species matches the expectation of aneffect of local LGM climate on genetic diversity.Conversely, animal-dispersed species depend on theirdispersers’ behavior for survival (Scofield et al. 2010). Theirlack of trend in genetic diversity may mirror the diversityof vertebrate Holocene recolonization routes highlightedabove for mammals.
Ecological requirements in plant taxa:When assessing the impact of ecological (temperature)requirement on plants, we expected to find an increasingpositive effect on GDpop from low to high elevation (fromless to more cold tolerant) plant species. The rationale forthis expectation was that the unfavorably cold LGMclimate should affect more strongly population size inspecies with higher temperature requirements as theybecame trapped in reduced size habitats compared tothose of lower temperature requirement species. Incontrast, species adapted to colder climates such supra-and mountain Mediterranean species for example,benefiting from larger habitats during the LGM, should nothave suffered demographic bottlenecks as did the moretruly Mediterranean group. Thus, a west to east orientedclinal climate at the LGM should result in a stronger west
to east clinal GDpop structure in true Mediterraneanspecies (‘Me’ in Fig. 4b) than for species with otherecological requirements. The strength of the effectsfollowed our expectations, with true Mediterranean plantsshowing a stronger cline of west-east increasing GDpopthan Supra- and Mountain-Mediterranean plants (‘Su’ and‘Mt’ in Fig. 4b). The group of plants with no precise thermalrequirement showed no significant cline. The non-significant slightly negative summary-effect of the 'Th'group was more surprising. We expected this group ofwarm climate species to have been impacted even morestrongly than other categories by cold climate at the LGMwhether through strong bottlenecks or extirpation andsubsequent migration / recolonization. Severalexplanations are possible. 'Th' species may have survivedlocally without stronger loss in GDpop in the west ascompared with the east, although we have no evidence tosupport this explanation. 'Th' species could also haverecolonized from glacial refugia not situated in the easternMediterranean, which was demonstrated for Cistusladanifer (which came back into Spain from North Africavia the Strait of Gibraltar) by Guzmán & Vargas (2009).Finally, the thermo-Mediterranean belt is known to haveendured severe human impact throughout the millennia,possibly obscuring clinal climatic and recolonizationeffects on GDpop. Interestingly, the two speciesgenerating most of the effect sizes in this group werespecies strongly impacted by humans (Pinus pinea, Oleaeuropaea), both being valuable food crop.
Marker and metric types:Studies using maternally-inherited markers are most of thetime designed to detect phylogeographic signals andcapture differentiation effects, e.g. those due to theimprints of contraction and recolonization to and fromPleistocene refugia. Studies using paternally-inherited(plastidial DNA in gymnosperms) or bi-parentally inheritedmarkers are more often designed to detect localdemographic signals (for example for conservationplanning) resulting from current environmental drivers, inaddition to phylogeographic signals. This confirms that theoverall trend detect in our study is a within populationdemographic bottleneck effect, more weakly detected inmaternally than paternally and bi-parentally inheritedgenomes. Phylogeographic studies have shown that thetwo different metric types we have used here, richness andequitability, can be negatively correlated along thedistribution range of species (Comps et al. 2001; Petit etal. 2003). In Europe, from refugia to the newly colonizedareas, heterozygosity increased (merging of recolonizationroutes that originated from different refugia) whereasallelic richness decreased (founder effects along therecolonization route) with local diversity peaks in suturezones. We found no such significant difference in ouranalysis. The two metric types had globally congruentlypositive and significant summary-effects. Taken together,the global positive effects we measured for marker and
72
metric types may indicate a stronger role of local climateover recolonization in shaping the genetic diversity ofMediterranean populations.
Biogeographic effects: South vs North and continentsvs islandsThe Mediterranean basin has a highly heterogeneous andfragmented geography (Blondel & Aronson 1999). Itsdifferent geographical compartments have likelyexperienced different past ecological conditions andevolutionary histories. The northern Mediterranean floraand fauna contain predominantly Nordic, Asian and localelements whereas the southern Mediterranean ispredominantly made of Tropical and local elements(Quézel & Médail 2003). Because of its peninsulas,migration may have been more restricted in the northernMediterranean than in the southern Mediterranean. Also,one might expect stronger demographic bottlenecks andstronger scale and size effects on islands than on thecontinent. Although the number of populations originatingfrom the southern Mediterranean was eight times lowerthan in the north, its summary-effect was more stronglypositive than that of northern Mediterranean populations.Also, in the southern Mediterranean, the equitability metrictype was more strongly positive than the richness metrictype (which was actually non-significant). Although thegradient was more restricted in its longitudinal span(mostly but not entirely limited to populations of theMaghreb) in the southern than in the northernMediterranean, these results suggest that factors linked tolocal LGM climate may have more strongly affectedgenetic diversity in the Southern Mediterranean than thoselinked to recolonization.
The weakly positive summary-effect of Mediterraneanislands is in sharp contrast with that of continents. It mayreflect a Mediterranean 'insularity syndrome' globallyindependent of climatic factors and more likely linked tohigh endemism (Médail & Diadema 2009) and/or earlyhuman impact (Vigne et al. 2009).
ConclusionsOur population genetic diversity dataset covered anextensive range of animal and plant species. It also had theadvantage of gathering data from species with strongeconomic importance (for example fruit trees andmedicinal plants), strong ecological importance (forexample forest trees) as well as endangered flagshipspecies (for example butterflies and endemic plants). Thetaxonomic groups that were the most heavily sampled(gymnosperms for plants and arthropods for animals)showed a congruently positive summary-effect, i.e. anincreasing genetic diversity from west to east. Theseabundant taxonomic groups are thus good models fordetecting trends and patterns affecting biodiversity ingeneral. The propensity of the genetic diversity of trees tobe an excellent testimony of the imprint of ancient
evolutionary and demographic processes (given their longgeneration time) has been mentioned for some time (Petitet al. 2003; Petit & Hampe 2006) and it seems thatarthropods can be added to this category.
Longitude is a strong structural element of biodiversity atgene level in the Mediterranean, both in southern Europeand in North Africa. Continental / oceanic longitudinal typegradients also exist in many parts of the world. Thegenerally overlooked role of longitude in shaping speciesranges and genetic diversity deserves stronger focus(Stewart et al. 2010). Taken together, our results suggestthat, on top of a genetic structure inherited from theexistence of glacial refugia (which phylogeography isincreasingly demonstrating as being very complex,Leppanen et al. 2011), local climate during the LGM durablyaffected the demography of resident populations in theMediterranean, observable as a weak but highly significantlongitudinal cline of genetic diversity.
For conserving and sustainably managing biodiversity,global or region-wide assessments are needed beyond theidiosyncrasy of single species or single taxonomic groupsto detect trends and large scale patterns. Meta-analyses,by making it possible to compare already available dataacquired within unrelated studies, provide an interestingframework for these assessments. Already successfullyused in ecology to test theoretical predictions (e.g.Rapoport's law predicting an increase of species rangewith latitude, Ruggiero & Werenkraut 2007), we haveshown that meta-analyses can also be powerful to test thedeterminants of large-scale biodiversity patterns.
Finally, our findings can now be compared with othermeasurements of past, current and expected biodiversity(species and functional traits for example) and theircongruence tested (Devictor et al. 2010), provided thatappropriate databases (species, ecosystems, past andpresent climate) exist or can be constructed at relevantscales. Data available for estimating biodiversity at genelevel remain critically insufficient in the Mediterranean. Forexample the Mediterranean comprises approximately 200mammal species and more than 300 bird species (Blondel& Aronson, 1999) whereas our dataset only included 10mammal and 3 bird species! This remains a majorchallenge in the poorly politically structuredMediterranean, but also in other regions of the worldwhere biodiversity is high and rapidly declining.
AcknowledgementsThis research was made possible by financial support fromthe European Network of Excellence EVOLTREE(EVOLution of TREEs as drivers of terrestrial biodiversity)and from INRA Grant P-EFPA6 to Cyrille Conord. Wewould like to thank D. Betored and C. Pichot for help withdatabase management and GIS analyses, and Drs F.Balfourier, D. Gömöry, C. Kerdelhué, R.J. Petit & G.G.Vendramin for kindly providing raw data.
73
REFERENCESAloe AM, Becker BJ (2009) Teacher verbal ability andschool outcomes: Where is the evidence°? EducationalResearcher, 38, 612-624.
Aravanopoulos FA, Panetsos KP, Skaltsoyiannes A (2004)Genetic structure of Pinus brutia stands exposed to wildfires. Plant Ecology, 171, 175-183.
Atkinson RJ, Rokas A, Stone GN (2007) Longitudinalpatterns in species richness and genetic diversity inEuropean oaks and oak gallwasps. In S. Weiss and N.Ferrand editors “Phylogeography of southern Europeanrefugia”, pp. 127–151. Springer, Dordrecht, The Netherlands.
Avise JC (2000). Phylogeography: The History andFormation of Species. Harvard University Press,Cambridge, MA, USA. (447 pp.)
Bangert RK; Allan GJ, Turek RJ, Wimp GM, Meneses N,Martinsen GD, Keim P, Whitham TG (2006) From genes togeography: a genetic similarity rule for arthropodcommunity structure at multiple geographic scales.Molecular Ecology, 15, 4215-4228.
Blondel J, Aronson J (1999). Biology and wildlife of theMediterranean region. Oxford University Press, New York.
Borenstein M, Hedges LV, Higgins JPT, Rothstein H, 2009.Introduction to Meta-Analysis. John Wiley and Sons.
Brewer S, Cheddadi R, de Beaulieu JL, Reille M (2002). Thespread of deciduous Quercus throughout Europe since thelast glacial period. Forest Ecology & Management, 156, 27-48.
Crutsinger GM, Collins MD, Fordyce JA, Gompert Z, NiceCC, Sanders NJ (2006) Plant genotypic diversity predictscommunity structure and governs an ecosystem process.Science, 313, 966-968
Cheddadi R, Fady B, François L, Hajar L, Suc JP, Huang K,Demarteau M, Vendramin GG (2009) Putative glacialrefugia of Cedrus atlantica from Quaternary pollen recordsand modern genetic diversity. Journal of Biogeography,36, 1361–1371.
Coart E, Van Glabeke S, Petit RJ, Van Bockstaele E, Roldan-Ruiz I (2005) Range wide versus local patterns of geneticdiversity in hornbeam (Carpinus betulus L.). ConservationGenetics, 6, 259-273.
Comps B, Gomory D. Letouzey J, Thiebaut B, Petit RJ(2001). Diverging trends between heterozygosity andallelic richness during postglacial colonization in theEuropean beech. Genetics, 157, 389-397
Convention of Biological Diversity (1992). United Nations,New York, USA. http://www.cbd.int/doc/legal/cbd-en.pdf
Cosson JF, Hutterer R, Libois R, et al. (2005).Phylogeographical footprints of the Strait of Gibraltar andQuaternary climatic fluctuations in the westernMediterranean: a case study with the greater white-toothed shrew, Crocidura russula (Mammalia: Soricidae).Molecular Ecology, 14, 1151-1162.
Deffontaine V, Libois R, Kotlik P, Sommer R, Nieberding C,Paradis E, Searle JB, Michaux J (2005). Beyond theMediterranean peninsulas: evidence of central Europeanglacial refugia for a temperate forest mammal species, thebank vole (Clethrionomys glareolus). Molecular Ecology,14, 1727-1739.
Del Re AC, Hoyt WT (2010). MAc: Meta-Analysis withcorrelations. R package version 1.1, available at
http://cran.r-project.org/web/packages/MAc/index.html
Devictor V, Mouillot D, Meynard C, Jiguet F, Thuiller W,Mouquet N (2010) Spatial mismatch and congruencebetween taxonomic, phylogenetic and functional diversity:the need for integrative conservation strategies in achanging world. Ecology Letters, 13, 1030-1040.
Fady B (2005) Is there really more biodiversity inMediterranean forest ecosystems? Taxon, 54, 905-910.
Fady B, Conord C (2010) Macroecological patterns ofspecies and genetic diversity in vascular plants of theMediterranean Basin. Diversity & Distributions, 16, 53-64.
Grivet D, Sebastiani F, Gonzalez-Martinez SC, VendraminGG. (2009) Patterns of polymorphism resulting from long-range colonization in the Mediterranean conifer Aleppopine. New Phytologist, 184, 1016-1028.
Guzmán B, Vargas P (2009) Long-distance colonizationof the Western Mediterranean by Cistus ladanifer(Cistaceae) despite the absence of special dispersalmechanisms Journal of Biogeography, 36, 954-968.
Hartung J, Knapp G, Sinha BK (2008) Statistical meta-analysis with applications. John Wiley, Sons.
Hewitt GM (1999) Post-glacial re-colonization of Europeanbiota. Biological Journal of the Linnean Society, 68, 87-112.
Jump AS, Matyas C, Penuelas J (2009) The altitude-for-latitude disparity in the range retractions of woodyspecies. Trends in Ecology and Evolution, 24, 694-701
Kadereit JW, Arafeh R, Somogyi G, Westberg E (2005)Terrestrial growth and marine dispersal? Comparativephylogeography of five coastal plant species at aEuropean scale. Taxon, 54, 861-876.
Keef SP, Roberts LA (2004) The meta-analysis of partialeffect sizes. British Journal of Mathematical and StatisticalPsychology, 57, 97–129.
Le Corre V, Kremer A (2003) Genetic variability at neutralmarkers, quantitative trait loci and trait in a subdividedpopulation under selection. Genetics, 164, 1205-1219.
Leppanen J, Vepsalainen K, Savolainen R (2011)Phylogeography of the ant Myrmica rubra and its inquilinesocial parasite. Ecology and evolution, 1, 46-62.
Liepelt S, Cheddadi R, de Beaulieu JL, Fady B, Gömöry D,Hussendörfer E, Konnert M, Litt T, Longauer R, Terhürne-Berson R, Ziegenhagen B (2009) Postglacial rangeexpansion and its genetic imprints in Abies alba (Mill.) - asynthesis from paleobotanic and genetic data. Review ofPalaeobotany and Palynology, 153, 139-149.
Médail F, Quézel P (1997) Hot-spots analysis forconservation of plant biodiversity in the Mediterraneanbasin. Annals of the Missouri Botanical garden, 84, 112-127.
Médail F, Diadema K (2009) Glacial refugia influence plantdiversity patterns in the Mediterranean Basin. Journal ofBiogeography, 36, 1333-1345.
Michaux JR, Libois R, Filippucci MG (2005). So close andso different: comparative phylogeography of two smallmammal species, the Yellow-necked fieldmouse(Apodemus flavicollis) and the Woodmouse (Apodemussylvaticus) in the Western Palearctic region. Heredity, 94,52-63.
Myers N, Mittermeier RA, Mittermeier CG, da FonsecaGAB, Kent J (2000) Biodiversity hotspots for conservationpriorities. Nature, 403, 853-858
74
Olson DM, Dinerstein E, Wikramanayake ED, Burgess ND,Powell GVN, Underwood EC, D'Amico JA, Itoua I, StrandHE, Morrison JC, Loucks CJ. Allnutt TF, Ricketts TH. KuraY, Lamoreux JF, Wettengel WW, Hedao P, Kassem KR(2001) Terrestrial Ecoregions of the World: A New Map ofLife on Earth. BioScience, 51, 933-938.
Papageorgiou AC, Vidalis A, Gailing O, Tsiripidis I,Hatziskakis S, Boutsios S, Galatsidas S, Finkeldey R (2008)Genetic variation of beech (Fagus sylvatica L.) in Rodopi(N.E. Greece). European Journal of Forest Research, 127,81-88.
Petit RJ, Aguinagalde I, de Beaulieu JL, Bittkau C, BrewerS, Cheddadi R, Ennos R, Fineschi S, Grivet D, Lascoux M,Mohanty A, Muller-Starck GM, Demesure-Musch B, PalmeA, Martin JP, Rendell S, Vendramin GG (2003) Glacialrefugia: Hotspots but not melting pots of genetic diversity.Science, 300, 1563-1565.
Petit RJ, Hampe A (2006). Some evolutionaryconsequences of being a tree. Annual Review of EcologyEvoluation and Systematics 37, 187-214.
Petit RJ, Vendramin GG (2007) Plant phylogeographybased on organelle genes: an introduction. In S. Weiss andN. Ferrand editors “Phylogeography of southern Europeanrefugia”, Springer, Dordrecht, The Netherlands, p 23-97.
Pignatti S (1982) Flora d’Italia. Edagricole, Bologna, Italy.
Quézel P, Médail F (2003) Ecologie et biogéographie desforêts du bassin méditerranéen. Elsevier, Paris.
Rameau JC, Mansion D, Dumé G, Gauberville C (2008)Flore forestière française Tome 3: Région méditerranéenne.IDF, Paris.
Richardson DM, Whittaker RJ (2010) Conservationbiogeography - foundations, concepts and challenges.Diversity & Distributions, 16, 313-320.
Riddle BR; Hafner DJ; Alexander LF, JR Jaeger (2000).Cryptic vicariance in the historical assembly of a BajaCalifornia Peninsular Desert biota. Proceedings of theNational Academy of Sciences, 97, 14438-14443.
Rokas A, Atkinson RJ, Webster L, Csoka G, Stone GN(2003) Out of Anatolia: longitudinal gradients in geneticdiversity support an eastern origin for a circum-Mediterranean oak gallwasp Andricus quercustozae.Molecular Ecology, 12, 2153-2174.
Rosenberg MS, Adams DC, J Gurevitch (2000) MetaWin:statistical software for meta-analysis. Version 2.0. SinauerAssociates, Sunderland, MA, USA.
Rosenthal R, DiMatteo MR, (2001) Meta-analysis: recentdevelopments in quantitative methods for literaturereviews. Annual Review of Psychology, 52, 59-82.
Ruggiero A, Werenkraut V (2007) One-dimensionalanalyses of Rapoport's rule reviewed through meta-analysis. Global Ecology, Biogeography, 16, 401-414.
Sánchez-Goñi MF, Cacho I, Turon JL, Guiot J, Sierro FJ,Peypouquet JP, Grimalt JO, Shackleton NJ (2002)Synchroneity between marine and terrestrial responses tomillennial scale climatic variability during the last glacialperiod in the Mediterranean region. Climate Dynamics, 19,95–105.
Schwartz MK, Luikart G, Waples RS (2007) Geneticmonitoring as a promising tool for conservation andmanagement. Trends in Ecology and Evolution, 22, 11–16.
Scofield DG, Sork VL, Smouse PE (2010). Influence ofacorn woodpecker social behaviour on transport of coastlive oak (Quercus agrifolia) acorns in a southern Californiaoak savanna. Journal of Ecology, 98, 561-572.
Soltis DE, Morris AB, Lachlan JSM, Manos PS, Soltis PS(2006) Comparative phylogeography of unglaciatedeastern North America. Molecular Ecology, 15, 4261-4293.
Soto A, Robledo-Arnuncio JJ, Gonzalez-Martinez SC,Smouse PE, Alia R (2010) Climatic niche and neutralgenetic diversity of the six Iberian pine species:a retrospective and prospective view. Molecular Ecology,19, 1396-1409.
Soranzo N, Alía R, Provan J, Powell W (2000) Patterns ofvariation at a mitochondrial sequence-tagged-site locusprovides new insights into the postglacial history ofEuropean Pinus sylvestris populations. Molecular Ecology,9, 1205-1211.
Stewart JR, Lister AM, Barnes I, Dalen L (2010). Refugiarevisited: individualistic responses of species in space andtime. Proceedings of the Royal Society B, 277, 661–671.
Taberlet P, Fumagalli L, Wust-Saucy AG, Cosson JF (1998)Comparative phylogeography and postglacial colonizationroutes in Europe. Molecular Ecology, 7, 453-464.
Taulavuori K, Bauer E, Taulavuori E (2011). Overwinteringstress of Vaccinium vitis-idaea in the absence of snowcover. Environmental and experimental botany, 72, 397-403.
Van Andel, TH (2002) The climate and landscape ofmiddle part of Weichselian glaciation in Europe: the stage3 project. Quaternary Research, 57, 2-8.
Vigne JD, Zazzo A, Saliège JF, Poplin F, Guilaine J,Simmons A (2009) Pre-Neolithic wild boar managementand introduction to Cyprus more than 11,400 years ago.Proceedings of the National Academy of Sciences, 106,16135-16138.
Whitham TG, Bailey JK, Schweitzer JA, Shuster SM,Bangert RK, Leroy CJ, Lonsdorf EV, Allan GJ, DiFazio SP,Potts BM, Fischer DG, Gehring CA, Lindroth RL, Marks JC,Hart SC, Wimp GM, Wooley SC (2006) A framework forcommunity and ecosystem genetics: from genes toecosystems. Nature Reviews Genetics, 7, 510-523.
Whittaker RJ, Araujo MB, Paul J, Ladle RJ, Watson JEM,Willis KJ (2005) Conservation biogeography: assessmentand prospect. Diversity & Distributions, 11, 3–23.
Wickham H (2011) The Split-Apply-Combine Strategy forData Analysis. Journal of Statistical Software, 40, 1-29.
Wu HB, Guiot JL, Brewer S, Guo ZT (2007) Climaticchanges in Eurasia and Africa at the last glacial maximumand mid-Holocene: reconstruction from pollen data usinginverse vegetation modelling. Climate Dynamics, 29,211-229.
Young A, Boyle T, Brown T (1996) The population geneticconsequences of habitat fragmentation for plants. Trendsin ecology and evolution, 11, 413-418.
75
EFFECT OF POPLAR GENOTYPESON MYCORRHIZAL INFECTION AND SECRETEDENZYME ACTIVITIES IN MYCORRHIZALAND NON-MYCORRHIZAL ROOTS
Courty PE1,3*, Labbé J1*, Kohler A1, Marçais B1, Bastien C2,Churin JL1, Garbaye J1, Le Tacon F1
1 UMR 1136 INRA-Nancy Université, Interactions Arbres / Microorganisms, INRA-Nancy, 54280 Champenoux, France.
2 INRA Orléans, Unité Amélioration, Génétique et Physiologie forestières,Ardon, BP 20619, 45166 Olivet Cedex, France.
3 Present address: University of Fribourg, Department of Biology, Rue AlbertGockel 3, CH-1700 Fribourg.
* These authors contributed equally to this work.
Corresponding Author:Courty [email protected]
IntroductionThe fine roots of tree species in temperate and borealforests are symbiotically associated with fungi, forming acomposite organ called ectomycorrhiza (ECM) (Smith andRead, 2008). The establishment and the functioning ofECM lead to complex morphological and physiologicalchanges in both the plant and the fungus (Martin andNehls, 2009, Courty et al. 2010a). The ECM symbiosis hasbeen described as a mutualistic association where theautotrophic plant supplies photosynthates to theheterotrophic fungus, which in turn supplies water andnutrients to the host (Smith and Read, 2008). Severalstudies also have shown that ectomycorrhizal fungi (ECMf)are able to produce extracellular enzymes, such asproteases, involved in the direct mobilization of nutrientsfrom organic substrates (Courty et al. 2005, 2006, 2010b;Lindahl et al. 2005; Koide et al. 2008). In addition, a given
species may contribute to significant functional variationsthrough metabolic activities (Buée et al. 2007; Courty etal. 2010b).
The ecological fitness and the metabolic activity of ECMfdepend on their genotypes, environmental factors (vander Heijden and Sanders 2002; Smith and Read, 2008),host plant genotypes (Barker et al. 2002; Linderman andDavis, 2004), and the interactions between all thesefactors (Khasa et al. 2002; Gehring et al. 2006; Karst et al.2009). Recent studies also suggest that host plantgenome may play a role in determining the dominantmycorrhizal type in dually colonized hosts (van derHeijden & Kuyper, 2001; Khasa et al. 2002). However, nostudies have simultaneously examined the effect of hostplant genotypes and the metabolic activity of one ECMfspecies in controlled conditions. In the Laccariabicolor/poplar ECM symbiosis, Tagu et al. (2005) have
The impact of ectomycorrhiza formation on the secretion of exoenzymes by the host plant and thesymbiont is unknown. Thirty-eight F1 individuals from an interspecific Populus deltoides (Bartr.)x Populus trichocarpa (Torr. & A. Gray) controlled cross, were inoculated with the ectomycorrhizalfungus Laccaria bicolor. The colonization of poplar roots by L. bicolor dramatically modified theirability to secrete enzymes involved in organic matter breakdown or organic phosphorus mobilization,such as N-acetylhexosaminidase, glucuronidase, cellobiohydrolase, glucosidase, xylosidase, laccaseand acid phosphatase. The expression of genes coding for laccase, N-acetylhexosaminidase and acidphosphatase was studied in mycorrhizal and non-mycorrhizal root tips. Depending on the genes, theirexpression was regulated upon symbiosis development. Moreover, it appears that poplar laccase orphosphatase are poorly contributing to ECM metabolic activity. Enzymes secreted by poplar rootswere added or substituted to enzymes secreted by L. bicolor. The enzymatic activities expressed inmycorrhizal roots differed significantly between the two parents, while it did not differ in non-mycorrhizal roots. Significant differences were found between poplar genotypes for all enzymaticactivities measured on ectomycorrhizas except for laccase activity. On the contrary, no significantdifferences were found between poplar genotypes for enzymatic activities of non-mycorrhizal roottips except for acid phosphatase activity. The level of enzymes secreted by the ectomycorrhizal roottips is under the genetic control of the host. Moreover, poplar heterosis was expressed through theenzymatic activities of the fungal partner.
Key words: Poplar, Laccaria bicolor, secreted enzymes, heterosis, heritability, host genetic control.
Published in Journal of Experimental Botany (2011) 62: 249-260, with doi:10.1093/jxb/erq274
Poplar genotypes and secreted enzyme activitiesin mycorrhizal and non-mycorrhizal roots
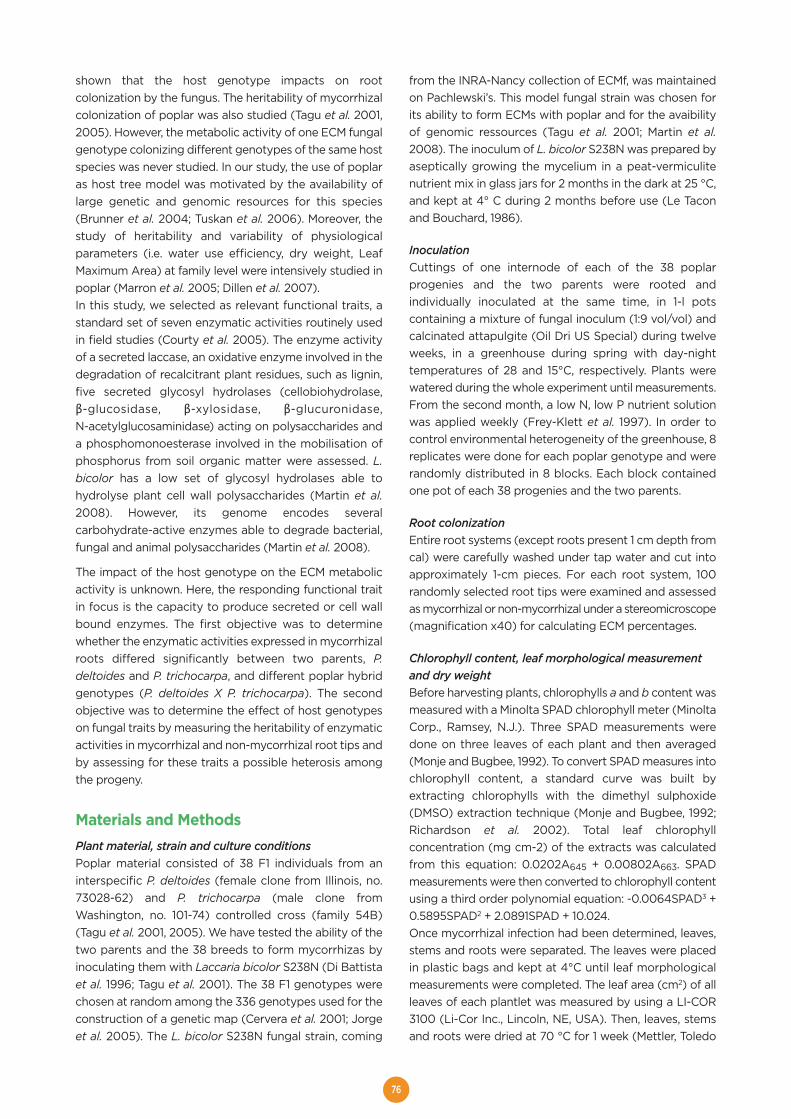
76
shown that the host genotype impacts on rootcolonization by the fungus. The heritability of mycorrhizalcolonization of poplar was also studied (Tagu et al. 2001,2005). However, the metabolic activity of one ECM fungalgenotype colonizing different genotypes of the same hostspecies was never studied. In our study, the use of poplaras host tree model was motivated by the availability oflarge genetic and genomic resources for this species(Brunner et al. 2004; Tuskan et al. 2006). Moreover, thestudy of heritability and variability of physiologicalparameters (i.e. water use efficiency, dry weight, LeafMaximum Area) at family level were intensively studied inpoplar (Marron et al. 2005; Dillen et al. 2007). In this study, we selected as relevant functional traits, astandard set of seven enzymatic activities routinely usedin field studies (Courty et al. 2005). The enzyme activityof a secreted laccase, an oxidative enzyme involved in thedegradation of recalcitrant plant residues, such as lignin,five secreted glycosyl hydrolases (cellobiohydrolase,β-glucosidase, β-xylosidase, β-glucuronidase, N-acetylglucosaminidase) acting on polysaccharides anda phosphomonoesterase involved in the mobilisation ofphosphorus from soil organic matter were assessed. L.bicolor has a low set of glycosyl hydrolases able tohydrolyse plant cell wall polysaccharides (Martin et al.2008). However, its genome encodes severalcarbohydrate-active enzymes able to degrade bacterial,fungal and animal polysaccharides (Martin et al. 2008).
The impact of the host genotype on the ECM metabolicactivity is unknown. Here, the responding functional traitin focus is the capacity to produce secreted or cell wallbound enzymes. The first objective was to determinewhether the enzymatic activities expressed in mycorrhizalroots differed significantly between two parents, P.deltoides and P. trichocarpa, and different poplar hybridgenotypes (P. deltoides X P. trichocarpa). The secondobjective was to determine the effect of host genotypeson fungal traits by measuring the heritability of enzymaticactivities in mycorrhizal and non-mycorrhizal root tips andby assessing for these traits a possible heterosis amongthe progeny.
Materials and MethodsPlant material, strain and culture conditionsPoplar material consisted of 38 F1 individuals from aninterspecific P. deltoides (female clone from Illinois, no.73028-62) and P. trichocarpa (male clone fromWashington, no. 101-74) controlled cross (family 54B)(Tagu et al. 2001, 2005). We have tested the ability of thetwo parents and the 38 breeds to form mycorrhizas byinoculating them with Laccaria bicolor S238N (Di Battistaet al. 1996; Tagu et al. 2001). The 38 F1 genotypes werechosen at random among the 336 genotypes used for theconstruction of a genetic map (Cervera et al. 2001; Jorgeet al. 2005). The L. bicolor S238N fungal strain, coming
from the INRA-Nancy collection of ECMf, was maintainedon Pachlewski’s. This model fungal strain was chosen forits ability to form ECMs with poplar and for the avaibilityof genomic ressources (Tagu et al. 2001; Martin et al.2008). The inoculum of L. bicolor S238N was prepared byaseptically growing the mycelium in a peat-vermiculitenutrient mix in glass jars for 2 months in the dark at 25 °C,and kept at 4° C during 2 months before use (Le Taconand Bouchard, 1986).
InoculationCuttings of one internode of each of the 38 poplarprogenies and the two parents were rooted andindividually inoculated at the same time, in 1-l potscontaining a mixture of fungal inoculum (1:9 vol/vol) andcalcinated attapulgite (Oil Dri US Special) during twelveweeks, in a greenhouse during spring with day-nighttemperatures of 28 and 15°C, respectively. Plants werewatered during the whole experiment until measurements.From the second month, a low N, low P nutrient solutionwas applied weekly (Frey-Klett et al. 1997). In order tocontrol environmental heterogeneity of the greenhouse, 8replicates were done for each poplar genotype and wererandomly distributed in 8 blocks. Each block containedone pot of each 38 progenies and the two parents.
Root colonizationEntire root systems (except roots present 1 cm depth fromcal) were carefully washed under tap water and cut intoapproximately 1-cm pieces. For each root system, 100randomly selected root tips were examined and assessedas mycorrhizal or non-mycorrhizal under a stereomicroscope(magnification x40) for calculating ECM percentages.
Chlorophyll content, leaf morphological measurementand dry weightBefore harvesting plants, chlorophylls a and b content wasmeasured with a Minolta SPAD chlorophyll meter (MinoltaCorp., Ramsey, N.J.). Three SPAD measurements weredone on three leaves of each plant and then averaged(Monje and Bugbee, 1992). To convert SPAD measures intochlorophyll content, a standard curve was built byextracting chlorophylls with the dimethyl sulphoxide(DMSO) extraction technique (Monje and Bugbee, 1992;Richardson et al. 2002). Total leaf chlorophyllconcentration (mg cm-2) of the extracts was calculatedfrom this equation: 0.0202A645 + 0.00802A663. SPADmeasurements were then converted to chlorophyll contentusing a third order polynomial equation: -0.0064SPAD3 +0.5895SPAD2 + 2.0891SPAD + 10.024. Once mycorrhizal infection had been determined, leaves,stems and roots were separated. The leaves were placedin plastic bags and kept at 4°C until leaf morphologicalmeasurements were completed. The leaf area (cm2) of allleaves of each plantlet was measured by using a LI-COR3100 (Li-Cor Inc., Lincoln, NE, USA). Then, leaves, stemsand roots were dried at 70 °C for 1 week (Mettler, Toledo
77
balance). The leaf mass area (LMA) was calculated foreach clone using the relationship between the area of eachleaf and its corresponding dry weight.
Enzymatic activity profiling of ectomycorrhizaland non-mycorrhizal root tipOne mycorrhizal root tip and one non-mycorrhizal root tipwere collected from each of the 320 cuttings in order todetermine their potential enzymatic activities, using thehigh-throughput photometric and fluorimetric microplateassays described and detailed in Courty et al. (2005), andapplied in previous studies (Buée et al. 2007; Courty et al.2010b). As the variability of enzyme activities among ECMtips within a root system is low, one tip is sufficient to geta representative value (Courty et al. 2005). Each well ofthe 96-well micro-titration plate contained either oneectomycorrhizal root tip or one non-ectomycorrhizal roottip. Seven activities were successively measured on roottips: xylosidase (EC 3.2.1.37), glucuronidase (EC 3.2.1.31),cellobiohydrolase (EC 3.2.1.91), N-acetylglucosaminidase(EC 3.2.1.14), ß-glucosidase (EC 3.2.1.3), acid phosphatase(EC 3.1.3.2), and laccase (EC 1.10.3.2) activities. Theenzymes activities were expressed as pmol mm-2 min-1 ofdeveloped surface area of root tips. The developed surfacearea of the root tips was measured after scanning andimage analysis using the Mac/Win Rhizo software (RegentInstruments, Quebec City, Canada). They correspond tothe activities of enzymes present on the surface of theroots or mycorrhiza mantles and released in the mediumduring the incubation.
Whole-genome expression oligoarray analysesGenes coding for laccase, N-acetylglucosaminidase andacid phosphatase were known and characterized in thegenome of L. bicolor and P. trichocarpa. As the genesinvolved in xylosidase, glucuronidase, cellobiohydrolaseand ß-glucosidase activity were not characterized, wewere not able to measure the corresponding transcriptexpression. Accumulation of predicted laccase (Lac), N-acetylglucosaminidase (Nag) and acid phosphatase (Pap)transcripts was detected in free-living mycelium of L.bicolor S238N, and in ectomycorrhizal and non-mycorrhizal root tips of poplar using NimbleGen L. bicolorwhole-genome expression oligoarray v2 (Martin et al.2008) and NimbleGen P. trichocarpa whole-genomeexpression oligoarray (Tuskan et al. 2006). Data areavailable at the GEO platform GPL2699. The L. bicolor 4-plex whole genome expression array contained 18,653gene models with three oligonucleotide probes for eachgene model. For 4,702 gene models, technical duplicateswere included on the oligoarray (A. Kohler & F. Martin,unpublished results). Average expression levels werecalculated for each gene from the independent probesand were used for further analysis. To estimate the signalbackground and the resulting threshold value forsignificant expression, the mean intensity of 2,032 randomprobes present on the microarray was calculated. Gene
models with expression exceeding the threshold by threeor more were considered to be transcribed. Raw array datawere filtered for non-specific probes and renormalizedusing ARRAYSTAR software (DNASTAR). Three biologicalreplicates were used. Therefore, the reported geneexpression values corresponded to the mean intensity ofhybridization signals obtained for the specificoligonucleotide probes. A student t-test with FDR(Benjamini-Hochberg) multiple testing corrections wasapplied on the data (P<0.05), using ARRAYSTAR sofware(DNASTAR).
Statistical analysisThe percentage of mycorrhizal colonization wastransformed by arcsin √X/100 function prior to varianceanalysis (ANOVA). Xylosidase, glucuronidase,cellobiohydrolase, chitinase, ß-glucosidase, acidphosphatase and laccase activities, root, shoot and stemdry weight and LMA were also submitted to ANOVA. Thefollowing mixed linear model was applied on an individualbasis to detect significant differences among the clones:Yijk = μ + Bi + Gj + εijkwhere μ is the overall mean, B is the block effect (fixed), Gis the genotype effect (random), and ε is the randomresidual error. Restricted maximum likelihood estimates of genetic, blockand residual variance components (σ2G, σ2B and σ2ε) werecomputed, and for each trait, individual broad senseheritability (h2) was estimated as follows: h2 = σ2G /(σ2G + σ2ε /n) where n is the average number ofreplicates per genotype. Standard deviations (SD) werederived from classic estimation of SD for a ratio x/y wherex = σ2G and y = σ2G + σ2ε /n. All analyses were performed with the statistical programsJMP 5.0 (SAS Institute Inc., Cary, NC, USA) and R version1.8.0 (R Development Core Team, 2006, www.R-project.org).The genetic coefficient of variation (CVG) was used(Cornelius, 1994) to compare the relative amounts ofgenetic variation of traits with different means:CVG = √( σ2G / μ)Relationships between the different traits were alsoanalysed by Pearson linear correlations. Developed projected area of mycorrhizal and mycorrhizalroot tips were compared between genotypes by ANOVA.
ResultsA total of 320 plants were harvested and studied in thisexperiment. Three dead plants were not used in theanalysis. No significant block effect was found for anymeasured traits.
Poplar ecophysiological traits Significant differences (p<0.001) were found betweenplant genotypes for all measured traits (chlorophyllcontent, leaf maximum area, stem and root dry weight).
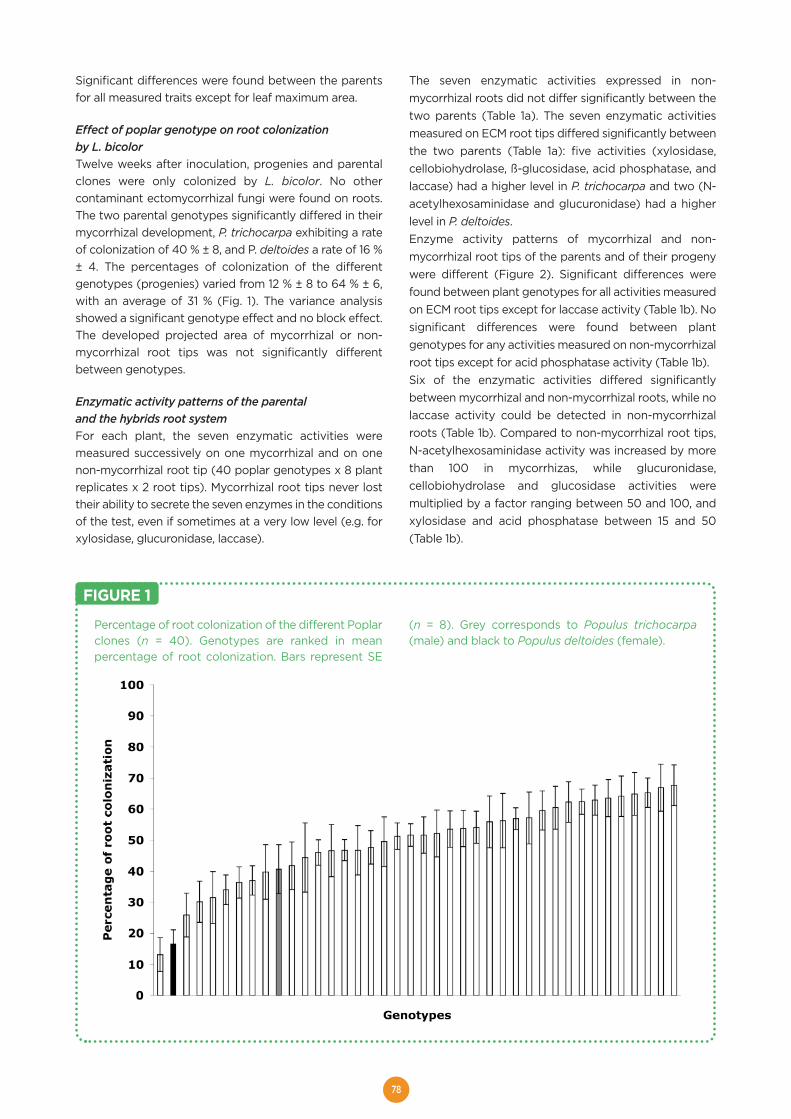
78
Significant differences were found between the parentsfor all measured traits except for leaf maximum area.
Effect of poplar genotype on root colonizationby L. bicolorTwelve weeks after inoculation, progenies and parentalclones were only colonized by L. bicolor. No othercontaminant ectomycorrhizal fungi were found on roots.The two parental genotypes significantly differed in theirmycorrhizal development, P. trichocarpa exhibiting a rateof colonization of 40 % ± 8, and P. deltoides a rate of 16 %± 4. The percentages of colonization of the differentgenotypes (progenies) varied from 12 % ± 8 to 64 % ± 6,with an average of 31 % (Fig. 1). The variance analysisshowed a significant genotype effect and no block effect.The developed projected area of mycorrhizal or non-mycorrhizal root tips was not significantly differentbetween genotypes.
Enzymatic activity patterns of the parentaland the hybrids root system For each plant, the seven enzymatic activities weremeasured successively on one mycorrhizal and on onenon-mycorrhizal root tip (40 poplar genotypes x 8 plantreplicates x 2 root tips). Mycorrhizal root tips never losttheir ability to secrete the seven enzymes in the conditionsof the test, even if sometimes at a very low level (e.g. forxylosidase, glucuronidase, laccase).
The seven enzymatic activities expressed in non-mycorrhizal roots did not differ significantly between thetwo parents (Table 1a). The seven enzymatic activitiesmeasured on ECM root tips differed significantly betweenthe two parents (Table 1a): five activities (xylosidase,cellobiohydrolase, ß-glucosidase, acid phosphatase, andlaccase) had a higher level in P. trichocarpa and two (N-acetylhexosaminidase and glucuronidase) had a higherlevel in P. deltoides. Enzyme activity patterns of mycorrhizal and non-mycorrhizal root tips of the parents and of their progenywere different (Figure 2). Significant differences werefound between plant genotypes for all activities measuredon ECM root tips except for laccase activity (Table 1b). Nosignificant differences were found between plantgenotypes for any activities measured on non-mycorrhizalroot tips except for acid phosphatase activity (Table 1b).Six of the enzymatic activities differed significantlybetween mycorrhizal and non-mycorrhizal roots, while nolaccase activity could be detected in non-mycorrhizalroots (Table 1b). Compared to non-mycorrhizal root tips,N-acetylhexosaminidase activity was increased by morethan 100 in mycorrhizas, while glucuronidase,cellobiohydrolase and glucosidase activities weremultiplied by a factor ranging between 50 and 100, andxylosidase and acid phosphatase between 15 and 50(Table 1b).
Percentage of root colonization of the different Poplarclones (n = 40). Genotypes are ranked in meanpercentage of root colonization. Bars represent SE
(n = 8). Grey corresponds to Populus trichocarpa(male) and black to Populus deltoides (female).
FIGURE 1
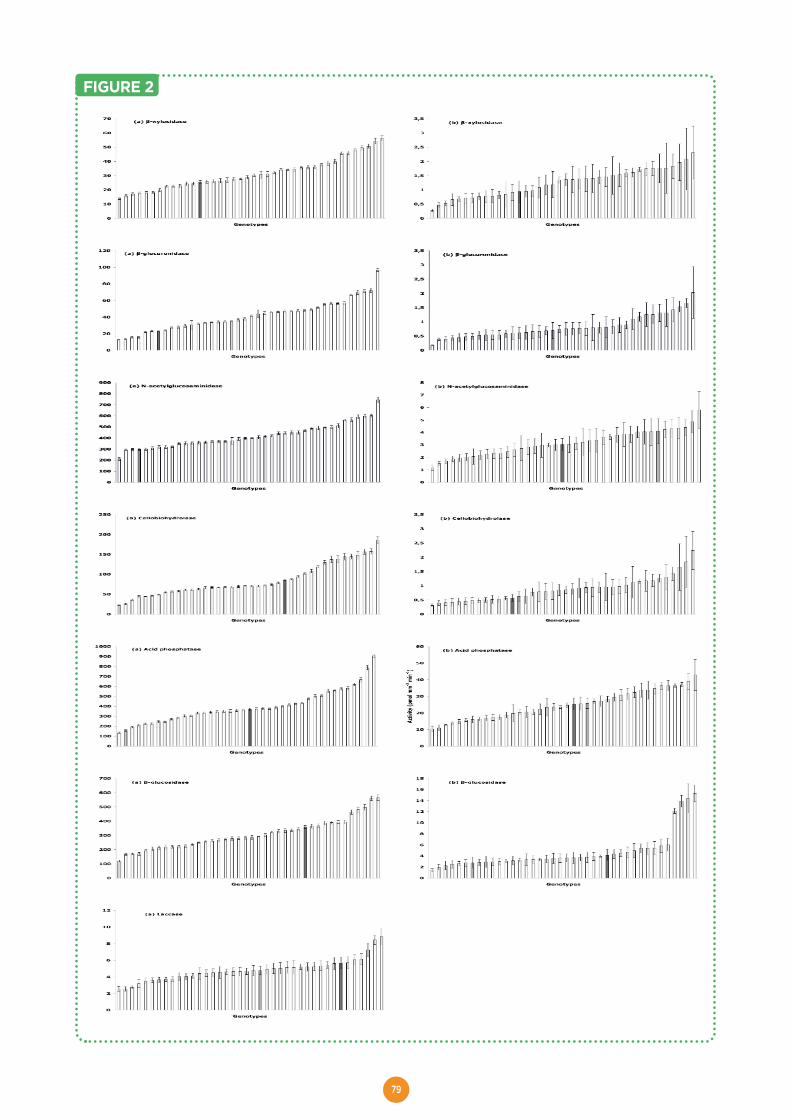
79
FIGURE 2
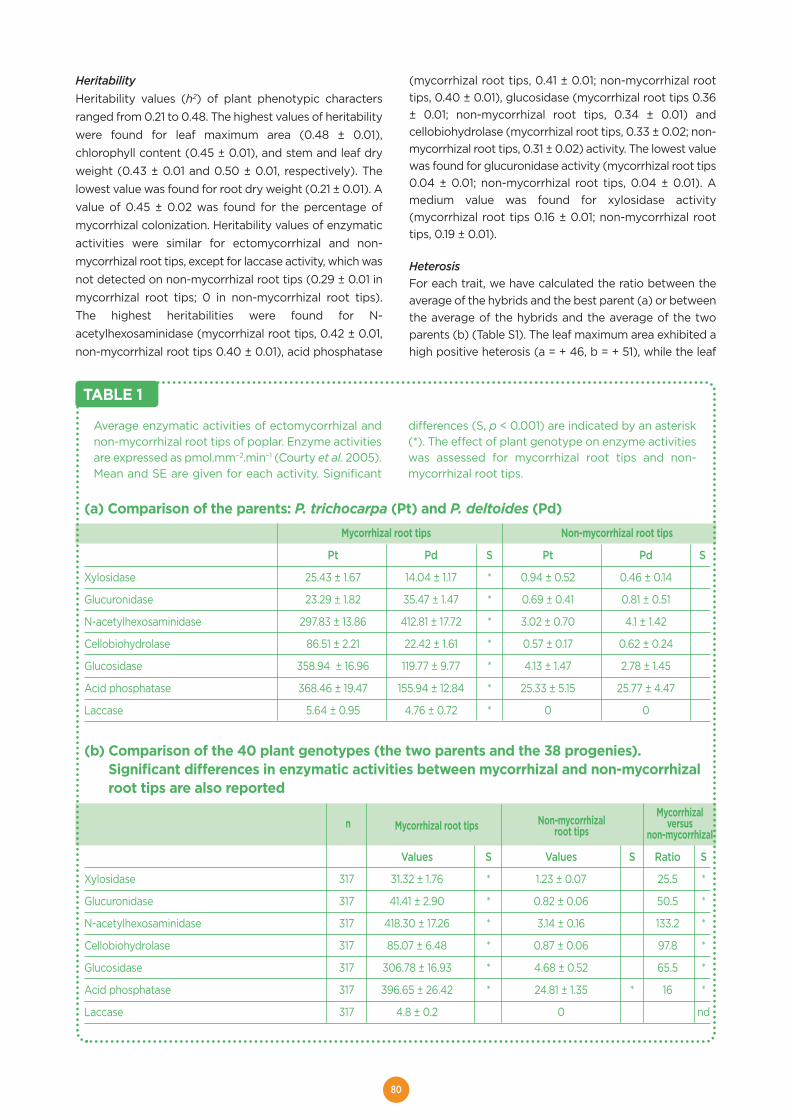
80
HeritabilityHeritability values (h2) of plant phenotypic charactersranged from 0.21 to 0.48. The highest values of heritabilitywere found for leaf maximum area (0.48 ± 0.01),chlorophyll content (0.45 ± 0.01), and stem and leaf dryweight (0.43 ± 0.01 and 0.50 ± 0.01, respectively). Thelowest value was found for root dry weight (0.21 ± 0.01). Avalue of 0.45 ± 0.02 was found for the percentage ofmycorrhizal colonization. Heritability values of enzymaticactivities were similar for ectomycorrhizal and non-mycorrhizal root tips, except for laccase activity, which wasnot detected on non-mycorrhizal root tips (0.29 ± 0.01 inmycorrhizal root tips; 0 in non-mycorrhizal root tips).The highest heritabilities were found for N-acetylhexosaminidase (mycorrhizal root tips, 0.42 ± 0.01,non-mycorrhizal root tips 0.40 ± 0.01), acid phosphatase
(mycorrhizal root tips, 0.41 ± 0.01; non-mycorrhizal roottips, 0.40 ± 0.01), glucosidase (mycorrhizal root tips 0.36± 0.01; non-mycorrhizal root tips, 0.34 ± 0.01) andcellobiohydrolase (mycorrhizal root tips, 0.33 ± 0.02; non-mycorrhizal root tips, 0.31 ± 0.02) activity. The lowest valuewas found for glucuronidase activity (mycorrhizal root tips0.04 ± 0.01; non-mycorrhizal root tips, 0.04 ± 0.01). Amedium value was found for xylosidase activity(mycorrhizal root tips 0.16 ± 0.01; non-mycorrhizal roottips, 0.19 ± 0.01).
HeterosisFor each trait, we have calculated the ratio between theaverage of the hybrids and the best parent (a) or betweenthe average of the hybrids and the average of the twoparents (b) (Table S1). The leaf maximum area exhibited ahigh positive heterosis (a = + 46, b = + 51), while the leaf
(a) Comparison of the parents: P. trichocarpa (Pt) and P. deltoides (Pd)Mycorrhizal root tips Non-mycorrhizal root tips
Pt Pd S Pt Pd S
Xylosidase 25.43 ± 1.67 14.04 ± 1.17 * 0.94 ± 0.52 0.46 ± 0.14
Glucuronidase 23.29 ± 1.82 35.47 ± 1.47 * 0.69 ± 0.41 0.81 ± 0.51
N-acetylhexosaminidase 297.83 ± 13.86 412.81 ± 17.72 * 3.02 ± 0.70 4.1 ± 1.42
Cellobiohydrolase 86.51 ± 2.21 22.42 ± 1.61 * 0.57 ± 0.17 0.62 ± 0.24
Glucosidase 358.94 ± 16.96 119.77 ± 9.77 * 4.13 ± 1.47 2.78 ± 1.45
Acid phosphatase 368.46 ± 19.47 155.94 ± 12.84 * 25.33 ± 5.15 25.77 ± 4.47
Laccase 5.64 ± 0.95 4.76 ± 0.72 * 0 0
(b) Comparison of the 40 plant genotypes (the two parents and the 38 progenies).Significant differences in enzymatic activities between mycorrhizal and non-mycorrhizalroot tips are also reported
Mycorrhizal root tips Non-mycorrhizalMycorrhizal
nroot tips
versusnon-mycorrhizal
Values S Values S Ratio S
Xylosidase 317 31.32 ± 1.76 * 1.23 ± 0.07 25.5 *
Glucuronidase 317 41.41 ± 2.90 * 0.82 ± 0.06 50.5 *
N-acetylhexosaminidase 317 418.30 ± 17.26 * 3.14 ± 0.16 133.2 *
Cellobiohydrolase 317 85.07 ± 6.48 * 0.87 ± 0.06 97.8 *
Glucosidase 317 306.78 ± 16.93 * 4.68 ± 0.52 65.5 *
Acid phosphatase 317 396.65 ± 26.42 * 24.81 ± 1.35 * 16 *
Laccase 317 4.8 ± 0.2 0 nd
TABLE 1
Average enzymatic activities of ectomycorrhizal andnon-mycorrhizal root tips of poplar. Enzyme activitiesare expressed as pmol.mm−2.min−1 (Courty et al. 2005).Mean and SE are given for each activity. Significant
differences (S, p < 0.001) are indicated by an asterisk(*). The effect of plant genotype on enzyme activitieswas assessed for mycorrhizal root tips and non-mycorrhizal root tips.
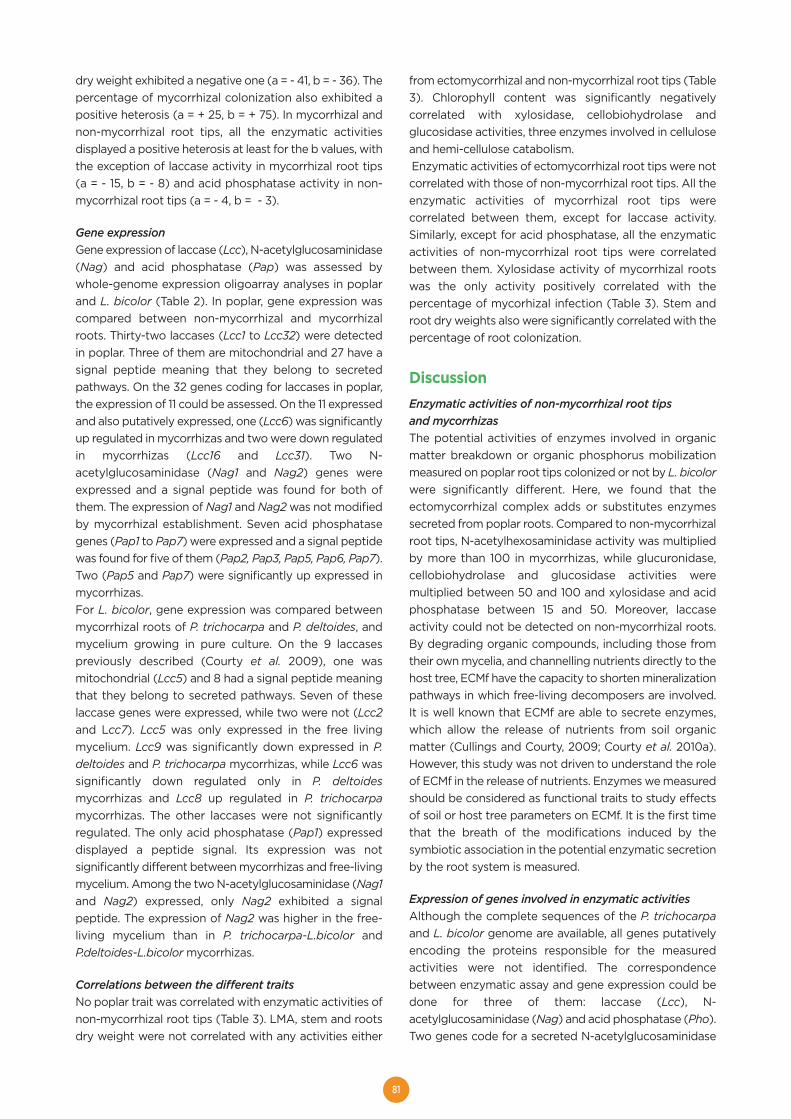
81
dry weight exhibited a negative one (a = - 41, b = - 36). Thepercentage of mycorrhizal colonization also exhibited apositive heterosis (a = + 25, b = + 75). In mycorrhizal andnon-mycorrhizal root tips, all the enzymatic activitiesdisplayed a positive heterosis at least for the b values, withthe exception of laccase activity in mycorrhizal root tips(a = - 15, b = - 8) and acid phosphatase activity in non-mycorrhizal root tips (a = - 4, b = - 3).
Gene expressionGene expression of laccase (Lcc), N-acetylglucosaminidase(Nag) and acid phosphatase (Pap) was assessed bywhole-genome expression oligoarray analyses in poplarand L. bicolor (Table 2). In poplar, gene expression wascompared between non-mycorrhizal and mycorrhizalroots. Thirty-two laccases (Lcc1 to Lcc32) were detectedin poplar. Three of them are mitochondrial and 27 have asignal peptide meaning that they belong to secretedpathways. On the 32 genes coding for laccases in poplar,the expression of 11 could be assessed. On the 11 expressedand also putatively expressed, one (Lcc6) was significantlyup regulated in mycorrhizas and two were down regulatedin mycorrhizas (Lcc16 and Lcc31). Two N-acetylglucosaminidase (Nag1 and Nag2) genes wereexpressed and a signal peptide was found for both ofthem. The expression of Nag1 and Nag2 was not modifiedby mycorrhizal establishment. Seven acid phosphatasegenes (Pap1 to Pap7) were expressed and a signal peptidewas found for five of them (Pap2, Pap3, Pap5, Pap6, Pap7).Two (Pap5 and Pap7) were significantly up expressed inmycorrhizas.For L. bicolor, gene expression was compared betweenmycorrhizal roots of P. trichocarpa and P. deltoides, andmycelium growing in pure culture. On the 9 laccasespreviously described (Courty et al. 2009), one wasmitochondrial (Lcc5) and 8 had a signal peptide meaningthat they belong to secreted pathways. Seven of theselaccase genes were expressed, while two were not (Lcc2and Lcc7). Lcc5 was only expressed in the free livingmycelium. Lcc9 was significantly down expressed in P.deltoides and P. trichocarpa mycorrhizas, while Lcc6 wassignificantly down regulated only in P. deltoidesmycorrhizas and Lcc8 up regulated in P. trichocarpamycorrhizas. The other laccases were not significantlyregulated. The only acid phosphatase (Pap1) expresseddisplayed a peptide signal. Its expression was notsignificantly different between mycorrhizas and free-livingmycelium. Among the two N-acetylglucosaminidase (Nag1and Nag2) expressed, only Nag2 exhibited a signalpeptide. The expression of Nag2 was higher in the free-living mycelium than in P. trichocarpa-L.bicolor andP.deltoides-L.bicolor mycorrhizas.
Correlations between the different traitsNo poplar trait was correlated with enzymatic activities ofnon-mycorrhizal root tips (Table 3). LMA, stem and rootsdry weight were not correlated with any activities either
from ectomycorrhizal and non-mycorrhizal root tips (Table3). Chlorophyll content was significantly negativelycorrelated with xylosidase, cellobiohydrolase andglucosidase activities, three enzymes involved in celluloseand hemi-cellulose catabolism. Enzymatic activities of ectomycorrhizal root tips were notcorrelated with those of non-mycorrhizal root tips. All theenzymatic activities of mycorrhizal root tips werecorrelated between them, except for laccase activity.Similarly, except for acid phosphatase, all the enzymaticactivities of non-mycorrhizal root tips were correlatedbetween them. Xylosidase activity of mycorrhizal rootswas the only activity positively correlated with thepercentage of mycorhizal infection (Table 3). Stem androot dry weights also were significantly correlated with thepercentage of root colonization.
Discussion Enzymatic activities of non-mycorrhizal root tipsand mycorrhizasThe potential activities of enzymes involved in organicmatter breakdown or organic phosphorus mobilizationmeasured on poplar root tips colonized or not by L. bicolorwere significantly different. Here, we found that theectomycorrhizal complex adds or substitutes enzymessecreted from poplar roots. Compared to non-mycorrhizalroot tips, N-acetylhexosaminidase activity was multipliedby more than 100 in mycorrhizas, while glucuronidase,cellobiohydrolase and glucosidase activities weremultiplied between 50 and 100 and xylosidase and acidphosphatase between 15 and 50. Moreover, laccaseactivity could not be detected on non-mycorrhizal roots.By degrading organic compounds, including those fromtheir own mycelia, and channelling nutrients directly to thehost tree, ECMf have the capacity to shorten mineralizationpathways in which free-living decomposers are involved.It is well known that ECMf are able to secrete enzymes,which allow the release of nutrients from soil organicmatter (Cullings and Courty, 2009; Courty et al. 2010a).However, this study was not driven to understand the roleof ECMf in the release of nutrients. Enzymes we measuredshould be considered as functional traits to study effectsof soil or host tree parameters on ECMf. It is the first timethat the breath of the modifications induced by thesymbiotic association in the potential enzymatic secretionby the root system is measured.
Expression of genes involved in enzymatic activities Although the complete sequences of the P. trichocarpaand L. bicolor genome are available, all genes putativelyencoding the proteins responsible for the measuredactivities were not identified. The correspondencebetween enzymatic assay and gene expression could bedone for three of them: laccase (Lcc), N-acetylglucosaminidase (Nag) and acid phosphatase (Pho). Two genes code for a secreted N-acetylglucosaminidase

82
Quantification by exon expression array of the transcriptlevels of laccase (lcc), N-acetylglucosaminidase (Nag)and acid phosphatase (Pap) genes in differentconditions. The length (bp) of signal peptide(Signal-P) was predicted with Signal P 3.0(http://www.cbs.dtu.dk/services/SignalP/). Theprediction of the subcellular location of the proteins
was performed with TargetP 1.1 available on thewebpage (http://www.cbs.dtu.dk/services/TargetP/);M=mitochondrial, S=secreted and -=unknown.Three biological replicates were used for eachtreatment with NimbleGen oligoarrays (v.2.0; NG2). ACyber-T test was performed on the mean for eachtranscript (*, P < 0.05).
TABLE 2
(a) Poplar genes. The NimbleGen array analysis wascarried out using P. trichocarpa root tipsmycorrhizal or not by L. bicolor. Transcript levelsin non-mycorrhizal root tips were used as thecontrol values. NT: not transcribed. (-): gene noton the array or no reliable probe left.
Protein ID Signal-P Target-P RatioLcc1 820390 24 S 1.0Lcc2 557962 24 S -Lcc3 797646 22 S NTLcc4 576931 23 S -Lcc5 762473 25 S -Lcc6 767563 28 S 4.3*Lcc7 219290 29 S 1.4Lcc8 759686 - 1.2Lcc9 653089 24 S -Lcc10 819177 26 S NTLcc11 797888 31 S NTLcc12 579478 32 S -Lcc13 235935 32 S -Lcc14 831900 34 S NTLcc15 235930 32 S -Lcc16 768177 26 S 0.4*Lcc17 548008 32 S -Lcc18 783559 32 S NTLcc19 822366 32 S 0.4Lcc20 560853 23 S NTLcc21 592533 23 S -Lcc22 832603 31 S 0.3Lcc23 738903 M -Lcc24 574533 30 S -Lcc25 777748 23 S 0.8Lcc26 738893 M -Lcc27 571858 33 S -Lcc28 574985 28 S -Lcc29 205176 M 1.6Lcc30 569758 28 S -Lcc31 420672 17 S 0.4*Lcc32 774519 - 0.2Nag1 772972 27 S 1.4Nag2 202916 25 S 1.5Pap1 821155 - 1.4Pap2 831269 28 S 0.6Pap3 818768 27 S 0.5Pap4 816041 - 1.4Pap5 272725 22 S 2.1*Pap6 259486 23 S 1.9Pap7 825753 32 S 1.8*
(b) L. bicolor genes. The NimbleGen array analysiswas carried out using P. trichocarpa (Pt) and P.deltoides (Pd) mycorrhizal by L. bicolor. Transcriptlevels in the mycelium grown in pure culture wereused as the control values. NE: not expressed inmycorrhizas (signal under background). (-): genenot on the array or no reliable probe left.
Protein ID Signal-P Target-P Ratio PtRatio PdLcc1 399743 17 S 0.1 0.2Lcc2 399744 17 S - -Lcc3 399745 17 S 4.4 2.0Lcc4 399746 18 S 0.8 0.6Lcc5 399747 19 M NE NELcc6 399748 20 S 0.4 0.3*Lcc7 399750 19 S - -Lcc8 399749 22 S 2.0* 1.4Lcc9 399751 16 S 0.3* 0.3*Pap1 310810 21 S 0.6 0.9Nag1 309753 0.6 0.6*Nag2 182604 18 S 0.4* 0.4*
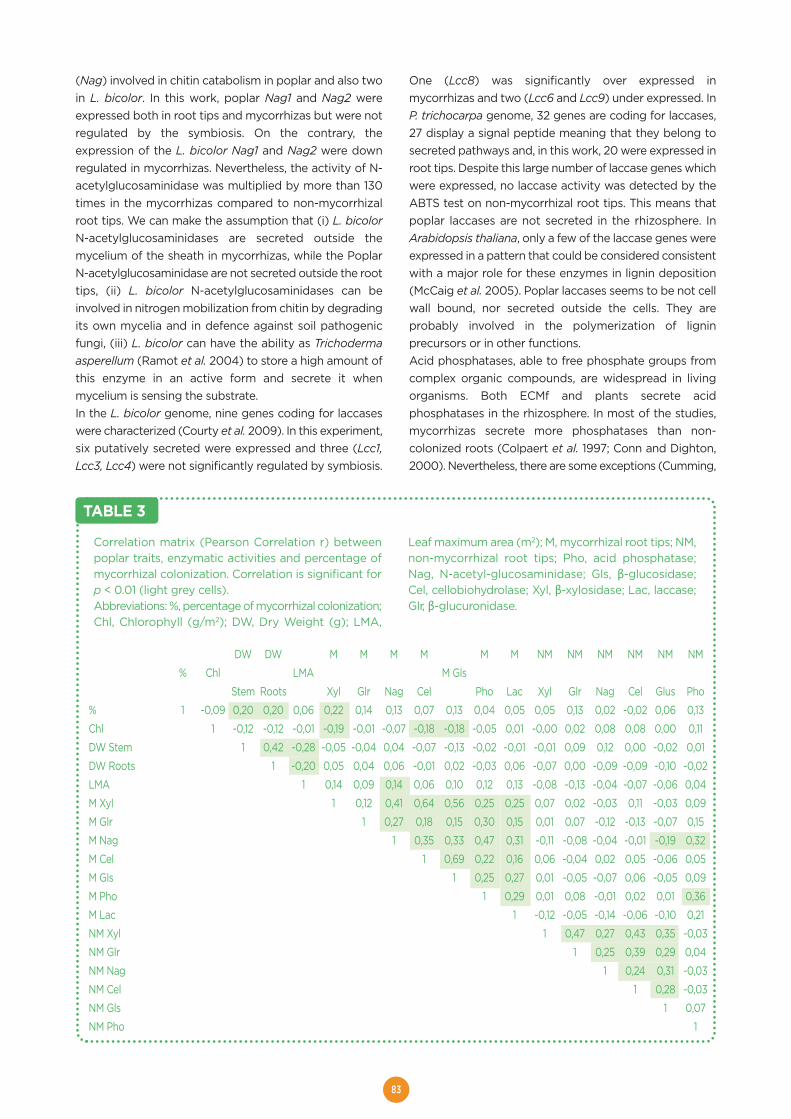
83
(Nag) involved in chitin catabolism in poplar and also twoin L. bicolor. In this work, poplar Nag1 and Nag2 wereexpressed both in root tips and mycorrhizas but were notregulated by the symbiosis. On the contrary, theexpression of the L. bicolor Nag1 and Nag2 were downregulated in mycorrhizas. Nevertheless, the activity of N-acetylglucosaminidase was multiplied by more than 130times in the mycorrhizas compared to non-mycorrhizalroot tips. We can make the assumption that (i) L. bicolorN-acetylglucosaminidases are secreted outside themycelium of the sheath in mycorrhizas, while the PoplarN-acetylglucosaminidase are not secreted outside the roottips, (ii) L. bicolor N-acetylglucosaminidases can beinvolved in nitrogen mobilization from chitin by degradingits own mycelia and in defence against soil pathogenicfungi, (iii) L. bicolor can have the ability as Trichodermaasperellum (Ramot et al. 2004) to store a high amount ofthis enzyme in an active form and secrete it whenmycelium is sensing the substrate. In the L. bicolor genome, nine genes coding for laccaseswere characterized (Courty et al. 2009). In this experiment,six putatively secreted were expressed and three (Lcc1,Lcc3, Lcc4) were not significantly regulated by symbiosis.
One (Lcc8) was significantly over expressed inmycorrhizas and two (Lcc6 and Lcc9) under expressed. InP. trichocarpa genome, 32 genes are coding for laccases,27 display a signal peptide meaning that they belong tosecreted pathways and, in this work, 20 were expressed inroot tips. Despite this large number of laccase genes whichwere expressed, no laccase activity was detected by theABTS test on non-mycorrhizal root tips. This means thatpoplar laccases are not secreted in the rhizosphere. InArabidopsis thaliana, only a few of the laccase genes wereexpressed in a pattern that could be considered consistentwith a major role for these enzymes in lignin deposition(McCaig et al. 2005). Poplar laccases seems to be not cellwall bound, nor secreted outside the cells. They areprobably involved in the polymerization of ligninprecursors or in other functions. Acid phosphatases, able to free phosphate groups fromcomplex organic compounds, are widespread in livingorganisms. Both ECMf and plants secrete acidphosphatases in the rhizosphere. In most of the studies,mycorrhizas secrete more phosphatases than non-colonized roots (Colpaert et al. 1997; Conn and Dighton,2000). Nevertheless, there are some exceptions (Cumming,
DW DW M M M M M M NM NM NM NM NM NM
% Chl LMA M Gls
Stem Roots Xyl Glr Nag Cel Pho Lac Xyl Glr Nag Cel Glus Pho
% 1 -0,09 0,20 0,20 0,06 0,22 0,14 0,13 0,07 0,13 0,04 0,05 0,05 0,13 0,02 -0,02 0,06 0,13
Chl 1 -0,12 -0,12 -0,01 -0,19 -0,01 -0,07 -0,18 -0,18 -0,05 0,01 -0,00 0,02 0,08 0,08 0,00 0,11
DW Stem 1 0,42 -0,28 -0,05 -0,04 0,04 -0,07 -0,13 -0,02 -0,01 -0,01 0,09 0,12 0,00 -0,02 0,01
DW Roots 1 -0,20 0,05 0,04 0,06 -0,01 0,02 -0,03 0,06 -0,07 0,00 -0,09 -0,09 -0,10 -0,02
LMA 1 0,14 0,09 0,14 0,06 0,10 0,12 0,13 -0,08 -0,13 -0,04 -0,07 -0,06 0,04
M Xyl 1 0,12 0,41 0,64 0,56 0,25 0,25 0,07 0,02 -0,03 0,11 -0,03 0,09
M Glr 1 0,27 0,18 0,15 0,30 0,15 0,01 0,07 -0,12 -0,13 -0,07 0,15
M Nag 1 0,35 0,33 0,47 0,31 -0,11 -0,08 -0,04 -0,01 -0,19 0,32
M Cel 1 0,69 0,22 0,16 0,06 -0,04 0,02 0,05 -0,06 0,05
M Gls 1 0,25 0,27 0,01 -0,05 -0,07 0,06 -0,05 0,09
M Pho 1 0,29 0,01 0,08 -0,01 0,02 0,01 0,36
M Lac 1 -0,12 -0,05 -0,14 -0,06 -0,10 0,21
NM Xyl 1 0,47 0,27 0,43 0,35 -0,03
NM Glr 1 0,25 0,39 0,29 0,04
NM Nag 1 0,24 0,31 -0,03
NM Cel 1 0,28 -0,03
NM Gls 1 0,07
NM Pho 1
TABLE 3
Correlation matrix (Pearson Correlation r) betweenpoplar traits, enzymatic activities and percentage ofmycorrhizal colonization. Correlation is significant forp < 0.01 (light grey cells).Abbreviations: %, percentage of mycorrhizal colonization;Chl, Chlorophyll (g/m2); DW, Dry Weight (g); LMA,
Leaf maximum area (m2); M, mycorrhizal root tips; NM,non-mycorrhizal root tips; Pho, acid phosphatase;Nag, N-acetyl-glucosaminidase; Gls, β-glucosidase;Cel, cellobiohydrolase; Xyl, β-xylosidase; Lac, laccase;Glr, β-glucuronidase.
84
1996). ECMf exhibit high phosphatase release in theirenvironment, particularly under mineral phosphorusdeficiency (Dighton, 1983; Nygren and Rosling, 2009). TheL. bicolor genome comprises only one gene coding for aputative secreted acid phosphatase, while P. trichocarpagenome contains five. The phosphatase Pap1 from L.bicolor was not regulated by symbiosis. Pap5 and Pap7from poplar were significantly highly expressed undermycorrhizal conditions, whereas the three others (Pap2,Pap3, Pap6) were not significantly regulated. Ezawa et al. (2005) have shown, on Tagetes petala insymbiosis with Archaeospora leptoticha, that the levels oftranscripts of the T. petala acid phosphatase (TpPAP1) wasincreased eight times by A. leptoticha colonization. Ourresults support the hypothesis of Ezawa et al. (2005) onthe fungal activation of the low-phosphate adaptationsystem of the plant partner and seem to show that thesame mechanism of plant phosphatase activation existsboth in arbuscular mycorrhizas and ectomycorhizas. Another hypothesis could be involved in the explanationof the differences in enzyme secretion between non-mycorrhizal and mycorrhizal roots. Inside the mycorrhizas,the root tissues, being isolated from the external mediumby the fungal sheath, probably poorly contribute toenzyme secretion. The ability to degrade cellulose,hemicelluloses and lignin is widespread among fungi andsoil bacteria (i.e. Streptomyces sp., Bacillus sp.,Cellulomonas sp., Lynd et al. 2002). However, it is assumedthat most of cellulose degradation in soil is performed byfungi (de Boer et al. 2005). Even if it has been shown thatlaccase genes were present in bacteria (Kellner et al.2008), bacterial lignin degradation appears to benegligible in terrestrial environments compared to fungallignin degradation (Peng et al. 2002). This is supported bythe fact that we did not find any laccase activity on non-mycorrhizal root tips. Among bacteria, Collimonas sp.display chitinolytic activities (de Boer et al. 2004).However, these bacteria are present under specificconditions, completely different from greenhouseexperiments with artificial substrate. Thus, despite the factthat this experiment was performed in non-axenicconditions, we may assume that the secreted enzymesthat we measured in mycorrhizas were mainly due tofungal activity.
Host genetic control of ECM enzyme secretion The enzymatic activities expressed in mycorrhizal rootsdiffered significantly between the two parents, while it didnot differ in non-mycorrhizal roots. Significant differenceswere found between poplar genotypes for all enzymaticactivities measured on ECMs except for laccase activity.On the contrary, no significant differences were foundbetween poplar genotypes for enzymatic activities of non-mycorrhizal root tips except for acid phosphatase activity. Heritability values of enzymatic activities were similar forectomycorrhizal and non-mycorrhizal root tips, except forglucuronidase in both types of roots and for laccase that
was not detected on non-mycorrhizal root tips. It isremarkable to find a high heritability value among thepoplar genotypes for the enzymatic secretions ofmycorrhizal roots, which are mainly due to fungal activity. Several previous studies have demonstrated significantgenetic variability within plants and/or fungal species forsymbiotic capability in mycorrhizal interactions. Rosado etal. (1994) reported a high value of heritability forcolonization of Pinus ellilotii by the ECMf Pisolithustinctorius, and moderate heritability for the developmentof P. tinctorius extramatrical mycelium. Eucalyptus grandis,E. globulus, E. marginata and Pinus muricata varied greatlyin their growth response to different Pisolithus andRhizopogon genotypes, respectively (Tonkin et al. 1989;Burgess et al. 1994; Piculell et al. 2008). Tagu et al. (2003,2005) have already shown that the ability of poplar toform ECMs is under its genetic control. Other studies withcontrasting results have found that plant genotype canplay a dominant role in controlling the associate soilmicrobial communities (Mari et al. 2003; Korkama et al.2007). Short-term experiment have either shownvariations in mycorrhizal colonization, in microbial and inmycorrhizal communities (Gehring et al. 2006; Barbour etal. 2009; Lojewski et al. 2009) or few differences inarbuscular fungal and bacterial communities (Bever et al.1996; Madritch and Hunter, 2002). Here, the degree offungal enzymatic secretion is modulated according topoplar genotype. An explanation could be that the hostgenotype controls the amount of fungal tissue in themantle and that enzyme activity is determined by theamount of fungal tissue present on the root. However, wefound no significant differences in the projected area ofmycorrhized or non-mycorrhized root tips betweengenotypes. So, it means that the amount of mycelium inthe root tip is similar whatever the genotype. These resultssuggest the potential for poplar genome to drive themicrobial-plant interaction, to create environments towhich ECM fungi can respond and that could be explainedby the “extended phenotype” phenomenom (Schweitzeret al. 2008; Whitham et al. 2008). As defined by Whithamet al. (2003), the heritable genetic variation withinindividual species (poplar in our study) has communityand ecosystem consequences. In addition, we found a highpositive heterosis for the capacity of poplar to formmycorrhizas (h2 a = + 45 %). We also found positiveheterosis for characters such as leaf maximum area, dryweight of roots and for five of the seven enzymaticactivities of mycorrhizal roots. Heterosis for poplar hybridsis a well-known phenomenon (Li and Wu, 1997; Marron etal. 2006). Heterosis is determined by non-mutuallyexclusive mechanisms, including genome-wide dominancecomplementation, locus-specific overdominance effectsand epistasis, although the relative contribution of each ofthese mechanisms is still unclear (Lippman and Zamir,2007). But it is also the first time that it is shown that plantheterosis could be expressed through the physiologicalactivity of the fungal partner.
85
ConclusionThe genetic diversity in tree species can influence fluxesof nutrients as well as interactions with soil microorganisms.Assessing tree genotype x environment interactions is amajor challenge in functional ecology. In this paper, ourdata linked and quantified the general relationshipsbetween poplar plant genetics, ECM fungal infection, andphysiological parameters. In the association L.bicolor/poplar, variations in plant and fungal responses inthese controlled conditions illustrate the broad plasticityof the interaction. In this study, the role of poplar geneticsin determining both poplar growth characteristics andfungal activities has been highlighted.
AcknowledgementsCourty PE was supported by a grant of the French Ministryof Ecology and Sustainable Development and Labbé J bya scholarship of Région Lorraine/INRA; part of thisresearch has been supported by the Biological Invasionsprogram of the same Ministry. This project was alsosupported by the European Network of ExcellenceEVOLTREE. We thank Joseph Armento and Krista Plettfor language corrections and helpful comments on themanuscript, and Francis Martin for valuable discussion.
REFERENCESBarbour RC, Baker SC, O'Reilly-Wapstra JM, Harvest TM,Potts BM. 2009. A footprint of tree-genetics on the biotaof the forest floor. Oikos, 118, 1917-1923.
Barker SJ, Duplessis S, Tagu D. 2002. The application ofgenetic approaches for investigations of mycorrhizalsymbioses. Plant and Soil, 244, 85-95.
Bever JD, Morton J, Antonovics J, Schultz P. 1996. Hostspecificity and diversity of glomalean fungi: anexperimental approach in an old-field community. Journalof Ecology, 84, 71-82.
de Boer W, Folman LB, Summerbell RC, Boddy L. 2005.Living in a fungal world: impact of fungi on soil bacterialniche development. FEMS Microbiology Review, 29, 795-811.
de Boer W, Leveau JHJ, Kowalchuk GA, Gunnewiek PJAK,Abeln ECA, Figge MJ, Sjollema K, Janse JD, van Veen JA.2004. Collimonas fungivorans gen. nov., sp. nov., achitinolytic soil bacterium with the ability to grow on livingfungal hyphae. International Journal of Systematic andEvolutionary Microbiology, 54, 857-864.
Brunner AM, Busov VB, Strauss SH. 2004. Poplar genomesequence: functional genomics in an ecologically dominantplant species. TRENDS in Plant Science, 9, 49-56.
Buée M, Courty PE, Mignot D, Garbaye J. 2007. Soil nicheeffect on species diversity and catabolic activities in anectomycorrhizal fungal community. Soil Biology andBiochemistry, 39, 1947-1955.
Burgess T, Dell B, Malajczuk Thompson N. 1994. Variationin mycorrhizal development and growth stimulation by 20Pisolithus isolates inoculated on to Eucalyptus grandis W.Hill ex Maiden. New Phytologist, 127, 731-739.
Cervera MT, Storme V, Ivens B, Gusmao J, Liu BH, HostynV, Hostyn Van Slycken J, Van Montagu M, Boerjan W. 2001.Dense genetic linkagmaps of three Populus species(Populus deltoides, P. nigra and P. trichocarpa based onAFLP and microsatellite markers. Genetics, 158, 787-809.
Colpaert JV, van Laere A, van Tichelen KK, van Assche JA.1997. The use of inositol hexaphosphate as a phosphorussource by mycorrhizal and non-mycorrhizal scots pine(Pinus sylvestris). Functional Ecology, 11, 407-415.
Conn C, Dighton J. 2000. Litter quality influences ondecomposition, ectomycorrhizal community structure andmycorrhizal root surface acid phosphatase activity. SoilBiology and Biochemistry, 32, 489-496.
Cornelius J. 1994. Heritabilities and additive geneticcoefficients of variation in forest trees. Canadian Journalof Forest Research, 24, 372-379.
Courty PE, Franc A, Garbaye J. 2010a. Temporal andfunctional pattern of secreted enzyme activities in anectomycorrhizal community. Soil Biology and Biochemistry,submitted.
Courty PE, Buée M, Diedhiou AG, Frey-Klett P, Le TaconF, Rineau F, Turpault MP, Uroz S, Garbaye J. 2010b. Therole of ectomycorrhizal communities in forest ecosystemprocesses: new perspectives and emerging concepts. SoilBiology and Biochemistry, 42, 679-698.
Courty PE, Hoegger P, Kilaru S, Kohler A, Buée M, GarbayeJ, Martin F, Kües U. 2009. Phylogenetic analysis, genomicorganization and expression analysis of multicopperoxidases in the ectomycorrhizal basidiomycete Laccariabicolor. New Phytologist, 182, 736-750.
Courty PE, Pouysegur R, Buée M, Garbaye J. 2006.Laccase and phosphatase activities of the dominantectomycorrhizal types in a lowland oak forest. Soil Biologyand Biochemistry, 38, 1219-1222.
Courty PE, Pritsch K, Schloter M, Hartmann A, Garbaye J.2005. Activity profiling of ectomycorrhiza communities intwo forest soils using multiple enzymatic tests. NewPhytologist, 167, 309-319.
Cullings K, Courty PE. 2009. Saprotrophic capabilities asfunctional traits to study functional diversity and resilienceof ectomycorrjizal communities. Oecologia, 161, 661-664.
Cumming JR. 1996. Phosphate-limitation physiology inectomycorrhizal pitch pine (Pinus rigida) seedlings. TreePhysiology, 16, 977-983
Di Battista C, Selosse MA, Bouchard D, Stenström E, LeTacon F. 1996. Variations in symbiotic efficiency,phenotypic characters and ploidy level among differentisolates of the ectomycorrhizal basidiomycete Laccariabicolor strain S238. Mycological Research, 100, 1315-1324.
Dighton J. 1983. Phosphatase production by mycorrhizalfungi. Plant and Soil, 71, 455-462.
Dillen SY, Marron N, Bastien C, Ricciotti L, Salani F, SabattiM, Pinel MPC, Rae AM, Taylor G, Ceulemans R. 2007.Effects of environment and progeny on biomassestimations of five hybrid poplar families grown at threecontrasting sites across Europe. Forest Ecology andManagement, 252, 12-23.
Ezawa T, Hayatsu M, Saito M. 2005. A new hypothesis onthe strategy for acquisition of phosphorus in arbuscularmycorrhiza: up-regulation of secreted acid phosphatasegene in the host plant. Molecular Plant-MicrobeInteractions, 18, 1046-1053.
86
Frey-Klett P, Pierrat JC, Garbaye J. 1997. Location andsurvival of mycorrhiza helper Pseudomonas fluorescensduring establishment of ectomycorrhizal symbiosisbetween Laccaria bicolor and Douglas fir. Applied andEnvironmental Microbiology, 63, 139-144.Gehring CA, Mueller R, Whitham TG. 2006. Environmentaland genetic effects on the formation of ectomycorrhizaland arbuscular mycorrhizal associations in cottonwoods.Oecologia, 149, 158-164.Gehring CA, Whitham TG. 2002. Mycorrhiza-herbivoreinteractions: population and community consequences. In:van der Heijden MGA, Sanders IR (eds) Mycorrhizalecology. Springer, Berlin Heidelberg New York, pp 295-320.Jorge V, Dowkiw A, Faivre-Rampant P, Bastien C. 2005.Genetic architecture of qualitative and quantitativeMelampsora larici-populina leaf rust resistance in hybridpoplar: genetic mapping and QTL detection. NewPhytologist, 167, 113-127. Kellner H, Luis P, Zimdars D, Kiesel B, Buscot F. 2008.Diversity of laccase-like multicopper-oxidase genes inforest and grassland Cambisol soil samples. Soil Biologyand Biochemistry, 40, 638-648.Khasa DP, Hambling B, Kernaghan G, Fung M, Ngimbi E.2002. Genetic variability in salt tolerance of selectedboreal woody seedlings. Forest Ecology and Management,165, 257-269.Karst J, Jones MD, Turkington R. 2009. Ectomycorrhizalcolonization and intraspecific variation in growthresponses of lodgepole pine. Plant Ecology, 200, 161-165.Koide RT, Sharda JN, Herr JR, Malcolm GM. 2008.Ectomycorrhizal fungi and the biotrophy–saprotrophycontinuum. New Phytologist, 178, 230-233.Korkama T, Fritze H, Pakkanen A, Pennanen T. 2007.Interactions between extraradical ectomycorrhizal mycelia,microbes associated with the mycelia and growth rate ofNorway spruce (Picea abies) clones. New Phytologist, 173,798-807.Le Tacon F, Bouchard D. 1986. Effects of differentectomycorrhizal fungi on growth of larch, Douglas fir,Scots pine and Norway spruce seedlings in fumigatednursery soil. Oecologia Applicata, 7, 389-402.Li B, Wu R. 1997. Heterosis and genotype×environmentinteractions of juvenile aspens in two contrasting sites.Canadian Journal of Forest Research, 27, 1525-1537.Lindahl BD, Finlay RD, Cairney JWG. 2005. Enzymaticactivities of mycelia in mycorrhizal fungal communities. In:Dighton J, White JF, Oudemans P, eds. The fungalcommunity: its organization and role in the ecosystem, 3rdedn. Boca Raton, FL, USA: CRC Press, 331-348.Linderman RG, Davis EA. 2004. Varied response of marigold(Tagetes spp.) genotypes to inoculation with differentarbuscular mycorrhizal fungi. Scientia Horticulturae, 99,67-78.Lippman ZB, Zamir D. 2007. Heterosis: revisiting themagic. Trends in Genetics, 23, 60-66.Lojewski NR, Fischer DG, Bailey JK, Schweitzer JA,Whitham TG, Hart SC. 2009. Genetic basis of abovegroundproductivity in two native Populus species and theirhybrids. Tree Physiology, 29, 1133-1142.Lynd LR, Weimer PJ, van Zyl WH, Pretorius IS. 2002.Microbial cellulose utilization: fundamentals and
biotechnology. Microbiology Molecular Biology Review,66, 506-577.Madritch MD, Hunter MD. 2002. Phenotypic diversityinfluences ecosystem functioning in an oak sandhillscommunity. Ecology, 83, 2084-2090.Mari S, Jonsson A, Finlay R, Ericsson T, Kähr M, ErikssonG. 2003. Genetic variation in nitrogen uptake and growthin mycorrhizal and nonmycorrhizal Picea abies (L.) Karst.seedlings. Forest Science, 49, 258-267Marron N, Bastien C, Sabatti M, Taylor G, Ceulemans R.2006. Plasticity of growth and sylleptic branchiness in twopoplar families grown at three sites across Europe. TreePhysiology, 26, 935-946.Marron N, Villar M, Dreyer E, Delay D, Boudouresque E,Petit JM, Delmotte FM, Guehl JM, Brignolas F. 2005.Diversity of leaf traits related to productivity in 31 Populusdeltoides-Populus nigra clones. Tree Physiology, 25, 425-435.Martin F, Nehls U. 2009. Harnessing ectomycorrhizalgenomics for ecological insights. Current Opinion in PlantBiology, 12, 508-515.Martin F, Aerts A, Ahrén D, et al. 2008. The genomesequence of the basidiomycete fungus Laccaria bicolorprovides insights into the mycorrhizal symbiosis. Nature,452, 88-92. Monje OA, Bugbee B. 1992. Inherent limitations ofnondestructive chlorophyll meters: a comparison of twotypes of meters. Hortscience, 27, 69-71.McCaig B, Meagher RB, Dean JFD. 2005. Gene structureand molecular analysis of the laccase-like multicopperoxidase (LMCO) gene family in Arabidopsis thaliana.Planta, 221, 619-636.Nygren CMR, Rosling A. 2009. Localisation ofphosphomonoesterase activity in ectomycorrhizal fungigrown on different phosphorus sources. Mycorrhiza, 19,197-204.Peng X, Masai E, Kitayama H, Harada K, Katayama Y,Fukuda M. 2002. Characterization of the 5-carboxyvanillatedecarboxilase gene an dits role in lignin-related biphenylcatabolism in Sphingomonas paucimobilis SYK-6. Appliedand Environmental Microbiology, 68, 4407-4415.Piculell BJ, Hoeksema JD, Thompson JN. 2008.Interactions of biotic and abiotic environmental factors inan ectomycorrhizal symbiosis, and the potential forselection mosaics. BMC Biology, 6, 23.R Development Core Team. 2006. R: A Language andEnvironment for Statistical Computing. R Foundation forStatistical Computing, Vienna, Austria.Ramot O, Viterbo A, Friesem D, Oppenheim A, Chet I.2004. Regulation of two homodimer hexosaminidases inthe mycoparasitic fungus Trichoderma asperellum byglucosamine. Current Genetics, 45, 205-213.Richardson AD, Duigan SP, Berlyn GP. 2002. An estimationof non-invasive methods to estimate foliar chlorophyllcontent. New Phytologist, 153, 185-194.Rosado SCS, Kropp BR, Piche Y. 1994. Genetics ofectomycorrhizal symbiosis. I. Host plant variability andheritability of ectomycorrhizal and root traits. NewPhytologist, 126, 105-110.Schweitzer JA, Bailey JK, Fischer DG, LeRoy CJ, LonsdorfEV, Whitham TG, Hart SC. 2008. Plant-soil-microorganisminteractions: Heritable relationship between plant

87
genotype and associated soil microorganisms. Ecology,89, 773-781.
Smith SE, Read DJ. 2008. Mycorrhizal Symbiosis 3rd Ed.Academic Press, London.
Tagu D, Bastien C, Faivre-Rampant P, Garbaye J, Vion P,Villar M, Martin F. 2005. Genetic analysis of phenotypicvariation for ectomycorrhiza formation in interspecific F1poplar full-sib family. Mycorrhiza, 15, 87-91.
Tagu D, Faivre Rampant P, Lapeyrie F, Frey-Klett P, VionP, Villar M. 2001. Variation in the ability to formectomycorrhizas in the F1 progeny of an interspecificpoplar (Populus spp.) cross. Mycorrhiza, 10, 237-240.
Tonkin CM, Malajczuk N, McComb JA. 1989.Ectomycorrhizal formation by micropropagated clones ofEucalyptus marginata inoculated with isolates of Pisolithustinctorius. New Phytologist, 111, 209-214.
Tuskan GA, DiFazio S, Jansson S, et al. 2006. The genomeof black cottonwood, Populus trichocarpa. Science, 313,1596-1604.
van der Heijden M, Sanders I. 2002. Mycorrhizal ecologicalstudies. van der Heijden MGA, Sanders IR, eds. 2002.Berlin, Germany: Springer Verlag.
van der Heijden EW, Kuyper TW. 2001. Laboratoryexperiments imply the conditionality of mycorrhizalbenefits for Salix repens: role of pH and nitrogen tophosphorus ratios. Plant and Soil, 228, 275-290.
Whitham TG, Young WP, Martinsen GD, et al. 2003.Community and ecosystem genetics: a consequence ofthe extended phenotype. Ecology, 84, 559-573.
Whitham TG, DiFazio SP, Schweitzer JA, Shuster SM, AllanGJ, Bailey JK, Woolbright SA. 2008. Extending genomicsto natural communities and ecosystems. Science, 320,492-495.
88
MOLECULAR FOOTPRINTS OF LOCAL ADAPTATION IN TWO MEDITERRANEAN CONIFERS
Delphine Grivet 1; Federico Sebastiani 2, 3; Ricardo Alía 1,5;Thomas Bataillon 4; Sara Torre 3; Mario Zabal-Aguirre 1;Giovanni G. Vendramin 3; Santiago C. González-Martínez 1, 51 Department of Forest Ecology & Genetics, Center of Forest Research, CIFOR-INIA, Carretera de la Coruña km 7.5, E28040 Madrid, Spain.
2 Department of Agricultural Biotechnology, Genexpress, University of Florence,Via della Lastruccia 14, I50019 Sesto Fiorentino (FI), Italy.3 Plant Genetics Institute, Division of Florence, National Research Council, via
Madonna del Piano 10, I50019 Sesto Fiorentino (FI), Italy.
4 BiRC – Bioinformatics Research Center, Aarhus University, C.F. Møllers Allé 8,DK8000 Aarhus C, Denmark
5 Sustainable Forest Management Research Institute, University of Valladolid-INIA.
Corresponding Author:Santiago C. González-MartínezDepartment of Ecology & Genetics, Center of Forest Research, CIFOR-INIA,Carretera de la Coruña km 7.5, E28040 Madrid, Spaine-mail: [email protected]
IntroductionIdentifying candidate genes underlying geneticdifferences for adaptive traits can help to understand howspecies have adapted to their environment and to predicthow they will respond to future climatic changes, which isa special concern in regions such as the MediterraneanBasin, where a substantial decrease in precipitation and apronounced warming is expected in the near future (Petit,Hampe, and Cheddadi 2005; Giorgi and Lionello 2008).The ability to detect the footprints of natural selection inpopulation DNA sequence samples depends on the natureand the strength of the selection events (Nielsen 2005),on the evolutionary scale at which they occur (Zhai,Nielsen, and Slatkin 2009) and on the sensitivity of themethods to other evolutionary forces that can mimic
selection (e.g. demography, population structure; Biswasand Akey 2006).
Positive selection, which drives the increase in frequencyof advantageous mutations, is of particular interestbecause it underlies local adaptation. Recent or on-goingpositive selection events can be detected using methodsbased on polymorphism within species (Biswas and Akey2006; Zhai, Nielsen, and Slatkin 2009). Recently, powerfulmethods based on site- and haplotype- frequency spectrathat are relatively insensitive to demography or populationstructure have been developed (Zeng, Shi, and Wu 2007).Detecting selection events over a wider evolutionary scale(e.g. recurrent positive selection or ancient selectivesweeps), can be efficiently done using methodscontrasting within species polymorphism with amongspecies divergence, as these methods are less sensitive to
This study combines neutrality tests and environmental correlations to identify non-neutral patternsof evolution in candidate genes related to drought stress in two closely-related Mediterraneanconifers, Pinus pinaster Ait. and Pinus halepensis Mill. Based on previous studies, we selected 12amplicons covering six candidate genes that were sequenced in a large sample spanning the full rangeof these two species. Neutrality tests relatively robust to demography (DHEW compound test andML-HKA test) were used to detect selection events at different temporal scales. Environmentalassociations between variation at candidate genes and climatic variables were also examined. Thesecombined approaches detected distinct genes that may be targeted by selection, most of themspecific to only one of the two conifers, despite their recent divergence (< 10 Ma). An exception was4-coumarate: CoA ligase (4cl), a gene involved in the production of various important secondaryproducts that appeared to play a role in local adaptation processes of both pines. Another remarkableresult was that all significant environmental correlations involved temperature indices, highlightingthe importance of this climatic factor as a selective driver on Mediterranean pines. The ability todetect natural selection at the DNA sequence level depends on the nature and the strength of theselection events, on the timescale at which they occurred and on the sensitivity of the methods toother evolutionary forces that can mimic selection (e.g. demography, population structure). Usingcomplementary approaches can help to capture different aspects of the evolutionary processes thatgovern molecular variation at both intra- and interspecific levels.
Key words: Natural selection, neutrality tests, environmental associations, candidate genes, drought stress, 4cl.
Published in Molecular Biology and Evolution (2011) 28: 101-116, with doi:10.1093/molbev/msq190
Tables S1, S2, S3, S4, S5, S6, S7 and S8, and Figures S1, S2 and S3, along with the corresponding supporting informationlegends and references, can be downloaded here: http://mbe.oxfordjournals.org/content/28/1/101/suppl/DC1
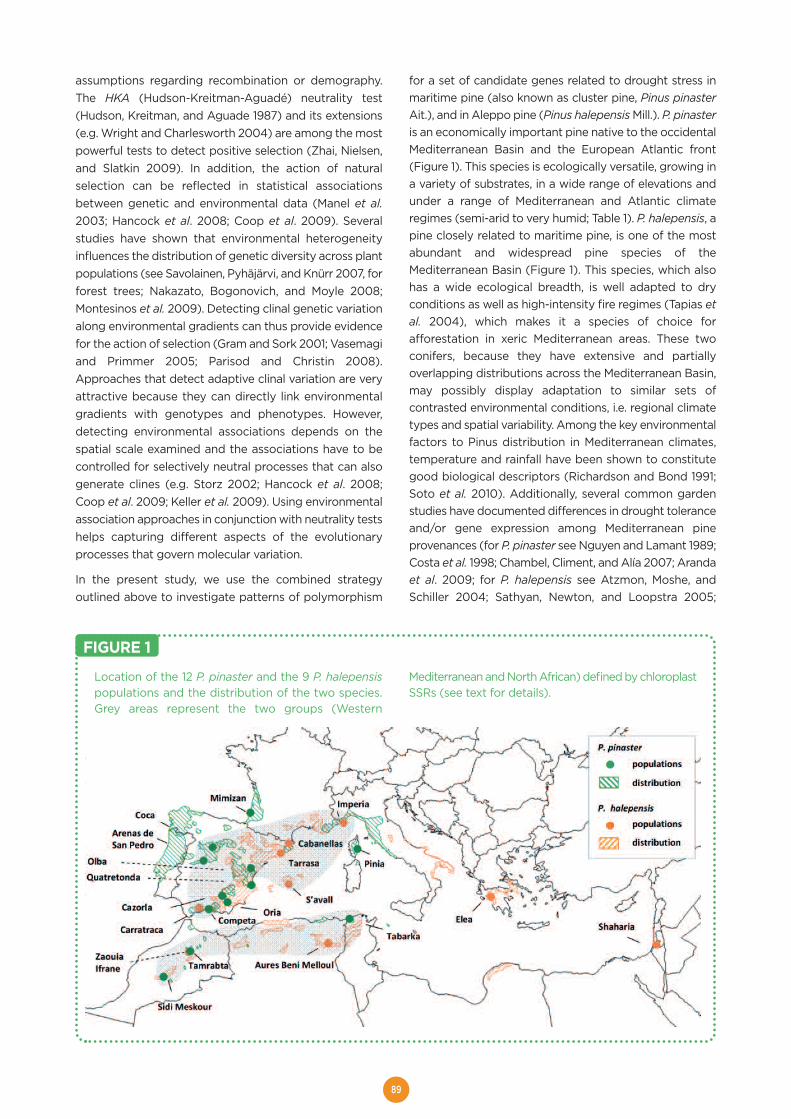
89
assumptions regarding recombination or demography.The HKA (Hudson-Kreitman-Aguadé) neutrality test(Hudson, Kreitman, and Aguade 1987) and its extensions(e.g. Wright and Charlesworth 2004) are among the mostpowerful tests to detect positive selection (Zhai, Nielsen,and Slatkin 2009). In addition, the action of naturalselection can be reflected in statistical associationsbetween genetic and environmental data (Manel et al.2003; Hancock et al. 2008; Coop et al. 2009). Severalstudies have shown that environmental heterogeneityinfluences the distribution of genetic diversity across plantpopulations (see Savolainen, Pyhäjärvi, and Knürr 2007, forforest trees; Nakazato, Bogonovich, and Moyle 2008;Montesinos et al. 2009). Detecting clinal genetic variationalong environmental gradients can thus provide evidencefor the action of selection (Gram and Sork 2001; Vasemagiand Primmer 2005; Parisod and Christin 2008).Approaches that detect adaptive clinal variation are veryattractive because they can directly link environmentalgradients with genotypes and phenotypes. However,detecting environmental associations depends on thespatial scale examined and the associations have to becontrolled for selectively neutral processes that can alsogenerate clines (e.g. Storz 2002; Hancock et al. 2008;Coop et al. 2009; Keller et al. 2009). Using environmentalassociation approaches in conjunction with neutrality testshelps capturing different aspects of the evolutionaryprocesses that govern molecular variation.
In the present study, we use the combined strategyoutlined above to investigate patterns of polymorphism
for a set of candidate genes related to drought stress inmaritime pine (also known as cluster pine, Pinus pinasterAit.), and in Aleppo pine (Pinus halepensis Mill.). P. pinasteris an economically important pine native to the occidentalMediterranean Basin and the European Atlantic front(Figure 1). This species is ecologically versatile, growing ina variety of substrates, in a wide range of elevations andunder a range of Mediterranean and Atlantic climateregimes (semi-arid to very humid; Table 1). P. halepensis, apine closely related to maritime pine, is one of the mostabundant and widespread pine species of theMediterranean Basin (Figure 1). This species, which alsohas a wide ecological breadth, is well adapted to dryconditions as well as high-intensity fire regimes (Tapias etal. 2004), which makes it a species of choice forafforestation in xeric Mediterranean areas. These twoconifers, because they have extensive and partiallyoverlapping distributions across the Mediterranean Basin,may possibly display adaptation to similar sets ofcontrasted environmental conditions, i.e. regional climatetypes and spatial variability. Among the key environmentalfactors to Pinus distribution in Mediterranean climates,temperature and rainfall have been shown to constitutegood biological descriptors (Richardson and Bond 1991;Soto et al. 2010). Additionally, several common gardenstudies have documented differences in drought toleranceand/or gene expression among Mediterranean pineprovenances (for P. pinaster see Nguyen and Lamant 1989;Costa et al. 1998; Chambel, Climent, and Alía 2007; Arandaet al. 2009; for P. halepensis see Atzmon, Moshe, andSchiller 2004; Sathyan, Newton, and Loopstra 2005;
Location of the 12 P. pinaster and the 9 P. halepensispopulations and the distribution of the two species.Grey areas represent the two groups (Western
Mediterranean and North African) defined by chloroplastSSRs (see text for details).
FIGURE 1
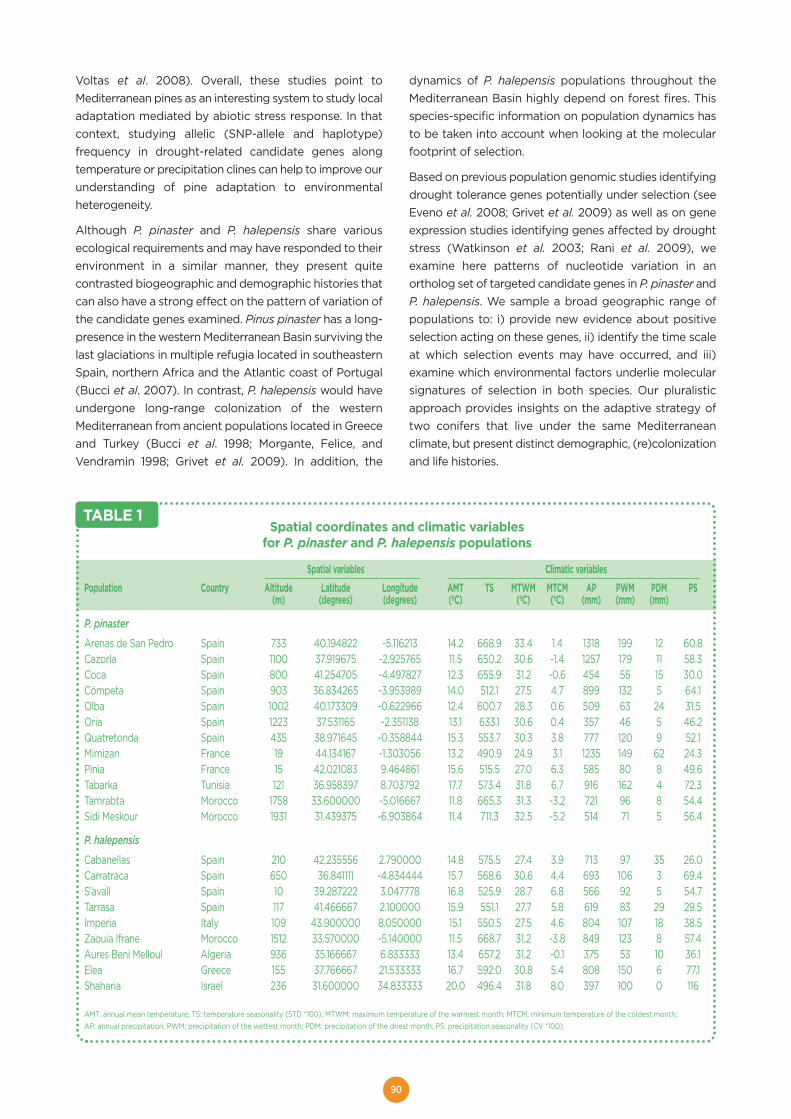
90
Voltas et al. 2008). Overall, these studies point toMediterranean pines as an interesting system to study localadaptation mediated by abiotic stress response. In thatcontext, studying allelic (SNP-allele and haplotype)frequency in drought-related candidate genes alongtemperature or precipitation clines can help to improve ourunderstanding of pine adaptation to environmentalheterogeneity.
Although P. pinaster and P. halepensis share variousecological requirements and may have responded to theirenvironment in a similar manner, they present quitecontrasted biogeographic and demographic histories thatcan also have a strong effect on the pattern of variation ofthe candidate genes examined. Pinus pinaster has a long-presence in the western Mediterranean Basin surviving thelast glaciations in multiple refugia located in southeasternSpain, northern Africa and the Atlantic coast of Portugal(Bucci et al. 2007). In contrast, P. halepensis would haveundergone long-range colonization of the westernMediterranean from ancient populations located in Greeceand Turkey (Bucci et al. 1998; Morgante, Felice, andVendramin 1998; Grivet et al. 2009). In addition, the
dynamics of P. halepensis populations throughout theMediterranean Basin highly depend on forest fires. Thisspecies-specific information on population dynamics hasto be taken into account when looking at the molecularfootprint of selection.
Based on previous population genomic studies identifyingdrought tolerance genes potentially under selection (seeEveno et al. 2008; Grivet et al. 2009) as well as on geneexpression studies identifying genes affected by droughtstress (Watkinson et al. 2003; Rani et al. 2009), weexamine here patterns of nucleotide variation in anortholog set of targeted candidate genes in P. pinaster andP. halepensis. We sample a broad geographic range ofpopulations to: i) provide new evidence about positiveselection acting on these genes, ii) identify the time scaleat which selection events may have occurred, and iii)examine which environmental factors underlie molecularsignatures of selection in both species. Our pluralisticapproach provides insights on the adaptive strategy oftwo conifers that live under the same Mediterraneanclimate, but present distinct demographic, (re)colonizationand life histories.
Spatial coordinates and climatic variablesfor P. pinaster and P. halepensis populations
Spatial variables Climatic variablesPopulation Country Altitude Latitude Longitude AMT TS MTWM MTCM AP PWM PDM PS
(m) (degrees) (degrees) (ºC) (ºC) (ºC) (mm) (mm) (mm)
P. pinaster
Arenas de San Pedro Spain 733 40.194822 -5.116213 14.2 668.9 33.4 1.4 1318 199 12 60.8Cazorla Spain 1100 37.919675 -2.925765 11.5 650.2 30.6 -1.4 1257 179 11 58.3Coca Spain 800 41.254705 -4.497827 12.3 655.9 31.2 -0.6 454 55 15 30.0Cómpeta Spain 903 36.834265 -3.953989 14.0 512.1 27.5 4.7 899 132 5 64.1Olba Spain 1002 40.173309 -0.622966 12.4 600.7 28.3 0.6 509 63 24 31.5Oria Spain 1223 37.531165 -2.351138 13.1 633.1 30.6 0.4 357 46 5 46.2Quatretonda Spain 435 38.971645 -0.358844 15.3 553.7 30.3 3.8 777 120 9 52.1Mimizan France 19 44.134167 -1.303056 13.2 490.9 24.9 3.1 1235 149 62 24.3Pinia France 15 42.021083 9.464861 15.6 515.5 27.0 6.3 585 80 8 49.6Tabarka Tunisia 121 36.958397 8.703792 17.7 573.4 31.8 6.7 916 162 4 72.3Tamrabta Morocco 1758 33.600000 -5.016667 11.8 665.3 31.3 -3.2 721 96 8 54.4Sidi Meskour Morocco 1931 31.439375 -6.903864 11.4 711.3 32.5 -5.2 514 71 5 56.4
P. halepensis
Cabanellas Spain 210 42.235556 2.790000 14.8 575.5 27.4 3.9 713 97 35 26.0Carratraca Spain 650 36.841111 -4.834444 15.7 568.6 30.6 4.4 693 106 3 69.4S’avall Spain 10 39.287222 3.047778 16.8 525.9 28.7 6.8 566 92 5 54.7Tarrasa Spain 117 41.466667 2.100000 15.9 551.1 27.7 5.8 619 83 29 29.5Imperia Italy 109 43.900000 8.050000 15.1 550.5 27.5 4.6 804 107 18 38.5Zaouia Ifrane Morocco 1512 33.570000 -5.140000 11.5 668.7 31.2 -3.8 849 123 8 57.4Aures Beni Melloul Algeria 936 35.166667 6.833333 13.4 657.2 31.2 -0.1 375 53 10 36.1Elea Greece 155 37.766667 21.533333 16.7 592.0 30.8 5.4 808 150 6 77.1Shaharia Israel 236 31.600000 34.833333 20.0 496.4 31.8 8.0 397 100 0 116
AMT: annual mean temperature; TS: temperature seasonality (STD *100); MTWM: maximum temperature of the warmest month; MTCM: minimum temperature of the coldest month;AP: annual precipitation; PWM: precipitation of the wettest month; PDM: precipitation of the driest month; PS: precipitation seasonality (CV *100).
TABLE 1
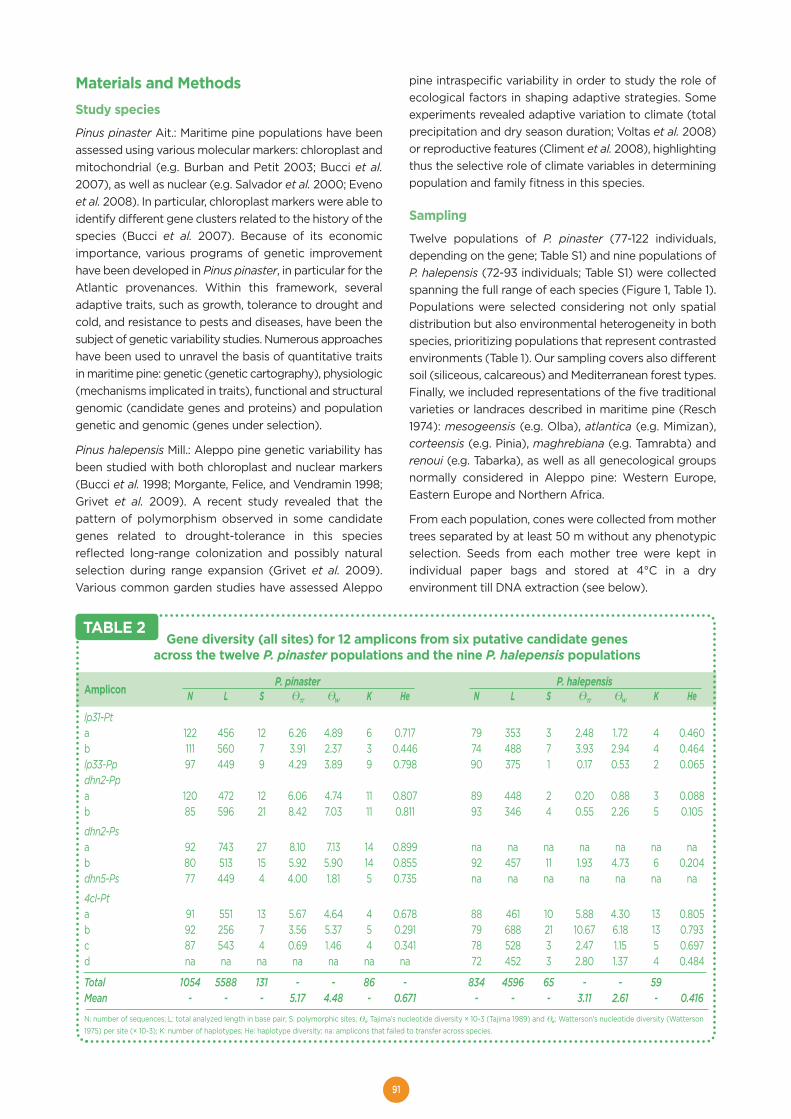
91
Materials and MethodsStudy species
Pinus pinaster Ait.: Maritime pine populations have beenassessed using various molecular markers: chloroplast andmitochondrial (e.g. Burban and Petit 2003; Bucci et al.2007), as well as nuclear (e.g. Salvador et al. 2000; Evenoet al. 2008). In particular, chloroplast markers were able toidentify different gene clusters related to the history of thespecies (Bucci et al. 2007). Because of its economicimportance, various programs of genetic improvementhave been developed in Pinus pinaster, in particular for theAtlantic provenances. Within this framework, severaladaptive traits, such as growth, tolerance to drought andcold, and resistance to pests and diseases, have been thesubject of genetic variability studies. Numerous approacheshave been used to unravel the basis of quantitative traitsin maritime pine: genetic (genetic cartography), physiologic(mechanisms implicated in traits), functional and structuralgenomic (candidate genes and proteins) and populationgenetic and genomic (genes under selection).
Pinus halepensis Mill.: Aleppo pine genetic variability hasbeen studied with both chloroplast and nuclear markers(Bucci et al. 1998; Morgante, Felice, and Vendramin 1998;Grivet et al. 2009). A recent study revealed that thepattern of polymorphism observed in some candidategenes related to drought-tolerance in this speciesreflected long-range colonization and possibly naturalselection during range expansion (Grivet et al. 2009).Various common garden studies have assessed Aleppo
pine intraspecific variability in order to study the role ofecological factors in shaping adaptive strategies. Someexperiments revealed adaptive variation to climate (totalprecipitation and dry season duration; Voltas et al. 2008)or reproductive features (Climent et al. 2008), highlightingthus the selective role of climate variables in determiningpopulation and family fitness in this species.
Sampling
Twelve populations of P. pinaster (77-122 individuals,depending on the gene; Table S1) and nine populations ofP. halepensis (72-93 individuals; Table S1) were collectedspanning the full range of each species (Figure 1, Table 1).Populations were selected considering not only spatialdistribution but also environmental heterogeneity in bothspecies, prioritizing populations that represent contrastedenvironments (Table 1). Our sampling covers also differentsoil (siliceous, calcareous) and Mediterranean forest types.Finally, we included representations of the five traditionalvarieties or landraces described in maritime pine (Resch1974): mesogeensis (e.g. Olba), atlantica (e.g. Mimizan),corteensis (e.g. Pinia), maghrebiana (e.g. Tamrabta) andrenoui (e.g. Tabarka), as well as all genecological groupsnormally considered in Aleppo pine: Western Europe,Eastern Europe and Northern Africa.
From each population, cones were collected from mothertrees separated by at least 50 m without any phenotypicselection. Seeds from each mother tree were kept inindividual paper bags and stored at 4°C in a dryenvironment till DNA extraction (see below).
Gene diversity (all sites) for 12 amplicons from six putative candidate genesacross the twelve P. pinaster populations and the nine P. halepensis populations
P. pinaster P. halepensisAmplicon N L S �� �w K He N L S �� �w K He
lp31-Pta 122 456 12 6.26 4.89 6 0.717 79 353 3 2.48 1.72 4 0.460b 111 560 7 3.91 2.37 3 0.446 74 488 7 3.93 2.94 4 0.464lp33-Pp 97 449 9 4.29 3.89 9 0.798 90 375 1 0.17 0.53 2 0.065dhn2-Ppa 120 472 12 6.06 4.74 11 0.807 89 448 2 0.20 0.88 3 0.088b 85 596 21 8.42 7.03 11 0.811 93 346 4 0.55 2.26 5 0.105
dhn2-Psa 92 743 27 8.10 7.13 14 0.899 na na na na na na nab 80 513 15 5.92 5.90 14 0.855 92 457 11 1.93 4.73 6 0.204dhn5-Ps 77 449 4 4.00 1.81 5 0.735 na na na na na na na
4cl-Pta 91 551 13 5.67 4.64 4 0.678 88 461 10 5.88 4.30 13 0.805b 92 256 7 3.56 5.37 5 0.291 79 688 21 10.67 6.18 13 0.793c 87 543 4 0.69 1.46 4 0.341 78 528 3 2.47 1.15 5 0.697d na na na na na na na 72 452 3 2.80 1.37 4 0.484
Total 1054 5588 131 - - 86 - 834 4596 65 - - 59Mean - - - 5.17 4.48 - 0.671 - - - 3.11 2.61 - 0.416
N: number of sequences; L: total analyzed length in base pair; S: polymorphic sites; ��: Tajima’s nucleotide diversity × 10-3 (Tajima 1989) and �w: Watterson’s nucleotide diversity (Watterson1975) per site (× 10-3); K: number of haplotypes; He: haplotype diversity; na: amplicons that failed to transfer across species.
TABLE 2
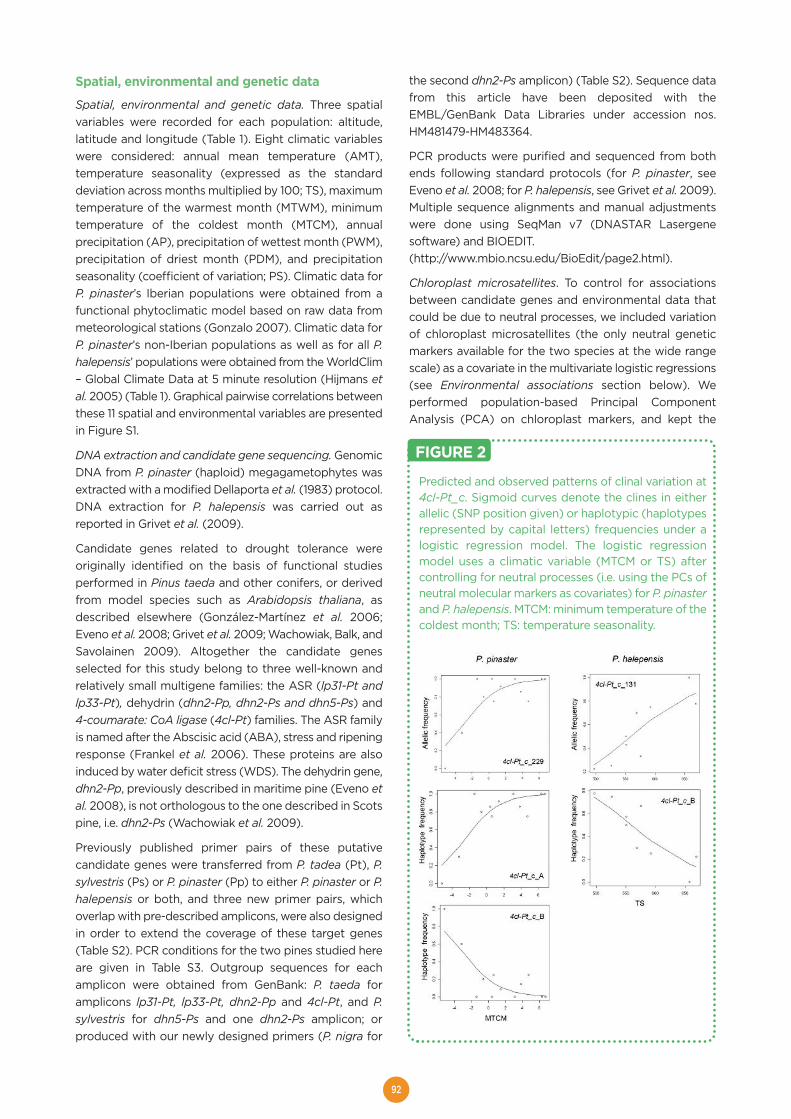
92
Spatial, environmental and genetic data
Spatial, environmental and genetic data. Three spatialvariables were recorded for each population: altitude,latitude and longitude (Table 1). Eight climatic variableswere considered: annual mean temperature (AMT),temperature seasonality (expressed as the standarddeviation across months multiplied by 100; TS), maximumtemperature of the warmest month (MTWM), minimumtemperature of the coldest month (MTCM), annualprecipitation (AP), precipitation of wettest month (PWM),precipitation of driest month (PDM), and precipitationseasonality (coefficient of variation; PS). Climatic data forP. pinaster’s Iberian populations were obtained from afunctional phytoclimatic model based on raw data frommeteorological stations (Gonzalo 2007). Climatic data forP. pinaster’s non-Iberian populations as well as for all P.halepensis’ populations were obtained from the WorldClim– Global Climate Data at 5 minute resolution (Hijmans etal. 2005) (Table 1). Graphical pairwise correlations betweenthese 11 spatial and environmental variables are presentedin Figure S1.
DNA extraction and candidate gene sequencing. GenomicDNA from P. pinaster (haploid) megagametophytes wasextracted with a modified Dellaporta et al. (1983) protocol.DNA extraction for P. halepensis was carried out asreported in Grivet et al. (2009).
Candidate genes related to drought tolerance wereoriginally identified on the basis of functional studiesperformed in Pinus taeda and other conifers, or derivedfrom model species such as Arabidopsis thaliana, asdescribed elsewhere (González-Martínez et al. 2006;Eveno et al. 2008; Grivet et al. 2009; Wachowiak, Balk, andSavolainen 2009). Altogether the candidate genesselected for this study belong to three well-known andrelatively small multigene families: the ASR (lp31-Pt andlp33-Pt), dehydrin (dhn2-Pp, dhn2-Ps and dhn5-Ps) and4-coumarate: CoA ligase (4cl-Pt) families. The ASR familyis named after the Abscisic acid (ABA), stress and ripeningresponse (Frankel et al. 2006). These proteins are alsoinduced by water deficit stress (WDS). The dehydrin gene,dhn2-Pp, previously described in maritime pine (Eveno etal. 2008), is not orthologous to the one described in Scotspine, i.e. dhn2-Ps (Wachowiak et al. 2009).
Previously published primer pairs of these putativecandidate genes were transferred from P. tadea (Pt), P.sylvestris (Ps) or P. pinaster (Pp) to either P. pinaster or P.halepensis or both, and three new primer pairs, whichoverlap with pre-described amplicons, were also designedin order to extend the coverage of these target genes(Table S2). PCR conditions for the two pines studied hereare given in Table S3. Outgroup sequences for eachamplicon were obtained from GenBank: P. taeda foramplicons lp31-Pt, lp33-Pt, dhn2-Pp and 4cl-Pt, and P.sylvestris for dhn5-Ps and one dhn2-Ps amplicon; orproduced with our newly designed primers (P. nigra for
the second dhn2-Ps amplicon) (Table S2). Sequence datafrom this article have been deposited with theEMBL/GenBank Data Libraries under accession nos.HM481479-HM483364.
PCR products were purified and sequenced from bothends following standard protocols (for P. pinaster, seeEveno et al. 2008; for P. halepensis, see Grivet et al. 2009).Multiple sequence alignments and manual adjustmentswere done using SeqMan v7 (DNASTAR Lasergenesoftware) and BIOEDIT.(http://www.mbio.ncsu.edu/BioEdit/page2.html).
Chloroplast microsatellites. To control for associationsbetween candidate genes and environmental data thatcould be due to neutral processes, we included variationof chloroplast microsatellites (the only neutral geneticmarkers available for the two species at the wide rangescale) as a covariate in the multivariate logistic regressions(see Environmental associations section below). Weperformed population-based Principal ComponentAnalysis (PCA) on chloroplast markers, and kept the
Predicted and observed patterns of clinal variation at4cl-Pt_c. Sigmoid curves denote the clines in eitherallelic (SNP position given) or haplotypic (haplotypesrepresented by capital letters) frequencies under alogistic regression model. The logistic regressionmodel uses a climatic variable (MTCM or TS) aftercontrolling for neutral processes (i.e. using the PCs ofneutral molecular markers as covariates) for P. pinasterand P. halepensis. MTCM: minimum temperature of thecoldest month; TS: temperature seasonality.
FIGURE 2

93
Principal Components (PCs) that explained the majority
of the overall inertia of the data. For P. pinaster, the three
first PCs of the 16 most common haplotypes (determined
on the basis of five chloroplast microsatellites) –
accounting for 74% of the overall variation – were
extracted from the lattice dataset (430 records X 16
variables) of Bucci et al. (2007). For populations that did
not match any of the 430 locations in this lattice, the mean
of the closest 3-4 locations was computed (Table S4). For
P. halepensis, PCs were computed in R (R Development
Core Team) for each of the nine populations based on the
22 haplotypes determined from three chloroplast
microsatellites (our unpublished data) and the three first
PCs, which explain 82% of the overall variation, were used
for subsequent analysis (Table S4).
Chloroplast microsatellites were also used to determinegroups with similar evolutionary history to conductneutrality tests (Figure 1). A previous study based onchloroplast microsatellites pointed at eight gene pools inP. pinaster (Bucci et al. 2007). Within the sampling used inthe present study, Mimizan (Continental French lineage)and Pinia (Northern Italy and Corsican lineages) representsingle lineages. Tabarka (Tunisia), Tamrabta (MoroccanMiddle Atlas) and Sidi Meskour (Moroccan High Atlas) areall part of a North African lineage that combines westernand eastern African origins. The rest of P. pinasterpopulations sampled are part of a wide WesternMediterranean linage, except for Quatretonda and Oriathat are considered marginal populations and may thuspresent a distinct evolutionary history (González-Martínezet al. 2007a; Eveno et al. 2008). In P. halepensis, eastern
Polymorphism, divergence and neutrality tests (silent sites) in P. pinasterfor the phylogeographical groups defined with chloroplast microsatellites (see text for details).
Amplicon S D HnormDHEW ML-HKA’s K Ks ML-HKA’s K Ks
P-value (P. taeda) (P. taeda) (P. halepensis) (P. halepensis)Western Mediterranean alp31-Pta 8 2.172 -0.635 0.958 0.961 38.350 1.292 20.310b 6 1.834 -1.380 0.913 0.698 44.250 0.720 24.360lp33-Pp 6 1.133 0.911 0.984 0.696 60.060 1.839 15.990dhn2-Ppa 7 0.269 -0.853 0.406 1.605 38.160 1.307 31.580b 19 0.186 0.825 0.727 3.256 * 31.940 1.975 39.720dhn2-Psa 15 0.631 0.703 0.562 ptna ptna phna phnab 8 -0.126 0.232 0.209 ptna ptna d ddhn5-Ps 2 1.960
0.136 0.907 ptna ptna phna phna4cl-Pta 2 0.422 0.067 0.610 0.307 31.480 0.250 26.870b 2 -1.041 -3.173 * 0.014 * 0.741 43.930 0.446 41.220c 1 0.214 0.565 0.663 0.542 23.080 0.000 1.190d na na na na na na na naNorth Africa blp31-Pta 7 -0.276 -3.065 * 0.336 0.878 39.300 0.952 22.280b 6 -2.046 * -3.813 ** 0.073 0.820 44.250 0.880 26.150lp33-Pp 5 0.014 0.926 0.899 0.614 57.860 1.946 13.040dhn2-Ppa 4 0.799 -0.554 0.615 0.868 36.610 0.792 28.620b 13 1.095 0.361 0.718 2.036 32.780 1.362 33.600dhn2-Psa 6 0.190 -0.232 0.322 ptna ptna phna phnab 6 -1.116 -1.223 0.085 ptna ptna d ddhn5-Ps 2 0.688 -0.809 0.540 ptna ptna phna phna4cl-Pta 8 2.797 0.411 0.995 1.279 39.160 0.442 28.880b 3 2.266 0.090 0.982 1.303 48.190 1.017 34.730c 2 0.201 0.387 0.494 1.039 25.240 0.000 3.410d na na na na na na na na
D: Tajima’s D (Tajima 1989); Hnorm: Fay and Wu’s normalized H (Zeng et al. 2006); DHEW test: compound test (Zeng et al. 2007); ML-HKA’s K: Selection parameter of the Maximum-Likelihoodmultilocus Hudson-Kreitman-Aguadé neutrality tests (Wright and Charlesworth 2004); the species used as outgroup is given in parenthesis; S: number of segregating sites; Ks: averageproportion of nucleotide differences between species per silent site ×10-3.na: amplicons that failed to transfer across species; ptna: P. taeda outgroup sequence not available; phna: P. halepensis outgroup sequence not available; d: discarded because possibleparalog.P-values [P neutrality test (neutral) ≤ P neutrality test (observed)]: 0 < *** < 0.001 < ** < 0.01 < * < 0.05 a Western Mediterranean: Arenas de San Pedro, Cazorla, Coca, Cómpeta and Olba.b North Africa: Tabarka, Tamrabta and Sidi Meskour.
TABLE 3a
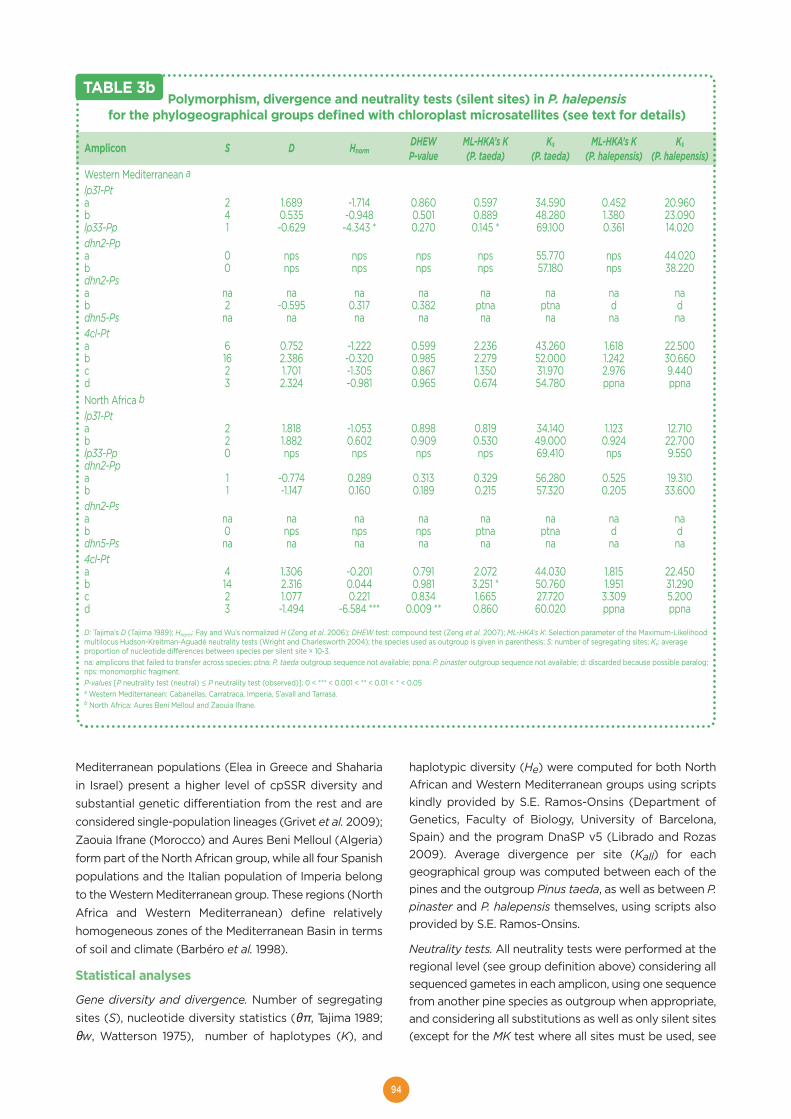
94
Mediterranean populations (Elea in Greece and Shahariain Israel) present a higher level of cpSSR diversity andsubstantial genetic differentiation from the rest and areconsidered single-population lineages (Grivet et al. 2009);Zaouia Ifrane (Morocco) and Aures Beni Melloul (Algeria)form part of the North African group, while all four Spanishpopulations and the Italian population of Imperia belongto the Western Mediterranean group. These regions (NorthAfrica and Western Mediterranean) define relativelyhomogeneous zones of the Mediterranean Basin in termsof soil and climate (Barbéro et al. 1998).
Statistical analyses
Gene diversity and divergence. Number of segregatingsites (S), nucleotide diversity statistics (θπ, Tajima 1989;θw, Watterson 1975), number of haplotypes (K), and
haplotypic diversity (He) were computed for both NorthAfrican and Western Mediterranean groups using scriptskindly provided by S.E. Ramos-Onsins (Department ofGenetics, Faculty of Biology, University of Barcelona,Spain) and the program DnaSP v5 (Librado and Rozas2009). Average divergence per site (Kall) for eachgeographical group was computed between each of thepines and the outgroup Pinus taeda, as well as between P.pinaster and P. halepensis themselves, using scripts alsoprovided by S.E. Ramos-Onsins.
Neutrality tests. All neutrality tests were performed at theregional level (see group definition above) considering allsequenced gametes in each amplicon, using one sequencefrom another pine species as outgroup when appropriate,and considering all substitutions as well as only silent sites(except for the MK test where all sites must be used, see
Polymorphism, divergence and neutrality tests (silent sites) in P. halepensisfor the phylogeographical groups defined with chloroplast microsatellites (see text for details)
Amplicon S D HnormDHEW ML-HKA’s K Ks ML-HKA’s K Ks
P-value (P. taeda) (P. taeda) (P. halepensis) (P. halepensis)Western Mediterranean alp31-Pta 2 1.689 -1.714 0.860 0.597 34.590 0.452 20.960b 4 0.535 -0.948 0.501 0.889 48.280 1.380 23.090lp33-Pp 1 -0.629 -4.343 * 0.270 0.145 * 69.100 0.361 14.020dhn2-Ppa 0 nps nps nps nps 55.770 nps 44.020b 0 nps nps nps nps 57.180 nps 38.220dhn2-Psa na na na na na na na nab 2 -0.595 0.317 0.382 ptna ptna d ddhn5-Ps na na na na na na na na4cl-Pta 6 0.752 -1.222 0.599 2.236 43.260 1.618 22.500b 16 2.386 -0.320 0.985 2.279 52.000 1.242 30.660c 2 1.701 -1.305 0.867 1.350 31.970 2.976 9.440d 3 2.324 -0.981 0.965 0.674 54.780 ppna ppnaNorth Africa blp31-Pta 2 1.818 -1.053 0.898 0.819 34.140 1.123 12.710b 2 1.882 0.602 0.909 0.530 49.000 0.924 22.700lp33-Pp 0 nps nps nps nps 69.410 nps 9.550dhn2-Ppa 1 -0.774 0.289 0.313 0.329 56.280 0.525 19.310b 1 -1.147 0.160 0.189 0.215 57.320 0.205 33.600dhn2-Psa na na na na na na na nab 0 nps nps nps ptna ptna d ddhn5-Ps na na na na na na na na4cl-Pta 4 1.306 -0.201 0.791 2.072 44.030 1.815 22.450b 14 2.316 0.044 0.981 3.251 * 50.760 1.951 31.290c 2 1.077 0.221 0.834 1.665 27.720 3.309 5.200d 3 -1.494 -6.584 *** 0.009 ** 0.860 60.020 ppna ppna
D: Tajima’s D (Tajima 1989); Hnorm: Fay and Wu’s normalized H (Zeng et al. 2006); DHEW test: compound test (Zeng et al. 2007); ML-HKA’s K: Selection parameter of the Maximum-Likelihoodmultilocus Hudson-Kreitman-Aguadé neutrality tests (Wright and Charlesworth 2004); the species used as outgroup is given in parenthesis; S: number of segregating sites; Ks: averageproportion of nucleotide differences between species per silent site × 10-3.na: amplicons that failed to transfer across species; ptna: P. taeda outgroup sequence not available; ppna: P. pinaster outgroup sequence not available; d: discarded because possible paralog;nps: monomorphic fragment.P-values [P neutrality test (neutral) ≤ P neutrality test (observed)]: 0 < *** < 0.001 < ** < 0.01 < * < 0.05 a Western Mediterranean: Cabanellas, Carratraca, Imperia, S’avall and Tarrasa. b North Africa: Aures Beni Melloul and Zaouia Ifrane.
TABLE 3b
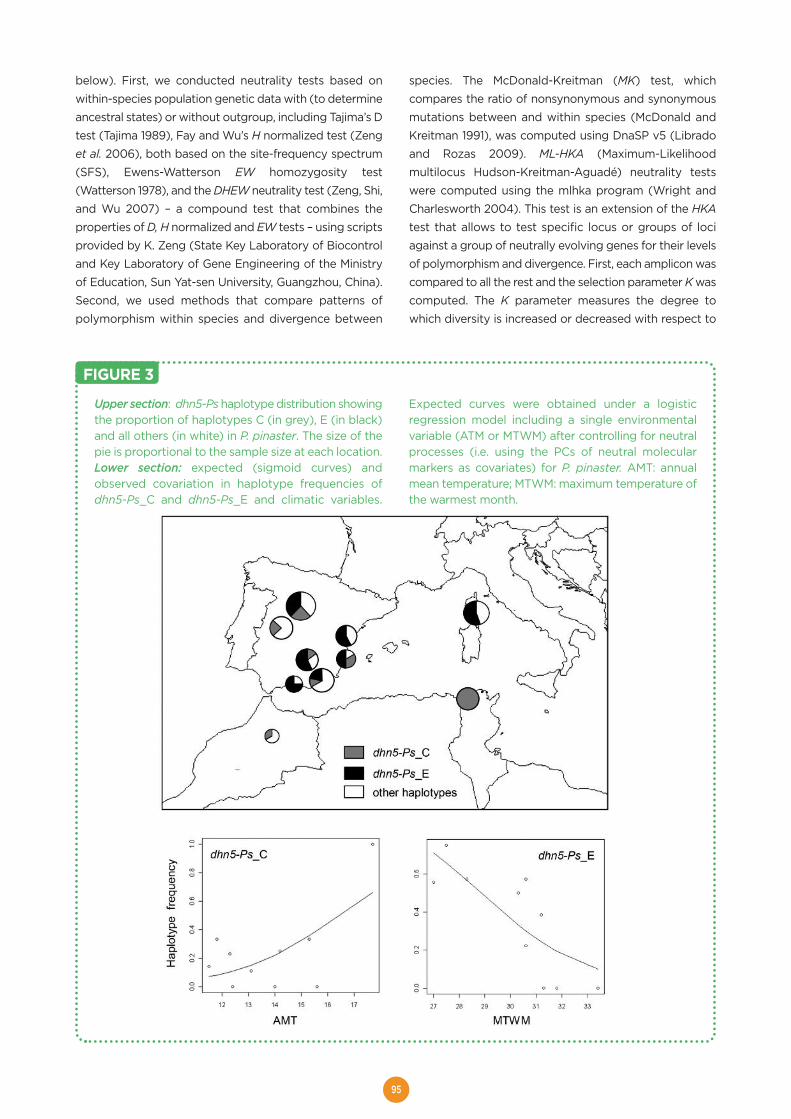
95
below). First, we conducted neutrality tests based onwithin-species population genetic data with (to determineancestral states) or without outgroup, including Tajima’s Dtest (Tajima 1989), Fay and Wu’s H normalized test (Zenget al. 2006), both based on the site-frequency spectrum(SFS), Ewens-Watterson EW homozygosity test(Watterson 1978), and the DHEW neutrality test (Zeng, Shi,and Wu 2007) – a compound test that combines theproperties of D, H normalized and EW tests – using scriptsprovided by K. Zeng (State Key Laboratory of Biocontroland Key Laboratory of Gene Engineering of the Ministryof Education, Sun Yat-sen University, Guangzhou, China).Second, we used methods that compare patterns ofpolymorphism within species and divergence between
species. The McDonald-Kreitman (MK) test, whichcompares the ratio of nonsynonymous and synonymousmutations between and within species (McDonald andKreitman 1991), was computed using DnaSP v5 (Libradoand Rozas 2009). ML-HKA (Maximum-Likelihoodmultilocus Hudson-Kreitman-Aguadé) neutrality testswere computed using the mlhka program (Wright andCharlesworth 2004). This test is an extension of the HKAtest that allows to test specific locus or groups of lociagainst a group of neutrally evolving genes for their levelsof polymorphism and divergence. First, each amplicon wascompared to all the rest and the selection parameter K wascomputed. The K parameter measures the degree towhich diversity is increased or decreased with respect to
Upper section: dhn5-Ps haplotype distribution showingthe proportion of haplotypes C (in grey), E (in black)and all others (in white) in P. pinaster. The size of thepie is proportional to the sample size at each location.Lower section: expected (sigmoid curves) andobserved covariation in haplotype frequencies ofdhn5-Ps_C and dhn5-Ps_E and climatic variables.
Expected curves were obtained under a logisticregression model including a single environmentalvariable (ATM or MTWM) after controlling for neutralprocesses (i.e. using the PCs of neutral molecularmarkers as covariates) for P. pinaster. AMT: annualmean temperature; MTWM: maximum temperature ofthe warmest month.
FIGURE 3
96
divergence. Second, for significant tests, the analysis wasrepeated considering only amplicons from different genesin order to avoid potential linkage. All runs consisted in100,000 cycles of the Markov chain; long runs of1,000,000 cycles were also computed for significant testsas well as different starting values for the divergence timeparameter (T). However, no differences were found in theresults and only basic runs are presented here. Standardlikelihood ratio tests (LRTs) were used to compare amongmodels considering one amplicon under selection at atime and the null model of no selection (degrees offreedom equal one). The ML-HKA test was performedusing different outgroups to gain insights on evolutionarytimes at which positive selective wave(s) may have takenplace: i) with P. taeda as outgroup for both P. pinaster andP. halepensis amplicons. In this case, the time frame wouldcorrespond to the split between the Trifoliae section (towhich P. taeda belongs) and the Pinus section (to whichthe Mediterranean pines belong) in the Oligocene (~25 Ma;Gernandt et al. 2005; Gernandt et al. 2008). Threeamplicons were discarded from these analyses becausethey had P. sylvestris or P. nigra as outgroups (two fromdhn2-Ps, and one from dhn5-Ps); ii) with P. halepensis asoutgroup for P. pinaster amplicons and P. pinaster asoutgroup for P. halepensis amplicons. The time frame, inthis case, would correspond to the diversification ofMediterranean pines (in the Miocene, ~10 Ma; Gernandt etal. 2008). One amplicon was discarded from this series oftests (dhn2-Ps_b; see Table S2 for amplicon nomenclature)due to bad alignment between species and, thus, thepossible amplification of a paralogous fragment in P.halepensis (dhn2-Ps_b from P. halepensis had moresimilarity with the outgroup, P. nigra, than with its closerelative P. pinaster).
Environmental associations. We tested if SNP-allele orhaplotype frequencies at candidate loci correlated withclimatic variables using logistic regression. We first carriedout series of univariate logistic regressions to test forassociation between SNP/haplotype frequencies andenvironmental variables using the program SAM (Joost,Kalbermatten, and Bonin 2008). We considered acorrelation as significant only when two likelihood ratiotests (G and Wald tests) rejected the null hypothesis of noassociation between the genetic and the environmentalvariables (at the 5% level). A strict Bonferroni correctionwas applied to correct for multiple testing of univariatemodels.
In a second step, whenever a SNP/haplotype was foundsignificantly correlated with an environmental variable, weperformed a multivariate logistic regression using neutralmarker PCs (see above) as covariates (together with theSNP and the environmental variables) to control for neutralprocesses (e.g. postglacial migrations, geographicalisolation) that may have also generated clines in theabsence of any local adaptation. Multiple logisticregressions were performed in R (R Development Core
Team) using the glm function (assuming that allelic countsat SNPs were binomially distributed) for eachSNP/haplotype separately. Model selection was carried outusing the drop1 function and likelihood ratio tests (LRTs).Whenever the models compared were not nested (andLRTs were thus not appropriate), we used Akaike’sInformation Criterium (AIC). Tests for environmentalassociations were performed at the amplicon level(counting the SNPs located within overlapping regionsonly once) and including only populations with more thanthree gametes sampled (average number of gametessampled per population: 7.98 in P. pinaster and 9.27 in P.halepensis, see Table S1).
ResultsGene diversity and divergence
Overall primer transfer rates across the two pine specieswere high (91.6% for P. pinaster and 83.3% for P.halepensis) and we obtained a total of 533 kbp and 380kbp of sequence in P. pinaster and P. halepensis,respectively. All sequences represented putative orthologs(determined on the basis of similarities with availablesequences in GenBank and construction of phylogeniesincluding multiple gene members of the target families indifferent conifers) except probably for dhn2-Ps_b in P.halepensis (see Methods). Maritime pine showed a higherlevel of gene diversity than Aleppo pine (Table 2), and thisresult held when considering only the nine orthologousamplicons in the two species (data not shown). In total, 131SNPs (24 non-synonymous) were detected in P. pinaster(4 to 27 per amplicon) and 65 SNPs (12 non-synonymous)in P. halepensis (1 to 21 per amplicon) (Table 2). There wereonly four shared polymorphisms (i.e. 2 % of polymorphicsites were shared) across species, with two of them (thosewithin 4cl-Pt) appearing only in one P. pinaster individual.Number of insertions/deletions was similar between thetwo species for the same locus, but these indels were notshared across species. None of them caused frame shifts.At the haplotype level, not only the number of haplotypessubstantially differed between the two species (86 for P.pinaster vs. only 59 for P. halepensis) but also theirfrequency spectrum: P. pinaster had multiple commonhaplotypes along with some less frequent ones, while P.halepensis generally displayed one major haplotypetogether with some low-frequency ones (Figure S2).Finally, there was also a contrasted pattern of genediversity between the regional groups defined bychloroplast microsatellites in P. pinaster: the WesternMediterranean group displayed higher nucleotide diversitythan the North African group (average per population of0.0039 vs. 0.0022). The SNP and haplotypes detectedwere used to conduct neutrality tests, as well as to detectassociations with environmental variables.
Divergence at the DNA sequence level was examinedusing two outgroups: P. taeda, a New World pine, and each
97
of the Mediterranean pines as reference for the other (i.e.P. halepensis was used as outgroup for P. pinaster and viceversa). For both species, nucleotide divergence per sitewith P. taeda (Kall = 0.0397 for P. pinaster; Kall = 0.0498for P. halepensis) was higher than with the otherMediterranean species (Kall = 0.0235 for P. pinaster vs. P.halepensis) except for dhn2-Pp_b in P. pinaster thatdisplayed a slightly higher divergence between theMediterranean pines than between each of them with P.taeda.
Neutrality tests
Neutrality tests rejected the null neutral model for distinctgenes depending on the species and the geographicgroup (Table 3). The D and Hnorm tests identified somegenes departing significantly from expectation under theneutral model that are not detected by the more robustDHEW test: lp31-Pt_a and lp31-Pt_b in the North Africangroup for P. pinaster; lp33-Pp in the WesternMediterranean group for P. halepensis. As shown below,these two tests are probably reflecting demographicalevents and not selective processes. More relevantly, twofragments of the 4cl-Pt gene were identified as potentialtargets of selection by DHEW tests: 4cl-Pt_b in theWestern Mediterranean group for P. pinaster and 4cl-Pt_din the North African group for P. halepensis. Consideringall polymorphic sites or only silent sites did not change thequalitative results of the test (Table 3 and Table S5).
None of the MK tests showed any departure from the nullhypothesis of an equal ratio of nonsynonymous tosynonymous variation within and between species (datanot shown). The ML-HKA tests based on silent sites (withP. taeda as outgroup) revealed uncoupled patterns ofpolymorphism and divergence in only one amplicon in P.pinaster in the Western Mediterranean group (dhn2-Pp_b),while in P. halepensis one amplicon in this same group(lp33-Pp) and one in the North African group (4cl-Pt_b)were significant (Table 3). These results still stood whenanalyses were restricted to only one amplicon per gene (inorder to avoid potential linkage between fragments fromthe same gene) and when fragments potentially underselection were not used as control loci (data not shown).When all substitution sites were included in the analyses,three more genes were significant for P. halepensis in theWestern Mediterranean group (dhn2-Ps_a, 4cl-Pt_a, 4cl-Pt_b) (Table S5). In contrast, when Mediterranean pineswere used as outgroup for each other, patterns ofpolymorphism and divergence either considering all sites(Table S5) or silent sites (Table 3) seemed to evolveneutrally and a similar trend of the maximum likelihoodestimate of the selection parameter (ML-HKA’s K) wasobserved in the two series of analyses.
Environmental associations
Environmental associations were examined at both theSNP and the haplotype level, and, overall, similarassociations were detected. Nonetheless, a few
correlations differed, with some found only at thehaplotype level, which highlights how these two levelscomplement each other as haplotypes may reflectinteractions among linked mutations. Within the twospecies, all significant associations detected betweenSNPs or haplotypes and climatic variables involvedtemperature indices as environmental variables.
As many as 23 significant associations were initially foundin P. pinaster (non-corrected model as provided by SAM,see Methods). Only three associations remained afterintegrating neutral marker PCs as covariates, two of themwith spatial variables (one with altitude, one with latitude)and one (4cl-Pt_c_229) with the minimum temperature ofthe coldest month (MTCM) (Figure 2; Table S6). At thehaplotype level, initially 32 associations were found inmaritime pine but only six remained in the correctedmodel: two (4cl-Pt_c_A and 4cl-Pt_c_B) with altitude andone (dhn5-Ps_C) with annual mean temperature (AMT),one (dhn5-Ps_E) with maximum temperature of thewarmest month (MTWM), and two (4cl-Pt_c_A and 4cl-Pt_c_B) with minimum temperature of the coldest month(MTCM) (Figure 2; Table S7). In the case of P. halepensis,only one association was found by the corrected models,both at the SNP (between 4cl-Pt_c_131 and temperatureseasonality, TS) and at the haplotype (4cl-Pt_c_B and TS)level (Figure 2; Tables S6 and S7).
In summary, association analysis identified two lociexhibiting significant correlations with temperatureindices: 4cl-Pt_c that is associated with MTCM in P.pinaster and with TS in P. halepensis at both the SNP andhaplotype levels, and dhn5-Ps that is associated with AMTand MTWM at the haplotype level in P. pinaster only.
DiscussionIn this study, we assessed the impact of natural selectionon the same set of candidate genes related to droughttolerance in two widespread Mediterranean pine species.Our results revealed distinct selection patterns accordingto species, geographic regions and loci. Below, we discussthese findings in the light of the history of each speciesand the specificities of each of the methods used to revealfootprints of selection.
Neutrality tests
Neutrality tests examining selection events based on site-and haplotype-frequency spectrum identified distinctgenes potentially targeted by selection. The D and/orHnorm tests detected three loci departing from neutralitythat were not detected by the DHEW compound tests.These results may be explained by the sensitivity of the Dand Hnorm tests to demographic factors and differentdegrees of background selection (Zeng et al. 2006).Especially, Tajima’s D is sensitive to background selectionand population growth while the Hnorm is more sensitiveto population shrinkage and subdivision. In a previous
98
study in P. halepensis based on ten candidate genes, wehave shown that this species has undergone historicalbottlenecks and that the western populations of thespecies harbored some signatures of this demographicevent (Grivet et al. 2009). In addition, based on the presentdata set and extensive coalescent simulation, we havefound that observed values of D and Hnorm for P. pinasterboth in the Western Mediterranean and North Africangroups reject the standard neutral model and suggest pastbottlenecks in this species too (see Figure S3). To test therobustness of the DHEW compound test, neutralcoalescent simulations under realistic bottlenecksscenarios were further simulated in P. pinaster (1,000coalescent simulations per scenario) and the significantvalues for this test were recorded. In all cases, the numberof significant tests obtained was equal or lower than thenumber expected by chance (see Figure S3), highlightingthe robustness of the DHEW test in the presence ofbottleneck events and geographic population structure ofmagnitudes similar to the ones found in maritime andAleppo pines. In addition to our simulations, the DHEWtest has been shown to be robust to recombination and tohave high sensitivity to detect positive selection (Zeng etal. 2007), as it combines powerful (and insensitive torecombination) haplotype-frequency spectrum tests (i.ethe EW test) with SFS statistics, such as the D test thatmaintains power to detect positive selection across a wideperiod of time (Zeng et al. 2006; Zhai, Nielsen and Slatkin2009). Only two on-going events of selection weredetected by the DHEW test, one in P. pinaster and one inP. halepensis. Both cases involved the 4cl-Pt gene (albeitin different geographical regions and distinct amplicons),suggesting a potential role of 4cl in local adaption in bothpine species (see below).
Among the tests examining polymorphism within speciesand divergence among species, the MK test did not detectany loci under selection. While this test is somewhat robustto demography, it seems less powerful in detectingpositive selection than HKA type tests (Zhai, Nielsen, andSlatkin 2009). The ML-HKA tests for both silent and allsites, using P. taeda as outgroup, identified threeamplicons with uncoupled levels of polymorphism anddivergence in the two pines. Two genes (dhn2-Pp_b in P.pinaster in the Western Mediterranean group and 4cl-Pt_bin P. halepensis in the North African group) showed highlevels of diversity compared to divergence (selectionparameter higher than one), a pattern compatible withbalancing selection. One other gene (lp33-Pp in theWestern Mediterranean group in P. halepensis) showedlow diversity compared to divergence (selectionparameter lower than one), which could reflect thetransient reduction in variability occurring during aselective sweep. Three other genes showed uncoupledlevels of polymorphism and divergence in P. halepensiswhen examining all sites, but not when examining silentsites alone. Two of these genes (4cl-Pt_a and 4cl-Pt_b in
the Western Mediterranean group) had an excess ofnucleotide diversity, which could reflect recent balancingselection acting on non-synonymous sites, while for onegene (dhn2-Pp_a in the Western Mediterranean group)purifying selection reducing diversity in non-synonymoussites could explain the observed pattern. Evidence forextensive purifying selection in conifers comes from anapproximately four-fold nucleotide diversity atsynonymous compared to non-synonymous sites in mostspecies (see Table 1 in González-Martínez et al. 2010),including maritime (dN/dS = 0.169) and Aleppo (dN/dS =0.344) pines (this study). Although demographical eventscan result in a significant ML-HKA test, its multilocus naturecombined with the HKA framework should produce amore robust test than those based on comparing differentaspects of polymorphism at a single locus (Wright andCharlesworth 2004).
In order to gain power by increasing sample size whiletaking the specific history of each species into account, weperformed the neutrality tests in groups of populationsthat present similar evolutionary history (i.e. North Africanand Western Mediterranean groups). However, groupingpopulations may bias the output of the SFS-basedneutrality tests as it can increase the proportion ofsingletons, leading to an excess of low frequency variantsand thus to more negative D (Städler et al. 2009). In ourstudy, populations were grouped according tohomogeneous gene pools (see Bucci et al. 2007 for P.pinaster and Grivet et al. 2009 for P. halepensis), theconsequence of which should be that no substantialdifferences in the number of rare variants at the populationand group levels are found. The extensive gene flownormally found in conifers with large and continuousdistribution would also support this approach.Nevertheless, to check that our results were not biasedbecause of population grouping, we performed neutralitytests at the population level too and found that values ofD test at the group level were not more negative than atthe single population level (data not shown). Moreover,results of the Hnorm and DHEW tests should not beaffected by the accumulation of singletons as the first isbased on intermediary and high frequency variants whilethe second integrates all variants of the site frequencyspectrum. Thus, our analyses appear reasonably robust topopulation grouping.
Selective events appear to have affected distinct genes inP. pinaster and in P. halepensis despite their overlappingenvironment and close phylogenetic relationship, a resultthat may be connected to the different histories of the twopines that have likely resulted in different selectivepressures. In P. pinaster, selective events were detectedonly within the Western Mediterranean group, while in P.halepensis footprints of selection were identified both inthe Western Mediterranean and North African groups.These results point to different geographical selectionpressures that may have led to the process of regional
99
adaptation of the pines (see Barbéro et al. 1998 for adescription of the different Mediterranean environmentalzones; and Gómez and Zamora 2000; Nakazato,Bogonovich, and Moyle 2008; Montesinos et al. 2009 forsome examples on adaptive variation acrossheterogeneous environments). It is also noticeable that P.pinaster had lower levels of nucleotide variation within theNorth African range. This fact can be attributed topopulation history and/or interpreted in the light of moreextreme environmental conditions constraining populationsizes and/or resulting in stronger selection in this range.
Environmental associations
Environmental associations identified two loci that werecorrelated with temperature, suggesting the importanceof this climatic variable as selective agent (Saxe et al. 2001;Jump et al. 2006). One of these genes was common forboth pines (4cl-Pt correlated with MTCM in P. pinaster andwith TS in P. halepensis), while the other gene associationwas only significant in P. pinaster (dhn5-Ps correlated withAMT and MTWM). Some of the correlations betweengenetic and climatic data in P. pinaster were due basicallyto the extreme values of a few North African populations(Sidi Meskour and Tamrabta for 4cl-Pt_c; Tabarka fordhn5-Ps_C; see Figures 2 and 3) and may not representtrue adaptive responses to environmental gradients butlocal adaptation to particular environments or genetic driftdue to population isolation (see references in Alleaume-Benharira, Pen, and Ronce 2006; Rosenblum, Hickerson,and Moritz 2007). In contrast, the other associations (4cl-Pt_c in P. halepensis and dhn5-Ps_E in P. pinaster) showedmore robust patterns. For instance, dhn5-Ps_E tended tobe absent from populations characterized by the highestMTWM (Arenas de San Pedro in central Spain, Tamrabtain Moroccan Middle Atlas and Tabarka in coastal Tunisia)regardless of their geographical location (Table 1 andFigure 3).
Environmental correlations with allelic variation can bespuriously inflated by neutral processes that may alsogenerate genetic clines, such as population history orpopulation genetic structure. This is particularly true forforest trees that may have followed a postglacialcolonization pathway overlapping temperature and rainfallclines. Here, to control for confounding associationsbetween candidate genes and environmental data, weincluded variation of chloroplast microsatellites as acovariate in the multivariate logistic regressions. In P.pinaster, the use of cpSSRs has allowed a more accuratedescription of genetic structure (Bucci et al. 2007) thanprevious studies based on biochemical markers, such asterpenes or allozymes (e.g. Baradat and Marpeau-Bezard1988; Salvador et al. 2000). Recently, nuclear moleculardata for a geographically limited set of populations(nuSSRs and SNPs) (Eveno et al. 2008; our unpublishedresults) have identified similar gene pools as Bucci et al.(2007). More extensive sampling with highly-polymorphic
biparentally-inherited nuclear markers could, in principle,reveal a more complex spatial genetic pattern affectingthe outcome of some of the multivariate logisticregressions reported in this study. However, because theavailable chloroplast data set we used strongly reflects thespecies’ history, they are expected to ‘correct’ for thepresence of overall neutral genetic gradients. Accordingly,including these markers as covariates identified asubstantial fraction of the correlations initially retained assignificant as false positives (83.6 % in P. pinaster and85.7% in P. halepensis) (Tables S6 and S7).
The dehydrin gene family
Neutrality tests and environmental associations both pointto dehydrins as potential targets of natural selection in P.pinaster. Some dehydrins were also suggested to be underselection in a study based on detection of outlier loci inthis species (Eveno et al. 2008). Dehydrins displayed alsonon-neutral patterns of nucleotide diversity in Pinussylvestris populations showing divergence for coldtolerance in Europe (Wachowiak et al. 2009) and wereassociated with carbon isotope discrimination (and, thus,potentially with drought tolerance) in P. taeda (González-Martínez et al. 2008). Altogether these studies suggest theinvolvement of dehydrins in the adaptive response of pinesto abiotic stress.
Dehydrins are part of a relatively small multigene family ofintracellular stabilizers that plays a major role in cellprotection against desiccation. These proteins areproduced in response to any type of stress that causesdehydration at the cellular level, such as cold, drought orsalinity (Close 1997). Changes in dehydrin gene expressionhave been reported in response to drought and/or coldstress in many plants such as cowpea (Ismail, Hall, andClose 1999), barley (Suprunova et al. 2004), wheat (Lopezet al. 2001), apple (Wisniewski et al. 2008), tomato (Weissand Egea-Cortines 2009) and blueberry (Panta, Rieger,and Rowland 2001); while transgenic experimentsconfirmed the role of dehydrin genes in enhancingtolerance to drought or freezing stress in plants (e.g. inArabidopsis, Puhakainen et al. 2004). In conifers, at leasteight dehydrin genes have been identified in Pinussylvestris (Joosen et al. 2006) and Picea abies (Yakovlevet al. 2008), and dehydrin expression has been shown toincrease under wounding, cold and drought stress(Richard et al. 2000; Watkinson et al. 2003). Thus, it is notsurprising to find in our study significant associationsbetween dehydrins and temperatures, as critical lowtemperatures can cause tissue injury while hightemperatures accompany dehydration, both stimulatingthe accumulation of dehydrins (Lewitt 1980; Ingram andBartels 1996; Rizhsky, Liang, and Mittler 2002). Althoughour results, and others in P. pinaster, suggest that selectionmay have acted on some of the dehydrins tested, furthergenetic association and functional studies are necessaryto confirm the role of dehydrins in local adaptation of thisMediterranean pine.
100
The 4-coumarate: CoA ligase (4cl) gene
There was converging evidence both from neutrality tests(DHEW in P. pinaster and both DHEW and ML-HKA in P.halepensis) and environmental associations that the 4-coumarate: CoA ligase (4cl) gene may be under selectionin the two Mediterranean pines studied. Preliminaryresults on phenotypical association corrected by neutralgradients in P. pinaster also point at 4cl-Pt. Indeed,multiple regressions reveal significant associationsbetween polymorphism in 4cl-Pt_c at the SNP andhaplotype levels and total height in populations growingin sites characterized by dry and intermediate humidity(Table S8). The 4cl family has been extensively studied inplants, where it is encoded by four to five genes in thefully sequenced genomes of Arabidopsis, rice and poplar(reviewed in Souza et al. 2008). The 4cl gene is involved,among other processes, in the production of basicenzymes of the phenylpropanoid metabolism that areimportant metabolites acting as protectants against bioticand abiotic stresses (Rani et al. 2009). The 4cl gene alsoencodes key enzymes in the biosynthesis of lignin andseveral studies have demonstrated its involvement in plantgrowth (e.g. Yun et al. 2005; Wagner et al. 2009; Yun etal. 2009). Thus, we expect that changes in 4cl functionwould have significant repercussions on tree physiologyand morphology. Implication of 4cl in pine morphologyand physiology has been shown in gene associationstudies (for P. taeda see González-Martínez et al. 2007b)as well as in gene suppression studies (for P. radiata seeWagner et al. 2009).
Neutrality tests versus Environmental correlations
The different approaches used in this study suggesteddifferent loci under selection within each of the twoMediterranean pine species. This fact has to beconnected to the specificities of the statistical methodsused, whose performance has been recently studiedunder various demographic and recombinationscenarios (Zeng et al. 2007; Zeng, Shi, and Wu 2007;Ramírez-Soriano et al. 2008; Zhai, Nielsen, and Slatkin2009). Within-species site and haplotype frequencyspectrum-based methods are suitable to detect ongoingor recently fixed selective sweeps - EW tending to bemore powerful around the time when a selectedmutation reaches fixation (Zeng, Shi, and Wu 2007). Incontrast, tests comparing levels of (within-species)polymorphism and (among-species) divergence are ableto detect the cumulative effects of positive selectionevents over a wider evolutionary scale. Within thiscategory, the ML-HKA test is suitable to quantify theamount of selection in the genome and, due to itsmultilocus nature, it is expected to be more robust tochanges in population size such as populationbottlenecks and expansion than traditional tests (Wrightand Charlesworth 2004). Simulations have shown thatthe HKA test is relatively insensitive to change of
divergence time as most of its power comes from thetransient reduction in variability occurring duringselective sweeps (Zhai, Nielsen, and Slatkin 2009).However, we only obtained significant tests when usingthe less closely-related outgroup (i.e. a New World pine,P. taeda). This points to either lower power whendivergence time from the outgroup is low or,alternatively, to selection events that took place beforethe split of the two Mediterranean pines considered. Inour study, none of the EW neutrality tests weresignificant (data not shown), while both the DHEW andthe ML-HKA tests revealed distinct genes potentiallyunder selection. As a consequence, potential selectiveevents detected by the neutrality tests assessed in thisstudy would correspond to either on-going or relativelyold selective events (i.e. before the diversification of theMediterranean pines in the Miocene, ~10 Ma; Gernandt etal. 2008).
Last generation tests, such as DHEW or ML-HKA, arepowerful for detecting positive selection and arerelatively insensitive to other evolutionary forces, but stilldo not integrate recombination rate, a factor that canproduce substantial biases (Nielsen et al. 2007; Ramírez-Soriano et al. 2008), nor provide insights on selectiondrivers. Methods based on correlation between geneticand environmental data are appealing because they aimat understanding species-specific adaptations andprocesses that connect an organism to its environmentby looking at allelic frequencies or the genetic structureof populations (Foll and Gaggiotti 2006; Joost,Kalbermatten, and Bonin 2008). These correlationmethods are also more appealing than methods basedon detection of outliers (e.g. Eveno et al. 2008) as theytarget particular selection drivers and provide ahypothesis testing framework. In addition, they are wellsuited for high-throughput genotyping even for non-model species (Namroud et al. 2008; Eckert et al.forthcoming). However, correlation methods are notwithout limitations, as it may be challenging to find theenvironmental factors that are relevant for each speciesadaptation and associations have to be controlled forhistorical and demographical processes, in particular forallelic clines produced by postglacial migrations inEurope and the Americas.
Together, neutrality tests and environmental associationapproaches complement each other by looking atdifferent evolutionary scales and types of selection. Inour study, they detected a relatively-high number ofgenes showing non-neutral patterns of evolution, a resultthat can be attributed to a selection of candidate genesbased on earlier studies (González-Martínez et al. 2006;Eveno et al. 2008; Grivet et al. 2009). This fact supportsa candidate gene approach with targeted genes, at leastfor organisms that have large genomes (e.g. conifers),which, so far, preclude dense genome-wide sampling.
101
ConclusionOur pluralistic approach revealed a dynamic action ofnatural selection in space and time within maritime andAleppo pines (Felsenstein 1976; see Vasemagi andPrimmer 2005 for other examples). Selection events alongwith environmental associations were detected; some ofthese events differ between the two species reflectingindividual histories (recolonization, demography,adaptation) while others are shared, which translatespartly as a common history of these closely-related andpartially sympatric Mediterranean pines. The simultaneoussearch for patterns of selection in two closely-relatedspecies can help understanding the evolutionary forcesresponsible for adaptive responses, and thus provides aneffective way of assessing the degree of local adaptation,a key factor to integrate in future management andconservation strategies (Wright and Gaut 2005).
AcknowledgementsWe are grateful to C. García-Barriga for her assistance inproducing sequences of P. pinaster candidate genes, to C.Collada, M.T. Cervera, M.A. Guevara, G. Gill, G.R. Brown andD.B. Neale for providing some of the primers, as well as toA.I. de-Lucas and C. Ordoñez for supplying some of the P.pinaster seeds. We thank J. Gonzalo for kindly providingthe climatic data from his functional phytoclimatic model,as well as S.E. Ramos-Onsins for his scripts to compute thediversity parameters and K. Zeng for his scripts tocompute the DHEW neutrality test. Thanks are extendedto M. Robson, M.A. Zavala and J. Climent for helpfuldiscussion on the study. We are also thankful to A.J. Eckertfor thoughtful comments on the manuscript, N.Takebayashi and two anonymous reviewers forconstructive comments and suggestions, and P.C. Grantfor revising the English. The EUFORGEN program(Bioversity International) provided the distribution mapsused in Fig. 1.
FundingThis work was supported by the EU EVOLTREE Networkof Excellence, the Collaborative Project on ‘Conservationof Forest Genetic Resources’ between the Spanish Ministryof Environment and INIA (AEG06-054) and ProjectsCGL2008-05289-C02-02 ⁄BOS (VaMPiro) and EUI2008-03713 (BiodivERsA-LinkTree) from the Spanish Ministry ofScience and Innovation, the later through the FP6BiodivERsA Eranet. TB acknowledges support from theDanish Research Council (FNU) through a Stenofellowship.
LITERATURE CITEDAlleaume-Benharira M, Pen IR, Ronce O. 2006.Geographical patterns of adaptation within a species’range: interactions between drift and gene flow. J EvolBiol. 19:203-215.
Aranda I, Alía R, Ortega U, Dantas AK, Majada J. 2009.Intra-specific variability in biomass partitioning and carbonisotopic discrimination under moderate drought stress inseedlings from Pinus pinaster populations. Tree GenetGenomes 6:169-178.
Atzmon N, Moshe Y, Schiller G. 2004. Ecophysiologicalresponse to severe drought in Pinus halepensis Mill. treesof two provenances. Plant Ecol. 171:15-22.
Baradat PH, Marpeau-Bezard A. 1988. Le pin maritime,Pinus pinaster Ait. Biologie et génétique des terpènes pourla connaissance et l'amélioration de l'espèce. PhD Thesis,University of Bordeaux I, France.
Barbéro M, Loisel R, Quézel P, Richardson DM, Romane F.1998. Pines of the Mediterranean Basin. In Richardson DM,editor. Ecology and Biogeography of Pinus. CambridgeUniversity Press, Cambridge. Pp. 153-170.
Biswas S, Akey JM. 2006. Genomic insights into positiveselection. Trends Genet. 22:437-446.
Bucci G, Anzidei M, Madaghiele A, Vendramin GG. 1998.Detection of haplotypic variation and natural hybridizationin halepensis-complex pine species using chloroplastsimple sequence repeat (SSR) markers. Mol Ecol. 7:1633-1643.
Bucci G, González-Martínez SC, Le Provost G, Plomion C,Ribeiro MM, Sebastiani F, Alía R, Vendramin GG. 2007.Range-wide phylogeography and gene zones in Pinuspinaster Ait. revealed by chloroplast microsatellite markers.Mol Ecol. 16:2137-2153.
Burban C, Petit RJ. 2003. Phylogeography of maritimepine inferred with organelle markers having contrastedinheritance. Mol Ecol. 12:1487-1495.
Chambel MR, Climent J, Alía R. 2007. Divergence amongspecies and populations of Mediterranean pines inbiomass allocation of seedlings grown under two wateringregimes. Ann For Sci. 64:87-97.
Climent J, Prada MA, Calama R, Chambel MR, De Ron DS,Alía R. 2008. To grow or to seed: Ecotypic variation inreproductive allocation and cone production by youngfemale Aleppo pine (Pinus halepensis, Pinaceae). Am JBot. 95:833-842.
Close T. 1997. Dehydrins: a commonality in the response ofplants to dehydration and low temperature. Physiol Plant.100:291-296.
Coop G, Pickrell JK, Novembre J, Kudaravalli S, Li J, AbsherD, Myers RM, Cavalli-Sforza LL, Feldman MW, Pritchard JK.2009. The role of geography in human adaptation. PLoSGenetics 5(6): e1000500.
Costa P, Bahrman N, Frigerio JM, Kremer A, Plomion C.1998. Water-deficit-responsive proteins in maritime pine.Plant Mol Biol. 38:587-596.
Dellaporta SL, Wood J, Hicks JB. 1983. A plant DNAminipreparation: version II. Plant Mol Biol Rep. 1:19-21.
Eckert AJ, van Heerwaarden J, Wegrzyn JL, Nelson CD,Ross-Ibarra J, González-Martínez SC, Neale DB.Forthcoming. Patterns of population structure andenvironmental associations to aridity across the range ofloblolly pine (Pinus taeda L., Pinaceae). Genetics.
Eveno E, Collada C, Guevara MA, et al. (11 co-authors).2008. Contrasting patterns of selection at Pinus pinasterAit. drought stress candidate genes as revealed by geneticdifferentiation analyses. Mol Biol Evol. 25:417-437.
102
Felsenstein J. 1976. Theoretical population-genetics ofvariable selection and migration. Annu Rev Genet.10:253-280.
Foll M, Gaggiotti O. 2006. Identifying the environmentalfactors that determine the genetic structure ofpopulations. Genetics 174:875-891.
Frankel N, Carrari F, Hasson E, Iusem ND. 2006. Evolutionaryhistory of the Asr gene family. Gene 378:74-83.
Gernandt DS, Lopez GG, Garcia SO, Liston A. 2005.Phylogeny and classification of Pinus. Taxon 54:29-42.
Gernandt DS, Magallon S, Lopez GG, Flores OZ, WillyardA, Liston A. 2008. Use of simultaneous analyses to guidefossil-based calibrations of Pinaceae phylogeny. Int J PlantSci.169:1086-1099.
Giorgi F, Lionello P. 2008. Climate change projections forthe Mediterranean region. Glob Planet Change 63:90-104.
Gómez JM, Zamora R. 2000. Spatial variation in theselective scenarios of Hormathophylla spinosa(Cruciferae). Am Nat. 155:657-668.
González-Martínez SC, Dillon S, Garnier-Géré P, et al. (16co-authors). Forthcoming. Patterns of nucleotide diversityand association mapping In Kole C, editor. Genomics ofConifers. Science Publishers, Inc., New Hampshire.
González-Martínez SC, Ersoz E, Brown GR, Wheeler NC,Neale DB. 2006. DNA sequence variation and selection oftag single-nucleotide polymorphisms at candidate genesfor drought-stress response in Pinus taeda L. Genetics172:1915-1926.
González-Martínez SC, Gómez A, Carrión JS, Agúndez D,Alía R, Gil L. 2007a. Spatial genetic structure of an explicitglacial refugium of maritime pine (Pinus pinaster Aiton) insoutheastern Spain. In Weiss S, Ferrand N, editors.Phylogeography in southern European refugia:evolutionary perspectives on the origins of Europeanbiodiversity, London. Pp. 257-269.
González-Martínez SC, Huber D, Ersoz E, Davis JM, NealeDB. 2008. Association genetics in Pinus taeda L. II. Carbonisotope discrimination. Heredity 101:19-26.
González-Martínez SC, Wheeler NC, Ersoz E, Nelson CD,Neale DB. 2007b. Association genetics in Pinus taeda L. I.Wood property traits. Genetics 175:399-409.
Gonzalo J. 2007. Phytoclimatic analysis of the SpanishPeninsula. Update and geostatistical analysis. PhD Thesis,University of Valladolid, Spain.
Gram WK, Sork VL. 2001. Association betweenenvironmental and genetic heterogeneity in forest treepopulations. Ecology 82:2012-2021.
Grivet D, Sebastiani F, González-Martínez SC, VendraminGG. 2009. Patterns of polymorphism resulting from long-range colonization in the Mediterranean conifer Aleppopine. New Phytol. 184:1016-1028.
Hancock AM, Witonsky DB, Gordon AS, Eshel G, PritchardJK, Coop G, Di Rienzo A. 2008. Adaptations to climate incandidate genes for common metabolic disorders. PLoSGenetics 4(2): e32.
Hijmans RJ, Cameron SE, Parra JL, Jones PG, Jarvis A.2005. Very high resolution interpolated climate surfacesfor global land areas. Int J Climatol. 25:1965-1978.
Hudson RR, Kreitman M, Aguade M. 1987. A test of neutralmolecular evolution based on nucleotide data. Genetics116:153-159.
Ingram J, Bartels D. 1996. The molecular basis ofdehydration tolerance in plants. Annu Rev Plant PhysiolPlant Mol Biol. 47:377-403.Ismail AM, Hall AE, Close TJ. 1999. Allelic variation of adehydrin gene cosegregates with chilling tolerance duringseedling emergence. Proc Natl Acad Sci USA. 96:13566-13570.Joosen RVL, Lammers M, Balk PA, Bronnum P, KoningsMCJM, Perks M, Stattin E, Van Wordragen MF, van derGeest AHM. 2006. Correlating gene expression tophysiological parameters and environmental conditionsduring cold acclimation of Pinus sylvestris, identificationof molecular markers using cDNA microarrays. TreePhysiol. 26:1297-1313.Joost S, Kalbermatten M, Bonin A. 2008. Spatial analysismethod (SAM): a software tool combining molecular andenvironmental data to identify candidate loci for selection.Mol Ecol Resources 8:957-960.Jump AS, Hunt JM, Martínez-Izquierdo JA, Peñuelas J.2006. Natural selection and climate change: temperature-linked spatial and temporal trends in gene frequency inFagus sylvatica. Mol Ecol. 15:3469-3480.Keller SR, Sowell DR, Neiman M, Wolfe LM, Taylor DR.2009. Adaptation and colonization history affect theevolution of clines in two introduced species. New Phytol.183:678-690.Kimura M, Ohta T. 1974. Some principles governingmolecular evolution. Proc Natl Acad Sci USA. 71:2848-2852.Lewitt J. 1980. Responses of plants to environmentalstresses, Vol I. Chilling, freezing and high temperaturestresses. Academic Press, New York, USA.Librado P, Rozas J. 2009. DnaSP v5: A software forcomprehensive analysis of DNA polymorphism data.Bioinformatics 25:1451-1452.Lopez CG, Banowetz G, Peterson CJ, Kronstad WE. 2001.Differential accumulation of a 24-kd dehydrin protein inwheat seedlings correlates with drought stress toleranceat grain filling. Hereditas 135:175-181.Manel S, Schwartz MK, Luikart G, Taberlet P. 2003.Landscape genetics: combining landscape ecology andpopulation genetics. Trends Ecol Evol. 18:189-197.McDonald JH, Kreitman M. 1991. Adaptive protein evolutionat the ADH locus in Drosophila Nature 351:652-654.Montesinos A, Tonsor SJ, Alonso-Blanco C, Picó FX. 2009.Demographic and genetic patterns of variation amongpopulations of Arabidopsis thaliana from contrastingnative environments. PLoS One 4:e7213.Morgante M, Felice N, Vendramin GG. 1998. Analysis ofhypervariable chloroplast microsatellites in Pinushalepensis reveals a dramatic genetic bottleneck. In KarpA, Isaac PG, Ingram DS, editors. Molecular tools forscreening biodiversity. Chapman & Hall, London, UK. Pp.407-412.Nakazato T, Bogonovich M, Moyle LC. 2008.Environmental factors predict adaptive phenotypicdifferentiation within and between two wild Andeantomatoes. Evolution 62:774-792.Namroud MC, Beaulieu J, Juge N, Laroche J, Bousquet J.2008. Scanning the genome for gene single nucleotidepolymorphisms involved in adaptive populationdifferentiation in white spruce. Mol Ecol. 17:3599-3613.
103
Nei M. 1987. Molecular evolutionary genetics. ColumbiaUniv. Press, New York.
Nguyen A, Lamant A. 1989. Variation in growth andosmotic regulation of roots of water-stressed maritimepine (Pinus pinaster Ait) provenances.Tree Physiol. 5:123-133.
Nielsen R. 2005. Molecular signatures of natural selection.Annu Rev Genet. 39:197-218.
Nielsen R, Hellmann I, Hubisz M, Bustamante C, Clark AG.2007. Recent and ongoing selection in the humangenome. Nat Rev Genet. 8:857-868.
Panta GR, Rieger MW, Rowland LJ. 2001. Effect of cold anddrought stress on blueberry dehydrin accumulation. JHorticult Sci Biotechnol. 76:549-556.
Parisod C, Christin PA. 2008. Genome-wide association tofine-scale ecological heterogeneity within a continuouspopulation of Biscutella laevigata (Brassicaceae). NewPhytol. 178:436-447.
Petit RJ, Hampe A, Cheddadi R. 2005. Climate changesand tree phylogeography in the Mediterranean. Taxon54:877-885.
Puhakainen T, Hess MW, Mäkelä P, Svensson J, Heino P,Palva ET. 2004. Overexpression of multiple dehydrin genesenhances tolerance to freezing stress in Arabidopsis. PlantMol Biol. 54:743-753.
Quézel P. 2000. Taxonomy and biogeography ofMediterranean pines. In Ne'eman G, Trabaud L, editors.Ecology, biogeography and management of Pinushalepensis and P. brutia forest ecosystems in theMediterranean Bassin. Backhuys Publishers, Leiden, TheNetherlands. Pp. 1-12.
Ramírez-Soriano A, Ramos-Onsins SE, Rozas J, Calafell F,Navarro A. 2008. Statistical power analysis of neutralitytests under demographic expansions, contractions andbottlenecks with recombination. Genetics 179:555-567.
Rani A, Singh K, Sood P, Kumar S, Ahuja PS. 2009. p-Coumarate:CoA ligase as a key gene in the yield ofcatechins in tea [Camellia sinensis (L.) O. Kuntze]. FunctIntegr Genomics 9: 271-275.
Resch T. 1974. Essai de distinction des races majeurs dePinus pinaster. Annales de la Recherche Forestière auMaroc 14:91-102.
Richard S, Morency MJ, Drevet C, Jouanin L, Séguin A.2000. Isolation and characterization of a dehydrin genefrom white spruce induced upon wounding, drought andcold stresses. Plant Mol Biol. 43:1-10.
Richardson DM, Bond WJ. 1991. Determinants of plant-distribution - Evidence from pine invasions. Am Nat.137:639-668.
Rizhsky L, Liang HJ, Mittler R. 2002. The combined effectof drought stress and heat shock on gene expression intobacco. Plant Physiol. 130:1143-1151.
Rosenblum EB, Hickerson MJ, Moritz C. 2007. A multilocusperspective on colonization accompanied by selection andgene flow. Evolution 61:2971-2985.
Salvador L, Alía R, Agúndez D, Gil L. 2000. Geneticvariation and migration pathways of maritime pine (Pinuspinaster Ait) in the Iberian peninsula. Theor Appl Genet.100:89-95.
Sathyan P, Newton RJ, Loopstra CA. 2005. Genes inducedby WDS are differentially expressed in two populations of
Aleppo pine (Pinus halepensis). Tree Genet Genomes 1:166-173.
Savolainen O, Pyhäjärvi T, Knürr T. 2007. Gene flow andlocal adaptation in trees. Annu Rev Ecol Evol Syst. 38:595-619.
Saxe H, Cannell MGR, Johnsen B, Ryan MG, Vourlitis G.2001. Tree and forest functioning in response to globalwarming. New Phytol. 149:369-399.
Soto A, Robledo-Arnuncio JJ, González-Martínez SC,Smouse PE, Alía R. 2010. Climatic niche and neutralgenetic diversity of the six Iberian pine species: aretrospective and prospective view. Mol Ecol. 19:1396-1409.
Souza CD, Barbazuk B, Ralph SG, Bohlmann J, HambergerB, Douglas CJ. 2008. Genome-wide analysis of a landplant-specific acyl: coenzymeA synthetase (ACS) genefamily in Arabidopsis, poplar, rice and Physcomitrella. NewPhytol. 179:987-1003.
Städler T, Haubold B, Merino C, Stephan W, Pfaffelhuber P.2009. The impact of sampling schemes on the sitefrequency spectrum in nonequilibrium subdividedpopulations. Genetics 182:205-216.
Storz JF. 2002. Contrasting patterns of divergence inquantitative traits and neutral DNA markers: analysis ofclinal variation. Mol Ecol. 11:2537-2551.
Suprunova T, Krugman T, Fahima T, Chen G, Shams I, KorolA, Nevo E. 2004. Differential expression of dehydrin genesin wild barley, Hordeum spontaneum, associated withresistance to water deficit. Plant Cell Environ. 27:1297-1308.
Tajima F. 1989. Statistical method for testing the neutralmutation hypothesis by DNA polymorphism. Genetics123:585-595.
Tapias R, Climent J, Pardos JA, Gil L. 2004. Life historiesof Mediterranean pines. Plant Ecol. 171:53-68.
Vasemagi A, Primmer CR. 2005. Challenges for identifyingfunctionally important genetic variation: the promise ofcombining complementary research strategies. Mol Ecol.14:3623-3642.
Voltas J, Chambel M, Prada M, Ferrio J. 2008. Climate-related variability in carbon and oxygen stable isotopesamong populations of Aleppo pine grown in common-garden tests. Trees-Struct Funct. 22:759-769.
Wachowiak W, Balk PA, Savolainen O. 2009. Search fornucleotide diversity patterns of local adaptation indehydrins and other cold-related candidate genes in Scotspine (Pinus sylvestris L.). Tree Genet Genomes 5:117-132.
Wagner A, Donaldson L, Kim H, Phillips L, Flint H, StewardD, Torr K, Koch G, Schmitt U, Ralph J. 2009. Suppressionof 4-Coumarate-CoA ligase in the coniferous gymnospermPinus radiata. Plant Physiol. 149:370-383.
Watkinson JI, Sioson AA, Vasquez-Robinet C, et al. (14 co-authors). 2003. Photosynthetic acclimation is reflected inspecific patterns of gene expression in drought-stressedloblolly pine. Plant Physiol. 133: 1702-1716.
Watterson GA. 1975. On the number of segregating sitesin genetical models without recombination. Theor PopBiol. 7: 256-276.
Watterson GA. 1978. The homozygosity test of neutrality.Genetics 88:405-417.
Weiss J, Egea-Cortines M. 2009. Transcriptomic analysisof cold response in tomato fruits identifies dehydrin as amarker of cold stress. J Appl Genetics 50:311-319.

104
Wisniewski M, Bassett C, Norelli J, Macarisin D, Artlip T,Gasic K, Korban S. 2008. Expressed sequence tag analysisof the response of apple (Malus x domestica 'Royal Gala')to low temperature and water deficit. Physiol Plant.133:298-317.
Wright SI, Charlesworth B. 2004. The HKA test revisited: aMaximum-Likelihood-Ratio test of the standard neutralmodel. Genetics 168:1071-1076.
Wright SI, Gaut BS. 2005. Molecular population geneticsand the search for adaptive evolution in plants. Mol BiolEvol. 22:506-519.
Yakovlev IA, Asante DKA, Fossdal CG, Partanen J, JunttilaO, Johnsen O. 2008. Dehydrins expression related totiming of bud burst in Norway spruce. Planta 228:459-472.
Yun MS, Chen WJ, Deng F, Yogo Y. 2005. Differentialproperties of 4-coumarate: CoA ligase related to growthsuppression by chalcone in maize and rice. Plant GrowthRegul. 46:169-176.
Yun MS, Chen WJ, Deng F, Yogo Y. 2009. Selective growthsuppression of five annual plant species by chalcone andnaringenin correlates with the total amount of 4-coumarate: coenzyme A ligase. Weed Biol Manag. 9:27-37.
Zeng K, Fu Y-X, Shi S, Wu C-I. 2006. Statistical tests fordetecting positive selection by utilizing high-frequencyvariants. Genetics 174:1431-1439.
Zeng K, Mano SH, Shi SH, Wu CI. 2007. Comparisons ofsite- and haplotype-frequency methods for detectingpositive selection. Mol Biol Evol. 24:1562-1574.
Zeng K, Shi S, Wu CI. 2007. Compound tests for thedetection of hitchhiking under positive selection. Mol BiolEvol. 24:1898-1908.
Zhai WW, Nielsen R, Slatkin M. 2009. An investigation ofthe statistical power of neutrality tests based oncomparative and population genetic data. Mol Biol Evol.26:273-283.

105
COMMUNITY GENETICS IN THE TIMEOF NEXT GENERATION MOLECULARTECHNOLOGIES
FELIX GUGERLI1, ROLAND BRANDL2, BASTIENCASTAGNEYROL3, ALAIN FRANC3, HERVÉ JACTEL3,HANS-PETER KOELEWIJN4, FRANCIS MARTIN5,MARTINA PETER1, KARIN PRITSCH6, HILKE SCHRÖDER7,MARINUS J.M. SMULDERS8, ANTOINE KREMER3, BIRGITZIEGENHAGEN2 and EVOLTREE JERA3 CONTRIBUTORS*1 WSL Swiss Federal Research Institute, 8903 Birmensdorf, Switzerland2 Fachbereich Biologie, Philipps-Universität Marburg, 35032 Marburg, Germany3 UMR1202 Biodiversity, Genes & Communities, INRA Pierroton, 33612 Cestas
Cedex, France4 ALTERRA Centre for Ecosystem Studies, Wageningen UR, 6700 AA
Wageningen, The Netherlands5 UMR "Interactions Arbres/Micro-Organismes", INRA Nancy, 54280
Champenoux, France6 Institute of Soil Ecology, Helmholtz Zentrum München, 85764 Neuherberg,
Germany
7 Institute for Forest Genetics, Johann Heinrich von Thuenen-Institute, 22927Grosshansdorf, Germany
8 Plant Research International, Wageningen UR, 6700 AA Wageningen, TheNetherlands
* The EC-supported Network of Excellence Evoltree (http://www.evoltree.eu)formed a group of scientists involved in and actively contributing to JointlyExecuted Research Activities on community genetics in forest ecosystems. Inaddition to the main authors, the group includes S. Augustin, M. Brändle, C.Burban, J. Burczyk, S. Cavers, I. Chybicki, C. Conord, E. Cremer, J. DeWoody,K. Donges, B. Fady, L. Karlinski, C. Kerdelhué, B. Kieliszewska-Rokicka, G. Kost,M. Kulczyk-Skrzeszewska, F. Lakatos, F. Lefèvre, S. Liepelt, S. Oddou-Muratorio, K.-H. Rexer, M. Rudawska, M. Schädler, G. Taylor, K. Tuba, M. Viger,F. Villani, M. Villar
Corresponding Author:Felix GugerliWSL Swiss Federal Research Institute, 8903 Birmensdorf, SwitzerlandE-mail: [email protected])
Community genetics aims to understand how geneticvariation within and among populations of host speciesaffects the composition of associated organismsinteracting with the host (Agrawal 2003; Whitham et al.2006; Johnson & Stinchcombe 2007; Rowntree et al. 2011;Wymore et al. 2011). Empirical community genetics hasbeen stimulated by pioneering work on poplars (Populusspp.), their genotype-based phenotypic variation, andassociated communities (Whitham et al. 2006). However,community genetics has hitherto largely remainedphenomenological, and the underlying genetic basis andprocesses involved in the interactions between host andassociated organisms have not been studied in detail yet.Given the rapid development of molecular techniques(Rokas & Abbot 2009), it will soon be feasible tocharacterize the genomes of numerous members of acommunity. With whole-genome sequences or othertypes of -omics data at hand (Nadeau & Jiggins 2010),community genetics will be able to establish a solidgenetic framework in which to understand the interplaybetween ecological and evolutionary processes (Rokas &
Abbot 2009). Here, we sketch possible avenues alongwhich research in community genetics may proceed,focussing in particular on how -omics may improve ourunderstanding of the role of gene variants in speciesinteractions. First, we argue for exploring spatio-temporalvariation to investigate the fundamental ecological andevolutionary aspects of community genetics. Second, wedescribe how genomic, transcriptomic, proteomic, andmetabolomic research can improve understanding of theinteractions between trees as focal species andectomycorrhizal fungi or herbivorous insects, the keyplayers in forest ecosystems.
Community genetics in a spatio-temporalperspectiveLet us consider populations of a focal species that start todiverge genetically. Genetic drift and/or selection mayinduce shifts in allele frequencies, leading to changes inthe phenotypic traits mediating interactions withassociated species that use the focal species as a host.
Understanding the interactions of co-occurring species within and across trophic levels provides keyinformation needed for understanding the ecological and evolutionary processes that underliebiological diversity. As genetics has only recently been integrated into the study of community-levelinteractions, the time is right for a critical evaluation of potential new, gene-based approaches tostudying communities. Next generation molecular techniques, used in parallel with field-basedobservations and manipulative experiments across spatio-temporal gradients, are key to expandingour understanding of community-level processes. Here, we introduce a variety of “-omics” tools, withrecent studies of plant–insect herbivores and of ectomycorrhizal systems providing detailed examplesof how next generation approaches can revolutionize our understanding of interspecific interactions.We suggest ways that novel technologies may convert community genetics from a field that relies oncorrelative inference to one that reveals causal mechanisms of genetic co-variation and adaptationswithin communities.
Key words: ectomycorrhizal symbiosis, forest ecosystems, gene-to-gene interactions, herbivorous insects, populationgenomics, quantitative trait analysis.
Published in Molecular Ecology (2013) 22: 3198-3207, with doi:10.1111/mec.12300
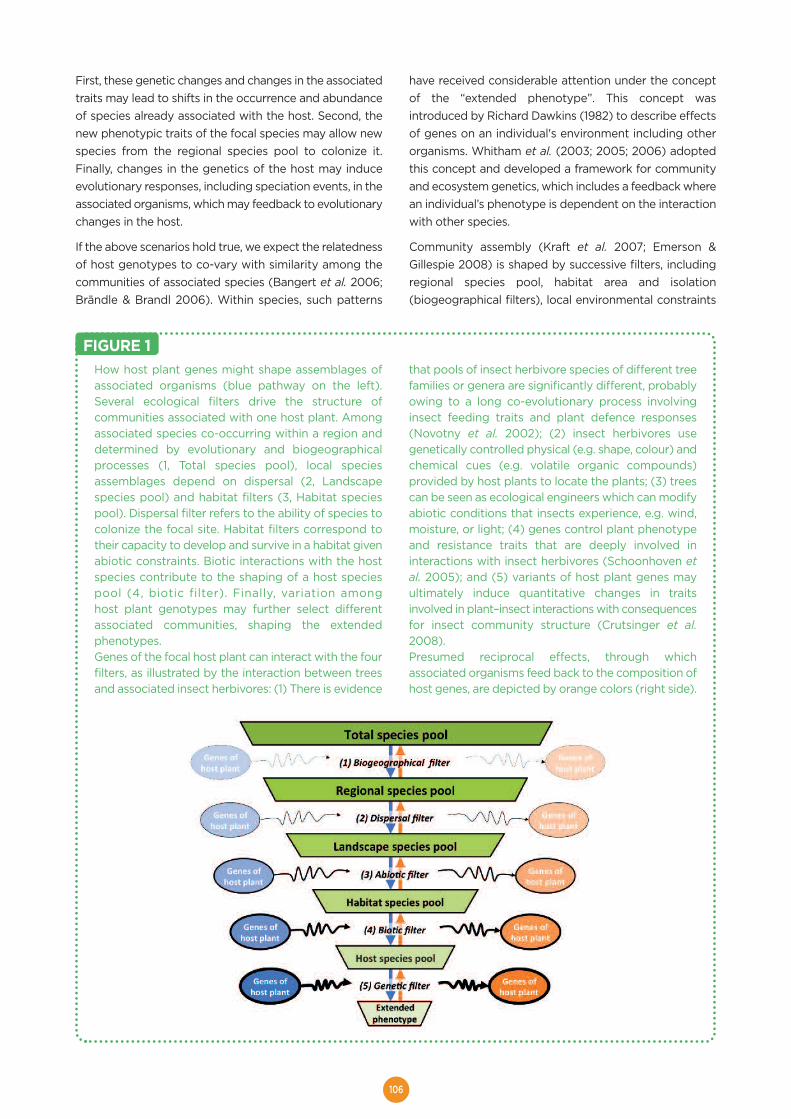
106
First, these genetic changes and changes in the associatedtraits may lead to shifts in the occurrence and abundanceof species already associated with the host. Second, thenew phenotypic traits of the focal species may allow newspecies from the regional species pool to colonize it.Finally, changes in the genetics of the host may induceevolutionary responses, including speciation events, in theassociated organisms, which may feedback to evolutionarychanges in the host.
If the above scenarios hold true, we expect the relatednessof host genotypes to co-vary with similarity among thecommunities of associated species (Bangert et al. 2006;Brändle & Brandl 2006). Within species, such patterns
have received considerable attention under the conceptof the “extended phenotype”. This concept wasintroduced by Richard Dawkins (1982) to describe effectsof genes on an individual's environment including otherorganisms. Whitham et al. (2003; 2005; 2006) adoptedthis concept and developed a framework for communityand ecosystem genetics, which includes a feedback wherean individual’s phenotype is dependent on the interactionwith other species.
Community assembly (Kraft et al. 2007; Emerson &Gillespie 2008) is shaped by successive filters, includingregional species pool, habitat area and isolation(biogeographical filters), local environmental constraints
How host plant genes might shape assemblages ofassociated organisms (blue pathway on the left).Several ecological filters drive the structure ofcommunities associated with one host plant. Amongassociated species co-occurring within a region anddetermined by evolutionary and biogeographicalprocesses (1, Total species pool), local speciesassemblages depend on dispersal (2, Landscapespecies pool) and habitat filters (3, Habitat speciespool). Dispersal filter refers to the ability of species tocolonize the focal site. Habitat filters correspond totheir capacity to develop and survive in a habitat givenabiotic constraints. Biotic interactions with the hostspecies contribute to the shaping of a host speciespool (4, biotic filter). Finally, variation amonghost plant genotypes may further select differentassociated communities, shaping the extendedphenotypes.Genes of the focal host plant can interact with the fourfilters, as illustrated by the interaction between treesand associated insect herbivores: (1) There is evidence
that pools of insect herbivore species of different treefamilies or genera are significantly different, probablyowing to a long co-evolutionary process involvinginsect feeding traits and plant defence responses(Novotny et al. 2002); (2) insect herbivores usegenetically controlled physical (e.g. shape, colour) andchemical cues (e.g. volatile organic compounds)provided by host plants to locate the plants; (3) treescan be seen as ecological engineers which can modifyabiotic conditions that insects experience, e.g. wind,moisture, or light; (4) genes control plant phenotypeand resistance traits that are deeply involved ininteractions with insect herbivores (Schoonhoven etal. 2005); and (5) variants of host plant genes mayultimately induce quantitative changes in traitsinvolved in plant–insect interactions with consequencesfor insect community structure (Crutsinger et al.2008).Presumed reciprocal effects, through whichassociated organisms feed back to the composition ofhost genes, are depicted by orange colors (right side).
FIGURE 1
107
(abiotic, biophysical filters) and biological interactionssuch as competition or predation (biotic filters; Fig. 1). Thehost genotype, interacting with the environment, mayaffect the structure of associated communities at severalfiltering steps by controlling phenotypic traits that allowassociated organisms to locate, select and exploitresources of their host (Johnson & Agrawal 2005; Baileyet al. 2009) (Fig. 1). Thus, spatial variation in thecomposition of associated communities has a strongregional component.
Despite many reports demonstrating a correlationbetween genotypes of a focal species and thecomposition of associated communities, the fundamentalecological, genetic and evolutionary processes thatgenerate this correlation remain poorly explored andrequire consideration in future studies. In this regard, threeaspects deserve special attention: spatial variation,temporal variation, and gene-to-gene interactions.
First, space needs to be better integrated into studydesigns. As noted above, the assembly of species dependson the regional species pool, whose phylogenetic andfunctional structure imposes a constraint on the emerginglocal communities (Fig. 1). A group of genotypes of a focalspecies in natural or experimental populations isembedded in a landscape context that may include forestpatches, arable land, urban environment or other habitatstype, each of which has different species pools that mightinteract with the focal species. As the associatedcommunity influences the fitness of the focal species, therelative fitness of these genotypes will vary across sites,even if the abiotic conditions are similar. However, in singlecommon garden experiments, genotypes of a focalspecies are exposed only to one particular species pool.Therefore, regional replicates of such experiments arenecessary to estimate the stability of relationshipsbetween genotypes of the focal species and communitiesof associated species. Such replicates would enable us todistinguish between mainly spatial effects and those thatcan be attributed to the interaction between hostgenotypes and associated organisms. Alternatively, onemight set up more complex common gardens includingparticular treatments, for example through fertilization orirrigation. Such an approach would allow tests of the effectof genotype x environment interactions on theassemblage of associated species for each local speciespool. Furthermore, replicated common gardenexperiments would allow constructing reaction norms ofdifferent genotypes of the focal species. Do thesegenotypes respond differentially for their extendedphenotypes to the changes of abiotic or biotic conditionsacross the testing sites? An initial step would be to identifythe shape of the reaction norms (linear or quadratic) andthen to estimate their variation among genotypes. Finally,the spatial context may also be dissected at the within-population level. For example, natural populations of treesusually exhibit strong spatial autocorrelation due to limited
dispersal, which increases steadily over generations. Onthe other hand random spatial genetic structure isobserved in recently planted forests. One would thereforeexpect very different spatial structures of extendedphenotypes among these strongly contrasting culturalregimes.
Second, community genetics should consider temporalvariation in species interactions, e.g. among seasons,among years along successional sequences, and othertypes of temporal gradients. Traits involved in plant–herbivore interactions are known to change during plantontogeny (Boege & Marquis 2005; Holeski et al. 2009),which is why communities of insect herbivores – andherbivory pressure – on seedlings and mature individualsmay differ (Le Corff & Marquis 1999; Basset 2001).Furthermore, although associated communities maychange within and between years due to fluctuations inplant phenotypes, equally they may change due todifferences in weather conditions. Thus, the phenotypictraits that are important for species interactions in aparticular season or year may change within and betweenyears, and drawing conclusions from short-termexperiments may be misleading. Although such traits, andthe underlying genes, are genuinely involved in communityinteractions, their relative importance compared to othergenes may vary in time and can therefore only beestablished in long-term experiments. Hundreds of insectgenerations interact with a long-living host such as a treeduring its lifetime, and each generation experiencesdifferent biophysical constraints and trophic interactionswith other fungi, herbivores or predators. As aconsequence, even though insect populations can adaptto individual host genotypes (Mopper et al. 2000), thestrength and direction of these adaptations are likely tochange over time (moving targets; Ruhnke et al. 2006).
Moreover, genetic processes underlie the formation ofadaptive demes and co-evolution between host andassociated organisms (Fig. 1). At present, the number andtype of genes involved and the associated phenotypes ofinteracting species are largely unknown. Recenttechnological advances enable researchers to sequencewhole genomes and to monitor gene expression ofinteracting species, offering the potential to identify thecandidate genes mediating the interactions between focaland associated species. Such approaches will movecommunity genetics from studying anonymousgenotype/phenotype effects to studying gene-to-organism, gene-to-gene, and ultimately togenome-to-genome interactions. While current researchhas focused on the few "genome-enabled" species(Ekblom & Galindo 2011), the many ongoing whole-genome projects will widen the array of study systemsapplying genomics data in the near future (e.g.http://www.arthropodgenomes.org/wiki/i5K,http://1000.fungalgenomes.org/home/,http://pinegenome.org/pinerefseq/).
108
The following sections describe how the various types of-omics may stimulate community genetics. and how theyenable the genetic component of variation in communitycomposition to be addressed at the level of variants inadaptive genes and their differential expression.
An example of functional genomicsbased on complete genome sequences:ectomycorrhizal symbiosisEctomycorrhizae, the mutualistic symbiosis between treeroots and a cortege of soil fungal partners, are the mostwidespread and species-rich associations in temperateand boreal forests. Ectomycorrhizal fungi receive carbonfrom photosynthesis and, in turn, promote tree growth,enhance the survival of seedlings and increase the fitnessof their plant partners under a wide range of environmentalconditions. Despite the ecological significance of thismutualistic interaction, we have only started to explore itsrole for community ecology.
A breakthrough was the release of the first two full-genome drafts of mycorrhizal fungi, namely Laccariabicolor (Basidiomycota) and Tuber melanosporum, thePérigord truffle (Ascomycota; Martin et al. 2008; Martin etal. 2010). Comparative genomics of the two mycorrhizalfungi indicated that they use different gene networks(‘molecular toolkits’) to establish symbiosis (Martin et al.2010). There are vast differences between these twoectomycorrhizal genomes. Laccaria bicolor has a 65 Mbgenome with more than 23 000 predicted proteins, whichis the largest complement of genes known for any fungus,whereas T. melanosporum has the largest fungal genomeso far with 125 Mb, but has only 7500 predicted genes, oneof the smallest complement of proteins in any filamentousfungal genomes sequenced so far. Also, whereas thesecretion of effector-like small secreted proteins seems tobe crucial for the establishment of the symbiosis in L.bicolor (Plett et al. 2011), these so-called mycorrhiza-induced small secreted proteins (MiSSPs) are not presentin the transcriptome of T. melanosporum symbiotic tissue(Martin et al. 2010). In spite of these differences,, somecommon features and some novelties emerged from thecomparison with genomes of saprophytic and pathogenicfungi. Besides the loss of plant cell-wall degradingenzymes in ectomycorrhizae, an increase in the diversityand expression of nutrient transporters and signallingpathways (e.g. tyrosine kinases) in symbiotic tissues arehallmarks of mycorrhizal genomes (Martin et al. 2008;Kosti et al. 2010; Martin et al. 2010; Plett et al. 2011). Thesesymbiosis-related genes are good candidates for geneexpression studies of multi-species interactions in the field.On the tree side, it is not known how the host tree selectsits symbiotic associates. Plant-encoded small secretedproteins may be required, as shown for nitrogen-fixingsymbioses (Van de Velde et al. 2010). Genomic studies willprobably be the only way to elucidate the mechanisms of
interaction and to understand the effect of gene variantson this interplay. Therefore, we think that this system is anexciting model for community genetics in the -omics era.
Ectomycorrhizal fungi show a continuum of specializationto the host tree from strict specialists to generalists.Differences in the expansion of multigene families, inparticular dynamic repertoires of genes encoding smallsecreted proteins and sugar-cleaving enzymes, might beresponsible for the different host ranges of specialists,such as T. melanosporum, and generalists, such as L.bicolor (Martin et al. 2010). That is, the genome expansionobserved in L. bicolor might be driven by selection of thesymbiont to exploit diverse substrates provided bymultiple potential hosts and by diverse soils. As moregenomes of mycorrhizal fungi are sequenced (Martin et al.2011), this hypothesis will become testable.
In addition to the genomics of host–symbiont interactions,studies of geographical patterns of co-evolution add toour knowledge of processes leading to reciprocaladaptation and specialization. There are only a handful ofstudies reporting the structure of geographic variation andpatterns of co-evolution in mycorrhizal interactions,indicating that these patterns are geographically highlyvariable (Hoeksema 2010; Hoeksema et al. 2012). To date,mostly higher-level traits, such as intensity of mycorrhizalcolonization or growth of host trees, have been studied.Several of these studies found significant genetic variationin either the host plant or the mycorrhizal fungus in itsecological effect on the other partner. For example, therelationship between the colonization intensity of theectomycorrhizal fungus Thelephora terrestris and thegrowth of its host, Lodgepole pine (Pinus contorta),depends on the tree’s genotype (Karst et al. 2009). Inpoplar, both the intensity of colonization and the amountof enzymes secreted by poplar root tips colonized by L.bicolor are under the genetic control of the host (Courtyet al. 2011). Similar findings come from arbuscularmycorrhizal systems, where host identity has a strongeffect on the fitness of different strains of Glomusintraradices (Ehinger et al. 2009).
An increasing body of evidence shows that subtleintraspecific differences in the genome of host plantsdetermine the composition of interacting communities inmycorrhizal fungi (e.g. Korkama et al. 2006; Whitham etal. 2006; Sthultz et al. 2009; Karliński et al. 2010; Leski etal. 2010; Hoeksema et al. 2012). We have experimentalevidence that such as intraspecific genetic variation in thehost also affects the composition of interactingmycorrhizal populations (Hoeksema & Thompson 2007),but this has not yet been tested under natural conditions.To understand the links between structure and diversity ofcommunities and ecosystem functioning, we need to knowmore about spatio-temporal patterns of genetic variation.There are indications that both interspecific (e.g. van derHeijden et al. 1998; Maherali & Klironomos 2007) andintraspecific (e.g. Johnson et al. 2012) diversity of
109
mycorrhizal fungi can regulate productivity and ecosystemfunctioning. We advocate studies of community andpopulation diversity in forests and combining them withfunctional field studies, involving both partners ofectomycorrhizal symbioses. Numerous new techniques areemerging for gene expression studies, marker geneevaluation using comparative genomics, and enzymeactivity profiling of whole ectomycorrhizal assemblages(Courty et al. 2010). The rapid development of high-throughput sequencing technologies facilitates the surveyand comparison of whole microbial communities (Buée etal. 2009), although analysis, interpretation, and publicationof data still needs to be optimized (Henrik Nilsson et al.2012). Nevertheless, combined genotypic and functionalstudies are now feasible and may be expanded to naturaland experimental gradients. Several reports indicate thatsoil microbe and mycorrhizal diversity differentially affectecosystem functioning under different environmentalconditions, e.g. nutrient status (van der Heijden et al.2008). We also know that plant-associated microorganismsare an important factor influencing plant responses toclimate change (Courty et al. 2010; Pickles et al. 2012).Combined genotypic and functional studies in diverseenvironments will help to understand current patterns andto predict changes and effects in the future.
Associations between genes and traits:potential of next generation approachesin community geneticsAn essential part of future studies in community geneticswill be to identify the genes that underlie the traits of hoststhat affect associated organisms. For this, sequencing ofthe complete genome of a host species is not sufficient.Rather, it is essential to link the presence or action ofparticular variants of genes or genomic regions of a hostplant to the presence or abundance of associatedorganisms or arrays of their genes. There are basically twostrategies for this, namely QTL mapping and genome-wideassociation studies (GWAS). We briefly outline andillustrate below the pros and cons of these two approachesfor community genetics.
An example of QTL mapping of community traits of poplaris a study aimed at identifying genomic regions associatedwith susceptibility to insects (DeWoody et al. unpubl.data).Parents and progeny of a poplar (Populus trichocarpa × P.deltoides) F2 mapping population were assessed forvarious categories of leaf damage, including chewers andskeletonizers. The damage levels significantly variedamong offspring genotypes. Each category was treatedas a quantitative trait in a QTL mapping approach andmore than ten QTLs were detected. QTLs also variedseasonally, suggesting that the insect communityresponds to traits and the underlying genetic variationover time. This underlines the importance of consideringtemporal variation in studies of community genetics, asnoted above.
Another example is a study on QTLs affectingectomycorrhizal symbiosis in a P. deltoides × P. trichocarpaF1 population (Labbé et al. 2011). Four identified QTLswere associated with candidate genes, and differentialtranscript levels were assessed with the help of a whole-genome microarray. The transcripts with the highestoverrepresentation were, based on their gene ontology, inthe repress defense mechanisms and in pathogenresistance.
Relatively few mapping populations have been producedfor long-lived tree species, due to the length of timeneeded to maintain and study them, and the high costsassociated with it. As a single cross will not contain allalleles present in a large population of an outcrossingspecies, not all QTLs can be detected in a single cross, andmost QTL interactions will go unnoticed. Hence, severalpopulations are necessary, and producing them would bean important investment. Next to full-sib families it may bepossible to use full or partial diallel designs with multipleparents, so that more alleles are included and many moreallele combinations can be studied, similar to MAGICpopulations (Kover et al. 2009) but without the need forselfing to multiply and maintain the population.
In the meantime, an elegant alternative for forest trees isto use existing progeny trials. Many of these have beenestablished and often replicated at different locations, andphenotypic data are usually available for extensive periodsof time. Many trials consist of half-sib families, in which thealleles from the mother segregate in the progeny. If only alimited number of fathers were involved, genotyping mayeven allow them to be split into a few interconnected full-sib families. Common garden experiments often include asample of the diversity of an area. When theseexperiments are replicated at multiple sites, it may bepossible to perform genome-wide association mappingwith the advantage of multi-site / multi-year data. An issue for community genetics, as mentioned above, isthat the local species pool may be different between thelocations of the trials. This can be tackled efficiently byreplicating the populations and planting them in differentlocations. Replicated populations will also spread the riskof losing individual members of the populations.
After finding a QTL region based on the presence of anassociated organism or, for example, damage caused byan insect species, the underlying mechanism can beunravelled, in this case by measuring the secondarycompound composition of all progeny trees and locatingsuch traits on the genetic map. Co-localization of acompound with a QTL would suggest that it wasresponsible for the effect on the insects and that astructural or regulatory gene involved in its synthesis islocated in that genomic region. In some species, this canbe tested by mutant analysis, but it is not practical withtrees. Alternatively, one could analyse the naturallyoccurring genetic variation in a large set of unrelated trees
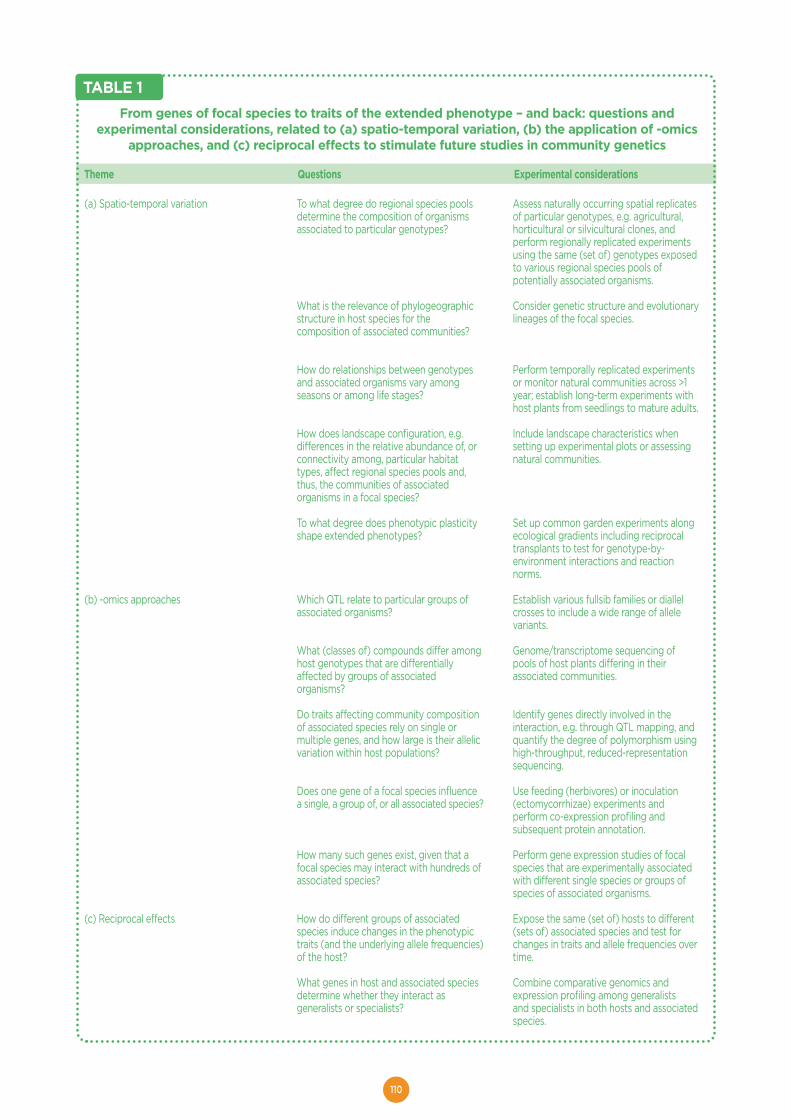
110
From genes of focal species to traits of the extended phenotype – and back: questions andexperimental considerations, related to (a) spatio-temporal variation, (b) the application of -omics
approaches, and (c) reciprocal effects to stimulate future studies in community genetics
Theme Questions Experimental considerations
TABLE 1
(a) Spatio-temporal variation
(b) -omics approaches
(c) Reciprocal effects
To what degree do regional species poolsdetermine the composition of organismsassociated to particular genotypes?
What is the relevance of phylogeographicstructure in host species for thecomposition of associated communities?
How do relationships between genotypesand associated organisms vary amongseasons or among life stages?
How does landscape configuration, e.g.differences in the relative abundance of, orconnectivity among, particular habitattypes, affect regional species pools and,thus, the communities of associatedorganisms in a focal species?
To what degree does phenotypic plasticityshape extended phenotypes?
Which QTL relate to particular groups ofassociated organisms?
What (classes of) compounds differ amonghost genotypes that are differentiallyaffected by groups of associatedorganisms?
Do traits affecting community compositionof associated species rely on single ormultiple genes, and how large is their allelicvariation within host populations?
Does one gene of a focal species influencea single, a group of, or all associated species?
How many such genes exist, given that afocal species may interact with hundreds ofassociated species?
How do different groups of associatedspecies induce changes in the phenotypictraits (and the underlying allele frequencies)of the host?
What genes in host and associated speciesdetermine whether they interact asgeneralists or specialists?
Assess naturally occurring spatial replicatesof particular genotypes, e.g. agricultural,horticultural or silvicultural clones, andperform regionally replicated experimentsusing the same (set of) genotypes exposedto various regional species pools ofpotentially associated organisms.
Consider genetic structure and evolutionarylineages of the focal species.
Perform temporally replicated experimentsor monitor natural communities across >1year; establish long-term experiments withhost plants from seedlings to mature adults.
Include landscape characteristics whensetting up experimental plots or assessingnatural communities.
Set up common garden experiments alongecological gradients including reciprocaltransplants to test for genotype-by-environment interactions and reactionnorms.
Establish various fullsib families or diallelcrosses to include a wide range of allelevariants.
Genome/transcriptome sequencing ofpools of host plants differing in theirassociated communities.
Identify genes directly involved in theinteraction, e.g. through QTL mapping, andquantify the degree of polymorphism usinghigh-throughput, reduced-representationsequencing.
Use feeding (herbivores) or inoculation(ectomycorrhizae) experiments andperform co-expression profiling andsubsequent protein annotation.
Perform gene expression studies of focalspecies that are experimentally associatedwith different single species or groups ofspecies of associated organisms.
Expose the same (set of) hosts to different(sets of) associated species and test forchanges in traits and allele frequencies overtime.
Combine comparative genomics andexpression profiling among generalistsand specialists in both hosts and associatedspecies.
111
with different combinations of compounds and conductassociation tests (i.e. GWAS).
Genome-wide association studies assume that, in theabsence of population substructure, markers that arephysically linked to a gene associated with a phenotype ofa trait can be distinguished from markers that are notlinked, as the latter are assumed to occur randomly inindividuals of the population regardless of the phenotype(Nordborg & Weigel 2008). There is no need to constructa mapping population as in QTL detection, but a referencegenome or a dense genetic map in combination withsufficient linkage disequilibrium (LD) are required (Kim etal. 2007). LD appears to be limited in tree species(Ingvarsson 2005; Heuertz et al. 2006; Pyhäjärvi et al.2007), which implies that high-density genetic markerarrays are needed for applying association mapping andthat many more individuals need to be studied. Forinstance, Fournier-Level et al. (2009) tested targetcandidate genes and identified the functional variationresponsible for the observed variation in anthocyaninvariation in grape by association analysis. The very low LDoften encountered in natural tree populations (Neale &Savolainen 2004) will assist in finding many of the possiblecombinations of compounds, thus increasing the power ofthe association study. A new approach, becoming feasiblebecause of high-throughput sequencing technology, is topool and sequence DNA from multiple individuals withina population with clearly distinct phenotypes or habitatconditions (Turner et al. 2010), and to identify thosemarkers across the genome that display a large differencein allelic frequency between the pooled groups(Holderegger et al. 2008). The advantage of this‘population resequencing’ approach, which vaguelyresembles bulked segregant analysis (BSA), is that nomapping population or extensive LD is necessary; thedrawback is that an annotated genome is still needed forreference. Since annotated genome sequences areincreasingly becoming available, this will be less of aproblem in the future. The approach can be readilyextended to polygenic traits (Heard et al. 2010). Apotential application to community genetics in trees wouldbe to pool the DNA from trees that host a particular insectwith DNA from those that do not, and compare thesequenced genomes of the two groups.
Next generation methods now enable genotyping-by-sequencing (Baird et al. 2008). In the context ofsegregating populations, restriction-site associated DNA(RAD) markers or transcriptome sequencing permit directmapping-by-sequencing, thus skipping markerdevelopment altogether (Hartwig et al. 2012; Zhu et al.2012). In QTL mapping this solves the problem ofgenerating dense maps, so that the limiting factor for highresolution is the number of recombinations or the size ofthe segregating population. As forest trees have very smallLD, the ability to generate high volumes of genomic datais a very promising development for GWAS.
Gene expression profiling, a complementary approach toassociation genomics as a strategy for functionalgenomics, is also being revolutionized by developments innext generation technologies. Gene expression profilinghas been applied to study stress response in trees, forexample following insect attack where transcript analysesby cDNA microarray profiles have been combined with 2-D protein and protein spectrometric analyses (Lippert etal. 2007). In this pioneering work on pines and pineweevils, the authors demonstrated that transcripts andtheir proteins were complimentary. Next generationsequencing of tagged cDNA ends now enablesresearchers to quantify the number of transcripts fromdifferent subsets of individuals (Xu et al. 2009). Given theavailability of gene annotations, the transcripts will beassociated with gene models and their regulators usingpublicly available databases. We expect that co-expressionprofiling will become feasible for populations as well as forindividual ontogenetic stages of interacting species. Suchan approach may also be scaled up from two-speciesinteractions to multiple-species interactions, i.e. a true'community transcriptome' approach.
Proteomic approaches allow for an efficient andsimultaneous detection of the proteins in a sample. Theproteome composition to some extent integratesfluctuations in expression over a period of time, thuspotentially being robust with regard to sampling time inthe field. The identification of peptides relies on either alarge, high-quality RNA-seq dataset, a complete set ofalleles from a multigene family, or the genome sequence.An example is the use of peptide identification (Q-TOF LC-MSE) for fast screening of Bet v 1 isoforms in pollen ofvarious birch species, as it was possible to determine bothpresence and relative abundances of individual isoforms(Schenk et al. 2009). For this, the mass spectra obtainedfrom the pollen were compared with a set of predictedpeaks based on a complete set of isoforms obtained bysequencing the genes. In species for which the genomesequence or a large amount of transcriptome data isavailable, this prediction becomes a relatively simplebioinformatics exercise.
Other -omics techniques, such as metabolomics, may beemployed in similar experimental schemes. Recentadvances have increased the sensitivity and throughput ofmetabolomics and proteomics assays (‘next-genbiochem’). Now, one can directly map QTL controlling themetabolic profile of all offspring of a cross. For instance,untargeted GC-TOF-MS metabolite profiling allowedmapping of 100 mQTLs (Carreno-Quintero et al. 2012). Themain drawbacks of metabolomics are the higher costs andthe problem of interfering factors due to the differentgrowing conditions of the trees included in the associationanalysis. Moreover the samples cannot be all taken at thesame time. On the other hand, the compounds measuredare also the ones that affect the interaction withassociated insect species. So if genetic variation in multiple
112
genes affects the content of one important compound, theassociation of the compound with presence or absence ofone or more insect species will be stronger than that ofeach of the underlying genes, and the association will alsobe more informative on the mechanism of the interaction.Even GWAS could be done in this way. In our exampleusing a pool of trees including those that host a particularinsect and those that do not, a comparison of compoundsmay be more straightforward than comparing DNAmarkers. In particular, if the insect is not always present onthe same trees across years, the compounds present ineach tree in each year could reveal a strong correlation,whereas the genes that enable the tree to produce thecompounds would not.
If, as indicated above, a compound affects the presence ofinsect species, then one would expect, reciprocally, thepresence of catabolites of the compound in insect speciesthat tolerate the compound, when these insects aresampled on the trees that produce it. This can be used toexperimentally validate the statistical associationsbetween compounds in the tree and the presence of insectspecies or guilds, and for a starting point forunderstanding the mechanisms behind the interactionsbetween trees and insects.
PerspectivesA suite of -omics approaches is available to pave the wayfor studying entire communities. Accordingly, we need torefine hypotheses and develop suitable study designs andstatistical tools (Augustin et al. 2010; Ovaskainen et al.2010), which will improve implementation once reducedcosts make these tools applicable to large-scale samplingof community-level interactions (Table 1).
As outlined above, we see two main directions that shouldbe followed in community genetics to substantiateinference on the interplay of genes, organisms,communities, and their respective environments. First,joint descriptive and experimental studies should includespatial and temporal gradients to account forenvironmental variation in these dimensions (Thompson2005; Crutsinger et al. 2009; Tack et al. 2010). Second,researchers in community genetics should make betteruse of the exponentially increasing genomic informationbecoming available, which will requires solid expertise inbioinformatics. If this is achieved, gene-to-gene interactionscan be explored in individual-based associations and atthe level of entire communities and shift communitygenetics towards becoming community genomics.
Moreover, community genetics goes beyond the effects ofgenotypes in one species on the community of associatedorganisms. We also need to consider the reciprocal effectsof how associated communities shape the genotypiccomposition of their hosts and of how the genotypes ofassociated species affect host communities (Fig. 1). There
are virtually no studies available on this aspect ofcommunity interactions, which leaves a wide-open field ofempirical research for the future. Exploring reciprocalinteractions might help to extrapolate populationgenomics and quantitative genomics of focal species. Wewill then need to adopt a community-based understandingof selection and drift as well as to include G x G x Einteractions into reaction norm calculations. However,elaborating on this subject goes beyond the scope of thepresent article.
In conclusion, we believe that the amalgamation oftraditional population genetics, quantitative genetics andecology, fostered by the advent of new genomictechnologies, will revolutionise our perception ofcommunity and ecosystem processes and pushcommunity genetics into a new era.
AcknowledgmentsOur sincere thanks go to Rolf Holderegger and theanonymous reviewers for helpful comments on earlierversions of the manuscript. Karen A. Brune and StephenCavers provided linguistic editing. This work was financedthrough the EC-supported Network of Excellence Evoltree(GOCE-016322).
REFERENCESAgrawal AA (2003) Community genetics: new insightsinto community ecology by integrating populationgenetics. Ecology, 84, 543–544.
Augustin S, Denux O, Castagneyrol B et al. (2010) Insectherbivory response to Populus nigra genetic diversity. FifthInternational Symposium, Poplars and willows: fromresearch models to multipurpose trees for a bio-basedsociety. Orvieto, Sept. 20–25, 2010, p. 207.
Bailey JK, Hendry AP, Kinnison MT et al. (2009) Fromgenes to ecosystems: an emerging synthesis of eco-evolutionary dynamics. New Phytologist, 184, 746–749.
Baird NA, Etter PD, Atwood TS et al. (2008) Rapid SNPdiscovery and genetic mapping using sequenced RADmarkers. PLoS One, 3, e3376.
Bangert RK, Turek RJ, Rehill B, Wimp GM, Bailey JK,Whitham TG (2006) A genetic similarity rule determinesarthropod community structure. Molecular Ecology, 15,1379–1391.
Basset Y (2001) Communities of insect herbivores foragingon saplings versus mature trees of Pourouma bicolor(Cecropiaceae) in Panama. Oecologia, 129, 253–260.
Boege K, Marquis RJ (2005) Facing herbivory as you growup: the ontogeny of resistance in plants. Trends in Ecology& Evolution, 20, 441–448.
Brändle M, Brandl R (2006) Is the composition ofphytophagous insects and parasitic fungi among treespredictable? Oikos, 113, 296–304.
Buée M, Reich M, Murat C et al. (2009) 454Pyrosequencing analyses of forest soils reveal anunexpectedly high fungal diversity. New Phytologist, 184,449–456.
113
Carreno-Quintero N, Acharjee A, Maliepaard C et al. (2012)Untargeted metabolic quantitative trait loci analyses reveala relationship between primary metabolism and potatotuber quality. Plant Physiology, 158, 1306-1318.
Courty P-E, Buée M, Diedhiou AG et al. (2010) The role ofectomycorrhizal communities in forest ecosystemprocesses: New perspectives and emerging concepts. SoilBiology & Biochemistry, 42, 679–698.
Courty PE, Labbé J, Kohler A et al. (2011) Effect of poplargenotypes on mycorrhizal infection and secreted enzymeactivities in mycorrhizal and non-mycorrhizal roots.Journal of Experimental Botany, 62, 249–260.
Crutsinger GM, Cadotte MW, Sanders NJ (2009) Plantgenetics shapes inquiline community structure acrossspatial scales. Ecology Letters, 12, 285–292.
Crutsinger GM, Reynolds WN, Classen AT, Sanders NJ(2008) Disparate effects of plant genotypic diversity onfoliage and litter arthropod communities. Oecologia, 158,65–75.
Dawkins R (1982) The Extended Phenotype: The Gene asthe Unit of Selection. Freeman, Oxford.
Ehinger M, Koch AM, Sanders IR (2009) Changes inarbuscular mycorrhizal fungal phenotypes and genotypesin response to plant species identity and phosphorusconcentration. New Phytologist, 184, 412–423.
Ekblom R, Galindo J (2011) Applications of next generationsequencing in molecular ecology of non-model organisms.Heredity, 107, 1–15.
Emerson BC, Gillespie RG (2008) Phylogenetic analysis ofcommunity assembly and structure over space and time.Trends in Ecology & Evolution, 23, 619–630.
Fournier-Level A, Cunff LL, Gomez C et al. (2009)Quantitative genetic bases of anthocyanin variation ingrape (Vitis vinifera L. ssp. sativa) berry: A quantitative traitlocus to quantitative trait nucleotide integrated study.Genetics, 183, 1127–1139.
Hartwig B, Velikkakam James G, Konrad KK, SchneebergerK, Turck F (2012) Fast isogenic mapping-by-sequencing ofethyl methanesulfonate-induced mutant bulks. PlantPhysiology, 160, 591–600.
Heard E, Tishkoff S, Todd JA et al. (2010) Ten years ofgenetics and genomics: what have we achieved and whereare we heading? Nature Reviews Genetics, 11, 723–733.
Henrik Nilsson R, Tedersoo L, Lindahl BD et al. (2012)Towards standardization of the description and publicationof next-generation sequencing datasets of fungalcommunities. New Phytologist, 191, 314–318.
Heuertz M, de Paoli E, Källmann T et al. (2006) Multilocuspatterns of nucleotide diversity, linkage disequilibrium anddemographic history of Norway spruce [Picea abies (L.)Karst]. Genetics, 174, 2095–2105.
Hoeksema JD (2010) Ongoing coevolution in mycorrhizalinteractions. New Phytologist, 187, 286–300.
Hoeksema JD, Hernandez JV, Rogers DL, Mendoza LL,Thompson JN (2012) Geographic divergence in a species-rich symbiosis: Interactions between Monterey pines andectomycorrhizal fungi. Ecology, 93, 2274-2285.
Hoeksema JD, Thompson JN (2007) Geographic structurein a widespread plant–mycorrhizal interaction: pines andfalse truffles. Journal of Evolutionary Biology, 20, 1148–1163.
Holderegger R, Herrmann D, Poncet B et al. (2008) Landahead: using genome scans to identify molecular markersof adaptive relevance. Plant Ecology and Diversity, 1,273–283.
Holeski LM, Kearsley MJC, Whitham TG (2009) Separatingontogenetic and environmental determination ofresistance to herbivory in cottonwood. Ecology, 90,2969–2973.
Ingvarsson PK (2005) Nucleotide polymorphism andlinkage disequilibrium within and among naturalpopulations of European aspen (Populus tremula L.,Salicaceae). Genetics, 169, 945–953.
Johnson D, Martin F, Cairney J, Anderson IC (2012) Theimportance of individuals: intraspecific diversity ofmycorrhizal plants and fungi in ecosystems. NewPhytologist, 194, 614–628.
Johnson MTJ, Agrawal AA (2005) Plant genotype andenvironment interaction to shape a diverse arthropodcommunity on evening primrose (Oenothera biennis).Ecology, 86, 874–885.
Johnson MTJ, Stinchcombe JR (2007) An emergingsynthesis between community ecology and evolutionarybiology. Trends in Ecology & Evolution, 22, 250–257.
Karliński L, Rudawska M, Kieliszewska-Rokicka B, Leski T(2010) Relationship between genotype and soilenvironment during colonization of poplar roots bymycorrhizal and endophytic fungi. Mycorrhiza, 20, 315-324.
Karst J, Jones M, Turkington R (2009) Ectomycorrhizalcolonization and intraspecific variation in growthresponses of lodgepole pine. Plant Ecology, 200, 161–165.
Kim S, Plagnol V, Hu TT et al. (2007) Recombination andlinkage disequilibrium in Arabidopsis thaliana. NatureGenetics, 39, 1151–1155.
Korkama T, Pakkanen A, Pennanen T (2006)Ectomycorrhizal community structure varies amongNorway spruce (Picea abies) clones. New Phytologist, 171,815–824.
Kosti I, Mandel-Gutfreund Y, Glaser F, Horwitz B (2010)Comparative analysis of fungal protein kinases andassociated domains. BMC Genomics, 11, 133.
Kover PX, Valdar W, Trakalo J et al. (2009) A multiparentadvanced generation nter-cross to fine-map quantitativetraits in Arabidopsis thaliana. PLoS Genetics, 5, e1000551.
Kraft NJB, Cornwell WK, Webb CO, Ackerly DD (2007)Trait evolution, community assembly, and the phylogeneticstructure of ecological communities. American Naturalist,170, 271–283.
Labbé J, Jorge V, Kohler A et al. (2011) Identification ofquantitative trait loci affecting ectomycorrhizal symbiosisin an interspecific F1 poplar cross and differentialexpression of genes in ectomycorrhizas of the two parents:Populus deltoides and Populus trichocarpa. Tree Genetics& Genomes, 7, 617–627.
Le Corff J, Marquis RJ (1999) Differences betweenunderstorey and canopy in herbivore communitycomposition and leaf quality for two oak species inMissouri. Ecological Entomology, 24, 46–58.
Leski T, Aučina A, Skridaila A, Pietras M, Riepšas E,Rudawska M (2010) Ectomycorrhizal community structureof different genotypes of Scots pine under forest nurseryconditions. Mycorrhiza, 20, 473–481.
114
Lippert D, Chowrira S, Ralph SG et al. (2007) Coniferdefense against insects: Proteome analysis of Sitka spruce(Picea sitchensis) bark induced by mechanical woundingor feeding by white pine weevils (Pissodes strobi).Proteomics, 7, 248–270.
Maherali H, Klironomos JN (2007) Influence of phylogenyon fungal community assembly and ecosystemfunctioning. Science, 316, 1746–1748.
Martin F, Aerts A, Ahren D et al. (2008) The genome ofLaccaria bicolor provides insights into mycorrhizalsymbiosis. Nature, 452, 88–92.
Martin F, Cullen D, Hibbett D et al. (2011) Sequencing thefungal tree of life. New Phytologist, 190, 818–821.
Martin F, Kohler A, Murat C et al. (2010) Perigord blacktruffle genome uncovers evolutionary origins andmechanisms of symbiosis. Nature, 464, 1033–1038.
Mopper S, Stiling P, Landau K, Simberloff D, Van Zandt P(2000) Spatiotemporal variation in leafminer populationstructure and adaptation to individual oak trees. Ecology,81, 1577–1587.
Nadeau NJ, Jiggins CD (2010) A golden age forevolutionary genetics? Genomic studies of adaptation innatural populations. Trends in Genetics, 26, 484–492.
Neale DB, Savolainen O (2004) Association genetics ofcomplex traits in conifers. Trends in Plant Science, 9,325–330.
Nordborg M, Weigel D (2008) Next-generation geneticsin plants. Nature, 456, 720–723.
Novotny V, Basset Y, Miller SE et al. (2002) Low hostspecificity of herbivorous insects in a tropical forest.Nature, 416, 841–844.
Ovaskainen O, Nokso-Koivista J, Hottola J et al. (2010)Identifying wood-inhabiting fungi with 454 sequencing –what is the probability that BLAST gives the correctspecies? Fungal Ecology, 3, 274–283.
Pickles BJ, Egger KN, Massicotte HB, Green DS (2012)Ectomycorrhizas and climate change. Fungal Ecology, 5,73–84.
Plett J, Kemppainen M, Kale S et al. (2011) A secretedeffector protein of Laccaria bicolor is required forsymbiosis development. Current Biology, 21, 1197–1203.
Pyhäjärvi T, Rosario García-Gil M, Knürr T, Mikkonen M,Wachowiak W, Savolainen O (2007) Demographic historyhas influenced nucleotide diversity in European Pinussylvestris populations. Genetics, 177, 1713–1724.
Rokas A, Abbot P (2009) Harnessing genomics forevolutionary insights. Trends in Ecology and Evolution, 24,192–200.
Rowntree JK, Shuker DM, Preziosi RF (2011) Forward fromthe crossroads of ecology and evolution. PhilosophicalTransactions of the Royal Society B: Biological Sciences,366, 1322–1328.
Ruhnke H, Schädler M, Matthies D, Klotz S, Brandl R (2006)Are sawflies adapted to individual host trees? A test of theadaptive deme formation hypothesis. EvolutionaryEcology Research, 8, 1039–1048.
Schenk MF, Cordewener JHG, America AHP, van'tWestende WPC, Smulders MJM, Gilissen LJWJ (2009)Characterization of PR-10 genes from eight Betula speciesand detection of Bet v 1 isoforms in birch pollen. BMC PlantBiology, 29, 24.
Schoonhoven LM, Loon JJAv, Dicke M (2005) Insect–PlantBiology, 2nd edn. Oxford University Press, New York.
Sthultz CM, Whitham TG, Kennedy K, Deckert R, GehringCA (2009) Genetically based susceptibility to herbivoryinfluences the ectomycorrhizal fungal communities of afoundation tree species. New Phytologist, 184, 657–667.
Tack AJM, Ovaskainen O, Pulkkinen P, Roslin T (2010)Spatial location dominates over host plant genotype instructuring an herbivore community. Ecology, 91, 2660–2672.
Thompson JN (2005) The geographic mosaic ofcoevolution. University of Chicago Press, Chicago.
Turner TL, Bourne EC, Von Wettberg EJ, Hu TT, NuzhdinSV (2010) Population resequencing reveals localadaptation of Arabidopsis lyrata to serpentine soils. NatureGenetics, 42, 260–263.
Van de Velde W, Zehirov G, Szatmari A et al. (2010) Plantpeptides govern terminal differentiation of bacteria insymbiosis. Science, 327, 1122–1126.
van der Heijden MGA, Bardgett RD, Van Straalen NM(2008) The unseen majority: soil microbes as drivers ofplant diversity and productivity in terrestrial ecosystems.Ecology Letters, 11, 296–310.
van der Heijden MGA, Klironomos JN, Ursic M et al. (1998)Mycorrhizal fungal diversity determines plant biodiversity,ecosystem variability and productivity. Nature, 396, 69–72.
Whitham TG, Bailey JK, Schweitzer JA et al. (2006) Aframework for community and ecosystem genetics: fromgenes to ecosystems. Nature Reviews Genetics, 7, 510–523.
Whitham TG, Lonsdorf EV, Schweitzer JA et al. (2005) "Alleffects of a gene on the world": Extended phenotypes,feedbacks, and multi-level selection. Ecoscience, 12, 5–7.
Whitham TG, Young WP, Martinsen GD et al. (2003)Community and ecosystem genetics: a consequence ofthe extended phenotype. Ecology, 84, 559–573.
Wymore AS, Keeley ATH, Yturralde KM, Schroer ML,Propper CR, Whitham TG (2011) Genes to ecosystems:exploring the frontiers of ecology with one of the smallestbiological units. New Phytologist, 191, 19–36.
Xu WJ, Wang ZX, Qiao ZD (2009) Modified PCR methodsfor 3’ end amplification from serial analysis of geneexpression (SAGE) tags. FEBS Journal, 276, 2657-2668.
Zhu Y, Mang H-g, Sun Q, Qian J, Hipps A, Hua J (2012)Gene discovery using mutagen-induced polymorphismsand deep sequencing: application to plant diseaseresistance Genetics, 192, 139–146.
Author contributionAll authors have conceptually contributed to thecontent of the present article through their activeinvolvement and the many discussions held duringthe EvolTree Jointly Executed Research Activity 3(JERA 3) on community ecology, which wasmanaged by BZ. FG designed and organized thearticle preparation, FG, RB, BC, HJ, MP, MJMS, andBZ drafted the various sections, and all main authorsparticipated in the writing of the final text.
115
LONG DISTANCE GENE FLOWAND ADAPTATION OF FOREST TREESTO RAPID CLIMATE CHANGE
Antoine Kremer1,2†, Ophélie Ronce3†, Juan J. Robledo-Arnuncio4, Frédéric Guillaume5, Gil Bohrer6, Ran Nathan7,Jon R. Bridle8, Richard Gomulkiewicz9, Etienne K. Klein10,Kermit Ritland11, Anna Kuparinen12, Sophie Gerber13,2,Silvio Schueler14
1 INRA, UMR1202 Biodiversité Gènes et Communautés, Cestas, F-33610, France;email: [email protected]
2 Université de Bordeaux, UMR1202 Biodiversité Gènes et Communautés,Talence, F-33410, France;
3 Université Montpellier 2 - CNRS, Institut des Sciences de l’Evolution, F-34095Montpellier, Cedex 05, France; email: [email protected]
4 Department of Forest Ecology and Genetics, Forest Research Centre (CIFOR),INIA, 28040 Madrid, Spain; email: [email protected]
5 ETH, Department of Environmental Sciences, Universitätstrasse 16, 8092Zürich, Switzerland; email: [email protected]
6 Department of Civil, Environmental & Geodetic Engineering, Ohio StateUniversity, Columbus, OH 43210, USA; email: [email protected]
7 Movement Ecology Laboratory, Department of Ecology, Evolution andBehavior, The Alexander Silberman Institute of Life Sciences, The HebrewUniversity of Jerusalem, Edmond J. Safra Campus, Jerusalem 91904, Israel;
email: [email protected] School of Biological Sciences, University of Bristol, Bristol, BS8 IUG, UK; email:
[email protected] School of Biological Sciences and Department of Mathematics, Washington
State University, Pullman, Washington 99164, USA; email: [email protected] INRA, UR Biostatistiques & Processus Spatiaux 546, F-84914 Avignon, France;
email: [email protected] Department of Forest Sciences, University of British Columbia, Vancouver, BC
V6T 1Z4, Canada; email: [email protected] Ecological Genetics Research Unit, Department of Biosciences, University of
Helsinki, Helsinki FI-00014, Finland; e-mail: [email protected] INRA, UMR1202 Biodiversité Gènes et Communautés, Cestas, F-33610,
France; email: [email protected] Federal Research and Training Centre for Forests, Natural Hazards and
Landscape, Seckendorf-Gudent-Weg 8, 1131 Wien, Austria; email:[email protected]
† Co-first authors
Corresponding Author:Antoine Kremer, INRAUMR1202 Biodiversité Gènes et Communautés 69 route d’Arcachon,Cestas, F-33610, FranceEmail: [email protected]
Introduction While evidence of climate change and its impact onworld’s biota is steadily increasing, so are our concernsabout the biological or human mediated capacities ofspecies and populations to cope with these changes(Solomon et al. 2007). Such concerns are presumablymore acute for sedentary and long lived organisms suchas trees, which are less likely to track favourable conditionsfast enough by migration. Furthermore, trees constitute alarge ecologically and economically important functionalgroup of woody plants that dominate many terrestrialecosystems in regions where the most pronounced climatechanges are projected to occur. The near-surfacetemperature is expected to shift northwards in mean ratesof 110-430 m yr-1 during the 21st century for Mediterranean,temperate and boreal forests, the major forest biomes inmid and high latitudes (Loarie et al. 2009). Local estimates
of this shift, in a scale of 1 km2, vary by three orders ofmagnitude (0.01 to 10 km yr-1). Niche modelling undervarious climatic and greenhouse emission predictionssuggests that bioclimatic envelopes (glossary) for foresttrees will shift northwards in North America (Iverson et al.2008) and north-eastwards in Europe (Thuillier 2003). Theestimated shift distance varies from 300 to 800 km withinone century depending on the climate or greenhouse gasemission scenario (Mc Kenney et al. 2007), withconsiderable variation across both models and species.The large bioclimatic envelope of many forest trees hidesa collection of highly differentiated populations andgenotypes with contrasting adaptation to local climate(Box 1). Shifts in bioclimatic envelopes are therefore likelyto generate not only potential extinction andrecolonization, but also large reorganization of geneticdiversity within the species range if divergent or locally-adapted populations respond in different ways.
Forest trees are keystone species, dominating many terrestrial ecosystems in regions where the mostpronounced climate changes will occur. Climate change generates new adaptive challenges for trees.Their life history traits could either constrain or accelerate their adaptation. On one hand, longgeneration time can slow down evolutionary responses. On the other hand, long distance (LD) geneflow could compensate for their long generation time, facilitating evolutionary change in a shiftingclimate. We critically examine the latter hypothesis, by reviewing data and theory about the extentof gene flow in trees and its evolutionary consequences. Abundant evidence of LD effective dispersalindicates that genes may move within one generation over larger scales than the predicted shifts oftree habitat. Gene flow can have antagonistic effects on adaptation and persistence in the specifictemporal and spatial frame of predicted climate change. Both theory and empirical data howeversuggest that the positive effects of LD gene flow in forest trees may dominate in many instances. Thebalance between the different effects of gene flow may however differ between the leading edge,the core and the rear of the distributions. Finally, we suggest future experimental and theoreticalresearch areas for a better integration of trees dispersal biology and evolutionary quantitative genetics.
Key words: selection, adaptation, gene flow, climate change, forest trees.
Published in Ecology Letters (2012) 15: 378-392, with doi:10.1111/j.1461-0248.2012.01746.x
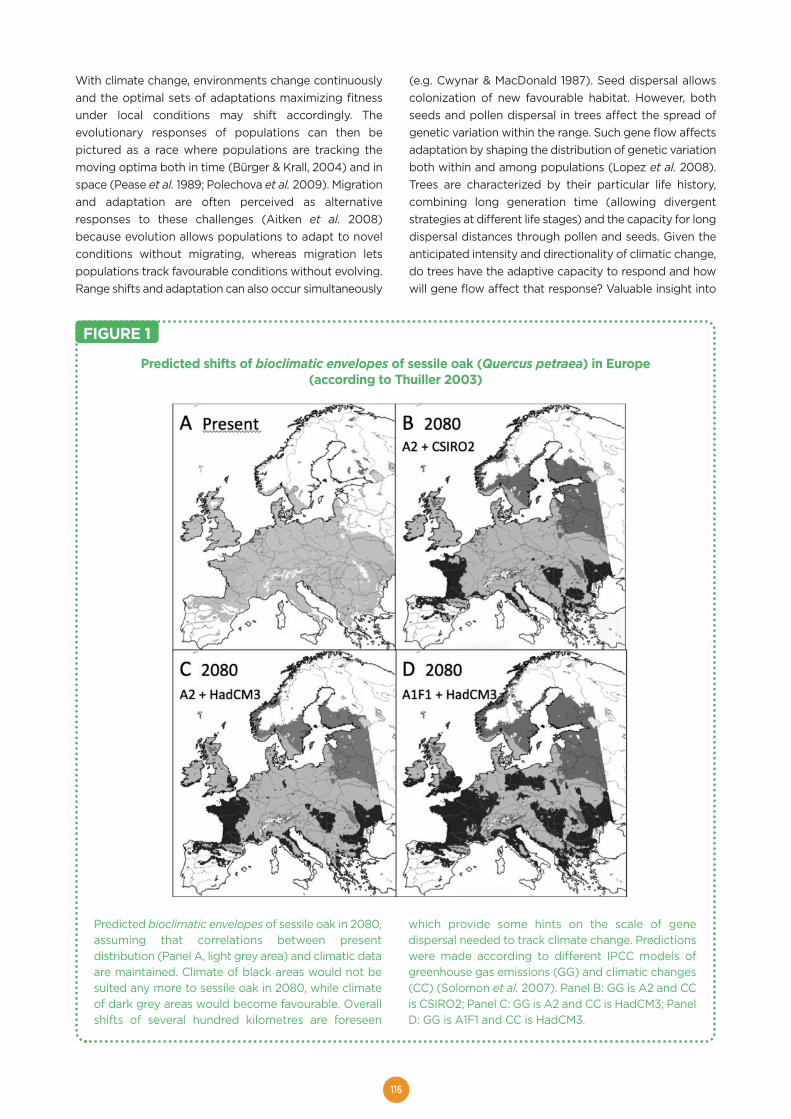
116
With climate change, environments change continuouslyand the optimal sets of adaptations maximizing fitnessunder local conditions may shift accordingly. Theevolutionary responses of populations can then bepictured as a race where populations are tracking themoving optima both in time (Bürger & Krall, 2004) and inspace (Pease et al. 1989; Polechova et al. 2009). Migrationand adaptation are often perceived as alternativeresponses to these challenges (Aitken et al. 2008)because evolution allows populations to adapt to novelconditions without migrating, whereas migration letspopulations track favourable conditions without evolving.Range shifts and adaptation can also occur simultaneously
(e.g. Cwynar & MacDonald 1987). Seed dispersal allowscolonization of new favourable habitat. However, bothseeds and pollen dispersal in trees affect the spread ofgenetic variation within the range. Such gene flow affectsadaptation by shaping the distribution of genetic variationboth within and among populations (Lopez et al. 2008).Trees are characterized by their particular life history,combining long generation time (allowing divergentstrategies at different life stages) and the capacity for longdispersal distances through pollen and seeds. Given theanticipated intensity and directionality of climatic change,do trees have the adaptive capacity to respond and howwill gene flow affect that response? Valuable insight into
Predicted shifts of bioclimatic envelopes of sessile oak (Quercus petraea) in Europe(according to Thuiller 2003)
Predicted bioclimatic envelopes of sessile oak in 2080,assuming that correlations between presentdistribution (Panel A, light grey area) and climatic dataare maintained. Climate of black areas would not besuited any more to sessile oak in 2080, while climateof dark grey areas would become favourable. Overallshifts of several hundred kilometres are foreseen
which provide some hints on the scale of genedispersal needed to track climate change. Predictionswere made according to different IPCC models ofgreenhouse gas emissions (GG) and climatic changes(CC) (Solomon et al. 2007). Panel B: GG is A2 and CCis CSIRO2; Panel C: GG is A2 and CC is HadCM3; PanelD: GG is A1F1 and CC is HadCM3.
FIGURE 1
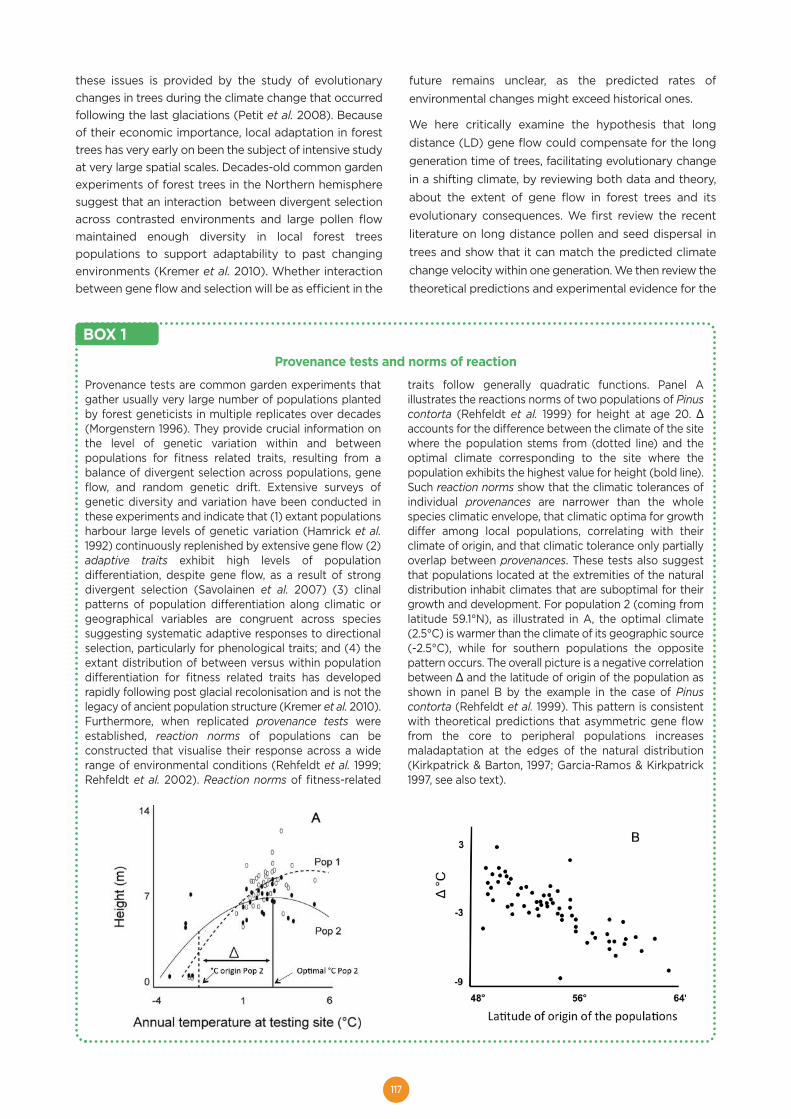
117
these issues is provided by the study of evolutionarychanges in trees during the climate change that occurredfollowing the last glaciations (Petit et al. 2008). Becauseof their economic importance, local adaptation in foresttrees has very early on been the subject of intensive studyat very large spatial scales. Decades-old common gardenexperiments of forest trees in the Northern hemispheresuggest that an interaction between divergent selectionacross contrasted environments and large pollen flowmaintained enough diversity in local forest treespopulations to support adaptability to past changingenvironments (Kremer et al. 2010). Whether interactionbetween gene flow and selection will be as efficient in the
future remains unclear, as the predicted rates ofenvironmental changes might exceed historical ones.
We here critically examine the hypothesis that longdistance (LD) gene flow could compensate for the longgeneration time of trees, facilitating evolutionary changein a shifting climate, by reviewing both data and theory,about the extent of gene flow in forest trees and itsevolutionary consequences. We first review the recentliterature on long distance pollen and seed dispersal intrees and show that it can match the predicted climatechange velocity within one generation. We then review thetheoretical predictions and experimental evidence for the
Provenance tests and norms of reaction
Provenance tests are common garden experiments thatgather usually very large number of populations plantedby forest geneticists in multiple replicates over decades(Morgenstern 1996). They provide crucial information onthe level of genetic variation within and betweenpopulations for fitness related traits, resulting from abalance of divergent selection across populations, geneflow, and random genetic drift. Extensive surveys ofgenetic diversity and variation have been conducted inthese experiments and indicate that (1) extant populationsharbour large levels of genetic variation (Hamrick et al.1992) continuously replenished by extensive gene flow (2)adaptive traits exhibit high levels of populationdifferentiation, despite gene flow, as a result of strongdivergent selection (Savolainen et al. 2007) (3) clinalpatterns of population differentiation along climatic orgeographical variables are congruent across speciessuggesting systematic adaptive responses to directionalselection, particularly for phenological traits; and (4) theextant distribution of between versus within populationdifferentiation for fitness related traits has developedrapidly following post glacial recolonisation and is not thelegacy of ancient population structure (Kremer et al. 2010).Furthermore, when replicated provenance tests wereestablished, reaction norms of populations can beconstructed that visualise their response across a widerange of environmental conditions (Rehfeldt et al. 1999;Rehfeldt et al. 2002). Reaction norms of fitness-related
traits follow generally quadratic functions. Panel Aillustrates the reactions norms of two populations of Pinuscontorta (Rehfeldt et al. 1999) for height at age 20. Δaccounts for the difference between the climate of the sitewhere the population stems from (dotted line) and theoptimal climate corresponding to the site where thepopulation exhibits the highest value for height (bold line).Such reaction norms show that the climatic tolerances ofindividual provenances are narrower than the wholespecies climatic envelope, that climatic optima for growthdiffer among local populations, correlating with theirclimate of origin, and that climatic tolerance only partiallyoverlap between provenances. These tests also suggestthat populations located at the extremities of the naturaldistribution inhabit climates that are suboptimal for theirgrowth and development. For population 2 (coming fromlatitude 59.1°N), as illustrated in A, the optimal climate(2.5°C) is warmer than the climate of its geographic source(-2.5°C), while for southern populations the oppositepattern occurs. The overall picture is a negative correlationbetween Δ and the latitude of origin of the population asshown in panel B by the example in the case of Pinuscontorta (Rehfeldt et al. 1999). This pattern is consistentwith theoretical predictions that asymmetric gene flowfrom the core to peripheral populations increasesmaladaptation at the edges of the natural distribution(Kirkpatrick & Barton, 1997; Garcia-Ramos & Kirkpatrick1997, see also text).
BOX 1
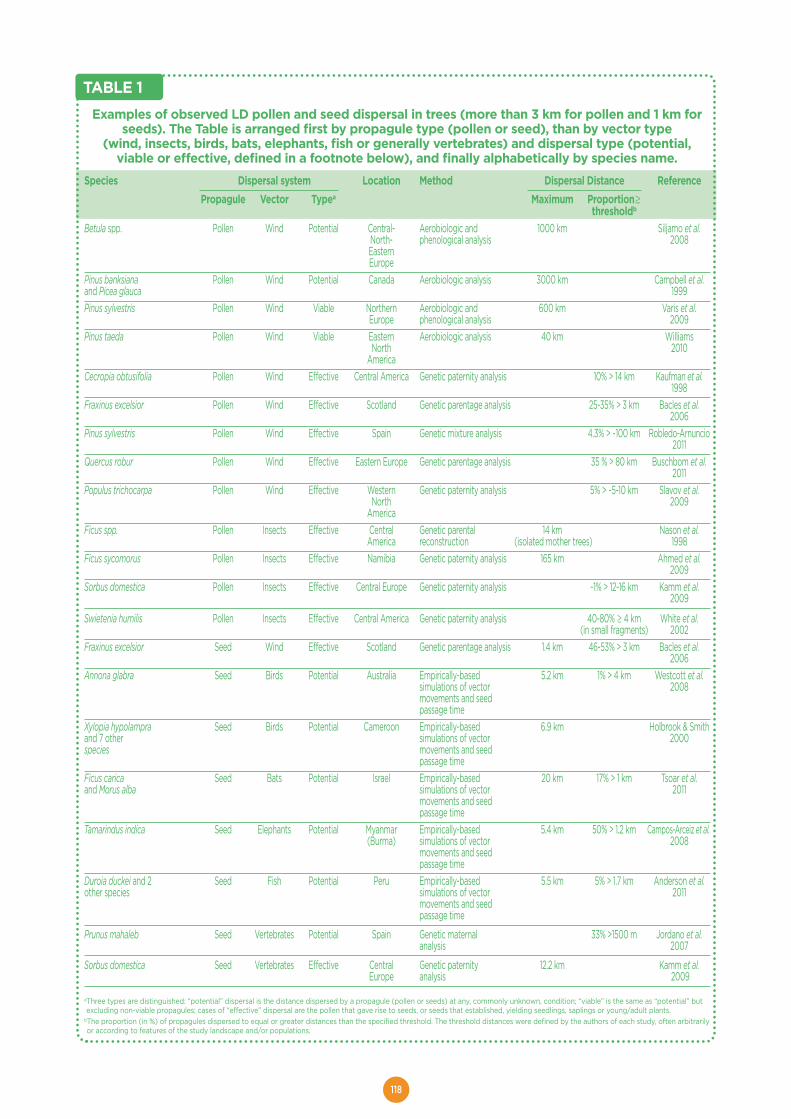
118
Examples of observed LD pollen and seed dispersal in trees (more than 3 km for pollen and 1 km forseeds). The Table is arranged first by propagule type (pollen or seed), than by vector type
(wind, insects, birds, bats, elephants, fish or generally vertebrates) and dispersal type (potential,viable or effective, defined in a footnote below), and finally alphabetically by species name.
Species Dispersal system Location Method Dispersal Distance ReferencePropagule Vector Typea Maximum Proportion≥
thresholdb
Betula spp. Pollen Wind Potential Central- Aerobiologic and 1000 km Siljamo et al.North- phenological analysis 2008EasternEurope
Pinus banksiana Pollen Wind Potential Canada Aerobiologic analysis 3000 km Campbell et al.and Picea glauca 1999Pinus sylvestris Pollen Wind Viable Northern Aerobiologic and 600 km Varis et al.
Europe phenological analysis 2009Pinus taeda Pollen Wind Viable Eastern Aerobiologic analysis 40 km Williams
North 2010America
Cecropia obtusifolia Pollen Wind Effective Central America Genetic paternity analysis 10% > 14 km Kaufman et al.1998
Fraxinus excelsior Pollen Wind Effective Scotland Genetic parentage analysis 25-35% > 3 km Bacles et al.2006
Pinus sylvestris Pollen Wind Effective Spain Genetic mixture analysis 4.3% > ~100 km Robledo-Arnuncio2011
Quercus robur Pollen Wind Effective Eastern Europe Genetic parentage analysis 35 % > 80 km Buschbom et al.2011
Populus trichocarpa Pollen Wind Effective Western Genetic paternity analysis 5% > ~5-10 km Slavov et al.North 2009
AmericaFicus spp. Pollen Insects Effective Central Genetic parental 14 km Nason et al.
America reconstruction (isolated mother trees) 1998Ficus sycomorus Pollen Insects Effective Namibia Genetic paternity analysis 165 km Ahmed et al.
2009Sorbus domestica Pollen Insects Effective Central Europe Genetic paternity analysis ~1% > 12-16 km Kamm et al.
2009
Swietenia humilis Pollen Insects Effective Central America Genetic paternity analysis 40-80% ≥ 4 km White et al.(in small fragments) 2002
Fraxinus excelsior Seed Wind Effective Scotland Genetic parentage analysis 1.4 km 46-53% > 3 km Bacles et al.2006
Annona glabra Seed Birds Potential Australia Empirically-based 5.2 km 1% > 4 km Westcott et al.simulations of vector 2008movements and seedpassage time
Xylopia hypolampra Seed Birds Potential Cameroon Empirically-based 6.9 km Holbrook & Smithand 7 other simulations of vector 2000species movements and seed
passage timeFicus carica Seed Bats Potential Israel Empirically-based 20 km 17% > 1 km Tsoar et al.and Morus alba simulations of vector 2011
movements and seedpassage time
Tamarindus indica Seed Elephants Potential Myanmar Empirically-based 5.4 km 50% > 1.2 km Campos-Arceiz et al.(Burma) simulations of vector 2008
movements and seedpassage time
Duroia duckei and 2 Seed Fish Potential Peru Empirically-based 5.5 km 5% > 1.7 km Anderson et al.other species simulations of vector 2011
movements and seed passage time
Prunus mahaleb Seed Vertebrates Potential Spain Genetic maternal 33% >1500 m Jordano et al.analysis 2007
Sorbus domestica Seed Vertebrates Effective Central Genetic paternity 12.2 km Kamm et al.Europe analysis 2009
aThree types are distinguished: “potential” dispersal is the distance dispersed by a propagule (pollen or seeds) at any, commonly unknown, condition; “viable” is the same as “potential” butexcluding non-viable propagules; cases of “effective” dispersal are the pollen that gave rise to seeds, or seeds that established, yielding seedlings, saplings or young/adult plants.
bThe proportion (in %) of propagules dispersed to equal or greater distances than the specified threshold. The threshold distances were defined by the authors of each study, often arbitrarilyor according to features of the study landscape and/or populations.
TABLE 1
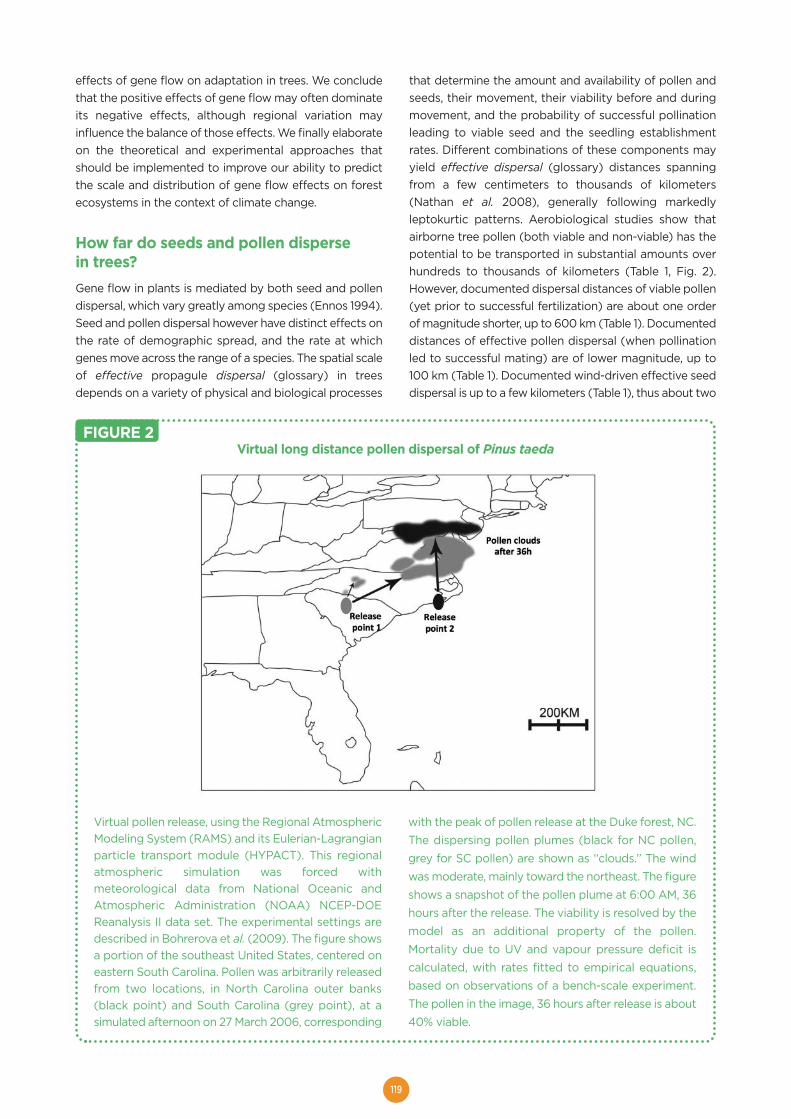
119
effects of gene flow on adaptation in trees. We concludethat the positive effects of gene flow may often dominateits negative effects, although regional variation mayinfluence the balance of those effects. We finally elaborateon the theoretical and experimental approaches thatshould be implemented to improve our ability to predictthe scale and distribution of gene flow effects on forestecosystems in the context of climate change.
How far do seeds and pollen dispersein trees?Gene flow in plants is mediated by both seed and pollendispersal, which vary greatly among species (Ennos 1994).Seed and pollen dispersal however have distinct effects onthe rate of demographic spread, and the rate at whichgenes move across the range of a species. The spatial scaleof effective propagule dispersal (glossary) in treesdepends on a variety of physical and biological processes
that determine the amount and availability of pollen andseeds, their movement, their viability before and duringmovement, and the probability of successful pollinationleading to viable seed and the seedling establishmentrates. Different combinations of these components mayyield effective dispersal (glossary) distances spanningfrom a few centimeters to thousands of kilometers(Nathan et al. 2008), generally following markedlyleptokurtic patterns. Aerobiological studies show thatairborne tree pollen (both viable and non-viable) has thepotential to be transported in substantial amounts overhundreds to thousands of kilometers (Table 1, Fig. 2).However, documented dispersal distances of viable pollen(yet prior to successful fertilization) are about one orderof magnitude shorter, up to 600 km (Table 1). Documenteddistances of effective pollen dispersal (when pollinationled to successful mating) are of lower magnitude, up to100 km (Table 1). Documented wind-driven effective seeddispersal is up to a few kilometers (Table 1), thus about two
Virtual long distance pollen dispersal of Pinus taeda
Virtual pollen release, using the Regional AtmosphericModeling System (RAMS) and its Eulerian-Lagrangianparticle transport module (HYPACT). This regionalatmospheric simulation was forced withmeteorological data from National Oceanic andAtmospheric Administration (NOAA) NCEP-DOEReanalysis II data set. The experimental settings aredescribed in Bohrerova et al. (2009). The figure showsa portion of the southeast United States, centered oneastern South Carolina. Pollen was arbitrarily releasedfrom two locations, in North Carolina outer banks(black point) and South Carolina (grey point), at asimulated afternoon on 27 March 2006, corresponding
with the peak of pollen release at the Duke forest, NC.The dispersing pollen plumes (black for NC pollen,grey for SC pollen) are shown as ‘‘clouds.’’ The windwas moderate, mainly toward the northeast. The figureshows a snapshot of the pollen plume at 6:00 AM, 36hours after the release. The viability is resolved by themodel as an additional property of the pollen.Mortality due to UV and vapour pressure deficit iscalculated, with rates fitted to empirical equations,based on observations of a bench-scale experiment.The pollen in the image, 36 hours after release is about40% viable.
FIGURE 2
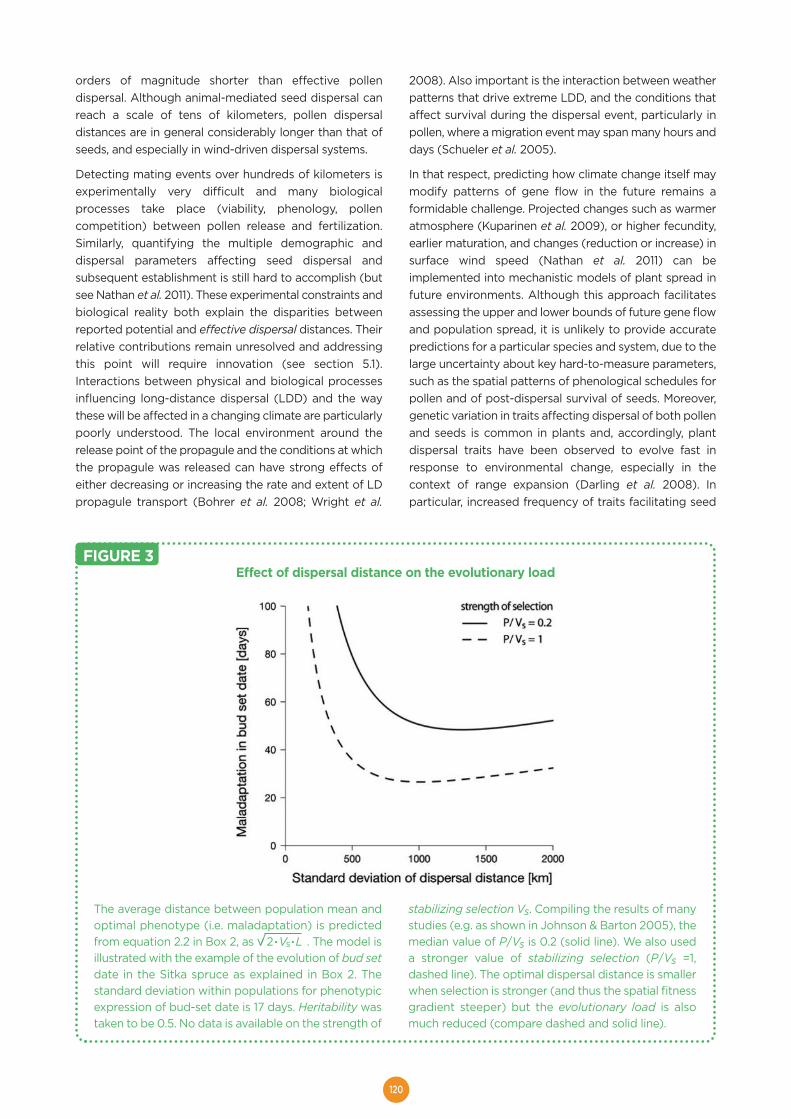
120
orders of magnitude shorter than effective pollendispersal. Although animal-mediated seed dispersal canreach a scale of tens of kilometers, pollen dispersaldistances are in general considerably longer than that ofseeds, and especially in wind-driven dispersal systems.
Detecting mating events over hundreds of kilometers isexperimentally very difficult and many biologicalprocesses take place (viability, phenology, pollencompetition) between pollen release and fertilization.Similarly, quantifying the multiple demographic anddispersal parameters affecting seed dispersal andsubsequent establishment is still hard to accomplish (butsee Nathan et al. 2011). These experimental constraints andbiological reality both explain the disparities betweenreported potential and effective dispersal distances. Theirrelative contributions remain unresolved and addressingthis point will require innovation (see section 5.1).Interactions between physical and biological processesinfluencing long-distance dispersal (LDD) and the waythese will be affected in a changing climate are particularlypoorly understood. The local environment around therelease point of the propagule and the conditions at whichthe propagule was released can have strong effects ofeither decreasing or increasing the rate and extent of LDpropagule transport (Bohrer et al. 2008; Wright et al.
2008). Also important is the interaction between weatherpatterns that drive extreme LDD, and the conditions thataffect survival during the dispersal event, particularly inpollen, where a migration event may span many hours anddays (Schueler et al. 2005).
In that respect, predicting how climate change itself maymodify patterns of gene flow in the future remains aformidable challenge. Projected changes such as warmeratmosphere (Kuparinen et al. 2009), or higher fecundity,earlier maturation, and changes (reduction or increase) insurface wind speed (Nathan et al. 2011) can beimplemented into mechanistic models of plant spread infuture environments. Although this approach facilitatesassessing the upper and lower bounds of future gene flowand population spread, it is unlikely to provide accuratepredictions for a particular species and system, due to thelarge uncertainty about key hard-to-measure parameters,such as the spatial patterns of phenological schedules forpollen and of post-dispersal survival of seeds. Moreover,genetic variation in traits affecting dispersal of both pollenand seeds is common in plants and, accordingly, plantdispersal traits have been observed to evolve fast inresponse to environmental change, especially in thecontext of range expansion (Darling et al. 2008). Inparticular, increased frequency of traits facilitating seed
Effect of dispersal distance on the evolutionary load
The average distance between population mean andoptimal phenotype (i.e. maladaptation) is predictedfrom equation 2.2 in Box 2, as v 2 .Vs.L . The model isillustrated with the example of the evolution of bud setdate in the Sitka spruce as explained in Box 2. Thestandard deviation within populations for phenotypicexpression of bud-set date is 17 days. Heritability wastaken to be 0.5. No data is available on the strength of
stabilizing selection Vs. Compiling the results of manystudies (e.g. as shown in Johnson & Barton 2005), themedian value of P/Vs is 0.2 (solid line). We also useda stronger value of stabilizing selection (P/Vs =1,dashed line). The optimal dispersal distance is smallerwhen selection is stronger (and thus the spatial fitnessgradient steeper) but the evolutionary load is alsomuch reduced (compare dashed and solid line).
FIGURE 3
121
dispersal have been found in recently foundedpopulations, at the expanding edge of the range, while theconverse trend was found in fragmented southernpopulations at the rear end (Riba et al. 2009). Identifyinghow global change (including climate change) will alterselection pressures acting on dispersal is therefore crucialin order to predict the extent of gene flow in futureenvironments.
Despite gaps that prevent us from precisely predicting theextent of LD gene flow, the available data on effectivedispersal and predicted habitat shifts still suggest thatthese two processes may operate over comparable scalesfor many tree species, but also that inter-specific variation
in the rate and magnitude of LD gene flow maysubstantially affect the variation in the response of foresttrees to climate change (Nathan et al. 2011, Table 1).
What are the possible effectsof gene flow on adaptation?We can conceptualize the potential effects of gene flowon adaptation through a simple model of species rangeevolution, where selection varies both in space and time(Pease et al. 1989; Polechova et al. 2009; Box 2). Localclimate can be thought of as imposing specific selectionpressures on a complex set of phenotypic traits (e.g.
A simple conceptual framework illustrating the antagonistic effects of gene flow
Two closely related theoretical models (Pease et al. 1989;Polechova et al. 2009) have explored the question ofevolution in environments changing both in space andtime, mimicking the effects of climate change in specieswith wide distributions. These models envision a speciesdistributed along some linear environmental gradient, suchas the Sitka spruce distributed along a large latitudinalgradient of temperatures (Mimura & Aitken 2007a). We usethis empirical example to illustrate potentially realisticvalues of parameters for the model. We assume fitnessdepends quadratically on how well an individual tree isadapted to its local ecological conditions, i.e., how itsphenotype matches the local optimum. By averaging overphenotypes in the local population, one may then write themean fitness (here the Malthusian population exponentialgrowth rate) in a given location as:
(2.1)
where r0 is the contribution to population growth of anindividual with the optimal phenotype, Vs describes howwell individuals that deviate from this optimal phenotypeperform (and is thus inversely related to the strength ofstabilizing selection), � is the optimal phenotype in thatlocation, Z is the local mean phenotype in the populationand P is the local phenotypic variance around this mean.This expression shows that the mean fitness in a variablepopulation subject to stabilizing selection is reduced in twoways: (1) Standing load (P/2Vs): caused by phenotypicvariation and present even when the mean phenotypematches the optimum; (2) Evolutionary load [(Z–�)2/2Vs]:caused by departure of the mean phenotype from the localoptimum (Lande & Shannon 1996). Evolutionary loads canbe generated by selection that varies over space or time(see Bridle et al. 2009 for a review).Pease et al. (1989) and Polechova et al. (2009) makespecific predictions about how migration might affect theevolutionary load in a changing climate. Their modelsassume the optimum phenotype changes linearly throughspace, with slope b. This is similar to Sitka spruce, wherebud set date increases linearly with the local mean annualtemperature, which itself varies linearly with the distanceto the Southern margin of the species range: assumingcurrent bud set date corresponds to the optimum, this
gives an estimate of b such that optimal bud set dateincreases by 13 days every °C, or by 3.24 days per 100 km(Mimura & Aitken 2007a; Aitken et al. 2008). Climatechange can be approximated by this gradient of optimalphenotypes being constantly shifted through space at rate v.According to different climate models, mean annualtemperature may increase by 3-5°C in the generation timeof Sitka Spruce (Aitken et al. 2008), which gives anestimate of v as a shift of approximately 1000 to 2000 kmper generation. Migration is modelled as a diffusionprocess, with average distance between parent andoffspring �. There are feedbacks between the evolution ofthe mean phenotype through time and space and that ofthe population density, mediated through gene flow andthe local growth rates (Pease et al. 1989; Polechova et al.2009).Further assuming that genetic variation for the trait underselection is relatively weak and does not vary throughspace, Pease et al. (1989) predict that the loss of fitness atthe scale of the range due to evolutionary load isapproximately
(2.2)
where G is the genetic variance for the trait. Though thisprediction might be crude in the case of forest trees withlarge within population genetic variance, it has heuristicvalue. Indeed, the first term in parentheses can beinterpreted as the component of phenotypic mismatch dueto spatial variability in the optimal phenotype and geneflow (migration load); this part of the load increases withdispersal distance (�). The second term describesphenotypic mismatch due to the lagging response of themean phenotype to temporal change in the local optimum(lag load). This part of the load decreases with dispersaldistance because migration helps the species track itsshifting optimum through space. The third term in (2.2)shows that the evolutionary load declines with geneticvariance G because response to selection increases.Dispersal distance also affects the evolution of geneticvariance G (Barton 2001; Polechova et al. 2009; Bridle etal. 2010), with positive effects on the evolutionary load(equation 2.2), but negative effects on the standing loadP/2Vs (equation 2.1)
BOX 2
122
phenology, frost hardiness, growth, seed size), anddefining different optimal trait values through varioustrade-offs, depending on specific combinations of climaticconditions encountered within the range. As an illustration,in Sitka Spruce, trees originating from higher latitude withlower annual mean temperature cease growing earlier inthe season than trees from lower latitude, when grown incommon garden (Mimura & Aitken 2007a), suggestingdifferent optimal bud set (glossary) dates alongtemperature gradients within the range. The simpleconceptual model in Box 2 connects adaptation todemography by assuming that an individual’s contributionto population growth declines as it departs from the locallyoptimal phenotype. This model suggests that gene flowhas antagonistic effects on adaptation by modifying thevarious sources of genetic load (glossary) depressingpopulation mean fitness, and thus population growth (seeBridle et al. 2009 for a review). We here review theseeffects by considering their alternative evolutionaryconsequences.
Gene flow constrains local adaptation
Because gene flow homogenises allele frequencies acrossspace, high gene flow could constrain adaptive divergence(glossary) along environmental gradients (Garcia-Ramos& Kirkpatrick 1997; Bohrer et al. 2005; but see Barton 2001;Yeaman & Guillaume 2009; Bridle et al. 2010 for a revisedconsideration of the strength of such constraints). Sometheoretical models predict in particular that gene flowfrom large central populations into small peripheral onesmay swamp local adaptation in marginal areas, preventingrange spread beyond some critical environmental limit(Kirkpatrick & Barton 1997; review in Bridle & Vines 2007).Gene flow then causes phenotypic clines (glossary) foradaptive traits to deviate from their optima (Box 2).Interestingly, the interaction of strong gene flow withselection on multiple traits could result in some phenotypicclines being flatter, and some steeper, than optimalbecause of genetic and selective interactions among traits(Guillaume 2011, Duputié et al. in revision). Furthermore,the constraining effects of migration on divergence arepredicted to be more severe when divergence involvesmany loci of small effects rather than few major genes withlarge effects on the phenotype (Yeaman & Guillaume2009). In forest trees, the former situation seems to be themost common (Neale & Kremer 2011).
Common garden experiments in forest trees (Box 1)suggest that genotypes can perform poorly whentransferred to climates far from their location of origin.Maladaptation of LD migrants could thus reduce the meanfitness in forest tree populations, generating a migrationload (glossary). Such migration load would be of concernif gene flow is extensive over long distances (see section2) and if phenotypic mismatch of immigrants is mostly dueto long lasting genetic effects (Aitken et al. 2008). In aSwedish population of Pinus sylvestris, Nilsson (1995)
indeed found that offspring sired by naturally dispersingpollen had significantly slower growth and higher freezingresistance than expected if offspring were sired only bypollen produced locally. Natural pollination thus resultedin a phenotypic shift corresponding to that expected ifmost pollen originated from higher latitudes by 1 to 2degrees (Nilsson 1995).
There is however little evidence that gene flow hasstrongly limited adaptation in forest trees in the past.Comparison of genetic differentiation at neutral molecularmarkers versus adaptive traits (glossary) repeatedlysuggests that extensive gene flow (presumably mostlythrough pollen dispersal) has not prevented rapid adaptivedivergence of extant populations (Savolainen et al. 2007;Kremer et al. 2010, for theoretical predictions see Kremer& Le Corre 2011). Populations under different climates mayhowever have diverged while still being far from the locallyoptimum phenotype. Determining how much observedphenotypic clines deviate from what would be optimalunder local conditions is however difficult to assess, andremains an open issue in evolutionary biology (Barton,2001; Butlin et al. 2003). When provenance tests (glossary)have been replicated over a broad range of climaticconditions, provenance (glossary) reaction norms(glossary, Box 1) allow comparison of optimal and originalclimate for each population. Mismatches are notuncommon (Wang et al. 2010) and interestingly somestudies (Rehfeldt et al. 1999; Rehfeldt et al. 2002) foundmore of them at the edge of distributions: e.g. populationsof Pinus contorta from locations with extreme climatesgrow better in milder conditions, closer to the core, thanin their original location. Such a pattern is consistent withthe theoretical expectation that gene flow from the coreincreases maladaptation in marginal populations (Garcia-Ramos & Kirkpatrick 1997).
Gene flow enhances the response to selection
Natural selection operates by sieving from geneticvariation found within populations. Local genetic diversityis therefore the fuel of evolutionary change. Forest treepopulations harbour high diversity both for molecularmarkers and quantitative traits (Hamrick et al. 1992), withheritabilities (glossary) typically above 0.4 for woodcharacteristics or phenological traits such as bud set date(Cornelius, 1994). The maintenance of such high levels ofquantitative variation for traits closely linked to fitnessremains a paradox where strong stabilizing selection(glossary) is acting to reduce variation within populations(see Johnson & Barton 2005 for a review). Theoreticalmodels predict that increases in genetic variance(glossary) due to gene flow could be substantial (Barton,2001). Along climatic gradients, the increase in geneticvariance within localities due to gene flow is predicted tobe proportional to the change in mean breeding value(glossary) along the typical dispersal distance. Forexample, in Sitka Spruce, the breeding value for bud set
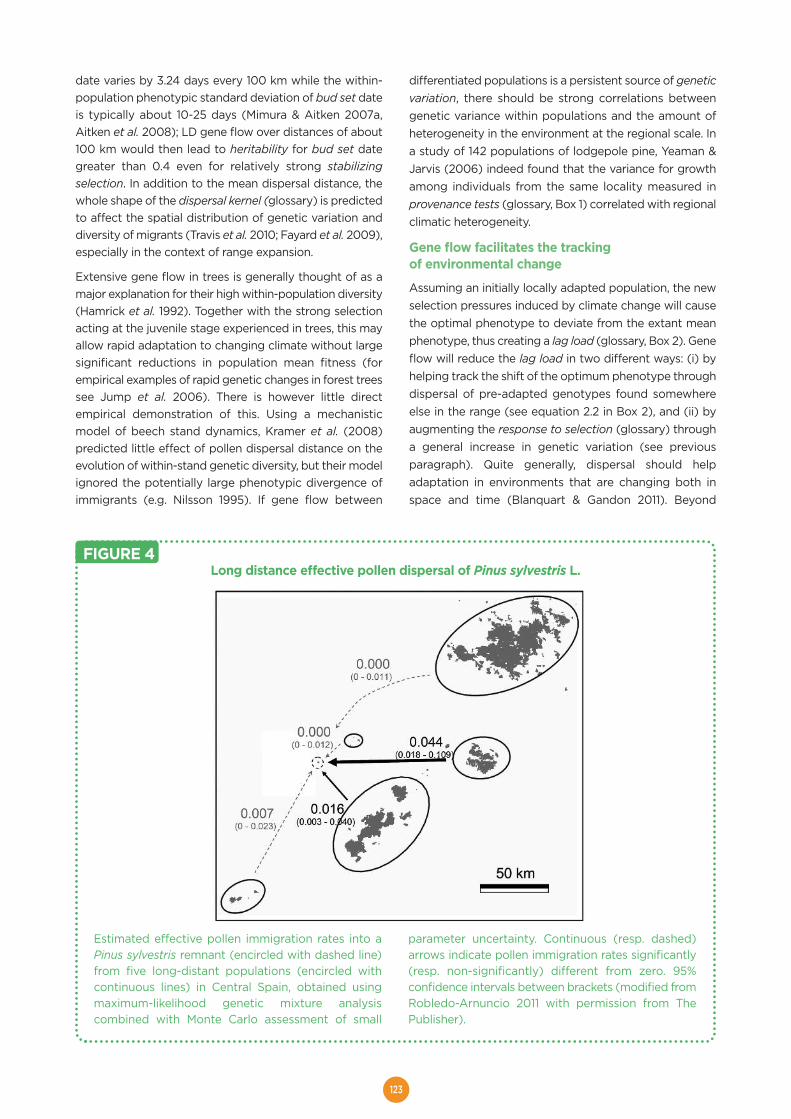
123
date varies by 3.24 days every 100 km while the within-population phenotypic standard deviation of bud set dateis typically about 10-25 days (Mimura & Aitken 2007a,Aitken et al. 2008); LD gene flow over distances of about100 km would then lead to heritability for bud set dategreater than 0.4 even for relatively strong stabilizingselection. In addition to the mean dispersal distance, thewhole shape of the dispersal kernel (glossary) is predictedto affect the spatial distribution of genetic variation anddiversity of migrants (Travis et al. 2010; Fayard et al. 2009),especially in the context of range expansion.
Extensive gene flow in trees is generally thought of as amajor explanation for their high within-population diversity(Hamrick et al. 1992). Together with the strong selectionacting at the juvenile stage experienced in trees, this mayallow rapid adaptation to changing climate without largesignificant reductions in population mean fitness (forempirical examples of rapid genetic changes in forest treessee Jump et al. 2006). There is however little directempirical demonstration of this. Using a mechanisticmodel of beech stand dynamics, Kramer et al. (2008)predicted little effect of pollen dispersal distance on theevolution of within-stand genetic diversity, but their modelignored the potentially large phenotypic divergence ofimmigrants (e.g. Nilsson 1995). If gene flow between
differentiated populations is a persistent source of geneticvariation, there should be strong correlations betweengenetic variance within populations and the amount ofheterogeneity in the environment at the regional scale. Ina study of 142 populations of lodgepole pine, Yeaman &Jarvis (2006) indeed found that the variance for growthamong individuals from the same locality measured inprovenance tests (glossary, Box 1) correlated with regionalclimatic heterogeneity.
Gene flow facilitates the trackingof environmental change
Assuming an initially locally adapted population, the newselection pressures induced by climate change will causethe optimal phenotype to deviate from the extant meanphenotype, thus creating a lag load (glossary, Box 2). Geneflow will reduce the lag load in two different ways: (i) byhelping track the shift of the optimum phenotype throughdispersal of pre-adapted genotypes found somewhereelse in the range (see equation 2.2 in Box 2), and (ii) byaugmenting the response to selection (glossary) througha general increase in genetic variation (see previousparagraph). Quite generally, dispersal should helpadaptation in environments that are changing both inspace and time (Blanquart & Gandon 2011). Beyond
Long distance effective pollen dispersal of Pinus sylvestris L.
Estimated effective pollen immigration rates into aPinus sylvestris remnant (encircled with dashed line)from five long-distant populations (encircled withcontinuous lines) in Central Spain, obtained usingmaximum-likelihood genetic mixture analysiscombined with Monte Carlo assessment of small
parameter uncertainty. Continuous (resp. dashed)arrows indicate pollen immigration rates significantly(resp. non-significantly) different from zero. 95%confidence intervals between brackets (modified fromRobledo-Arnuncio 2011 with permission from ThePublisher).
FIGURE 4
124
theoretical predictions, there is little experimental evidenceon the impact of gene flow on the lag load of treepopulations engaged in an evolutionary race with achanging environment. Simulating the evolution of growthcessation date in pine and birch, Kuparinen et al. (2010)found that the large lag that developed after one centuryof climate warming (about 40 days behind the optimaldate) was only moderately reduced (by 2 days) by thehigher pollen and seed dispersal distances of birch alongthe climatic gradient.
Gene flow affects inbreeding levels
Gene flow may also affect genetic variation for fitnessindependently from the issue of adaptation to climate, byaffecting genetic resemblance between mates. Earlyinbreeding depression (glossary) is widespread in largelyoutcrossing species such as trees and inbreeding wasfound more frequently in isolated marginal populations(Mimura & Aitken 2007b), which may depress their meanfitness and their ability to persist in a changingenvironment. In many plant species with small isolatedpopulations, progeny formed by crosses betweenpopulations show higher fitness than that obtained bywithin population crosses (e.g. Willi & Fischer 2005). Sucha pattern of heterosis (glossary) is however not expectedto be generally very strong in trees, due to thecombination of large population size and extensive geneflow (for theoretical predictions see Glémin et al. 2003;Lopez et al. 2009). Conversely, small amounts of gene flowbetween formerly isolated populations can also in theoryseriously disrupt fitness due to negative interactionsbetween genes having evolved separately (Edmands &Timmerman 2003), but contrasting results from artificialcrosses between distant populations fail to provide solidevidence for this type of outbreeding depression(glossary) in trees (Harfouche et al. 2000; Goto et al. 2011).Because tree populations are seldom isolated from eachother, outbreeding depression due to negative geneinteractions is expected to be rare (Frankham et al. 2011).
How will the different effects of geneflow balance each other in the contextof climate change?We here suggest that the positive effects of gene flowmay often dominate negative effects for forest treesconfronted to climate change. This is in particular the casedue to the specific life cycle of forest trees. However, thisbalance of effects is likely to be modulated by (i) theregional context (e.g. expanding edge or retracting part ofthe range), and (ii) the dispersal syndrome (relativestrength of pollen versus seed dispersal).
Balance between antagonistic effects
Maladaptation in a changing climate is caused bymismatches between optimal and realized meanphenotypes, due to environments that are changing in
time and space too fast for the population to adjust tothese changes. Such mismatch depresses the mean fitnessof populations, generating an evolutionary load (glossary,Box 2). Setting aside the effects of gene flow on geneticvariance, the simple model in Box 2 predicts that there isan optimal level of migration that minimizes suchevolutionary load under a shifting climate: when dispersaldistance is short, the lag load decreases fast withincreasing migration, which helps the population track theoptimal climate (Fig. 3). If gene flow is too high, however,local adaptation is prevented (migration load) andmaladaptation increases (albeit slowly) with increasingmigration (Fig. 3). The optimal dispersal distance is higherif the environment changes more quickly in time in a givenlocation, and if selection varies less sharply in space (Box2). As an illustration, in the evolution of bud set date inSitka Spruce (Mimura & Aitken 2007a; Aitken et al. 2008,see Box 2), the optimal migration distance is relativelylarge (immigrants should on average originate fromlocations with mean temperature differing by more than3°C to the local site, i.e. more than 1000km). This suggeststhat, for a range of realistic dispersal distances, the positivetracking effect of dispersal should dominate its negativeeffects on local adaptation.
Once the effects of gene flow on the evolution of geneticvariance are taken into account, the constraining effectsof migration on adaptation in marginal populations ismuch weakened: very high gene flow seems instead tofacilitate adaptation across a wide array of environmentalconditions, but at the cost of a reduced fitness everywherein the range, which could ultimately compromise speciespersistence (for theoretical predictions see Barton 2001;Polechova et al. 2009), and this effect on populationfitness becomes greater when the stochastic effects offinite populations are included (Bridle et al. 2010). The veryhigh fecundity, long life span and strong competition atthe juvenile stage, which are characteristic of forest trees,could in principle permit very high genetic load causingmassive mortality at the juvenile stage, without havingmuch impact on adult density. Further exploration ofconnections between forest trees population dynamicsand genetic diversity are needed to conclude when thedemographic cost of adaptation compromises persistence.
Overall, models that integrate different antagonisticeffects predict that intermediate levels of gene flow (e.g.between one and ten migrants per generation) suffice toreplenish genetic variance eroded by drift and selection,and alleviate inbreeding depression without causing largemigration load, thus maximize mean fitness inheterogeneous environments (Lopez et al. 2009; see alsoBlanquart & Gandon 2011 for the case of spatio-temporalvariation). Empirical evidence that migration enhancesfitness in marginal habitats of several plant speciessupports such predictions (Kawecki 2008). We lack similardirect evidence in forest trees. The admixture of genotypesof diverse geographical origin is increasingly thought of as

125
key to successful establishment of introduced populations,because of it increases the genetic variance necessary foradaptive responses (see Zheng & Ennos 1999 for anexample in introduced pine populations). Experimentalmanipulation of gene flow in forest trees would providevaluable data to better understand its constraining orboosting effects on adaptation to local climate.
Regional variation
Predicted shifts in bioclimatic envelopes imply that currentpopulations at the trailing and leading edges of the rangewill face different adaptive challenges. Southern marginpopulations will face climatic conditions that currently donot permit species growth. Will these challengedpopulations have the evolutionary potential(Gomulkiewicz & Houle 2009) to adapt before goingextinct? Their persistence will depend on whether theevolutionary or demographic constraints preventingcurrent establishment in warmer or drier climates will berelaxed enough to enable enlargement of species’fundamental niches. Conversely, at the northern margins,new areas will become suitable for growth, but the successof colonization may depend on the genetic make-up ofnew population founders.
Gene flow can have contrasted consequences forpopulations at trailing and leading edges of a shiftingrange (Hampe & Petit 2005): populations at the leadingedge or in the central part of the distribution are likely toreceive “pre-adapted” genes from more southernpopulations, and gene flow may facilitate their adaptation(Hu & He 2006). The opposite may be true for populationsat the rear end that encounter an entirely novelenvironment. The flow of pre-adapted genes from centralpopulations is then not possible, which may increasemaladaptation and extinction probabilities in populationsat the southern margins. However, both demographic andgenetic rescue effects of dispersal from larger populationswithin the species' range may help those marginalpopulations to persist. The precise balance of themultifarious effects of gene flow remains to be exploredin this context.
Balance between the effects of seedand pollen flow
Balance between the negative and positive effects of geneflow may also vary with the relative contribution of seedand pollen dispersal. Both pollen flow and seed flowcontribute substantially to genetic diversity. On the onehand, pollen often disperses farther than seeds (seesection 2 and Table 1) and in greater quantities. On theother hand, a single pollen grain carries half the numberof alleles compared to a single seed, and only seeds canestablish a new population in a remote habitat. Due to longgeneration times in trees, migrant seeds accumulate in anew population over years before the new generationreproduces, promoting high levels of diversity in recentlyfounded populations (Austerlitz et al. 2000). Long
distance gene flow mediated by pollen in marginalhabitats is therefore conditional on the successfulestablishment of shorter distance migrating seeds. Themovement of alleles by pollen necessarily involvescombining with existing genetic variation, which explainswhy seed and pollen dispersal may have differentconsequences for population divergence, maintenance ofwithin-population diversity, and mean fitness (Hu & Li2003; Lopez et al. 2008). When selection varies sharply inspace, pollen dispersal could, in particular, generate highermigration loads than equivalent seed dispersal (Lopez etal. 2008). This happens because selection is less efficientat removing badly adapted immigrant alleles when theirdeleterious effects are partly masked in hybrids (Lopez etal. 2008). Selection at the gametophytic stage may furtheraffect these differences (Hu & Li 2003; Hu & He 2006).
Most models of adaptation and migration in aheterogeneous environment (e.g. Pease et al. 1989;Kirkpatrick & Barton 1997; Polechova et al. 2009, see Box2; but see Butlin et al. 2003) consider a single dispersalparameter. With pollen and seed dispersal, demographicmigration is partially uncoupled from gene flow. Hu & He(2006) predicted that pollen dispersal could slow downor accelerate range expansion in some homogeneousenvironments by interfering with the spread of beneficialor deleterious mutations. At retracting range margins, seedand pollen dispersal may play very different roles onadaptation: seed dispersal enhances the probability ofadaptation in a sink habitat, while pollen dispersalgenerally compromises it (Aguilée et al. unpublished).Conversely, both pollen flow and seed flow could havepositive effects at expanding range margins. In thepresence of pollen limitation, long-distance pollen flowcould moreover prevent extinction in marginal populations(Butlin et al. 2003).
Future research directionsDevelop new methods to trace pollen and seeds
Experimental dispersal studies monitoring LD pollen andseed dispersal have often been limited in spatial scale dueto (i) overlapping of the pollen/seed shadows (glossary)masking LDD, (ii) dilution effect (LDD is rare and requireshigh power to observe, let alone measure), and (iii) largenumbers of putative sources (characterizing their positionsand genotypes is time- and cost-intensive). Using highlypolymorphic genetic markers like microsatellites greatlyovercomes the first point, and the advent of next-generation sequencing will improve power and resolution,however it is still necessary to conceive new experimentaldesigns dealing with points (ii)-(iii). We propose potentialstrategies here, mostly relying on a stronger interactionwith mechanistic approaches.
Making use of meteorological dataFor wind-mediated gene flow, available weather datacould help determine the potential range of pollen and

126
seed dispersal within particular landscapes, regions, orcontinents. Such an analysis requires regionalmeteorological datasets, phenological observations overa wide region and sufficient understanding of themeteorological factors driving pollen and seed emissionand spread. Products of regional and global weatherreanalysis, such as the North American RegionalReanalysis (NARR) dataset and the European Centre forMedium Range Weather Forecast (ECMWF) data, offeruseful observational and model-based information onwind, temperature, humidity, radiation and othermeteorological data (Schueler et al. 2005). On-lineinterfaces for weather and radiation simulation tools canalso be used to evaluate conditions across large dispersalranges (Bohrerova et al. 2009). For pollen, phenologicaldata are available from pollen monitoring networks (e.g.the European Aerobiology Network, EAN) or fromphenological observations (e.g. the European PhenologicalNetwork). Model-driven weather reconstructions(Solomon et al. 2007) can provide estimates of dispersalpotentials in past and future climates (Kuparinen et al.2009; Nathan et al. 2011). Improved characterizations ofwind dispersal mechanisms accounting for interactionsbetween pollen/seeds and turbulent winds in relation toweather conditions can be combined to determine annualand multiannual wind-driven pollen and seed dispersalpatterns throughout large geographic regions (Muñoz etal. 2004; Thompson & Katul 2008; Nathan et al. 2011).
To experimentally trace pollen or seed movement at thecontinental scale, a joint use of weather data, weatherforecasting models and field observation of pollen/seedpools seems most promising. Large-scale spatialcharacterization of presence/absence of a species,phenology, and airflows were already used to identifytemporal windows ideal for LDD and relate them to theactual presence of pollen grains in physical captors(Siljamo et al. 2008). A next step would be to measure thediversity of origins in the effective pollen pools throughthe genetic and/or phenotypic diversity of the seedproduced (Nilsson 1995).
Taking advantage of adequate landscape configurationsGenetic assignment (glossary) methods linking pollen,seeds or seedlings to candidate parental populationscould be used to evaluate the effective rate and range ofcontemporary gene flow among discrete populations(Manel et al. 2005). Focus could be placed initially onisolated populations or trees, particularly informativeabout LDD because they are less subject to dilutioneffects. A recent study using genetic assignment in suchdemographic setting has revealed effective pollen geneflow over 100-km distances in a wind-pollinated species(Fig. 4). For species with extremely low densities, evenparentage analysis (glossary) may prove efficient indetecting LD gene flow (Ahmed et al. 2009). Femaleplants, male-sterile or self-incompatible isolatedindividuals might prove useful traps for investigating the
composition of LD effective pollen clouds, and could bedistributed at specific positions during the pollinationperiod, e.g. using potted plants, flowering branches keptalive or flowering grafts. High precision aerial photographsand satellite images could be used to retrieve all potentialsources at the regional scale and avoid biases due to ghostpopulations. An alternative solution, not requiring trapplants but not assessing effective dispersal directly, is tocharacterize the genetic content of the pollen pool bygenotyping single pollen grains (Matsuki et al. 2007),sampled in volumetric traps from existing aerobiology(glossary) networks or placed at specific sites in alandscape. Note however that the atypical demographicconditions of isolated trees that facilitate LDD assessmentmay result in observed LDD patterns difficult to generalize(e.g. dilution effects in large populations), for whichmodelling approaches may be necessary.
Combining mechanistic and genetic modelsMechanistic and genetic tools for assessing dispersal havebeen developed and applied virtually independently,although they have complementary features and highpotential for synergy, particularly for the analysis of LDD.For example, the ability of mechanistic approaches toassess dispersal across multiple scales complements theproblematic extrapolation of genetic methods beyond thesmall scale in which individuals were sampled. Geneticmethods, in turn, can provide data to validatemechanistically-derived kernels, and to add the required(and often hard to measure) component of post-dispersalestablishment effects needed to assess effective dispersal.Mechanistically derived propagule transport probabilityfunctions over different distances could also beincorporated into the usual probabilistic (maximum-likelihood or Bayesian) migration rate estimationprocedures based solely on genetic likelihoods, allowingjointly estimation of migration rates and mechanisticparameters that determine dispersal over long distances.
Developing the connectivity networkCurrent research on spatial patterns of dispersal and geneflow is dominated by the dispersal kernel concept, whichbears significant disadvantages when applied to broadscales. Studies using dispersal kernels generally requiresampling intensities that become unfeasible over longdistances. Moreover, they often assume isotropy (i.e., thesame dispersal kernel for all directions); although thisassumption is unrealistic for many systems in which thedispersal vector moves in a directional manner, such asmany seasonal winds, downward flow of rivers, andoriented movement of animals. Similarly, geneticassignment methods for migration rate estimationtypically incorporate neither directional nor other kinds ofspatial information. Lagrangian dispersal (glossary)simulations can account for dispersal anisotropy byincorporating turbulence patterns (Bohrer et al. 2008),and hourly, daily or seasonal variation in wind direction(Wright et al. 2008); this computationally-intensive
127
approach, however, is practically limited to relatively short-term small-scale applications. An alternative approach,connectivity maps (glossary), depicts dispersalprobabilities between sites based on large-scale datasetsand/or models available for the primary dispersal vector,for example, to assess wind connectivity of plants amongislands in the southern oceans (Muñoz et al. 2004). Inprinciple, this method could be adjusted to many plantspecies in a variety of spatial scales, if the patterns ofmovement of the dispersal vector can be estimated.Because some key vectors such as wind, inland watersystems, ocean currents and migrating birds dispersemany plant species, efforts to develop vector connectivitymaps could advance the study of gene flow via pollen andseeds for a large number of species.
Implement experimental approaches to assessevolutionary changes in trees
Despite obvious biological constraints in trees, werecommend setting up experiments that would allowassessing evolutionary changes over a few generations.Such experiments would not only provide estimates ofevolutionary rates, they would also offer the opportunityto test evolutionary hypotheses regarding responses toclimate change. Existing provenance tests constitute in thisrespect a precious source of data, allowing thequantification of between and within sites geneticdiversity for climate adaptation and the putativedemographic impact of maladaptation (Box 1). Furtherexploitation of such data should be encouraged.Additional options can be foreseen:
Testing for the effect of gene flow on the changes ofpopulation means and genetic and phenotypic varianceover one generation. A straightforward design consists in conducting full sibcontrol “hybrid” crosses between distant and closepopulations in comparison to “pure” within populationcrosses. Offspring should then be raised under controlledconditions mimicking different climatic scenarios. Whilemore difficult to implement, because of potentially smallsample sizes and unaccounted microenvironmentalvariation, an alternative “in situ” experiment consists incomparing “natural migrants” that have been identified byparentage analysis or genetic assignment methods to“local residents”.
Testing the effects of the strength of selection oversuccessive generations.We suggest installing short generation tree populations(birch or willow) within open top chambers, and let thepopulation reproduce under such conditions. Strength ofselection can be set by manipulating conditions within theopen top chambers. Foreign pollen can be supplementedat each generation to mimic gene flow.
Measuring the strength of selection at various filteringstages over the life cycle. While filtering stages (i.e. stages with strong competition
and selective mortality) are well known in trees especiallyat the young stage (from seeds to juvenile seedlings), thechanges induced by selection at each stage have onlyrarely been assessed. We suggest to monitor populationmeans, and genetic variances of relevant adaptive traits aswell as allelic frequencies at genes of adaptive significanceafter each filtering stage.
Analysing adaptation in transferred populations. Artificial transfers of populations have been done in thepast in forest trees and some of them are well documented(Fallour-Rubio et al. 2009). They can provide alternativeways of tracking evolutionary changes at contemporarytime scales. In some cases these transfers actuallymimicked climate changes, as populations were movedfrom cooler to milder climates. Well known examples aretransfers of North American tree species to Europe, whoseintroduced populations have differentiated in so-calledland races (Northern red oak, Daubree & Kremer 1993), orlarge scale transfers of native trees within Europe.Transferred populations have usually been deployed overlarger areas than provenance tests and the transferredmaterial has been tested in a real forestry context, ratherthan in experimental plantations.
Develop integrative theoretical approaches
Extend evolutionary models of adaptation to climatechange to the case of trees. Analytical models –as the example shown in Box 2-provide conceptual insights into how gene flow,adaptation and biotic interactions shape species ranges instable or changing environments (Pease et al. 1989;Kirkpatrick & Barton 1997; Barton 2001; Polechova et al.2009; Price & Kirkpatrick 2009). Available models,however, rarely incorporate salient features of tree lifecycles, such as distinct dispersal modes, overlappinggenerations, or fat-tailed dispersal kernels (glossary),which may profoundly affect their evolutionary responsesto climate change. How the pace of adaptation in achanging environment depends on variation in fitnessexpressed before vs. after sexual maturity and on thecorrelation between juvenile vs. adult traits is for instancean important area for future research.Exploring the effects of LD gene flow on adaptation alsorequires modelling dispersal as a more complex processthan the simple homogeneous diffusion considered in themodels summarized in Box 2. What is the evolutionaryimpact of rare long distance dispersal events well beyondthe average dispersal distance? While the effect of fat-tailed dispersal kernels on rates of expansion (Thompson& Katul 2008) and neutral diversity (Travis et al. 2010;Fayard et al. 2009) have been explored, we lack similartheoretical investigation of their effects on adaptivediversity in the context of climate change. Answering thisquestion would also help identifying critical features ofpollen and seed dispersal distributions on which empiricalestimates should focus.
128
The idea that climate change is equivalent to simple spatialshift of local climatic conditions is also a grosssimplification. Rather, climatic change may results in newcombinations of precipitation patterns, temperature,photoperiod and biotic conditions that occur nowherewithin the current range, imposing entirely new selectionpressures, and favouring the assembly of novel genotypes(Williams & Jackson 2007). Adaptation to climate changemay thus require the production of new phenotypiccombinations. Reaching such combinations means thatnatural selection is acting on multiple traits simultaneously.Evolutionary models have often been limited to singletraits. Multivariate adaptive responses depend on theamount of genetic correlation (glossary) among traits,which may limit or accelerate adaptation to climatechange (e.g., Etterson & Shaw 2001). Modelling thoseresponses as a univariate rather than multivariate process,as done so far, might thus fail to provide an accuratepicture of species’ adaptive capacities. Although we havebegun to incorporate multivariate evolution into models ofmigration-selection balance (see, Guillaume & Whitlock2007; Guillaume 2011; Duputié et al. in review), empiricaldata are direly missing on patterns of genetic correlationsamong key ecological traits in trees and on the spatial andtemporal variation of their joint selection pressures.
Efforts should be made to fill these gaps and help calibratemodels with real data, to ultimately be able to mergeevolutionary approaches with niche- and process-basedecological forecasting of climate induced range shifts.
Use integrative simulation platforms. Trait-based, mechanistic models have recently beendeveloped enabling predictions of species ranges undercurrent and future non analogous climates (e.g., Morin etal. 2008). For instance the Phenofit model (Chuine &Beaubien 2001) predicts tree distributions based onexisting phenological responses to local climate, droughtand frost tolerance. Microevolutionary phenomenadescribed above have only started to be incorporated insuch ecological forecast models (Kearney et al. 2009;Kuparinen et al. 2010). There is therefore an urgent needto incorporate genetic and ecological concepts intointegrated models to accurately predict the impact ofenvironmental changes on species persistence over thenext century and at the continental scale. Efforts shouldbe dedicated to foster development of integratedcomputer simulation platforms with this aim. Individual-based, population and quantitative genetics simulationpackages already exist (e.g. Nemo, Guillaume &Rougemont 2006; Metapop, e.g. Le Corre & Kremer 2003;Kremer & Le Corre, 2011) that could be extended to includethe ecological and spatially explicit layers needed.
A key aspect of the modelling approach advocated hereis the overlay of predictions from different processes;ecological niche and bioclimatic envelope modelling,variation of gene flow over geographical ranges, and
evolutionary adaptation of local populations. The basallayer, the climatic layer, defines how changes in climaticconditions over the species’ geographical range modifythe localization of suitable habitats (Thuiller 2003). Thesecond layer describes spatial variation of pollen and seeddispersal and should integrate information from theclimatic layer to model the changes of seed and pollenmovements caused by climate change throughmodification of the dispersal kernels (Kuparinen et al.2009; Nathan et al. 2011), pollen viability (Bohrerova et al.2009), or the timing of pollination and femalereceptiveness. The third layer integrates information fromthe two previous ones to predict how local populationsadapt to their shifting conditions (e.g., Kuparinen et al.2010). Information from the climatic layer will set thestrength of selection acting on different adaptive traits byindicating how far from its local optimum a populationmight be. Information on gene flow from the second layerwill indicate hybridization rates and fitness effects,depending on the geographical origin of the migrants(Savolainen et al. 2007; Lopez et al. 2008; Yeaman &Guillaume 2009). It will also indicate the potential forcolonization of new habitats. Finally, the outcome of localadaptation can be interpreted in terms of growth andpersistence of local populations and how this feeds backinto predictions of the intensity of gene flow over largergeographical scales.
ConclusionWhile much emphasis has been placed on the ability oftree populations to migrate fast enough in response toclimate change, we have here examined the potentialconsequences of long distance gene flow on theiradaptive response to climate change. Many tree species have evolved dispersal syndromesenabling the effective flow of genetic information acrossdistant populations inhabiting contrasting environments.We have argued how such exchanges, although potentiallymaladaptive in some evolutionary and demographicscenarios, may in the case of forest trees favour adaptationto changing climatic conditions, compensating for theirlong generation time. Our understanding of the interaction between gene flowand local adaptation under realistic ecological,demographic and dispersal assumptions is howeverlimited, and we have suggested potential theoretical andexperimental avenues of research for the integration ofdispersal biology, ecology and evolutionary quantitativegenetics in a better predictive inferential framework.
AcknowledgementsThis article is a synthesis of a workshop organized withinthe Coordination and Support Action (CSA)FORESTTRAC “Forest ecosystem genomics research:supporting transatlantic cooperation” which took place in
129
Barsac (France) from September 27th to October 1st 2010.FORESTTRAC was supported by the European Unionunder the FP7 Workprogramme Environment (FP7-244096). This is publication ISEM 2012-013 of the Institutdes Sciences de l’Evolution Montpellier. This work wassupported by the Agence Nationale de la Recherche,programme « 6th extinction », through the projectEVORANGE (ANR-09-PEXT-011). FG was supported by agrant from the Swiss NSF (no. PZ00P3_121697). RN wassupported by grants from the Israel Science Foundation(ISF-474 ⁄ 02, ISF-150 ⁄ 07 and ISF-FIRST-1316 ⁄ 05) andthe Adelina and Massimo Della Pergola Chair of LifeSciences. JJRA was supported by a grant from the SpanishMinistry of Science and Innovation (CGL2009-09428).
REFERENCESAhmed, S., Compton, S.G., Butlin, R.K. & Gilmartin, P.M.(2009). Wind-borne insects mediate directional pollentransfer between desert fig trees 160 kilometers apart.Proc. Natl. Acad. Sci. U. S. A., 106, 20342-20347.Aitken, S.N., Yeaman, S., Holliday, J.A., Wang, T. & Curtis-McLane, S. (2008). Adaptation, migration or extirpation:climatic changes outcomes for tree populations.Evolutionary Applications, 1, 95-111.Anderson, J. T., Nuttle, T., Saldaña Rojas, J.S., Pendergast,T.H. & Flecker, A.S. (2011). Extremely long-distance seeddispersal by an overfished Amazonian frugivore.Proceedings of the Royal Society B: BiologicalSciences:doi: 10.1098/rspb.2011.0155.Austerlitz, F., Mariette, S., Machon, N., Gouyon, Ph., Godelle,B. (2000). Effects of colonization processes on geneticdiversity: Differences between annual plants and treespecies. Genetics, 154, 1309-1321.Bacles, C.F.E., Lowe A.J. & Ennos, R.A. (2006). Effectiveseed dispersal across a fragmented landscape. Science, 311,628-628.Barton, N.H. (2001). Adaptation at the edge of a species'range. In: Integrating Ecology and Evolution in a SpatialContext (ed. J. Silvertown and J. Antonovics). BlackwellSciences, Oxford, pp. 365-392.Blanquart, F., Gandon, S. (2011). Evolution of migration in aperiodically changing environment. Am. Nat., 177, 188-201.Bohrer, G., Nathan, R. & Volis, S. (2005). Effects of long-distance dispersal for metapopulation survival and geneticstructure at ecological time and spatial scales. J. Ecol., 93,1029-1040.Bohrer, G., Nathan, R., Katul, G.G., Walko, R.L. & Avissar, R.(2008). Effects of canopy heterogeneity, seed abscission,and inertia on wind-driven dispersal kernels of tree seeds.J. Ecol., 96, 569-580.Bohrerova, Z., Bohrer, G., Cho, K.D., Bolch, M.A. & Linden,K.G. (2009). Determining the viability response of Pinustaeda pollen under abiotic stresses typical to atmosphericconditions during long distance dispersal. Ecol. Appl., 19,656-667.Bridle, J.R. & Vines, T.H. (2007). Limits to evolution at rangemargins: When and why does adaptation fail? Trends Ecol.Evol., 22,140-47.Bridle, J.R., Polechova, J. & Vines, T.H. (2009). Limits toadaptation and patterns of diversity. In: Speciation and
patterns of diversity. (eds Butlin, R.K., Bridle, J.R. & Schluter,D.). Cambridge University Press, pp77-102.
Bridle, J.R., Polechova, J., Kawata, M. & Butlin, R.K. (2010).Why is adaptation prevented at ecological margins? Newinsights from individual-based simulations. Ecol. Lett., 13,484-494.
Bürger, R. & Krall, C. (2004). Quantitative-genetic modelsand changing environments. In: Evolutionary ConservationBiology (eds. Ferriere, R., Dieckmann, U. & Couvet, D.).Cambridge University Press, pp. 171-187.
Buschbom, J., Yanbaev, Y. & Degen, B. (2011). Efficientlong-distance gene flow into an isolated relict oak stand.J. Hered., doi: 10.1093/jhered/esr023
Butlin, R.K., Bridle, J.R. & Kawata, M. (2003). Genetics andthe boundaries of species´ distributions. In: Macroecology:Concepts and Consequences (ed. Blackburn, T. & Gaston,K.J.). Blackwell Science, pp. 274-295.
Campbell, I.D., McDonald, K., Flannigan, M.D. & Kringayark,J. (1999). Long-distance transport of pollen into the Arctic.Nature, 399, 29-30.
Campos-Arceiz, A., Larrinaga, A. R., Weerasinghe, U. R.,Takatsuki, S., Pastorini, J., Leimgruber, P., et al. (2008).Behavior rather than diet mediates seasonal differences inseed dispersal by Asian elephants. Ecology, 89, 2684-2691.
Cornelius, J. (1994). Heritabilities and additive geneticcoefficients of variation in forest trees. Can. J. For. Res., 24,372-379.
Cwynar, L.C. & Macdonald, G.M. (1987). Geographicvariation of lodgpepole pine in relation to populationhistory. Amer. Nat., 129, 463-469
Darling E., Samis, K. E. & Eckert, C. G. (2008). Increasedseed dispersal potential towards geographic range limitsin a Pacific coast dune plant. New Phytol., 178, 424-435.
Daubree J.B. & Kremer, A. (1993). Genetic andphenological differentiation between introduced andnatural populations of Quercus rubra L. Ann. For. Sci.(Suppl 1), 271s-280s.
Edmands, S. & Timmerman, C. C. (2003). Modeling factorsaffecting the severity of outbreeding depression. Conserv.Biol., 17, 883-892.
Ennos, R.A. (1994). Estimating the relative rates of pollenand seed migration among plant populations. Heredity, 72,250-259.
Etterson, J. R. & Shaw, R. G. (2001). Constraint to adaptiveevolution in response to global warming. Science, 294, 151-154.
Fallour-Rubio, D., Guibal, F., Klein, E.K., Bariteau, M. &Lefèvre, F. (2009). Rapidchanges in plasticity acrossgenerations within an expanding cedar forest. J. Evol. Biol.,22, 553-563.
Fayard, J., Klein, E. K. & Lefèvre, F. (2009). Long distancedispersal and the fate of a gene from the colonizationfront. J. Evol. Biol., 22, 2171-2182.
Frankham, R., Ballou, J.D., Eldridge, M.D.B., Lacy, R.C., Ralls,K., Dudash, M.R. & Fenster, C.B. (2011). Predicting theprobability of outbreeding depression. ConservationBiology, 25, 465-475.
Garcia-Ramos, G. & Kirkpatrick, M. (1997). Genetic modelsof adaptation and gene flow in peripheral populations.Evolution, 51, 21-28.
130
Glémin, S., Ronfort, J. & Bataillon, T. (2003). Patterns ofinbreeding depression and architecture of the load insubdivided populations. Genetics, 165, 2193-2212.
Gomulkiewicz, R. & Houle, D. (2009). Demographic andgenetic constraints on evolution. Am. Nat., 174, E218-E229.
Goto, S., Lijima, H., Ogawa, H & Ohya, K. (2011).Outbreeding depression caused by intraspecifichybridization between local and non local genotypes inAbies sachalinensis. Restor. Ecol., 19, 243-250.
Guillaume. F. & Rougemont, J. (2006). Nemo: anevolutionary and population genetics programmingframework. Bioinformatics, 22, 2556-2557.
Guillaume, F. & Whitlock, M.C. (2007). Effects of migrationon the genetic covariance matrix. Evolution, 61, 2398-2409.
Guillaume, F. (2011). Migration-induced phenotypicdivergence: the migration-selection balance on correlatedtraits. Evolution (In Press) DOI: 10.1111/j.1558-5646.2011.01248.x
Hampe, A. & Petit, R.J. (2005). Conserving biodiversityunder climate change: the rear edge matters. Ecol. Lett., 8,461-467.
Hamrick, J.L., Godt, M.J.W. & Sherman-Broyles, S.L. (1992).Factors influencing levels of genetic diversity in woodyplant species. New Forest., 6, 95-124.
Harfouche, A., Bahrman, N., Baradat, P., Guyon, J.P., Petit,R.J. & Kremer, A. (2000). Provenance hybridization in adiallel mating scheme of maritime pine (Pinus pinasterAit.). II. Heterosis. Can. J. . For. Res., 30, 10-16.
Holbrook, K.M. & Smith, T.B. (2000). Seed dispersal andmovement patterns in two species of Ceratogymnahornbills in a West African tropical lowland forest.Oecologia, 125, 249-257.
Hu, X.S. & Li, B. (2003). On migration load of seeds andpollen grains in a local population. Heredity, 90, 162-168.
Hu, X.S. & He, F.L. (2006). Seed and pollen flow inexpanding a species' range. J. Theor. Biol., 240, 662-672.
Iverson, L.R., Prasad, A.M., Matthews, S.N. & Peters, M.(2008). Estimating potential habitat for 134 eastern UStree species under six climate scenarios. For. Ecol. Man.,254, 390-406.
Johnson, T. & Barton, N. (2005). Theoretical models ofselection and mutation on quantitative traits. Philos. Trans.R. Soc. B. Biol. Sci., 360, 1411-1425.
Jordano, P., Garcia, C., Godoy, J.A. & Garcia-Castano, J.L.(2007). Differential contribution of frugivores to complexseed dispersal patterns. Proc..Natl. Acad. Sci. U S A., 104,3278-3282.
Kamm, U., Rotach, P., Gugerli, F., Siroky, M., Edwards, P. &Holderegger, R. (2009). Frequent long-distance gene flowin a rare temperate forest tree (Sorbus domestica) at thelandscape level. Heredity, 103, 476-482.
Kaufman, S.R., Smouse, P.E. & Alvarez-Buylla, E.R. (1998).Pollen-mediated gene flow and differential malereproductive success in a tropical pioneer tree, Cecropiaobtusifolia Bertol. (Moraceae): a paternity analysis.Heredity, 81, 164-173.
Kawecki, T.J. (2008). Adaptation to marginal habitats.Annu. Rev. Ecol. Evol. Syst., 39, 321-42.
Kearney, M., Porter, W.P., Williams, C., Ritchie, S. &Hoffmann, A.A. (2009). Integrating biophysical modelsand evolutionary theory to predict climatic impacts on
species' ranges: the dengue mosquito Aedes aegypti inAustralia. Funct. Ecol., 23, 528-538.Kelly, C.K., Chase, M.W., de Bruijn, A., Fay, M.F. & Woodward,F.I. (2003). Temperature-based population segregation inbirch. Ecol. Lett., 6, 87-89.Kirkpatrick, M. & Barton N.H. (1997). Evolution of a species'range. Am. Nat., 150, 1-23.Kramer, K., Buiteveld, J., Forstreuter, M., Geburek, T.,Leonardi, S., Menozzi, P., et al. (2008). Bridging the gapbetween ecophysiological and genetic knowledge toassess the adaptive potential of European beech. Ecol.Modell., 216, 333-353.Kremer, A., Le Corre, V., Petit, R.J. & Ducousso, A. (2010).Historical and contemporary dynamics of adaptivedifferentiation in European oaks. In: Molecular approachesin natural resource Conservation (ed. DeWoody, A.,Bickham, J., Michler, C., Nichols K., Rhodes G. & Woeste K.).Cambridge University Press, pp. 101-117.Kremer, A. & Le Corre, V. (2011). Decoupling ofdifferentiation between traits and their underlying genesin response to divergent selection. Hereditydoi:10.1038/hdy.2011.81Kuparinen, A., Katul, G.G., Nathan, R. & Schurr, F.M. (2009).Increases in air temperature can promote wind-drivendispersal and spread of plants. Proc. R. Soc. B Biol. Sci.,276, 3081-3087.Kuparinen, A., Savolainen, O. & Schurr, F.M. (2010).Increased mortality can promote evolutionary adaptationof forest trees to climate change. For. Ecol. Man., 259, 1003-1008. Lande, R. & Shannon, S. (1996). The role of geneticvariation in adaptation and population persistence in achanging environment. Evolution, 50, 434-437.Le Corre, V. & Kremer, A. (2003). Genetic variability atneutral markers, quantitative trait loci and trait in asubdivided population under selection. Genetics, 164,1205-1219.Loarie S.R., Duffy, P.B., Hamilton, H., Asner, G.P., Field, C.B.& Ackerly, D.D. (2009). The velocity of climate change.Nature, 462, 1052-1056.Lopez, S., Rousset, F., Shaw, F. H., Shaw, R. G. & Ronce, O.(2008). Migration load in plants: role of pollen and seeddispersal in heterogeneous landscapes. J. Evol. Biol., 21 ,294-309.Lopez, S., Rousset, F., Shaw, F. H., Shaw, R. G. & Ronce, O.(2009). Joint effects of inbreeding and local adaptationon the evolution of genetic load after fragmentation.Conserv. Biol., 23,1618-1627.Manel, S., Gaggiotti, O.E. & Waples, R.S. (2005).Assignment methods: matching biological questions withappropriate techniques. Trends Ecol. Evol., 20, 136-142.Matsuki, Y., Isagi, Y. & Suyama, Y. (2007). The determinationof multiple microsatellite genotypes and DNA sequencesfrom a single pollen grain. Molecular Ecology Notes, 7, 194-198.Mc Kenney, D.W., Pedlar, J.H., Lawrence, K., Campbell, K. &Hutchinson, M.F. (2007). Potential impacts of climatechange on the distribution of North American trees.Bioscience, 57, 939-948.Mimura, M, & Aitken, S.N. (2007a). Adaptive gradients andisolation-by-distance with postglacial migration in Piceasitchensis. Heredity, 99, 224-232.
131
Mimura, M, & Aitken, S.N. (2007b). Increased selfing anddecreased effective pollen donor number in peripheralrelative to central populations in Picea sitchensis(Pinaceae). Am. J. Bot., 94, 991-998.
Morgenstern, E.K. (1996). Geographic variation in foresttrees. University of British Columbia Press, Vancouver,Canada. 209 p.
Morin, X., Viner, D. & Chuine, I. (2008). Tree species rangeshifts at a continental scale: new predictive insights froma process-based model. J. Ecol., 96, 784-794.
Muñoz, J., Felicísimo, A.M., Cabezas, F., Burgaz, A.R. &Martínez, I. (2004). Wind as a long-distance dispersalvehicle in the Southern Hemisphere. Science, 304, 1144-1147.
Nason, J.D., Herre, E.A. & Hamrick, J.L. (1998). The breedingstructure of a tropical keystone plant species. Nature, 391,685-87.
Nathan, R., Schurr, F.M., Spiegel, O., Steinitz, O.,Trakhtenbrot, A. & Tsoar, A. (2008). Mechanisms of long-distance seed dispersal. Trends Ecol. Evol., 23, 638-647.
Nathan, R., Horvitz, N., He, Y., Kuparinen, A., Schurr, F.M. &Katul, G.G. (2011). Spread of North American wind-dispersed trees in future environments. Ecol. Lett., 14,211-219.
Neale, D.B. & Kremer, A. (2011). Forest tree genomics:growing resources and applications. Nature ReviewsGenetics, 12, 111-122.
Nilsson, J.E. (1995). Genetic variation in the natural pollencloud of Pinus sylvestris - A study based on progenytesting. Scand. J. For. Res., 10, 140-148.
Pease, C.P., Lande, R. & Bull, J.J. (1989). A model ofpopulation growth, dispersal and evolution in a changingenvironment. Ecology, 70, 1657-64.
Petit, R.J., Hu, F.S. & Dick, C.K. (2008). Forests of the past:a window to future changes. Science, 320, 1450-1452.
Polechova, J., Barton, N. & Marion, G. (2009). Species'range: adaptation in space and time. Am. Nat., 174, E186-204.
Price, T.D. & Kirkpatrick, M. (2009). Evolutionary stablerange limits set by interspecific competition. Proceedingsof the Royal Society B-Biological sciences, 276, 1429-1434.
Rehfeldt, G. E., Ying, C.C., Spittlehouse, D.L. & Hamilton,D.A. (1999). Genetic responses to climate in Pinus contorta:niche breadth, climate change, and reforestation. Ecol.Monogr., 69, 375-407.
Rehfeldt, G.E, Tchebakova, N.M., Parfenova, Y.I., Wykoff,W.R., Kuzmina, N.A. & Milyutin, L.I. (2002). Intraspecificresponse to climate in Pinus sylvestris. Glob. Change Biol.,8, 912-929.
Riba, M., Mayol, M., Giles, B.E., Ronce, O., Imbert, E., Van derVelde, M., Chauvet, S., Ericson, L. , Bijlsma, R., Vosman, B.,Smulders, M.J.M. & Olivieri, I. (2009). Darwin’s windhypothesis: does it work for plant dispersal in fragmentedhabitats. New Phytologist, 183, 667-677.
Robledo-Arnuncio, J.J. (2011). Wind pollination overmesoscale distances: an investigation with Scots pine. NewPhytol., 190, 222-233.
Savolainen, O., Pyhäjärvi, T., & Knürr, T. (2007). Gene flowand local adaptation in trees. Ann. Rev. Ecol. Evol. Syst., 38,595-619.
Schueler, S., Schlünzen, K.H. & Scholz, F. (2005). Viabilityand sensitivity of oak pollen and its implications for pollen-mediated gene flow. Trends Ecol. Evol., 19, 154-161.Siljamo, P., Sofiev, M., Severova, E., Ranta, H., Kukkonen, J.,Polevova, S., et al. (2008). Sources, impact and exchangeof early-spring birch pollen in the Moscow region andFinland. Aerobiologia, 24, 211-230.Solomon, S., Qin, D., Manning, M., Chen, Z., Marquis, M,Averyt, K.B, et al. (2007). Climate Change 2007: ThePhysical Science Basis. Contribution of Working Group I tothe Fourth Assessment Report of the IntergovernmentalPanel on Climate Change. Cambridge University Press,Cambridge, United Kingdom and New York, NY, USA.Thompson, S. & Katul, G.G. (2008). Plant propagationfronts and wind dispersal: An analytical model to upscalefrom seconds to decades using superstatistics Am. Nat.,171, 468-479. Thuiller, W. (2003). BIOMOD - optimizing predictions ofspecies distributions and projecting potential future shiftsunder global change. Glob. Change Biol., 9, 1353-1362.Travis, J.M.J., Munkemuller, T. & Burton, O.J. (2010).Mutation surfing and the evolution of dispersal duringrange expansions. J. Evol. Biol., 12, 2656-2667.Tsoar, A., Shohami, D. & Nathan, R. (2011). A movementecology approach to study seed dispersal and plantinvasion: an overview and application of seed dispersal byfruit bats. Pages 103-119. In: Fifty Years of Invasion Ecology:The Legacy of Charles Elton (ed Richardson, D.M.), Wiley-Blackwell, Oxford, UK. doi: 10.1002/9781444329988.ch9Varis, S., Pakkanen, A., Galofré, A. & Pulkkinen, P. (2009).The extent of south-north pollen transfer in Finnish Scotspine. Silva Fenn., 43, 717-726.Wang, T.L., O'Neill, G.A. & Aitken, S.N. (2010). Integratingenvironmental and genetic effects to predict responses oftree populations to climate. Ecol. Appl., 20, 153-163.Westcott, D.A., Setter, M., Bradford, M.G., McKeown, A. &Setter, S. (2008). Cassowary dispersal of the invasive pondapple in a tropical rainforest: the contribution ofsubordinate dispersal modes in invasion. Diversity andDistributions, 14, 432-439.White, G.M., Boshier, D.H. & Powell, W. (2002). Increasedpollen flow counteracts fragmentation in a tropical dryforest: An example from Swietenia humilis Zuccarini. Proc.Natl. Acad. Sci. USA, 99, 2038-42.Willi, Y., & Fischer, M. (2005). Genetic rescue ininterconnected populations of small and large size of theself-incompatible Ranunculus reptans. Heredity, 95, 437-443.Williams, C.G. (2010). Long-distance pine pollen stillgerminates after meso-scale dispersal. Am. J. Bot., 97, 846-855.Williams J.W & Jackson, S.T. (2007). Novel climates, no-analog communities, and ecological surprises. Front. Ecol.Environ., 5,475–82Wright, S.J., Trakhtenbrot, A., Bohrer, G., Detto, M., Katul,G.G., Horvitz, N., et al. (2008). Understanding strategies forseed dispersal by wind under contrasting atmosphericconditions. Proc. Nat. Acad. Sci. USA, 105, 19084-19089.Yeaman, S. & Jarvis, A. (2006). Regional heterogeneity andgene flow maintain variance in a quantitative trait withinpopulations of lodgepole pine. Proc. R. Soc. B Biol. Sci.,273, 1587-1593.
132
Yeaman, S. & Guillaume, F. (2009). Predicting adaptationunder migration load: the role of genetic skew. Evolution,63, 2926-2938.
Zheng Y.Q. & Ennos R.A. (1999). Genetic variability andstructure of natural and domesticated populations ofCaribbean pine (Pinus caribaea Morelet). Theor. Appl.Genet. 98, 765-771.
GLOSSARYAdaptive divergence: the differentiation among the meanphenotypes of populations subject to different selectivepressures.
Adaptive trait: a phenotypic trait that enhances the fitnessof an individual in a particular environment. Examples fortrees are the time of flushing and bud set, andphysiological traits determining water use efficiency.
Aerobiology: the study of airborne organisms and organicparticles.
Bioclimatic envelope: the predicted potential geographicdistribution of a species in a particular climatic scenario.
Breeding value: part of an individual’s phenotype that canbe transmitted to its offspring through the transmission ofgenetic material.
Bud set: formation of a terminal bud at the end of thevegetative period, the timing of which is heritable anddetermines cold tolerance in boreal and temperate trees.
Connectivity map: a map describing the cost or theprobability of dispersal along possible trajectories linkinga set of locations.
Dispersal kernel: a probability density function of dispersaldistances or locations from a source point.
Effective dispersal: dispersal leading to successfulestablishment or reproduction.
Evolutionary load: the mean fitness loss in a populationproduced by the deviation of the mean phenotype fromthe local optimum due to varying selection in space andtime.
Fat-tailed dispersal kernel: dispersal kernels with a slowprobability decrease at long distances relative to anegative exponential.
Genetic assignment: the probabilistic ascertainment of theoriginal population of an individual genotype.
Genetic correlation: non independent genetic variation fortwo phenotypic traits, which can be due in particular tothe fact that the same genes affect variation of severaltraits.
Genetic load: the loss of mean fitness in a population dueto the departure of individual phenotypes from theoptimum in a given environment.Genetic variance: part of the total phenotypic variancethat is due to genetic differences between individuals.Heritability: the proportion of phenotypic variation amongthe individuals of a population in a particular environmentthat is due to genetic variation. Heterosis: the higher fitness of progeny obtained throughcrosses between populations rather than within the samepopulation.Inbreeding depression: reduced fitness of inbredindividuals.Lag load: the loss of mean fitness in a population due tothe lagging response of the phenotypic mean to temporalchanges in the optimum.Lagrangian dispersal model: a mathematical descriptionof the trajectories of individual dispersers.Migration load: the contribution of immigrant genes tomaladaptation.Outbreeding depression: reduced fitness of individualsborn to parents from different populations.Parentage analysis: the probabilistic determination of theparents of an individual, frequently using genetic markers.Phenotypic cline: a continuous change of a phenotypictrait along an environmental and/or geographical gradient.Pollen/seed shadow: the density of pollen grains/seedsdispersed at different distances from an individual. Itequals the product of the dispersal kernel by theindividual's fecundity.Provenance: the original geographic source of apopulation or group of individuals (used also to refer tosuch a population or group).Provenance test: a common garden experiment, in one ormore locations, where the genetic variation of differentprovenances is evaluated (see provenance).Reaction norm: the set of phenotypes expressed by aparticular genotype under a range of environments.Response to selection: the difference between the meanphenotype of the offspring of a group of selected parentsand the mean phenotype of the population beforeselection. Stabilizing selection: selection that favours intermediateover extreme phenotypes.Standing load: the loss of mean fitness in a population dueto the phenotypic variance around the mean phenotype.Present even when the mean phenotype matches theoptimum.
133
CONSIDERING EVOLUTIONARY PROCESSESIN ADAPTIVE FORESTRY
François Lefèvre*, Thomas Boivin, Aurore Bontemps,François Courbet, Hendrik Davi, Marion Durand-Gillmann,Bruno Fady, Julie Gauzere, Cindy Gidoin, Marie-JoeKaram, Hadrien Lalagüe, Sylvie Oddou-Muratorio,Christian Pichot.
Corresponding Author:INRA, UR629 Ecologie des Forêts Méditerranéennes, URFM,Domaine Saint Paul, Site Agroparc, 84914 Avignon Cedex 9, France.* [email protected]
IntroductionEcosystem functioning depends on the adaptation ofliving organisms to their physicochemical environment. Inparticular, the maladaptation of trees to local conditionscan provoke ecosystem dysfunctions such as forestdieback or failure of regeneration, and it can also affectbiotic interactions between trees and associated species.Multi-site common-garden experiments, which allowmodelling the reaction norm of current tree populationsto climatic parameters, suggest that climate change willlead to a high risk of maladaptation of tree species, at leastin some parts of the current distribution range (Savolainenet al. 2007; St Clair and Howe 2007). To maintain forestservices under climate change, tree stands will have torespond within one to ten generations to (1) more frequentand more intense extreme climatic events, (2) changingmean climatic parameters and (3) other related changessuch as parasite outbreaks (IPCC 2007). Consequently,ecological services of the forests will depend on theintensity and velocity of the evolution of tree populationsin response to climate change (Rehfeldt et al. 2001). Thus,adaptation should be considered in a dynamic
perspective, as a bouquet of evolutionary processes thatchange populations and communities to fit theirenvironment. Among these processes, genetic adaptation,i.e. genetic change of a population responding to selection,can be rapid and contribute to the ecological success ofspecies facing climate change including forest trees(Aitken et al. 2008; Hoffmann and Sgrò 2011). A recentreview stressed the high potential of evolutionary responseto climate change in trees (Alberto et al. 2013). However,evidence of lack of adaptation does also exist, e.g. nichelimits and empty niches, including for tree species thathave large population size and produce huge quantities ofseeds (Bradshaw 1991).
During the last century, foresters have succeeded inadapting forest genetic resources to bioclimatic conditionsvery different from their native range, obtaining goodsurvival, growth and reproduction in the newenvironments. Emblematic examples are the worldwidetransfer of Pinus radiata (Yan et al. 2006) and the south tonorth translocation of Picea abies (Skrøppa et al. 2010).This adaptation was achieved in very few generations oftrees, it proceeds from plasticity and/or evolution. For
Context: Managing forests under climate change requires adaptation. The adaptive capacity of foresttree populations is huge but not limitless. Integrating evolutionary considerations into adaptiveforestry practice will enhance the capacity of managed forests to respond to climate-driven changes.Aims: Focusing on natural regeneration systems, we propose a general framework that can be usedin various and complex local situations by forest managers, in combination with their own expertise,to integrate evolutionary considerations into decision making for the emergence of an evolution-oriented forestry. Methods: We develop a simple process-based analytical grid, using few processes and parameters,to analyse the impact of forestry practice on the evolution and evolvability of tree populations.Results: We review qualitative and, whenever possible, quantitative expectations on the intensity ofevolutionary drivers in forest trees. Then, we review the effects of actual and potential forestrypractice on the evolutionary processes. We illustrate the complexity of interactions in two study cases:the evolutionary consequences for forest trees of biotic interactions and of highly heterogeneousenvironment. Conclusion: Evolution-oriented forestry may contribute adapting forests to climate change. It requirescombining short-term and long-term objectives. We propose future lines of research andexperimentation.
Key words: genetic resources ; silviculture ; adaptation ; climate change.
Annals of Forest Science (in press, accepted 07/02/2013)
Published in Annals of Forest Sciences (2014) 71: 723-739, with doi:10.1007/s13595-013-0272-1
134
each adaptive trait, the phenotypic plasticity and thecapacity of evolution depend on the genetic content andthe environment of the population, which can both evolve(Pigliucci 2008). Within each population, genetic changesof mean trait value, plasticity and evolvability result fromthe combination of random and selectively orientedprocesses that can be affected by forestry practice.Whether immediate response to selection can hamperfuture evolutions, e.g. due to erosion of the geneticdiversity, remains an open question. Evidence frombreeding experience shows that the geneticresponsiveness of populations submitted to continuousselection can be maintained through time for some traits:evolvability was maintained over more than 100generations of selection for protein and oil content in theIllinois maize breeding population (Moose et al. 2004). Nosuch long-term empirical evidence is available for trees.However, local adaptation that commonly emerged inmost tree species over the course of post-glacialrecolonisation provides another illustration of achievedevolution (Savolainen et al. 2007). Noticeably, this localadaptation did not completely erode within-populationgenetic variation of adaptive traits (Mimura and Aitken2007; Alberto et al. 2013). The long-term maintenance ofevolvability also depends on the genetic architecture ofthe traits under selection, and in the case of polygenicinheritance, Kremer and Le Corre (2012) showed thatevolutionary changes first result from the selection of thefittest combinations of gene alleles before it reduces theallelic diversity at individual gene loci.
However, adaptation is not limitless. Futuyma (2010)reviewed the factors that can limit adaptation from theshort term to the phylogenic time scale. Focusing on anecological rather than geological time scale, we can retainhere seven constraints to evolutionary changes. Firstly,developmental constraints result from functionalinteractions among traits involved in the elaboration of theperformance. We use here “performance” as a genericterm, referring either to fitness components in anecological perception or to forestry objectives like woodquantity or quality in an agronomic perspective, or to anycombination of these traits. Secondly, genetic constraintsresult from the genetic architecture of traits, with complexepistatic interactions between several genes on one traitor pleiotropic effects of one single gene on several traits.Actually, forestry practices have little (but not null) impacton these first two limiting factors. Then, Futuyma (2010)identified four limiting factors of adaptation on whichforestry practice may have direct or indirect impact: lackof genetic diversity, demographic stochasticity (counter-acting directional selection), random genetic drift andasymmetric gene flow (e.g. at niche limits). In addition tothese, Kuparinen et al. (2010) identified another limitingfactor potentially affected by forestry practice: lowmortality.
Deciphering the factors that determine adaptation in thereal forest, from the genes to the traits and from the traits
to the performance, is complex. Each environment cannotbe reduced to only one parameter, e.g. altitude combinestemperature, soil, rainfall, biotic factors etc. Similarly, eachperformance, e.g. survival in stress conditions, can beachieved by different combinations of functional traitvalues. Finally, each value of a functional trait can beobtained by different combinations of gene alleles andinteractions. As a consequence, one can hardly attribute afixed intrinsic adaptive value to each physiological trait orto each gene allele. This complexity is also a chance foradaptation because it provides flexibility and there aremultiple biological pathways to reach an ecologicalsolution.
Forest management can enhance forest adaptation toclimate change in three ways. Firstly, a full-control strategyconsists in replacing the local population by a presumablybetter fit population. This is achieved through plantationof so-called forest reproductive material, which eithercomes from a breeding program or from a selected seedstand. This strategy allows for drastic stepwise evolutions,but it requires minimizing uncertainties about theecological integration of the alien resource in the new siteunder future climates. Secondly, a driving strategy consistsin guiding, i.e. supporting and accelerating, naturalevolutionary processes using the local genetic resource,ecologically integrated within its current environment. Thisis achieved through natural regeneration. This strategyonly produces progressive changes, limited by theevolutionary potential of the local resource, but it is flexibleand relaxes the ecological uncertainty related tointroduction of alien material. Thirdly, a combined strategywould follow the driving strategy after enrichment of thelocal resource with a certain amount of alien material inorder to increase the evolutionary potential and toaccelerate evolution while limiting the ecologicaluncertainty due to introduction. Since the first approachhas already been treated elsewhere and deserves acomplete treatment, e.g. see St Clair and Howe (2007) fora concrete experience in Pseudotsuga menziesii, we focushere on the second and third strategies. Three mainquestions emerge in this context: (1) How fast can treepopulations respond to changes? (2) Will the populationskeep their capacity to adapt to both continuous andunpredictable changes? (3) How can forestry practiceaffect, positively or negatively, the properties ofadaptation and adaptability through time? Due to thecomplexity of evolutionary mechanisms interacting withhighly diverse local conditions and climate changescenarios, the first two questions can only receive case-specific answers. Here, we call evolution-oriented forestrya particular form of adaptive forestry that integrates theenhancement of evolutionary processes among itspossible objectives, and we propose a process-basedapproach to investigate the impact of silviculture on theevolution and evolvability of tree populations facingclimate change.
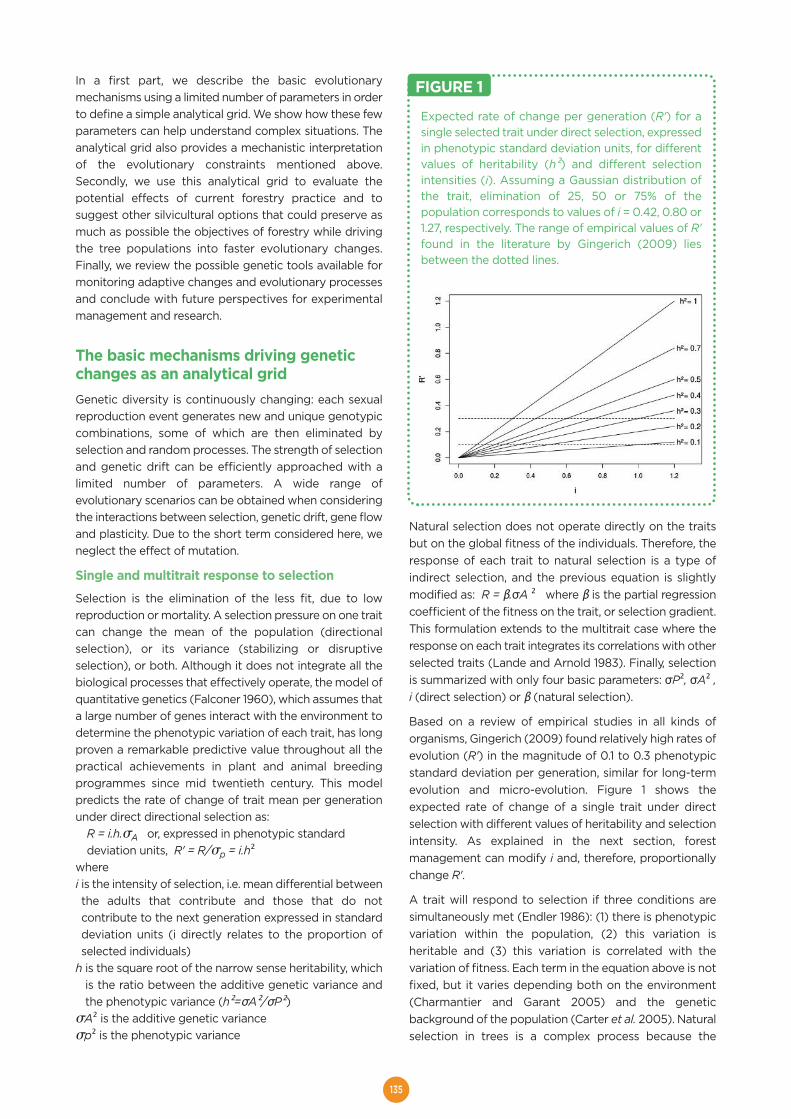
135
In a first part, we describe the basic evolutionarymechanisms using a limited number of parameters in orderto define a simple analytical grid. We show how these fewparameters can help understand complex situations. Theanalytical grid also provides a mechanistic interpretationof the evolutionary constraints mentioned above.Secondly, we use this analytical grid to evaluate thepotential effects of current forestry practice and tosuggest other silvicultural options that could preserve asmuch as possible the objectives of forestry while drivingthe tree populations into faster evolutionary changes.Finally, we review the possible genetic tools available formonitoring adaptive changes and evolutionary processesand conclude with future perspectives for experimentalmanagement and research.
The basic mechanisms driving geneticchanges as an analytical gridGenetic diversity is continuously changing: each sexualreproduction event generates new and unique genotypiccombinations, some of which are then eliminated byselection and random processes. The strength of selectionand genetic drift can be efficiently approached with alimited number of parameters. A wide range ofevolutionary scenarios can be obtained when consideringthe interactions between selection, genetic drift, gene flowand plasticity. Due to the short term considered here, weneglect the effect of mutation.
Single and multitrait response to selection
Selection is the elimination of the less fit, due to lowreproduction or mortality. A selection pressure on one traitcan change the mean of the population (directionalselection), or its variance (stabilizing or disruptiveselection), or both. Although it does not integrate all thebiological processes that effectively operate, the model ofquantitative genetics (Falconer 1960), which assumes thata large number of genes interact with the environment todetermine the phenotypic variation of each trait, has longproven a remarkable predictive value throughout all thepractical achievements in plant and animal breedingprogrammes since mid twentieth century. This modelpredicts the rate of change of trait mean per generationunder direct directional selection as:
R = i.h.�A or, expressed in phenotypic standarddeviation units, R' = R/�p = i.h²
where i is the intensity of selection, i.e. mean differential betweenthe adults that contribute and those that do notcontribute to the next generation expressed in standarddeviation units (i directly relates to the proportion ofselected individuals)
h is the square root of the narrow sense heritability, whichis the ratio between the additive genetic variance andthe phenotypic variance (h²=σA²/σP²)
�A² is the additive genetic variance�p² is the phenotypic variance
Natural selection does not operate directly on the traitsbut on the global fitness of the individuals. Therefore, theresponse of each trait to natural selection is a type ofindirect selection, and the previous equation is slightlymodified as: R = β.σA ² where β is the partial regressioncoefficient of the fitness on the trait, or selection gradient.This formulation extends to the multitrait case where theresponse on each trait integrates its correlations with otherselected traits (Lande and Arnold 1983). Finally, selectionis summarized with only four basic parameters: σP², σA² ,i (direct selection) or β (natural selection).
Based on a review of empirical studies in all kinds oforganisms, Gingerich (2009) found relatively high rates ofevolution (R') in the magnitude of 0.1 to 0.3 phenotypicstandard deviation per generation, similar for long-termevolution and micro-evolution. Figure 1 shows theexpected rate of change of a single trait under directselection with different values of heritability and selectionintensity. As explained in the next section, forestmanagement can modify i and, therefore, proportionallychange R'.
A trait will respond to selection if three conditions aresimultaneously met (Endler 1986): (1) there is phenotypicvariation within the population, (2) this variation isheritable and (3) this variation is correlated with thevariation of fitness. Each term in the equation above is notfixed, but it varies depending both on the environment(Charmantier and Garant 2005) and the geneticbackground of the population (Carter et al. 2005). Naturalselection in trees is a complex process because the
Expected rate of change per generation (R') for asingle selected trait under direct selection, expressedin phenotypic standard deviation units, for differentvalues of heritability (h²) and different selectionintensities (i). Assuming a Gaussian distribution ofthe trait, elimination of 25, 50 or 75% of thepopulation corresponds to values of i = 0.42, 0.80 or1.27, respectively. The range of empirical values of R'found in the literature by Gingerich (2009) liesbetween the dotted lines.
FIGURE 1
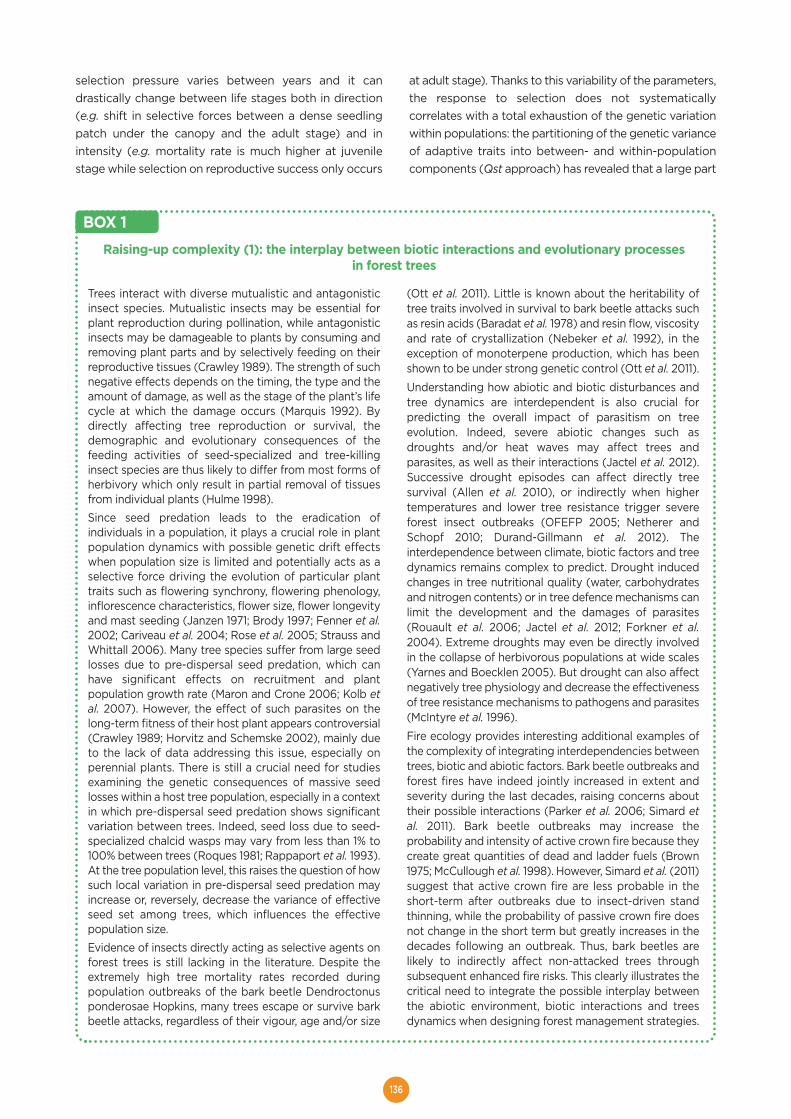
136
selection pressure varies between years and it candrastically change between life stages both in direction(e.g. shift in selective forces between a dense seedlingpatch under the canopy and the adult stage) and inintensity (e.g. mortality rate is much higher at juvenilestage while selection on reproductive success only occurs
at adult stage). Thanks to this variability of the parameters,the response to selection does not systematicallycorrelates with a total exhaustion of the genetic variationwithin populations: the partitioning of the genetic varianceof adaptive traits into between- and within-populationcomponents (Qst approach) has revealed that a large part
Raising-up complexity (1): the interplay between biotic interactions and evolutionary processesin forest trees
Trees interact with diverse mutualistic and antagonisticinsect species. Mutualistic insects may be essential forplant reproduction during pollination, while antagonisticinsects may be damageable to plants by consuming andremoving plant parts and by selectively feeding on theirreproductive tissues (Crawley 1989). The strength of suchnegative effects depends on the timing, the type and theamount of damage, as well as the stage of the plant’s lifecycle at which the damage occurs (Marquis 1992). Bydirectly affecting tree reproduction or survival, thedemographic and evolutionary consequences of thefeeding activities of seed-specialized and tree-killinginsect species are thus likely to differ from most forms ofherbivory which only result in partial removal of tissuesfrom individual plants (Hulme 1998). Since seed predation leads to the eradication ofindividuals in a population, it plays a crucial role in plantpopulation dynamics with possible genetic drift effectswhen population size is limited and potentially acts as aselective force driving the evolution of particular planttraits such as flowering synchrony, flowering phenology,inflorescence characteristics, flower size, flower longevityand mast seeding (Janzen 1971; Brody 1997; Fenner et al.2002; Cariveau et al. 2004; Rose et al. 2005; Strauss andWhittall 2006). Many tree species suffer from large seedlosses due to pre-dispersal seed predation, which canhave significant effects on recruitment and plantpopulation growth rate (Maron and Crone 2006; Kolb etal. 2007). However, the effect of such parasites on thelong-term fitness of their host plant appears controversial(Crawley 1989; Horvitz and Schemske 2002), mainly dueto the lack of data addressing this issue, especially onperennial plants. There is still a crucial need for studiesexamining the genetic consequences of massive seedlosses within a host tree population, especially in a contextin which pre-dispersal seed predation shows significantvariation between trees. Indeed, seed loss due to seed-specialized chalcid wasps may vary from less than 1% to100% between trees (Roques 1981; Rappaport et al. 1993).At the tree population level, this raises the question of howsuch local variation in pre-dispersal seed predation mayincrease or, reversely, decrease the variance of effectiveseed set among trees, which influences the effectivepopulation size. Evidence of insects directly acting as selective agents onforest trees is still lacking in the literature. Despite theextremely high tree mortality rates recorded duringpopulation outbreaks of the bark beetle Dendroctonusponderosae Hopkins, many trees escape or survive barkbeetle attacks, regardless of their vigour, age and/or size
(Ott et al. 2011). Little is known about the heritability oftree traits involved in survival to bark beetle attacks suchas resin acids (Baradat et al. 1978) and resin flow, viscosityand rate of crystallization (Nebeker et al. 1992), in theexception of monoterpene production, which has beenshown to be under strong genetic control (Ott et al. 2011).
Understanding how abiotic and biotic disturbances andtree dynamics are interdependent is also crucial forpredicting the overall impact of parasitism on treeevolution. Indeed, severe abiotic changes such asdroughts and/or heat waves may affect trees andparasites, as well as their interactions (Jactel et al. 2012).Successive drought episodes can affect directly treesurvival (Allen et al. 2010), or indirectly when highertemperatures and lower tree resistance trigger severeforest insect outbreaks (OFEFP 2005; Netherer andSchopf 2010; Durand-Gillmann et al. 2012). Theinterdependence between climate, biotic factors and treedynamics remains complex to predict. Drought inducedchanges in tree nutritional quality (water, carbohydratesand nitrogen contents) or in tree defence mechanisms canlimit the development and the damages of parasites(Rouault et al. 2006; Jactel et al. 2012; Forkner et al.2004). Extreme droughts may even be directly involvedin the collapse of herbivorous populations at wide scales(Yarnes and Boecklen 2005). But drought can also affectnegatively tree physiology and decrease the effectivenessof tree resistance mechanisms to pathogens and parasites(McIntyre et al. 1996).
Fire ecology provides interesting additional examples ofthe complexity of integrating interdependencies betweentrees, biotic and abiotic factors. Bark beetle outbreaks andforest fires have indeed jointly increased in extent andseverity during the last decades, raising concerns abouttheir possible interactions (Parker et al. 2006; Simard etal. 2011). Bark beetle outbreaks may increase theprobability and intensity of active crown fire because theycreate great quantities of dead and ladder fuels (Brown1975; McCullough et al. 1998). However, Simard et al. (2011)suggest that active crown fire are less probable in theshort-term after outbreaks due to insect-driven standthinning, while the probability of passive crown fire doesnot change in the short term but greatly increases in thedecades following an outbreak. Thus, bark beetles arelikely to indirectly affect non-attacked trees throughsubsequent enhanced fire risks. This clearly illustrates thecritical need to integrate the possible interplay betweenthe abiotic environment, biotic interactions and treesdynamics when designing forest management strategies.
BOX 1
137
of the genetic variance of functional traits is maintainedwithin population (Alberto et al. 2013, for a review), and anabsence of within population genetic variance for aquantitative trait has exceptionally been reported in trees(Sáenz-Romero et al. 2006). Interestingly, the geneticarchitecture of a trait, i.e. the system of genes involved inthe variation of the trait and their interactions with othertraits, simultaneously determines long-term persistence ofevolvability by a capacity to release cryptic variation in anew environmental or genetic context (Le Rouzic et al.2007) as well as a potential limit to selection in case ofdetrimental genetic correlations (Walsh and Blows 2009).Functional constraints, resulting in environmentalcorrelations between traits, can also limit the response toselection. Not included into this predictive model,epigenetic effects, i.e. environmentally determinedheritable modification of gene expression, can alsocontribute to adaptation to sudden changes (Bossdorf etal. 2008; Skrøppa et al. 2010).
Random changes due to genetic driftand mating system
Genetic drift accounts for the reduction of geneticdiversity that occurs in small populations, in absence ofselection, mutation or migration, due to the variation ofallele frequencies after random sampling from onegeneration to the next. Furthermore, small populations areprone to increased inbreeding due to the higherprobability of mating between relatives. Inbreeding has atwofold effect: it reduces fitness whenever inbreedingdepression is present, and it retains non-randomassociation of gene alleles (linkage disequilibrium) athigher rate which represents a reduction in the diversity ofgenotypic combinations. Non-random mating system canalso affect inbreeding: the mating system varies amongindividuals and populations, including selfing rate (most oftree species are not dioecious) and diversity of pollendonors, depending on the relative fecundity and spatialdistribution of reproducing trees.
Under the assumptions of Wright-Fisher's modelpopulation (Wright 1931), the reduction of gene diversityand the increase of inbreeding are driven by one singleparameter, population size. Using this model as areference, the effective population size (Ne) of a realpopulation of size N that has a per-generation rate ofreduction of gene diversity (DHe) or increase of inbreeding(DF) is such that: DHe = -1/2Ne or DF = 1/2Ne. It can beshown that, in the absence of dominance, Ne alsomeasures the per-generation rate of reduction of additivevariance: DσA² = -1/2Ne. Ne is defined on the rate ofchange of gene diversity or inbreeding, not on the actualpopulation size N. Ne is most often not directly estimablein natural populations (unless longitudinal estimates ofgene diversity, He or σA², or inbreeding, F), but its changescan be predicted and decreasing Ne means intensifyingthe intensity of genetic drift. When the actual population
only departs from the theoretical model by relaxing theassumption of Poissonian distribution of reproductivesuccess, it can be shown that: Ne = (4N–2)/(V+2) whereV is the actual variance in reproductive success, i.e. Nedecreases substantially in proportion to this variance.
Tree populations are generally assumed to have largeeffective population size (Petit and Hampe 2006), in partbecause they are outcrossing and disperse their genesover long distances in particular through pollen (Ashley2010); thus, they should not be too much affected bygenetic drift. In their review, Schoen and Brown (1991)found Ne estimates for tree species in the range of otheroutbreeding plants: mean values around 3,000 forPseudotsuga menziesii and >8,000 for Pinus sylvestris andPicea abies, with high variations among populations withineach species. However, locally, seed and pollencontributions to reproduction are highly uneven amongindividuals (Burczyk et al. 2002; Krouchi et al. 2004;Oddou-Muratorio et al. 2005), and the great majority ofthe pollen disperses only in the close neighbourhood,which can greatly reduce the effective population size. Intheir review, Smouse and Sork (2004) found that theeffective pollen pool size Nep, defined as the inverse ofthe probability that a female draws two offsprings fromthe same father, ranges from 2 to 200 in tree populations.Nep can be very small in some populations: fragmentedpopulations of wind pollinated species of Quercushumboldtii (Fernandez-M and Sork 2005) and Quercusalba (Smouse et al. 2001) exhibit estimates of Nep around6 and 8 respectively. By contrast, in continuous forestpopulations, several examples estimate high values of Nep:Robledo-Arnuncio et al. (2004) estimated a Nep >70 in aSpanish population of Pinus sylvestris. Fragmentedpopulations, isolated populations and populations at lowdensity have a higher risk of extinction due to the erosionof diversity by genetic drift (Goodell et al. 1997; Hardy etal. 2004; Robledo-Arnuncio et al. 2004; Aguilar et al.2008).
Interactions between selection, drift, gene flowand phenotypic plasticity
A well-known interaction between drift and selection is thevortex of extinction (Gilpin and Soule 1986): when there isa genetic load in the population, a rapid decrease inpopulation size leads to increased genetic drift andincreased inbreeding, resulting in reduced mean fitnessthat further reduces population size, which over time willresult in extinction in a geometric decline. However, thereis no experimental evidence to our knowledge that thiskind of extinction vortex ever occurred in trees.Alternatively, resistant genotypes that emerge in thepopulation increase their contribution to the nextgeneration and can restore population growth if noteliminated at random, a process known as evolutionaryrescue (Gomulkiewicz and Holt 1995). Whether

138
populations can be rescued depends on population size,genetic diversity and the degree of maladaptation to thenew environment.
In the case when the environment changes both in spaceand time, gene flow can bring into the population pre-adapted genes (Pease et al. 1989; review by Kremer et al.2012). Kuparinen et al. (2010) showed that pollen and seeddispersal at longer distance speed up the adaptationprocess. In tree populations, it is expected that pollen-mediated rather than seed mediated gene flow willcontribute to this processes, with average pollinationdistances commonly being hundreds of meters (Ashley2010), and maximum distance of 100km measured in Pinussylvestris airborne transported pollen (Robledo-Arnuncio2011). In this species, along a latitudinal gradient, Nilsson(1995) showed that long-distance pollen migration bringsinto the population new phenotypes with a phenologyspecific of other locations. Local individuals with extremephenotypic values, in particular for flowering phenology,are keen to catch more long-distance pollen grainsbecause they are better synchronized with sourcepopulation of interest and also because they are lesssaturated by local pollen.
Abundant theoretical literature exists on the role ofphenotypic plasticity in evolution; recent reviews ofpredictions on the interaction between selection andplasticity in the context of climate change can be found inChevin et al. (2010, 2012), the second review also provideskey references of empirical studies of plasticity in trees.Maladaptive plasticity is obviously detrimental toadaptation. When adaptive plasticity is not geneticallyvariable, it is expected to slow down the genetic responseto directional selection in each generation but also to allow
the phenotypes to track the environmental change moreclosely. The sustainability of this process of adaptationdepends on the fitness cost of plasticity. When adaptiveplasticity varies genetically, i.e. there is GxE interaction andplasticity can evolve, the amount of genetic variance of theplastic trait depends on the environment: if the newenvironment increases the genetic variance, then plasticitytends to accelerate the genetic response to selection andplasticity is itself selected for (Lande 2009). Consideringa steep spatial environmental gradient, where gene flowinteracts with selection and plasticity, the evolution ofplasticity is expected to allow the population to explore alarger range, and marginal habitats are expected to showhigher plasticity (Chevin and Lande 2011).
A further degree of complexity arises when consideringthe interplay between abiotic environment, bioticinteractions and evolutionary processes (Box 1).
Potential effects of forestry practiceon the rate of evolution of treesA global framework to assess the evolutionaryimpact of silviculture
Considering the evolutionary impact of silviculture is thusan additional requisite to adaptive forestry. While facingclimate change and uncertain future, forestry practiceshould simultaneously accelerate genetic adaptation byhelping tree populations to track the known environmentalchanges and preserve the genetic diversity as a reservoirof future options to respond to the next unknown changes.This is a classical challenge in breeding programs:obtaining a rapid genetic gain while keeping the potentialfor long-term response to selection. Breeders solve thisproblem by combining selection and recombination.Genetic adaptation occurs if better performing genotypesemerge during reproduction and if the best performinggenotypes spread in the population before extinction.Therefore, we can assign three objectives to evolution-oriented forestry practice: (1) increase the chance ofemergence of “innovative” genetic combinations, (2)facilitate the spread of the best adapted genotypes and(3) preserve genetic diversity for long-term response toselection. Acting simultaneously on the demography andthe environmental conditions, silviculture has an impact onthe parameters of selection and genetic drift. Due to themultiplicity and complexity of the processes involved andto the huge diversity of biological and environmentalfeatures among forests, it is more reliable to predict theeffects of silviculture on the parameters of evolution ratherthan on the final state of the genetic diversity. Thus,silviculture should aim to limit the intensity of genetic drift,increase the diversity of mating pairs, avoid counter-selection and maintain selection pressure in the rightdirection, reduce inbreeding etc. Here, we briefly considerthe evolutionary benefits, or risks, associated to current orfuture forestry practice. A more quantitative prediction of
Expected effects of forestry practice on evolutionaryprocesses: schematic pathway from the forestrymanagement in natural regeneration systems to theselection and genetic drift parameters. See text forexplanation of the paths (σP² phenotypic variance,σA² additive genetic variance, β selection gradientfor natural selection, i selection intensity for directselection, s selfing rate, Nep effective pollen poolsize, V variance of reproductive success, Ne effectivepopulation size, F inbreeding).
FIGURE 2
139
their balanced effects could rely on simulation studiesusing process-based models that explicitly integratedemographic, genetic and biophysical processes and allowto simulate interventions (Kramer et al. 2008).
Foreseen evolutionary impact of common forestrypractice
A general consequence of silviculture on the drivers ofevolution is the change of environmental conditions:competition and, possibly, other biotic or abioticenvironmental factors. As mentioned above, theenvironmental conditions determines not only thephenotypic variance (σP²) of the traits but also the geneticvariance (σA²), in case of GxE interactions, and theselection gradient that relates trait value to fitness (β)(Figure 2). Furthermore, increased canopy closure alsoaffects pollen dispersal and mating system parameters:selfing rate (s), effective pollen pool size (Nep) andvariance of reproductive success (V) (García et al. 2005;Milleron et al. 2012).
Beyond these general effects, thinning, whethersystematic or selective, will affect the spatial clustering ofgenetically related reproducing trees and their allocationto reproduction and, therefore, the mating system (Figure2). By removing neighbouring-related individuals, thinningmay reduce spatial genetic structure and, consequently,inbreeding in the regeneration (Dounavi et al. 2002).Sagnard et al. (2011) showed that, when the density ofseed trees is low (<16 trees.ha-1), a clustered distribution ofseed trees will produce less spatial genetic structure in theseedlings than a random or dispersed distribution.Robledo-Arnuncio et al. (2004), in Pinus sylvestris, andRestoux et al. (2008), in Abies alba, found at seed stagethat low densities of reproductive trees simultaneouslyincrease the probability of selfing (from <5% to >20%) andthe diversity of the outcrossing pollen (Nep), which can bemechanistically explained by a higher rate of long distancepollen pollination (Klein et al. 2006). Therefore, lower seedtrees density can result in higher genetic diversity atseedling stage, whenever pollen is not limiting and purgeof inbreeding occurs early, but it can be a risk when pollenis limiting, which must be considered in the context ofclimate change.
When the local population size is limited, a genetic drifteffect may result from the reduction of the number ofreproducing trees, leading to a loss of rare alleles (amongwhich currently deleterious genes). Such effect wasobserved in old-growth forests of Pinus strobus comparingpre- and post-harvest stands (>100 and <30 trees,respectively) (Buchert et al. 1997; Rajora et al. 2000), aswell as in Picea rubens old growth forests (Mosseler et al.2003). Konnert and Hussendörfer (2001) compared 16even-aged and nine uneven-aged management systemsin Abies alba, several forests for each group and also thetwo management systems within the same forest: theyfound a slightly higher number of rare alleles but smaller
number of different gametic combinations in the uneven-aged forests. However, there are too few studies of thistype to draw general conclusions on an eventual intrinsicdifference between these two management systemsregarding their effects on the genetic diversity. The drifteffect is not a priori limited to the managed population butit may also affect secondary tree species as observed forAbies amabilis, Tsuga heterophylla, Thuya plicata and Pinusmonticola in Pseudotsuga menziesii forests by El-Kassabyand Benowicz (2000).
In naturally regenerated stands, reproductive trees usuallyresult from successive selective thinnings for theirphenotypic value such as stem vigour, healthconsideration, lack of defects like thick branches or forkedor twisted trunk, as well as for their spatial distribution inorder to reduce competition. In Fagus sylvatica, selectivethinning favouring the most vigorous trees was found toincrease the heterozygosity by 4% to 9% (Lauber et al.1997; Dounavi et al. 2002), even when selection occurs ata very early stage (Thiebaut et al. 1992). However, thiseffect was not detected in other studies on Abies alba(Hussendörfer and Konnert 2000) or Pinus contorta(McDonald et al. 2001). We must remind here that anincrease in heterozygosity during maturation of foreststands is frequently observed and that natural selection ofseedlings can start at a very early stage in overstockedyoung regeneration (Pichot et al. 2006). Selective thinningfavouring the best growing trees may act as selection forcompeting ability: assuming a Gaussian distribution of treeheight, the elimination of the 25% (resp. 50%) smallestindividuals represents a selection intensity i = 0.42 (resp.0.80) on this trait. Selective thinning may also integrate adirect selection on other traits chosen by the forester(Figure 2). We need to understand more clearly whichfunctional traits are indirectly selected for and how thesetraits relate to future fitness in the context of changingclimate. One main question that still needs to be addressedis how far silviculture will intensify selection for juvenilevigour and, if this is the case, how far juvenile vigour isgenetically positively or negatively correlated withdrought resistance.
The intensity of genetic drift, through the variance inreproductive success, and the mating system not onlydepends on the number and spatial distribution ofreproductive trees but also on their allocation toreproduction. As indicated in Figure 2, this allocation isinfluenced by local stand density as well as other practiceslike pruning (Ayari et al. 2012). Thinning and pruning alsoaffect the plasticity, which will interact with selectionprocesses as previously mentioned: the question here iswhether the plastic response induced by the silviculture isadaptive or maladaptive regarding future climate change.
Multiple forestry practices may also be combined andinteract to modify the microenvironmental conditions ofdevelopment, generally as to reduce stress and
140
competition in order to favour growth (Forrester et al.2012). Thus, after an extreme drought event in 1976, standdecline was reduced in Picea abies stands that hadpreviously been thinned in 1971 (Misson et al. 2003):compared to the control plot, heavy thinning had a morebeneficial impact than moderate thinning (thinning from36 to 14 m².ha-1 or to 20 m².ha-1 basal area, respectively).We are not aware of any study of the effects this couldhave on plasticity (e.g. reduced acclimation to futurestress) and selection. As a case study, we present theanalysis of evolution and potential effects of silviculture inthe situation of highly heterogeneous environment withinthe forest (Box 2).
Evolutionary benefits and risks expected fromsome silvicultural recommendations relatedto climate change
New forestry practice is progressively implemented toreduce ecological and economic risks related to climatechange (Legay and Mortier 2005; Yousefpour et al. 2012).From an evolutionary point of view, reducingenvironmental stress has a twofold effect. On the onehand, it reduces the damages and therefore contributes toincrease the effective population size (Ne), which is acrucial issue when population size is already small or isexpected to decrease drastically due to severe damages.But, on the other hand, it also slows down the geneticimprovement in the next generation by reducing selectionintensity (i) and it does not exploit potential adaptive
plasticity (no acclimation to future stress), which is animportant issue to consider in large populations. We brieflyconsider here some of these practices, or changes inpractices, from the evolutionary point of view and illustratetheir possible balanced effects. In all cases, wheneverapplying new practice, it is crucial to keep precise recordsof what is done, how and when, in order to facilitate futureevaluation ex post, in particular after marked climaticevents.
Shortening rotation reduces the probability of the risk, e.g.to extreme climatic events, but it can also increase thevulnerability to the risk if shorter rotations select for higherjuvenile vigour and if juvenile vigour is geneticallynegatively correlated with stress resistance. Both of theseconditions still have to be investigated. The answer willprobably depend on the species, on the environment andon the management system considered.
Reducing the density of stands is envisaged to reduce theeffective drought stress supported by the trees. However,this immediate positive effect may be partly balanced bya long-term detrimental effect on selection by inducing amaladaptive phenotypic response and by reducingselective mortality (see first section). This risk is reducedif time is left for sufficient natural selection to proceedbefore thinning. More generally, from the evolutionarypoint of view, interventions occurring at juvenile stageraise the question of age-age correlations. Apart from the
Raising-up complexity (2): evolution and silviculture in a highly spatiallyheterogeneous environment
In trees, the selection process is complex due to the longlife-cycle and the high within-stand spatial environmentalheterogeneity. Firstly, for long-lived and sessile organisms,different selection pressures may occur successively fromthe juvenile stage to the adult stage, e.g. selection forcompeting ability in a young dense regeneration vs.selection for stress resistance in the adult stage. Secondly,in heterogeneous environment, the phenotypic correlationbetween parents and offspring do not only depend ongenetic control of the phenotype but also on thedifference in environmental effects between the parents'and offsprings' sites. Finally, the environmentalheterogeneity induces spatial variation in selectionpressure, eventually leading to different selection pressurebetween parents and offsprings. Thus, evolution-orientedforestry should take environmental heterogeneity intoaccount. As a general objective, evolution-oriented silvicultureshould aim at favouring the mating success of the bestgrowing trees located in the patches where the highestdesired selection pressure occurs. In homogeneousconditions where the selection pressure is uniform, thisobjective is directly achieved by classical selectivethinning. In heterogeneous conditions, this objective couldbe achieved if enough trees are selected for seeding
within each patch where high selective pressure occurs,even though these trees may have lower growth thanneighbours growing in more favourable conditions.
In such context, assessing and mapping the environmentalheterogeneity among patches is essential to avoidconfusion between micro-environmental and geneticeffects on the performance of the trees. It is crucial notonly to assess the individual performance but also thepatch conditions with synthetic indicators, easy to use andindependent of the competition, such as site index,species composition of vegetation etc. Local variations ofsite index can be assessed through spatial patterns of treeheight; therefore it would be easier to identify and markvery early the 'good' phenotypes in highly selective areas,before a substantial reduction in number of trees happensdue to other criteria.
Genetic improvement of the whole population will occurif these highly selected trees effectively contribute to theregeneration at stand level. If pollen or seed dispersallimits their effective contribution, considering herefecundity as included into the global dispersal process, itmight be necessary to assist natural regeneration by localseed transfer from low to high selection patches within thestand.
BOX 2
141
temporal changes in environmental conditions, life stagesdiffer in their physiology and development. During thecomplex and temporally changing selection process intrees, juvenile-adult genetic correlations contribute todetermine how far a selection pressure (or release ofselection) during the juvenile stage will genetically affectthe adult population. This issue can hardly be addressedin situ. Partial answer, here again, comes from the breedingexperience and early selection schemes. Studies ongrowth and wood density in different Pinus speciesrevealed that genetic age-age correlation >0.8 is generallyachieved from the age of 10-12 years (Hannrup and Ekberg1998; Gwaze et al. 2000; Wu et al. 2007; Bouffier et al.2008). It varies greatly with environmental conditions, andin Pinus radiata, this level of correlation can be reached assoon as 2-5 years in certain sites (Gwaze et al. 2000; Wuet al. 2007). Matheson et al. (2002) showed that geneticage-age correlations in Pinus radiata also vary with thegenetic background with higher correlations in presenceof inbreeding. Thus, silviculture may have an effect on age-age correlations through its effects on the environmentalconditions and on the genetic background. Furtherinvestigations on age-age correlations of functional traitsare deeply needed.
In the case of massive dieback, sanitary logging isnecessary to reduce the spread of primary or secondaryparasites, and it can also be necessary for fire preventionor for the protection of forest users. However, excessiveelimination of surviving trees could result in the eliminationof resistance to the pathogen (Burke 2011).
Evolution-oriented forestry, why not?
We imagined some specifically evolution-oriented forestrypractices in the case of natural regeneration managementsystem (Table 1). These interventions should not be directlyconsidered as recommendations or guidelines as such; werather propose them as case studies to illustrate innovativeadaptive forestry that would take into account short- andlong-term evolutionary potential, still to be associated withother clues. This is not an exhaustive list, and anycombination of the proposed interventions can beenvisaged.
In order to reduce the intensity of genetic drift (increaseNe) in small populations, silviculture may be orientedtowards reduced variance of fecundity (V) between trees:reducing V will not only increase Ne within each annualseed production, as mentioned above, but it will alsoreduce the fluctuation of effective contributions acrossyears and thus increase pluri-annual Ne estimates (Krouchiet al. 2004). This would be another objective assigned tothinning and pruning. It requires a balance betweenkeeping sufficient number of seedling trees and sufficientspacing between them (optimisation should be made ona case-by-case basis, depending on dispersal capacities).Due to the tree x year interaction effect on the variation infecundity generally observed in trees, a general
recommendation would be to cumulate reproductionduring several years. Actually, current practice may alreadybe optimal for this purpose. A negative side effect is toslow down the elimination of detrimental alleles (Couvetand Ronfort 1994) and reduce the response to selection.A compromise between preserving the genetic diversityfor the future (reduce genetic drift) and accelerating theimmediate response to selection could be to equalize themating success per patch, in particular when theenvironment is spatially heterogenous (Box 2).
In order to reshuffle the local genetic diversity andincrease genetic recombination, silviculture could enhancelocal gene flow, either through artificial dispersal of localseeds or by assisting pollen dispersal. With the sameobjective, isolated seed trees should be considered withcare: from one side, they may have a higher selfing ratebut, on the other side, they can capture long distancepollen flow. If selfed seeds are eliminated at an early stageof development (e.g. empty seeds in some coniferspecies), the fertile seeds hamper a large genetic diversity.In the case of heterogeneous environment within theforest, areas for wood production and areas for evolutioncould be spatially dissociated while maintaining gene flowbetween these entities (Box 2).
In an environmental cline, typically an altitudinal cline, astrategy might be to accelerate the migration of thepopulation towards more favourable areas. The velocity ofmigration depends on the effective dispersal, and effectivedispersal is highly dependent on the local conditions forseedling establishment conditions (Amm et al. 2012). Wecan imagine to enhance seed germination and seedlinggrowth by preparing the soil or controlling competitionand predation at distance from the core of the population,in the direction wanted for migration. For zoochorousspecies, we can also imagine to attract seed dispersersalong the wanted migration route (Oddou-Muratorio et al.2004; García et al. 2009; Schleuning et al. 2011).
Genetic enrichment of the local genetic resource by theintroduction of a limited amount of allochthonous materialfrom a putatively pre-adapted origin, through seed orpollen introduction, could present a twofold benefit ofintroducing gene alleles of interest and increasing theglobal genetic diversity. To avoid gene swamping effectand reduction of the effective population size, it is essentialto use a large genetic base of the introduced material(Lefèvre 2004). For long-lived organisms, it is alsoimportant to anticipate a possible trade-off betweenadaptation to long-term climatic trend and adaptation tocurrent conditions and/or to annual fluctuations, such asvulnerability to late frost of early flushing genotypes.
As a complete utopy, we can imagine future access tointensive genotypic data on each adult tree. Inspired fromthe marker-assisted selection strategies used in plant andanimal breeding, marker-assisted selective thinning could
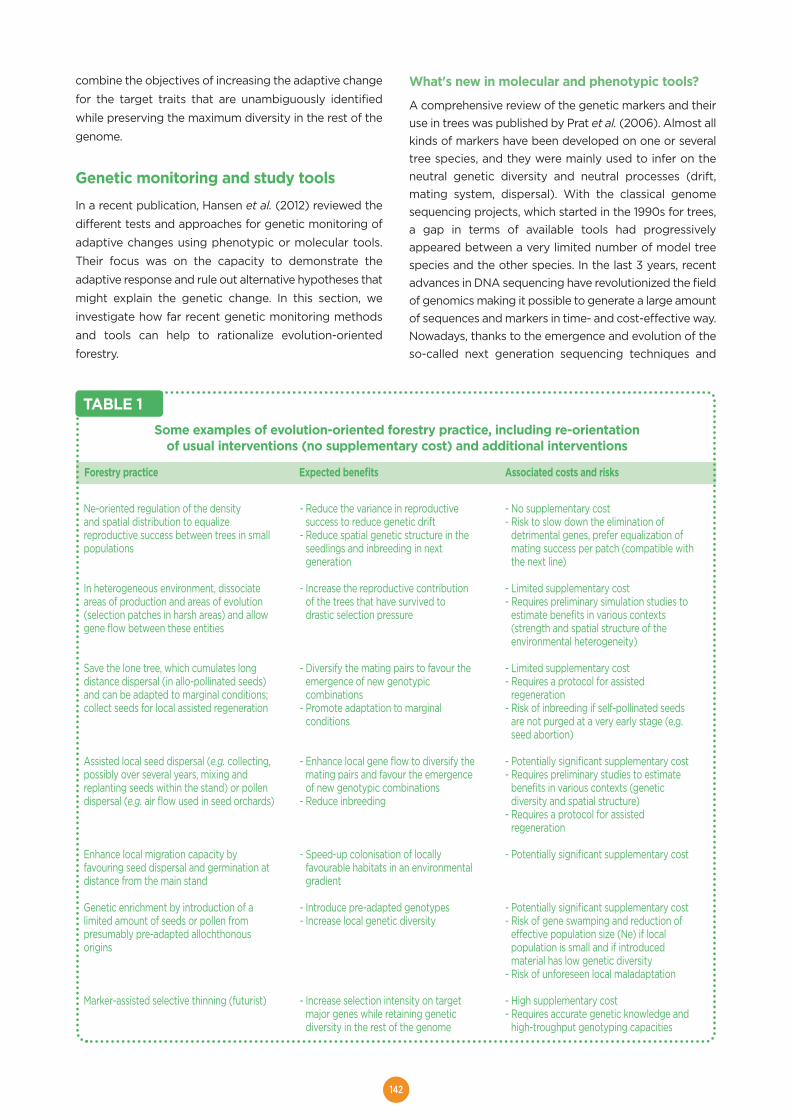
142
combine the objectives of increasing the adaptive change
for the target traits that are unambiguously identified
while preserving the maximum diversity in the rest of the
genome.
Genetic monitoring and study tools In a recent publication, Hansen et al. (2012) reviewed the
different tests and approaches for genetic monitoring of
adaptive changes using phenotypic or molecular tools.
Their focus was on the capacity to demonstrate the
adaptive response and rule out alternative hypotheses that
might explain the genetic change. In this section, we
investigate how far recent genetic monitoring methods
and tools can help to rationalize evolution-oriented
forestry.
What's new in molecular and phenotypic tools?
A comprehensive review of the genetic markers and theiruse in trees was published by Prat et al. (2006). Almost allkinds of markers have been developed on one or severaltree species, and they were mainly used to infer on theneutral genetic diversity and neutral processes (drift,mating system, dispersal). With the classical genomesequencing projects, which started in the 1990s for trees,a gap in terms of available tools had progressivelyappeared between a very limited number of model treespecies and the other species. In the last 3 years, recentadvances in DNA sequencing have revolutionized the fieldof genomics making it possible to generate a large amountof sequences and markers in time- and cost-effective way.Nowadays, thanks to the emergence and evolution of theso-called next generation sequencing techniques and
Some examples of evolution-oriented forestry practice, including re-orientationof usual interventions (no supplementary cost) and additional interventions
Forestry practice Expected benefits Associated costs and risks
TABLE 1
Ne-oriented regulation of the densityand spatial distribution to equalizereproductive success between trees in smallpopulations
In heterogeneous environment, dissociateareas of production and areas of evolution(selection patches in harsh areas) and allowgene flow between these entities
Save the lone tree, which cumulates longdistance dispersal (in allo-pollinated seeds)and can be adapted to marginal conditions;collect seeds for local assisted regeneration
Assisted local seed dispersal (e.g. collecting,possibly over several years, mixing andreplanting seeds within the stand) or pollendispersal (e.g. air flow used in seed orchards)
Enhance local migration capacity byfavouring seed dispersal and germination atdistance from the main stand
Genetic enrichment by introduction of alimited amount of seeds or pollen frompresumably pre-adapted allochthonousorigins
Marker-assisted selective thinning (futurist)
- Reduce the variance in reproductivesuccess to reduce genetic drift
- Reduce spatial genetic structure in theseedlings and inbreeding in nextgeneration
- Increase the reproductive contributionof the trees that have survived todrastic selection pressure
- Diversify the mating pairs to favour theemergence of new genotypiccombinations
- Promote adaptation to marginalconditions
- Enhance local gene flow to diversify themating pairs and favour the emergenceof new genotypic combinations
- Reduce inbreeding
- Speed-up colonisation of locallyfavourable habitats in an environmentalgradient
- Introduce pre-adapted genotypes- Increase local genetic diversity
- Increase selection intensity on targetmajor genes while retaining geneticdiversity in the rest of the genome
- No supplementary cost- Risk to slow down the elimination of
detrimental genes, prefer equalization ofmating success per patch (compatible withthe next line)
- Limited supplementary cost- Requires preliminary simulation studies to
estimate benefits in various contexts(strength and spatial structure of theenvironmental heterogeneity)
- Limited supplementary cost- Requires a protocol for assisted
regeneration- Risk of inbreeding if self-pollinated seeds
are not purged at a very early stage (e.g.seed abortion)
- Potentially significant supplementary cost- Requires preliminary studies to estimate
benefits in various contexts (geneticdiversity and spatial structure)
- Requires a protocol for assistedregeneration
- Potentially significant supplementary cost
- Potentially significant supplementary cost- Risk of gene swamping and reduction of
effective population size (Ne) if localpopulation is small and if introducedmaterial has low genetic diversity
- Risk of unforeseen local maladaptation
- High supplementary cost- Requires accurate genetic knowledge and
high-troughput genotyping capacities
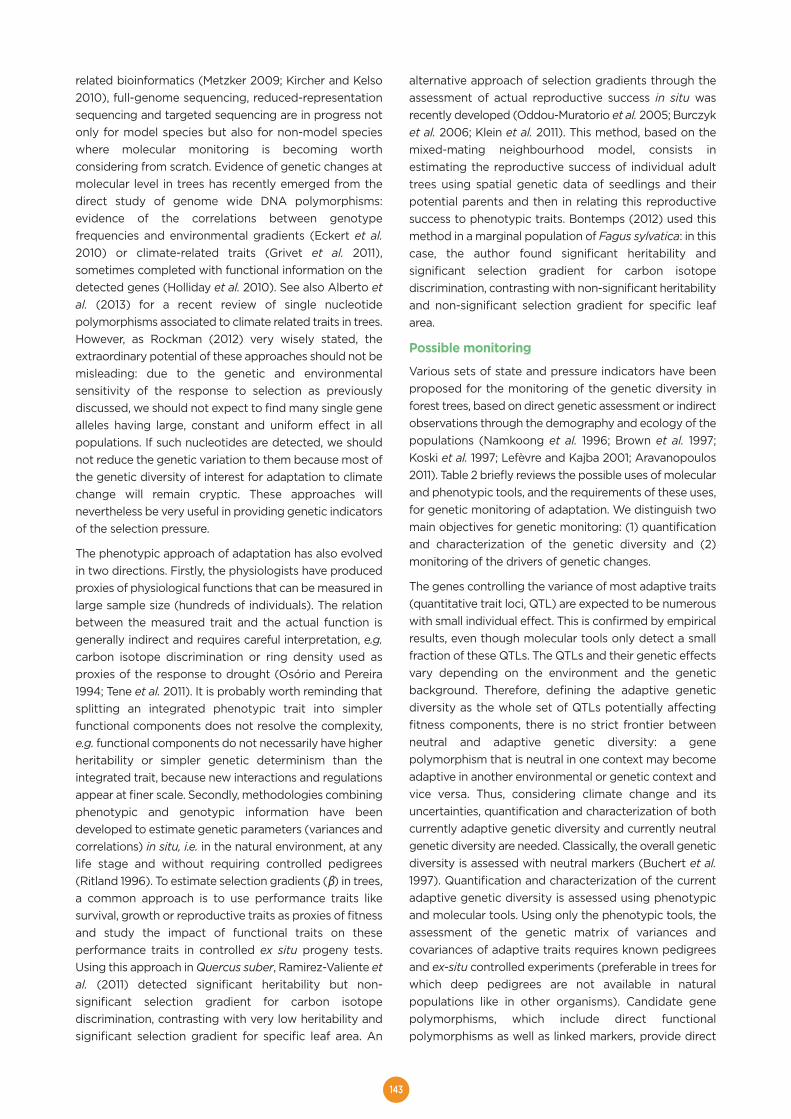
143
related bioinformatics (Metzker 2009; Kircher and Kelso2010), full-genome sequencing, reduced-representationsequencing and targeted sequencing are in progress notonly for model species but also for non-model specieswhere molecular monitoring is becoming worthconsidering from scratch. Evidence of genetic changes atmolecular level in trees has recently emerged from thedirect study of genome wide DNA polymorphisms:evidence of the correlations between genotypefrequencies and environmental gradients (Eckert et al.2010) or climate-related traits (Grivet et al. 2011),sometimes completed with functional information on thedetected genes (Holliday et al. 2010). See also Alberto etal. (2013) for a recent review of single nucleotidepolymorphisms associated to climate related traits in trees.However, as Rockman (2012) very wisely stated, theextraordinary potential of these approaches should not bemisleading: due to the genetic and environmentalsensitivity of the response to selection as previouslydiscussed, we should not expect to find many single genealleles having large, constant and uniform effect in allpopulations. If such nucleotides are detected, we shouldnot reduce the genetic variation to them because most ofthe genetic diversity of interest for adaptation to climatechange will remain cryptic. These approaches willnevertheless be very useful in providing genetic indicatorsof the selection pressure.
The phenotypic approach of adaptation has also evolvedin two directions. Firstly, the physiologists have producedproxies of physiological functions that can be measured inlarge sample size (hundreds of individuals). The relationbetween the measured trait and the actual function isgenerally indirect and requires careful interpretation, e.g.carbon isotope discrimination or ring density used asproxies of the response to drought (Osório and Pereira1994; Tene et al. 2011). It is probably worth reminding thatsplitting an integrated phenotypic trait into simplerfunctional components does not resolve the complexity,e.g. functional components do not necessarily have higherheritability or simpler genetic determinism than theintegrated trait, because new interactions and regulationsappear at finer scale. Secondly, methodologies combiningphenotypic and genotypic information have beendeveloped to estimate genetic parameters (variances andcorrelations) in situ, i.e. in the natural environment, at anylife stage and without requiring controlled pedigrees(Ritland 1996). To estimate selection gradients (β) in trees,a common approach is to use performance traits likesurvival, growth or reproductive traits as proxies of fitnessand study the impact of functional traits on theseperformance traits in controlled ex situ progeny tests.Using this approach in Quercus suber, Ramirez-Valiente etal. (2011) detected significant heritability but non-significant selection gradient for carbon isotopediscrimination, contrasting with very low heritability andsignificant selection gradient for specific leaf area. An
alternative approach of selection gradients through theassessment of actual reproductive success in situ wasrecently developed (Oddou-Muratorio et al. 2005; Burczyket al. 2006; Klein et al. 2011). This method, based on themixed-mating neighbourhood model, consists inestimating the reproductive success of individual adulttrees using spatial genetic data of seedlings and theirpotential parents and then in relating this reproductivesuccess to phenotypic traits. Bontemps (2012) used thismethod in a marginal population of Fagus sylvatica: in thiscase, the author found significant heritability andsignificant selection gradient for carbon isotopediscrimination, contrasting with non-significant heritabilityand non-significant selection gradient for specific leafarea.
Possible monitoring
Various sets of state and pressure indicators have beenproposed for the monitoring of the genetic diversity inforest trees, based on direct genetic assessment or indirectobservations through the demography and ecology of thepopulations (Namkoong et al. 1996; Brown et al. 1997;Koski et al. 1997; Lefèvre and Kajba 2001; Aravanopoulos2011). Table 2 briefly reviews the possible uses of molecularand phenotypic tools, and the requirements of these uses,for genetic monitoring of adaptation. We distinguish twomain objectives for genetic monitoring: (1) quantificationand characterization of the genetic diversity and (2)monitoring of the drivers of genetic changes.
The genes controlling the variance of most adaptive traits(quantitative trait loci, QTL) are expected to be numerouswith small individual effect. This is confirmed by empiricalresults, even though molecular tools only detect a smallfraction of these QTLs. The QTLs and their genetic effectsvary depending on the environment and the geneticbackground. Therefore, defining the adaptive geneticdiversity as the whole set of QTLs potentially affectingfitness components, there is no strict frontier betweenneutral and adaptive genetic diversity: a genepolymorphism that is neutral in one context may becomeadaptive in another environmental or genetic context andvice versa. Thus, considering climate change and itsuncertainties, quantification and characterization of bothcurrently adaptive genetic diversity and currently neutralgenetic diversity are needed. Classically, the overall geneticdiversity is assessed with neutral markers (Buchert et al.1997). Quantification and characterization of the currentadaptive genetic diversity is assessed using phenotypicand molecular tools. Using only the phenotypic tools, theassessment of the genetic matrix of variances andcovariances of adaptive traits requires known pedigreesand ex-situ controlled experiments (preferable in trees forwhich deep pedigrees are not available in naturalpopulations like in other organisms). Candidate genepolymorphisms, which include direct functionalpolymorphisms as well as linked markers, provide direct
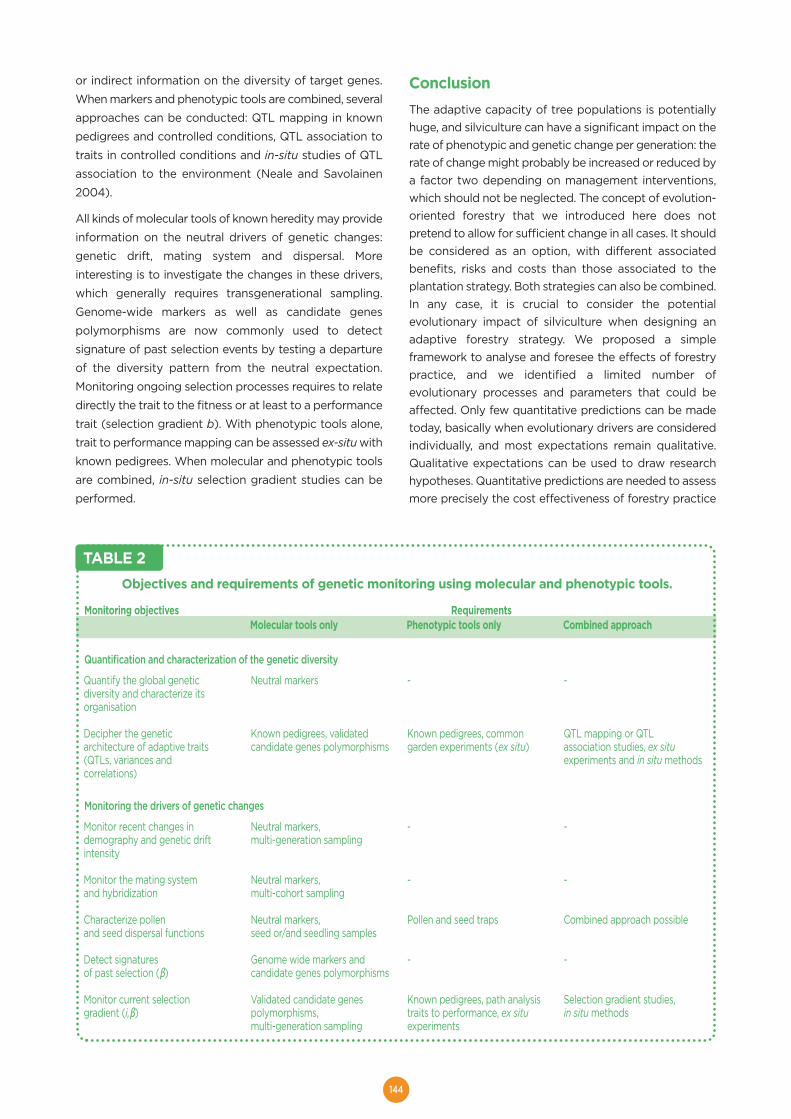
144
or indirect information on the diversity of target genes.
When markers and phenotypic tools are combined, several
approaches can be conducted: QTL mapping in known
pedigrees and controlled conditions, QTL association to
traits in controlled conditions and in-situ studies of QTL
association to the environment (Neale and Savolainen
2004).
All kinds of molecular tools of known heredity may provide
information on the neutral drivers of genetic changes:
genetic drift, mating system and dispersal. More
interesting is to investigate the changes in these drivers,
which generally requires transgenerational sampling.
Genome-wide markers as well as candidate genes
polymorphisms are now commonly used to detect
signature of past selection events by testing a departure
of the diversity pattern from the neutral expectation.
Monitoring ongoing selection processes requires to relate
directly the trait to the fitness or at least to a performance
trait (selection gradient b). With phenotypic tools alone,
trait to performance mapping can be assessed ex-situ with
known pedigrees. When molecular and phenotypic tools
are combined, in-situ selection gradient studies can be
performed.
ConclusionThe adaptive capacity of tree populations is potentiallyhuge, and silviculture can have a significant impact on therate of phenotypic and genetic change per generation: therate of change might probably be increased or reduced bya factor two depending on management interventions,which should not be neglected. The concept of evolution-oriented forestry that we introduced here does notpretend to allow for sufficient change in all cases. It shouldbe considered as an option, with different associatedbenefits, risks and costs than those associated to theplantation strategy. Both strategies can also be combined.In any case, it is crucial to consider the potentialevolutionary impact of silviculture when designing anadaptive forestry strategy. We proposed a simpleframework to analyse and foresee the effects of forestrypractice, and we identified a limited number ofevolutionary processes and parameters that could beaffected. Only few quantitative predictions can be madetoday, basically when evolutionary drivers are consideredindividually, and most expectations remain qualitative.Qualitative expectations can be used to draw researchhypotheses. Quantitative predictions are needed to assessmore precisely the cost effectiveness of forestry practice
Objectives and requirements of genetic monitoring using molecular and phenotypic tools.
Monitoring objectives RequirementsMolecular tools only Phenotypic tools only Combined approach
Quantification and characterization of the genetic diversity
Monitoring the drivers of genetic changes
TABLE 2
Quantify the global geneticdiversity and characterize itsorganisation
Decipher the geneticarchitecture of adaptive traits(QTLs, variances andcorrelations)
Monitor recent changes indemography and genetic driftintensity
Monitor the mating systemand hybridization
Characterize pollenand seed dispersal functions
Detect signaturesof past selection (β)
Monitor current selectiongradient (i,β)
Neutral markers
Known pedigrees, validatedcandidate genes polymorphisms
Neutral markers,multi-generation sampling
Neutral markers,multi-cohort sampling
Neutral markers,seed or/and seedling samples
Genome wide markers andcandidate genes polymorphisms
Validated candidate genespolymorphisms,multi-generation sampling
-
Known pedigrees, commongarden experiments (ex situ)
-
-
Pollen and seed traps
-
Known pedigrees, path analysistraits to performance, ex situexperiments
-
QTL mapping or QTLassociation studies, ex situexperiments and in situ methods
-
-
Combined approach possible
-
Selection gradient studies,in situ methods
145
under various climate change scenarios. Quantitativecomparison of evolution-oriented forestry with otherbaseline management options will require further process-based modelling and simulation studies for different foresttypes and species, different biotic and abioticenvironments and different climate change scenarios. Fora better understanding of the limits of the response toselection, we suggest to couple demogenetic models withbiophysical models or host-parasite models.
One challenge for forestry decision-making under climatechange is to reach a compromise between short-term andlong-term objectives, e.g. speed-up the response tocurrent selection pressure while preserving diversity andevolvability for uncertain future. A safe guideline is tofavour natural selection for certainly adaptive traits, likedrought resistance in the areas where more severedrought is expected, avoid random genetic erosion andincrease genetic mixing. Over-selection for undue traitsshould also be avoided. As we have shown, each forestrypractice has an effect on several evolutionary drivers (ageneticist would say pleiotropic effects) and interactioneffects of different practices on a single evolutionary driveralso exist (epistasis in genetic terms). To understand theglobal impact of forestry practice, in parallel to modellingapproaches, long-term silvicultural options should beexperimented. These new experiments will provide to thenext generation of foresters very informative results,complementary to those obtained from comparativestudies of existing situations.
Local decision should rely on a case by case approachtaking into account each particular situation. Followingquantitative genetics theory, we expect that in most casesgenotypic diversity rather than allelic diversity constrainsevolutionary changes. Can we obtain higher rate of changeby driving recombination and selection within the currentpopulation? Do we need to introduce allochthonous pre-adapted genotypes to accelerate the emergence andspread of adequate allelic combinations? To address thesequestions and make a diagnostic, combinedgenophenotypic approaches in situ are very promisingand should be further developed. Molecular tools initiallydeveloped for model species now become available fornon-model species. Similarly, methodologies andknowledge about the genetic architecture of traits andphenotype construction (e.g. genetic and environmentalcorrelations, age-age correlations) should be generalizedto non-model species to help better understanding thegene to trait and gene to fitness mapping.
AcknowledgmentsWe particularly thank two anonymous reviewers and theeditor for their relevant and useful comments on aprevious version of the manuscript. The opinionsexpressed here benefitted from background experimentaland modelling research funded by the EVOLTREE network
of excellence (www.evoltree.eu), the ERA-Net BiodiversaLINKTREE project, the FRB VARIADAPT project, the ANRMACBI project, the Agropolis Foundation BIOFIS projectas well as Région Provence Alpes Côte d'Azur andDépartement Santé des Forêts.
REFERENCESAguilar R, Quesada M, Ashworth L, Herrerias-Diego Y,Lobo J (2008) Genetic consequences of habitatfragmentation in plant populations: susceptible signals inplant traits and methodological approaches. Mol Ecol17:5177–5188
Aitken SN, Yeaman S, Holliday JA, Wang T (2008)Adaptation, migration or extirpation: climate changeoutcomes for tree populations. Evol Appl 1:95-111
Alberto F, Aitken S, Alia A, Gonzáles-Martinez S, HanninenH, Kremer A, Lefèvre F, Lenormand T, Yeaman S, WhettenR, Savolainen O (2013) Evolutionary response to climatechange – evidence from tree populations. Global ChangeBiol (in press)
Allen CD, Macalady AK, Chenchouni H, Bachelet D,McDowell N, Vennetier M, Kitzberger T, Rigling A,Breshears D, Hogg EH(Ted), Gonzalez P, Fensham R,Zhang Z, Castro J, Demidova N, Lim JH, Allard G, RunningSW, Semerci A, Cobb N (2010) A global overview ofdrought and heat-induced tree mortality reveals emergingclimate change risks for forests. For Ecol Manag 259:660–684
Amm A, Pichot C, Dreyfus Ph, Davi H, Fady B (2012)Improving the estimation of landscape scale seeddispersal by integrating seedling recruitment. Ann For Sci69:845-856
Aravanopoulos FA (2011) Genetic monitoring in naturalperennial plant populations. Botany 89:75–81
Ashley M (2010) Plant parentage, pollination, anddispersal: how DNA microsatellites have altered thelandscape. Crit Rev Plant Sci 29:148–161
Ayari A, Zubizarreta-Gerendiain A, Tome M, Tome J, GarchiS, Henchi B (2012) Stand, tree and crown variablesaffecting cone crop and seed yield of Aleppo pine forestsin different bioclimatic regions of Tunisia. Forest Syst21:128-140
Baradat P, Marpeau A, Bernard-Dagan C (1978) Variationof terpenes within and between populations of maritimepine. In: Rudin D (ed) Biochemical genetics of forest trees,Swedish University of Agricultural Sciences, Umea
Bontemps A (2012) Potentiel évolutif d'une population dehêtre commun sur le Mont Ventoux. Ph.D. dissertationUniversity Paul Cézanne, Aix-Marseille III, Aix en Provence.
Bossdorf O, Richards CL, Pigliucci M (2008) Epigeneticsfor ecologists. Ecol Lett 11:106–115
Bouffier L, Charlot C, Raffin A, Rozenberg P, Kremer A(2008) Can wood density be efficiently selected at earlystage in maritime pine (Pinus pinaster Ait.)? Ann For Sci65:106p2-106p8
Bradshaw AD (1991) Genostasis and the limits to evolution.Philos T R Soc B 333:289–305
Brody AK (1997) Effects of pollinators, herbivores, andseed predators on flowering phenology. Ecology 78: 1624-1631
146
Brown JK (1975) Fire cycles and community dynamics inlodgepole pine forests. In: Baumgartner DM (ed)Symposium Proceedings: Management of lodgepole pineecosystems. Washington State University CooperativeExtension Service, Pullman, pp430-456Brown A, Young A, Burdon J, Christidis L, Clarke G, CoatesD, Sherwin W (1997) Genetic indicators for state of theenvironment reporting, Australia: State of the EnvironmentTechnical Paper Series (Environmental indicators).Department of the Environment, Sport and Territories,CanberraBuchert GP, Rajora OP, Hood JV, Dancik BP (1997) Effectsof harvesting on genetic diversity in old-growth easternwhite pine in Ontario, Canada. Conserv Biol 11:747-758Burczyk J, Adams WT, Moran GF, Griffins AR (2002)Complex patterns of mating revealed in a Eucalyptusregnans seed orchard using allozyme markers and theneighbourhood model. Mol Ecol 11:2379-2391Burczyk J, Adams WT, Birkes DS, Chybicki IJ (2006) Usinggenetic markers to directly estimate gene flow andreproductive success parameters in plants on the basis ofnaturally regenerated seedlings. Genetics 173:363–372Burke KL (2011) The effects of logging and disease onAmerican chestnut. For Ecol Manag 261:1027-1033Cariveau D, Rebecca EI, Brody AK, Garcia-Mayeya LS, OheA (2004) Direct and indirect effects of pollinators andseed predators to selection on plant and floral traits. Oikos104: 15-26Carter AJR, Hermisson J, Hansen TF (2005) The role ofepistatic gene interactions in the response to selection andthe evolution of evolvability. Theor Popul Biol 68:179–196Charmantier A, Garant D (2005) Environmental qualityand evolutionary potential: lessons from wild populations.P Roy Soc B - Biol Sci 272:1415–1425Chevin L-M, Collins S, Lefèvre F (2012) Phenotypicplasticity and evolutionary demographic responses toclimate change: taking theory out to the field. Funct Ecoldoi: 10.1111/j.1365-2435.2012.02043.xChevin LM, Lande R (2011) Adaptation to marginal habitatsby evolution of increased phenotypic plasticity. J EvolutionBiol, 24:1462–1476Chevin L-M, Lande R, Mace GM (2010) Adaptation,plasticity, and extinction in a changing environment:towards a predictive theory. PLoS Biology 8:e1000357.Couvet D, Ronfort J (1994) Mutation load depending onvariance in reproductive success and mating system. In:Loeschcke V, Tomiuk J, Jain SK (eds.) Conservationgenetics. Birkhauser Basel, pp. 55–68Crawley MJ (1989). Insect herbivores and plant populationdynamics. Annu Rev Entomol 34: 531–564Dounavi K, Steiner W, Maurer W (2002) Effects of differentsilvicultural treatments on the genetic structure ofEuropean beech populations (Fagus sylvatica L.). ManagFor Ecosyst 4:81-90Durand-Gillmann M, Cailleret M, Boivin T, Nageleisen LM,Davi H (2012) Individual vulnerability of Silver fir (Abiesalba Mill.) to parasitism by two contrasting biotic agents:mistletoe (Viscum album L. ssp. abietis) and bark beetles(Coleoptera: Curculionidae: Scolytinae) during a declineprocess. Ann For Sci doi:10.1007/s13595-012-0251-yEckert AJ, Bower AD, Gonzalez-Martinez SC, Wegrzyn J,Coop G, Neale DB (2010) Back to nature: ecological
genomics of loblolly pine (Pinus taeda, Pinaceae). Mol Ecol19:3789–3805
El-Kassaby YA, Benowicz A (2000) Effects of commercialthinning on genetic, plant species and structural diversityin second growth Douglas-fir (Pseudotsuga menziesii(Mirb.) Franco) stands. Forest Genetics 7:193-203
Endler JA (1986) Natural selection in the wild. Monographsin population biology 21. Princeton University Press,Princeton
Falconer DS (1960) Introduction to quantitative genetics.Oliver and Boyd, Edinburgh
Fenner M, Cresswell JE, Hurley RA, Baldwin T (2002)Relationship between capitulum size and predispersalseed predation by insect larvae in common Asteraceae.Oecologia 130: 72-77
Fernandez-M JF, Sork VL (2005) Mating patterns of asubdivided population of the Andean oak (Quercushumboldtii Bonpl., Fagaceae). J Hered 96:635–643
Forkner RE, Marquis RJ, Lill JT (2004) Feeny revisited:condensed tannins as anti-herbivore defences in leaf-chewing. Herbivore communities of Quercus. Ecol Entomol29: 174–187
Forrester DI, Collopy JJ, Beadle, Christopher L, Warren CR,Baker TG (2012). Effect of thinning, pruning and nitrogenfertiliser application on transpiration, photosynthesis andwater-use efficiency in a young Eucalyptus nitensplantation. For Ecol Manag 266:286-300
Futuyma DJ (2010) Evolutionary constraint and ecologicalconsequences. Evolution 64:1865–1884
García C, Arroyo JM, Godoy JA, Jordano P (2005) Matingpatterns, pollen dispersal, and the ecological maternalneighbourhood in a Prunus mahaleb L. population. MolEcol 14:1821-1830
García C, Jordano P, Arroyo JM, Godoy JA (2009)Maternal genetic correlations in the seed rain: effects offrugivore activity in heterogeneous landscapes. J Ecol97:1424-1435
Gilpin ME, Soule ME (1986) Minimum viable populations:processes of species extinction. In: Soule ME (ed)Conservation biology: the science of scarcity and diversity.Sinauer Associates, Sunderland, pp. 19-34
Gingerich PD (2009) Rates of evolution. Annu Rev EcolEvol S 40:657–675
Gomulkiewicz R Holt RD (1995) When does evolution bynatural selection prevent extinction? Evolution 49:201-207
Goodell K, Elam DE, Nason JD, Ellstrand NC (1997) Geneflow among small populations of a self-incompatible plant:an interaction between demography and genetics, Am JBot 84:1362-1371
Grivet D, Sebastiani F, Alía R, Bataillon T, Torre S, Zabal-Aguirre M, Vendramin GG, González-Martínez SC (2011)Molecular footprints of local adaptation in twoMediterranean conifers. Mol Biol Evol 28:101-116
Gwaze DP, bridgewater FE, Byram TD, Woolliams JA,Williams CG (2000) Predicting age-age correlations intree-breeding programs: a case study in Pinus taeda L.Theor Appl Genet 100:199-206
Hannrup B, Ekberg (1998) Age-age correlations fortracheid length and wood density in Pinus sylvestris. CanJ For Res 28:1373-1379
147
Hansen MM, Olivieri I, Waller DM, Nielsen EE, the GeMWorking Group (2012) Monitoring adaptive geneticresponses to environmental change. Mol Ecol 21:1311–1329Hardy O, Gonzales-Martinez SC, Colas B, Fréville H, MignotA, Olivieri I (2004) Fine-scale genetic structure and genedispersal in Centaurea corymbosa (Asteraceae). II.Correlated paternity within and among sibships. Genetics168:1601–1614Hoffmann AA, Sgrò CM (2011) Climate change andevolutionary adaptation. Nature 470:479-485Holliday JA, Ritland K, Aitken SN (2010) Widespread,ecologically relevant genetic markers developed fromassociation mapping of climate-related traits in Sitkaspruce (Picea sitchensis). New Phytol 188:501-514Horvitz CC, Schemske DW (2002) Effects of plant size, leafherbivory, local competition and fruit production onsurvival, growth and future reproduction of a neotropicalherb. J Ecol 90: 279–290Hulme PE (1998) Post-dispersal seed predation:consequences for plant demography and evolution.Perspect Plant Ecol 1: 32-46Hussendörfer E, Konnert M (2000) Impact of forestmanagement on genetic variation of Silver fir andEuropean beech populations. For Landsc Res 75:187-204IPCC (2007) Climate change 2007: AR4 synthesis report.An assessment of the Intergovernmental Panel on ClimateChange, adopted at IPCC Plenary XXVII, Valencia, Spain,12-17/11/2007Jactel H, Petit RJ, Desprez-Loustau M-L, Delzon S, Piou D,Battisti A, Koricheva J (2012) Drought effects on damageby forest insects and pathogens: a meta-analysis. GlobalChange Biol 195: 267-276Janzen DH (1971) Seed predation by animals. Annu RevEcol S 2: 465-492Kircher M, Kelso J (2010) High-throughput DNAsequencing? Concepts and limitations. BioEssays 32:524-536Klein EK, Carpentier FH, Oddou-Muratorio S (2011)Estimating the variance of male fecundity from genotypesof progeny arrays: evaluation of the Bayesian forwardapproach. Methods Ecol Evol 2:349–361Klein EK, Lavigne C, Gouyon PH (2006) Mixing ofpropagules from discrete sources at long distance:comparing a dispersal tail to an exponential. BMC Ecology,6:3Kolb A, Ehrlén J, Eriksson O (2007) Ecological andevolutionary consequences of spatial and temporalvariation in pre-dispersal seed predation. Perspect PlantEcol 9:79–100Konnert M, Hussendörfer E (2001) Genetic variation ofsilver fir (Abies alba) in unevenaged forests (Plenter forest)in comparison with evenaged forests (Altersklassenwald).Forest Sci 70:307-320Koski V, Skrøppa T, Paule L, Wolf H, Turok J (1997)Technical guidelines for genetic conservation of Norwayspruce (Picea abies (L.) Karst.). International Plant GeneticResources Institute, RomeKramer K, Buiteveld J, Forstreuter M, Geburek T, LeonardiS, Menozzi P, Povillon F, Schelhaas MJ, Teissier du Cros E,Vendramin GG, van der Werf DC (2008). Bridging the gapbetween ecophysiological and genetic knowledge toassess the adaptive potential of European beech. EcolModel 216:333–353
Kremer A, Le Corre V (2012) Decoupling of differentiationbetween traits and their underlying genes in response todivergent selection. Heredity 108:375-385Kremer A, Ronce O, Robledo-Arnuncio JJ, Guillaume F,Bohrer G, Nathan R, Bridle JR, Gomulkiewicz R, Klein EK,Ritland K, Kuparinen A, Gerber S, Schueler S (2012) Long-distance gene flow and adaptation of forest trees to rapidclimate change. Ecol Lett 15:378-392Krouchi F , Derridj A, Lefèvre F (2004) Year and tree effecton reproductive organisation of Cedrus atlantica in anatural forest. For Ecol Manag 197:181-189Kuparinen A, Savolainen O, Schurr FM (2010) Increasedmortality can promote evolutionary adaptation of foresttrees to climate change. For Ecol Manag 259:1003–1008Lande R (2009) Adaptation to an extraordinaryenvironment by evolution of phenotypic plasticity andgenetic assimilation. J Evolution Biol 22:1435–1446Lande R, Arnold SJ (1983) The measurement of selectionon correlated characters. Evolution 37:1210–1226Lauber U, Rotach P, Hussendörfer E (1997) The influenceof silvicultural interventions on the genetic structure of ayoung beech stand (Fagus sylvatica L.). Schweiz ZForstwes 148:847-862Lefèvre F (2004) Human impacts on forest geneticresources in the temperate zone: an updated review. ForEcol Manag 197:257-271Lefèvre F, Kajba D (2001) Indicators for monitoring geneticdiversity. In: Lefèvre F, Barsoum N, Heinze B, Kajba D,Rotach P, de Vries S, Turok J (eds) In situ conservation ofPopulus nigra. International Plant Genetic ResourcesInstitute, Rome, pp 36-46Legay M, Mortier F (2005) La forêt face au changementclimatique: adapter la gestion forestière - Prise en comptedans les documents d'orientation de la gestion forestière.Synthèse de l'atelier ONF/INRA du 20 octobre 2005.Office National des Forêts, Paris. Les Dossiers Forestiersn°16Le Rouzic A, Siegel PB, Carlborg O (2007) Phenotypicevolution from genetic polymorphisms in a radial networkarchitecture. BMC Biol 5:50 doi:10.1186/1741-7007-5-50Maron JL, Crone E (2006) Herbivory: effects on plantabundance, distribution and population growth. P Roy SocB 273: 2575–2584Marquis RJ (1992) The selective impact of herbivores. In:Fritz RS, Simms EL (eds) Plant resistance to herbivoresand pathogens. University of Chicago Press, Chicago,pp301–325Matheson AC, Wu HX, Spencer DJ, Raymond CA, GriffinAR (2002) Inbreeding in Pinus radiata III. The effect ofinbreeding on age-age correlation and early selectionefficiency. Silvae Genet 51:115-122McCullough DG, Werner RA, Neumann D (1998) Fire andinsects in northern and boreal ecosystems of NorthAmerica. Annu Rev Entomol 43: 107-127McDonald SE, Thomas BR, Cherniawsky DM, Purdy BG(2001) Managing genetic resources of lodgepole pine inwest-central Alberta: patterns of isozyme variation innatural populations and effects of forest management. ForEcol Manag 152:45-58McIntyre GA, Jacobi WR, Ramaley AW (1996) Factorsaffecting Cytospora canker occurrence on aspen. JArboric 22: 229–233
148
Metzker ML (2009) Sequencing technologies - the nextgeneration. Nat Rev Genet 11:31-46
Milleron M, Lopez de Heredia U, Lorenzo Z, Perea R,Dounavi A, Alonso J, Gil L, Nanos N (2012) Effect ofcanopy closure on pollen dispersal in a wind-pollinatedspecies (Fagus sylvatica L.) Plant Ecol 213:1715-1728
Mimura M, Aitken SN (2007) Adaptive gradients andisolation-by-distance with postglacial migration in Piceasitchensis. Heredity 99:224–232
Misson L, Nicault A, Guiot J (2003) Effects of differentthinning intensities on drought response in Norway spruce(Picea abies (L.) Karst.) For Ecol Manage 183:47-60
Moose SP, Dudley JW, Rocheford TR (2004) Maizeselection passes the century mark: a unique resource for21st century genomics. Trends Plant Sci 9:358-364
Mosseler A, Major JE, Rajora OP (2003) Old-growth redspruce forests as reservoirs of genetic diversity andreproductive fitness. Theor Appl Genet 106:151-161
Namkoong G, Boyle T, Gregorius HR, Joly H, Savolainen O,Ratnam W, Young A (1996) Testing criteria and indicatorsfor assessing the sustainability of forest management:genetic criteria and indicators. Center for InternationalForestry Research CIFOR, Bogor. Working Paper N°10
Neale D, Savolainen O (2004) Association genetics ofcomplex traits in conifers. Trends Plant Sci 9:325-330
Nebeker TE, Hodges JD, Blanche CA, Honea CR, TisdaleRA (1992) Variation in the constitutive defensive system ofLoblolly pine in relation to bark beetle attack. Forest Sci38: 457-466
Netherer S, Schopf A (2010) Potential effects of climatechange on insect herbivores – general aspects and aspecific example (Pine processionary moth,Thaumetopoea pityocampa). For Ecol Manag 259:831–838
Nilsson JE (1995) Genetic variation in the natural pollencloud of Pinus sylvestris: a study based on progeny testing.Scand J Forest Res 10:140-148
Oddou-Muratorio S, Demesure-Musch B, Pélissier R,Gouyon PH (2004) Impacts of gene flow and logginghistory on the local genetic structure of a scattered treespecies, Sorbus torminalis L. Crantz. Mol Ecol 13:3689–3702
Oddou-Muratorio S, Klein EK, Austerlitz F (2005) Pollenflow in the wildservice tree, Sorbus torminalis (L.) Crantz.II. Pollen dispersal and heterogeneity in mating successinferred from parent–offspring analysis. Mol Ecol 14:4441-4452
OFEFP, Rapport forestier (2005) Faits et chiffres sur l’étatde la forêt suisse. Office fédéral de l’environnement, desforêts et du paysage, Berne
Osório J, Pereira JS (1994) Genotypic differences in water-use efficiency and 13C discrimination in Eucalyptusglobulus. Tree Physiol 14:871-882
Ott DS, Yanchuk AD, Huber DPW, Wallin KF (2011) Geneticvariation of lodgepole pine, Pinus contorta var. latifolia,chemical and physical defenses that affect mountain pinebeetle, Dendroctonus ponderosae, attack and treemortality. J Chem Ecol 37: 1002-1012
Parker TJ, Clancy KM, Mathiasen RL (2006) Interactionsamong fire, insects and pathogens in coniferous forests ofthe interior western United States and Canada. Agri ForEntomol 8:167-189
Pease CM, Lande R, Bull JJ (1989) A model of populationgrowth, dispersal and evolution in a changingenvironment. Ecology 70:1657-1664Petit RJ, Hampe A (2006) Some evolutionaryconsequences of being a tree. Annu Rev Ecol Evol S37:187–214.Pichot C, Bastien C, Courbet F, Demesure-Musch B,Dreyfus P, Fady B, Frascaria-Lacoste N, Gerber S, LefèvreF, Morand-Prieur ME, Oddou S, Teissier du Cros E, ValadonA (2006). Déterminants et conséquences de la qualitégénétique des graines et semis lors de la phase initiale derégénération naturelle des peuplements forestiers. LesActes du BRG n°6, Burreau des Ressources Génétiques,Paris, pp 277-297Pigliucci M (2008) Is evolvability evolvable? Nat Rev Genet9:75–82Prat D, Faivre-Rampant P, Prado E (2006) Analyse dugénome et gestion des ressources génétiques forestières.INRA ed Quae, ParisRajora OP, Rahman MH, Buchert GP, Dancik BP (2000)Microsatellite DNA analysis of genetic effects of harvestingin old-growth eastern white pine (Pinus strobus) inOntario, Canada. Mol Ecol 9:339-348Ramirez-Valiente JA, Valladares F, Huertas AD, GranadosS, Aranda I (2011) Factors affecting cork oak growth underdry conditions: local adaptation and contrasting additivegenetic variance within populations. Tree Genet Genomes7:285-295Rappaport NG, Mori S, Roques A (1993) Estimating effectof Megastigmus spermotrophus (Hymenoptera:Torymidae) on Douglas-fir seed production: the newparadigm. J Econ Entomol 86:845-849 Rehfeldt GE, Wykoff WR, Ying CC (2001) Physiologicplasticity, evolution, and impacts of a changing climate on.Climatic Change 50:355–376Restoux G, Silva ED, Sagnard F, Torre F, Klein E, Fady B(2008) Life at the margin: the mating system ofMediterranean conifers. Web Ecology 8: 94–102Ritland K (1996) A marker-based method for inferencesabout quantitative inheritance in natural population.Evolution 50:1062-1073Robledo-Arnuncio JJ (2011) Wind pollination overmesoscale distances: an investigation with Scots pine. NewPhytol 190:222-233Robledo-Arnuncio JJ, Alía R, Gil L (2004) Increased selfingand correlated paternity in a small population of apredominantly outcrossing conifer, Pinus sylvestris. MolEcol 13:2567–2577Rockman MV (2012) The QTN program and the alleles thatmatter for evolution: all that’s gold does not glitter.Evolution 66:1–17Roques A (1981) Biologie et répartition de Megastigmusspermotrophus Wachtl. (Hymenoptera: ChalcidoideaTorymidae) et des autres insectes liés aux cônes dans lespeuplements forestiers et vergers à graines français desapin de Douglas Pseudotsuga menziesii [Mirb.] Franco.Acta Oecol 2:161-180Rose KE, Louda SM, Rees M (2005) Demographic andevolutionary impacts of native and invasive insectherbivores on Cirsium canescens. Ecology 86: 453–465Rouault G, Candau JN, Lieutier F, Nageleisen L-M, MartinJC, Warzée N (2006) Effects of drought and heat on forest
149
insect populations in relation to the 2003 drought inWestern Europe. Ann For Sci 63: 613-624
Sáenz-Romero C, Guzmán-Reyna R, Rehfeldt G (2006)Altitudinal genetic variation among Pinus oocarpapopulations in Michoacan, Mexico. Implications for seedzoning, conservation, tree breeding and global warming.For Ecol Manag 229:340-350
Sagnard F, Oddou-Muratorio S, Pichot C, Vendramin GG,Fady B (2011) Effects of seed dispersal, adult tree andseedling density on the spatial genetic structure ofregeneration at fine temporal and spatial scales. TreeGenet Genomes 7:37-48
Savolainen O, Pyhäjärvi T, Knürr T (2007) Gene flow andlocal adaptation in trees. Annu Rev Ecol Evol S 38:595–619
Schleuning M, Farwig N, Peters MK, Bergsdorf T, Bleher B,Brandl R, Dalitz H, Fischer G, Freund W, Gikungu MW,Hagen M, Garcia FH, Kagezi GH, Kaib M, Kraemer M, LungT, Naumann CM, Schaab G, Templin M, Uster D, Wagele JW,Bohning-Gaese K (2011) Forest fragmentation andselective logging have inconsistent effects on multipleanimal-mediated ecosystem processes in a tropical forest.PloS ONE 6:e27785
Schoen D, Brown HD (1991) Intraspecific variation inpopulation gene diversity and effective population sizecorrelates with the mating system in plants. P Natl AcadSci USA 88:4494-4497
Simard M, Romme WH, Griffin JM, Turner MG (2011) Domountain pine beetle outbreaks change the probability ofactive crown fire in lodgepole pine forests? Ecol Monogr81: 3-24
Skrøppa T, Tollefsrud M, Sperisen C, Johnsen Ø (2010).Rapid change in adaptive performance from onegeneration to the next in Picea abies - central Europeantrees in a Nordic environment. Tree Genet Genomes 6:93–99
Smouse P, Dryer RJ, Westfall RD, Sork VL (2001) Two-generation analysis of pollen flow across a landscape. I.Male gamete heterogeneity among females. Evolution55:260-271
Smouse P, Sork VL (2004) Measuring pollen flow in foresttrees: an exposition of alternative approaches, For EcolManag 197:21–38St Clair JB, Howe GT (2007) Genetic maladaptation ofcoastal Douglas-fir seedlings to future climates. GlobalChange Biol 13:1441–1454Strauss SY, Whittall JB (2006) Non-pollinator agents ofselection on floral traits. In: Harder LD, Barrett SCH (eds.),Ecology and evolution of flowers. Oxford University Press,Oxford, pp. 120-138Tene A, Tobin B, Dyckmans J, Ray D, Black K, NieuwenhuisM (2011) Assessment of tree response to drought:validation of a methodology to identify and test proxiesfor monitoring past environmental changes in trees. TreePhysiol 31:309-322Thiebaut B, Comps B, Leroux A (1992) Relation hauteur-génotype dans une régénération naturelle de hêtre (Fagussylvatica) équienne et agée de 18 ans. Ann Sci For 49:321-335Walsh B, Blows MW (2009) Abundant genetic variation +strong selection = multivariate genetic constraints: ageometric view of adaptation. Annu Rev Ecol Evol S 40:41–59Wright S (1931) Evolution in Mendelian populations.Genetics 16:97-158Wu HX, Powell MB, Yang JL, Ivkovic M, McRae TA (2007)Efficiency of early selection for rotation-aged woodquality traits in radiata pine. Ann For Sci 64:1-9Yan H, Bi HQ, Li R, Eldridge R, Wu Z, Li Y, Simpson J (2006)Assessing climatic suitability of Pinus radiata (D. Don) forsummer rainfall environment of southwest China. For EcolManag 234:199-208Yarnes C, Boecklen WJ (2005) Abiotic factors promoteplant heterogeneity and influence herbivore performanceand mortality in Gambel’s Oak (Quercus gambelii, Nutt.).Entomol Exp Appl 114:87–95Yousefpour R, Jacobsen JB, Thorsen BJ, Meilby H,Hanewinkel M, Oehler K (2012) A review of decision-making approaches to handle uncertainty and risk inadaptive forest management under climate change. AnnFor Sci 69:1-15
150
THE TRANSCIPTOME OF POPULUS IN ELEVATEDCO2 REVEALS INCREASED ANTHOCYANINBIOSYNTHESIS DURING DELAYED AUTUMNALSENESCENCE
M.J. Tallis1, Y Lin1, A. Rogers2, J. Zhang1,3, N.R. Street1,F. Miglietta4, D.F. Karnosky5, P. De Angelis6 and G. Taylor1*
1 School of Biological Science, Bassett Crescent East, University ofSouthampton, SO16 7PX.
2 Environmental Sciences Department, Brookhaven National Laboratory, UptonNY 11973, USA.
3 College of Life Sciences, Peking University, Beijing, 100871, P.R.China4 Institute of Biometeorology-CNR, Via Caproni, 8 50145 Firenze, Italy.5 School of Forest Resources & Environmental Science, Michigan Technological
University, 1400 Townsend Drive, Houghton, Michigan 49931-1295 USA.6 Department of Forest Environment and Resources (DISAFRI), University of
Tuscia, Via S. Camillo De Lellis, 01100 Viterbo, Italy.
Present addresses:NR Street: Umeå Plant Science Centre, Department of Plant Physiology,University of Umeå, SE-901 87 Umeå, Sweden.
Corresponding authors:Professor Gail TaylorSchool of Biological Sciences, Bassett Crescent East,University of Southampton, SO16 [email protected]
Summary• Over recent decades the observed delay in autumnalsenescence has been linked to rising temperatures. Herewe suggest that increasing atmospheric CO2 alone maypartly account for extensions of the growing season andfor the first time, through transcriptome analysis, identifygene expression changes associated with this delayedsenescence. • Using a plantation of Populus x euramericana grown inelevated [CO2] (e[CO2]) using Free-air CO2 Enrichment(FACE) technology, we investigated the molecular andbiochemical basis underlying this response. Leafbiosynthetic pathways influenced by e[CO2] duringsenescence were identified using a Populus cDNAmicroarray and an analysis of expression changes forgenes representing multiple biochemical pathways, RT-qPCR, and leaf biochemical assays. • Both pathways for secondary metabolism and for theglycolytic pathway were significantly up-regulated bye[CO2] during senescence. Within these pathways the twomost significantly up-regulated ESTs in e[CO2]represented transcripts for and LDOX and DFR, whichregulate anthocyanin biosynthesis, with a normalisedexpression (e[CO2] / a[CO2]) of 39.6 and 19.3 respectively. • We propose that in e[CO2] there is an associationbetween increased autumnal sugar accumulation andchanges in gene expression in genes determininganthocyanin biosynthesis. This prolongs leaf longevityduring natural autumnal senescence through improvedstress tolerance.
IntroductionEvidence from phenological records suggests that recentglobal warming is leading to longer growing seasons. Ananalysis of over 1700 species showed significant shifts inplant phenology (Parmesan & Yohe, 2003) including
extension of the growing season (Menzel & Fabian, 1999;Menzel et al. 2006; Myneni et al. 1997 and Zhou et al. 2001)which has been attributed to rising air temperature(Menzel & Fabian, 1999). On average over the past 35 yearsautumnal senescence has been delayed across Europe by1.3 days decade-1 (Menzel et al. 2006). However, whilst astrong correlation exists between atmospheric warmingand an earlier spring phenophase, the correlation betweenwarming and a later on-set of the autumn phenophase isvery weak (Menzel et al. 2006). Understanding thisprocess is important since changing phenology can alterbio-geochemical cycling and albedo both feeding back onclimate change (Peñuelas, Rutishauser, and Filella, 2009).For example, an extended autumn has been reported toincrease carbon storage in the boreal zone of Northernlatitude forests (Lucht et al. 2002) and in the aspen borealforests of North America (Chen et al. 1999)
Over the time period of the Menzel et al. (2006) study(1971 -2000) atmospheric carbon dioxide has increased by44 µmol mol-1 (13.5 %). We have shown previously thatelevated atmospheric CO2 ( e[CO2]) delays autumnalsenescence in a forest canopy exposed for six years toe[CO2] in a free air CO2 exposure (FACE) ecosystemexperiment. At the canopy level the decline in greenness(NDVI) and leaf area index (LAI) were both significantlyreduced by e[CO2]. Also significantly reduced was thedecline in leaf chlorophyll indicating delayed senescencein these trees (Taylor et al. 2008). However, these findingare controversial since rising [CO2] has been shown toshorten (Sigurdsson, 2001), extend (Li et al. 2000; Rae etal. 2005; Taylor et al. 2008) or have no effect (Herrick &Thomas, 2003) on forest senescence.
Natural autumnal senescence is regulated by day length,temperature, light, nitrogen supply and water supply andby plant carbon-nitrogen and source-sink balance(Wingler et al. 2006). The timing of which can be regardedas the result of a trade-off between the conflicting
Key words: Populus, autumnal senescence, cDNA microarray, anthocyanin biosynthesis, elevated CO2, LDOX.
Published in New Phytologist (2010) 186: 415-428, with doi:10.1111/j.1469-8137.2010.03184.x
151
requirements for optimizing the nitrogen and carbonstatus of the plant (Keskitalo et al. 2005). The strength ofthe plants sink for photosynthate can positively influencephotosynthetic responses to e[CO2] (Bryant, Taylor andFrehner, 1999; Ainsworth et al. 2004) and also reduce therate of senescence (Wingler et al. 2004; Kaschuk et al.2009). Recent studies using girdled sugar maple treeshave shown that sugar accumulation in leaves resulted inthe formation of anthocyanins (Murakami, Schaberg andShane, 2008) and leaves with increased anthocyanincontent were associated with a delayed senescence(Schaberg et al. 2008). In poplar over expressing anArabidopsis sucrose phosphate synthase gene resulted inincreased leaf sucrose content between August andthroughout senescence which was associated with adelayed senescence (Park et al. 2009). These data indicatethe complex interactions between the plantsdevelopmental state, source sink balance and rate ofsenescence. Nevertheless, the initiation and sequence ofevents during senescence are well conserved. The stimulusfor the process of autumnal senescence in Populus is ashortening of the photoperiod initiating bud-set, at leastfor high-latitude trees (Böhlenius et al. 2006; Fracheboudet al. 2009; Keskitalo et al. 2005; Olsen et al. 1997) whichis considered an adaptive trait related to plant fitness(Ingvarsson et al. 2006). Following this initial stimulus awell characterised sequence of cellular events has beenreported (Keskitalo et al. 2005) from chloroplastbreakdown, carotenoid and soluble sugar loss, toanthocynain production, a massive 80 % nitrogenremobilisation and leaf abscission. During this process inpoplar 166 genes were classed as the most up-regulatedrevealing a shift from gene expression associated withanabolism to that of catabolism and an increased role ofthe mitochondria for energy generation as photosynthesisbreaks down (Andersson et al. 2004).
The aim of this research was to understand how exposureto increased atmospheric CO2 disrupts the process ofautumnal senescence and to identify key changes inmetabolism and gene expression associated with delayedsenescence. We conducted our investigation at thePOP/EUROFACE (Free Air CO2 Enrichment) experiment(Miglietta et al. 2001) where trees had been grown for sixyears, since planting to canopy closure, in a fully open airenvironment at either ambient [CO2] (a[CO2]) or e[CO2](550 µmol mol-1). Conducting this study at a FACE siteallowed us to eliminate the potentially confoundingproblems of sink, N and water limitation that are commonin experiments using other CO2 fumigation techniques(McLeod & Long, 1999) which are known to influence therate of senescence. The highly productive, fast growingtrees reported to be non-resource limited (Liberloo et al.2009) at the POP/EUROFACE experiment provided theideal model system in which to investigate the changes innatural autumnal senescence of a forest canopy growingin e[CO2]. Furthermore Populus is now recognised as a
model tree genus (Taylor, 2002; Tuskan et al. 2006;Jansson & Douglas, 2007) enabling genomic resources tobe deployed to answer questions of ecological andevolutionary significance on plant response andadaptation to climate change.
Materials and MethodsThe POP/EUROFACE site
The PopFACE experiment (9 ha) was situated on anutrient rich, clay soil in Tuscania, Italy (42° 22' N, 11° 48' E;altitude 150 m a.s.l.; www.unitus.it/euroface). Three speciesof Populus, P. alba L. (clone 2AS-11), P. nigra L. (clone JeanPourtet), and P. x euramericana (Dode) Guinier (clone I-214) were grown in the experiment within six experimentalplots. The whole site was assigned to three blocks eachcontaining two 314 m2 octagonal plots assigned twotreatments of [CO2] (control or ambient CO2, a[CO2] andeleveated CO2 e[CO2] of 550 µmol mol-1). Complete designcharacteristics of PopFACE are available elsewhere(Miglietta, et al. 2001; Scarascia-Mugnozza et al. 2006).During the period of this study trees had been planted forsix years, coppiced after three years and a closed canopywas evident. Canopy characterisation and climatic dataduring this study have been described in detail (Taylor etal. 2008) and only the ambient nitrogen sub-plots wereused in this study, the same treatments as Taylor et al.(2008). A strong chlorosis of the canopies in plots five andsix was evident during this study so these plots werediscounted from any further analysis as described inLiberloo et al. (2007). Day time CO2 enrichment wasprovided from bud burst until bud-set except during thisstudy when CO2 enrichment was continued throughout.The e[CO2] measured at 1 min intervals was within a 20%deviation from the target concentration of 550 ppm for94% of the time during the first three year rotation, andfor 78% of the time during the second rotation (Liberlooet al. 2009). The leaf sampling regime is described in theSupporting Information and all sampled leaves wereinstantly placed in foil, added to a weighted bag anddropped from the canopy to be placed in liquid N2, fromremoval until placing in liquid N2 was ~ 10 s.
Canopy level spectral reflectance
Canopy reflectance was measured with a field portablespectroradiometer (GER 3700) (GER, Buffalo, NY, USA.Mod. 3700), and a chlorophyll specific NDVI (Gitelson andMerzlyak, 1994; Gamon and Surfus, 1999) was calculatedas described in Taylor et al. (2008). Further details aregiven in Supporting Information.
Microarray Hybridisation
Total RNA was extracted using the protocol of Chang etal. (1993) with the following modifications, 2.67 % β-Mercapto-ethanol was added to the CTAB extractionbuffer instead of spermidine. After the overnight 4 ºC LiClprecipitation and re-suspension in SSTE two additional
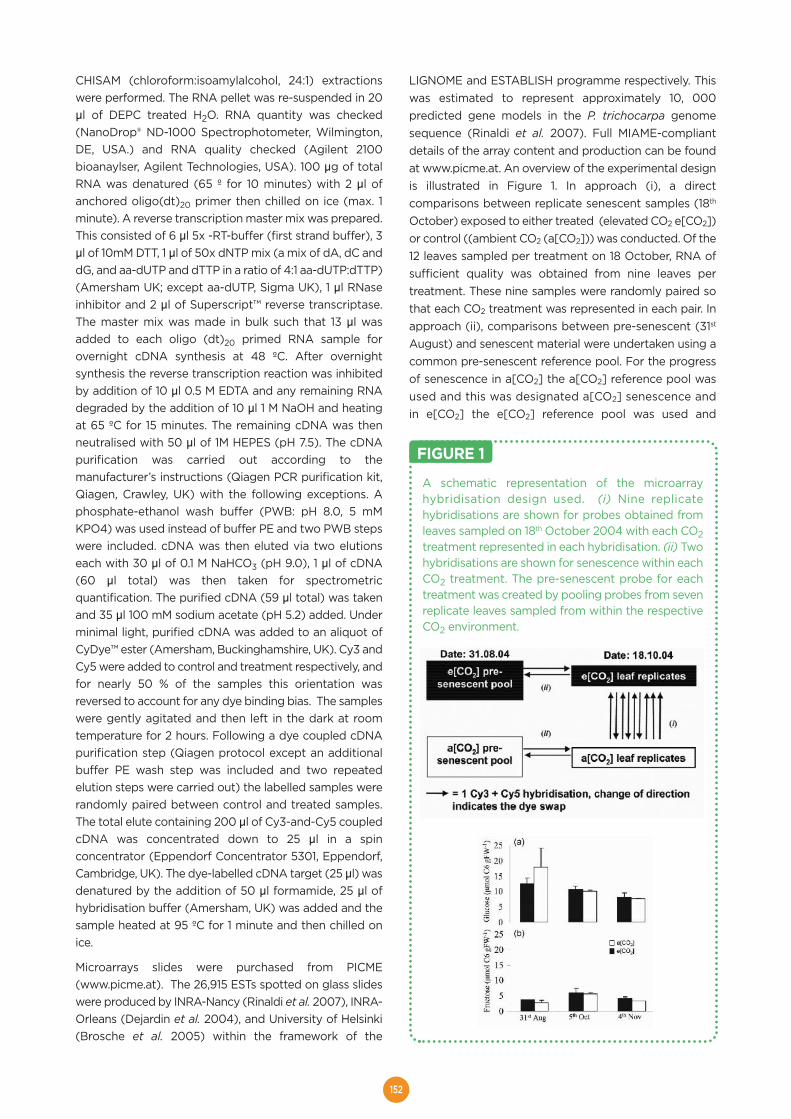
152
CHISAM (chloroform:isoamylalcohol, 24:1) extractionswere performed. The RNA pellet was re-suspended in 20µl of DEPC treated H2O. RNA quantity was checked(NanoDrop® ND-1000 Spectrophotometer, Wilmington,DE, USA.) and RNA quality checked (Agilent 2100bioanaylser, Agilent Technologies, USA). 100 µg of totalRNA was denatured (65 º for 10 minutes) with 2 µl ofanchored oligo(dt)20 primer then chilled on ice (max. 1minute). A reverse transcription master mix was prepared.This consisted of 6 µl 5x -RT-buffer (first strand buffer), 3µl of 10mM DTT, 1 µl of 50x dNTP mix (a mix of dA, dC anddG, and aa-dUTP and dTTP in a ratio of 4:1 aa-dUTP:dTTP)(Amersham UK; except aa-dUTP, Sigma UK), 1 µl RNaseinhibitor and 2 µl of Superscript™ reverse transcriptase.The master mix was made in bulk such that 13 µl wasadded to each oligo (dt)20 primed RNA sample forovernight cDNA synthesis at 48 ºC. After overnightsynthesis the reverse transcription reaction was inhibitedby addition of 10 µl 0.5 M EDTA and any remaining RNAdegraded by the addition of 10 µl 1 M NaOH and heatingat 65 ºC for 15 minutes. The remaining cDNA was thenneutralised with 50 µl of 1M HEPES (pH 7.5). The cDNApurification was carried out according to themanufacturer’s instructions (Qiagen PCR purification kit,Qiagen, Crawley, UK) with the following exceptions. Aphosphate-ethanol wash buffer (PWB: pH 8.0, 5 mMKPO4) was used instead of buffer PE and two PWB stepswere included. cDNA was then eluted via two elutionseach with 30 µl of 0.1 M NaHCO3 (pH 9.0), 1 µl of cDNA(60 µl total) was then taken for spectrometricquantification. The purified cDNA (59 µl total) was takenand 35 µl 100 mM sodium acetate (pH 5.2) added. Underminimal light, purified cDNA was added to an aliquot ofCyDye™ ester (Amersham, Buckinghamshire, UK). Cy3 andCy5 were added to control and treatment respectively, andfor nearly 50 % of the samples this orientation wasreversed to account for any dye binding bias. The sampleswere gently agitated and then left in the dark at roomtemperature for 2 hours. Following a dye coupled cDNApurification step (Qiagen protocol except an additionalbuffer PE wash step was included and two repeatedelution steps were carried out) the labelled samples wererandomly paired between control and treated samples.The total elute containing 200 µl of Cy3-and-Cy5 coupledcDNA was concentrated down to 25 µl in a spinconcentrator (Eppendorf Concentrator 5301, Eppendorf,Cambridge, UK). The dye-labelled cDNA target (25 µl) wasdenatured by the addition of 50 µl formamide, 25 µl ofhybridisation buffer (Amersham, UK) was added and thesample heated at 95 ºC for 1 minute and then chilled onice.
Microarrays slides were purchased from PICME(www.picme.at). The 26,915 ESTs spotted on glass slideswere produced by INRA-Nancy (Rinaldi et al. 2007), INRA-Orleans (Dejardin et al. 2004), and University of Helsinki(Brosche et al. 2005) within the framework of the
LIGNOME and ESTABLISH programme respectively. Thiswas estimated to represent approximately 10, 000predicted gene models in the P. trichocarpa genomesequence (Rinaldi et al. 2007). Full MIAME-compliantdetails of the array content and production can be foundat www.picme.at. An overview of the experimental designis illustrated in Figure 1. In approach (i), a directcomparisons between replicate senescent samples (18th
October) exposed to either treated (elevated CO2 e[CO2])or control ((ambient CO2 (a[CO2])) was conducted. Of the12 leaves sampled per treatment on 18 October, RNA ofsufficient quality was obtained from nine leaves pertreatment. These nine samples were randomly paired sothat each CO2 treatment was represented in each pair. Inapproach (ii), comparisons between pre-senescent (31st
August) and senescent material were undertaken using acommon pre-senescent reference pool. For the progressof senescence in a[CO2] the a[CO2] reference pool wasused and this was designated a[CO2] senescence andin e[CO2] the e[CO2] reference pool was used and
A schematic representation of the microarrayhybridisation design used. (i) Nine replicatehybridisations are shown for probes obtained fromleaves sampled on 18th October 2004 with each CO2treatment represented in each hybridisation. (ii) Twohybridisations are shown for senescence within eachCO2 treatment. The pre-senescent probe for eachtreatment was created by pooling probes from sevenreplicate leaves sampled from within the respectiveCO2 environment.
FIGURE 1
153
designated e[CO2] senescence. Microarray hybridisationswere carried out to directly assess the transcriptomechanges occurring during senescence in a[CO2] and ine[CO2]. RNA was extracted individually from pre-senescent(31 August 2004) leaves and then pooled. The pool fore[CO2] consisted of seven samples (four from plot one andthree from plot four). The pool for a[CO2] consisted ofseven samples (four from plot two and three from plotthree). In each pool 100 µg of total RNA was establishedusing 14.3 µg of total RNA from each replicate leaf.
Pre-hybridisation, hybridisation and scanning of the PICMEmicroarray slides are described in Street et al. (2009). Thetranscript profile data were also analysed according toStreet et al.(2009). Linear models with B statisticsimplemented in the LIMMA (Smyth, 2004:http://bioinf.wehi.edu.au/limma/) package for thestatistical software ‘R’ (http://www.r-project.org) wereused to identify ESTs that may be differentially expressed(Diaz et al. 2003). The model contained only one specifiedfactor for treatment either (i) e[CO2] for the 18th Octoberdirect comparison between exposure to a[CO2] ande[CO2] or (ii) expression on 18th October for thecomparison between the pre-senescent reference poolsand the senescent material. Calculated B and P values areadjusted for multiple testing with a false discover rate(FDR) of 0.05 (Benjamini & Hochberg, 1995) considered avery conservative statistical analysis for FACE experimentsof field acclimated material (Leakey et al. 2009a). As theinfluence of senescence on transcript abundance can bevery large for some transcripts (Andersson et al. 2004)this conservative statistical analysis was consideredappropriate. ESTs considered as significantly differentiallyexpressed in e[CO2] compared to a[CO2] late insenescence (18 October 2004) and those differentiallyexpressed between pre-senescent and senescent tissueswere those with a B value of ≥ 3. A B value of zero equalsa 50:50 probability of differential expression where as a Bvalue of 3 represents approximately 95% certainty ofdifferential expression (exp[3] / (1+exp[3])) = 0.95, or 95%). We used a B value of ≥ 3 and a two-fold change inmean normalized expression as our threshold fordeclaring an EST as significantly differentially expressed.Sequence annotation was obtained using the tblastxalgorithm run by the DOE Joint Genome Institute (JGI,http://genome.jgi-psf.org). All microarray data generatedhave been deposited in the Gene Expression Omnibus(GEO) database as Series GSE15874.
Analysis of expression changes for genesrepresenting multiple biochemical pathways
Microarray data was further analysed by MapMan (version2.2.0, downloaded from (http://gabi.rzpd.de/projects/MapMan/). Mapman software displays large data sets ontodiagrams of metabolic pathways or other processes(Thimm et al. 2004). Arabidopsis thaliana ortholog idswere obtained using the gene model ids of each EST
sequence on the PICME array and the ortholog extractorfunction in PopGenIE (Sjödin et al. 2009). The mean Log2
ratio for all the Populus ESTs representing a single orthologArabidopsis gene model were used in the Mapmanpathway analysis. The Wilcoxon Rank Sum Test was usedwithin MapMan to identify any functional group of genesthat exhibit a different behaviour in terms of expressionprofile compared to all the other remaining functionalgroups. Data were Benjamini Hochberg corrected inMapMan and P ≤ 0.05 was considered the cut-off foridentifying functional groups considered to have adifferent behaviour in terms of expression profiles. Thepathway diagrams for anthocyanin biosynthesis werebased on that described for Arabidopsis (Solfanelli et al.2006) and additional information for Populus wereobtained from Tsai et al. (2006).
Real-time quantitative PCR
The selection and validation of the internal reference geneis described in Supporting Information. ESTs to bevalidated were searched by their EST name in the PICMEdatabase and the EST information was extracted fromNCBI using Accession Number. Gene model informationwas downloaded from JGI. Real-time qPCR primers weredesigned using Beacon Design 5.0 (PREMIER BiosoftInternational) and the following criteria: Tm of 55-60°Cand PCR amplicon lengths of 115 to 160 bp, yielding primersequences with lengths of 19 to 22 nucleotides and GCcontents of 45% to 55%. Primers were also designed toamplify close to the 3’ end of the transcripts or EST, andat least one primer of a pair was designed to cover anexon-exon junction if possible. All primers used in thisstudy were synthesized and desalted by Sigma-Genosys.
The protocols for cDNA synthesis and SYBR Green qPCRare described in supplementary materials and methods.The primer pairs used and mean ct values of the referencegene are also reported in supplementary materials andmethods.
Leaf Biochemistry
Anthocyanin content
Frozen leaves were ground and 50 mg from each samplewas used for analysis according to the method of Martinet al. (2002). Data were calculated from the mean of threetechnical repeats for eight replicate leaves per treatment(four per plot).
Soluble carbohydrates and starch
Extraction and measurement of glucose, fructose, sucroseand starch content has been described previously (Rogerset al. 2006). Glucose, fructose and sucrose were extractedfrom frozen ground material using sequential incubationsin ethanol. Starch was extracted from the residual materialand converted to glucose. Glucose, fructose, sucrose andthe glucose resulting from the starch degradation werethen assayed using a continuous enzymatic substrateassay.
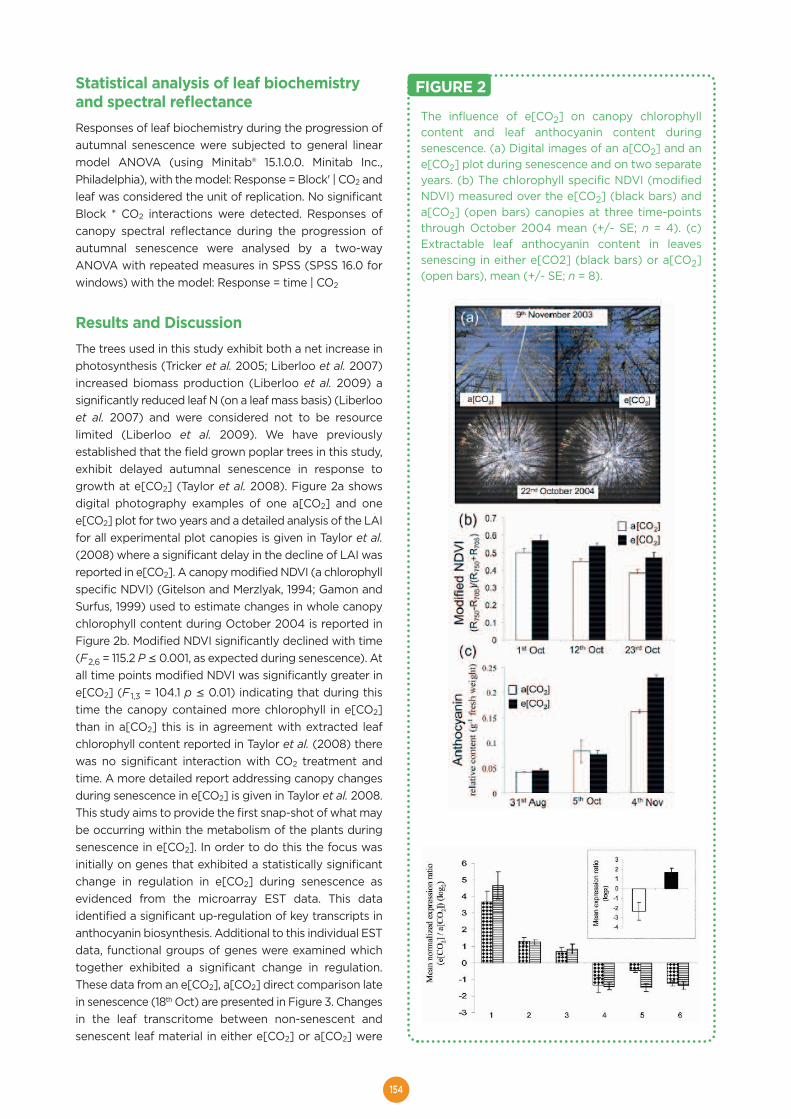
154
Statistical analysis of leaf biochemistryand spectral reflectanceResponses of leaf biochemistry during the progression ofautumnal senescence were subjected to general linearmodel ANOVA (using Minitab® 15.1.0.0. Minitab Inc.,Philadelphia), with the model: Response = Block' | CO2 andleaf was considered the unit of replication. No significantBlock * CO2 interactions were detected. Responses ofcanopy spectral reflectance during the progression ofautumnal senescence were analysed by a two-wayANOVA with repeated measures in SPSS (SPSS 16.0 forwindows) with the model: Response = time | CO2
Results and DiscussionThe trees used in this study exhibit both a net increase inphotosynthesis (Tricker et al. 2005; Liberloo et al. 2007)increased biomass production (Liberloo et al. 2009) asignificantly reduced leaf N (on a leaf mass basis) (Liberlooet al. 2007) and were considered not to be resourcelimited (Liberloo et al. 2009). We have previouslyestablished that the field grown poplar trees in this study,exhibit delayed autumnal senescence in response togrowth at e[CO2] (Taylor et al. 2008). Figure 2a showsdigital photography examples of one a[CO2] and onee[CO2] plot for two years and a detailed analysis of the LAIfor all experimental plot canopies is given in Taylor et al.(2008) where a significant delay in the decline of LAI wasreported in e[CO2]. A canopy modified NDVI (a chlorophyllspecific NDVI) (Gitelson and Merzlyak, 1994; Gamon andSurfus, 1999) used to estimate changes in whole canopychlorophyll content during October 2004 is reported inFigure 2b. Modified NDVI significantly declined with time(F2,6 = 115.2 P≤0.001, as expected during senescence). Atall time points modified NDVI was significantly greater ine[CO2] (F 1,3 = 104.1 p ≤ 0.01) indicating that during thistime the canopy contained more chlorophyll in e[CO2]than in a[CO2] this is in agreement with extracted leafchlorophyll content reported in Taylor et al. (2008) therewas no significant interaction with CO2 treatment andtime. A more detailed report addressing canopy changesduring senescence in e[CO2] is given in Taylor et al. 2008.This study aims to provide the first snap-shot of what maybe occurring within the metabolism of the plants duringsenescence in e[CO2]. In order to do this the focus wasinitially on genes that exhibited a statistically significantchange in regulation in e[CO2] during senescence asevidenced from the microarray EST data. This dataidentified a significant up-regulation of key transcripts inanthocyanin biosynthesis. Additional to this individual ESTdata, functional groups of genes were examined whichtogether exhibited a significant change in regulation.These data from an e[CO2], a[CO2] direct comparison latein senescence (18th Oct) are presented in Figure 3. Changesin the leaf transcritome between non-senescent andsenescent leaf material in either e[CO2] or a[CO2] were
The influence of e[CO2] on canopy chlorophyllcontent and leaf anthocyanin content duringsenescence. (a) Digital images of an a[CO2] and ane[CO2] plot during senescence and on two separateyears. (b) The chlorophyll specific NDVI (modifiedNDVI) measured over the e[CO2] (black bars) anda[CO2] (open bars) canopies at three time-pointsthrough October 2004 mean (+/- SE; n = 4). (c)Extractable leaf anthocyanin content in leavessenescing in either e[CO2] (black bars) or a[CO2](open bars), mean (+/- SE; n = 8).
FIGURE 2
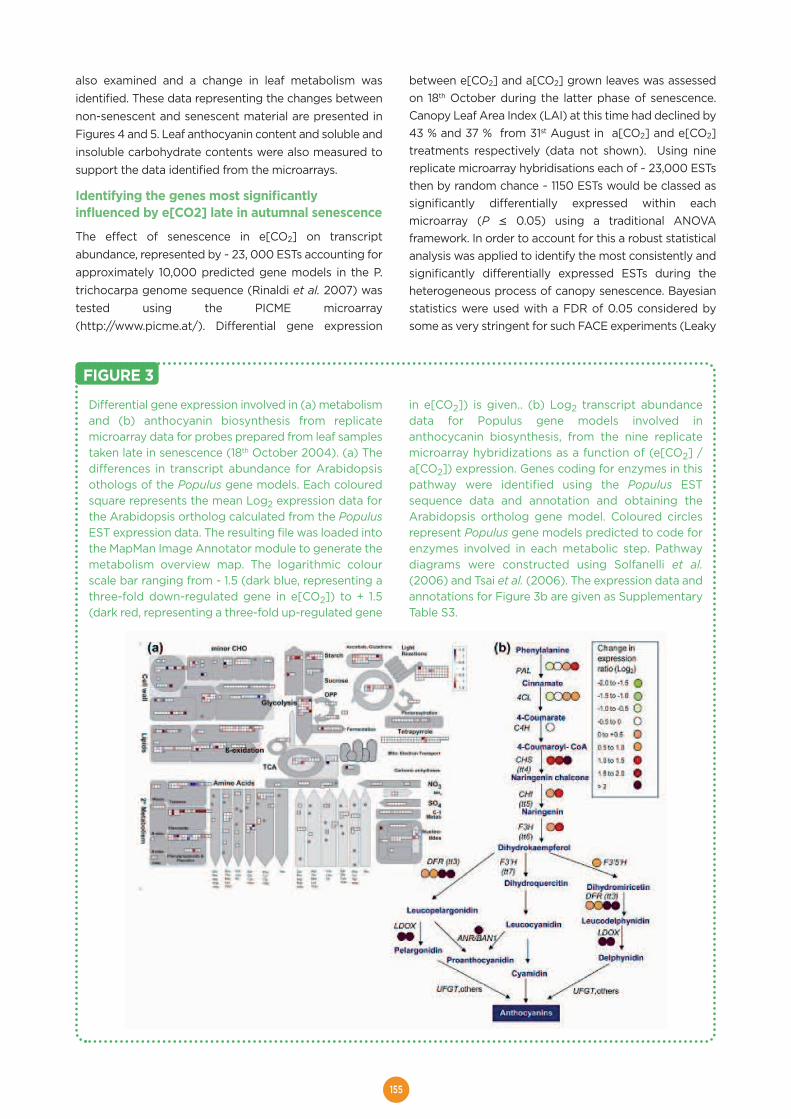
155
also examined and a change in leaf metabolism wasidentified. These data representing the changes betweennon-senescent and senescent material are presented inFigures 4 and 5. Leaf anthocyanin content and soluble andinsoluble carbohydrate contents were also measured tosupport the data identified from the microarrays.
Identifying the genes most significantlyinfluenced by e[CO2] late in autumnal senescence
The effect of senescence in e[CO2] on transcriptabundance, represented by ~ 23, 000 ESTs accounting forapproximately 10,000 predicted gene models in the P.trichocarpa genome sequence (Rinaldi et al. 2007) wastested using the PICME microarray(http://www.picme.at/). Differential gene expression
between e[CO2] and a[CO2] grown leaves was assessedon 18th October during the latter phase of senescence.Canopy Leaf Area Index (LAI) at this time had declined by43 % and 37 % from 31st August in a[CO2] and e[CO2]treatments respectively (data not shown). Using ninereplicate microarray hybridisations each of ~ 23,000 ESTsthen by random chance ~ 1150 ESTs would be classed assignificantly differentially expressed within eachmicroarray (P ≤ 0.05) using a traditional ANOVAframework. In order to account for this a robust statisticalanalysis was applied to identify the most consistently andsignificantly differentially expressed ESTs during theheterogeneous process of canopy senescence. Bayesianstatistics were used with a FDR of 0.05 considered bysome as very stringent for such FACE experiments (Leaky
Differential gene expression involved in (a) metabolismand (b) anthocyanin biosynthesis from replicatemicroarray data for probes prepared from leaf samplestaken late in senescence (18th October 2004). (a) Thedifferences in transcript abundance for Arabidopsisothologs of the Populus gene models. Each colouredsquare represents the mean Log2 expression data forthe Arabidopsis ortholog calculated from the PopulusEST expression data. The resulting file was loaded intothe MapMan Image Annotator module to generate themetabolism overview map. The logarithmic colourscale bar ranging from - 1.5 (dark blue, representing athree-fold down-regulated gene in e[CO2]) to + 1.5(dark red, representing a three-fold up-regulated gene
in e[CO2]) is given.. (b) Log2 transcript abundancedata for Populus gene models involved inanthocycanin biosynthesis, from the nine replicatemicroarray hybridizations as a function of (e[CO2] /a[CO2]) expression. Genes coding for enzymes in thispathway were identified using the Populus ESTsequence data and annotation and obtaining theArabidopsis ortholog gene model. Coloured circlesrepresent Populus gene models predicted to code forenzymes involved in each metabolic step. Pathwaydiagrams were constructed using Solfanelli et al.(2006) and Tsai et al. (2006). The expression data andannotations for Figure 3b are given as SupplementaryTable S3.
FIGURE 3
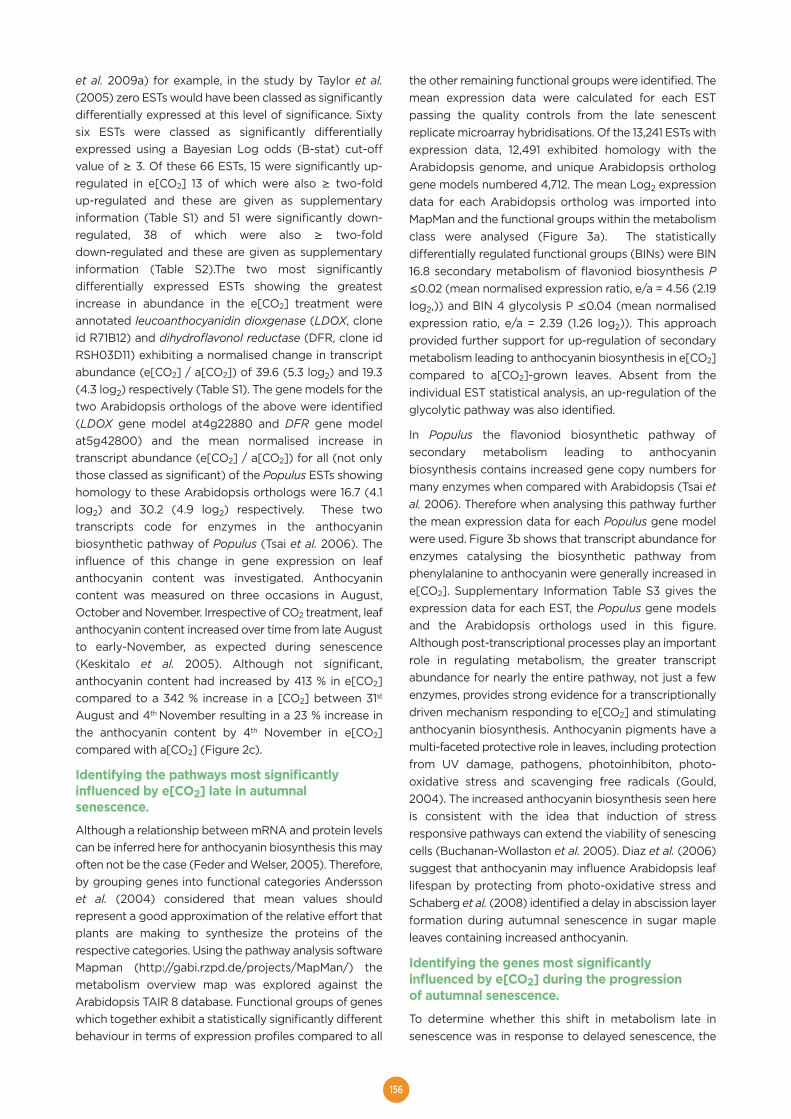
156
et al. 2009a) for example, in the study by Taylor et al.(2005) zero ESTs would have been classed as significantlydifferentially expressed at this level of significance. Sixtysix ESTs were classed as significantly differentiallyexpressed using a Bayesian Log odds (B-stat) cut-offvalue of ≥ 3. Of these 66 ESTs, 15 were significantly up-regulated in e[CO2] 13 of which were also ≥ two-foldup-regulated and these are given as supplementaryinformation (Table S1) and 51 were significantly down-regulated, 38 of which were also ≥ two-folddown-regulated and these are given as supplementaryinformation (Table S2).The two most significantlydifferentially expressed ESTs showing the greatestincrease in abundance in the e[CO2] treatment wereannotated leucoanthocyanidin dioxgenase (LDOX, cloneid R71B12) and dihydroflavonol reductase (DFR, clone idRSH03D11) exhibiting a normalised change in transcriptabundance (e[CO2] / a[CO2]) of 39.6 (5.3 log2) and 19.3(4.3 log2) respectively (Table S1). The gene models for thetwo Arabidopsis orthologs of the above were identified(LDOX gene model at4g22880 and DFR gene modelat5g42800) and the mean normalised increase intranscript abundance (e[CO2] / a[CO2]) for all (not onlythose classed as significant) of the Populus ESTs showinghomology to these Arabidopsis orthologs were 16.7 (4.1log2) and 30.2 (4.9 log2) respectively. These twotranscripts code for enzymes in the anthocyaninbiosynthetic pathway of Populus (Tsai et al. 2006). Theinfluence of this change in gene expression on leafanthocyanin content was investigated. Anthocyanincontent was measured on three occasions in August,October and November. Irrespective of CO2 treatment, leafanthocyanin content increased over time from late Augustto early-November, as expected during senescence(Keskitalo et al. 2005). Although not significant,anthocyanin content had increased by 413 % in e[CO2]compared to a 342 % increase in a [CO2] between 31st
August and 4th November resulting in a 23 % increase inthe anthocyanin content by 4th November in e[CO2]compared with a[CO2] (Figure 2c).
Identifying the pathways most significantlyinfluenced by e[CO2] late in autumnalsenescence.
Although a relationship between mRNA and protein levelscan be inferred here for anthocyanin biosynthesis this mayoften not be the case (Feder and Welser, 2005). Therefore,by grouping genes into functional categories Anderssonet al. (2004) considered that mean values shouldrepresent a good approximation of the relative effort thatplants are making to synthesize the proteins of therespective categories. Using the pathway analysis softwareMapman (http://gabi.rzpd.de/projects/MapMan/) themetabolism overview map was explored against theArabidopsis TAIR 8 database. Functional groups of geneswhich together exhibit a statistically significantly differentbehaviour in terms of expression profiles compared to all
the other remaining functional groups were identified. Themean expression data were calculated for each ESTpassing the quality controls from the late senescentreplicate microarray hybridisations. Of the 13,241 ESTs withexpression data, 12,491 exhibited homology with theArabidopsis genome, and unique Arabidopsis orthologgene models numbered 4,712. The mean Log2 expressiondata for each Arabidopsis ortholog was imported intoMapMan and the functional groups within the metabolismclass were analysed (Figure 3a). The statisticallydifferentially regulated functional groups (BINs) were BIN16.8 secondary metabolism of flavoniod biosynthesis P≤0.02 (mean normalised expression ratio, e/a = 4.56 (2.19log2,)) and BIN 4 glycolysis P ≤0.04 (mean normalisedexpression ratio, e/a = 2.39 (1.26 log2)). This approachprovided further support for up-regulation of secondarymetabolism leading to anthocyanin biosynthesis in e[CO2]compared to a[CO2]-grown leaves. Absent from theindividual EST statistical analysis, an up-regulation of theglycolytic pathway was also identified.
In Populus the flavoniod biosynthetic pathway ofsecondary metabolism leading to anthocyaninbiosynthesis contains increased gene copy numbers formany enzymes when compared with Arabidopsis (Tsai etal. 2006). Therefore when analysing this pathway furtherthe mean expression data for each Populus gene modelwere used. Figure 3b shows that transcript abundance forenzymes catalysing the biosynthetic pathway fromphenylalanine to anthocyanin were generally increased ine[CO2]. Supplementary Information Table S3 gives theexpression data for each EST, the Populus gene modelsand the Arabidopsis orthologs used in this figure.Although post-transcriptional processes play an importantrole in regulating metabolism, the greater transcriptabundance for nearly the entire pathway, not just a fewenzymes, provides strong evidence for a transcriptionallydriven mechanism responding to e[CO2] and stimulatinganthocyanin biosynthesis. Anthocyanin pigments have amulti-faceted protective role in leaves, including protectionfrom UV damage, pathogens, photoinhibiton, photo-oxidative stress and scavenging free radicals (Gould,2004). The increased anthocyanin biosynthesis seen hereis consistent with the idea that induction of stressresponsive pathways can extend the viability of senescingcells (Buchanan-Wollaston et al. 2005). Diaz et al. (2006)suggest that anthocyanin may influence Arabidopsis leaflifespan by protecting from photo-oxidative stress andSchaberg et al. (2008) identified a delay in abscission layerformation during autumnal senescence in sugar mapleleaves containing increased anthocyanin.
Identifying the genes most significantlyinfluenced by e[CO2] during the progressionof autumnal senescence.
To determine whether this shift in metabolism late insenescence was in response to delayed senescence, the
157
changes in leaf transcript abundance and selectedmetabolites during the progress of autumnal senescencewere examined. Differential gene expression between thepre-senescent (31 August) and the senescent canopies (18October) was investigated using RNA from a pre-senescent reference pool, similar to the approach ofAndersson et al. (2004). During senescence in a[CO2]normalised transcript abundance was calculated as (18 Oct/ 31 Aug) and 921 ESTs representing 148 unique Populusgene models were significantly differentially expressed (≥
3 Bvalue and ≥ 2-fold change ) whilst in the e[CO2] treatedcanopies those ESTs significantly differentially expressednumbered 494 representing 49 unique Populus genemodels. These differences are interesting as they suggestthat the senescence transcriptional programme wasdisrupted by the e[CO2] treatment. Using a differentmicroarray platform, Andersson et al. (2004) identified201 ESTs as the most up-regulated during senescence inPopulus tremula and these represent 166 unique Populusgene models, an amount similar to that identified in
Mapman metabolism overview maps showingchanges in transcript abundance during senescencein both e[CO2] and a[CO2] as a function of expressiondata (18 Oct / 31 Aug) within each CO2 environmentfor Arabidopsis othologs of the Populus ESTs. Themean normalised expression ratio (log2) is also givenfor those functional groups that exhibited asignificantly different behaviour in terms of expressionprofiles compared to all the other remaining groups.Figures (a) and (b) represent gene expressionchanges during senescence in a[CO2] and e[CO2]respectively. The logarithmic colour scale bar rangesfrom - 1.5 (dark blue, representing a three-fold down-regulated gene on 18th Oct) to + 1.5 (dark red,representing a three-fold up-regulated gene on 18th
Oct) is given.. The normalized expression values for allESTs classed as significantly differentially expressed
through the process of senescence in e[CO2] arereported in Supplementary Tables 4 and 5 and thoseduring senescence in a[CO2] in Supplementary Tables6 and 7. (c) Ratio for all functional groups classed assignificantly differentially expressed (BenjaminiHochberg corrected Wilcoxon Rank Sum test inMapMan) during senescence in e[CO2] in terms ofexpression profiles compared to all the otherremaining groups. The expression ratio for the samegroup is given for the a[CO2] and P values arereported as * P ≤ 0.05; ** P ≤ 0.01; *** P ≤ 0.001; ****P ≤ 0.0001. Functional groups are annotated inMapMan as: (1) PS. light reactions, (2) Secondarymetabolism. Flavonoids, (3) Secondary metabolism.Phenylpropanoids, (4) Glycolysis, (5) Amino acidmetabolism. Synthesis. aromatic aa. Chorismate, (6)TCA cycle.
FIGURE 4
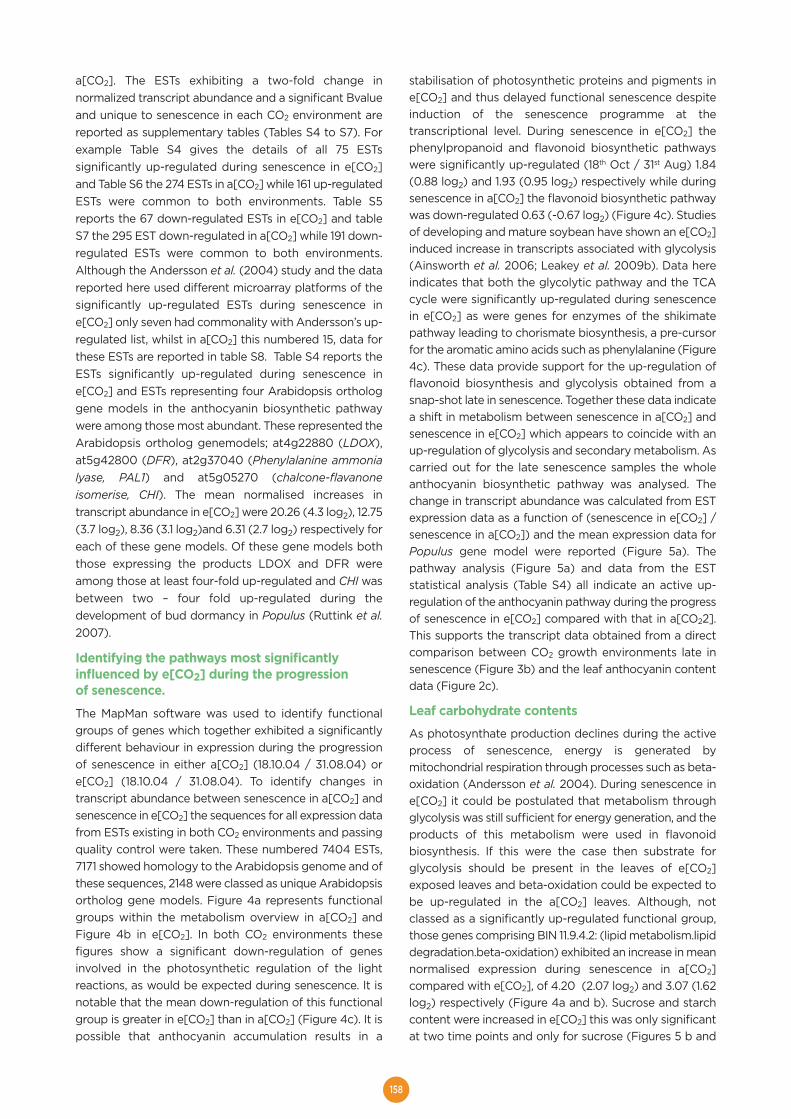
158
a[CO2]. The ESTs exhibiting a two-fold change innormalized transcript abundance and a significant Bvalueand unique to senescence in each CO2 environment arereported as supplementary tables (Tables S4 to S7). Forexample Table S4 gives the details of all 75 ESTssignificantly up-regulated during senescence in e[CO2]and Table S6 the 274 ESTs in a[CO2] while 161 up-regulatedESTs were common to both environments. Table S5reports the 67 down-regulated ESTs in e[CO2] and tableS7 the 295 EST down-regulated in a[CO2] while 191 down-regulated ESTs were common to both environments.Although the Andersson et al. (2004) study and the datareported here used different microarray platforms of thesignificantly up-regulated ESTs during senescence ine[CO2] only seven had commonality with Andersson’s up-regulated list, whilst in a[CO2] this numbered 15, data forthese ESTs are reported in table S8. Table S4 reports theESTs significantly up-regulated during senescence ine[CO2] and ESTs representing four Arabidopsis orthologgene models in the anthocyanin biosynthetic pathwaywere among those most abundant. These represented theArabidopsis ortholog genemodels; at4g22880 (LDOX),at5g42800 (DFR), at2g37040 (Phenylalanine ammonialyase, PAL1) and at5g05270 (chalcone-flavanoneisomerise, CHI). The mean normalised increases intranscript abundance in e[CO2] were 20.26 (4.3 log2), 12.75(3.7 log2), 8.36 (3.1 log2)and 6.31 (2.7 log2) respectively foreach of these gene models. Of these gene models boththose expressing the products LDOX and DFR wereamong those at least four-fold up-regulated and CHI wasbetween two – four fold up-regulated during thedevelopment of bud dormancy in Populus (Ruttink et al.2007).
Identifying the pathways most significantlyinfluenced by e[CO2] during the progressionof senescence.
The MapMan software was used to identify functionalgroups of genes which together exhibited a significantlydifferent behaviour in expression during the progressionof senescence in either a[CO2] (18.10.04 / 31.08.04) ore[CO2] (18.10.04 / 31.08.04). To identify changes intranscript abundance between senescence in a[CO2] andsenescence in e[CO2] the sequences for all expression datafrom ESTs existing in both CO2 environments and passingquality control were taken. These numbered 7404 ESTs,7171 showed homology to the Arabidopsis genome and ofthese sequences, 2148 were classed as unique Arabidopsisortholog gene models. Figure 4a represents functionalgroups within the metabolism overview in a[CO2] andFigure 4b in e[CO2]. In both CO2 environments thesefigures show a significant down-regulation of genesinvolved in the photosynthetic regulation of the lightreactions, as would be expected during senescence. It isnotable that the mean down-regulation of this functionalgroup is greater in e[CO2] than in a[CO2] (Figure 4c). It ispossible that anthocyanin accumulation results in a
stabilisation of photosynthetic proteins and pigments ine[CO2] and thus delayed functional senescence despiteinduction of the senescence programme at thetranscriptional level. During senescence in e[CO2] thephenylpropanoid and flavonoid biosynthetic pathwayswere significantly up-regulated (18th Oct / 31st Aug) 1.84(0.88 log2) and 1.93 (0.95 log2) respectively while duringsenescence in a[CO2] the flavonoid biosynthetic pathwaywas down-regulated 0.63 (-0.67 log2) (Figure 4c). Studiesof developing and mature soybean have shown an e[CO2]induced increase in transcripts associated with glycolysis(Ainsworth et al. 2006; Leakey et al. 2009b). Data hereindicates that both the glycolytic pathway and the TCAcycle were significantly up-regulated during senescencein e[CO2] as were genes for enzymes of the shikimatepathway leading to chorismate biosynthesis, a pre-cursorfor the aromatic amino acids such as phenylalanine (Figure4c). These data provide support for the up-regulation offlavonoid biosynthesis and glycolysis obtained from asnap-shot late in senescence. Together these data indicatea shift in metabolism between senescence in a[CO2] andsenescence in e[CO2] which appears to coincide with anup-regulation of glycolysis and secondary metabolism. Ascarried out for the late senescence samples the wholeanthocyanin biosynthetic pathway was analysed. Thechange in transcript abundance was calculated from ESTexpression data as a function of (senescence in e[CO2] /senescence in a[CO2]) and the mean expression data forPopulus gene model were reported (Figure 5a). Thepathway analysis (Figure 5a) and data from the ESTstatistical analysis (Table S4) all indicate an active up-regulation of the anthocyanin pathway during the progressof senescence in e[CO2] compared with that in a[CO22].This supports the transcript data obtained from a directcomparison between CO2 growth environments late insenescence (Figure 3b) and the leaf anthocyanin contentdata (Figure 2c).
Leaf carbohydrate contents
As photosynthate production declines during the activeprocess of senescence, energy is generated bymitochondrial respiration through processes such as beta-oxidation (Andersson et al. 2004). During senescence ine[CO2] it could be postulated that metabolism throughglycolysis was still sufficient for energy generation, and theproducts of this metabolism were used in flavonoidbiosynthesis. If this were the case then substrate forglycolysis should be present in the leaves of e[CO2]exposed leaves and beta-oxidation could be expected tobe up-regulated in the a[CO2] leaves. Although, notclassed as a significantly up-regulated functional group,those genes comprising BIN 11.9.4.2: (lipid metabolism.lipiddegradation.beta-oxidation) exhibited an increase in meannormalised expression during senescence in a[CO2]compared with e[CO2], of 4.20 (2.07 log2) and 3.07 (1.62log2) respectively (Figure 4a and b). Sucrose and starchcontent were increased in e[CO2] this was only significantat two time points and only for sucrose (Figures 5 b and
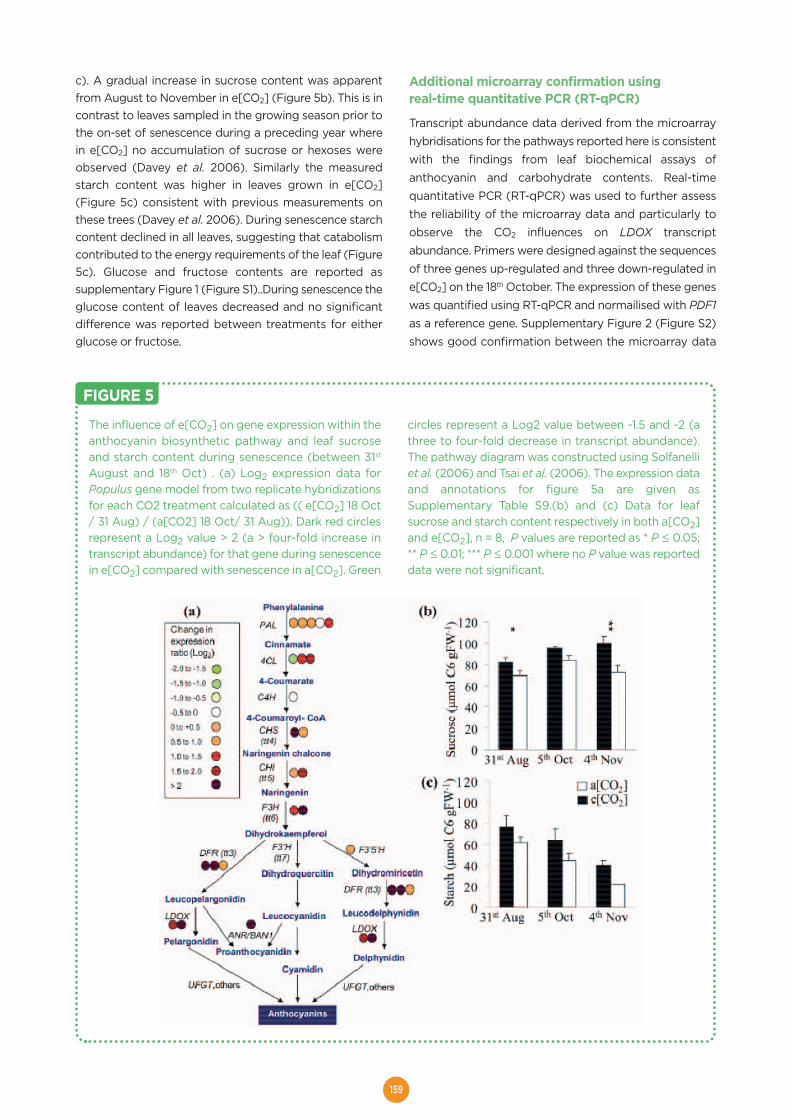
159
c). A gradual increase in sucrose content was apparentfrom August to November in e[CO2] (Figure 5b). This is incontrast to leaves sampled in the growing season prior tothe on-set of senescence during a preceding year wherein e[CO2] no accumulation of sucrose or hexoses wereobserved (Davey et al. 2006). Similarly the measuredstarch content was higher in leaves grown in e[CO2](Figure 5c) consistent with previous measurements onthese trees (Davey et al. 2006). During senescence starchcontent declined in all leaves, suggesting that catabolismcontributed to the energy requirements of the leaf (Figure5c). Glucose and fructose contents are reported assupplementary Figure 1 (Figure S1)..During senescence theglucose content of leaves decreased and no significantdifference was reported between treatments for eitherglucose or fructose.
Additional microarray confirmation usingreal-time quantitative PCR (RT-qPCR)
Transcript abundance data derived from the microarrayhybridisations for the pathways reported here is consistentwith the findings from leaf biochemical assays ofanthocyanin and carbohydrate contents. Real-timequantitative PCR (RT-qPCR) was used to further assessthe reliability of the microarray data and particularly toobserve the CO2 influences on LDOX transcriptabundance. Primers were designed against the sequencesof three genes up-regulated and three down-regulated ine[CO2] on the 18th October. The expression of these geneswas quantified using RT-qPCR and normailised with PDF1as a reference gene. Supplementary Figure 2 (Figure S2)shows good confirmation between the microarray data
The influence of e[CO2] on gene expression within theanthocyanin biosynthetic pathway and leaf sucroseand starch content during senescence (between 31st
August and 18th Oct) . (a) Log2 expression data forPopulus gene model from two replicate hybridizationsfor each CO2 treatment calculated as (( e[CO2] 18 Oct/ 31 Aug) / (a[CO2] 18 Oct/ 31 Aug)). Dark red circlesrepresent a Log2 value > 2 (a > four-fold increase intranscript abundance) for that gene during senescencein e[CO2] compared with senescence in a[CO2]. Green
circles represent a Log2 value between -1.5 and -2 (athree to four-fold decrease in transcript abundance).The pathway diagram was constructed using Solfanelliet al. (2006) and Tsai et al. (2006). The expression dataand annotations for figure 5a are given asSupplementary Table S9.(b) and (c) Data for leafsucrose and starch content respectively in both a[CO2]and e[CO2], n = 8, P values are reported as * P ≤ 0.05;** P ≤ 0.01; *** P ≤ 0.001 where no P value was reporteddata were not significant.
FIGURE 5
160
and those from RT-qPCR. The relative expression of LDOXbetween the late growing season and late senescencesamples was also examined using RT-qPCR. A clear up-regulation of LDOX during senescence in e[CO2] can beseen, with the opposite occurring in a[CO2] (SupportingInformation (Fig S2 inset).
Summary
Once autumnal senescence in Populus is initiated by achange in photoperiod (Olsen et al. 1997; Keskitalo et al.2005; Böhlenius et al. 2006) the balance between reactiveoxygen species (ROS) production and ROS scavengingcan determine the rate of senescence (McKersie et al. 1988;Buchanan-Wollaston et al. 2003; Gepstein et al. 2003). Wehave shown that soluble carbohydrates and starch wereincreased by exposure to e[CO2] at a concentrationpredicted for 2050, and that this may act as a signal tostimulate the synthesis of anthocyanin. This supportsfindings in several contrasting plant species and organsand is supported by work on the mutant pho3 (Lloyd &Zakhleniuk, 2004). In this sucrose-export mutant (pho3)LDOX and DFR were up-regulated by 190 and 31 timesrespectively, again linking leaf sucrose content andanthocyanin biosynthesis. Direct sugar induction ofanthocyanin biosynthesis in Arabidopsis has also beenreported (Teng et al. 2005; Solfanelli et al. 2006).Furthermore, the association between e[CO2] and thepartitioning of carbon to the synthesis of secondarymetabolites was evident in tobacco plants exposed to ane[CO2] of 1000 ppm (Matros et al. 2006). The Matros etal. (2006) study provides evidence for a direct linkbetween e[CO2], an increased leaf C:N ratio and anincreased activity of Phenylalanine ammonia lyase (PAL),a key enzyme catalyzing the first committed step in thebiosynthesis of phenylpropanoids, with a concomitantincrease of secondary metabolites. Long-lived trees, suchas Populus, have evolved strategies for defence, dormancyand wood formation that may not be well represented inthe genomes of annuals such as Arabidopsis. Enzymesinvolved in the flavonoid biosynthetic pathway leading toanthocyanin production are coded by multiple copy genesin Populus and generally single copy genes in Arabidopsisfor example, LDOX and DFR (Tsai et al. 2006). This studyfurther highlights the importance of using Populus as amodel to study natural autumnal senescence (Jansson &Douglas, 2007) and the open-field environment asessential to gain a mechanistic understanding of how treesmay respond in the natural environment (Taylor et al.2005; Sjödin et al. 2008).
In conclusion, we have identified an association betweena delayed autumnal senescence in e[CO2] a change in leafcarbohydrate status, gene expression profiles andanthocyanin content. It is possible that this may be asecondary response to other factors. For example, canopytemperature is often increased during growth in e[CO2] atFACE sites, as is evident for soy bean (Long et al. 2006).Nevertheless the data reported here begin to identify
processes by which climate change can influence plantphenology. Using transcript profiling we identified anumber of genes that changed in expression duringsenescence in an atmosphere enriched with CO2 and themost conspicuous of these were genes involved in thebiosynthetic pathway of anthocyanin; they were stronglyand significantly induced in e[CO2] resulting in anincreased leaf anthocyanin content. The carbohydratecontent of senescing leaves was also increased in e[CO2]and we propose that this provided both a signal and a fuelfor anthocyanin biosynthesis. Additional leaf anthocyaninthen provides increased protection to the senescing leavesin e[CO2] and extends the senescent phase. This CO2
stimulated shift in metabolism is consistent with thegrowth/differentiation balance hypothesis extended byHerms and Matteson (1992) and observed in forest studies(Harding et al. 2005; Mattson et al. 2005; Cseke et al.2009). Evidence from this study allows us to postulate thatexcess carbon in e[CO2] is available to be partitioned tocarbon rich secondary metabolites. These provide aprotective role in senescing leaves, so extending leaflongevity, as the carbon demand from growth declines inthe autumn. We have begun to identify the geneticmechanisms for adaptation to future CO2, but the long-term consequences of such changes for forest ecosystemfunction and micro-evolutionary adaptation remainuncertain.
AcknowledgementsThis research was supported by the European Commissionthrough the Directorate General Research within the FifthFramework for Research – Quality of Life andManagement of the Living Resources Programme,contract number QLK5-CT-2002-00953 (POPYOMICS),coordinated by the University of Southampton. ThePopFACE experiment within the EUROFACE infrastructurewas supported by the EC through its Environment R andD programme within the Fourth Framework as a researchcontract ENV4-CT97-0657 (PopFACE) and within theFifth Framework as contract EVR1-CT-2002-40027(EUROFACE) coordinated by Giuseppe Scarascia-Mugnozza at the University of Viterbo. This research wasalso supported by the Office of Science (BER), USDepartment of Energy, Grant No. DE-FG02-04ER63792,‘POPGENICS’ awarded to GT and DFK. AR was supportedby the US Department of Energy Office of Science grantno. DEFG02-04ER63792 and by contract no. DE-AC02-98CH10886 to Brookhaven National Laboratory. Researchin the laboratory of GT was also supported by the DEFRAproject BEGIN and the Seventh Framework Network ofExcellence, EVOLTREE. The authors thank B Gielen, CCalfapietra, T Oro, GJJ Clarkson, M Pecchiari and CSteynen for help in the field, and LE Graham and J Tuckerfor help with the microarray hybridisations. A Zaldei isthanked for support of the infrastructure at the POPFACEfield site.
161
REFERENCESAinsworth EA, Rogers A, Nelson R and Long SP. 2004.Testing the "source-sink" hypothesis of down-regulationof photosynthesis in elevated [CO2] in the field with singlegene substitutions in Glycine max. Agricultural and ForestMeteorology 122: 85-94Ainsworth EA, Rogers A, Vodkin LO, Walter A & Schurr U.2006. The effects of elevated CO2 concentration onsoybean gene expression. An analysis of growing andmature leaves. Plant Physiology 142: 135-147.Andersson A, Keskitalo J, Sjodin A, Bhalerao R, Sterky F,Wissel K, Tandre K, Aspeborg H, Moyle R, Ohmiya Y et al.2004. A transcriptional timetable of autumn senescence.Genome Biology 5: art. no.-R24.Benjamini Y and Hochberg Y. 1995. Controlling the FalseDiscovery Rate: A Practical and Powerful Approach toMultiple Testing. Journal of the Royal Statistical Society.Series B (Methodological) 57: 289-300.Bryant JB, Taylor G and Frehner M. 1998. Photosyntheticacclimation in chalk grassland herbs exposed to elevatedCO2 in a FACE system. Plant Cell and Environment 21:159-168.Böhlenius H, Huang T, Charbonnel-Campaa L, BrunnerAM, Jansson S, Strauss SH and Nilsson O. 2006. CO/FTregulatory module controls timing of flowering andseasonal growth cessation in trees. Science 312: 1040-1043.Brosché M, Vinocur B, Alatalo ER, Lamminmaki A,Teichmann T, Ottow EA, Djilianov D, Afif D, Bogeat-Triboulot MB, Altman A, Polle A, Dreyer E, Rudd S, Lars P,Auvinen P and Kangasjarvi J. 2005. Gene expression andmetabolite profiling of Populus euphratica growing in theNegev desert. Genome Biology 6: art. no.-R101Buchanan-Wollaston V, Earl S, Harrison E, Mathas E,Navabpour S, Page T and Pink D. 2003. The molecularanalysis of leaf senescence - a genomics approach. PlantBiotechnology Journal 1: 3-22. Buchanan-Wollaston V, Page T, Harrison E, Breeze E, LimPO, Nam HG, Lin J-F, Wu S-H, Swidzinski J, Ishizaki K etal. 2005. Comparartive transcriptome analysis revealssignificant differences in gene expression and signallingpathways between developmental and dark/starvation-induced senescence in Arabidopsis. The Plant Journal 42:567-585.Chang S, Puryear J and Cairney J. 1993. A simple andefficient method for isolating RNA from pine trees. PlantMolecular Biology Reporter 11: 113-116.Chen WJ, Black TA, Yang PC, Barr AG, Neumann HH, NesicZ, Blanken PD, Novak MD, Eley J, Ketler RJ et al. 1999.Effects of climatic variability on the annual carbonsequestration by a boreal aspen forest. Global ChangeBiology 5: 41-53.Cseke LJ, Tsai C-J, Rogers A, Nelson MP, White HL,Karnosky DF, Podila GK. 2009. Transcriptomic comparisonin the leaves of two aspen genotypes having similarcarbon assimilation rates but different allocation patternsunder elevated CO2. New Phytologist. In Press. Davey PA, Olcer H, Zakhleniuk O, Bernacchi CJ,Calfapietra C, Long SP and Raines CA. 2006. Can fast-growing plantation trees escape biochemicaldown-regulation of photosynthesis when grownthroughout their complete production cycle in the openair under elevated carbon dioxide? Plant, Cell andEnvironment 29: 1235 - 1244.
Déjardin A, Leplé J-C, Lesage-Descauses M-C, Costa Gand Pilate G. 2004. Expressed Sequence Tags from poplarwood tissues - A comparative analysis from multiplelibraries. Plant Biology, 6: 55 - 64
Diaz E, Yang YH, Ferreira T, Loh KC, Okazaki Y,Hayashizaki Y, Tessier-Lavingne M, Speed TP, Ngai J.2003. Analysis of gene expression in the developingmouse retina. Proceedings of the National Academy ofSciences, USA 100: 5491–5496.
Diaz C, Saliba-Colombani V, Loudet O, Belluomo P, MoreauL, Daniel-Vedele F, Morot-Gaudry J-F and Masclaux-Daubresse C. 2006. Leaf yellowing and anthocyaninaccumulation are two genetically independent strategiesin response to nitrogen limitation in Arabidopsis thaliana.Plant Cell Physiol. 47: 74-83.
Feder ME and Walser JC. 2005. The biological limitationsof transcriptomics in elucidating stress and stressresponses. Journal of Evolutionary Biology. 18: 901-910
Fracheboud Y, Luquez V, Björkén L, Sjödin A, TuominenH, and Jansson S. 2009. The control of autumnsenescence in European Aspen. Plant Physiology 149:1982-1991
Gamon JA and Surfus JS. 1999. Assessing leaf pigmentcontent and activity with a reflectometer. New Phytologist143: 105-117
Gepstein S, Sabehi G, Carp M-J, Hajouj T, Nesher MFO,Yariv I, Dor C and Bassani M. 2003. Large-scaleidentification of leaf senescence-associated genes. ThePlant Journal 36: 629-642.
Gitelson AA and Merzlyak MN. 1994. Spectral reflectancechanges associated with autumn senescence of Aesculus-Hippocastanum L and Acer-Platanoides L leaves - spectralfeatures and relation to chlorophyll estimation. Journal ofPlant Physiology 143: 286-292
Gould KS. 2004. Natures Swiss army knife: the diverseprotective roles of anthocyanins in leaves. Journal ofBiomedicine and Biotechnology 5: 314-320.
Harding SA, Jiang H, Jeong ML, Casado FL, Lin H-W andTsai C-J. 2005. Functional genomics analysis of foliarcondensed tannin and phenolic glycoside regulation innatural cottonwood hybrids. Tree Physiology 25: 1475-1486.
Herms DA and Mattson WJ. 1992. The dilemma of plants:to grow or defend. The Quarterly Review of Biology 67:283-335.
Herrick JD and Thomas RB. .2003. Leaf senescence andlate-season net photosynthesis of sun and shade leaves ofoverstory sweetgum (Liquidambar styraciflua) grown inelevated and ambient carbon dioxide concentrations. TreePhysiology 23: 109-118.
Ingvarsson PK, Garcia MV, Hall D, Luquez V, Jansson S.2006. Clinal variation in phyB2, a candidate gene for day-lengh induced growth cessation and bud set, across alatitudinal gradient in European aspen (Populus tremula).Genetics 172:1845–1853
Jansson S and Douglas C. 2007. Populus: a model systemfor plant biology. Annual Review of Plant Biology. 58: 435-458.
Keskitalo J, Bergquist G, Gardeström and Jansson S.2005. A cellular timetable of autumnal senescence. PlantPhysiology 139: 1635-1648.
162
Kaschuk G, Hungria M, Leffelaar PA, Giller KE and KuyperTW. 2009. Differences in photosynthetic behaviour andleaf senescence of soybean (Glycine max [L.] Merrill)dependent on N2 fixation or nitrate supply. Plant Biologydoi:10.1111/j.1438-8677.2009.00211.x.
Leakey ADB, Ainsworth EA, Bernard SM, Cody MarkelzRJ, Ort DR, Placella SA, Rogers A, Smith MD, SudderthEA, Weston DJ et al. 2009a. Gene expression profiling:opening the black box of plant ecosystem responses toglobal change. Global Change Biology 15: 1201–1213
Leakey ADB, Xu F, Gillespie KM, McGrath JM, AinsworthEA and Ort DR. 2009b. Genomic basis for stimulatedrespiration by plants growing under elevated carbondioxide. Proceedings of the National Academy of Sciencesof the United States of America, 106, 3597-3602.
Li, J-H, Dijkstra P, Hymus GJ, Wheeler RM, Piastuch WC,Hinkle CR, and Drake BG. 2000. Leaf senescence ofQuercus myrtifolia as affected by long-term CO2
enrichment in its native environment. Global ChangeBiology 6: 727-733.
Liberloo M, Tulva I, Raïm O and Ceulemans R. 2007.Photosynthetic stimulation under long-term CO2
enrichment and fertilization is sustained across a closedPopulus canopy profile (EUROFACE). New Phytologist 173:537-549.
Liberloo M, Lukac M, Calfapietra C, Hoosbeek MR, GielenB, Miglietta F, Scarascia-Mugnozza GE and Ceulemans R.2009. Coppicing shifts CO2 stimulation of poplarproductivity to above-ground pools: a synthesis of leaf tostand level results from the POP/EUROFACE experiment.New Phytologist 182: 331–346
Lloyd JC and Zakhleniuk OV. 2004. Responses of primaryand secondary metabolism to sugar accumulationrevealed by microarray expression analysis of theArabidopsis mutant, pho3. Journal of Experimental Botany55: 1221 - 1230.
Long SP, Ainsworth EA, Leakey ADB, Nösberger J and OrtDR. 2006. Food for thought: lower-than-expected cropyield stimulation with rising CO2 concentrations. Science312: 1918-1921
Lucht W, Prentice CI, Myneni RB, Sitch S, Friedlingstein P,Cramer W, Bousquet P, Buermann W and Smith B. 2002.Climatic control of the high-latitude vegetation greeningtrend and Pinatubo effect. Science 296: 1687-1688.
Martin T, Oswald O, and Graham IA. 2002. Arabidopsisseedling growth, storage lipid mobilization, andphotosynthetic gene expression are regulated by carbon:nitrogen availability. Plant Physiology 128: 472-481.
Matros A, Amme S, Kettig B, Buck-Sorlin GH, SonnewaldU and Mock H-P. 2006. Growth at elevated CO2
concentrations leads to modified profiles of secondarymetabolites in tobacco cv. SamsunNN and to increasedresistance against infection with potato virus Y. Plant, Celland Environment 29: 126-137.
Mattson WJ, Julkunen-Tiitto R and Herms DA. 2005. CO2
enrichment and carbon partitioning to phenolics: do plantresponses accord better with the protein competition orthe growth-differentiation balance models? OIKOS 111:337-347.
McLeod AR and Long SP. 1999. Free-air carbon dioxideenrichment (FACE) in global change research: A review. In:Advances in Ecological Research 28: 1-56.
McKersie BD, Senaratna T, Walker MA, Kendall EJ andHetherington PR. 1988. Deterioration of membranesduring aging in plants: evidence for free radical mediation.In LD Noodén and AC Leopold eds, Senescence and agingin plants. Academic Press Inc. London.
Menzel A, and Fabian P. 1999. Growing season extendedin Europe. Nature 397: 659-659.
Menzel, A, Sparks TH, Estrella N Koch E, Aasa A, Ahas R,Alm-kübler K, Bissolli P, Braslavská O, Briede A et al.2006. European phenological response to climate changematches the warming pattern. Global Change Biology 12:1-8.
Miglietta F, Peressotti A, Vaccari FP, Zaldei A, DeAngelisP and Scarascia-Mugnozza G. 2001. Free-air CO2
enrichment (FACE) of a poplar plantation: the POPFACEfumigation system. New Phytologist 150: 465-476.
Murakami PF, Schaberg PG and Shane JB. 2008. Stemgirdling manipulates leaf sugar concentrations andanthocyanin expression in sugar maple trees duringautumn. Tree Physiology 28: 1467–1473
Myneni RB, Keeling CD, Tucker CJ, Asrar G and NemaniRR. 1997. Increased plant growth in the northern highlatitudes from 1981 to 1991. Nature 386: 698-702.
Olsen JE, Junttila O, Nilsen J, Eriksson ME, Martinussen I,Olsson O, Sandberg G and Moritz T. 1997. Ecotpicexpression of oat phytochrome A in hybrid aspen changescritical daylength for growth and prevents coldacclimatization. The Plant Journal 12: 1339 - 1350.
Park J-Y, Canam T, Kang K-Y, Unda F and Mansfield SD.2009. Sucrose phosphate synthase expression influencespoplar phenology. Tree Physiology 29: 937–946
Parmesan C and Yohe G. 2003. A globally coherentfingerprint of climate change impacts across naturalsystems. Nature 421: 37-42.
Peñuelas J, Rutishauser T, and Filella I. 2009. Phenologyfeedbacks on climate change. Science 324: 887-888
Rae A, Ferris R, Tallis MJ and Taylor G. 2006. Elucidatinggenomic regions determining enhanced leaf growth anddelayed senescence in elevated CO2. Plant, Cell andEnvironment 29: 1730-1741.
Rinaldi C, Kohler A, Frey P, Duchaussoy F, Ningre N,Couloux A, Wincker P, Thiec DL, Fluch S, Martin F et al.2007. Transcript profiling of poplar leaves upon infectionwith compatible and incompatible strains of the foliar rustMelampsora larici-populina. Plant Physiology 144: 347-366.
Ruttink T, Arend M, Morreel K, Storme V, Rombauts S,Fromm J, Bhalerao RP, Boerjan W, and Rohdea A. 2007.A molecular timetable for apical bud formation anddormancy induction in Poplar. The Plant Cell 19: 2370-2390.
Rogers A, Gibon Y, Stitt M, Morgan PB, Bernacchi CJ, OrtDR, Long SP. 2006. Increased carbon availability atelevated carbon dioxide concentration improves nitrogenassimilation in a legume. Plant, Cell & Environment. 29:1651-1658.
Scarascia-Mugnozza G, Calfapietra C, Ceulemans R,Gielen B, Cotrufo MF, De Angelis P, Godbold D, HoosbeekMR, Kull O, Lukac M et al. 2006. Responses to elevated[CO2] of a short rotation, multispecies poplar plantation:the POPFACE / EUROFACE experiment. In: Nösberger J,Long SP, Norby RJ, Stitt M, Hendrey GR and Blum H, eds.Ecological Studies, Vol. 187. Managed ecosystems and CO2
163
Case studies, processes and perspectives. Springer-Verlag,Berlin Heidelberg, 173-195.
Schaberg PG, Murakami PF, Turner MR, Heitz HK andHawley GJ. 2008. Association of red coloration withsenescence of sugar maple leaves in autumn. Trees 22:573–578
Sigurdsson BD. 2001. Elevated CO2 and nutrient statusmodified leaf phenology and growth rhythm of youngPopulus trichocarpa trees in a 3-year field study. Trees-Structure and Function 15: 403-413.
Sjödin A, Wissel K, Bylesjö M, Trygg J and Jansson S.2008. Global expression profiling in leaves of free-growingaspen. BMC Plant Biology 8:61
Sjödin A, Street NR, Sandberg G, Gustafsson P, JanssonS. 2009. The Populus Genome Integrative Explorer(PopGenIE): a new resource for exploring the Populusgenome. New Phytologist 182: 1013–1025
Smyth G K. 2004. Linear models and empirical Bayesmethods for assessing differential expression in microarrayexperiments. Statistical Applications in Genetics andMolecular Biology 3: No. 1, Article 3
Solfanelli C, Poggi A, Loreti E, Alpi A and Perata P. 2006.Sucrose-specific induction of the anthocyanin biosyntheticpathway in Arabidopsis. Plant Physiology 140: 637-646.
Street NR, Tucker J, Brosché M, Kangasjärvi J,Broadmeadow M, Taylor G. 2009. A genetical genomicsapproach to understand ozone sensitivity in Populus.Environmental pollution, In press.
Taylor G. 2002. Populus. Arabidopsis for forestry. Do weneed a model tree? Annals of Botany 90: 681-689.
Taylor G, Street NR, Tricker PJ, Sjodin A, Graham L,Skogstrom O, Calfapietra C, Scarascia-Mugnozza G andJansson S. 2005. The transcriptome of Populus in elevatedCO2. New Phytologist 167: 143-154.
Taylor G, Tallis MJ, Giardina CP, Percy KE, Miglietta F,Gupta PS, Gioli B, Calfapietra C, Gielen B, Kubiske ME etal. 2008. Future atmospheric CO2 leads to delayed
autumnal senescence in Populus over two continents.Global Change Biology 14: 264-275.
Teng S, Keurentjes J, Bentsink L, Koornneef M andSmeekens S. 2005. Sucrose-specific induction ofanthocyanin biosynthesis in Arabidopsis requires theMYB75/PAP1 gene. Plant Physiology 139: 1840-1852.
Thimm O, Bläsing O, Gibon Y, Nagel A, Meyer S, Krüger P,Selbig J, Müller L, Rhee SYMS. 2004. MAPMAN: a user-driven tool to display genomics data sets onto diagramsof metabolic pathways and other biological processes.Plant Journal 37: 914–939
Tricker PJ, Trewin H, Kull O, Clarkson GJJ, Eensalu E, TallisMJ, Colella A, Doncaster CP, Sabatti M and Taylor G .2005.Stomatal conductance and not stomatal densitydetermines the long-term reduction in leaf transpiration ofpoplar in elevated CO2. Oecologia 143: 652-660
Tsai C-J, Harding SA, Tschaplinski TJ, Lindroth RL andYuan Y. 2006. Genome-wide analysis of the structuralgenes regulating defense phenylpropanoid metabolism inPopulus. New Phytologist 172: 47-62.
Tuskan GA, Difazio S, Jansson S, Bohlmann J, Grigoriev I,Hellsten U, Putnam N, Ralph S, Rombauts S, Salamov A etal. 2006. The genome of black cottonwood, Populustrichocarpa (Torr. & Gray). Science 313: 1596–1604.
Wingler A, Mares M and Pourtau N. 2004. Spatial patternsand metabolic regulation of photosynthetic parametersduring leaf senescence. New Phytologist 161: 781-789.
Wingler A, Purdy S, MacLean JA and Pourtau N. 2006.The role of sugars in integrating environmental signalsduring the regulation of leaf senescence. Journal ofExperimental Botany 57: 391–399.
Zhou L, Tucker C J, Kaufmann RK, Slayback D, ShabanovNV and Myneni RB. 2001. Variations in northernvegetation activity infrerred from satellite data ofvegetation index during 1981 to 1999. Journal ofGeophysical Research 106: 20069-20083.
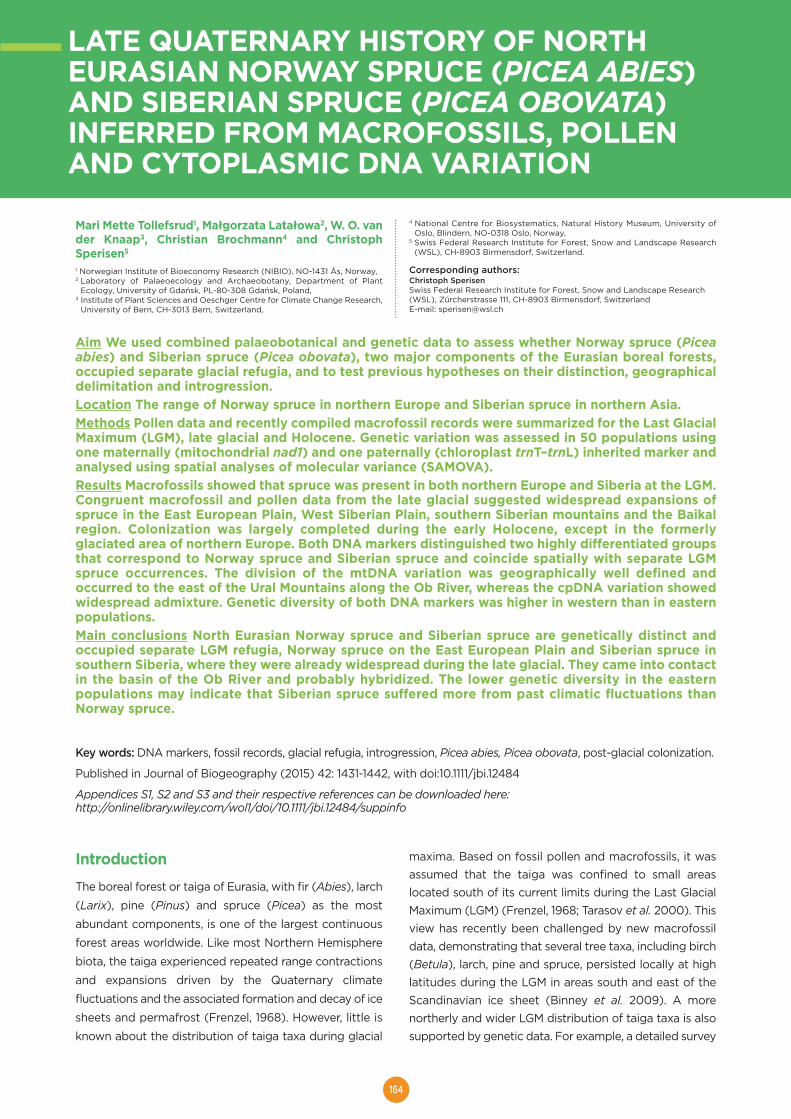
164
LATE QUATERNARY HISTORY OF NORTHEURASIAN NORWAY SPRUCE (PICEA ABIES)AND SIBERIAN SPRUCE (PICEA OBOVATA)INFERRED FROM MACROFOSSILS, POLLENAND CYTOPLASMIC DNA VARIATION
Mari Mette Tollefsrud1, Małgorzata Latałowa2, W. O. vander Knaap3, Christian Brochmann4 and ChristophSperisen5
1 Norwegian Institute of Bioeconomy Research (NIBIO), NO-1431 Ås, Norway,2 Laboratory of Palaeoecology and Archaeobotany, Department of Plant
Ecology, University of Gdańsk, PL-80-308 Gdańsk, Poland,3 Institute of Plant Sciences and Oeschger Centre for Climate Change Research,
University of Bern, CH-3013 Bern, Switzerland,
4 National Centre for Biosystematics, Natural History Museum, University ofOslo, Blindern, NO-0318 Oslo, Norway,
5 Swiss Federal Research Institute for Forest, Snow and Landscape Research(WSL), CH-8903 Birmensdorf, Switzerland.
Corresponding authors:Christoph SperisenSwiss Federal Research Institute for Forest, Snow and Landscape Research(WSL), Zürcherstrasse 111, CH-8903 Birmensdorf, SwitzerlandE-mail: [email protected]
Introduction
The boreal forest or taiga of Eurasia, with fir (Abies), larch
(Larix), pine (Pinus) and spruce (Picea) as the most
abundant components, is one of the largest continuous
forest areas worldwide. Like most Northern Hemisphere
biota, the taiga experienced repeated range contractions
and expansions driven by the Quaternary climate
fluctuations and the associated formation and decay of ice
sheets and permafrost (Frenzel, 1968). However, little is
known about the distribution of taiga taxa during glacial
maxima. Based on fossil pollen and macrofossils, it wasassumed that the taiga was confined to small areaslocated south of its current limits during the Last GlacialMaximum (LGM) (Frenzel, 1968; Tarasov et al. 2000). Thisview has recently been challenged by new macrofossildata, demonstrating that several tree taxa, including birch(Betula), larch, pine and spruce, persisted locally at highlatitudes during the LGM in areas south and east of theScandinavian ice sheet (Binney et al. 2009). A morenortherly and wider LGM distribution of taiga taxa is alsosupported by genetic data. For example, a detailed survey
Aim We used combined palaeobotanical and genetic data to assess whether Norway spruce (Piceaabies) and Siberian spruce (Picea obovata), two major components of the Eurasian boreal forests,occupied separate glacial refugia, and to test previous hypotheses on their distinction, geographicaldelimitation and introgression.Location The range of Norway spruce in northern Europe and Siberian spruce in northern Asia.Methods Pollen data and recently compiled macrofossil records were summarized for the Last GlacialMaximum (LGM), late glacial and Holocene. Genetic variation was assessed in 50 populations usingone maternally (mitochondrial nad1) and one paternally (chloroplast trnT–trnL) inherited marker andanalysed using spatial analyses of molecular variance (SAMOVA).Results Macrofossils showed that spruce was present in both northern Europe and Siberia at the LGM.Congruent macrofossil and pollen data from the late glacial suggested widespread expansions ofspruce in the East European Plain, West Siberian Plain, southern Siberian mountains and the Baikalregion. Colonization was largely completed during the early Holocene, except in the formerlyglaciated area of northern Europe. Both DNA markers distinguished two highly differentiated groupsthat correspond to Norway spruce and Siberian spruce and coincide spatially with separate LGMspruce occurrences. The division of the mtDNA variation was geographically well defined andoccurred to the east of the Ural Mountains along the Ob River, whereas the cpDNA variation showedwidespread admixture. Genetic diversity of both DNA markers was higher in western than in easternpopulations.Main conclusions North Eurasian Norway spruce and Siberian spruce are genetically distinct andoccupied separate LGM refugia, Norway spruce on the East European Plain and Siberian spruce insouthern Siberia, where they were already widespread during the late glacial. They came into contactin the basin of the Ob River and probably hybridized. The lower genetic diversity in the easternpopulations may indicate that Siberian spruce suffered more from past climatic fluctuations thanNorway spruce.
Key words: DNA markers, fossil records, glacial refugia, introgression, Picea abies, Picea obovata, post-glacial colonization.
Published in Journal of Biogeography (2015) 42: 1431-1442, with doi:10.1111/jbi.12484
Appendices S1, S2 and S3 and their respective references can be downloaded here:http://onlinelibrary.wiley.com/wol1/doi/10.1111/jbi.12484/suppinfo
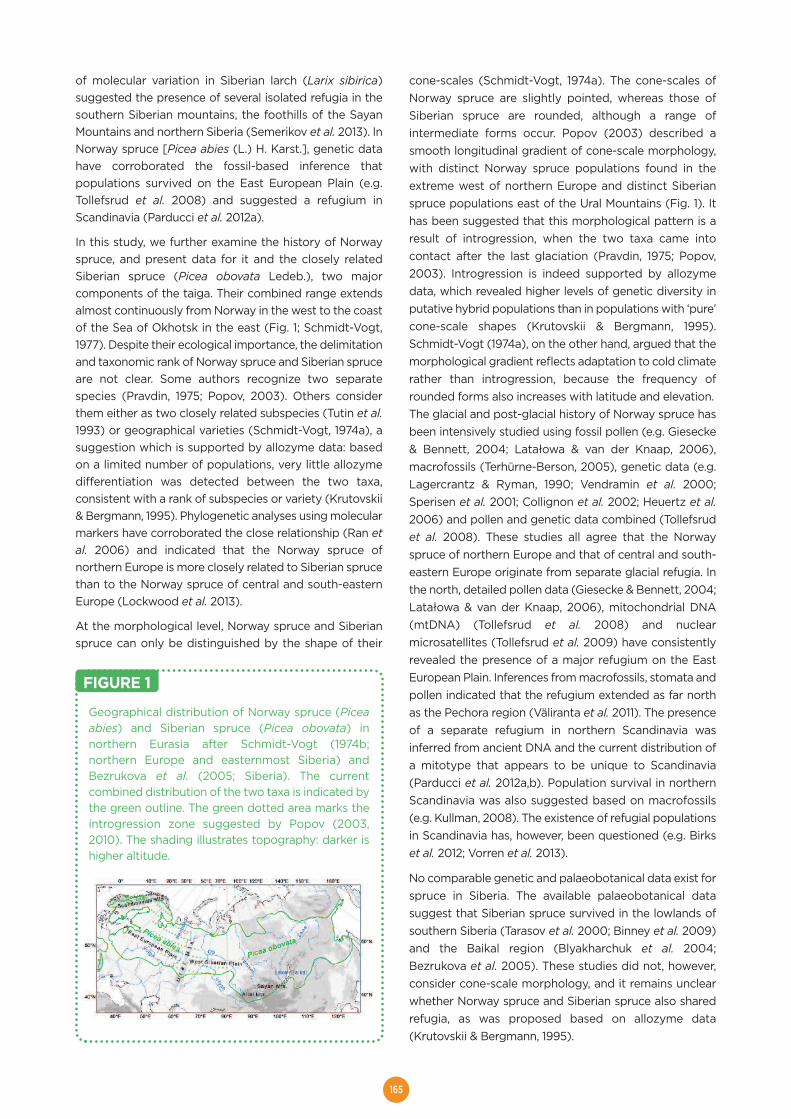
165
of molecular variation in Siberian larch (Larix sibirica)suggested the presence of several isolated refugia in thesouthern Siberian mountains, the foothills of the SayanMountains and northern Siberia (Semerikov et al. 2013). InNorway spruce [Picea abies (L.) H. Karst.], genetic datahave corroborated the fossil-based inference thatpopulations survived on the East European Plain (e.g.Tollefsrud et al. 2008) and suggested a refugium inScandinavia (Parducci et al. 2012a).
In this study, we further examine the history of Norwayspruce, and present data for it and the closely relatedSiberian spruce (Picea obovata Ledeb.), two majorcomponents of the taiga. Their combined range extendsalmost continuously from Norway in the west to the coastof the Sea of Okhotsk in the east (Fig. 1; Schmidt-Vogt,1977). Despite their ecological importance, the delimitationand taxonomic rank of Norway spruce and Siberian spruceare not clear. Some authors recognize two separatespecies (Pravdin, 1975; Popov, 2003). Others considerthem either as two closely related subspecies (Tutin et al.1993) or geographical varieties (Schmidt-Vogt, 1974a), asuggestion which is supported by allozyme data: basedon a limited number of populations, very little allozymedifferentiation was detected between the two taxa,consistent with a rank of subspecies or variety (Krutovskii& Bergmann, 1995). Phylogenetic analyses using molecularmarkers have corroborated the close relationship (Ran etal. 2006) and indicated that the Norway spruce ofnorthern Europe is more closely related to Siberian sprucethan to the Norway spruce of central and south-easternEurope (Lockwood et al. 2013).
At the morphological level, Norway spruce and Siberianspruce can only be distinguished by the shape of their
cone-scales (Schmidt-Vogt, 1974a). The cone-scales ofNorway spruce are slightly pointed, whereas those ofSiberian spruce are rounded, although a range ofintermediate forms occur. Popov (2003) described asmooth longitudinal gradient of cone-scale morphology,with distinct Norway spruce populations found in theextreme west of northern Europe and distinct Siberianspruce populations east of the Ural Mountains (Fig. 1). Ithas been suggested that this morphological pattern is aresult of introgression, when the two taxa came intocontact after the last glaciation (Pravdin, 1975; Popov,2003). Introgression is indeed supported by allozymedata, which revealed higher levels of genetic diversity inputative hybrid populations than in populations with ‘pure’cone-scale shapes (Krutovskii & Bergmann, 1995).Schmidt-Vogt (1974a), on the other hand, argued that themorphological gradient reflects adaptation to cold climaterather than introgression, because the frequency ofrounded forms also increases with latitude and elevation.The glacial and post-glacial history of Norway spruce hasbeen intensively studied using fossil pollen (e.g. Giesecke& Bennett, 2004; Latałowa & van der Knaap, 2006),macrofossils (Terhürne-Berson, 2005), genetic data (e.g.Lagercrantz & Ryman, 1990; Vendramin et al. 2000;Sperisen et al. 2001; Collignon et al. 2002; Heuertz et al.2006) and pollen and genetic data combined (Tollefsrudet al. 2008). These studies all agree that the Norwayspruce of northern Europe and that of central and south-eastern Europe originate from separate glacial refugia. Inthe north, detailed pollen data (Giesecke & Bennett, 2004;Latałowa & van der Knaap, 2006), mitochondrial DNA(mtDNA) (Tollefsrud et al. 2008) and nuclearmicrosatellites (Tollefsrud et al. 2009) have consistentlyrevealed the presence of a major refugium on the EastEuropean Plain. Inferences from macrofossils, stomata andpollen indicated that the refugium extended as far northas the Pechora region (Väliranta et al. 2011). The presenceof a separate refugium in northern Scandinavia wasinferred from ancient DNA and the current distribution ofa mitotype that appears to be unique to Scandinavia(Parducci et al. 2012a,b). Population survival in northernScandinavia was also suggested based on macrofossils(e.g. Kullman, 2008). The existence of refugial populationsin Scandinavia has, however, been questioned (e.g. Birkset al. 2012; Vorren et al. 2013).
No comparable genetic and palaeobotanical data exist forspruce in Siberia. The available palaeobotanical datasuggest that Siberian spruce survived in the lowlands ofsouthern Siberia (Tarasov et al. 2000; Binney et al. 2009)and the Baikal region (Blyakharchuk et al. 2004;Bezrukova et al. 2005). These studies did not, however,consider cone-scale morphology, and it remains unclearwhether Norway spruce and Siberian spruce also sharedrefugia, as was proposed based on allozyme data(Krutovskii & Bergmann, 1995).
Geographical distribution of Norway spruce (Piceaabies) and Siberian spruce (Picea obovata) innorthern Eurasia after Schmidt-Vogt (1974b;northern Europe and easternmost Siberia) andBezrukova et al. (2005; Siberia). The currentcombined distribution of the two taxa is indicated bythe green outline. The green dotted area marks theintrogression zone suggested by Popov (2003,2010). The shading illustrates topography: darker ishigher altitude.
FIGURE 1
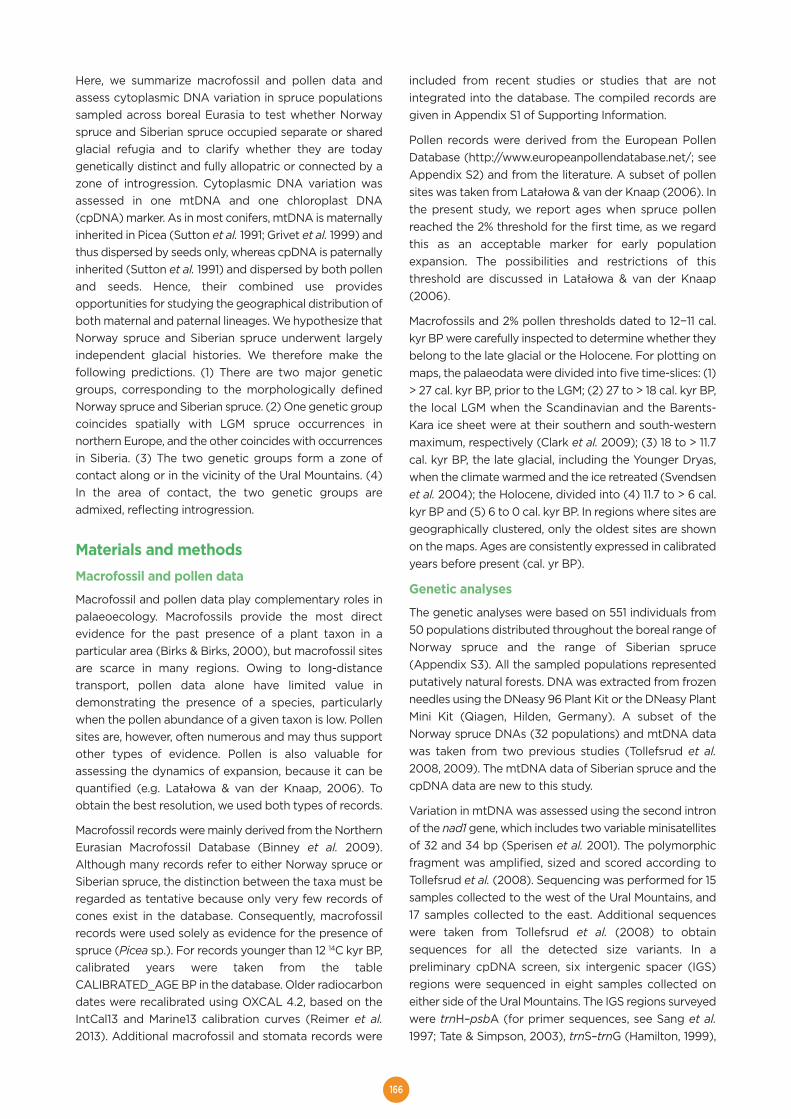
166
Here, we summarize macrofossil and pollen data andassess cytoplasmic DNA variation in spruce populationssampled across boreal Eurasia to test whether Norwayspruce and Siberian spruce occupied separate or sharedglacial refugia and to clarify whether they are todaygenetically distinct and fully allopatric or connected by azone of introgression. Cytoplasmic DNA variation wasassessed in one mtDNA and one chloroplast DNA(cpDNA) marker. As in most conifers, mtDNA is maternallyinherited in Picea (Sutton et al. 1991; Grivet et al. 1999) andthus dispersed by seeds only, whereas cpDNA is paternallyinherited (Sutton et al. 1991) and dispersed by both pollenand seeds. Hence, their combined use providesopportunities for studying the geographical distribution ofboth maternal and paternal lineages. We hypothesize thatNorway spruce and Siberian spruce underwent largelyindependent glacial histories. We therefore make thefollowing predictions. (1) There are two major geneticgroups, corresponding to the morphologically definedNorway spruce and Siberian spruce. (2) One genetic groupcoincides spatially with LGM spruce occurrences innorthern Europe, and the other coincides with occurrencesin Siberia. (3) The two genetic groups form a zone ofcontact along or in the vicinity of the Ural Mountains. (4)In the area of contact, the two genetic groups areadmixed, reflecting introgression.
Materials and methodsMacrofossil and pollen data
Macrofossil and pollen data play complementary roles inpalaeoecology. Macrofossils provide the most directevidence for the past presence of a plant taxon in aparticular area (Birks & Birks, 2000), but macrofossil sitesare scarce in many regions. Owing to long-distancetransport, pollen data alone have limited value indemonstrating the presence of a species, particularlywhen the pollen abundance of a given taxon is low. Pollensites are, however, often numerous and may thus supportother types of evidence. Pollen is also valuable forassessing the dynamics of expansion, because it can bequantified (e.g. Latałowa & van der Knaap, 2006). Toobtain the best resolution, we used both types of records.
Macrofossil records were mainly derived from the NorthernEurasian Macrofossil Database (Binney et al. 2009).Although many records refer to either Norway spruce orSiberian spruce, the distinction between the taxa must beregarded as tentative because only very few records ofcones exist in the database. Consequently, macrofossilrecords were used solely as evidence for the presence ofspruce (Picea sp.). For records younger than 12 14C kyr BP,calibrated years were taken from the tableCALIBRATED_AGE BP in the database. Older radiocarbondates were recalibrated using OXCAL 4.2, based on theIntCal13 and Marine13 calibration curves (Reimer et al.2013). Additional macrofossil and stomata records were
included from recent studies or studies that are notintegrated into the database. The compiled records aregiven in Appendix S1 of Supporting Information.
Pollen records were derived from the European PollenDatabase (http://www.europeanpollendatabase.net/; seeAppendix S2) and from the literature. A subset of pollensites was taken from Latałowa & van der Knaap (2006). Inthe present study, we report ages when spruce pollenreached the 2% threshold for the first time, as we regardthis as an acceptable marker for early populationexpansion. The possibilities and restrictions of thisthreshold are discussed in Latałowa & van der Knaap(2006).
Macrofossils and 2% pollen thresholds dated to 12−11 cal.kyr BP were carefully inspected to determine whether theybelong to the late glacial or the Holocene. For plotting onmaps, the palaeodata were divided into five time-slices: (1)> 27 cal. kyr BP, prior to the LGM; (2) 27 to > 18 cal. kyr BP,the local LGM when the Scandinavian and the Barents-Kara ice sheet were at their southern and south-westernmaximum, respectively (Clark et al. 2009); (3) 18 to > 11.7cal. kyr BP, the late glacial, including the Younger Dryas,when the climate warmed and the ice retreated (Svendsenet al. 2004); the Holocene, divided into (4) 11.7 to > 6 cal.kyr BP and (5) 6 to 0 cal. kyr BP. In regions where sites aregeographically clustered, only the oldest sites are shownon the maps. Ages are consistently expressed in calibratedyears before present (cal. yr BP).
Genetic analyses
The genetic analyses were based on 551 individuals from50 populations distributed throughout the boreal range ofNorway spruce and the range of Siberian spruce(Appendix S3). All the sampled populations representedputatively natural forests. DNA was extracted from frozenneedles using the DNeasy 96 Plant Kit or the DNeasy PlantMini Kit (Qiagen, Hilden, Germany). A subset of theNorway spruce DNAs (32 populations) and mtDNA datawas taken from two previous studies (Tollefsrud et al.2008, 2009). The mtDNA data of Siberian spruce and thecpDNA data are new to this study.
Variation in mtDNA was assessed using the second intronof the nad1 gene, which includes two variable minisatellitesof 32 and 34 bp (Sperisen et al. 2001). The polymorphicfragment was amplified, sized and scored according toTollefsrud et al. (2008). Sequencing was performed for 15samples collected to the west of the Ural Mountains, and17 samples collected to the east. Additional sequenceswere taken from Tollefsrud et al. (2008) to obtainsequences for all the detected size variants. In apreliminary cpDNA screen, six intergenic spacer (IGS)regions were sequenced in eight samples collected oneither side of the Ural Mountains. The IGS regions surveyedwere trnH–psbA (for primer sequences, see Sang et al.1997; Tate & Simpson, 2003), trnS–trnG (Hamilton, 1999),
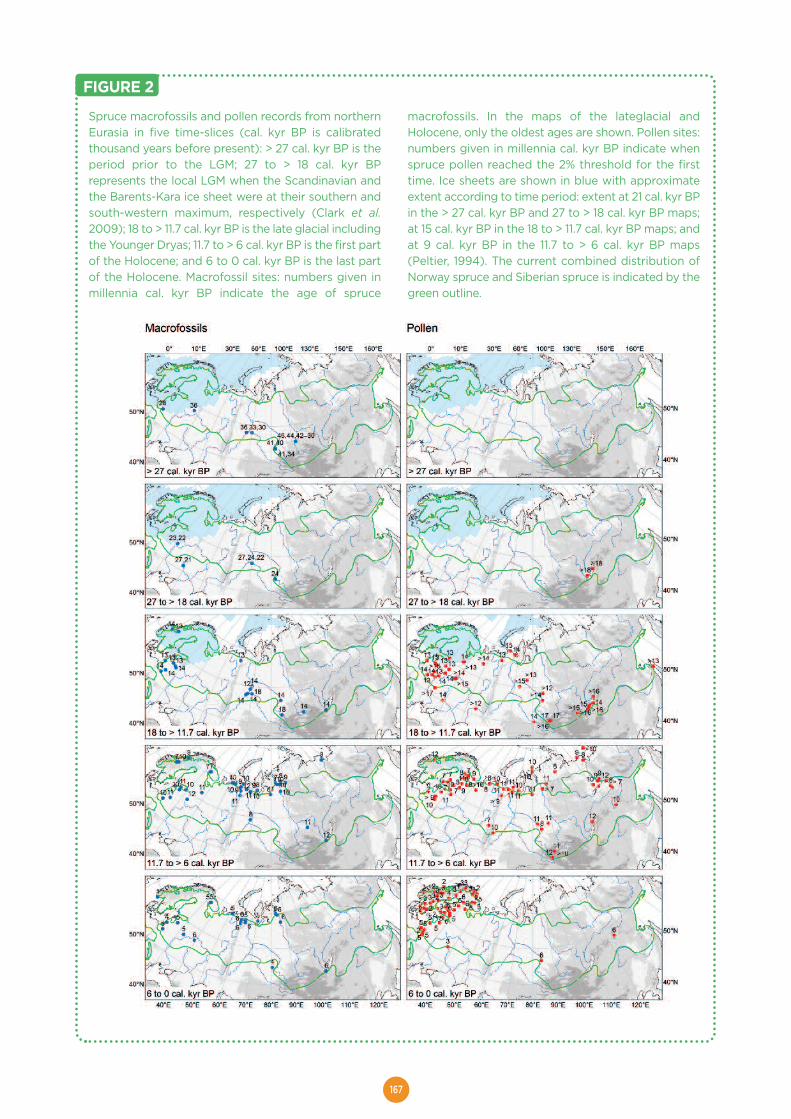
167
Spruce macrofossils and pollen records from northernEurasia in five time-slices (cal. kyr BP is calibratedthousand years before present): > 27 cal. kyr BP is theperiod prior to the LGM; 27 to > 18 cal. kyr BPrepresents the local LGM when the Scandinavian andthe Barents-Kara ice sheet were at their southern andsouth-western maximum, respectively (Clark et al.2009); 18 to > 11.7 cal. kyr BP is the late glacial includingthe Younger Dryas; 11.7 to > 6 cal. kyr BP is the first partof the Holocene; and 6 to 0 cal. kyr BP is the last partof the Holocene. Macrofossil sites: numbers given inmillennia cal. kyr BP indicate the age of spruce
macrofossils. In the maps of the lateglacial andHolocene, only the oldest ages are shown. Pollen sites:numbers given in millennia cal. kyr BP indicate whenspruce pollen reached the 2% threshold for the firsttime. Ice sheets are shown in blue with approximateextent according to time period: extent at 21 cal. kyr BPin the > 27 cal. kyr BP and 27 to > 18 cal. kyr BP maps;at 15 cal. kyr BP in the 18 to > 11.7 cal. kyr BP maps; andat 9 cal. kyr BP in the 11.7 to > 6 cal. kyr BP maps(Peltier, 1994). The current combined distribution ofNorway spruce and Siberian spruce is indicated by thegreen outline.
FIGURE 2
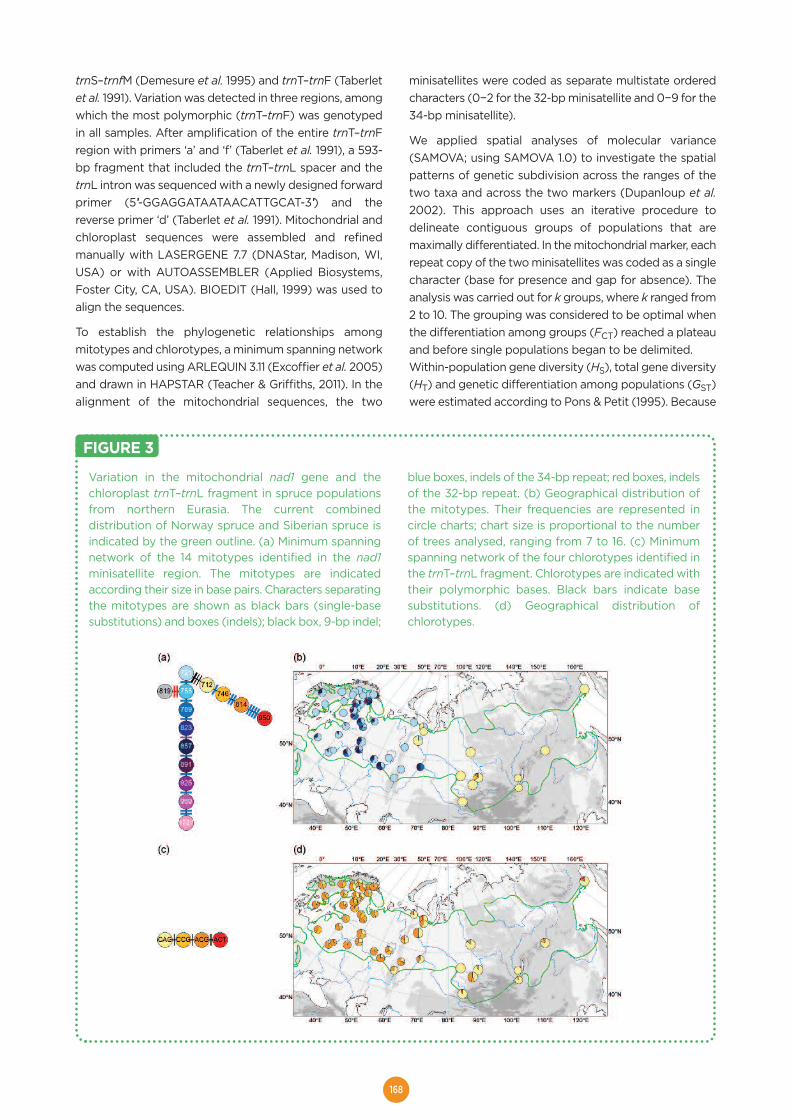
168
trnS–trnfM (Demesure et al. 1995) and trnT–trnF (Taberletet al. 1991). Variation was detected in three regions, amongwhich the most polymorphic (trnT–trnF) was genotypedin all samples. After amplification of the entire trnT–trnFregion with primers ‘a’ and ‘f’ (Taberlet et al. 1991), a 593-bp fragment that included the trnT–trnL spacer and thetrnL intron was sequenced with a newly designed forwardprimer (5′-GGAGGATAATAACATTGCAT-3′) and thereverse primer ‘d’ (Taberlet et al. 1991). Mitochondrial andchloroplast sequences were assembled and refinedmanually with LASERGENE 7.7 (DNAStar, Madison, WI,USA) or with AUTOASSEMBLER (Applied Biosystems,Foster City, CA, USA). BIOEDIT (Hall, 1999) was used toalign the sequences.
To establish the phylogenetic relationships amongmitotypes and chlorotypes, a minimum spanning networkwas computed using ARLEQUIN 3.11 (Excoffier et al. 2005)and drawn in HAPSTAR (Teacher & Griffiths, 2011). In thealignment of the mitochondrial sequences, the two
minisatellites were coded as separate multistate orderedcharacters (0−2 for the 32-bp minisatellite and 0−9 for the34-bp minisatellite).
We applied spatial analyses of molecular variance(SAMOVA; using SAMOVA 1.0) to investigate the spatialpatterns of genetic subdivision across the ranges of thetwo taxa and across the two markers (Dupanloup et al.2002). This approach uses an iterative procedure todelineate contiguous groups of populations that aremaximally differentiated. In the mitochondrial marker, eachrepeat copy of the two minisatellites was coded as a singlecharacter (base for presence and gap for absence). Theanalysis was carried out for k groups, where k ranged from2 to 10. The grouping was considered to be optimal whenthe differentiation among groups (FCT) reached a plateauand before single populations began to be delimited.Within-population gene diversity (HS), total gene diversity(HT) and genetic differentiation among populations (GST)were estimated according to Pons & Petit (1995). Because
Variation in the mitochondrial nad1 gene and thechloroplast trnT–trnL fragment in spruce populationsfrom northern Eurasia. The current combineddistribution of Norway spruce and Siberian spruce isindicated by the green outline. (a) Minimum spanningnetwork of the 14 mitotypes identified in the nad1minisatellite region. The mitotypes are indicatedaccording their size in base pairs. Characters separatingthe mitotypes are shown as black bars (single-basesubstitutions) and boxes (indels); black box, 9-bp indel;
blue boxes, indels of the 34-bp repeat; red boxes, indelsof the 32-bp repeat. (b) Geographical distribution ofthe mitotypes. Their frequencies are represented incircle charts; chart size is proportional to the numberof trees analysed, ranging from 7 to 16. (c) Minimumspanning network of the four chlorotypes identified inthe trnT–trnL fragment. Chlorotypes are indicated withtheir polymorphic bases. Black bars indicate basesubstitutions. (d) Geographical distribution ofchlorotypes.
FIGURE 3
169
genetic differentiation depends on the level of variation,the standardized genetic differentiation was calculated asG′ST = GST (1 + HS) / (1 – HS) following Hedrick (2005), thusallowing a comparison between GST of the mitochondrialand chloroplast markers, which exhibited very differentlevels of variation. These indices were calculated over allpopulations, and for groups of populations delineated bySAMOVA.
ResultsMacrofossil and pollen data
Macrofossils dated to the period before the LGM (> 27 cal.kyr BP) and to the LGM (27 to > 18 cal. kyr BP) were scarce,but indicated full-glacial presence of spruce in bothnorthern Europe and Siberia (Fig. 2). Macrofossils datedto the LGM are reported at four sites, two on the EastEuropean Plain and two on the West Siberian Plain. Thetwo sites on the West Siberian Plain were identical to thepre-LGM sites (Appendix S1), suggesting the long-termpersistence of spruce in this area. Two additionaloccurrences, based on pollen dated to earlier than 18 cal.kyr BP, are described for the Baikal region.
Fossil records of the late glacial (18 to > 11.7 cal. kyr BP)were numerous and widespread, particularly the pollenrecords (Fig. 2). On the East European Plain, pollen recordssuggest that spruce established rapidly across large areas,
including the Baltic countries, the northern basin of theVolga River and the area west of the northern UralMountains. Most pollen sites reached the 2% thresholdbetween 15 and 13 cal. kyr BP, including those situatedclose to the northern Ural Mountains. In southern Siberia,pollen and macrofossils consistently showed early spruceoccurrences on the West Siberian Plain, Altai and Sayanmountains and the Baikal region. The records from theseareas are generally older than those from the EastEuropean Plain, ranging from 18 to 13 cal. kyr BP.
In northern Europe, range expansion as recorded at the >2% pollen threshold was very slow up to the millennium9−8 cal. kyr BP. Northward expansion towards Finland wasfast, particularly from 7 to 5 cal. kyr BP, and spruce reachedits modern northern limits in Finland around 2 cal. kyr BP.Spruce expanded westwards towards the Baltic Sea andcolonized Scandinavia from 5 cal. kyr BP to the presentmillennium. The timing of northward colonization in Siberiais less clear because of a scarcity of data, particularly forcentral Siberia. Fossil pollen records indicate that sprucehad already reached its current northern limits in Siberiaduring the early Holocene (11−8 cal. kyr BP), and alsorevealed spruce occurrences north of these limits.
Genetic data
Sizing and sequencing of the mitochondrial nad1 markerrevealed 14 mitotypes in the 50 populations surveyed (Fig. 3,Appendix S3). Three mitotypes were not previouslyreported. The size variation was mainly a result of copy-number variation in the two minisatellites. Two nucleotidesubstitutions and a 9-bp indel defined one western andone eastern lineage (Fig. 3a). The four mitotypes of theeastern lineage were restricted to Siberia and twopopulations in the northern Ural Mountains. The 10mitotypes of the western lineage were mainly found innorthern and north-eastern Europe. Mitotype 721 bp andthe mitotypes 789, 857 and 891 bp were also detected intwo separate populations situated in the western part ofthe West Siberian Plain (Fig. 3b). One of these populationsand one population from the northern Ural Mountainsincluded mitotypes of both lineages.
The chloroplast trnT–trnL marker included threepolymorphic sites, together defining four chlorotypes(CAG, CCG, ACT and ACG). Only the first character wasparsimony-informative (Fig. 3c). The rare chlorotype ACTwas only found in Siberia and in one population from thenorthern Ural Mountains. The three other chlorotypesoccurred across northern Eurasia, but their frequenciesvaried considerably between eastern and western regions(Fig. 3d). For example, chlorotype CAG was abundant inSiberia, but rare in most of northern Europe, whereaschlorotype CCG was rare in Siberia but abundant innorthern Europe.
Spatial analysis of molecular variance (SAMOVA)delineated two highly differentiated groups in bothmarkers (mtDNA, FCT = 0.69; cpDNA, FCT = 0.44), one
Population structure of northern Eurasian sprucepopulations as revealed by spatial analysis ofmolecular variance (SAMOVA). Populations delineatedto a particular group are presented in the samecolour: (a) mtDNA groups; (b) cpDNA groups.
FIGURE 4
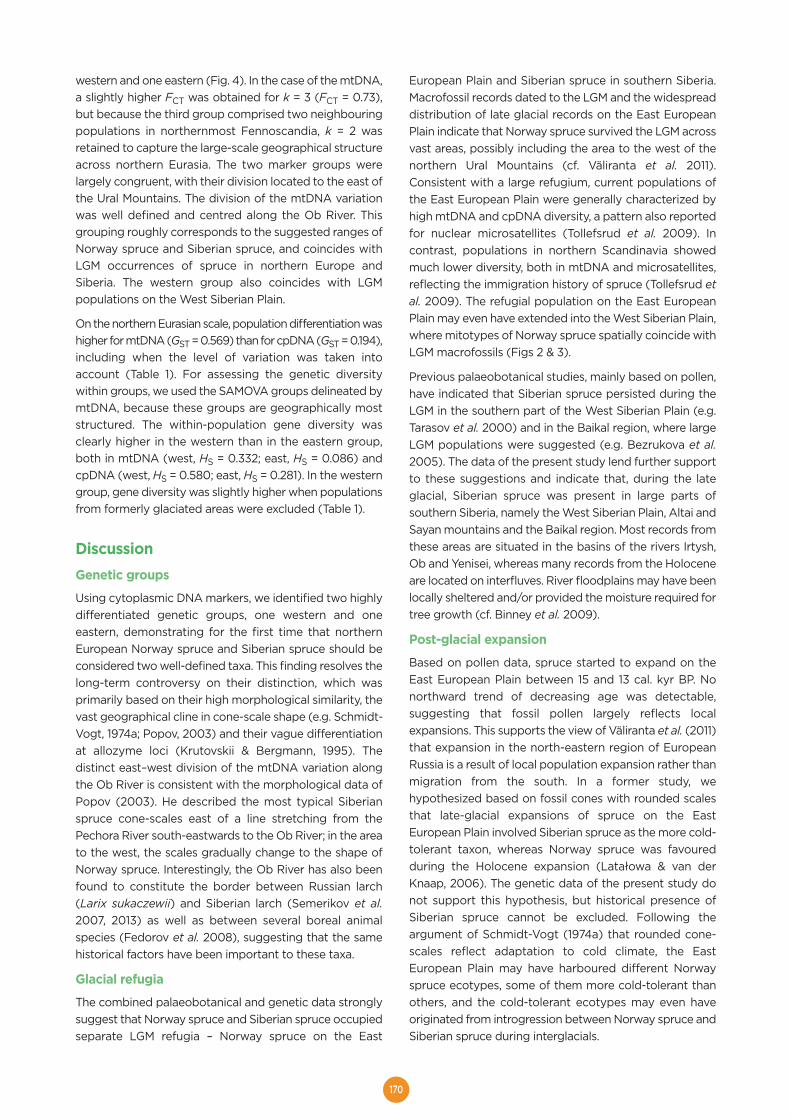
170
western and one eastern (Fig. 4). In the case of the mtDNA,a slightly higher FCT was obtained for k = 3 (FCT = 0.73),but because the third group comprised two neighbouringpopulations in northernmost Fennoscandia, k = 2 wasretained to capture the large-scale geographical structureacross northern Eurasia. The two marker groups werelargely congruent, with their division located to the east ofthe Ural Mountains. The division of the mtDNA variationwas well defined and centred along the Ob River. Thisgrouping roughly corresponds to the suggested ranges ofNorway spruce and Siberian spruce, and coincides withLGM occurrences of spruce in northern Europe andSiberia. The western group also coincides with LGMpopulations on the West Siberian Plain.
On the northern Eurasian scale, population differentiation washigher for mtDNA (GST = 0.569) than for cpDNA (GST = 0.194),including when the level of variation was taken intoaccount (Table 1). For assessing the genetic diversitywithin groups, we used the SAMOVA groups delineated bymtDNA, because these groups are geographically moststructured. The within-population gene diversity wasclearly higher in the western than in the eastern group,both in mtDNA (west, HS = 0.332; east, HS = 0.086) andcpDNA (west, HS = 0.580; east, HS = 0.281). In the westerngroup, gene diversity was slightly higher when populationsfrom formerly glaciated areas were excluded (Table 1).
DiscussionGenetic groups
Using cytoplasmic DNA markers, we identified two highlydifferentiated genetic groups, one western and oneeastern, demonstrating for the first time that northernEuropean Norway spruce and Siberian spruce should beconsidered two well-defined taxa. This finding resolves thelong-term controversy on their distinction, which wasprimarily based on their high morphological similarity, thevast geographical cline in cone-scale shape (e.g. Schmidt-Vogt, 1974a; Popov, 2003) and their vague differentiationat allozyme loci (Krutovskii & Bergmann, 1995). Thedistinct east–west division of the mtDNA variation alongthe Ob River is consistent with the morphological data ofPopov (2003). He described the most typical Siberianspruce cone-scales east of a line stretching from thePechora River south-eastwards to the Ob River; in the areato the west, the scales gradually change to the shape ofNorway spruce. Interestingly, the Ob River has also beenfound to constitute the border between Russian larch(Larix sukaczewii) and Siberian larch (Semerikov et al.2007, 2013) as well as between several boreal animalspecies (Fedorov et al. 2008), suggesting that the samehistorical factors have been important to these taxa.
Glacial refugia
The combined palaeobotanical and genetic data stronglysuggest that Norway spruce and Siberian spruce occupiedseparate LGM refugia – Norway spruce on the East
European Plain and Siberian spruce in southern Siberia.Macrofossil records dated to the LGM and the widespreaddistribution of late glacial records on the East EuropeanPlain indicate that Norway spruce survived the LGM acrossvast areas, possibly including the area to the west of thenorthern Ural Mountains (cf. Väliranta et al. 2011).Consistent with a large refugium, current populations ofthe East European Plain were generally characterized byhigh mtDNA and cpDNA diversity, a pattern also reportedfor nuclear microsatellites (Tollefsrud et al. 2009). Incontrast, populations in northern Scandinavia showedmuch lower diversity, both in mtDNA and microsatellites,reflecting the immigration history of spruce (Tollefsrud etal. 2009). The refugial population on the East EuropeanPlain may even have extended into the West Siberian Plain,where mitotypes of Norway spruce spatially coincide withLGM macrofossils (Figs 2 & 3).
Previous palaeobotanical studies, mainly based on pollen,have indicated that Siberian spruce persisted during theLGM in the southern part of the West Siberian Plain (e.g.Tarasov et al. 2000) and in the Baikal region, where largeLGM populations were suggested (e.g. Bezrukova et al.2005). The data of the present study lend further supportto these suggestions and indicate that, during the lateglacial, Siberian spruce was present in large parts ofsouthern Siberia, namely the West Siberian Plain, Altai andSayan mountains and the Baikal region. Most records fromthese areas are situated in the basins of the rivers Irtysh,Ob and Yenisei, whereas many records from the Holoceneare located on interfluves. River floodplains may have beenlocally sheltered and/or provided the moisture required fortree growth (cf. Binney et al. 2009).
Post-glacial expansion
Based on pollen data, spruce started to expand on theEast European Plain between 15 and 13 cal. kyr BP. Nonorthward trend of decreasing age was detectable,suggesting that fossil pollen largely reflects localexpansions. This supports the view of Väliranta et al. (2011)that expansion in the north-eastern region of EuropeanRussia is a result of local population expansion rather thanmigration from the south. In a former study, wehypothesized based on fossil cones with rounded scalesthat late-glacial expansions of spruce on the EastEuropean Plain involved Siberian spruce as the more cold-tolerant taxon, whereas Norway spruce was favouredduring the Holocene expansion (Latałowa & van derKnaap, 2006). The genetic data of the present study donot support this hypothesis, but historical presence ofSiberian spruce cannot be excluded. Following theargument of Schmidt-Vogt (1974a) that rounded cone-scales reflect adaptation to cold climate, the EastEuropean Plain may have harboured different Norwayspruce ecotypes, some of them more cold-tolerant thanothers, and the cold-tolerant ecotypes may even haveoriginated from introgression between Norway spruce andSiberian spruce during interglacials.
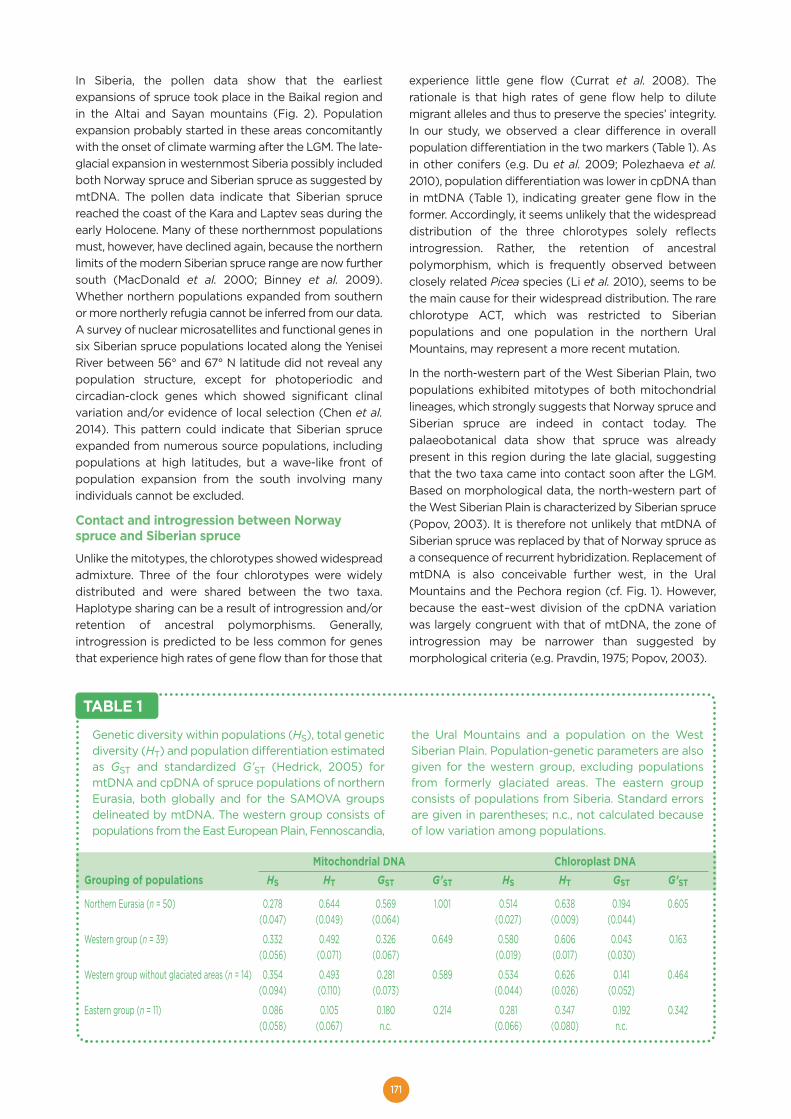
171
In Siberia, the pollen data show that the earliestexpansions of spruce took place in the Baikal region andin the Altai and Sayan mountains (Fig. 2). Populationexpansion probably started in these areas concomitantlywith the onset of climate warming after the LGM. The late-glacial expansion in westernmost Siberia possibly includedboth Norway spruce and Siberian spruce as suggested bymtDNA. The pollen data indicate that Siberian sprucereached the coast of the Kara and Laptev seas during theearly Holocene. Many of these northernmost populationsmust, however, have declined again, because the northernlimits of the modern Siberian spruce range are now furthersouth (MacDonald et al. 2000; Binney et al. 2009).Whether northern populations expanded from southernor more northerly refugia cannot be inferred from our data.A survey of nuclear microsatellites and functional genes insix Siberian spruce populations located along the YeniseiRiver between 56° and 67° N latitude did not reveal anypopulation structure, except for photoperiodic andcircadian-clock genes which showed significant clinalvariation and/or evidence of local selection (Chen et al.2014). This pattern could indicate that Siberian spruceexpanded from numerous source populations, includingpopulations at high latitudes, but a wave-like front ofpopulation expansion from the south involving manyindividuals cannot be excluded.
Contact and introgression between Norwayspruce and Siberian spruce
Unlike the mitotypes, the chlorotypes showed widespreadadmixture. Three of the four chlorotypes were widelydistributed and were shared between the two taxa.Haplotype sharing can be a result of introgression and/orretention of ancestral polymorphisms. Generally,introgression is predicted to be less common for genesthat experience high rates of gene flow than for those that
experience little gene flow (Currat et al. 2008). Therationale is that high rates of gene flow help to dilutemigrant alleles and thus to preserve the species’ integrity.In our study, we observed a clear difference in overallpopulation differentiation in the two markers (Table 1). Asin other conifers (e.g. Du et al. 2009; Polezhaeva et al.2010), population differentiation was lower in cpDNA thanin mtDNA (Table 1), indicating greater gene flow in theformer. Accordingly, it seems unlikely that the widespreaddistribution of the three chlorotypes solely reflectsintrogression. Rather, the retention of ancestralpolymorphism, which is frequently observed betweenclosely related Picea species (Li et al. 2010), seems to bethe main cause for their widespread distribution. The rarechlorotype ACT, which was restricted to Siberianpopulations and one population in the northern UralMountains, may represent a more recent mutation.
In the north-western part of the West Siberian Plain, twopopulations exhibited mitotypes of both mitochondriallineages, which strongly suggests that Norway spruce andSiberian spruce are indeed in contact today. Thepalaeobotanical data show that spruce was alreadypresent in this region during the late glacial, suggestingthat the two taxa came into contact soon after the LGM.Based on morphological data, the north-western part ofthe West Siberian Plain is characterized by Siberian spruce(Popov, 2003). It is therefore not unlikely that mtDNA ofSiberian spruce was replaced by that of Norway spruce asa consequence of recurrent hybridization. Replacement ofmtDNA is also conceivable further west, in the UralMountains and the Pechora region (cf. Fig. 1). However,because the east–west division of the cpDNA variationwas largely congruent with that of mtDNA, the zone ofintrogression may be narrower than suggested bymorphological criteria (e.g. Pravdin, 1975; Popov, 2003).
Mitochondrial DNA Chloroplast DNAGrouping of populations HS HT GST G’ST HS HT GST G’ST
Northern Eurasia (n = 50) 0.278 0.644 0.569 1.001 0.514 0.638 0.194 0.605(0.047) (0.049) (0.064) (0.027) (0.009) (0.044)
Western group (n = 39) 0.332 0.492 0.326 0.649 0.580 0.606 0.043 0.163(0.056) (0.071) (0.067) (0.019) (0.017) (0.030)
Western group without glaciated areas (n = 14) 0.354 0.493 0.281 0.589 0.534 0.626 0.141 0.464(0.094) (0.110) (0.073) (0.044) (0.026) (0.052)
Eastern group (n = 11) 0.086 0.105 0.180 0.214 0.281 0.347 0.192 0.342(0.058) (0.067) n.c. (0.066) (0.080) n.c.
TABLE 1
Genetic diversity within populations (HS), total geneticdiversity (HT) and population differentiation estimatedas GST and standardized G’ST (Hedrick, 2005) formtDNA and cpDNA of spruce populations of northernEurasia, both globally and for the SAMOVA groupsdelineated by mtDNA. The western group consists ofpopulations from the East European Plain, Fennoscandia,
the Ural Mountains and a population on the WestSiberian Plain. Population-genetic parameters are alsogiven for the western group, excluding populationsfrom formerly glaciated areas. The eastern groupconsists of populations from Siberia. Standard errorsare given in parentheses; n.c., not calculated becauseof low variation among populations.
172
Contrasting patterns of genetic diversity
The genetic diversity in both mtDNA and cpDNA wasfound to be clearly higher in western than in easternpopulations, a pattern that also has been observed inallozymes, albeit less pronouncedly (Krutovskii &Bergmann, 1995). In the case of mtDNA, all but one of thepopulations of the eastern mitochondrial lineage werefixed for the 712-bp mitotype. The three other mitotypes,each containing several copies of the 34-bp minisatellite,were found in a single population located in the northernfoothills of the southern Siberian mountains. Assumingstepwise copy-number changes in the minisatellite, itseems likely that ancestral populations carried moremitotypes.
The higher genetic diversity in Norway spruce than inSiberian spruce could have two causes – less pronouncedfluctuations in population size of Norway spruce due tomore stable and suitable climatic conditions during theQuaternary and/or gene flow from Siberian spruce. Itseems unlikely that the clear difference in diversity is solelya result of introgression. Diversities of mtDNA and cpDNAare both quite high in the western part of the EastEuropean Plain, an area that has not been suggested to beinfluenced by introgression (cf. Fig. 1). Glaciologicalevidence indicates that the climate of the East EuropeanPlain was rather humid during glacial maxima, whereasthat of Siberia was very dry, particularly during periodswhen the Scandinavian ice sheet was large, such as duringthe LGM, absorbing much of the moisture spread from theAtlantic Ocean (Stauch & Gualtieri, 2008; Krinner et al.2011). A cold and extremely dry LGM climate in Siberia andmuch milder conditions on the East European Plain arealso supported by palaeobotanical data (Hubberten et al.2004) and palaeovegetation maps (Allen et al. 2010).Siberian spruce may thus have repeatedly experiencedreductions in population size and consequently in geneticdiversity, whereas Norway spruce was less affected. Asimilar pattern of reduced diversity into the continent wasobserved in Abies in the Russian Far East, where a morestable climate along the coast was suggested to haveprevented major demographic fluctuations (Semerikovaet al. 2011). It seems possible that glaciations also played arole, particularly during the Saalian stage, when glaciers inSiberia were more extensive (Stauch & Gualtieri, 2008).Indeed, climatic events pre-dating the LGM weresuggested to have influenced the genetic structure ofSiberian larch (Semerikov et al. 2013) and several Eurasianboreal animal species (Fedorov et al. 2008).
ConclusionsThe combined palaeobotanical and genetic data allowedus to draw the following major conclusions. (1) NorthEurasian Norway spruce and Siberian spruce aregenetically distinct and occupied separate LGM refugia.Norway spruce persisted during the LGM on the East
European Plain, where it was already widely distributedduring the late glacial, suggesting widespread LGM treeoccurrences. Siberian spruce persisted in southern Siberia,but may also have survived locally at high latitudes,facilitating rapid northward expansion. (2) The two taxacame into contact in the area of the Ob River, where theyprobably hybridized. (3) The higher cytoplasmic DNAdiversity in Norway spruce than in Siberian spruce may bea consequence of more favourable past climatic conditionsfor Norway spruce and/or introgression from Siberianspruce.
Our survey of cytoplasmic DNA variation did not provideevidence for population subdivision either on the EastEuropean Plain or in Siberia. Multilocus surveys withnuclear markers will be necessary to provide furtherinsights into the structure of refugial populations. Nuclearmarkers could also help to delineate the introgression zoneand to elucidate patterns of past and current gene flow inthis zone. Furthermore, variation in functional genes couldbe used to determine whether the gradient in cone-scalemorphology is associated with introgression and/orclimatic adaptation.
AcknowledgementsWe thank Paolo Cherubini, Thomas Geburek, MaximKapralov, Daniel Nievergelt, Andreas Rigling and FritzSchweingruber for providing spruce samples from Russia.We are grateful to the staff at the ABI lab at the Universityof Oslo for producing excellent DNA sequences. We alsothank Heather Binney for providing valuable informationabout the structure of the Eurasian Macrofossil Databaseand Arne Steffenrem, who assisted with extraction of datafrom the database. Marcelina Zimny is acknowledged forher help in preparing tables and references ofpalaeobotanical data, György Sipos for critically readingand commenting on the manuscript, Donatella Magri andan anonymous referee for their helpful comments. Finally,we thank the data contributors of the EMD and EPD. Thisstudy was supported by the Norwegian Institute ofBioeconomy Research, the Research Council of Norway(Strategic Institute Programme 501500: DNA markers forcharacterization of genetic variation in Norwegian Foresttrees), and the EU network EVOLTREE; the work done byM.L. was based on statutory funds in the Faculty ofBiology, University of Gdańsk (DS/530-L145-D486-14).
REFERENCESAllen, J.R.M., Hickler, T., Singarayer, J.S., Sykes, M.T., Valdes,P.J. & Huntley, B. (2010) Last glacial vegetation of northernEurasia. Quaternary Science Reviews, 29, 2604–2618.Bezrukova, E.V., Abzaeva, A.A., Letunova, P.P., Kulagina,N.V., Vershinin, K.E., Belov, A.V., Orlova, L.A., Danko, L.V. &Krapivina, S.M. (2005) Post-glacial history of Siberianspruce (Picea obovata) in the Lake Baikal area and thesignificance of this species as a paleo-environmentalindicator. Quaternary International, 136, 47–57.
173
Binney, H.A., Willis, K.J., Edwards, M.E., Bhagwat, S.A.,Anderson, P.M., Andreev, A.A., Blaauw, M., Damblon, F.,Haesaerts, P., Kienast, F., Kremenetski, K.V., Krivonogov,S.K., Lozhkin, A.V., MacDonald, G.M., Novenko, E.Y.,Oksanen, P., Sapelko, T.V., Väliranta, M. & Vazhenina, L.(2009) The distribution of late-Quaternary woody taxa innorthern Eurasia: evidence from a new macrofossildatabase. Quaternary Science Reviews, 28, 2445–2464.
Birks, H.H. & Birks, H.J.B. (2000) Future uses of pollenanalysis must include plant macrofossils. Journal ofBiogeography, 27, 31–35.
Birks, H.H., Giesecke, T., Hewitt, G.M., Tzedakis, P.C., Bakke,J. & Birks, H.J.B. (2012) Comment on “Glacial survival ofboreal trees in northern Scandinavia”. Science, 338, 742–743.
Blyakharchuk, T.A., Wright, H.E., Borodavko, P.S., van derKnaap, W.O. & Ammann, B. (2004) Late Glacial andHolocene vegetational changes on the Ulagan high-mountain plateau, Altai Mountains, southern Siberia.Palaeogeography, Palaeoclimatology, Palaeoecology, 209,259–279.
Chen, J., Tsuda, Y., Stocks, M., Källman, T., Xu, N-N.,Kärkkäinen, K., Huotari, T., Semerikov, V.L., Vendramin, G.G.& Lascoux, M. (2014) Clinal variation at phenology-relatedgenes in spruce: parallel evolution in FTL2 and Gigantea?Genetics, 197, 1025–1038.
Clark, P.U., Dyke, A.S., Shakun, J.D., Carlson, A.E., Clark, J.,Wohlfarth, B., Mitrovica, J.X., Hostetler, S.W. & McCabe, A.M.(2009) The Last Glacial Maximum. Science, 325, 710–714.
Collignon, A.-M., Van de Sype, H. & Favre, J.-M. (2002)Geographical variation in random amplified polymorphicDNA and quantitative traits in Norway spruce. CanadianJournal of Forest Research, 32, 266–282.
Currat, M., Ruedi, M., Petit, R.J. & Excoffier, L. (2008) Thehidden side of invasions: massive introgression by localgenes. Evolution, 62, 1908–1920.
Demesure, B., Sodzi, N. & Petit, R.J. (1995) A set ofuniversal primers for amplification of polymorphic non-coding regions of mitochondrial and chloroplast DNA inplants. Molecular Ecology, 4, 129–131.
Du, F-K., Petit, R.J. & Liu, J-Q. (2009) More introgressionwith less gene flow: chloroplast vs. mitochondrial DNA inthe Picea asperata complex in China, and comparison withother conifers. Molecular Ecology, 18, 1396–1407.
Dupanloup, I., Schneider, S. & Excoffier, L. (2002) Asimulated annealing approach to define the geneticstructure of populations. Molecular Ecology, 11, 2571–2581.
Excoffier, L., Laval, G. & Schneider, S. (2005) Arlequin(version 3.0): an integrated software package forpopulation genetics data analysis. EvolutionaryBioinformatics Online, 1, 47–50.
Fedorov, V.B., Goropashnaya, A.V., Boeskorov, G.G. & Cook,J.A. (2008) Comparative phylogeography anddemographic history of the wood lemming (Myopusschisticolor): implications for late Quaternary history of thetaiga species in Eurasia. Molecular Ecology, 17, 598–610.
Frenzel, B. (1968) The Pleistocene vegetation of northernEurasia. Science, 161, 637–649.
Giesecke, T. & Bennett, K.D. (2004) The Holocene spreadof Picea abies (L.) Karst. in Fennoscandia and adjacentareas. Journal of Biogeography, 31, 1523–1548.
Grivet, D., Jeandroz, S. & Favre, J.-M. (1999) Nad1 b/c intronpolymorphism reveals maternal inheritance of themitochondrial genome in Picea abies. Theoretical andApplied Genetics, 99, 346–349.Hall, T.A. (1999) BioEdit: a user-friendly biological sequencealignment editor and analysis program for Windows95/98/NT. Nucleic Acids Symposium Series, 41, 95–98.Hamilton, M.B. (1999) Four primer pairs for theamplification of chloroplast intergenic regions withintraspecific variation. Molecular Ecology, 8, 521–523.Hedrick, P.W. (2005) A standardized geneticdifferentiation measure. Evolution, 59, 1633–1638.Heuertz, M., De Paoli, E., Källman, T., Larsson, H., Jurman,I., Morgante, M., Lascoux, M. & Gyllenstrand, N. (2006)Multilocus patterns of nucleotide diversity, linkagedisequilibrium and demographic history of Norway spruce[Picea abies (L.) Karst]. Genetics, 174, 2095–2105.Hubberten, H.W., Andreev, A., Astakhov, V.I. et al. (2004)The periglacial climate and environment in northernEurasia during the Last Glaciation. Quaternary ScienceReviews, 23, 1333–1357.Krinner, G., Diekmann, B., Colleoni, F. & Stauch, G. (2011)Global, regional and local scale factors determiningglaciation extent in Eastern Siberia over the last 140,000years. Quaternary Science Reviews, 30, 821–831.Krutovskii, K.V. & Bergmann, F. (1995) Introgressivehybridization and phylogenetic relationships betweenNorway, Picea abies (L.) Karst., and Siberian, P. obovataLedeb., spruce species studied by isozyme loci. Heredity,74, 464–480.Kullman, L. (2008) Early postglacial appearance of treespecies in northern Scandinavia: review and perspective.Quaternary Science Reviews, 27, 2467–2472.Lagercrantz, U. & Ryman, N. (1990) Genetic structure ofNorway spruce (Picea abies): concordance of morphologicaland allozymic variation. Evolution, 44, 38–53.Latałowa, M. & van der Knaap, W.O. (2006) LateQuaternary expansion of Norway spruce Picea abies (L.)Karst. in Europe according to pollen data. QuaternaryScience Reviews, 25, 2780–2805.Li, Y., Stocks, M., Hemmilä, S., Källman, T., Zhu, H-T., Zhou,Y-F., Chen, J., Liu, J-Q. & Lascoux, M. (2010) Demographichistories of four spruce (Picea) species of the Qinghai-Tibetan Plateau and neighboring areas inferred frommultiple nuclear loci. Molecular Biology and Evolution, 27,1001–1014.Lockwood, J.D., Aleksić, J.M., Zou, J-B., Wang, J., Liu, J-Q.& Renner, S.S. (2013) A new phylogeny for the genus Piceafrom plastid, mitochondrial, and nuclear sequences.Molecular Phylogenetics and Evolution, 69, 717-727.MacDonald, G.M., Velichko, A.A., Kremenetski, C.V.,Borisova, O.K., Goleva, A.A., Andreev, A.A., Cwynar, L.C.,Riding, R.T., Forman, S.L., Edwards, T.W.D., Aravena, R.,Hammarlund, D., Szeicz, J.M. & Gataullin, V.N. (2000)Holocene treeline history and climate change acrossnorthern Eurasia. Quaternary Research, 53, 302–311.Parducci, L., Jørgensen, T., Tollefsrud, M.M. et al. (2012a)Glacial survival of boreal trees in northern Scandinavia.Science, 335, 1083–1086.Parducci, L., Edwards, M.E., Bennett, K.D., Alm, T., Elverland,E., Tollefsrud, M.M., Jørgensen, T., Houmark-Nielsen, M.,Larsen, N.K., Kiær, K.H., Fontana S.L., Alsos I.G. & Willerslev,
174
E. (2012b) Response to comment on “Glacial survival ofboreal trees in northern Scandinavia”. Science, 338, 742.
Peltier, W.R. (1994) Ice age paleotopography. Science, 265,195–201.
Polezhaeva, M.A., Lascoux, M. & Semerikov, V.L. (2010)Cytoplasmic DNA variation and biogeography of Larix Mill.in northeast Asia. Molecular Ecology, 19, 1239–1252.
Pons, O. & Petit, R.J. (1995) Estimation, variance andoptimal sampling of gene diversity. I. Haploid locus.Theoretical and Applied Genetics, 90, 462–470.
Popov, P.P. (2003) Structure and differentiation of sprucepopulations in eastern Europe and western Siberia. RussianJournal of Ecology, 34, 27–33.
Popov, P.P. (2010) Form structure and geographicdifferentiation of spruce populations in northwesternRussia. Russian Journal of Ecology, 41, 336–343.
Pravdin, L.F. (1975) European spruce and Siberian sprucein the USSR (in Russian). Nauka, Moskow.
Ran, J-H., Wei, X-X. & Wang, X-Q. (2006) Molecularphylogeny and biogeography of Picea (Pinaceae):implications for phylogeographical studies usingcytoplasmic haplotypes. Molecular Phylogenetics andEvolution, 41, 405–419.
Reimer, P.J., Bard, E., Bayliss, A. et al. (2013) IntCal13 andMarine13 radiocarbon age calibration curves, 0–50,000years cal BP. Radiocarbon, 55, 1869–1887.
Sang, T., Crawford, D.J. & Stuessy, T.F. (1997) Chloroplast DNAphylogeny, reticulate evolution, and biogeography of Paeonia(Paeoniaceae). American Journal of Botany, 84, 1120–1136.
Schmidt-Vogt, H. (1974a) Die systematische Stellung dergemeinen Fichte (Picea abies [L.] Karst.) und der sibirischenFichte (Picea obovata Ledeb.) in der Gattung Picea. EinBeitrag zur Einführung von Erkenntnissen auf dem Gebietforstlicher Genökologie in die Systematik der Baumarten.Allgemeine Forst- und Jagdzeitung, 145, 45–60.
Schmidt-Vogt, H. (1974b) Das natürliche Verbreitungsgebietder Fichte (Picea abies [L.] Karst.) in Eurasien. AllgemeineForst- und Jagdzeitung, 145, 185–197.
Schmidt-Vogt, H. (1977) Die Fichte. Verlag Paul Parey,Hamburg.
Semerikov, V.L., Iroshnikov, A.I. & Lascoux, M. (2007)Mitochondrial DNA variation pattern and postglacialhistory of the Siberian larch (Larix sibirica Ledeb.). RussianJournal of Ecology, 38, 147–154.
Semerikov, V.L., Semerikova, S.A., Polezhaeva, M.A.,Kosintsev, P.A. & Lascoux, M. (2013) Southern montanepopulations did not contribute to the recolonization ofWest Siberian Plain by Siberian larch (Larix sibirica): arange-wide analysis of cytoplasmic markers. MolecularEcology, 22, 4958–4971.
Semerikova, S.A., Semerikov, V.L. & Lascoux, M. (2011) Post-glacial history and introgression in Abies (Pinaceae)species of the Russian Far East inferred from both nuclearand cytoplasmic markers. Journal of Biogeography, 38,326–340.
Sperisen, C., Büchler, U., Gugerli, F., Mátyás, G., Geburek, T.& Vendramin, G.G. (2001) Tandem repeats in plantmitochondrial genomes: application to the analysis ofpopulation differentiation in the conifer Norway spruce.Molecular Ecology, 10, 257–263.
Stauch, G. & Gualtieri, L. (2008) Late Quaternaryglaciations in northeastern Russia. Journal of QuaternaryScience, 23, 545–558.
Sutton, B.C.S., Flanagan, D.J., Gawley, J.R., Newton, C.H.,Lester, D.T. & Elkassaby, Y.A. (1991) Inheritance ofchloroplast and mitochondrial DNA in Picea andcomposition of hybrids from introgression zones.Theoretical and Applied Genetics, 82, 242–248.
Svendsen, J.I., Alexanderson, H., Astakhov, V.I. et al. (2004)Late Quaternary ice sheet history of northern Eurasia.Quaternary Science Reviews, 23, 1229–1271.
Taberlet, P., Gielly, L., Pautou, G. & Bouvet, J. (1991)Universal primers for amplification of three non-codingregions of chloroplast DNA. Plant Molecular Biology, 17,1105–1109.
Tarasov, P.E., Volkova, V.S., Webb, T., Guiot, J., Andreev,A.A., Bezusko, L.G., Bezusko, T.V., Bykova, G.V., Dorofeyuk,N.I., Kvavadze, E.V., Osipova, I.M., Panova, N.K. &Sevastyanov, D.V. (2000) Last glacial maximum biomesreconstructed from pollen and plant macrofossil data fromnorthern Eurasia. Journal of Biogeography, 27, 609–620.
Tate, J.A. & Simpson, B.B. (2003) Paraphyly of Tarasa(Malvaceae) and diverse origins of the polyploid species.Systematic Botany, 28, 723–737.
Teacher, A.G.F. & Griffiths, D.J. (2011) HapStar: automatedhaplotype network layout and visualization. MolecularEcology Resources, 11, 151–153.
Terhürne-Berson, R. (2005) Changing distribution patternsof selected conifers in the Quaternary of Europe causedby climatic variations. PhD Thesis, University of Bonn,Bonn.
Tollefsrud, M.M., Kissling, R., Gugerli, F., Johnsen, Ø.,Skrøppa, T., Cheddadi, R., van der Knaap, W.O., Latałowa,M., Terhürne-Berson, R., Litt, T., Geburek, T., Brochmann, C.& Sperisen, C. (2008) Genetic consequences of glacialsurvival and postglacial colonization in Norway spruce:combined analysis of mitochondrial DNA and fossil pollen.Molecular Ecology, 17, 4134–4150.
Tollefsrud, M.M., Sønstebø, J.H., Brochmann, C., Johnsen,Ø., Skrøppa, T. & Vendramin, G.G. (2009) Combinedanalysis of nuclear and mitochondrial markers provide newinsight into the genetic structure of North European Piceaabies. Heredity, 102, 549–562.
Tutin, T.G., Burges, N.A., Chater, A.O., Edmonds, J.R.,Heywood, D.H., Moore, D.M., Valentine, D.H., Walters, S.M.& Webb, D.A. (1993) Flora Europaea, 2nd edn. CambridgeUniversity Press, Cambridge, UK.
Väliranta, M., Kaakinen, A., Kuhry, P., Kultti, S., Salonen, J.S.& Seppä, H. (2011) Scattered late-glacial and earlyHolocene tree populations as dispersal nuclei for forestdevelopment in north-eastern European Russia. Journal ofBiogeography, 38, 922–932.
Vendramin, G.G., Anzidei, M., Madaghiele, A., Sperisen, C.& Bucci, G. (2000) Chloroplast microsatellite analysisreveals the presence of population subdivision in Norwayspruce (Picea abies K.). Genome, 43, 68–78.
Vorren, T.O., Vorren, K.-D., Aasheim, O., Dahlgren, K.I.T.,Forwick, M. & Hassel, K. (2013) Palaeoenvironment innorthern Norway between 22.2 and 14.5 cal. ka BP. Boreas,42, 876–895.
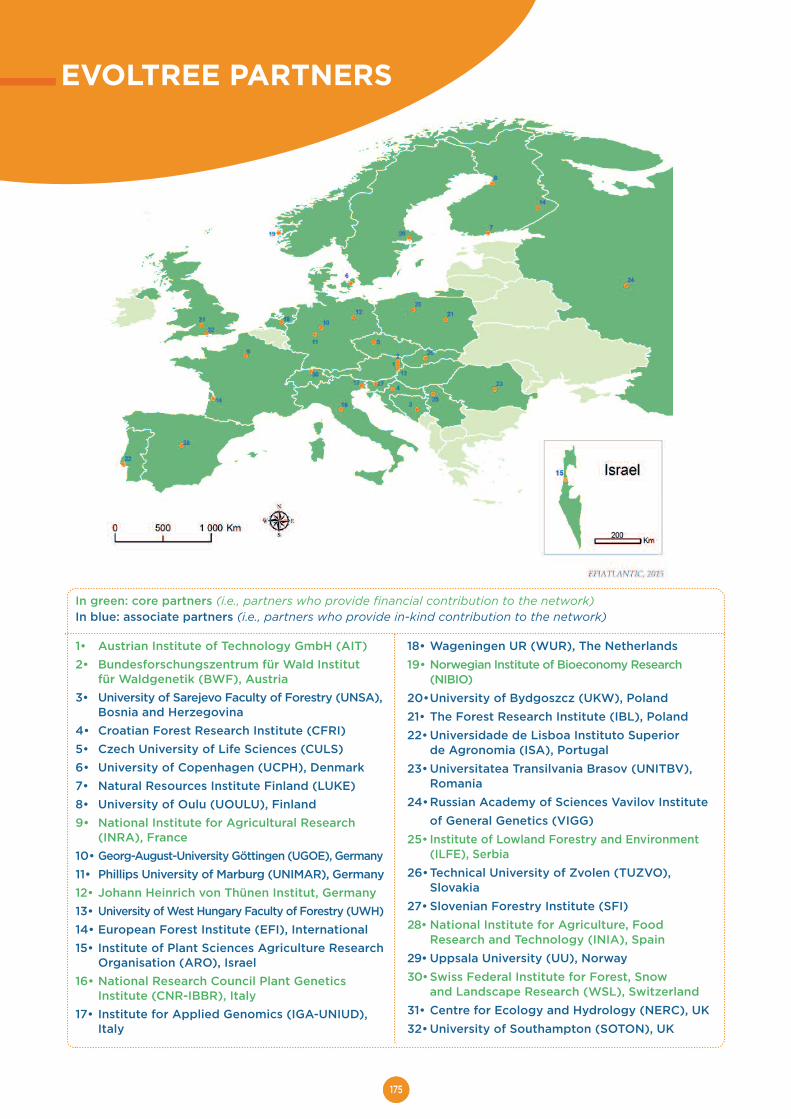
175175
In green: core partners (i.e., partners who provide financial contribution to the network)In blue: associate partners (i.e., partners who provide in-kind contribution to the network)
EVOLTREE PARTNERS
1• Austrian Institute of Technology GmbH (AIT)2• Bundesforschungszentrum für Wald Institut
für Waldgenetik (BWF), Austria3• University of Sarejevo Faculty of Forestry (UNSA),
Bosnia and Herzegovina4• Croatian Forest Research Institute (CFRI)5• Czech University of Life Sciences (CULS)6• University of Copenhagen (UCPH), Denmark7• Natural Resources Institute Finland (LUKE)8• University of Oulu (UOULU), Finland9• National Institute for Agricultural Research
(INRA), France10• Georg-August-University Göttingen (UGOE), Germany11• Phillips University of Marburg (UNIMAR), Germany12• Johann Heinrich von Thünen Institut, Germany13• University of West Hungary Faculty of Forestry (UWH)14• European Forest Institute (EFI), International15• Institute of Plant Sciences Agriculture Research
Organisation (ARO), Israel16• National Research Council Plant Genetics
Institute (CNR-IBBR), Italy17• Institute for Applied Genomics (IGA-UNIUD),
Italy
18• Wageningen UR (WUR), The Netherlands19• Norwegian Institute of Bioeconomy Research
(NIBIO)20•University of Bydgoszcz (UKW), Poland21• The Forest Research Institute (IBL), Poland22• Universidade de Lisboa Instituto Superior
de Agronomia (ISA), Portugal23• Universitatea Transilvania Brasov (UNITBV),
Romania24•Russian Academy of Sciences Vavilov Institute
of General Genetics (VIGG)25• Institute of Lowland Forestry and Environment
(ILFE), Serbia26•Technical University of Zvolen (TUZVO),
Slovakia27• Slovenian Forestry Institute (SFI)28• National Institute for Agriculture, Food
Research and Technology (INIA), Spain29• Uppsala University (UU), Norway30•Swiss Federal Institute for Forest, Snow
and Landscape Research (WSL), Switzerland31• Centre for Ecology and Hydrology (NERC), UK32• University of Southampton (SOTON), UK

The EVOLTREE coordination team would like to thank all EVOLTREE participants, past andpresent, who have supported the network throughout the last 10 years by contributing toits successful work and activities. We are also grateful to the European Commission forfunding during the period as Network of Excellence (2006-2010) under FP6 and to allinstitutional EVOLTREE members for self-funding after that period.
INSTITUTE OF LOWLAND FORESTRY AND ENVIRONMENT (ILFE) SERBIA
SWITZERLAND

Related Documents