VILNIUS GEDIMINAS TECHNICAL UNIVERSITY Irina TRAVKINA THE EVALUATION OF FACTORS HAVING AN IMPACT ON THE LITHUANIAN EXPORT COMPETITIVENESS DOCTORAL DISSERTATION SOCIAL SCIENCES, ECONOMICS (04S) Vilnius 2015

Welcome message from author
This document is posted to help you gain knowledge. Please leave a comment to let me know what you think about it! Share it to your friends and learn new things together.
Transcript
VILNIUS GEDIMINAS TECHNICAL UNIVERSITY
Irina TRAVKINA
THE EVALUATION OF FACTORS HAVING AN IMPACT ON THE LITHUANIAN EXPORT COMPETITIVENESS
DOCTORAL DISSERTATION
SOCIAL SCIENCES, ECONOMICS (04S)
Vilnius 2015
Doctoral dissertation was prepared at Vilnius Gediminas Technical University in 2006–2015.
The dissertation is defended as an external work.
Scientific Consultant
Prof. Dr Manuela TVARONAVIČIENĖ (Vilnius Gediminas Technical University, Economics – 04S).
The Dissertation Defense Council of Scientific Field of Economics of Vilnius Gediminas Technical University:
Chairman
Prof. Dr Habil. Aleksandras Vytautas RUTKAUSKAS (Vilnius Gediminas Technical University, Economics – 04S).
Members: Dr Vera BORONENKO (Daugavpils University, Economics – 04S), Prof. Dr Habil. Romualdas GINEVIČIUS (Vilnius Gediminas Technical University, Economics – 04S), Prof. Dr Habil. Borisas MELNIKAS (Vilnius Gediminas Technical University, Economics – 04S), Prof. Dr Vytautas SNIEŠKA (Kaunas University of Technology, Economics – 04S).
The dissertation will be defended at the public meeting of the Dissertation Defense Council of Economics in the Senate Hall of Vilnius Gediminas Technical University at 10 a. m. on 7 December 2015.
Address: Saulėtekio al. 11, LT-10223 Vilnius, Lithuania. Tel.: +370 5 274 4956; fax +370 5 270 0112; e-mail: [email protected]
A notification on the intend defending of the dissertation was send on 6 November 2015. A copy of the doctoral dissertation is available for review at VGTU repository http://dspace.vgtu.lt/ and at the Library of Vilnius Gediminas Technical University (Saulėtekio al. 14, LT-10223 Vilnius, Lithuania).
VGTU leidyklos TECHNIKA 2333-M mokslo literatūros knyga
ISBN 978-609-457-865-6
© VGTU leidykla TECHNIKA, 2015 © Irina Travkina, 2015 [email protected]
VILNIAUS GEDIMINO TECHNIKOS UNIVERSITETAS
Irina TRAVKINA
VEIKSNIŲ, LEMIANČIŲ LIETUVOS EKSPORTO KONKURENCINGUMĄ, VERTINIMAS
DAKTARO DISERTACIJA
SOCIALINIAI MOKSLAI, EKONOMIKA (04S)
Vilnius 2015
Disertacija rengta 2006–2015 metais Vilniaus Gedimino technikos universitete.
Disertacija ginama eksternu.
Mokslinis konsultantas
prof. dr. Manuela TVARONAVIČIENĖ (Vilniaus Gedimino technikos universitetas, ekonomika – 04S).
Vilniaus Gedimino technikos universiteto Ekonomikos mokslo krypties disertacijos gynimo taryba:
Pirmininkas
prof. habil. dr. Aleksandras Vytautas RUTKAUSKAS (Vilniaus Gedimino technikos universitetas, ekonomika – 04S).
Nariai:
dr. Vera BORONENKO (Daugpilio universitetas, ekonomika – 04S),
prof. habil. dr. Romualdas GINEVIČIUS (Vilniaus Gedimino technikos universitetas, ekonomika – 04S),
prof. habil. dr. Borisas MELNIKAS (Vilniaus Gedimino technikos universitetas, ekonomika – 04S),
prof. dr. Vytautas SNIEŠKA (Kauno technologijos universitetas, ekonomika –
04S).
Disertacija bus ginama viešame Ekonomikos mokslo krypties disertacijos gynimo tarybos posėdyje 2015 m. gruodžio 7 d. 10 val. Vilniaus Gedimino technikos universiteto senato posėdžių salėje.
Adresas: Saulėtekio al. 11, LT-10223 Vilnius, Lietuva. Tel.: (8 5) 274 4956; faksas (8 5) 270 0112; el. paštas [email protected]
Pranešimai apie numatomą ginti disertaciją išsiųsti 2015 m. lapkričio 6 d.
Disertaciją galima peržiūrėti VGTU talpykloje http://dspace.vgtu.lt/ ir Vilniaus Gedimino technikos universiteto bibliotekoje (Saulėtekio al. 14, LT-10223 Vilnius, Lietuva).
v
Abstract
The dissertation investigates the essential factors of Lithuanian export competi-tiveness, methodological and theoretical aspects of evaluation of factors of ex-port competitiveness.
The dissertation raises a number of major tasks: to analyse the literature on the evolution of the theories of the international trade and competitiveness based on the critical overview of the scientific literature on the factors, having an im-pact on export competitiveness; to provide a critical overview of the empirical research on the measurement of export competitiveness, to give a classification of relevant factors and to identify the suitable factors, to incorporate them into the model; to create the model aimed at evaluating the composition of export competitiveness factors and their impact on export competitiveness of countries with small open economy; based on the created methodical principles and the case of Lithuania, to perform the empirical evaluation of export competitiveness factors and to provide the strategic guidelines for enhancing the Lithuanian ex-port competitiveness in the short-run and middle-run perspectives.
The dissertation consists of 4 chapters, including introduction, general conclusions, references and annexes.
The introduction identifies the investigated problem, the importance of the thesis and the object of the research; and describes the purpose and tasks of the paper, research methodology, scientific novelty, the practical significance of the results examined in the paper and the defended statements. The introduction ends in presenting the author’s publications on the subject of the defended dis-sertation, offering the material of the made presentations in conferences and de-fining the structure of the dissertation.
Chapter 1 is dedicated to the explanation of the scientific problem, exa-mined in the dissertation, and to substantiate the needs to conduct the research on the international trade competitiveness, as well as provides the study of the theories and methodologies applied in the research, and define the research methodologies.
Chapter 2 provides the main groups of factors determining the export com-petitiveness. Chapters 3 and 4 present the results of the empirical analyses and suggest managerial solutions based on the outcomes of the research, and the model designed to evaluate the factors of industry export competitiveness and their impact on the enhancement of country’s export competitiveness.
4 articles focusing on the subject of the discussed dissertation are published: three articles – in the journal quoted by ICONDA and Business Source Complete data base, and one article – in the conference proceedings quoted in Thomson ISI data base.
vi
Reziumė
Disertacijoje nagrinėjami Lietuvos eksporto pagrindiniai konkurencingumo veiksniai, metodologiniai bei teoriniai konkurencingumo vertinimo aspektai.
Darbe sprendžiami keli pagrindiniai uždaviniai: atlikti eksporto konku-rencingumą (augimą) lemiančių veiksnių mokslinės literatūros analizę; išanali-zuoti eksporto konkurencingumo vertinimo būdus bei atrinkti veiksnius, tinka-mus modeliui formuoti; nustatyti mažų, atviros ekonomikos šalių eksporto konkurencingumą (augimą) lemiančių veiksnių sudėtį; pagal atrinktų veiksnių sudėtį parengti jų poveikio mažų, atviros ekonomikos šalių eksporto konku-rencingumui vertinimo modelį; remiantis siūlomais metodiniais principais bei pasitelkus Lietuvos pavyzdį, įvertinti eksporto konkurencingumą bei parengti eksporto plėtros gaires trumpalaikės ir vidutinės trukmės perspektyvose.
Disertaciją sudaro įvadas, keturi skyriai, bendrosios išvados, naudotos li-teratūros ir autorės publikacijų disertacijos tema sąrašai ir priedai.
Įvadiniame skyriuje aptariama tiriamoji problema, darbo aktualumas, aprašomas tyrimų objektas, formuluojamas darbo tikslas bei uždaviniai, aprašoma tyrimų metodika, darbo mokslinis naujumas, darbo rezultatų praktinė reikšmė, ginamieji teiginiai.
Pirmajame disertacijos skyriuje pristatoma kritinė mokslinės literatūros, nagrinėjančios šalies bei tarptautinės prekybos konkurencingumą, jo vertinimą bei skirtingus vertinimo aspektus apžvalga, taip pat pristatomos teorijos bei ty-rimų metodologijos, nagrinėjančios pramonės šakų eksporto konkurencingumo veiksnių vertinimą bei plačiai teorijoje bei praktikoje naudojami analizės metodai.
Antrajame skyriuje pristatomi veiksniai, darantys įtaką šalies konku-rencingumui. Trečiajame bei ketvirtajame disertacijos skyriuose pristatomi at-liktų tyrimų rezultatai bei pateikiamas sukurtas modelis, leidžiantis įvertinti Lie-tuvos eksporto konkurencingumo veiksnius bei jų poveikio galimybes šalies eksporto konkurencingumui.
Disertacijos tema paskelbti 4 straipsniai: trys – mokslo žurnaluose, įtrauk-tuose į ICONDA ir Business Source Complete duomenų bazių sąrašą, vienas – konferencijos medžiagoje, referuotoje Thomson ISI duomenų bazėje.
vii
Notations
Abbreviations
ADF – augmented Dickey–Fuller test; AIC – Akaike information criterion; AR – autoregressive; B1GM – gross domestic product; CN – combined nomenclature; ELG – export-led growth; EU – European Union; EUROSTAT – Bureau of European Statistics; Export – export of goods and services, or the total export, or the whole export FDI – foreign direct investment; G – government spending; GDP– gross domestic product; GCF – gross capital formation; GFCF – gross fixed capital formation; GVA – gross value added; H – hours; I – investment;
viii
I(1) – stationary at first difference; LP – labour productivity; LR – Republic of Lithuania; SIC – Schwarz information criterion; TJ – terajoule, equal to one trillion joules; VA – value added; VAR – vector autoregressive (model); WIFO – Österreichisches Institut für Wirtschaftsforschung (eng. The Austrian Institute of Economic Research).
ix
Contents
INTRODUCTION .............................................................................................................. 1
The Problem Formulation............................................................................................... 1
The Relevance of the Thesis ........................................................................................... 1
The Object of the Research ............................................................................................ 2
The Aim of the Thesis .................................................................................................... 2
The Objectives of the Thesis .......................................................................................... 2
Research Methodology ................................................................................................... 3
Scientific Novelty of the Thesis ..................................................................................... 3
Practical Value of the Research Findings ....................................................................... 4
The Defended Statements ............................................................................................... 4
Approval of the Research Findings ................................................................................ 4
Structure of the Dissertation ........................................................................................... 5
1. THEORETICAL FRAMEWORK FOR THE MEASUREMENT OF INTERNATIONAL TRADE COMPETITIVENESS .................................................... 7
1.1. Competitiveness and International Trade ................................................................ 8
1.2. Genesis of Competitiveness................................................................................... 12
1.3. Types of Competitiveness Measurement ............................................................... 16
1.4. Theoretical Application of Competitiveness Measurement in Lithuania ............................................................................................................ 18
1.5. Conclusions of the Chapter 1 and Formulation of the Tasks of the Dissertation .................................................................................................. 20
x
2. LITHUANIAN EXPORT AND MANUFACTURING ................................................ 23
2.1. International Trade Reforms in Lithuania ............................................................. 24
2.2. The Specific Features of the Export Structure in Lithuania .................................. 27
2.2.1. Integrated Systems of Export Classifications .............................................. 29
2.2.2. The Analysis of Export Structure Based on Goods’ Nature ........................ 32
2.2.3. The Analysis of Export Structure Based on Factor-Input Aspect ................ 37
2.2.4. The Analysis of Export Structure Based on Sectorial Composition ............ 41
2.2.5. The Analysis of Export Structure Based on LT-origin Aspect .................... 44
2.2.6. Conclusions of the Section 2.2..................................................................... 52
2.3. The Specific Features of the Manufacturing Structure in Lithuania ...................... 53
2.3.1. Statistical Classification of Economic Activities in the European Communities (NACE) ....................................................... 57
2.3.2. The Overview of Lithuanian Manufacturing Industry ................................. 59
2.3.3. The Analysis of the Manufacturing Structure Based on Goods’ Nature .............................................................................. 62
2.3.4. Factor-Input Analysis of the Manufacturing Structure ................................ 66
2.3.5. Cross-Sectorial Analysis of the Manufacturing Structure............................ 68
2.3.6. Conclusions of the Section 2.3..................................................................... 70
2.4. Productivity Facets Determined by Manufacturing Factors of Production ........... 71
2.4.1. Labour as the Main Factor of Productivity .................................................. 72
2.4.2. Capital as the Main Factor of Productivity .................................................. 74
2.4.3. Energy as the Main Factor of Productivity .................................................. 77
2.4.4. Combining Insights from Factor-Input Indicators ....................................... 82
2.4.5. Conclusions of the Section 2.4..................................................................... 83
2.5. Conclusions of the Chapter 2................................................................................. 84
3. EXPORT AND GROSS DOMESTIC PRODUCT GROWTH IN LITHUANIA: SHORT-RUN OR MIDDLE-RUN CAUSALITY ....................................................... 89
3.1. The Analysis of the Relationship between Export and Gross Domestic Product ........................................................................................ 89
3.2. The Methodology of Testing ................................................................................. 91
3.3. Empirical Analysis and Findings ........................................................................... 94
3.4. Conclusions of the Chapter 3................................................................................. 99
4. THE EMPIRICAL TESTING OF THE EVALUATION OF FACTORS DETERMINING EXPORT COMPETITIVENESS ................................................... 101
4.1. Combining the Insights into the Factors Determining Lithuanian Export Competitiveness ................................................................................................... 102
4.2. The Empirical Testing of Export Competitiveness .............................................. 104
4.2.1. Export Competitiveness Model: Indicators................................................ 104
4.2.2. Export Competitiveness Model: Construction and Investigation .............. 106
4.3. The Model as a Solution ...................................................................................... 116
4.4. Strategic Guidelines to Enhancing Short-run and Middle-run Competitiveness of Lithuanian Export ............................................. 117
4.5. Conclusions of the Chapter 4............................................................................... 124
xi
GENERAL CONCLUSIONS ......................................................................................... 127
REFERENCES ............................................................................................................... 129
LIST OF SCIENTIFIC PUBLICATIONS BY THE AUTHOR ON THE TOPIC OF THE DISSERTATION ............................................................. 141
SUMMARY IN LITHUANIAN ..................................................................................... 143
ANNEXES11 ................................................................................................................... 155
Annex A. Conversion Table “International Trade – Manufacturing” Created by the Author ......................................................................................... 157 Annex B. The Analysis of Lithuanian Export Considered from the Aspect of Origin .................................................................................................. 165 Annex C. The Results of the Measurements of Vector Autoregressive (VAR) models ............................................................................ 172 Annex D. The Results of Practical Implementation of the Investigated Model .......... 173 Annex E. The Co-authors’ Agreements to Present Publications Material in the Doctoral Dissertation ................................................................................ 182 Annex F. Copies of Scientific Publications by the Autor on the Topic of the Dissertation ............................................................................................... 185
1 1The annexes are supplied in the enclosed compact disc

1
Introduction
The Problem Formulation
The economic integration in the European Union and the development of the global competitive market manifest themselves in challenges and preconditions for the country’s export structure and its changes, as well as providing opportu-nities for making it compliant with the competitive export policy pursued by the country. The key goal of the Lithuanian export development strategy is to achieve that by the year 2020 most of industrial companies operating in Lithua-nia would be competitive internationally, and the industrial structure of Lithua-nia and its share in the gross domestic product would be in full conformity with the measures applied in the EU countries and oriented to further perspective. The government emphasized the increasing importance of export as the main indicator of the competitiveness of the country.
The Relevance of the Thesis
In order to purposefully respond to the formation and development of the com-petitive international trade, it is primarily necessary to develop an effective Lithuanian export strategy based on the competitiveness of the existing indust-
2 INTRODUCTION
rial sectors and their exported goods and to identify the key factors determining their competitive advantage. Thus, complex evaluation of the key factors of the country’s export competitiveness, which is an essential tool for the country’s strategic planning and an assumption for increasing the country‘s competitive-ness, is required. The design of the respective models requires the search for solutions to a problem ascribed to the science of Economics, which, on the one hand, is characterized by the fact that a modern economic theory lacks a theore-tical rationale that could serve as a basis for measurement practices of export competitiveness. On the other hand, it is characterized by insufficiency of the scientific expertise designed for exploring new opportunities for the formation and development of the competitive export policy, taking into account the circumstances associated with the specific features of the country and its interna-tional trade.
The Object of the Research
The factors, having an impact on the competitiveness (growth) of the export of small open economy countries.
The Aim of the Thesis
To prepare a model for evaluating the composition of the export competitiveness factors, as well as their impact on the economic growth of small open economy countries, and, based on the created model, to perform the empirical research for the case of Lithuania.
The Objectives of the Thesis
In order to achieve the described aim of thesis, the following problems have to be solved:
1. To analyse the literature on the evolution of the theories of the inter-national trade and competitiveness based on the critical overview of the scientific literature on the factors, impacting export competitive-ness.
2. To provide a critical overview of the empirical research on the mea-surement of export competitiveness, to give a classification of rele-
INTRODUCTION 3
vant factors, to identify the suitable factors, to incorporate them into the model and to summarize the available methodological principles.
3. To create the model aimed at evaluating the composition of export competitiveness factors and their impact on export competitiveness of small open economy countries.
4. Based on the created methodical principles and the case of Lithuania, to perform the empirical evaluation of export competitiveness factors and to provide the strategic guidelines for enhancing the Lithuanian export competitiveness in the short-run and middle-run perspectives.
Research Methodology
The analysis of the scientific literature was based on systematizing, comparison and generalization of the scientific statements and the data obtained in the empirical research. For the empirical testing of the model, such methods as data normalization, multiple regression, the vector autoregressive model (VAR), Granger causality test and the impulse response function were used. The re-search results were statistically processed using the Eviews software and pre-sented in charts by using MS Excel.
Scientific Novelty of the Thesis
The scientific novelty of the present investigation is based on the achievements in the field of research and development of economics in the area of export competitiveness as follows:
1. The development of the model for identifying and combining the competitiveness factors, having an impact on the export of small open economy countries into a whole system. The supplementing of the competitiveness factors with the significant model’s component for small open economy countries, including energy considered to be a secondary factor of production (along with the classical factors of production, such as labour and capital). Using the composition of factors in the suggested model as an effective tool for enhancing export competitiveness in the short-run and middle-run time perspec-tives.
2. The orientation of the suggested methodological principles to the formation of strategic export guidelines for small open economy
4 INTRODUCTION
countries and adaptation of guidelines to the export policy, principle, the available resources and time perspective.
Practical Value of the Research Findings
The presented overview of the scientific literature and the suggested methodo-logical principles, which were used to create the model aimed at evaluating the composition of the export competitiveness factors and their impact on the eco-nomic growth of small open economy countries, could be practically used by export researchers.
The results of the research can be useful for the interested parties, forming industrial and export policies for the economy as a whole, or separate industries. The research results can be used for forecasting and encouraging some purpo-sive structural changes in the Lithuanian economy and export policy.
The Defended Statements
1. The Lithuanian economic growth is determined by the increase in the Lithuanian export (but not conversely). The impact of export on the GDP depends on the duration of a particular period.
2. The model, aimed at evaluating the export competitiveness of small open economy countries and integrating such factors, which define the whole amount of the exported goods (presented by various classi-fication systems), as well as the main (labour and capital) and secon-dary (energy) factors of production and their productivity, was crea-ted. Being based on the proposed methodological principles, the model is an effective tool for evaluating the trends of export competi-tiveness enhancement in the short-run and middle-run time perspec-tives.
3. The factors identified for creating the model differently impact the Lithuanian export competitiveness in the short-run and middle-run perspectives.
Approval of the Research Findings
Four articles focusing on the subject of the discussed dissertation are published: three articles – in the journal quoted by ICONDA and Business Source
INTRODUCTION 5
Complete data base, and one article – in conference proceedings of Thomson ISI data base. Two presentations on the subject have been made at the scientific con-ferences. Two other presentations on the subject have been made in scientific se-minars.
Structure of the Dissertation
The scientific paper consists of the introduction, four chapters, general conclu-sions, references and annexes.
The total volume of the dissertation is 142 pages (without annexes), inclu-ding agenda, 75 pictures and 19 tables.

7
1 Theoretical Framework for the
Measurement of International Trade Competitiveness
Why some countries or sectors are often prospering when the others fall behind? The questions such as these provoke a concern for the competitiveness of countries. Despite the fact that the notion of country’s or industry’s competitive-ness has proven to be debatable, the importance and the attention of scientists, as well as analysts is huge.
The “competitiveness” as a term is still under interpretation. In different scientific sources, i.e. economic or managerial articles, competitiveness is being related on “how countries, regions and companies manage their competencies to achieve long-term growth, generate jobs and increase welfare” (IMD 2014). Arturo Bris, Director IMD World Competitiveness Center and Professor of Fi-nance suggest that “there is no single nation in the world that has succeeded in a sustainable way without preserving the prosperity of its people”. He confirms that “competitiveness is therefore a way towards progress that does not result in winners and losers: when two countries compete, both are better off”.
Competitiveness is not just about growth or economic performance but one should take into account the key factors, which contribute to the ability to com-
8 1. THEORETICAL FRAMEWORK FOR THE MEASUREMENT OF INTERNATIONAL...
pete, such as the quality of life, technology, knowledge, government efficiency, business efficiency, infrastructure etc. (Travkina et al. 2009). Importantly, those key factors are intertwined and, finally, affect countries’ economic growth (Tvaronavičienė 2006) and sustainable development (Lapinskienė, Tvaronavi-čienė 2009).
In the presented chapter the author seeks to explain the theoretical aspects of the competitiveness, especially of the international trade competitiveness, and of its measurement; to summarise the characteristics and synthesize the results of empirical studies; to scrutinize the genesis from the classical theories such as Adam Smith’s absolute advantage to new theories such as Michael Porter’s “diamond model” and to assess their influence primarily on the international trade competitiveness’ measurement; and, finally, to develop theoretical frame-work for the measurement of Lithuanian international trade competitiveness by using suggested indicators.
The chapter has the following structure. In Section 1 the author concentrates on the essential notions of the competitiveness. In Section 2, international trade theories, embracing the earliest, such as mercantilism, and the most recent, such as systemic models of national competitiveness, are critically analysed. The following approach is adopted: author attributes theoretical theories to the three groups, and elaborates sets of factors determining the competitiveness at every distinguished stage. In Section 3, the author’s overview of the evolution of the competitiveness measurement is described. In Section 4, a theoretical framework for the measurement of Lithuanian international trade competitiveness by using suggested indicators is being discussed.
The data presented in the Chapter 1 can be found in the published articles of the author (Travkina, Tvaronavičienė 2010).
1.1. Competitiveness and International Trade
Over the last twenty years the notion ‘competitiveness’ has been widely used, while in some cases in a confusingly disputable way. Actually, the questions that are the core for the concept of competitiveness are, basically, those that econo-mic theorists and policy-makers have been trying to address for centuries: a bet-ter understanding of the issues that are central in order to improve economic well-being and to manage the distribution of wealth (Martin 2003, Martin et al. 2004, Martin 2006).
This concern of competitiveness has rapidly spread across the national, sec-torial, regional and local discussions. Growing interest has emerged in the com-prising elements of countries’ economies aiming to enhance the competitiveness
1. THEORETICAL FRAMEWORK FOR THE MEASUREMENT OF INTERNATIONAL... 9
of every firm, industrial sector and major city, what consequently means the competitiveness of the national economy as a whole.
In Lithuania, for example, the government has emphasized the increasing importance of the competitiveness of the country. Foreign trade and its deve-lopment are seen as a part of the state economic policy (Ministry of Economy of the Republic of Lithuania 2003, 2008, 2014).
However, this natural attention to competitiveness raises an array of ques-tions about perception and measurement of competitiveness at countries, re-gion’s and industrial sector’s levels. In what respect different speakers discuss country’s competitiveness? In what sense do countries and sectors compete? The usual practice is that neither economists nor policy-makers arrange their discus-sions about national growth and development, covering the context of competi-tiveness. This situation began to change quite recently (Porter 1998, 2003, 2008, 2014; Gardiner et al. 2004, 2011). However, general consensus about the nature and measurement of international trade competitiveness has not been found yet. International trade competitiveness criteria have to reflect on the suc-cess of the sectors to compete with one another over the shares of national and, especially, global export markets. This approach seems to be supported by the European Commission's attitude, by which “competitiveness is the ability to produce goods and services which meet the test of International markets, while at the same time maintaining high and sustainable levels of income or, more generally, the ability of (sectors) to generate, while being exposed to external competition, relatively high income and employment levels” (European Commission 1999).
Taking into account the fact that particular economic sectors are more open in the sense of trade than the entirely taken national economy, the emphasis on the export seems to have solid grounds. As Rowthorn, for example, asserts, “the prosperity of a region is determined primarily by the strength of its export base; i.e. all those activities which bring income into the region by providing a good or service to the outside world” (Rowthorn 1987, 1999).
The opinion could be supported that reduction in the size of certain sector export base, or impairment in certain sector trade balance, or both, would signal a decline in national competitiveness. This approach is very similar to the one that is found in many definitions of national competitiveness, as for example, in the Lithuanian (LT) long-run strategy (2007), where national competitiveness is defined as “our ability to produce goods and services that meet the testing of in-ternational competition” (Ministry of Economy of the Republic of Lithua-nia 2003, 2007, 2014).
Though, Krugman (1990, 1994, and 1996) and others (Cohen, 1994; Prestowitz, 1994; Thurow, 1994; Scharping 1994) warn that “concerns about competitiveness are, as an empirical matter, almost always completely un-
10 1. THEORETICAL FRAMEWORK FOR THE MEASUREMENT OF INTERNATIONAL...
founded. The obsession with competitiveness is not only wrong, but dangerous thinking in terms of competitiveness leads to bad economic policies on a range of issues” (Krugman 1994). Krugman immerses into discussion on national competitiveness. He proposes to look at economy’s comprising components as “the analogy between a country and a corporation is reasonable”; whereas, for example, an unsuccessful firm will ultimately go out of business, but there is no an equivalent “bottom line” for a country. Krugman states that “interna-tional trade is not a zero-sum game“, on the understanding that corporations can compete for the market share, and one firm's success will often be at the expense of another. However, he thinks, the success of one country creates ra-ther than destroys opportunities for others. Finally, he indicates, that if com-petitiveness has any meaning, then it is simply another way of saying produc-tivity; because “the growth rate of living standards essentially equals the growth rate of domestic productivity, not productivity relative to competitors, but simply domestic productivity”. Krugman’s questionable perspective on competitiveness dates back to a 1994 “Foreign Affairs” article “Competitive-ness. A Dangerous Obsession,” in which he made the utterly astounding con-tention (mentioned before). It is not changed until now: today Paul Krugman (2011) argues that ‘competitiveness’ is a myth, a bad metaphor, a fundamen-tally misleading goal.
Michael Porter, who is the pioneer of competitiveness theory, suggests that the best measure of competitiveness is productivity: “The competitiveness, then, is measured by productivity. Productivity allows a Nation to support high wages, a strong currency and attractive returns to capital, and with them a high standard of living” (Porter, Ketels 2003; Delgado, Ketels, Porter, Stern 2012).
These considerations are similar to all sectors engaged in international trade. The author agrees that notion of sector competitiveness is not the same as for region. Identification of provided notions is neither macro-economically nor microeconomically based: sectors are neither simple aggregation of firms nor are they scaled-down versions of nations (Snieška, Bruneckienė 2009).
Despite the fundamental questions and dilemmas about the conceptual defi-nition of competitiveness, the literature survey has highlighted the other methods of competitiveness perception: if taken them into account (Esser et al. 1995), the nation competitiveness can also be analyzed by distinguishing levels (microeco-nomic, mezzo economic, macroeconomic, and mega economic), spheres (tech-nology, economy, policy, society, and ecology), and time perspective (short-, middle- and long-range time spans).
A new approach, having today the considerable number of followers (most of them are in the United States and Canada), suggested that competi-tiveness should “be based on the operating framework of universal sustaina-bility” (Lattimer 2012). The scientists assumed that competitiveness is only
1. THEORETICAL FRAMEWORK FOR THE MEASUREMENT OF INTERNATIONAL... 11
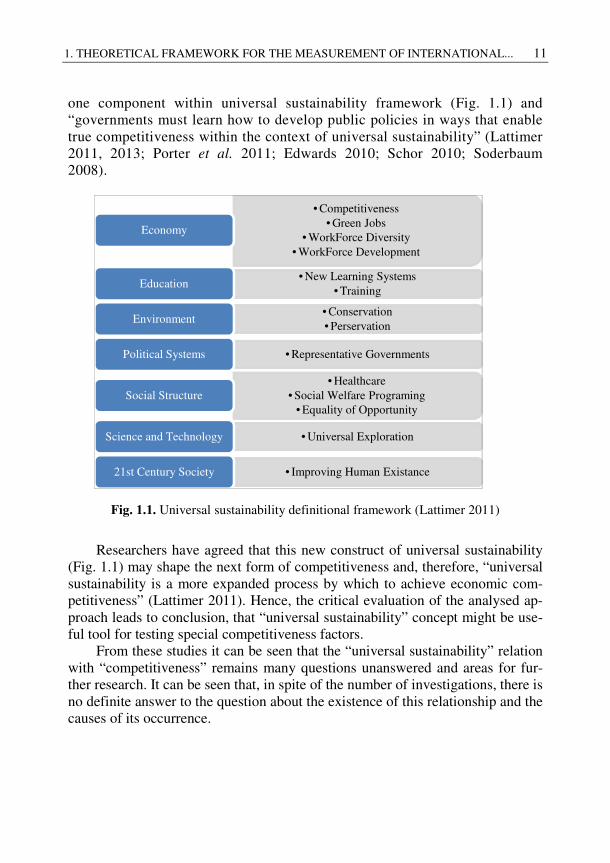
one component within universal sustainability framework (Fig. 1.1) and “governments must learn how to develop public policies in ways that enable true competitiveness within the context of universal sustainability” (Lattimer 2011, 2013; Porter et al. 2011; Edwards 2010; Schor 2010; Soderbaum 2008).
Fig. 1.1. Universal sustainability definitional framework (Lattimer 2011)
Researchers have agreed that this new construct of universal sustainability (Fig. 1.1) may shape the next form of competitiveness and, therefore, “universal sustainability is a more expanded process by which to achieve economic com-petitiveness” (Lattimer 2011). Hence, the critical evaluation of the analysed ap-proach leads to conclusion, that “universal sustainability” concept might be use-ful tool for testing special competitiveness factors.
From these studies it can be seen that the “universal sustainability” relation with “competitiveness” remains many questions unanswered and areas for fur-ther research. It can be seen that, in spite of the number of investigations, there is no definite answer to the question about the existence of this relationship and the causes of its occurrence.
• Competitiveness• Green Jobs
• WorkForce Diversity• WorkForce Development
Economy
• New Learning Systems• Training
Education
• Conservation• Perservation
Environment
• Representative GovernmentsPolitical Systems
• Healthcare• Social Welfare Programing
• Equality of OpportunitySocial Structure
• Universal ExplorationScience and Technology
• Improving Human Existance21st Century Society
12 1. THEORETICAL FRAMEWORK FOR THE MEASUREMENT OF INTERNATIONAL...
1.2. Genesis of Competitiveness
The presented Chapter focuses attention on the pattern of international trade competitiveness; a notion, which has been used more seldom, and clarification of which has been even more complicated. To start with, a definition of interna-tional trade competitiveness comes from the Smith’s trade theory. The theoreti-cal overview starting from the trade theory and embracing the competitiveness theory will help to detect concepts and elements that would facilitate clarifying and understanding of the driving factors determining international trade com-petitiveness.
Every of the following major groups of economic theories provides frame-works of direct relevance to any discussion on international trade competitive-ness (Table 1.1.):
1. The first group: classical and neo-classical theories. 2. The second group: the new trade theory, development economics and
growth theory. 3. The third group: the Keynesian economic theory.
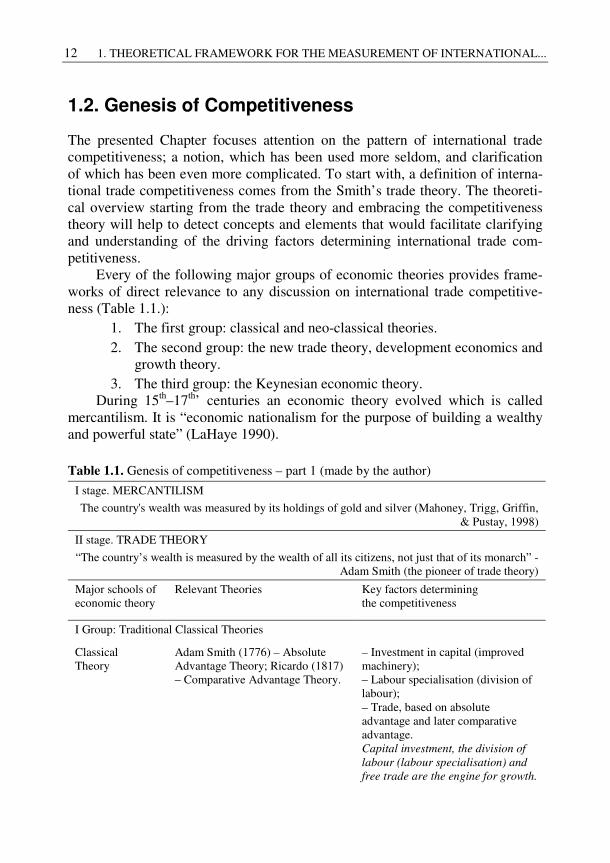
During 15th–17th’ centuries an economic theory evolved which is called mercantilism. It is “economic nationalism for the purpose of building a wealthy and powerful state” (LaHaye 1990). Table 1.1. Genesis of competitiveness – part 1 (made by the author)
I stage. MERCANTILISM
The country's wealth was measured by its holdings of gold and silver (Mahoney, Trigg, Griffin, & Pustay, 1998)
II stage. TRADE THEORY
“The country’s wealth is measured by the wealth of all its citizens, not just that of its monarch” - Adam Smith (the pioneer of trade theory)
Major schools of economic theory
Relevant Theories Key factors determining the competitiveness
I Group: Traditional Classical Theories
Classical Theory
Adam Smith (1776) – Absolute Advantage Theory; Ricardo (1817) – Comparative Advantage Theory.
– Investment in capital (improved machinery); – Labour specialisation (division of labour); – Trade, based on absolute advantage and later comparative advantage. Capital investment, the division of
labour (labour specialisation) and
free trade are the engine for growth.
1. THEORETICAL FRAMEWORK FOR THE MEASUREMENT OF INTERNATIONAL... 13
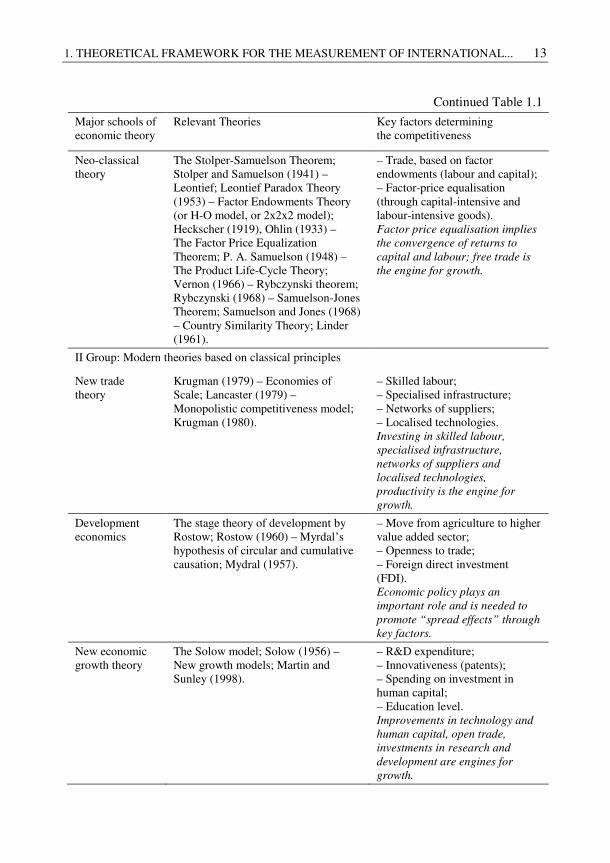
Continued Table 1.1
Major schools of economic theory
Relevant Theories Key factors determining the competitiveness
Neo-classical theory
The Stolper-Samuelson Theorem; Stolper and Samuelson (1941) – Leontief; Leontief Paradox Theory (1953) – Factor Endowments Theory (or H-O model, or 2x2x2 model); Heckscher (1919), Ohlin (1933) – The Factor Price Equalization Theorem; P. A. Samuelson (1948) – The Product Life-Cycle Theory; Vernon (1966) – Rybczynski theorem; Rybczynski (1968) – Samuelson-Jones Theorem; Samuelson and Jones (1968) – Country Similarity Theory; Linder (1961).
– Trade, based on factor endowments (labour and capital); – Factor-price equalisation (through capital-intensive and labour-intensive goods). Factor price equalisation implies
the convergence of returns to
capital and labour; free trade is
the engine for growth.
II Group: Modern theories based on classical principles
New trade theory
Krugman (1979) – Economies of Scale; Lancaster (1979) – Monopolistic competitiveness model; Krugman (1980).
– Skilled labour; – Specialised infrastructure; – Networks of suppliers; – Localised technologies. Investing in skilled labour,
specialised infrastructure,
networks of suppliers and
localised technologies,
productivity is the engine for
growth.
Development economics
The stage theory of development by Rostow; Rostow (1960) – Myrdal’s hypothesis of circular and cumulative causation; Mydral (1957).
– Move from agriculture to higher value added sector; – Openness to trade; – Foreign direct investment (FDI). Economic policy plays an
important role and is needed to
promote “spread effects” through
key factors.
New economic growth theory
The Solow model; Solow (1956) – New growth models; Martin and Sunley (1998).
– R&D expenditure; – Innovativeness (patents); – Spending on investment in human capital; – Education level. Improvements in technology and
human capital, open trade,
investments in research and
development are engines for
growth.
14 1. THEORETICAL FRAMEWORK FOR THE MEASUREMENT OF INTERNATIONAL...
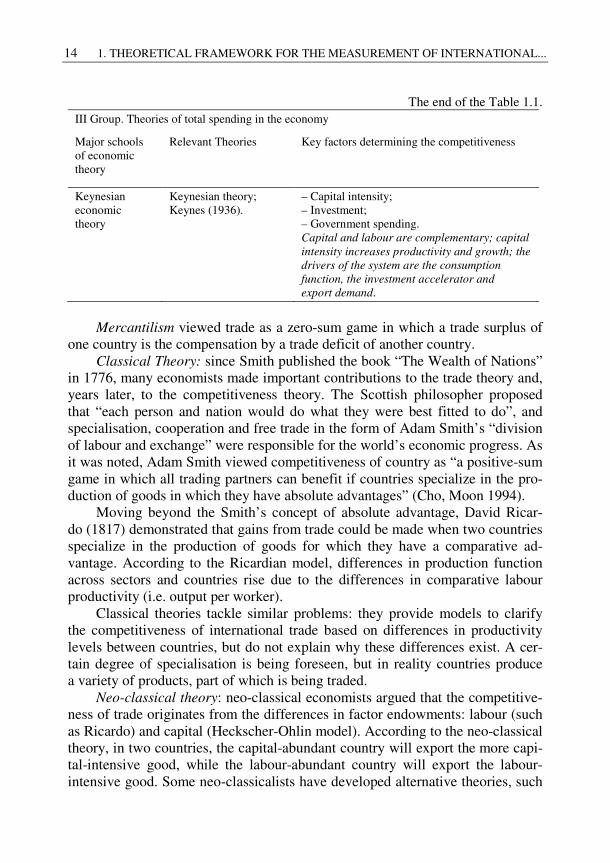
The end of the Table 1.1. III Group. Theories of total spending in the economy
Major schools of economic theory
Relevant Theories Key factors determining the competitiveness
Keynesian economic theory
Keynesian theory; Keynes (1936).
– Capital intensity; – Investment; – Government spending. Capital and labour are complementary; capital
intensity increases productivity and growth; the
drivers of the system are the consumption
function, the investment accelerator and
export demand.
Mercantilism viewed trade as a zero-sum game in which a trade surplus of
one country is the compensation by a trade deficit of another country. Classical Theory: since Smith published the book “The Wealth of Nations”
in 1776, many economists made important contributions to the trade theory and, years later, to the competitiveness theory. The Scottish philosopher proposed that “each person and nation would do what they were best fitted to do”, and specialisation, cooperation and free trade in the form of Adam Smith’s “division of labour and exchange” were responsible for the world’s economic progress. As it was noted, Adam Smith viewed competitiveness of country as “a positive-sum game in which all trading partners can benefit if countries specialize in the pro-duction of goods in which they have absolute advantages” (Cho, Moon 1994).
Moving beyond the Smith’s concept of absolute advantage, David Ricar-do (1817) demonstrated that gains from trade could be made when two countries specialize in the production of goods for which they have a comparative ad-vantage. According to the Ricardian model, differences in production function across sectors and countries rise due to the differences in comparative labour productivity (i.e. output per worker).
Classical theories tackle similar problems: they provide models to clarify the competitiveness of international trade based on differences in productivity levels between countries, but do not explain why these differences exist. A cer-tain degree of specialisation is being foreseen, but in reality countries produce a variety of products, part of which is being traded.
Neo-classical theory: neo-classical economists argued that the competitive-ness of trade originates from the differences in factor endowments: labour (such as Ricardo) and capital (Heckscher-Ohlin model). According to the neo-classical theory, in two countries, the capital-abundant country will export the more capi-tal-intensive good, while the labour-abundant country will export the labour-intensive good. Some neo-classicalists have developed alternative theories, such
1. THEORETICAL FRAMEWORK FOR THE MEASUREMENT OF INTERNATIONAL... 15
as Leontief paradox, product cycle, country similarity and economies of scale (Cho, Moon 1994; Martin 2003), which are still widely used for practical pur-poses in scientific research.
Noticeable, that none of these discussed traditional theories is forgotten. For example, mercantilist terminology is used today; this is seen for example when the media reports that a country was exposed to “unfavorable balance of trade”, i.e. its export was lesser than its imports. The theory of comparative advantage is a basic tool for many countries, when they choose sectorial and trade policies. However, no single theory complies with the needs of competitiveness estima-tion.
Traditional Classical Theories (the first group) consider the competitive-ness of international trade only in the medium run (AD-AS model) because of the relationship of demand and supply with two-dimensional factor endow-ments: labour and capital.
New trade theory: it was initially associated with Paul Krugman (1970); and it contains economic criticism of international free trade theory. New trade theorists assert that the comparative advantage theory can be used when arguing against being “natural” or “endowed” as a synonym to the competitive (such as assumed by the traditional theory). According to the new trade theory’s propo-nents, factors influencing comparative advantage are skilled labour, specialised infrastructure, networks of suppliers and localised technologies (Martin 2003).
Development economics: the theory deals with economics of the develop-ment process in low-income countries. Improving the potential for the mass of the population due to effectiveness of aid, free trade and foreign is the engine for economic growth (Rostow 1960).
Growth Economy: the growth theory (either new growth theory, or endoge-nous growth theory) was developed as a result of the debates around the neo-classical growth model. The accumulation of knowledge, the formalisation of the importance of human capital are key driving factors for increasing returns and have an impact on the long-run growth of an economy (Paul 1980; Weil 2005).
Modern Theories, based on classical principles (the second group) discuss the competitiveness of international trade only in the medium run (AD-AS model) or in the long run. In the medium run the competitiveness is measured by productivity, which, in its turn, is defined not only with two factors (such as labour and capital), but also takes into account unemployment rate, in-flation, interest rate, output fluctuations (sometimes called business cycles) and other factors. In the long run the competitiveness is one of the main factors that determine economic growth.
Keynesian economic theory: is the theory different from classical econo-mics and growth theory on rather essential points (Keynes 1936). Keynes did not
16 1. THEORETICAL FRAMEWORK FOR THE MEASUREMENT OF INTERNATIONAL...
believe that prices cleared markets at all time. According to Keynesian theory, changes aggregate demand, whether anticipated or unanticipated, and have their greatest short-run effect on real output and employment, but not on prices (Blinder 1991).
The theory of total spending in the economy (the third group) affects the competitiveness of international trade in the short run, but not in the medium run or the long run.
1.3. Types of Competitiveness Measurement
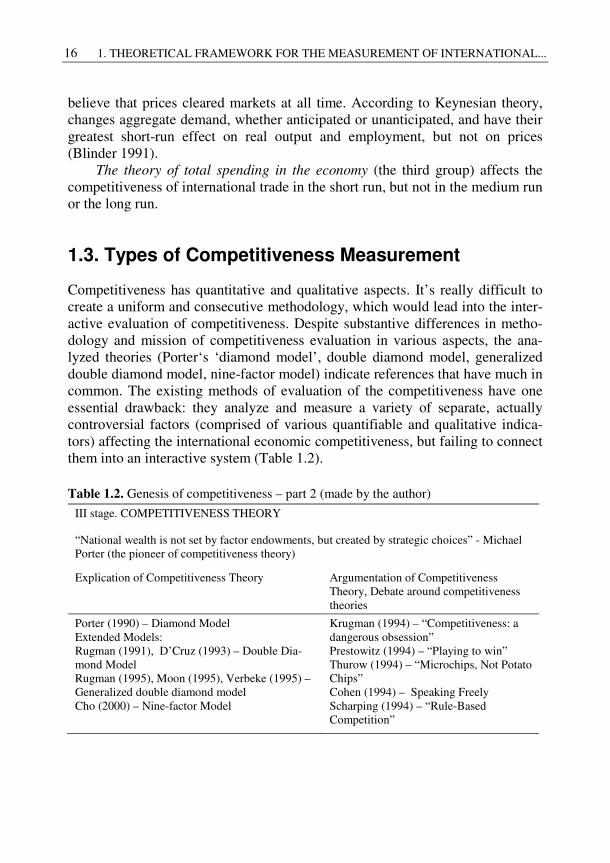
Competitiveness has quantitative and qualitative aspects. It’s really difficult to create a uniform and consecutive methodology, which would lead into the inter-active evaluation of competitiveness. Despite substantive differences in metho-dology and mission of competitiveness evaluation in various aspects, the ana-lyzed theories (Porter‘s ‘diamond model’, double diamond model, generalized double diamond model, nine-factor model) indicate references that have much in common. The existing methods of evaluation of the competitiveness have one essential drawback: they analyze and measure a variety of separate, actually controversial factors (comprised of various quantifiable and qualitative indica-tors) affecting the international economic competitiveness, but failing to connect them into an interactive system (Table 1.2).
Table 1.2. Genesis of competitiveness – part 2 (made by the author)
III stage. COMPETITIVENESS THEORY
“National wealth is not set by factor endowments, but created by strategic choices” - Michael Porter (the pioneer of competitiveness theory)
Explication of Competitiveness Theory Argumentation of Competitiveness Theory, Debate around competitiveness theories
Porter (1990) – Diamond Model Extended Models: Rugman (1991), D’Cruz (1993) – Double Dia-mond Model Rugman (1995), Moon (1995), Verbeke (1995) – Generalized double diamond model Cho (2000) – Nine-factor Model
Krugman (1994) – “Competitiveness: a dangerous obsession” Prestowitz (1994) – “Playing to win” Thurow (1994) – “Microchips, Not Potato Chips” Cohen (1994) – Speaking Freely Scharping (1994) – “Rule-Based Competition”
1. THEORETICAL FRAMEWORK FOR THE MEASUREMENT OF INTERNATIONAL... 17
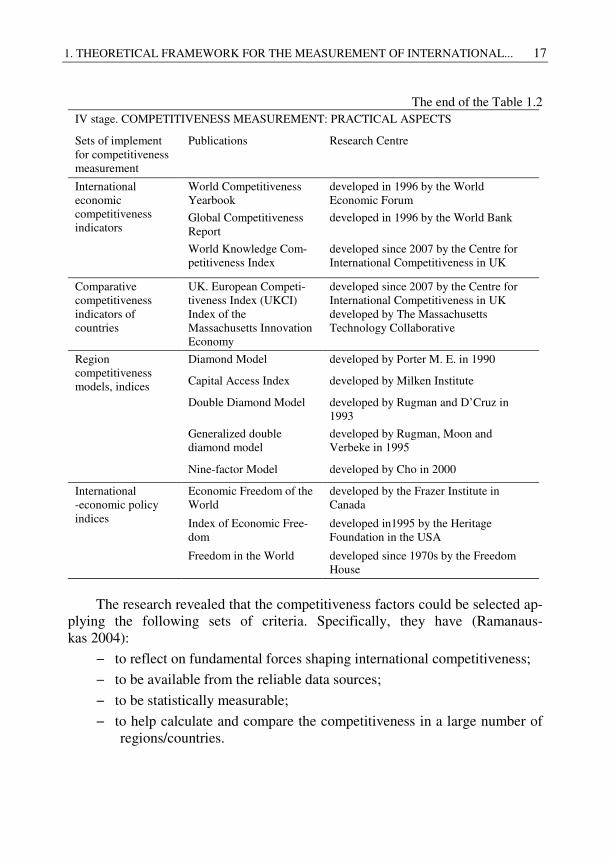
The end of the Table 1.2 IV stage. COMPETITIVENESS MEASUREMENT: PRACTICAL ASPECTS
Sets of implement for competitiveness measurement
Publications Research Centre
International economic competitiveness indicators
World Competitiveness Yearbook
developed in 1996 by the World Economic Forum
Global Competitiveness Report
developed in 1996 by the World Bank
World Knowledge Com-petitiveness Index
developed since 2007 by the Centre for International Competitiveness in UK
Comparative competitiveness indicators of countries
UK. European Competi-tiveness Index (UKCI) Index of the Massachusetts Innovation Economy
developed since 2007 by the Centre for International Competitiveness in UK developed by The Massachusetts Technology Collaborative
Region competitiveness models, indices
Diamond Model developed by Porter M. E. in 1990
Capital Access Index developed by Milken Institute
Double Diamond Model developed by Rugman and D’Cruz in 1993
Generalized double diamond model
developed by Rugman, Moon and Verbeke in 1995
Nine-factor Model developed by Cho in 2000
International -economic policy indices
Economic Freedom of the World
developed by the Frazer Institute in Canada
Index of Economic Free-dom
developed in1995 by the Heritage Foundation in the USA
Freedom in the World developed since 1970s by the Freedom House
The research revealed that the competitiveness factors could be selected ap-
plying the following sets of criteria. Specifically, they have (Ramanaus-kas 2004):
− to reflect on fundamental forces shaping international competitiveness;
− to be available from the reliable data sources;
− to be statistically measurable;
− to help calculate and compare the competitiveness in a large number of regions/countries.
18 1. THEORETICAL FRAMEWORK FOR THE MEASUREMENT OF INTERNATIONAL...
Generalizing, defining and measuring competitiveness should allow to pre-venting:
− the loss of time and other resources trying to enhance country’s competi-tiveness;
− the shift towards protectionism and trade wars and/or to worsened state policy.
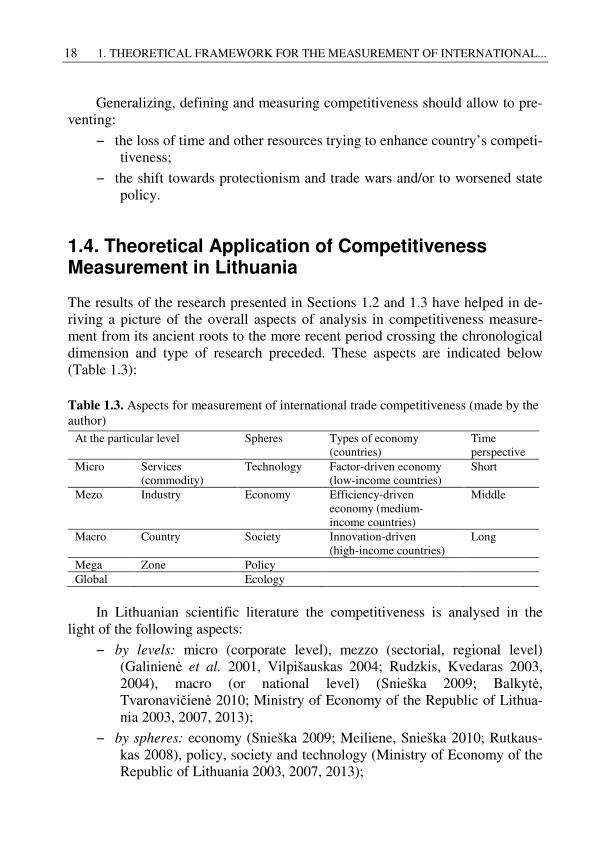
1.4. Theoretical Application of Competitiveness Measurement in Lithuania
The results of the research presented in Sections 1.2 and 1.3 have helped in de-riving a picture of the overall aspects of analysis in competitiveness measure-ment from its ancient roots to the more recent period crossing the chronological dimension and type of research preceded. These aspects are indicated below (Table 1.3): Table 1.3. Aspects for measurement of international trade competitiveness (made by the author)
At the particular level Spheres Types of economy (countries)
Time perspective
Micro Services (commodity)
Technology Factor-driven economy (low-income countries)
Short
Mezo Industry Economy Efficiency-driven economy (medium-income countries)
Middle
Macro Country Society Innovation-driven (high-income countries)
Long
Mega Zone Policy Global Ecology
In Lithuanian scientific literature the competitiveness is analysed in the
light of the following aspects:
− by levels: micro (corporate level), mezzo (sectorial, regional level) (Galinienė et al. 2001, Vilpišauskas 2004; Rudzkis, Kvedaras 2003, 2004), macro (or national level) (Snieška 2009; Balkytė, Tvaronavičienė 2010; Ministry of Economy of the Republic of Lithua-nia 2003, 2007, 2013);
− by spheres: economy (Snieška 2009; Meiliene, Snieška 2010; Rutkaus-kas 2008), policy, society and technology (Ministry of Economy of the Republic of Lithuania 2003, 2007, 2013);
1. THEORETICAL FRAMEWORK FOR THE MEASUREMENT OF INTERNATIONAL... 19
− by time perspective: medium (Snieška 2009; Meilienė, Snieška 2010), long (Ministry of Economy of the Republic of Lithuania 2003, 2007, 2013).
The research carried out by the listed authors has proven that in scientific literature competitiveness of Lithuanian international trade is analysed in a num-ber of ways:
1. According to the traditional classical theories: by the competition in-tensity level in a different market (Snieška, Šliburytė 2000), by busi-ness structure or market demand (Kvainauskaitė, Snieška 2002; Kvainauskaitė et al. 2003), by the measured comparative advantage (Čiburienė, Zaharieva 2004).
2. According to the modern theories, based on medium run: by course of exchange, norms of interests, balance of foreign trade, technologi-cal innovations (Maksvytienė, Urbonas 2001), by outsourcing of knowledge process (Snieška, Drakštaitė 2007) and, respectively, ba-sed on long run: by factors included into Porter‘s model (Startienė, Genytė 2004).
The International trade competitiveness can be measured in different ways: analyzing one or several factors of competitiveness, using theoretical models of competitiveness, creating composite indices, etc. The analysis of the main prob-lems of competitiveness measurement (Simanaviciene et al. 2007, Kitson et al. 2004, de Vet et al. 2004, Huggins, 2003, Lengyel, 2003) showed that competitiveness cannot be completely defined by one or several economic and social indicators. Thus, complex measurement of competitiveness is necessary.
Based on empirical research, the European Commission studies highlighted the periods for competitiveness measurement according to the time perspective: “long term” is generally a minimum of 10 years (if the report is prepared at country or manufacturing levels) and/or suggested 10 to 25 years (if the analysis is performed from a global or zonal perspective); “short-term” outlook prepared by the European Commission reflects the view and opinion from 1–2 years perspective; and the “middle-term” period would include the overview from 3–10 years perspective.
The research proved that the measurement by a composite index helps to solve the problem of complexity. A group of scientists (Giovannini et al. 2005; Saisana et al. 2005; Wignaraja et al. 2004; IMD, 2004; Freudenberg, 2003, Huggins, 2003) defines a composite index as an artificially made-up instrument of quantitative and qualitative measurement of a particular sphere. The index consists of sub-indicators; hence, the objects under examination can be ranked on the ground of it. It is emphasized that multi-criteria conceptions (i.e. competi-tiveness, industrialization, coherence, the integration of markets, the develop-ment of knowledge society, etc.) are measured by the index most accurately, as
20 1. THEORETICAL FRAMEWORK FOR THE MEASUREMENT OF INTERNATIONAL...
they cannot be measured by a single index only. The critical analysis of the measurement by the index, prepared by Snieška and Bruneckiene (2009), allow to distinguishing its advantages and drawbacks. The authors of the mentioned research doubt that scientific discussions about the measurement of particular spheres by the index will end up, however, they envisage more advantages than drawbacks to it. It is predicted that indices will continue to be widely applied in the future in the measurement of multi-criteria conceptions because of the bene-fit which indices provide as a means of conveyance and analysis.
1.5. Conclusions of the Chapter 1 and Formulation of the Tasks of the Dissertation
Chapter 1 provides a comprehensive survey of the literature, discussing the con-cept of competitiveness. The results of Chapter 1 can be summarised as follows:
1. The notion of “competitiveness” has been widely used, while, in some cases, it is misunderstood. The most commonly-used notion is related to “the ability to produce goods and services which meet the requirements of international markets”. However, many scientists consider that “the obsession with competitiveness is not only wrong but dangerous”. They suggest simplifying the interpretation of competitiveness and think that the best measure of competitiveness is productivity. A new ap-proach, having a considerable number of followers today, suggests that competitiveness should “be based on the operating framework of uni-versal sustainability” (this approach leaves many questions unanswered and is an area for further research).
2. Based on the theoretical aspects of competitiveness measurement, two distinguishable strands are being discussed. One strand contains the literature analyzing international trade competitiveness as a ne-cessarily dynamic and evolutionary concept. Another strand of literature focuses on particular drivers, determining the competitiveness of trade.
3. The results of the study show that the competitiveness of Lithuanian in-ternational trade can be measured by applying classical and neo-classical theories. Considering the listed theoretical findings related to the measurement of international trade competitiveness of small open economy countries, the author suggests using modern theories based on classical principles, providing the theoretical foundation for a new trade theory of productivity growth (strongly influenced by the Krugman hy-pothesis), along with the new economic growth theory. In particular, the strand of sample empirical literature related to productivity of input fac-
1. THEORETICAL FRAMEWORK FOR THE MEASUREMENT OF INTERNATIONAL... 21
tors (further – “productivity aspect”, “productivity approach” or “productivity factors”) and various classifications of the exported goods (further – “aspects of various classifications of the exported goods”).
4. The author identified the aspects for measuring the export competitive-ness: in further Chapters the export of goods and services of small open economy (such as an object) will be analysed in the economic sphere and from the short-run and middle-run perspectives (until the 5-year pe-riod). The factors determining export competitiveness will be evaluated at the mezzo level, i.e. at the major exporters’ level, as well as at the level of manufacturing and export of goods.

23
2 Lithuanian Export and
Manufacturing
The relationships between export competitiveness and particular determined fac-tors as productivity and various classifications of exported goods are complex to analyze. Since the late 1990s debates on these relationships have been strongly influenced by the Krugman hypothesis, which states that the competitiveness could be measured directly based on productivity. In this Chapter it is assumed that export competitiveness is a derivative from export structural change by four various classification systems and productivity of the main factors; therefore, properly presented and juxtaposed data on labour, capital and energy productivi-ty would provide new insights on a character of relations between export com-petitiveness and productivity of the main factors of production.
Chapter 2 has the following structure. In Section 2.1, international trade reforms in Lithuania for the period of 25 years are being discussed. In Sec-tion 2.2, peculiarities of export structure in Lithuania based on different types of classification are examined and trend analysis is introduced. In Sec-tion 2.3, the specificity of manufacturing structure in Lithuania is presented and the concept of exporting manufacturing sectors is applied. In Section 2.4, three factors of production, such as labour-capital-energy, used by Lithua-nian manufacturing, are being critically analysed and their productivity for
24 2. LITHUANIAN EXPORT AND MANUFACTURING
the period of 15 years together with trends and possible implications on the ex-port competitiveness are presented.
The analysis presented in the Chapter 2 can be found in the previously pub-lished articles by the author (Travkina et al. 2009; Travkina, Tvaronavi-čienė 2011; Travkina, Tvaronavičienė 2015).
2.1. International Trade Reforms in Lithuania
According to the definition (Investopedia), international trade is the exchange of capital, goods and services across international borders or territories. Interna-tional trade represents a significant share of gross domestic product (GDP). While foreign trade theories, embracing the earliest, such as mercantilism, are presented throughout the history (Chapter 1), its economic, social, and political importance has been on the rise in recent centuries. Industrialization, transna-tional corporations, advanced transportation, outsourcing and globalization have a significant impact on the international trade system (Travkina 2008).
Lithuania became an independent state in 1990, what has led to radical po-litical, economic and social changes in foreign trade, which were partially de-termined by change of economic policy and new agreements. Specifically, foreign trade was liberalized due to the number of unilateral decisions and trea-ties, which created the current Lithuanian foreign trade framework and trade po-licy-making structure.
In this section the author concentrates on the external factors that affect Lithuania’s international trade with a special focus on the industrial sector. The analysis of the Lithuanian foreign trade development according to the re-forms mentioned earlier and using the statistical data is made looking at the four stages (Travkina et al. 2011):
− the first period, after the reclaimed Declaration of Independence (1990–1997);
− the second period, during and after the crisis in Russia and other CIS (1998–2003);
− the third period, after the accession to the EU (2004–2008);
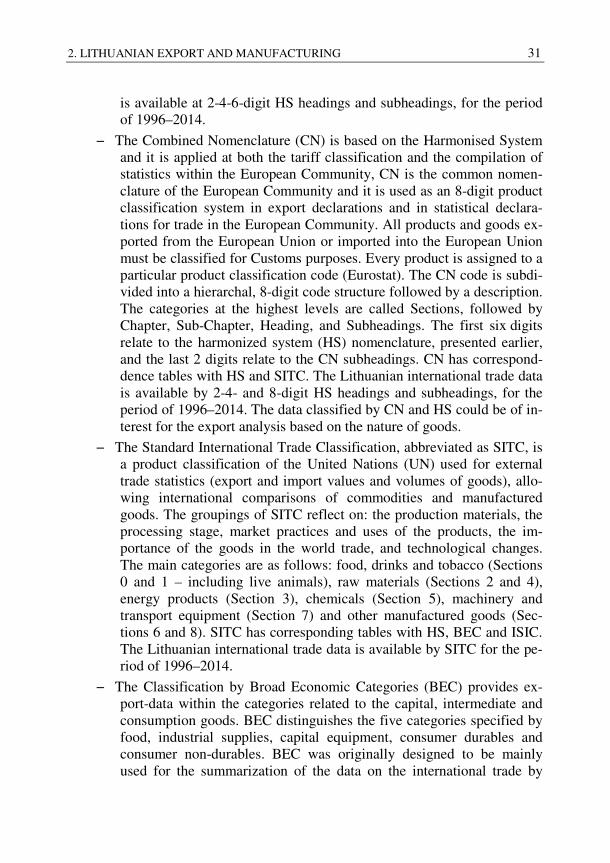
− the fourth period, after the financial crisis (2009–2013). During first three stages considered by the author trade volumes were in-
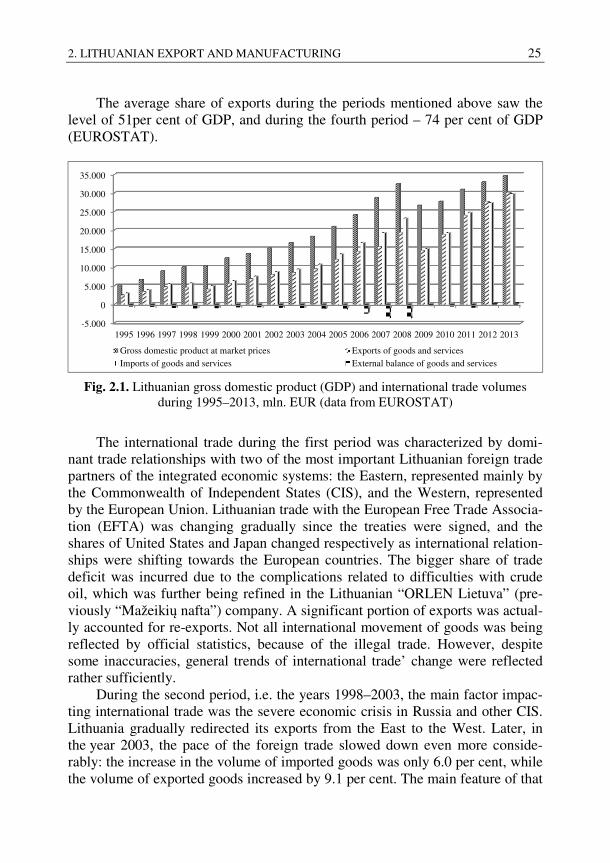
creased, and trade balance was negative (Fig. 2.1). The trade balance was posi-tive for the first time after the Declaration of Independence only in 2012, as well as the export volume that returned to the pre-crisis level. It should be noted that the GDP volume returned to the pre-crisis level after 3 years, and the export volume – after 2 years.
2. LITHUANIAN EXPORT AND MANUFACTURING 25
The average share of exports during the periods mentioned above saw the level of 51per cent of GDP, and during the fourth period – 74 per cent of GDP (EUROSTAT).
Fig. 2.1. Lithuanian gross domestic product (GDP) and international trade volumes
during 1995–2013, mln. EUR (data from EUROSTAT)
The international trade during the first period was characterized by domi-nant trade relationships with two of the most important Lithuanian foreign trade partners of the integrated economic systems: the Eastern, represented mainly by the Commonwealth of Independent States (CIS), and the Western, represented by the European Union. Lithuanian trade with the European Free Trade Associa-tion (EFTA) was changing gradually since the treaties were signed, and the shares of United States and Japan changed respectively as international relation-ships were shifting towards the European countries. The bigger share of trade deficit was incurred due to the complications related to difficulties with crude oil, which was further being refined in the Lithuanian “ORLEN Lietuva” (pre-viously “Mažeikių nafta”) company. A significant portion of exports was actual-ly accounted for re-exports. Not all international movement of goods was being reflected by official statistics, because of the illegal trade. However, despite some inaccuracies, general trends of international trade’ change were reflected rather sufficiently.
During the second period, i.e. the years 1998–2003, the main factor impac-ting international trade was the severe economic crisis in Russia and other CIS. Lithuania gradually redirected its exports from the East to the West. Later, in the year 2003, the pace of the foreign trade slowed down even more conside-rably: the increase in the volume of imported goods was only 6.0 per cent, while the volume of exported goods increased by 9.1 per cent. The main feature of that
-5.000
0
5.000
10.000
15.000
20.000
25.000
30.000
35.000
1995 1996 1997 1998 1999 2000 2001 2002 2003 2004 2005 2006 2007 2008 2009 2010 2011 2012 2013
Gross domestic product at market prices Exports of goods and servicesImports of goods and services External balance of goods and services
26 2. LITHUANIAN EXPORT AND MANUFACTURING
year was the fact that exports grew faster than imports, similarly to the period of 2000–2001. The growth of export would have been even more impressive, if not the overhaul of the “ORLEN Lietuva”.
At the beginning of the third period (2004–2008) a number of factors hin-dered Lithuanian export prospects. Firstly, this was due to the fact that “ORLEN Lietuva” was managed by the Russian oil giant “Yukos” suffered from the ope-rational paralysis and there was a threat of the uncertainty in the oil supply con-tinuity. Secondly, the retardation of export was affected by the political issues: Russian officials restricted reciprocal imports from the European Union (inclu-ding Lithuanian agricultural products). During the third period imports were growing more vigorously as compared to exports. Consequent negative trade balance was rather high.
The author presents some aspects of change in international trade after Lithuania’s joining the European Union in the article “Accession to the Europe-an Union: impact of legislation change on performance of Lithuanian compa-nies” and focuses on implications of the EU accession on competitiveness of New Member States, and specifically, Lithuania. The case study verifies that free trade principle does not automatically guarantee distorted competition between old and new, originating in New Member States companies. Lithuanian accession to the EU coincided with the transformation of the trade regime, what implied restriction of importing possibilities to Lithuania, and, at the same time, Lithuania’s diminished competitiveness in the European market. Economic conflicts between Russia and Poland temporarily changed the situation with the Lithuanian re-export to Russia and helped maintaining export levels similar to earlier international trade levels. To generalize, Lithuania did not express its ac-tive position during the EU accession but rather depended on the political situa-tion. However, the accession without political representation and respective ne-gotiations in the field had worsened Lithuanian competitiveness during European trade regime transformation. As the analysis of particular case study indicates, the EU accession had temporarily hit, for example, banana imports, which gradually obtained recovering tendency (Travkina et al. 2009). Implica-tions of the EU accession on exports were later observed in substantial shift to-wards the European market.
The fourth period (from 2009) presented the international trade difficulties right after the financial crisis of 2007–2008, as well as known as the Global Fi-nancial Crisis. Lithuanian economy crash volume was much deeper than ex-pected: GDP fell by 18.1 per cent year-on-year, mostly in construction and man-ufacturing. Due to the positive impact of the inventory cycle, increasing in foreign demand and private consumption expenditure. Lithuanian economy started stabilizing from the second half of the year 2011. Starting from 2012, a number of the world economies saw the growth weakened again, although the
2. LITHUANIAN EXPORT AND MANUFACTURING 27
economic situation in Lithuania had improved: ~5.9 per cent GDP growth for 2011 one of the highest in the EU (3.7 per cent for 2012, and 3.3 for 2013 – were the highest in the EU as well); employment was growing, whereas unem-ployment was shrinking. From the year 2013 economic growth was somewhat weaker due to slower growth in tradable activities.
2.2. The Specific Features of the Export Structure in Lithuania
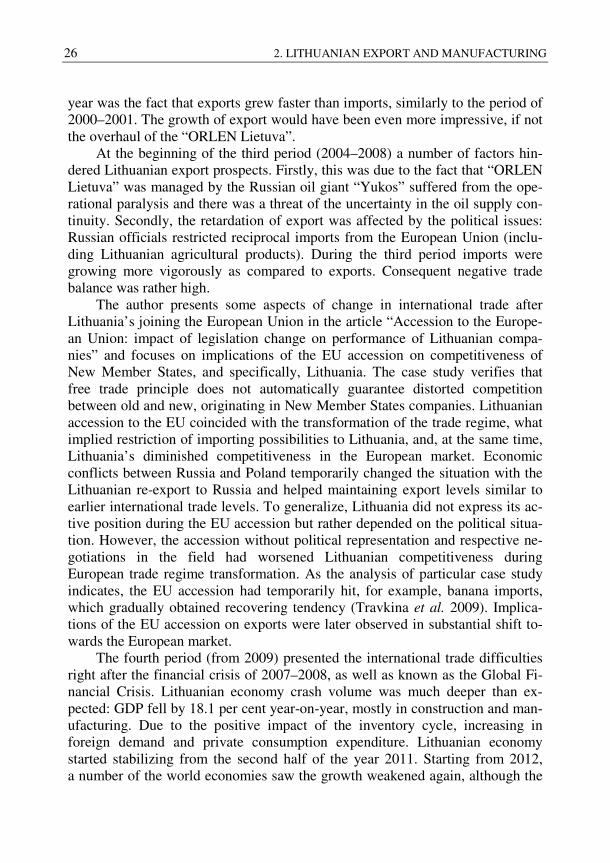
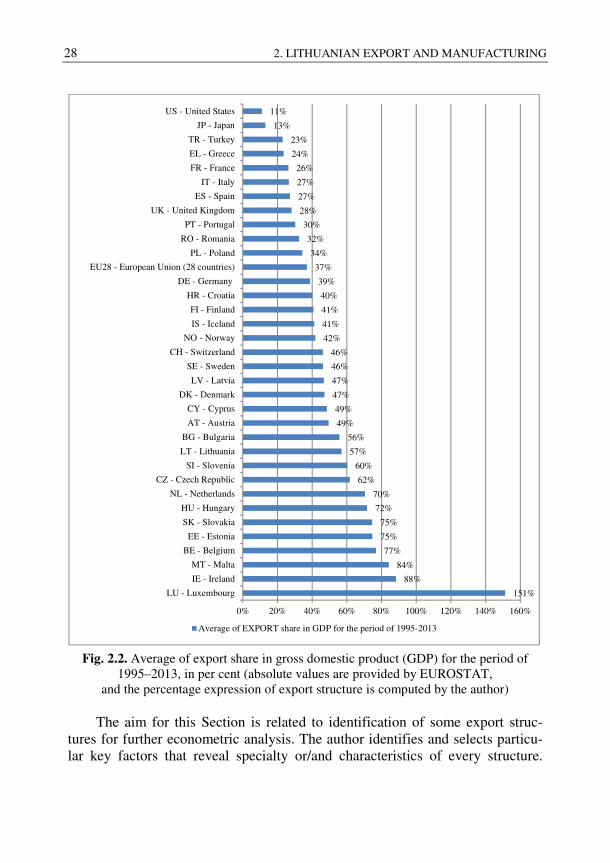
It is noticeable, that the average share of Lithuanian export for the total period of 1996–2013 in the GDP structure accounted for 57 per cent of GDP (see Fig. 2.2), and it is 54 per cent higher than EU-28 average share. Such high ave-rage is a typical indicator for countries with small open economy, whose eco-nomic activities are mostly export-oriented, like in Lithuania or in other Baltic States. The export is one of the main driving forces for such economic struc-tures.
In this Section the export structure’s classification systems and their trends in Lithuania during 1996–2013 year period are discussed. Before doing the trend analysis, classification systems of exported goods will be introduced and ex-plained. Secondly, the author strives to provide a picture of how particular groups of goods were exported during a distinguished time span; to trace tendencies by identifying which goods expanded their exports, and which otherwise – shrank.
As indicated above, in the scientific literature the author found a variety of systems determining export structure. In this Section the author focuses on the following criteria:
− the statistics downloaded from EUROSTAT or Statistics Lithuania offi-cial web-sites;
− the change of the currency into Euro;
− the statistical information used for this research is based on “data adjusted for working day and seasonal effects” only. Seasonally ad-justed Euro zone and EU series are calculated by aggregating the sea-sonally adjusted national data (EUROSTAT);
− the period under examination is 18-year period of 1996–2013;
− only quarterly information was used for this Section’s research. The author aimed to determine the relationship between export and various
types of export structure; and examine if particular classification types of struc-ture demonstrate similar effect on the export analysis.
28 2. LITHUANIAN EXPORT AND MANUFACTURING
Fig. 2.2. Average of export share in gross domestic product (GDP) for the period of
1995–2013, in per cent (absolute values are provided by EUROSTAT, and the percentage expression of export structure is computed by the author)
The aim for this Section is related to identification of some export struc-
tures for further econometric analysis. The author identifies and selects particu-lar key factors that reveal specialty or/and characteristics of every structure.
151%
88%
84%
77%
75%
75%
72%
70%
62%
60%
57%
56%
49%
49%
47%
47%
46%
46%
42%
41%
41%
40%
39%
37%
34%
32%
30%
28%
27%
27%
26%
24%
23%
13%
11%
0% 20% 40% 60% 80% 100% 120% 140% 160%
LU - Luxembourg
IE - Ireland
MT - Malta
BE - Belgium
EE - Estonia
SK - Slovakia
HU - Hungary
NL - Netherlands
CZ - Czech Republic
SI - Slovenia
LT - Lithuania
BG - Bulgaria
AT - Austria
CY - Cyprus
DK - Denmark
LV - Latvia
SE - Sweden
CH - Switzerland
NO - Norway
IS - Iceland
FI - Finland
HR - Croatia
DE - Germany
EU28 - European Union (28 countries)
PL - Poland
RO - Romania
PT - Portugal
UK - United Kingdom
ES - Spain
IT - Italy
FR - France
EL - Greece
TR - Turkey
JP - Japan
US - United States
Average of EXPORT share in GDP for the period of 1995-2013
2. LITHUANIAN EXPORT AND MANUFACTURING 29
The influence of selected factors on export growth, as well as on the export’s competitiveness is considered through econometric analysis in the Chapter 4.
The overview of academic literature, presented in the Chapter 1, has indi-cated particular export classification systems:
1. Export classification based on the nature of exported goods. 2. Export classification based on factor inputs of exported goods. 3. Export classification based on the sectorial composition (output) of
exported goods. 4. Export classification based on the origin of exported goods.
2.2.1. Integrated Systems of Export Classifications
Classifications serve as the basis for data collection and dissemination in any area of statistics. They provide standardized concepts applicable for description of phenomena, such as economic activity, products, expenditures, occupation or health. They are necessary to consistently measure these phenomena within and across countries and geographical regions (Eurostat, 2015).
The author dedicates the introduction to statistical classifications. This Sub-section includes the introduction to the typology of classifications based on the degree of integration between different systems of classifications. This kind of an integrated system allows completing the comparability of statistics produced in different statistical domains. As a consequence, for example, statistics on the production of goods (reported in the EU according to Prodcom surveys) could be compared with statistics on trade (in the EU produced according to CN).
It is noticeable that the beginning of the compilation of an international in-tegrated system of classifications of activities and products related to the resolu-tions adopted by the 17th meeting of the United Nations Statistical Commission (1972) and the 21st meeting of the Conference of European Statisticians (1973) (Eurostat, 2015).
However, today, the key European economic classifications are fully har-monized with the global ones. Under the relevant European regulations, this also applies to the national classifications of the Member States of the European Union and, under the EEA Treaty, to the EFTA-EEA countries. In Europe the requirement for harmonization between the central economic classifications and any special survey classifications are available as well. The central economic classifications thus form the core for an international, European and national group of classifications.
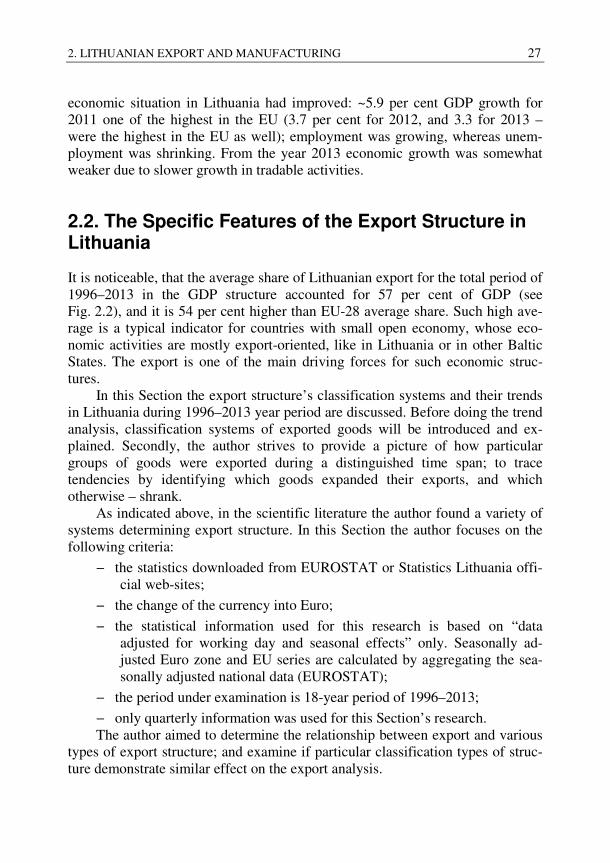
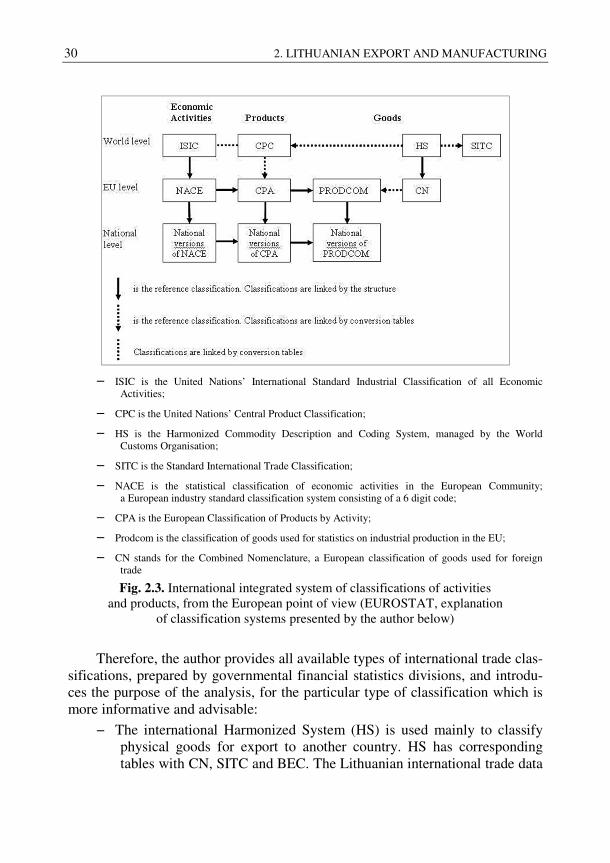
From the European point of view, this system can be represented as follows in Figure 2.3.
30 2. LITHUANIAN EXPORT AND MANUFACTURING
− ISIC is the United Nations’ International Standard Industrial Classification of all Economic
Activities;
− CPC is the United Nations’ Central Product Classification;
− HS is the Harmonized Commodity Description and Coding System, managed by the World Customs Organisation;
− SITC is the Standard International Trade Classification;
− NACE is the statistical classification of economic activities in the European Community; a European industry standard classification system consisting of a 6 digit code;
− CPA is the European Classification of Products by Activity;
− Prodcom is the classification of goods used for statistics on industrial production in the EU;
− CN stands for the Combined Nomenclature, a European classification of goods used for foreign trade Fig. 2.3. International integrated system of classifications of activities
and products, from the European point of view (EUROSTAT, explanation of classification systems presented by the author below)
Therefore, the author provides all available types of international trade clas-sifications, prepared by governmental financial statistics divisions, and introdu-ces the purpose of the analysis, for the particular type of classification which is more informative and advisable:
− The international Harmonized System (HS) is used mainly to classify physical goods for export to another country. HS has corresponding tables with CN, SITC and BEC. The Lithuanian international trade data
2. LITHUANIAN EXPORT AND MANUFACTURING 31
is available at 2-4-6-digit HS headings and subheadings, for the period of 1996–2014.
− The Combined Nomenclature (CN) is based on the Harmonised System and it is applied at both the tariff classification and the compilation of statistics within the European Community, CN is the common nomen-clature of the European Community and it is used as an 8-digit product classification system in export declarations and in statistical declara-tions for trade in the European Community. All products and goods ex-ported from the European Union or imported into the European Union must be classified for Customs purposes. Every product is assigned to a particular product classification code (Eurostat). The CN code is subdi-vided into a hierarchal, 8-digit code structure followed by a description. The categories at the highest levels are called Sections, followed by Chapter, Sub-Chapter, Heading, and Subheadings. The first six digits relate to the harmonized system (HS) nomenclature, presented earlier, and the last 2 digits relate to the CN subheadings. CN has correspond-dence tables with HS and SITC. The Lithuanian international trade data is available by 2-4- and 8-digit HS headings and subheadings, for the period of 1996–2014. The data classified by CN and HS could be of in-terest for the export analysis based on the nature of goods.
− The Standard International Trade Classification, abbreviated as SITC, is a product classification of the United Nations (UN) used for external trade statistics (export and import values and volumes of goods), allo-wing international comparisons of commodities and manufactured goods. The groupings of SITC reflect on: the production materials, the processing stage, market practices and uses of the products, the im-portance of the goods in the world trade, and technological changes. The main categories are as follows: food, drinks and tobacco (Sections 0 and 1 – including live animals), raw materials (Sections 2 and 4), energy products (Section 3), chemicals (Section 5), machinery and transport equipment (Section 7) and other manufactured goods (Sec-tions 6 and 8). SITC has corresponding tables with HS, BEC and ISIC. The Lithuanian international trade data is available by SITC for the pe-riod of 1996–2014.
− The Classification by Broad Economic Categories (BEC) provides ex-port-data within the categories related to the capital, intermediate and consumption goods. BEC distinguishes the five categories specified by food, industrial supplies, capital equipment, consumer durables and consumer non-durables. BEC was originally designed to be mainly used for the summarization of the data on the international trade by
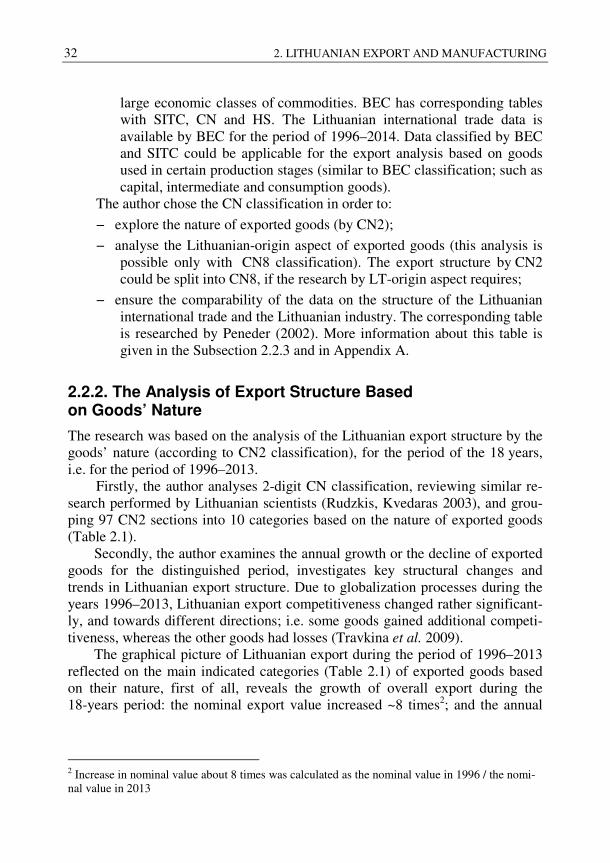
32 2. LITHUANIAN EXPORT AND MANUFACTURING
large economic classes of commodities. BEC has corresponding tables with SITC, CN and HS. The Lithuanian international trade data is available by BEC for the period of 1996–2014. Data classified by BEC and SITC could be applicable for the export analysis based on goods used in certain production stages (similar to BEC classification; such as capital, intermediate and consumption goods).
The author chose the CN classification in order to:
− explore the nature of exported goods (by CN2);
− analyse the Lithuanian-origin aspect of exported goods (this analysis is possible only with CN8 classification). The export structure by CN2 could be split into CN8, if the research by LT-origin aspect requires;
− ensure the comparability of the data on the structure of the Lithuanian international trade and the Lithuanian industry. The corresponding table is researched by Peneder (2002). More information about this table is given in the Subsection 2.2.3 and in Appendix A.
2.2.2. The Analysis of Export Structure Based on Goods’ Nature
The research was based on the analysis of the Lithuanian export structure by the goods’ nature (according to CN2 classification), for the period of the 18 years, i.e. for the period of 1996–2013.
Firstly, the author analyses 2-digit CN classification, reviewing similar re-search performed by Lithuanian scientists (Rudzkis, Kvedaras 2003), and grou-ping 97 CN2 sections into 10 categories based on the nature of exported goods (Table 2.1).
Secondly, the author examines the annual growth or the decline of exported goods for the distinguished period, investigates key structural changes and trends in Lithuanian export structure. Due to globalization processes during the years 1996–2013, Lithuanian export competitiveness changed rather significant-ly, and towards different directions; i.e. some goods gained additional competi-tiveness, whereas the other goods had losses (Travkina et al. 2009).
The graphical picture of Lithuanian export during the period of 1996–2013 reflected on the main indicated categories (Table 2.1) of exported goods based on their nature, first of all, reveals the growth of overall export during the 18-years period: the nominal export value increased ~8 times2; and the annual
2 Increase in nominal value about 8 times was calculated as the nominal value in 1996 / the nomi-nal value in 2013
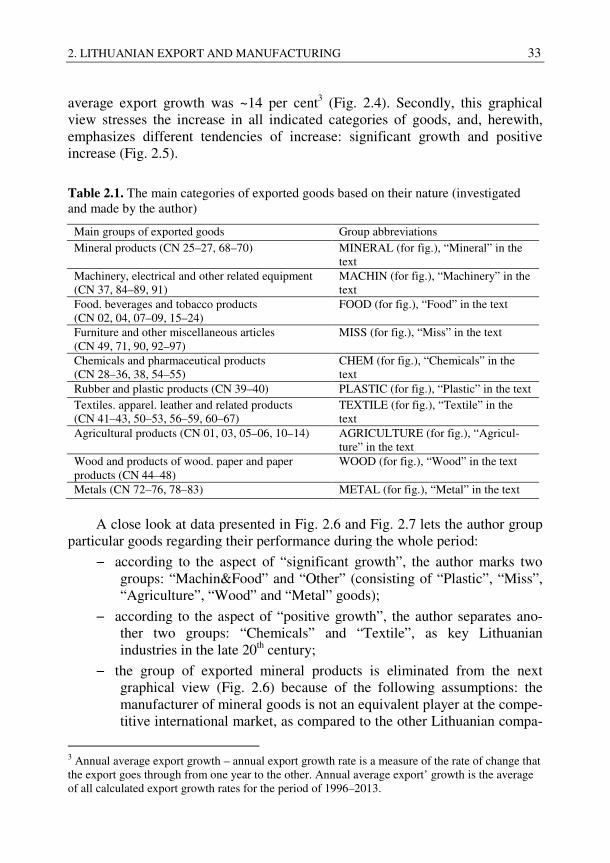
2. LITHUANIAN EXPORT AND MANUFACTURING 33
average export growth was ~14 per cent3 (Fig. 2.4). Secondly, this graphical view stresses the increase in all indicated categories of goods, and, herewith, emphasizes different tendencies of increase: significant growth and positive increase (Fig. 2.5).
Table 2.1. The main categories of exported goods based on their nature (investigated and made by the author)
Main groups of exported goods Group abbreviations Mineral products (CN 25–27, 68–70) MINERAL (for fig.), “Mineral” in the
text Machinery, electrical and other related equipment (CN 37, 84–89, 91)
MACHIN (for fig.), “Machinery” in the text
Food. beverages and tobacco products (CN 02, 04, 07–09, 15–24)
FOOD (for fig.), “Food” in the text
Furniture and other miscellaneous articles (CN 49, 71, 90, 92–97)
MISS (for fig.), “Miss” in the text
Chemicals and pharmaceutical products (CN 28–36, 38, 54–55)
CHEM (for fig.), “Chemicals” in the text
Rubber and plastic products (CN 39–40) PLASTIC (for fig.), “Plastic” in the text Textiles. apparel. leather and related products (CN 41–43, 50–53, 56–59, 60–67)
TEXTILE (for fig.), “Textile” in the text
Agricultural products (CN 01, 03, 05–06, 10–14) AGRICULTURE (for fig.), “Agricul-ture” in the text
Wood and products of wood. paper and paper products (CN 44–48)
WOOD (for fig.), “Wood” in the text
Metals (CN 72–76, 78–83) METAL (for fig.), “Metal” in the text
A close look at data presented in Fig. 2.6 and Fig. 2.7 lets the author group
particular goods regarding their performance during the whole period:
− according to the aspect of “significant growth”, the author marks two groups: “Machin&Food” and “Other” (consisting of “Plastic”, “Miss”, “Agriculture”, “Wood” and “Metal” goods);
− according to the aspect of “positive growth”, the author separates ano-ther two groups: “Chemicals” and “Textile”, as key Lithuanian industries in the late 20th century;
− the group of exported mineral products is eliminated from the next graphical view (Fig. 2.6) because of the following assumptions: the manufacturer of mineral goods is not an equivalent player at the compe-titive international market, as compared to the other Lithuanian compa-
3 Annual average export growth – annual export growth rate is a measure of the rate of change that the export goes through from one year to the other. Annual average export’ growth is the average of all calculated export growth rates for the period of 1996–2013.
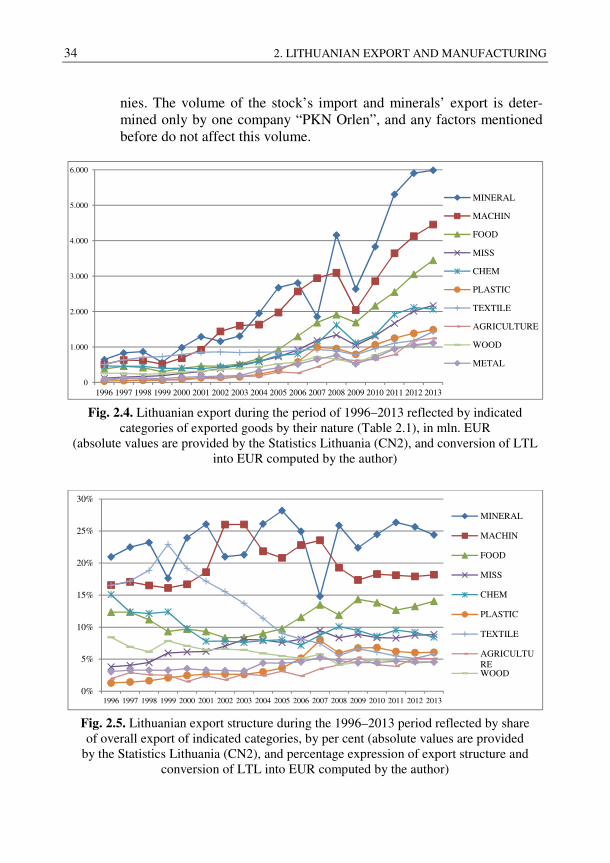
34 2. LITHUANIAN EXPORT AND MANUFACTURING
nies. The volume of the stock’s import and minerals’ export is deter-mined only by one company “PKN Orlen”, and any factors mentioned before do not affect this volume.
Fig. 2.4. Lithuanian export during the period of 1996–2013 reflected by indicated
categories of exported goods by their nature (Table 2.1), in mln. EUR (absolute values are provided by the Statistics Lithuania (CN2), and conversion of LTL
into EUR computed by the author)
Fig. 2.5. Lithuanian export structure during the 1996–2013 period reflected by share of overall export of indicated categories, by per cent (absolute values are provided
by the Statistics Lithuania (CN2), and percentage expression of export structure and conversion of LTL into EUR computed by the author)
0
1.000
2.000
3.000
4.000
5.000
6.000
1996 1997 1998 1999 2000 2001 2002 2003 2004 2005 2006 2007 2008 2009 2010 2011 2012 2013
MINERAL
MACHIN
FOOD
MISS
CHEM
PLASTIC
TEXTILE
AGRICULTURE
WOOD
METAL
0%
5%
10%
15%
20%
25%
30%
1996 1997 1998 1999 2000 2001 2002 2003 2004 2005 2006 2007 2008 2009 2010 2011 2012 2013
MINERAL
MACHIN
FOOD
MISS
CHEM
PLASTIC
TEXTILE
AGRICULTUREWOOD
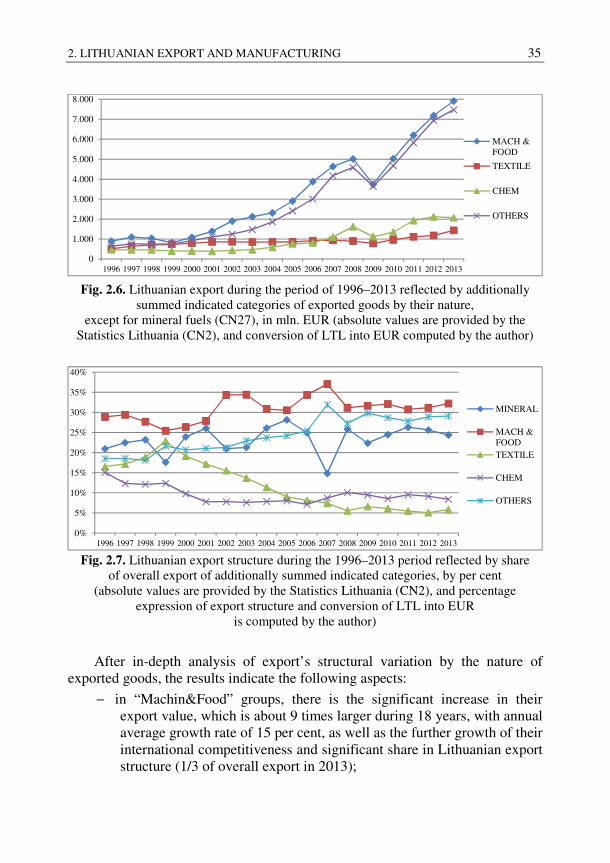
2. LITHUANIAN EXPORT AND MANUFACTURING 35
Fig. 2.6. Lithuanian export during the period of 1996–2013 reflected by additionally
summed indicated categories of exported goods by their nature, except for mineral fuels (CN27), in mln. EUR (absolute values are provided by the
Statistics Lithuania (CN2), and conversion of LTL into EUR computed by the author)
Fig. 2.7. Lithuanian export structure during the 1996–2013 period reflected by share of overall export of additionally summed indicated categories, by per cent
(absolute values are provided by the Statistics Lithuania (CN2), and percentage expression of export structure and conversion of LTL into EUR
is computed by the author)
After in-depth analysis of export’s structural variation by the nature of exported goods, the results indicate the following aspects:
− in “Machin&Food” groups, there is the significant increase in their export value, which is about 9 times larger during 18 years, with annual average growth rate of 15 per cent, as well as the further growth of their international competitiveness and significant share in Lithuanian export structure (1/3 of overall export in 2013);
0
1.000
2.000
3.000
4.000
5.000
6.000
7.000
8.000
1996 1997 1998 1999 2000 2001 2002 2003 2004 2005 2006 2007 2008 2009 2010 2011 2012 2013
MACH &FOOD
TEXTILE
CHEM
OTHERS
0%
5%
10%
15%
20%
25%
30%
35%
40%
1996 1997 1998 1999 2000 2001 2002 2003 2004 2005 2006 2007 2008 2009 2010 2011 2012 2013
MINERAL
MACH &FOODTEXTILE
CHEM
OTHERS
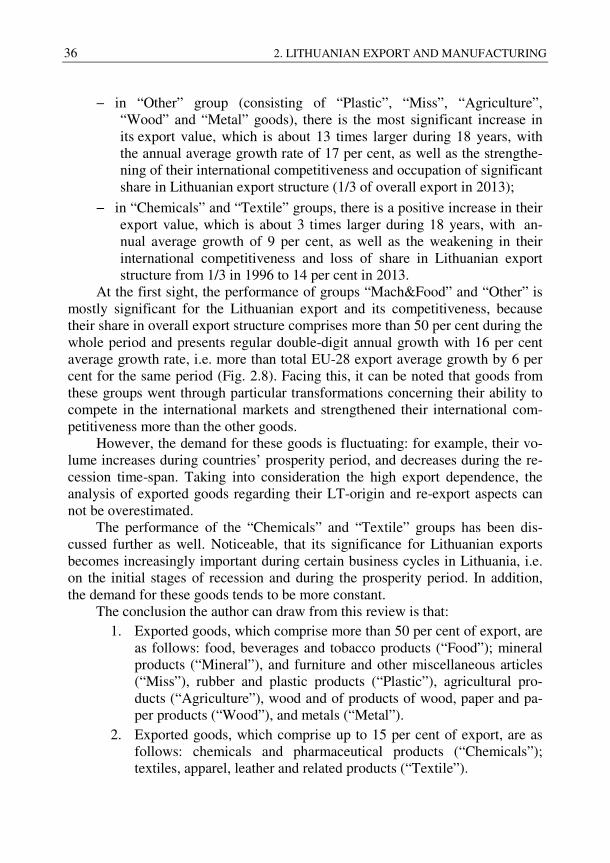
36 2. LITHUANIAN EXPORT AND MANUFACTURING
− in “Other” group (consisting of “Plastic”, “Miss”, “Agriculture”, “Wood” and “Metal” goods), there is the most significant increase in its export value, which is about 13 times larger during 18 years, with the annual average growth rate of 17 per cent, as well as the strengthe-ning of their international competitiveness and occupation of significant share in Lithuanian export structure (1/3 of overall export in 2013);
− in “Chemicals” and “Textile” groups, there is a positive increase in their export value, which is about 3 times larger during 18 years, with an-nual average growth of 9 per cent, as well as the weakening in their international competitiveness and loss of share in Lithuanian export structure from 1/3 in 1996 to 14 per cent in 2013.
At the first sight, the performance of groups “Mach&Food” and “Other” is mostly significant for the Lithuanian export and its competitiveness, because their share in overall export structure comprises more than 50 per cent during the whole period and presents regular double-digit annual growth with 16 per cent average growth rate, i.e. more than total EU-28 export average growth by 6 per cent for the same period (Fig. 2.8). Facing this, it can be noted that goods from these groups went through particular transformations concerning their ability to compete in the international markets and strengthened their international com-petitiveness more than the other goods.
However, the demand for these goods is fluctuating: for example, their vo-lume increases during countries’ prosperity period, and decreases during the re-cession time-span. Taking into consideration the high export dependence, the analysis of exported goods regarding their LT-origin and re-export aspects can not be overestimated.
The performance of the “Chemicals” and “Textile” groups has been dis-cussed further as well. Noticeable, that its significance for Lithuanian exports becomes increasingly important during certain business cycles in Lithuania, i.e. on the initial stages of recession and during the prosperity period. In addition, the demand for these goods tends to be more constant.
The conclusion the author can draw from this review is that: 1. Exported goods, which comprise more than 50 per cent of export, are
as follows: food, beverages and tobacco products (“Food”); mineral products (“Mineral”), and furniture and other miscellaneous articles (“Miss”), rubber and plastic products (“Plastic”), agricultural pro-ducts (“Agriculture”), wood and of products of wood, paper and pa-per products (“Wood”), and metals (“Metal”).
2. Exported goods, which comprise up to 15 per cent of export, are as follows: chemicals and pharmaceutical products (“Chemicals”); textiles, apparel, leather and related products (“Textile”).
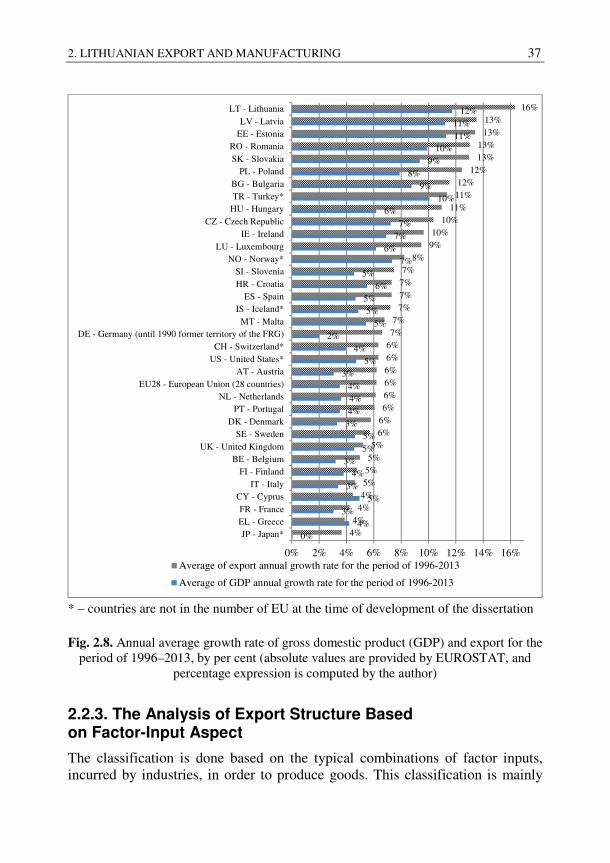
2. LITHUANIAN EXPORT AND MANUFACTURING 37
* – countries are not in the number of EU at the time of development of the dissertation
Fig. 2.8. Annual average growth rate of gross domestic product (GDP) and export for the period of 1996–2013, by per cent (absolute values are provided by EUROSTAT, and
percentage expression is computed by the author)
2.2.3. The Analysis of Export Structure Based on Factor-Input Aspect
The classification is done based on the typical combinations of factor inputs, incurred by industries, in order to produce goods. This classification is mainly
0%4%
3%5%
3%4%
3%5%5%
3%4%4%4%
3%5%
4%2%
5%5%
5%6%
5%7%
6%7%
7%6%
10%9%
8%9%
10%11%11%
12%
4%4%
4%4%5%5%5%5%
6%6%6%6%6%6%6%6%7%7%
7%7%7%7%
8%9%10%
10%11%
11%12%
12%13%13%
13%13%
16%
0% 2% 4% 6% 8% 10% 12% 14% 16%
JP - Japan*EL - GreeceFR - France
CY - CyprusIT - Italy
FI - FinlandBE - Belgium
UK - United KingdomSE - Sweden
DK - DenmarkPT - Portugal
NL - NetherlandsEU28 - European Union (28 countries)
AT - AustriaUS - United States*CH - Switzerland*
DE - Germany (until 1990 former territory of the FRG)MT - Malta
IS - Iceland*ES - Spain
HR - CroatiaSI - Slovenia
NO - Norway*LU - Luxembourg
IE - IrelandCZ - Czech Republic
HU - HungaryTR - Turkey*BG - Bulgaria
PL - PolandSK - SlovakiaRO - Romania
EE - EstoniaLV - Latvia
LT - Lithuania
Average of export annual growth rate for the period of 1996-2013
Average of GDP annual growth rate for the period of 1996-2013
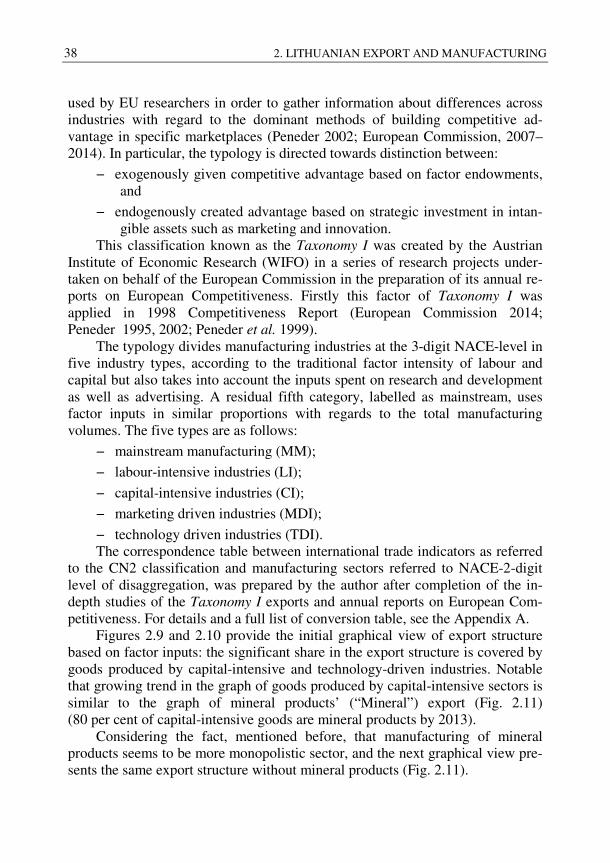
38 2. LITHUANIAN EXPORT AND MANUFACTURING
used by EU researchers in order to gather information about differences across industries with regard to the dominant methods of building competitive ad-vantage in specific marketplaces (Peneder 2002; European Commission, 2007–2014). In particular, the typology is directed towards distinction between:
− exogenously given competitive advantage based on factor endowments, and
− endogenously created advantage based on strategic investment in intan-gible assets such as marketing and innovation.
This classification known as the Taxonomy I was created by the Austrian Institute of Economic Research (WIFO) in a series of research projects under-taken on behalf of the European Commission in the preparation of its annual re-ports on European Competitiveness. Firstly this factor of Taxonomy I was applied in 1998 Competitiveness Report (European Commission 2014; Peneder 1995, 2002; Peneder et al. 1999).
The typology divides manufacturing industries at the 3-digit NACE-level in five industry types, according to the traditional factor intensity of labour and capital but also takes into account the inputs spent on research and development as well as advertising. A residual fifth category, labelled as mainstream, uses factor inputs in similar proportions with regards to the total manufacturing volumes. The five types are as follows:
− mainstream manufacturing (MM);
− labour-intensive industries (LI);
− capital-intensive industries (CI);
− marketing driven industries (MDI);
− technology driven industries (TDI). The correspondence table between international trade indicators as referred
to the CN2 classification and manufacturing sectors referred to NACE-2-digit level of disaggregation, was prepared by the author after completion of the in-depth studies of the Taxonomy I exports and annual reports on European Com-petitiveness. For details and a full list of conversion table, see the Appendix A.
Figures 2.9 and 2.10 provide the initial graphical view of export structure based on factor inputs: the significant share in the export structure is covered by goods produced by capital-intensive and technology-driven industries. Notable that growing trend in the graph of goods produced by capital-intensive sectors is similar to the graph of mineral products’ (“Mineral”) export (Fig. 2.11) (80 per cent of capital-intensive goods are mineral products by 2013).
Considering the fact, mentioned before, that manufacturing of mineral products seems to be more monopolistic sector, and the next graphical view pre-sents the same export structure without mineral products (Fig. 2.11).
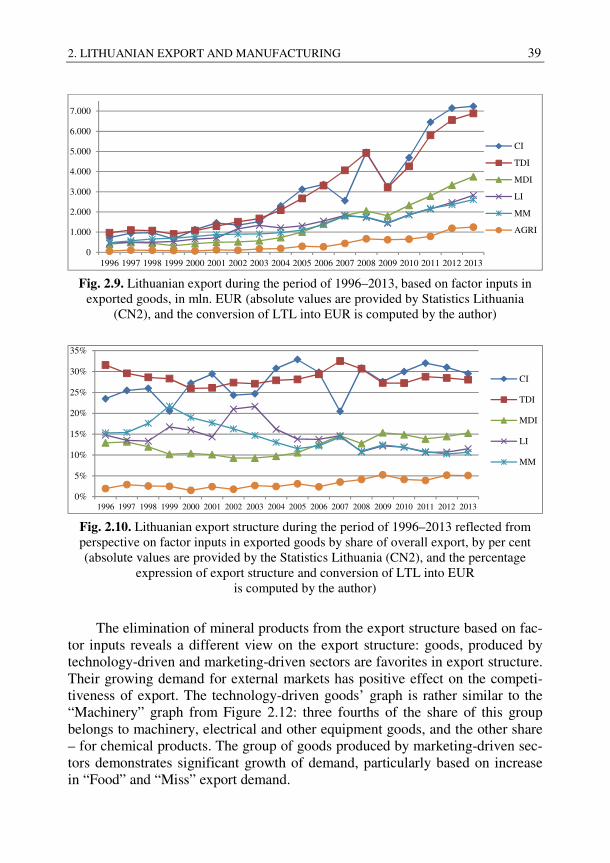
2. LITHUANIAN EXPORT AND MANUFACTURING 39
Fig. 2.9. Lithuanian export during the period of 1996–2013, based on factor inputs in
exported goods, in mln. EUR (absolute values are provided by Statistics Lithuania (CN2), and the conversion of LTL into EUR is computed by the author)
Fig. 2.10. Lithuanian export structure during the period of 1996–2013 reflected from perspective on factor inputs in exported goods by share of overall export, by per cent (absolute values are provided by the Statistics Lithuania (CN2), and the percentage
expression of export structure and conversion of LTL into EUR is computed by the author)
The elimination of mineral products from the export structure based on fac-tor inputs reveals a different view on the export structure: goods, produced by technology-driven and marketing-driven sectors are favorites in export structure. Their growing demand for external markets has positive effect on the competi-tiveness of export. The technology-driven goods’ graph is rather similar to the “Machinery” graph from Figure 2.12: three fourths of the share of this group belongs to machinery, electrical and other equipment goods, and the other share – for chemical products. The group of goods produced by marketing-driven sec-tors demonstrates significant growth of demand, particularly based on increase in “Food” and “Miss” export demand.
0
1.000
2.000
3.000
4.000
5.000
6.000
7.000
1996 1997 1998 1999 2000 2001 2002 2003 2004 2005 2006 2007 2008 2009 2010 2011 2012 2013
CI
TDI
MDI
LI
MM
AGRI
0%
5%
10%
15%
20%
25%
30%
35%
1996 1997 1998 1999 2000 2001 2002 2003 2004 2005 2006 2007 2008 2009 2010 2011 2012 2013
CI
TDI
MDI
LI
MM
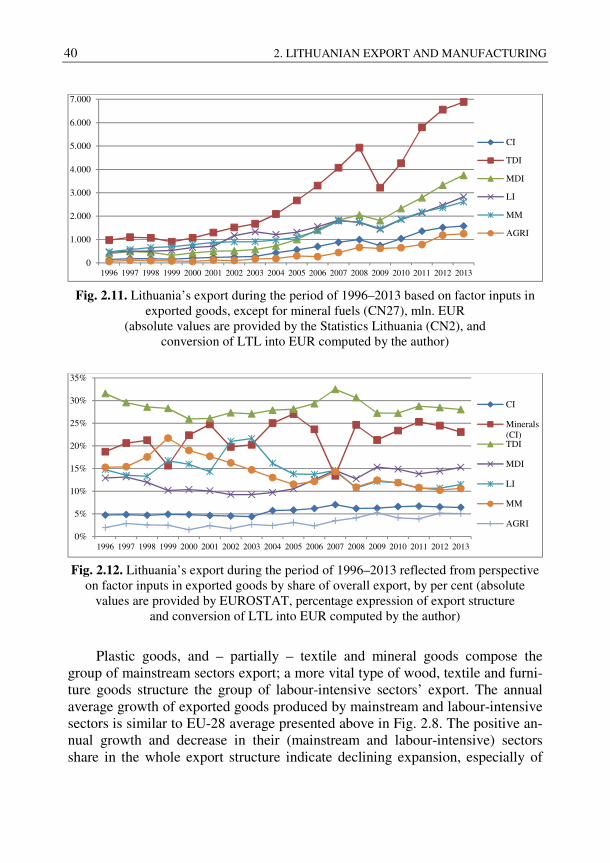
40 2. LITHUANIAN EXPORT AND MANUFACTURING
Fig. 2.11. Lithuania’s export during the period of 1996–2013 based on factor inputs in
exported goods, except for mineral fuels (CN27), mln. EUR (absolute values are provided by the Statistics Lithuania (CN2), and
conversion of LTL into EUR computed by the author)
Fig. 2.12. Lithuania’s export during the period of 1996–2013 reflected from perspective
on factor inputs in exported goods by share of overall export, by per cent (absolute values are provided by EUROSTAT, percentage expression of export structure
and conversion of LTL into EUR computed by the author)
Plastic goods, and – partially – textile and mineral goods compose the group of mainstream sectors export; a more vital type of wood, textile and furni-ture goods structure the group of labour-intensive sectors’ export. The annual average growth of exported goods produced by mainstream and labour-intensive sectors is similar to EU-28 average presented above in Fig. 2.8. The positive an-nual growth and decrease in their (mainstream and labour-intensive) sectors share in the whole export structure indicate declining expansion, especially of
0
1.000
2.000
3.000
4.000
5.000
6.000
7.000
1996 1997 1998 1999 2000 2001 2002 2003 2004 2005 2006 2007 2008 2009 2010 2011 2012 2013
CI
TDI
MDI
LI
MM
AGRI
0%
5%
10%
15%
20%
25%
30%
35%
1996 1997 1998 1999 2000 2001 2002 2003 2004 2005 2006 2007 2008 2009 2010 2011 2012 2013
CI
Minerals(CI)TDI
MDI
LI
MM
AGRI
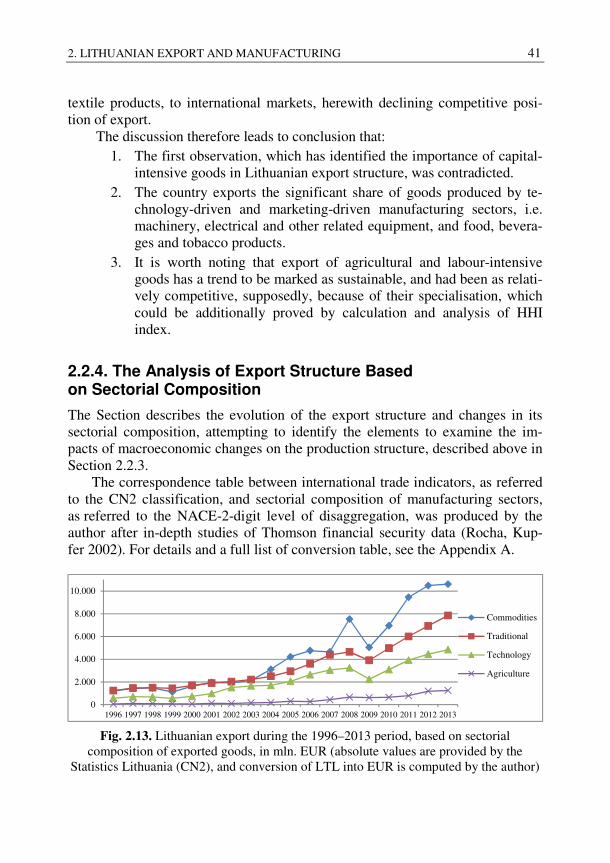
2. LITHUANIAN EXPORT AND MANUFACTURING 41
textile products, to international markets, herewith declining competitive posi-tion of export.
The discussion therefore leads to conclusion that: 1. The first observation, which has identified the importance of capital-
intensive goods in Lithuanian export structure, was contradicted. 2. The country exports the significant share of goods produced by te-
chnology-driven and marketing-driven manufacturing sectors, i.e. machinery, electrical and other related equipment, and food, bevera-ges and tobacco products.
3. It is worth noting that export of agricultural and labour-intensive goods has a trend to be marked as sustainable, and had been as relati-vely competitive, supposedly, because of their specialisation, which could be additionally proved by calculation and analysis of HHI index.
2.2.4. The Analysis of Export Structure Based on Sectorial Composition
The Section describes the evolution of the export structure and changes in its sectorial composition, attempting to identify the elements to examine the im-pacts of macroeconomic changes on the production structure, described above in Section 2.2.3.
The correspondence table between international trade indicators, as referred to the CN2 classification, and sectorial composition of manufacturing sectors, as referred to the NACE-2-digit level of disaggregation, was produced by the author after in-depth studies of Thomson financial security data (Rocha, Kup-fer 2002). For details and a full list of conversion table, see the Appendix A.
Fig. 2.13. Lithuanian export during the 1996–2013 period, based on sectorial
composition of exported goods, in mln. EUR (absolute values are provided by the Statistics Lithuania (CN2), and conversion of LTL into EUR is computed by the author)
0
2.000
4.000
6.000
8.000
10.000
1996 1997 1998 1999 2000 2001 2002 2003 2004 2005 2006 2007 2008 2009 2010 2011 2012 2013
Commodities
Traditional
Technology
Agriculture
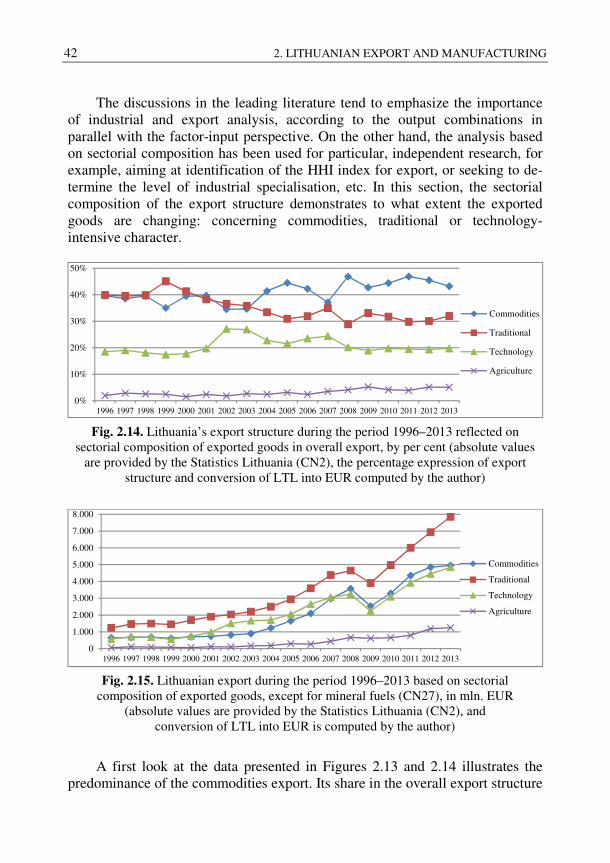
42 2. LITHUANIAN EXPORT AND MANUFACTURING
The discussions in the leading literature tend to emphasize the importance of industrial and export analysis, according to the output combinations in parallel with the factor-input perspective. On the other hand, the analysis based on sectorial composition has been used for particular, independent research, for example, aiming at identification of the HHI index for export, or seeking to de-termine the level of industrial specialisation, etc. In this section, the sectorial composition of the export structure demonstrates to what extent the exported goods are changing: concerning commodities, traditional or technology-intensive character.
Fig. 2.14. Lithuania’s export structure during the period 1996–2013 reflected on
sectorial composition of exported goods in overall export, by per cent (absolute values are provided by the Statistics Lithuania (CN2), the percentage expression of export
structure and conversion of LTL into EUR computed by the author)
Fig. 2.15. Lithuanian export during the period 1996–2013 based on sectorial
composition of exported goods, except for mineral fuels (CN27), in mln. EUR (absolute values are provided by the Statistics Lithuania (CN2), and
conversion of LTL into EUR is computed by the author)
A first look at the data presented in Figures 2.13 and 2.14 illustrates the predominance of the commodities export. Its share in the overall export structure
0%
10%
20%
30%
40%
50%
1996 1997 1998 1999 2000 2001 2002 2003 2004 2005 2006 2007 2008 2009 2010 2011 2012 2013
Commodities
Traditional
Technology
Agriculture
0
1.000
2.000
3.000
4.000
5.000
6.000
7.000
8.000
1996 1997 1998 1999 2000 2001 2002 2003 2004 2005 2006 2007 2008 2009 2010 2011 2012 2013
Commodities
Traditional
Technology
Agriculture
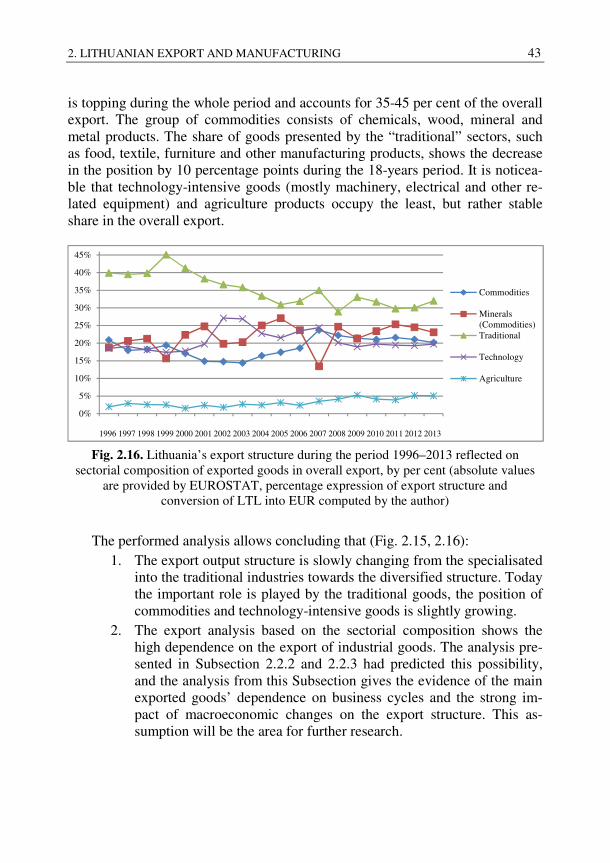
2. LITHUANIAN EXPORT AND MANUFACTURING 43
is topping during the whole period and accounts for 35-45 per cent of the overall export. The group of commodities consists of chemicals, wood, mineral and metal products. The share of goods presented by the “traditional” sectors, such as food, textile, furniture and other manufacturing products, shows the decrease in the position by 10 percentage points during the 18-years period. It is noticea-ble that technology-intensive goods (mostly machinery, electrical and other re-lated equipment) and agriculture products occupy the least, but rather stable share in the overall export.
Fig. 2.16. Lithuania’s export structure during the period 1996–2013 reflected on
sectorial composition of exported goods in overall export, by per cent (absolute values are provided by EUROSTAT, percentage expression of export structure and
conversion of LTL into EUR computed by the author)
The performed analysis allows concluding that (Fig. 2.15, 2.16): 1. The export output structure is slowly changing from the specialisated
into the traditional industries towards the diversified structure. Today the important role is played by the traditional goods, the position of commodities and technology-intensive goods is slightly growing.
2. The export analysis based on the sectorial composition shows the high dependence on the export of industrial goods. The analysis pre-sented in Subsection 2.2.2 and 2.2.3 had predicted this possibility, and the analysis from this Subsection gives the evidence of the main exported goods’ dependence on business cycles and the strong im-pact of macroeconomic changes on the export structure. This as-sumption will be the area for further research.
0%
5%
10%
15%
20%
25%
30%
35%
40%
45%
1996 1997 1998 1999 2000 2001 2002 2003 2004 2005 2006 2007 2008 2009 2010 2011 2012 2013
Commodities
Minerals(Commodities)Traditional
Technology
Agriculture
44 2. LITHUANIAN EXPORT AND MANUFACTURING
2.2.5. The Analysis of Export Structure Based on LT-origin Aspect
Discussions in the Lithuanian literature strive to emphasize the obvious im-portance of re-export and Lithuanian-origin export for the overall country’s ex-port and its competitiveness (Rudzkis, Kvedaras 2003; Lithuanian Economic Outlook DNB 2011; Enterprise Lithuania 2014). The main underlying premise, suggested by scholars, is that the country’s increase in export (not related to in-crease in import), increasing revenues and diversity within the export structure, is seen as the main contributor to the increase in country’s competitiveness. Therefore, the increase in export is essential for countries with small open eco-nomy, like Lithuania, and contributes to the increase in cash flow, employment indicators and growth of production basis. Hence, international competitiveness of export is directly linked to the country’s ability to compete in the international markets and sustainable economic growth (Travkina, Tvaronavičienė 2011; Kor-sakienė et al. 2014).
On the other hand, particular economic sectors are rather open in the sense of the trade with regards to the entire national economy. Therefore, a special fo-cus has to be put, firstly, on the type of export, and secondly, on the manufactu-ring sectors, which are seen as the major contributors to the international trade. The author comes across the question whether the largest portion of goods of Lithuanian origin were exported by the same manufacturing sectors are seen as key contributors to the international trade?
Discussions presented in this Subsection led to several research questions. The first research question is as follows: whether the significant share of indus-trial export comprises the goods of Lithuanian-origin, moreover, whether the shift of their volume affects competitiveness of the overall export. The second research question is whether the significant share of industrial export applies to resale goods, and whether the change of their volume contributes to the increase of country‘s macroeconomic indicators, simultaneously not affecting the growth of production basis and/or the increase in export competitiveness potential. The remainder of this Subsection is organised as follows. Firstly, the author intro-duces the division of the overall country‘s export, referred to the CN8 classifica-tion, according to the type of sale. Secondly, the overview of key exported groups and of overall export based on the type of sale is provided. For details and a full list of research results, see the Appendix B.
Starting from 2008, the Lithuanian statistics present information about ex-port of Lithuanian-origin goods on the CN8 classification, i.e. on the maximum detailed structural base. The period for analysis is not so favorable in data: the author has decided to use the annual statistical data for the research. The infor-mation on the Lithuanian-origin goods is available for the CN2 classification as well. Notwithstanding, the 2-digit code structure (CN2) is known as the catego-
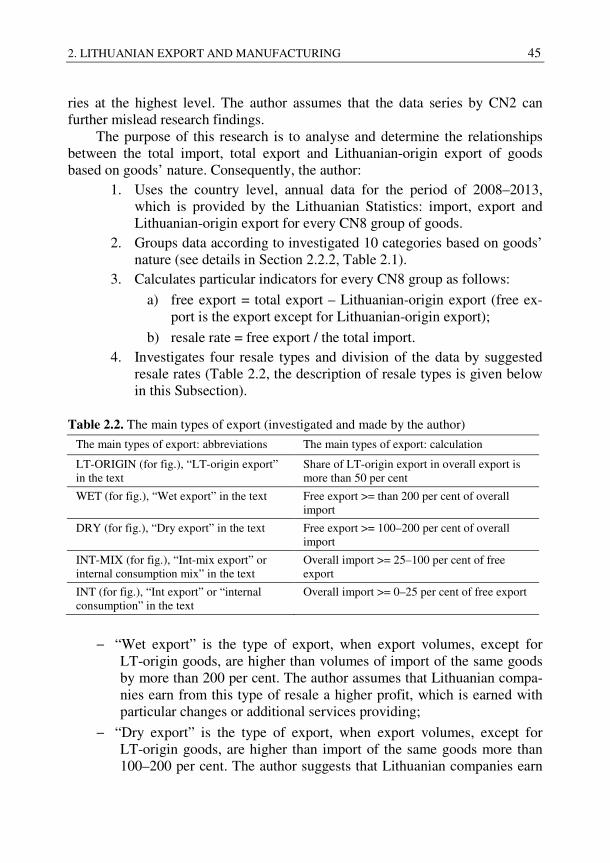
2. LITHUANIAN EXPORT AND MANUFACTURING 45
ries at the highest level. The author assumes that the data series by CN2 can further mislead research findings.
The purpose of this research is to analyse and determine the relationships between the total import, total export and Lithuanian-origin export of goods based on goods’ nature. Consequently, the author:
1. Uses the country level, annual data for the period of 2008–2013, which is provided by the Lithuanian Statistics: import, export and Lithuanian-origin export for every CN8 group of goods.
2. Groups data according to investigated 10 categories based on goods’ nature (see details in Section 2.2.2, Table 2.1).
3. Calculates particular indicators for every CN8 group as follows:
a) free export = total export – Lithuanian-origin export (free ex-port is the export except for Lithuanian-origin export);
b) resale rate = free export / the total import. 4. Investigates four resale types and division of the data by suggested
resale rates (Table 2.2, the description of resale types is given below in this Subsection).
Table 2.2. The main types of export (investigated and made by the author)
The main types of export: abbreviations The main types of export: calculation
LT-ORIGIN (for fig.), “LT-origin export” in the text
Share of LT-origin export in overall export is more than 50 per cent
WET (for fig.), “Wet export” in the text Free export >= than 200 per cent of overall import
DRY (for fig.), “Dry export” in the text Free export >= 100–200 per cent of overall import
INT-MIX (for fig.), “Int-mix export” or internal consumption mix” in the text
Overall import >= 25–100 per cent of free export
INT (for fig.), “Int export” or “internal consumption” in the text
Overall import >= 0–25 per cent of free export
− “Wet export” is the type of export, when export volumes, except for LT-origin goods, are higher than volumes of import of the same goods by more than 200 per cent. The author assumes that Lithuanian compa-nies earn from this type of resale a higher profit, which is earned with particular changes or additional services providing;
− “Dry export” is the type of export, when export volumes, except for LT-origin goods, are higher than import of the same goods more than 100–200 per cent. The author suggests that Lithuanian companies earn
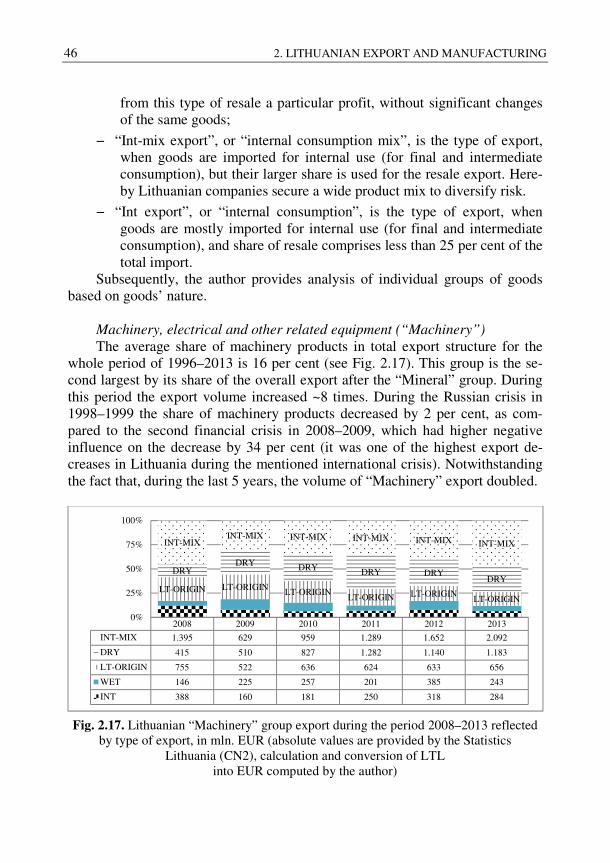
46 2. LITHUANIAN EXPORT AND MANUFACTURING
from this type of resale a particular profit, without significant changes of the same goods;
− “Int-mix export”, or “internal consumption mix”, is the type of export, when goods are imported for internal use (for final and intermediate consumption), but their larger share is used for the resale export. Here-by Lithuanian companies secure a wide product mix to diversify risk.
− “Int export”, or “internal consumption”, is the type of export, when goods are mostly imported for internal use (for final and intermediate consumption), and share of resale comprises less than 25 per cent of the total import.
Subsequently, the author provides analysis of individual groups of goods based on goods’ nature.
Machinery, electrical and other related equipment (“Machinery”)
The average share of machinery products in total export structure for the whole period of 1996–2013 is 16 per cent (see Fig. 2.17). This group is the se-cond largest by its share of the overall export after the “Mineral” group. During this period the export volume increased ~8 times. During the Russian crisis in 1998–1999 the share of machinery products decreased by 2 per cent, as com-pared to the second financial crisis in 2008–2009, which had higher negative influence on the decrease by 34 per cent (it was one of the highest export de-creases in Lithuania during the mentioned international crisis). Notwithstanding the fact that, during the last 5 years, the volume of “Machinery” export doubled.
Fig. 2.17. Lithuanian “Machinery” group export during the period 2008–2013 reflected
by type of export, in mln. EUR (absolute values are provided by the Statistics Lithuania (CN2), calculation and conversion of LTL
into EUR computed by the author)
2008 2009 2010 2011 2012 2013
INT-MIX 1.395 629 959 1.289 1.652 2.092
DRY 415 510 827 1.282 1.140 1.183
LT-ORIGIN 755 522 636 624 633 656
WET 146 225 257 201 385 243
INT 388 160 181 250 318 284
LT-ORIGIN LT-ORIGIN LT-ORIGINLT-ORIGIN LT-ORIGIN
LT-ORIGIN
DRYDRY DRY DRY DRY
DRY
INT-MIXINT-MIX INT-MIX INT-MIX INT-MIX INT-MIX
0%
25%
50%
75%
100%
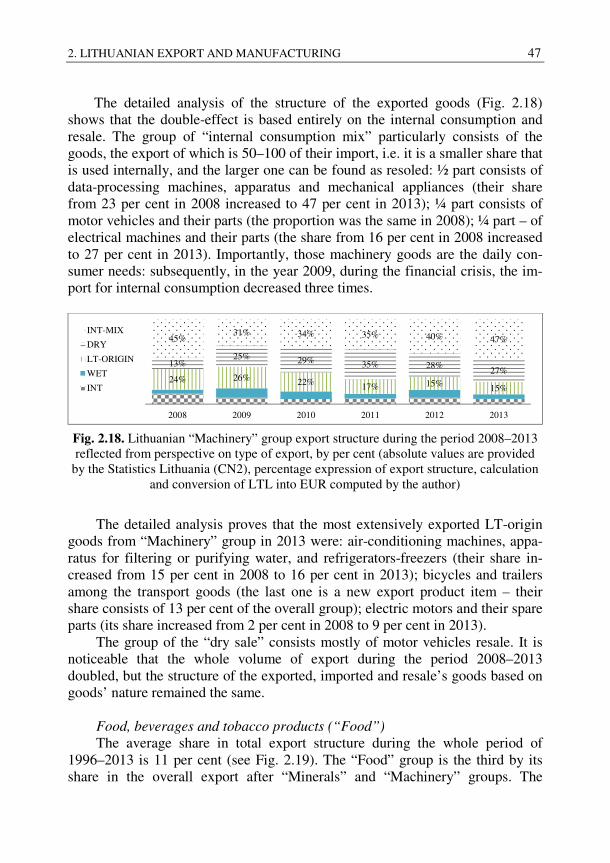
2. LITHUANIAN EXPORT AND MANUFACTURING 47
The detailed analysis of the structure of the exported goods (Fig. 2.18) shows that the double-effect is based entirely on the internal consumption and resale. The group of “internal consumption mix” particularly consists of the goods, the export of which is 50–100 of their import, i.e. it is a smaller share that is used internally, and the larger one can be found as resoled: ½ part consists of data-processing machines, apparatus and mechanical appliances (their share from 23 per cent in 2008 increased to 47 per cent in 2013); ¼ part consists of motor vehicles and their parts (the proportion was the same in 2008); ¼ part – of electrical machines and their parts (the share from 16 per cent in 2008 increased to 27 per cent in 2013). Importantly, those machinery goods are the daily con-sumer needs: subsequently, in the year 2009, during the financial crisis, the im-port for internal consumption decreased three times.
Fig. 2.18. Lithuanian “Machinery” group export structure during the period 2008–2013 reflected from perspective on type of export, by per cent (absolute values are provided
by the Statistics Lithuania (CN2), percentage expression of export structure, calculation and conversion of LTL into EUR computed by the author)
The detailed analysis proves that the most extensively exported LT-origin goods from “Machinery” group in 2013 were: air-conditioning machines, appa-ratus for filtering or purifying water, and refrigerators-freezers (their share in-creased from 15 per cent in 2008 to 16 per cent in 2013); bicycles and trailers among the transport goods (the last one is a new export product item – their share consists of 13 per cent of the overall group); electric motors and their spare parts (its share increased from 2 per cent in 2008 to 9 per cent in 2013).
The group of the “dry sale” consists mostly of motor vehicles resale. It is noticeable that the whole volume of export during the period 2008–2013 doubled, but the structure of the exported, imported and resale’s goods based on goods’ nature remained the same.
Food, beverages and tobacco products (“Food”)
The average share in total export structure during the whole period of 1996–2013 is 11 per cent (see Fig. 2.19). The “Food” group is the third by its share in the overall export after “Minerals” and “Machinery” groups. The
24% 26% 22% 17% 15% 15%
13%25% 29% 35% 28%
27%
45%31% 34% 35% 40% 47%
2008 2009 2010 2011 2012 2013
INT-MIX
DRY
LT-ORIGIN
WET
INT
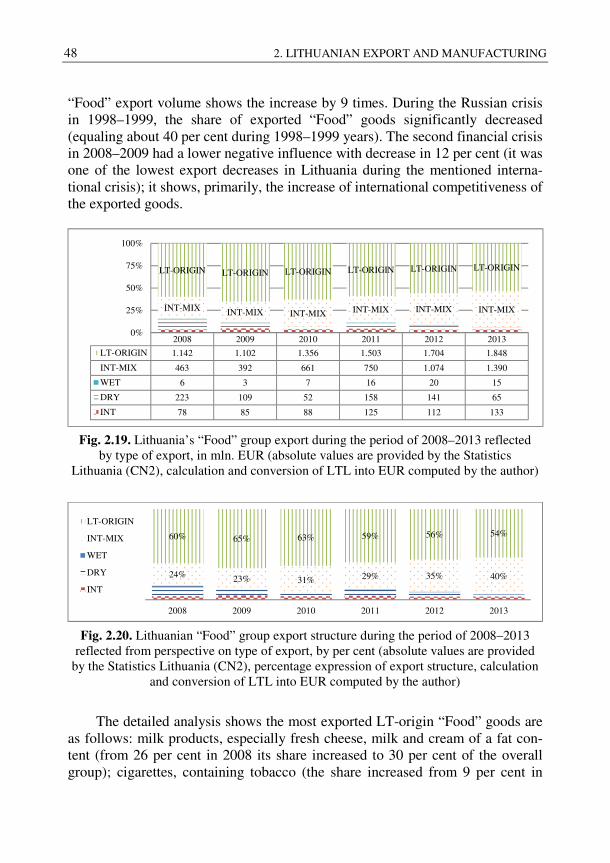
48 2. LITHUANIAN EXPORT AND MANUFACTURING
“Food” export volume shows the increase by 9 times. During the Russian crisis in 1998–1999, the share of exported “Food” goods significantly decreased (equaling about 40 per cent during 1998–1999 years). The second financial crisis in 2008–2009 had a lower negative influence with decrease in 12 per cent (it was one of the lowest export decreases in Lithuania during the mentioned interna-tional crisis); it shows, primarily, the increase of international competitiveness of the exported goods.
Fig. 2.19. Lithuania’s “Food” group export during the period of 2008–2013 reflected
by type of export, in mln. EUR (absolute values are provided by the Statistics Lithuania (CN2), calculation and conversion of LTL into EUR computed by the author)
Fig. 2.20. Lithuanian “Food” group export structure during the period of 2008–2013
reflected from perspective on type of export, by per cent (absolute values are provided by the Statistics Lithuania (CN2), percentage expression of export structure, calculation
and conversion of LTL into EUR computed by the author)
The detailed analysis shows the most exported LT-origin “Food” goods are as follows: milk products, especially fresh cheese, milk and cream of a fat con-tent (from 26 per cent in 2008 its share increased to 30 per cent of the overall group); cigarettes, containing tobacco (the share increased from 9 per cent in
2008 2009 2010 2011 2012 2013
LT-ORIGIN 1.142 1.102 1.356 1.503 1.704 1.848
INT-MIX 463 392 661 750 1.074 1.390
WET 6 3 7 16 20 15
DRY 223 109 52 158 141 65
INT 78 85 88 125 112 133
INT-MIX INT-MIX INT-MIX INT-MIX INT-MIX INT-MIX
LT-ORIGIN LT-ORIGIN LT-ORIGIN LT-ORIGIN LT-ORIGIN LT-ORIGIN
0%
25%
50%
75%
100%
24% 23% 31% 29% 35% 40%
60% 65% 63% 59% 56% 54%
2008 2009 2010 2011 2012 2013
LT-ORIGIN
INT-MIX
WET
DRY
INT
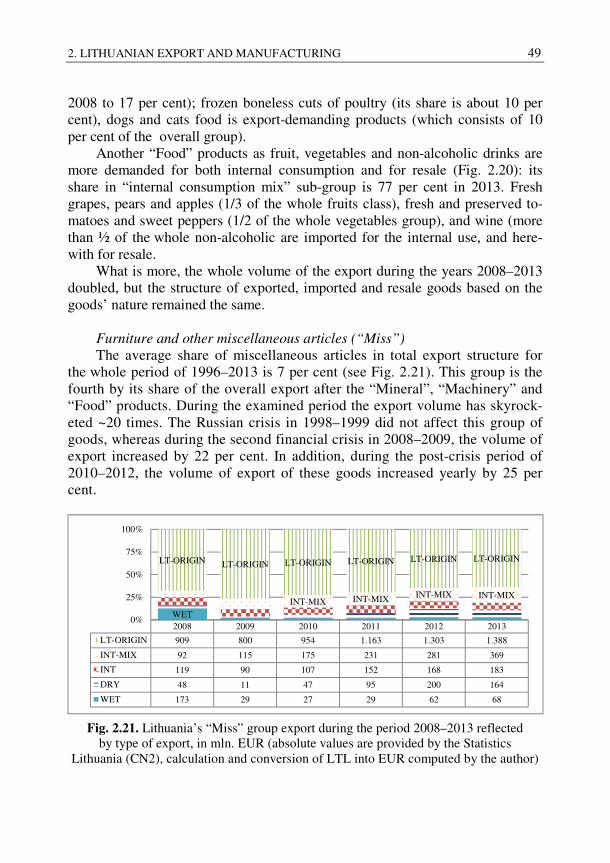
2. LITHUANIAN EXPORT AND MANUFACTURING 49
2008 to 17 per cent); frozen boneless cuts of poultry (its share is about 10 per cent), dogs and cats food is export-demanding products (which consists of 10 per cent of the overall group).
Another “Food” products as fruit, vegetables and non-alcoholic drinks are more demanded for both internal consumption and for resale (Fig. 2.20): its share in “internal consumption mix” sub-group is 77 per cent in 2013. Fresh grapes, pears and apples (1/3 of the whole fruits class), fresh and preserved to-matoes and sweet peppers (1/2 of the whole vegetables group), and wine (more than ½ of the whole non-alcoholic are imported for the internal use, and here-with for resale.
What is more, the whole volume of the export during the years 2008–2013 doubled, but the structure of exported, imported and resale goods based on the goods’ nature remained the same.
Furniture and other miscellaneous articles (“Miss”)
The average share of miscellaneous articles in total export structure for the whole period of 1996–2013 is 7 per cent (see Fig. 2.21). This group is the fourth by its share of the overall export after the “Mineral”, “Machinery” and “Food” products. During the examined period the export volume has skyrock-eted ~20 times. The Russian crisis in 1998–1999 did not affect this group of goods, whereas during the second financial crisis in 2008–2009, the volume of export increased by 22 per cent. In addition, during the post-crisis period of 2010–2012, the volume of export of these goods increased yearly by 25 per cent.
Fig. 2.21. Lithuania’s “Miss” group export during the period 2008–2013 reflected
by type of export, in mln. EUR (absolute values are provided by the Statistics Lithuania (CN2), calculation and conversion of LTL into EUR computed by the author)
2008 2009 2010 2011 2012 2013
LT-ORIGIN 909 800 954 1.163 1.303 1.388
INT-MIX 92 115 175 231 281 369
INT 119 90 107 152 168 183
DRY 48 11 47 95 200 164
WET 173 29 27 29 62 68
WETINT-MIX INT-MIX INT-MIX INT-MIX
LT-ORIGIN LT-ORIGIN LT-ORIGIN LT-ORIGIN LT-ORIGIN LT-ORIGIN
0%
25%
50%
75%
100%
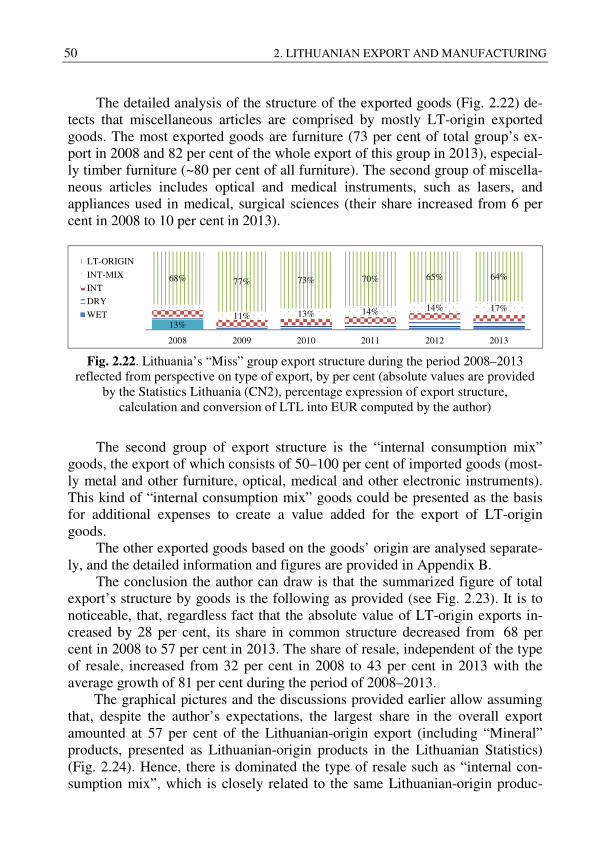
50 2. LITHUANIAN EXPORT AND MANUFACTURING
The detailed analysis of the structure of the exported goods (Fig. 2.22) de-tects that miscellaneous articles are comprised by mostly LT-origin exported goods. The most exported goods are furniture (73 per cent of total group’s ex-port in 2008 and 82 per cent of the whole export of this group in 2013), especial-ly timber furniture (~80 per cent of all furniture). The second group of miscella-neous articles includes optical and medical instruments, such as lasers, and appliances used in medical, surgical sciences (their share increased from 6 per cent in 2008 to 10 per cent in 2013).
Fig. 2.22. Lithuania’s “Miss” group export structure during the period 2008–2013
reflected from perspective on type of export, by per cent (absolute values are provided by the Statistics Lithuania (CN2), percentage expression of export structure,
calculation and conversion of LTL into EUR computed by the author)
The second group of export structure is the “internal consumption mix” goods, the export of which consists of 50–100 per cent of imported goods (most-ly metal and other furniture, optical, medical and other electronic instruments). This kind of “internal consumption mix” goods could be presented as the basis for additional expenses to create a value added for the export of LT-origin goods.
The other exported goods based on the goods’ origin are analysed separate-ly, and the detailed information and figures are provided in Appendix B.
The conclusion the author can draw is that the summarized figure of total export’s structure by goods is the following as provided (see Fig. 2.23). It is to noticeable, that, regardless fact that the absolute value of LT-origin exports in-creased by 28 per cent, its share in common structure decreased from 68 per cent in 2008 to 57 per cent in 2013. The share of resale, independent of the type of resale, increased from 32 per cent in 2008 to 43 per cent in 2013 with the average growth of 81 per cent during the period of 2008–2013.
The graphical pictures and the discussions provided earlier allow assuming that, despite the author’s expectations, the largest share in the overall export amounted at 57 per cent of the Lithuanian-origin export (including “Mineral” products, presented as Lithuanian-origin products in the Lithuanian Statistics) (Fig. 2.24). Hence, there is dominated the type of resale such as “internal con-sumption mix”, which is closely related to the same Lithuanian-origin produc-
13%11% 13% 14% 14% 17%
68% 77% 73% 70% 65% 64%
2008 2009 2010 2011 2012 2013
LT-ORIGIN
INT-MIX
INT
DRY
WET
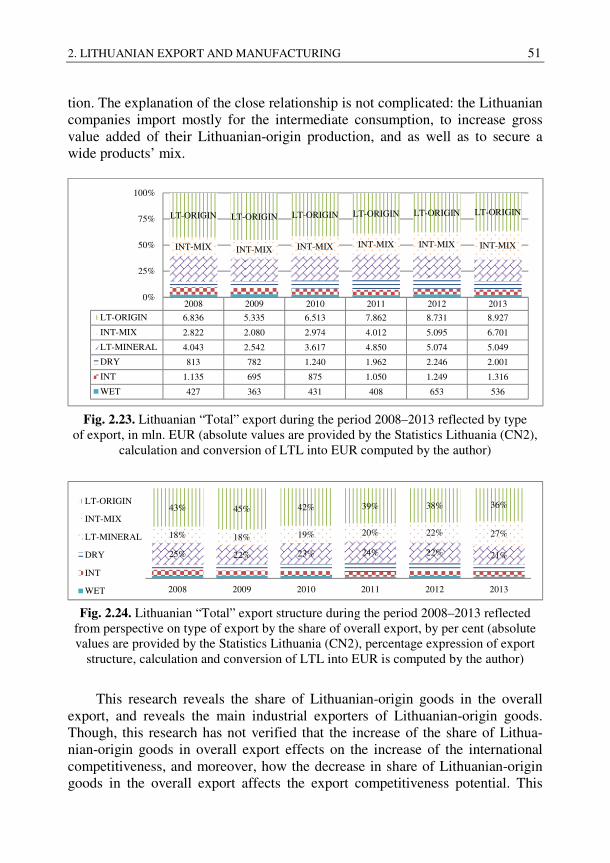
2. LITHUANIAN EXPORT AND MANUFACTURING 51
tion. The explanation of the close relationship is not complicated: the Lithuanian companies import mostly for the intermediate consumption, to increase gross value added of their Lithuanian-origin production, and as well as to secure a wide products’ mix.
Fig. 2.23. Lithuanian “Total” export during the period 2008–2013 reflected by type
of export, in mln. EUR (absolute values are provided by the Statistics Lithuania (CN2), calculation and conversion of LTL into EUR computed by the author)
Fig. 2.24. Lithuanian “Total” export structure during the period 2008–2013 reflected
from perspective on type of export by the share of overall export, by per cent (absolute values are provided by the Statistics Lithuania (CN2), percentage expression of export
structure, calculation and conversion of LTL into EUR is computed by the author)
This research reveals the share of Lithuanian-origin goods in the overall export, and reveals the main industrial exporters of Lithuanian-origin goods. Though, this research has not verified that the increase of the share of Lithua-nian-origin goods in overall export effects on the increase of the international competitiveness, and moreover, how the decrease in share of Lithuanian-origin goods in the overall export affects the export competitiveness potential. This
2008 2009 2010 2011 2012 2013
LT-ORIGIN 6.836 5.335 6.513 7.862 8.731 8.927
INT-MIX 2.822 2.080 2.974 4.012 5.095 6.701
LT-MINERAL 4.043 2.542 3.617 4.850 5.074 5.049
DRY 813 782 1.240 1.962 2.246 2.001
INT 1.135 695 875 1.050 1.249 1.316
WET 427 363 431 408 653 536
INT-MIX INT-MIX INT-MIX INT-MIX INT-MIX INT-MIX
LT-ORIGIN LT-ORIGIN LT-ORIGIN LT-ORIGIN LT-ORIGIN LT-ORIGIN
0%
25%
50%
75%
100%
25% 22% 23% 24% 22% 21%
18% 18% 19% 20% 22% 27%
43% 45% 42% 39% 38% 36%
2008 2009 2010 2011 2012 2013
LT-ORIGIN
INT-MIX
LT-MINERAL
DRY
INT
WET
52 2. LITHUANIAN EXPORT AND MANUFACTURING
statement proves to be a critical need for further analysis of the export competi-tiveness potential.
2.2.6. Conclusions of the Section 2.2
After in-depth analysis of export’s structure, the results indicate the following aspects:
1. The export analysis based on the nature of exported goods, provided in the Section 2.2.2 shows that relation between export structure and international export competitiveness can be seen:
a) the strongest positive relationship is found between “Other” group of exported goods (such as “Plastic”, “Agriculture”, “Wood”, “Metal” and “Miss”) and strengthening of the inter-national competitiveness;
b) the positive relationship is found between “Mach&Food” group of exported goods and international competitiveness growth;
c) the failing relationship is found between “Chemicals” and “Textile” groups of exported goods and weak international competitiveness.
2. The export analysis based on the factor inputs of exported goods, provided in the Section 2.2.3, shows that the country exports the significant share of goods produced by technology-driven and marke-ting-driven manufacturing sectors, i.e. machinery, electrical and other related equipment, and food, beverages and tobacco products.
3. The export analysis based on the sectorial composition of exported goods, provided in the Section 2.2.4, shows that export output struc-ture is slowly changing from the specialisated into the traditional in-dustries towards the diversified structure. Today the important role is played by the traditional goods, the position of commodities and technology-intensive goods is slightly growing.
4. The export analysis, based on the origin of exported goods, provided in the Section 2.2.5, allows identifying the manufacturing sectors, which are seen not only as the major contributors to the international trade, but also as the main Lithuanian-origin exporters. Notably, that “Machinery” group holds only 15 per cent of Lithuanian-origin export in the export structure in 2013, herewith, via the analysis pre-sented in Sections 2.2.2–2.2.4 this group is indicated as having posi-tive relationship with export competitiveness. This fact has to be ve-rified by the econometric analysis. The “Miss” group of exported
2. LITHUANIAN EXPORT AND MANUFACTURING 53
goods is the main Lithuanian-origin exporter (as well as “Plastic”, “Agriculture”, “Wood” and “Metal” groups of exported goods).
2.3. The Specific Features of the Manufacturing Structure in Lithuania
Over the recent 18 years (1996–2013) Lithuania, together with Latvia and Esto-nia, stood out in the EU as countries with a very energetic economic growth: these countries occupied the top three positions among the EU member states by the annual growth of the real GDP (Fig. 2.25). The average annual growth rate of the Lithuanian economy equaled 12 per cent and it tripled the EU-28 average, Latvia’s and Estonia’s indicators were slightly lowers (11 per cent).
During the analyzed period, the economic development in the Baltic States followed a similar scenario: all countries replaced their currencies by the Euro and introduced the Euro as a national currency; their governments pursued a rather strict fiscal policy; and the Scandinavian capital occupied strong positions in all three countries; moreover, a favorable geographic location secures genera-ting of sufficient revenue from re-export and transit.
Before the financial crisis of 2007–2008, as well as known as the Global Financial Crisis, the economic development in the Baltic States was boosted by the increased flows of foreign direct investment (FDI) into the banking sector, When influential foreign banks took over the control of many local banks more than ten years ago, borrowing costs went down dramatically swelling the bank loan portfolio, and making the impact on the construction sector and domestic trade. The real estate market was shaken up, as well. Therefore, rapid economic growth in the Baltic States relied to a large expansion of domestic consumption.
The financial crisis, in connection with the pre-crisis fever, had conside-rable consequences for the economies of the Baltic States: in 2009 GDP fell by 18 per cent in Lithuania, correspondingly reaching 19 per cent in Latvia and 14 per cent in Estonia.
Despite the above-mentioned common features of economic development and similar starting positions, the situation in Estonia and Latvia after the resto-ration of the independence happened to be more favorable for the services sector development as compared to Lithuania. Estonia is a neighbor of the Nordic countries and historically had close relationship with this region. Partly this ex-plains why the country generates more revenue from tourism and transit than Lithuania. Moreover, Estonia, which is 2.2 times smaller than Lithuania by po-pulation, managed to attract more FDI flows (Fig. 2.26) with the lion’s share coming from Scandinavia, as the Nordic countries (Denmark and Sweden) are focusing on development of their services export. Similar finding can be applied
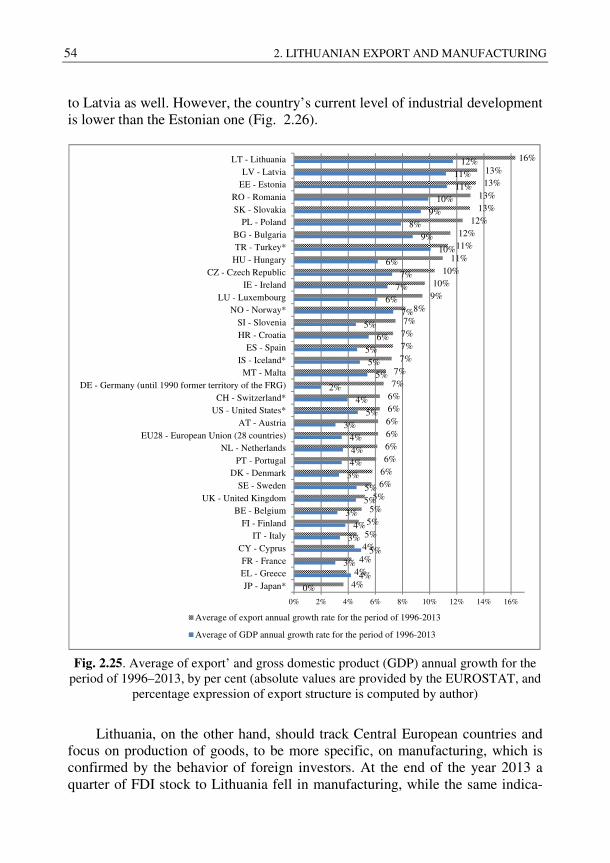
54 2. LITHUANIAN EXPORT AND MANUFACTURING
to Latvia as well. However, the country’s current level of industrial development is lower than the Estonian one (Fig. 2.26).
Fig. 2.25. Average of export’ and gross domestic product (GDP) annual growth for the
period of 1996–2013, by per cent (absolute values are provided by the EUROSTAT, and percentage expression of export structure is computed by author)
Lithuania, on the other hand, should track Central European countries and focus on production of goods, to be more specific, on manufacturing, which is confirmed by the behavior of foreign investors. At the end of the year 2013 a quarter of FDI stock to Lithuania fell in manufacturing, while the same indica-
0%4%
3%5%
3%4%
3%5%5%
3%4%4%4%
3%5%
4%2%
5%5%
5%6%
5%7%
6%7%
7%6%
10%9%
8%9%
10%11%11%
12%
4%4%
4%4%5%5%5%5%
6%6%6%6%6%6%6%6%7%7%
7%7%7%7%
8%9%10%
10%11%
11%12%
12%13%13%
13%13%
16%
0% 2% 4% 6% 8% 10% 12% 14% 16%
JP - Japan*EL - GreeceFR - France
CY - CyprusIT - Italy
FI - FinlandBE - Belgium
UK - United KingdomSE - Sweden
DK - DenmarkPT - Portugal
NL - NetherlandsEU28 - European Union (28 countries)
AT - AustriaUS - United States*CH - Switzerland*
DE - Germany (until 1990 former territory of the FRG)MT - Malta
IS - Iceland*ES - Spain
HR - CroatiaSI - Slovenia
NO - Norway*LU - Luxembourg
IE - IrelandCZ - Czech Republic
HU - HungaryTR - Turkey*BG - Bulgaria
PL - PolandSK - SlovakiaRO - Romania
EE - EstoniaLV - Latvia
LT - Lithuania
Average of export annual growth rate for the period of 1996-2013
Average of GDP annual growth rate for the period of 1996-2013
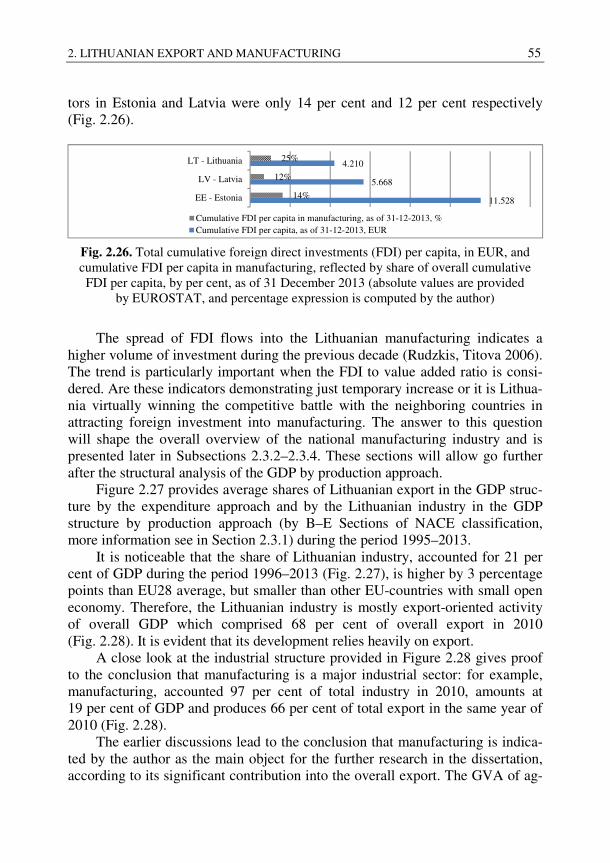
2. LITHUANIAN EXPORT AND MANUFACTURING 55
tors in Estonia and Latvia were only 14 per cent and 12 per cent respectively (Fig. 2.26).
Fig. 2.26. Total cumulative foreign direct investments (FDI) per capita, in EUR, and cumulative FDI per capita in manufacturing, reflected by share of overall cumulative FDI per capita, by per cent, as of 31 December 2013 (absolute values are provided
by EUROSTAT, and percentage expression is computed by the author)
The spread of FDI flows into the Lithuanian manufacturing indicates a higher volume of investment during the previous decade (Rudzkis, Titova 2006). The trend is particularly important when the FDI to value added ratio is consi-dered. Are these indicators demonstrating just temporary increase or it is Lithua-nia virtually winning the competitive battle with the neighboring countries in attracting foreign investment into manufacturing. The answer to this question will shape the overall overview of the national manufacturing industry and is presented later in Subsections 2.3.2–2.3.4. These sections will allow go further after the structural analysis of the GDP by production approach.
Figure 2.27 provides average shares of Lithuanian export in the GDP struc-ture by the expenditure approach and by the Lithuanian industry in the GDP structure by production approach (by B–E Sections of NACE classification, more information see in Section 2.3.1) during the period 1995–2013.
It is noticeable that the share of Lithuanian industry, accounted for 21 per cent of GDP during the period 1996–2013 (Fig. 2.27), is higher by 3 percentage points than EU28 average, but smaller than other EU-countries with small open economy. Therefore, the Lithuanian industry is mostly export-oriented activity of overall GDP which comprised 68 per cent of overall export in 2010 (Fig. 2.28). It is evident that its development relies heavily on export.
A close look at the industrial structure provided in Figure 2.28 gives proof to the conclusion that manufacturing is a major industrial sector: for example, manufacturing, accounted 97 per cent of total industry in 2010, amounts at 19 per cent of GDP and produces 66 per cent of total export in the same year of 2010 (Fig. 2.28).
The earlier discussions lead to the conclusion that manufacturing is indica-ted by the author as the main object for the further research in the dissertation, according to its significant contribution into the overall export. The GVA of ag-
11.528
5.668
4.210
14%
12%
25%
EE - Estonia
LV - Latvia
LT - Lithuania
Cumulative FDI per capita in manufacturing, as of 31-12-2013, %Cumulative FDI per capita, as of 31-12-2013, EUR
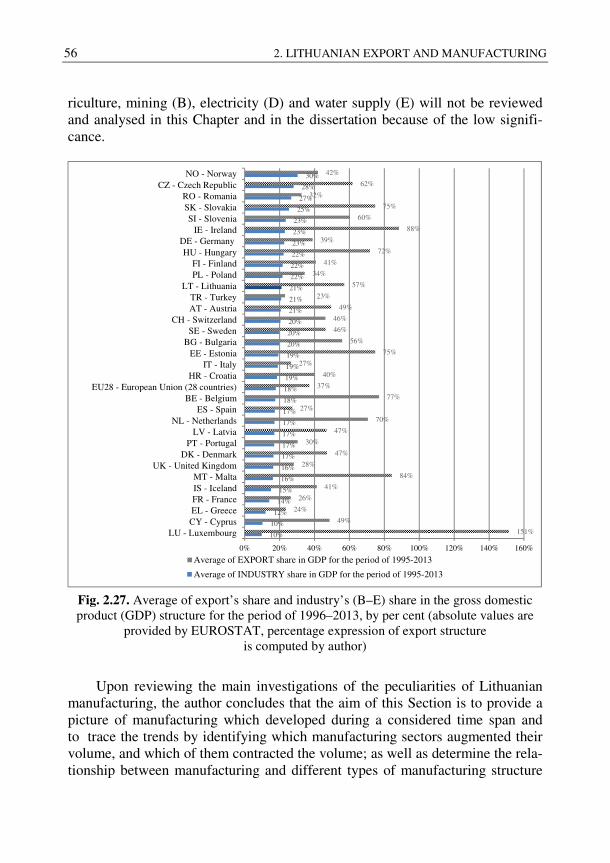
56 2. LITHUANIAN EXPORT AND MANUFACTURING
riculture, mining (B), electricity (D) and water supply (E) will not be reviewed and analysed in this Chapter and in the dissertation because of the low signifi-cance.
Fig. 2.27. Average of export’s share and industry’s (B–E) share in the gross domestic product (GDP) structure for the period of 1996–2013, by per cent (absolute values are
provided by EUROSTAT, percentage expression of export structure is computed by author)
Upon reviewing the main investigations of the peculiarities of Lithuanian manufacturing, the author concludes that the aim of this Section is to provide a picture of manufacturing which developed during a considered time span and to trace the trends by identifying which manufacturing sectors augmented their volume, and which of them contracted the volume; as well as determine the rela-tionship between manufacturing and different types of manufacturing structure
10%
10%
12%
14%
15%
16%
16%
17%
17%
17%
17%
17%
18%
18%
19%
19%
19%
20%
20%
20%
21%
21%
21%
22%
22%
22%
23%
23%
23%
25%
27%
28%
30%
151%
49%
24%
26%
41%
84%
28%
47%
30%
47%
70%
27%
77%
37%
40%
27%
75%
56%
46%
46%
49%
23%
57%
34%
41%
72%
39%
88%
60%
75%
32%
62%
42%
0% 20% 40% 60% 80% 100% 120% 140% 160%
LU - LuxembourgCY - CyprusEL - GreeceFR - FranceIS - IcelandMT - Malta
UK - United KingdomDK - Denmark
PT - PortugalLV - Latvia
NL - NetherlandsES - Spain
BE - BelgiumEU28 - European Union (28 countries)
HR - CroatiaIT - Italy
EE - EstoniaBG - BulgariaSE - Sweden
CH - SwitzerlandAT - AustriaTR - Turkey
LT - LithuaniaPL - PolandFI - Finland
HU - HungaryDE - Germany
IE - IrelandSI - Slovenia
SK - SlovakiaRO - Romania
CZ - Czech RepublicNO - Norway
Average of EXPORT share in GDP for the period of 1995-2013
Average of INDUSTRY share in GDP for the period of 1995-2013
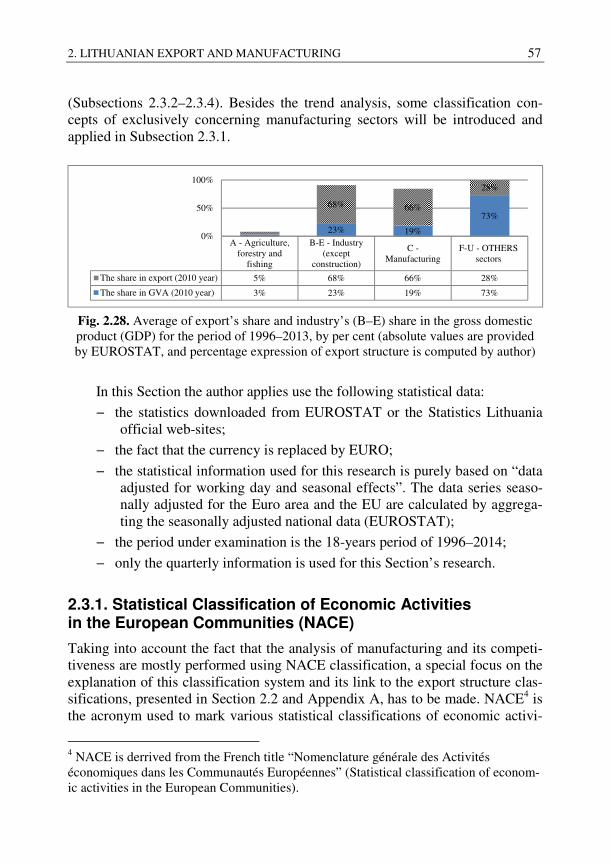
2. LITHUANIAN EXPORT AND MANUFACTURING 57
(Subsections 2.3.2–2.3.4). Besides the trend analysis, some classification con-cepts of exclusively concerning manufacturing sectors will be introduced and applied in Subsection 2.3.1.
Fig. 2.28. Average of export’s share and industry’s (B–E) share in the gross domestic product (GDP) for the period of 1996–2013, by per cent (absolute values are provided by EUROSTAT, and percentage expression of export structure is computed by author)
In this Section the author applies use the following statistical data:
− the statistics downloaded from EUROSTAT or the Statistics Lithuania official web-sites;
− the fact that the currency is replaced by EURO;
− the statistical information used for this research is purely based on “data adjusted for working day and seasonal effects”. The data series seaso-nally adjusted for the Euro area and the EU are calculated by aggrega-ting the seasonally adjusted national data (EUROSTAT);
− the period under examination is the 18-years period of 1996–2014;
− only the quarterly information is used for this Section’s research.
2.3.1. Statistical Classification of Economic Activities in the European Communities (NACE)
Taking into account the fact that the analysis of manufacturing and its competi-tiveness are mostly performed using NACE classification, a special focus on the explanation of this classification system and its link to the export structure clas-sifications, presented in Section 2.2 and Appendix A, has to be made. NACE4 is the acronym used to mark various statistical classifications of economic activi-
4 NACE is derrived from the French title “Nomenclature générale des Activités économiques dans les Communautés Européennes” (Statistical classification of econom-ic activities in the European Communities).
A - Agriculture,forestry and
fishing
B-E - Industry(except
construction)
C -Manufacturing
F-U - OTHERSsectors
The share in export (2010 year) 5% 68% 66% 28%
The share in GVA (2010 year) 3% 23% 19% 73%
23% 19%
73%68% 66%
28%
0%
50%
100%
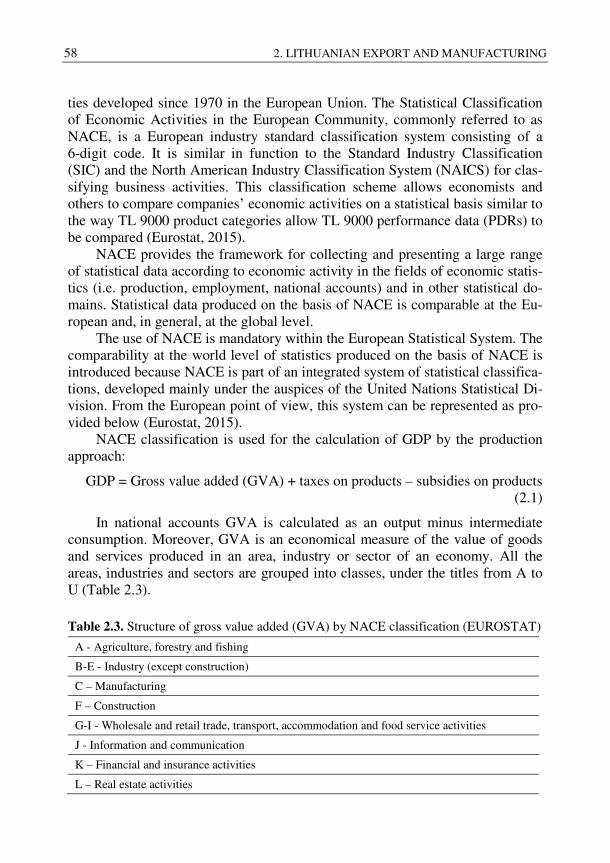
58 2. LITHUANIAN EXPORT AND MANUFACTURING
ties developed since 1970 in the European Union. The Statistical Classification of Economic Activities in the European Community, commonly referred to as NACE, is a European industry standard classification system consisting of a 6-digit code. It is similar in function to the Standard Industry Classification (SIC) and the North American Industry Classification System (NAICS) for clas-sifying business activities. This classification scheme allows economists and others to compare companies’ economic activities on a statistical basis similar to the way TL 9000 product categories allow TL 9000 performance data (PDRs) to be compared (Eurostat, 2015).
NACE provides the framework for collecting and presenting a large range of statistical data according to economic activity in the fields of economic statis-tics (i.e. production, employment, national accounts) and in other statistical do-mains. Statistical data produced on the basis of NACE is comparable at the Eu-ropean and, in general, at the global level.
The use of NACE is mandatory within the European Statistical System. The comparability at the world level of statistics produced on the basis of NACE is introduced because NACE is part of an integrated system of statistical classifica-tions, developed mainly under the auspices of the United Nations Statistical Di-vision. From the European point of view, this system can be represented as pro-vided below (Eurostat, 2015).
NACE classification is used for the calculation of GDP by the production approach:
GDP = Gross value added (GVA) + taxes on products – subsidies on products (2.1)
In national accounts GVA is calculated as an output minus intermediate consumption. Moreover, GVA is an economical measure of the value of goods and services produced in an area, industry or sector of an economy. All the areas, industries and sectors are grouped into classes, under the titles from A to U (Table 2.3).
Table 2.3. Structure of gross value added (GVA) by NACE classification (EUROSTAT)
A - Agriculture, forestry and fishing
B-E - Industry (except construction)
C – Manufacturing
F – Construction
G-I - Wholesale and retail trade, transport, accommodation and food service activities
J - Information and communication
K – Financial and insurance activities
L – Real estate activities
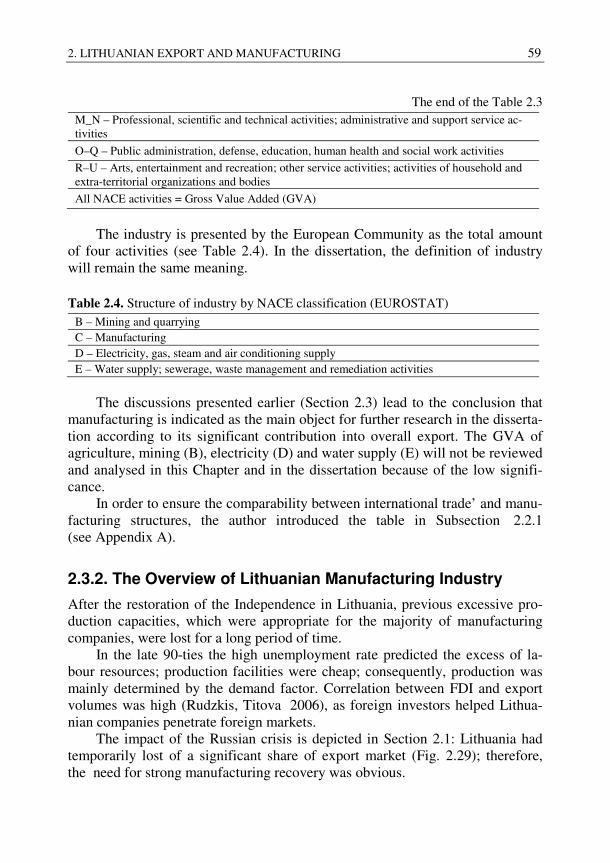
2. LITHUANIAN EXPORT AND MANUFACTURING 59
The end of the Table 2.3 M_N – Professional, scientific and technical activities; administrative and support service ac-tivities
O–Q – Public administration, defense, education, human health and social work activities
R–U – Arts, entertainment and recreation; other service activities; activities of household and extra-territorial organizations and bodies
All NACE activities = Gross Value Added (GVA)
The industry is presented by the European Community as the total amount
of four activities (see Table 2.4). In the dissertation, the definition of industry will remain the same meaning.
Table 2.4. Structure of industry by NACE classification (EUROSTAT)
B – Mining and quarrying C – Manufacturing D – Electricity, gas, steam and air conditioning supply E – Water supply; sewerage, waste management and remediation activities
The discussions presented earlier (Section 2.3) lead to the conclusion that
manufacturing is indicated as the main object for further research in the disserta-tion according to its significant contribution into overall export. The GVA of agriculture, mining (B), electricity (D) and water supply (E) will not be reviewed and analysed in this Chapter and in the dissertation because of the low signifi-cance.
In order to ensure the comparability between international trade’ and manu-facturing structures, the author introduced the table in Subsection 2.2.1 (see Appendix A).
2.3.2. The Overview of Lithuanian Manufacturing Industry
After the restoration of the Independence in Lithuania, previous excessive pro-duction capacities, which were appropriate for the majority of manufacturing companies, were lost for a long period of time.
In the late 90-ties the high unemployment rate predicted the excess of la-bour resources; production facilities were cheap; consequently, production was mainly determined by the demand factor. Correlation between FDI and export volumes was high (Rudzkis, Titova 2006), as foreign investors helped Lithua-nian companies penetrate foreign markets.
The impact of the Russian crisis is depicted in Section 2.1: Lithuania had temporarily lost of a significant share of export market (Fig. 2.29); therefore, the need for strong manufacturing recovery was obvious.
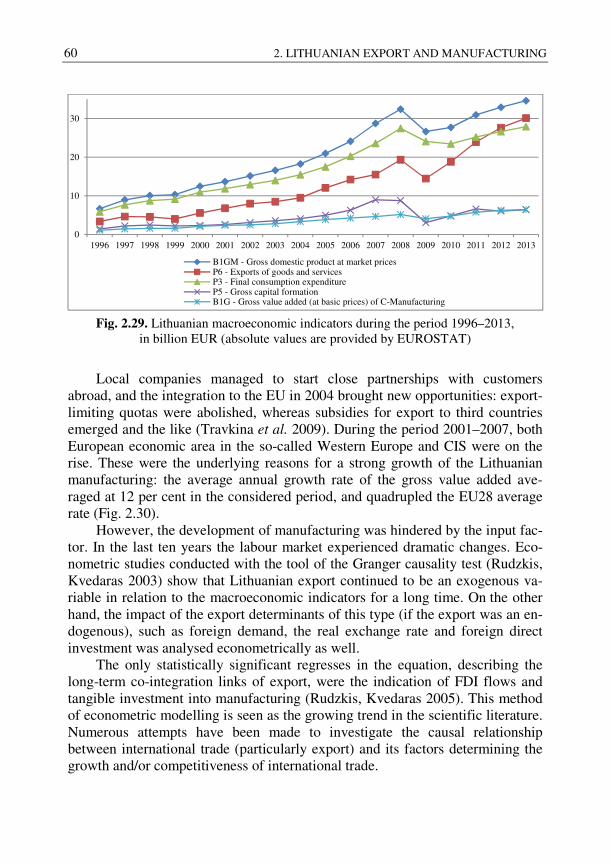
60 2. LITHUANIAN EXPORT AND MANUFACTURING
Fig. 2.29. Lithuanian macroeconomic indicators during the period 1996–2013,
in billion EUR (absolute values are provided by EUROSTAT)
Local companies managed to start close partnerships with customers abroad, and the integration to the EU in 2004 brought new opportunities: export-limiting quotas were abolished, whereas subsidies for export to third countries emerged and the like (Travkina et al. 2009). During the period 2001–2007, both European economic area in the so-called Western Europe and CIS were on the rise. These were the underlying reasons for a strong growth of the Lithuanian manufacturing: the average annual growth rate of the gross value added ave-raged at 12 per cent in the considered period, and quadrupled the EU28 average rate (Fig. 2.30).
However, the development of manufacturing was hindered by the input fac-tor. In the last ten years the labour market experienced dramatic changes. Eco-nometric studies conducted with the tool of the Granger causality test (Rudzkis, Kvedaras 2003) show that Lithuanian export continued to be an exogenous va-riable in relation to the macroeconomic indicators for a long time. On the other hand, the impact of the export determinants of this type (if the export was an en-dogenous), such as foreign demand, the real exchange rate and foreign direct investment was analysed econometrically as well.
The only statistically significant regresses in the equation, describing the long-term co-integration links of export, were the indication of FDI flows and tangible investment into manufacturing (Rudzkis, Kvedaras 2005). This method of econometric modelling is seen as the growing trend in the scientific literature. Numerous attempts have been made to investigate the causal relationship between international trade (particularly export) and its factors determining the growth and/or competitiveness of international trade.
0
10
20
30
1996 1997 1998 1999 2000 2001 2002 2003 2004 2005 2006 2007 2008 2009 2010 2011 2012 2013
B1GM - Gross domestic product at market pricesP6 - Exports of goods and servicesP3 - Final consumption expenditureP5 - Gross capital formationB1G - Gross value added (at basic prices) of C-Manufacturing
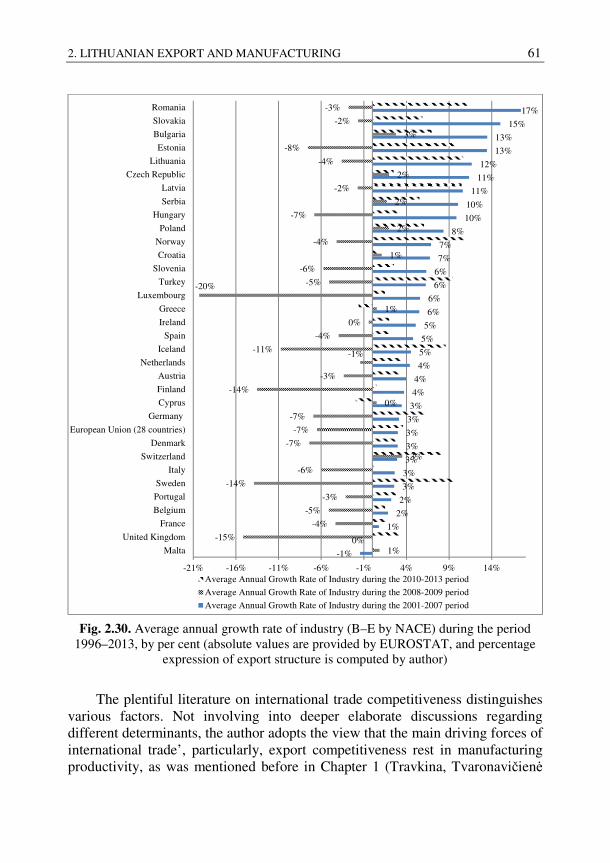
2. LITHUANIAN EXPORT AND MANUFACTURING 61
Fig. 2.30. Average annual growth rate of industry (B–E by NACE) during the period
1996–2013, by per cent (absolute values are provided by EUROSTAT, and percentage expression of export structure is computed by author)
The plentiful literature on international trade competitiveness distinguishes various factors. Not involving into deeper elaborate discussions regarding different determinants, the author adopts the view that the main driving forces of international trade’, particularly, export competitiveness rest in manufacturing productivity, as was mentioned before in Chapter 1 (Travkina, Tvaronavičienė
-1%
0%
1%
2%
2%
3%
3%
3%
3%
3%
3%
3%
4%
4%
4%
5%
5%
5%
6%
6%
6%
6%
7%
7%
8%
10%
10%
11%
11%
12%
13%
13%
15%
17%
1%
-15%
-4%
-5%
-3%
-14%
-6%
3%
-7%
-7%
-7%
0%
-14%
-3%
-1%-11%
-4%
0%
1%
-20% -5%
-6%
1%
-4%
2%
-7%
2%
-2%
2%
-4%
-8%
3%
-2%
-3%
-21% -16% -11% -6% -1% 4% 9% 14%
Malta
United Kingdom
France
Belgium
Portugal
Sweden
Italy
Switzerland
Denmark
European Union (28 countries)
Germany
Cyprus
Finland
Austria
Netherlands
Iceland
Spain
Ireland
Greece
Luxembourg
Turkey
Slovenia
Croatia
Norway
Poland
Hungary
Serbia
Latvia
Czech Republic
Lithuania
Estonia
Bulgaria
Slovakia
Romania
Average Annual Growth Rate of Industry during the 2010-2013 period
Average Annual Growth Rate of Industry during the 2008-2009 period
Average Annual Growth Rate of Industry during the 2001-2007 period
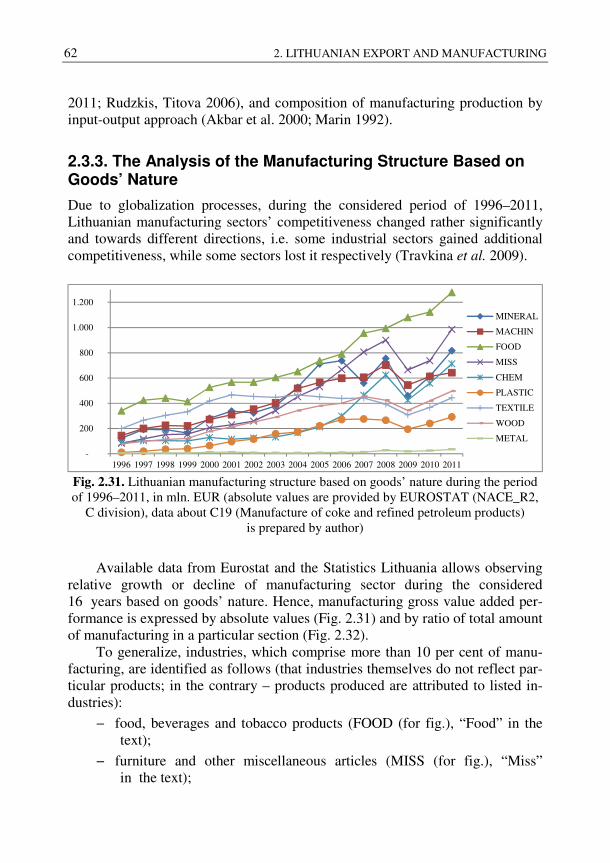
62 2. LITHUANIAN EXPORT AND MANUFACTURING
2011; Rudzkis, Titova 2006), and composition of manufacturing production by input-output approach (Akbar et al. 2000; Marin 1992).
2.3.3. The Analysis of the Manufacturing Structure Based on Goods’ Nature
Due to globalization processes, during the considered period of 1996–2011, Lithuanian manufacturing sectors’ competitiveness changed rather significantly and towards different directions, i.e. some industrial sectors gained additional competitiveness, while some sectors lost it respectively (Travkina et al. 2009).
Fig. 2.31. Lithuanian manufacturing structure based on goods’ nature during the period of 1996–2011, in mln. EUR (absolute values are provided by EUROSTAT (NACE_R2,
C division), data about C19 (Manufacture of coke and refined petroleum products) is prepared by author)
Available data from Eurostat and the Statistics Lithuania allows observing relative growth or decline of manufacturing sector during the considered 16 years based on goods’ nature. Hence, manufacturing gross value added per-formance is expressed by absolute values (Fig. 2.31) and by ratio of total amount of manufacturing in a particular section (Fig. 2.32).
To generalize, industries, which comprise more than 10 per cent of manu-facturing, are identified as follows (that industries themselves do not reflect par-ticular products; in the contrary – products produced are attributed to listed in-dustries):
− food, beverages and tobacco products (FOOD (for fig.), “Food” in the text);
− furniture and other miscellaneous articles (MISS (for fig.), “Miss” in the text);
-
200
400
600
800
1.000
1.200
1996 1997 1998 1999 2000 2001 2002 2003 2004 2005 2006 2007 2008 2009 2010 2011
MINERAL
MACHIN
FOOD
MISS
CHEM
PLASTIC
TEXTILE
WOOD
METAL
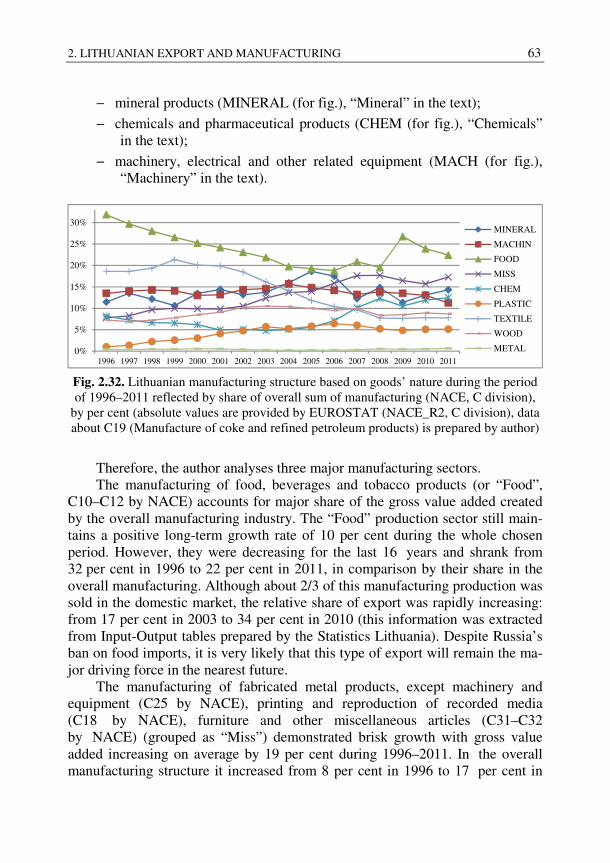
2. LITHUANIAN EXPORT AND MANUFACTURING 63
− mineral products (MINERAL (for fig.), “Mineral” in the text);
− chemicals and pharmaceutical products (CHEM (for fig.), “Chemicals” in the text);
− machinery, electrical and other related equipment (MACH (for fig.), “Machinery” in the text).
Fig. 2.32. Lithuanian manufacturing structure based on goods’ nature during the period of 1996–2011 reflected by share of overall sum of manufacturing (NACE, C division),
by per cent (absolute values are provided by EUROSTAT (NACE_R2, C division), data about C19 (Manufacture of coke and refined petroleum products) is prepared by author)
Therefore, the author analyses three major manufacturing sectors. The manufacturing of food, beverages and tobacco products (or “Food”,
C10–C12 by NACE) accounts for major share of the gross value added created by the overall manufacturing industry. The “Food” production sector still main-tains a positive long-term growth rate of 10 per cent during the whole chosen period. However, they were decreasing for the last 16 years and shrank from 32 per cent in 1996 to 22 per cent in 2011, in comparison by their share in the overall manufacturing. Although about 2/3 of this manufacturing production was sold in the domestic market, the relative share of export was rapidly increasing: from 17 per cent in 2003 to 34 per cent in 2010 (this information was extracted from Input-Output tables prepared by the Statistics Lithuania). Despite Russia’s ban on food imports, it is very likely that this type of export will remain the ma-jor driving force in the nearest future.
The manufacturing of fabricated metal products, except machinery and equipment (C25 by NACE), printing and reproduction of recorded media (C18 by NACE), furniture and other miscellaneous articles (C31–C32 by NACE) (grouped as “Miss”) demonstrated brisk growth with gross value added increasing on average by 19 per cent during 1996–2011. In the overall manufacturing structure it increased from 8 per cent in 1996 to 17 per cent in
0%
5%
10%
15%
20%
25%
30%
1996 1997 1998 1999 2000 2001 2002 2003 2004 2005 2006 2007 2008 2009 2010 2011
MINERAL
MACHIN
FOOD
MISS
CHEM
PLASTIC
TEXTILE
WOOD
METAL
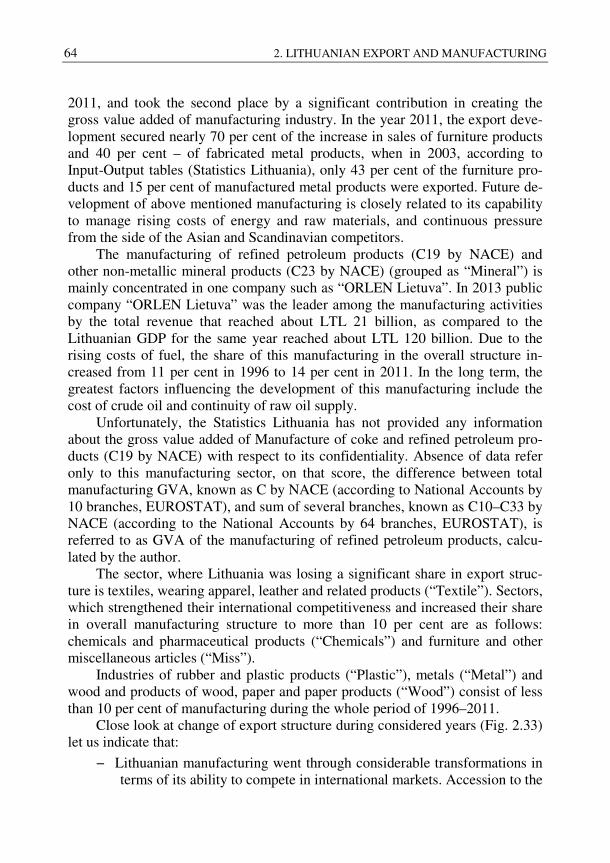
64 2. LITHUANIAN EXPORT AND MANUFACTURING
2011, and took the second place by a significant contribution in creating the gross value added of manufacturing industry. In the year 2011, the export deve-lopment secured nearly 70 per cent of the increase in sales of furniture products and 40 per cent – of fabricated metal products, when in 2003, according to Input-Output tables (Statistics Lithuania), only 43 per cent of the furniture pro-ducts and 15 per cent of manufactured metal products were exported. Future de-velopment of above mentioned manufacturing is closely related to its capability to manage rising costs of energy and raw materials, and continuous pressure from the side of the Asian and Scandinavian competitors.
The manufacturing of refined petroleum products (C19 by NACE) and other non-metallic mineral products (C23 by NACE) (grouped as “Mineral”) is mainly concentrated in one company such as “ORLEN Lietuva”. In 2013 public company “ORLEN Lietuva” was the leader among the manufacturing activities by the total revenue that reached about LTL 21 billion, as compared to the Lithuanian GDP for the same year reached about LTL 120 billion. Due to the rising costs of fuel, the share of this manufacturing in the overall structure in-creased from 11 per cent in 1996 to 14 per cent in 2011. In the long term, the greatest factors influencing the development of this manufacturing include the cost of crude oil and continuity of raw oil supply.
Unfortunately, the Statistics Lithuania has not provided any information about the gross value added of Manufacture of coke and refined petroleum pro-ducts (C19 by NACE) with respect to its confidentiality. Absence of data refer only to this manufacturing sector, on that score, the difference between total manufacturing GVA, known as C by NACE (according to National Accounts by 10 branches, EUROSTAT), and sum of several branches, known as C10–C33 by NACE (according to the National Accounts by 64 branches, EUROSTAT), is referred to as GVA of the manufacturing of refined petroleum products, calcu-lated by the author.
The sector, where Lithuania was losing a significant share in export struc-ture is textiles, wearing apparel, leather and related products (“Textile”). Sectors, which strengthened their international competitiveness and increased their share in overall manufacturing structure to more than 10 per cent are as follows: chemicals and pharmaceutical products (“Chemicals”) and furniture and other miscellaneous articles (“Miss”).
Industries of rubber and plastic products (“Plastic”), metals (“Metal”) and wood and products of wood, paper and paper products (“Wood”) consist of less than 10 per cent of manufacturing during the whole period of 1996–2011.
Close look at change of export structure during considered years (Fig. 2.33) let us indicate that:
− Lithuanian manufacturing went through considerable transformations in terms of its ability to compete in international markets. Accession to the
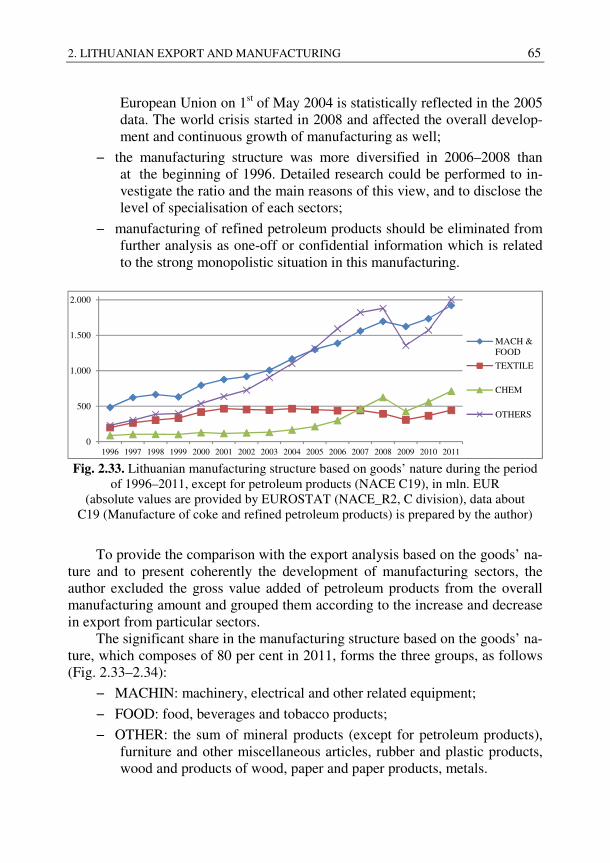
2. LITHUANIAN EXPORT AND MANUFACTURING 65
European Union on 1st of May 2004 is statistically reflected in the 2005 data. The world crisis started in 2008 and affected the overall develop-ment and continuous growth of manufacturing as well;
− the manufacturing structure was more diversified in 2006–2008 than at the beginning of 1996. Detailed research could be performed to in-vestigate the ratio and the main reasons of this view, and to disclose the level of specialisation of each sectors;
− manufacturing of refined petroleum products should be eliminated from further analysis as one-off or confidential information which is related to the strong monopolistic situation in this manufacturing.
Fig. 2.33. Lithuanian manufacturing structure based on goods’ nature during the period of 1996–2011, except for petroleum products (NACE C19), in mln. EUR
(absolute values are provided by EUROSTAT (NACE_R2, C division), data about C19 (Manufacture of coke and refined petroleum products) is prepared by the author)
To provide the comparison with the export analysis based on the goods’ na-ture and to present coherently the development of manufacturing sectors, the author excluded the gross value added of petroleum products from the overall manufacturing amount and grouped them according to the increase and decrease in export from particular sectors.
The significant share in the manufacturing structure based on the goods’ na-ture, which composes of 80 per cent in 2011, forms the three groups, as follows (Fig. 2.33–2.34):
− MACHIN: machinery, electrical and other related equipment;
− FOOD: food, beverages and tobacco products;
− OTHER: the sum of mineral products (except for petroleum products), furniture and other miscellaneous articles, rubber and plastic products, wood and products of wood, paper and paper products, metals.
0
500
1.000
1.500
2.000
1996 1997 1998 1999 2000 2001 2002 2003 2004 2005 2006 2007 2008 2009 2010 2011
MACH &FOOD
TEXTILE
CHEM
OTHERS
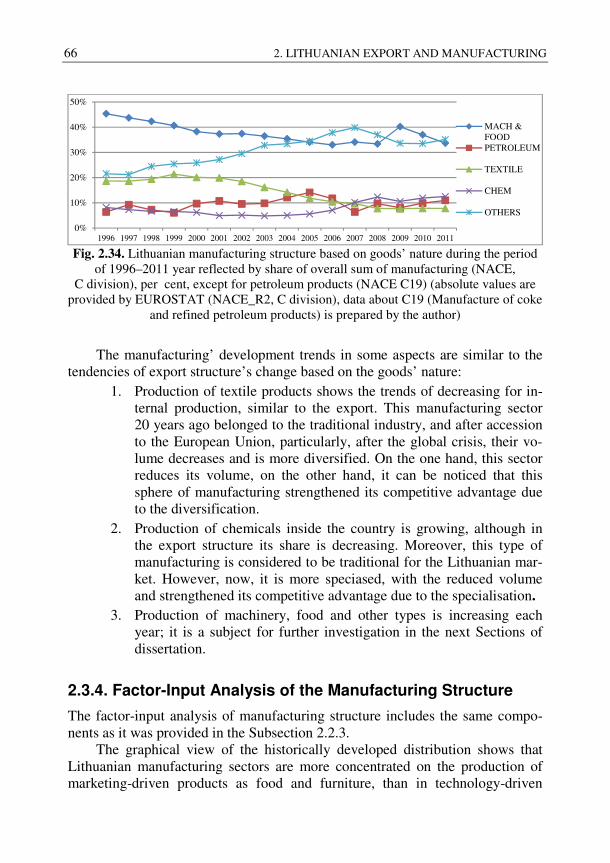
66 2. LITHUANIAN EXPORT AND MANUFACTURING
Fig. 2.34. Lithuanian manufacturing structure based on goods’ nature during the period of 1996–2011 year reflected by share of overall sum of manufacturing (NACE,
C division), per cent, except for petroleum products (NACE C19) (absolute values are provided by EUROSTAT (NACE_R2, C division), data about C19 (Manufacture of coke
and refined petroleum products) is prepared by the author)
The manufacturing’ development trends in some aspects are similar to the tendencies of export structure’s change based on the goods’ nature:
1. Production of textile products shows the trends of decreasing for in-ternal production, similar to the export. This manufacturing sector 20 years ago belonged to the traditional industry, and after accession to the European Union, particularly, after the global crisis, their vo-lume decreases and is more diversified. On the one hand, this sector reduces its volume, on the other hand, it can be noticed that this sphere of manufacturing strengthened its competitive advantage due to the diversification.
2. Production of chemicals inside the country is growing, although in the export structure its share is decreasing. Moreover, this type of manufacturing is considered to be traditional for the Lithuanian mar-ket. However, now, it is more speciased, with the reduced volume and strengthened its competitive advantage due to the specialisation.
3. Production of machinery, food and other types is increasing each year; it is a subject for further investigation in the next Sections of dissertation.
2.3.4. Factor-Input Analysis of the Manufacturing Structure
The factor-input analysis of manufacturing structure includes the same compo-nents as it was provided in the Subsection 2.2.3.
The graphical view of the historically developed distribution shows that Lithuanian manufacturing sectors are more concentrated on the production of marketing-driven products as food and furniture, than in technology-driven
0%
10%
20%
30%
40%
50%
1996 1997 1998 1999 2000 2001 2002 2003 2004 2005 2006 2007 2008 2009 2010 2011
MACH &FOODPETROLEUM
TEXTILE
CHEM
OTHERS
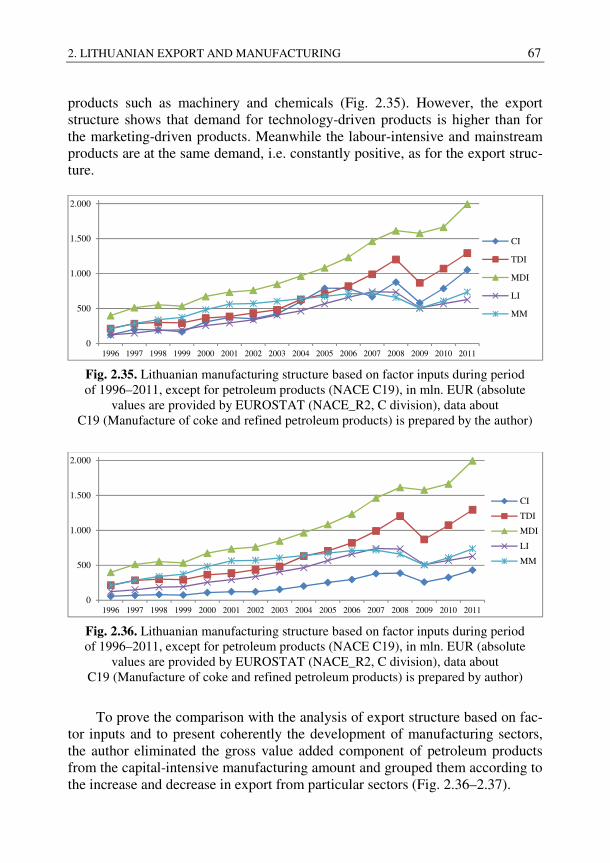
2. LITHUANIAN EXPORT AND MANUFACTURING 67
products such as machinery and chemicals (Fig. 2.35). However, the export structure shows that demand for technology-driven products is higher than for the marketing-driven products. Meanwhile the labour-intensive and mainstream products are at the same demand, i.e. constantly positive, as for the export struc-ture.
Fig. 2.35. Lithuanian manufacturing structure based on factor inputs during period of 1996–2011, except for petroleum products (NACE C19), in mln. EUR (absolute
values are provided by EUROSTAT (NACE_R2, C division), data about C19 (Manufacture of coke and refined petroleum products) is prepared by the author)
Fig. 2.36. Lithuanian manufacturing structure based on factor inputs during period of 1996–2011, except for petroleum products (NACE C19), in mln. EUR (absolute
values are provided by EUROSTAT (NACE_R2, C division), data about C19 (Manufacture of coke and refined petroleum products) is prepared by author)
To prove the comparison with the analysis of export structure based on fac-tor inputs and to present coherently the development of manufacturing sectors, the author eliminated the gross value added component of petroleum products from the capital-intensive manufacturing amount and grouped them according to the increase and decrease in export from particular sectors (Fig. 2.36–2.37).
0
500
1.000
1.500
2.000
1996 1997 1998 1999 2000 2001 2002 2003 2004 2005 2006 2007 2008 2009 2010 2011
CI
TDI
MDI
LI
MM
0
500
1.000
1.500
2.000
1996 1997 1998 1999 2000 2001 2002 2003 2004 2005 2006 2007 2008 2009 2010 2011
CI
TDI
MDI
LI
MM
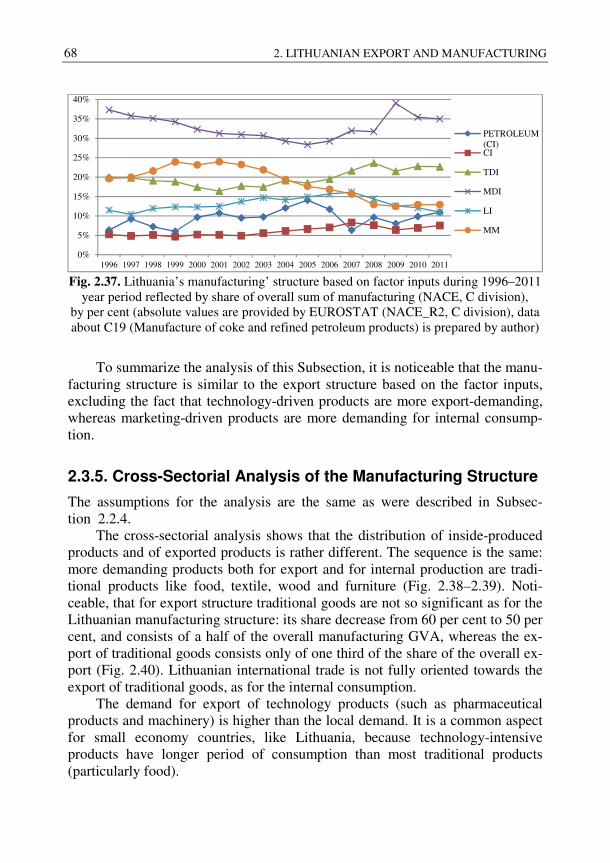
68 2. LITHUANIAN EXPORT AND MANUFACTURING
Fig. 2.37. Lithuania’s manufacturing’ structure based on factor inputs during 1996–2011 year period reflected by share of overall sum of manufacturing (NACE, C division),
by per cent (absolute values are provided by EUROSTAT (NACE_R2, C division), data about C19 (Manufacture of coke and refined petroleum products) is prepared by author)
To summarize the analysis of this Subsection, it is noticeable that the manu-facturing structure is similar to the export structure based on the factor inputs, excluding the fact that technology-driven products are more export-demanding, whereas marketing-driven products are more demanding for internal consump-tion.
2.3.5. Cross-Sectorial Analysis of the Manufacturing Structure
The assumptions for the analysis are the same as were described in Subsec-tion 2.2.4.
The cross-sectorial analysis shows that the distribution of inside-produced products and of exported products is rather different. The sequence is the same: more demanding products both for export and for internal production are tradi-tional products like food, textile, wood and furniture (Fig. 2.38–2.39). Noti-ceable, that for export structure traditional goods are not so significant as for the Lithuanian manufacturing structure: its share decrease from 60 per cent to 50 per cent, and consists of a half of the overall manufacturing GVA, whereas the ex-port of traditional goods consists only of one third of the share of the overall ex-port (Fig. 2.40). Lithuanian international trade is not fully oriented towards the export of traditional goods, as for the internal consumption.
The demand for export of technology products (such as pharmaceutical products and machinery) is higher than the local demand. It is a common aspect for small economy countries, like Lithuania, because technology-intensive products have longer period of consumption than most traditional products (particularly food).
0%
5%
10%
15%
20%
25%
30%
35%
40%
1996 1997 1998 1999 2000 2001 2002 2003 2004 2005 2006 2007 2008 2009 2010 2011
PETROLEUM(CI)CI
TDI
MDI
LI
MM
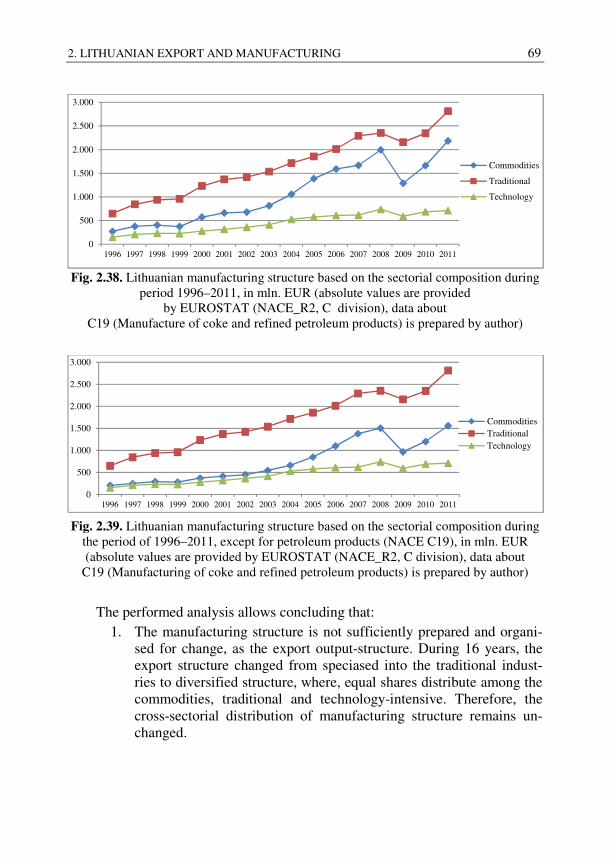
2. LITHUANIAN EXPORT AND MANUFACTURING 69
Fig. 2.38. Lithuanian manufacturing structure based on the sectorial composition during period 1996–2011, in mln. EUR (absolute values are provided
by EUROSTAT (NACE_R2, C division), data about C19 (Manufacture of coke and refined petroleum products) is prepared by author)
Fig. 2.39. Lithuanian manufacturing structure based on the sectorial composition during
the period of 1996–2011, except for petroleum products (NACE C19), in mln. EUR (absolute values are provided by EUROSTAT (NACE_R2, C division), data about
C19 (Manufacturing of coke and refined petroleum products) is prepared by author)
The performed analysis allows concluding that: 1. The manufacturing structure is not sufficiently prepared and organi-
sed for change, as the export output-structure. During 16 years, the export structure changed from speciased into the traditional indust-ries to diversified structure, where, equal shares distribute among the commodities, traditional and technology-intensive. Therefore, the cross-sectorial distribution of manufacturing structure remains un-changed.
0
500
1.000
1.500
2.000
2.500
3.000
1996 1997 1998 1999 2000 2001 2002 2003 2004 2005 2006 2007 2008 2009 2010 2011
Commodities
Traditional
Technology
0
500
1.000
1.500
2.000
2.500
3.000
1996 1997 1998 1999 2000 2001 2002 2003 2004 2005 2006 2007 2008 2009 2010 2011
CommoditiesTraditionalTechnology
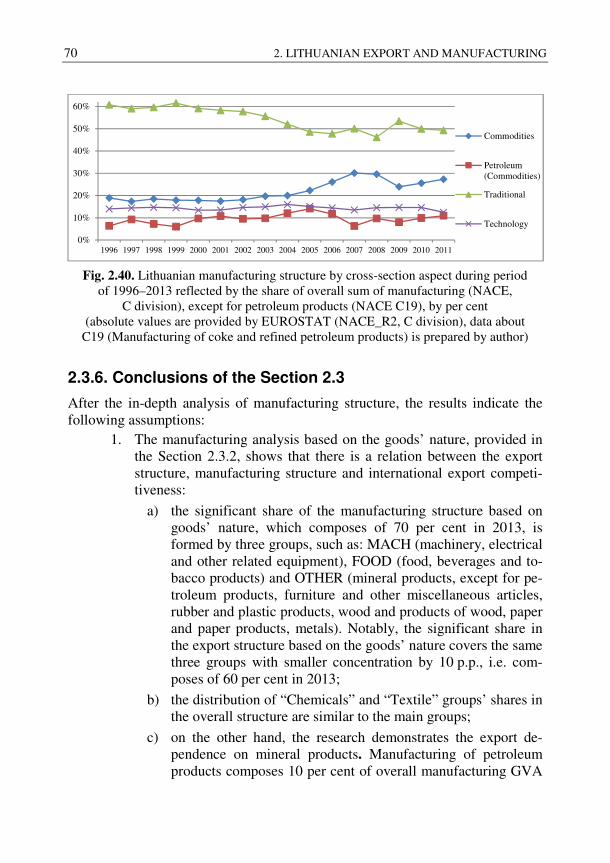
70 2. LITHUANIAN EXPORT AND MANUFACTURING
Fig. 2.40. Lithuanian manufacturing structure by cross-section aspect during period
of 1996–2013 reflected by the share of overall sum of manufacturing (NACE, C division), except for petroleum products (NACE C19), by per cent
(absolute values are provided by EUROSTAT (NACE_R2, C division), data about C19 (Manufacturing of coke and refined petroleum products) is prepared by author)
2.3.6. Conclusions of the Section 2.3
After the in-depth analysis of manufacturing structure, the results indicate the following assumptions:
1. The manufacturing analysis based on the goods’ nature, provided in the Section 2.3.2, shows that there is a relation between the export structure, manufacturing structure and international export competi-tiveness:
a) the significant share of the manufacturing structure based on goods’ nature, which composes of 70 per cent in 2013, is formed by three groups, such as: MACH (machinery, electrical and other related equipment), FOOD (food, beverages and to-bacco products) and OTHER (mineral products, except for pe-troleum products, furniture and other miscellaneous articles, rubber and plastic products, wood and products of wood, paper and paper products, metals). Notably, the significant share in the export structure based on the goods’ nature covers the same three groups with smaller concentration by 10 p.p., i.e. com-poses of 60 per cent in 2013;
b) the distribution of “Chemicals” and “Textile” groups’ shares in the overall structure are similar to the main groups;
c) on the other hand, the research demonstrates the export de-pendence on mineral products. Manufacturing of petroleum products composes 10 per cent of overall manufacturing GVA
0%
10%
20%
30%
40%
50%
60%
1996 1997 1998 1999 2000 2001 2002 2003 2004 2005 2006 2007 2008 2009 2010 2011
Commodities
Petroleum(Commodities)
Traditional
Technology
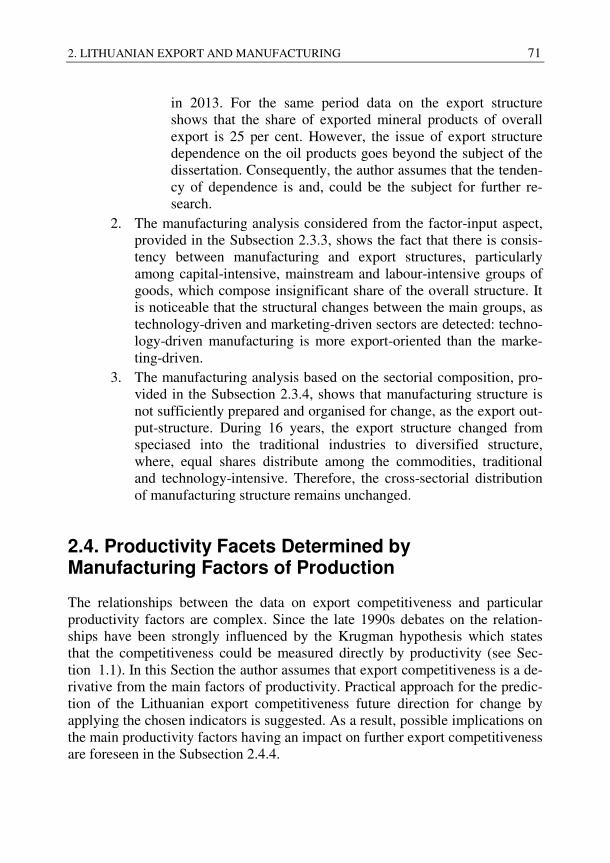
2. LITHUANIAN EXPORT AND MANUFACTURING 71
in 2013. For the same period data on the export structure shows that the share of exported mineral products of overall export is 25 per cent. However, the issue of export structure dependence on the oil products goes beyond the subject of the dissertation. Consequently, the author assumes that the tenden-cy of dependence is and, could be the subject for further re-search.
2. The manufacturing analysis considered from the factor-input aspect, provided in the Subsection 2.3.3, shows the fact that there is consis-tency between manufacturing and export structures, particularly among capital-intensive, mainstream and labour-intensive groups of goods, which compose insignificant share of the overall structure. It is noticeable that the structural changes between the main groups, as technology-driven and marketing-driven sectors are detected: techno-logy-driven manufacturing is more export-oriented than the marke-ting-driven.
3. The manufacturing analysis based on the sectorial composition, pro-vided in the Subsection 2.3.4, shows that manufacturing structure is not sufficiently prepared and organised for change, as the export out-put-structure. During 16 years, the export structure changed from speciased into the traditional industries to diversified structure, where, equal shares distribute among the commodities, traditional and technology-intensive. Therefore, the cross-sectorial distribution of manufacturing structure remains unchanged.
2.4. Productivity Facets Determined by Manufacturing Factors of Production
The relationships between the data on export competitiveness and particular productivity factors are complex. Since the late 1990s debates on the relation-ships have been strongly influenced by the Krugman hypothesis which states that the competitiveness could be measured directly by productivity (see Sec-tion 1.1). In this Section the author assumes that export competitiveness is a de-rivative from the main factors of productivity. Practical approach for the predic-tion of the Lithuanian export competitiveness future direction for change by applying the chosen indicators is suggested. As a result, possible implications on the main productivity factors having an impact on further export competitiveness are foreseen in the Subsection 2.4.4.
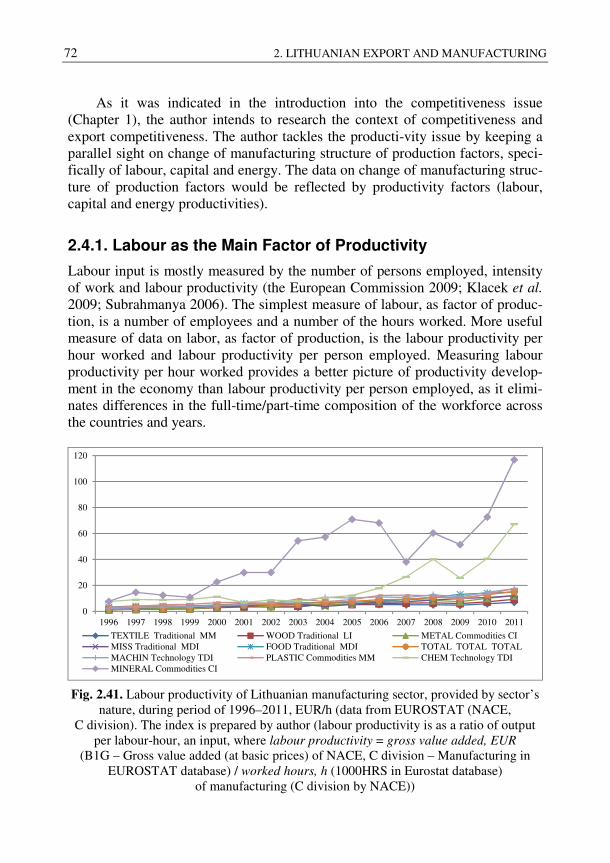
72 2. LITHUANIAN EXPORT AND MANUFACTURING
As it was indicated in the introduction into the competitiveness issue (Chapter 1), the author intends to research the context of competitiveness and export competitiveness. The author tackles the producti-vity issue by keeping a parallel sight on change of manufacturing structure of production factors, speci-fically of labour, capital and energy. The data on change of manufacturing struc-ture of production factors would be reflected by productivity factors (labour, capital and energy productivities).
2.4.1. Labour as the Main Factor of Productivity
Labour input is mostly measured by the number of persons employed, intensity of work and labour productivity (the European Commission 2009; Klacek et al. 2009; Subrahmanya 2006). The simplest measure of labour, as factor of produc-tion, is a number of employees and a number of the hours worked. More useful measure of data on labor, as factor of production, is the labour productivity per hour worked and labour productivity per person employed. Measuring labour productivity per hour worked provides a better picture of productivity develop-ment in the economy than labour productivity per person employed, as it elimi-nates differences in the full-time/part-time composition of the workforce across the countries and years.
Fig. 2.41. Labour productivity of Lithuanian manufacturing sector, provided by sector’s
nature, during period of 1996–2011, EUR/h (data from EUROSTAT (NACE, C division). The index is prepared by author (labour productivity is as a ratio of output
per labour-hour, an input, where labour productivity = gross value added, EUR (B1G – Gross value added (at basic prices) of NACE, C division – Manufacturing in
EUROSTAT database) / worked hours, h (1000HRS in Eurostat database) of manufacturing (C division by NACE))
0
20
40
60
80
100
120
1996 1997 1998 1999 2000 2001 2002 2003 2004 2005 2006 2007 2008 2009 2010 2011
TEXTILE Traditional MM WOOD Traditional LI METAL Commodities CIMISS Traditional MDI FOOD Traditional MDI TOTAL TOTAL TOTALMACHIN Technology TDI PLASTIC Commodities MM CHEM Technology TDIMINERAL Commodities CI
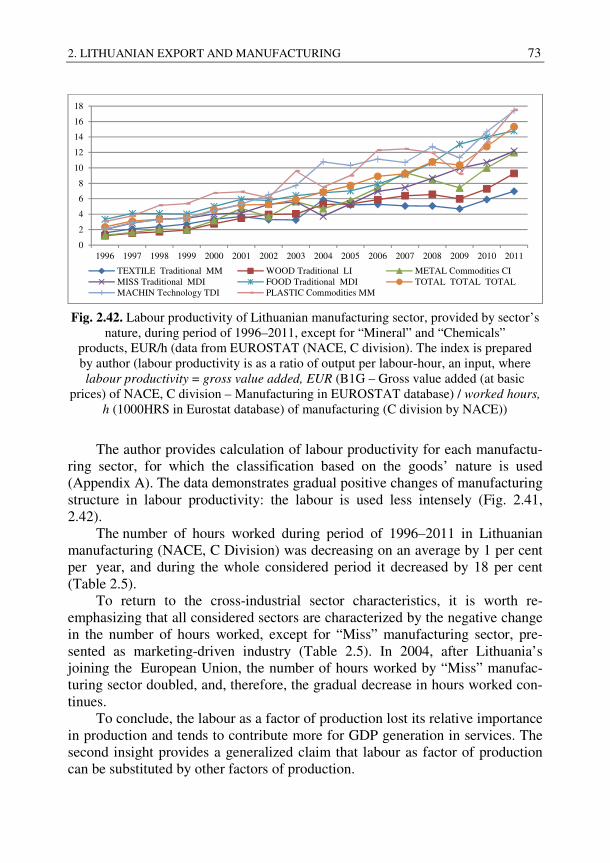
2. LITHUANIAN EXPORT AND MANUFACTURING 73
Fig. 2.42. Labour productivity of Lithuanian manufacturing sector, provided by sector’s
nature, during period of 1996–2011, except for “Mineral” and “Chemicals” products, EUR/h (data from EUROSTAT (NACE, C division). The index is prepared by author (labour productivity is as a ratio of output per labour-hour, an input, where labour productivity = gross value added, EUR (B1G – Gross value added (at basic
prices) of NACE, C division – Manufacturing in EUROSTAT database) / worked hours,
h (1000HRS in Eurostat database) of manufacturing (C division by NACE))
The author provides calculation of labour productivity for each manufactu-ring sector, for which the classification based on the goods’ nature is used (Appendix A). The data demonstrates gradual positive changes of manufacturing structure in labour productivity: the labour is used less intensely (Fig. 2.41, 2.42).
The number of hours worked during period of 1996–2011 in Lithuanian manufacturing (NACE, C Division) was decreasing on an average by 1 per cent per year, and during the whole considered period it decreased by 18 per cent (Table 2.5).
To return to the cross-industrial sector characteristics, it is worth re-emphasizing that all considered sectors are characterized by the negative change in the number of hours worked, except for “Miss” manufacturing sector, pre-sented as marketing-driven industry (Table 2.5). In 2004, after Lithuania’s joining the European Union, the number of hours worked by “Miss” manufac-turing sector doubled, and, therefore, the gradual decrease in hours worked con-tinues.
To conclude, the labour as a factor of production lost its relative importance in production and tends to contribute more for GDP generation in services. The second insight provides a generalized claim that labour as factor of production can be substituted by other factors of production.
0
2
4
6
8
10
12
14
16
18
1996 1997 1998 1999 2000 2001 2002 2003 2004 2005 2006 2007 2008 2009 2010 2011
TEXTILE Traditional MM WOOD Traditional LI METAL Commodities CIMISS Traditional MDI FOOD Traditional MDI TOTAL TOTAL TOTALMACHIN Technology TDI PLASTIC Commodities MM
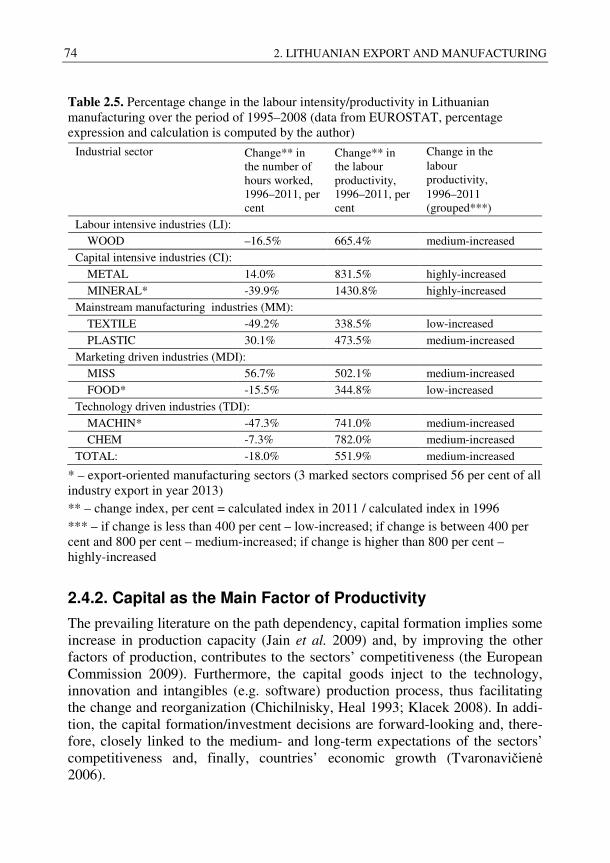
74 2. LITHUANIAN EXPORT AND MANUFACTURING
Table 2.5. Percentage change in the labour intensity/productivity in Lithuanian manufacturing over the period of 1995–2008 (data from EUROSTAT, percentage expression and calculation is computed by the author)
Industrial sector Change** in the number of hours worked, 1996–2011, per cent
Change** in the labour productivity, 1996–2011, per cent
Change in the labour productivity, 1996–2011 (grouped***)
Labour intensive industries (LI): WOOD –16.5% 665.4% medium-increased
Capital intensive industries (CI):
METAL 14.0% 831.5% highly-increased
MINERAL* -39.9% 1430.8% highly-increased Mainstream manufacturing industries (MM):
TEXTILE -49.2% 338.5% low-increased
PLASTIC 30.1% 473.5% medium-increased
Marketing driven industries (MDI): MISS 56.7% 502.1% medium-increased
FOOD* -15.5% 344.8% low-increased
Technology driven industries (TDI):
MACHIN* -47.3% 741.0% medium-increased CHEM -7.3% 782.0% medium-increased
TOTAL: -18.0% 551.9% medium-increased
* – export-oriented manufacturing sectors (3 marked sectors comprised 56 per cent of all industry export in year 2013) ** – change index, per cent = calculated index in 2011 / calculated index in 1996 *** – if change is less than 400 per cent – low-increased; if change is between 400 per cent and 800 per cent – medium-increased; if change is higher than 800 per cent – highly-increased
2.4.2. Capital as the Main Factor of Productivity
The prevailing literature on the path dependency, capital formation implies some increase in production capacity (Jain et al. 2009) and, by improving the other factors of production, contributes to the sectors’ competitiveness (the European Commission 2009). Furthermore, the capital goods inject to the technology, innovation and intangibles (e.g. software) production process, thus facilitating the change and reorganization (Chichilnisky, Heal 1993; Klacek 2008). In addi-tion, the capital formation/investment decisions are forward-looking and, there-fore, closely linked to the medium- and long-term expectations of the sectors’ competitiveness and, finally, countries’ economic growth (Tvaronavičienė 2006).
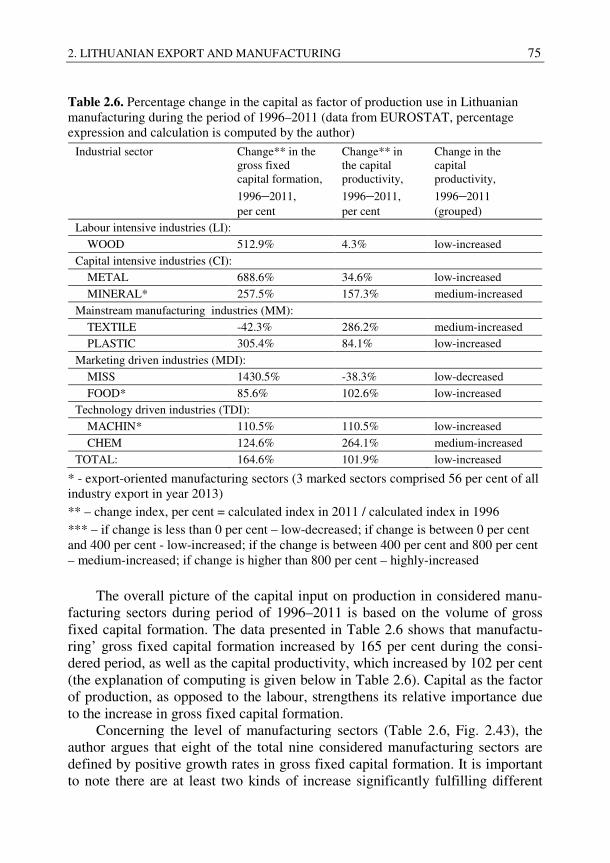
2. LITHUANIAN EXPORT AND MANUFACTURING 75
Table 2.6. Percentage change in the capital as factor of production use in Lithuanian manufacturing during the period of 1996–2011 (data from EUROSTAT, percentage expression and calculation is computed by the author)
Industrial sector Change** in the gross fixed capital formation,
1996–2011, per cent
Change** in the capital productivity,
1996–2011, per cent
Change in the capital productivity,
1996–2011 (grouped)
Labour intensive industries (LI):
WOOD 512.9% 4.3% low-increased
Capital intensive industries (CI): METAL 688.6% 34.6% low-increased
MINERAL* 257.5% 157.3% medium-increased
Mainstream manufacturing industries (MM):
TEXTILE -42.3% 286.2% medium-increased PLASTIC 305.4% 84.1% low-increased
Marketing driven industries (MDI):
MISS 1430.5% -38.3% low-decreased
FOOD* 85.6% 102.6% low-increased Technology driven industries (TDI):
MACHIN* 110.5% 110.5% low-increased
CHEM 124.6% 264.1% medium-increased
TOTAL: 164.6% 101.9% low-increased
* - export-oriented manufacturing sectors (3 marked sectors comprised 56 per cent of all industry export in year 2013) ** – change index, per cent = calculated index in 2011 / calculated index in 1996 *** – if change is less than 0 per cent – low-decreased; if change is between 0 per cent and 400 per cent - low-increased; if the change is between 400 per cent and 800 per cent – medium-increased; if change is higher than 800 per cent – highly-increased
The overall picture of the capital input on production in considered manu-
facturing sectors during period of 1996–2011 is based on the volume of gross fixed capital formation. The data presented in Table 2.6 shows that manufactu-ring’ gross fixed capital formation increased by 165 per cent during the consi-dered period, as well as the capital productivity, which increased by 102 per cent (the explanation of computing is given below in Table 2.6). Capital as the factor of production, as opposed to the labour, strengthens its relative importance due to the increase in gross fixed capital formation.
Concerning the level of manufacturing sectors (Table 2.6, Fig. 2.43), the author argues that eight of the total nine considered manufacturing sectors are defined by positive growth rates in gross fixed capital formation. It is important to note there are at least two kinds of increase significantly fulfilling different
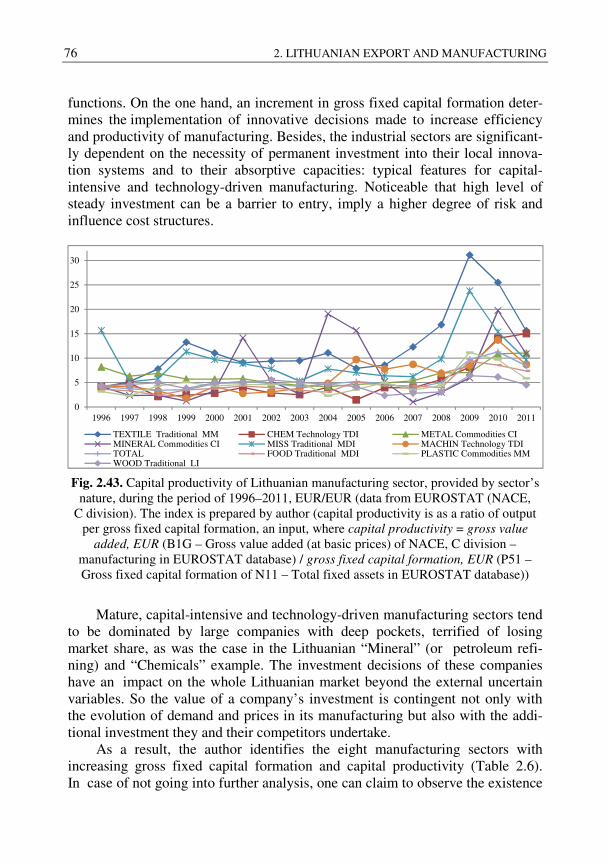
76 2. LITHUANIAN EXPORT AND MANUFACTURING
functions. On the one hand, an increment in gross fixed capital formation deter-mines the implementation of innovative decisions made to increase efficiency and productivity of manufacturing. Besides, the industrial sectors are significant-ly dependent on the necessity of permanent investment into their local innova-tion systems and to their absorptive capacities: typical features for capital-intensive and technology-driven manufacturing. Noticeable that high level of steady investment can be a barrier to entry, imply a higher degree of risk and influence cost structures.
Fig. 2.43. Capital productivity of Lithuanian manufacturing sector, provided by sector’s
nature, during the period of 1996–2011, EUR/EUR (data from EUROSTAT (NACE, C division). The index is prepared by author (capital productivity is as a ratio of output
per gross fixed capital formation, an input, where capital productivity = gross value
added, EUR (B1G – Gross value added (at basic prices) of NACE, C division – manufacturing in EUROSTAT database) / gross fixed capital formation, EUR (P51 – Gross fixed capital formation of N11 – Total fixed assets in EUROSTAT database))
Mature, capital-intensive and technology-driven manufacturing sectors tend to be dominated by large companies with deep pockets, terrified of losing market share, as was the case in the Lithuanian “Mineral” (or petroleum refi-ning) and “Chemicals” example. The investment decisions of these companies have an impact on the whole Lithuanian market beyond the external uncertain variables. So the value of a company’s investment is contingent not only with the evolution of demand and prices in its manufacturing but also with the addi-tional investment they and their competitors undertake.
As a result, the author identifies the eight manufacturing sectors with increasing gross fixed capital formation and capital productivity (Table 2.6). In case of not going into further analysis, one can claim to observe the existence
0
5
10
15
20
25
30
1996 1997 1998 1999 2000 2001 2002 2003 2004 2005 2006 2007 2008 2009 2010 2011
TEXTILE Traditional MM CHEM Technology TDI METAL Commodities CIMINERAL Commodities CI MISS Traditional MDI MACHIN Technology TDITOTAL FOOD Traditional MDI PLASTIC Commodities MMWOOD Traditional LI
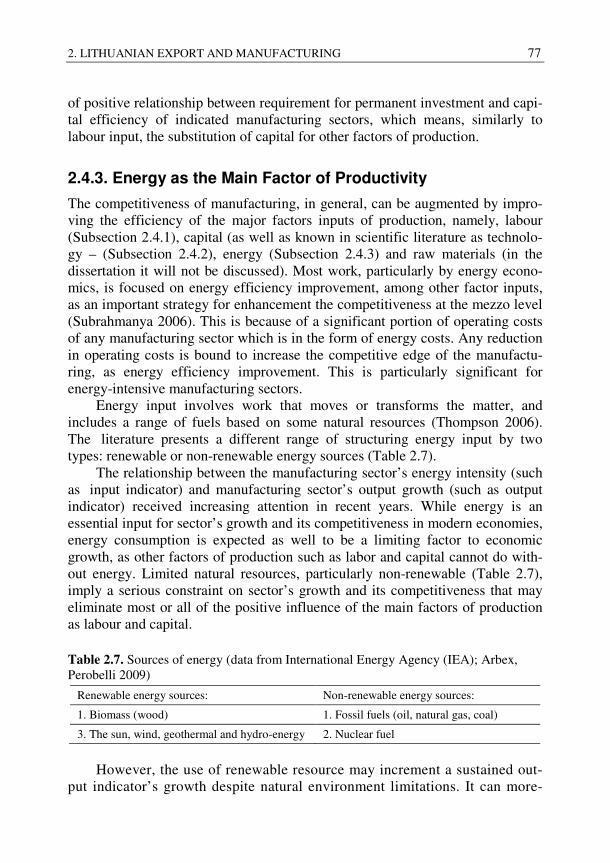
2. LITHUANIAN EXPORT AND MANUFACTURING 77
of positive relationship between requirement for permanent investment and capi-tal efficiency of indicated manufacturing sectors, which means, similarly to labour input, the substitution of capital for other factors of production.
2.4.3. Energy as the Main Factor of Productivity
The competitiveness of manufacturing, in general, can be augmented by impro-ving the efficiency of the major factors inputs of production, namely, labour (Subsection 2.4.1), capital (as well as known in scientific literature as technolo-gy – (Subsection 2.4.2), energy (Subsection 2.4.3) and raw materials (in the dissertation it will not be discussed). Most work, particularly by energy econo-mics, is focused on energy efficiency improvement, among other factor inputs, as an important strategy for enhancement the competitiveness at the mezzo level (Subrahmanya 2006). This is because of a significant portion of operating costs of any manufacturing sector which is in the form of energy costs. Any reduction in operating costs is bound to increase the competitive edge of the manufactu-ring, as energy efficiency improvement. This is particularly significant for energy-intensive manufacturing sectors.
Energy input involves work that moves or transforms the matter, and includes a range of fuels based on some natural resources (Thompson 2006). The literature presents a different range of structuring energy input by two types: renewable or non-renewable energy sources (Table 2.7).
The relationship between the manufacturing sector’s energy intensity (such as input indicator) and manufacturing sector’s output growth (such as output indicator) received increasing attention in recent years. While energy is an essential input for sector’s growth and its competitiveness in modern economies, energy consumption is expected as well to be a limiting factor to economic growth, as other factors of production such as labor and capital cannot do with-out energy. Limited natural resources, particularly non-renewable (Table 2.7), imply a serious constraint on sector’s growth and its competitiveness that may eliminate most or all of the positive influence of the main factors of production as labour and capital. Table 2.7. Sources of energy (data from International Energy Agency (IEA); Arbex, Perobelli 2009)
Renewable energy sources: Non-renewable energy sources:
1. Biomass (wood) 1. Fossil fuels (oil, natural gas, coal)
3. The sun, wind, geothermal and hydro-energy 2. Nuclear fuel
However, the use of renewable resource may increment a sustained out-
put indicator’s growth despite natural environment limitations. It can more-
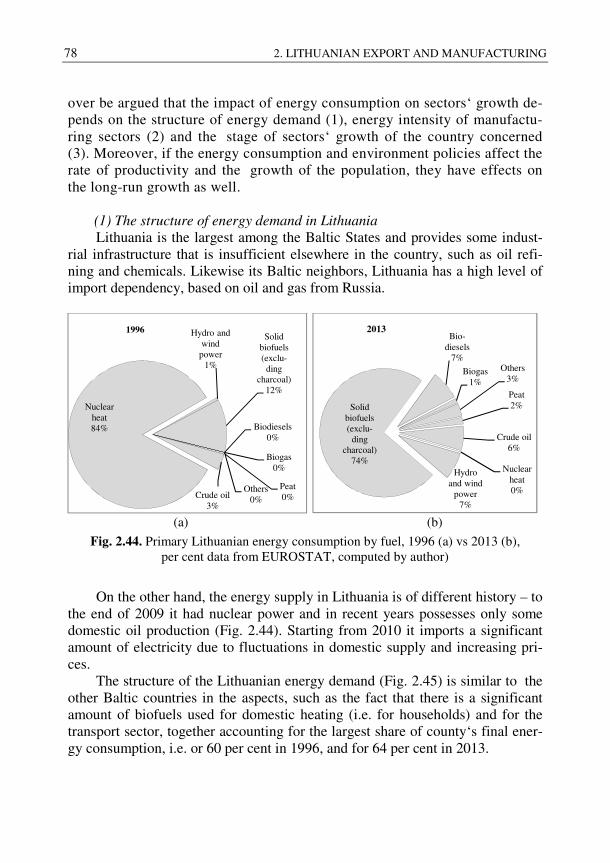
78 2. LITHUANIAN EXPORT AND MANUFACTURING
over be argued that the impact of energy consumption on sectors‘ growth de-pends on the structure of energy demand (1), energy intensity of manufactu-ring sectors (2) and the stage of sectors‘ growth of the country concerned (3). Moreover, if the energy consumption and environment policies affect the rate of productivity and the growth of the population, they have effects on the long-run growth as well.
(1) The structure of energy demand in Lithuania
Lithuania is the largest among the Baltic States and provides some indust-rial infrastructure that is insufficient elsewhere in the country, such as oil refi-ning and chemicals. Likewise its Baltic neighbors, Lithuania has a high level of import dependency, based on oil and gas from Russia.
(a) (b)
Fig. 2.44. Primary Lithuanian energy consumption by fuel, 1996 (a) vs 2013 (b), per cent data from EUROSTAT, computed by author)
On the other hand, the energy supply in Lithuania is of different history – to the end of 2009 it had nuclear power and in recent years possesses only some domestic oil production (Fig. 2.44). Starting from 2010 it imports a significant amount of electricity due to fluctuations in domestic supply and increasing pri-ces.
The structure of the Lithuanian energy demand (Fig. 2.45) is similar to the other Baltic countries in the aspects, such as the fact that there is a significant amount of biofuels used for domestic heating (i.e. for households) and for the transport sector, together accounting for the largest share of county‘s final ener-gy consumption, i.e. or 60 per cent in 1996, and for 64 per cent in 2013.
Peat0%Crude oil
3%
Nuclear heat84%
Hydro and wind
power1%
Solid biofuels (exclu-
ding charcoal)
12%
Biodiesels 0%
Biogas 0%
Others 0%
1996
Peat2%
Crude oil 6%
Nuclear heat0%
Hydro and wind
power7%
Solid biofuels (exclu-
ding charcoal)
74%
Bio-diesels
7%
Biogas 1%
Others 3%
2013
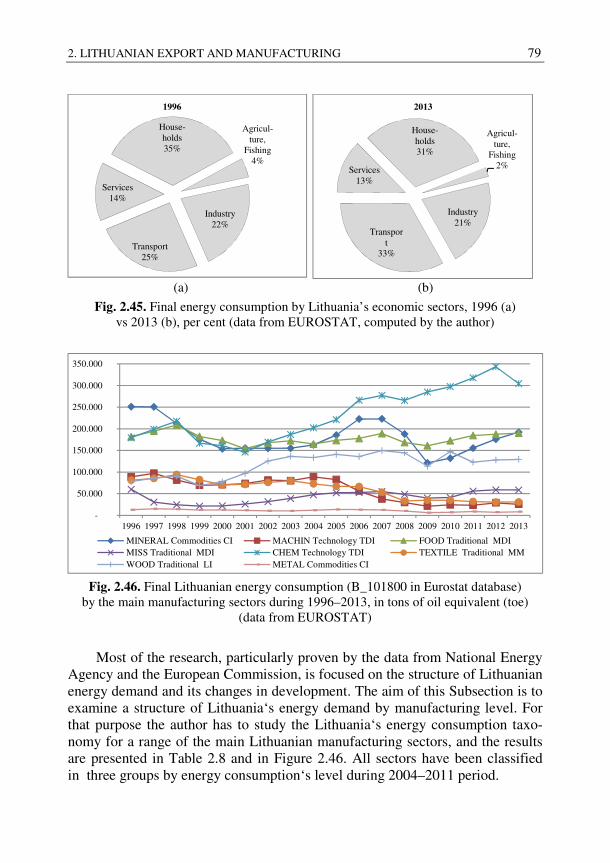
2. LITHUANIAN EXPORT AND MANUFACTURING 79
(a) (b)
Fig. 2.45. Final energy consumption by Lithuania’s economic sectors, 1996 (a) vs 2013 (b), per cent (data from EUROSTAT, computed by the author)
Fig. 2.46. Final Lithuanian energy consumption (B_101800 in Eurostat database)
by the main manufacturing sectors during 1996–2013, in tons of oil equivalent (toe) (data from EUROSTAT)
Most of the research, particularly proven by the data from National Energy Agency and the European Commission, is focused on the structure of Lithuanian energy demand and its changes in development. The aim of this Subsection is to examine a structure of Lithuania‘s energy demand by manufacturing level. For that purpose the author has to study the Lithuania‘s energy consumption taxo-nomy for a range of the main Lithuanian manufacturing sectors, and the results are presented in Table 2.8 and in Figure 2.46. All sectors have been classified in three groups by energy consumption‘s level during 2004–2011 period.
Industry 22%
Transport25%
Services 14%
House-holds 35%
Agricul-ture,
Fishing 4%
1996
Industry 21%
Transport
33%
Services 13%
House-holds 31%
Agricul-ture,
Fishing 2%
2013
-
50.000
100.000
150.000
200.000
250.000
300.000
350.000
1996 1997 1998 1999 2000 2001 2002 2003 2004 2005 2006 2007 2008 2009 2010 2011 2012 2013
MINERAL Commodities CI MACHIN Technology TDI FOOD Traditional MDIMISS Traditional MDI CHEM Technology TDI TEXTILE Traditional MMWOOD Traditional LI METAL Commodities CI
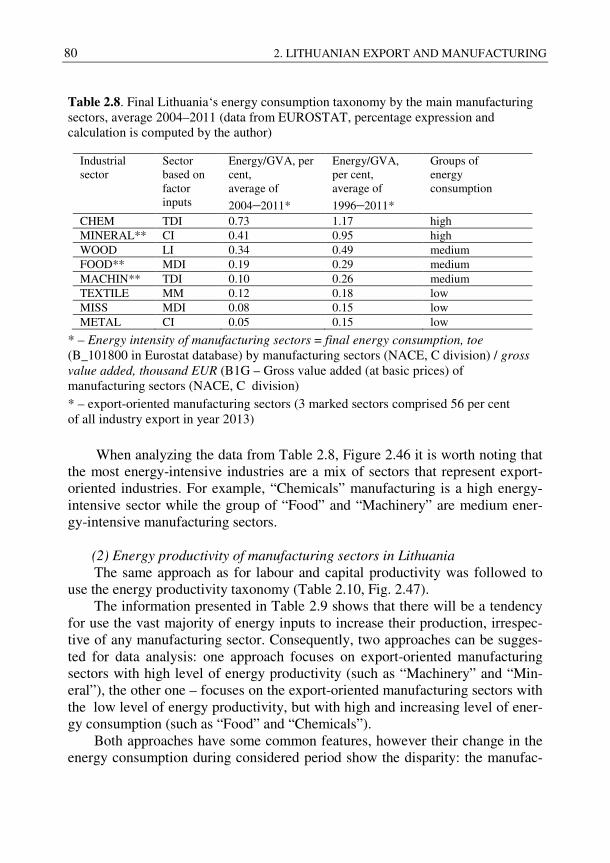
80 2. LITHUANIAN EXPORT AND MANUFACTURING
Table 2.8. Final Lithuania‘s energy consumption taxonomy by the main manufacturing sectors, average 2004–2011 (data from EUROSTAT, percentage expression and calculation is computed by the author)
* – Energy intensity of manufacturing sectors = final energy consumption, toe (B_101800 in Eurostat database) by manufacturing sectors (NACE, C division) / gross
value added, thousand EUR (B1G – Gross value added (at basic prices) of manufacturing sectors (NACE, C division) * – export-oriented manufacturing sectors (3 marked sectors comprised 56 per cent of all industry export in year 2013)
When analyzing the data from Table 2.8, Figure 2.46 it is worth noting that
the most energy-intensive industries are a mix of sectors that represent export-oriented industries. For example, “Chemicals” manufacturing is a high energy-intensive sector while the group of “Food” and “Machinery” are medium ener-gy-intensive manufacturing sectors.
(2) Energy productivity of manufacturing sectors in Lithuania
The same approach as for labour and capital productivity was followed to use the energy productivity taxonomy (Table 2.10, Fig. 2.47).
The information presented in Table 2.9 shows that there will be a tendency for use the vast majority of energy inputs to increase their production, irrespec-tive of any manufacturing sector. Consequently, two approaches can be sugges-ted for data analysis: one approach focuses on export-oriented manufacturing sectors with high level of energy productivity (such as “Machinery” and “Min-eral”), the other one – focuses on the export-oriented manufacturing sectors with the low level of energy productivity, but with high and increasing level of ener-gy consumption (such as “Food” and “Chemicals”).
Both approaches have some common features, however their change in the energy consumption during considered period show the disparity: the manufac-
Industrial sector
Sector based on factor inputs
Energy/GVA, per cent, average of
2004–2011*
Energy/GVA, per cent, average of
1996–2011*
Groups of energy consumption
CHEM TDI 0.73 1.17 high MINERAL** CI 0.41 0.95 high WOOD LI 0.34 0.49 medium FOOD** MDI 0.19 0.29 medium MACHIN** TDI 0.10 0.26 medium TEXTILE MM 0.12 0.18 low MISS MDI 0.08 0.15 low METAL CI 0.05 0.15 low
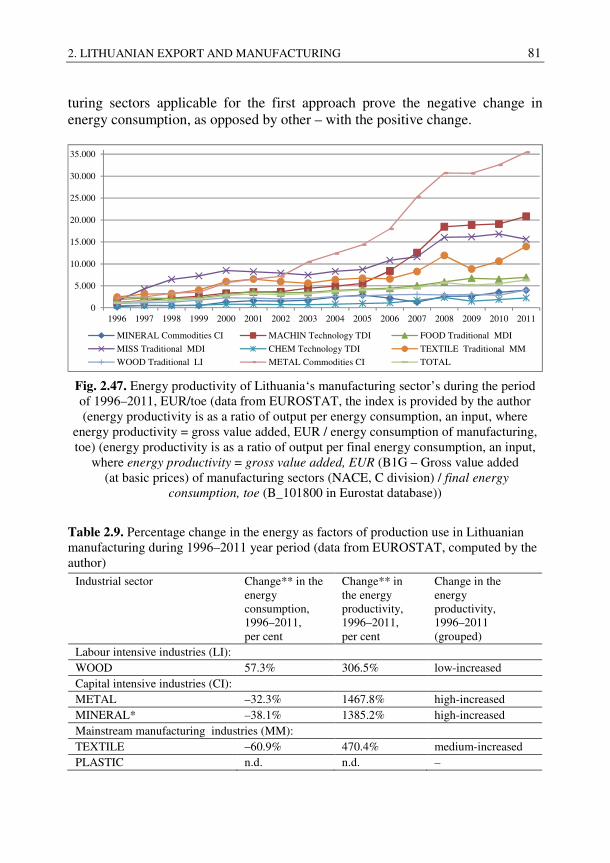
2. LITHUANIAN EXPORT AND MANUFACTURING 81
turing sectors applicable for the first approach prove the negative change in energy consumption, as opposed by other – with the positive change.
Fig. 2.47. Energy productivity of Lithuania‘s manufacturing sector’s during the period of 1996–2011, EUR/toe (data from EUROSTAT, the index is provided by the author (energy productivity is as a ratio of output per energy consumption, an input, where
energy productivity = gross value added, EUR / energy consumption of manufacturing, toe) (energy productivity is as a ratio of output per final energy consumption, an input,
where energy productivity = gross value added, EUR (B1G – Gross value added (at basic prices) of manufacturing sectors (NACE, C division) / final energy
consumption, toe (B_101800 in Eurostat database))
Table 2.9. Percentage change in the energy as factors of production use in Lithuanian manufacturing during 1996–2011 year period (data from EUROSTAT, computed by the author)
Industrial sector Change** in the energy consumption, 1996–2011, per cent
Change** in the energy productivity, 1996–2011, per cent
Change in the energy productivity, 1996–2011 (grouped)
Labour intensive industries (LI): WOOD 57.3% 306.5% low-increased Capital intensive industries (CI): METAL –32.3% 1467.8% high-increased MINERAL* –38.1% 1385.2% high-increased Mainstream manufacturing industries (MM): TEXTILE –60.9% 470.4% medium-increased PLASTIC n.d. n.d. –
0
5.000
10.000
15.000
20.000
25.000
30.000
35.000
1996 1997 1998 1999 2000 2001 2002 2003 2004 2005 2006 2007 2008 2009 2010 2011
MINERAL Commodities CI MACHIN Technology TDI FOOD Traditional MDI
MISS Traditional MDI CHEM Technology TDI TEXTILE Traditional MM
WOOD Traditional LI METAL Commodities CI TOTAL
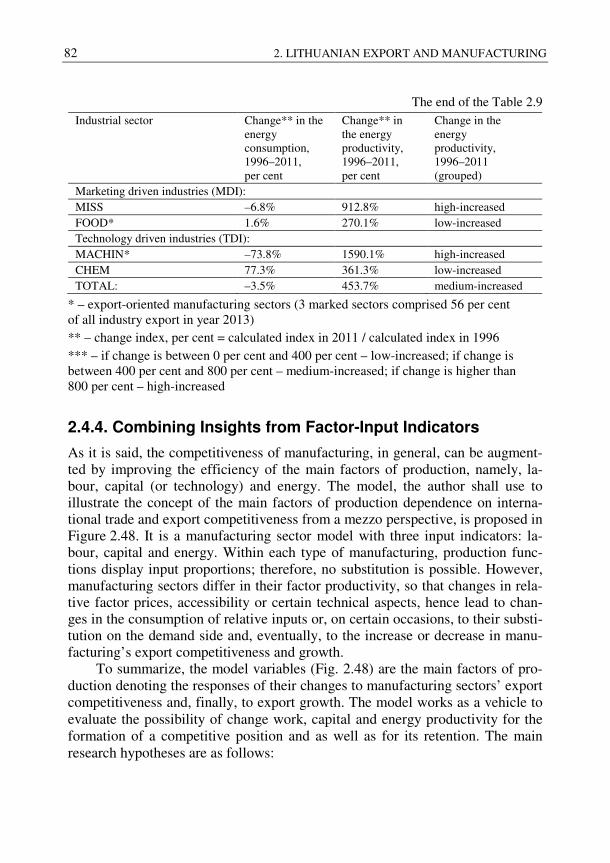
82 2. LITHUANIAN EXPORT AND MANUFACTURING
The end of the Table 2.9 Industrial sector Change** in the
energy consumption, 1996–2011, per cent
Change** in the energy productivity, 1996–2011, per cent
Change in the energy productivity, 1996–2011 (grouped)
Marketing driven industries (MDI): MISS –6.8% 912.8% high-increased FOOD* 1.6% 270.1% low-increased Technology driven industries (TDI): MACHIN* –73.8% 1590.1% high-increased CHEM 77.3% 361.3% low-increased TOTAL: –3.5% 453.7% medium-increased
* – export-oriented manufacturing sectors (3 marked sectors comprised 56 per cent of all industry export in year 2013) ** – change index, per cent = calculated index in 2011 / calculated index in 1996 *** – if change is between 0 per cent and 400 per cent – low-increased; if change is between 400 per cent and 800 per cent – medium-increased; if change is higher than 800 per cent – high-increased
2.4.4. Combining Insights from Factor-Input Indicators
As it is said, the competitiveness of manufacturing, in general, can be augment-ted by improving the efficiency of the main factors of production, namely, la-bour, capital (or technology) and energy. The model, the author shall use to illustrate the concept of the main factors of production dependence on interna-tional trade and export competitiveness from a mezzo perspective, is proposed in Figure 2.48. It is a manufacturing sector model with three input indicators: la-bour, capital and energy. Within each type of manufacturing, production func-tions display input proportions; therefore, no substitution is possible. However, manufacturing sectors differ in their factor productivity, so that changes in rela-tive factor prices, accessibility or certain technical aspects, hence lead to chan-ges in the consumption of relative inputs or, on certain occasions, to their substi-tution on the demand side and, eventually, to the increase or decrease in manu-facturing’s export competitiveness and growth.
To summarize, the model variables (Fig. 2.48) are the main factors of pro-duction denoting the responses of their changes to manufacturing sectors’ export competitiveness and, finally, to export growth. The model works as a vehicle to evaluate the possibility of change work, capital and energy productivity for the formation of a competitive position and as well as for its retention. The main research hypotheses are as follows:
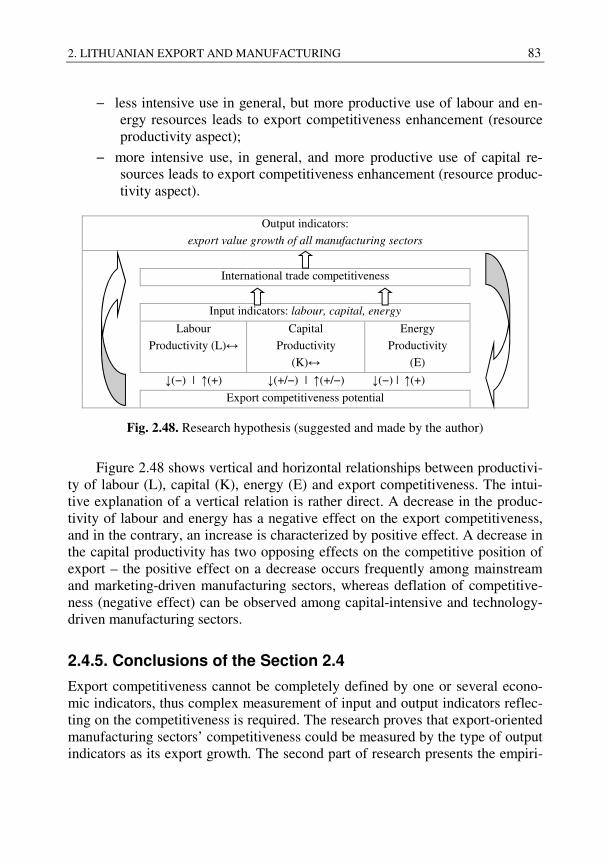
2. LITHUANIAN EXPORT AND MANUFACTURING 83
− less intensive use in general, but more productive use of labour and en-ergy resources leads to export competitiveness enhancement (resource productivity aspect);
− more intensive use, in general, and more productive use of capital re-sources leads to export competitiveness enhancement (resource produc-tivity aspect).
Output indicators:
export value growth of all manufacturing sectors
International trade competitiveness
Input indicators: labour, capital, energy
Labour
Productivity (L)↔
Capital
Productivity
(K)↔
Energy
Productivity
(E)
↓(−) | ↑(+) ↓(+/−) | ↑(+/−) ↓(−) | ↑(+)
Export competitiveness potential
Fig. 2.48. Research hypothesis (suggested and made by the author)
Figure 2.48 shows vertical and horizontal relationships between productivi-ty of labour (L), capital (K), energy (E) and export competitiveness. The intui-tive explanation of a vertical relation is rather direct. A decrease in the produc-tivity of labour and energy has a negative effect on the export competitiveness, and in the contrary, an increase is characterized by positive effect. A decrease in the capital productivity has two opposing effects on the competitive position of export – the positive effect on a decrease occurs frequently among mainstream and marketing-driven manufacturing sectors, whereas deflation of competitive-ness (negative effect) can be observed among capital-intensive and technology-driven manufacturing sectors.
2.4.5. Conclusions of the Section 2.4
Export competitiveness cannot be completely defined by one or several econo-mic indicators, thus complex measurement of input and output indicators reflec-ting on the competitiveness is required. The research proves that export-oriented manufacturing sectors’ competitiveness could be measured by the type of output indicators as its export growth. The second part of research presents the empiri-
84 2. LITHUANIAN EXPORT AND MANUFACTURING
cal application of export competitiveness measurement founded on input indica-tors, as labour, capital and energy.
The research presented in this Section shows that the potential for export competitiveness enhancement may result in the increase of labour, capital and energy productivity, and in decrease in energy and labour input intensity. Addi-tionally, the research indicates that the capital-intensive manufacturing sectors with highly–increased labour and energy productivity are essential for the export growth, and, as the author supposes, have potential for the export competitive-ness and GDP growth.
Herewith, in this Chapter the author presents the following results:
− the output and input indicators for the further stages of research (more information is provided in Section 4.2) can be identified (Fig. 2.48);
− the intuitive explanation of vertical and horizontal relationships between input indicators as productivity of labour (L), capital (K), energy (E) and output indicator as export competitiveness can be stated.
The Chapter 4 will be concentrated on the complex measurement of input and output indicators reflecting on export and its competitiveness, export struc-ture, productivity ratios and the main factors of production.
The structure of operating costs in manufacturing sectors, changes in inputs intensities/productivities and substitution within the main factors of production, an analysis of price elasticity of the main factors of production can be further incorporated together into the future research.
2.5. Conclusions of the Chapter 2
Based on the empirical analysis, the following conclusions can be drawn: 1. International trade reforms in Lithuania for the period of 25 years are
discussed in Subsection 2.1: the author concentrates on the external factors affecting the Lithuanian international trade, with a special fo-cus on the industrial sector. The analysis of the Lithuanian foreign trade development according to the trade liberalization reforms and using the statistical data was made by considering four stages: the first period, after the proclamation of the Declaration of Independen-ce (1990–1997), the second period, during and after the crisis in Rus-sia and other CIS (1998–2003), the third period, after Lithuania‘s joining the EU (2004–2008), and the fourth period, after the financial crisis (2009–2013).
2. The author provides all available types of international trade classifi-cations prepared by the governmental financial statistics divisions
2. LITHUANIAN EXPORT AND MANUFACTURING 85
and introduces four types of classifications of the exported goods, which are used for further research (Subsection 2.2.1).
3. The export structure’s analysis based on various classifications of the exported goods shows that the relations between the export structure and international export competitiveness can be as follows:
a) a positive relationship was found between the “Other” group of the exported goods (such as “Plastic”, “Agriculture”, Wood”, “Metal” and “Miss” groups of goods) and strengthening of in-ternational competitiveness. A positive relationship was found between “Mach&Food” group of the exported goods and their furtherance of international competitiveness growth. The fai-ling relationship was found between “Chemicals” and “Tex-tile” groups of the exported goods and their weak international competitiveness (see the classification of the exported goods
based on goods’ nature, Subsection 2.2.2);
b) goods produced by technology-driven and marketing-driven manufacturing sectors (i.e. machinery, electrical and other re-lated equipment, as well as food, beverages and tobacco pro-ducts) represent a significant share in the export structure. Ex-port demand for these goods is rather high. The most signifi-cant export demand can be observed in the dynamics of goods produced by capital-intensive sectors. It is worth noting that export of agricultural and labour-intensive goods has a trend to be marked as sustainable, and has always been relatively com-petitive, supposedly, because of specialisation in the above-mentioned goods, which could be additionally proved by cal-culation and, for example, by the analysis of HHI index (see the classification of the exported goods based on factor inputs, Subsection 2.2.3);
c) the export structure is slowly changing from the structure spe-cialised for the so-called traditional industries to a diversified structure. Today, the important role is played by traditional goods, but a position of commodities and technology-intensive goods is getting stronger (see the classification of the exported goods based on sectorial composition, Subsection 2.2.4);
d) the classification by the origin of the exported goods reveals the greatest share of the overall export, reaching 57 per cent for Lithuanian-origin export. Hence, there is a dominant type of resale, such as “internal consumption mix” (explained in Sub-section 2.2.5), which is closely related to the same Lithuanian-
86 2. LITHUANIAN EXPORT AND MANUFACTURING
origin products. The explanation of the above close relation-ship is not complicated: the import of Lithuanian companies is mostly intended for intermediate consumption and aimed at in-creasing gross value added of Lithuanian-origin products as well as securing a wide products’ mix (see the classification based on the origin of the exported goods, Subsection 2.2.5).
4. The tendencies of manufacturing sectors’ development, in some as-pects, are similar to the those characteristic of changes in the export structure based on goods’ nature:
a) production of “Textile” products shows the tendencies of de-creasing internal production, similar to those for export. Twen-ty years ago, this manufacturing sector belonged to the tradi-tional industry, and after Lithuania’s joining the European Union, and, particularly, after the global crisis, the volume of “Textile” products decreased. On the one hand, this sector re-duced its volume, while on the other hand, it can be noticed that this sphere of manufacturing strengthened its competitive advantage through diversification. Production of “Chemicals” inside the country is growing, although its share in the export structure is decreasing. Moreover, this type of manufacturing is considered to be traditional for the Lithuanian market. Howe-ver, now, it is more specialised, as well as having the reduced volume and greater competitive advantage due to the speciali-sation. The production of “Machinery”, “Food” and “Other” goods is increasing every year. It is moreover the subject for further investigation in the dissertation (see the classification of manufacturing sectors based on the goods’ nature, Subsec-tion 2.3.3);
b) the manufacturing structure considered from the factor-input aspect is similar to the export structure, except for the fact that technology-driven products are more export-demanding, whereas marketing-driven products are more demanding for internal consumption (see the classification of manufacturing sectors based on factor inputs, Subsection 2.3.4);
c) the manufacturing structure analised from the sectorial compo-sition aspect is not sufficiently flexible for change, unlike the export output-structure. During 16 years, the export structure has been shifting from the specialisated structure for the tradi-tional industries to a diversified structure, whereas rather equal share distribution can be observed among the commodities,
2. LITHUANIAN EXPORT AND MANUFACTURING 87
traditional and technology-intensive goods (see the classifica-tion of manufacturing sectors according to the sectorial com-position, Subsection 2.3.5).
5. The relationships between export competitiveness and particular pro-ductivity indicators of the main factors of industrial production (such as labour, capital and energy) have been examined:
a) the calculation of labour productivity for each manufacturing sector demonstrated gradual positive changes of manufacturing structure in labour productivity: the labour is used less intense-ly. Therefore, the labour as a factor of production lost its rela-tive importance in production and tends to contribute more to GDP generation in services. The second insight provides a generalized claim that labour as a factor of production can be substituted by other factors of production. It is worth re-emphasizing that all considered sectors are characterized by a negative change in the number of the hours worked, except for “Miss” manufacturing sector presented as a marketing-driven industry (Subsection 2.4.1);
b) capital as the factor of production, when opposed to labour, strengthens its relative importance due to the rise of gross fixed capital formation. The author identified eight manufacturing sectors with the increasing gross fixed capital formation and capital productivity. Not going into further analysis, one can claim to observe the existence of a positive relationship between the requirement for permanent investment and capital efficiency of the indicated manufacturing sectors, which means, similarly to labour input, the substitution of capital for other factors of production (Subsection 2.4.2);
c) the analysis of energy productivity for each manufacturing sec-tor primarily includes the preparation of the structure of Lithu-ania‘s energy demand at the manufacturing level. For that pur-pose, the author studied the Lithuania‘s energy consumption taxonomy for a whole number of the main Lithuanian manu-facturing sectors. It is worth noting that the most energy-intensive industries present a mix of sectors, considering ex-port-oriented industries. For example, “Chemicals” manufac-turing is a high energy-intensive sector, while the group of “Food” and “Machinery” are medium energy-intensive manu-facturing sectors (Subsection 2.4.3);
88 2. LITHUANIAN EXPORT AND MANUFACTURING
d) secondly, the analysis of energy productivity indicators shows a tendency for using a vast majority of energy inputs to in-crease the production of any manufacturing sector. Conse-quently, two approaches can be suggested for data analysis. One approach focuses on export-oriented manufacturing sec-tors with a high level of energy productivity (such as “Machi-nery” and “Mineral”), while the other one focuses on export-oriented manufacturing sectors with a low level of energy productivity, but a high and increasing level of energy con-sumption (such as “Food” and “Chemicals”). Both approaches have some common features, however, the variation of their energy consumption during the considered period shows the disparity between them. Thus, the manufacturing sectors covered by the first approach prove a negative change in ener-gy consumption, as opposed by the second approach, de-monstrating a positive change.
89
3 Export and Gross Domestic
Product Growth in Lithuania: Short-run or Middle-run Causality
The main objective of this Chapter is to establish a clear relationship between international trade, particularly export, and the economic growth in Lithuania over the period of 2000–2015 using the Granger-causality test.
The Chapter is organized as follows: firstly, the mentioned relationship should be described using information from peer-reviewed scientific sources. Secondly, the author presents the methodology and econometric testing results. Finally, the main finding of the Chapter 3 should be summarized.
The analysis presented in the Chapter 3 can be found in the published ar-ticles of the author (Travkina 2015).
3.1. The Analysis of the Relationship between Export and Gross Domestic Product
The relationship between export (such as the main indicator of international trade) and GDP (such as the main indicator of economic growth) has long been
90 3. EXPORT AND GROSS DOMESTIC PRODUCT GROWTH IN LITHUANIA:…
the main subject of the scientific interest in the literature of economic develop-ment and economic growth.
Since the early 1960s policy makers and scholars have shown a great inte-rest in the possible relationship between exports and economic growth. The mo-tivation is clear. Should a country promote exports to speed up economic growth or should it primarily focus on economic growth, which in turn will generate exports? There are basically four theoretical propositions (Konya 2004):
1. According to the so called export-led growth hypothesis, export acti-vity leads to the economic growth. The trade theory provides several plausible explanations in favor of this idea. Beside others, a positive impact of an outward oriented trade policy on technological change, labour productivity, capital efficiency and, eventually, on production can be mentioned.
2. The second proposition is the growth-driven export hypothesis, which postulates a reverse relationship. It is based on the idea that economic growth induces trade flows. It can moreover create compa-rative advantages in certain areas leading to specialisation and facili-tating exports.
These two approaches certainly do not exclude each other. 3. Therefore, the third notion is a feedback relationship between export
and economic growth. 4. Finally, there is also potential for a simple contemporaneous rela-
tionship between these two variables. For example, the Asian newly industrialized countries such as Hong Kong,
Singapore, Taiwan are cited as successful examples of export-oriented growth model of development. However, most African countries are counter-examples. In these countries, the correlation between economic growth and trade growth is negative (Bouoiyour 2003).
There is a significant strand of Lithuanian scientific literature devoted to discussion on the importance of the export-led growth for small open economy countries, whose economic activities are mostly export-oriented, like in Lithua-nia or the other Baltic States (Travkina, Tvaronavičienė 2010, 2011, 2015; Lankauskienė, Tvaronavičienė 2014; Dudzevičiūtė et al. 2014; Rutkauskas et al. 2014; Vosylius et al. 2013; Rutkauskas, Stasytytė 2012; Bruneckienė, Pal-tanavičienė 2012; Meilienė, Snieška 2010; Rojaka 2008, 2009; Ginevičius et al. 2005; Vilpišauskas 2004; Rudzkis, Kvedaras 2003).
The Genesis of Competitiveness, showed up in Chapters 1.2 and 1.3 by the author, argues that even without reference to a particular type of relationship between export and GDP, the international trade development positively in-fluences economic growth, because it will increase capacity utilization, allow a country to take advantage of scale economies, promote technical change, and
3. EXPORT AND GROSS DOMESTIC PRODUCT GROWTH IN LITHUANIA:… 91
increase the resource allocation efficiency, and overall productivity as well. However, there are more theoretical insights tested by various models (see for details in Chapter 1.3). The models mostly used in previous studies derive from neo-classical economic theory or from modern theories based on classical principles (Krugman 1994; Bouoiyour 2003; Travkina, Tvaronavičienė 2010). Recent studies indicate that the relationship between trade and economic growth depends on the level of development (1) and economic structure (2) and is subject to an interactive process of economic development and structural change (Sun, Parikh 2001; Travkina, Tvaronavičienė 2011, 2015; Bruneckienė, Paltanavičienė 2012; Meilienė, Snieška 2010). However, the most recent and comprehensive survey of this literature is done by Giles and Williams (2000a) who review more than one hundred and fifty applied papers on export-growth, published between 1963 and 1999. These papers fall into three groups:
– the first group of studies is based on cross-country rank correlation coef-ficients;
– the second one applies the cross-sectional regression analysis, and – the third group uses time series techniques on a country-by-country ba-
sis. Two thirds of the papers belong to the third group, and more than seventy
of these are based on the concept of the Granger causality and on various tests of it. Applications of causality tests and co-integration techniques in examining the relationship between international trade and economic growth have become popular since the beginning of the 1985 (Jung, Marshall 1985), particularly, there has been considerable interest in testing export-led growth (ELG) using the notion of Granger causality.
Rather scarce studies exist in Lithuania, in which these techniques are ap-plied (Rudzkis, Kvedaras 2003). In the case of Lithuania, Rudzkis and Kvedaras (2003) find evidence of export causing growth both in the long run, and in the short run. In addition, prior studies have ignored dynamic analysis, such as im-pulse responses, and have had gaps in their econometric procedure of applying the VAR model.
3.2. The Methodology of Testing
Testing ideas can be investigated through vector autoregression (VAR) models incorporating the notion of Granger or regressive causality.
This study is the subject to contribution to the scientific literature:
− it provides the econometric application in the proven way, to avoid mis-specification and to minimize the testing bias. It includes and estimates
92 3. EXPORT AND GROSS DOMESTIC PRODUCT GROWTH IN LITHUANIA:…
the causal relationship by applying the three-variable VAR model based on the three time series (GDP, import, export);
− it complements the literature on relationships between trade liberaliza-tion, economic growth and empirical evidence of the source of econo-mic development in the case of Lithuania.
In this Chapter the author tests the short-term and middle-term relationships between GDP, export and import for Lithuania from 2000Q1 until 2007Q4 and from 2009Q1 until 2015Q1, using a three-variable vector autoregressive (VAR) model.
The author applies econometric procedures, including the following steps: 1. Test unit root of time series. 2. Construct the three-variable VAR model. 3. VAR diagnostics. 4. Granger causality test. 5. Impulse response function.
“Eviews” program was selected as the instrument of statistical and econo-metric analysis as well as for model testing.
1. Test unit root of time series
The author implements the unit root test of the three time series: GDP, ex-port and import by using the Augmented Dickey-Fuller (ADF) test (Enders 2009). If those studied series are stationary in first difference (I(1)), they will be used to construct a three-variable VAR. If some of the series, or all three, have a higher order than I(1). The author will transfer them into the other forms such as logarithms, share of GDP or form of difference, and then retest the unit root. This step will cease when the transformed series are non-stationary with an order of one.
2. Construction of three-variable VAR model
VAR is the extension of the autoregressive (AR) model to the case in which there is more than one variable under study. The term “VAR” becomes more transparent if there is used matrix notation. A first order VAR in two variables would be given by (Lapinskas 2012):
�� = �� + ��� + ����� +⋯+ ����� + ����� +⋯+ ����� + ���
�� = �� + ��� + ����� +⋯+ ����� + ����� +⋯+ ����� + ���
(3.1)
3. EXPORT AND GROSS DOMESTIC PRODUCT GROWTH IN LITHUANIA:… 93
The term “VAR” becomes more transparent if there is used use matrix nota-tion. A first order VAR in two variables would be given by
�� = �� + ����� +����� + ���
�� = �� + ����� + ����� + ��� (3.2)
where ��� and ��� are two white noise processes (independent of the history of Y and X) that may be correlated (Lapinskas 2012).
3. VAR diagnostics
To check the VAR model, the following tests should be implemented and decribed below:
a) Lag order selection;
b) R-squared, adjusted R-squared, Akaike info criterion, Durbin-Watson stat.;
c) VAR residual serial correlation LM test;
d) VAR residual normality test;
e) VAR residual heteroscedasticity test.
a) Lag order selection According to Enders (2009), the model will be misspecified, when the lag
length is too small. The more lags there are, the more parameters we need to es-timate and the less bias in our results occur. The model will be over parameter-ized if the number of lags is too large. There are two approaches: lag order selec-tion based on the LR test; and lag order selection based on Information criteria such as AIC (Akaike’s Information Criterion), FPE (final prediction error), SC (Schwarz criterion), HQ (the Hannan & Quinn (1979) criterion) (Lutkepohl 2005).
b) R-squared, adjusted R-squared, Akaike info criterion, Durbin-Watson stat.
The popular characteristic of the model quality is the coefficient of deter-mination R-squared. For example, R2=0.65, the author says that the right-hand variables explain 65 per cent of Y‘s variability. The problem with R2 is that this ratio cannot fall when more explanatory variables are added to a model. There are many possibilities to penalize for extra explanatory variables, for example, cal-culation of adjusted R-squared, Akaike info criterion (AIC), Durbin-Watson stat., Schwarz information criterion (SIC). Noticeably, that sometimes these cri-teria (most popular among them are AIC and/or SIC) give conflicting answers: if
94 3. EXPORT AND GROSS DOMESTIC PRODUCT GROWTH IN LITHUANIA:…
a few models have the same left-hand variable, the best is with the smallest AIC and/or SIC.
c) VAR residual serial correlation LM, normality and heterosce-dasticity tests
However, it is usual that different criteria give a different number of maxi-mum lag lengths. The problem is which criteria have been chosen. To overcome this problem, the author should run VAR with different lag orders, chosen by different criteria and the LR test, and then implement the VAR residual serial correlation LM test, residual normality and heteroscedasticity tests. An appropriate lag order needs to satisfy those tests (Nguyen 2011).
4. Granger causality test
In order to know the causality showing an impact between those four time series, the author applies the Granger causality test (Enders 2009). This test de-tects, whether the lags of one variable can Granger-cause any other variables in the VAR system. The null hypothesis is that all lags of one variable can be ex-cluded from each equation in the VAR system.
The basic idea of the Granger or regressive causality is that a variable X Granger causes Y, if past values of X can help explaining Y. Of course, if the Granger causality holds, this does not guarantee that X causes Y. This is why academicians say “Granger causality” rather than just “causality”. Nevertheless, if the past values of X have explanatory power for the current values of Y, it at least suggests that X might be causing Y. Granger causality is the only relevant with time series variables (Lapinskas 2012).
5. Impulse response function
Based on the Granger causality test, the author does not know whether or not the exports and imports have a positive effect on GDP. It is moreover un-clear, whether or not the impact of exports on GDP is stronger than that of im-ports on GDP. To answer these questions, the author analyzes the impulse-response function. Shin and Pesaran defined the impulse response function as follows: “An impulse response function measures the time profile of the effect of shocks at a given point in time on the (expected) future values of variables in a dynamic system” (Shin, Pesaran 1998).
3.3. Empirical Analysis and Findings
Data set of real variables (GDP, export and import) was constructed and consist-ed in 41 observations through two periods: 2000Q1–2007Q4 and 2009Q1–2015Q1. The aim of this Section is to test the short-run and middle-run causality
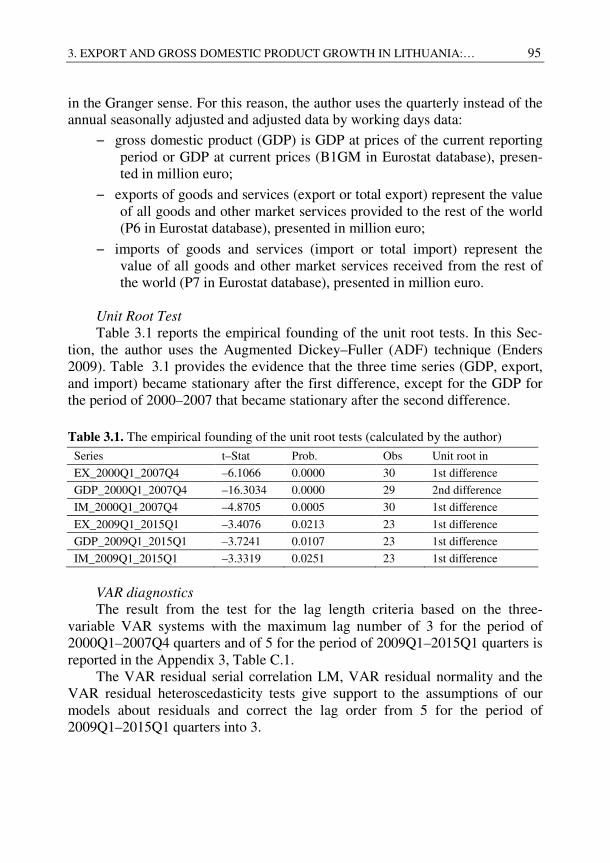
3. EXPORT AND GROSS DOMESTIC PRODUCT GROWTH IN LITHUANIA:… 95
in the Granger sense. For this reason, the author uses the quarterly instead of the annual seasonally adjusted and adjusted data by working days data:
− gross domestic product (GDP) is GDP at prices of the current reporting period or GDP at current prices (B1GM in Eurostat database), presen-ted in million euro;
− exports of goods and services (export or total export) represent the value of all goods and other market services provided to the rest of the world (P6 in Eurostat database), presented in million euro;
− imports of goods and services (import or total import) represent the value of all goods and other market services received from the rest of the world (P7 in Eurostat database), presented in million euro.
Unit Root Test
Table 3.1 reports the empirical founding of the unit root tests. In this Sec-tion, the author uses the Augmented Dickey–Fuller (ADF) technique (Enders 2009). Table 3.1 provides the evidence that the three time series (GDP, export, and import) became stationary after the first difference, except for the GDP for the period of 2000–2007 that became stationary after the second difference. Table 3.1. The empirical founding of the unit root tests (calculated by the author)
Series t–Stat Prob. Obs Unit root in
EX_2000Q1_2007Q4 –6.1066 0.0000 30 1st difference
GDP_2000Q1_2007Q4 –16.3034 0.0000 29 2nd difference
IM_2000Q1_2007Q4 –4.8705 0.0005 30 1st difference
EX_2009Q1_2015Q1 –3.4076 0.0213 23 1st difference
GDP_2009Q1_2015Q1 –3.7241 0.0107 23 1st difference
IM_2009Q1_2015Q1 –3.3319 0.0251 23 1st difference
VAR diagnostics
The result from the test for the lag length criteria based on the three-variable VAR systems with the maximum lag number of 3 for the period of 2000Q1–2007Q4 quarters and of 5 for the period of 2009Q1–2015Q1 quarters is reported in the Appendix 3, Table C.1.
The VAR residual serial correlation LM, VAR residual normality and the VAR residual heteroscedasticity tests give support to the assumptions of our models about residuals and correct the lag order from 5 for the period of 2009Q1–2015Q1 quarters into 3.
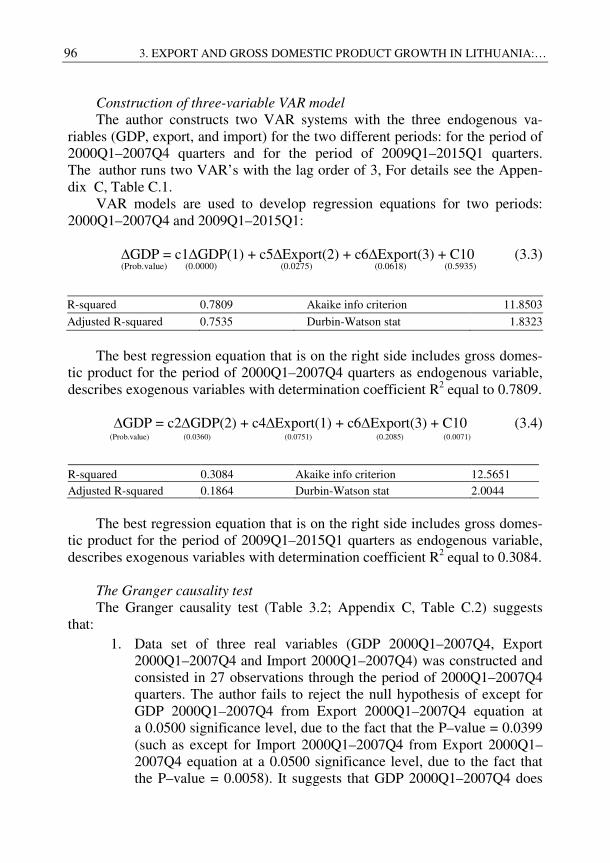
96 3. EXPORT AND GROSS DOMESTIC PRODUCT GROWTH IN LITHUANIA:…
Construction of three-variable VAR model
The author constructs two VAR systems with the three endogenous va-riables (GDP, export, and import) for the two different periods: for the period of 2000Q1–2007Q4 quarters and for the period of 2009Q1–2015Q1 quarters. The author runs two VAR’s with the lag order of 3, For details see the Appen-dix C, Table C.1.
VAR models are used to develop regression equations for two periods: 2000Q1–2007Q4 and 2009Q1–2015Q1:
∆GDP = c1∆GDP(1) + c5∆Export(2) + c6∆Export(3) + C10 (3.3)
(Prob.value) (0.0000) (0.0275) (0.0618) (0.5935)
R-squared 0.7809 Akaike info criterion 11.8503
Adjusted R-squared 0.7535 Durbin-Watson stat 1.8323
The best regression equation that is on the right side includes gross domes-
tic product for the period of 2000Q1–2007Q4 quarters as endogenous variable, describes exogenous variables with determination coefficient R2 equal to 0.7809.
∆GDP = c2∆GDP(2) + c4∆Export(1) + c6∆Export(3) + C10 (3.4)
(Prob.value) (0.0360) (0.0751) (0.2085) (0.0071)
R-squared 0.3084 Akaike info criterion 12.5651 Adjusted R-squared 0.1864 Durbin-Watson stat 2.0044
The best regression equation that is on the right side includes gross domes-
tic product for the period of 2009Q1–2015Q1 quarters as endogenous variable, describes exogenous variables with determination coefficient R2 equal to 0.3084.
The Granger causality test
The Granger causality test (Table 3.2; Appendix C, Table C.2) suggests that:
1. Data set of three real variables (GDP 2000Q1–2007Q4, Export 2000Q1–2007Q4 and Import 2000Q1–2007Q4) was constructed and consisted in 27 observations through the period of 2000Q1–2007Q4 quarters. The author fails to reject the null hypothesis of except for GDP 2000Q1–2007Q4 from Export 2000Q1–2007Q4 equation at a 0.0500 significance level, due to the fact that the P–value = 0.0399 (such as except for Import 2000Q1–2007Q4 from Export 2000Q1–2007Q4 equation at a 0.0500 significance level, due to the fact that the P–value = 0.0058). It suggests that GDP 2000Q1–2007Q4 does
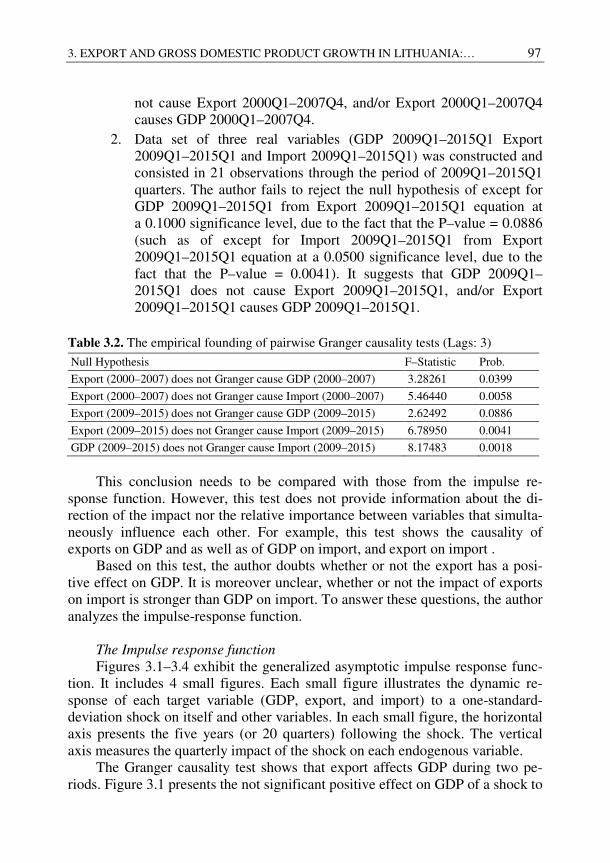
3. EXPORT AND GROSS DOMESTIC PRODUCT GROWTH IN LITHUANIA:… 97
not cause Export 2000Q1–2007Q4, and/or Export 2000Q1–2007Q4 causes GDP 2000Q1–2007Q4.
2. Data set of three real variables (GDP 2009Q1–2015Q1 Export 2009Q1–2015Q1 and Import 2009Q1–2015Q1) was constructed and consisted in 21 observations through the period of 2009Q1–2015Q1 quarters. The author fails to reject the null hypothesis of except for GDP 2009Q1–2015Q1 from Export 2009Q1–2015Q1 equation at a 0.1000 significance level, due to the fact that the P–value = 0.0886 (such as of except for Import 2009Q1–2015Q1 from Export 2009Q1–2015Q1 equation at a 0.0500 significance level, due to the fact that the P–value = 0.0041). It suggests that GDP 2009Q1–2015Q1 does not cause Export 2009Q1–2015Q1, and/or Export 2009Q1–2015Q1 causes GDP 2009Q1–2015Q1.
Table 3.2. The empirical founding of pairwise Granger causality tests (Lags: 3)
Null Hypothesis F–Statistic Prob.
Export (2000–2007) does not Granger cause GDP (2000–2007) 3.28261 0.0399
Export (2000–2007) does not Granger cause Import (2000–2007) 5.46440 0.0058
Export (2009–2015) does not Granger cause GDP (2009–2015) 2.62492 0.0886
Export (2009–2015) does not Granger cause Import (2009–2015) 6.78950 0.0041
GDP (2009–2015) does not Granger cause Import (2009–2015) 8.17483 0.0018
This conclusion needs to be compared with those from the impulse re-
sponse function. However, this test does not provide information about the di-rection of the impact nor the relative importance between variables that simulta-neously influence each other. For example, this test shows the causality of exports on GDP and as well as of GDP on import, and export on import .
Based on this test, the author doubts whether or not the export has a posi-tive effect on GDP. It is moreover unclear, whether or not the impact of exports on import is stronger than GDP on import. To answer these questions, the author analyzes the impulse-response function.
The Impulse response function
Figures 3.1–3.4 exhibit the generalized asymptotic impulse response func-tion. It includes 4 small figures. Each small figure illustrates the dynamic re-sponse of each target variable (GDP, export, and import) to a one-standard-deviation shock on itself and other variables. In each small figure, the horizontal axis presents the five years (or 20 quarters) following the shock. The vertical axis measures the quarterly impact of the shock on each endogenous variable.
The Granger causality test shows that export affects GDP during two pe-riods. Figure 3.1 presents the not significant positive effect on GDP of a shock to
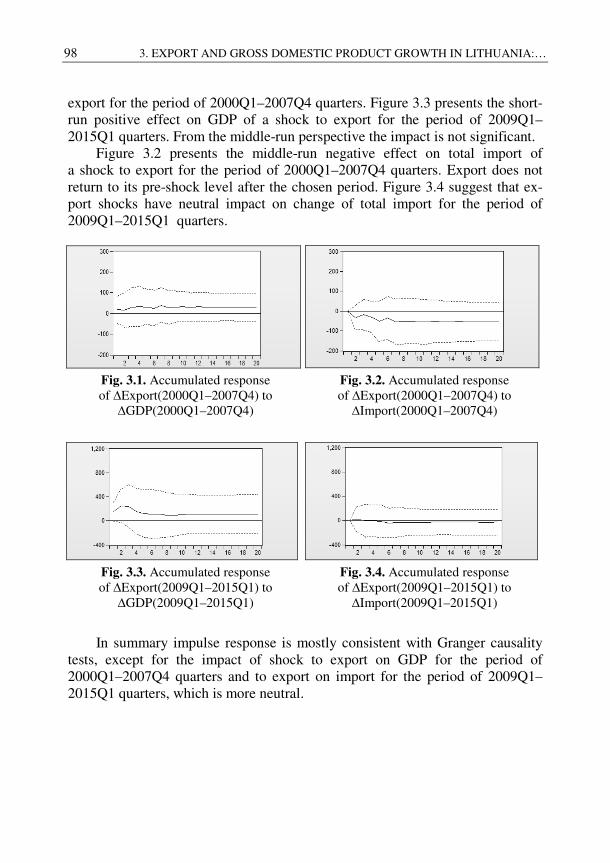
98 3. EXPORT AND GROSS DOMESTIC PRODUCT GROWTH IN LITHUANIA:…
export for the period of 2000Q1–2007Q4 quarters. Figure 3.3 presents the short-run positive effect on GDP of a shock to export for the period of 2009Q1–2015Q1 quarters. From the middle-run perspective the impact is not significant.
Figure 3.2 presents the middle-run negative effect on total import of a shock to export for the period of 2000Q1–2007Q4 quarters. Export does not return to its pre-shock level after the chosen period. Figure 3.4 suggest that ex-port shocks have neutral impact on change of total import for the period of 2009Q1–2015Q1 quarters.
Fig. 3.1. Accumulated response of ∆Export(2000Q1–2007Q4) to ∆GDP(2000Q1–2007Q4)
Fig. 3.2. Accumulated response of ∆Export(2000Q1–2007Q4) to ∆Import(2000Q1–2007Q4)
Fig. 3.3. Accumulated response of ∆Export(2009Q1–2015Q1) to ∆GDP(2009Q1–2015Q1)
Fig. 3.4. Accumulated response of ∆Export(2009Q1–2015Q1) to ∆Import(2009Q1–2015Q1)
In summary impulse response is mostly consistent with Granger causality tests, except for the impact of shock to export on GDP for the period of 2000Q1–2007Q4 quarters and to export on import for the period of 2009Q1–2015Q1 quarters, which is more neutral.
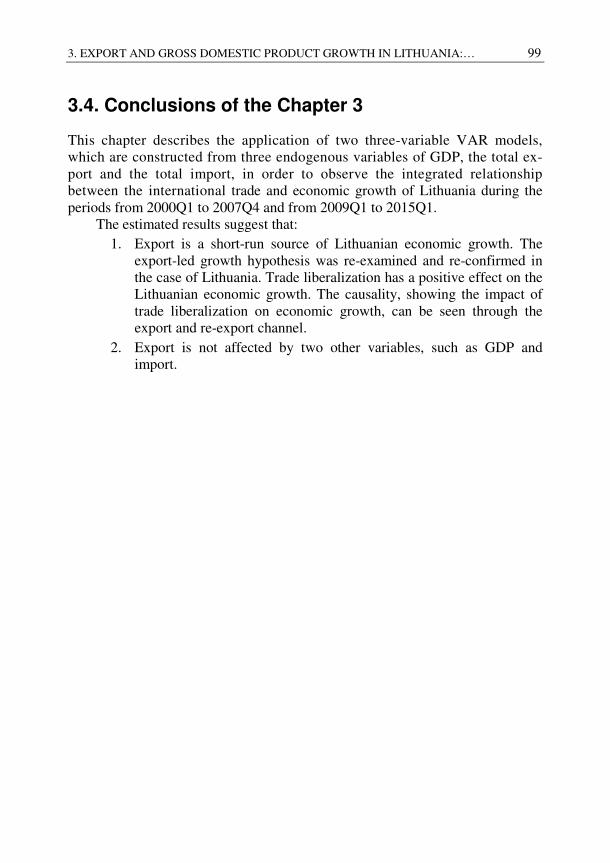
3. EXPORT AND GROSS DOMESTIC PRODUCT GROWTH IN LITHUANIA:… 99
3.4. Conclusions of the Chapter 3
This chapter describes the application of two three-variable VAR models, which are constructed from three endogenous variables of GDP, the total ex-port and the total import, in order to observe the integrated relationship between the international trade and economic growth of Lithuania during the periods from 2000Q1 to 2007Q4 and from 2009Q1 to 2015Q1.
The estimated results suggest that: 1. Export is a short-run source of Lithuanian economic growth. The
export-led growth hypothesis was re-examined and re-confirmed in the case of Lithuania. Trade liberalization has a positive effect on the Lithuanian economic growth. The causality, showing the impact of trade liberalization on economic growth, can be seen through the export and re-export channel.
2. Export is not affected by two other variables, such as GDP and import.

101
4 The Empirical Testing of the
Evaluation of Factors Determining Export Competitiveness
The main objective of this chapter is to establish the relationships among the particular factors presented in Chapters 1 and 2 as the main factors impacting export competitiveness in the case of Lithuania. The analysis is based on the Lithuanian data for the period of 1996–2013. The data is taken from the Eurostat database.
The chapter has the following structure: Section 4.1 presents the hypotheses formulated based on the theoretical framework investigated in Chapter 1, as well as on the identified particular factors determining export competitiveness, and various classifications of the exported goods and productivity indicators of the main factors of industrial production given in Chapter 2. It includes the re-examined export-led growth hypothesis presented in Chapter 3 for the case of Lithuania, and the main insights provided in the concluding remarks of the above-mentioned Chapters.
In Section 4.2, the empirical testing of the suggested model is provided in the framework of relevant statistical data, empirical studies and econometric analysis.
102 4. THE EMPIRICAL TESTING OF THE EVALUATION OF FACTORS…
In Section 4.3, the reduced form of the practical approach used in the sug-gested model in the case of Lithuania is described.
In Section 4.4, the author presents the strategic guidelines for enhancing the short-run and middle-run competitiveness of Lithuanian export.
The analysis presented in the Chapter 4 will be available in the further pub-lications of the author.
4.1. Combining the Insights into the Factors Determining Lithuanian Export Competitiveness
This chapter focuses on generalizing the insights formulated as the model for evaluating the competitiveness factors for Lithuanian export (Fig. 4.1).
To summarize, the model’s endogenous target variables are export of goods and services (P6 in Eurostat database), as well as economic growth presented by GDP at market prices (B1GM in Eurostat database).
The exogenous target variables, comprising two main practical model’s ap-proaches, which are investigated in Chapter 1, are as follows:
a) the Productivity approach includes the main factors of produc-tion of Lithuanian manufacturing sectors, such as labour, capi-tal and energy;
b) the Approach to various classifications of the exported goods includes the structure of export of goods presented by three various classification types.
The explanation of a horizontal relation between the selected variables has not been investigated in the dissertation. Hypothetically, there may be a varia-tion from substitutability to complementarity among inputs as their intensities change. Further research on this topic is needed (Travkina, Tvaronavičienė 2010).
The second vertical strand of the model denotes the responses of changes in export of goods and productivity indicators of the main factors of production to export competitiveness growth (export value growth).
It is worth noting that the response spectrum is displayed in terms of posi-tive, negative and indifferent export curves.
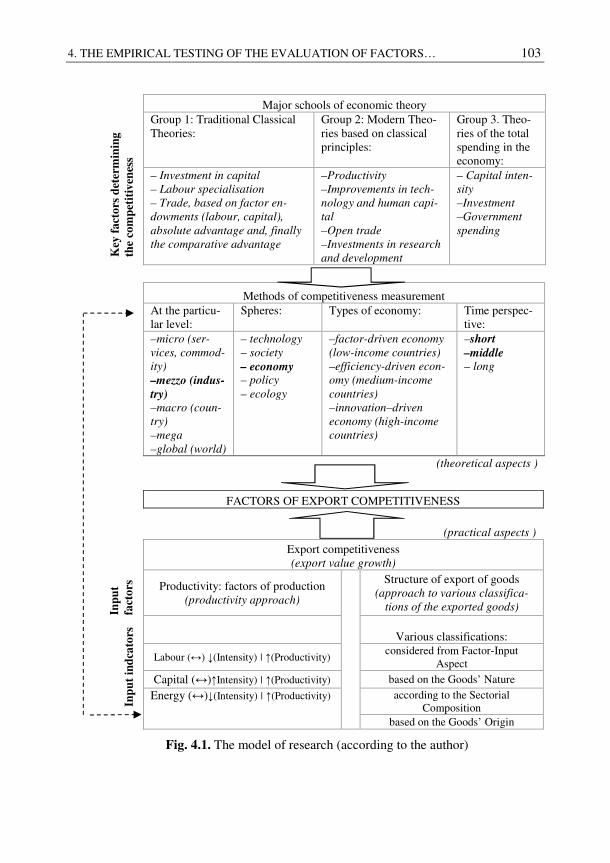
4. THE EMPIRICAL TESTING OF THE EVALUATION OF FACTORS… 103
Major schools of economic theory K
ey f
act
ors
det
erm
inin
g
the
com
pet
itiv
enes
s
Group 1: Traditional Classical Theories:
Group 2: Modern Theo-ries based on classical principles:
Group 3. Theo-ries of the total spending in the economy:
– Investment in capital
– Labour specialisation
– Trade, based on factor en-
dowments (labour, capital),
absolute advantage and, finally
the comparative advantage
–Productivity
–Improvements in tech-
nology and human capi-
tal
–Open trade
–Investments in research
and development
– Capital inten-
sity
–Investment
–Government
spending
Methods of competitiveness measurement
At the particu-lar level:
Spheres: Types of economy: Time perspec-tive:
–micro (ser-
vices, commod-
ity)
–mezzo (indus-
try) –macro (coun-
try)
–mega
–global (world)
– technology
– society
– economy – policy
– ecology
–factor-driven economy
(low-income countries)
–efficiency-driven econ-
omy (medium-income
countries)
–innovation–driven
economy (high-income
countries)
–short
–middle – long
(theoretical aspects )
FACTORS OF EXPORT COMPETITIVENESS
(practical aspects )
Export competitiveness (export value growth)
Inp
ut
fact
ors
Productivity: factors of production (productivity approach)
Structure of export of goods (approach to various classifica-
tions of the exported goods)
Inp
ut
ind
cato
rs
Various classifications:
Labour (↔) ↓(Intensity) | ↑(Productivity) considered from Factor-Input
Aspect
Capital (↔)↑Intensity) | ↑(Productivity) based on the Goods’ Nature
Energy (↔)↓(Intensity) | ↑(Productivity) according to the Sectorial Composition
based on the Goods’ Origin
Fig. 4.1. The model of research (according to the author)
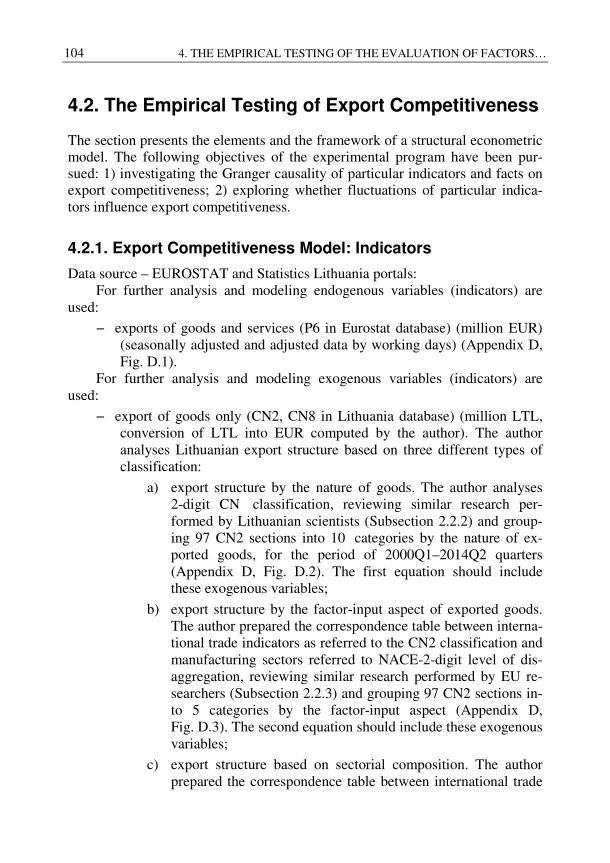
104 4. THE EMPIRICAL TESTING OF THE EVALUATION OF FACTORS…
4.2. The Empirical Testing of Export Competitiveness
The section presents the elements and the framework of a structural econometric model. The following objectives of the experimental program have been pur-sued: 1) investigating the Granger causality of particular indicators and facts on export competitiveness; 2) exploring whether fluctuations of particular indica-tors influence export competitiveness.
4.2.1. Export Competitiveness Model: Indicators
Data source – EUROSTAT and Statistics Lithuania portals: For further analysis and modeling endogenous variables (indicators) are
used:
− exports of goods and services (P6 in Eurostat database) (million EUR) (seasonally adjusted and adjusted data by working days) (Appendix D, Fig. D.1).
For further analysis and modeling exogenous variables (indicators) are used:
− export of goods only (CN2, CN8 in Lithuania database) (million LTL, conversion of LTL into EUR computed by the author). The author analyses Lithuanian export structure based on three different types of classification:
a) export structure by the nature of goods. The author analyses 2-digit CN classification, reviewing similar research per-formed by Lithuanian scientists (Subsection 2.2.2) and group-ing 97 CN2 sections into 10 categories by the nature of ex-ported goods, for the period of 2000Q1–2014Q2 quarters (Appendix D, Fig. D.2). The first equation should include these exogenous variables;
b) export structure by the factor-input aspect of exported goods. The author prepared the correspondence table between interna-tional trade indicators as referred to the CN2 classification and manufacturing sectors referred to NACE-2-digit level of dis-aggregation, reviewing similar research performed by EU re-searchers (Subsection 2.2.3) and grouping 97 CN2 sections in-to 5 categories by the factor-input aspect (Appendix D, Fig. D.3). The second equation should include these exogenous variables;
c) export structure based on sectorial composition. The author prepared the correspondence table between international trade
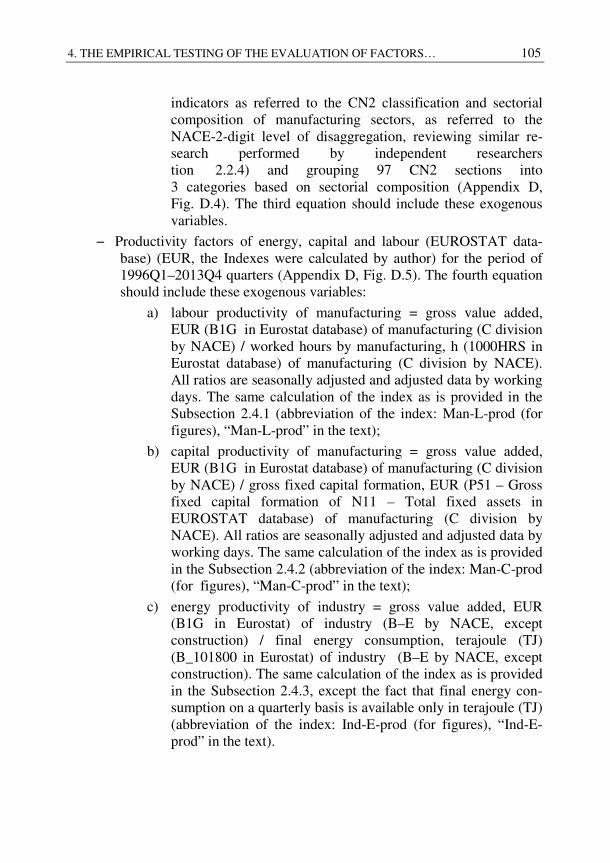
4. THE EMPIRICAL TESTING OF THE EVALUATION OF FACTORS… 105
indicators as referred to the CN2 classification and sectorial composition of manufacturing sectors, as referred to the NACE-2-digit level of disaggregation, reviewing similar re-search performed by independent researchers tion 2.2.4) and grouping 97 CN2 sections into 3 categories based on sectorial composition (Appendix D, Fig. D.4). The third equation should include these exogenous variables.
− Productivity factors of energy, capital and labour (EUROSTAT data-base) (EUR, the Indexes were calculated by author) for the period of 1996Q1–2013Q4 quarters (Appendix D, Fig. D.5). The fourth equation should include these exogenous variables:
a) labour productivity of manufacturing = gross value added, EUR (B1G in Eurostat database) of manufacturing (C division by NACE) / worked hours by manufacturing, h (1000HRS in Eurostat database) of manufacturing (C division by NACE). All ratios are seasonally adjusted and adjusted data by working days. The same calculation of the index as is provided in the Subsection 2.4.1 (abbreviation of the index: Man-L-prod (for figures), “Man-L-prod” in the text);
b) capital productivity of manufacturing = gross value added, EUR (B1G in Eurostat database) of manufacturing (C division by NACE) / gross fixed capital formation, EUR (P51 – Gross fixed capital formation of N11 – Total fixed assets in EUROSTAT database) of manufacturing (C division by NACE). All ratios are seasonally adjusted and adjusted data by working days. The same calculation of the index as is provided in the Subsection 2.4.2 (abbreviation of the index: Man-C-prod (for figures), “Man-C-prod” in the text);
c) energy productivity of industry = gross value added, EUR (B1G in Eurostat) of industry (B–E by NACE, except construction) / final energy consumption, terajoule (TJ) (B_101800 in Eurostat) of industry (B–E by NACE, except construction). The same calculation of the index as is provided in the Subsection 2.4.3, except the fact that final energy con-sumption on a quarterly basis is available only in terajoule (TJ) (abbreviation of the index: Ind-E-prod (for figures), “Ind-E-prod” in the text).
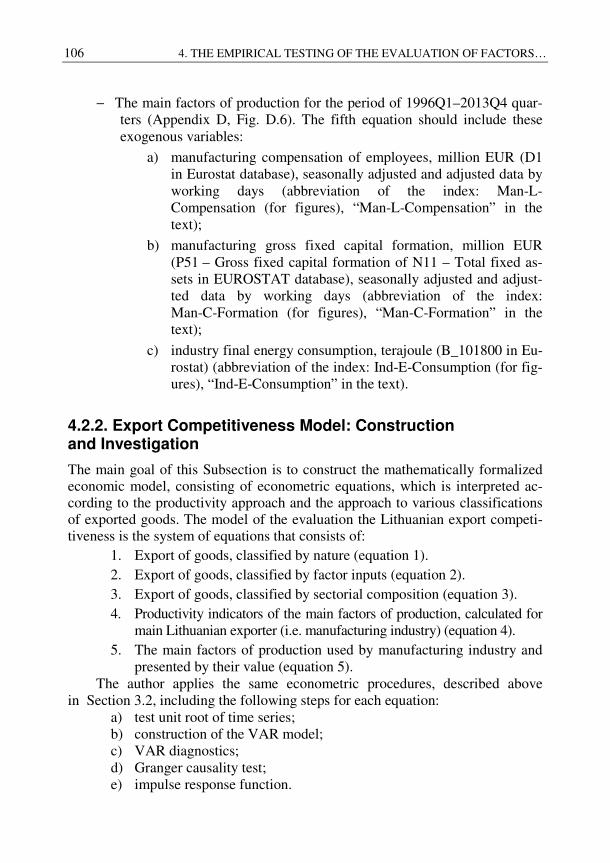
106 4. THE EMPIRICAL TESTING OF THE EVALUATION OF FACTORS…
− The main factors of production for the period of 1996Q1–2013Q4 quar-ters (Appendix D, Fig. D.6). The fifth equation should include these exogenous variables:
a) manufacturing compensation of employees, million EUR (D1 in Eurostat database), seasonally adjusted and adjusted data by working days (abbreviation of the index: Man-L-Compensation (for figures), “Man-L-Compensation” in the text);
b) manufacturing gross fixed capital formation, million EUR (P51 – Gross fixed capital formation of N11 – Total fixed as-sets in EUROSTAT database), seasonally adjusted and adjust-ted data by working days (abbreviation of the index: Man-C-Formation (for figures), “Man-C-Formation” in the text);
c) industry final energy consumption, terajoule (B_101800 in Eu-rostat) (abbreviation of the index: Ind-E-Consumption (for fig-ures), “Ind-E-Consumption” in the text).
4.2.2. Export Competitiveness Model: Construction and Investigation
The main goal of this Subsection is to construct the mathematically formalized economic model, consisting of econometric equations, which is interpreted ac-cording to the productivity approach and the approach to various classifications of exported goods. The model of the evaluation the Lithuanian export competi-tiveness is the system of equations that consists of:
1. Export of goods, classified by nature (equation 1). 2. Export of goods, classified by factor inputs (equation 2). 3. Export of goods, classified by sectorial composition (equation 3). 4. Productivity indicators of the main factors of production, calculated for
main Lithuanian exporter (i.e. manufacturing industry) (equation 4). 5. The main factors of production used by manufacturing industry and
presented by their value (equation 5). The author applies the same econometric procedures, described above
in Section 3.2, including the following steps for each equation: a) test unit root of time series; b) construction of the VAR model; c) VAR diagnostics; d) Granger causality test; e) impulse response function.
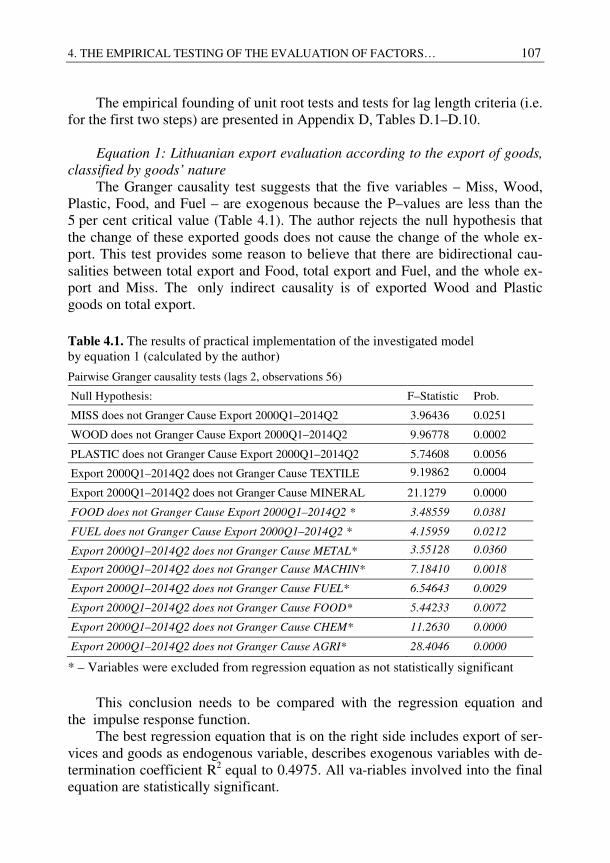
4. THE EMPIRICAL TESTING OF THE EVALUATION OF FACTORS… 107
The empirical founding of unit root tests and tests for lag length criteria (i.e. for the first two steps) are presented in Appendix D, Tables D.1–D.10.
Equation 1: Lithuanian export evaluation according to the export of goods,
classified by goods’ nature
The Granger causality test suggests that the five variables – Miss, Wood, Plastic, Food, and Fuel – are exogenous because the P–values are less than the 5 per cent critical value (Table 4.1). The author rejects the null hypothesis that the change of these exported goods does not cause the change of the whole ex-port. This test provides some reason to believe that there are bidirectional cau-salities between total export and Food, total export and Fuel, and the whole ex-port and Miss. The only indirect causality is of exported Wood and Plastic goods on total export.
Table 4.1. The results of practical implementation of the investigated model by equation 1 (calculated by the author)
Pairwise Granger causality tests (lags 2, observations 56)
Null Hypothesis: F–Statistic Prob.
MISS does not Granger Cause Export 2000Q1–2014Q2 3.96436 0.0251
WOOD does not Granger Cause Export 2000Q1–2014Q2 9.96778 0.0002
PLASTIC does not Granger Cause Export 2000Q1–2014Q2 5.74608 0.0056
Export 2000Q1–2014Q2 does not Granger Cause TEXTILE 9.19862 0.0004
Export 2000Q1–2014Q2 does not Granger Cause MINERAL 21.1279 0.0000
FOOD does not Granger Cause Export 2000Q1–2014Q2 * 3.48559 0.0381
FUEL does not Granger Cause Export 2000Q1–2014Q2 * 4.15959 0.0212
Export 2000Q1–2014Q2 does not Granger Cause METAL* 3.55128 0.0360
Export 2000Q1–2014Q2 does not Granger Cause MACHIN* 7.18410 0.0018
Export 2000Q1–2014Q2 does not Granger Cause FUEL* 6.54643 0.0029
Export 2000Q1–2014Q2 does not Granger Cause FOOD* 5.44233 0.0072
Export 2000Q1–2014Q2 does not Granger Cause CHEM* 11.2630 0.0000
Export 2000Q1–2014Q2 does not Granger Cause AGRI* 28.4046 0.0000
* – Variables were excluded from regression equation as not statistically significant
This conclusion needs to be compared with the regression equation and
the impulse response function. The best regression equation that is on the right side includes export of ser-
vices and goods as endogenous variable, describes exogenous variables with de-termination coefficient R2 equal to 0.4975. All va-riables involved into the final equation are statistically significant.
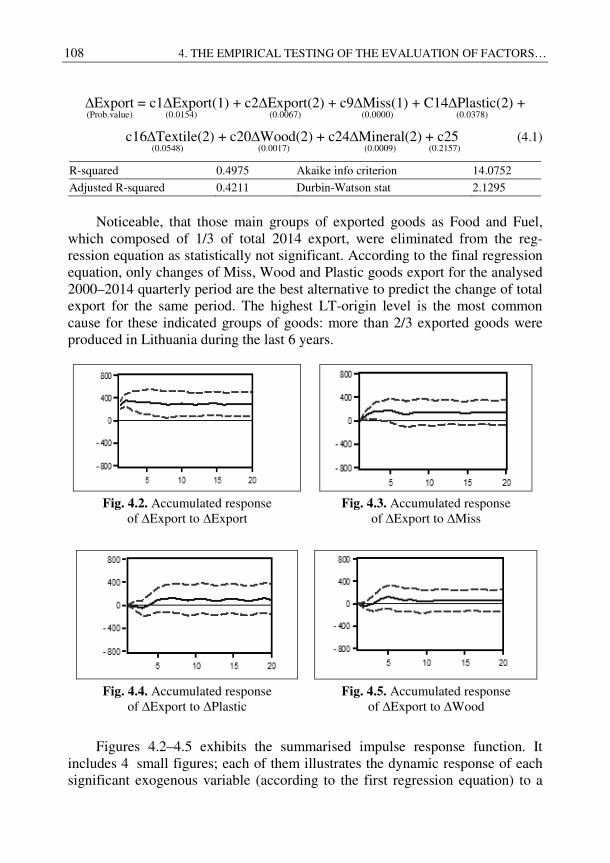
108 4. THE EMPIRICAL TESTING OF THE EVALUATION OF FACTORS…
∆Export = c1∆Export(1) + c2∆Export(2) + c9∆Miss(1) + C14∆Plastic(2) + (Prob.value) (0.0154) (0.0067) (0.0000) (0.0378)
c16∆Textile(2) + c20∆Wood(2) + c24∆Mineral(2) + c25 (4.1) (0.0548) (0.0017) (0.0009) (0.2157)
R-squared 0.4975 Akaike info criterion 14.0752
Adjusted R-squared 0.4211 Durbin-Watson stat 2.1295
Noticeable, that those main groups of exported goods as Food and Fuel,
which composed of 1/3 of total 2014 export, were eliminated from the reg-ression equation as statistically not significant. According to the final regression equation, only changes of Miss, Wood and Plastic goods export for the analysed 2000–2014 quarterly period are the best alternative to predict the change of total export for the same period. The highest LT-origin level is the most common cause for these indicated groups of goods: more than 2/3 exported goods were produced in Lithuania during the last 6 years.
Fig. 4.2. Accumulated response
of ∆Export to ∆Export Fig. 4.3. Accumulated response
of ∆Export to ∆Miss
Fig. 4.4. Accumulated response
of ∆Export to ∆Plastic
Fig. 4.5. Accumulated response of ∆Export to ∆Wood
Figures 4.2–4.5 exhibits the summarised impulse response function. It includes 4 small figures; each of them illustrates the dynamic response of each significant exogenous variable (according to the first regression equation) to a
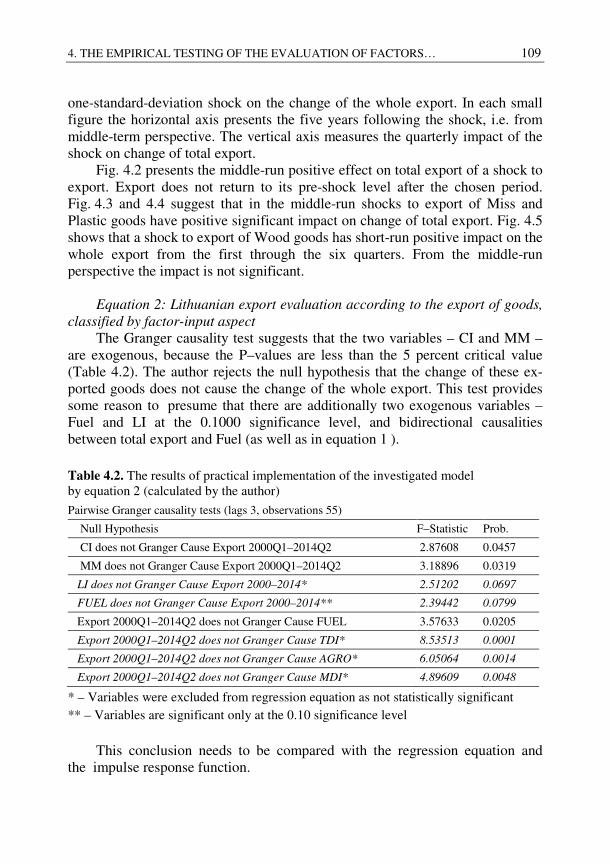
4. THE EMPIRICAL TESTING OF THE EVALUATION OF FACTORS… 109
one-standard-deviation shock on the change of the whole export. In each small figure the horizontal axis presents the five years following the shock, i.e. from middle-term perspective. The vertical axis measures the quarterly impact of the shock on change of total export.
Fig. 4.2 presents the middle-run positive effect on total export of a shock to export. Export does not return to its pre-shock level after the chosen period. Fig. 4.3 and 4.4 suggest that in the middle-run shocks to export of Miss and Plastic goods have positive significant impact on change of total export. Fig. 4.5 shows that a shock to export of Wood goods has short-run positive impact on the whole export from the first through the six quarters. From the middle-run perspective the impact is not significant.
Equation 2: Lithuanian export evaluation according to the export of goods,
classified by factor-input aspect
The Granger causality test suggests that the two variables – CI and MM – are exogenous, because the P–values are less than the 5 percent critical value (Table 4.2). The author rejects the null hypothesis that the change of these ex-ported goods does not cause the change of the whole export. This test provides some reason to presume that there are additionally two exogenous variables – Fuel and LI at the 0.1000 significance level, and bidirectional causalities between total export and Fuel (as well as in equation 1 ).
Table 4.2. The results of practical implementation of the investigated model by equation 2 (calculated by the author)
Pairwise Granger causality tests (lags 3, observations 55)
Null Hypothesis F–Statistic Prob.
CI does not Granger Cause Export 2000Q1–2014Q2 2.87608 0.0457
MM does not Granger Cause Export 2000Q1–2014Q2 3.18896 0.0319
LI does not Granger Cause Export 2000–2014* 2.51202 0.0697
FUEL does not Granger Cause Export 2000–2014** 2.39442 0.0799
Export 2000Q1–2014Q2 does not Granger Cause FUEL 3.57633 0.0205
Export 2000Q1–2014Q2 does not Granger Cause TDI* 8.53513 0.0001
Export 2000Q1–2014Q2 does not Granger Cause AGRO* 6.05064 0.0014
Export 2000Q1–2014Q2 does not Granger Cause MDI* 4.89609 0.0048
* – Variables were excluded from regression equation as not statistically significant ** – Variables are significant only at the 0.10 significance level
This conclusion needs to be compared with the regression equation and
the impulse response function.
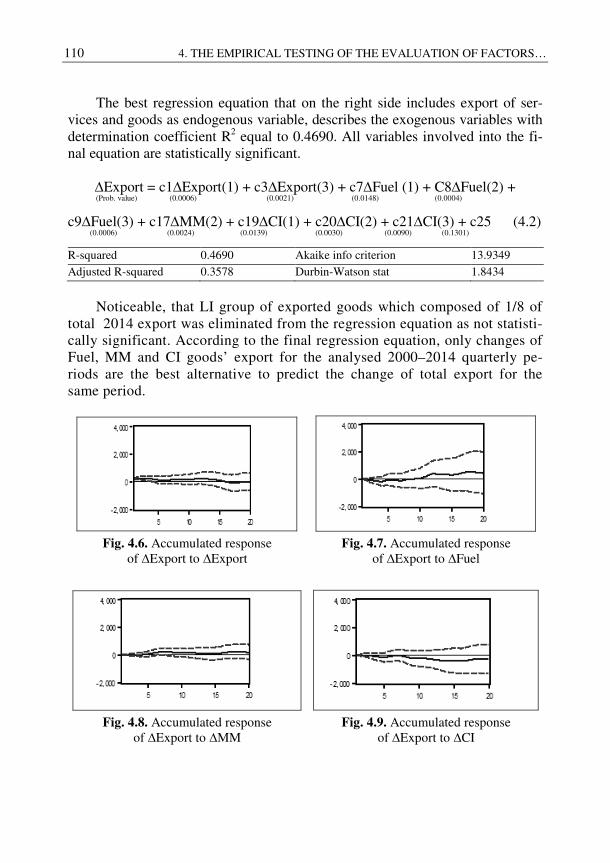
110 4. THE EMPIRICAL TESTING OF THE EVALUATION OF FACTORS…
The best regression equation that on the right side includes export of ser-vices and goods as endogenous variable, describes the exogenous variables with determination coefficient R2 equal to 0.4690. All variables involved into the fi-nal equation are statistically significant.
∆Export = c1∆Export(1) + c3∆Export(3) + c7∆Fuel (1) + C8∆Fuel(2) +
(Prob. value) (0.0006) (0.0021) (0.0148) (0.0004)
c9∆Fuel(3) + c17∆MM(2) + c19∆CI(1) + c20∆CI(2) + c21∆CI(3) + c25 (4.2)
(0.0006) (0.0024) (0.0139) (0.0030) (0.0090) (0.1301)
R-squared 0.4690 Akaike info criterion 13.9349
Adjusted R-squared 0.3578 Durbin-Watson stat 1.8434
Noticeable, that LI group of exported goods which composed of 1/8 of
total 2014 export was eliminated from the regression equation as not statisti-cally significant. According to the final regression equation, only changes of Fuel, MM and CI goods’ export for the analysed 2000–2014 quarterly pe-riods are the best alternative to predict the change of total export for the same period.
Fig. 4.6. Accumulated response
of ∆Export to ∆Export Fig. 4.7. Accumulated response
of ∆Export to ∆Fuel
Fig. 4.8. Accumulated response
of ∆Export to ∆MM
Fig. 4.9. Accumulated response of ∆Export to ∆CI
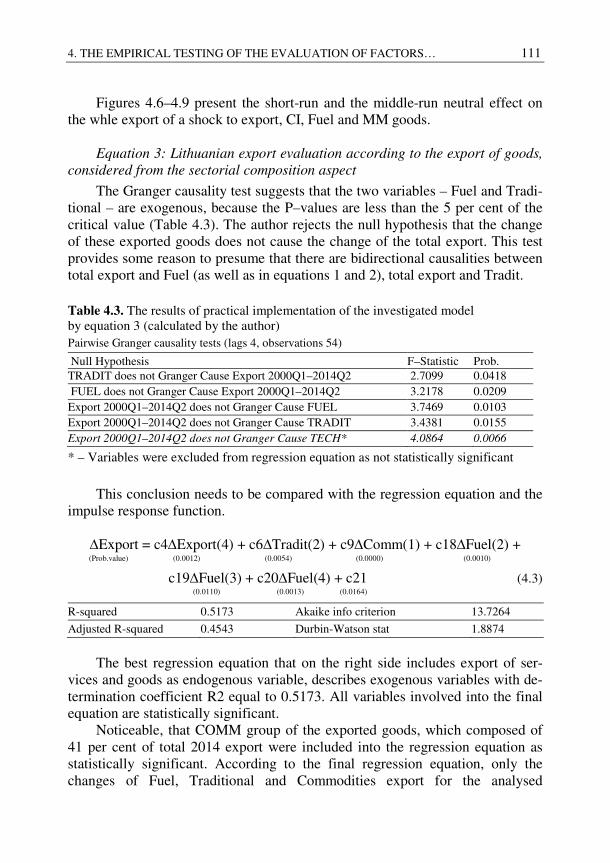
4. THE EMPIRICAL TESTING OF THE EVALUATION OF FACTORS… 111
Figures 4.6–4.9 present the short-run and the middle-run neutral effect on the whle export of a shock to export, CI, Fuel and MM goods.
Equation 3: Lithuanian export evaluation according to the export of goods,
considered from the sectorial composition aspect
The Granger causality test suggests that the two variables – Fuel and Tradi-tional – are exogenous, because the P–values are less than the 5 per cent of the critical value (Table 4.3). The author rejects the null hypothesis that the change of these exported goods does not cause the change of the total export. This test provides some reason to presume that there are bidirectional causalities between total export and Fuel (as well as in equations 1 and 2), total export and Tradit.
Table 4.3. The results of practical implementation of the investigated model by equation 3 (calculated by the author) Pairwise Granger causality tests (lags 4, observations 54)
Null Hypothesis F–Statistic Prob. TRADIT does not Granger Cause Export 2000Q1–2014Q2 2.7099 0.0418 FUEL does not Granger Cause Export 2000Q1–2014Q2 3.2178 0.0209 Export 2000Q1–2014Q2 does not Granger Cause FUEL 3.7469 0.0103 Export 2000Q1–2014Q2 does not Granger Cause TRADIT 3.4381 0.0155 Export 2000Q1–2014Q2 does not Granger Cause TECH* 4.0864 0.0066
* – Variables were excluded from regression equation as not statistically significant
This conclusion needs to be compared with the regression equation and the impulse response function.
∆Export = c4∆Export(4) + c6∆Tradit(2) + c9∆Comm(1) + c18∆Fuel(2) +
(Prob.value) (0.0012) (0.0054) (0.0000) (0.0010)
c19∆Fuel(3) + c20∆Fuel(4) + c21 (4.3) (0.0110) (0.0013) (0.0164) R-squared 0.5173 Akaike info criterion 13.7264
Adjusted R-squared 0.4543 Durbin-Watson stat 1.8874
The best regression equation that on the right side includes export of ser-
vices and goods as endogenous variable, describes exogenous variables with de-termination coefficient R2 equal to 0.5173. All variables involved into the final equation are statistically significant.
Noticeable, that COMM group of the exported goods, which composed of 41 per cent of total 2014 export were included into the regression equation as statistically significant. According to the final regression equation, only the changes of Fuel, Traditional and Commodities export for the analysed
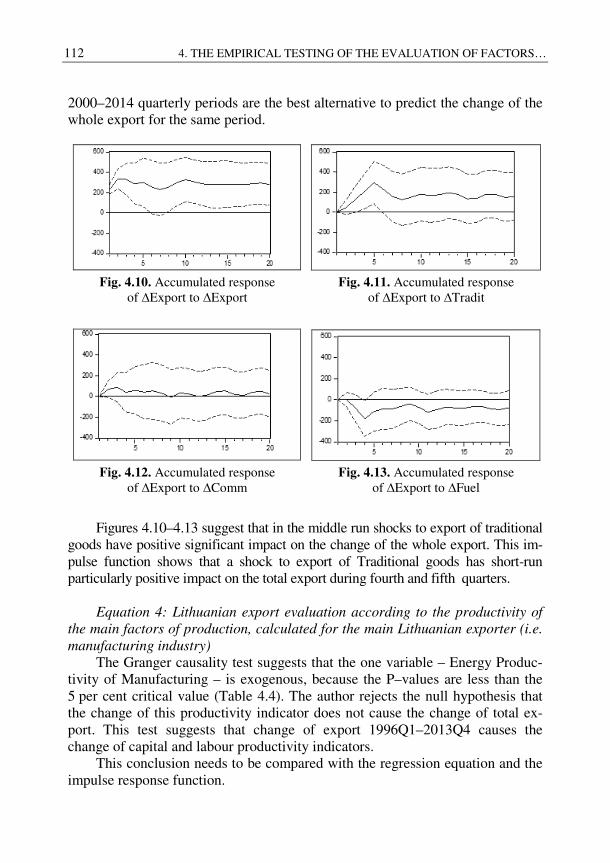
112 4. THE EMPIRICAL TESTING OF THE EVALUATION OF FACTORS…
2000–2014 quarterly periods are the best alternative to predict the change of the whole export for the same period.
Fig. 4.10. Accumulated response
of ∆Export to ∆Export Fig. 4.11. Accumulated response
of ∆Export to ∆Tradit
Fig. 4.12. Accumulated response
of ∆Export to ∆Comm
Fig. 4.13. Accumulated response
of ∆Export to ∆Fuel
Figures 4.10–4.13 suggest that in the middle run shocks to export of traditional goods have positive significant impact on the change of the whole export. This im-pulse function shows that a shock to export of Traditional goods has short-run particularly positive impact on the total export during fourth and fifth quarters.
Equation 4: Lithuanian export evaluation according to the productivity of
the main factors of production, calculated for the main Lithuanian exporter (i.e.
manufacturing industry)
The Granger causality test suggests that the one variable – Energy Produc-tivity of Manufacturing – is exogenous, because the P–values are less than the 5 per cent critical value (Table 4.4). The author rejects the null hypothesis that the change of this productivity indicator does not cause the change of total ex-port. This test suggests that change of export 1996Q1–2013Q4 causes the change of capital and labour productivity indicators.
This conclusion needs to be compared with the regression equation and the impulse response function.
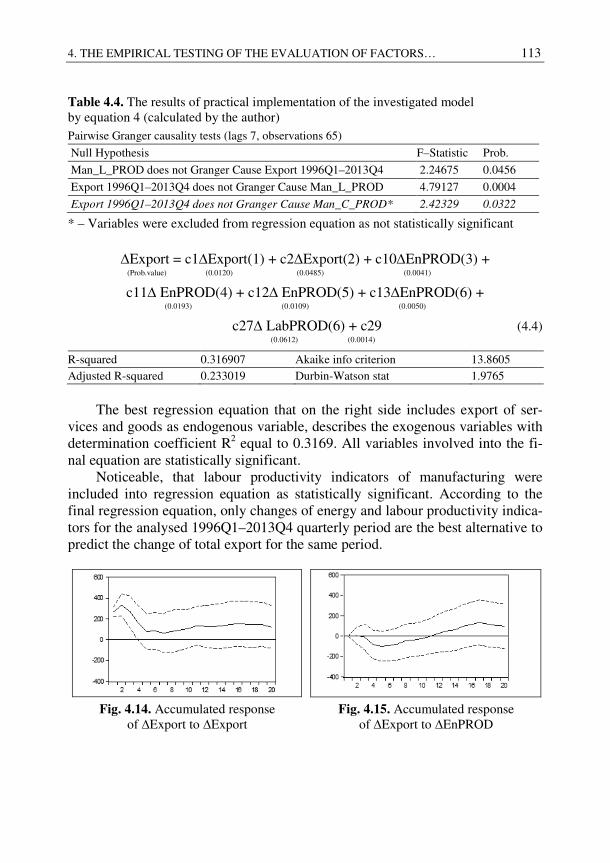
4. THE EMPIRICAL TESTING OF THE EVALUATION OF FACTORS… 113
Table 4.4. The results of practical implementation of the investigated model by equation 4 (calculated by the author) Pairwise Granger causality tests (lags 7, observations 65)
Null Hypothesis F–Statistic Prob.
Man_L_PROD does not Granger Cause Export 1996Q1–2013Q4 2.24675 0.0456
Export 1996Q1–2013Q4 does not Granger Cause Man_L_PROD 4.79127 0.0004
Export 1996Q1–2013Q4 does not Granger Cause Man_C_PROD* 2.42329 0.0322
* – Variables were excluded from regression equation as not statistically significant
∆Export = c1∆Export(1) + c2∆Export(2) + c10∆EnPROD(3) + (Prob.value) (0.0120) (0.0485) (0.0041)
c11∆ EnPROD(4) + c12∆ EnPROD(5) + c13∆EnPROD(6) + (0.0193) (0.0109) (0.0050)
c27∆ LabPROD(6) + c29 (4.4) (0.0612) (0.0014)
R-squared 0.316907 Akaike info criterion 13.8605 Adjusted R-squared 0.233019 Durbin-Watson stat 1.9765
The best regression equation that on the right side includes export of ser-
vices and goods as endogenous variable, describes the exogenous variables with determination coefficient R2 equal to 0.3169. All variables involved into the fi-nal equation are statistically significant.
Noticeable, that labour productivity indicators of manufacturing were included into regression equation as statistically significant. According to the final regression equation, only changes of energy and labour productivity indica-tors for the analysed 1996Q1–2013Q4 quarterly period are the best alternative to predict the change of total export for the same period.
Fig. 4.14. Accumulated response
of ∆Export to ∆Export Fig. 4.15. Accumulated response
of ∆Export to ∆EnPROD
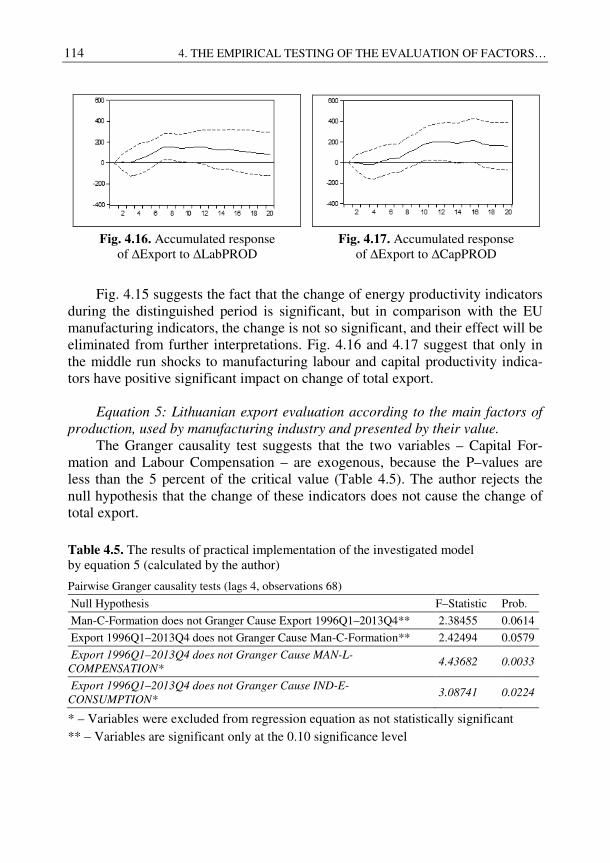
114 4. THE EMPIRICAL TESTING OF THE EVALUATION OF FACTORS…
Fig. 4.16. Accumulated response
of ∆Export to ∆LabPROD
Fig. 4.17. Accumulated response
of ∆Export to ∆CapPROD
Fig. 4.15 suggests the fact that the change of energy productivity indicators during the distinguished period is significant, but in comparison with the EU manufacturing indicators, the change is not so significant, and their effect will be eliminated from further interpretations. Fig. 4.16 and 4.17 suggest that only in the middle run shocks to manufacturing labour and capital productivity indica-tors have positive significant impact on change of total export.
Equation 5: Lithuanian export evaluation according to the main factors of
production, used by manufacturing industry and presented by their value.
The Granger causality test suggests that the two variables – Capital For-mation and Labour Compensation – are exogenous, because the P–values are less than the 5 percent of the critical value (Table 4.5). The author rejects the null hypothesis that the change of these indicators does not cause the change of total export.
Table 4.5. The results of practical implementation of the investigated model by equation 5 (calculated by the author)
Pairwise Granger causality tests (lags 4, observations 68)
Null Hypothesis F–Statistic Prob.
Man-C-Formation does not Granger Cause Export 1996Q1–2013Q4** 2.38455 0.0614
Export 1996Q1–2013Q4 does not Granger Cause Man-C-Formation** 2.42494 0.0579
Export 1996Q1–2013Q4 does not Granger Cause MAN-L-
COMPENSATION* 4.43682 0.0033
Export 1996Q1–2013Q4 does not Granger Cause IND-E-
CONSUMPTION* 3.08741 0.0224
* – Variables were excluded from regression equation as not statistically significant ** – Variables are significant only at the 0.10 significance level
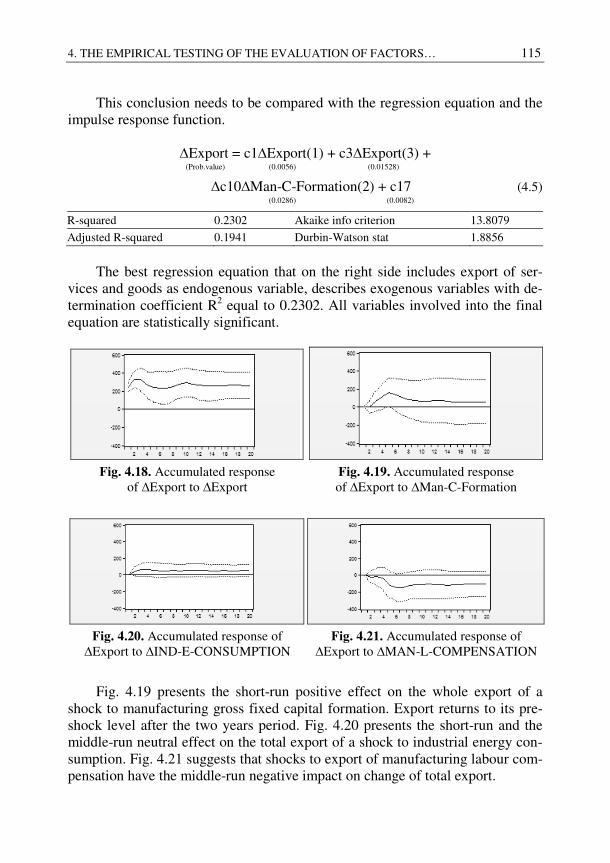
4. THE EMPIRICAL TESTING OF THE EVALUATION OF FACTORS… 115
This conclusion needs to be compared with the regression equation and the impulse response function.
∆Export = c1∆Export(1) + c3∆Export(3) + (Prob.value) (0.0056) (0.01528)
∆c10∆Man-C-Formation(2) + c17 (4.5) (0.0286) (0.0082)
R-squared 0.2302 Akaike info criterion 13.8079
Adjusted R-squared 0.1941 Durbin-Watson stat 1.8856
The best regression equation that on the right side includes export of ser-
vices and goods as endogenous variable, describes exogenous variables with de-termination coefficient R2 equal to 0.2302. All variables involved into the final equation are statistically significant.
Fig. 4.18. Accumulated response
of ∆Export to ∆Export Fig. 4.19. Accumulated response
of ∆Export to ∆Man-C-Formation
Fig. 4.20. Accumulated response of ∆Export to ∆IND-E-CONSUMPTION
Fig. 4.21. Accumulated response of ∆Export to ∆MAN-L-COMPENSATION
Fig. 4.19 presents the short-run positive effect on the whole export of a shock to manufacturing gross fixed capital formation. Export returns to its pre-shock level after the two years period. Fig. 4.20 presents the short-run and the middle-run neutral effect on the total export of a shock to industrial energy con-sumption. Fig. 4.21 suggests that shocks to export of manufacturing labour com-pensation have the middle-run negative impact on change of total export.
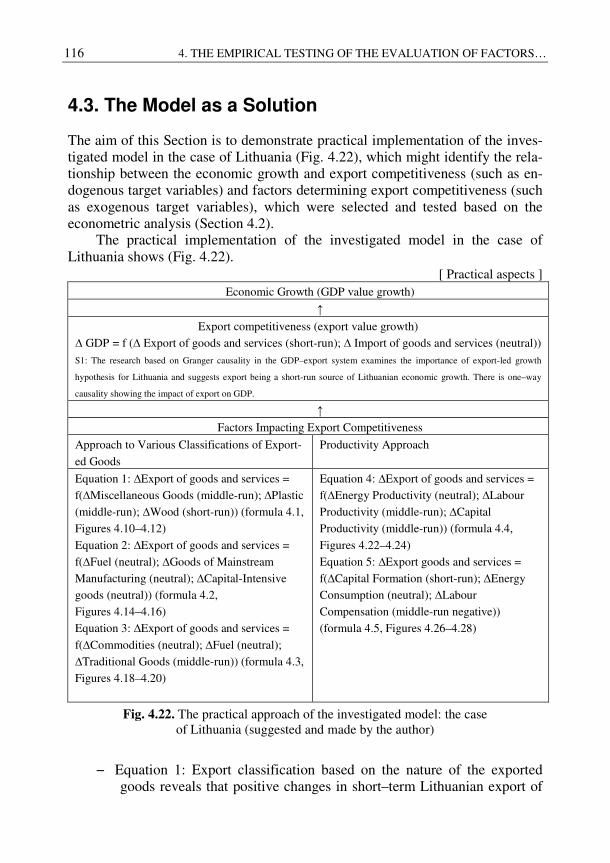
116 4. THE EMPIRICAL TESTING OF THE EVALUATION OF FACTORS…
4.3. The Model as a Solution
The aim of this Section is to demonstrate practical implementation of the inves-tigated model in the case of Lithuania (Fig. 4.22), which might identify the rela-tionship between the economic growth and export competitiveness (such as en-dogenous target variables) and factors determining export competitiveness (such as exogenous target variables), which were selected and tested based on the econometric analysis (Section 4.2).
The practical implementation of the investigated model in the case of Lithuania shows (Fig. 4.22).
[ Practical aspects ] Economic Growth (GDP value growth)
↑
Export competitiveness (export value growth)
∆ GDP = f (∆ Export of goods and services (short-run); ∆ Import of goods and services (neutral))
S1: The research based on Granger causality in the GDP–export system examines the importance of export-led growth
hypothesis for Lithuania and suggests export being a short-run source of Lithuanian economic growth. There is one–way
causality showing the impact of export on GDP.
↑
Factors Impacting Export Competitiveness
Approach to Various Classifications of Export-
ed Goods
Productivity Approach
Equation 1: ∆Export of goods and services =
f(∆Miscellaneous Goods (middle-run); ∆Plastic
(middle-run); ∆Wood (short-run)) (formula 4.1,
Figures 4.10–4.12)
Equation 2: ∆Export of goods and services =
f(∆Fuel (neutral); ∆Goods of Mainstream
Manufacturing (neutral); ∆Capital-Intensive
goods (neutral)) (formula 4.2,
Figures 4.14–4.16)
Equation 3: ∆Export of goods and services =
f(∆Commodities (neutral); ∆Fuel (neutral);
∆Traditional Goods (middle-run)) (formula 4.3,
Figures 4.18–4.20)
Equation 4: ∆Export of goods and services =
f(∆Energy Productivity (neutral); ∆Labour
Productivity (middle-run); ∆Capital
Productivity (middle-run)) (formula 4.4,
Figures 4.22–4.24)
Equation 5: ∆Export goods and services =
f(∆Capital Formation (short-run); ∆Energy
Consumption (neutral); ∆Labour
Compensation (middle-run negative))
(formula 4.5, Figures 4.26–4.28)
Fig. 4.22. The practical approach of the investigated model: the case of Lithuania (suggested and made by the author)
− Equation 1: Export classification based on the nature of the exported goods reveals that positive changes in short–term Lithuanian export of
4. THE EMPIRICAL TESTING OF THE EVALUATION OF FACTORS… 117
goods are caused by the “Wood” products (or mostly labour-intensive goods) and have a positive effect on the whole export increase, whereas in the medium-term, changes in the export in Miscellaneous (mostly furniture) and Plastic goods (or mostly labour-, capital intensive and marketing driven goods) caused a significant positive change in the whole export.
− Equation 2: Export classification based on the factor inputs is not in-formative for the evaluation of the short-run and middle-run impacts on the total Lithuanian export.
− Equation 3: Export classification according to the sectorial composition shows that the exported Lithuanian traditional goods cause a significant positive change in the whole export both in the short and in the middle runs.
− Equation 4: The increase in the manufacturing labour and capital productivity has a positive effect on the whole export only in the middle run. The industrial energy productivity does not cause any short-run and middle-run positive impacts on the total export.
− Equation 5: The increase in the gross fixed capital formation in manu-facturing has a significant positive effect on the whole export only in the short run. The decrease in the manufacturing labour compensa-tion has a significant positive effect on the whole export only in the middle run. The industrial energy consumption does not cause any short-run or middle-run impact on the total export.
4.4. Strategic Guidelines to Enhancing Short-run and Middle-run Competitiveness of Lithuanian Export
Strategic guidelines are provided exclusively on the basis of the results of the empirical analysis for the case of Lithuania and on the analysis of scientific li-terature.
To justify the application of the model of export competitiveness evaluation to strategic planning of export policy for short-term and middle-term perspec-tives, further strategic recommendations for enhancing the Lithuanian export competitiveness based on the results of the empirical research (the case of Lithuania) are provided below.
The description of strategic guidelines is organized as follows: firstly, the suggested measurement approach should be presented. Secondly, the author identifies principles suggested for continuous measurement of factors determin-
118 4. THE EMPIRICAL TESTING OF THE EVALUATION OF FACTORS…
ing export competitiveness. Finally, the main insights from the performed re-search, strategic guidelines and recommendations for enhancing Lithuanian ex-port competitiveness should be provided.
The suggested measurement approach to various classifications of the ex-
ported goods is applicable, if:
− A small open economy country mostly exports goods (more than 80%);
− Re-export consists of a particular share of the whole export structure. Principles suggested for continuous measurement of factors determining
export competitiveness, according to the above-mentioned approach, are pre-sented as follows:
1. Various classifications of export should be used:
a) a national classification, for example, based on “the nature of the exported goods”, or CN2 classification;
a) a classification used in institutional regional research centres, for example, based on factor inputs;
b) a classification used by independent research centres, for example, the classification considered from the sectorial com-position aspect;
c) a classification based on the origin of the exported goods. 2. Other principles, which are recommended and applied in particular
Lithuanian research publications:
a) manufacturing of refined petroleum products should be elimi-nated from further analysis as one–off or confidential infor-mation, which is related to a strong monopolistic situation in this manufacturing;
b) the statistical information based on “data adjusted for the working day and seasonal effects” (in demand);
c) the evaluation of the short-run and middle-run impacts on ex-port is based on the impulse-response function;
d) the constant update of calculation should be made continually (at least once a year);
e) export of goods has to be analysed and divided via Lithuanian export and re-export aspects.
The main insights from the performed research according to the above-mentioned approach are summarised as follows:
1. The analysis based on the nature of the exported goods shows that there is the relation between the export structure and international export competitiveness. The strongest positive relationship is found
4. THE EMPIRICAL TESTING OF THE EVALUATION OF FACTORS… 119
between the “Other” group of the exported goods (such as “Plastic”, “Agriculture”, “Wood”, “Metal” and “Miss” groups of goods) and strengthening of international competitiveness. A positive relation-ship is found between “Mach&Food” group of the exported goods and their furtherance of international competitiveness growth. The failing relationship is found between “Chemicals” and “Textile” groups of the exported goods and their weak international competiti-veness.
2. Goods produced by technology-driven and marketing-driven manu-facturing sectors (i.e. machinery, electrical and other related equipment, as well as food, beverages and tobacco products) repre-sent a significant share in export structure. Export demand for these goods is rather high.
3. The most significant export demand can be observed in the dynamics of goods produced by capital-intensive sectors.
4. It is worth noting that export of agricultural and labour-intensive goods has a trend to be marked as sustainable, and has always been relatively competitive, supposedly, because of specialisation in these goods, which could be additionally proved by calculation and, for example, by the analysis of HHI index.
5. The export structure is slowly changing from the specialised structu-re for the so-called traditional industries to a diversified structure. Today, the important role is played by traditional goods, while the position of commodities and technology-intensive goods is slightly growing.
6. The classification by the origin of the exported goods reveals the greatest share of the overall export, reaching 57 per cent for Lithua-nian-origin export. Hence, there is a dominant type of resale, such as “internal consumption mix”, which is closely related to the same Lithuanian-origin products. The explanation of the above close rela-tionship is not complicated: the import of Lithuanian companies is mostly intended for intermediate consumption and aimed at increa-sing gross value added of Lithuanian-origin products, as well as at securing a wide products’ mix.
Guidelines for enhancing short-run competitiveness (or determining what kinds of goods have a positive impact on export changes in the short-run per-spective, i.e. in the first two years) are provided as follows:
1. A positive shock to export of Wood goods has a short-run positive impact on the whole export (when export classification based on goods’ nature is used).
120 4. THE EMPIRICAL TESTING OF THE EVALUATION OF FACTORS…
2. The export classification considered from factor-input aspect is not informative for enhancing short-run (as well as middle-run) competi-tiveness.
3. A positive shock to export of Traditional goods has a short-run posi-tive impact on the whole export (when export classification based on the sectorial composition is used).
Guidelines for enhancing middle-run competitiveness (or what kinds of goods have a positive impact on export changes in the middle-run perspective, i.e. a period from two to five years) are provided as follows:
1. A positive shock to export of Miss (i.e. furniture and other miscella-neous articles) and Plastic goods has a middle-run positive impact on the whole export (when export classification based on goods’ nature is used).
2. The export classification considered from factor-input aspect is not informative for enhancing middle-run (as well as short-run) competi-tiveness.
3. A positive shock to export of Traditional goods has a middle-run po-sitive impact on the whole export (when export classification based on the sectorial composition is used) as well as in the short run.
Recommended suggestions according to the approach to various classifica-tions of the exported goods are provided as follows:
1. Strengthen the role of Traditional goods (according to the classifica-tion based on the sectorial composition), implementing diversifica-tion (1), flexibility (2), continuous quality upgrading (3) and conti-nuous innovation (4) methods in export competitiveness enhancement’ policy.
2. The necessity for entering new export markets and new products’ introduction to the export markets is obvious and these actions are strongly recommended for all groups of the exported goods.
The suggested measurement approach to productivity of the main factors of
industrial production is applicable, if the main exporter of country with small open economy country is the industry.
Principles suggested for continuous measurement of factors determining export competitiveness, according to the above-mentioned approach, are pre-sented as follows:
1. The main factors of production should include traditional factors, such as labour and capital, as well as some complementary factors, such as energy (the suggestion of modern theories based on the classical principles).
2. Productivity indicators should be systematically evaluated.
4. THE EMPIRICAL TESTING OF THE EVALUATION OF FACTORS… 121
3. Other recommended principles, which are applied to particular Lithuanian research publications:
a) manufacturing of refined petroleum products should be elimi-nated from further analysis as one–off or confidential infor-mation related to a strong monopolistic situation in this manu-facturing;
b) the statistical information based on “data adjusted for a wor-king day and seasonal effects” (in demand);
c) the evaluation of the short-run and middle-run impact of the export based on the impulse response function;
d) the update of calculations has to be implemented continually, at least once a year.
The main insights from the performed research according to the above-mentioned approach are summarised as follows:
1. The tendencies of manufacturing development in some aspects are similar to those of the changes in export structure based on the goods’ nature:
a) production of textile products shows the tendencies of decrea-sing internal production, similar to those for export. Twenty years ago this manufacturing sector belonged to the traditional industry, and after Lithuania’s joining the European Union, and, particularly, after the global crisis, the volume of textile products decreased. On the one hand, this sector reduced its volume, while on the other hand, it can be observed that this sphere of manufacturing strengthened its competitive advantage through diversification;
b) production of chemicals inside the country is growing, although its share in the export structure is decreasing. Moreo-ver, this type of manufacturing is considered to be traditional for the Lithuanian market. However, now, it is more specia-lised, as well as having the reduced volume and greater compe-titive advantage due to the specialization.
2. The manufacturing structure considered from the factor-input aspect is similar to the export structure, except for the fact that technology-driven products are more export-demanding, whereas marketing-driven products are more demanding for internal consumption.
3. The manufacturing structure analised from the sectorial composition aspect, is not sufficiently flexible for change, unlike the export out-put-structure. During 16 years, the export structure has been shifting
122 4. THE EMPIRICAL TESTING OF THE EVALUATION OF FACTORS…
from the specialisated structure for the traditional industries to a di-versified structure, whereas rather equal share distribution can be ob-served among the commodities, traditional and technology-intensive goods.
4. The author provides the calculation of labour productivity for each manufacturing sector classified according to the goods’ nature:
a) the data demonstrates gradual positive changes in the manufac-turing structure in labour productivity: the labour is used less intensely. Therefore, the labour as a factor of production lost its relative importance in production and tends to contribute more to GDP generation in services;
b) the second insight provides a generalized claim that labour as a factor of production can be substituted by other factors of pro-duction;
c) it is worth re-emphasing the fact that all considered sectors are characterized by a negative change in the number of the hours worked, except for “Miss” manufacturing sector presented as a marketing-driven industry.
5. The overall picture of the capital input in production in the conside-red manufacturing sectors is based on the volume of gross fixed capi-tal formation:
a) capital as a factor of production, as opposed to labour, strengthens its relative importance due to increasing gross fixed capital formation;
b) the author identified eight manufacturing sectors with the in-creasing gross fixed capital formation and capital productivity. Not going into further analysis, one can claim to observe the existence of a positive relationship between the requirement for permanent investment and capital efficiency of the indica-ted manufacturing sectors, which means, similarly to labour input, the substitution of capital for other factors of production.
6. The author offers the structure of Lithuania‘s energy demand at ma-nufacturing level:
a) for that purpose, the author studied the Lithuania‘s energy con-sumption taxonomy for a whole number of the main Lithua-nian manufacturing sectors;
b) tt is worth noting that the most energy-intensive industries pre-sent a mix of sectors, considering export-oriented industries. For example, “Chemicals” manufacturing is a high energy-
4. THE EMPIRICAL TESTING OF THE EVALUATION OF FACTORS… 123
intensive sector, while the group of “Food” and “Machinery” are medium energy-intensive manufacturing sectors.
7. The analysis shows that a tendency for using a vast majority of ener-gy inputs to increase the production of any manufacturing sector. Consequently, two approaches can be suggested for data analysis:
a) one approach focuses on export-oriented manufacturing sectors with a high level of energy productivity (such as “Machinery” and “Mineral”);
b) the other one focuses on export-oriented manufacturing sectors with a low level of energy productivity, but a high and increa-sing level of energy consumption (such as “Food” and “Chem-icals”);
c) both approaches have some common features, however, the variation of their energy consumption during the considered period show the disparity between them. Thus, the manufactu-ring sectors covered by the first approach prove a negative change in energy consumption, as opposed by other approach, demonstrating a positive change.
Guidelines for the enhancing short-run competitiveness (or what factors of industrial production have a positive impact on the export change in a short-run perspective, i.e. in the first two years) are provided as follows:
1. A positive shock to gross fixed capital formation in manufacturing has a short-run positive impact on the whole export.
2. A positive shock to energy consumption in industry does not have any short-run (as well as middle-run) impact on the whole export.
3. A positive shock to labour compensation in manufacturing does not have any short-run impact on the whole export.
4. A positive shock to capital, labour and energy productivity in manu-facturing industry does not have any short-run positive impact on the whole export.
Guidelines for the enhancing middle-run competitiveness (or what factors of industrial production will have a positive impact on the export change in the middle-run perspective, i.e. a period from two to five years) are provided as follows:
1. A positive shock to gross fixed capital formation in manufacturing does not have any middle-run positive impact on the whole export.
2. A positive shock to energy consumption in industry does not have any middle-run (as well as short-run) impact on the whole export.
124 4. THE EMPIRICAL TESTING OF THE EVALUATION OF FACTORS…
3. A positive shock to labour compensation in manufacturing has a middle-run negative impact on the whole export.
4. A positive shock to capital productivity in manufacturing industry has a middle-run positive impact on the whole export.
5. A positive shock to labour productivity in manufacturing industry has a middle-run positive impact on the whole export.
6. A positive shock to energy productivity in industry has a weak middle-run positive impact on the whole export.
Recommended suggestions according to the approach to productivity of the main factors of industrial production are provided as follows:
1. To stimulate capital investments in manufacturing industry (it is the main Lithuanian exporter), primarily, because of the increase in the productivity of the capital stocks. The author considers various types of capital investments to be stimulated: not only investments in tan-gible assets, but in intangible assets as well (particularly in intellec-tual capital and property. In the case of Lithuania, the essential in-vestments should be made in branding or re-branding, and in the issue of patents and trademarks).
The provided strategic guidelines for enhancing short-run and middle-run competitiveness of Lithuanian export make only a methodological basis; howe-ver, its practical application could allow timely formation of the purposive ex-port-related policy.
4.5. Conclusions of the Chapter 4
Based on practical implementation of the suggested model in the case of Lithua-nia within the framework of econometric analysis, the following conclusions can be drawn:
1. In Chapter 4, the empirical testing of the suggested model is provi-ded in the framework of relevant statistical data and econometric analysis. According to practical implementation of the proposed mo-del in the case of Lithuania, the author presents the main strategic guidelines for enhancing short-run and middle-run competitiveness of Lithuanian export as follows:
a) a positive shock to export of Wood goods has a short-run posi-tive impact on the whole export. A positive shock to export of Miss (i.e. furniture and other miscellaneous articles) and Plas-tic goods has a middle-run positive impact on the whole export
4. THE EMPIRICAL TESTING OF THE EVALUATION OF FACTORS… 125
(when export classification based on the goods’ nature is used);
b) an export classification based on factor inputs is not informa-tive for enhancing short-run (as well as middle-run) competi-tiveness;
c) a positive shock to export of Traditional goods has a short-run (as well as middle-run) positive impact on the whole export (when export classification based on the sectorial composition is used);
d) a positive shock to gross fixed capital formation in manufac-turing has a short-run positive impact on the whole export, but does not have any middle-run positive impact on the whole ex-port;
e) a positive shock to energy consumption in industry does not have any short-run (as well as middle-run) impact on the whole export;
f) a positive shock to manufacturing labour compensation does not have any short-run impact on the whole export, but has a middle-run negative impact on the whole export;
g) a positive shock to capital and labour productivity in manufac-turing industry does not have any short-run positive impact on the whole export. A positive shock to capital and labour productivity in manufacturing has a middle-run positive impact on the whole export;
h) a positive shock to energy productivity in industry does not have any middle-run (as well as short-run) positive impact on the whole export.
2. The author offers further strategic recommendations for enhancing Lithuanian export competitiveness under the guidance of analysis and experience:
a) traditional goods themselves (classified by the sectorial com-position aspect) secure their strong position in Lithuanian ex-port and manufacturing structures. Export competitiveness enhancement is related to further implementation and strengthening of diversification (1), flexibility (2), continuous quality upgrading (3) and continuous innovation (4) in export policy of traditional goods;
b) the necessity of entering new export markets and the introduc-tion of new products to export markets are obvious, and these
126 4. THE EMPIRICAL TESTING OF THE EVALUATION OF FACTORS…
actions are strongly recommended for all groups of the export-ed goods;
c) the potential of export competitiveness enhancement is related to stimulation of capital investments in manufacturing (which is the main Lithuanian exporter), primarily, because of the in-crease in the productivity of capital stocks. The author consi-ders that various types of capital investments can be stimulated not only by the investments in tangible assets, but in intangible assets as well (particularly, in the intellectual capital and pro-perty). In the case of Lithuania, essential investments should be made in branding or re-branding, and in the issue of patents and trademarks.
127
General Conclusions
1. The results of the study show that a more detailed assessment of the competitiveness of international trade can be made by applying clas-sical and neo-classical theories. The results of the study show that the competitiveness of international trade can be in greater detail measu-red by applying classical and neo-classical theories. Considering the listed theoretical findings related to the measurement of international trade competitiveness of small, open eocnomy countries, the author suggests using new trade theories based on the analysis of producti-vity growth and the application of various classifications of the exported goods.
2. The empirical and econometric analysis of Lithuanian export structu-re shows that there is a positive relationship between the “Miss”, “Plastic“ and “Wood“ group of the exported goods and strengthening of international competitiveness (the classification of the exported goods based on goods’ nature). Today, the traditional goods play an important role in Lithuanian export competitiveness enhancement and in Lithuanian export growth (the classification of the exported goods based on sectorial composition).
128 GENERAL CONCLUSIONS
3. The empirical analysis of Lithuanian manufacturing shows that there is a relation between the export structure, manufacturing structure and international export competitiveness: products made by techno-logy-driven manufacturing industries are more export-demanding, whereas products made by marketing-driven manufacturing indust-ries are more dependent on internal consumption.
4. The econometric analysis of the causality relationship between Lithuanian export and economic growth (GDP) proves that export is a short-run source of the Lithuanian economic growth. The export-led growth model intended for implementation in export develop-ment policy was re-examined and re-confirmed in the case of Lithua-nia.
5. According to practical implementation of the model proposed for the case of Lithuania in the framework of relevant statistical data and econometric analysis it is suggested that the short-run export compe-titiveness enhancement should be related to the increase in export of the traditional goods (particularly, in the „Wood“ and „Miss“) and to stimulation of capital investments in the manufacturing industry.
6. According to practical implementation of the proposed model in the case of Lithuania, in the framework of relevant statistical data and econometric analysis it is suggested that the middle-run export com-petitiveness enhancement should be related to the increase in export of traditional goods (particularly, in the „Plastic“ and „Miss“) and in capital, labour and energy productivity of the manufacturing industry.
129
References
Adlytė, R.; Valančienė, L.; Krušinskas, R. 2015. Investment to technologies strengths and weaknesses: Lithuania in the context of EU, Journal of economics,
business and management, 2015, Vol. 3(6): 633–637. DOI: 10.7763/JOEBM.2015.V3.257.
Akbar, M.; Naqvi, Z. F.; Din, M. 2000. Export Diversification and the Structural Dynamics in the Growth Process: The Case of Pakistan, Sixteenth Annual General
Meeting and Conference of the Pakistan Society of Development Economists Islam-
abad. January 22–24, 2001, Papers and Proceedings. 39(4): 573–589.
Arbex, M.; Perobelli, F. S. 2010. Solow meets Leontief: Economic growth and en-ergy consumption, Energy Economics, 32: 43–53. doi: 10.1016/j.eneco.2009.05.004.
Badrinath, R.; Wignaraja, G. 2004. Building Business Competitiveness, Interna-
tional Trade Forum, Issue 2: 6–8.
Bagdanavičius, J. 1999. Tarptautinės prekybos politikos pokyčiai, Lietuvos ūkis,
11–12.
Balkytė, A.; Tvaronavičienė, M. 2010. Perception of competitiveness in the context of sustainable development: facets of “Sustainable competitiveness”, Journal of
Business Economics and Management 11(2): 341–365.
Barney, J. B. 1991. Firm resources and sustainable competitive advantage, Journal
of Management, 17(1): 99–120.
130 REFERENCES
Bikker, J.A.; Haaf, K. 2002. Measures of competition and concentration in the bank-ing industry: a review -of the literature, Economic & Financial Modelling.
Blinder, A. 1991. Keynesian Economics, Concise Encyclopedia of Economics.
Bobinaitė, V.; Juozapavičienė, A.; Staniewskic, M.; Szczepankowskic, P. 2013. Comparative analysis of features of Polish and Lithuanian Day–ahead electricity market prices, Energy Policy, 63: 181–196. doi:10.1016/j.enpol.2013.08.045.
Bouoiyour, J. 2003. Trade and GDP Growth in Morocco: Short-run or Long–run Causality? Revista Brasileira de economia de Empresas, 3(2): 19–26.
Bruneckienė, J. 2008. Measurement of Lithuanian Regions by Regional Competi-
tiveness Index, Doctoral Dissertation, 04S. KTU.
Bruneckienė, J.; Paltanavičienė, D. 2012. Measurement of Export Competitiveness of the Baltic States by Composite Index, Engineering Economics, 23(1): 50–62. DOI: http://dx.doi.org/10.5755/j01.ee.23.1.1218.
Burinskiene, A. 2009. Tarptautine prekyba ir jos raidos tendencijos, Mokslas – Lie-
tuvos ateitis: verslas XXI amziuje, 1(3): 5–8.
Burinskiene, A. 2010. The Application of Electronic Commerce Technologies in the
Development of International Trade, Doctoral Dissertation, 04S. Vilnius: Technika.
Bruneckienė, J.; Pekarskienė, I.; Sovienė, J. 2014. The critical aspects of Lithuanian competition policy in relation to cartels. Procedia social and behavioral sciences, 19th international scientific conference Economics and Management, 2014, 156: 261–267. DOI: 10.1016/j.sbspro.2014.11.186.
Camagni, R. 2002. On the concept of Territorial Competitiveness: Sound or Mis-leading? Paper presented at the ERSA Conference, Dortmund.
Chichilnisky, G.; Heal, G. 1993. Energy-capital substitution: a General Equilibrium analysis, International Institute for Applied Systems Analysis, 2361 Luxemburg, Austria, Working Paper: 339–90.
Cho, D. S.; Moon, C. H. 1994. From Adam Smith to Michael Porter. Evolution of
Competitiveness Theory, Asia–Pacific Business Series 2: 223 p.
Cho, D. S.; Moon, H. C. 2005. A New Stage Model and Its Application to Asian Countries. From Adam Smith to Michael Porter: Evolution to Competitiveness The-ory, World Scientific. Asia–Pacific Business Series, 175–193. http://dx.doi.org/10.1142/9789812385222_0008.
Čiburienė, J. et al. 2006. Education as factor to achieve productivity growth: Lithu-anian case, In The Next Decade Challenges for Business: international scientific
conference, Riga. Latvia: 236–244.
Čiburienė, J.; Zaharieva, G. 2006. International Trade as a Factor of Competitive-ness: Comparison of Lithuanian and Bulgarian Cases, Inžinerinė Ekonomika–
Engineering Economics 49(4): 48–56.
REFERENCES 131
Činčikaitė, R. 2013. The Measurement of Urban Competitiveness in a Complex Way
on the Perspective of Sustainable Development, Doctoral Dissertation, 04S. KTU.
Delgado, M.; Ketels, M.; Porter, M. E.; Stern, S. 2012. The Determinants of Nation-al Competitiveness, NBER Working Paper No. 18249. Available from Internet: http://www.nber.org/papers/w18249.
Department of Statistics to the Government of the Republic of Lithuania. 2015. Available from Internet: http://www.stat.gov.lt/en/pages/view/?id=1459.
DnB Economic Research Unit. 2011. Lithuanian Economic Outlook.
Dudzevičiūtė, G. 2013. The research of the economic structural changes: energy consumption aspect, Journal of Security and Sustainability Issues 2(4): 13–23. http://dx.doi.org/10.9770/jssi.2013.2.4(2).
Dudzevičiūtė, G. 2013. Lithuanian manufacturing trends in the context of developed and developing countries, Entrepreneurship and Sustainability Issues 1(1): 55–66. http://dx.doi.org/10.9770/jesi.2013.1.1(6).
Dudzevičiūtė, G. 2013. Energy intensity in the Lithuanian manufacturing sector, Journal of security and sustainability issues, 3(2): 77–85. Available from internet: http://www.lka.lt/lt/moksline–veikla/leidiniai/journal–of–security–sak9.html.
Dudzevičiūtė, G.; Mačiulis, A.; Tvaronavičienė, M. 2014. Structural changes оf ecоnоmies: Lithuania in the glоbal cоntext, Technological and economic develop-
ment of economy, 20 (2): 353–370.
Dunning, J. H. 1992. The Competitive Advantage of Countries and the Activities of Transnational Corporations, Transnational corporations. 1(2): 138–168.
Edwards, A. R. 2010. The sustainability revolution: Portrait of a paradigm shift, Gabriola Island, Canada: New Society Publishers.
Ejdys, J.; Ustinovičius, L.; Stankevičienė, J. 2015. Innovative application of con-temporary management methods in a knowledge–based economy – interdisciplinari-ty in science, Journal of Business Economics and Management 16(1): 2015. DOI:10.3846/16111699.2014.986192.
Enders, W. 2009. Applied Econometric Time Series, 3rd Edition, SeriesWiley, New York. ISBN: 978–0–470–57425–6.
Enterprise Lithuania. 2014. Importance of Export for the Lithuanian Economy.
Esfahani, H.S. 1991. Exports. imports. and economic growth in semi–industrialized countries, Journal of Development Economics, 35(1): 93–116.
Esser, K.; Hillebrand, W.; Messner, K.; Meyer–Stmer, J. 1995. Systemic Competi-
tiveness. New Governance Patterns for industrial Development, London.
European commission. 2009. EU industrial structure 2009: performance and com-
petitiveness.
132 REFERENCES
European Commission. 2012. European Competitiveness Report 2012: Reaping the
Benefits of Globalization.
European Commission. 2013. Member States’ Energy Dependence: An Indicator–Based Assessment, European Economy Occasional Papers 145.
European Commission. 2014. Energy economic developments in Europe. DG Eco-
nomic and Financial Affairs, European Economy Series No. 1.
European Commission. 2014. European Competitiveness Report 2014: Helping
firms grow.
EUROSTAT. 2015. Eurostat Statistical Office of the European Communities. NACE
Rev. 2 Introductory Guidelines, Luxembourg. Available from Internet: http://ec.europa.eu/eurostat/ramon/miscellaneous/index.cfm?TargetUrl=DSP_INTRO_STAT_CLASS.
Fagerberg, J. et al. 2007. The competitiveness of Nations: Why Some countries Prosper While Others Fall Behind, World Development 35(10): 1595–1620.
Fasila, C. B.; Borotab, T. 2013. World trade patterns and prices: The role of produc-tivity and quality heterogeneity, Journal of International Economics, 91(1): 68–81. doi:10.1016/j.jinteco.2013.04.004.
Felipe, J.; Kumar, U.; Abdon, A. 2014. How rich countries became rich and why poor countries remain poor: It's the economic structure…duh! Japan and the World
Economy, 29: 46–58. doi:10.1016/j.japwor.2013.11.004.
Fojtíková, L. 2014. Performance and Growth of the Eurozone Export, 17th Interna-
tional Conference Enterprise and Competitive Environment 2014, Procedia Eco-nomics and Finance. 12: 154–163. doi:10.1016/S2212–5671(14)00331–1.
Galinienė, B.; Visokavičienė, B.; Kaklauskas, A. 2001. Evaluation of Lithuanian export competitiveness, Scientific Conference “Competitiveness of Lithuanian
economy”, Vilnius. Lithuania: 43–49.
Gardiner, B.; Martin, R.; Tyler, P. 2004. Competitiveness, Productivity and Eco-nomic Growth across the European Regions, Regional Studies 38(9): 1045–1067. doi: 10.1080/0034340042000292638.
Garelli, S. 2012. Competitiveness: Changing the Mindset, in Top Class Competi-
tors: How Nations, Firms, and Individuals Succeed in the New World of Competi-
tiveness, John Wiley & Sons. Inc.. Hoboken. NJ. USA. doi: 10.1002/9781119209270.ch1.
Giles, J. A.; Williams, C. L. 2000. Export-led Growth: A Survey of the Empirical Literature and Some Non-Causality Results, Part 1, Journal of International Trade
and Economic Development, 9 (4). DOI:10.1080/09638190050086177.
Giles, J. A.; Williams, C. L. 2000. Export-led Growth: A Survey of the Empirical Literature and Some Non-Causality Results, Part 2, Journal of International Trade
and Economic Development, 9 (4). DOI:10.1080/096381900750056867.
REFERENCES 133
Ginevičius, R.; Rakauskienė, O. G.; Patalavičius, R.; Tvaronavičienė, M.; Kalašin-skienė, K.; Lisauskaitė, V. 2005. Eksporto ir investicijų plėtra Lietuvoje, Mono-grafija. Vilnius: Technika.
Guyomard, H.; Mouel, C. L. 2002. The New Banana Import Regime in the Europe-an Union: A Quantitative Assessment, Institut National de la Re-cherche
Agronomique, France.
Hausmann, R.; Pritchett, L.; Rodrik, D. 2005. Growth Accelerations, Journal of
Economic Growth, 10(4): 303–329.
Hornstein, A.; Krusell, P. 1996. Can Technology Improvements Cause Productivity Slowdowns? NBER Macroeconomics Annual 11, MIT Press: Cambridge MA: 209–259.
IMD. 2015. The World Competitiveness Yearbook for the 2002–2014, The World Competitiveness Center, Swiss. Available from Internet: http://www.imd.org/wcc.
International Energy Agency (IEA). 2014. Energy Technology Perspectives.
International Energy Agency (IEA). 2006. World Energy Outlook, Paris.
Jung. W. S.; Marshall. P. J. 1985. Exports. growth and causality in developing coun-tries. Journal of Development Economics, 18(1). doi:10.1016/0304–3878(85)90002–1.
Kitson, M.; Martin, R.; Tyler, P. 2004. Regional Competitiveness: An Elusive yet Key Concept? Regional Studies, 38(9): 991–999. doi: 10.1080/0034340042000320816.
Klacek, J. et al. 2009. Total factor productivity in Czech manufacturing industry – KLEM framework, Statistika 5: 414–428.
Kónya, L. 2004. Export-led Growth. Growth-driven Export. Both or None? Granger Causality Analysis on OECD Countries, Applied Econometrics and International
Development, 4(1): 73–94. Available from Internet: http://www.usc.es/economet/reviews/aeid415.pdf.
Korsakienė, R.; Tvaronavičienė, M.; Smaliukienė, R. 2014. Impact of energy prices on industrial sector development and export: Lithuania in the context of Baltic States, The 2–dn International Scientific conference “Contemporary Issues in Busi-
ness. Management and Education 2013”, Amsterdam. 110: 461–469.
Krivka, A. 2015. Complex evaluation of the economic crisis impact on Lithuanian industrines, Journal of Business Economics and Management, 15(2). DOI:10.3846/16111699.2013.867277.
Krugman, P. R. 1986. Introduction: New Thinking about Trade Policy, MIT Press, Cambridge. MA.
Krugman, P. R. 1990. Rethinking International Trade, Cambridge, MA, MIT Press.
Krugman, P. R. 1994. Competitiveness: A Dangerous Obsession, Foreign Affairs 73(2): 28–44.
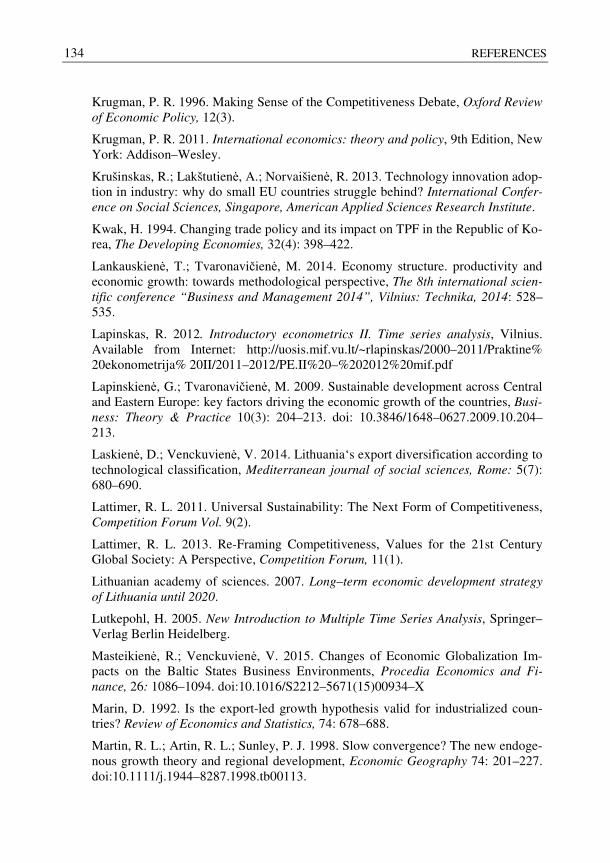
134 REFERENCES
Krugman, P. R. 1996. Making Sense of the Competitiveness Debate, Oxford Review
of Economic Policy, 12(3).
Krugman, P. R. 2011. International economics: theory and policy, 9th Edition, New York: Addison–Wesley.
Krušinskas, R.; Lakštutienė, A.; Norvaišienė, R. 2013. Technology innovation adop-tion in industry: why do small EU countries struggle behind? International Confer-
ence on Social Sciences, Singapore, American Applied Sciences Research Institute.
Kwak, H. 1994. Changing trade policy and its impact on TPF in the Republic of Ko-rea, The Developing Economies, 32(4): 398–422.
Lankauskienė, T.; Tvaronavičienė, M. 2014. Economy structure. productivity and economic growth: towards methodological perspective, The 8th international scien-
tific conference “Business and Management 2014”, Vilnius: Technika, 2014: 528–535.
Lapinskas, R. 2012. Introductory econometrics II. Time series analysis, Vilnius. Available from Internet: http://uosis.mif.vu.lt/~rlapinskas/2000–2011/Praktine% 20ekonometrija% 20II/2011–2012/PE.II%20–%202012%20mif.pdf
Lapinskienė, G.; Tvaronavičienė, M. 2009. Sustainable development across Central and Eastern Europe: key factors driving the economic growth of the countries, Busi-
ness: Theory & Practice 10(3): 204–213. doi: 10.3846/1648–0627.2009.10.204–213.
Laskienė, D.; Venckuvienė, V. 2014. Lithuania‘s export diversification according to technological classification, Mediterranean journal of social sciences, Rome: 5(7): 680–690.
Lattimer, R. L. 2011. Universal Sustainability: The Next Form of Competitiveness, Competition Forum Vol. 9(2).
Lattimer, R. L. 2013. Re-Framing Competitiveness, Values for the 21st Century Global Society: A Perspective, Competition Forum, 11(1).
Lithuanian academy of sciences. 2007. Long–term economic development strategy
of Lithuania until 2020.
Lutkepohl, H. 2005. New Introduction to Multiple Time Series Analysis, Springer–Verlag Berlin Heidelberg.
Masteikienė, R.; Venckuvienė, V. 2015. Changes of Economic Globalization Im-pacts on the Baltic States Business Environments, Procedia Economics and Fi-
nance, 26: 1086–1094. doi:10.1016/S2212–5671(15)00934–X
Marin, D. 1992. Is the export-led growth hypothesis valid for industrialized coun-tries? Review of Economics and Statistics, 74: 678–688.
Martin, R. L.; Artin, R. L.; Sunley, P. J. 1998. Slow convergence? The new endoge-nous growth theory and regional development, Economic Geography 74: 201–227. doi:10.1111/j.1944–8287.1998.tb00113.
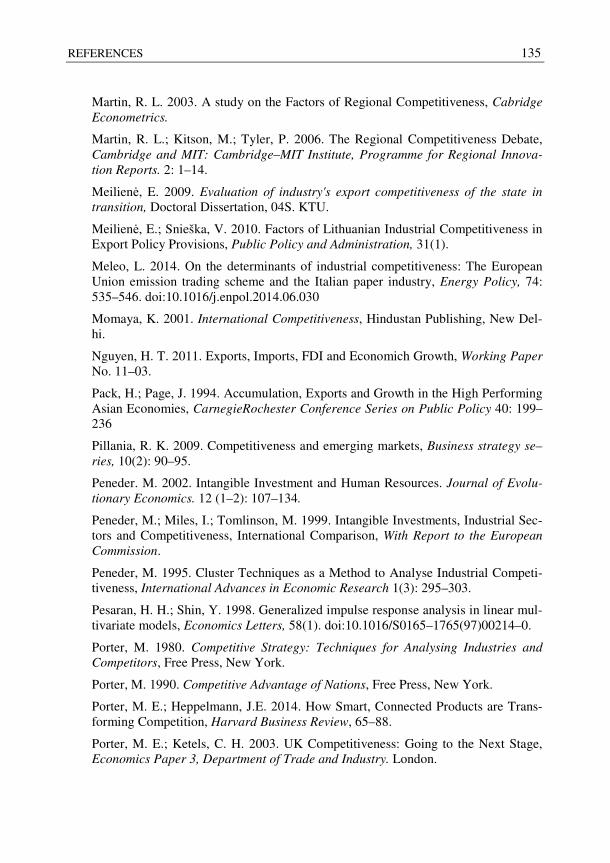
REFERENCES 135
Martin, R. L. 2003. A study on the Factors of Regional Competitiveness, Cabridge
Econometrics.
Martin, R. L.; Kitson, M.; Tyler, P. 2006. The Regional Competitiveness Debate, Cambridge and MIT: Cambridge–MIT Institute, Programme for Regional Innova-
tion Reports. 2: 1–14.
Meilienė, E. 2009. Evaluation of industry's export competitiveness of the state in
transition, Doctoral Dissertation, 04S. KTU.
Meilienė, E.; Snieška, V. 2010. Factors of Lithuanian Industrial Competitiveness in Export Policy Provisions, Public Policy and Administration, 31(1).
Meleo, L. 2014. On the determinants of industrial competitiveness: The European Union emission trading scheme and the Italian paper industry, Energy Policy, 74: 535–546. doi:10.1016/j.enpol.2014.06.030
Momaya, K. 2001. International Competitiveness, Hindustan Publishing, New Del-hi.
Nguyen, H. T. 2011. Exports, Imports, FDI and Economich Growth, Working Paper
No. 11–03.
Pack, H.; Page, J. 1994. Accumulation, Exports and Growth in the High Performing Asian Economies, CarnegieRochester Conference Series on Public Policy 40: 199–236
Pillania, R. K. 2009. Competitiveness and emerging markets, Business strategy se–
ries, 10(2): 90–95.
Peneder. M. 2002. Intangible Investment and Human Resources. Journal of Evolu-
tionary Economics. 12 (1–2): 107–134.
Peneder, M.; Miles, I.; Tomlinson, M. 1999. Intangible Investments, Industrial Sec-tors and Competitiveness, International Comparison, With Report to the European
Commission.
Peneder, M. 1995. Cluster Techniques as a Method to Analyse Industrial Competi-tiveness, International Advances in Economic Research 1(3): 295–303.
Pesaran, H. H.; Shin, Y. 1998. Generalized impulse response analysis in linear mul-tivariate models, Economics Letters, 58(1). doi:10.1016/S0165–1765(97)00214–0.
Porter, M. 1980. Competitive Strategy: Techniques for Analysing Industries and
Competitors, Free Press, New York.
Porter, M. 1990. Competitive Advantage of Nations, Free Press, New York.
Porter, M. E.; Heppelmann, J.E. 2014. How Smart, Connected Products are Trans-forming Competition, Harvard Business Review, 65–88.
Porter, M. E.; Ketels, C. H. 2003. UK Competitiveness: Going to the Next Stage, Economics Paper 3, Department of Trade and Industry. London.
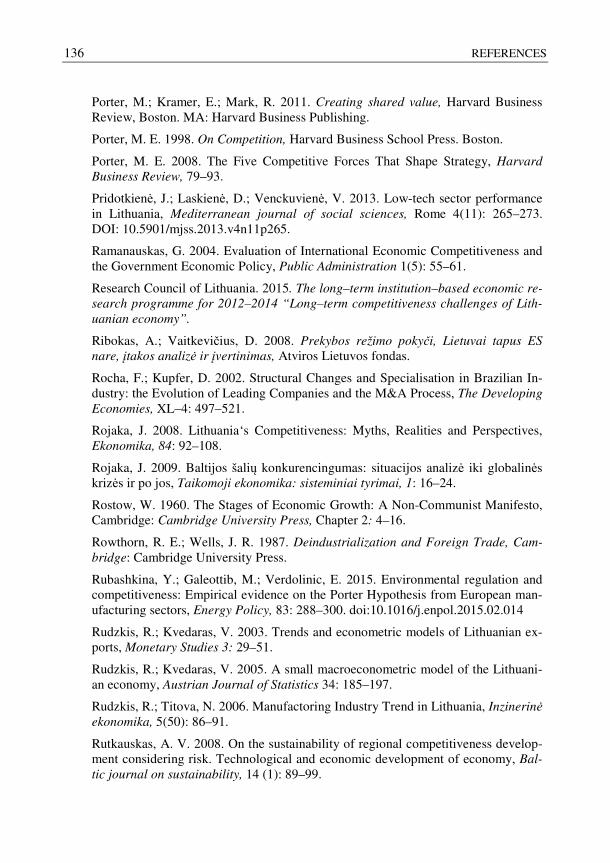
136 REFERENCES
Porter, M.; Kramer, E.; Mark, R. 2011. Creating shared value, Harvard Business Review, Boston. MA: Harvard Business Publishing.
Porter, M. E. 1998. On Competition, Harvard Business School Press. Boston.
Porter, M. E. 2008. The Five Competitive Forces That Shape Strategy, Harvard
Business Review, 79–93.
Pridotkienė, J.; Laskienė, D.; Venckuvienė, V. 2013. Low-tech sector performance in Lithuania, Mediterranean journal of social sciences, Rome 4(11): 265–273. DOI: 10.5901/mjss.2013.v4n11p265.
Ramanauskas, G. 2004. Evaluation of International Economic Competitiveness and the Government Economic Policy, Public Administration 1(5): 55–61.
Research Council of Lithuania. 2015. The long–term institution–based economic re-
search programme for 2012–2014 “Long–term competitiveness challenges of Lith-
uanian economy”.
Ribokas, A.; Vaitkevičius, D. 2008. Prekybos režimo pokyči, Lietuvai tapus ES
nare, įtakos analizė ir įvertinimas, Atviros Lietuvos fondas.
Rocha, F.; Kupfer, D. 2002. Structural Changes and Specialisation in Brazilian In-dustry: the Evolution of Leading Companies and the M&A Process, The Developing
Economies, XL–4: 497–521.
Rojaka, J. 2008. Lithuania‘s Competitiveness: Myths, Realities and Perspectives, Ekonomika, 84: 92–108.
Rojaka, J. 2009. Baltijos šalių konkurencingumas: situacijos analizė iki globalinės krizės ir po jos, Taikomoji ekonomika: sisteminiai tyrimai, 1: 16–24.
Rostow, W. 1960. The Stages of Economic Growth: A Non-Communist Manifesto, Cambridge: Cambridge University Press, Chapter 2: 4–16.
Rowthorn, R. E.; Wells, J. R. 1987. Deindustrialization and Foreign Trade, Cam-
bridge: Cambridge University Press.
Rubashkina, Y.; Galeottib, M.; Verdolinic, E. 2015. Environmental regulation and competitiveness: Empirical evidence on the Porter Hypothesis from European man-ufacturing sectors, Energy Policy, 83: 288–300. doi:10.1016/j.enpol.2015.02.014
Rudzkis, R.; Kvedaras, V. 2003. Trends and econometric models of Lithuanian ex-ports, Monetary Studies 3: 29–51.
Rudzkis, R.; Kvedaras, V. 2005. A small macroeconometric model of the Lithuani-an economy, Austrian Journal of Statistics 34: 185–197.
Rudzkis, R.; Titova, N. 2006. Manufactoring Industry Trend in Lithuania, Inzinerinė
ekonomika, 5(50): 86–91.
Rutkauskas, A. V. 2008. On the sustainability of regional competitiveness develop-ment considering risk. Technological and economic development of economy, Bal-
tic journal on sustainability, 14 (1): 89–99.
REFERENCES 137
Rutkauskas, A. V.; Stasytytė, V.; Michnevič, E. 2014. Universally sustainable de-velopment strategy for a small country: a systemic decision, Inžinerinė ekonomika, Kaunas: Technologija, 25 (5): 630–537.
Rutkauskas, A. V.; Stasytytė, V. 2010. Regional competitiveness information sys-tem as a result of information generation and knowledge engineering, Advances
Techniques in Computing Sciences and Software Engineering, Germany: Springer–Verlag Berlin, 419–424.
Rutkauskas, A. V.; Stasytytė, V. 2013. Intelligence as a Main Way to Ensure Uni-versal Sustainability of Country’s Development, Economics and Business, 24: 127–134.
Rutkauskas, A. V.; Stasytytė, V. 2012. With sustainability engineering to sustaina-bility efficiency, The 7th international scientific conference “Business and Man-
agement 2012”, Vilnius: Technika. 173–184.
Sabonienė, A.; Pridotkienė, J. 2014. Changes in Lithuanian flax industry exports, Production and Co–operation in Agriculture, 15th annual international scientific
conference. Jelgava: Latvia University of Agriculture, Economic Science for Rural
Development. No. 34.
Saboniene, A. 2009. Lithuanian Export Competitiveness: Comparison with other Baltic States, Engineering Economics, 2: 49–57.
Sabonienė, A. 2013. Lithuania’s Export Specialisation According to Technological Classificatio, The 3rd International Conference on Human and Social Sciences.
Roma, Italy.
Satoa, M.; Dechezleprêtrea, M. 2015. Asymmetric industrial energy prices and in-ternational trade, Energy Economics. available online from 8 September 2015, doi:10.1016/j.eneco.2015.08.020
Schor, J. B. 2010. Plenitude: The new economics of true wealth, New York. NY: The Penguin Press.
Schumpeter, J. 1942. Capitalism, Socialism and Democracy, New York: Harper & Row; 3rd Edition.
Shleifer, A.; Vishny, R. 1997. A Survey of Corporate Governance, Nobel Sympo–sium on Law and Finance, Journal of Finance, 52: 737–83.
Silgonera, M. et al. 2015. Fishing in the same pool: Export strengths and competi-tiveness of China and Central, Eastern and Southeastern Europe at the EU–15 mar-ket, China Economic Review, 32: 68–83. doi:10.1016/j.chieco.2014.11.001
Snieška, V. 2008. Research into International Competitiveness in 2000–2008, Engi-
neering Economics 59(4): 29–41.
Snieška, V.; Bruneckienė, J. 2009. Measurement of Lithuanian Regions by Regional Competitiveness Index, Inžinerinė Ekonomika–Engineering Economics 61(1): 45–57.
138 REFERENCES
Snieška, V.; Drakšaitė, A. 2013. Evaluation of sustainability of the general govern-ment debt in a small open economy, Mediterranean journal of social sciences.
Rome. 4: 610–618.
Snieška, V.; Venckuvienė, V.; Valodkienė, G.; Masteikienė, R. 2013. Modelling the outcome of credit shocks in small open economy, Mediterranean journal of social
sciences Rome, 4(9): 619–627. DOI: 10.5901/mjss.2013.v4n9p619.
Soderbaum, P. 2008. Understanding sustainability economics: Towards pluralism
in economics, London: Earthscan Publishers.
Solow, R. 1956. A Contribution to the Theory of Economic Growth, Quarterly
Journal of Economics, 70: 65–94.
Solow, R. 1957. Technical Change and the Aggregate Production Function. Re-
viewed Economics, 39(3): 312–320.
Stasytytė, V. 2013. The development of an attitute towards risk management in the context of country competitiveness, Business. Management and Education 11(2): 281–293
Statistics Lithuania. 2015. Foreign Trade. Available from Internet: http://db1.stat.gov.lt/statbank/selecttable/omrade0.asp?SubjectCode=S6&PLanguage=1
Subrahmanya, B. 2006. Labour productivity, energy intensity and economic per-formance in small enterprises: A study of brick enterprises cluster in India, Energy
Conversion and Management 47: 763–777.
Sun, H.; Parikh, A. 2001. Exports, Inward Foreign Direct Investment (FDI) and Re-gional Economic Growth in China, Regional Studies, 35(3). DOI:10.1080/713693805.
Swan, T. W. 1956. Economic Growth and Capital Accumulation, Economic Record,
32(2): 334–61.
Šeinauskienė, B. 2014. Influence of Export Strategy Standartization–Adaptation on
Performance in International Market, Doctoral Dissertation, 04S. KTU.
Štreimikienė, D.; Bruneckienė, J.; Čibinskienė, A. 2013. The review of electricity market liberalization impacts on electricity prices, Transformations in Business &
Economics, 12(3): 40–60.
Štreimikienė, D.; Čibinskienė, A. 2013. The model of assesing the impact of elec-tricity market liberalization on competitiveness of economy, the Sixth International
Scientific Conference, 6(1): 641–646.
Taranco, M. A.; Rio, P.; Albinana, F. C. 2010. Assessing the influence of ma–nufacturing sectors on electricity demand, A cross–country input–output approach, Energy Policy 38.
Thompson, H. 2006. The applied theory of energy substitution in production, Ener-
gy Economics 28: 410–425. Doi: 10.1016/j.eneco.2005.01.005
REFERENCES 139
Tvaronavičienė, M.; Grybaitė, V.; Tunčikienė, Ž. 2013. Globalization drivers in de-veloped and less developed countries: if consistent patterns can be traced, Journal of
Security and Sustainability Issues 2(4): 5–11. http://dx.doi.org/10.9770/jssi.2013.2.4(1)
Tvaronaviciene, M. 2006. Investment driving forces affecting Lithuanian economic growth, Journal of Business Economics and Management 7(2): 69–76. doi: 10.3846/1611–1699.2006.7.69–76
Tvaronavičienė, M.; Grybaitė, V.; Korsakienė, R. 2008. Foreign capital destina-tions: Baltic States versus India, Journal of Business Economics and Management,
(9)3: 227–235.
Tvaronavičienė, M.; Grybaitė, V.; Tvaronavičius, V. 2008. Economic and other de-velopment aspects of Baltic countries: estimation issues, 5th International Scientific
Conference: Business and Management’ 2008: 107–115.
United Nations Industrial Development Organization (UNIDO). 2002. Competing
through innovation and learning: Industrial development report. 2002/2003. Vien-na.
United Nations. 2004. Export Diversification and Economic Growth: The Experi-ence of Selec–ted Least Developed Countries, Economic and Social Commission for Asia and the Pacific (ESCAP) Unit, Development Papers No. 24:1–7.
Venckuvienė. V. 2014. Challenges for reaching innovativeness in Lithuanian low-tech sector: case study, Business Management Dynamics, 3(10): 21–27.
Venkuvienė, V.; Masteikienė, R. 2015. The Impact of Russian Federation Economic Embargo on the Central and Eastern European Countries Business Environments, Economics and Finance, 26: 1095–1101. doi:10.1016/S2212–5671(15)00935–1
Vilkas. E. 1999. Comparative advantages and long–run development of Lithuanian economy. Lithuania: from transition to convergence, International conference, Vil-
nius. 1–19.
Vilpišauskas, R. 2004. International competitiveness and the Lithuanian export poli-cy, Monetary Studies 1: 54–69.
Vitas, A. 2012. The economy structural changes analysis and evaluation in Baltic
states, Doctoral dissertation, 04S. Vilnius University.
Vitunskienė, V.; Serva, E. 2015. Shifts in Lithuania’s agri–food industry export competitiveness: a comparative analysis versus high- and medium-high technology manufacturing industries, Oeconomia Copernicana.
Vosylius, E.; Rakutis, V.; Tvaronavičienė, M. 2013. Economic growth. sustainable development and energy security interrelation, Journal of security and sustainability
issues, 2(3): 5–14.
Voinescua, R.; Moisoiua, C. 2014. Romania Competitiveness, Theoretical and Poli-cy Approaches, Towards a more competitive EU, 2nd International Conference
‘Economic Scientific Research – Theoretical. Empirical and Practical Approaches’, Bucharest. doi:10.1016/S2212–5671(15)00248–8.

140 REFERENCES
WEF. 2005. Global Competitiveness Report, Oxford University Press for the World Economic Forum, New York.
Weil, D. N. 2005. Growth theory, Brown University: Pearson Education.
World Bank. 2014. World Development Report: Knowledge for Development, Ox-ford University Press, New York.
Zaharieva, G.; Čiburienė, J. 2008. The national competitiveness: the gain and cost of European integration (Bulgarian and Lithuanian case), Economics and Manage-
ment, 13.
141
List of Scientific Publications by
the Author on the Topic of the Dissertation
Papers in the Reviewed Scientific Journals
Travkina, I. 2015. Export and GDP Growth in Lithuania: Short-run or Middle-run Cau-sality? Entrepreneurship and Sustainability Issues, 3(1): 74–84. DOI: http://dx.doi.org/10.9770/jesi.2015.2.4(7).
Travkina, I.; Tvaronavičienė, M. 2015. Peculiarities of Export Structure in Lithuania: Synthesis and Analysis, Entrepreneurship and Sustainability Issues, 2(4): 233–247. http://dx.doi.org/10.9770/jesi.2015.2.4(7).
Travkina, I.; Tvaronavičienė, M. 2011. Export competitiveness and domestic productivi-ty facets: case of Lithuania, Journal of business economics and management, Stralsund: North–German Academy of Informatology (Stralsund), ISSN 1611–1699, 12(1): 49–68.
Travkina, I.; Dudzevičiūtė, G.; Maciukevičienė, L. 2010. Accession to the European Union: impact of legislation change on performance of Lithuanian companies, Verslas:
teorija ir praktika, 10(2): 142–149.
142 LIST OF SCIENTIFIC PUBLICATIONS BY THE AUTHOR ON THE TOPIC…
Other Papers
Travkina, I.; Tvaronavičienė, M. 2010. An investigation into relative competitiveness of international trade: the case of Lithuania, in The 6th International Conference “Business
and Management 2010”: Selected papers, Vilnius: Technika, 504–510. doi:10.3846/bm.2010.067.
Travkina, I. 2008. Integracijos proceso raida globalizacijos kontekste, Verslas, vadyba ir
studijos 2008, Mokslo darbai. Vilnius: Technika. 1 Knyga: 72–79.
143
Summary in Lithuanian
Įvadas
Mokslo problemos formulavimas
Lietuvos eksporto plėtros 2014–2020 metų gairėse iškeltas tikslas – pasiekti, kad iki 2020 metų kuo daugiau Lietuvoje veikiančių įmonių būtų konkurencingos tarptauti-niu mastu, o pramonės ir su ja susijusi verslo struktūra bei sukuriama nacionalinio pro-dukto dalis būtų artimos ES šalių rodikliams. Lietuvos Respublikos Vyriausybės patvir-tintoje Lietuvos ūkio (ekonomikos) plėtros iki 2015 m, ilgalaikėje strategijoje buvo teigiama, kad pramonės konkurencingumą geriausiai atskleidžia eksportuojamos pro-dukcijos dalis bei jos produktyvumas. Strategijoje nurodyta, kad eksportas yra vienas svarbiausių šalies tarptautinio konkurencingumo rodiklių.
Darbo aktualumas
Siekiant kryptingai reaguoti į konkurencingos tarptautinės prekybos formavimąsi bei plėtrą, pirmiausia būtina suformuoti efektyvią Lietuvos eksporto strategiją, pagrįstą eksportuojančių prekių konkurencingumu, ir išskirti veiksnius, lemiančius konkurencinį jų pranašumą. Kyla poreikis įvertinti šalies eksporto konkurencingumo veiksnius, kurie tampa svarbiausiu strateginio planavimo etapu ir šalies konkurencingumo didinimo prie-laida. Tam būtini atitinkami moksliniai tyrimai, kurių rezultatais galima būtų remtis. Ši aplinkybė ir lėmė disertacijos temos pasirinkimą. Viena vertus, šiuolaikinė ekonomikos teorija nestokoja pagrįstų sprendimų, kaip didinti eksporto konkurencingumą, kita
144 SUMMARY IN LITHUANIAN
vertus, turimas mokslinis pažinimas, kuris būtų reikalingas eksporto strategijai formuoti, atsižvelgiant į atskiros, mažos, atviros ekonomikos šalies ir jos tarptautinės prekybos ypatumus, yra nepakankamas, tad skatina ieškoti naujų konkurencingumo vertinimo as-pektų.
Tyrimo objektas
Mažų, atviros ekonomikos šalių eksporto konkurencingumą (augimą) lemiantys veiksniai.
Darbo tikslas
Parengti mažų, atviros ekonomikos šalių eksporto konkurencingumą (augimą) le-miančių veiksnių sudėties ir jų poveikio ekonominiam augimui vertinimo modelį, kuriuo remiantis atlikti empirinį tyrimą Lietuvos pavyzdžiu.
Darbo uždaviniai
Darbo tikslui pasiekti buvo sprendžiami šie uždaviniai:
1. Atlikti eksporto konkurencingumą (augimą) lemiančių veiksnių mokslinės lite-ratūros analizę, išnagrinėjant tarptautinės prekybos ir konkurencingumo teorijų genezę.
2. Išanalizuoti eksporto konkurencingumo vertinimo būdus, atrinkti veiksnius, tinkamus modeliui formuoti ir susisteminti esamus konkurencingumo vertini-mo metodinius principus.
3. Nustatyti mažų, atviros ekonomikos šalių eksporto konkurencingumą (augimą) lemiančių veiksnių sudėtį ir pagal atrinktų veiksnių sudėtį parengti jų poveikio mažų, atviros ekonomikos šalių eksporto konkurencingumui vertinimo modelį.
4. Remiantis siūlomais metodiniais principais bei pasitelkus Lietuvos pavyzdį, įvertinti eksporto konkurencingumą bei parengti eksporto plėtros gaires trum-palaikės ir vidutinės trukmės perspektyvose.
Tyrimų metodika
Mokslinės literatūros analizė grindžiama mokslinių teiginių ir empirinių tyrimų re-zultatų sisteminimu, palyginimu ir apibendrinimu, Empiriniams tyrimams naudojami tokie metodai: duomenų normalizavimas, vektorinės autoregresijos modelis (VAR), Granger priežastingumo testai bei impulsų atsakymo funkcija. Tyrimo rezultatai statis-tiškai apdoroti ir pateikti, naudojant MS „Excel“ ir „Eviews“ programinę įrangą.
Mokslinis naujumas
1. Pasiūlytas mažų, atviros ekonomikos šalių eksporto konkurencingumo veiksnių parinkimo bei sujungimo į bendrą sistemą, modelis. Konkurencingumo
SUMMARY IN LITHUANIAN 145
veiksnių sudėtis papildyta mažoms, atviros ekonomikos šalims reikšminga modelio komponente – energija, kaip antriniu gamybos veiksniu (šalia klasiki-nių gamybos veiksnių – darbo ir kapitalo). Modelyje, kuris orientuotas į ek-sporto didinimą, veiksnių sudėtis skiriasi priklausomai nuo trumpalaikės ir/ar vidutinio laikotarpio perspektyvos.
2. Parengti metodiniai principai orientuoti į mažų, atviros ekonomikos šalių eksporto plėtros gairių formavimą bei jų pritaikomumą, priklausomai nuo tikslų, vykdytojų, turimų išteklių bei laiko perspektyvos.
Darbo rezultatų praktinė reikšmė
Eksporto tyrėjams pravers autorės susisteminta mokslinės literatūros apžvalga bei pateikti metodiniai principai, kuriuos taikant suformuotas modelis, tinkamas naudoti vertinant mažų, atviros ekonomikos šalių eksporto konkurencingumą (augimą) lemiančių veiksnių sudėtį ir jų poveikį eksporto konkurencingumui bei ekonominiam augimui.
Rezultatai naudingi suinteresuotoms grupėms, formuojant viso šalies ūkio ir atskirų ūkio šakų, visos šalies eksporto ir atskirų ūkio šakų eksporto, bei industrinę politiką. Taip pat prognozuojant ir skatinant tam tikrus tikslingus Lietuvos ūkio ir eksporto struktūros pokyčius.
Ginamieji teiginiai
1. Lietuvos eksporto augimas lemia BVP augimą (o ne priešingai), Eksporto po-veikis BVP kinta priklausomai nuo analizuojamo laikotarpio trukmės.
2. Sukurtas mažų, atviros ekonomikos šalių eksporto konkurencingumo vertinimo modelis, integruojantis veiksnius: eksportuojamų prekių visumą, apibūdinamą pagal skirtingas klasifikavimo sistemas; pagrindinius (darbas ir kapitalas) bei antrinius (energija) gamybos veiksnius ir jų produktyvumą. Modelis yra tinka-mas instrumentas vertinti galimus eksporto plėtros scenarijus, taikant pasiūly-tus metodinius principus trumpalaikėje bei vidutinės trukmės perspektyvose.
3. Mažų, atviros ekonomikos šalių eksporto konkurencingumą trumpalaikėje per-spektyvoje veikia viena atrinktų veiksnių grupė, vidutinės trukmės perspekty-voje – kita atrinktų veiksnių grupė.
Disertacijos struktūra
Disertaciją sudaro įvadas, keturi skyriai bei bendrosios išvados. Įvade įvardijama ti-riamoji problema, apibrėžiamas problemos aktualumas, formuluojamas darbo tikslas bei uždaviniai, apibūdinamas mokslinis darbo naujumas.
Darbą sudaro 142 puslapiai (be priedų), 6 priedai, yra 19 lentelių ir 75 paveikslai. Naudotasi 163 bibliografiniais šaltiniais.
146 SUMMARY IN LITHUANIAN
1. Literatūros šaltinių tarptautinės prekybos konkurencingumo vertinimo tematika apžvalga
Šiame disertacijos skyriuje detaliai nagrinėjama konkurencingumo samprata, tarptautinės prekybos ir šalies konkurencingumo sąsajos; atskleistos šių dienų tarptaut-inės prekybos konkurencingumo sąvokos, konkurencingumą lemiantys veiksniai, teori-niai ir praktiniai jų nustatymo metodai bei aspektai, įvardintos bei susistemintos šių metodų įvertinimo daugialypiškumo bei mokslinio pagrindimo problemos.
Tarptautinės prekybos teorijų raidos genezė parodė, kad šalies konkurencingumas ir jį lemiantys veiksniai buvo pradėti nagrinėti klasikinės ekonomikos teorijos pradin-inkų, kurie konkurencingumą suprato kaip gebėjimą eksportuoti ir vertino jį trijų pagrindinių gamybos veiksnių absoliučiais ir (ar) santykiniais dydžiais. Neoklasikinė ekonomikos mokykla, susiformavusi XIX amžiaus viduryje, naujai įvertino klasikų požiūrį į ekonomikos, taip pat ir į tarptautinės prekybos konkurencingumo vertinimo procesus. Mokslininkai į vieną gamybos veiksnį sujungė kapitalą ir žemę, vietoj trijų gamybos veiksnių pasirinkę dviejų veiksnių analizę (darbą ir kapitalą). Neoklasikinės ekonomikos atstovai vertindavo tarptautinės prekybos konkurencingumą pagal šalių turimų technologijų ir (ar) veiksnių santykį. Keli neoklasikinės ekonomikos atstovai išvystė alternatyviąsias teorijas: Leontjevo paradoksas, gyvavimo cikliškumas, masto ekonomija ir kitos. Taip buvo išplėstas praktinis teorijų pritaikomumas vertinant konku-rencingumą bei liko aktualios šių dienų modeliams. Taip pat visa klasikinė teorija buvo papildyta matematiniu bendrosios pusiausvyros modeliavimu.
XX amžiaus pabaigoje profesorius Paulas Krugmanas, aiškindamas spartėjančios tarptautinės prekybos panašaus pobūdžio prekėmis tarp šalių prielaidas, pristatė naują tarptautinės prekybos teoriją. Viena pagrindinių šios teorijos prielaidų yra ta, kad taikant serijinę gamybą daugelį prekių galima pagaminti pigiau, nes veikia masto ekonomija. Šiandien daugelis tarptautinės prekybos modelių remiasi prof. P. Krugmano analitinėmis prielaidomis: gamybai taiko masto ekonomiją, vartojimui – prekių įvairovės pirmenybę. Profesorius įžvelgė, kad „jeigu panašių šalių gamybai būdinga masto ekonomija, prek-yba tarp jų vis tiek yra pelninga: pirma, įmonės gali sutaupyti didindamos parduodamos produkcijos apimtis bei mažindamos sąnaudas (masto ekonomijos efektas); antra, prekių įvairovės didinimas skatina įmonių konkurenciją“. Būdas, kaip įvertinti konku-rencingumą – apskaičiuoti „paprastą vietinį produktyvumą“, teigė P. Krugmanas.
Naujos tarptautinės prekybos šalininkai prie veiksnių, lemiančių tarptautinės prekybos konkurencingumą, be jau pradininko prof. P. Krugmano įvardinto veiksnių produktyvumo, nurodė specializuotos infrastruktūros lygį, darbo jėgos kvalifikaciją, tiekėjų tinklą, vietines technologijas, sąnaudų struktūros pokyčius, taip pat ir mak-roekonominius rodiklius: infliaciją, palūkanų normą ir BVP svyravimus. Klasikinė ir neoklasikinės teorijos, naudojamos modeliuojant tarptautinės prekybos konkurencingu-mo politikos gaires vidutinės trukmės laikotarpiu; tarptautinės prekybos modeliai, suformuoti pagal išplėstinius gamybos veiksnius bei makroekonominius rodiklius, yra orientuoti į ilgalaikę perspektyvą, apimančią nuo 12 iki 20 metų laikotarpį.
Šiame skyriuje nagrinėjami bei apibendrinami moksliniuose tyrimuose taikomi modeliai, skirti tarptautinės prekybos konkurencingumą lemiantiems veiksniams
SUMMARY IN LITHUANIAN 147
įvertinti. Šių teorijų studijose išskiriami keturi konkurencingumo veiksnių vertinimo aspektai: 1) lygio, 2) srities, 3) ekonomikos (šalies) tipo, 4) laikotarpio.
Nustatyta, kad šiuolaikiniuose praktiniuose Lietuvos tyrimuose trūksta sprendimų, reikalingų eksporto politikos konkurencingumo potencialui didinti. Išryškinti poreikiai nagrinėti Lietuvos eksporto konkurencingumą lemiančius veiksnius – produktyvumą (a) bei eksporto struktūrinius pokyčius (b) ekonominiu aspektu (1), pagrindinio eksportuoto-jo (mezzo) lygiu (2), trumpalaikiu bei vidutiniu laikotarpiais (3). Pasiūlytas originalus teoriniais tyrimais paremtas modelis, kurio paskirtis ir esmė – kompleksiškai įvertinti eksporto konkurencingumą lemiančius veiksnius, jų sudėtį ir poveikį šalies ekonominiam augimui, bei galimybė taikyti įvairius ekonominius, statistinius ir ekonometrinius metodus.
2. Lietuvos eksportas ir pramonė
Pasitelkiant Lietuvos pavyzdį bei pasiūlytą teorinį modelį, antrame disertacijos skyriuje pristatoma kompleksinio empirinio tyrimo medžiaga, kurioje atsispindi atrinktų eksporto konkurencingumą lemiančių veiksnių – prekių eksporto struktūrinių pokyčių bei pramonės trijų gamybos veiksnių (darbo, kapitalo ir energijos) produktyvumo – ana-lizės rezultatai. Tyrimas buvo atliekamas keliomis kryptimis.
Pirma, buvo analizuojama šalies tarptautinės prekybos evoliucija ir Lietuvos įmonių konkurencingumo pokyčiai, nulemti pakitusių ūkinės veiklos teisinio regu-liavimo normų po nepriklausomybės atkūrimo. Buvo nagrinėjama, ar prisijungimas prie Europos Sąjungos palengvino tarptautinę prekybą, ir, jei ne, kokios priežastys lėmė nep-ageidaujamus rezultatus. Kritiškai įvertinami subjektyvūs ir objektyvūs veiksniai, veikiantys Lietuvos įmones po 2007–2008 metų finansų krizės.
Antra, Lietuvos pavyzdžiu buvo tikrinami autorės modelyje siūlomi trys klasikiniai veiksniai, lemiantys mažų, atviros ekonomikos šalių eksporto konkurencingumą:
1. Lietuvos prekių eksporto struktūra.
2. Lietuvos pramonės struktūra.
3. Lietuvos pramonės pagrindinių gamybos veiksnių (darbo, kapitalo ir energijos) produktyvumas.
Šioje disertacijos dalyje pateiktas išsamus jų empirinis tyrimas pagal skirtingus klasifikatorius ir grupavimus.
1. Lietuvos prekių eksporto struktūra Lietuvos prekių ir paslaugų eksporto struktūroje prekių eksportui atitenka didžioji
dalis. Šiuo požiūriu siekiama įvertinti prekių eksporto komponentus bei jų pokyčius pa-gal šias klasifikacijas:
− Pagrindines prekių grupes, remiantis užsienio prekybos statistikos „kombinuo-tos nomenklatūros“ klasifikatoriumi, sutrumpintai žymimu KN2. Buvo sufor-muotos dešimt prekių eksporto grupių.
− Prekių veiksnių sudėtį, remiantis Austrijos ekonominių tyrimų instituto (angl. WIFO) sukurtais klasifikatoriais (angl. Taxonomy). Prekės buvo grupuojamos
148 SUMMARY IN LITHUANIAN
kaip darbui imlios, kapitalui imlios, vyraujančios, paremtos rinkodara ir paremtos technologijomis.
− Eksporto sektorinę kompoziciją, remiantis klasikine pasaulinių tyrimų centrų klasifikacija pagal prekes, tradicines šakas ir technologijas.
− Lietuviškos kilmės prekių grupes, remiantis detaliausiu užsienio prekybos statistikos „kombinuotos nomenklatūros“ klasifikatoriumi, sutrumpintai žymimu KN8.
Tyrimo rezultatai parodė, kad Lietuvos eksporto struktūra palaipsniui pereina prie įvairintos struktūros, kurioje vyrauja tradicinės, rinkodara ir technologijomis paremtos, daugiausia reeksportui skirtos prekės. Analizė atskleidė, kad būtent lietuviškos kilmės eksportas, sudarantis 1/3 viso 2013 metų prekių eksporto, per visą nagrinėjamą laikotarpį labiausiai lėmė eksporto konkurencingumo stiprinimą bei augimą.
2. Lietuvos pramonės struktūra Didžiausias šalies eksportuotojas yra pramonė. Šiuo aspektu autorė įvertino
pramonės komponentus, jų pokyčius pagal analogišką grupavimą (klasifikacijas), siekiant jų palyginamumo tolesniuose skyriuose bei formuojant pagrindinius disertacijos teiginius. Buvo:
− Suformuotos dešimt pramonės produkcijos pagrindinių prekių grupių, remiantis ekonominės veiklos rūšių klasifikatoriaus (angl. NACE) 2 redakcija (sutrumpintai NACE2). Prekių grupių pavadinimai analogiški, kaip ir eksporto struktūros.
− Suformuotos penkios pramonių grupės pagal jų pagamintos produkcijos (pre-kių) veiksnių sudėtį, remiantis Austrijos ekonominių tyrimų instituto (angl. WIFO) sukurtais klasifikatoriais (angl. Taxonomy). Pramonės buvo grupuojamos kaip darbui imlios, kapitalui imlios, vyraujančios, paremtos rinkodara ir paremtos technologijomis.
− Suformuotos trys pramonių grupės pagal jų produkcijos sektorinę kompoziciją, remiantis klasikine pasaulinių tyrimų centrų klasifikacija pagal prekes, tradicines šakas ir technologijas.
Empirinis tyrimas parodė, kad Lietuvos pramonės ir eksporto struktūros sudėtis pa-gal prekių pobūdį yra panašios, jose vyrauja tradicinės, rinkodara ir technologijomis paremtos prekės. Analizė atskleidė, kad palaikyti vis didėjantį bei konkurencingumą stiprinantį įvairinimo lygį eksporto struktūroje padeda reeksportas, o pačios pramonės perorientavimas link įvairintos produkcijos tik įgauna pagreitį.
3. Lietuvos pramonės pagrindinių gamybos veiksnių (darbo, kapitalo ir energijos) produktyvumas
Buvo atlikta Lietuvos pramonės šakų pagrindinių gamybos veiksnių – darbo, kapi-talo ir energijos – produktyvumo ir intensyvumo rodiklių lyginamoji analizė:
− Darbo produktyvumo rodikliai atskleidė sparčiausio produktyvumo didėjimo ir intensyvumo mažėjimo tendencijas visose pramonės šakose.
− Kapitalo produktyvumo rodikliai atskleidė didėjančio produktyvumo ir intensy-vumo tendencijas visose pramonės šakose.
SUMMARY IN LITHUANIAN 149
− Energijos produktyvumo rodikliai atskleidė spartaus produktyvumo didėjimo ir nežymaus intensyvumo mažėjimo tendencijas visose pramonės šakose.
Remiantis atliktais empiriniais tyrimais, prieita prie išvadų, kad šalies eksporto konkurencingumo didinimui įtaką daro darbo ir energijos produktyvumo rodiklių didi-nimas ir intensyvumo rodiklių mažinimas, bei kapitalo produktyvumo ir intensyvumo rodiklių didinimas. Analizė atskleidė, kad eksporto konkurencingumo potencialas yra siejamas su kapitalo ir energijos būtent produktyvumo rodiklių paspartinimu.
3. Bendrasis vidaus produktas ir eksporto augimas Lietuvoje: trumpalaikis ar vidutinės trukmės priežastingumas
Trečiame disertacijos skyriuje pereinama prie eksporto ir bendrojo vidaus produkto (BVP) sąveikos analizės. Nors pirmame disertacijos skyriuje buvo išsamiai pristatytos bei pagrįstos teorinės prielaidos, patvirtinančios, kad eksportas yra nepriklausomas (egzoge-ninis) kintamasis modeliuojant šalies ūkį, tačiau šios įžvalgos nėra patvirtintos a priori. Gamybos masto efekto paspartinimas valstybės lygmenyje bei investicijos į technologijas galėtų padidinti BVP ir tokiu būdu paskatinti eksporto plėtrą. Todėl po bendros eksporto ir jo pagrindinių komponentų analizės, pristatytos antrame disertacijos skyriuje, pereinama prie ekonometrinio Lietuvos eksporto sąryšio (priklausomybės ir (ar) nepriklausomybės) su bendruoju vidaus produktu įvertinimo.
Vienas disertacijos klausimų, vertinant eksporto konkurencingumą, yra paties ekspor-to ir BVP priežastingumo ryšių nustatymas. Galimos kelios šių priežastingumo ryšių inter-pretacijos. Pirma, jei eksportas yra nepriklausomas (egzogeninis) kintamasis BVP atžvilgiu, ir yra BVP didėjimo priežastis, būtų tikslinga šalies ekonominę politiką orientuo-ti į eksporto plėtros skatinimą. Antra, jei BVP didėjimas skatinamas investicijomis šalies viduje ir dėl šių priežasčių padidėja gamybos mastai, šalis eksportuotų daugiau, tokiu būdu galėtų pasireikšti grįžtamojo ryšio efektas tarp eksporto ir BVP. Pasauliniame kontekste atlikti tyrimai rodo, kad ryšys tarp šių dviejų rodiklių gali ir neegzistuoti. Ekonometrija siūlo tokio pobūdžio sąveikas nagrinėti taikant Granger priežastingumo metodiką: tikrina-ma, ar vienas kintamasis yra informatyvus, prognozuojant kito kintamojo ateitį. Jeigu in-formatyvus, pirmasis kintamasis laikomas antrojo kintamojo priežastimi. Iš ekonometrinės pusės, šio priežastingumo testavimas yra naudingas ir kitoms prielaidoms suformuoti: jei eksportas laikomas nepriklausomu (egzogeniniu) kintamuoju BVP atžvilgiu, eksporto reikšmes galima vertinti kitais būdais ir rezultatus panaudoti BVP prognozėms modeliuoti.
Pirmiausia, norint patikrinti aptartus sąveikos ryšius tarp Lietuvos prekių ir paslaugų eksporto bei šalies BVP, sudaroma analizuojamų kintamųjų vektorinės autoregresijos (VAR) lygčių sistema. Tyrimui naudojami tik sezoniškai išlyginti, ketvirtinio periodišku-mo duomenys. Suformuotos dvi VAR lygčių sistemos buvo tikrinamos dėl tinkamo vėlavimo skaičiaus parinkimo, kintamųjų kointegruotumo, liekanų charakteristikų, o jos parametrų įverčiai po to panaudoti Granger priežastingumo testuose. Siekiant išvengti šalies dviejų didžiausių krizių įtakos tyrimo rezultatams, autorė analizavo du periodus: pirmasis apėmė 2000–2007 metus, antrasis – nuo 2009 m, pradžios iki 2015 m. pirmojo
150 SUMMARY IN LITHUANIAN
ketvirčio pabaigos. Abiems atvejais, nulinės hipotezės, kad prekių ir paslaugų eksportas nėra BVP Granger priežastis, atmetamos. Tas pats galioja ir nagrinėjant eksporto bei im-porto ryšius: prekių ir paslaugų eksportas yra prekių ir paslaugų importo Granger priežas-tis.
Šis tyrimas parodė, kad abiem atvejais BVP kitimo įtaka yra nereikšminga prekių ir pasaugų eksportui, tačiau, prekių ir paslaugų eksporto kitimo įtaka yra reikšminga pačiam BVP bei prekių ir paslaugų importui. Tuo pačiu patvirtinta, kad eksportą galima nagrinėti atskirai nuo eksporto–BVP sistemos. Reakcijos į impulsus analizė atskleidė, kad paveikus tam tikru papildomu impulsu prekių ir paslaugų eksportą. BVP reakcija į tokį impulsą būtų nevienoda vienu ir kitu atvejais: 2000–2007 metų periodui poveikis yra daugiau neutralus, tačiau 2009–2015 metų periodui poveikis yra ryškus ir teigiamas. Remiantis tyrimo re-zultatais prieita prie išvados, kad BVP augimo šaltinis laikotarpyje tarp pirmosios ir antro-sios finansų krizių buvo labiau kiti BVP sudedamieji, pavyzdžiui, investicijos bei vartoji-mas, tačiau po 2008 m, finansų krizės, BVP teigiami pokyčiai labiausiai lemiami prekių ir paslaugų eksporto augimo.
Trečiame disertacijos skyriuje atlikta priežastingumo ryšių tarp BVP ir šalies eksporto analizė, taikant Granger priežastingumo tikrinimo metodiką. Buvo tikrinama eksporto le-miamo augimo svarbos Lietuvos ekonomikai hipotezė. Tyrimas patvirtino, kad eksportas yra Lietuvos augimo trumpalaikėje perspektyvoje šaltinis, dėl to būtų tikslinga šalies ekonominę politiką orientuoti į eksporto skatinimą.
Tyrimas nustatė, kad ryšys tarp BVP ir šalies eksporto yra vienos krypties efektas: būtent eksporto augimas lemia BVP augimą (o ne priešingai). Dėl to, eksportą tikslinga analizuoti atskirai (nuo BVP), ieškant veiksnių, kurie įgalintų jį padidinti ir trumpalaikėje, ir vidutinės trukmės perspektyvoje.
Papildomai nustatyta, kad Lietuvos eksporto poveikis BVP kinta priklausomai nuo analizuojamo laikotarpio trukmės: teigiamas eksporto augimo poveikis yra trumpalaikėje perspektyvoje, vidutinės trukmės laikotarpyje poveikis yra neutralus.
4. Veiksnių, lemiančių eksporto konkurencingumą, vertinimo empirinis tyrimas
Paskutiniame disertacijos skyriuje atliktas atrinktų (pagal siūlomą modelį) penkių veiksnių, lemiančių Lietuvos eksporto konkurencingumą, ekonometrinis modeliavimas bei aprašytas autorės pasiūlytas šalies eksporto konkurencingumo veiksnių vertinimo modelis (S1 pav.). Veiksniai buvo vertinami trumpalaikės ir vidutinės trukmės perspektyvose, atsižvelgiant į:
− eksportuojamų prekių visumą, apibūdinamą pagal skirtingas klasifikavimo sistemas;
− pramonės, kaip pagrindinio šalies eksportuotojo, pagrindinius gamybos veik-snius – darbą, kapitalą ir energiją, bei jų produktyvumo bei panaudojimo rodi-klius.
Ekonometrinis modeliavimas buvo atliktas vadovaujantis parengtais metodiniais principais, kai kiekvienai laiko eilučių sistemai buvo sukonstruotas vektorinės autoregresi-
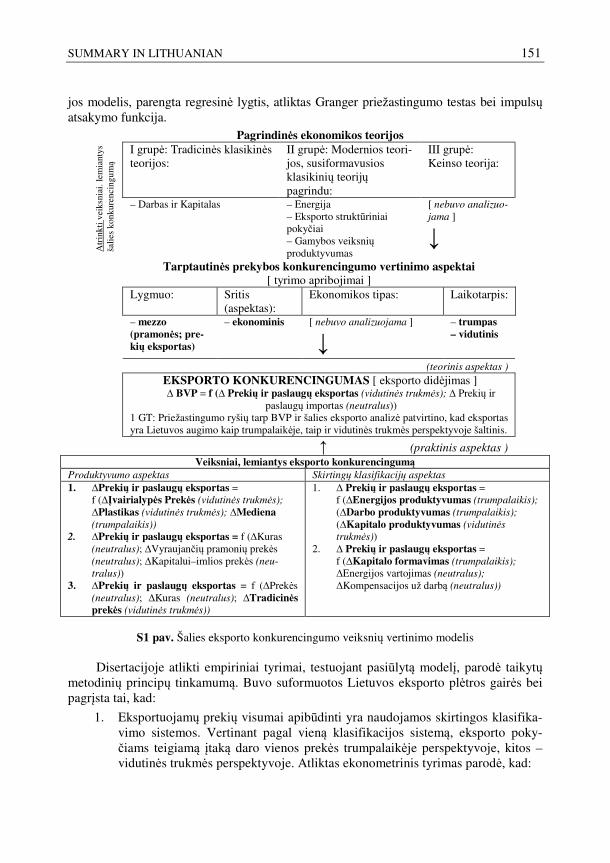
SUMMARY IN LITHUANIAN 151
jos modelis, parengta regresinė lygtis, atliktas Granger priežastingumo testas bei impulsų atsakymo funkcija.
Atr
inkt
i vei
ksni
ai. l
emia
ntys
ša
lies
konk
uren
cing
umą
Pagrindinės ekonomikos teorijos
I grupė: Tradicinės klasikinės teorijos:
II grupė: Modernios teori-jos, susiformavusios klasikinių teorijų pagrindu:
III grupė: Keinso teorija:
– Darbas ir Kapitalas
– Energija – Eksporto struktūriniai pokyčiai – Gamybos veiksnių produktyvumas
[ nebuvo analizuo-
jama ]
↓
Tarptautinės prekybos konkurencingumo vertinimo aspektai
[ tyrimo apribojimai ]
Lygmuo: Sritis
(aspektas): Ekonomikos tipas: Laikotarpis:
– mezzo
(pramonės; pre-
kių eksportas)
– ekonominis [ nebuvo analizuojama ]
↓
– trumpas – vidutinis
(teorinis aspektas )
EKSPORTO KONKURENCINGUMAS [ eksporto didėjimas ] ∆ BVP = f (∆ Prekių ir paslaugų eksportas (vidutinės trukmės); ∆ Prekių ir
paslaugų importas (neutralus)) 1 GT: Priežastingumo ryšių tarp BVP ir šalies eksporto analizė patvirtino, kad eksportas yra Lietuvos augimo kaip trumpalaikėje, taip ir vidutinės trukmės perspektyvoje šaltinis.
↑ (praktinis aspektas ) Veiksniai, lemiantys eksporto konkurencingumą
Produktyvumo aspektas Skirtingų klasifikacijų aspektas 1. ∆Prekių ir paslaugų eksportas =
f (∆Įvairialypės Prekės (vidutinės trukmės); ∆Plastikas (vidutinės trukmės); ∆Mediena (trumpalaikis))
2. ∆Prekių ir paslaugų eksportas = f (∆Kuras (neutralus); ∆Vyraujančių pramonių prekės (neutralus); ∆Kapitalui–imlios prekės (neu-
tralus)) 3. ∆Prekių ir paslaugų eksportas = f (∆Prekės
(neutralus); ∆Kuras (neutralus); ∆Tradicinės prekės (vidutinės trukmės))
1. ∆ Prekių ir paslaugų eksportas = f (∆Energijos produktyvumas (trumpalaikis); (∆Darbo produktyvumas (trumpalaikis); (∆Kapitalo produktyvumas (vidutinės
trukmės)) 2. ∆ Prekių ir paslaugų eksportas =
f (∆Kapitalo formavimas (trumpalaikis);
∆Energijos vartojimas (neutralus); ∆Kompensacijos už darbą (neutralus))
S1 pav. Šalies eksporto konkurencingumo veiksnių vertinimo modelis
Disertacijoje atlikti empiriniai tyrimai, testuojant pasiūlytą modelį, parodė taikytų
metodinių principų tinkamumą. Buvo suformuotos Lietuvos eksporto plėtros gairės bei pagrįsta tai, kad:
1. Eksportuojamų prekių visumai apibūdinti yra naudojamos skirtingos klasifika-vimo sistemos. Vertinant pagal vieną klasifikacijos sistemą, eksporto poky-čiams teigiamą įtaką daro vienos prekės trumpalaikėje perspektyvoje, kitos – vidutinės trukmės perspektyvoje. Atliktas ekonometrinis tyrimas parodė, kad:
152 SUMMARY IN LITHUANIAN
a) Teigiamus Lietuvos eksporto pokyčius trumpalaikėje perspektyvoje labiausiai atspindi eksporto analizė pagal prekių tipo klasifikaciją; ir trumpalaikėje, ir vidutinės trukmės perspektyvoje labiausiai atspindi eksporto analizė pagal sektorinę klasifikaciją. Lietuvos konkuren-cingumo stiprinimas siejamas su „ Įvairialypės prekės “, „Plastiko“ ir „Medienos“ prekių grupių eksporto didinimu (pagal prekių tipo kla-sifikciją). Reikšmingas vaidmuo, siekiant šalies eksporto konku-rencingumo didinimo, atitenka tradicinėms prekėms ir jų eksporto didinimui (pagal sektorinę klasifikaciją).
b) Lietuvos prekių reekporto poveikis viso šalies eksporto pokyčiams neutralus. Nors, Lietuvos prekių reeksportas tiesiogiai daro teigiamą įtaką BVP, tai yra šalies augimui.
2. Analizei atrinkti gamybos veiksniai skirtingai veikia Lietuvos eksporto konkurencingumą trumpalaikėje ir vidutinės trukmės perspektyvoje. Ekonomet-rinis tyrimas patvirtino, jog:
a) Investicijos į kapitalą veikia eksporto pokyčius tik trumpalaikėje perspektyvoje.
b) Kapitalo produktyvumo didinimas veikia eksporto pokyčius tik vidu-tinės trukmės perspektyvoje.
c) Darbo sąnaudų (išmokų darbuotojams) didinimo/mažinimo poveikis eksporto pokyčiams yra neutralus.
d) Darbo produktyvumo didinimas veikia eksporto pokyčius vidutinės trukmės perspektyvoje.
e) Energijos vartojimo didinimo/mažinimo poveikis eksporto poky-čiams yra neutralus.
f) Energijos produktyvumo didinimas silpnai veikia eksporto pokyčius tik vidutinės trukmės perspektyvoje.
Autorės siūlomos gairės traktuojamos ir kaip keliančios aktualius iššūkius eksporto politikos formavimui bei planavimui.
Bendrosios išvados
1. Atlikus sisteminę tarptautinės prekybos konkurencingumo teorijų analizę, pat-virtinta nuostata, kad klasikinėse ir neoklasikinėse teorijose detaliau vertinamas tarptautinės prekybos konkurencingumas. Vadovaujantis teorine apžvalga, siū-lytina vertinti mažų, atviros ekonomikos šalių tarptautinės prekybos konkuren-cingumą, remiantis naujosios prekybos teorijos prielaidomis, kurios vadovauja-si produktyvumo augimo ir skirtingų klasifikacijų taikymo modernia analize.
2. Lietuvos eksporto empirinė ir ekonometrinė analizės parodė, kad eksporto konkurencingumo stiprinimas siejamas su „Įvairialypių prekių“, „Plastiko“ ir „Medienos“ prekių grupių eksporto didinimu (pagal prekių tipo klasifikaciją).
SUMMARY IN LITHUANIAN 153
Reikšmingas vaidmuo, siekiant šalies eksporto konkurencingumo didinimo, atitenka tradicinėms prekėms (pagal eksporto sektorinę kompoziciją) ir jų eks-porto didinimui.
3. Lietuvos pramonės empirinė analizė patvirtino egzistuojantį santykį tarp eks-porto struktūros, pramonės struktūros ir eksporto tarptautinio konkurencingu-mo: technologijomis paremta pramonė yra labiau orientuota į eksportą, nei rin-kodara paremta pramonė, labiau orientuotos į vidinį vartojimą.
4. Eksportas yra Lietuvos augimo trumpalaikėje perspektyvoje šaltinis. Hipotezė dėl eksportu paremtos augimo strategijos taikymo Lietuvos atveju buvo patik-rinta bei patvirtinta.
5. Vadovaujantis atlikto ekonometrinio tyrimo rezultatais bei pasitelkus Lietuvos pavyzdį, trumpalaikėje perspektyvoje, siekiant Lietuvos eksporto konkurencin-gumo augimo, siūloma šalies plėtotės strategiją orientuoti į tradicinių pramonės šakų prekes (labiausiai į medienos ir baldų), tuo pačiu siekiant vieno pagrindi-nio gamybos veiksnio – kapitalo – panaudojimo didinimo.
6. Vadovaujantis atlikto ekonometrinio tyrimo rezultatais bei pasitelkus Lietuvos pavyzdį, vidutinės trukmės perspektyvoje, siekiant Lietuvos eksporto konku-rencingumo augimo, siūloma šalies plėtotės strategiją orientuoti į tradicinių pramonės šakų prekes (labiausiai į plastiko ir baldų), tuo pačiu siekiant trijų pagrindinių gamybos veiksnių – darbo, kapitalo ir energijos – produktyvumo didinimo.

154 SUMMARY IN LITHUANIAN
155
Annexes1
Annex A. Conversion Table “International Trade – Manufacturing” Cre-ated by the Author
Annex B. The Analysis of Lithuanian Export Considered from the Aspect
of Origin Annex C. The Results of the Measurements of Vector Autoregressive
(VAR) models Annex D. The Results of Practical Implementation of the Investigated
Model Annex E. The Co-authors’ Agreements to Present Publications Material in the Doctoral Dissertation Annex F. Copies of Scientific Publications by the Autor on the Topic of
the Dissertation 1The annexes are supplied in the enclosed compact disc
Irina TRAVKINA
THE EVALUATION OF FACTORS HAVING AN IMPACT ON THE LITHUANIAN EXPORT COMPETITIVENESS
Doctoral Dissertation
Social Sciences, Economics (04S)
Irina TRAVKINA
VEIKSNIŲ, LEMIANČIŲ LIETUVOS EKSPORTO KONKURENCINGUMĄ. VERTINIMAS
Daktaro disertacija
Socialiniai mokslai, ekonomika (04S)
2015 11 06. 14,10 sp. l. Tiražas 20 egz. Vilniaus Gedimino technikos universiteto leidykla „Technika“. Saulėtekio al. 11. 10223 Vilnius. http://leidykla.vgtu.lt Spausdino BĮ UAB „Baltijos kopija“ Kareivių g. 13B, 09109 Vilnius
Related Documents


