The evaluation of consumer health information provision in community libraries in Rotherham: a user study A study submitted in partial fulfilment of the requirements of Master of Science in Information Management At THE UNIVERSITY OF SHEFFIELD By PAUL ROSS LEVETT September 2002 1

Welcome message from author
This document is posted to help you gain knowledge. Please leave a comment to let me know what you think about it! Share it to your friends and learn new things together.
Transcript

The evaluation of consumer health information provision
in community libraries in Rotherham: a user study
A study submitted in partial fulfilment of the requirements of
Master of Science in Information Management
At
THE UNIVERSITY OF SHEFFIELD
By
PAUL ROSS LEVETT
September 2002 1
Abstract
This study took place shortly after the implementation of a community health
information pilot project in 4 Rotherham community libraries. Visitors to 3 of the 4
community libraries were surveyed over a 3 week period in June-July 2002. The
questionnaire focused on finding out what sources respondents used to find health
information, what types of health information respondents would like to see stocked in
the library, in what format did respondents prefer to receive information and what
improvements respondents thought should be made. At the same time a second, more
detailed questionnaire was distributed to people who had made health enquiries to
measure how useful was the information provided to them. The results of the Library
Visitor Survey, based on 111 completed questionnaires, identified Doctor/GP as the
most popular information source with 84.8% of respondents. Public Library came 7th
with 65.7%, ahead of the Internet (44.4%) and the NHS Direct helpline (30%). To the
best of the author’s knowledge this represents the first comparison of consumer
preference for using public libraries with other information sources as a source of health
information. The most surprising finding was that more respondents said they would
use a touch screen information kiosk (52.3%) than said they would use a computer
(45.9%) in a library to find health information. 83.8% of the 43 respondents who said
they used the Internet to find health information were in the age range 31-60, leading the
author to conclude that the appeal of the People’s Network for finding health
information may currently be limited mainly to library visitors in that age range. The
second, Health Enquirer Survey, questionnaire suffered from a poor response rate (13
returned) but returned useful qualitative information about the effects of consumer
health information provision.
Abstract word count 290 words
2
Acknowledgements
I should like to thank the Principal Librarian, Rotherham Health Care Library and
Information Service, and the Patient Information Officer, Rotherham Patient Health
Information Service, for inviting me to carry out the evaluation and for providing
financial support to cover the costs of travel and the production of the questionnaires. I
owe a tremendous debt of gratitude to the Patient Information Officer for her role in
publicising my research among staff in the community libraries, for providing vital
statistics about services provided, and for co-ordinating with staff to ensure my research
timetable was met. Without this assistance I could not have carried out my research. I
should like to thank the staff in the three community libraries who made me feel very
welcome, provided much needed tea and biscuits, and participated in the distribution and
collection of questionnaires. My thanks also go to my dissertation tutors, and the
reception staff, in the Department of Information Studies, University of Sheffield, for
their help, patience and advice, and to the staff in the following libraries who helped me
to find information: University of Sheffield Main Library, ScHARR library, St George’s
Library, and the Royal Hallamshire Hospital Health Sciences Library; Sheffield Hallam
University Learning Centre; the Kings Fund library; and the Wellcome Library for the
History and Understanding of Medicine. I would also like to thank the UK Online User
Group (UKOLUG) and the DIALOG Corporation for giving me the UKOLUG ‘Online’
Student Award 2001 so I could attend the Online Information 2001 conference, and I
would like to thank the Arts and Humanities Research Board (AHRB) for giving me a
Postgraduate Vocational Award that paid my tuition fees and provided a maintenance
grant.
Finally I thank my darling Jennifer for her friendship which has helped keep me
sane these past 12 months and for her love which has opened a new chapter in my life.
Paul Ross Levett
St George’s Church, Sheffield
3
Contents
Abstract ..............................................................................................................................2
Acknowledgements ............................................................................................................3
Contents .............................................................................................................................4
List of acronyms used in this dissertation..........................................................................6
List of tables.......................................................................................................................7
List of figures .....................................................................................................................8
Introduction........................................................................................................................9
Chapter 1 Literature Review ............................................................................................13
1.1 The Literature Search.............................................................................................13
1.2 Investigate the health information needs of the general public..............................17
1.3 Establish the role of public libraries in the government’s agenda for public health
......................................................................................................................................23
1.4 Establish how Rotherham libraries are tackling the consumer health information
agenda ..........................................................................................................................30
1.5 Previous studies that have examined the provision of consumer health information
services in libraries.......................................................................................................35
1.6 Form hypotheses about the relationship between various factors and the use of a
public library to find out health information................................................................44
Chapter 2 Methodology and Methods..............................................................................46
2.1 Research Questions ................................................................................................46
2.2 Research Methodology ..........................................................................................46
2.3 Research Methods – Sampling Strategy ................................................................48
2.4 Library Opening Hours ..........................................................................................49
2.5 Sampling Frames....................................................................................................50
2.6 Sample Size Calculation ........................................................................................53
2.7 Statement of Confidence/Reliability ......................................................................54
2.8 Data Collection Issues............................................................................................55
2.9 The second survey – The health enquirer questionnaire........................................55
4

2.10 Limitations of the survey method ........................................................................56
2.11 Obtaining consent from health enquirers to be surveyed.....................................57
2.12 Questionnaire Design ...........................................................................................58
2.13 Statistical Analysis ...............................................................................................60
Chapter 3 Results and Discussion....................................................................................62
3.1 Library Visitor Survey ...........................................................................................62
3.2 Library Visitor Survey Response ...........................................................................66
3.3 Library Visitor Survey Question 1 Results ............................................................70
3.4 Library Visitor Survey Question 2 Results ............................................................75
3.5 Library Visitor Survey Question 4 Results ............................................................79
3.6 Library Visitor Survey Results to Question’s 5 and 3 ...........................................82
3.7 Hypotheses Tested .................................................................................................84
3.8 Health Enquirer Survey Response .........................................................................87
3.9 Health Enquirer Survey Results .............................................................................88
Conclusions......................................................................................................................98
References ......................................................................................................................106
Appendix A – Text of form used to record consent of health enquirers to be surveyed115
Appendix B - Library Visitor Survey Questionnaire Text.............................................116
Appendix C – Health Enquirer Survey Questionnaire Text...........................................118
Appendix D Hypotheses tests - working out..................................................................123
5
List of acronyms used in this dissertation
AMED - Allied and Complementary Medicine Database
BNI - British Nursing Index
BVPI - Best Value Performance Indicators
CHIQ - Centre for Health Information Quality
CIPFA - Chartered Institute of Public Finance and Accountability
CPLS - CIPFA Committee on Public Library Statistics
DCMS - Department of Culture, Media and Sport
df - degrees of freedom
DiTV - Digital interactive Television
GP - General Practitioner
LIC - Library and Information Commission
LISU - Library and Information Statistics Unit, Loughborough University
MHWLG - Library Association Medical, Health and Welfare Libraries Group
N/A - Not Applicable
NeLH - National electronic Library for Health
NHS - National Health Service
NLM - (US) National Library of Medicine
OHE - Office of Health Economics
PCT - Primary Care Trust
PLUS - Public Library User Survey
RMBC - Rotherham Metropolitan Borough Council
UK - United Kingdom
US - United States of America
6
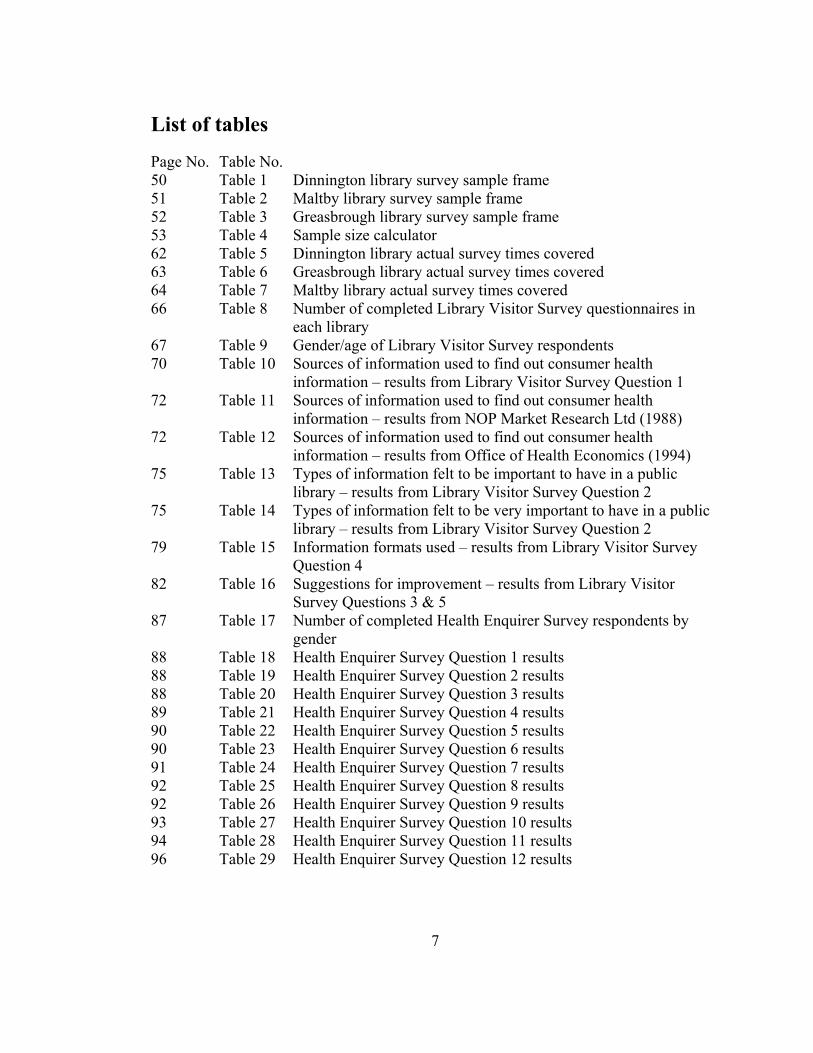
List of tables
Page No. Table No. 50 Table 1 Dinnington library survey sample frame 51 Table 2 Maltby library survey sample frame 52 Table 3 Greasbrough library survey sample frame 53 Table 4 Sample size calculator 62 Table 5 Dinnington library actual survey times covered 63 Table 6 Greasbrough library actual survey times covered 64 Table 7 Maltby library actual survey times covered 66 Table 8 Number of completed Library Visitor Survey questionnaires in
each library 67 Table 9 Gender/age of Library Visitor Survey respondents 70 Table 10 Sources of information used to find out consumer health
information – results from Library Visitor Survey Question 1 72 Table 11 Sources of information used to find out consumer health
information – results from NOP Market Research Ltd (1988) 72 Table 12 Sources of information used to find out consumer health
information – results from Office of Health Economics (1994) 75 Table 13 Types of information felt to be important to have in a public
library – results from Library Visitor Survey Question 2 75 Table 14 Types of information felt to be very important to have in a public
library – results from Library Visitor Survey Question 2 79 Table 15 Information formats used – results from Library Visitor Survey
Question 4 82 Table 16 Suggestions for improvement – results from Library Visitor
Survey Questions 3 & 5 87 Table 17 Number of completed Health Enquirer Survey respondents by
gender 88 Table 18 Health Enquirer Survey Question 1 results 88 Table 19 Health Enquirer Survey Question 2 results 88 Table 20 Health Enquirer Survey Question 3 results 89 Table 21 Health Enquirer Survey Question 4 results 90 Table 22 Health Enquirer Survey Question 5 results 90 Table 23 Health Enquirer Survey Question 6 results 91 Table 24 Health Enquirer Survey Question 7 results 92 Table 25 Health Enquirer Survey Question 8 results 92 Table 26 Health Enquirer Survey Question 9 results 93 Table 27 Health Enquirer Survey Question 10 results 94 Table 28 Health Enquirer Survey Question 11 results 96 Table 29 Health Enquirer Survey Question 12 results
7

List of figures
Page No. Figure No. 66 Figure 1 Relative percentage of completed Library Visitor Surveys from
each library 68 Figure 2 Library Visitor Survey gender of respondents 68 Figure 3 CIPFA PLUS 1997 survey gender of respondents 69 Figure 4 Library Visitor Survey age distribution of respondents 69 Figure 5 CIPFA PLUS 1997 survey age distribution of respondents 70 Figure 6 Sources of information used by respondents to find consumer
health information – results from Library Visitor Survey Question 1
79 Figure 7 Information formats preferred by respondents to obtain health information – results from Library Visitor Survey Question 4
82 Figure 8 Suggestions for improvement - results from Library Visitor Survey Questions 3 & 5
91 Figure 9 Health Enquirer Survey Question 7 results – were staff able to help find useful health information or to supply it later?
8

Introduction
Since the 1970’s health information has been made more available to the public in
response to increasing consumer demand and the changing attitudes of healthcare
professionals and public health priorities of successive UK governments. Public
libraries have played, and continue to play, an important part in the dissemination of
health information to the public through their role as community information centres.
Rotherham Patient Health Information Service (a.k.a. Healthinfo), in partnership
with Rotherham Metropolitan Borough Council (RMBC) Libraries, Museums and Arts
Services have set up a community health information pilot project in Dinnington,
Greasbrough, Maltby and Herringthorpe community libraries. Each library has received
a collection of consumer health information resources and is supported by a full time
Patient Information Officer, based in Healthinfo, and the staff and resources of
Rotherham Health Care Library and Information Service. Both services are based at
Rotherham District General Hospital. At the invitation of the Patient Information
Officer, Healthinfo, and the Principal Librarian, Rotherham Health Care Library and
Information Service, the author, an MSc student in the Department of Information
Studies, University of Sheffield, was asked to evaluate the impact of the pilot project in
three of the four community libraries at Dinnington, Greasbrough and Maltby, by
investigating the awareness and use of consumer health information resources from a
representative sample of users over one week in each of the three libraries. The author
suggested that it might also be useful to obtain information about the effect of health
information provided by Rotherham libraries on people who had made a health enquiry,
and this suggestion was welcomed by the dissertation sponsors.
In order to investigate users the research required a method for getting information
directly from the users. Baker and Lancaster (1991: 370) argued that questionnaires
were an appropriate method for collecting information about people’s “opinions,
9

personal preferences, intentions or recent experiences.” The sponsors felt that this type
of information would help them understand user needs by providing a richer picture than
non-specific measures of ‘satisfaction’ with the resources. Using questionnaires was in
keeping with the limited dissertation time period and resources available to the author to
carry out research, because questionnaires allow information about a user population to
be gathered from a sample of that population in a relatively short space of time (in this
case 3 weeks). The research was carried out using two questionnaires. The first
questionnaire surveyed users of the three community libraries and the second was a
more detailed questionnaire of people who had made health enquiries to measure how
useful the information provided to them had been.
The overall aim of the dissertation is to provide a snapshot of user expectations
and experience of using consumer health information resources in Rotherham
community libraries. During the literature search it became apparent that nobody has
yet attempted to compare public library use with other sources to find out health
information. This was recommended as an area for research by at least one study (Pifalo
et al., 1997: 21), and although use of a health information service and other sources was
measured in another study (Sweetland, 2000), the results were not presented in a
comparative form. It is intended that the results of the research will answer the gaps in
our knowledge about:
• What sources do Rotherham library users say they use to find health information,
and compare the results with other studies that have asked what sources people use
to find out health information;
• What types of health information do Rotherham library users prefer to use in public
libraries and in what format do people prefer to obtain information and analyse how
Rotherham libraries are meeting or could meet this level of provision;
• Identifying improvements to service provision;
• The testing of hypotheses about the relationship between various factors and the use
of a public library to find out health information.
10

The objectives of the dissertation are:
1. To carry out a literature review to examine previous work related to the area of
consumer health information provision to:
a. Investigate the health information needs of the public;
b. Establish the role of library and information services in the government’s
agenda for public health;
c. Establish how Rotherham libraries are tackling the health agenda;
d. Find examples of previous studies that have examined the provision of
consumer health information services in public libraries;
e. Form hypotheses about the relationship between various factors and the use
of a public library to find out health information.
2. To explain the research methodology and methods employed to administer the
questionnaires and collect the data and how limitations in the methodology would
affect the results, and to explain how the data was analysed;
3. To present the research findings about public library users awareness and use of
consumer health information provision in the community libraries at Dinnington,
Greasbrough and Maltby, and about the impact that providing health information has
had on people who make health information enquiries in Rotherham libraries;
4. Discuss how the findings relate to the context in which Rotherham Healthcare
Library & Information Services operate.
The scope of the evaluation includes the collection of questionnaire data from
library users and the measurement of the “use” of resources was based on user
responses. The author did not collect resource circulation or in-house use statistics and
the results do not therefore represent a formal evaluation of the community health
information pilot project against planned performance objectives based on such
measures. The author did not include a specific measure of “satisfaction” with library
services as that information is already collected in Rotherham for Best Value
Performance Indicators (BVPI) published by the Office of the Deputy Prime Minister,
Local Government Directorate.
11
Limitations on the research included:
• The desire of the dissertation sponsors – Rotherham Health Care Library and
Information Service – to obtain useful information about the impact and effects of
the community health information pilot project in Rotherham community libraries;
• The time available to carry out the research in the libraries - one month out of the
three month dissertation period;
• The human resources available to carry out the research. The author would
administer the library user questionnaire. Staff in the community libraries and
Healthinfo distributed the second questionnaire to health enquirers;
• The library user questionnaire was distributed by hand to visitors to each of the three
community libraries over a one week period. This method would necessarily
exclude non-visitors and users of those community libraries who are housebound but
who are served by home visits. It was intended that as the second questionnaire
would survey health enquirers this would include non-visitors who made telephone
enquiries or whose health enquiries were sent to Rotherham Health Care Library and
Information Services via their home visitors.
12
Chapter 1 Literature Review
The research context needed to be established by drawing on previous work
related to the area of consumer health information provision. This was in order to meet
the aims of the literature review to:
a. Investigate the health information needs of the public;
b. Establish the role of library and information services in the government’s
agenda for public health;
c. Establish how Rotherham libraries are tackling the health agenda;
d. Find examples of previous studies that have examined the provision of
consumer health information services in public libraries;
e. Form hypotheses about the relationship between various factors and the use
of a public library to find out health information.
1.1 The Literature Search
The process of finding the relevant literature and establishing the context of health
information in Rotherham public libraries involved planning and carrying out a literature
search of bibliographic databases, journals, Internet sources and library catalogues. The
planning involved writing down key words to search with; selecting time period and
geographical coverage parameters to limit the search; and identifying suitable sources of
information to use. The literature search used the following search terms:
• consumer health information;
• consumer health information library services;
• health information general public needs;
• patient information needs;
• public library survey methods results questions;
• library health collection measure use;
13
• public library users demographics;
• public library users population make up.
The coverage parameters were: to retrieve material from the period 1970-2002; in
the English language; from the UK and the US. Where possible these search parameters
were set within the electronic sources when searching. When looking for previous
studies in this area the author did not distinguish between qualitative and quantitative
research methodologies or make restrictions based on the population or research setting.
The literature search concentrated mainly on published work, however unpublished
work in the form of conference papers was also examined.
The sources of information from which literature was gathered, retrieved and
collected included the following:
The first source I searched was the University of Sheffield, Department of Information
Studies, Publications Database - http://dis.shef.ac.uk/dispub - which lists bibliographic
details of publications by staff and students in the Department since 1963. I searched for
Document Type ‘Dissertations’ with the Title Keywords “health information” to find
examples of student dissertations in the same or a similar subject area.
Conferences - at which notes were taken and papers collected were:
• Online Information 2001, 4-6 December 2001, Olympia Grand Hall, London.
The conference proceedings included a paper relating to research being carried
out by David Nicholas, Paul Huntingdon and Peter Williams of City University
and Barrie Gunter of Sheffield University, into comparisons of new digital
platforms that are used for delivering consumer health information electronically
to the public;
• New Advances in Patient Information, 29 April 2002, Kings Fund, London. A
paper was given by Linda Butler of Birmingham Public Library into a
14
government funded pilot of the National electronic Library for Health (NeLH) in
public libraries;
• Health Libraries Group Conference, 14-17 July 2002, Edinburgh Conference
Centre, Heriot-Watt University, Edinburgh. Clare Nankivell of the University of
Central England gave a presentation on the findings of the evaluation of the pilot
of the NeLH in public libraries. Also Jill Beard of Bournemouth University gave
a paper on the British Library funded HealthInfo4U project in public libraries.
The two projects will be described in the literature review below;
Bibliographic databases - searched that required an ATHENS password from Sheffield
University library to enable access were:
• LISA + INSPEC – electronic access through the University’s WebSPIRS
service;
• Science Citation Index and Social Sciences Citation Index – electronic access
through ISI Web of Science http://wos.mimas.ac.uk;
• Medline – electronic access through the BIOMED web site –
http://biomed.niss.ac.uk;
Journals – from which articles were collected included:
• British Medical Journal - electronic access through the BMJ Publishing website
http://www.bmj.com;
• Bulletin of the Medical Library Association – hard copy;
• Health Libraries Review – both hard copy and electronic access through the
SwetsnetNavigator website http://www.swetsnet.nl;
• Journal of Documentation – hard copy;
• CILIP Update – hard copy,
• Health Information on the Internet – electronic access through the CatchWord
website http://zerlina.bids.ac.uk.
15

Internet sources - searched were:
• Google – http://www.google.com;
• BIOME – http://www.biome.ac.uk.
Government websites – that included useful information were:
• National Statistics – http://www.statistics.gov.uk;
• Department of Health – http://www.doh.gov.uk;
• NHS Information Authority – http://www.nhsia.nhs.uk;
• NHS Direct Online – http://www.nhsdirect.nhs.uk;
• National electronic Library for Health – http://www.nelh.nhs.uk;
• Department of Culture Media and Sports – http://www.dcms.gov.uk;
• Resource – http://www.resource.gov.uk;
• Rotherham Metropolitan Borough Council – http://www.rotherham.gov.uk.
Library catalogues - searched were:
• STAR (Sheffield Universities Union catalogue) – electronic access through the
Sheffield University library website http://www.shef.ac.uk/library;
• British Library Public Catalogue – online at http://blpc.bl.uk;
• Wellcome Library catalogue – online at http://catalogue.wellcome.ac.uk/.
Libraries - in which information was retrieved were:
• University of Sheffield Main Library, ScHARR library, St George’s Library, and
the Royal Hallamshire Hospital Health Sciences Library;
• Sheffield Hallam University Learning Centre at Collegiate Crescent campus;
• Kings Fund library, London;
• Wellcome Library for the History and Understanding of Medicine, London.
16
1.2 Investigate the health information needs of the general public
“Consumer health information” is a generic term currently used by librarians and
information workers to describe health information provided to the general public. Gann
(1995: 60) described increasing consumerism in society as one of the reasons for the
development of consumer health information in that:
“People are no longer content to be told what’s good for them; they want access
to information which enables them to weigh up risks and benefits, and to make
informed choices between options in health care.”
In the UK this mood is reflected in the changing attitude of health professionals
towards patient ‘self-care’ and ‘shared decision making’, and in government moves to
provide increased public access to health information with the aim of ‘empowering’
citizens to play an active role in the management of their health. While the former is the
product of an ongoing debate about the benefits of patient participation in decision
making about certain treatments, the pace of the latter has increased since the change of
government in the UK in 1997. Both points will be discussed further below in the
literature review.
There isn’t one generic type of health information consumer as the term by its very
nature includes everybody. Rees (1994: 2) produced a list of categories including “The
worried well, chronically sick, children, adolescents, elderly, pregnant women,
substance abusers, the mentally ill, and the disabled.” To this list we might add people
diagnosed with an illness, people who speak English as a foreign language, accident
victims and people who are dying and/or in palliative care. All these people rely upon
the support of health professionals and their families and friends for support and care,
therefore health care professionals and carers must be included in any list of health
information consumers as well.
17
In determining the extent to which there is a need for public libraries to provide
health information we should consider the evidence from librarians that the public make
health enquiries in public libraries and from academics of the alarmingly high amount of
information that is forgotten after a consultation with a GP.
In a conference paper about the pilot of the National electronic Library for Health
(NeLH) in public libraries, Butler (2002: 1) described some frequently asked health
questions by users of Birmingham public library: “I’ve just been told I have X and I
want to find out about it” is the most frequently asked health question; Asking about the
side effects of drugs was described as being a key regular enquiry; The checking of
doctors qualifications by members of the public is another popular enquiry; And
questions about new treatments are dealt with by reference to the journal literature. The
actual proportion of health-related enquiries as a percentage of the total number of
enquiries was measured in the United States by the National Library of Medicine during
a survey (Wood et al., 2000) of forty-one public libraries across nine states. Wood et al.
(2000: 318) reported that health information was considered one of the top five or top
ten topics of interest to users and “about two thirds of the libraries estimated that health
requests account for 6% to 20% of their total reference requests.”
Successive studies (NOP Market Research Limited, 1988; Office of Health
Economics, 1994; National Consumer Council, 1998) have demonstrated the importance
of the local GP as a source of information used by the public to find out about health
matters, with the percentage of people who say they use a GP to find out health
information ranging from 48% to 73%. Griffin (1995: 5) investigated the usefulness of
GP’s as a source of health information by carrying out a satisfaction survey of members
of the public and he found that “80 percent of respondents were very or fairly satisfied
with the treatment and/or advice provided by their GP.” However Ley (1988: 32)
described how research carried out in the 1970’s found that GP patients could only recall
between 50% and 68% of the information they had received during their consultation.
These findings could be related to stress and the different ways in which people react to
18
the stress of diagnosis. A study (Baker, 1995) of the effect of stress on the information
seeking behaviour of women with Multiple Sclerosis (MS) looked at the psychological
research by Miller, Leinbach & Brody (1989: 333) who classed patients as ‘Monitors’
who seek information or ‘Blunters’ who “distract themselves from and psychologically
blunt threatening cues.” Baker (1995: 73) found that:
“Monitors want both general and specific information on a variety of topics and
they start gathering it from the time of diagnosis. Blunters, on the other hand,
prefer general information and appear to want it only after having had MS for a
period of time.”
Baker’s research suggests that peoples reaction to the stress of diagnosis could be
a causal factor in the findings reported by Ley about the low level of information recall
by patients at the time of diagnosis. This could also be a causal factor in Butler’s
finding that the most frequently asked health question in Birmingham public library is
from people who have been diagnosed as being ill and who are seeking information
about the illness. This suggests public libraries play an important role as providers of
health information.
The attitude of GP’s towards providing information to patients during consultation
has been shaped by the amount of time they are able to devote to each patient. In the
UK National Health Service, Foster (1999: 319 (7208), 525 #4451) described how “To
cope with demands, patients need to be booked at ten minute intervals at the most.” In
that short amount of time the GP has certain goals including:
• Provide a clear unambiguous honest explanation of what is wrong with the
patient and how they can be treated;
• Obtain compliance from the patient for any treatment they must take if their
condition is to improve;
• In the case of surgery, where possible to obtain “informed consent” from the
patient to operate on them to satisfy medico-legal requirements.
19
This model of advice, compliance and informed consent represents the traditional
GP view of the consultation. The goals of the GP in this model are arguably also
followed by community pharmacists when they counsel people on their prescription
medicine. One such community pharmacist (Stone, 1995: 47) described how:
“Part of my role is to make sure that the patient presenting a prescription or
making a purchase receives the correct product, correctly labelled and packaged,
as promptly as possible, and that they know and understand how to use it.”
However there are alternatives to the model of passive patient compliance in
decisions about their health taken by others. Coulter (2002: 324 (7338), 648-651)
argued that there is a need for health care professionals to give patients “evidence-
based” health information for them to make informed treatment decisions. She
described this as part of a “shift towards shared decision making, in which patients are
encouraged to express their views and participate in making clinical decisions.” The
current favoured approach to enabling effective shared decision making for patients
facing health treatment or cancer screening decisions, as described by O’Connor et al.
(1999: 319 (7212), 731-734), is the development of “decision aids” for patients, which
they defined as:
“Interventions designed to help people make specific and deliberative choices
among options (including the status quo) by providing (at the minimum)
information on the options and outcomes relevant to a patient’s health.”
O’Connor et al. (1999) examined fourteen studies of decision aids and their effect
on patients and found that while some decision aids had no discernible effect, others
increased patient preferences for choosing between alternative treatments, with some
patients declining treatment after finding out the full facts. In her essay on medicines
and the role of patient information leaflets Gibbs (1995) described how, in a study of
patients who had been prescribed an anti-inflammatory drug for arthritis, a small number
of patients had decided to stop taking the drug after they read a leaflet. Gibbs (1995: 28)
concluded from this that “it seemed that they had made a rational choice. The
20

empowered consumer had decided not to take the tablets and we could not fault their
decision.”
The National Consumer Council (1998: 33) carried out research to find out
consumers preferences for 14 different topics for a future government health campaign
and found that “Consumers think all the topics are important…but almost all say heart
disease and stroke (96%) and cancers (95%), both major causes of death in Britain, are
important topics for a government health campaign.” The high popularity ratings for all
14 options suggest the public want more health information for them to make decisions
about managing their health. The government’s Healthy Citizens programme, as
outlined by the Department of Health (1999: 3.28), also encourages moves towards self-
managed care and ensures “people have the knowledge and expertise they need to deal
with illnesses and health problems.” The plan called for: the development of a national
consumer health information service NHS Direct to deliver health information to the
public 24 hours a day 7 days a week by telephone and over the Internet; promoting
public training programmes in first aid and resuscitation techniques; and the creation of
the NHS expert patients programme. The expert patients programme was described by
Browne & Poulter (2002) as “a new government initiative to help people living with
long term conditions maintain their health and improve their quality of life through lay
led self management courses.” Coulter, Entwistle & Gilbert (1999: 318 (7179), 318)
cited a number of studies that demonstrated that patients with hypertension and with
breast cancer had improved their treatment through shared or informed decision making.
In their survey of 62 patients Coulter, Entwistle & Gilbert (1998: ix) identified that
patients need information to:
• “Understand what is wrong
• Gain a realistic idea of prognosis
• Make the most of consultations
• Understand the processes and likely outcomes of possible tests and
treatments
• Assist in self care
21
• Learn about available services and sources of help
• Provide reassurance and help to cope
• Help others understand
• Legitimise seeking help and their concerns
• Learn how to prevent further illness
• Identify further information and self help groups
• Identify the “best” health care providers.”
‘Good quality’ health information must be accurate, reliable, current,
comprehensive, evidence-based, authoritative and relevant/appropriate to the needs of
the individual/patient. As we have discovered above, it may not be possible for a GP to
give all the relevant information during a ten minute consultation. Dunn (2002: 324
(7338), 648-651) argued that “the time taken to reach meaningful decision sharing will
depend very much on the background of patients, their level of intelligence, and the
condition under discussion. In many cases, 10 minutes would allow only an introduction
to the problem.” In addition to the problem of lack of time in GP consultations, Worth,
Tierney & Watson (2000) reported a serious information gap in meeting post-discharge
hospital patient information needs in which the lack of time for hospital doctors and
ward staff to explain how to deal with common postoperative symptoms was the main
problem. Worth, Tierney & Watson (2000: 404) advocate that “the fact that patients are
spending more of their recovery time at home, suggests that greater responsibility for
information provision, especially in the immediate post-discharge period, should now be
assumed by community staff.” The community staff they have in mind are Patient
Advice and Liaison Services staff (PALS), community nurses and GP’s. However, as
we have seen, GP’s don’t have the time to spare which suggests that the burden of
responsibility should rest on the shoulders of PALS and community nurses. This article
points to the need for PALS and community nurses to have access to a high quality
evidence base in the community. The extent to which the public library can help meet
the need for the provision of good quality consumer health information in the
community is considered below.
22
1.3 Establish the role of public libraries in the government’s agenda for
public health
The previous Conservative government Patients Charter (Department of Health,
1991) saw the establishment in each region of a Health Information Service along the
lines of the Wessex “Help for Health” model, and telephone helplines in regional and
district health authorities. Childs (1992: 30) described how the information provided by
the Health Information Services included “waiting times…common diseases, conditions
and treatments, how to complain about NHS services and how to maintain and improve
your health.” Under the new Labour government after 1997, the regional Health
Information Services became the backbone of NHS Direct initially providing help by
telephone then expanding to provide help via the Internet. At the same time the
significance of the Internet revolution was not lost on the post-1997 Labour government
and the idea of digital information mass media came of age as people began talking
about the new ‘information society.’
In its first plan for the National Health Service (Department of Health, 1997) the
new Labour government made a commitment to provide information about health,
illness and best treatment practice to the public through the Internet and other digital
media such as Digital interactive Television (DiTV). The government was acutely
aware that in making this commitment it also needed to provide the means by which the
public could access the information. It commissioned the Library and Information
Commission (LIC) (1997: 1.27) to respond to the opportunities afforded by the Internet
revolution. The resulting report, New library: the people’s network, made specific
mention, in section 1.27, that:
“…content to be delivered will include: a. information on local authority services
– education, health, welfare and social services, planning and leisure, for
example.”
23
The report was enthusiastically adopted by the government as the way to ensure
social inclusion for Internet access and, under the title the “People’s Network”, the
government committed £170 million of public money to spend on the building of an IT
infrastructure to link all Britain’s public libraries to the Internet, on IT training for
library staff, and on the creation of digital content to support ‘lifelong learning’.
Another important government initiative with implications for the future role of
public libraries and the provision of consumer health information was the Department of
Health (1998) information strategy document Information for Health that included
measures for improving public health information including: the further development of
NHS Direct as a national service; the further development of the Centre for Health
Information Quality (CHIQ), to work with health information producers to improve its
quality, accessibility and the evidence base; the introduction of a gateway to health
information on the Internet; and to enable public access to the National electronic
Library for Health (NeLH) which includes content such as medical information
databases, NHS national service frameworks (guidelines for NHS health professionals
for the level of care they are expected to provide), and ‘Virtual Branch Libraries’ on
specific subjects including cancer and heart disease. Significantly section 5.14 dealt
with the question of widening public access to digital information thus (Department of
Health, 1998: 5.14):
“It will be important to ensure that strategies for providing public information on
health and health services take account of the needs of the “information poor”
and those sections of society without access to some of the new media. The
opportunities of the information age must be open to all.”
Government recognition of the need for digital community information centres is
important because it presents public libraries with an opportunity to build on their
existing important community role in providing consumer health information to the
public, including those unable to visit the library in person.. In Health Information in
24

the North: a plan for the future, Childs (1993: 44) described how public libraries
currently provide the following important community services:
• “the collection and provision of community information;
• a large network of branch libraries that provide information points staffed
in the evenings and at weekends;
• mobile libraries to rural areas;
• domiciliary services to individual homes and residential centres;
• patients’ libraries in hospitals etc.”
As we shall discover below RMBC Libraries, Museums and Arts Services provide
many of these facilities, and more, to the citizens of Rotherham. Public libraries and
librarians clearly have an important role to play in providing consumer health
information to the public and need to expand their role to act as gatekeeper to health
information on the Internet. Below we shall consider the barriers public libraries face
when carrying out these roles:
The Library and Information Statistics Unit (LISU) (2001) have published figures
showing that 58% of the UK population (34,508,000 people) are registered borrowers of
public libraries and that there were 330,634,000 visits in one year (1999-2000). No
statistic was produced showing the proportion of those visits which were made for the
purposes of finding health information. Marcella & Baxter (In: Bohme & Spiller, 1999:
232) found, in a questionnaire survey of 1,294 people, that Health was the 6th most
commonly sought type of citizenship information. Data produced by Public Lending
Right (in: Bohme & Spiller, 1999: 24) shows that as a proportion of public library book
loans, Health is the 10th largest category at 1.9% of loans (10 million) made in 1996/9.
Other sources of health information where usage has been measured include GP
surgeries, Pharmacists, the NHS Direct national helpline, the NHS Direct Online
website, Touch screen health information kiosks and the Living Health Digital
interactive Television (DiTV) channel. The Office for National Statistics (2001)
reported that in 1998-99 there were 255.3 million consultations with GP’s in Great
25
Britain (Office for National Statistics, 2001: 198) and that during 2000-01 the NHS
Direct helpline handled 3.42 million calls (Office for National Statistics, 2001: 196).
Stone (1995: 47) reported that over 1 million prescriptions are dispensed from
community pharmacies every day (365 million p.a.). Meanwhile Nicolas et al. (2001:
152) estimated that the NHS Direct Online website receives 1,400 visits per day
(511,000 p.a.), that the network of 78 or so touch sensitive health information kiosks, set
up in various locations around the country by the company ‘In Touch with Health’,
receive approximately 865 visits per day (315,725 p.a.) and that the 33,000 Telewest
cable television subscribers who can receive the Living Health DiTV channel are
making approximately 400 visits per day (146,000 p.a.).
Bohme & Spiller (1999) reported the findings of a study of six library user groups
including teenagers, school leavers, families, lifelong learners and adults engaged in
study, to find out the public’s perception of the role libraries play. Bohme & Spiller
(1999: 118) found that the library was “perceived to be a keystone in each local
community” and that users also reported the benefits of the library as:
• “a source of information
• expert staff to help you
• a place to study in peace and quiet ‘without distractions’
• a free service – a ‘safety net’ for all”
Despite this evidence of the high value the public feel they get from their libraries,
the latest evaluation of UK public libraries by the Audit Commission (2002: 1) found
that “since 1992/93 visits have fallen by 17 per cent and loans by almost one
quarter…twenty-three per cent fewer people are using libraries for borrowing than just
three years ago.” The report linked falling attendances with reduced spending on
bookstock, reduced opening hours, lack of awareness of the services available in
libraries, and increasing competition from high street and Internet book shops that offer
a more relaxed atmosphere and/or more convenience.
26

The first barrier that public libraries face in carrying out the role of providing
consumer health information to the public and acting as a gatekeeper to health
information on the Internet is that to be seen as a viable alternative to other sources of
health information it should be considered that competition with those other sources of
health information is a fact. It is therefore important to find out what the public think of
using libraries compared with using other health information sources and so this was
measured in my research (see chapter’s 2 and 3).
A second barrier to public libraries is the need to provide the public with
Information Technology and Information Literacy skills training to enable Internet users
to retrieve good quality health information that is accurate, reliable, current,
comprehensive, evidence-based, authoritative and relevant/appropriate. In a recent
study of the Internet information seeking behaviour of health consumers Eysenbach &
Köhler (2002: 324 (7337), 573) found little evidence that users checked the authenticity
of the source of information, used appraisal checklists, or evaluative strategies when
conducting a search on the Internet. Furthermore Eysenbach & Köhler (2002: 324
(7337), 573) found that “very few internet users later remember from which websites
they retrieved information or who stood behind the sites.” This suggests that despite the
value of the Internet as an information medium, it’s usefulness as a source of health
information is still limited by our need for direction and our capacity to forget. This
evidence supports the government’s decisions to fund IT training for public librarians
and to provide printers as part of the People’s Network infrastructure, but significantly it
also points to the need to give public librarians training in all sources of good health
information, both digital and hard copy. Only with this knowledge can public librarians
competently fulfil their crucial reference service function in this area, which the
evidence from Bohme & Spiller and Eysenbach & Köhler’s studies suggest the public
want and need.
27

The results discussed above suggest a third barrier: Is the Internet the right
medium for accessing health information in public libraries? The 2001 CIPFA annual
library survey results for Rotherham (RMBC, 2001: 94) show book borrowing is still the
number 1 reason for using a public library with 77% of respondents giving it as the
reason they had visited the library. An important recent project (de Vekey & Beard,
2002), funded by the British Library, piloted a website that allowed free access in five
public libraries to an Internet database with content drawn from the British Nursing
Index (BNI) and the Allied and Complementary Medicine Database (AMED). In the
evaluation of the project the researchers found that the percentage of available full text
articles, that were sought, was only 6% because publishers with content indexed in the
database only had a small percentage of their content available online. The remaining
94% of the articles had to be delivered later by post. The results of the project
evaluation showed that for the service to work required a hybrid access model of 80%
hard copy document supply to 20% full-text download, with associated cost implications
for the long-term sustainability of the service. In addition, recent research by City
University (Nicholas et al., 2002: 33) has revealed that there are different ages for users
of different digital platforms on which health information can be found/delivered/read.
The research found that DiTV users tend to be older (one third were over 55); health
website users are typically 35-54; Touch screen kiosk users are largely under 35; while
teenagers are most likely to want to use their mobile phone. This has implications for
public libraries not so much in terms of what digital platforms public libraries should be
providing content for, but rather it is significant in that it suggests that the appeal of the
People’s Network for finding health information on the Internet may be limited to a
particular age/social demographic minority of the population. If it could be shown that
age is a determinant of use of the Internet to find health information in Rotherham
community libraries the evidence would support this finding. Therefore this became a
research question to be investigated for this dissertation (see section 1.5, Hypothesis
No.3 below). A related issue to this barrier is the need for public libraries to comply
with the provisions of the Disability Discrimination Act 1995 which, the Disability
Rights Commission (2002: 2) have explained, obliges public service providers to make
28

“reasonable adjustments to physical features on premises to overcome barriers to
access.” Physical Features are not defined but might include PC’s, and “reasonable
adjustments” requires making service provision not just accessible but also useable to
the disabled. For public libraries this might affect the type of hardware/software that
needs to be bought in future, for example the provision of at least one large screen PC
monitor or the provision of headphones and talking web page software in each library,
and the provision of web browsers with the ability to enlarge screen font size to assist
the visually impaired.
A fourth barrier to overcome: Is the public library an appropriate place for
consulting about health information on the Internet? Public access computers in
libraries are often sited together in a shared space. This raises a problem of how to
enable the user to access health information while maintaining their confidentiality.
Solutions are either to put one or more PC’s in a separate room or to screen off one or
more PC’s. A further complication is the need to make the local authority’s policy on
Internet use clear to library Internet users. Booth & Walton (2000: 160) warned of the
limitations that installing filtering software on library Internet PC’s would have for
research on gynaecological materials for instance. Lastly, Barclay & Halsted (2001:
130) have discussed how people may ask inappropriate questions of a librarian – seeking
health advice rather than simply health information – and they recommended that for
example:
“If someone calls asking for side effects of a particular drug, the librarian must
read exactly from the source such as the Physician’s Desk Reference and not
offer any advice based on personal experience. The librarian may act as an
information provider but never as a health care provider.”
Given these constraints on public librarians scope for providing health information
it would be interesting to find out if people who had made a health enquiry in Healthinfo
or Rotherham community libraries felt the librarian was able to provide information
29

which was useful to them. This became a research question to be investigated for this
dissertation.
1.4 Establish how Rotherham libraries are tackling the consumer
health information agenda
The population of Rotherham, according to Rotherham Health Authority (in:
RMBC, 2001: 14), is 255,424, and they are served by a network of 15 community
libraries and four mobile library service points. Library services to hospital staff and
patients are provided by Rotherham Health Care Library and Information Service
operating from the Libraries Suite of Rotherham District General Hospital. Their draft
Mission statement (Bratton, 2002a) says that the service aims “To support Rotherham’s
health care professionals in delivering high quality health services to support local
people.” RMBC (2001: 58) describe the service as “one of the busiest of its type in the
Trent NHS Region, providing electronic, journal and book information and specialist
support for the local Gastroenterology Research Department.” The service has provided
invaluable support to patients, their carers and their relatives, and continues to field
consumer health enquiries passed on from the community libraries. The service
recognised the need to develop this area of its activities and in 2001, in co-operation
with Rotherham Health Community and Rotherham District General Hospital, it
established the Rotherham Patient Health Information Service (a.k.a. Healthinfo) on the
hospital’s main concourse staffed by a full time Patient Information Officer and trained
volunteers. To signify the priorities of the new service, Healthinfo’s draft mission
statement (Bratton, 2002a) says that Healthinfo aims “To be a gateway to up to date,
quality health information resources in appropriate and easily understandable formats,
accessible throughout Rotherham.” In the first four months of 2002, Healthinfo
reportedly (Bratton, 2002b) dealt with 122 enquiries, and 20 of those enquiries had been
sent in via Rotherham community libraries. According to the figures published in Ryder
(2002: 53) the proportion of books in the Libraries Suite that are consumer health
information is 3,000 books out of a bookstock of 16,000, which is 18%. This compares
30
favourably with figures published by the NHS Regional Librarians Group (2000: 15)
that show the national average proportion of hospital library collections that is consumer
health information is 14%. However, in her SWOT analysis of the Healthinfo service,
Bratton (2002a) pointed out that two weaknesses are that in the hospital library the
consumer health information collection is in need of revision and consolidation. Also
with the Healthinfo service point located upstairs on the main concourse but the
bookstock being located in the Libraries Suite downstairs this means that consumer
health information is spread over two locations on different floors of the hospital which
is inefficient. A review of space utilisation at the District General Hospital is in progress
at the time of writing and the objective of Rotherham Patient Health Information Service
is for the consumer health collection in the hospital library to be relocated in a new
shared facility on the main concourse with Healthinfo.
For the community health information pilot project, in Dinnington, Greasbrough,
Maltby and Herringthorpe community libraries, each library received a collection of
consumer health information resources. For each library this included up to 300 new
books; 3 sets of leaflets dealing with all aspects of cancer treatment and care, produced
by CancerBACUP; books/booklets produced by other national support organisations
including the Alzheimer’s Society and Age Concern; a set of the popular Family Doctor
series of booklets produced by the British Medical Association; and a set of the Videos
for Patients series produced by Videos for Patients Limited. Some of the libraries are
also sent the Which Health and NHS Magazine serials. The new books have been
particularly welcomed by the staff in the libraries. RMBC (2001: 89) reported the time
it takes to restock the entire lending stock is 6.7 years. If we divide the bookstock
(figures provided by Bratton, 2002c) for each of the three libraries by 6.7 years we can
estimate the annual bookstock on shelf replacement for each library and work out what
the 300 new consumer health information books represents as a proportion of the 2002
on shelf replacement. The working out is as follows:
31
Total bookstock as Bookstock on Estimated 2002 on shelf
at 8 April 2002 shelves at 8 April 2002 replacement bookstock
Greasbrough: 14,944 N/A 14,944 / 6.7 = 2,230
Maltby: 28,434 20,865 20,865 / 6.7 = 3,114
Dinnington: 28,828 20,356 20,356 / 6.7 = 3,038
Percentage of estimated 2002 on shelf replacement bookstock provided by the books
bought for the community health information pilot project:
Greasbrough: 300 / 2,230 X 100 = 13%
Maltby: 300 / 3,114 X 100 = 9.6%
Dinnington: 300 / 3,038 X 100 = 9.9%
As mentioned above, the National Library of Medicine (Wood et al., 2000)
reported that health information was considered one of the top five or top ten topics of
interest to public library users, and the 2001 CIPFA annual library survey results for
Rotherham (RMBC, 2001: 94) show book borrowing as the number 1 reason for using a
public library. We might therefore infer from the above figures that the community
health information pilot project bought about the right amount of books for each library
as a proportion of its 2002 book replacement budget to meet potential on shelf demand
for new books about consumer health information. The author would like to point out
that without the measurement of the use of health books as a proportion of total
circulation, based on actual book circulation figures for those libraries, it is not possible
for the author to make a formal recommendation that 10% of the annual book
replacement budget should be spent on buying consumer health information books. The
author recommends such measurement be carried out to support future book budgeting
decision making.
32
Books bought for the community health information pilot project were selected by
the Principal Librarian and the Patient Health Information Officer to cover topics that
are popular in the Patient’s Library and on the theme of good health. The Patient Health
Information Officer is currently working on a stock buying policy for Rotherham public
libraries in which the public libraries will purchase books on good health whereas books
on illnesses and treatments will continue to be bought by Rotherham Health Care
Library and Information Service at the District General Hospital. An interesting
development for this policy will be the inclusion of public participation in the selection
process, with the involvement of the “Friends of (name of) Library” groups that have
been established in recent years. This is an excellent idea given these groups track
record of encouraging community participation in local decision making. Two recent
public surveys were organised by library support groups, The Friends of Dinnington
Library and Thurcroft Library Matters. RMBC (2001: 93) reported that:
“While primarily to help establish local levels of satisfaction and areas for
development, the value of the Dinnington survey in demonstrating the strong
level of community support for the re-location of Dinnington Library cannot be
overstated.”
Rotherham community libraries provide a variety of services to users who are not
able to reach the libraries. In the Borough as a whole there are around 300 housebound
readers, who are served in their own homes by personal visits once a month from local
library staff. People in sheltered accommodation and nursing homes are served by the
Bookability mobile library vehicle based at Rotherham District General Hospital, and
RMBC (2001: 45) reported that the staff had created health and information packs for
wardens of sheltered accommodation and nursing homes in response to demand for such
information. People in sheltered accommodation and nursing homes are kept informed
of library services by a magazine sent three times a year, which includes advertisements
for the Healthinfo service. Health enquiries from people who are unable to visit the
library are forwarded by the librarians serving them to the Rotherham Health Care
33

Library and Information Service. Three mobile libraries based at Maltby Library serve
the areas not covered by static library sites.
The author observed that all three libraries were connected to the People’s network
to varying degrees reflecting the size of the user population. For instance Greasbrough
library currently has one Internet PC, equipped with a CD-ROM drive and a printer,
whereas Dinnington has 18 PC’s 2 scanners 2 printers and a photocopier. The number
of Internet accessible PC’s at Greasbrough library will increase as funding permits.
Significantly, provision of guidance to public library Internet users in how to locate
quality health sources is one of the development aims of Rotherham Health Care Library
and Information Service, in partnership with Rotherham General Hospitals Trust.
Reportedly (RMBC, 2001: 148) the aim is to “Create a package of health information
digital content for network delivery.” The librarians in the libraries visited have
welcomed the training they received, and the list of good quality health websites,
provided by the Patient Information Officer. Later in an interview with the Patient
Information Officer she said she had showed library staff a small selection of key sites
including NHS Direct Online, OMNI, NeLH, SurgeryDoor, and PatientUK. Staff are
provided with a handout for sites on specific topics, and a disk containing the URL’s of
these sites so they can print them out and give them to people who want to use it at
home.
Rotherham Primary Care Trust (PCT) are currently working on their own patient
information strategy with their Health Promotion unit. The Trust provides a Health
Advice Centre based in Rotherham town centre that does not provide diagnosis or give
medical advice or counselling but that does supply information on local health services,
local self-help and support groups, hospital waiting times, checking doctors’
qualifications and health improvement information. The Trust is currently evaluating
the service they provide and as part of the strategy development Rotherham Health Care
Library and Information Service are, at the time of writing, seeking the support of the
PCT in a funding bid for a full time community health project worker, based in the
34

Patient Health Information Service, who can support and develop the health information
project in the community libraries.
1.5 Previous studies that have examined the provision of consumer
health information services in libraries
The author appraised five studies that have looked at the provision of consumer
health information in libraries, using criteria derived from a seminar handout provided
by Booth (2002), to evaluate whether the studies were: a close representation of the truth
(valid); credible and repeatable (reliable); and provided results that would help form
research questions (applicable).
Study 1 - Pifalo et al. (1997) carried out a study into the impact and value of
information provided by the Delaware Academy of Medicine’s Consumer Health
Library.
Validity
• Is there a direct comparison between the research and similar studies?
The research topic was influenced by the relative lack of studies dealing with this
subject, and the decision to carry out an evaluation of the impact and value of
information was influenced by two previous studies that had measured the effect of
library supplied information on the clinical decision making of health professionals.
• Has the data collection instrument been used in previous user studies?
The questionnaire was designed for the study and included questions about whether
the anxiety level of the user had been increased or reduced based on the
recommendation of a previous study.
35
• What type/size of sample was it? Did participants reflect the user population?
A letter of invitation to participate in the study was sent to people who had received
information through the post. The 270 people who responded were sent the
questionnaire. The survey was thus not based on a randomly selected sample and the
effects of information provided were self reported. Visitors to the Consumer Health
Library were excluded as name and address data were not kept. The authors found
that certain gender/age groups were over-represented than would be expected in
comparison with census statistics.
Reliability
• Was the questionnaire included in the report?
Yes.
• What was the response rate? Were non-users included?
234 completed questionnaires were returned – a response rate of 86.7%. Non-users
were excluded from the survey although the authors recommended that other
approaches to exploring impact and value should be considered such as giving
randomly selected users a topic with which to request information.
• Would it be possible to repeat the study from the information given?
Yes.
• Did the authors base their conclusions on the data?
Yes. Discussion was led by the results of the survey, and conclusions took the form
of inferences suggested by the results.
Applicability
• Would I use the same methodology and methods in my study?
The value of conducting a user survey was demonstrated by the high response rate.
However the postal distribution method used in this study required the authors to
36

wait for the results of the preliminary mailing before they could distribute the survey
proper thus extending the time period required, and doubling the postal expense, to
carry out the research. The survey recommendations that an additional impact
option should be added to ask whether the respondent had shared the information
with someone else, and that the use of libraries as health information providers
should be compared with other sources of information, were both accepted by the
author and taken into consideration when designing this research.
Study 2 - Sweetland (2000) carried out a study of six users of the Health Facts consumer
health information service at Frenchay hospital Bristol.
Validity
• Is there a direct comparison between the research and similar studies?
Yes. The study examined in details the themes of the cognitive, affective and
behavioural effects of information provision that emerged from a previous
questionnaire survey of the same service point.
• Has the data collection instrument been used in previous user studies?
No. A semi-structured interview schedule was devised for the study and piloted on
two users.
• What type/size of sample was it? Did participants reflect the user population?
The sample was of six consecutive users of the service, who had requested
information by telephone or in person and who needed a substantial amount of health
information. All were female.
Reliability
• Was the questionnaire included in the report?
Yes. Each question asked was listed in the report.
37
• What was the response rate? Were non-users included?
The study did not report if anybody turned down an interview.
• Would it be possible to repeat the study from the information given?
Yes.
• Did the authors base their conclusions on the data?
Yes. Results were listed under each question. Discussion related the findings to
previous studies. Emerging themes were identified and the methods used were
evaluated.
Applicability
• Would I use the same methodology and methods in my study?
No. Each interview lasted up to one hour, taking place three weeks after the initial
enquiry. The small sample size allowed in-depth questioning but it was made clear
this study was to complement – not replace – the findings of the previous
questionnaire survey. Several of the questions used in the interview schedule were
used in my questionnaires and these are listed below in the section on questionnaire
design in chapter 2. A recommendation of the study was to compare people’s
impressions of using NHS Direct with other sources, and this formed the basis of one
of the questions used in my 2nd questionnaire, again this is explained in the section
on questionnaire design in chapter 2.
Study 3 - The National Library of Medicine carried out a study (Wood et al., 2000) of
the role of US public libraries in meeting consumer health information needs.
38
Validity
• Is there a direct comparison between the research and similar studies?
The research formed the evaluation part of a major US National Library of Medicine
(NLM) pilot study of the use of NLM databases (PubMed, Internet Grateful Med and
MEDLINEplus) in American public libraries. A formal evaluation framework was
designed as part of the project, putting into effect a recommendation that the NLM
develop expertise in evaluation methodology and that evaluation should be an
integral part of NLM research.
• Has the data collection instrument been used in previous user studies?
No, the evaluation framework was custom designed for the study. Usage of NLM
databases from Internet PC’s at those sites was measured. Errors in some of the IP
addresses were identified and attempts were made to rectify the IP address
recognition to enable user sessions to be monitored. The findings were
supplemented with the results of interview of library staff at the participating sites.
• What type/size of sample was it? Did participants reflect the user population?
Three Regional Medical Libraries, eight Resource Libraries, and forty one public
libraries or library systems from nine States plus the District of Columbia were
selected.
Reliability
• Was the questionnaire included in the report?
N/A. No interview schedule was published either.
• What was the response rate? Were non-users included?
NLM was successfully able to monitor thirty of the public libraries or library
systems, representing one hundred and sixty one library sites.
39

• Would it be possible to repeat the study from the information given?
No.
• Did the authors base their conclusions on the data?
Yes. The study reported that MEDLINEplus usage from the 161 library sites
monitored accounted for about 400 HTML page downloads per week during the
month long project period (September 1999) and actual usage varied between sites.
Factors that were said by Wood et al. (2002: 320) to account for the variances
included the:
“Relative diffusion of resources and effort in large library systems with many
branches. Other factors at play included the level of librarian interest at each
location, the degree of management support, the experience with health
information, and the demographic variables such as population and education”
Interesting findings about the percentage of reference enquiries that were consumer
health information, the quality of librarian and user training, and the impact of
promotional activities could be used for comparison with my research.
Applicability
• Would I use the same methodology and methods in my study?
N/A outside the scope of the project itself.
Study 4 - Beard & Madge (2002) have evaluated “Healthinfo4U,” a British Library
Concord Project that looked into ways to enhance public access to quality-assured
healthcare journal literature in UK public libraries.
Validity
• Is there a direct comparison between the research and similar studies?
Yes. The research was sponsored by the British Library’s “Concord” programme to
work with public libraries to widen access to collections and support lifelong
40
learning. The research hypotheses were formed after a consideration of the barriers
to decision making that were suggested in a previous study.
• Has the data collection instrument been used in previous user studies?
Not known from the article.
• What type/size of sample was it? Did participants reflect the user population?
Not possible to tell if the sample was self selected. No figures were given for the
gender/age/ethnic composition of the sample – just remarks that they represented a
‘good’ balance of diversity.
Reliability
• Was the questionnaire included in the report?
No. But the themes covered in the questionnaire were listed.
• What was the response rate? Were non-users included?
Eighty three questionnaires were returned, an unspecified number of focus groups
were held, and the results of telephone feedback were included.
• Would it be possible to repeat the study from the information given?
No.
• Did the authors base their conclusions on the data?
Yes. The results were presented in bar/pie chart form and as descriptive statistics.
Areas for further evaluation were cited.
41
Applicability
• Would I use the same methodology and methods in my study?
N/A. The two hypotheses tested were interesting and the outcome of a formal
evaluation of the project would be worth noting. Early results showing the
proportion of information that was provided in hard copy as opposed to the
proportion that was supplied in full text format was interesting.
Study 5 - Nankivell & McNicol (2002) and Butler (2002) have delivered evaluations of
the pilot project to deliver the National electronic Library for Health (NeLH) in UK
public libraries.
Validity
• Is there a direct comparison between the research and similar studies?
The impetus for the project came from the increasing demand for public access to
health information and the development of the NeLH as a tool for supporting health
professionals’ access to information.
• Has the data collection instrument been used in previous user studies?
No. An evaluation methodology was custom designed for the project to include: a
literature search; monitoring of web logs; conducting an online user survey; staff
diaries; staff focus group and evaluation questionnaire.
• What type/size of sample was it? Did participants reflect the user population?
The project was run in two public libraries in Birmingham and three public libraries
in Hampshire. The trial period was six months. Web logs were anonymous but the
session login asked users to identify their age, gender and other demographic
information. The formal published evaluation should contain this information.
42

Reliability
• Was the questionnaire included in the report?
No.
• What was the response rate? Were non-users included?
The number of users was not reported in either Nankivell & McNicol (2002) or
Butler (2002). The initial findings reported a low level of use and suggested that
siting of the NeLH dedicated PC’s and promotion of the existence of the service
were contributory factors.
• Would it be possible to repeat the study from the information given?
No.
• Did the authors base their conclusions on the data?
Yes. The initial findings also reported it was not very easy for the general public to
find what they want; most users needed help to navigate the site, which took up a
large amount of staff time; the site used academic language and too many medical
terms; however the evaluation also reported a high level of user satisfaction with the
information retrieved from the site and a site user success rate of over 50% for
finding what they wanted. Butler (2002: 3) reported that the project showed that the
value of the promotion of the NeLH in public libraries was that it was:
“Useful for community based health professionals who don’t have access to the
Internet at their workplace or for those people who wish to find detailed
scientific information.”
Applicability
• Would I use the same methodology and methods in my study?
N/A outside the scope of the project itself.
43
1.6 Form hypotheses about the relationship between various factors
and the use of a public library to find out health information
Nicholas et al.’s (2002) finding that there are different age audiences for different
digital platforms on which health information can be found/delivered/read, suggests that
demographic differences of age and gender may account for preference of use of a
public library and the use of the Internet to find health information. To ascertain if this
is the case, the author formulated hypotheses 1, 2 & 3 (described below) to test on the
data returned from the library user questionnaire.
As part of the National Library of Medicine (NLM) study (Wood et al., 2000)
training was given to public librarians in how to use the NLM databases. Wood et al.
(2000: 318) remarked that “for some, this session was their first training in health
information” and that “librarians appreciated the opportunity to learn more about health
information.” At the same time it was reported that “patron training varied widely and
was, for the most part, one-on-one.” Butler’s finding (Butler, 2002) that users of the
NeLH in UK (Birmingham) public libraries needed help to navigate the site, together
with the findings of the NLM study suggest that public library staff should be given
training in the location and use of sources of consumer health information on the
Internet to enable them to provide one-on-one tuition for library users. To ascertain if
this is a legitimate training need for staff in Rotherham public libraries, the author
formulated hypotheses 4 & 5 (described below) to test on the data returned from the
library user questionnaire.
Hypotheses:
1. There is no statistically significant probability that there is an association (p
<.05) between gender of respondents and the use of a public library to find out
health information.
44

2. There is no statistically significant probability that there is an association (p
<.05) between age of respondents and the use of a public library to find out
health information.
3. There is no statistically significant probability that there is an association (p
<.05) between age of respondents and the use of the Internet in a public library to
find out health information.
4. There is no statistically significant probability that there is an association (p
<.05) between use of a public library to find out health information and the use
of a computer in the library.
5. There is no statistically significant probability that there is an association (p
<.05) between use of a public library to find out health information and the use
of a librarian.
45
Chapter 2 Methodology and Methods
The purpose of this chapter is to explain the strengths and weaknesses of the
research strategy, design and methods chosen to collect and analyse data to answer the
research questions below and the hypotheses that were described at the end of the
previous chapter. It is as well to begin with a recap of the research questions that my
research aimed to answer:
2.1 Research Questions
• What sources do Rotherham library users say they use to find health information?
• What types of health information do Rotherham library users prefer to use in public
libraries and in what format do people prefer to obtain information?
• Are there any improvements to service provision that users can identify?
• What are the effects of health information provided by Rotherham libraries on
people who have made a health enquiry?
• Is age a determinant of Internet use in Rotherham community libraries to find out
health information?
• Are people who use public libraries to find out health information likely to have used
a computer and made use of the help of a librarian?
• Do people who make health enquiries in Healthinfo or Rotherham community
libraries feel the librarians are able to provide them with useful information?
• How do people’s impressions about using NHS Direct compare with using the
Internet and using their library/Healthinfo?
2.2 Research Methodology
The author set out to answer the above questions by producing evidence from two
questionnaire surveys. The first was designed as a “library visitor survey” of the visitors
to the three Rotherham community libraries in which the community health information
46
project was being piloted. The second was designed as a “health enquirer survey” of
people who had made a health enquiry in Rotherham libraries/Healthinfo service. The
decision to conduct a user evaluation survey was made at the request of the staff of
Rotherham Health Care Library and Information Service. The questionnaire survey
method was used for previous evaluation studies of the effects of consumer health
information provision: on the users of the Ontario Consumer Health Information Service
(Marshall, 1995); on users of Delaware Academy of Medicine’s Consumer Health
Library (Pifalo et al., 1997); and on the users of Sheffield Healthline, the South
Yorkshire regional precursor to the NHS Direct national telephone helpline (Bexon,
1998). These studies demonstrated that, using the questionnaire survey method, data
could be collected that would represent information use from and experience of a large
and representative sample of the user population, meeting the requirements of the
dissertation sponsors. Using questionnaires would also enable different users to be
surveyed at the three different geographical locations at different times but using an
identical data collection instrument, promoting objectivity in the data collection stage.
That a sampling strategy was used, as explained below, would show the survey could be
repeated by future researchers who may want to compare their results with the results of
this research. The sampling strategy followed also ensured the library visitor survey was
carried out at times to ensure proper coverage of visitors to the three service points. The
two questionnaires for this dissertation were designed to capture a mix of quantitative
and qualitative data. MORI Social Research Institute (2002: 1) described the advantage
of using quantitative data is that it allows “conclusions to be drawn about either the
extent to which something is happening or percentages of people who have certain
attitudes and opinions.” Quantitative data will not explain why something is happening
hence the decision to produce questionnaires containing a combination of multiple
choice questions that would allow preference between a small number of well defined
variables to be measured and open-ended questions that would allow respondents to
answer in their own words so they could represent their opinion truthfully. This idea
was suggested in the survey guidelines of the American Association of Museums (1990:
24).
47
2.3 Research Methods – Sampling Strategy
The aim of the sampling strategies for the two surveys was to collect data in a way
that was objective, reliable and valid. The degree to which these three conditions were
met would determine the extent to which the results of the surveys can be claimed to be
generalisable to the wider library user population of the three Rotherham community
libraries.
The library visitor survey was to be carried out in the public libraries at
Greasbrough, Dinnington and Maltby. To ensure data was in fact collected from a
representative sample of the library visitor population, the author needed to draw up
sampling frames for the three libraries to help ensure library visitors during the survey
period would stand an equal chance of being selected to participate. The Chartered
Institute for Public Finance and Accountancy (CIPFA) conduct the UK’s national public
library survey process. CIPFA’s Committee on Public Library Statistics (CPLS) has
developed a methodology for the undertaking of user surveys in public libraries. The
CPLS (1995:13) recommend the use of a standard timetable to define the times when
visitors should be included in the survey. The idea is that the opening hours for the
library are superimposed on the timetable and the survey should be carried out during
those hours. The key to solving the issue of coverage was to ensure that each opening
hour of the day that the library opening hours covered during one week would be
surveyed. Irving & Smith (1998: 47) suggested that between 50 and 100 completed
surveys represents the smallest survey size for the results to be generalisable, however
the response rate reported in past library user surveys varies widely and so a sample size
calculation needed to be carried out to measure the non-response rate and enable a
statement of confidence in the survey to be made. The survey period was 17 June – 5
July 2002 and the survey was to be taken over one week in each library.
48

The opening hours for the three libraries and the sampling frames constructed for
the library visitor survey are as follows (RMBC, 2001: 33-34):
2.4 Library Opening Hours
Dinnington Mon 09:00 – 17:30
Tues 09:00 – 20:00
Wed 09:00 – 17:30
Thurs 09:00 – 17:30
Fri 09:00 – 20:00
Sat 09:00 – 13:00
Hours Open: 51.5 Covering the hours 09:00 – 20:00
Maltby Mon 09:00 – 13:00 14:00 – 19:00
Tues 09:00 – 13:00 14:00 – 17:00
Wed 09:00 – 13:00
Thurs 09:00 – 13:00 14:00 – 19:00
Fri 09:00 – 13:00 14:00 – 17:00
Sat 09:00 – 13:00
Hours Open: 40 Covering the hours 09:00 – 13:00 & 14:00 – 19:00
Greasbrough Mon 09:00 – 12:00 14:00 - 17:00
Tues 09:00 – 12:00 14:00 – 17:00
Wed
Thurs 09:00 – 12:00 14:00 – 19:00
Fri 09:00 – 12:00 14:00 – 17:00
Sat 09:00 – 12:00
Hours Open: 29 Covering the hours 09:00 – 12:00 & 14:00 – 19:00
49
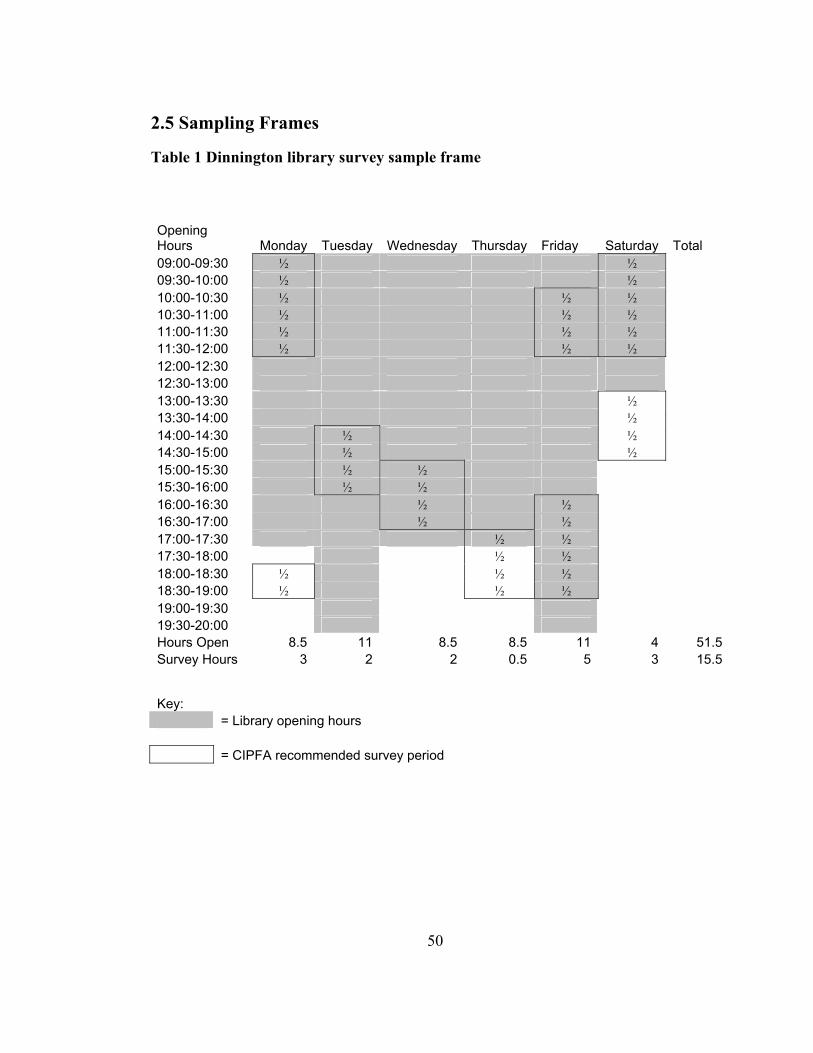
2.5 Sampling Frames
Table 1 Dinnington library survey sample frame
Opening Hours Monday Tuesday Wednesday Thursday Friday Saturday Total 09:00-09:30 ½ ½ 09:30-10:00 ½ ½ 10:00-10:30 ½ ½ ½ 10:30-11:00 ½ ½ ½ 11:00-11:30 ½ ½ ½ 11:30-12:00 ½ ½ ½ 12:00-12:30 12:30-13:00 13:00-13:30 ½ 13:30-14:00 ½ 14:00-14:30 ½ ½ 14:30-15:00 ½ ½ 15:00-15:30 ½ ½ 15:30-16:00 ½ ½ 16:00-16:30 ½ ½ 16:30-17:00 ½ ½ 17:00-17:30 ½ ½ 17:30-18:00 ½ ½ 18:00-18:30 ½ ½ ½ 18:30-19:00 ½ ½ ½ 19:00-19:30 19:30-20:00 Hours Open 8.5 11 8.5 8.5 11 4 51.5Survey Hours 3 2 2 0.5 5 3 15.5
Key: = Library opening hours = CIPFA recommended survey period
50

Table 2 Maltby library survey sample frame
Opening Hours Monday Tuesday Wednesday Thursday Friday Saturday Total 09:00-09:30 ½ ½ 09:30-10:00 ½ ½ 10:00-10:30 ½ ½ ½ 10:30-11:00 ½ ½ ½ 11:00-11:30 ½ ½ ½ 11:30-12:00 ½ ½ ½ 12:00-12:30 12:30-13:00 13:00-13:30 ½ 13:30-14:00 ½ 14:00-14:30 ½ ½ 14:30-15:00 ½ ½ 15:00-15:30 ½ ½ 15:30-16:00 ½ ½ 16:00-16:30 ½ ½ 16:30-17:00 ½ ½ 17:00-17:30 ½ ½ 17:30-18:00 ½ ½ 18:00-18:30 ½ ½ ½ 18:30-19:00 ½ ½ ½ 19:00-19:30 19:30-20:00 Hours Open 9 7 4 9 7 4 40Survey Hours 4 2 0 2 3 3 14
Key: = Library opening hours = CIPFA recommended survey period
51

Table 3 Greasbrough library survey sample frame
Opening Hours Monday Tuesday Wednesday Thursday Friday Saturday Total 09:00-09:30 ½ ½ 09:30-10:00 ½ ½ 10:00-10:30 ½ ½ ½ 10:30-11:00 ½ ½ ½ 11:00-11:30 ½ ½ ½ 11:30-12:00 ½ ½ ½ 12:00-12:30 12:30-13:00 13:00-13:30 ½ 13:30-14:00 ½ 14:00-14:30 ½ ½ 14:30-15:00 ½ ½ 15:00-15:30 ½ ½ 15:30-16:00 ½ ½ 16:00-16:30 ½ ½ 16:30-17:00 ½ ½ 17:00-17:30 ½ ½ 17:30-18:00 ½ ½ 18:00-18:30 ½ ½ ½ 18:30-19:00 ½ ½ ½ 19:00-19:30 19:30-20:00 Hours Open 6 6 0 8 6 3 29Survey Hours 3 2 0 2 3 3 13
Key: = Library opening hours = CIPFA recommended survey period
52
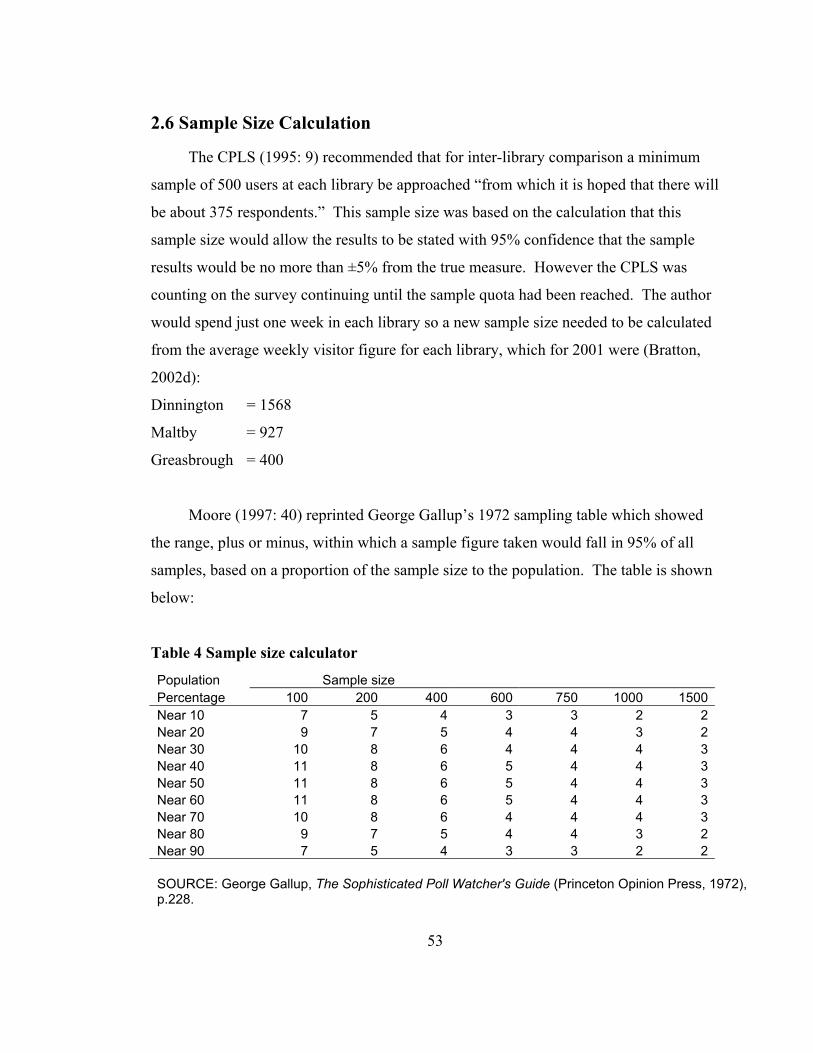
2.6 Sample Size Calculation
The CPLS (1995: 9) recommended that for inter-library comparison a minimum
sample of 500 users at each library be approached “from which it is hoped that there will
be about 375 respondents.” This sample size was based on the calculation that this
sample size would allow the results to be stated with 95% confidence that the sample
results would be no more than ±5% from the true measure. However the CPLS was
counting on the survey continuing until the sample quota had been reached. The author
would spend just one week in each library so a new sample size needed to be calculated
from the average weekly visitor figure for each library, which for 2001 were (Bratton,
2002d):
Dinnington = 1568
Maltby = 927
Greasbrough = 400
Moore (1997: 40) reprinted George Gallup’s 1972 sampling table which showed
the range, plus or minus, within which a sample figure taken would fall in 95% of all
samples, based on a proportion of the sample size to the population. The table is shown
below:
Table 4 Sample size calculator
Population Sample size Percentage 100 200 400 600 750 1000 1500 Near 10 7 5 4 3 3 2 2 Near 20 9 7 5 4 4 3 2 Near 30 10 8 6 4 4 4 3 Near 40 11 8 6 5 4 4 3 Near 50 11 8 6 5 4 4 3 Near 60 11 8 6 5 4 4 3 Near 70 10 8 6 4 4 4 3 Near 80 9 7 5 4 4 3 2 Near 90 7 5 4 3 3 2 2 SOURCE: George Gallup, The Sophisticated Poll Watcher's Guide (Princeton Opinion Press, 1972), p.228.
53

The smallest sample shown on the above table is 100 as 10% of the total
population, however it was too simple to base the sample size on 10% of the total
weekly visitor figures for the libraries for two reasons: 1) the survey would not be taken
during every opening hour of the week, but rather during a proportion of the opening
hours timetabled so as to survey each opening hour of the day that the library opening
hours covered over one week; 2) visitor numbers would likely vary greatly during the
different hours of the day. So instead the sample size was calculated as follows:
P = Survey hours . x Weekly visitor figure Weekly opening hours 10
p is the parameter 10% of the population # of library visitors during the survey hours
The CPLS (1995: 6) also recommended surveying an additional 30% to cater for
non response. Using this formula, the sample size required from each library was
calculated as follows:
Dinnington 15.5 x 1568 = 47 + (0.30 x 47) = 61 51.5 10
Maltby 14 x 927 = 32 + (0.30 x 32) = 42 40 10
Greasbrough 13 x 400 = 18 + (0.30 x 18) = 23 29 10
95% confidence sample size 47 + 32 + 18 = 97
Survey sample size 61 + 42 + 23 = 126
2.7 Statement of Confidence/Reliability
As the 95% confidence sample size quoted above is near 100, and this represents
10% of the ‘population’ – the weekly library visitor figures adjusted for the survey hours
- then according to Gallup’s table we should use a confidence interval of ±7% when
interpreting the results of the library visitor survey, and this was calculated using a
method that covers the true p in 95% of samples of 10% of the library visitor population
54

during the survey period. Please be aware that this not a statement of probability that the
survey results are within ±7% of the true value because the sample could be in the 5%
outside the interval and as Moore (1997: 466) points out “there is no randomness left
once we have chosen one particular sample so probability does not make sense.”
2.8 Data Collection Issues
The CPLS (1995: 8) suggested an in house distribution method whereby surveys
are handed out to people as they enter a public library with a pencil and they are
instructed to fill in the survey and return it in the return box on the issue desk when they
leave the library. The CPLS said that following such methods should achieve a 75%
return rate. The 10% of library visitors sample ratio was required to estimate a sample
size based on the average weekly visitor figures, the data collection strategy however
was to approach a convenience sample of all library visitors who entered the libraries
during the survey hours, this would mean the survey would exclude non-visitors and
those who visited the library during the survey week outside the survey hours. The
sample would be self-selecting only to the extent that they could exercise their choice
not to participate in the survey, although the CPLS quoted return ratio of 75% provided
hope of obtaining a good rate of return. The plan was for the author to administer the
questionnaires for the library visitor survey in the libraries at Dinnington and Maltby and
possibly at Greasbrough, although at the start of the survey period there was the
possibility that the staff at Greasbrough library would carry out the distribution and
collection of surveys in that library. In addition only visitors who appeared to be over
the age of 15 were to be surveyed.
2.9 The second survey – The health enquirer questionnaire
The second survey would be sent out by post to people who made a health enquiry,
and who agreed to be surveyed, at the Healthinfo service point, at Dinnington,
Greasbrough and Maltby libraries, or who had made a health enquiry at another
55
Rotherham library where the enquiry had been forwarded to Rotherham Healthcare
Library and Information Service to be answered. The questionnaires would be handed
out to enquirers during the survey period 10 June – 5 July 2002. The sample would be
self selecting in that health enquirers would be invited to participate in the survey and
would be required to return the survey in an enclosed pre-paid reply envelope. The
sample size was always going to be small – based on the health enquiry statistics
produced by Healthinfo (Bratton, 2002b) the number of health enquiries made at that
service point in the first four months of 2002 was 30 per month. Given the fact that
other service points would be participating led the author to estimate that 30 would be a
realistic sample size. The small sample size would mean it would not be possible to
calculate a confidence level which could be used to make generalisations about the
results to the wider user population. Instead the results would be used as additional
qualitative feedback to illustrate the effects on some health enquirers of the information
they received from Rotherham libraries. Coverage potentially might be wider than the
library visitor survey because people who were non-visitors of Rotherham libraries, but
who might still “use” the services because their health enquiries would be forwarded to
Rotherham Healthcare Library and Information Service to be answered, could
potentially include people from certain priority groups which the former Library
Association Medical, Health and Welfare Libraries Group (MHWLG) Domiciliary
Services Subject Group (MHWLG, 1991: 5) identified as including “people unable to
use library service points because of disability, illness, frailty, mental health problems,
or their responsibilities in caring for others” such as the housebound (served by local
library staff home visits) and those in nursing homes and sheltered accommodation
(served by the Bookability service).
2.10 Limitations of the survey method
One limitation was that in both surveys non-users/non-enquirers would be
excluded. Though regrettable this was necessary given the limited human resources
available, the short time period (mid-June until end of first week in July), the small scale
56
nature of the research, and the fact that one of the research aims is to measure
effectiveness of the information provided. Another limitation was that both
questionnaires were based on convenience sampling. The data collected will be from
people who visited the libraries, or respondents who agree to be surveyed, during the
survey period. However the calculation of a confidence level at least allows the results
of the library visitor survey to be presented appropriately.
Despite the limitations in the sampling strategies there are very good reasons for
carrying out this type of research. In the latest report on the state of Britain’s public
library services, the Audit Commission (2002: 9) criticised library services where
consultation with the public is lacking:
“For example, where non-users or priority groups have not been engaged, where
the results from consultation have not been acted on, or where the reviews has
(sic) relied on satisfaction data, rather than engaging the public in more depth.”
O’Connor (2002: 2) argued that health library services “operating in an
environment of funding by results” should demonstrate their value to patient care
outcomes. The data collected from the questionnaires would enable the author to
measure user awareness and the impact of information provided by the service.
2.11 Obtaining consent from health enquirers to be surveyed
The dissertation sponsors confirmed the health enquirer questionnaire research
would not need to go before Rotherham District General Hospital ethics committee. The
postal questionnaire would be administered by Rotherham Healthcare Library &
Information Service staff therefore the author would not need to see any name and
address data of people who made a health enquiry. Following the practice suggested by
Pifalo et al (1997: 19) it was agreed with the dissertation sponsors that as a courtesy
people with a health enquiry would be asked if they would like to participate in the
postal survey. Library staff were told to ask those who did agree to participate to give
57
their name and address, signature and date, on a consent form designed by the author,
the text of which is included in Appendix A to this dissertation. The form would be
used to address the outgoing postal questionnaire after which the form would be
destroyed.
2.12 Questionnaire Design
Appendix B of this dissertation shows the text of the library visitor survey
questionnaire. Appendix C shows the text of the health enquirer survey questionnaire.
The questionnaires, once drafted were sent to the dissertation sponsors for checking, and
were discussed by the author with his dissertation tutor. The dissertation sponsors
verified, after reading the questionnaires, that the information the author intended to
collect and analyse would be useful and relevant to their needs. Many of the questions
were based on questions asked in previous survey questionnaires adapted, where
required, to cope with the specific circumstances of the environment in which the
surveys were carried out, as described below:
In the library visitor survey (Appendix B):
• Question 1 was based on questions asking about what sources of health
information do people use that were used in two surveys previously identified:
NOP Market Research Limited (1988) and Office of Health Economics (1994);
• Question 2 asked what types of information would people like to see stocked in
the library. The options available to choose were based on a combination of
typical consumer health information types, listed by MacDougall and Brittain
(1992: 9), and by the author looking at the types of information listed in the
Health section of Birmingham public library website
(http://www.birmingham.gov.uk/GenerateContent?CONTENT_ITEM_ID=3338
&CONTENT_ITEM_TYPE=0&MENU_ID=144 Accessed 9 May 2002);
58
• Question 4, asked in what format would people like information. The author
designed the options list after consideration of what formats the information
types in Question 2 would likely be offered in a public library;
• Questions 3 and 5 were open questions asking the respondent to complete in their
own words, so as to collect qualitative responses. The last questions, asking for
the respondent to state their gender and age range, were necessary to assist with
the interpretation of the descriptive statistics that will be generated in the results.
In the health enquirer survey (Appendix C) the format was based on the questionnaire
designed by Bexon (1998):
• Questions 1 and 2 were to collect data about how people make enquiries and for
whom;
• Question 4 was designed to collect data about why people needed information;
• Questions 3 and 5 were designed to collect data about how successful people
were in finding the information they were looking for;
• Questions 6 and 9 were designed to collect data about whether people used the
information and if it was available at the time it was needed;
• Question 7 was designed to collect data to help measure the impact of the
information on respondents cognitive, affective and empowerment information
needs;
• Question 10 was designed to collect data about respondents opinions of access
costs versus benefits of three significant sources of consumer health information,
NHS Direct helpline, the Internet and their local library;
• Question 8 and the last two questions were designed to collect information about
the health status, gender and age of respondents.
59
2.13 Statistical Analysis
The data collected from Question 1 of the library visitor survey was compared
with the data collected from two previous surveys (NOP Market Research Limited,
1988; and Office of Health Economics, 1994).
The data collected from Question 7 of the health enquirer survey was compared
with responses from the Bexon (1998) survey of users of Sheffield Healthline, thereby
allowing a comparison of the perceived usefulness of information obtained from
libraries with information obtained from a telephone consumer health information
service.
The χ² non-parametric statistical test was used to test the hypotheses outlined
previously on page 42. The test compares the frequency of nominal variables, in this
case the answers to particular questions on the library visitor survey as described below,
with a theoretical frequency distribution of the same nominal variables. The hypotheses
would not be tested using results from the health enquirer survey because the sample
size for the second survey was too small to calculate a statement of confidence.
The following describes the nominal variables from the library visitor survey that
were used to test the hypotheses:
• For hypotheses 1 to 5 the independent variable selected for the test was Question 1
Variable 6 – the use of a public library to find out health information;
• The dependent variables for each hypothesis were as follows:
o Hypothesis 1 = gender of respondents;
o Hypothesis 2 = age of respondents;
o Hypothesis 3 = Question 1 Variable 11 – the use of the Internet to find out
health information;
o Hypothesis 4 = Question 4 Variable 6 – the use of a computer to use the
Internet or a CD-ROM in the library;
60 o Hypothesis 5 = Question 4 Variable 8 – the help of a librarian in the library;
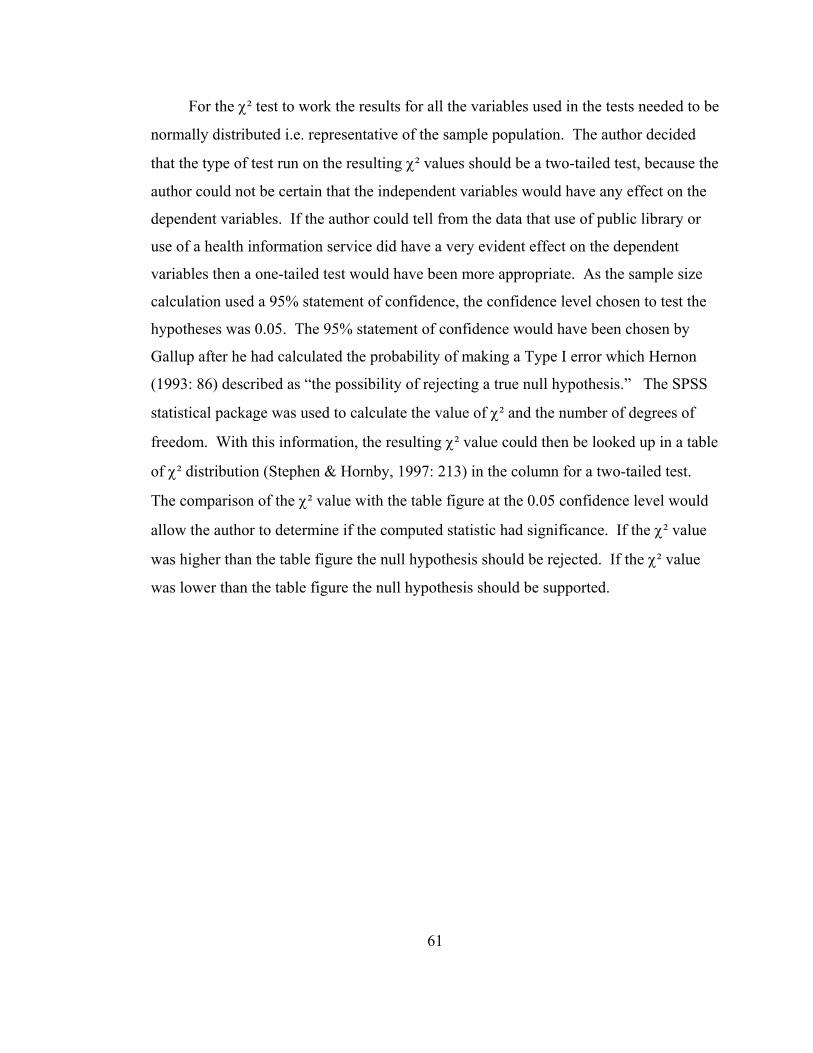
For the χ² test to work the results for all the variables used in the tests needed to be
normally distributed i.e. representative of the sample population. The author decided
that the type of test run on the resulting χ² values should be a two-tailed test, because the
author could not be certain that the independent variables would have any effect on the
dependent variables. If the author could tell from the data that use of public library or
use of a health information service did have a very evident effect on the dependent
variables then a one-tailed test would have been more appropriate. As the sample size
calculation used a 95% statement of confidence, the confidence level chosen to test the
hypotheses was 0.05. The 95% statement of confidence would have been chosen by
Gallup after he had calculated the probability of making a Type I error which Hernon
(1993: 86) described as “the possibility of rejecting a true null hypothesis.” The SPSS
statistical package was used to calculate the value of χ² and the number of degrees of
freedom. With this information, the resulting χ² value could then be looked up in a table
of χ² distribution (Stephen & Hornby, 1997: 213) in the column for a two-tailed test.
The comparison of the χ² value with the table figure at the 0.05 confidence level would
allow the author to determine if the computed statistic had significance. If the χ² value
was higher than the table figure the null hypothesis should be rejected. If the χ² value
was lower than the table figure the null hypothesis should be supported.
61
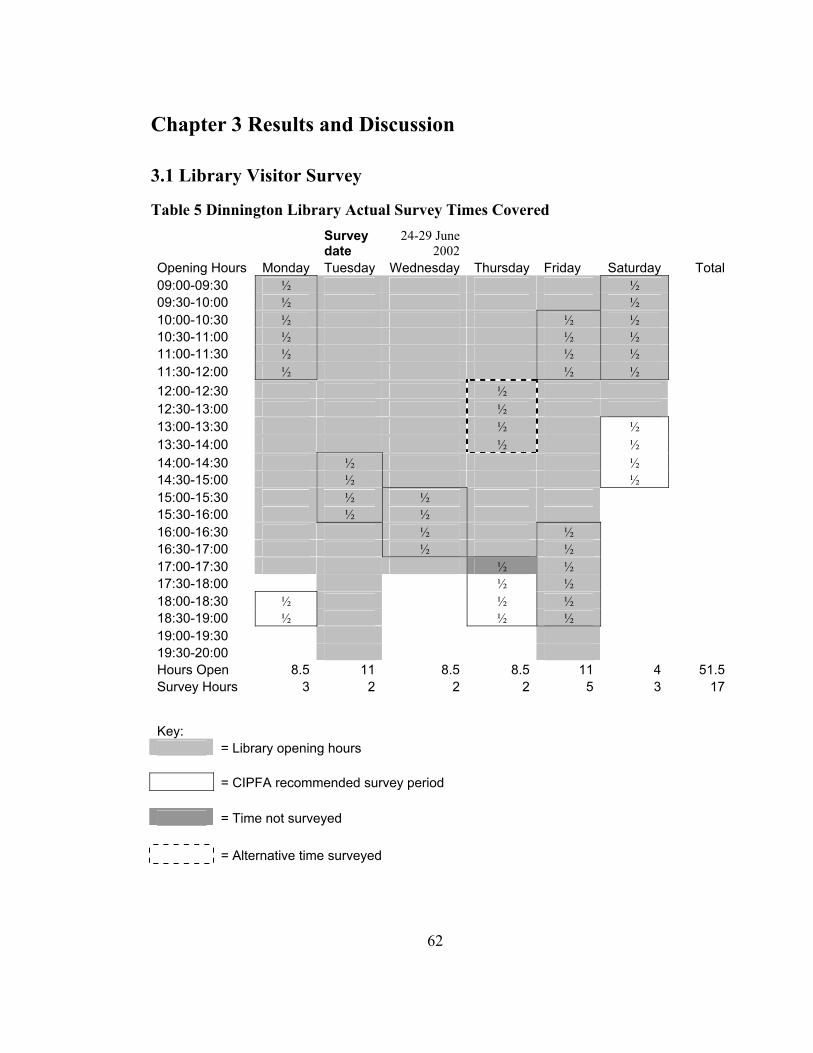
Chapter 3 Results and Discussion
3.1 Library Visitor Survey
Table 5 Dinnington Library Actual Survey Times Covered
Survey date
24-29 June 2002
Opening Hours Monday Tuesday Wednesday Thursday Friday Saturday Total09:00-09:30 ½ ½ 09:30-10:00 ½ ½ 10:00-10:30 ½ ½ ½ 10:30-11:00 ½ ½ ½ 11:00-11:30 ½ ½ ½ 11:30-12:00 ½ ½ ½ 12:00-12:30 ½ 12:30-13:00 ½ 13:00-13:30 ½ ½ 13:30-14:00 ½ ½ 14:00-14:30 ½ ½ 14:30-15:00 ½ ½ 15:00-15:30 ½ ½ 15:30-16:00 ½ ½ 16:00-16:30 ½ ½ 16:30-17:00 ½ ½ 17:00-17:30 ½ ½ 17:30-18:00 ½ ½ 18:00-18:30 ½ ½ ½ 18:30-19:00 ½ ½ ½ 19:00-19:30 19:30-20:00 Hours Open 8.5 11 8.5 8.5 11 4 51.5Survey Hours 3 2 2 2 5 3 17
Key: = Library opening hours = CIPFA recommended survey period = Time not surveyed = Alternative time surveyed
62
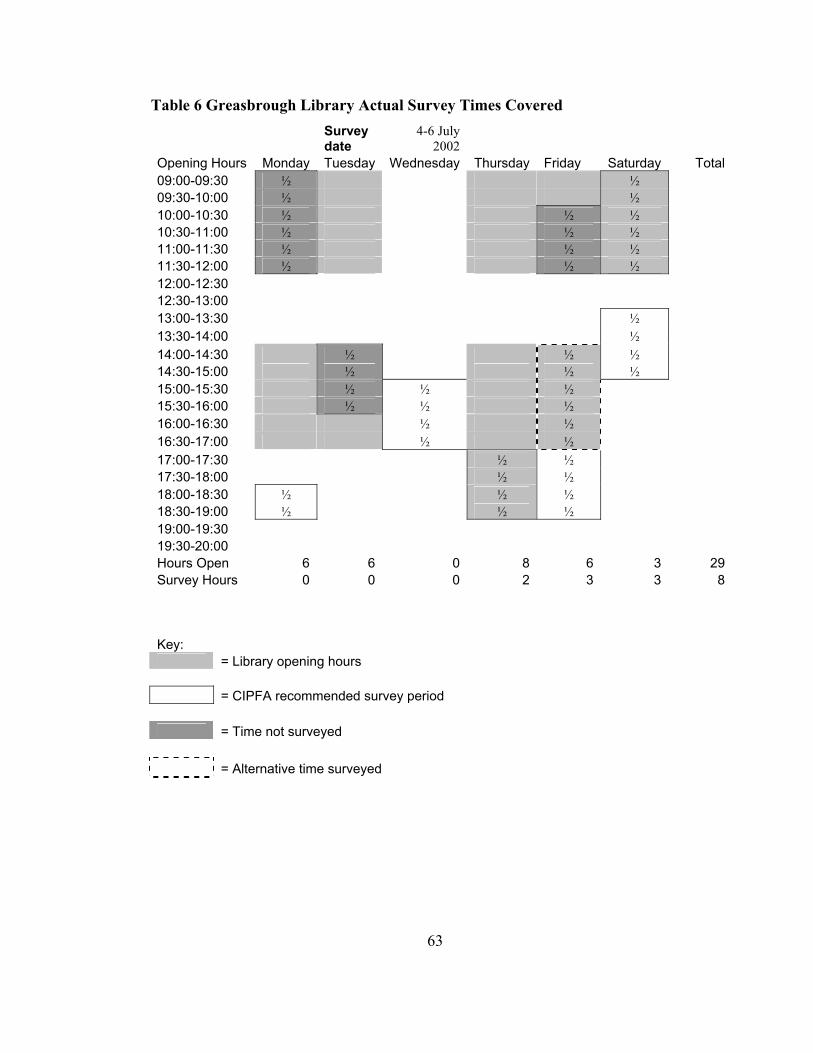
Table 6 Greasbrough Library Actual Survey Times Covered
Survey date
4-6 July 2002
Opening Hours Monday Tuesday Wednesday Thursday Friday Saturday Total09:00-09:30 ½ ½ 09:30-10:00 ½ ½ 10:00-10:30 ½ ½ ½ 10:30-11:00 ½ ½ ½ 11:00-11:30 ½ ½ ½ 11:30-12:00 ½ ½ ½ 12:00-12:30 12:30-13:00 13:00-13:30 ½ 13:30-14:00 ½ 14:00-14:30 ½ ½ ½ 14:30-15:00 ½ ½ ½ 15:00-15:30 ½ ½ ½ 15:30-16:00 ½ ½ ½ 16:00-16:30 ½ ½ 16:30-17:00 ½ ½ 17:00-17:30 ½ ½ 17:30-18:00 ½ ½ 18:00-18:30 ½ ½ ½ 18:30-19:00 ½ ½ ½ 19:00-19:30 19:30-20:00 Hours Open 6 6 0 8 6 3 29Survey Hours 0 0 0 2 3 3 8
Key: = Library opening hours = CIPFA recommended survey period = Time not surveyed = Alternative time surveyed
63
Table 7 Maltby Library Actual Survey Times Covered
Survey date
17-22 June 2002
Opening Hours Monday Tuesday Wednesday Thursday Friday Saturday Total09:00-09:30 ½ ½ 09:30-10:00 ½
½ ½ ½ ½ ½ ½ ½ ½
½ 10:00-10:30 ½ 10:30-11:00 ½ 11:00-11:30 ½ 11:30-12:00 ½ 12:00-12:30 ½ 12:30-13:00 ½
½ 13:30-14:00 ½
13:00-13:30
14:00-14:30 ½ ½ 14:30-15:00 ½ ½ 15:00-15:30 ½ ½ 15:30-16:00 ½ ½ 16:00-16:30 ½ ½ ½ 16:30-17:00 ½ ½ ½ 17:00-17:30 ½ ½ 17:30-18:00 ½ ½ 18:00-18:30 ½ ½ ½ 18:30-19:00 ½ ½ ½ 19:00-19:30 19:30-20:00 Hours Open 9 7 4 9 7 4 40Survey Hours 4 3 0 2 2 3 14
Key: = Library opening hours = CIPFA recommended survey period = Time not surveyed = Alternative time surveyed
64

There were three compelling reasons for amending the CPLS designed survey
sampling frame:
1. The population coverage under the theoretical sample frame did not cover certain
opening hours during the week. One of the effects of my changes was that every
opening hour of the day that the library opening hours covered during one week, was
covered by my survey;
2. Travel to the three libraries from Sheffield took, on average, one hour by bus from
Sheffield Interchange. On the few occasions where the sample frame required the
author to survey the library at two different times of the day this was changed, in all
but one case (Dinnington on Friday 28 June), so that the author could collect data
during one visit;
3. The original survey plan assumed that the staff in Greasbrough library would be able
to assist with the distribution of the surveys during the survey week. However, in
the event, sickness absence at the beginning of the survey week meant this was not
possible. The librarian in charge was away until the Wednesday and she asked the
author to carry out the survey in person after her return. The survey in Greasbrough
library was therefore carried out from Thursday 4 to Saturday 6 July 2002 at times
that ensured that every opening hour of the day that the library opening hours
covered during one week were surveyed during those three days.
65
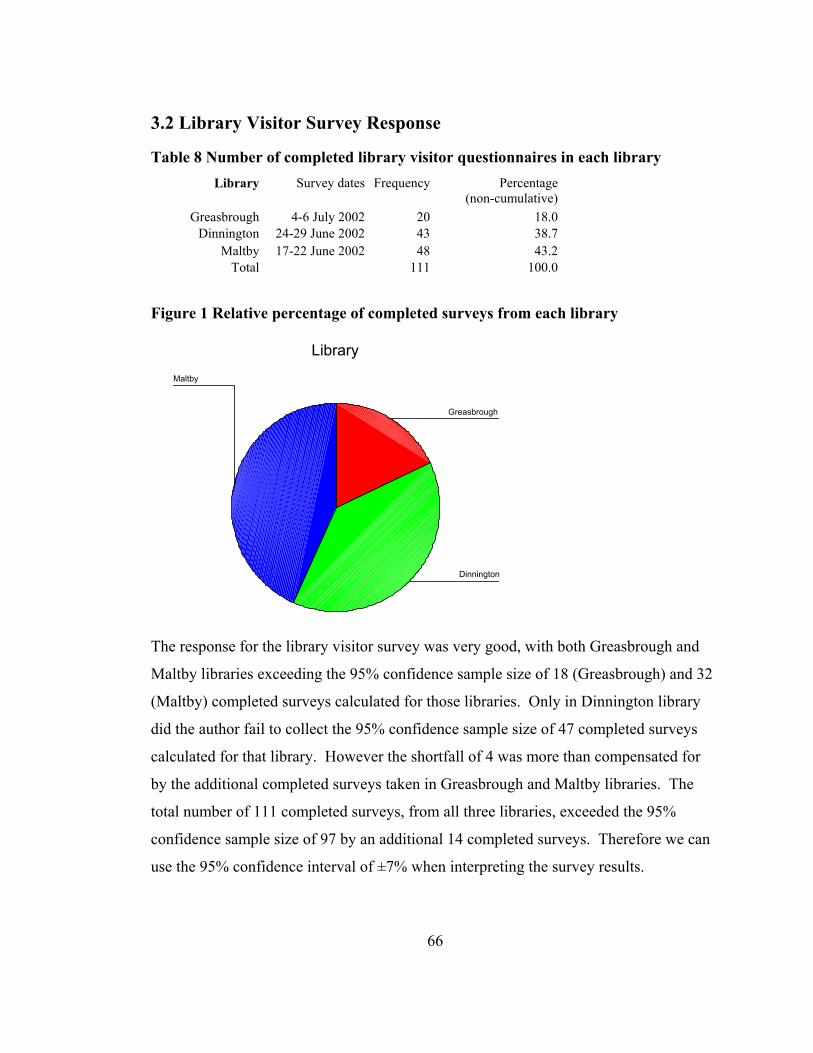
3.2 Library Visitor Survey Response
Table 8 Number of completed library visitor questionnaires in each library Library Survey dates Frequency Percentage
(non-cumulative)Greasbrough 4-6 July 2002 20 18.0
Dinnington 24-29 June 2002 43 38.7Maltby 17-22 June 2002 48 43.2
Total 111 100.0
Figure 1 Relative percentage of completed surveys from each library
Library
Maltby
Dinnington
Greasbrough
The response for the library visitor survey was very good, with both Greasbrough and
Maltby libraries exceeding the 95% confidence sample size of 18 (Greasbrough) and 32
(Maltby) completed surveys calculated for those libraries. Only in Dinnington library
did the author fail to collect the 95% confidence sample size of 47 completed surveys
calculated for that library. However the shortfall of 4 was more than compensated for
by the additional completed surveys taken in Greasbrough and Maltby libraries. The
total number of 111 completed surveys, from all three libraries, exceeded the 95%
confidence sample size of 97 by an additional 14 completed surveys. Therefore we can
use the 95% confidence interval of ±7% when interpreting the survey results.
66

The response rate was also very good. Although exact figures were not kept, the author
estimates that about 80% of visitors during the survey period, who appeared to be over
the age of 15, agreed to be surveyed.
Table 9 Gender/age of library visitor survey respondents
Total number of completed questionnaires for each age category, by gender Gender Age range Men Women Not stated Grand total Not stated 19 Under 15 2 15-20 5 21-30 2 8 31-40 8 13 41-50 10 8 51-60 7 13 61-70 4 6 Over 70 5 1 Total 37 56 19 111
There was a 60/40 split by gender, and respondents were mostly adults over 25.
Two respondents said they were under 15, although this was only just over 2% of the 93
survey respondents who gave their age, so the age limit on participants to be surveyed
was met for the most part. The gender of respondents closely matched the results of
CIPFA’s 1997 nation-wide Public Library User Survey (PLUS), as reported in Bohme &
Spiller (1999: 52-59), which collected statistics from 68,787 completed questionnaires
from across the UK. Figure 2 and Figure 3 on the next page are pie charts comparing
the results of the library visitor survey with the results of the gender distribution of the
1997 CIPFA PLUS survey (in Bohme & Spiller, 1999: 54). Figure 4 and Figure 5 on the
next page are bar charts comparing the results of the library visitor survey with the
results of the age distribution of the 1997 CIPFA PLUS survey. While the gender
distribution in both surveys is almost identical, the age distribution of the Rotherham
library visitor survey recorded 64% of respondents in the 31-60 age group whereas
CIPFA recorded 48.6% of respondents in the 34-65 age group.
67

Figure 2 Library visitor survey gender of respondents
Rotherham library user survey 2002 Gender of users
37, 40%
56, 60%
MenWomen
Figure 3 CIPFA PLUS 1997 survey gender of respondents
CIPFA 1997 results Gender of users %
40.5
59.5
MenWomen
68
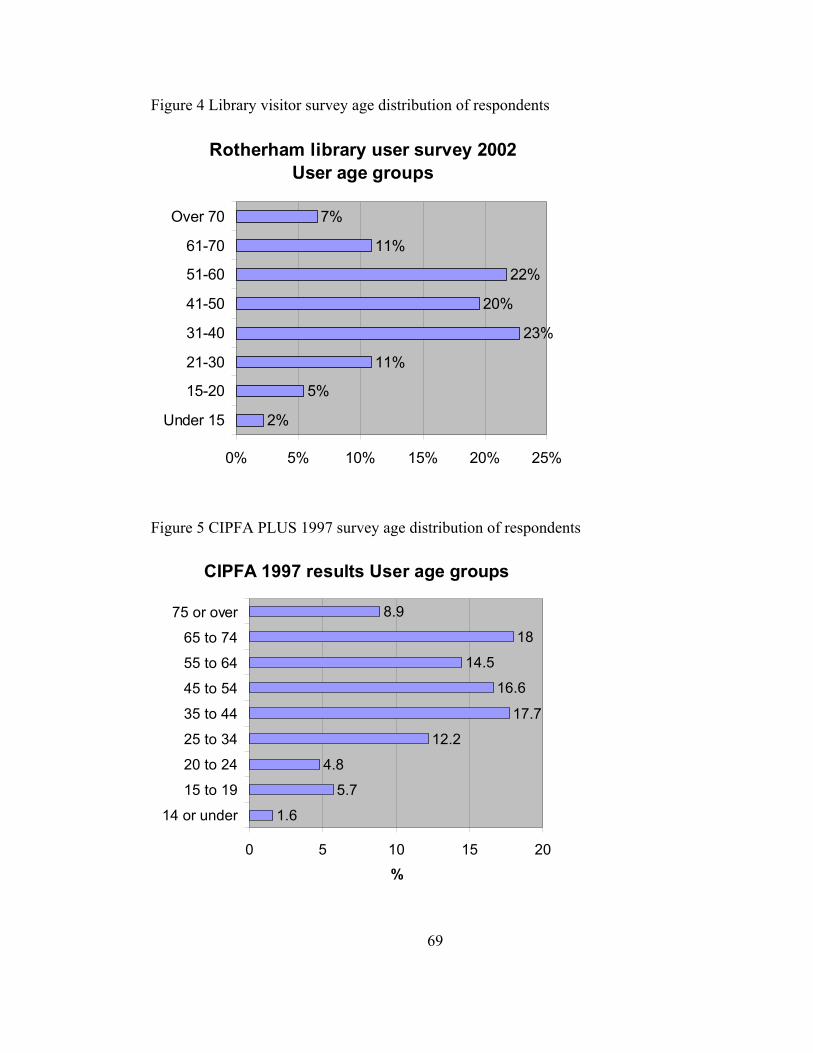
Figure 4 Library visitor survey age distribution of respondents
Rotherham library user survey 2002 User age groups
2%
5%
11%
23%
20%
22%
11%
7%
0% 5% 10% 15% 20% 25%
Under 15
15-20
21-30
31-40
41-50
51-60
61-70
Over 70
Figure 5 CIPFA PLUS 1997 survey age distribution of respondents
CIPFA 1997 results User age groups
1.6
5.7
4.8
12.2
17.7
16.6
14.5
18
8.9
0 5 10 15 20
14 or under
15 to 19
20 to 24
25 to 34
35 to 44
45 to 54
55 to 64
65 to 74
75 or over
%
69
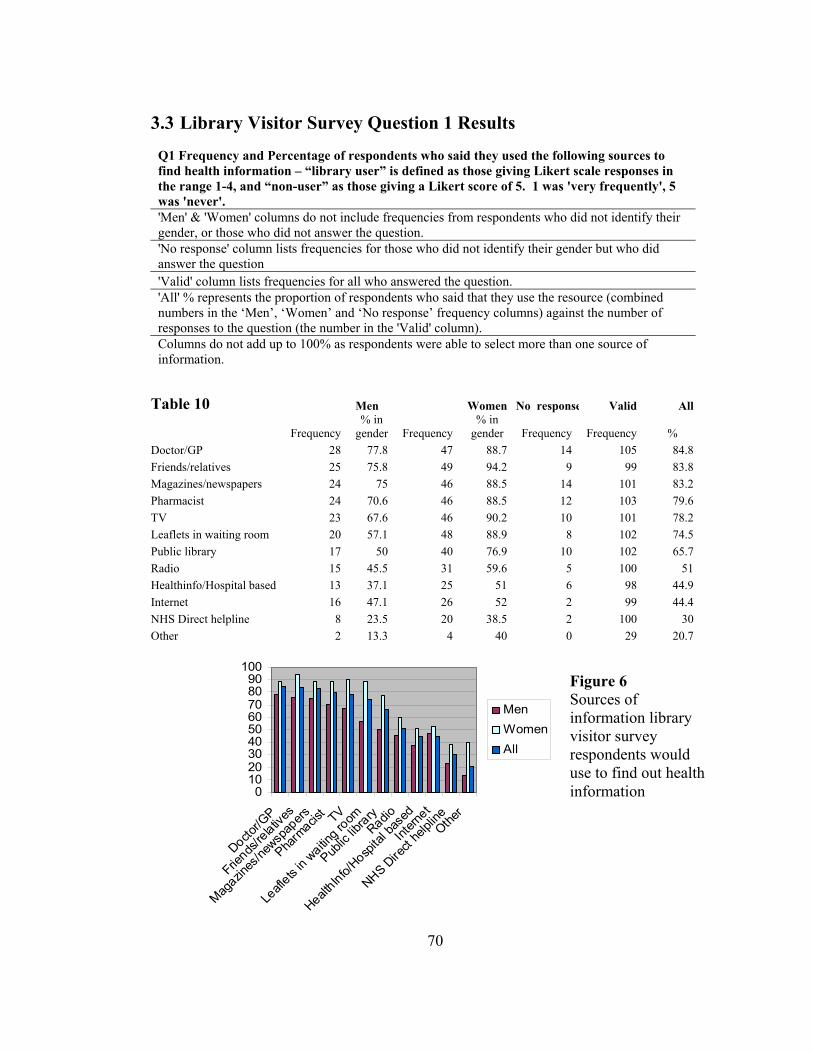
3.3 Library Visitor Survey Question 1 Results
Q1 Frequency and Percentage of respondents who said they used the following sources to find health information – “library user” is defined as those giving Likert scale responses in the range 1-4, and “non-user” as those giving a Likert score of 5. 1 was 'very frequently', 5 was 'never'. 'Men' & 'Women' columns do not include frequencies from respondents who did not identify their gender, or those who did not answer the question. 'No response' column lists frequencies for those who did not identify their gender but who did answer the question 'Valid' column lists frequencies for all who answered the question. 'All' % represents the proportion of respondents who said that they use the resource (combined numbers in the ‘Men’, ‘Women’ and ‘No response’ frequency columns) against the number of responses to the question (the number in the 'Valid' column). Columns do not add up to 100% as respondents were able to select more than one source of information.
Table 10 Men Women No response Valid All
Frequency % in
gender Frequency % in
gender Frequency Frequency % Doctor/GP 28 77.8 47 88.7 14 105 84.8 Friends/relatives 25 75.8 49 94.2 9 99 83.8 Magazines/newspapers 24 75 46 88.5 14 101 83.2 Pharmacist 24 70.6 46 88.5 12 103 79.6 TV 23 67.6 46 90.2 10 101 78.2 Leaflets in waiting room 20 57.1 48 88.9 8 102 74.5 Public library 17 50 40 76.9 10 102 65.7 Radio 15 45.5 31 59.6 5 100 51 Healthinfo/Hospital based 13 37.1 25 51 6 98 44.9 Internet 16 47.1 26 52 2 99 44.4 NHS Direct helpline 8 23.5 20 38.5 2 100 30 Other 2 13.3 4 40 0 29 20.7
0102030405060708090
100
Doctor/G
P
Friends
/relativ
es
Magazin
es/ne
wspap
ers
Pharm
acist TV
Leafl
ets in
waiting ro
om
Public
library
Radio
HealthInfo/
Hospita
l bas
ed
Intern
et
NHS Dire
ct he
lplineOthe
r
MenWomenAll
Figure 6 Sources of information library visitor survey respondents would use to find out health information
70
Note about the library visitor survey results
The results are from a questionnaire survey of 111 visitors to three community
libraries in the Rotherham Borough in the period 17th June to 5th July 2002. The data
was collected from a representative sample of approximately 10% of the weekly visitor
numbers for the libraries, apportioned for the number of hours in which the survey
actually took place. Data was collected using methods that enable the author to state
that in 95% of such samples of the survey population, the results would be ±7% of the
true value.
Discussion
Table 10 presents the results of Question 1 of the library user survey which aimed
to gather evidence to answer the research question “What sources do Rotherham library
users say they use to find health information?” To the best of the author’s knowledge,
Table 10 represents the first comparison of consumer preference for using public
libraries with other information sources as a source of health information.
Question 1 of the library visitor survey presented respondents with a list of sources
of health information and asked them to assign a value of 1-5 on a Likert scale with 1
meaning they used the source very frequently to find health information, and 5 meaning
they never used the source. Use of the information source was determined by recoding
the responses into two categories: Responses with the values 1-4 indicated some degree
of use – even if the respondent meant they only used the source once a year – and so
they were classified as users; Responses with the value 5 had clearly indicated they
never used the source and so they were classified as non-users.
71

Table 11 Sources of information used to find out about health matters % TV films and programmes 54Doctor/G.P. 49Newspapers 38Magazines 33Members of own immediate family 21Friends/other relatives 21Advertisements 18Radio programmes 13SOURCE NOP Market Research Limited (1988: 37)
Table 12 From which of these sources, if any, do you obtain your health information? Men % Women % GP 37 39 Magazines/Newspapers 33 44 TV 34 29 Friends or relatives 19 19 Pharmacist 13 16 Leaflets in GP waiting room 12 16 Radio 9 9 Practice nurse/health visitor/midwife 4 10 Other health professional 5 7 SOURCE Office of Health Economics (OHE) (1994, Table 1)
If we are to compare the results of Table 10 with those in Tables 11 and 12 it
should be first noted that the list of categories for the NOP survey (Table 11) had been
expanded in the OHE survey (Table 12) to include Pharmacists, Leaflets in a GP waiting
room, Practice nurses, and other health visitors, and that the list of sources was expanded
again for the library visitor survey (Table 10) to include Public Library,
Healthinfo/Hospital based information service, Internet and NHS Direct Helpline. This
reflects the increase in the number of additional sources of consumer health information
that are available to the public. NOP 1988 surveyed a national representative sample of
1,800 adults, and OHE 1994 surveyed a national representative sample of 1,194 adults.
This 2002 library visitor survey was of a representative sample of 111 adults (over 15
years of age) in three Rotherham community libraries. The results of the survey should
be taken to be generalisable only within the sample of Rotherham library visitors during
72

the survey period, and within the sample constraints described above. The extent to
which the library visitor results can be compared with the other two surveys, and to
which they are generalisable to the wider library user population, are thus limited.
As a measure of preference for sources of consumer health information, the survey
comparison reveals some interesting findings:
• Doctor/GP came out top of the library visitor survey, with 84.8% of respondents
saying they had used their Doctor at some point to find out health information. This
finding matched the top result of the OHE 1994 survey whereas the NOP 1988
survey had found Television to be the most cited source of health information. In
the library visitor survey TV appeared 5th with 78.2% of respondents citing it as a
source they used to find out health information;
• Public Library came 7th out of 11 listed sources of information plus 1 ‘Other’
category, with 65.7% (67 out of 111) of respondents saying they had used a public
library to find out health information at some point. This is more than the proportion
of respondents who said they had used the Internet (44.4%) and more than twice the
proportion of respondents who said they had used the NHS Direct helpline (30%).
This result does not measure the proportion of public library visits made with the
intention of finding health information, and the author would recommend this as a
question for further research;
• Although they appeared in a different order, the first 6 sources cited in the results of
the two earlier surveys also appeared in the first 6 sources cited in the results of the
library visitor survey, although the NOP survey had split family and friends whereas
the OHE and library visitor surveys merged them into one category. In addition,
when the author recoded the results to display the frequencies of respondents who
had assigned a Likert scale value of 1-2, to represent the proportion of respondents
who answered “very frequently” or just below, the same first 6 sources as in Table
10 were cited and, although they were in a different order, Doctor/GP still came out
top. One could argue that, based on the results of the two previous surveys the top 6
preferences could have been expected. It is interesting that the two newest media
73

being used to deliver consumer health information, the Internet and NHS Direct
helpline, did not attract a higher percentage of respondents given the high usage
figures for those services quoted above on Page 25. We might attribute this to lack
of awareness, or lack of access, or other issues such as trust. For further discussion
about these issues the author would direct the reader to the answer to Question 11 of
the Health Enquirer Survey below which discusses respondents impressions of the
relative advantages and disadvantages of the Internet, NHS Direct helpline and their
Public Library.
74

3.4 Library Visitor Survey Question 2 Results
Q2 Number and Percentage of respondents who thought it important to have the following types of health information in the library – 2 tables shown for comparison: Table 13 – “important” is defined as those giving Likert scale responses in the range 1-4 (i.e. those who attributed at least some measure of importance to the type), and “not important” as those giving a Likert score of 5. 1 was 'very important', 5 was 'not at all important'. Table 14 – “important” is defined as those giving Likert scale responses in the range 1-2, indicating they thought the information was 1 ‘very important’ or just below. 'Men' & 'Women' do not include figures from the respondents who did not identify their gender, or those who did not answer this question. 'No response' column lists frequencies for those who did not identify their gender but who did answer that they felt it important that the information was available in libraries 'Valid' column lists the frequency of those who answered the question. 'All' column includes responses from those who did not identify their gender. The 'Total' % therefore represents the proportion of respondents who said that they thought the information important to the number of responses to that question (figure in the 'Valid' column) Columns do not add up to 100% as respondents were able to select more than one type of information. Table 13 Men Women No response Valid All
Frequency% in
gender Frequency% in
gender Frequency Frequency % Location & opening hours 26 78.8 50 94.3 14 101 89.1 Support for carers 24 77.4 50 94.3 14 99 88.9 Local travel 28 84.8 49 92.5 14 103 88.3 Diet/nutrition/exercise 25 78.1 52 96.3 13 102 88.2 Conditions/Diseases/ Treatments 25 78.1 51 92.7 11 101 86.1 First Aid books 25 78.1 48 90.6 13 100 86.0 NHS service performance 23 71.9 48 90.6 11 99 82.8 Self help guides 21 67.7 47 94 11 96 82.3 Alternative therapies 23 74.2 47 90.4 9 96 82.3 Patient groups 21 70 46 90.2 8 94 79.8 Table 13 Types of information felt to be important to have in a public library
Table 14 Men Women Valid All
Frequency% in gender Frequency
% in gender Frequency %
Location & opening hours 16 44 40 71 70 63 Support for carers 17 56 36 63 66 57 Diet/nutrition/exercise 13 36 37 66 50 54 Conditions/Diseases/ Treatments 15 41 39 69 61 54 Local travel 16 44 30 55 58 52 NHS service performance 16 44 33 58 58 52 First Aid books 15 41 32 57 53 47 Self help guides 11 30 28 50 46 41 Alternative therapies 10 27 24 42 38 34 Patient groups 8 24 24 42 38 34 Table 14 Types of information felt to be very important to have in a public library
75

Discussion
Table’s 13 and 14 present analyses of the results of Question 2 of the library user
survey which aimed to gather evidence to answer the research question “What types of
health information do Rotherham library users want to see in public libraries?”
Question 2 of the library visitor survey presented respondents with a list of types
of health information and asked them to assign a value of 1-5 on a Likert scale with 1
meaning they thought it was very important to have that type of information in their
library, and 5 meaning they thought that type of information was not at all important. In
Table 13 the measure of perceived importance of the information type was determined
by recoding the responses into two categories: Responses with the values 1-4 indicated
the respondent attributed at least some measure of importance to the type; Responses
with the value 5 had clearly indicated they did not think the information was important.
The results as shown in Table 13 are within the range 79.8%-89.1%. This shows that
most people attributed some degree of importance to all the types of information listed.
To attempt a more accurate gauge of the strength of feeling for the different information
types, Table 14 was created by recoding the results to display the frequencies of
respondents who had assigned a Likert scale value of 1-2, to represent the proportion of
respondents who answered “very important” or just below.
The authors own observations on the presentation of the materials bought for the
community health information pilot project in the three libraries was as follows:
Dinnington community library – Materials were well presented on shelving specially
bought in for the purpose. The author thought it was a good idea to keep all the health
subject general loan and reference material together as it created a ‘health section’ of the
library that could be pointed out to enquirers, although with space at a premium
downstairs the health materials were located upstairs. It was of interest for the author to
find out from the answers to Question 5. ‘What improvements could be made?’ whether
better signage was flagged up by respondents as needed to point out the location of the
76
health material. Posters in the health section promoted Health events, organ donation,
the Healthinfo service and the SurgeryDoor consumer health information website. In
the downstairs area, bookmarks advertising Healthinfo were on the main desk; Leaflets
from RMBC’s Sports Development Unit, Active Communities Programme, included
walking diaries and the Rotherham Walking Festival; and leaflets about local bus times
were on display; Local community information was available from the HUB Online
South Rotherham electronic community magazine, accessible from a PC dedicated to the
purpose located just outside the library entrance – HUB Online community pages
included a link to the Healthinfo service web page.
Maltby community library – At the time of visiting, a dedicated health information
section had not yet been set up, although this was due to be rectified. The books were in
one corner of the main shelving area, but with minimal signposting. Leaflets, including
the Rotherham Walking Festival and local bus times, were on display at the entrance;
Local community information was presented in the form of a booklet, Maltby
Community Information 2001, which has a section on health providing the address and
contact details of local doctors, chemists, dieticians and the local health centre. Local
community information was also available from one PC set up as a dedicated terminal
for the Rotherham On-Line electronic public information system. This included access
to RMBC’s website and the Community Information Database, maintained by
Rotherham Libraries e-library services team. The Rotherham mobile library service is
based at Maltby library and the author witnessed staff from the mobile libraries selecting
books from the community health information pilot project collection to carry on the
mobile libraries.
Greasbrough community library – The materials were well presented in a separate
health section of shelving. A prominent blue cork board mounted posters promoting
Health events and the Healthinfo service, plus special mounts for Which Health and
NHS Magazine and the Directory of Voluntary Community Self Health Groups. Situated
by the health section was a video and Television set up playing one of the Videos for
77
Patients. Not all the health books were in the health section – there was a separate
display of mother and baby care books by one window that faced onto the footpath to
the adjacent community Health centre.
The results in Table 14 show the top 6 most important community information
types that should be in public libraries, with more than 50% of respondents who thought
they were “very important” or just below, are: the location and opening hours of local
health services (63%); information about sources of support for carers (57%);
information about diet, nutrition and exercise (54%); information about common
conditions, diseases and their treatments (54%); local travel arrangements (52%); and
information about NHS service performance (52%).
Given it was considered the most important type of consumer health information
to have in public libraries, it was good to note that Maltby library had the location and
opening hours of local health services on display in booklet form. In Dinnington library
such community information was presented electronically. Two different formats but
with the same top-most priorities: to keep this type of information complete, accurate, up
to date, and accessible. Question 4 of the library visitor survey sought to examine with
what formats respondents preferred to retrieve information.
Note to the reader: Question 4 follows next because the results to Question 3 were
few and those few were more correctly answers to Question 5 therefore the author
decided to amalgamate Question 3 and 5 and present the answers to those questions
together below.
78

3.5 Library Visitor Survey Question 4 Results
Q4. Have you used these materials in the library, or if you have not would you consider using them? Table 15 Information formats used
I have used it
I would use it
Frequency % Frequency %Reference books 65 58.6 22 19.8Books 80 72.1 11 9.9Newspapers/Magazines 35 31.5 40 36Video or audio tapes 34 30.6 40 36Computer 24 21.6 51 45.9Kiosk 14 12.6 58 52.3Librarian 63 56.8 20 18Other 3 2.7 3 2.7
Figure 7 Information formats preferred by respondents to obtain health information
Use of materials in the library
01020304050607080
Referen
ce bo
oks
Books
Newsp
apers
/Mag
azine
s
Video o
r aud
io tap
es
Compu
terKios
k
Librar
ianOthe
r
Material
Perc
enta
ge o
f rep
onde
nts
I have used itI would use it
79
Discussion
Table 15 and Figure 7 present the results of Question 4 of the library user survey
which aimed to gather evidence to answer the research question “In what information
format do people prefer to obtain health information?” Respondents were presented
with a list of 7 information formats, in which the information types listed in Question 2
were likely to be found in a public library, and they were asked to indicate if they had
used the information format or if they would use it.
Among the library visitor survey respondents the three most preferred formats
used to find health information in public libraries are books (72.1%), reference books
(58.6%) and the help of a librarian (56.8%). The three were also the only formats that
more respondents said they had used rather than would use. Out of the remaining
formats the most surprising finding was that more respondents said they would use a
touch screen information kiosk (52.3%) than said they would use a computer (45.9%) in
a library to find health information. This is surprising because in all three libraries
surveyed there are computer suites, and the number of computers with Internet access is
increasing, but in comparison there were no touch screen kiosk facilities delivering
health information and the nearest such kiosk was in the main concourse at Rotherham
District General Hospital outside Healthinfo. A possible reason for this result might be
the perceived convenience factor of using a kiosk as opposed to using the Internet.
Nicholas et al. (2001: 153) recorded that on average visitors to the NHS Direct Online
website spent 5-6 minutes per session compared with kiosk users who spent 1 minute
per session. Nicholas et al. (2001: 153) described the reason for this might be that
“kiosk users were thought to be rushed for time and may be unwilling to invest the time
necessary to interrogate what might be a new system for them.” In July 2001 RMBC
carried out a questionnaire of 1,600 volunteer members of ‘Rotherham Reachout’, a
citizens panel, to find out where people said they would find touch screen kiosks to be
most conveniently located. RMBC (2001: 94) found that 65% said they would prefer to
see kiosks placed in shops/supermarkets, 59% said they would prefer to have kiosks in
80

council buildings such as housing offices or public libraries, 12% would want kiosks to
be located on the street in a booth, and 11% didn’t know.
The unusual finding does suggest an interesting question: would more people use a
kiosk than would use a computer with Internet access to find out health information if
the facilities were made available in public libraries? More respondents said they had
used a computer (21.6%) than had used a kiosk (12.6%) to find health information but as
mentioned this is probably because such facilities are not made available in public
libraries. The author would recommend this as an area for further research.
The most preferred formats used to find health information in Rotherham public
libraries are books (72.1%) and the help of a librarian (56.8%). A large proportion of
the respondents to RMBC’s Rotherham Reachout questionnaire (59%) said it would be
convenient for them to have touch screen kiosk facilities placed in public libraries, also a
large proportion of respondents to the library visitor survey (52.3%) said they would use
a touch screen kiosk in a library to find health information. These findings support the
current proposal put forward by Rotherham Health Care Library and Information
Service to move the Patients Library in Rotherham District General Hospital upstairs
and co-locate it with the Healthinfo service and the Touch Screen health information
kiosk on the Hospital main concourse.
81

3.6 Library Visitor Survey Results to Question’s 5 and 3
Q3. If we did not mention in Question 2 a type of health information that you feel is very important, please explain below what that type of health information is Q5. How can the library improve the way it provides healthcare information to you?
Table 16 Library visitor survey respondent suggestions for improvement Response Frequency %No response 75 67.6Excellent/cannot be improved 9 8.1Promotional events/visiting speakers 7 6.3Local info/display boards 6 5.4More books 5 4.5More leaflets 2 1.8Unaware/poor signage 2 1.8Other 5 4.5Total 111 100.0
Figure 8 below describes the proportional responses of those who gave responses to
Questions 3 & 5 (i.e. excluding the 67.6% who did not answer Question 5)
Improvements
Other
Unaware/poor signage
More leaflets
More books
Local info
Promotional events
Excellent
82
Questions 3 and 5 were left open for respondents to make suggestions for further
improvements to the health information provided in Rotherham public libraries. Below
the author has summarised the responses that respondents gave into two text boxes:
w
s
r
p
c
r
p
t
a
t
N
s
s
Positive comments
“Greasbrough library health information is excellent”
“Does not need to improve, I find it very good already”
“Excellent information”
“I feel this library (Dinnington) is very up to date on health info”
“Good quality information about...my mother’s cancer of the colon provided quickly by a really
helpful hospital librarian - happened 10 years ago, I am still grateful!”
Suggestions for improvement
“Was really unaware health information was available (Maltby)”
“If there is, I did not notice any signs pointing to healthcare info...signs?! (Dinnington)”
“Have open days on specialist topics”
“Would welcome visits from experts e.g. dieticians, alternative therapists, etc.”
“Easy access to a video machine to play the videos offered (Dinnington)”
“More leaflets on drugs (Maltby)”
While the majority of survey participants (67.6%) declined to answer, of those
ho did answer the largest single response (8.1%) was that the health information
ervices currently provided were excellent, could not be improved upon, and 1
espondent mentioned the health information was very up to date. Of the remainder, 7
eople said they would like to see more promotional events, a greater awareness of
urrent health campaigns or to have visiting speakers to give talks on health topics. One
espondent in Dinnington library requested access to video/TV facilities in that library to
lay the health videos available. Interestingly two respondents said they were unaware
hat health information was available – 1 in Maltby library which, as reported above, had
n absence of clear signage, and 1 in Dinnington library which, as reported above, has
he health section upstairs but with no signage as to the location of the health collection.
o such comment was received from Greasbrough library users, where the health
ection is well presented. Although these are only 2 comments taken from a small scale
urvey, these responses do indicate a need for clear signage in libraries to point out the
83

location of health information resources. Another interesting comment was the
respondent who recalled the speed and helpfulness of information provided in the past
by Rotherham Health Care Library and Information Service.
3.7 Hypotheses Tested
The working out of the hypotheses tests by the SPSS software analysis of the
survey data is contained below in Appendix D. The χ² value and number of degrees of
freedom (df) noted below are taken from the relevant hypothesis test.
1. There is no statistically significant probability that there is an association (p <.05)
between gender of respondents and the use of a public library to find out health
information.
Test result χ² = 6.667 with 1df = rejects the above null hypothesis
2. There is no statistically significant probability that there is an association (p <.05)
between age of respondents and the use of a public library to find out health information.
Test result χ² = 5.250 with 7df = supports the above null hypothesis
3. There is no statistically significant probability that there is an association (p <.05)
between age of respondents and the use of the Internet in a public library to find out
health information.
Test result χ² = 24.404 with 7df = rejects the above null hypothesis
4. There is no statistically significant probability that there is an association (p <.05)
between use of a public library to find out health information and the use of a computer
in the library.
Test result χ² = 3.239 with 1df = supports the above null hypothesis
84
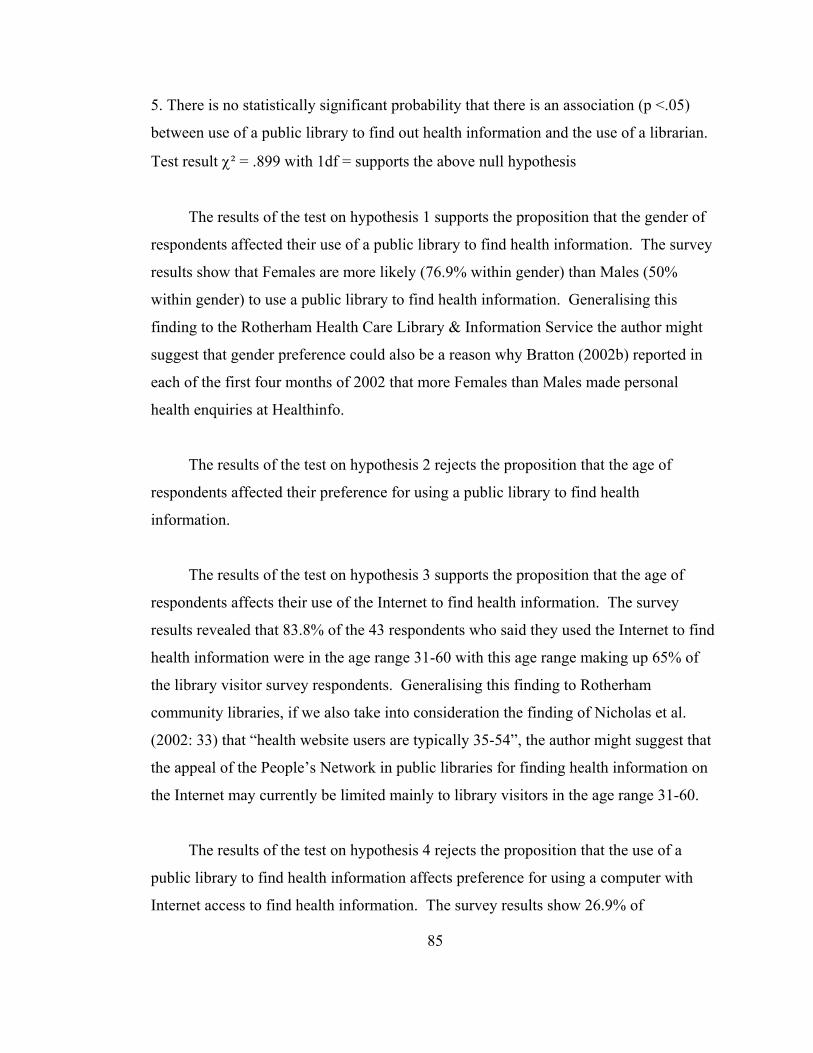
5. There is no statistically significant probability that there is an association (p <.05)
between use of a public library to find out health information and the use of a librarian.
Test result χ² = .899 with 1df = supports the above null hypothesis
The results of the test on hypothesis 1 supports the proposition that the gender of
respondents affected their use of a public library to find health information. The survey
results show that Females are more likely (76.9% within gender) than Males (50%
within gender) to use a public library to find health information. Generalising this
finding to the Rotherham Health Care Library & Information Service the author might
suggest that gender preference could also be a reason why Bratton (2002b) reported in
each of the first four months of 2002 that more Females than Males made personal
health enquiries at Healthinfo.
The results of the test on hypothesis 2 rejects the proposition that the age of
respondents affected their preference for using a public library to find health
information.
The results of the test on hypothesis 3 supports the proposition that the age of
respondents affects their use of the Internet to find health information. The survey
results revealed that 83.8% of the 43 respondents who said they used the Internet to find
health information were in the age range 31-60 with this age range making up 65% of
the library visitor survey respondents. Generalising this finding to Rotherham
community libraries, if we also take into consideration the finding of Nicholas et al.
(2002: 33) that “health website users are typically 35-54”, the author might suggest that
the appeal of the People’s Network in public libraries for finding health information on
the Internet may currently be limited mainly to library visitors in the age range 31-60.
The results of the test on hypothesis 4 rejects the proposition that the use of a
public library to find health information affects preference for using a computer with
Internet access to find health information. The survey results show 26.9% of
85

respondents who use a public library to find health information have used a computer to
find health information, but also 11.4% of respondents who do not use a public library to
find health information have used a computer to find health information. To a certain
extent the latter result may indicate use of the Internet to find health information outside
of Rotherham public libraries, e.g. at home/work/school. Alternatively the results may
also indicate use of the Internet to find health information inside Rotherham public
libraries by people who do not consider Internet searching as using a public library
resource. The author would recommend this as an area for further research.
The results of the test on hypothesis 5 reject the proposition that there is an
association between use of a public library to find out health information and the use of
a librarian. However this is not the same thing as rejecting the proposition that people
need the help of a librarian to find health information on the Internet. The survey results
show 41 out of 67 respondents who said they used a library to find health information
(61.2% of this category) said they have used the help of a librarian to find health
information. By comparison 18 out of 35 respondents who said they have not used a
library to find health information (51.4% of this category) said they also have used the
help of a librarian to find health information. A majority of respondents (57.8% of the
total) have made use of the help of a librarian to find health information. Additional
analysis showed that a higher proportion of respondents who have used the Internet to
find health information have also used the help of a librarian (31%) than the proportion
of respondents who have used the Internet to find health information but have not used
the help of a librarian (13.1%). These findings support the previous findings of Butler
(2002) and the US National Library of Medicine (Wood et al. 2000) that public library
staff should be given training in the location and use of sources of consumer health
information on the Internet to enable them to provide one-on-one tuition for library
users.
86

3.8 Health Enquirer Survey Response
Table 17 Number of completed health enquirer surveys by gender
Questionnaire 2 Age group * Gender Crosstabulation Gender Total No
response Male Female
Age group No response
1 1
16-20 yrs 2 2 21-30 yrs 2 2 31-40 yrs 2 2 41-50 yrs 1 1 51-60 yrs 1 1 1 3 61-70 yrs 1 1 2 Total 2 2 9 13
The response to the health enquirer survey was poor and only 13 completed
surveys were returned. This came despite providing reply-paid envelopes to return the
questionnaires in and despite a change in distribution strategy half way through the
month-long survey period. Where hitherto surveys had been given to people who made
a health enquiry in Rotherham community libraries and in Healthinfo, from the
beginning of the third week the surveys were also given to people who borrowed a
health related book in the community libraries. Given the very small response it is not
possible to generalise the findings of the survey to the wider user community. However
the results are reproduced here because they formed an attempt to answer the last two
research questions:
• Do people who make health enquiries in Healthinfo or Rotherham community
libraries feel the librarians are able to provide them with useful information?
• How do people’s impressions about using NHS Direct compare with using the
Internet and using their library/Healthinfo?
To help answer the first question the surveys that were returned did include
interesting qualitative data from respondents in their answers to Questions 4, 5 & 10. In
order to illustrate how the respondents felt their comments have been reproduced in text
87
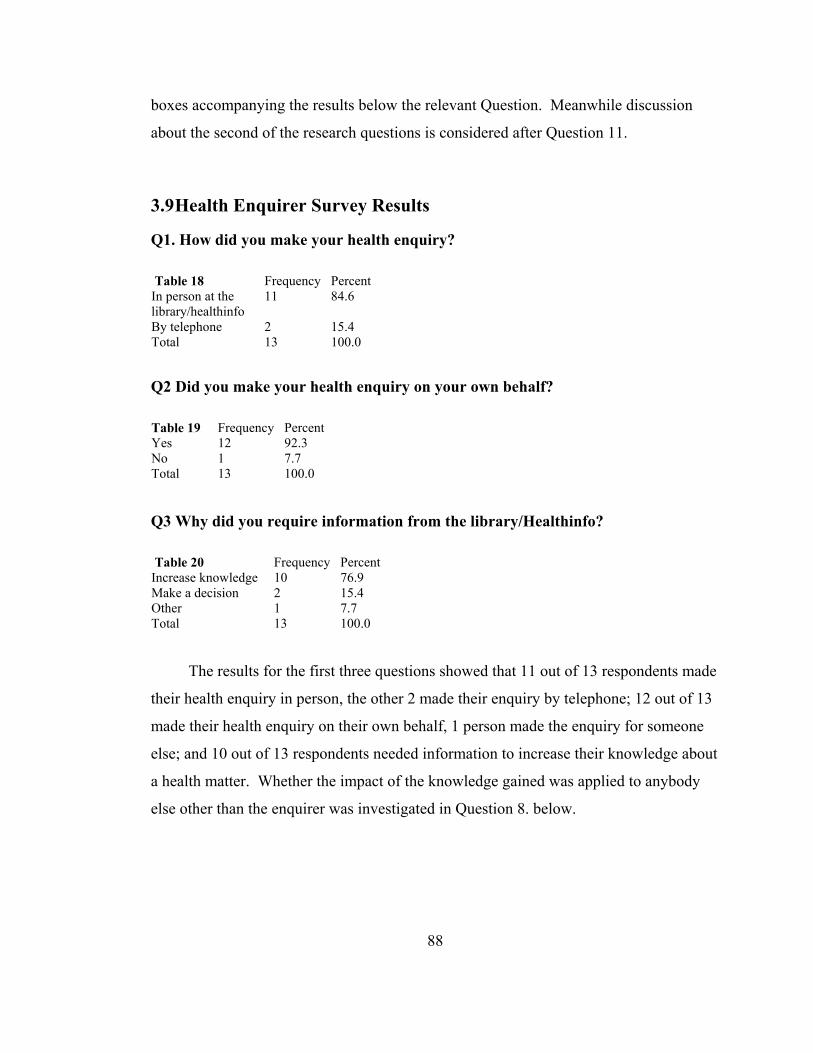
boxes accompanying the results below the relevant Question. Meanwhile discussion
about the second of the research questions is considered after Question 11.
3.9 Health Enquirer Survey Results
Q1. How did you make your health enquiry? Table 18 Frequency Percent In person at the library/healthinfo
11 84.6
By telephone 2 15.4 Total 13 100.0
Q2 Did you make your health enquiry on your own behalf? Table 19 Frequency Percent Yes 12 92.3 No 1 7.7 Total 13 100.0 Q3 Why did you require information from the library/Healthinfo? Table 20 Frequency Percent Increase knowledge 10 76.9 Make a decision 2 15.4 Other 1 7.7 Total 13 100.0
The results for the first three questions showed that 11 out of 13 respondents made
their health enquiry in person, the other 2 made their enquiry by telephone; 12 out of 13
made their health enquiry on their own behalf, 1 person made the enquiry for someone
else; and 10 out of 13 respondents needed information to increase their knowledge about
a health matter. Whether the impact of the knowledge gained was applied to anybody
else other than the enquirer was investigated in Question 8. below.
88

Q4 Was your enquiry answered? Table 21 Frequency Percent Yes, fully 12 92.3 Yes, partially 1 7.7 Total 13 100.0
Health enquirer survey respondents comments: “I was able to get books on all the areas I wanted a better understanding of.” “Found info straight away on the Internet.” “The information received was very useful.” “She told me that she didn’t have info but would send it ASAP (I was happy with that).” “I got the info I was looking for.” “Found the young lady very helpful.” Health enquirer survey respondents constructive criticism/opinions: “I needed more concise information regarding surgery and treatment of a particular ailment.” “Librarians give information, and more in depth help should come from medical sources”
All 13 respondents answered that their enquiry had been answered fully (12/13) or
partially (1/13). One of the replies given above indicates that the respondent was willing
to wait for the information to be sent at a later date. Other respondents appreciated
being able to find the information they wanted “straight away”. The prevailing wisdom,
as described by Barclay & Halsted (2001: 128) is that “Healthcare consumers want
access to information immediately and for free.” However, as described earlier (de
Vekey & Beard, 2002), an ongoing British Library funded pilot project for delivering
medical professional journal literature in five UK public libraries envisages a model of
89
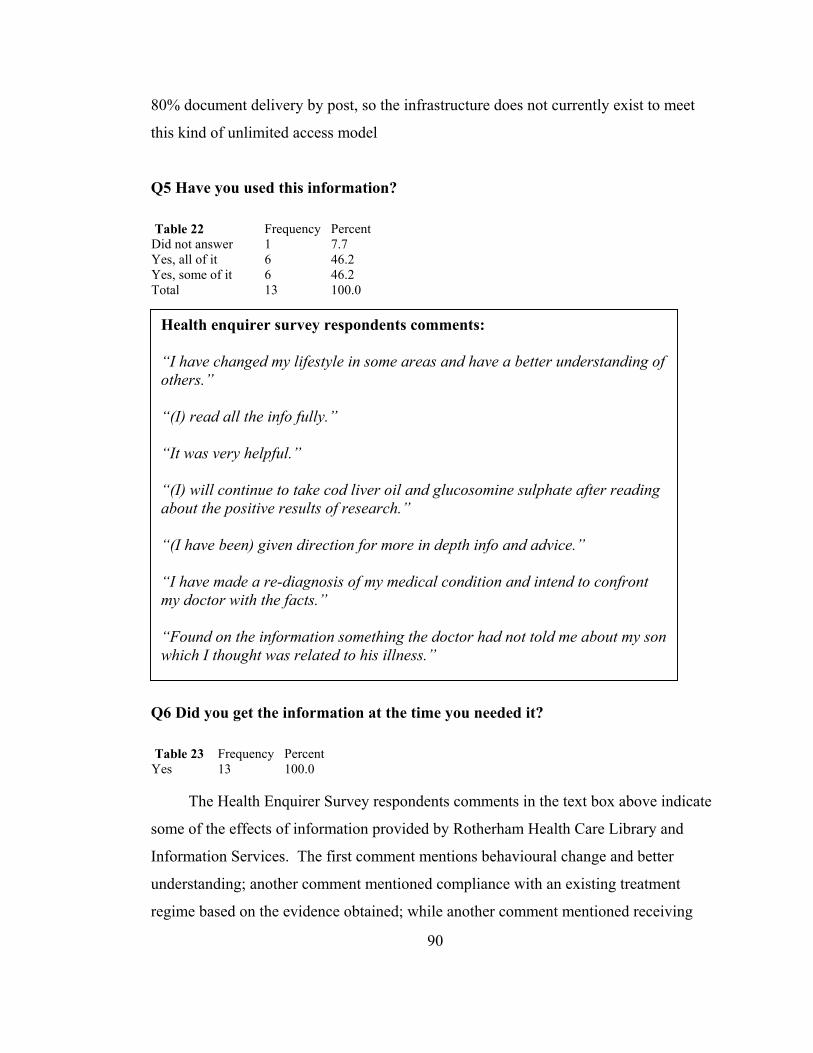
80% document delivery by post, so the infrastructure does not currently exist to meet
this kind of unlimited access model
Q5 Have you used this information? Table 22 Frequency Percent Did not answer 1 7.7 Yes, all of it 6 46.2 Yes, some of it 6 46.2 Total 13 100.0
Health enquirer survey respondents comments: “I have changed my lifestyle in some areas and have a better understanding of others.” “(I) read all the info fully.” “It was very helpful.” “(I) will continue to take cod liver oil and glucosomine sulphate after reading about the positive results of research.” “(I have been) given direction for more in depth info and advice.” “I have made a re-diagnosis of my medical condition and intend to confront my doctor with the facts.” “Found on the information something the doctor had not told me about my son which I thought was related to his illness.”
Q6 Did you get the information at the time you needed it? Table 23 Frequency Percent Yes 13 100.0
The Health Enquirer Survey respondents comments in the text box above indicate
some of the effects of information provided by Rotherham Health Care Library and
Information Services. The first comment mentions behavioural change and better
understanding; another comment mentioned compliance with an existing treatment
regime based on the evidence obtained; while another comment mentioned receiving
90

new information they had not had from their doctor which they thought was important.
12 out of 13 respondents said that they had used either all of the information (6/13) or
some of it (6/13). All 13 respondents said they had received the information at the time
they needed it.
Q7 The staff were able to help me find useful health information or to supply it
later Table 24 Frequency Percent Strongly agree 9 69.2 Agree 2 15.4 Neither agree or disagree 1 7.7 Strongly disagree 1 7.7 Total 13 100.0
Staff helpful?
Strongly disagree
Neither agree or dis
Agree
Strongly agree
Figure 9
Health Enquirer Survey Question 7 results – were staff able to help find useful health information or to supply it later?
91
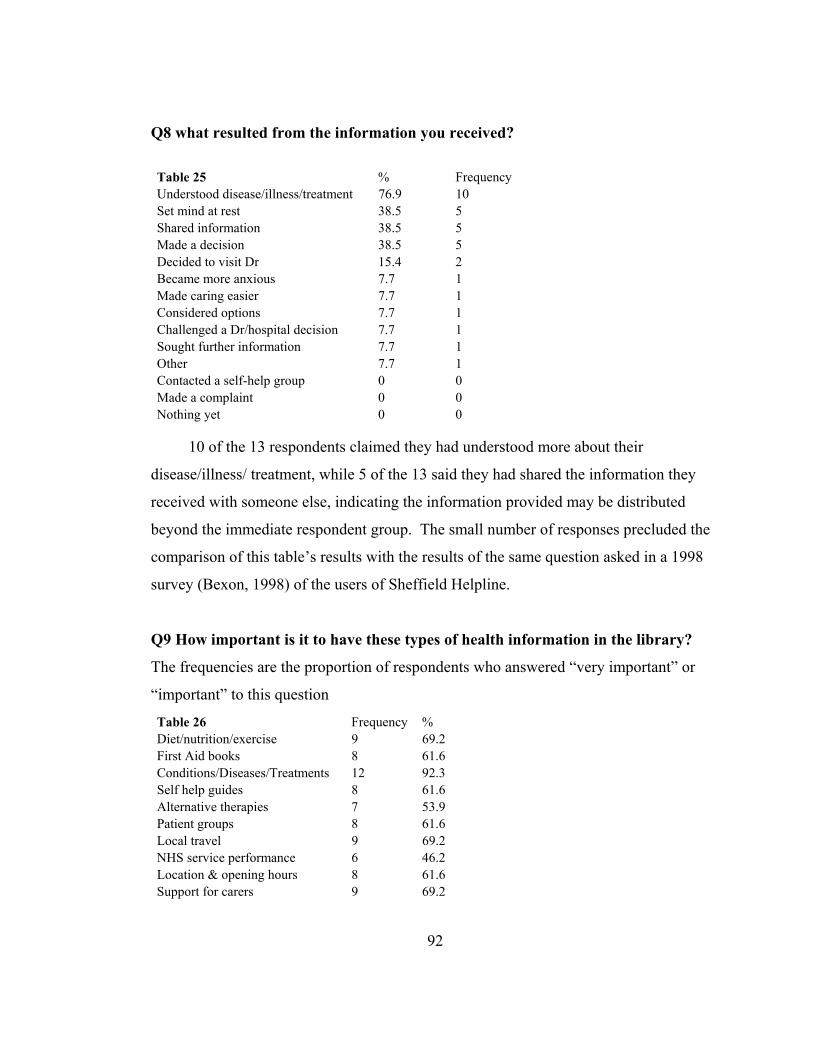
Q8 what resulted from the information you received?
Table 25 % Frequency Understood disease/illness/treatment 76.9 10 Set mind at rest 38.5 5 Shared information 38.5 5 Made a decision 38.5 5 Decided to visit Dr 15.4 2 Became more anxious 7.7 1 Made caring easier 7.7 1 Considered options 7.7 1 Challenged a Dr/hospital decision 7.7 1 Sought further information 7.7 1 Other 7.7 1 Contacted a self-help group 0 0 Made a complaint 0 0 Nothing yet 0 0
10 of the 13 respondents claimed they had understood more about their
disease/illness/ treatment, while 5 of the 13 said they had shared the information they
received with someone else, indicating the information provided may be distributed
beyond the immediate respondent group. The small number of responses precluded the
comparison of this table’s results with the results of the same question asked in a 1998
survey (Bexon, 1998) of the users of Sheffield Helpline.
Q9 How important is it to have these types of health information in the library?
The frequencies are the proportion of respondents who answered “very important” or
“important” to this question
Table 26 Frequency % Diet/nutrition/exercise 9 69.2 First Aid books 8 61.6 Conditions/Diseases/Treatments 12 92.3 Self help guides 8 61.6 Alternative therapies 7 53.9 Patient groups 8 61.6 Local travel 9 69.2 NHS service performance 6 46.2 Location & opening hours 8 61.6 Support for carers 9 69.2
92
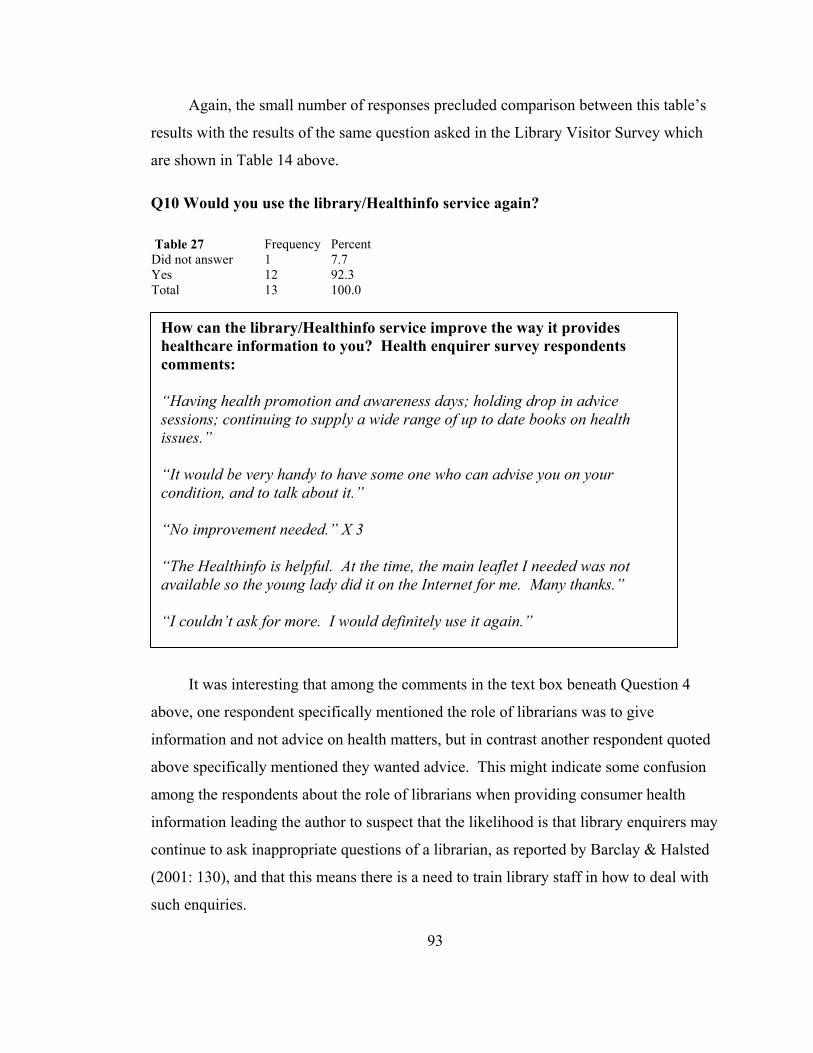
Again, the small number of responses precluded comparison between this table’s
results with the results of the same question asked in the Library Visitor Survey which
are shown in Table 14 above. Q10 Would you use the library/Healthinfo service again? Table 27 Frequency Percent Did not answer 1 7.7 Yes 12 92.3 Total 13 100.0
a
i
a
a
i
c
(
s
How can the library/Healthinfo service improve the way it provides healthcare information to you? Health enquirer survey respondents comments: “Having health promotion and awareness days; holding drop in advice sessions; continuing to supply a wide range of up to date books on health issues.” “It would be very handy to have some one who can advise you on your condition, and to talk about it.” “No improvement needed.” X 3 “The Healthinfo is helpful. At the time, the main leaflet I needed was not available so the young lady did it on the Internet for me. Many thanks.” “I couldn’t ask for more. I would definitely use it again.”
It was interesting that among the comments in the text box beneath Question 4
bove, one respondent specifically mentioned the role of librarians was to give
nformation and not advice on health matters, but in contrast another respondent quoted
bove specifically mentioned they wanted advice. This might indicate some confusion
mong the respondents about the role of librarians when providing consumer health
nformation leading the author to suspect that the likelihood is that library enquirers may
ontinue to ask inappropriate questions of a librarian, as reported by Barclay & Halsted
2001: 130), and that this means there is a need to train library staff in how to deal with
uch enquiries.
93
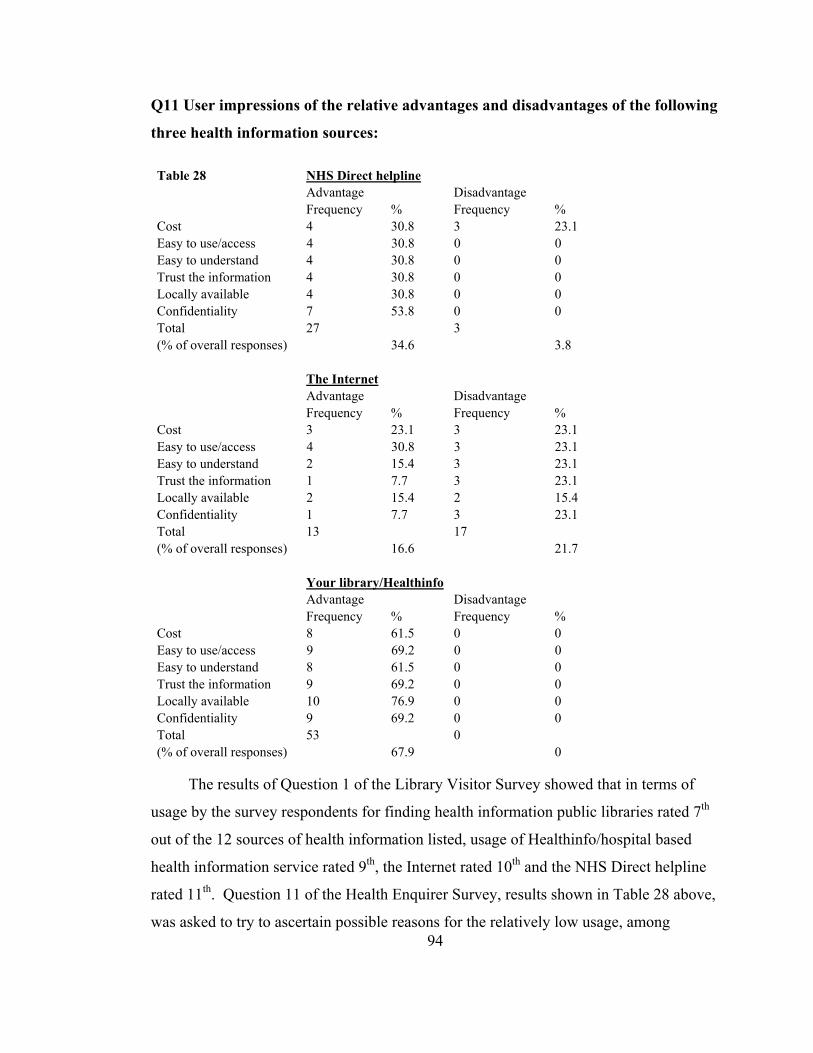
Q11 User impressions of the relative advantages and disadvantages of the following
three health information sources: Table 28 NHS Direct helpline Advantage Disadvantage Frequency % Frequency % Cost 4 30.8 3 23.1 Easy to use/access 4 30.8 0 0 Easy to understand 4 30.8 0 0 Trust the information 4 30.8 0 0 Locally available 4 30.8 0 0 Confidentiality 7 53.8 0 0 Total 27 3 (% of overall responses) 34.6 3.8 The Internet Advantage Disadvantage Frequency % Frequency % Cost 3 23.1 3 23.1 Easy to use/access 4 30.8 3 23.1 Easy to understand 2 15.4 3 23.1 Trust the information 1 7.7 3 23.1 Locally available 2 15.4 2 15.4 Confidentiality 1 7.7 3 23.1 Total 13 17 (% of overall responses) 16.6 21.7 Your library/Healthinfo Advantage Disadvantage Frequency % Frequency % Cost 8 61.5 0 0 Easy to use/access 9 69.2 0 0 Easy to understand 8 61.5 0 0 Trust the information 9 69.2 0 0 Locally available 10 76.9 0 0 Confidentiality 9 69.2 0 0 Total 53 0 (% of overall responses) 67.9 0
94
The results of Question 1 of the Library Visitor Survey showed that in terms of
usage by the survey respondents for finding health information public libraries rated 7th
out of the 12 sources of health information listed, usage of Healthinfo/hospital based
health information service rated 9th, the Internet rated 10th and the NHS Direct helpline
rated 11th. Question 11 of the Health Enquirer Survey, results shown in Table 28 above,
was asked to try to ascertain possible reasons for the relatively low usage, among
Library Visitor Survey respondents, of the NHS Direct helpline and the Internet for
finding health information. Although the number of Health Enquirer Survey
respondents was small, some possible reasons for low usage of the services were
indicated by the results:
• 4 out of 13 respondents rated NHS Direct helpline as having advantages of cost, ease
of access, use and understanding, trust and local availability. 7 out of 13 respondents
rated the NHS Direct helpline as having the advantage of confidentiality. The only
disadvantage respondents reported was the cost of using the service (3 out of 13),
suggesting cost of retrieving information is a concern for some service users to an
extent that it might dissuade them from using the service;
• The Internet was rated disfavourably (i.e. more people rated the following factors as
disadvantages than rated them as advantages) in terms of ease of understanding, trust
and confidentiality. Respondents were evenly split on the issues of cost and local
availability. In the area of ease of access alone did respondents rate the Internet
more favourably. The mixed results suggest there are obstacles to overcome in
terms of people’s perceptions of the Internet as a source of health information, and
that these might well include the issues of user training, identifying trustworthy
sources of information and taking steps to safeguard the confidentiality of users,
mentioned above in the results of Question 1 of the Library Visitor Survey;
• The community libraries/Healthinfo scored well with an overall 67.9% rating by
respondents of the advantages offered by the services in terms of cost, ease of
access, use and understanding, trust, local availability and confidentiality. However
again the small size of the sample must be emphasised and while none of the
respondents mentioned any disadvantages this should not be taken to mean a 100%
satisfaction with the service. For instance if 9 out of the 13 respondents rated
confidentiality as an advantage offered by their community library/Healthinfo when
finding health information what did the other 4 respondents who did not answer
think? This sort of question can only be answered in follow up interviews with
survey respondents, which method was used in a study of the effectiveness of the
provision of consumer health information by Sweetland (2000). The author would
95

suggest that a combination of a Health Enquirer Survey together with follow up
interviews with respondents would be a suitable method for engaging service users
to find out more in-depth information about the effects of consumer health
information provision.
Q12 Which of these statements closely describes the health of yourself or the person
for which you were enquiring?
Table 29 Frequency % Healthy 3 23.1 Might be ill 2 15.4 Diagnosed as ill 2 15.4 Self-diagnosed as ill 0 0 Receiving treatment/medication 6 46.2 Not receiving treatment/medication 2 15.4 Living with long-term illness 6 46.2 Other 1 7.7
Respondents who were receiving treatment or medication (6 out of 13) or who
were living with a long term illness (6 out of 13) were the largest groups. 2 respondents
mentioned the name of the condition/illness they were looking for information about
(osteo-arthritis, and diabetes). 1 respondent wanted information about surgical treatment
for a particular ailment. 1 respondent said they had made a re-diagnosis of their
condition and would use the information to “confront” their doctor. These findings
appear to support Butler’s (2002) finding that the people most likely to ask health
questions in a public library are those who have been diagnosed as being ill and who are
seeking information about the illness. 3 respondents were self-described as ‘healthy’
and were not looking for information for someone else. This suggests that consumer
health information resources in Rotherham libraries may also be used for educational or
precautionary purposes. 1 healthy respondent said they needed diagrams and an
explanation of the workings of the small/large bowel for a course for work. 1 healthy
respondent said they needed information about a disease/illness or treatment so that it
would make caring for an ill or disabled person easier, furthermore they had shared the
information with family or friends. 1 healthy respondent wanted information about a
disease/illness or treatment and had made a health related decision based on the 96

information they had received, they commented they had changed their lifestyle in some
areas as a result.
97
Conclusions
What was learnt
The response to the Library Visitor Survey was good. The total number of
completed surveys from the three libraries was 111, which number exceeded the 95%
confidence sample size of 97. In contrast the response to the Health Enquirer Survey
was not as good as only 13 completed surveys were returned. However the results of the
Health Enquirer Survey did reveal useful qualitative responses that help illustrate the
effects of health information provided in Rotherham libraries.
What sources do Rotherham library users say they use to find health information?
Doctor/GP came out top of the Library Visitor Survey, with 84.8% of respondents
saying they had used their Doctor at some point to find out health information. Public
Library came 7th with 65.7%, ahead of the Internet (44.4%) and the NHS Direct helpline
(30%). The first 6 sources in Table 10 also appeared in the top 6 sources in the results
of two previous surveys of the sources of information people use to find health
information (NOP Market Research Limited, 1988; Office of Health Economics, 1994).
What types of health information do Rotherham library users prefer to use in
public libraries and in what format do people prefer to obtain information?
The top 6 most important types of consumer health information that Library
Visitor Survey respondents said were important to have in public libraries are: the
location and opening hours of local health services (63%); information about sources of
support for carers (57%); information about diet, nutrition and exercise (54%);
information about common conditions, diseases and their treatments (54%); local travel
arrangements (52%); and information about NHS service performance (52%). The most
preferred formats used to find health information in Rotherham public libraries are
books (72.1%) and the help of a librarian (56.8%). A large proportion of respondents to
the library visitor survey (52.3%) said they would use a touch screen kiosk in a library to
find health information and this was attributed to the convenience of using a kiosk as
98

opposed to using a computer. However more respondents said they had used a computer
(21.6%) than had used a kiosk (12.6%) to find health information.
Are there any improvements to service provision that users can identify?
7 people said they would like to see more promotional events, a greater awareness
of current health campaigns or to have visiting speakers to give talks on health topics. 1
respondent in Dinnington library requested access to video/TV facilities in that library to
play the health videos available. 2 respondents indicated a need for clear signage in
Dinnington and Maltby libraries to point out the location of health information
resources.
What are the effects of health information provided by Rotherham libraries on
people who have made a health enquiry?
Comments made by respondents indicated that effects included: behavioural
change and better understanding; compliance with an existing treatment regime based on
evidence obtained in Rotherham libraries; and receiving new information, not from their
doctor, which they thought was important. Comments also indicated some confusion
among the respondents about the role of librarians when providing consumer health
information. There is a need to train library staff in how to deal with health enquiries so
that they always present information but not advice, and there is also an equal need to
educate library users about the limitations of the health services that can be offered in
public libraries.
Is age a determinant of Internet use in Rotherham community libraries to find out
health information?
The results of the second χ² test supported the hypothesis “There is no statistically
significant probability that there is an association (p <.05) between age of respondents
and the use of a public library to find out health information”. However the results of
the third χ² test rejected the hypothesis “There is no statistically significant probability
that there is an association (p <.05) between age of respondents and the use of the
99

Internet in a public library to find out health information”. The results of the Library
Visitor Survey showed 83.8% of the 43 respondents who said they used the Internet to
find health information were in the age range 31-60. This leads the author to suggest
that the appeal of the People’s Network for finding health information may currently be
limited mainly to library visitors in this age range.
Are people who use public libraries to find out health information likely to have
used a computer and made use of the help of a librarian?
The survey results show 41 out of 67 respondents who said they used a library to
find health information (61.2% of this category) say they have used the help of a
librarian to find health information. Analysis also showed that a higher proportion of
respondents who have used the Internet to find health information have used the help of
a librarian (31%) than the proportion of respondents who have used the Internet to find
health information but have not used the help of a librarian (13.1%). These findings
support the findings of two previous studies (Butler, 2002; Wood et al., 2000) that have
recommended that public library staff should be given training in the location and use of
sources of consumer health information on the Internet to enable them to provide one-
on-one tuition for library users.
Do people who make health enquiries in Healthinfo or Rotherham community
libraries feel the librarians are able to provide them with useful information?
All 13 Health Enquirer Survey respondents answered that their enquiry had been
answered fully (12/13) or partially (1/13). 12 out of 13 respondents said that they had
used either all of the information (6/13) or some of it (6/13). 5 of the 13 said they had
shared the information they received with someone else. All 13 respondents said they
had received the information at the time they needed it.
100
How do people’s impressions about using NHS Direct compare with using the
Internet and using their library/Healthinfo?
The low ranking of the use of the Internet and NHS Direct helpline as sources of
consumer health information was examined further in the Health Enquirer Survey and in
the results of that survey the issue of cost was raised as a disadvantage of using NHS
Direct helpline, while the issues of its ease of understanding, low trust and
confidentiality were raised as disadvantages of using the Internet. The community
libraries/Healthinfo scored well with an overall 67.9% positive rating by respondents of
cost, ease of access, use and understanding, trust, local availability and confidentiality as
advantages of using Rotherham library and information services to find health
information.
Future research directions
Firstly I would argue that the data collection and sample strategy for the Library
Visitor Survey worked well. I was able to collect a substantial number of completed
questionnaires in person at the community libraries in a 3 week survey period. I would
not hesitate to recommend the methodology and methods employed to future researchers
who may want to produce comparisons with this research. It would for instance be
interesting to carry out the survey in 5 years time, when the People’s Network project
has matured, to see how future survey respondents rate the Internet as a source for
finding consumer health information.
The Library Visitor Survey did not measure the proportion of public library visits
made with the intention of finding health information. It would also be interesting for
future researchers to enquire of those visitors who were making their visit to find health
information what sources of information they were likely to use during their visit.
A surprising finding from the Library Visitor Survey was that more respondents
said they would use a touch screen information kiosk (52.3%) than said they would use a
computer (45.9%) in a library to find health information despite the fact that more
101
respondents said they had used a computer (21.6%) than had used a kiosk (12.6%) to
find health information. I have suggested that the perceived convenience of using a
touch screen kiosk may be an explanatory factor, however I would recommend that a
future direction for research would be to investigate the reasons behind this result and to
question whether more people would use a touch screen kiosk than a computer with
Internet access to find out health information if more health kiosk facilities were made
available in public libraries.
If the future researcher were interested in evaluating usage of the People’s Network to
find health information I would suggest an additional area to investigate should be the
use of the Internet to find health information outside of Rotherham public libraries at
home, work or school. Another area of research would be to find out from those who
use the Internet in community libraries how they perceive the People’s Network: as a
local authority library resource; as a central government resource; as a mixture of both;
or with a different ‘owner’; and whether their response affects what kinds of health
resources they believe should be delivered on the desktop. Another area of research
would be to investigate how the requirement on public library authorities to facilitate
access by the disabled to the People’s Network, to comply with the Disability
Discrimination Act 1995, affects the type of IT equipment bought for use in public
libraries.
The percentage of the annual book replacement budget that should be spent on
buying consumer health information books cannot be stated without the measurement of
the use of health books as a proportion of total circulation, based on actual book
circulation figures for Rotherham community libraries. This measure needs to be made
to support future health book budgeting decision making.
Worth, Tierney & Watson (2000) argued there is a need for PALS and community
nurses to have access to a high quality evidence base in the community. However de
Vekey and Beard (2002) have also described the high document delivery costs involved
102
in delivering professional medical journal literature in public libraries. There are no
easy solutions but the proposed bid for a full time community health project worker
based in the Patient Health Information Service to support and develop the health
information project in the community libraries would enable local solutions to be
investigated and trialled while maintaining service levels.
Evaluating the research - shortcomings
The author did not collect resource circulation or in-house use statistics and the
research was not therefore a formal evaluation of the community health information
pilot project against planned performance objectives based on such measures. This
evaluation may still need to be conducted by Rotherham Health Care Library and
Information Services.
Shortcomings in the way the Library Visitor Survey was carried out were that had
the Survey been administered in Greasbrough library for the whole survey week there,
more completed questionnaires would have been collected. The results of the survey
suggest that potentially an additional 20-30 completed questionnaires may have been
collected during the 3 days the survey was not administered in Greasbrough. In the
event this was not in itself a problem as the survey gathered a more than sufficient
number of completed questionnaires for the purposes of drawing a sample with a 95%
confidence interval of ±7%. If this type of research exercise were to be scaled up to
reduce the confidence interval then, based on the results of this survey, if one could
place a second volunteer in the same three community libraries at different hours, but
covering the same amount of opening time, or if one volunteer doubled the number of
survey hours, and if the survey period in each library were extended by an extra two
weeks, making the survey period three weeks for each library, this could result in up to
400 completed surveys being collected in each library. This figure would exceed the
CIPFA CPLS (1995: 5) recommended figure of 375 completed surveys for each library,
that they calculated would ensure a 95% confidence interval of ±3%. This is the
standard sample size recommended by CIPFA for the carrying out of CIPFA PLUS
103
surveys for the purposes of inter-library comparison within one local authority area.
However this would extend the survey period to 9 weeks, which is probably not feasible
for a small MSc project. In any case this would simply narrow the confidence interval
and not increase the likelihood of including non-users or those who refuse to be included
in the survey.
The second, Health Enquirer Survey, questionnaire suffered from a poor response
rate, and several factors could have caused this. Firstly the distribution strategy meant
participants were self-selecting and not randomly selected. Secondly although the
questionnaire was handed out with a reply paid envelope the requirement to maintain
confidentiality meant that name and address data was not collected so it was not possible
to follow up distribution with chase letters after a suitable interval asking participants to
return the questionnaire. Thirdly the sample size was always going to be smaller (the
original estimate was that 30 completed survey would be returned) than a size that
would allow a statement of confidence to be made and applied to the results. On the
other hand, the Health Enquirer Survey did provide useful qualitative responses that
were analysed honestly and objectively to the best of the author’s ability. However the
poor response rate and inability to calculate a statement of confidence meant that it was
not possible to generalise the findings of the survey to the wider user community. The
author must conclude that a combination of a more rigorous sample and distribution
strategy together with follow up interviews with respondents would have been a more
suitable method for engaging service users to find out more in-depth information about
the effects of consumer health information provision.
Evaluating the research – benefits, applications
To the best of the author’s knowledge, Table 10 represents the first comparison
of consumer preference for using public libraries with other information sources as a
source of health information. The results are generalisable to the sample of Rotherham
library visitors in the three community libraries during the survey period and within the
sample constraints. It was instructive to compare Table 10 with the results of the two
104

earlier surveys to find out what sources Rotherham library visitors use to find consumer
health information.
Measuring the preference of library visitors for different types of health
information will hopefully provide some direction for Rotherham Health Care Library
and Information Services development of “a package of health information digital
content for network delivery.” The finding that use of the Internet to find health
information may appeal mainly to those in the 30-60 age group also has implications for
the Service in that there appears to be a need to promote awareness about the potential
and capabilities of the People’s Network for finding health information to library visitors
in the age groups outside the 30-60 age range.
Finally I believe that the findings of my research support the current funding
proposals put forward by Rotherham Health Care Library and Information Service for a
full time community health project worker and for the co-location of the Patients Library
with the Healthinfo service in Rotherham District General Hospital.
THE END
Word count, from Introduction to Conclusions, 25,244 words.
105
References
American Association of Museums. (1990). Visitor surveys: a users manual.
Washington, DC: American Association of Museums.
Audit Commission. (2002). Briefing: AC Knowledge Learning from audit, inspection
and research: Building Better Library Services [Online]. London: Audit Commission.
http://www.audit-commission.gov.uk/publications/pdf/ACKLibrariesbr.pdf [Accessed 1
August 2002].
Baker, L. M. (1995). “A new method for studying patient information needs and
information seeking patterns”. In: Lloyd-Williams, M. (ed.), Proceedings of SHIMR ’95,
pp.67-75. Sheffield: Centre for Health Information Management Research, University of
Sheffield.
Baker, S. L. & Lancaster, F. W. (1991). The measurement and evaluation of library
services. [2nd ed.]. Arlington, Virginia: Information Resources Press.
Barclay, D. & Halsted, D. D. (2001). The Medical Library Association consumer health
reference service handbook. New York: Neal-Schuman Publishers, Inc.
Beard, J. & Madge, B. (2002). “Working with public libraries to enhance access to
quality-assured health information for the lay public: a case study”. A paper given on
15th July 2002 at Health Information United, 2002 Health Libraries Group conference.
14-17 July, 2002, Edinburgh Conference Centre, Heriot-Watt University, Edinburgh.
Bexon, N. (1998). Assessing the value and impact of health information gained by the
consumer, with specific reference to Sheffield Healthline. MA, University of Sheffield.
106

Bohme, S. & Spiller, D. (eds.) (1999). Perspectives of public library use 2: a
compendium of survey information. Loughborough University: Library and Information
Statistics Unit.
Booth, A. (2002). Appraising a user study: key questions to help you make sense of a
user study. A handout given to the author by Booth during a seminar for the INF 6370
Healthcare Information module on 24 May 2002.
Booth, A. & Walton, G. (eds.) (2000). Managing knowledge in health services. London:
Library Association Publishing.
Bratton, D. (2002a) ([email protected]) (16th July 2002) Mission/Vision.
Personal email to P. Levett ([email protected]).
Bratton, D. (2002b) ([email protected]) (8th May 2002) Healthinfo stats.
Personal email to P. Levett ([email protected]).
Bratton, D. (2002c) ([email protected]) (8th May 2002) FW: Library stats.
Personal email to P. Levett ([email protected]).
Bratton, D. (2002d) ([email protected]) (2nd July 2002) FW: Library stats.
Personal email to P. Levett ([email protected]).
Browne, H. & Poulter, J. (2002). Expert Patients Programme: a new approach to
chronic disease management. What is it?. Barnsley: Kendray Hospital, Clinical
Governance Support Department.
107
Butler, L. (2002). “Health information and the NeLH in Public Libraries”. A paper given
at the New Advances in Patient Information conference. 29 April, 2002, Kings Fund,
London. London: CILIP Health Libraries Group and the Consumer Health Information
Consortium.
Chartered Institute of Public Finance and Accountancy (CIPFA), Committee on Public
Library Statistics (CPLS). (1995). A standard for the undertaking of user surveys in
public libraries in the United Kingdom: a manual of guidance. Croydon: Institute of
Public Finance Ltd.
Childs, S. M. (1992). Developing a health information plan. Newcastle: Information
North.
Childs, S. M. (1993). Health Information in the North: a plan for the future. Newcastle:
Information North.
Coulter, A., Entwistle, V. & Gilbert, D. (1998). Informing patients: an assessment of the
quality of patient information materials. London: King’s Fund Publishing.
Coulter, A., Entwistle, V. & Gilbert, D. (1999). “Sharing decisions with patients: is the
information good enough?”. British Medical Journal, [Online]. 318 (7179), 318.
http://bmj.com/cgi/content/full/318/7179/318 [Accessed 15 April 2002].
Coulter, A. (2002). “After Bristol: putting patients at the centre”. British Medical
Journal, [Online]. 324 (7338), 648-651. http://bmj.com/cgi/content/full/324/7338/648
[Accessed 15 April 2002].
Department of Health. (1991). Patients Charter. London: The Stationery Office.
108

Department of Health. (1997). New NHS: modern, dependable [Online]. London: The
Stationery Office. http://www.archive.official-
documents.co.uk/document/doh/newnhs/wpaper3.htm [Accessed 22 July 2002].
Department of Health. (1998). Information for Health: An Information Strategy for the
Modern NHS 1998–2005. A national strategy for local implementation [Online].
London: The Stationery Office.
http://www.nhsia.nhs.uk/def/pages/info4health/contents.asp [Accessed 1 August 2002].
Department of Health. (1999). Saving Lives: Our Healthier Nation [Online]. London:
The Stationery Office. http://www.archive.official-
documents.co.uk/document/cm43/4386/4386-03.htm#3.27 [Accessed 22 July 2002].
de Vekey, J. & Beard, J. (2002). British Library Co-operation & Partnership
Programme No. 6: Working with public libraries to enhance lay persons’ access to
quality-assured health information: Draft interim feedback report. Bournemouth
University: Academic Services.
Disability Rights Commission. (2002). 2004 what it means to you: a guide for service
providers [Online]. Stratford-upon-Avon: Disability Rights Commission.
http://www.drc-gb.org/drc/Documents/DRC_8pp.pdf [Accessed 2 August 2002].
Dunn, N. (2002). “Commentary: Patient centred care: timely, but is it practical?”. British
Medical Journal, [Online]. 324 (7338), 648-651.
http://bmj.com/cgi/content/full/324/7338/648 [Accessed 15 April 2002].
Eysenbach, G. & Köhler, C. (2002). “How do consumers search for and appraise health
information on the world wide web? Qualitative study using focus groups, usability
tests, and in-depth interviews”. British Medical Journal [Online], 324 (7337), 573.
http://bmj.com/cgi/content/full/324/7337/573 [Accessed 30 May 2002].
109
Fink, A. (1995). How to sample in surveys. London: Sage Publications.
Foster, J. (1999). “Expectations of a 10 minute consultation need to be more realistic”.
British Medical Journal [Online], 319 (7208), 525 #4451.
http://bmj.com/cgi/eletters/319/7208/525#4451 [Accessed 30 July 2002].
Gann, R. (1995). “Consumer health information: information for the public, patients and
carers”. In: Carmel, M. (ed.), Health care librarianship and information work, pp.59-71.
London: Library Association Publishing.
Gibbs, S. (1995). “Medicines and the role of patient information leaflets”. In: Griffin, J.
(ed.) (1995). Health information and the consumer: papers from a symposium held on
30th November 1994, pp.25-30. London: Office of Health Economics.
Griffin, J. (ed.) (1995). Health information and the consumer: papers from a symposium
held on 30th November 1994. London: Office of Health Economics.
Hernon, P. (1993). Statistics for library decision making: a handbook. Norwood, New
Jersey: Ablex Publishing Corporation.
Irving, R. & Smith, C. (1998). No sweat: the indispensable guide to reports and
dissertations. Corby: Institute of Management Foundation.
Ley, P. (1988). Communicating with patients: improving communication, satisfaction
and compliance. London: Chapman and Hall.
Library and Information Commission. (1997). New library: the people’s network
[Online]. London: Library and Information Commission.
http://www.ukoln.ac.uk/services/lic/newlibrary/full.html [Accessed 22 July 2002].
110

Library and Information Statistics Unit. (2001). 2001 Library & information statistics
tables for the United Kingdom. Loughborough University: Library and Information
Statistics Unit.
MacDougall, J. & Brittain, J. M. (1992). Use of information in the NHS. Boston Spa:
British Library, Research and Development Department.
Marshall, J. (1995). “Assessing the impact of information on health decision-making”.
In: Lacroix, E. M. (ed.), Health information for the global village, pp. 180-184.
Washington, DC: Local Organising Committee, 7th International Congress on Medical
Librarianship.
MHWLG Domiciliary Services Subject Group. (1991). Library Association guidelines
for library services to people who are housebound. London: Library Association.
Miller, S. M., Leinbach, A. & Brody, D. S. (1989). “Coping style in hypertensive
patients: nature and consequences”. Journal of Consulting and Clinical Psychology, 57
(3), 333-337.
Moore, D. S. (1997). Statistics: concepts and controversies. [4th ed.]. New York: W. H.
Freeman and Company.
MORI Social Research Institute. (2002). Perceptions of libraries: desk research
conducted for Audit Commission [Online]. London: MORI http://www.audit-
commission.gov.uk/publications/doc/morilibraries.DOC [Accessed 6 May 2002].
111

Nankivell, C. & McNicol, S. (2002). “Value, impact and use of NeLH in public
libraries”. A paper given on 15th July 2002 at Health Information United, 2002 Health
Libraries Group conference. 14-17 July, 2002, Edinburgh Conference Centre, Heriot-
Watt University, Edinburgh.
National Consumer Council. (1998). Consumer concerns 1998: a consumer view of
health services, the report of an RSL survey. London: National Consumer Council.
(Report No. PD59/D/98).
NHS Regional Librarians Group. (2000). A survey of NHS libraries: statistics from the
NHS Regional Librarians Group 1999-00 [Online]. London: NHS Regional Librarians
Group, Quality and Statistics Panel. http://www.londonlinks.ac.uk/rlg/documents/NHS
LibrarySurvey_1999-2000.pdf [Accessed 30 May 2002].
Nicholas, D., Huntingdon, P., Williams, P., & Gunter, B. (2001). “Delivering consumer
health information digitally: platform comparisons”. In: Graham, C. (ed.) Online
Information 2001 Proceedings. Proceedings of the 25th Online Information conference.
4-6 December, 2001, Olympia Grand Hall, London. pp.145-153. Oxford: Learned
Information Europe Ltd.
Nicholas, D., Gunter, B., Withey, R., Huntingdon, P., & Williams, P. (2002). “The
digital information consumer”. Library and Information Update, 1 (1), pp.32-34.
NOP Market Research Limited. (1988). Consumer health education survey prepared by
NOP Market Research Limited for Health Education Authority: Summer 1987 and
Winter 1988. London: Health Education Authority.
O’Connor, P. (2002). “Determining the impact of health library services in patient care:
a review of the literature”. Health Information and Libraries Journal, 19, 1-13.
112
O’Connor, A. M., Rostom, A., Fiset, V., Tetroe, J., Entwistle, V., Llewellyn-Thomas,
H., Holmes-Rovner, M., Barry, M. & Jones, J. (1999). “Decision aids for patients facing
health treatment or screening decision: systematic review”. British Medical Journal,
[Online]. 319 (7212), 731-734. http://bmj.com/cgi/content/full/319/7212/731 [Accessed
15 April 2002].
Office of Health Economics. (1994). “Health education and the consumer”. Table 1.
Reproduced as Table 12.1 in: Katz, J., Peberdy, A. & Douglas, J. (eds) (2000).
Promoting health: knowledge and practice. Houndsmills, Basingstoke: Macmillan Press
Ltd.
Office for National Statistics. (2001). UK2002: the official yearbook of Great Britain
and N.Ireland. London: The Stationery Office.
Pifalo, V., Hollander, S., Henderson, C. L., DeSalvo, P. & Gill, G. P. (1997). “The
impact of consumer health information provided by libraries: the Delaware experience”.
Bulletin of the Medical Library Association, 85 (1), 16-22.
Rees, A. M. (1994). The consumer health information source book. [4th ed.]. Phoenix,
Arizona: The Oryx Press.
Rotherham Metropolitan Borough Council. (2001). Draft annual library plan 2001
[Online]. Rotherham: Rotherham Metropolitan Borough Council, Libraries, Museums
and Arts Services.
http://www.libplans.ws/plans/2001/metropolitan/E4403_rotherham.pdf [Accessed 23
July 2002].
Ryder, J. (2002). Directory of health library and information services in the United
Kingdom and the Republic of Ireland. [11th ed.]. London: Library Association
Publishing.
113
Stephen, P. & Hornby, S. (1997). Simple statistics for library and information
professionals. [2nd ed.]. London: Library Association Publishing.
Stone, L. (1995). “The role of pharmacists”. In: Griffin, J. (ed.) (1995). Health
information and the consumer: papers from a symposium held on 30th November 1994,
pp. 46-50. London: Office of Health Economics.
Sweetland, J. (2000). “Users’ perceptions of the impact of information provided by a
Consumer Health Information service: an in-depth study of six users”. Health Libraries
Review, 17, 77-82.
Wood, F. B., Lyon, B., Schell, M. B., Kitendaugh, P., Cid, V. H. & Siegel, E. R. (2000).
“Public library consumer health information pilot project : results of a National Library
of Medicine evaluation”. Bulletin of the Medical Library Association, 88 (4), 314-322.
Worth, A., Tierney, A. J. & Watson, N. T. (2000). “Discharged from hospital: should
more responsibility for meeting patients and carers information needs now be shouldered
in the community.” Health and Social Care in the Community, 8 (6), 398-405.
114
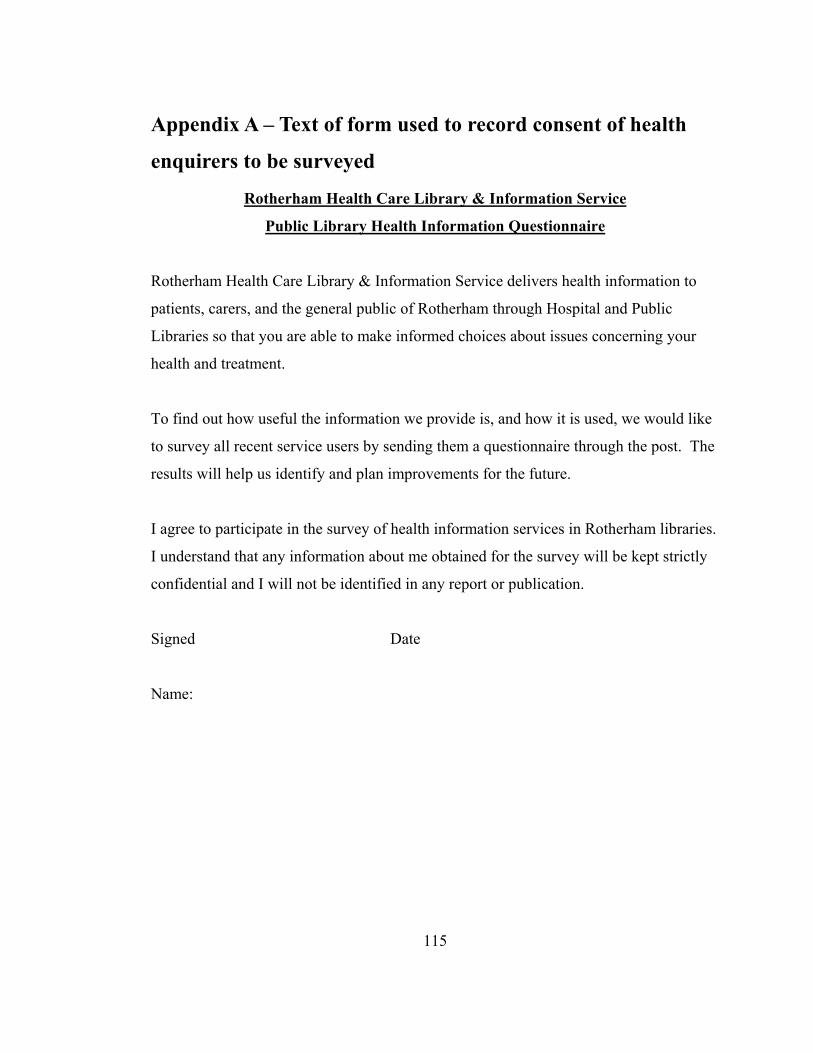
Appendix A – Text of form used to record consent of health
enquirers to be surveyed
Rotherham Health Care Library & Information Service
Public Library Health Information Questionnaire
Rotherham Health Care Library & Information Service delivers health information to
patients, carers, and the general public of Rotherham through Hospital and Public
Libraries so that you are able to make informed choices about issues concerning your
health and treatment.
To find out how useful the information we provide is, and how it is used, we would like
to survey all recent service users by sending them a questionnaire through the post. The
results will help us identify and plan improvements for the future.
I agree to participate in the survey of health information services in Rotherham libraries.
I understand that any information about me obtained for the survey will be kept strictly
confidential and I will not be identified in any report or publication.
Signed Date
Name:
115
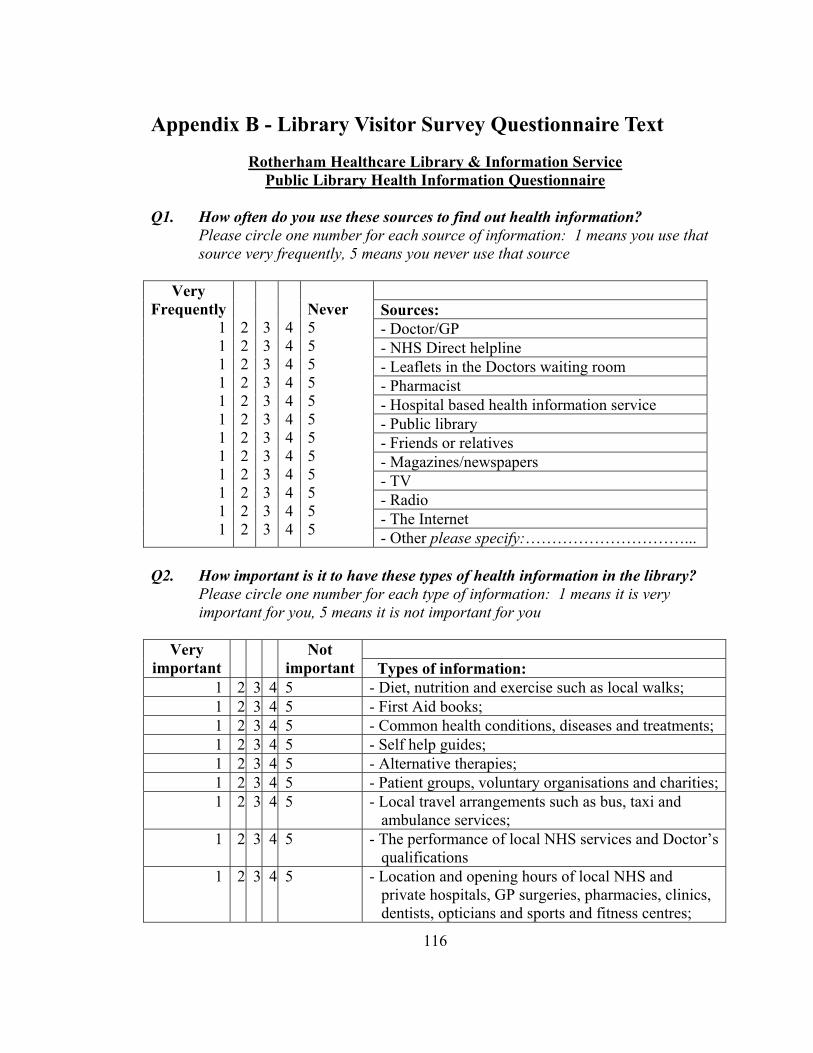
Appendix B - Library Visitor Survey Questionnaire Text
Rotherham Healthcare Library & Information Service Public Library Health Information Questionnaire
Q1. How often do you use these sources to find out health information?
Please circle one number for each source of information: 1 means you use that source very frequently, 5 means you never use that source
Sources: - Doctor/GP - NHS Direct helpline - Leaflets in the Doctors waiting room - Pharmacist - Hospital based health information service - Public library - Friends or relatives - Magazines/newspapers - TV - Radio - The Internet
Very Frequently
1 1 1 1 1 1 1 1 1 1 1 1
2 2 2 2 2 2 2 2 2 2 2 2
3 3 3 3 3 3 3 3 3 3 3 3
4 4 4 4 4 4 4 4 4 4 4 4
Never 5 5 5 5 5 5 5 5 5 5 5 5 - Other please specify:…………………………...
Q2. How important is it to have these types of health information in the library?
Please circle one number for each type of information: 1 means it is very important for you, 5 means it is not important for you
Very important
Not important Types of information:
1 2 3 4 5 - Diet, nutrition and exercise such as local walks; 1 2 3 4 5 - First Aid books; 1 2 3 4 5 - Common health conditions, diseases and treatments; 1 2 3 4 5 - Self help guides; 1 2 3 4 5 - Alternative therapies; 1 2 3 4 5 - Patient groups, voluntary organisations and charities;1 2 3 4 5 - Local travel arrangements such as bus, taxi and
ambulance services; 1 2 3 4 5 - The performance of local NHS services and Doctor’s
qualifications 1 2 3 4 5 - Location and opening hours of local NHS and
private hospitals, GP surgeries, pharmacies, clinics, dentists, opticians and sports and fitness centres;
116

1 2 3 4 5 - Information that can help you adjust to a new situation and help you care for someone else such as benefits for carers, support groups and respite care services
Q3. If we did not mention in Question 2 a type of health information that you feel
is very important, please explain below what that type of health information is: ……………………………............................................................................................ Q4. Have you used these materials in the library, or if you have not would you
consider using them? Please cross one box for each material:
Material: - Reference books, encyclopaedias, dictionaries and directories - Books - Newspapers/magazines - Video or audio tapes - Computer to use the Internet or a CD-ROM - Touch screen information kiosk - Help from a librarian to answer my enquiry
I have used it
[ ] [ ] [ ] [ ] [ ] [ ] [ ] [ ]
I would use it [ ] [ ] [ ] [ ] [ ] [ ] [ ] [ ] - Other please specify:…………………………...
Q5. How can the library improve the way it provides healthcare information to you? ……………………………............................................................................................ The following information is useful to us for statistical purposes. This questionnaire is anonymous. Please return this questionnaire even if you do not answer these particular questions. Are you: [ ] Male [ ] Female To which age group [ ] 15 years or under [ ] 41-50 years Do you belong? [ ] 16-20 years [ ] 51-60 years [ ] 21-30 years [ ] 61-70 years [ ] 31-40 years [ ] 71 + years Thank you very much for filling in this questionnaire. PLEASE PUT THE QUESTIONNAIRE IN THE BOX ON THE LIBRARY ISSUE DESK ON YOUR WAY OUT TODAY. Alternatively please post it in a stamped envelope addressed to:
117
Rotherham Healthcare Library & Information Service, Libraries Suite, Rotherham District General Hospital, Moorgate Road, Rotherham, S60 2UD.
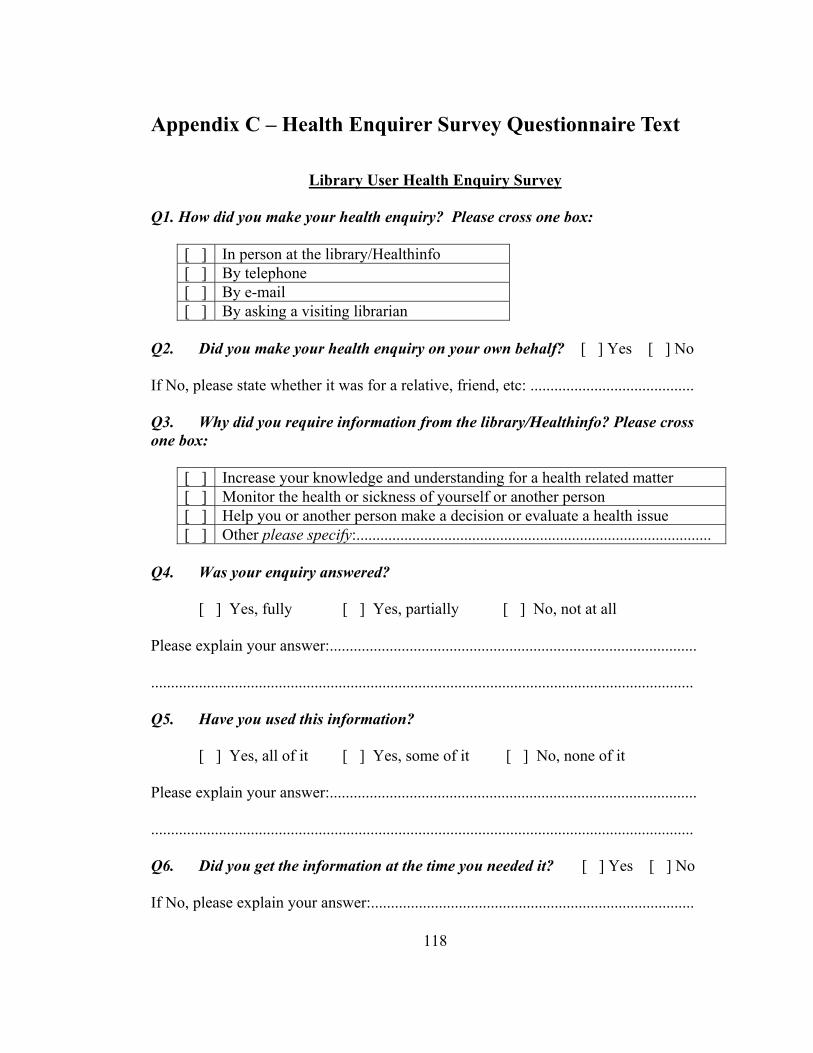
Appendix C – Health Enquirer Survey Questionnaire Text
Library User Health Enquiry Survey
Q1. How did you make your health enquiry? Please cross one box:
[ ] In person at the library/Healthinfo [ ] By telephone [ ] By e-mail [ ] By asking a visiting librarian
Q2. Did you make your health enquiry on your own behalf? [ ] Yes [ ] No If No, please state whether it was for a relative, friend, etc: ......................................... Q3. Why did you require information from the library/Healthinfo? Please cross one box:
[ ] Increase your knowledge and understanding for a health related matter [ ] Monitor the health or sickness of yourself or another person [ ] Help you or another person make a decision or evaluate a health issue [ ] Other please specify:.........................................................................................
Q4. Was your enquiry answered?
[ ] Yes, fully [ ] Yes, partially [ ] No, not at all Please explain your answer:............................................................................................ ........................................................................................................................................ Q5. Have you used this information?
[ ] Yes, all of it [ ] Yes, some of it [ ] No, none of it Please explain your answer:............................................................................................ ........................................................................................................................................ Q6. Did you get the information at the time you needed it? [ ] Yes [ ] No If No, please explain your answer:.................................................................................
118
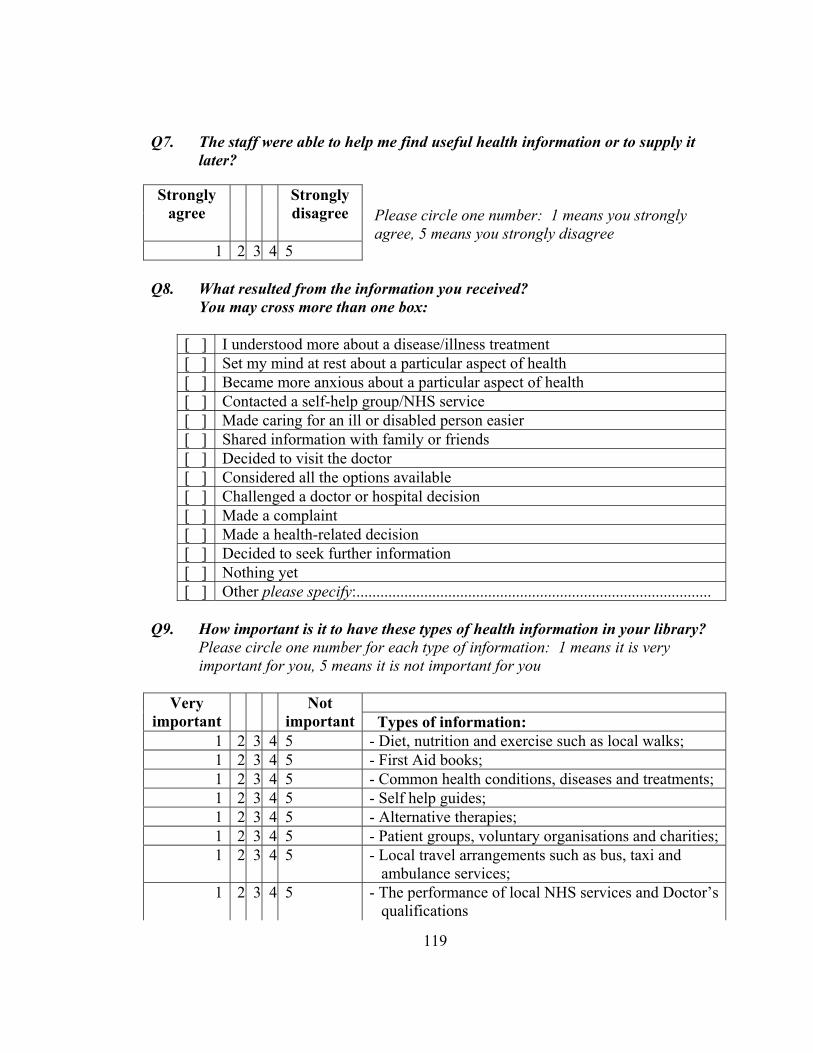
Q7. The staff were able to help me find useful health information or to supply it
later? Please circle one number: 1 means you strongly agree, 5 means you strongly disagree
Q8. What resulted from the information you received? You may cross more than one box:
[ ] I understood more about a disease/illness treatment [ ] Set my mind at rest about a particular aspect of health [ ] Became more anxious about a particular aspect of health [ ] Contacted a self-help group/NHS service [ ] Made caring for an ill or disabled person easier [ ] Shared information with family or friends [ ] Decided to visit the doctor [ ] Considered all the options available [ ] Challenged a doctor or hospital decision [ ] Made a complaint [ ] Made a health-related decision [ ] Decided to seek further information [ ] Nothing yet [ ] Other please specify:.........................................................................................
Q9. How important is it to have these types of health information in your library?
Please circle one number for each type of information: 1 means it is very important for you, 5 means it is not important for you
Very important
Not important Types of information:
1 2 3 4 5 - Diet, nutrition and exercise such as local walks; 1 2 3 4 5 - First Aid books; 1 2 3 4 5 - Common health conditions, diseases and treatments; 1 2 3 4 5 - Self help guides; 1 2 3 4 5 - Alternative therapies; 1 2 3 4 5 - Patient groups, voluntary organisations and charities;1 2 3 5 - Local travel arrangements such as bus, taxi and
ambulance services; 1 2 3 4 5 - The performance of local NHS services and Doctor’s
qualifications
4
Strongly agree
Strongly disagree
1 2 3 4 5
119

1 2 3 4 5 - Location and opening hours of local NHS and private hospitals, GP surgeries, pharmacies, clinics, dentists, opticians and sports and fitness centres;
1 2 3 4 5 - Information that can help you adjust to a new situation and help you care for someone else such as benefits for carers, support groups and respite care services
Q10. Would you use the library/Healthinfo service again? How can the library/Healthinfo service improve the way it provides healthcare information to you? ……………………………............................................................................................ …………………………………………………………………………………………. Q11. For the following three health information sources please tick any of the options that you consider to be an advantage of that service, and cross any of the options that you consider to be a disadvantage of that service. You may tick, cross or leave blank as many boxes as you like: NHS Direct
telephone helpline
The Internet
Your library/
Healthinfo Cost [ ] [ ] [ ] Easy to use/access [ ] [ ] [ ] Easy to understand [ ] [ ] [ ] Trust the information [ ] [ ] [ ] Locally available [ ] [ ] [ ] Confidentiality [ ] [ ] [ ] Q12. Which of these statements most closely describes the state of health of yourself, or the person for which you were enquiring? You may put a cross in more than
one box:
[ ] Healthy [ ] Might be ill but not diagnosed [ ] Diagnosed as ill [ ] Self-diagnosed as ill [ ] Receiving or taking treatment/medication [ ] Not taking medication or receiving treatment [ ] Living with long term illness [ ] Other please specify:.........................................................................................
120
The following information is useful to us for statistical purposes. This questionnaire is anonymous. Please return this questionnaire even if you do not answer these particular questions. Are you: [ ] Male [ ] Female To which age group [ ] 15 years or under [ ] 41-50 years Do you belong? [ ] 16-20 years [ ] 51-60 years [ ] 21-30 years [ ] 61-70 years [ ] 31-40 years [ ] 71 + years THANK YOU VERY MUCH FOR FILLING IN THIS QUESTIONNAIRE. Please return the questionnaire in the enclosed stamped addressed envelope to: Rotherham Healthcare Library & Information Service, Libraries Suite, Rotherham District General Hospital, Moorgate Road, Rotherham, S60 2UD.
121

122
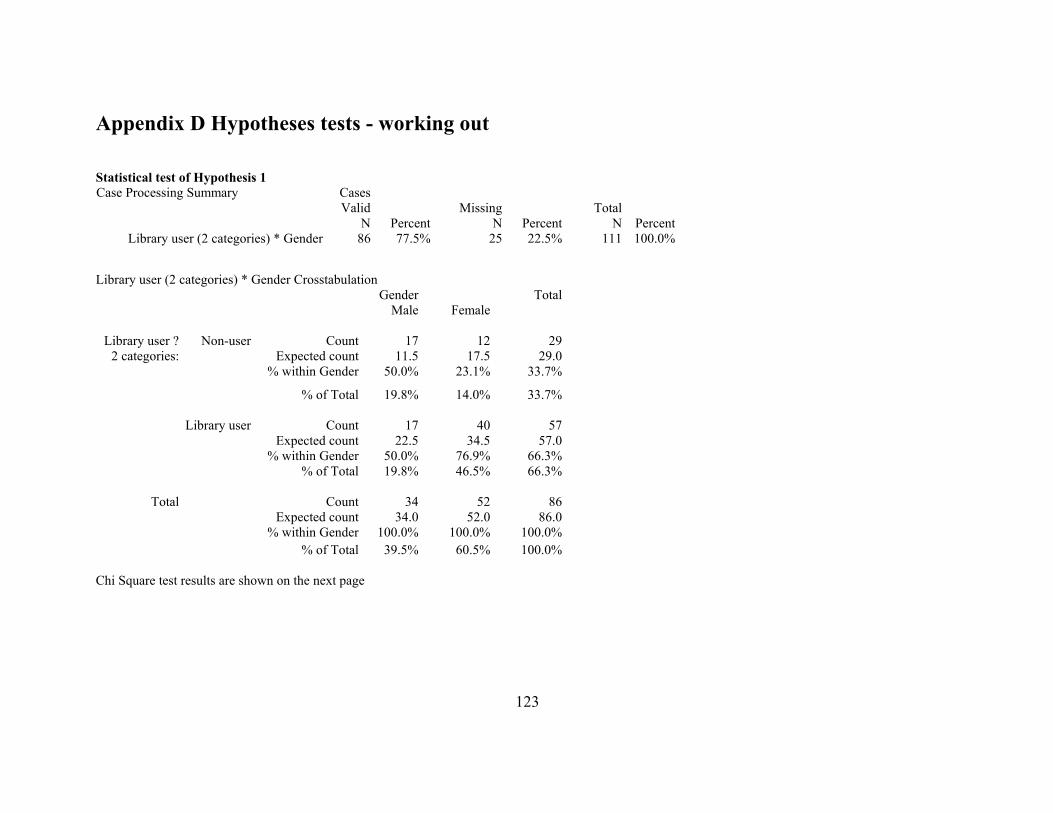
Appendix D Hypotheses tests - working out
Statistical test of Hypothesis 1 Case Processing Summary Cases
Valid Missing TotalN Percent N Percent N Percent
Library user (2 categories) * Gender 86 77.5% 25 22.5% 111 100.0%
Library user (2 categories) * Gender Crosstabulation
Gender TotalMale Female
Library user ? Non-user Count 17 12 292 categories: Expected count 11.5 17.5 29.0
% within Gender 50.0% 23.1% 33.7%
% of Total 19.8% 14.0% 33.7%
Library user Count 17 40 57Expected count 22.5 34.5 57.0
% within Gender 50.0% 76.9% 66.3%% of Total 19.8% 46.5% 66.3%
Total Count 34 52 86Expected count 34.0 52.0 86.0
% within Gender 100.0% 100.0% 100.0%% of Total 39.5% 60.5% 100.0%
Chi Square test results are shown on the next page
123
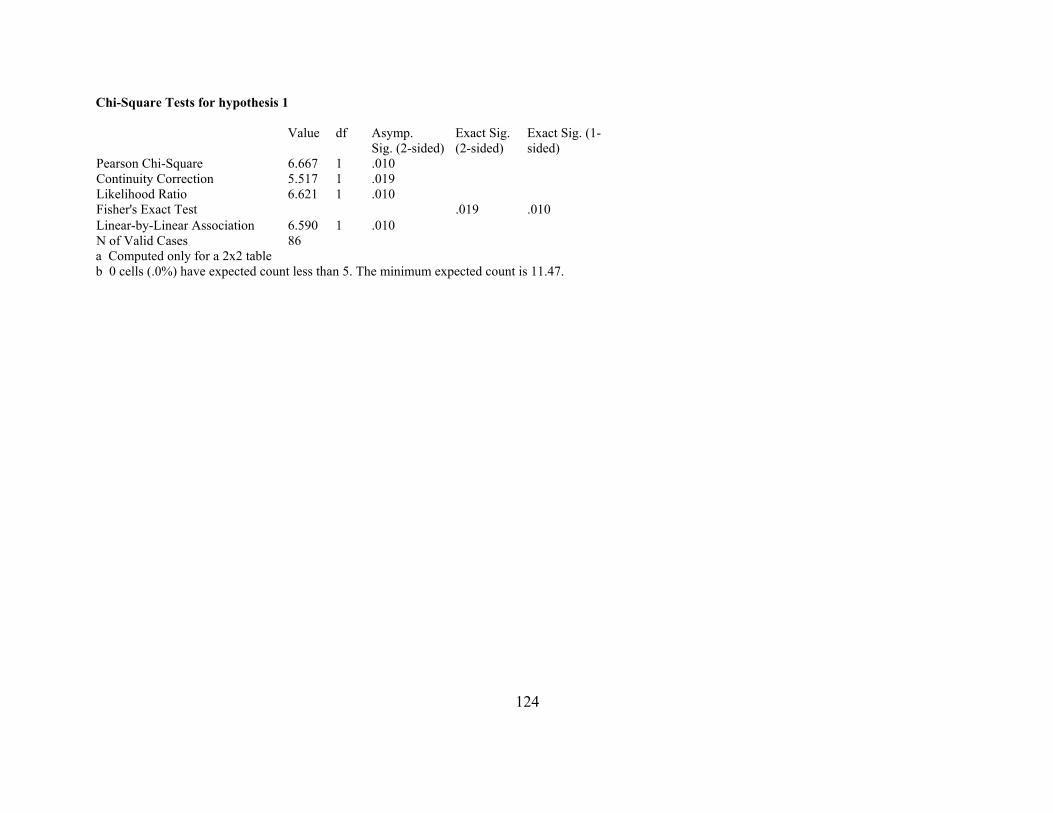
Chi-Square Tests for hypothesis 1
Value df Asymp.Sig. (2-sided)
Exact Sig. (2-sided)
Exact Sig. (1-sided)
Pearson Chi-Square 6.667 1 .010 Continuity Correction 5.517 1 .019 Likelihood Ratio 6.621 1 .010 Fisher's Exact Test .019 .010 Linear-by-Linear Association 6.590 1 .010 N of Valid Cases 86 a Computed only for a 2x2 table b 0 cells (.0%) have expected count less than 5. The minimum expected count is 11.47.
124
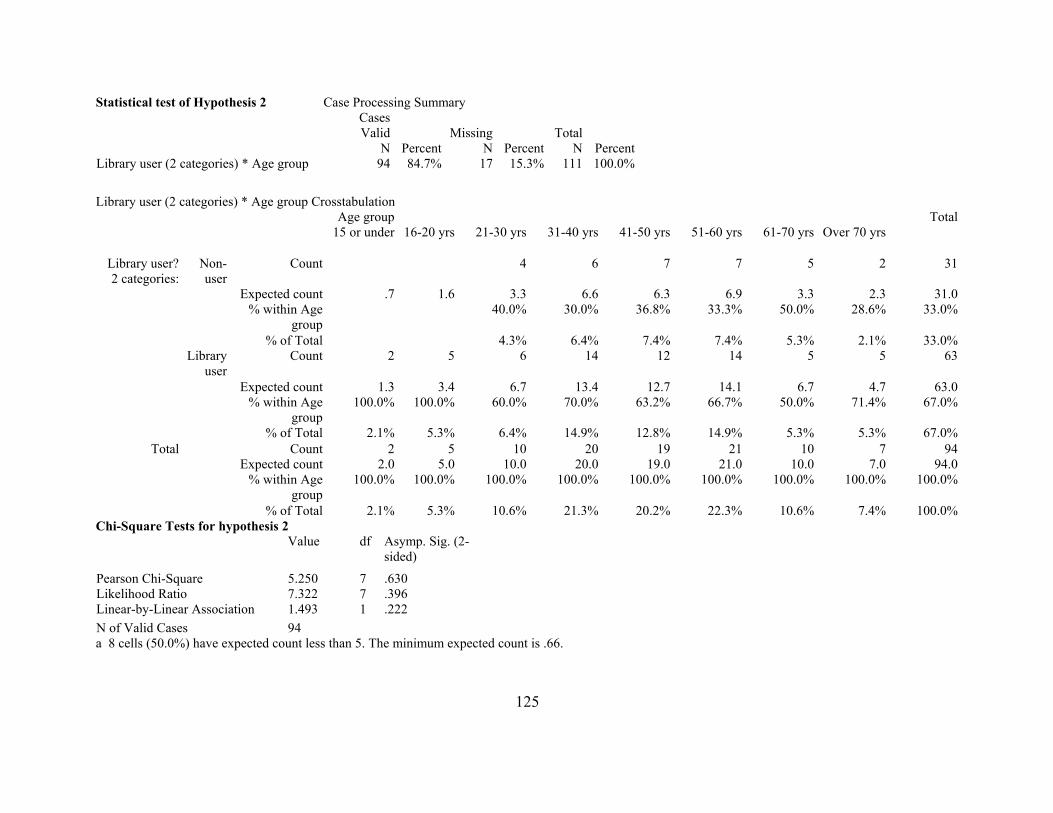
Statistical test of Hypothesis 2 Case Processing Summary CasesValid Missing Total
N Percent N Percent N PercentLibrary user (2 categories) * Age group 94 84.7% 17 15.3% 111 100.0%
Library user (2 categories) * Age group Crosstabulation
Age group Total15 or under 16-20 yrs 21-30 yrs 31-40 yrs 41-50 yrs 51-60 yrs 61-70 yrs Over 70 yrs
Library user?2 categories:
Non-user
Count 4 6 7 7 5 2 31
Expected count .7 1.6 3.3 6.6 6.3 6.9 3.3 2.3 31.0% within Age
group40.0% 30.0% 36.8% 33.3% 50.0% 28.6% 33.0%
% of Total 4.3% 6.4% 7.4% 7.4% 5.3% 2.1% 33.0%Library
userCount 2 5 6 14 12 14 5 5 63
Expected count 1.3 3.4 6.7 13.4 12.7 14.1 6.7 4.7 63.0% within Age
group100.0% 100.0% 60.0% 70.0% 63.2% 66.7% 50.0% 71.4% 67.0%
% of Total 2.1% 5.3% 6.4% 14.9% 12.8% 14.9% 5.3% 5.3% 67.0%Total Count 2 5 10 20 19 21 10 7 94
Expected count 2.0 5.0 10.0 20.0 19.0 21.0 10.0 7.0 94.0% within Age
group100.0% 100.0% 100.0% 100.0% 100.0% 100.0% 100.0% 100.0% 100.0%
% of Total 2.1% 5.3% 10.6% 21.3% 20.2% 22.3% 10.6% 7.4% 100.0%Chi-Square Tests for hypothesis 2 Value df Asymp. Sig. (2-
sided)
Pearson Chi-Square 5.250 7 .630 Likelihood Ratio 7.322 7 .396 Linear-by-Linear Association 1.493 1 .222 N of Valid Cases 94 a 8 cells (50.0%) have expected count less than 5. The minimum expected count is .66.
125
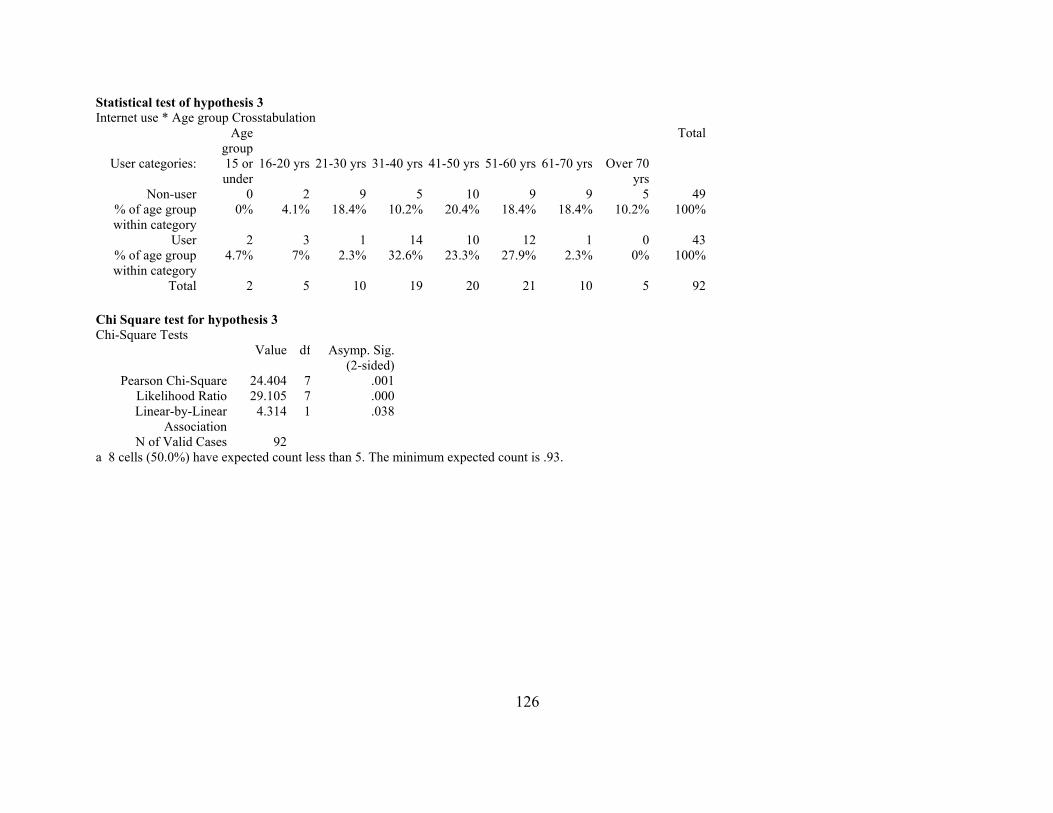
Statistical test of hypothesis 3 Internet use * Age group Crosstabulation
Age group
Total
User categories: 15 or under
16-20 yrs 21-30 yrs 31-40 yrs 41-50 yrs 51-60 yrs 61-70 yrs Over 70 yrs
Non-user 0
otal 2 5 10 19 20 21 10 5 92
2 9 5 10 9 9 5 49% of age group within category
0% 4.1% 18.4% 10.2% 20.4% 18.4% 18.4% 10.2% 100%
User 2 3 1 14 10 12 1 0 43% of age group within category
4.7% 7% 2.3% 32.6% 23.3% 27.9% 2.3% 0% 100%
T Chi Square test for hypothesis 3 Chi-Square Tests
Value df Asymp. Sig. (2-sided)
Pearson Chi-Square 24.404 7 .001Likelihood Ratio 29.105 7 .000Linear-by-Linear
Association4.314 1 .038
N of Valid Cases 92a 8 cells (50.0%) have expected count less than 5. The minimum expected count is .93.
126
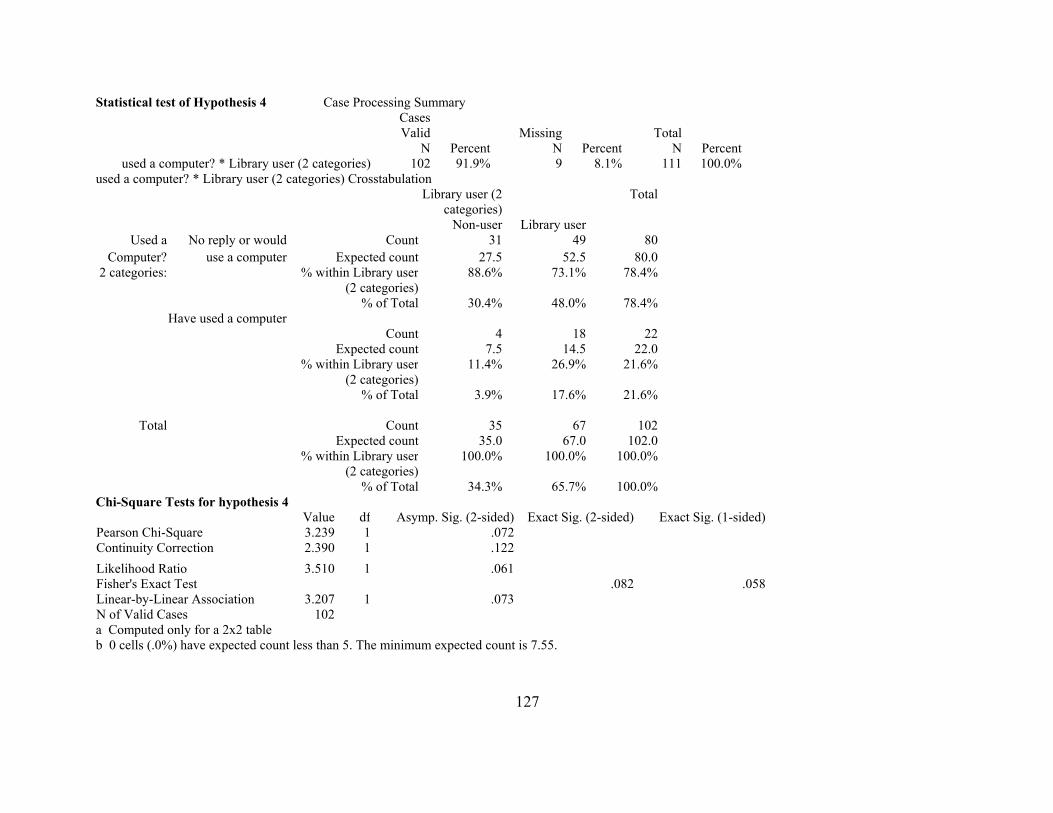
Statistical test of Hypothesis 4 Case Processing Summary CasesValid Missing Total
N Percent N Percent N Percentused a computer? * Library user (2 categories) 102 91.9% 9 8.1% 111 100.0%
used a computer? * Library user (2 categories) Crosstabulation Library user (2
categories)Total
Non-user Library userUsed a No reply or would Count 31 49 80
Computer? use a computer Expected count 27.5 52.5 80.02 categories: % within Library user
(2 categories)88.6% 73.1% 78.4%
% of Total 30.4% 48.0% 78.4%Have used a computer
Count 4 18 22Expected count 7.5 14.5 22.0
% within Library user (2 categories)
11.4% 26.9% 21.6%
% of Total 3.9% 17.6% 21.6%
Total Count 35 67 102Expected count 35.0 67.0 102.0
% within Library user(2 categories)
100.0% 100.0% 100.0%
% of Total 34.3% 65.7% 100.0%Chi-Square Tests for hypothesis 4
Value df Asymp. Sig. (2-sided) Exact Sig. (2-sided) Exact Sig. (1-sided)Pearson Chi-Square 3.239 1 .072Continuity Correction 2.390 1 .122Likelihood Ratio 3.510 1 .061Fisher's Exact Test .082 .058Linear-by-Linear Association 3.207 1 .073N of Valid Cases 102a Computed only for a 2x2 table b 0 cells (.0%) have expected count less than 5. The minimum expected count is 7.55.
127
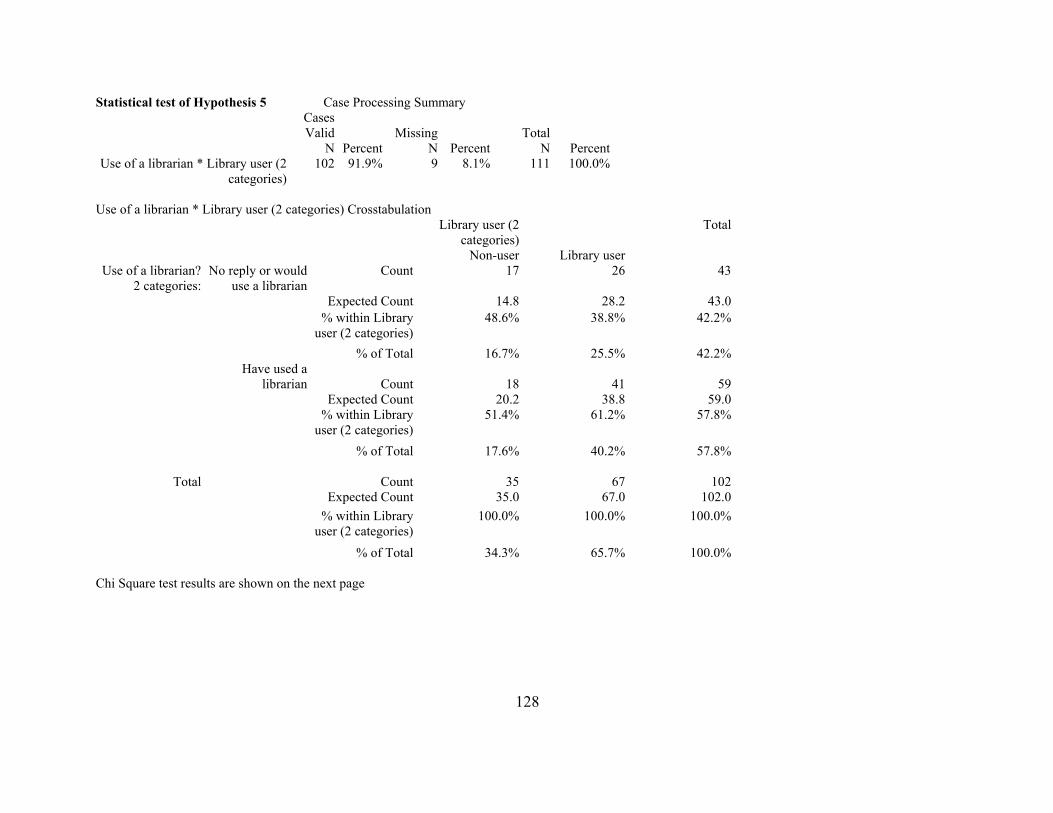
Statistical test of Hypothesis 5 Case Processing Summary CasesValid Missing Total
N Percent N Percent N PercentUse of a librarian * Library user (2
categories)102 91.9% 9 8.1% 111 100.0%
Use of a librarian * Library user (2 categories) Crosstabulation
Library user (2 categories)
Total
Non-user Library userUse of a librarian?
2 categories:No reply or would
use a librarian Count 17 26
43
Expected Count 14.8 28.2 43.0 % within Library
user (2 categories)48.6% 38.8% 42.2%
% of Total 16.7% 25.5% 42.2%Have used a
librarian Count 18
41 59Expected Count 20.2 38.8 59.0
% within Libraryuser (2 categories)
51.4% 61.2% 57.8%
% of Total 17.6% 40.2% 57.8%
Total
Count 35
67 102Expected Count 35.0 67.0 102.0
% within Libraryuser (2 categories)
100.0% 100.0% 100.0%
% of Total 34.3% 65.7% 100.0% Chi Square test results are shown on the next page
128
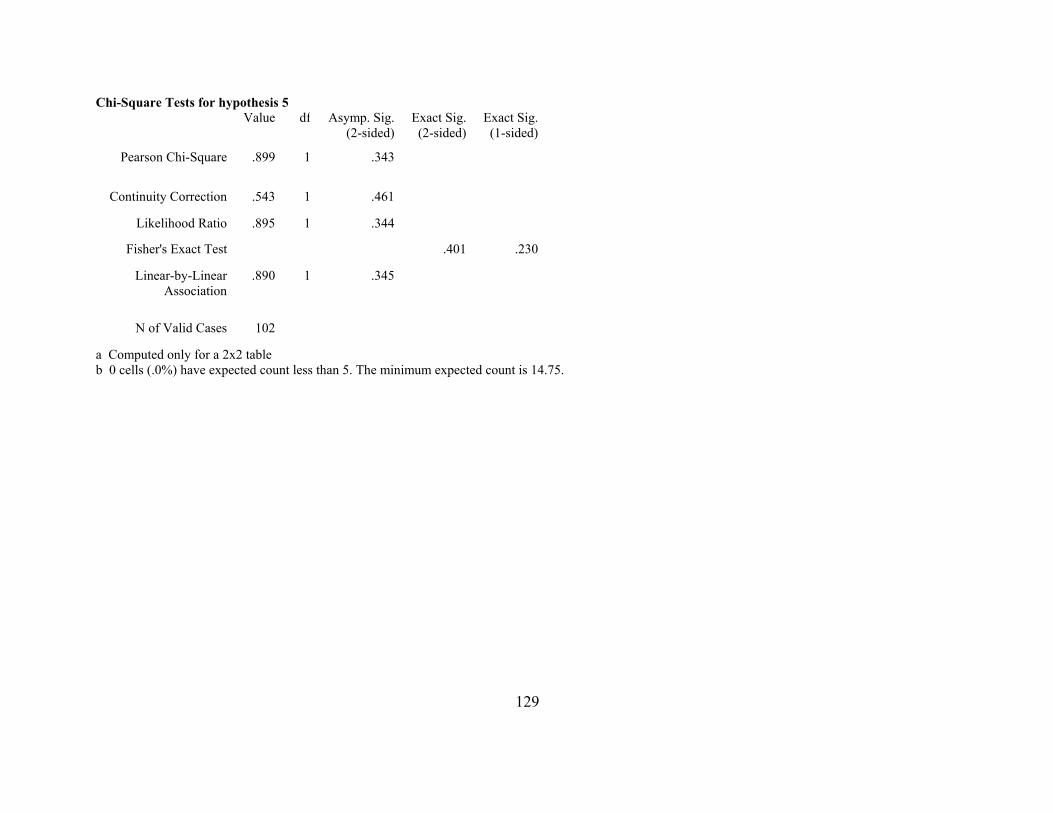
Chi-Square Tests for hypothesis 5 Value df Exact Sig.
(2-sided)
.899
.401
Asymp. Sig.(2-sided)
Exact Sig. (1-sided)
Pearson Chi-Square 1 .343
Continuity Correction .543 1 .461
Likelihood Ratio .895 1 .344
Fisher's Exact Test .230
Linear-by-Linear Association
.890 1 .345
N of Valid Cases 102
a Computed only for a 2x2 table b 0 cells (.0%) have expected count less than 5. The minimum expected count is 14.75.
129

130
Related Documents