The EUROSTUDENT view on equity Brussels, 07 November 2012 Christoph Gwosć Findings from EUROSTUDENT IV 2008 - 2011

The EUROSTUDENT view on equity Brussels, 07 November 2012 Christoph Gwosć Findings from EUROSTUDENT IV 2008 - 2011.
Mar 27, 2015
Welcome message from author
This document is posted to help you gain knowledge. Please leave a comment to let me know what you think about it! Share it to your friends and learn new things together.
Transcript
The EUROSTUDENT view on equity
Brussels, 07 November 2012Christoph Gwosć
Findings from EUROSTUDENT IV 2008 - 2011

The EUROSTUDENT view on equity Brussels, 07 November 2012 2
Contents
1. The EUROSTUDENT project
2. Equity in terms of students’ access to higher education by social make-up
3. Equity in financial respect by students’ social make-up

The EUROSTUDENT view on equity Brussels, 07 November 2012 3
The EUROSTUDENT project
• 25 European countries participated in the fourth round
• More than 200,000 students in HE were surveyed
• Survey based on common core questionnaire
• 10 different topics were covered
(e. g. transition into HE, social
make-up, finances, international
mobility)

The EUROSTUDENT view on equity Brussels, 07 November 2012 4
The social dimension and participative equity
Entrance to higher education
Studyframework Graduation
high high
low low
Country C
Country A
Country B
The EUROSTUDENT view on equity Brussels, 07 November 2012 5
Contents
2. Equity in terms of students’ access to higher education by social make-up
The EUROSTUDENT view on equity Brussels, 07 November 2012 6
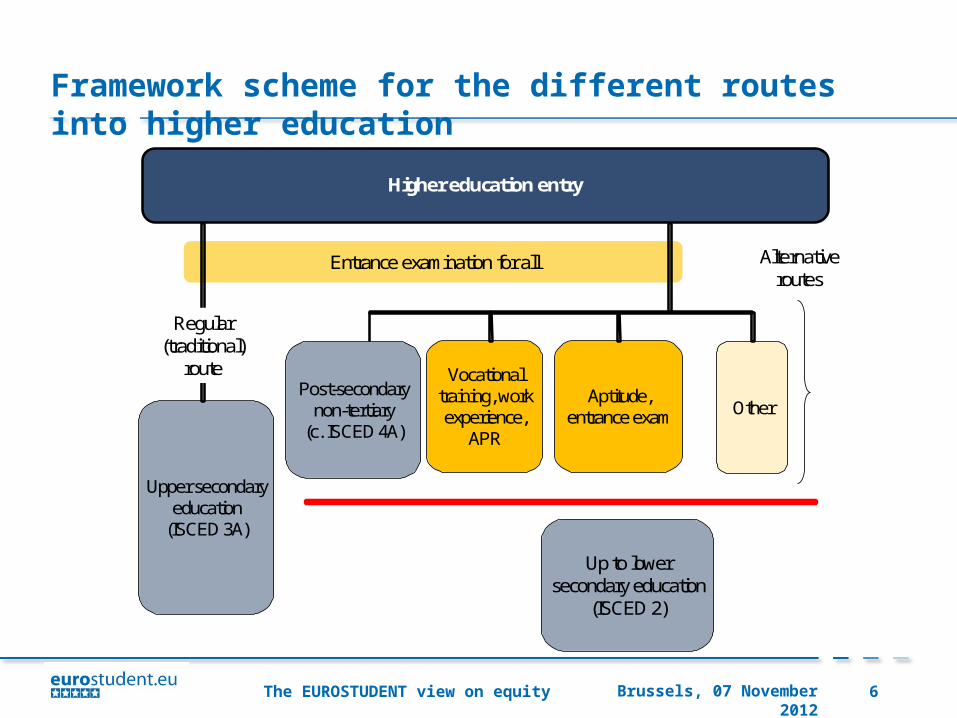
Framework scheme for the different routes into higher education
Post-secondary non-tertiary
(c. ISCED 4A)
Upper secondary education
(ISCED 3A)
Up to lower secondary education
(ISCED 2)
Vocational training, work experience,
APR
OtherAptitude,
entrance exam
Entrance examination for all
Regular (traditional)
route
Alternative routes
Higher education entry

The EUROSTUDENT view on equity Brussels, 07 November 2012 7
Students entering higher education through a regular route
100 100 100 100 100 100 100 100 98 97 96 94 93 92 92 90 90 89 85 79 77 76 720
10
20
30
40
50
60
70
80
90
100
TR SK IT PL HR RO LV NL FR CZ DE DK CH AT NO EE MT ES PT FI IE E/W SE
Shar
e of
stud
ents
in %
all students (without other)
The EUROSTUDENT view on equity Brussels, 07 November 2012 8
Findings
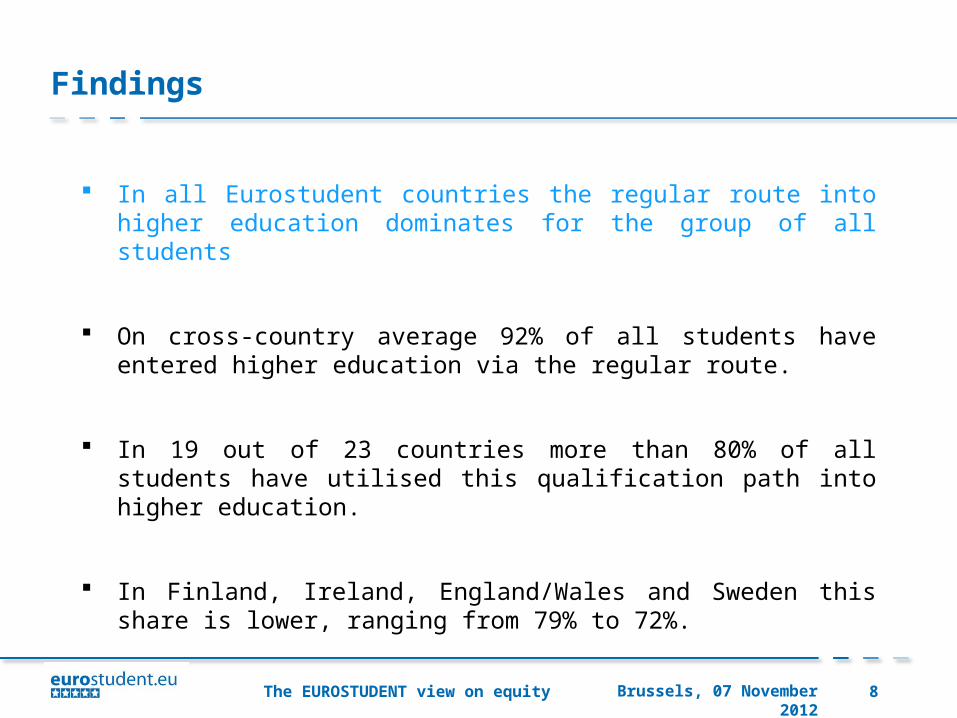
In all Eurostudent countries the regular route into higher education dominates for the group of all students
On cross-country average 92% of all students have entered higher education via the regular route.
In 19 out of 23 countries more than 80% of all students have utilised this qualification path into higher education.
In Finland, Ireland, England/Wales and Sweden this share is lower, ranging from 79% to 72%.
The EUROSTUDENT view on equity Brussels, 07 November 2012 9
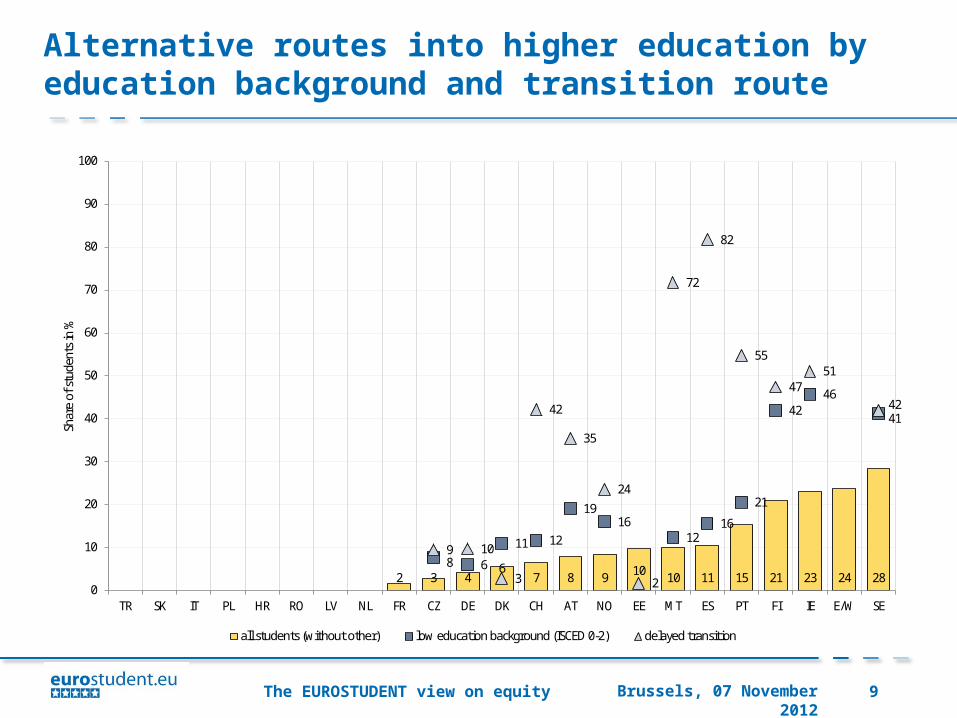
Alternative routes into higher education by education background and transition route
2 3 46
7 8 9 10 10 11 15 21 23 24 288 6
11 12
1916
1216
21
4246
41
9 10
3
42
35
24
2
72
82
55
4751
42
0
10
20
30
40
50
60
70
80
90
100
TR SK IT PL HR RO LV NL FR CZ DE DK CH AT NO EE MT ES PT FI IE E/W SE
Shar
e of
stud
ents
in %
all students (without other) low education background (ISCED 0-2) delayed transition

The EUROSTUDENT view on equity Brussels, 07 November 2012 10
Findings
Alternative qualification routes into higher education exist in most countries and are frequently used by students from low education backgrounds
15 out of 23 countries provide access to higher education via alternative routes.
In Finland, Ireland, England/Wales and Sweden more than 20% of all students have utilised such routes.
In all countries for which data are available, the share of students with low education background entering via alternative routes is disproportionately high. In Finland, Ireland and Sweden more than 40% of all students with low education background took alternative qualification paths.

The EUROSTUDENT view on equity Brussels, 07 November 2012 11
Contents
3. Equity in financial respect by students’ social make-up

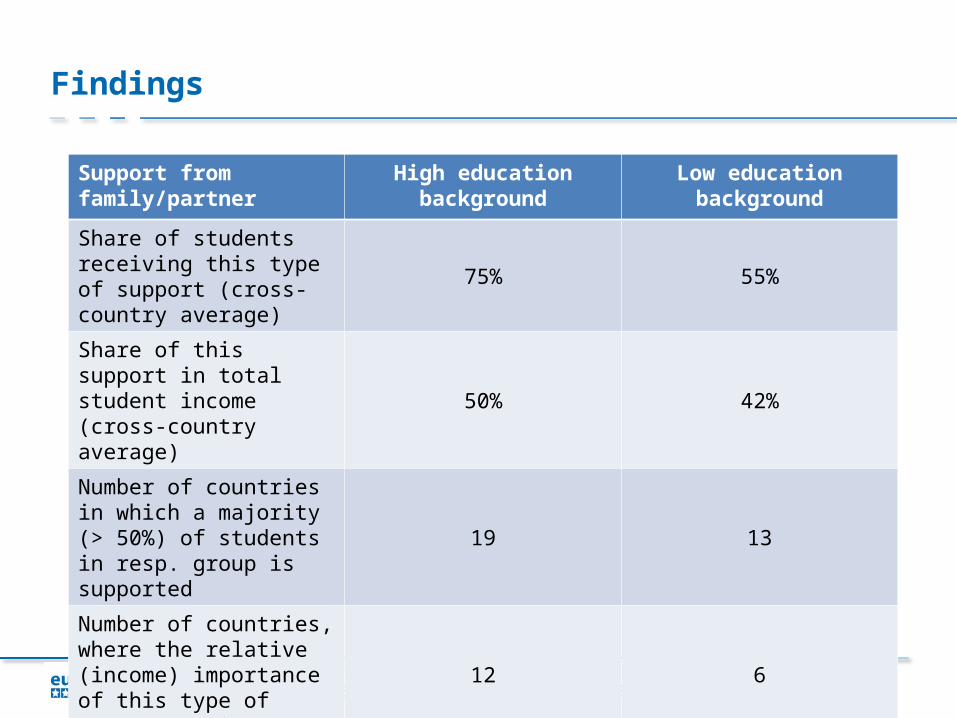
Importance of family/partner contribution by education background – students not living with parents
The EUROSTUDENT view on equity Brussels, 07 November 2012 13
Findings
Support from family/partner High education background Low education background
Share of students receiving this type of support (cross-country average)
75% 55%
Share of this support in total student income (cross-country average)
50% 42%
Number of countries in which a majority (> 50%) of students in resp. group is supported
19 13
Number of countries, where the relative (income) importance of this type of support > 50%
12 6

The EUROSTUDENT view on equity Brussels, 07 November 2012 14
Importance of gainful employment by education background – students not living with parents
67
59
50 50
42 4245
25
41 4238
3028
24
2824
20
35
26
8
15
0
10
20
30
40
50
60
70
80
90
CZ EE NO FI LV AT CH RO PT IE PL DK DE FR E/W NL SE LT ES HR TR
Self-
earn
ed in
com
e as
sha
re o
f tot
al in
com
e in
%
low education background (ISCED 0-2) high education background (ISCED 5-6) all students

The EUROSTUDENT view on equity Brussels, 07 November 2012 15
Findings
Students from low education backgrounds rely to a much higher extent on paid work than their peers from high education backgrounds
Across all countries, self-earned income on average provides 45% of total income of students with low education background.
Students with high education background depend on average only to 32% of their total income upon this source.
This basic pattern is true for all countries but Lithuania and Turkey.
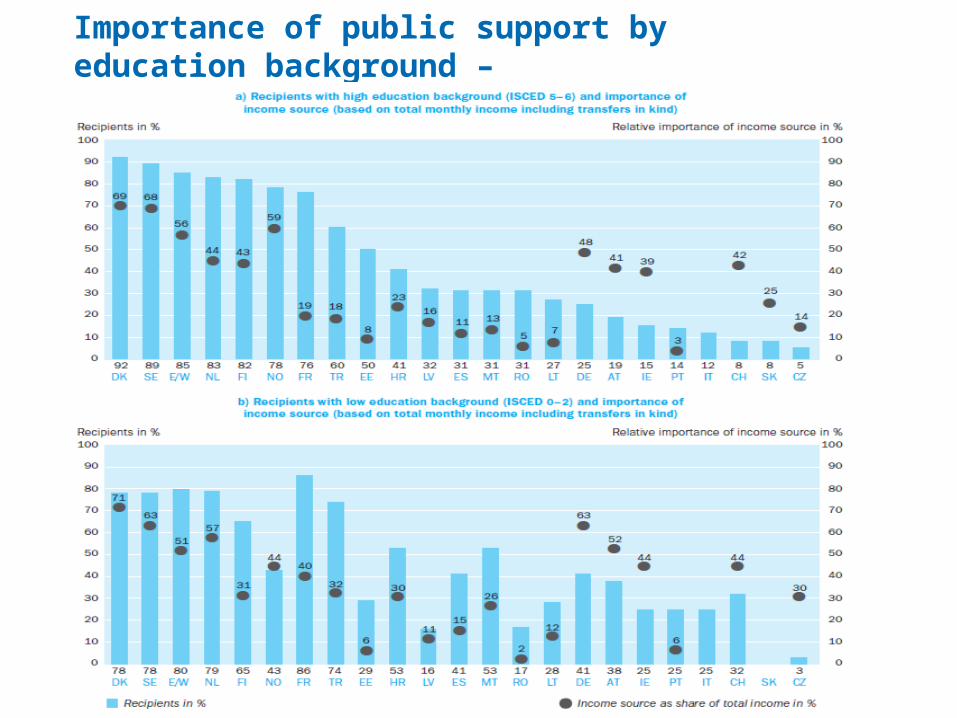
Importance of public support by education background – students not living with parents

The EUROSTUDENT view on equity Brussels, 07 November 2012 17
Findings
Public support High education background Low education background
Share of students receiving this type of support (cross-country average)
43% 46%
Share of this support in total student income (cross-country average)
30% 35%
Number of countries in which a majority (> 50%) of students in resp. group is supported
8 9
Number of countries, where the relative (income) importance of this type of support > 50%
4 6


The EUROSTUDENT view on equity Brussels, 07 November 2012 19
Highest educational attainment of students’ parents (of either the father or the mother)
49 76 71 65 60 51 73 43 58 42 37 35 21 44 39 5663 39 31 50 65 40 57
51 24 29 35 40 49 27 57 42 58 63 65 79 56 61 44 37 61 69 50 35 60 43
45 4542
37
25 24
19
15
10 10 8 8 85 5 4 3 2 2 2 1 1
0
10
20
30
40
50
60
70
80
90
100
E/W PT TR MT IE ES IT NL CZ FR FI NO DK CH SE AT RO EE DE HR PL LV SK
Stud
ents
in %
non-tertiary education (ISCED 0-4) high education (ISCED 5-6) low education (ISCED 0-2)

The EUROSTUDENT view on equity Brussels, 07 November 2012 20
Students’ fathers by highest educational attainment compared to corresp. age group in general population (index: 1 = perfect balance)
FRSKHR
RO
DELV
TR
AT
CZ
MT
DK
ITEE NO
PL
ESPT
IEFI NL
CH
0.0
0.5
1.0
1.5
2.0
2.5
3.0
3.5
0.0 0.2 0.4 0.6 0.8 1.0 1.2
inde
x: h
igh
educ
ation
bac
kgro
und
index: low education background fathers sample average
inclusive system: low education group well represented,high education with relatively low overrepresentation
mixed system I: low education group well represented,high education with relatively high overrepresentation
exclusive system: low education group underrepresented,high education with relatively high overrepresentation
mixed system II: low education group underrepresented,high education with relatively low overrepresentation
The EUROSTUDENT view on equity Brussels, 07 November 2012 21
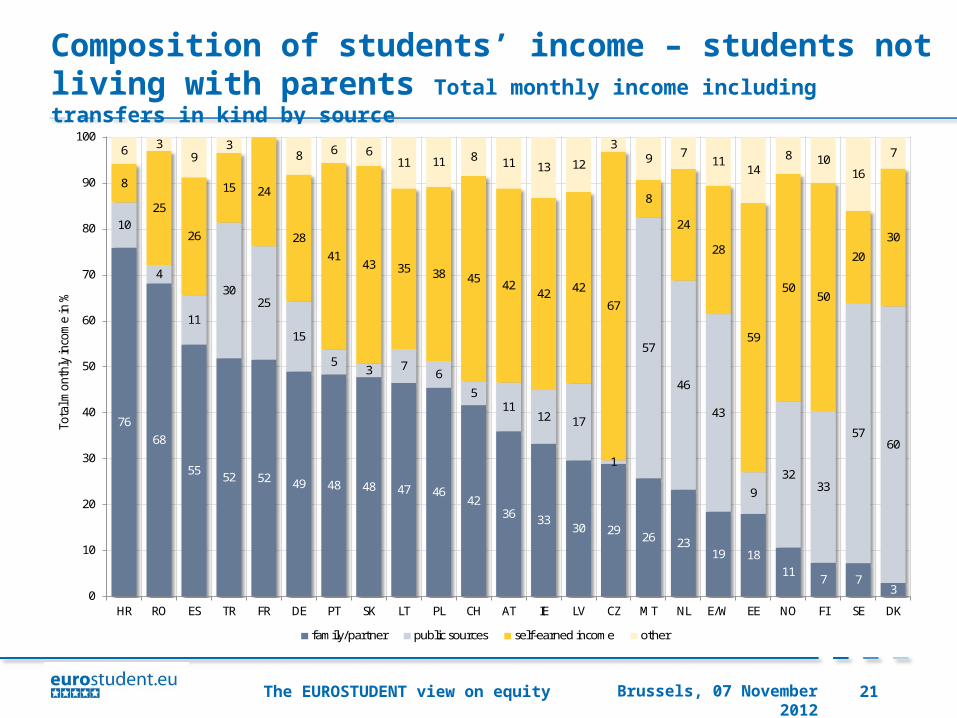
Composition of students’ income – students not living with parents Total monthly income including transfers in kind by source
7668
55 52 52 49 48 48 47 4642
36 3330 29 26 23
19 1811
7 73
10
4
11
3025
15
53 7
6
511
12 17
1
57
46
43
9
3233
5760
8
25
26
15 24
28
4143 35 38 45 42
42 42
67
8
24
28
59
5050
20
30
6 39
38 6 6
11 11 8 11 13 12
39 7
1114
8 1016
7
0
10
20
30
40
50
60
70
80
90
100
HR RO ES TR FR DE PT SK LT PL CH AT IE LV CZ MT NL E/W EE NO FI SE DK
Tota
l mon
thly
inco
me
in %
family/partner public sources self-earned income other

The EUROSTUDENT view on equity Brussels, 07 November 2012 22
Concentration of students’ income – students not living with parents Gini coefficient based on total monthly income including transfers in kind
0.420.41
0.40 0.40
0.37
0.32 0.32 0.32 0.320.31 0.31
0.30
0.270.25 0.25
0.24
0.20 0.20 0.200.18
0.15
0.00
0.05
0.10
0.15
0.20
0.25
0.30
0.35
0.40
0.45
EE IE CZ SK LV FI PL PT TR FR NO HR RO AT SE E/W CH DK MT DE NL
Valu
e of
Gin
i coe
ffici
ent

The EUROSTUDENT view on equity Brussels, 07 November 2012 23
Students’ assessment of sufficiency of funding to cover monthly costs by finance-related characteristics – students not living with parentsStudents with a dependency on a specific income source with (strong) agreement
80 57 56 52 49 49 48 48 47 44 44 44 43 43 41 41 36 34 32 32 15 140
10
20
30
40
50
60
70
80
90
IT CH CZ NO NL FI PL AT SE IE FR DK LV LT HR SK TR ES MT EE PT RO
Shar
e of
stu
dent
s in
%
all students dependency on public support dependency on parental support dependency on paid employment
Related Documents