The European Wireless The European Wireless Data Market Data Market Mark Holden Mark Holden Wireless Data Service Director Wireless Data Service Director Strategy Analytics Strategy Analytics [email protected] [email protected] October 1998 October 1998

The European Wireless Data Market Mark Holden Wireless Data Service Director Strategy Analytics [email protected] October 1998.
Dec 18, 2015
Welcome message from author
This document is posted to help you gain knowledge. Please leave a comment to let me know what you think about it! Share it to your friends and learn new things together.
Transcript

The European Wireless The European Wireless Data MarketData Market
Mark HoldenMark HoldenWireless Data Service DirectorWireless Data Service Director
Strategy AnalyticsStrategy Analytics
[email protected]@strategyanalytics.com
October 1998October 1998

October 1998 2
AGENDAAGENDA
1.1. Current Market StatusCurrent Market Status
-- Networks, devices, applications, Networks, devices, applications, usersusers
2.2. Future DevelopmentsFuture Developments
-- Cellular enhancementsCellular enhancements
3.3. Market ForecastsMarket Forecasts
-- Differences between 1997 & 1998 Differences between 1997 & 1998 forecastsforecasts

October 1998 3
Current Status - NetworksCurrent Status - Networks
Cellular the dominant wide-area technologyCellular the dominant wide-area technology Consistent SMS usage growth across EuropeConsistent SMS usage growth across Europe
Operator shift towards the verticalsOperator shift towards the verticals
Growing focus on coverage issues & service/ quality Growing focus on coverage issues & service/ quality assurance levelsassurance levels
The operator as ISPThe operator as ISP
Dedicated operators face an uncertain futureDedicated operators face an uncertain future
TETRA vs. TETRAPOLTETRA vs. TETRAPOL
Interactive paging: is there a future in Europe?Interactive paging: is there a future in Europe?
October 1998 4
Current Status - Devices/EquipmentCurrent Status - Devices/Equipment
Devices & equipment are a major user concernDevices & equipment are a major user concern Leveraging existing portable devices & systemsLeveraging existing portable devices & systems
Cost of accessories (e.g. PC cards)Cost of accessories (e.g. PC cards)
Practicalities of usePracticalities of use
Ease of operation & human computer interfaceEase of operation & human computer interface
Smart phones & hand-held computers not yet Smart phones & hand-held computers not yet widely accepted by European corporateswidely accepted by European corporates
October 1998 5
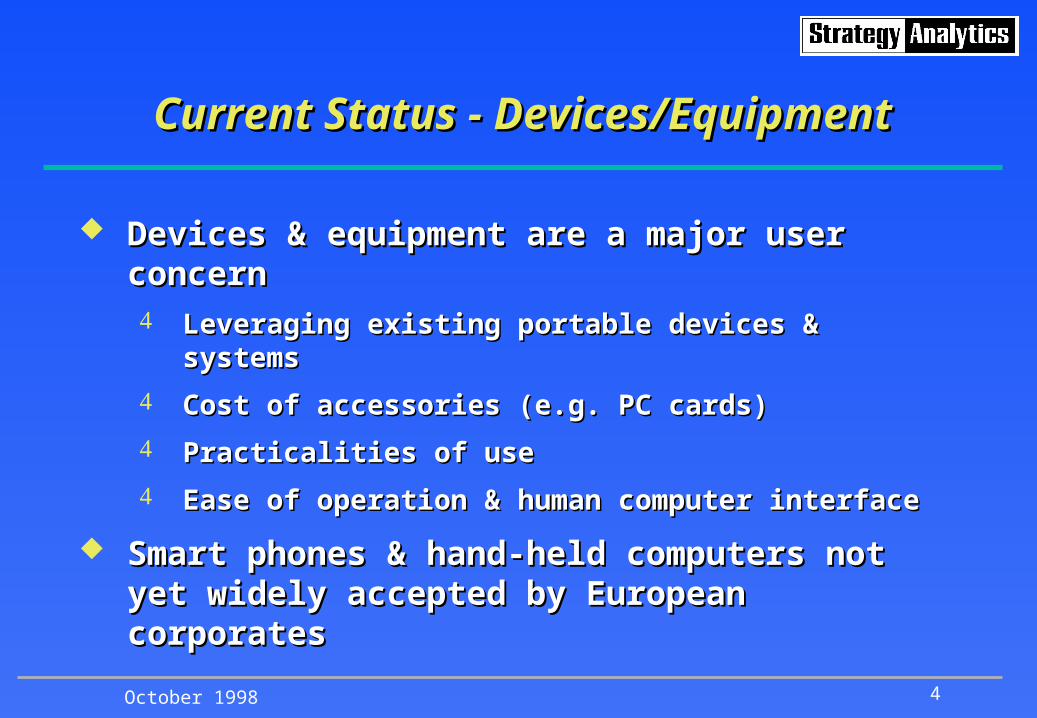
Current Status - ApplicationsCurrent Status - Applications
Key user segments are the verticalsKey user segments are the verticals Remote information access & short messagingRemote information access & short messaging
Reporting & updating functionsReporting & updating functions
Resource location & allocationResource location & allocation
Mobile professionals have similar needsMobile professionals have similar needs File transfer applications have yet to emergeFile transfer applications have yet to emerge
Fixed applications, e.g. telemetryFixed applications, e.g. telemetry

October 1998 6
Current Status - UsersCurrent Status - Users
Relatively high awareness in the verticalsRelatively high awareness in the verticals Productivity & service level imperativesProductivity & service level imperatives
Few formal corporate cellular implementationsFew formal corporate cellular implementations Evaluation & assessment of the practicalitiesEvaluation & assessment of the practicalities
Coverage, speed, reliabilityCoverage, speed, reliability
Equipment considerations, e.g. power issuesEquipment considerations, e.g. power issues
Impact on existing systems, applications & working Impact on existing systems, applications & working practicespractices
COSTCOST
October 1998
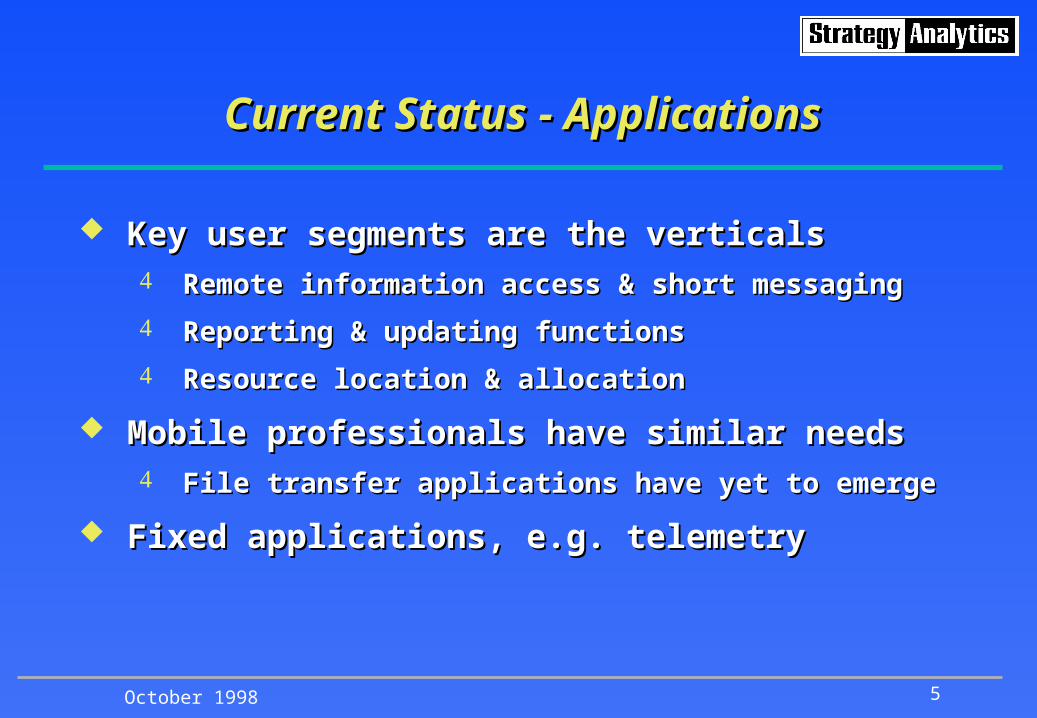
Analogue Trunked (PMR/PAMR)Analogue Cellular (Circuit Switched)
Alphanumeric PagingDedicated Packet
Satellite
1994-1996
Pre 1994
1997
1998
1999
2000
GSMData/Fax
GSMP-P SMS ERMES
Digital Cellular Consolidation
UMTS
Iridium DigitalTrunked
HSCSD GPRS
2-wayPagingP-M
SMS
P-P = Point-to-Point, P-M = Point to Multi-Point
Roadmap for Wireless Data ServicesRoadmap for Wireless Data Services
October 1998 8
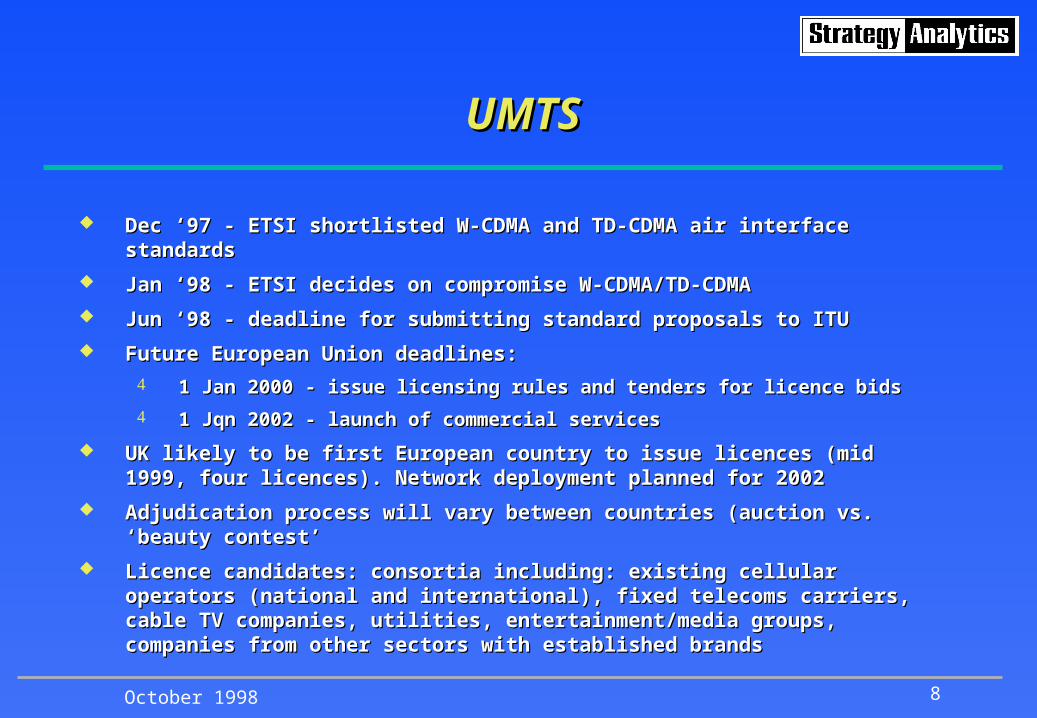
UMTSUMTS
Dec ‘97 - ETSI shortlisted W-CDMA and TD-CDMA air interface standardsDec ‘97 - ETSI shortlisted W-CDMA and TD-CDMA air interface standards
Jan ‘98 - ETSI decides on compromise W-CDMA/TD-CDMAJan ‘98 - ETSI decides on compromise W-CDMA/TD-CDMA
Jun ‘98 - deadline for submitting standard proposals to ITUJun ‘98 - deadline for submitting standard proposals to ITU
Future European Union deadlines:Future European Union deadlines:
1 Jan 2000 - issue licensing rules and tenders for licence bids1 Jan 2000 - issue licensing rules and tenders for licence bids
1 Jqn 2002 - launch of commercial services1 Jqn 2002 - launch of commercial services
UK likely to be first European country to issue licences (mid 1999, four UK likely to be first European country to issue licences (mid 1999, four licences). Network deployment planned for 2002licences). Network deployment planned for 2002
Adjudication process will vary between countries (auction vs. ‘beauty contest’Adjudication process will vary between countries (auction vs. ‘beauty contest’
Licence candidates: consortia including: existing cellular operators (national Licence candidates: consortia including: existing cellular operators (national and international), fixed telecoms carriers, cable TV companies, utilities, and international), fixed telecoms carriers, cable TV companies, utilities, entertainment/media groups, companies from other sectors with established entertainment/media groups, companies from other sectors with established brandsbrands
October 1998 9
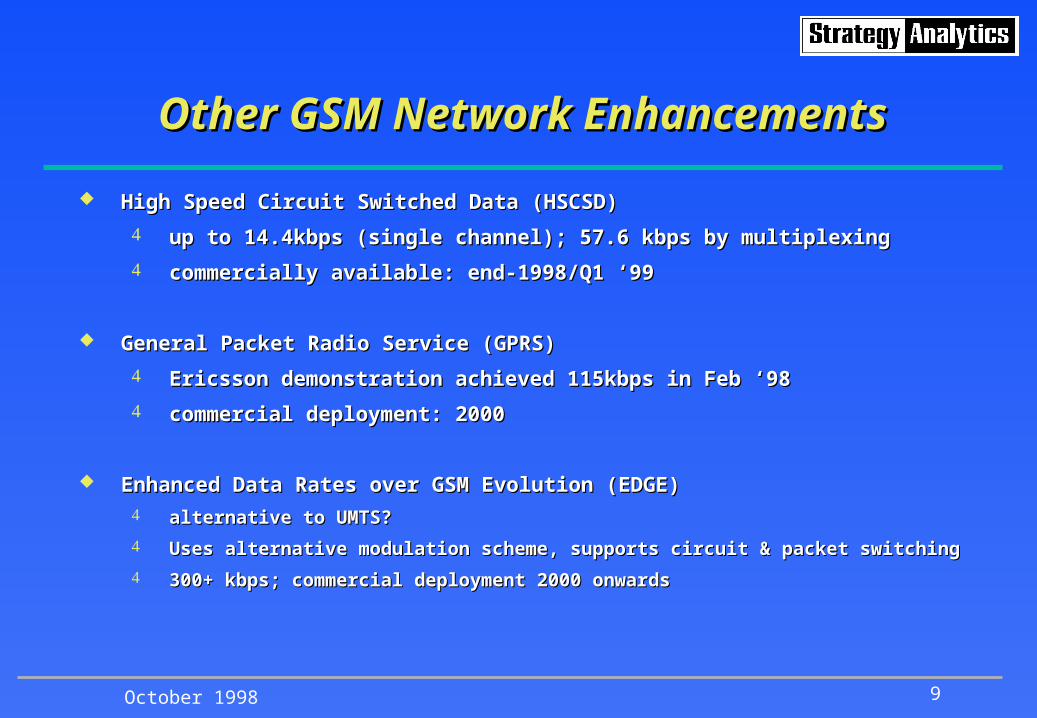
Other GSM Network EnhancementsOther GSM Network Enhancements
High Speed Circuit Switched Data (HSCSD)High Speed Circuit Switched Data (HSCSD)
up to 14.4kbps (single channel); 57.6 kbps by multiplexingup to 14.4kbps (single channel); 57.6 kbps by multiplexing
commercially available: end-1998/Q1 ‘99commercially available: end-1998/Q1 ‘99
General Packet Radio Service (GPRS)General Packet Radio Service (GPRS)
Ericsson demonstration achieved 115kbps in Feb ‘98Ericsson demonstration achieved 115kbps in Feb ‘98
commercial deployment: 2000commercial deployment: 2000
Enhanced Data Rates over GSM Evolution (EDGE)Enhanced Data Rates over GSM Evolution (EDGE) alternative to UMTS?alternative to UMTS?
Uses alternative modulation scheme, supports circuit & packet switchingUses alternative modulation scheme, supports circuit & packet switching
300+ kbps; commercial deployment 2000 onwards300+ kbps; commercial deployment 2000 onwards

October 1998 10
European Wireless Data Market to 2004European Wireless Data Market to 2004
0
1000
2000
3000
4000
5000
6000
7000
8000
1997 1998 2000 2004
Satellite
PMR
PAMR
Ded. Data
Cell. Data
2695
8824
1223783
Figures in thousands
CAAGR 1997-2004: 41%Cellular: 55%PMR: 23%
October 1998 11
1997& 1998 Forecasts - Differences1997& 1998 Forecasts - Differences
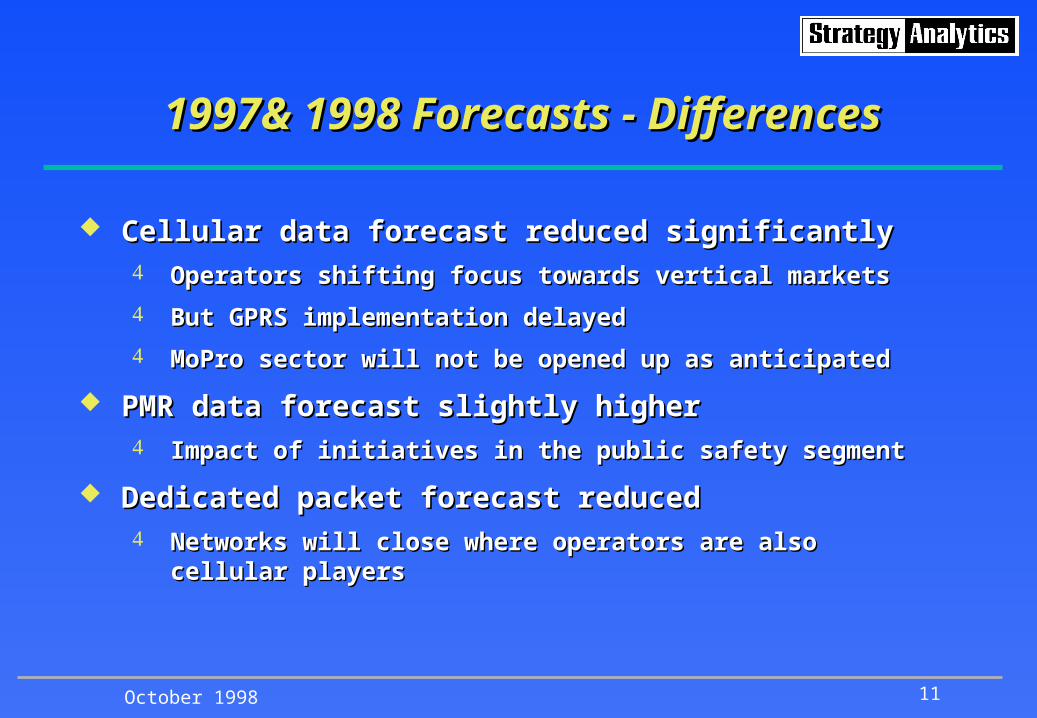
Cellular data forecast reduced significantlyCellular data forecast reduced significantly Operators shifting focus towards vertical marketsOperators shifting focus towards vertical markets
But GPRS implementation delayedBut GPRS implementation delayed
MoPro sector will not be opened up as anticipatedMoPro sector will not be opened up as anticipated
PMR data forecast slightly higherPMR data forecast slightly higher Impact of initiatives in the public safety segmentImpact of initiatives in the public safety segment
Dedicated packet forecast reducedDedicated packet forecast reduced Networks will close where operators are also cellular Networks will close where operators are also cellular
playersplayers
October 1998 12
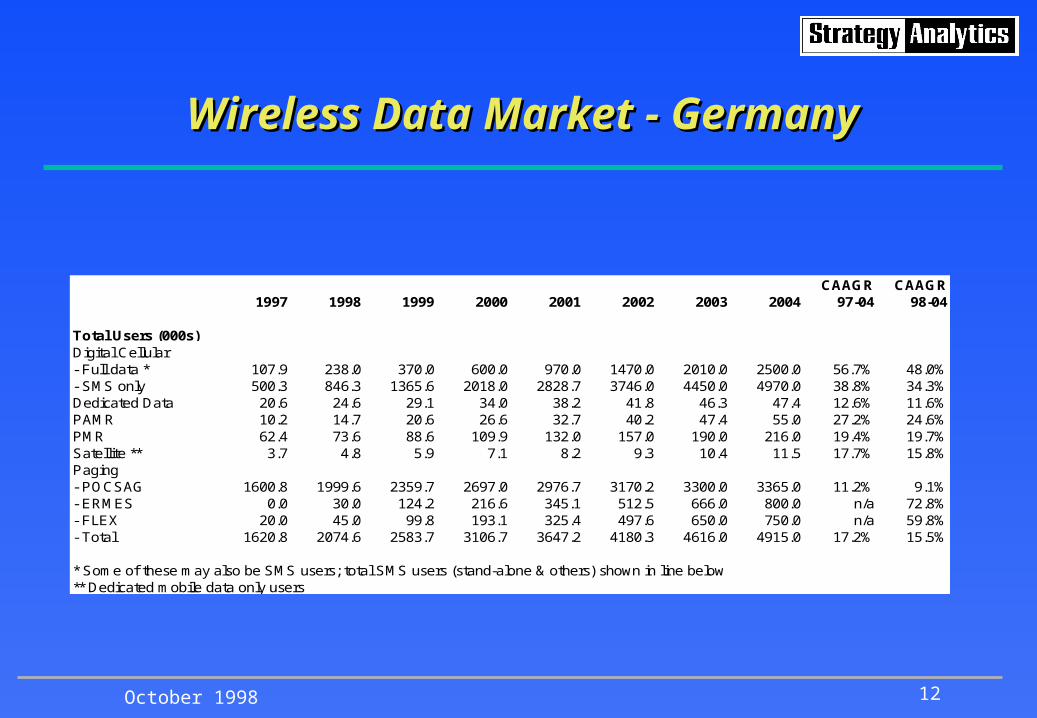
Wireless Data Market - GermanyWireless Data Market - Germany
CAAGR CAAGR1997 1998 1999 2000 2001 2002 2003 2004 97-04 98-04
Total Users (000s)Digital Cellular- Full data * 107.9 238.0 370.0 600.0 970.0 1470.0 2010.0 2500.0 56.7% 48.0%- SMS only 500.3 846.3 1365.6 2018.0 2828.7 3746.0 4450.0 4970.0 38.8% 34.3%Dedicated Data 20.6 24.6 29.1 34.0 38.2 41.8 46.3 47.4 12.6% 11.6%PAMR 10.2 14.7 20.6 26.6 32.7 40.2 47.4 55.0 27.2% 24.6%PMR 62.4 73.6 88.6 109.9 132.0 157.0 190.0 216.0 19.4% 19.7%Satellite ** 3.7 4.8 5.9 7.1 8.2 9.3 10.4 11.5 17.7% 15.8%Paging- POCSAG 1600.8 1999.6 2359.7 2697.0 2976.7 3170.2 3300.0 3365.0 11.2% 9.1%- ERMES 0.0 30.0 124.2 216.6 345.1 512.5 666.0 800.0 n/a 72.8%- FLEX 20.0 45.0 99.8 193.1 325.4 497.6 650.0 750.0 n/a 59.8%- Total 1620.8 2074.6 2583.7 3106.7 3647.2 4180.3 4616.0 4915.0 17.2% 15.5%
* Some of these may also be SMS users; total SMS users (stand-alone & others) shown in line below** Dedicated mobile data only users

October 1998 13
Wireless Data Market - ItalyWireless Data Market - Italy
CAAGR CAAGR1997 1998 1999 2000 2001 2002 2003 2004 97-04 98-04
Total Users (000s)Digital Cellular- Full data * 35.4 70.8 109.0 171.0 257.0 355.0 448.0 552.0 48.1% 40.8%- SMS only 108.6 298.8 678.0 1162.5 1580.0 2030.0 2530.0 2880.0 59.7% 45.9%Dedicated Data 0.0 0.0 0.0 0.0 0.0 0.0 0.0 0.0 n/a n/aPAMR 1.6 2.3 2.9 3.8 5.0 6.0 6.9 7.7 25.2% 22.3%PMR 14.5 17.3 20.7 27.2 35.9 45.3 55.0 65.0 23.9% 24.7%Satellite ** 1.4 1.8 2.3 2.7 3.3 3.8 4.4 5.1 20.1% 18.6%Paging- POCSAG n/a n/a n/a n/a n/a n/a n/a n/a n/a n/a- ERMES n/a n/a n/a n/a n/a n/a n/a n/a n/a n/a- FLEX n/a n/a n/a n/a n/a n/a n/a n/a n/a n/a- Total n/a n/a n/a n/a n/a n/a n/a n/a n/a n/a
* Some of these may also be SMS users; total SMS users (stand-alone & others) shown in line below** Dedicated mobile data only users

October 1998 14
Wireless Data Market - UKWireless Data Market - UK
CAAGR CAAGR1997 1998 1999 2000 2001 2002 2003 2004 97-04 98-04
Total Users (000s)Digital Cellular- Full data * 67.0 120.0 206.0 334.0 550.0 770.0 990.0 1220.0 51.4% 47.2%- SMS only 491.1 727.9 997.3 1296.5 1646.5 2058.1 2510.9 3000.0 29.5% 26.6%Dedicated Data 94.8 110.1 130.1 156.6 189.8 226.3 264.2 286.0 17.1% 17.2%PAMR 7.0 10.0 14.0 19.2 25.6 32.7 40.6 50.0 32.4% 30.8%PMR 46.2 54.4 68.0 86.4 112.3 149.3 201.6 244.0 26.8% 28.4%Satellite ** 3.1 3.6 4.3 4.8 5.4 5.9 6.5 7.0 12.4% 11.6%Paging- POCSAG 1455.0 1773.0 2123.0 2462.0 2695.0 2787.0 2814.0 2830.0 10.0% 8.1%- ERMES 0.0 12.0 37.0 110.0 260.0 494.0 741.0 940.0 n/a 106.9%- FLEX 0.0 0.0 12.0 39.0 100.0 198.0 306.9 400.0 n/a n/a- Total 1455.0 1785.0 2172.0 2611.0 3055.0 3479.0 3861.9 4170.0 16.2% 15.2%
* Some of these may also be SMS users; total SMS users (stand-alone & others) shown in line below** Dedicated mobile data only users
October 1998 15
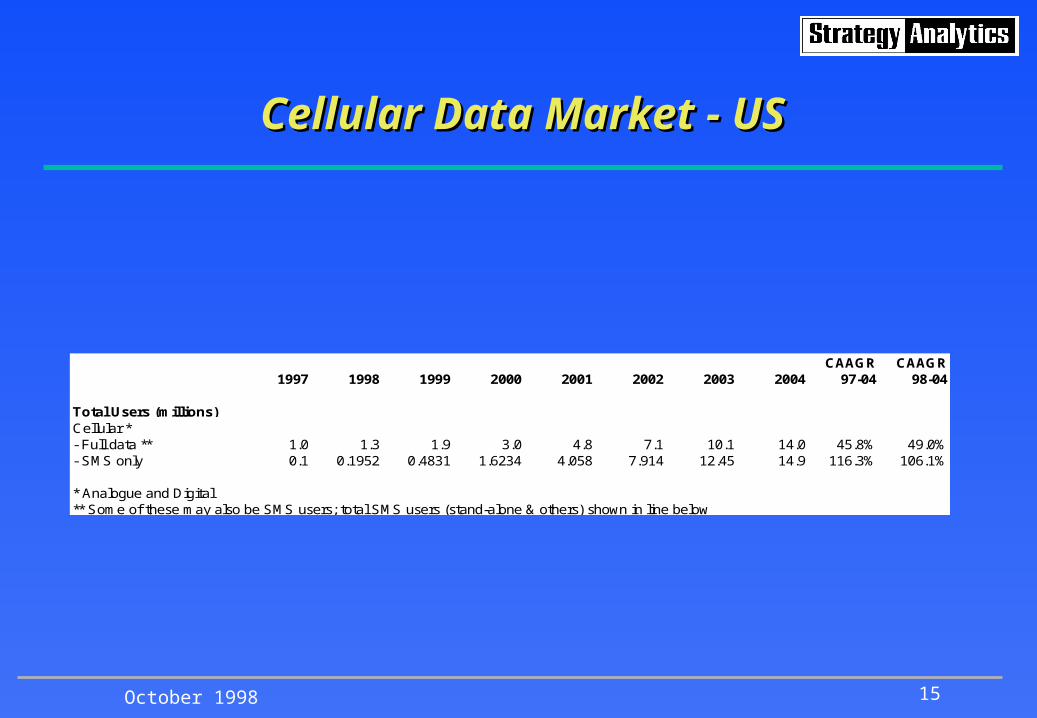
Cellular Data Market - USCellular Data Market - US
CAAGR CAAGR1997 1998 1999 2000 2001 2002 2003 2004 97-04 98-04
Total Users (millions)Cellular *- Full data ** 1.0 1.3 1.9 3.0 4.8 7.1 10.1 14.0 45.8% 49.0%- SMS only 0.1 0.1952 0.4831 1.6234 4.058 7.914 12.45 14.9 116.3% 106.1%
* Analogue and Digital** Some of these may also be SMS users; total SMS users (stand-alone & others) shown in line below

October 1998 16
ARPU & Total Data Revenues - GermanyARPU & Total Data Revenues - Germany
(1) Average Revenue Per User Per Month (ARPU - $)CAAGR CAAGR
1997 1998 1999 2000 2001 2002 2003 2004 97-04 98-04
Micro Info. Services 10.0 10.3 10.8 11.4 11.9 12.5 13.1 13.8 4.7% 5.0%Messaging Services 51.7 50.0 46.7 43.0 39.5 36.6 33.7 31.0 -7.0% -7.7%Multimedia Services 103.4 100.0 93.4 86.0 79.0 73.2 67.3 62.0 -7.0% -7.7%
(2) Total Revenues ($ Millions)CAAGR CAAGR
1997 1998 1999 2000 2001 2002 2003 2004 97-04 98-04
Micro Info. Services 60.0 104.6 177.2 275.0 404.7 562.8 702.0 823.2 45.4% 41.0%Messaging Services 66.3 139.9 201.1 297.2 436.8 606.9 754.8 855.6 44.1% 35.2%Multimedia Services 1.3 5.7 12.4 24.8 46.0 77.5 113.6 148.8 96.0% 72.2%
Total Data Revenues 127.6 250.3 390.8 597.0 887.5 1247.1 1570.4 1827.6 46.3% 39.3%
October 1998 17
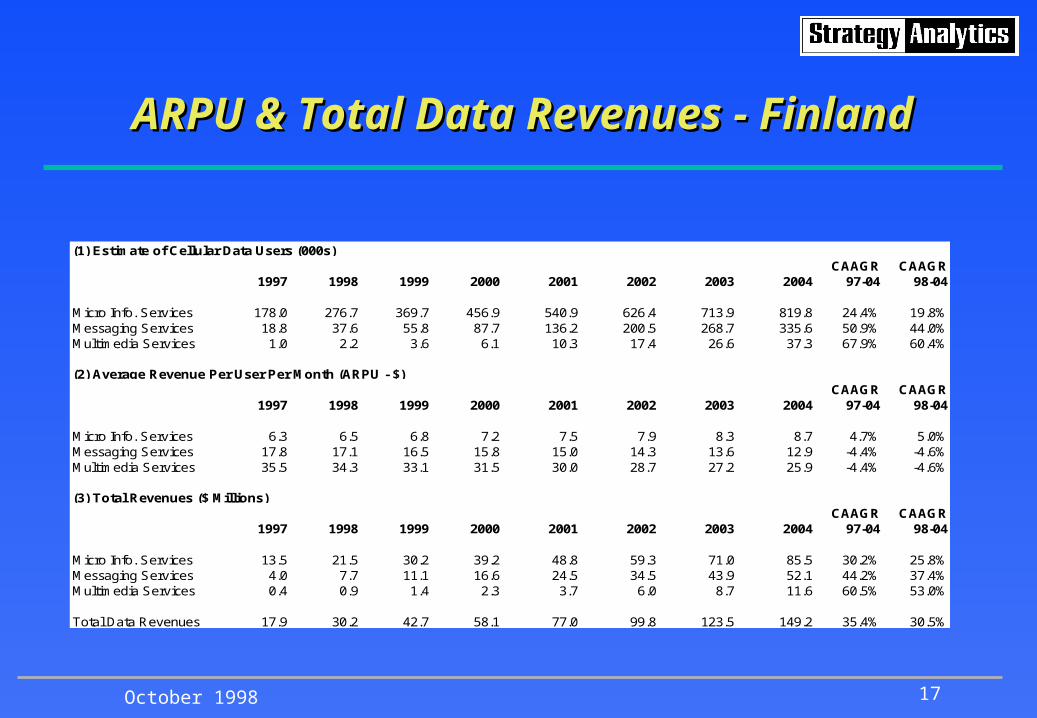
ARPU & Total Data Revenues - FinlandARPU & Total Data Revenues - Finland
(1) Estimate of Cellular Data Users (000s)CAAGR CAAGR
1997 1998 1999 2000 2001 2002 2003 2004 97-04 98-04
Micro Info. Services 178.0 276.7 369.7 456.9 540.9 626.4 713.9 819.8 24.4% 19.8%Messaging Services 18.8 37.6 55.8 87.7 136.2 200.5 268.7 335.6 50.9% 44.0%Multimedia Services 1.0 2.2 3.6 6.1 10.3 17.4 26.6 37.3 67.9% 60.4%
(2) Average Revenue Per User Per Month (ARPU - $)CAAGR CAAGR
1997 1998 1999 2000 2001 2002 2003 2004 97-04 98-04
Micro Info. Services 6.3 6.5 6.8 7.2 7.5 7.9 8.3 8.7 4.7% 5.0%Messaging Services 17.8 17.1 16.5 15.8 15.0 14.3 13.6 12.9 -4.4% -4.6%Multimedia Services 35.5 34.3 33.1 31.5 30.0 28.7 27.2 25.9 -4.4% -4.6%
(3) Total Revenues ($ Millions)CAAGR CAAGR
1997 1998 1999 2000 2001 2002 2003 2004 97-04 98-04
Micro Info. Services 13.5 21.5 30.2 39.2 48.8 59.3 71.0 85.5 30.2% 25.8%Messaging Services 4.0 7.7 11.1 16.6 24.5 34.5 43.9 52.1 44.2% 37.4%Multimedia Services 0.4 0.9 1.4 2.3 3.7 6.0 8.7 11.6 60.5% 53.0%
Total Data Revenues 17.9 30.2 42.7 58.1 77.0 99.8 123.5 149.2 35.4% 30.5%

October 1998 18
ARPU & Total Data Revenues - UKARPU & Total Data Revenues - UK
(1) Average Revenue Per User Per Month (ARPU - $)CAAGR CAAGR
1997 1998 1999 2000 2001 2002 2003 2004 97-04 98-04
Micro Info. Services 8.0 8.2 8.7 9.1 9.5 10.0 10.5 11.0 4.7% 5.0%Messaging Services 35.5 34.3 33.1 31.5 30.0 28.7 27.2 25.9 -4.4% -4.6%Multimedia Services 71.0 68.5 66.1 63.0 60.0 57.3 54.4 51.7 -4.4% -4.6%
(2) Total Revenues ($ Millions)CAAGR CAAGR
1997 1998 1999 2000 2001 2002 2003 2004 97-04 98-04
Micro Info. Services 47.1 72.0 103.5 141.3 188.5 247.4 316.9 397.5 35.6% 33.0%Messaging Services 27.1 46.6 76.8 118.0 184.1 243.5 294.1 340.6 43.6% 39.3%Multimedia Services 2.9 5.4 9.8 16.4 27.7 42.4 58.2 75.7 59.7% 55.2%
Total Data Revenues 77.1 124.0 190.1 275.8 400.3 533.3 669.1 813.8 40.0% 36.8%
October 1998 19
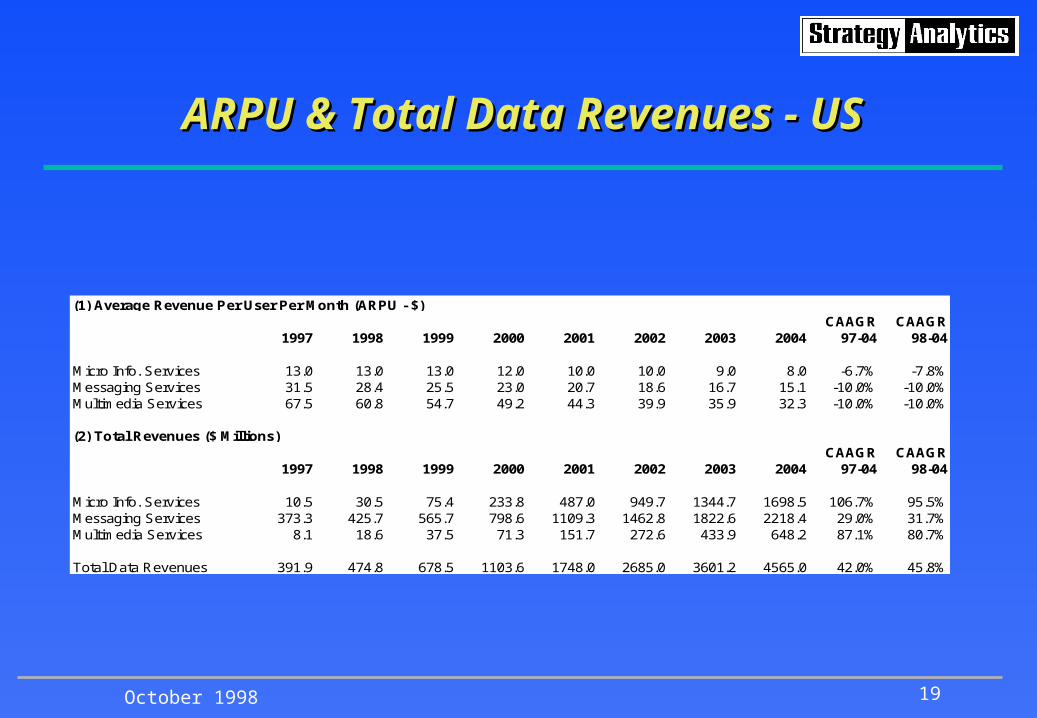
ARPU & Total Data Revenues - USARPU & Total Data Revenues - US
(1) Average Revenue Per User Per Month (ARPU - $)CAAGR CAAGR
1997 1998 1999 2000 2001 2002 2003 2004 97-04 98-04
Micro Info. Services 13.0 13.0 13.0 12.0 10.0 10.0 9.0 8.0 -6.7% -7.8%Messaging Services 31.5 28.4 25.5 23.0 20.7 18.6 16.7 15.1 -10.0% -10.0%Multimedia Services 67.5 60.8 54.7 49.2 44.3 39.9 35.9 32.3 -10.0% -10.0%
(2) Total Revenues ($ Millions)CAAGR CAAGR
1997 1998 1999 2000 2001 2002 2003 2004 97-04 98-04
Micro Info. Services 10.5 30.5 75.4 233.8 487.0 949.7 1344.7 1698.5 106.7% 95.5%Messaging Services 373.3 425.7 565.7 798.6 1109.3 1462.8 1822.6 2218.4 29.0% 31.7%Multimedia Services 8.1 18.6 37.5 71.3 151.7 272.6 433.9 648.2 87.1% 80.7%
Total Data Revenues 391.9 474.8 678.5 1103.6 1748.0 2685.0 3601.2 4565.0 42.0% 45.8%
October 1998 20
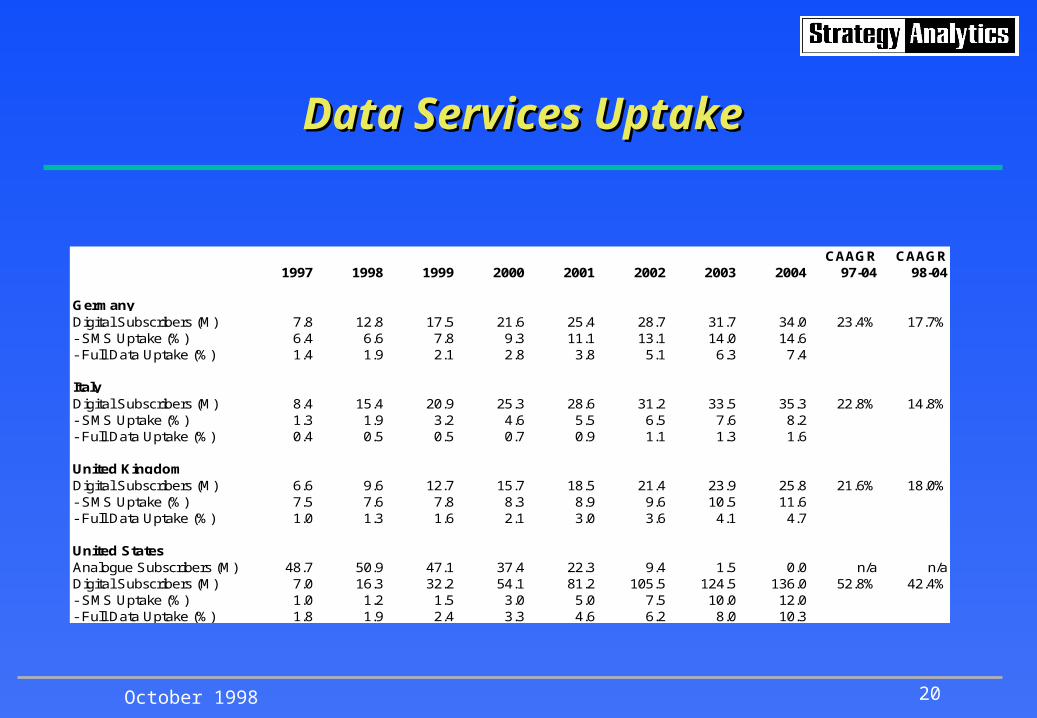
Data Services UptakeData Services Uptake
CAAGR CAAGR1997 1998 1999 2000 2001 2002 2003 2004 97-04 98-04
GermanyDigital Subscribers (M) 7.8 12.8 17.5 21.6 25.4 28.7 31.7 34.0 23.4% 17.7%- SMS Uptake (%) 6.4 6.6 7.8 9.3 11.1 13.1 14.0 14.6- Full Data Uptake (%) 1.4 1.9 2.1 2.8 3.8 5.1 6.3 7.4
ItalyDigital Subscribers (M) 8.4 15.4 20.9 25.3 28.6 31.2 33.5 35.3 22.8% 14.8%- SMS Uptake (%) 1.3 1.9 3.2 4.6 5.5 6.5 7.6 8.2- Full Data Uptake (%) 0.4 0.5 0.5 0.7 0.9 1.1 1.3 1.6
United KingdomDigital Subscribers (M) 6.6 9.6 12.7 15.7 18.5 21.4 23.9 25.8 21.6% 18.0%- SMS Uptake (%) 7.5 7.6 7.8 8.3 8.9 9.6 10.5 11.6- Full Data Uptake (%) 1.0 1.3 1.6 2.1 3.0 3.6 4.1 4.7
United StatesAnalogue Subscribers (M) 48.7 50.9 47.1 37.4 22.3 9.4 1.5 0.0 n/a n/aDigital Subscribers (M) 7.0 16.3 32.2 54.1 81.2 105.5 124.5 136.0 52.8% 42.4%- SMS Uptake (%) 1.0 1.2 1.5 3.0 5.0 7.5 10.0 12.0- Full Data Uptake (%) 1.8 1.9 2.4 3.3 4.6 6.2 8.0 10.3
October 1998 21
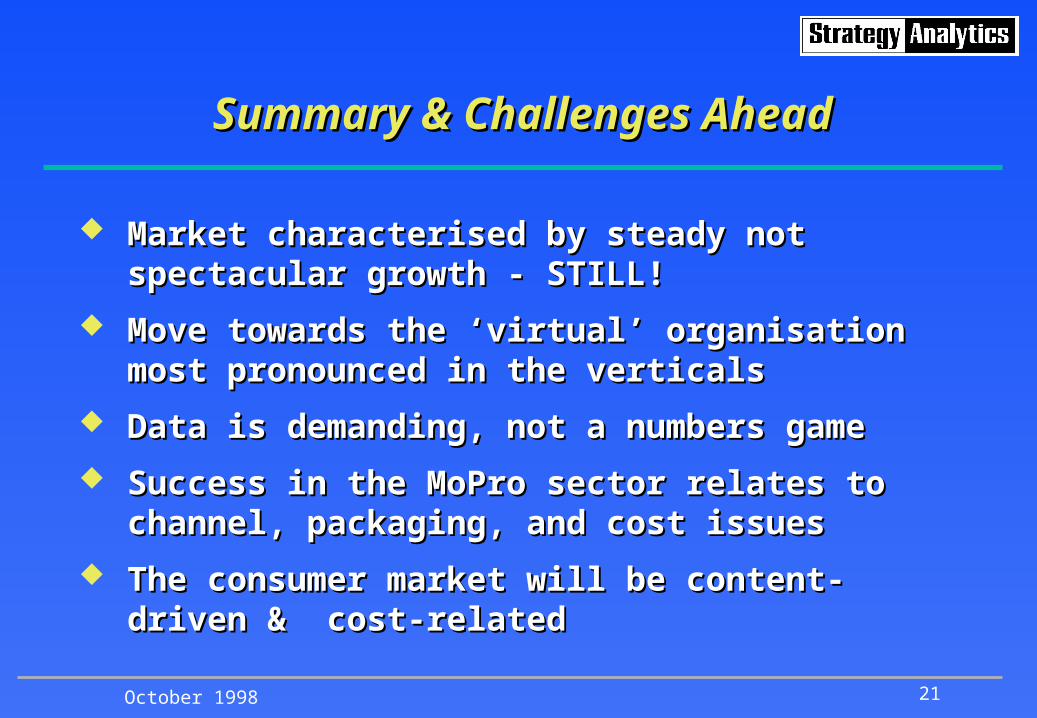
Summary & Challenges AheadSummary & Challenges Ahead
Market characterised by steady not spectacular Market characterised by steady not spectacular growth - STILL!growth - STILL!
Move towards the ‘virtual’ organisation most Move towards the ‘virtual’ organisation most pronounced in the verticalspronounced in the verticals
Data is demanding, not a numbers gameData is demanding, not a numbers game
Success in the MoPro sector relates to channel, Success in the MoPro sector relates to channel, packaging, and cost issuespackaging, and cost issues
The consumer market will be content-driven & The consumer market will be content-driven & cost-relatedcost-related
Related Documents