Atmos. Chem. Phys., 9, 1687–1709, 2009 www.atmos-chem-phys.net/9/1687/2009/ © Author(s) 2009. This work is distributed under the Creative Commons Attribution 3.0 License. Atmospheric Chemistry and Physics Operational climate monitoring from space: the EUMETSAT Satellite Application Facility on Climate Monitoring (CM-SAF) J. Schulz 1 , P. Albert 1 , H.-D. Behr 1 , D. Caprion 2 , H. Deneke 3 , S. Dewitte 2 , B. D ¨ urr 4 , P. Fuchs 1 , A. Gratzki 1 , P. Hechler 1 , R. Hollmann 1 , S. Johnston 5 , K.-G. Karlsson 5 , T. Manninen 6 , R. M ¨ uller 1 , M. Reuter 1 , A. Riihel ¨ a 6 , R. Roebeling 3 , N. Selbach 1 , A. Tetzlaff 5 , W. Thomas 1 , M. Werscheck 1 , E. Wolters 3 , and A. Zelenka 4 1 Deutscher Wetterdienst (DWD), Frankfurter Straße 135, 63004 Offenbach, Germany 2 Royal Meteorological Institute of Belgium (RMI), Ringlaan 3 Avenue Circulaire, 1180 Brussels, Belgium 3 Koninklijk Nederlands Meteorologisch Instituut (KNMI), Wilhelminalaan 10 3732 GK De Bilt, The Netherlands 4 MeteoSchweiz, P.O. Box 514, 8044 Z¨ urich, Switzerland 5 Swedish Meteorological and Hydrological Institute (SMHI), Folkborgsv¨ agen 1, 601 76 Norrk ¨ oping, Sweden 6 Finnish Meteorological Institute (FMI), P.O. Box 503, 00101 Helsinki, Finland Received: 29 February 2008 – Published in Atmos. Chem. Phys. Discuss.: 8 May 2008 Revised: 26 January 2009 – Accepted: 26 January 2009 – Published: 5 March 2009 Abstract. The Satellite Application Facility on Climate Monitoring (CM-SAF) aims at the provision of satellite- derived geophysical parameter data sets suitable for climate monitoring. CM-SAF provides climatologies for Essential Climate Variables (ECV), as required by the Global Cli- mate Observing System implementation plan in support of the UNFCCC. Several cloud parameters, surface albedo, ra- diation fluxes at the top of the atmosphere and at the sur- face as well as atmospheric temperature and humidity prod- ucts form a sound basis for climate monitoring of the at- mosphere. The products are categorized in monitoring data sets obtained in near real time and data sets based on care- fully intercalibrated radiances. The CM-SAF products are derived from several instruments on-board operational satel- lites in geostationary and polar orbit as the Meteosat and NOAA satellites, respectively. The existing data sets will be continued using data from the instruments on-board the new joint NOAA/EUMETSAT Meteorological Operational Polar satellite. The products have mostly been validated against several ground-based data sets both in situ and re- motely sensed. The accomplished accuracy for products de- rived in near real time is sufficient to monitor variability on diurnal and seasonal scales. The demands on accuracy in- crease the longer the considered time scale is. Thus, interan- nual variability or trends can only be assessed if the sensor Correspondence to: J. Schulz ([email protected]) data are corrected for jumps created by instrument changes on successive satellites and more subtle effects like instru- ment and orbit drift and also changes to the spectral response function of an instrument. Thus, a central goal of the recently started Continuous Development and Operations Phase of the CM-SAF (2007–2012) is to further improve all CM-SAF data products to a quality level that allows for studies of in- terannual variability. 1 Introduction Concerns about the Earth’s climate implicate an increasing necessity for climate monitoring on a global scale. Cli- mate change and variation occur on different time scales and data sets useful for climate monitoring must therefore cover longer time series to understand these changes. The demands on the accuracy increase accordingly to the time scales con- sidered. At the seasonal to interannual time scale the ac- curacy requirements increase dramatically because climate phenomena at this scale are initiated by very small changes in the observed parameters. At decennial to centennial time scales which are exclusively suitable for trend detection the accuracy of data sets must be one order of magnitude higher than compared to the needs of detecting interannual fluctua- tions. Only space-based observations can deliver the needed global coverage with sufficient quality and timeliness. Par- ticularly over the ocean and sparsely populated areas satellite Published by Copernicus Publications on behalf of the European Geosciences Union.

Welcome message from author
This document is posted to help you gain knowledge. Please leave a comment to let me know what you think about it! Share it to your friends and learn new things together.
Transcript
Atmos. Chem. Phys., 9, 1687–1709, 2009www.atmos-chem-phys.net/9/1687/2009/© Author(s) 2009. This work is distributed underthe Creative Commons Attribution 3.0 License.
AtmosphericChemistry
and Physics
Operational climate monitoring from space: the EUMETSATSatellite Application Facility on Climate Monitoring (CM-SAF)
J. Schulz1, P. Albert1, H.-D. Behr1, D. Caprion2, H. Deneke3, S. Dewitte2, B. Durr 4, P. Fuchs1, A. Gratzki 1,P. Hechler1, R. Hollmann1, S. Johnston5, K.-G. Karlsson5, T. Manninen6, R. Muller1, M. Reuter1, A. Riihela6,R. Roebeling3, N. Selbach1, A. Tetzlaff5, W. Thomas1, M. Werscheck1, E. Wolters3, and A. Zelenka4
1Deutscher Wetterdienst (DWD), Frankfurter Straße 135, 63004 Offenbach, Germany2Royal Meteorological Institute of Belgium (RMI), Ringlaan 3 Avenue Circulaire, 1180 Brussels, Belgium3Koninklijk Nederlands Meteorologisch Instituut (KNMI), Wilhelminalaan 10 3732 GK De Bilt, The Netherlands4MeteoSchweiz, P.O. Box 514, 8044 Zurich, Switzerland5Swedish Meteorological and Hydrological Institute (SMHI), Folkborgsvagen 1, 601 76 Norrkoping, Sweden6Finnish Meteorological Institute (FMI), P.O. Box 503, 00101 Helsinki, Finland
Received: 29 February 2008 – Published in Atmos. Chem. Phys. Discuss.: 8 May 2008Revised: 26 January 2009 – Accepted: 26 January 2009 – Published: 5 March 2009
Abstract. The Satellite Application Facility on ClimateMonitoring (CM-SAF) aims at the provision of satellite-derived geophysical parameter data sets suitable for climatemonitoring. CM-SAF provides climatologies for EssentialClimate Variables (ECV), as required by the Global Cli-mate Observing System implementation plan in support ofthe UNFCCC. Several cloud parameters, surface albedo, ra-diation fluxes at the top of the atmosphere and at the sur-face as well as atmospheric temperature and humidity prod-ucts form a sound basis for climate monitoring of the at-mosphere. The products are categorized in monitoring datasets obtained in near real time and data sets based on care-fully intercalibrated radiances. The CM-SAF products arederived from several instruments on-board operational satel-lites in geostationary and polar orbit as the Meteosat andNOAA satellites, respectively. The existing data sets willbe continued using data from the instruments on-board thenew joint NOAA/EUMETSAT Meteorological OperationalPolar satellite. The products have mostly been validatedagainst several ground-based data sets both in situ and re-motely sensed. The accomplished accuracy for products de-rived in near real time is sufficient to monitor variability ondiurnal and seasonal scales. The demands on accuracy in-crease the longer the considered time scale is. Thus, interan-nual variability or trends can only be assessed if the sensor
Correspondence to:J. Schulz([email protected])
data are corrected for jumps created by instrument changeson successive satellites and more subtle effects like instru-ment and orbit drift and also changes to the spectral responsefunction of an instrument. Thus, a central goal of the recentlystarted Continuous Development and Operations Phase ofthe CM-SAF (2007–2012) is to further improve all CM-SAFdata products to a quality level that allows for studies of in-terannual variability.
1 Introduction
Concerns about the Earth’s climate implicate an increasingnecessity for climate monitoring on a global scale. Cli-mate change and variation occur on different time scales anddata sets useful for climate monitoring must therefore coverlonger time series to understand these changes. The demandson the accuracy increase accordingly to the time scales con-sidered. At the seasonal to interannual time scale the ac-curacy requirements increase dramatically because climatephenomena at this scale are initiated by very small changesin the observed parameters. At decennial to centennial timescales which are exclusively suitable for trend detection theaccuracy of data sets must be one order of magnitude higherthan compared to the needs of detecting interannual fluctua-tions.
Only space-based observations can deliver the neededglobal coverage with sufficient quality and timeliness. Par-ticularly over the ocean and sparsely populated areas satellite
Published by Copernicus Publications on behalf of the European Geosciences Union.
1688 J. Schulz et al.: Operational climate monitoring from space: CM-SAF
data are largely the only data source. Existing satellites nowprovide sufficiently long data series that have been used forclimate analysis (e.g.,Santer et al., 2007, Mieruch et al.,2008andTrenberth et al., 2005). Satellite data provide infor-mation on the climate system that are not available or difficultto measure from the Earths surface like top of atmosphere ra-diation, cloud properties or humidity in the upper atmospherethe two latter having a large impact on the greenhouse effect.
Understanding the processes which control the natural sta-bility and variability of the climate system is one of the mostdifficult and challenging scientific problems faced by the cli-mate science community today. An improved understandingof the interaction processes between water vapor and cloudsas well as their radiative impact is urgently required.
The Earth’s Radiation Budget (ERB) is the balance be-tween the incoming radiation from the sun and the outgoingreflected and scattered solar radiation plus the thermal in-frared emission to space. Earth surface conditions greatlyinfluence the radiation budget, e.g. through surface tempera-ture variations in the thermal infrared and through a criticalcontribution to the planetary albedo (especially for desert re-gions and snow- and ice-covered polar regions).
Water vapor is a major greenhouse gas and is usually con-sidered to play an amplifying role in global warming througha strongly positive climate feedback loop (Held and Soden,2000), although with some remaining question marks con-cerning the link to cloud feedback processes. Due to the nonlinearity of interactions of the radiation field and the watervapor, outgoing longwave radiation (OLR) is more sensitiveto a small humidity perturbation in a dry environment thanin a moist region. For instance, increasing the upper tro-pospheric humidity from 5% to 10% at constant tempera-ture, increases the outgoing longwave radiation by 10 Wm−2
while increasing the upper tropospheric humidity from 25%to 30% only modifies OLR by less than 5 Wm−2. This con-fers a central role to the dry upper troposphere regions inthe radiation budget and its sensitivity. Documenting therecent decades history of the water vapor field should givesome understanding of the mechanisms at play in the climateand how it responds to the increasing greenhouse gas con-centration. For instance, a potential drying of the upper tro-posphere as a consequence of a CO2 increase as postulatedin recent climate change theory can be investigated with anextensive documentation of the tropospheric humidity fromsatellite (Rind, 1998; Soden, 2000).
Because the water vapor distribution results from the largescale dynamics and associated transports that take place atsynoptic scales, its documentation can also yield some in-sights into the dynamics of the atmosphere and its evolution.It is then important to monitor its evolution with high tem-poral resolution over a long time period. This effort couldin principle be useful to detect, if any, trends not only in themean climate but also in the transient activity, which is cen-tral to the energy cycle.
Clouds exert a blanketing effect similar to that of watervapor. In the infrared spectral region clouds behave likeblack-bodies, and emit radiation back to the Earth and toouter space depending on their temperature. As water va-por, clouds absorb and emit infrared radiation and thus con-tribute to the warming of the Earth’s surface. However, thiseffect is counterbalanced by the reflectance of clouds, whichreduces the amount of incoming solar radiation at the Earth’ssurface. Because most clouds are bright reflectors they blockmuch of the incoming solar radiation and reflect it back tospace before it can be absorbed by the Earth surface or theatmosphere, which has a cooling effect on the climate sys-tem. The net average effect of the Earth’s cloud cover in thepresent climate is a slight cooling because the reflection ofradiation more than compensates for the greenhouse effectof clouds.
One of the most problematic issues in studying cloudsis their transient nature- they are continuously changing inspace and time, which make them very difficult to both ob-serve and simulate in models. This also explains why dif-ferences in cloud descriptions and cloud parameterizationsbetween various climate models are responsible for a majorpart of the variation seen in climate model scenarios throughcloud feedback processes (Stephens, 2005). Hence, progressis needed here both concerning cloud observation and cloudmodeling aspects.
From the above paragraphs it is obvious that a high qualitycombined water vapor – cloud – radiation time series derivedfrom satellite data is of enormous value for climate research.This is reflected in the choice of products of the Satellite Ap-plication Facility (SAF) on Climate Monitoring (CM-SAF).The CM-SAF is part of EUMETSAT’s SAF Network, thatcomprises eight SAFs (see www.eumetsat.int for further de-tails). The SAF network is a network of networks, dedicatedto tackle the tasks and challenges in the field of meteorologyand climatology supported by satellite data as the main in-put. The CM-SAF as part of this network plays a major rolein EUMETSAT’s activities towards climate monitoring.
Beside the issues of monitoring and understanding the cli-mate system, adaptation to and active protection against cli-mate change is highly relevant to societies. Both are stronglycoupled to the production of electricity, where solar energysystems provide a sustainable and environmentally sound al-ternative to traditional power plants. Accurate solar irradi-ance data is needed for the efficient planning and design ofsolar energy systems. CM-SAF radiation data may help to in-crease the efficiency of such systems which leads to a poten-tial reduction of CO2 emissions by the replacement of fossilpower plants.
This paper introduces the CM-SAF concept, its currentproducts including their quality and its near future plan.Within the next section the historic background and the ob-jectives of CM-SAF are described in more detail. This isfollowed by a description of the individual climate moni-toring products including the techniques to derive them and
Atmos. Chem. Phys., 9, 1687–1709, 2009 www.atmos-chem-phys.net/9/1687/2009/
J. Schulz et al.: Operational climate monitoring from space: CM-SAF 1689
estimations of achieved accuracy. The last section is dedi-cated to the tasks of the so called Continuous Developmentand Operations Phase (CDOP) with a duration of five years(2007–2012).
2 Background and objectives
First attempts to generate long-term data series of atmo-spheric quantities derived from satellite measurements goback to the early eighties when the International SatelliteCloud Climatology Project (ISCCP) started its work (Rossowand Garder, 1993). The cloud information from the ISCCPdata set was successfully used to derive a climatology ofthe shortwave radiation budget (Gupta et al., 1999). Pre-cursory cloud data sets are e.g., the PATMOS data set (Ja-cobowitz et al., 2003), the SCANDIA cloud climatology(Karlsson, 2003) over Scandinavia, and the European CloudClimatology (Meerkotter et al., 2004) which were all derivedfrom Advanced Very High Resolution Radiometer (AVHRR)observations. SCANDIA has recently been used to elu-cidate possible weaknesses of regional climate simulationswith respect to the simulation of cloud amount, cloud opti-cal thickness and the vertical distribution of clouds (Karls-son et al., 2008). The NASA Water Vapor Project (NVAP)provides global total column water vapor data sets derivedfrom Television and Infrared Operational Satellite (TIROS)Operational Vertical Sounders (TOVS), and Special Sen-sor Microwave/Imager (SSM/I) data spanning a period over14 years (1998–2001) (Vonder Haar, 2003).
Although accuracy and precision of satellite-based timeseries may locally be lower than existing and correspond-ing data sets derived from ground-based measurements, theyprovide a much more homogeneous data quality compared tothe heterogeneous observation system at the ground. How-ever, dedicated effort is needed to generate homogeneous,stable and accurate data sets with high spatial resolution fromrecent, current and future satellite sensors. Then, such timeseries of satellite-derived quantities can be used e.g., for thedetection of climate change. Following the terminology ofthe NOAA White Paper on creating Climate Data Records(CDRs) from satellite measurements (Colton et al., 2003),CM-SAF has the mandate to generate thematic climate datarecords in an operational off-line environment. Environmen-tal Data Records (EDR) are obtained if satellite sensor dataare converted to geophysical variables in real time using thenominal calibration over time. EDRs may be aggregated tomonthly means and used for some monitoring purposes. Fora CDR usable for analysis of interannual variability or trendsit is required to improve the calibration, to homogenise theseries of data coming from different satellites, and to use onlyone retrieval scheme for the whole temporal record. The con-cept of different data records as used within NOAA and CM-SAF is explained in more detail inRobinson et al.(2004).
A very accurate absolute calibration as well as a veryhigh sensor stability over time is required to accomplish theneeded product accuracy (Ohring et al., 2005). Additionally,radiance data coming from different satellite platforms mustbe intercalibrated. It is required that this data sets and relatedmethods are provided by several satellite operators.
Within the range of essential climate variables (ECV)as defined in the GCOS Second Adequacy Report (GCOS,2003) the CM-SAF currently focuses on the provision ofgeophysical parameters describing elements of the energyand water cycle. CM-SAF provides regional products withcomparably high spatial resolution as well as global prod-ucts that complement ongoing international activities. CM-SAF exploits the polar orbiting NOAA and MetOp satel-lites utilizing data from the Advanced Very High Resolu-tion Radiometer (AVHRR), High resolution Infrared Radi-ation Sounder (HIRS), Infrared Atmospheric Sounding In-terferometer (IASI), Advanced Microwave Sounding Unit(AMSU) and Microwave Humidity Sounder (MHS) instru-ments. Additionally, the Global Earth Radiation Budget(GERB) (Harries et al., 2005) and the Spinning EnhancedVisible and Infrared Imager (SEVIRI) radiometers (Schmetzet al., 2002) on-board the METEOSAT Second Generation(MSG) satellites are used. Data from the Clouds and Earth’sRadiant Energy System (CERES) on-board TERRA andAQUA support the retrieval of radiation fluxes at top of theatmosphere. Furthermore, data of the Special Sensor Mi-crowave/Imager (SSM/I) series are used to provide a consis-tent time series of total column water vapor over the oceanspanning the period 1987–2005.
CM-SAF data sets can be categorized into three differ-ent groups fulfilling different requirements. During the Ini-tial Operations Phase (IOP, 2004-2007) operational proce-dures to quickly process large amounts of data were estab-lished. Products are available in almost real time but retrievalschemes changed over time. Additionally, radiances used asinput were only nominally calibrated, i.e., no intercalibrationaccounts for sensor changes and other sensor related errors.During the so called Continuous Development and Opera-tions phase (CDOP, 2007–2012) the focus is on the genera-tion of long homogeneous time series of the CM-SAF prod-ucts. The three data set categories and their properties are:
– CDRs for operational climate monitoring are con-structed from so called Environmental Data Records(EDR). EDRs are instantaneous estimates of geophys-ical variables retrieved in near real-time only utilizinginformation from the past and aiming at a small ran-dom error. Input to this processing are nominal cal-ibrated radiances or automatically intercalibrated sen-sor data if provided by the space agencies. The instan-taneous EDRs are then integrated over time to obtaindaily and monthly averaged products. Within this pro-cess also information from the future is used, e.g., awhole month of data is used to compute daily averages
www.atmos-chem-phys.net/9/1687/2009/ Atmos. Chem. Phys., 9, 1687–1709, 2009
1690 J. Schulz et al.: Operational climate monitoring from space: CM-SAF
for a particular month employing also temporal correla-tions to fill gaps. The application area of these data setsis on diurnal and sub-seasonal to seasonal time scales,e.g., the monitoring of extreme events and the supportof NMSs climate departments in early disseminationof climate information to the public. Additionally, theproducts are accurate enough to be used for solar energyapplications. The use on longer time scales depends onthe quality of automated intersensor calibration. De-rived geophysical averages may have to be corrected us-ing ground based information for further use. The datasets currently created at CM-SAF mostly belong to thiscategory.
– Reprocessed CDRs form a second class and will be cre-ated if substantial knowledge on the correction of instru-ment and retrieval errors can be applied. This should atleast include inter satellite homogenisation and no algo-rithm changes over time for the production of the dataset. Depending on the number of satellite instrumentsinvolved in a product and the success of automated ra-diance homogenisation as well as corrections of system-atic errors caused by instrument failures or orbit varia-tions, the products are expected to be useful for timescales ranging from diurnal, seasonal to inter-annual.For the latter scale the variability is much smaller com-pared to diurnal and sub-seasonal fluctuations. Most ofthe CM-SAF products will reach this status during theCDOP.
– A third class of CDRs will be provided for the analy-ses of long term climate variability (decadal). Here it isnecessary that expert teams have improved absolute cal-ibration of the involved instruments to the highest pos-sible level and that other instrument and orbit relatedsystematic errors are diminished to a level that the verysmall decadal variability in a variable can be monitored.Some of the parameters, e.g., total column water vaporover oceans from passive microwave imager data mayreach this status shortly after the CDOP when the timeseries of such data approaches 30 years. Additionally,the records started from new instruments as IASI andothers on EUMETSAT MetOp satellite are expected todeliver such high quality data to create a data set suit-able for the analysis of decadal variability.
3 Products, retrieval schemes and validation
As mentioned above CM-SAF focuses on retrieving geo-physical parameters from satellite data employing inversionschemes based on radiation transfer theory. This comple-ments other international activities on the use of satellite datain climate research as the use of radiance data for climatetrend detection and the assimilation of satellite data into dy-
namical models to retrieve geophysical products as e.g. in theERA-40 reanalysis. The products currently are:
– Cloud parameters: cloud fractional cover (CFC), cloudtype (CTY), cloud top pressure (CTP), cloud top height(CTH), cloud top temperature (CTT), cloud phase(CPH), cloud optical thickness (COT), cloud water path(CWP);
– Radiation budget parameters at the surface and the topof the atmosphere (TOA). Surface: Incoming short-wave radiation (SIS), surface albedo (SAL), net short-wave radiation (SNS), netlongwave radiation (SNL),downward (SDL) and outgoing longwave radiation(SOL), surface radiation budget (SRB); TOA: Incom-ing solar radiative flux (TIS), reflected solar radiativeflux (TRS), emitted thermal radiative flux (TET);
– Humidity products: Total (HTW - surface to 100 hPa)and layered (HLW) precipitable water, mean tem-perature, and relative humidity for 5 layers (1000–850 hPa, 850–700 hPa, 700–500 hPa, 500–300 hPa,300–200 hPa) as well as specific humidity and tempera-ture at the six layer boundaries (HSH).
These products were mainly discussed and defined duringthe development phase of the CM-SAF (Woick et al., 2002).The list of products reflects atmospheric parameters that canbe derived from sensors on-board operational satellites withstate-of-the-art retrieval schemes. The list was confirmed bya user survey held by CM-SAF in 2001 which allowed alsoto prioritize the development of products. The majority ofproducts is classified as essential climate variable (ECV),as can be seen in the GCOS implementation plan (GCOS,2004). Although well known parameters as sea and landsurface temperature as well as ice and snow cover are notexplicitly provided their impact is implicitly covered by sur-face albedo and surface radiation fluxes. All products areavailable via electronic ordering atwww.cmsaf.eu.
Currently, all CM-SAF products derived from instrumentson the Meteosat platform cover the full METEOSAT visibledisc. Products derived from AVHRR measurements cover anarea between 30◦ N to 80◦ N and 60◦ W to 60◦ E, i.e. basi-cally Europe and the Northeast Atlantic. Water vapor prod-ucts derived from ATOVS data are provided with global cov-erage. Near real time monitoring products are available fromMay 2007 onwards.
Additionally, a total column water vapor product derivedfrom SSM/I data that covers global ice-free ocean areas isprovided. The SSM/I record is based on homogenised SSM/Ibrightness temperatures (Andersson et al., 2009) and is avail-able for the period July 1987 – August 2006. Cloud productsand surface albedo will be further extended to cover the In-ner Arctic. AVHRR, ATOVS and IASI data from the MetOpsatellite will be used to further improve coverage and accu-racy of the products in the near future.
Atmos. Chem. Phys., 9, 1687–1709, 2009 www.atmos-chem-phys.net/9/1687/2009/
J. Schulz et al.: Operational climate monitoring from space: CM-SAF 1691
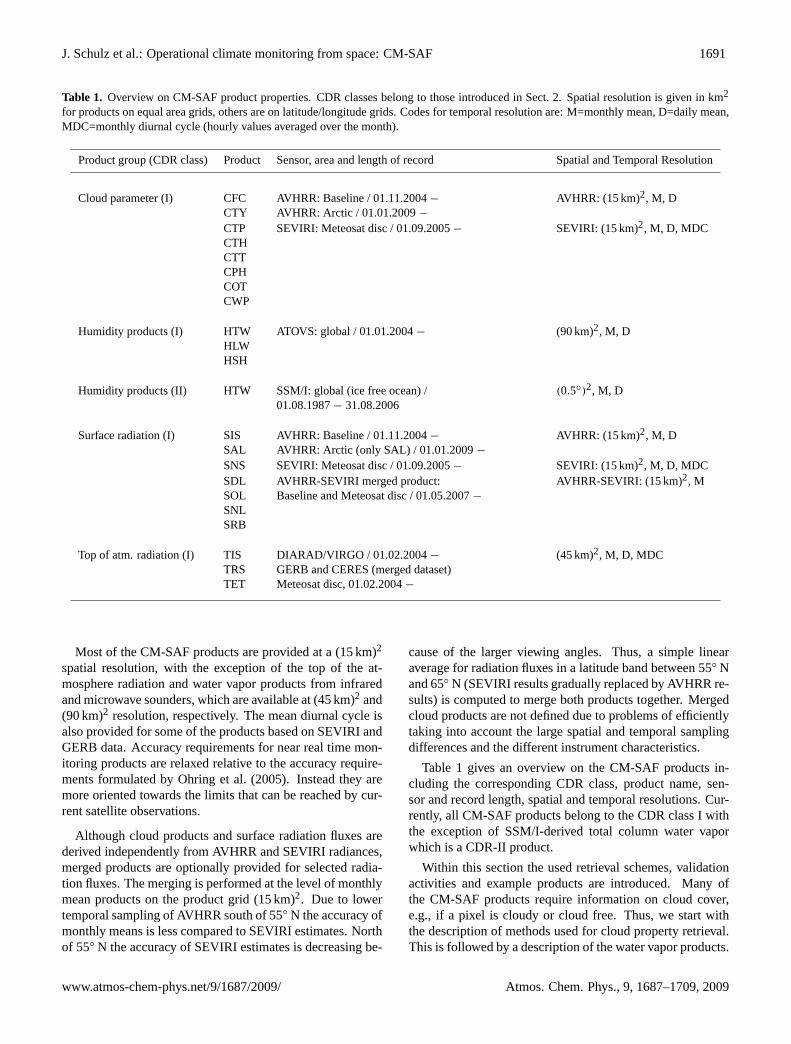
Table 1. Overview on CM-SAF product properties. CDR classes belong to those introduced in Sect.2. Spatial resolution is given in km2
for products on equal area grids, others are on latitude/longitude grids. Codes for temporal resolution are: M=monthly mean, D=daily mean,MDC=monthly diurnal cycle (hourly values averaged over the month).
Product group (CDR class) Product Sensor, area and length of record Spatial and Temporal Resolution
Cloud parameter (I) CFC AVHRR: Baseline / 01.11.2004− AVHRR: (15 km)2, M, DCTY AVHRR: Arctic / 01.01.2009−CTP SEVIRI: Meteosat disc / 01.09.2005− SEVIRI: (15 km)2, M, D, MDCCTHCTTCPHCOTCWP
Humidity products (I) HTW ATOVS: global / 01.01.2004− (90 km)2, M, DHLWHSH
Humidity products (II) HTW SSM/I: global (ice free ocean) / (0.5◦)2, M, D01.08.1987− 31.08.2006
Surface radiation (I) SIS AVHRR: Baseline / 01.11.2004− AVHRR: (15 km)2, M, DSAL AVHRR: Arctic (only SAL) / 01.01.2009−SNS SEVIRI: Meteosat disc / 01.09.2005− SEVIRI: (15 km)2, M, D, MDCSDL AVHRR-SEVIRI merged product: AVHRR-SEVIRI: (15 km)2, MSOL Baseline and Meteosat disc / 01.05.2007−
SNLSRB
Top of atm. radiation (I) TIS DIARAD/VIRGO / 01.02.2004− (45 km)2, M, D, MDCTRS GERB and CERES (merged dataset)TET Meteosat disc, 01.02.2004−
Most of the CM-SAF products are provided at a (15 km)2
spatial resolution, with the exception of the top of the at-mosphere radiation and water vapor products from infraredand microwave sounders, which are available at (45 km)2 and(90 km)2 resolution, respectively. The mean diurnal cycle isalso provided for some of the products based on SEVIRI andGERB data. Accuracy requirements for near real time mon-itoring products are relaxed relative to the accuracy require-ments formulated byOhring et al.(2005). Instead they aremore oriented towards the limits that can be reached by cur-rent satellite observations.
Although cloud products and surface radiation fluxes arederived independently from AVHRR and SEVIRI radiances,merged products are optionally provided for selected radia-tion fluxes. The merging is performed at the level of monthlymean products on the product grid (15 km)2. Due to lowertemporal sampling of AVHRR south of 55◦ N the accuracy ofmonthly means is less compared to SEVIRI estimates. Northof 55◦ N the accuracy of SEVIRI estimates is decreasing be-
cause of the larger viewing angles. Thus, a simple linearaverage for radiation fluxes in a latitude band between 55◦ Nand 65◦ N (SEVIRI results gradually replaced by AVHRR re-sults) is computed to merge both products together. Mergedcloud products are not defined due to problems of efficientlytaking into account the large spatial and temporal samplingdifferences and the different instrument characteristics.
Table 1 gives an overview on the CM-SAF products in-cluding the corresponding CDR class, product name, sen-sor and record length, spatial and temporal resolutions. Cur-rently, all CM-SAF products belong to the CDR class I withthe exception of SSM/I-derived total column water vaporwhich is a CDR-II product.
Within this section the used retrieval schemes, validationactivities and example products are introduced. Many ofthe CM-SAF products require information on cloud cover,e.g., if a pixel is cloudy or cloud free. Thus, we start withthe description of methods used for cloud property retrieval.This is followed by a description of the water vapor products.
www.atmos-chem-phys.net/9/1687/2009/ Atmos. Chem. Phys., 9, 1687–1709, 2009
1692 J. Schulz et al.: Operational climate monitoring from space: CM-SAF
Finally, retrieval schemes for the resulting radiation fluxes atthe top of the atmosphere and the surface are explained andtheir quality is assessed.
3.1 Cloud properties
All cloud parameters mentioned above are derived fromboth NOAA/AVHRR and MSG/SEVIRI visible and infraredchannels, with corresponding spatial and temporal sampling.
3.1.1 Retrieval
Fractional cloud cover, cloud type and cloud-top parame-ters are derived followingDybbroe et al.(2005a), Dybbroeet al.(2005b) for NOAA/AVHRR andDerrien and LeGleau(2005) for MSG/SEVIRI. Fundamental principles of the al-gorithms applied to SEVIRI raw data can already be foundin an earlier paper byDerrien et al.(1993). The algorithmsare provided by the SAF in Support to Nowcasting and VeryShort-Range Forecasting (NWC-SAF). Both retrievals arebased on a multi-spectral threshold technique applied to eachpixel of a satellite scene. Typically, these methods allow toretrieve cloud parameters during daylight and during night-time in the visible and near-infrared part of the spectrum be-tween 0.5µm and 3.7µm and in the infrared region between10 and 12µm. The SEVIRI algorithm also makes use of the8.7µm channel.
The first retrieved parameter is the fractional cloud coverbased on cloud masking of several satellite pixels. The ma-jority of threshold tests uses the infra-red channels of theradiometers, e.g. the well-known difference of brightnesstemperatures inside and outside the so-called infrared win-dow channels to detect high-level cirrus clouds (split-windowtechnique, see e.g.Inoue, 1987). The series of tests to bepassed allows to finally separate clear-sky, cloudy and par-tially cloudy pixels. Also snow/ice-covered pixels and un-classified pixels (where all tests failed) are identified. Acloud-mask is then generated for the entire SEVIRI slot orAVHRR orbit which is used in subsequent algorithm steps,e.g. for the cloud-top parameter retrieval.
The first step for cloud type retrieval is to use measuredcloud temperatures in the infrared channels to separate thickclouds. For further separation of water clouds and semi-transparent ice clouds, differences in reflection character-istics at short-wave infrared channels (e.g. at 1.6, 3.7 and3.9µm) and differences in transmission characteristics in in-frared channels (3.7 or 3.9µm, 8.7, 11 and 12µm) are uti-lized.
Cloud-top pressure assignment for MSG/SEVIRI cloudypixels followsSchmetz et al.(1993) andMenzel et al.(1983),respectively. These methods rely on the linear relationshipbetween radiances in one window channel and in one sound-ing channel and are used to estimate the cloud top. The cloudtop products are to some extent influenced by potential errorsin the used background temperature profiles from meteoro-
logical analysis as provided by the GME model. The modelis described inMajewski et al.(2002). However, for climatemonitoring purposes we believe that the current methodol-ogy is better than to rely on standard climatological pro-files which would preclude or at least complicate future trendanalysis. This concerns especially the planned historic pro-cessing efforts in the CM-SAF where the GME model anal-ysis will be replaced by well established model re-analysisin order to constrain and limit the impact from errors in theused background fields.
Besides the macrophysical cloud properties, the CM-SAFprovides cloud physical properties which are cloud phase,cloud optical thickness, and the cloud liquid water path.These properties are discussed in the following:
The AVHRR cloud phase product is based on a pure tem-perature interpretation using 11µm channel brightness tem-peratures, as suggested byRossow and Schiffer(1991). Forthe SEVIRI-based cloud phase product we compare simu-lated (precalculated and stored in look-up table) and mea-sured reflectances of the 1.6µm SEVIRI channel which issuited to distinguish water clouds from ice clouds (Jolivetand Feijt, 2003). Radiative transfer simulations are per-formed using the Doubling Adding KNMI (DAK) model(Haan et al., 1987). Once the initial cloud phase is retrieved,an additional 10.8µm cloud top temperature threshold testdetermines the final cloud phase, which maintains the initialretrieval as ice phase if the cloud-top temperature is below265K (Wolters et al., 2008).
The cloud-optical thickness is calculated following themethod described inNakajima and King(1990). Thismethod relies on the fact that the top of atmosphere re-flectance at a non-absorbing visible spectral channel ismainly a function of the optical thickness, whereas the re-flectance in a water or ice absorbing near-infrared spectralchannel is mainly a function of the cloud particle size. Aniteration algorithm is used to simultaneously retrieve cloudoptical thickness and particle size from the measurementsof both channels. Nakajima and Nakajima(1995) intro-duced such an algorithm for the 0.6µm, 3.7µm, and 10µmAVHRR channels. Roebeling et al.(2006) successfullyadapted their approach to SEVIRI measurements, but usingthe 1.6µm instead of the 3.7µm channel. The cloud liquidwater path is calculated afterStephens et al.(1978). Notethat reliance on visible and near-infrared channel data limitsthe availability of products to daytime conditions. Moreover,NOAA currently only operates the 1.6µm channel on theNOAA-17 satellite.
Daily mean cloud products are derived for pixels withat least six NOAA overpasses per day. Monthly productsare subsequently calculated from daily averages, requiring atleast twenty valid days per month. For SEVIRI-based prod-ucts from Meteosat data those restrictions are only relevantin cases with substantial data loss.
Atmos. Chem. Phys., 9, 1687–1709, 2009 www.atmos-chem-phys.net/9/1687/2009/
J. Schulz et al.: Operational climate monitoring from space: CM-SAF 1693
3.1.2 Validation
Validation of cloud coverage results derived from bothAVHRR (locally over the baseline area) and the entire ME-TEOSAT disk against ground-based synoptical observationshowed that results typically agree within one octa cloudi-ness. The satellite observations tend to overestimate thecloud coverage over sea where contrasts between clouds andthe ground are generally higher, both for the solar and thethermal spectral range. Furthermore, the SEVIRI-based re-trieval overestimates the cloudiness at large observation an-gles while the opposite effect is observed over the tropi-cal belt where observations are made in near-nadir viewingmode. Differences exceed in both cases 10%.
On the basis of case studies, CM-SAF results for SEVIRIalso were compared with results derived from Moderate Res-olution Imaging Spectrometer (MODIS) and from Cloud-Aerosol LIDAR with Orthogonal Polarization (CALIOP) ob-servations. These comparisons confirmed the results de-scribed above. Further comparisons to MODIS are now doneoperationally. Results are published every year in the CM-SAF Annual Validation Report.
The validation of the cloud type is based on tempo-rally sampled radar profiles and radiosonde measurementsat European measurement sites (Cabauw, The Netherlands;Chilbolton, UK) which were also involved in the CloudNETcampaign (Illingworth et al., 2007). From these ground-based measurements we retrieve corresponding cloud-toppressure and cloud-top temperature which are subsequentlycompared to spatially sampled satellite-based results of 3×3satellite pixels. The validation for mid-level clouds is verydifficult as only very few match-ups have been found. Cloudtype assignments are finally made for three cloud layers,i.e. low-level clouds, mid-level clouds, and high-level clouds.Best performance is found for low-level clouds which areconsistently classified for 85% of pixels, followed by thecomparably good classification of high-level clouds (80%)and fair results for mid-level clouds (50%).
Again radar and also lidar measurements are used to de-termine cloud-top parameters from ground-based measure-ments. There is however a lack of ground-based measure-ments to compare with and validation is an ongoing task.Generally, the methods (comparison of hourly results againsttemporally sampled lidar measurements and radar data) ap-plied to opaque clouds have shown that satellite estimates arereasonable, although typically overestimating the cloud-topheight, while results for semi-transparent clouds and multi-layered scenes are usually of lower quality. We found an av-erage bias of about 300 m for available measurements fromthe above-mentioned CloudNET sites.
Similarly, CloudNET data are used for the validation ofthe cloud phase product. For cloud scenes collocated andsynchronized with ground-based observations accuracies arefound better than 5% for cloud layers with optical thicknesslarger than∼5. In addition, both the ground-based observed
monthly water and ice cloud occurrence is reproduced wellby the cloud phase product, with bias errors mostly within±10% (Wolters et al., 2008).
The cloud-optical thickness is validated using ground-based pyranometer measurements of global irradiance. Adirect relation between irradiance and COT is limited tofully overcast sky and homogeneous cloudiness (Boers et al.,2000). Also, the accuracy of the cloud-optical thicknessproduct decreases at higher COT values (King, 1987) wherethe visible measurements show less sensitivity to COT val-ues. Thus, a more recent approach from (Deneke et al., 2005)is applied which basically links satellite-derived COT to theatmospheric transmission for different atmospheric condi-tions. Then, deviations of ground-based and satellite-inferredtransmission can be attributed to uncertainties in the retrievedCOT. Since the cloud liquid water path (CWP) is calculatedfrom atmospheric transmission and droplet effective radiusinformation, errors of these quantities also affect the CWPretrieval.
The CWP retrievals are consequently less reliable for op-tically thick clouds (COT>70). In addition, due to theneglected three-dimensional structure of cloud fields thedroplet effective radius and CWP of a single satellite pixelmay be largely overestimated. Recent validation activitiesof CWP based on ground based microwave radiometer mea-surements indicated an absolute accuracy better than 5 gm−2,which corresponds to relative accuracy better than 10% (Roe-beling et al., 2008).
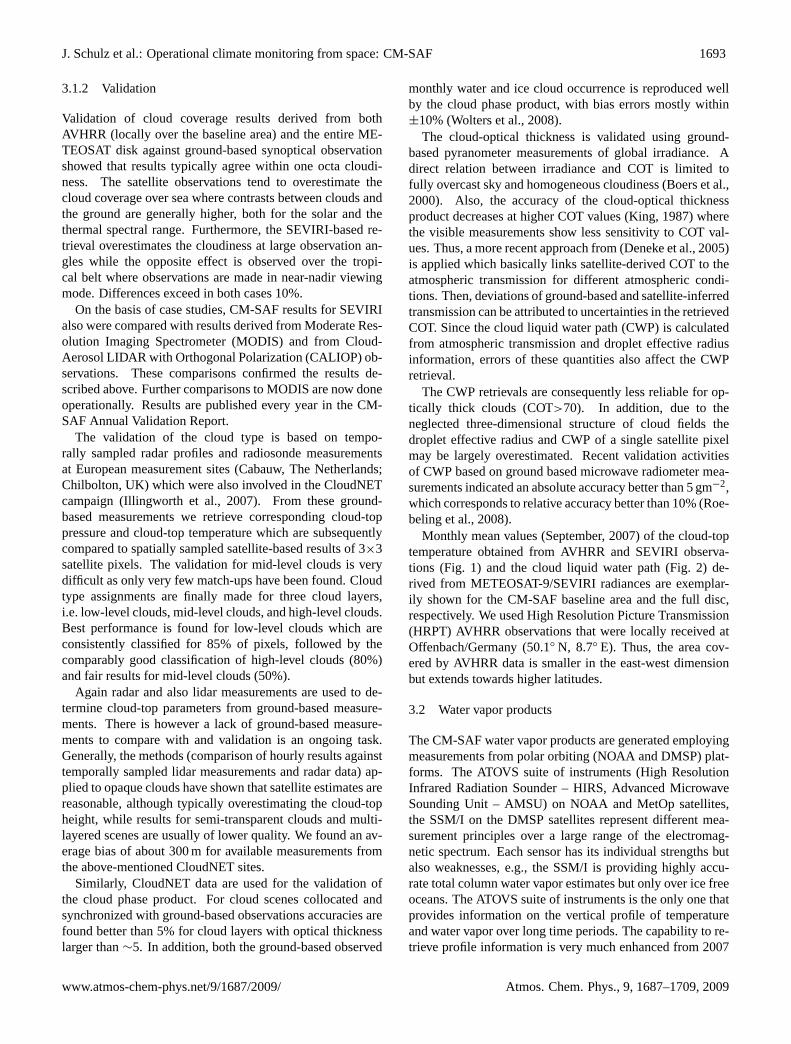
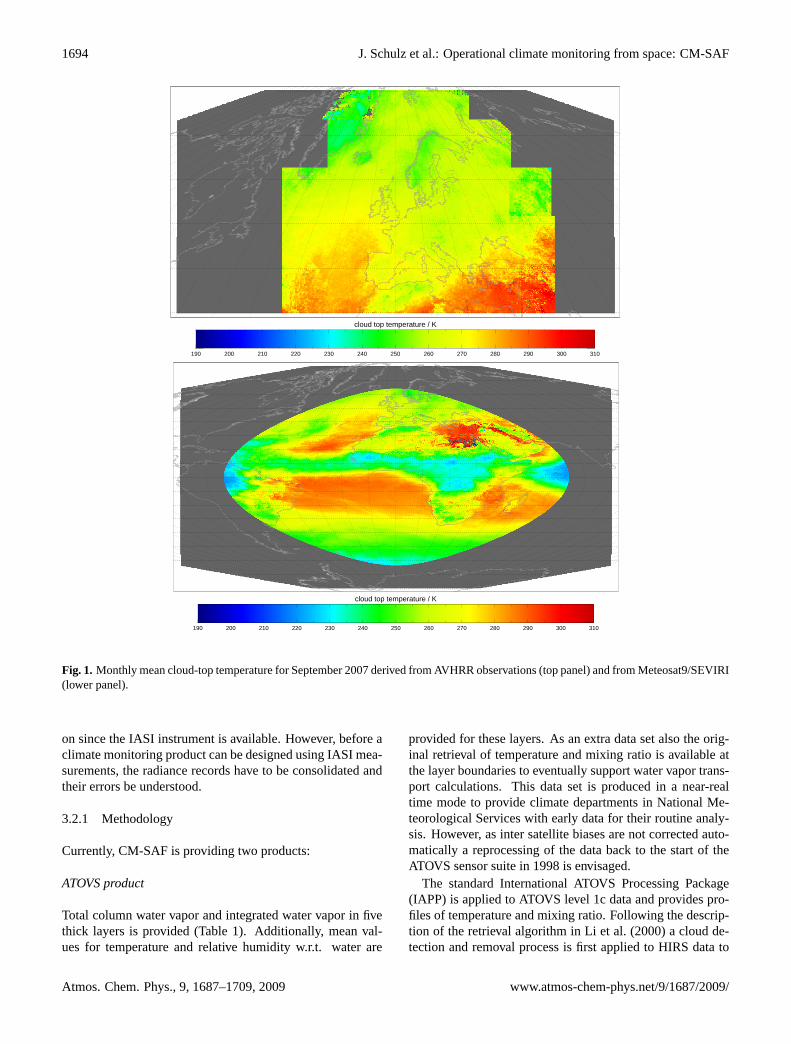
Monthly mean values (September, 2007) of the cloud-toptemperature obtained from AVHRR and SEVIRI observa-tions (Fig. 1) and the cloud liquid water path (Fig.2) de-rived from METEOSAT-9/SEVIRI radiances are exemplar-ily shown for the CM-SAF baseline area and the full disc,respectively. We used High Resolution Picture Transmission(HRPT) AVHRR observations that were locally received atOffenbach/Germany (50.1◦ N, 8.7◦ E). Thus, the area cov-ered by AVHRR data is smaller in the east-west dimensionbut extends towards higher latitudes.
3.2 Water vapor products
The CM-SAF water vapor products are generated employingmeasurements from polar orbiting (NOAA and DMSP) plat-forms. The ATOVS suite of instruments (High ResolutionInfrared Radiation Sounder – HIRS, Advanced MicrowaveSounding Unit – AMSU) on NOAA and MetOp satellites,the SSM/I on the DMSP satellites represent different mea-surement principles over a large range of the electromag-netic spectrum. Each sensor has its individual strengths butalso weaknesses, e.g., the SSM/I is providing highly accu-rate total column water vapor estimates but only over ice freeoceans. The ATOVS suite of instruments is the only one thatprovides information on the vertical profile of temperatureand water vapor over long time periods. The capability to re-trieve profile information is very much enhanced from 2007
www.atmos-chem-phys.net/9/1687/2009/ Atmos. Chem. Phys., 9, 1687–1709, 2009
1694 J. Schulz et al.: Operational climate monitoring from space: CM-SAF
cloud top temperature / K
190 200 210 220 230 240 250 260 270 280 290 300 310
cloud top temperature / K
190 200 210 220 230 240 250 260 270 280 290 300 310
Fig. 1. Monthly mean cloud-top temperature for September 2007 derived from AVHRR observations (top panel) and from Meteosat9/SEVIRI(lower panel).
on since the IASI instrument is available. However, before aclimate monitoring product can be designed using IASI mea-surements, the radiance records have to be consolidated andtheir errors be understood.
3.2.1 Methodology
Currently, CM-SAF is providing two products:
ATOVS product
Total column water vapor and integrated water vapor in fivethick layers is provided (Table1). Additionally, mean val-ues for temperature and relative humidity w.r.t. water are
provided for these layers. As an extra data set also the orig-inal retrieval of temperature and mixing ratio is available atthe layer boundaries to eventually support water vapor trans-port calculations. This data set is produced in a near-realtime mode to provide climate departments in National Me-teorological Services with early data for their routine analy-sis. However, as inter satellite biases are not corrected auto-matically a reprocessing of the data back to the start of theATOVS sensor suite in 1998 is envisaged.
The standard International ATOVS Processing Package(IAPP) is applied to ATOVS level 1c data and provides pro-files of temperature and mixing ratio. Following the descrip-tion of the retrieval algorithm inLi et al. (2000) a cloud de-tection and removal process is first applied to HIRS data to
Atmos. Chem. Phys., 9, 1687–1709, 2009 www.atmos-chem-phys.net/9/1687/2009/
J. Schulz et al.: Operational climate monitoring from space: CM-SAF 1695
cloud water path / kg/m2
0.00 0.04 0.08 0.12 0.16 0.20
Fig. 2. Monthly mean cloud liquid water path for September 2007 derived from Meteosat-9/SEVIRI observations.
assure that only cloud-free HIRS pixels are used. A non-linear iterative physical retrieval is used to derive the atmo-spheric profiles.
The needed first guess for such a retrieval can be providedby a statistical regression retrieval or a Numerical WeatherPrediction (NWP) model first guess field. To keep consis-tency with the CM-SAF cloud and radiation flux products,NWP data from the German global model (GME) as de-scribed inMajewski et al.(2002) are used as first guess. Thisis favorable compared to the results of the regression retrievalas those contain a lot of artifacts over arid and semi-arid ter-rain and in mountainous regions. In order to assess the sen-sitivity of temperature and mixing ratio profiles to the firstguess we compared the initial guess from GME with the cor-responding instantaneously retrieved profiles from ATOVSobservations. For this comparison we considered the meanabsolute and the mean absolute relative difference for tem-perature and mixing ratio profiles, respectively. The normal-isation is carried out with respect to the arithmetic mean ofinitial guess and instantaneous profile. The retrieval schemechanges the temperature profile from the initial guess on av-erage by 0.6 K near the surface and by 1.1 K at 200 hPa.Standard deviations are 1.5 K near the surface and 2 K near200 hPa. The maximum mixing ratio change occurs also at200 hPa (35%) and exhibits a near surface value of 12%. Thestandard deviation for mixing ratio is relatively large and ap-proximately of the same order as the mean absolute relativedifference. The maximum change in the tropopause region isnoteworthy due to its large relevance for climate in view ofthe radiative effect of water vapor at such levels.
The initialization with the GME model results has largestimpact in the lower- to mid-troposphere (900–700 hPa) as the
profiles are not changed very much from the model fields.The consequences for a CDR class I data set are small as theresulting satellite product will only have major changes whenthe NWP model changes apruptly its description of the watervapor field which is not very likely. For further developmentinto a CDR class II data set a NWP re-analysis has to be usedto avoid spurious effects on longer term variability caused bymodel changes.
The main satellite data source for the retrieval process de-pends on the cloudiness of a scene and the underlying sur-face. Retrievals over oceans rely on all sensors whereas re-trievals over land surfaces are mainly based on cloud-freeHIRS measurements.
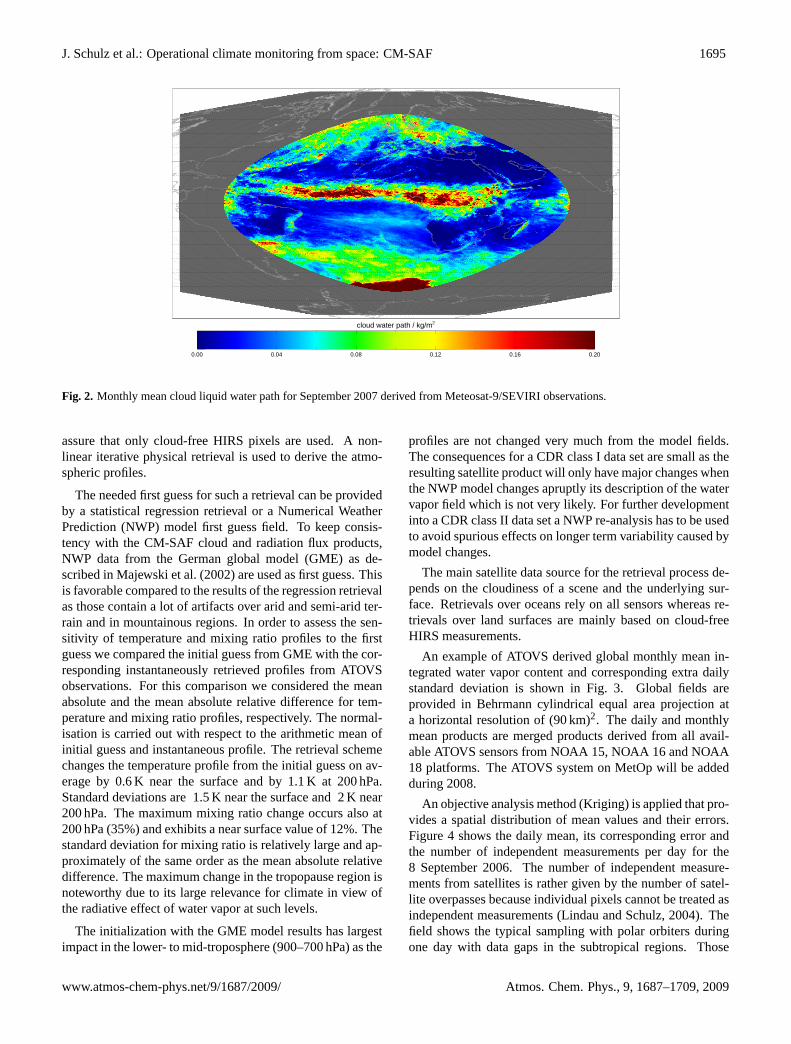
An example of ATOVS derived global monthly mean in-tegrated water vapor content and corresponding extra dailystandard deviation is shown in Fig.3. Global fields areprovided in Behrmann cylindrical equal area projection ata horizontal resolution of (90 km)2. The daily and monthlymean products are merged products derived from all avail-able ATOVS sensors from NOAA 15, NOAA 16 and NOAA18 platforms. The ATOVS system on MetOp will be addedduring 2008.
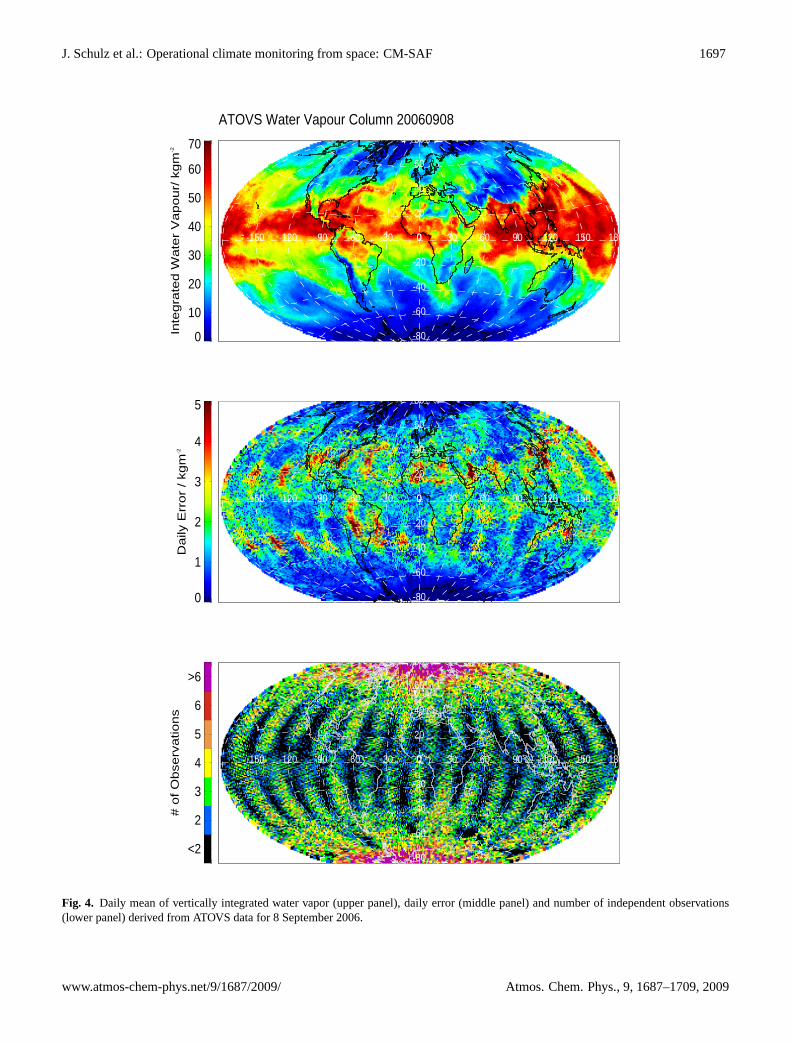
An objective analysis method (Kriging) is applied that pro-vides a spatial distribution of mean values and their errors.Figure4 shows the daily mean, its corresponding error andthe number of independent measurements per day for the8 September 2006. The number of independent measure-ments from satellites is rather given by the number of satel-lite overpasses because individual pixels cannot be treated asindependent measurements (Lindau and Schulz, 2004). Thefield shows the typical sampling with polar orbiters duringone day with data gaps in the subtropical regions. Those
www.atmos-chem-phys.net/9/1687/2009/ Atmos. Chem. Phys., 9, 1687–1709, 2009
1696 J. Schulz et al.: Operational climate monitoring from space: CM-SAF
0
10
20
30
40
50
60
70
Inte
gra
ted W
ate
r V
apour/
kgm
-2
ATOVS Water Vapour Column 200609
-150 -120 -90 -60 -30 0 30 60 90 120 150 180
-80
-60
-40
-20
0
20
40
60
80
0
4
8
12
16
20
Extr
a D
aily
Sta
ndard
Devia
tion / k
gm
-2
-150 -120 -90 -60 -30 0 30 60 90 120 150 180
-80
-60
-40
-20
0
20
40
60
80
020
40
60
80
100
120
140
160
180200
# o
f O
bserv
ations
-150 -120 -90 -60 -30 0 30 60 90 120 150 180
-80
-60
-40
-20
0
20
40
60
80
Fig. 3. Monthly mean vertically integrated water vapor (upper panel), corresponding extra daily standard deviation (middle panel) andnumber of independent observations (lower panel) derived from ATOVS data for September 2006.
Atmos. Chem. Phys., 9, 1687–1709, 2009 www.atmos-chem-phys.net/9/1687/2009/
J. Schulz et al.: Operational climate monitoring from space: CM-SAF 1697
0
10
20
30
40
50
60
70
Inte
gra
ted W
ate
r V
apour/
kgm
-2
ATOVS Water Vapour Column 20060908
-150 -120 -90 -60 -30 0 30 60 90 120 150 180
-80
-60
-40
-20
0
20
40
60
80
0
1
2
3
4
5
Daily
Err
or
/ kgm
-2
-150 -120 -90 -60 -30 0 30 60 90 120 150 180
-80
-60
-40
-20
0
20
40
60
80
<2
2
3
4
5
6
>6
# o
f O
bserv
ations
-150 -120 -90 -60 -30 0 30 60 90 120 150 180
-80
-60
-40
-20
0
20
40
60
80
Fig. 4. Daily mean of vertically integrated water vapor (upper panel), daily error (middle panel) and number of independent observations(lower panel) derived from ATOVS data for 8 September 2006.
www.atmos-chem-phys.net/9/1687/2009/ Atmos. Chem. Phys., 9, 1687–1709, 2009
1698 J. Schulz et al.: Operational climate monitoring from space: CM-SAF
0 20 40 60 80TPW Radiosonde / mm
0
20
40
60
80T
PW
AT
OV
S /
mm
xm = 16.3 mm
bias = 0.5 mm
RMS = 3.6 mm
r = 0.97
N = 643
0 5 10 15 20 25 30TPW radiosonde (latitude>|±60°|) / mm
0
5
10
15
20
25
30
TP
W A
TO
VS
(la
titud
e>|±
60°|
) / m
m
xm = 9.2 mm
bias = 0.6 mm
RMS = 2.0 mm
r = 0.90
N = 161
0 20 40 60 80TPW radiosonde (ocean) / mm
0
20
40
60
80
TP
W A
TO
VS
(oc
ean)
/ m
m
xm = 16.4 mm
bias = 0.5 mm
RMS = 3.6 mm
r = 0.97
N = 405
0 20 40 60 80TPW radiosonde (land) / mm
0
20
40
60
80
TP
W A
TO
VS
(la
nd)
/ mm
xm = 16.2 mm
bias = 0.4 mm
RMS = 3.8 mm
r = 0.96
N = 238
Fig. 5. Global comparison of daily averages of vertically integrated water vapor for October 2004: all data (top left), data north and south of60◦ latitude (top right), data over ocean (bottom left) and data over land (bottom right).
gaps are effectively interpolated in the daily mean field. Thecorresponding error field for this day represents larger errorswhere no measurements are available and where the intra-daily variability is not well represented with 4–6 satelliteoverpasses per day as over the Gulf Stream region east ofthe USA. Large errors appear also in places where it is ex-pected that the retrieval is hindered by difficult surfaces asover the Sahara where knowledge of emissivity and the diur-nal cycle of the surface temperature limit the quality of theretrieval. As the method is also capable of handling retrievalerrors and error covariances an improved error budget cal-culation is under development and will further enhance thequality of the error map.
SSM/I product
A total column water vapor estimate over ice free oceansis derived from measurements of the SSM/I employing theretrieval bySchlussel and Emery(1990). The above men-tioned Kriging method is also used to combine the SSM/Imeasurements in an optimal way. The record covers theperiod 1987–2005 and is updated in yearly intervals. This
data set can be regarded as a climate data set suitable forlong term variability studies as all SSM/I radiometers havebeen intercalibrated using a statistical method described inAndersson et al.(2009).
3.2.2 Validation
ATOVS product
An initial validation of ATOVS results was performed forthe period January 2004 to December 2005 employing ra-diosonde data recorded at 173 Global Climate Observ-ing System Upper-Air Network (GUAN) stations. The ra-diosonde data are used to validate the ATOVS daily averageson the (90 km)2 grid. For this purpose the radiosonde data areallocated to the grid boxes and averaged over the day if morethan one radiosonde ascent is available in a grid box. Notethat a comparison to radiosonde data is more or less equiva-lent to a comparison of the products performance over landsurfaces. Over ocean better results are expected because alsothe microwave instruments contribute to the product whereasover land it is mainly a HIRS product supported by the first
Atmos. Chem. Phys., 9, 1687–1709, 2009 www.atmos-chem-phys.net/9/1687/2009/
J. Schulz et al.: Operational climate monitoring from space: CM-SAF 1699
guess of the retrieval. Additionally, the comparison is alsoslightly biased to the Northern Hemisphere as 56% of theGUAN stations are located there. On the Southern Hemi-sphere about 10% of the stations are located near the coastof Antarctica which is a very difficult environment for thesatellite product.
As a quality measure for the comparison points we pre-scribed to have at least two radiosonde observations per dayin an ATOVS product grid box because we compare dailymean values. This requirement reduces the total number ofcomparisons approximately by a factor of two compared tothe existing radiosonde data.
The quality of radiosonde observations considerablyvaries among the different stations. Different calibration pro-cedures and various ages of radiosondes can influence thequality of the measurements. The latter issue can have a largeeffect on the bias ranging from−4 to −10% of relative hu-midity observations as shown byMiloshevich et al.(2004).In presence of ice saturation the bias largely increases. Itis unclear which stations apply the proposed correction al-gorithm of (Miloshevich et al., 2004) in their routine obser-vations as this is not part of the available radiosonde metadata. Smaller errors in radiosondes may be expected fromthe newly established GCOS Reference Upper-Air Network(GRUAN). GRUAN is required to measure temperature andhumidity profiles with an accuracy of 0.1–0.2 K and 2%, re-spectivelyGCOS(2007). It is expected that radiosonde ob-servations distributed over the GTS does not have this qual-ity.
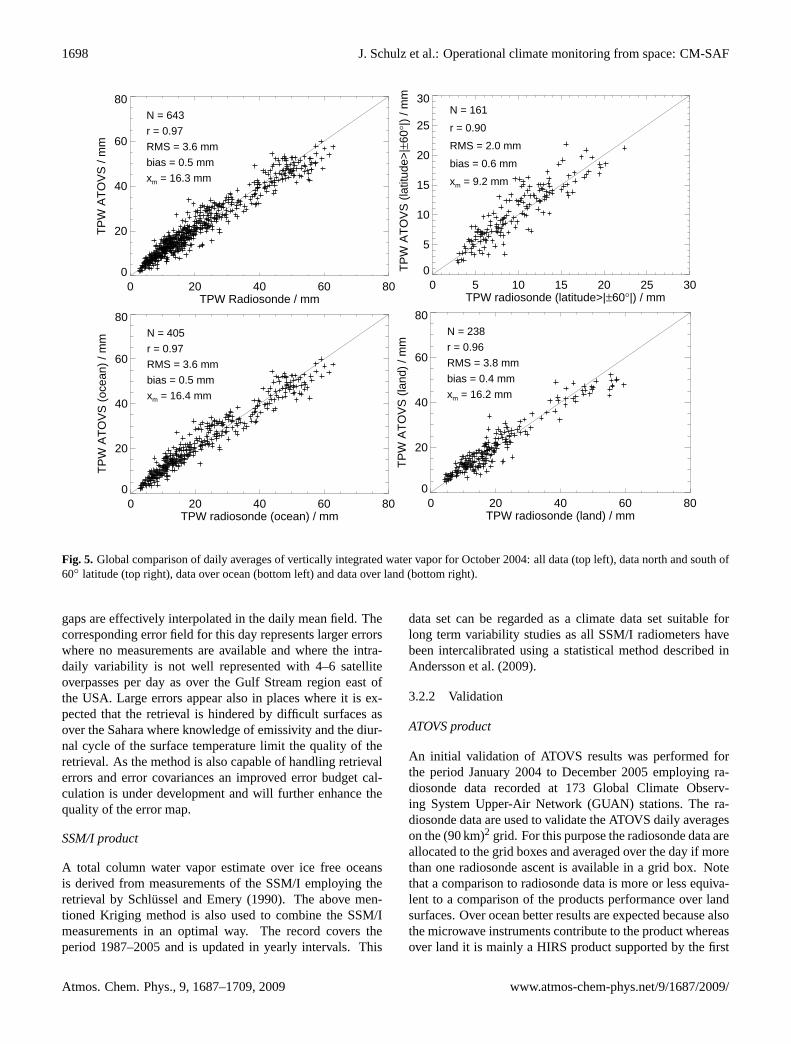
As an example Fig.5 shows four scatter plots for October2004 indicating a very high Pearson product-moment corre-lation (0.94) between radiosondes and retrievals. The prod-ucts exhibit a small bias and RMS of 0.5 mm and 3.6 mm,respectively. In addition, scatter plots are shown separatelyfor land and ocean stations as well as for stations in polar re-gions, i.e.,lat>| ± 60◦
|. Ocean stations are stations within50 km off the coast. No significant decrease or increase inquality between all, land and ocean stations becomes evident.Even in the problematic polar regions the ATOVS productsexhibit high quality.
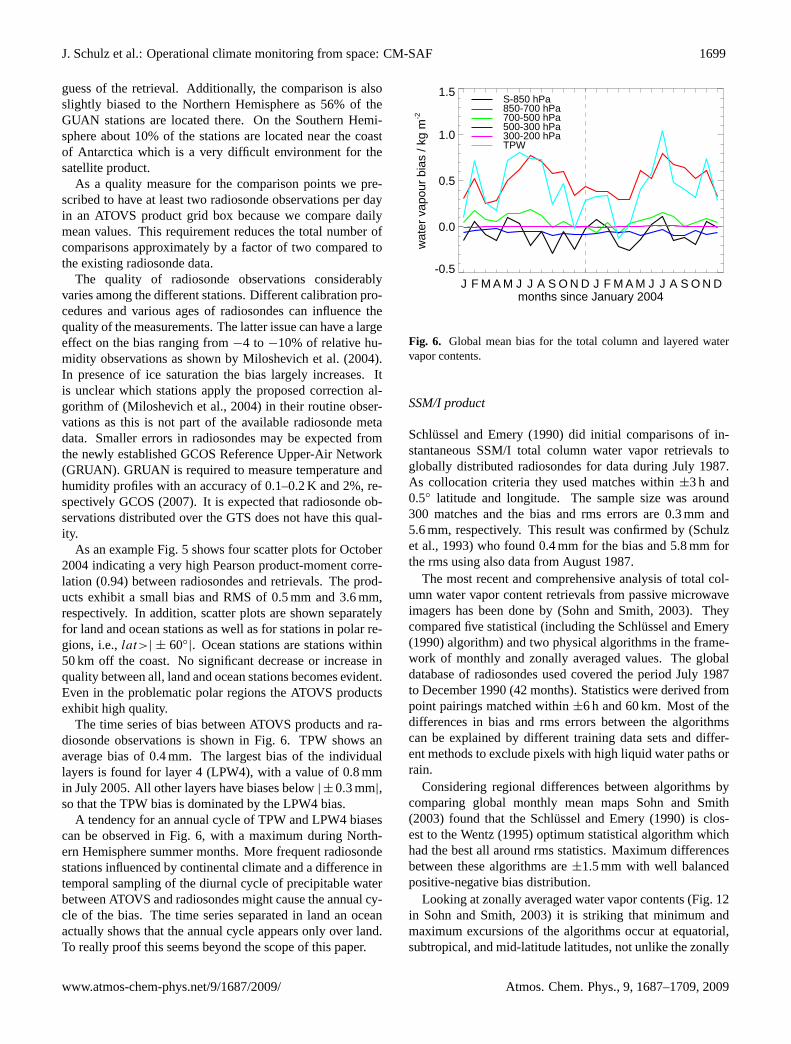
The time series of bias between ATOVS products and ra-diosonde observations is shown in Fig.6. TPW shows anaverage bias of 0.4 mm. The largest bias of the individuallayers is found for layer 4 (LPW4), with a value of 0.8 mmin July 2005. All other layers have biases below|±0.3 mm|,so that the TPW bias is dominated by the LPW4 bias.
A tendency for an annual cycle of TPW and LPW4 biasescan be observed in Fig.6, with a maximum during North-ern Hemisphere summer months. More frequent radiosondestations influenced by continental climate and a difference intemporal sampling of the diurnal cycle of precipitable waterbetween ATOVS and radiosondes might cause the annual cy-cle of the bias. The time series separated in land an oceanactually shows that the annual cycle appears only over land.To really proof this seems beyond the scope of this paper.
J F M A M J J A S O N D J F M A M J J A S O N Dmonths since January 2004
-0.5
0.0
0.5
1.0
1.5
wat
er v
apou
r bi
as /
kg m
-2
S-850 hPa850-700 hPa700-500 hPa500-300 hPa300-200 hPaTPW
Fig. 6. Global mean bias for the total column and layered watervapor contents.
SSM/I product
Schlussel and Emery(1990) did initial comparisons of in-stantaneous SSM/I total column water vapor retrievals toglobally distributed radiosondes for data during July 1987.As collocation criteria they used matches within±3 h and0.5◦ latitude and longitude. The sample size was around300 matches and the bias and rms errors are 0.3 mm and5.6 mm, respectively. This result was confirmed by (Schulzet al., 1993) who found 0.4 mm for the bias and 5.8 mm forthe rms using also data from August 1987.
The most recent and comprehensive analysis of total col-umn water vapor content retrievals from passive microwaveimagers has been done by (Sohn and Smith, 2003). Theycompared five statistical (including theSchlussel and Emery(1990) algorithm) and two physical algorithms in the frame-work of monthly and zonally averaged values. The globaldatabase of radiosondes used covered the period July 1987to December 1990 (42 months). Statistics were derived frompoint pairings matched within±6 h and 60 km. Most of thedifferences in bias and rms errors between the algorithmscan be explained by different training data sets and differ-ent methods to exclude pixels with high liquid water paths orrain.
Considering regional differences between algorithms bycomparing global monthly mean mapsSohn and Smith(2003) found that theSchlussel and Emery(1990) is clos-est to theWentz(1995) optimum statistical algorithm whichhad the best all around rms statistics. Maximum differencesbetween these algorithms are±1.5 mm with well balancedpositive-negative bias distribution.
Looking at zonally averaged water vapor contents (Fig. 12in Sohn and Smith, 2003) it is striking that minimum andmaximum excursions of the algorithms occur at equatorial,subtropical, and mid-latitude latitudes, not unlike the zonally
www.atmos-chem-phys.net/9/1687/2009/ Atmos. Chem. Phys., 9, 1687–1709, 2009
1700 J. Schulz et al.: Operational climate monitoring from space: CM-SAF
averaged profiles of cloudiness and precipitation.Sohnand Smith(2003) used the original brightness temperaturethresholds of the published algorithms to exclude precipitat-ing pixels from the record. In the current software versionused with CM-SAF this is not used. Instead precipitation andcloud liquid water path retrieved from SSM/I data are usedto sort out pixels. From this one may expect that minimumand maximum excursion are smaller with the new version.
The evaluation of the SSM/I retrieval schemes inSohn andSmith(2003) has shown that the current CM-SAF scheme isfully competitive compared to other existing retrievals. Thepresented comparison results from Sohn and Smith (2003)are based on SSM/I data from the DMSP F8 and F10 plat-forms that need substantial corrections because of a non-functioning 85 GHz channel on F8 and large height andtherefore zenith angle variations of the F10 satellite. It isnot described if those features are corrected in the data usedin the Sohn and Smith study. Thus, the there found bias er-rors can be caused by a missing correction for those effects.However, the comparison statistics also show that the SSM/Iis clearly the best suitable instrument for climate monitoringof vertically integrated water vapor over oceans.
3.3 Top of atmosphere radiation fluxes
Top of the atmosphere radiation fluxes can principally beused for the evaluation of the radiative budget of climatemodels and reanalysis. The temporal resolution of the geo-stationary satellite data (15 min) matches reasonably wellwith the time step of current global models and processes likeconvection and surface heating may be studied on a modeltime step basis. The radiative fluxes at the top of the atmo-sphere depend mainly on the presence of clouds, while cloudinformation is not directly assimilated into atmospheric mod-els. The comparison of the radiative fluxes as calculated bythe model and as measured from satellites provides a qual-ity control of the model cloud parameterizations and/or themodel cloud radiative properties, see e.g.,Allan et al.(2007).
Throughout this chapter reflected solar radiation withwavelengths roughly below 4µm, will be referred to asshortwave broadband radiation. Emitted thermal radiationwith wavelengths roughly above 4µm, will be referred to aslongwave broadband radiation. The term narrowband radia-tion will be used to refer to the measurement by individualchannels of a multi-spectral imager.
Products as clear sky flux or cloud radiative forcing thatare derived products based on the existing basic products ofthe radiative fluxes at the top of the atmosphere and of thecloud properties are planned for inclusion in the CM-SAFproduct suite until 2012.
3.3.1 Retrieval
The individual single satellite products from GERB andCERES on-board the AQUA and TERRA satellites are de-
rived from the basic radiance measurements of the instru-ments. The CM-SAF top of atmosphere radiative flux prod-ucts are merged from the individual satellite products ofGERB and CERES (seeHarries et al., 2005for details). Inthat sense these products are level 3 products. The incomingsolar radiative flux is determined from the Differential Ab-solute Radiometer DIARAD on-board the SOlar and Helio-spheric Observatory (SOHO) satellite (Dewitte et al., 2004).
CM-SAF top of atmosphere radiative fluxes are availablewith high temporal and spatial resolution covering the fullMeteosat disc and polar latitudes. On the Meteosat discGERB measurements are used to benefit from its high tem-poral resolution. CERES measurements are exclusively usedover polar regions with improved temporal sampling whereGERB measurements are not available. GERB results arecompared with CERES data in the solar spectral range toverify if measurements suffer from systematic Angular De-pendency Model (ADM) errors. While empirical ADMs arederived from the CERES instrument on the Tropical Rain-fall Measurement Mission (TRMM) satellite using the Visi-ble and InfraRed Scanner (VIRS) imager for scene identifi-cation (Loeb et al., 2003), the longwave model stems fromtheoretical considerations based on radiative transfer calcu-lations (Clerbaux et al., 2003).
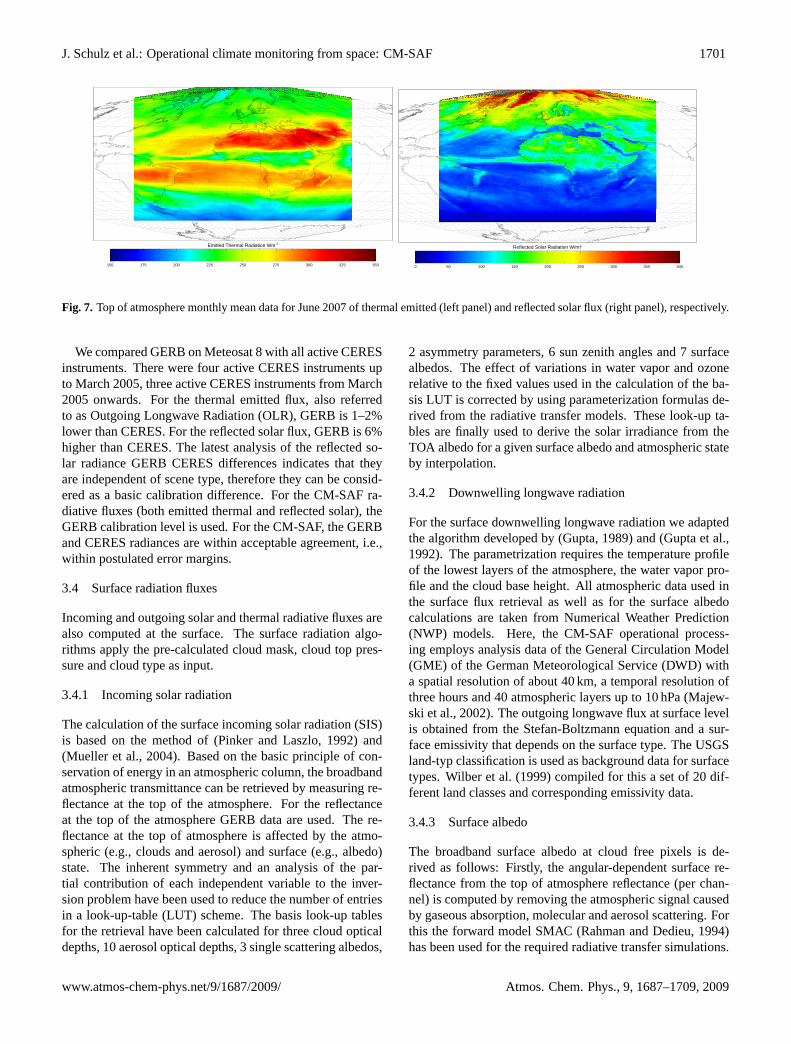
Example products are shown in Fig.7 where the monthlymean top of atmosphere thermal emitted flux and the solarreflected flux are given for June 2007. The high values ofthe reflected solar radiation and the low values of the emit-ted thermal radiation around the equator are due to the abun-dance of deep convective clouds in the tropical convergencezone associated with the rising branch of the Hadley circu-lation. Since in the tropical convergence zone the reflectedsolar radiation is dominated by the presence of clouds, thereis little land-ocean contrast. To the contrary, for the regionaround the Sahara and Saudi Arabia, clear sky conditions oc-cur frequently due to the large scale subsidence associatedwith the descending branch of the Hadley circulation. There-fore in the subsidence region, the reflected solar radiation isdetermined by the surface albedo, and there is a high land-ocean contrast due to the high albedo of the desert, and thelow albedo of the ocean.
3.3.2 Validation
The accuracy of the incoming solar flux product is dominatedby the accuracy of the total solar irradiance which is also re-ferred to as Solar Constant. Recent studies have shown thatthe accuracy of the latter is about 1 W/m2 (Crommelyncket al., 1995), (Dewitte et al., 2001), thus being also the ac-curacy of the incoming solar flux product. Validation of thethermal emitted flux and the reflected solar flux was carriedout over different surface types. It is based on a comparisonof results against Meteosat-7 retrieval results and an inter-comparison of GERB and CERES radiance data.
Atmos. Chem. Phys., 9, 1687–1709, 2009 www.atmos-chem-phys.net/9/1687/2009/
J. Schulz et al.: Operational climate monitoring from space: CM-SAF 1701
Emitted Thermal Radiation Wm-2
150 175 200 225 250 275 300 325 350
Reflected Solar Radiation W/m†
0 50 100 150 200 250 300 350 400
Fig. 7. Top of atmosphere monthly mean data for June 2007 of thermal emitted (left panel) and reflected solar flux (right panel), respectively.
We compared GERB on Meteosat 8 with all active CERESinstruments. There were four active CERES instruments upto March 2005, three active CERES instruments from March2005 onwards. For the thermal emitted flux, also referredto as Outgoing Longwave Radiation (OLR), GERB is 1–2%lower than CERES. For the reflected solar flux, GERB is 6%higher than CERES. The latest analysis of the reflected so-lar radiance GERB CERES differences indicates that theyare independent of scene type, therefore they can be consid-ered as a basic calibration difference. For the CM-SAF ra-diative fluxes (both emitted thermal and reflected solar), theGERB calibration level is used. For the CM-SAF, the GERBand CERES radiances are within acceptable agreement, i.e.,within postulated error margins.
3.4 Surface radiation fluxes
Incoming and outgoing solar and thermal radiative fluxes arealso computed at the surface. The surface radiation algo-rithms apply the pre-calculated cloud mask, cloud top pres-sure and cloud type as input.
3.4.1 Incoming solar radiation
The calculation of the surface incoming solar radiation (SIS)is based on the method of (Pinker and Laszlo, 1992) and(Mueller et al., 2004). Based on the basic principle of con-servation of energy in an atmospheric column, the broadbandatmospheric transmittance can be retrieved by measuring re-flectance at the top of the atmosphere. For the reflectanceat the top of the atmosphere GERB data are used. The re-flectance at the top of atmosphere is affected by the atmo-spheric (e.g., clouds and aerosol) and surface (e.g., albedo)state. The inherent symmetry and an analysis of the par-tial contribution of each independent variable to the inver-sion problem have been used to reduce the number of entriesin a look-up-table (LUT) scheme. The basis look-up tablesfor the retrieval have been calculated for three cloud opticaldepths, 10 aerosol optical depths, 3 single scattering albedos,
2 asymmetry parameters, 6 sun zenith angles and 7 surfacealbedos. The effect of variations in water vapor and ozonerelative to the fixed values used in the calculation of the ba-sis LUT is corrected by using parameterization formulas de-rived from the radiative transfer models. These look-up ta-bles are finally used to derive the solar irradiance from theTOA albedo for a given surface albedo and atmospheric stateby interpolation.
3.4.2 Downwelling longwave radiation
For the surface downwelling longwave radiation we adaptedthe algorithm developed by (Gupta, 1989) and (Gupta et al.,1992). The parametrization requires the temperature profileof the lowest layers of the atmosphere, the water vapor pro-file and the cloud base height. All atmospheric data used inthe surface flux retrieval as well as for the surface albedocalculations are taken from Numerical Weather Prediction(NWP) models. Here, the CM-SAF operational process-ing employs analysis data of the General Circulation Model(GME) of the German Meteorological Service (DWD) witha spatial resolution of about 40 km, a temporal resolution ofthree hours and 40 atmospheric layers up to 10 hPa (Majew-ski et al., 2002). The outgoing longwave flux at surface levelis obtained from the Stefan-Boltzmann equation and a sur-face emissivity that depends on the surface type. The USGSland-typ classification is used as background data for surfacetypes.Wilber et al.(1999) compiled for this a set of 20 dif-ferent land classes and corresponding emissivity data.
3.4.3 Surface albedo
The broadband surface albedo at cloud free pixels is de-rived as follows: Firstly, the angular-dependent surface re-flectance from the top of atmosphere reflectance (per chan-nel) is computed by removing the atmospheric signal causedby gaseous absorption, molecular and aerosol scattering. Forthis the forward model SMAC (Rahman and Dedieu, 1994)has been used for the required radiative transfer simulations.
www.atmos-chem-phys.net/9/1687/2009/ Atmos. Chem. Phys., 9, 1687–1709, 2009
1702 J. Schulz et al.: Operational climate monitoring from space: CM-SAF
Fig. 8. Incoming solar radiation at surface level at NCEP (left panel) and CM-SAF (right panel) spatial resolution, respectively. Data fromMeteosat-8/SEVIRI of 31st August 2006, 10:45 UTC.
Viewing and illumination conditions are corrected employ-ing bidirectional reflectance distribution functions for differ-ent surface types. There are six different surface types usedin the algorithm, namely barren, forest, cropland, grassland,snow/ice, and ocean. The source for the data is a combinedUSGS/Corine 2000 land use classification dataset. The sur-face albedo is then calculated from surface reflectance data assuggested byRoujean et al.(1992). The broadband surfacealbedo is estimated from a narrow- to broadband conversion(Liang, 2000). The instantaneous surface albedo is finallycomputed by normalization to a solar zenith angle of 60◦.
3.4.4 Averaging procedure
Climatological studies require daily averages of the radiationfluxes. For the polar orbiter products the daily averages of thelongwave flux are derived by linearly averaging all available,but at least three NOAA overpasses during the day. The dailymean value of SIS is derived following the method presentedin Diekmann et al.(1988) which takes into account the di-urnal variation of the solar incoming clear-sky flux. Again,three overpasses per day must be at least available. Monthlyaverages require again at least twenty daily mean products.A daily mean is not feasible for surface albedo as usually theclear sky area is rather small compared to the cloudy area. In-stead a weekly and monthly mean albedo is calculated fromthe instantaneous estimates.
3.4.5 Product examples
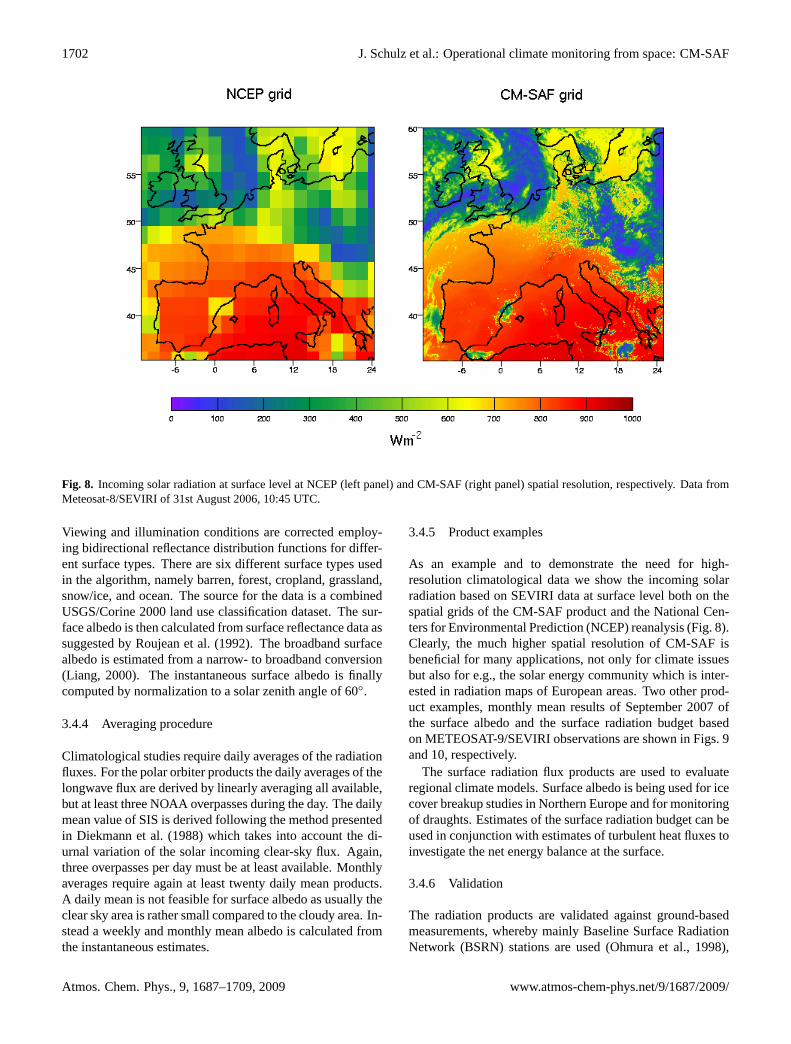
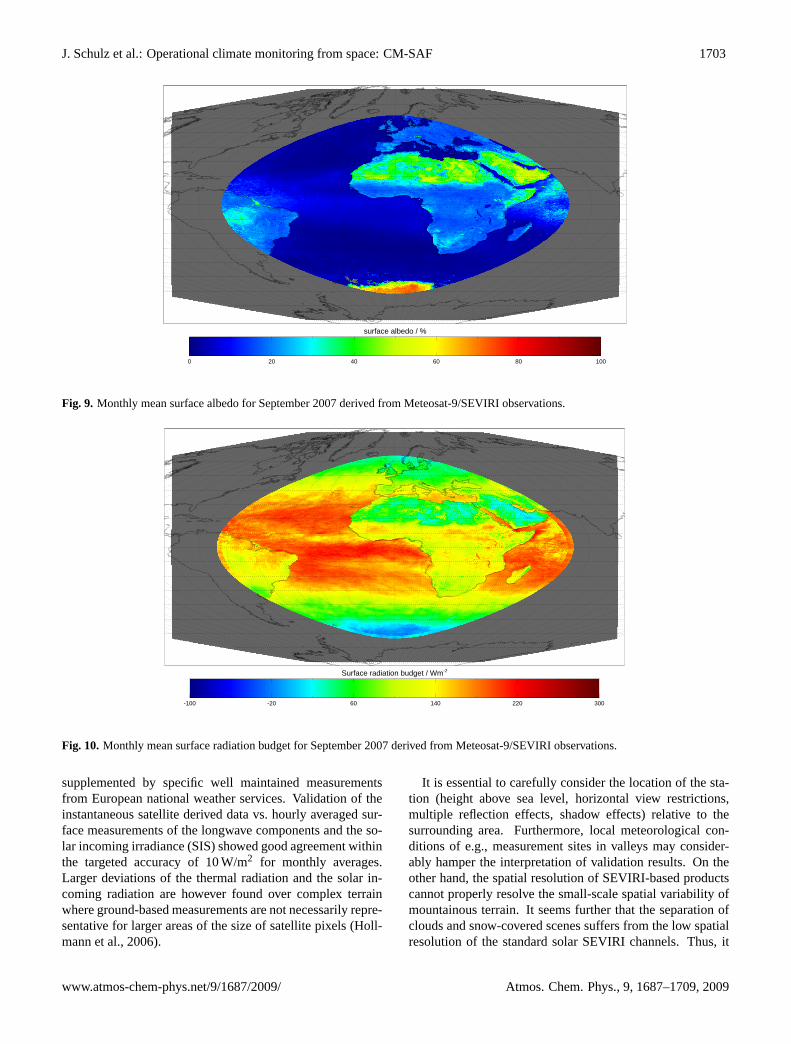
As an example and to demonstrate the need for high-resolution climatological data we show the incoming solarradiation based on SEVIRI data at surface level both on thespatial grids of the CM-SAF product and the National Cen-ters for Environmental Prediction (NCEP) reanalysis (Fig.8).Clearly, the much higher spatial resolution of CM-SAF isbeneficial for many applications, not only for climate issuesbut also for e.g., the solar energy community which is inter-ested in radiation maps of European areas. Two other prod-uct examples, monthly mean results of September 2007 ofthe surface albedo and the surface radiation budget basedon METEOSAT-9/SEVIRI observations are shown in Figs.9and10, respectively.
The surface radiation flux products are used to evaluateregional climate models. Surface albedo is being used for icecover breakup studies in Northern Europe and for monitoringof draughts. Estimates of the surface radiation budget can beused in conjunction with estimates of turbulent heat fluxes toinvestigate the net energy balance at the surface.
3.4.6 Validation
The radiation products are validated against ground-basedmeasurements, whereby mainly Baseline Surface RadiationNetwork (BSRN) stations are used (Ohmura et al., 1998),
Atmos. Chem. Phys., 9, 1687–1709, 2009 www.atmos-chem-phys.net/9/1687/2009/
J. Schulz et al.: Operational climate monitoring from space: CM-SAF 1703
surface albedo / %
0 20 40 60 80 100
Fig. 9. Monthly mean surface albedo for September 2007 derived from Meteosat-9/SEVIRI observations.
Surface radiation budget / Wm-2
-100 -20 60 140 220 300
Fig. 10. Monthly mean surface radiation budget for September 2007 derived from Meteosat-9/SEVIRI observations.
supplemented by specific well maintained measurementsfrom European national weather services. Validation of theinstantaneous satellite derived data vs. hourly averaged sur-face measurements of the longwave components and the so-lar incoming irradiance (SIS) showed good agreement withinthe targeted accuracy of 10 W/m2 for monthly averages.Larger deviations of the thermal radiation and the solar in-coming radiation are however found over complex terrainwhere ground-based measurements are not necessarily repre-sentative for larger areas of the size of satellite pixels (Holl-mann et al., 2006).
It is essential to carefully consider the location of the sta-tion (height above sea level, horizontal view restrictions,multiple reflection effects, shadow effects) relative to thesurrounding area. Furthermore, local meteorological con-ditions of e.g., measurement sites in valleys may consider-ably hamper the interpretation of validation results. On theother hand, the spatial resolution of SEVIRI-based productscannot properly resolve the small-scale spatial variability ofmountainous terrain. It seems further that the separation ofclouds and snow-covered scenes suffers from the low spatialresolution of the standard solar SEVIRI channels. Thus, it
www.atmos-chem-phys.net/9/1687/2009/ Atmos. Chem. Phys., 9, 1687–1709, 2009
1704 J. Schulz et al.: Operational climate monitoring from space: CM-SAF
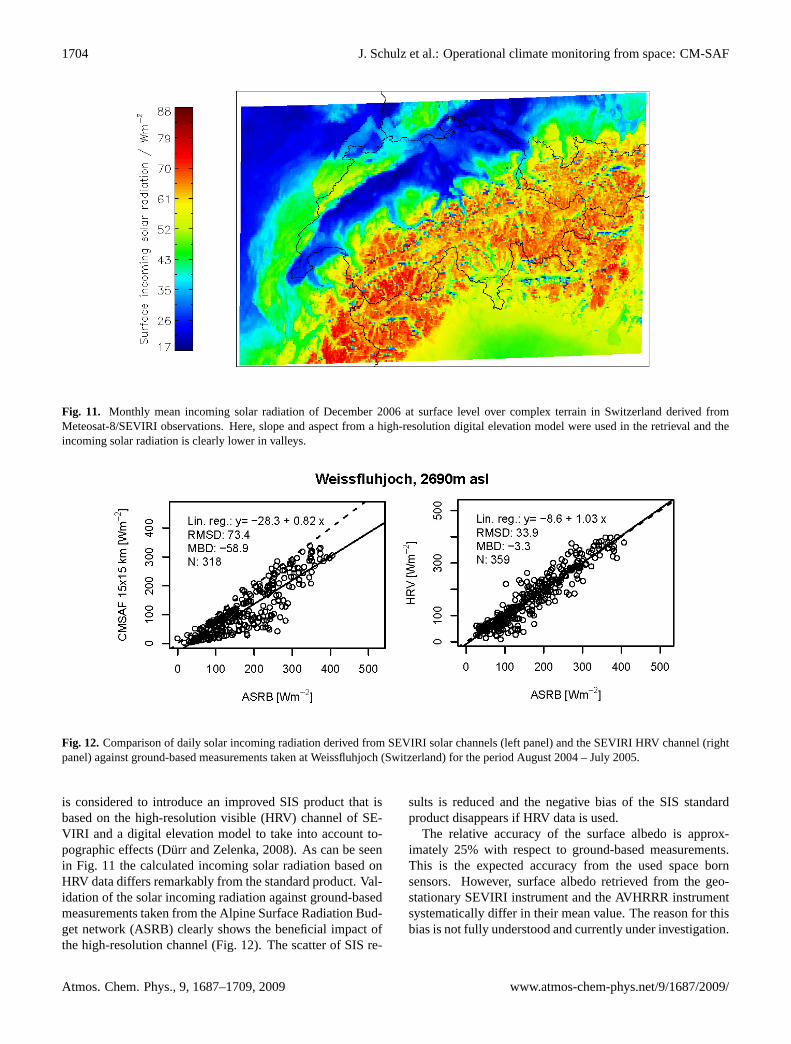
Fig. 11. Monthly mean incoming solar radiation of December 2006 at surface level over complex terrain in Switzerland derived fromMeteosat-8/SEVIRI observations. Here, slope and aspect from a high-resolution digital elevation model were used in the retrieval and theincoming solar radiation is clearly lower in valleys.
Fig. 12. Comparison of daily solar incoming radiation derived from SEVIRI solar channels (left panel) and the SEVIRI HRV channel (rightpanel) against ground-based measurements taken at Weissfluhjoch (Switzerland) for the period August 2004 – July 2005.
is considered to introduce an improved SIS product that isbased on the high-resolution visible (HRV) channel of SE-VIRI and a digital elevation model to take into account to-pographic effects (Durr and Zelenka, 2008). As can be seenin Fig. 11 the calculated incoming solar radiation based onHRV data differs remarkably from the standard product. Val-idation of the solar incoming radiation against ground-basedmeasurements taken from the Alpine Surface Radiation Bud-get network (ASRB) clearly shows the beneficial impact ofthe high-resolution channel (Fig.12). The scatter of SIS re-
sults is reduced and the negative bias of the SIS standardproduct disappears if HRV data is used.
The relative accuracy of the surface albedo is approx-imately 25% with respect to ground-based measurements.This is the expected accuracy from the used space bornsensors. However, surface albedo retrieved from the geo-stationary SEVIRI instrument and the AVHRRR instrumentsystematically differ in their mean value. The reason for thisbias is not fully understood and currently under investigation.
Atmos. Chem. Phys., 9, 1687–1709, 2009 www.atmos-chem-phys.net/9/1687/2009/
J. Schulz et al.: Operational climate monitoring from space: CM-SAF 1705
4 Summary and future perspectives
CM-SAF as part of EUMETSAT’s SAF network providessatellite-derived thematic climate data records. The CM-SAFproducts comprise macrophysical and cloud physical vari-ables as among others cloud cover and cloud optical thick-ness, vertically resolved temperature and water vapor infor-mation as well as resulting radiation fluxes at the top of theatmosphere and the surface. Spatial coverage of the prod-ucts ranges from regional (AVHRR derived cloud parame-ters) over continental (SEVIRI full disc products) to global(ATOVS and SSM/I water vapor products). Temporal cov-erage is rather short for most of the CM-SAF data productsbecause the operational production started in 2005 and noprocessing of historical data was foreseen. The exception ofthis is the SSM/I water vapor series that covers a period from1987–2005.
CM-SAF utilizes most up to date retrieval schemes to de-rive its products from operational satellite sensors. Vali-dation results as described above revealed encouraging re-sults for all products, although particular problems as thesystematic difference between surface albedo derived fromAVHRR and SEVIRI remain to be solved. Currently, avail-able products can already be used for several applicationsincluding variability analysis at diurnal to subseasonal timescales, improvements of cloud parameterizations in climatemodels, etc. Series based on already intercalibrated data asthe CERES referenced top of the atmosphere radiation fluxesand the intersensor calibrated SSM/I water vapor data canalso be used for studies of interannual variability. Solar ra-diation fluxes at the surface are also beneficial for the solarenergy community.
Based on recommendations from GCOS, the WMO SpaceProgramm, and EUMETSAT, CM-SAF has identified fourkey issues for the future development of the CM-SAF datasets in a time frame of 5–10 years. These are:
1. CalibrationRequirements for more accurate satellite informationproducts are steadily increasing. To create the sta-ble long-term data sets needed for monitoring climatechange it becomes vital to inter-calibrate sensors onsimilar and different satellites. To integrate observationsand products from different satellite systems, the mea-surements must be inter-calibrated. For instanceRoe-beling et al.(2006) investigated the differences betweencloud properties derived from SEVIRI on Meteosat-8and AVHRR on the NOAA-17 platform. It showedclearly the need of intercalibration before integration.Otherwise the data cannot be used for climate applica-tions because jumps (systematic biases) can occur in atime series constructed from different sensor observa-tions.
Relative calibration of satellite data is a pre-requisitefor a reasonable processing of data obtained from dif-
ferent sensors of the same type. Current schedule ofMSG launches shows that data from three spacecraftswill need to be harmonised until 2012. It is howeverexpected that the satellite operator (EUMETSAT) willprovide such radiance data sets towards the end of theCDOP.
First attempts to generate sensor intercalibrated bright-ness temperature time series from SSM/I records havealready been undertaken in the framework of theHOAPS-3 data set (Andersson et al., 2009). Those ba-sic data have already been used to build the SSM/I wa-ter vapor product. Furthermore, it is envisaged to re-trieve global cloud products using the satellite intercali-bration that was developed to generate the PATMOS-Xdata set (Jacobowitz et al., 2003), but replacing the re-trieval methods with CM-SAF cloud algorithms. Suchcomplementary time series would be quite helpful toidentify algorithm weaknesses and strengths.
International activities like the Global Space-basedInter-Calibration System (GSICS) initiative stronglyhelp to fulfil some of the CM-SAF needs with respectto data sets and methods during the CDOP. However,some intercalibration activities may have to be pursuedby CM-SAF especially in those cases where non EU-METSAT sensors like the SSM/I are used or newer in-struments like SEVIRI shall be homogenised with olderinstruments like MVIRI on the Meteosat first generationin due time. The global network of Regional Special-ized Satellite Centers on Climate Monitoring (R/SSC-CM) planned by WMO will help to foster the interna-tional collaboration in the generation of intercalibratedradiance records. The R/SSC-CM will also help to orga-nize the production and quality assessment of geophys-ical data sets derived from the intercalibrated radiancerecords.
2. Temporal extension of the data sets and reprocessingof current products based on homogenised sensor dataand employing improved retrieval schemes that are notchanged during the processingAs mentioned in the Introduction climate change andvariation occur on different time scales and data setsuseful for climate monitoring must therefore coverlonger time series to understand these changes. The de-mands on the accuracy increase accordingly to the timescales considered.
Today the existing CM-SAF data from class CDR-Iare suitable for monitoring diurnal and subseasonal toseasonal fluctuations of environmental variables whichcan be large. Currently, CM-SAF started to processhistorical satellite data to ensure that its data sets maybecome suitable for analysis of interannual variabilityand trend detection, i.e. the data sets are developedto fulfil requirements for the classes CDR-II and III.
www.atmos-chem-phys.net/9/1687/2009/ Atmos. Chem. Phys., 9, 1687–1709, 2009
1706 J. Schulz et al.: Operational climate monitoring from space: CM-SAF
Furthermore, improvements of retrieval algorithms andthe growing time series of newer instruments such asSEVIRI that are affected by calibration changes willcause reprocessing of these data sets within the period2007 to 2012. Both activities imply close interaction ofresponsible space agencies in order to archive and pro-vide the required data in the given time frame. Such re-processing events also need to be carefully coordinatedwith data suppliers (upstream) and the user community(downstream).
3. The production of global and regional productsClimate variability at regional level may be related toglobal climate changes but regional effects may differfrom region to region. CM-SAF aims to provide supportfor climate analysis at regional level but needs globalproducts to improve the understanding of scale inter-action and to interpret the nature of regional changes.Global products enhance the amount of possible appli-cations, e.g., global products can be used to supportstudies on climate sensitivity of global climate mod-els. However, the extension to global products is notpossible for all products because of the inhomogeneityof the observing system. This is especially true for in-struments in geostationary orbit where the SEVIRI in-strument sets new standards but dedicated algorithmscannot be applied globally. Additionally, collabora-tion between at least four satellite operators would beneeded to achieve an almost global product. Regionalproducts derived from SEVIRI with improved qualitywill still serve as regional benchmark data sets. Prod-ucts from polar orbiters typically suffer from inadequatespatiotemporal sampling at low latitudes but providecomplementary data with often better spatial resolution.However, at high latitudes polar orbiter data are essen-tial to study polar conditions.
4. The integration of new products that facilitate a betterunderstanding of the energy and water cycleThe primary strength of the CM-SAF approach for cli-mate monitoring is the provision of consistent thematicclimate data records. One of the most concerning ques-tions about the changing Earth climate system is thepotential change of the hydrological and energy cy-cle. Energy and water cycle related geophysical pa-rameters over water surfaces at global scale are pro-vided by the Hamburg Ocean Atmosphere Parametersand Fluxes from Satellite Data (HOAPS-3) (Anderssonet al., 2009). Consequently, CM-SAF will take over theresponsibility for the processing of HOAPS during theCDOP. This will enhance the product suite with precip-itation and turbulent heat fluxes over the ocean. Poten-tially, the CM-SAF surface flux products can be used toinvestigate the net heat flux at the ocean surface.
A 30 year long climatology of upper tropospheric hu-midity derived from a homogenized Meteosat recordspanning over Meteosat First and Second Generation in-struments will be derived in cooperation with the Lab-oratoire Meteorologie Dynamique (LMD). It will pro-vide a very good data set to study the variability of wa-ter vapor at intraseasonal scale.Brogniez et al.(2006)found from a series of Meteosat First Generation datafor the period 1983–2005 an asymmetry between thetwo hemispheres along the annual cycle. Whereas theintra-seasonal variability is homogeneous in the South-ern Hemisphere the variability shows a distinct mini-mum in the Northern Hemisphere during the summer.Thus, the planned data set extended with data from thenew SEVIRI instrument will be perfectly usable to anal-yse the quality of intra-seasonal variability in futureglobal reanalysis. Other new products include ice waterpath, aerosol properties and enhanced surface radiationflux products as a spectrally resolved irradiance.
Acknowledgements.We acknowledge the Cloudnet project (Eu-ropean Union contract EVK2-2000-00611) for providing the mi-crowave radiometer and target classification data, which was pro-duced by the University of Reading using measurements from theexpirimental sites of Chilbolton in the UK, Paleaseau in Franceand Cabauw in the Netherlands. The supportive work of the EU-METSAT secretary is greatly acknowledged. We thank the NWC-SAF consortium for providing the NOAA/PPS and MSG/SEVIRIretrieval packages.
The authors are indebted to the work of the CM-SAF team in par-ticular L. Schreiber, D. Stein, S. Villbrandt, R. Weber for support-ing the technical development of the CM-SAF processing scheme,R. Cremer for supporting the validation activities, B. Thiess and P.Willing for handling the CM-SAF User Help Desk and finally W.Mehley for administrative support of the whole activity.
We are grateful to R. Lindau (Univ. Bonn, Germany) and A.Walther (Freie Univ. Berlin, Germany) for their valuable workwith the Kriging algorithm and the validation of water vaporproducts, respectively. We thank the colleagues at DeutscherWetterdienst at Offenbach and the meteorological observatoryLindenberg for providing NWP analysis data and ground-basedmeasurements that were used to validate several CM-SAF products.
Edited by: J. Brandt
References
Allan, R., Slingo, A., Milton, S., and Brooks, M.: Evaluation ofthe Met Office global forecast model using Geostationary EarthRadiation Budget (GERB) data, Q. J. Roy. Meteor. Soc., 133,1993–2010, 2007.
Andersson, A., Klepp, C., Fennig, K., Bakan, S., Grassl, H., andSchulz, J.: The HOAPS climatology: Essential water cycle com-ponents over global oceans derived from satellite data, B. Am.Meteorol. Soc., submitted, 2009.
Atmos. Chem. Phys., 9, 1687–1709, 2009 www.atmos-chem-phys.net/9/1687/2009/
J. Schulz et al.: Operational climate monitoring from space: CM-SAF 1707
Boers, R., van Lammeren, A., and Feijt, A.: Accuracy of cloud op-tical depth retrievals from ground based pyranometers, J. Atmos.Ocean. Tech., 17, 916–927, 2000.
Brogniez, H., Roca, R., and Picon, L.: A clear-sky radiance archivefrom Meteosat water vapor observations, J. Geophys. Res., 111,D21109, doi:10.1029/2006JD00723, 2006.
Clerbaux, N., Dewitte, S., Gonzalez, L., Bertrand, C., Nicula, B.,and Ipe, A.: Outgoing longwave flux estimation: improvementof angular modelling using spectral information, Remote. Sens.Environ., 85, 389–395, 2003.
Colton, M., Karl, T., Goldberg, M., and Bates, J.: Creating Cli-mate Data Records from NOAA Operational Satellites, Whitepaper, National Oceanic And Atmospheric Administration, Na-tional Environmental Satellite, Data, and Information Service, 53pp., 2003.
Crommelynck, D., Fichot, A., III, R. L., and Romero, J.: First real-isation of the Space Absolute Radiometric Reference during theATLAS 2 flight period, Adv. Space Res., 16, 17–23, 1995.
Deneke, H., Feijt, A., van Lammeren, A., and Simmer, C.: Val-idation of a physical retrieval scheme of solar surface irradi-ances from narrowband satellite radiances, J. Appl. Meteorol.,44, 1453–1466, 2005.
Derrien, M. and LeGleau, H.: MSG/SEVIRI cloud mask and typefrom SAFNWC, Int. J. Remote. Sens., 26, 4707–4732, 2005.
Derrien, M., Farki, B., Harang, L., Gleau, H. L., Noyalet, A.,Pochic, D., and Sairouni, A.: Automatic cloud detection appliedto NOAA-11 / AVHRR imagery, Remote. Sens. Environ., 46,246–267, 1993.
Dewitte, S., Joukoff, A., Crommelynck, D., III, R. L., Helizon, R.,and Wilson, R.: Contribution of the SOLCON program to thelong term total solar irradiance observation, J. Geophys. Res.,106, 759–766, 2001.
Dewitte, S., Crommelynck, D., and Joukoff, A.: Total solar irra-diance observations from DIARAD/VIRGO, J. Geophys. Res.,109, A02102, doi:10.1029/2002JA009694, 2004.
Diekmann, F.-J., Happ, S., Rieland, M., Benesch, W., Czeplak, G.,and Kasten, F.: An operational estimate of global solar irradi-ance at ground level from METEOSAT data: results from 1985to 1987, Meteorol. Rundsch., 41, 65–79, 1988.
Durr, B. and Zelenka, A.: Satellite derived surface global irradi-ance over the Alpine region from METEOSAT Second Genera-tion data, Int. J. Remote Sens., accepted, 2009.
Dybbroe, A., A. Thoss, A., and Karlsson, K.-G.: SAFNWCAVHRR cloud detection and analysis using dynamic thresholdsand radiative transfer modelling Part I: Algorithm description, J.Appl. Meteorol., 44, 39–54, 2005a.
Dybbroe, A., Thoss, A., and Karlsson, K.-G.: SAFNWC AVHRRcloud detection and analysis using dynamic thresholds and radia-tive transfer modelling Part II: Validation, J. Appl. Meteorol., 44,55–71, 2005b.
GCOS: The second report on the adequacy of the global observingsystems for climate in support of UNFCCC, Technical DocumentGCOS – 82, WMO/TD No. 1143, World Meteorological Orga-nization, Geneva, Switzerland, 2003.
GCOS: Implementation Plan for the Global Observing System ForClimate in support of the UNFCCC, Technical Document GCOS– 92, WMO/TD No. 1219, World Meteorological Organization,Geneva, Switzerland, 2004.
GCOS: GCOS Reference Upper-Air Network (GRUAN): Justifica-
tion, requirements, siting and instrumentation options, TechnicalDocument GCOS – 112, WMO/TD No. 1379, World Meteoro-logical Organization, Geneva, Switzerland, 2007.
Gupta, S.: A parameterization for longwave surface radiation fromsun-synchronous satellite data, J. Climate, 2, 305–320, 1989.
Gupta, S., Darnell, L., and Wilber, A.: A parameterization for long-wave surface radiation from satellite data: recent improvements,J. Appl. Meteorol., 31, 1361–1367, 1992.
Gupta, S. K., Ritchey, N. A., Wilber, A. C., Whitlock, C. H., Gib-son, G. G., and Stackhouse Jr., P. W.: A climatology of surfaceradiation budget derived from satellite data, J. Climate, 12, 2691–2710, 1999.
Haan, J. D., Bosma, P., and Hovenier, J.: The adding method formultiple scattering calculations of polarized light, Astron. Astro-phys., 183, 371–391, 1987.
Harries, J., Russell, J., Hanafin, J., Brindley, H., Futyan, J., Ru-fus, J., Kellock, S., Matthews, G., Wrigley, R., Last, A., Mueller,J., Mossavati, R., Ashmall, J., Sawyer, E., Parker, D., Caldwell,M., Allan, P., Smith, A., Bates, M., Coan, B., Stewart, B., Lep-ine, D., Cornwall, L., Corney, D., Ricketts, M., Drummond, D.,Smart, D., Cutler, R., Dewitte, S., Clerbaux, N., Gonzalez, L.,Ipe, A., Bertrand, C., Joukoff, A., Crommelynck, D., Nelms,N., Llewellyn-Jones, D., Butcher, G., Smith, G., Szewczyk, Z.,Mlynczak, P., Slingo, A., Allan, R., and Ringer, M.: The Geosta-tionary Earth Radiation Budget Project, B. Am. Meteorol. Soc.,doi:10.1175/BAMS-86-7-945, 945–960, 2005.
Held, I. and Soden, B.: Water vapor feedback and global warming,Annu. Rev. Energy Env., 25, 441–475, 2000.
Hollmann, R., Muller, R., and Gratzki, A.: CM-SAF surface radi-ation budget: First results with AVHRR data, Adv. Space Res.,37, 2166–2171, 2006.
Illingworth, A. J., Hogan, R. J., O’Connor, E. J., et al.: Continuousevaluation of cloud profiles in seven operational models usingground-based observations, B. Am. Meteorol. Soc., 88, 6, 883–898, 2007.
Inoue, T.: A cloud type classification with NOAA-7 split-windowmeasurements, J. Geophys. Res., 92, 3991–4000, 1987.
Jacobowitz, H., Stowe, L., Ohring, G., Heidinger, A., Knapp, K.,and Nalli, N.: The Advanced Very High Resolution RadiometerPathfinder Atmosphere (PATMOS) climate dataset: A resourcefor climate research, B. Am. Meteorol. Soc., 84, 785–793, 2003.
Jolivet, D. and Feijt, A. J.: Cloud thermodynamic phase and particlesize estimation using the 0.67 and 1.6µm channels from meteo-rological satellites, Atmos. Chem. Phys. Discuss., 3, 4461–4488,2003,http://www.atmos-chem-phys-discuss.net/3/4461/2003/.
Karlsson, K.: A 10 year cloud climatology over Scandinavia de-rived from NOAA advanced very high resolution radiometerimagery, Int. J. Climatol., 23, 1023–1044, doi:10.1002/joc.916,2003.
Karlsson, K., Willen, U., Jones, C., and Wyser, K.: Evalua-tion of regional cloud climate simulations over Scandinaviausing a 10-year NOAA Advanced Very High Resolution Ra-diometer cloud climatology, J. Geophys. Res., 113, D01203,doi:10.1029/2007JD008658, 2008.
King, M.: Determination of the scaled optical thickness from re-flected solar radiation measurements, J. Atmos. Sci., 44, 1734–1751, 1987.
Li, J., Wolf, W., Menzel, W., Zhang, W., Huang, H.-L., andAchtor, T.: Global soundings of the atmosphere from ATOVS
www.atmos-chem-phys.net/9/1687/2009/ Atmos. Chem. Phys., 9, 1687–1709, 2009
1708 J. Schulz et al.: Operational climate monitoring from space: CM-SAF
measurements: The algorithm and validation., J. Appl. Meteo-rol., 39, 1248–1268, 2000.
Liang, S.: Narrowband to broadband conversions of land surfacealbedo: I. Algorithms, Remote. Sens. Environ., 76, 213–238,2000.
Lindau, R. and Schulz, J.: Gridding/merging techniques for the hu-midity composite product of the CM-SAF, vol. EUM P41, 519–526, 2004.
Loeb, N., Manalo-Smith, N., Kato, S., Gupta, S., Minnis, P., andWielicki, B.: Angular distribution models for top-of-atmosphereradiative flux estimation from the Clouds and the Earths RadiantEnergy System instrument on the Tropical Rainfall MeasuringMission satellite, J. Appl. Meteorol., 42, 1748–1769, 2003.
Majewski, D., Liermann, D., Prohl, P., Ritter, B., Buchhold, M.,Hanisch, T., Paul, G., Wergen, W., and Baumgardner, J.: The op-erational global icosahedral-hexagonal grid point model GME:Description and high resolution tests, Mon. Weather Rev., 130,319–338, 2002.
Meerkotter, R., Konig, C., Bissolli, P., Gesell, G., andMannstein, H.: A 14-year European Cloud Climatology fromNOAA//AVHRR data in comparison to surface observations,Geophys. Res. Lett., 31, L15103, doi:10.1029/2004GL020098,2004.
Menzel, W., Smith, W., and Stewart, T.: Improved Cloud MotionWind Vector and Altitude Assignment using VAS, J. Clim. Appl.Meteorol., 22, 377–384, 1983.
Mieruch, S., Noel, S., Bovensmann, H., and Burrows, J. P.: Anal-ysis of global water vapor trends from satellite measurementsin the visible spectral range, Atmos. Chem. Phys., 8, 491–504,2008,http://www.atmos-chem-phys.net/8/491/2008/.
Miloshevich, Paukkunen, L. M., Vomel, H., and Oltmans, S. J.:Development and validation of a time-lag correction for Vaisalaradiosondes humidity measurements, J. Atmos. Oceanic Tech.,21, 1305–1327, 2004.
Mueller, R., Dagestad, K., Ineichen, P., Schroedter-Homscheidt,M., Cros, S., Dumortier, D., Kuhlemann, R., Olseth, J., Pier-navieja, G., Resie, C., Wald, L., and Heinemann, D.: Rethinkingsatellite based solar irradiance modelling. The SOLIS clear-skymodule, Remote Sense. Environ., 91, 160–174, 2004.
Nakajima, T. and King, M.: Determination of the optical thicknessand effective particle radius of clouds from reflected solar radi-ation measurements, part 1: Theory, J. Atmos. Sci., 47, 1878–1893, 1990.
Nakajima, T. and Nakajima, T.: Determination of cloud microphys-ical properties from NOAA AVHRR measurements for FIRE andASTEX regions, J. Atmos. Sci., 52, 4043–4095, 1995.
Ohmura, A., Dutton, E., Forgan, B., Froehlich, C., Gilgen, H., Heg-ner, H., Heimo, A., Koenig-Langlo, G., McArthur, B., Mueller,G., Philipona, R., Pinker, R., Whitlock, C., Dehne, K., andWild, M.: Baseline Surface Radiation Network (BSRN/WCRP):new precision radiometry for climate research, B. Am. Meteorol.Soc., 79, 10, 2115–2136, 1998.
Ohring, G., Wielicki, B., Spencer, R., Emery, B., and Datla, R.:Satellite Instrument Calibration for Measuring Clobal ClimateChange, B. Am. Meteorol. Soc., doi:10.1175/BAMS-86-9-1303,1303–1313, 2005.
Pinker, R. and Laszlo, I.: Modelling surface solar irradiance forsatellite applications on a global scale, J. Appl. Meterol., 31,194–211, 1992.
Rahman, H. and Dedieu, G.: SMAC: A simplified method for the at-mospheric correction of satellite measurements in the solar spec-trum, Int. J. Remote. Sens., 15, 123–143, 1994.
Rind, D.: Just Add Water Vapor, Science, 281, 1152–1153, 1998.Robinson, D., Barry, R., Campbell, J., Defries, R., Emery, W., Hur-
rell, M. H. J., Laing, A., Miller, R., Myneni, R., R. Somerville,P. T., and Vonder Haar, T.: Climate Data Records from Envi-ronmental Satellites: Interim Report, Technical report, NationalResearch Council, Committee on Climate Data Records fromNOAA Operational Satellites, 136 pp., 2004.
Roebeling, R., Feijt, A., and Stammes, P.: Cloud property re-trievals for climate monitoring: implications of differences be-tween Spinning Enhanced Visible and Infrared Radiometer (SE-VIRI) on METEOSAT-8 and Advanced Very High ResolutionRadiometer (AVHRR) on NOAA-17, J. Geophys. Res., 111,D20210, doi:10.1029/2005JD0069990, 2006.
Roebeling, R., Deneke, H. M., and Feijt, A.: Validation of cloud liq-uid water path retrievals from SEVIRI using one year of Cloud-NET observations, J. Appl. Meteorol. Clim., 47, 206–222, 2008.
Rossow, W. and Garder, L.: Cloud Detection Using Satellite Mea-surements of Infrared and Visible Radiances for ISCCP, J. Cli-mate, 6, 2341–2369, 1993.
Rossow, W. and Schiffer, R.: ISCCP cloud data products, B. Am.Meteorol. Soc., 72, 2–20, 1991.
Roujean, J.-L., Leroy, M., and Deschamps, P.: A Bidirectional Re-flectance Model of the Earths Surface for the Correction of Re-mote Sensing Data, B. Am. Meteorol. Soc., 97, 20455–20468,1992.
Santer, B., Mears, C., Wentz, F., Taylor, K., Gleckler, P., Wigley,T., Barnett, T., Boyle, J., Bruggemann, W., Gillett, N., Klein,S., Meehl, G., Nozawa, T., Pierce, D., Scott, P., Washington,W., and Wehner, M.: Identification of human-induced changesin atmospheric moisture content, P. Natl. Acad. Sci. USA, 104,15248–15253, 2007.
Schlussel, P. and Emery, W. J.: Atmospheric water vapor overoceans from SSM/I measurements, Int. J. Remote Sens., 11, 753–766, 1990.
Schmetz, J., Holmlund, K., Hoffman, J., Strauss, B., Mason, B.,Gaertner, V., Koch, A., and van de Berg, L.: Operational Cloud-Motion Winds from Meteosat Infrared Images, J. Appl. Meterol.,32, 1206–1225, 1993.
Schmetz, J., Pili, P., Tjemkes, S., Just, D., Kerkmann, J., Rota, S.,and Ratier, A.: An introduction to Meteosat Second Generation(MSG), B. Am. Meteorol. Soc., 83, 977–992, 2002.
Schulz, J., Schlussel, P., and Grassl, H.: Water vapor in the atmo-spheric boundary layer over oceans from SSM/I measurements,Int. J. Remote Sens., 14, 2773–2789, 1993.
Soden, B. J.: Atmospheric physics: Enlightening water vapor, Na-ture, 406, 247–248, 2000.
Sohn, B. and Smith, E.: Explaining sources of discrepancy in SSM/Iwater vapor algorithms, J. Climate, 16, 3229–3255, 2003.
Stephens, G.: Cloud feedbacks in the climate system: A criticalreview, J. Climate, 18, 237–273, 2005.
Stephens, G., Paltridge, G., and Platt, C.: Radiation profiles in ex-tended water clouds. III. Observations, J. Atmos. Sci., 35, 2133–2141, 1978.
Trenberth, K., Fasullo, J., and Smith, L.: Trends and variability incolumn-integrated atmospheric water vapor, Clim. Dynam., 24,741–758, doi:10.1007/s00 382–005–0017–4, 2005.
Atmos. Chem. Phys., 9, 1687–1709, 2009 www.atmos-chem-phys.net/9/1687/2009/
J. Schulz et al.: Operational climate monitoring from space: CM-SAF 1709
Vonder Haar, T.: Continuation of the NVAP Global Water Va-por Data Sets for Pathfinder Science Analysis, Technical Report3333, Science and Technology Cooperation, 2003.
Wentz, F.: The intercomparison of 53 SSM/I water vapor algo-rithms, Remote Sensing Systems Tech. Rep. on WetNet WaterVapor Intercomparison Project (VIP), Remote Sensing Systems,Santa Rosa, CA, 19 pp., 1995.
Wilber, A., Kratz, D., and Gupta, S.: Surface Emissivity Mapsfor Use in Satellite Retrievals of Longwave Radiation, TechnicalPublication TP-1999-209362, NASA Langley Research Center,1999.
Woick, H., Dewitte, S., Feijt, A., Gratzki, A., Hechler, P., Hollmann,R., Karlsson, K.-G., Laine, V., Lowe, P., Nitsche, H., Werscheck,M., and Wollenweber, G.: The Satellite Application Facility onClimate Monitoring, Adv. Space Res., 30, 2405–2410, 2002.
Wolters, E. L. A., Roebeling, R. A., and Feijt, A. J.: Evaluation ofcloud phase retrieval methods for SEVIRI onboard Meteosat-8using ground-based lidar and cloud radar data, J. Appl. Meteorol.Clim., 47, 1723–1738, 2008.
www.atmos-chem-phys.net/9/1687/2009/ Atmos. Chem. Phys., 9, 1687–1709, 2009
Related Documents