Journal of Agricultural Science; Vol. 6, No. 9; 2014 ISSN 1916-9752 E-ISSN 1916-9760 Published by Canadian Center of Science and Education 144 The Establishment of Vegetable and Fruit Markets and Nurseries: A Case Study in the Greater Sekhukhune District, Limpopo Province, South Africa Phokele Maponya 1 , David Modise 1 , Erika Van Den Heever 1 , Sandile Mahlangu 1 , Ntsako Baloyi 1 , Risinga Maluleke 1 , Dikeledi Chauke 2 , Koena Manamela 2 , Mapurunyane Mphahlele 2 , Morongwa Mojapelo 2 , Maria Mphahlele 3 , Johan Carstens 4 & Marjan Van der Walt 4 1 Agricultural Research Council – Vegetable and Ornamental Plant Institute, Pretoria, South Africa 2 Department of Rural Development and Land Reform, Polokwane, South Africa 3 Department of Rural Development and Land Reform, Pretoria, South Africa 4 Agricultural Research Council – Institute for Soil, Climate and Water, Pretoria, South Africa Correspondence: Phokele Maponya, Agricultural Research Council – Vegetable and Ornamental Plant Institute, Pretoria, South Africa. E-mail: [email protected]; [email protected] Received: June 3, 2014 Accepted: July 6, 2014 Online Published: August 15, 2014 doi:10.5539/jas.v6n9p144 URL: http://dx.doi.org/10.5539/jas.v6n9p144 Abstract This paper highlighted the importance of the establishment of vegetable markets, fruit markets and nurseries in the Greater Sekhukhune district, Limpopo Province, South Africa. This entailed taking a representative sample consisting of 69 agricultural projects, with 1096 beneficiaries participating in this research. The following 5 local municipalities were visited: Ephraim Mogale, Greater Tubatse, Elias Motsoaledi, Fetakgomo and Makhuduthamaga. Quantitative and qualitative methods were used in the form of a detailed questionnaire written in English, a focus group discussion, a stakeholder’s discussion, and field observations as part of the data collection. A purposive sampling technique was used to select the 69 projects, in order to cover uniformity and homogenous characteristics such as infrastructure requirements, skills availability, production challenges, agricultural training needs, water source needs, educational level and others. Data was coded, captured, and analyzed with the Software Package for Social Sciences (SPSS version 20) using Descriptive Analysis and Univariate Regression Analysis. The results showed a significant association among the following variables: age, educational level, farming experience, land size, land acquisition, crops planted, water source and market participation. It is recommended that fruit and vegetable markets be established, as well as the creation of a complete, viable agro-value chain that will expand community driven agricultural production and processing. Keywords: fruit markets, Greater Sekhukhune district, Limpopo Province, South Africa, vegetable markets, agricultural projects and agricultural production 1. Introduction The majority of rural households in South Africa are living under severe poverty. Agriculture is the predominant economic activity for rural households in the country, with about 8.5 million people depending directly or indirectly on agriculture for their livelihood (StatsSA, 2011). This indicates that agriculture remains at the core of rural development, and has a positive influence in the country’s economic growth. Investment in the agricultural sector has undeniable potential to make an enormous impact on the livelihoods of people to alleviate poverty, to bring financial security and to improve nutrition to name a few (Osci-Bimpch, 2013). Rural industrialization promotes the alleviation of rural poverty, and enhances a sustainable economic growth. The localization of markets encourages linkages between the rural sector and the mainstream. Development of formal and sustainable agriculture markets is critical in helping to unleash the full potential of agriculture in third world countries. Linking rural farmers to the markets is vital in increasing agricultural production, generating economic growth in rural areas and reducing food insecurity and poverty. Improving these linkages boosts productivity, increasing incomes and strengthening food security. Better access of small producers to domestic and international markets means that they can reliably sell more produce at higher prices.

Welcome message from author
This document is posted to help you gain knowledge. Please leave a comment to let me know what you think about it! Share it to your friends and learn new things together.
Transcript
Journal of Agricultural Science; Vol. 6, No. 9; 2014 ISSN 1916-9752 E-ISSN 1916-9760
Published by Canadian Center of Science and Education
144
The Establishment of Vegetable and Fruit Markets and Nurseries: A Case Study in the Greater Sekhukhune District, Limpopo Province,
South Africa
Phokele Maponya1, David Modise1, Erika Van Den Heever1, Sandile Mahlangu1, Ntsako Baloyi1, Risinga Maluleke1, Dikeledi Chauke2, Koena Manamela2, Mapurunyane Mphahlele2, Morongwa Mojapelo2, Maria
Mphahlele3, Johan Carstens4 & Marjan Van der Walt4 1 Agricultural Research Council – Vegetable and Ornamental Plant Institute, Pretoria, South Africa 2 Department of Rural Development and Land Reform, Polokwane, South Africa 3 Department of Rural Development and Land Reform, Pretoria, South Africa 4 Agricultural Research Council – Institute for Soil, Climate and Water, Pretoria, South Africa
Correspondence: Phokele Maponya, Agricultural Research Council – Vegetable and Ornamental Plant Institute, Pretoria, South Africa. E-mail: [email protected]; [email protected]
Received: June 3, 2014 Accepted: July 6, 2014 Online Published: August 15, 2014
doi:10.5539/jas.v6n9p144 URL: http://dx.doi.org/10.5539/jas.v6n9p144
Abstract
This paper highlighted the importance of the establishment of vegetable markets, fruit markets and nurseries in the Greater Sekhukhune district, Limpopo Province, South Africa. This entailed taking a representative sample consisting of 69 agricultural projects, with 1096 beneficiaries participating in this research. The following 5 local municipalities were visited: Ephraim Mogale, Greater Tubatse, Elias Motsoaledi, Fetakgomo and Makhuduthamaga. Quantitative and qualitative methods were used in the form of a detailed questionnaire written in English, a focus group discussion, a stakeholder’s discussion, and field observations as part of the data collection. A purposive sampling technique was used to select the 69 projects, in order to cover uniformity and homogenous characteristics such as infrastructure requirements, skills availability, production challenges, agricultural training needs, water source needs, educational level and others. Data was coded, captured, and analyzed with the Software Package for Social Sciences (SPSS version 20) using Descriptive Analysis and Univariate Regression Analysis. The results showed a significant association among the following variables: age, educational level, farming experience, land size, land acquisition, crops planted, water source and market participation. It is recommended that fruit and vegetable markets be established, as well as the creation of a complete, viable agro-value chain that will expand community driven agricultural production and processing.
Keywords: fruit markets, Greater Sekhukhune district, Limpopo Province, South Africa, vegetable markets, agricultural projects and agricultural production
1. Introduction
The majority of rural households in South Africa are living under severe poverty. Agriculture is the predominant economic activity for rural households in the country, with about 8.5 million people depending directly or indirectly on agriculture for their livelihood (StatsSA, 2011). This indicates that agriculture remains at the core of rural development, and has a positive influence in the country’s economic growth. Investment in the agricultural sector has undeniable potential to make an enormous impact on the livelihoods of people to alleviate poverty, to bring financial security and to improve nutrition to name a few (Osci-Bimpch, 2013). Rural industrialization promotes the alleviation of rural poverty, and enhances a sustainable economic growth. The localization of markets encourages linkages between the rural sector and the mainstream.
Development of formal and sustainable agriculture markets is critical in helping to unleash the full potential of agriculture in third world countries. Linking rural farmers to the markets is vital in increasing agricultural production, generating economic growth in rural areas and reducing food insecurity and poverty. Improving these linkages boosts productivity, increasing incomes and strengthening food security. Better access of small producers to domestic and international markets means that they can reliably sell more produce at higher prices.
www.ccsenet.org/jas Journal of Agricultural Science Vol. 6, No. 9; 2014
145
The literature suggests a positive connection between growth in agricultural development and non-farm activity towards rural development.
The Sekhukhune district municipality has 740 villages, with a mushrooming of urban areas as well (StatsSA, 2011). The district has a mixture of commercial and subsistence agriculture, with subsistence farming predominant in rural areas. Despite agriculture being the vital contributor to employment within the district, agriculture remains a relatively marginal contributor (approximately 9.7%) to the aggregate GGP of the district (StatsSA, 2011). Rural farmers are struggling to access markets for their produce. According to Maponya & Moja (2012) 63% of households within the district were food insecure and levels of hunger were on the increase.
More than 50% of the district populations are residing in rural areas, thus there is a need for development of local agricultural markets. Facilitating the establishment of viable markets is a vital part of rural development and agricultural development in the district. According to FAO (2003), new markets or improvements to existing markets in rural areas can help overcome many of the marketing problems faced by rural farmers. Formal markets in rural areas play a significant role in improving agricultural marketing. They can increase retail competition by providing a convenient place where farmers can meet with consumers, reduce post-harvest losses by providing overhead protection for produce, provide a focal point for rural activities and make marketing a more pleasurable activity.
Production sites (69) in Sekhukhune district, Limpopo Province are part of the Agri-Park project which is coordinated by the Agricultural Research Council (ARC). The project is also in other districts in Limpopo, Mpumalanga, KwaZulu-Natal and Eastern Cape provinces. Beneficiaries were trained and are mentored so as to implement sustainable production and develop markets. The overall aim of the study is to establish whether sustainable agricultural markets are viable in the Sekhukhune district. The major objectives are: (1) to identify and describe the characteristics of selected agricultural projects in the Sekhukhune district and (2) to determine factors that influence decision making to participate in agricultural markets.
2. Methodology
Quantitative and qualitative methods were used. A detailed questionnaire in English was developed for the data collection, and used both open and closed ended questions. Focus group discussions and field observations were also part of the data collection. As part of standard protocol for conducting the study, meetings were held with all stakeholders in the Sekhukhune district, namely: (1) local municipalities, (2) Limpopo Department of Agriculture (LDA), (3) Department of Rural Development and Land Reform (DRDLR), (4) local economic agencies and (5) local farmers. The purpose of the meetings was to introduce and explain the aim of the study, and future plans of the potential market.
Purposive sampling was used to select agricultural projects. The sampling was used to assess uniformity and homogenous characteristics, namely infrastructure needs, skills availability, production challenges, agricultural training needs, water source needs, educational level, land acquisition, size of land farming experience, source of water and inputs and implements used (Table 1). Agricultural projects visited in the Sekhukhune district were prioritized based on the agricultural potential of the area, namely project type, numbers of projects around an area, size of the land, chances of extending production, water availability, commitment of members to their projects, internal conflicts and working material and infrastructure.
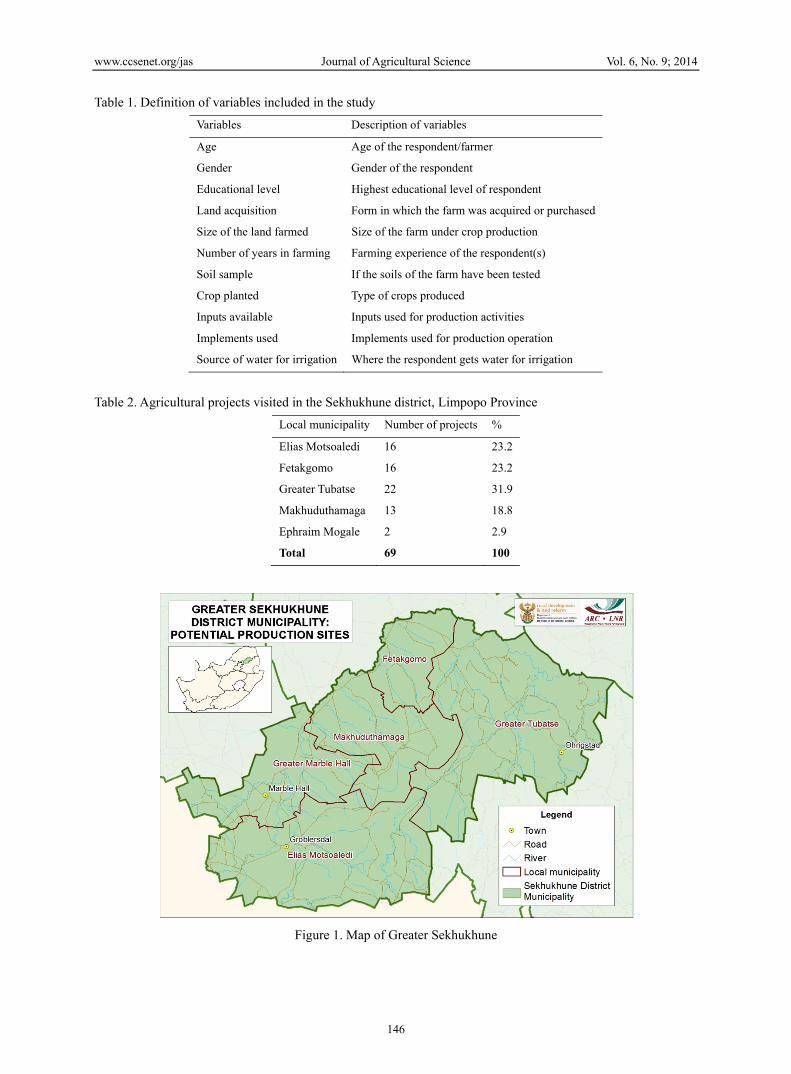
The Limpopo Province lies in the northern part of South Africa, and has shared borders with Zimbabwe and Botswana, which allows favourable economic cooperation with these countries (StatsSA, 2011). It has a total number of 5 district municipalities, namely Waterberg, Capricorn, Sekhukhune, Mopani and Vhembe districts (StatsSA, 2011). The present study was conducted in the Greater Sekhukhune district municipality (Figure 1). The work was done by the ARC together with officials from DRDLR, LDA and local municipalities. A total of 69 projects in 5 local municipalities were visited and all formed part of the study. The 5 local municipalities visited were Elias Motsoaledi, Fetakgomo, Greater Tubatse, Makhuduthamaga and Ephraim Mogale (Table 2). Agricultural projects visited were prioritized based on the agriculture potential of the area, namely project type, numbers of projects around an area, size of the land, chances of extension to increase production, water availability, commitment of members in their projects, internal issues and working material and infrastructure.
www.ccsenet.org/jas Journal of Agricultural Science Vol. 6, No. 9; 2014
146
Table 1. Definition of variables included in the study
Variables Description of variables
Age Age of the respondent/farmer
Gender Gender of the respondent
Educational level Highest educational level of respondent
Land acquisition Form in which the farm was acquired or purchased
Size of the land farmed Size of the farm under crop production
Number of years in farming Farming experience of the respondent(s)
Soil sample If the soils of the farm have been tested
Crop planted Type of crops produced
Inputs available Inputs used for production activities
Implements used Implements used for production operation
Source of water for irrigation Where the respondent gets water for irrigation
Table 2. Agricultural projects visited in the Sekhukhune district, Limpopo Province
Local municipality Number of projects %
Elias Motsoaledi 16 23.2
Fetakgomo 16 23.2
Greater Tubatse 22 31.9
Makhuduthamaga 13 18.8
Ephraim Mogale 2 2.9
Total 69 100
Figure 1. Map of Greater Sekhukhune
www.ccsenet.org/jas Journal of Agricultural Science Vol. 6, No. 9; 2014
147
3. Results and Discussion
3.1 Socio-Economic Factors
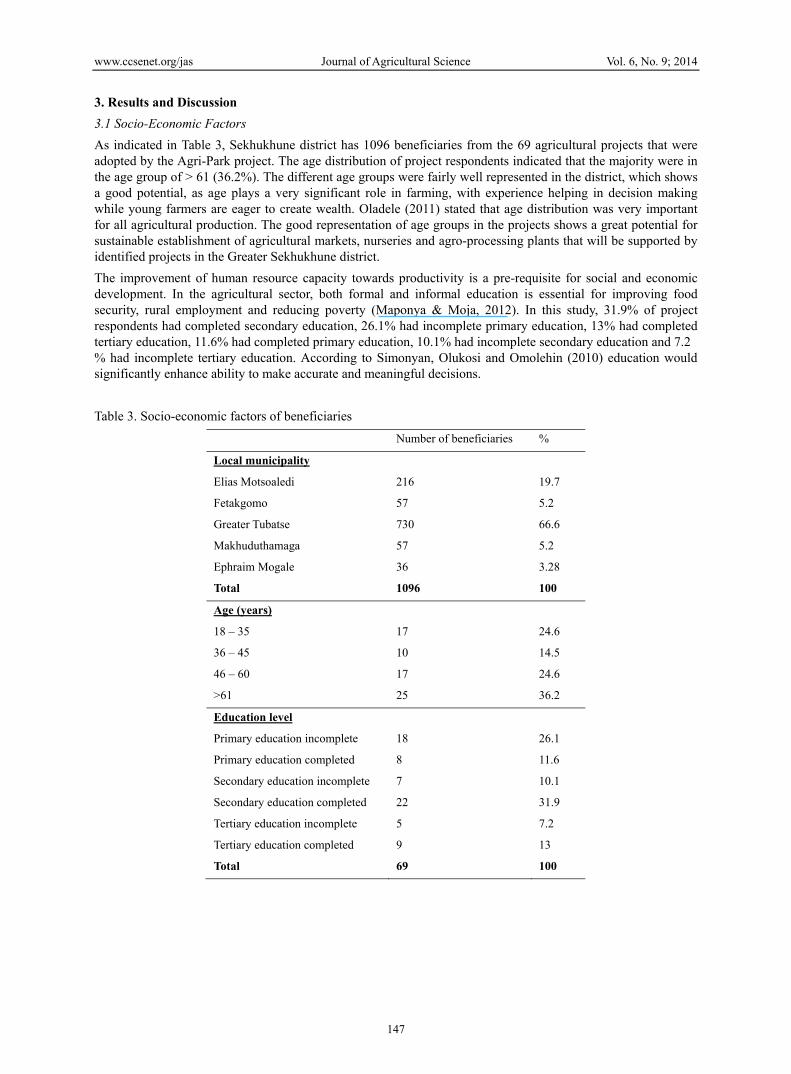
As indicated in Table 3, Sekhukhune district has 1096 beneficiaries from the 69 agricultural projects that were adopted by the Agri-Park project. The age distribution of project respondents indicated that the majority were in the age group of > 61 (36.2%). The different age groups were fairly well represented in the district, which shows a good potential, as age plays a very significant role in farming, with experience helping in decision making while young farmers are eager to create wealth. Oladele (2011) stated that age distribution was very important for all agricultural production. The good representation of age groups in the projects shows a great potential for sustainable establishment of agricultural markets, nurseries and agro-processing plants that will be supported by identified projects in the Greater Sekhukhune district.
The improvement of human resource capacity towards productivity is a pre-requisite for social and economic development. In the agricultural sector, both formal and informal education is essential for improving food security, rural employment and reducing poverty (Maponya & Moja, 2012). In this study, 31.9% of project respondents had completed secondary education, 26.1% had incomplete primary education, 13% had completed tertiary education, 11.6% had completed primary education, 10.1% had incomplete secondary education and 7.2 % had incomplete tertiary education. According to Simonyan, Olukosi and Omolehin (2010) education would significantly enhance ability to make accurate and meaningful decisions.
Table 3. Socio-economic factors of beneficiaries
Number of beneficiaries %
Local municipality
Elias Motsoaledi
Fetakgomo
Greater Tubatse
Makhuduthamaga
Ephraim Mogale
Total
216
57
730
57
36
1096
19.7
5.2
66.6
5.2
3.28
100
Age (years)
18 – 35
36 – 45
46 – 60
>61
17
10
17
25
24.6
14.5
24.6
36.2
Education level
Primary education incomplete
Primary education completed
Secondary education incomplete
Secondary education completed
Tertiary education incomplete
Tertiary education completed
Total
18
8
7
22
5
9
69
26.1
11.6
10.1
31.9
7.2
13
100
www.ccsenet.org/jas Journal of Agricultural Science Vol. 6, No. 9; 2014
148
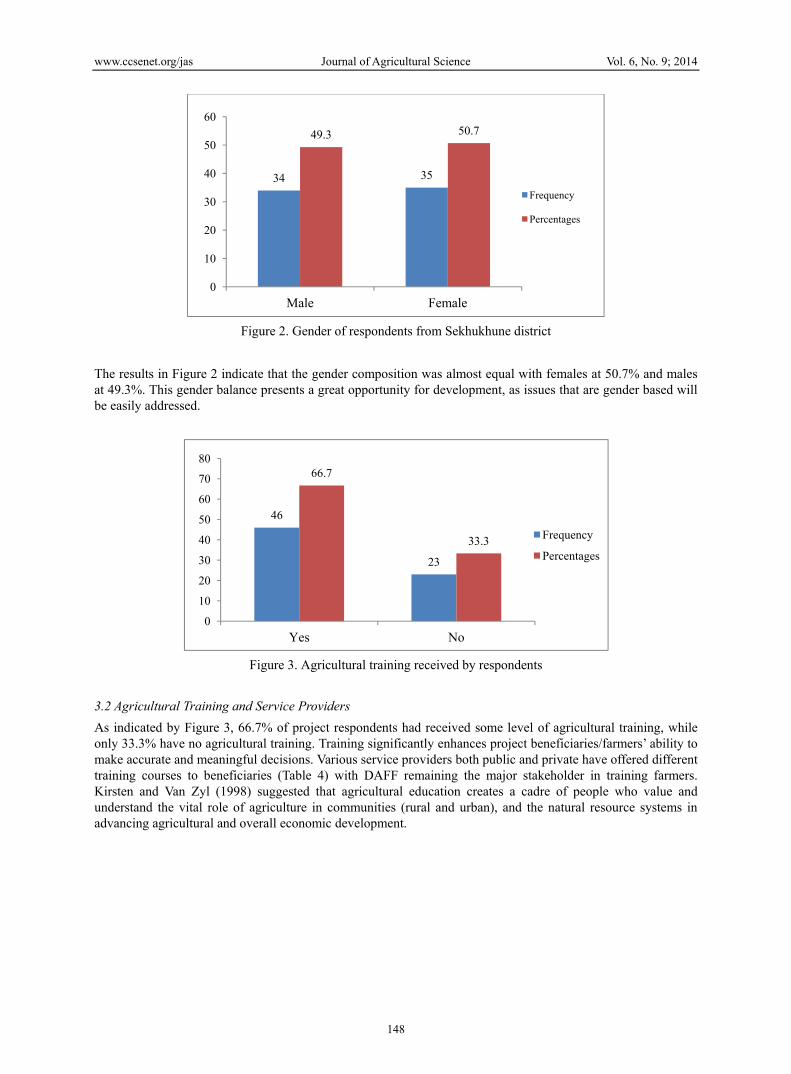
Figure 2. Gender of respondents from Sekhukhune district
The results in Figure 2 indicate that the gender composition was almost equal with females at 50.7% and males at 49.3%. This gender balance presents a great opportunity for development, as issues that are gender based will be easily addressed.
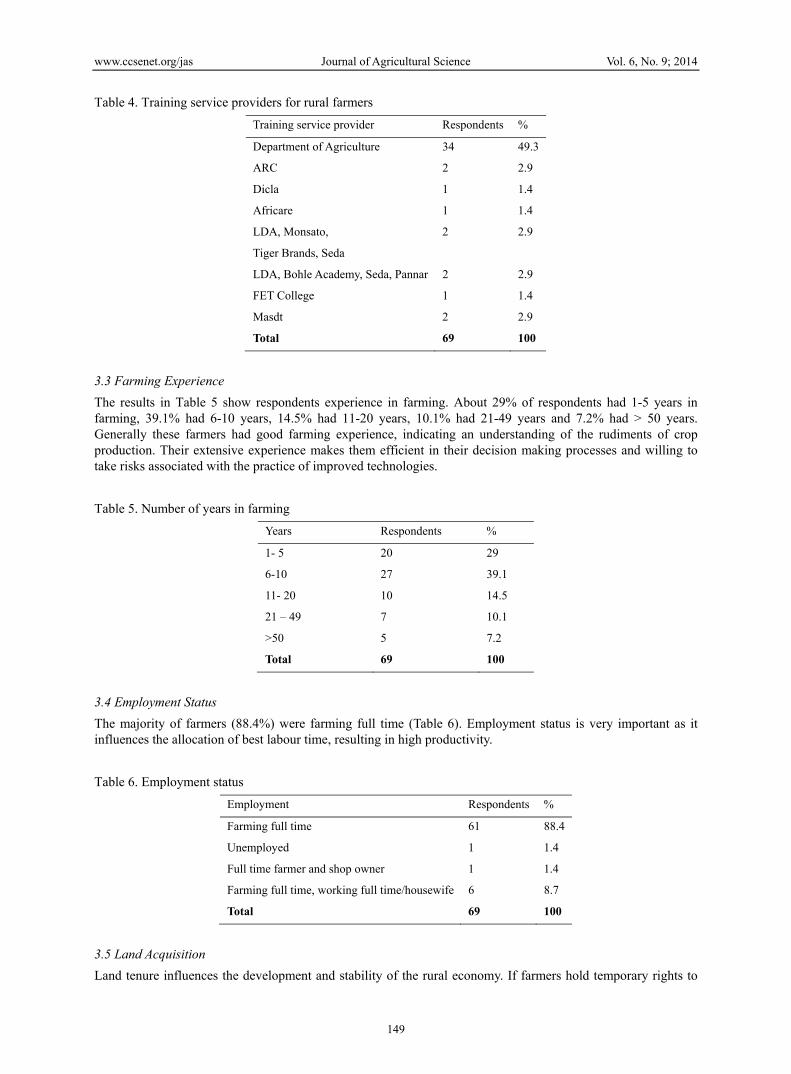
Figure 3. Agricultural training received by respondents
3.2 Agricultural Training and Service Providers
As indicated by Figure 3, 66.7% of project respondents had received some level of agricultural training, while only 33.3% have no agricultural training. Training significantly enhances project beneficiaries/farmers’ ability to make accurate and meaningful decisions. Various service providers both public and private have offered different training courses to beneficiaries (Table 4) with DAFF remaining the major stakeholder in training farmers. Kirsten and Van Zyl (1998) suggested that agricultural education creates a cadre of people who value and understand the vital role of agriculture in communities (rural and urban), and the natural resource systems in advancing agricultural and overall economic development.
34 35
49.3 50.7
0
10
20
30
40
50
60
Male Female
Frequency
Percentages
46
23
66.7
33.3
0
10
20
30
40
50
60
70
80
Yes No
Frequency
Percentages
www.ccsenet.org/jas Journal of Agricultural Science Vol. 6, No. 9; 2014
149
Table 4. Training service providers for rural farmers
Training service provider Respondents %
Department of Agriculture 34 49.3
ARC 2 2.9
Dicla 1 1.4
Africare 1 1.4
LDA, Monsato,
Tiger Brands, Seda
2 2.9
LDA, Bohle Academy, Seda, Pannar 2 2.9
FET College 1 1.4
Masdt 2 2.9
Total 69 100
3.3 Farming Experience
The results in Table 5 show respondents experience in farming. About 29% of respondents had 1-5 years in farming, 39.1% had 6-10 years, 14.5% had 11-20 years, 10.1% had 21-49 years and 7.2% had > 50 years. Generally these farmers had good farming experience, indicating an understanding of the rudiments of crop production. Their extensive experience makes them efficient in their decision making processes and willing to take risks associated with the practice of improved technologies.
Table 5. Number of years in farming
Years Respondents %
1- 5 20 29
6-10 27 39.1
11- 20 10 14.5
21 – 49 7 10.1
>50 5 7.2
Total 69 100
3.4 Employment Status
The majority of farmers (88.4%) were farming full time (Table 6). Employment status is very important as it influences the allocation of best labour time, resulting in high productivity.
Table 6. Employment status
Employment Respondents %
Farming full time 61 88.4
Unemployed 1 1.4
Full time farmer and shop owner 1 1.4
Farming full time, working full time/housewife 6 8.7
Total 69 100
3.5 Land Acquisition
Land tenure influences the development and stability of the rural economy. If farmers hold temporary rights to
www.ccsenet.org/jas Journal of Agricultural Science Vol. 6, No. 9; 2014
150
using land, it leads to social problems and hinders agricultural development. Ownership of land has always played a vital role in production efficiency, with projects that own land being more efficient and producing more. Results on land acquisition (Table 7) indicate that the majority of projects operate on land that was inherited (50.7%).
Table 7. Land acquisition
Land acquisition Projects %
Own finance 6 8.7
Inheritance 35 50.7
Land Redistribution for Agricultural Development (LRAD) 2 2.9
Permission to occupy (PTO) 5 7.2
Lease 4 5.8
Municipal 1 1.4
Tribal land 15 21.7
Household garden 1 1.4
Total 69 100
3.6 Land Size
A large percentage (58%) of projects utilize 1-5 hectares (Table 8), and land size played a crucial role in rural agricultural production. In support, other studies (FAO, 2003; Baloyi, 2011) showed that farm size had an impact on production levels.
Table 8. Size of land
Size (ha) Projects %
1- 5 40 58
6 - 10 16 23.2
11 - 20 3 4.3
21 - 50 3 4.3
> 51 7 10.1
Total 69 100
3.7 Water Source
High quality, abundant water is required for efficient agricultural production. According to FAO (2012) irrigation now claims close to 70% of all freshwater appropriated for human use. Projects used different water sources for irrigation, with dams being the most utilized (34.8%), followed by boreholes (23.2%) and rivers (17.4%), while other water sources were also used (Table 9).
Table 9. Sources of water
Source Projects %
Dam 24 34.8
River 12 17.4
Borehole 16 23.2
Borehole, river 3 4.3
Dam, borehole 4 5.8
www.ccsenet.org/jas Journal of Agricultural Science Vol. 6, No. 9; 2014
151
Dam, river, borehole 2 2.9
Tanks 3 4.3
Taps 1 1.4
Furrows/Stream 1 1.4
Generator 1 1.4
Not applicable 2 2.9
Total 69 100
3.8 Water Rights
For farmers, a lack of water security negatively affects the utility. According to FAO (2004), the lack of secure water rights is frequently the result of a number of factors including the form and design of irrigation schemes and how they are funded and developed. Table 10 shows the results of water rights on projects, with the majority (69.6%) of projects having no water rights, 13% having water rights, and 17.4% were in the process of applying for water rights. The high rate of projects without water rights is of concern, and creates a challenge for sustainability.
Table 10. Water rights
Projects %
Yes 9 13
No 48 69.6
In the process of applying 12 17.4
Total 69 100
3.9 Farm Implements
Mechanization of farming operations is a key to agricultural productivity, as it improves farmer’s efficiency. Different farm implements ranging from hand tools to high-tech machinery complement each other. Results in Table 11 indicates that a majority (52.2%) of projects were using only hand tools without complementing with other implements. Other projects used various types of complementary implements. The use of appropriate implements increased capability, and improved productivity on the farm.
Table 11. Implements
Implements Projects %
Tractor 1 1.4
Tractor, planter, boom spray 5 7.2
Tractor, plough, hand-tools, sprayer 2 2.9
Tractor, plough, hand-tools, bakkie, truck 16 23.2
Tractor, planters, ripper, plough, sprayer/pivot 2 2.9
Hand-tools 36 52.2
Centre pivot, tunnels, tractor, disc, plough 1 1.4
Irrigation system 1 1.4
Tractor, cultivator 1 1.4
Not applicable 4 5.79
Total 69 100
www.ccsenet.org/jas Journal of Agricultural Science Vol. 6, No. 9; 2014
152
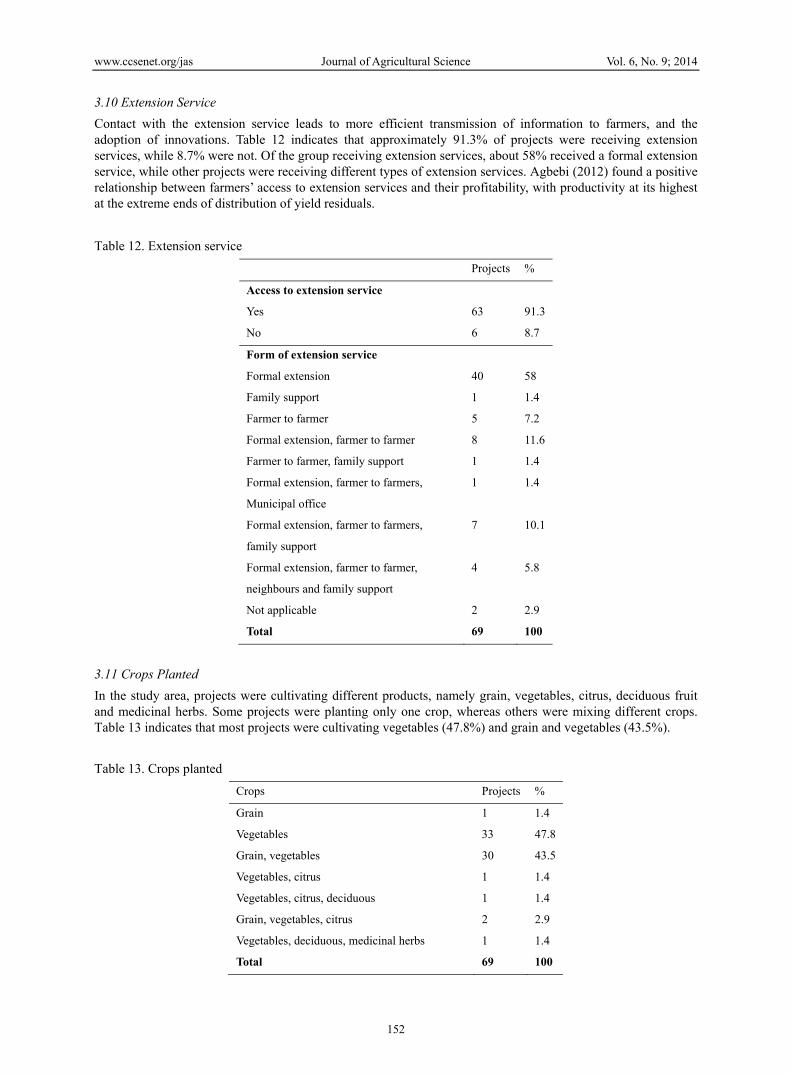
3.10 Extension Service
Contact with the extension service leads to more efficient transmission of information to farmers, and the adoption of innovations. Table 12 indicates that approximately 91.3% of projects were receiving extension services, while 8.7% were not. Of the group receiving extension services, about 58% received a formal extension service, while other projects were receiving different types of extension services. Agbebi (2012) found a positive relationship between farmers’ access to extension services and their profitability, with productivity at its highest at the extreme ends of distribution of yield residuals.
Table 12. Extension service
Projects %
Access to extension service
Yes 63 91.3
No 6 8.7
Form of extension service
Formal extension 40 58
Family support 1 1.4
Farmer to farmer 5 7.2
Formal extension, farmer to farmer 8 11.6
Farmer to farmer, family support 1 1.4
Formal extension, farmer to farmers,
Municipal office
1 1.4
Formal extension, farmer to farmers,
family support
7 10.1
Formal extension, farmer to farmer,
neighbours and family support
4 5.8
Not applicable 2 2.9
Total 69 100
3.11 Crops Planted
In the study area, projects were cultivating different products, namely grain, vegetables, citrus, deciduous fruit and medicinal herbs. Some projects were planting only one crop, whereas others were mixing different crops. Table 13 indicates that most projects were cultivating vegetables (47.8%) and grain and vegetables (43.5%).
Table 13. Crops planted
Crops Projects %
Grain 1 1.4
Vegetables 33 47.8
Grain, vegetables 30 43.5
Vegetables, citrus 1 1.4
Vegetables, citrus, deciduous 1 1.4
Grain, vegetables, citrus 2 2.9
Vegetables, deciduous, medicinal herbs 1 1.4
Total 69 100
www.ccsenet.org/jas Journal of Agricultural Science Vol. 6, No. 9; 2014
153
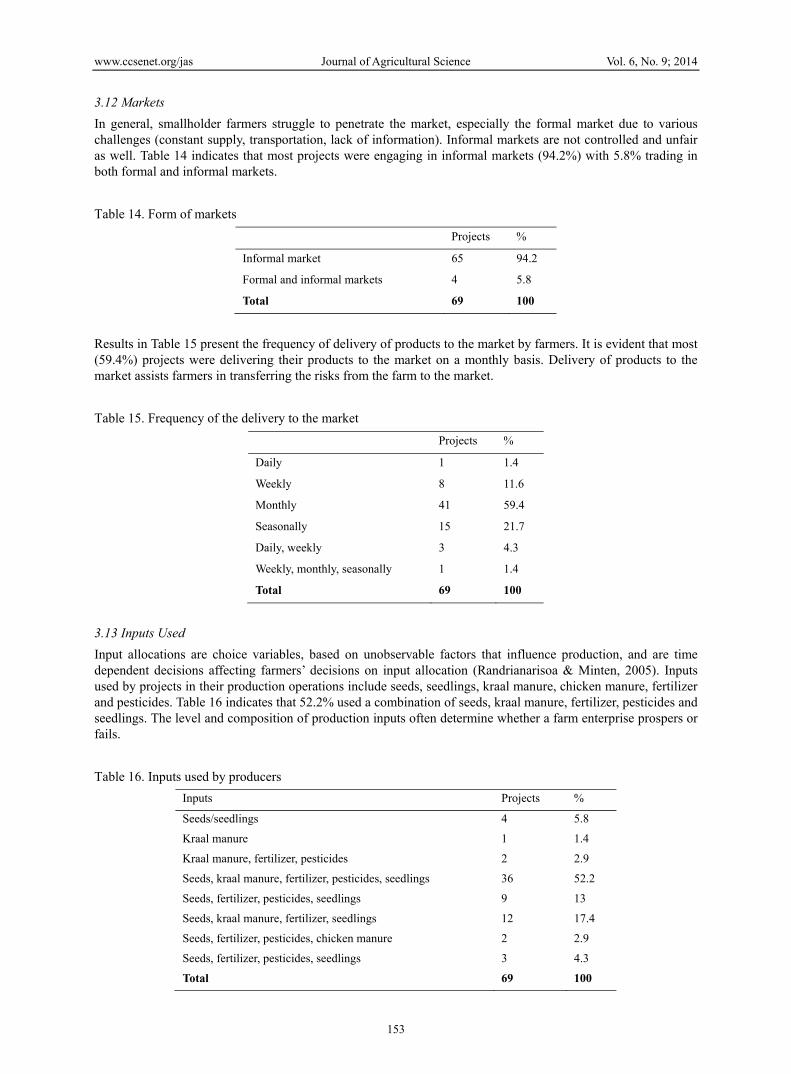
3.12 Markets
In general, smallholder farmers struggle to penetrate the market, especially the formal market due to various challenges (constant supply, transportation, lack of information). Informal markets are not controlled and unfair as well. Table 14 indicates that most projects were engaging in informal markets (94.2%) with 5.8% trading in both formal and informal markets.
Table 14. Form of markets
Projects %
Informal market 65 94.2
Formal and informal markets 4 5.8
Total 69 100
Results in Table 15 present the frequency of delivery of products to the market by farmers. It is evident that most (59.4%) projects were delivering their products to the market on a monthly basis. Delivery of products to the market assists farmers in transferring the risks from the farm to the market.
Table 15. Frequency of the delivery to the market
Projects %
Daily 1 1.4
Weekly 8 11.6
Monthly 41 59.4
Seasonally 15 21.7
Daily, weekly 3 4.3
Weekly, monthly, seasonally 1 1.4
Total 69 100
3.13 Inputs Used
Input allocations are choice variables, based on unobservable factors that influence production, and are time dependent decisions affecting farmers’ decisions on input allocation (Randrianarisoa & Minten, 2005). Inputs used by projects in their production operations include seeds, seedlings, kraal manure, chicken manure, fertilizer and pesticides. Table 16 indicates that 52.2% used a combination of seeds, kraal manure, fertilizer, pesticides and seedlings. The level and composition of production inputs often determine whether a farm enterprise prospers or fails.
Table 16. Inputs used by producers
Inputs Projects %
Seeds/seedlings 4 5.8
Kraal manure 1 1.4
Kraal manure, fertilizer, pesticides 2 2.9
Seeds, kraal manure, fertilizer, pesticides, seedlings 36 52.2
Seeds, fertilizer, pesticides, seedlings 9 13
Seeds, kraal manure, fertilizer, seedlings 12 17.4
Seeds, fertilizer, pesticides, chicken manure 2 2.9
Seeds, fertilizer, pesticides, seedlings 3 4.3
Total 69 100
www.ccsenet.org/jas Journal of Agricultural Science Vol. 6, No. 9; 2014
154
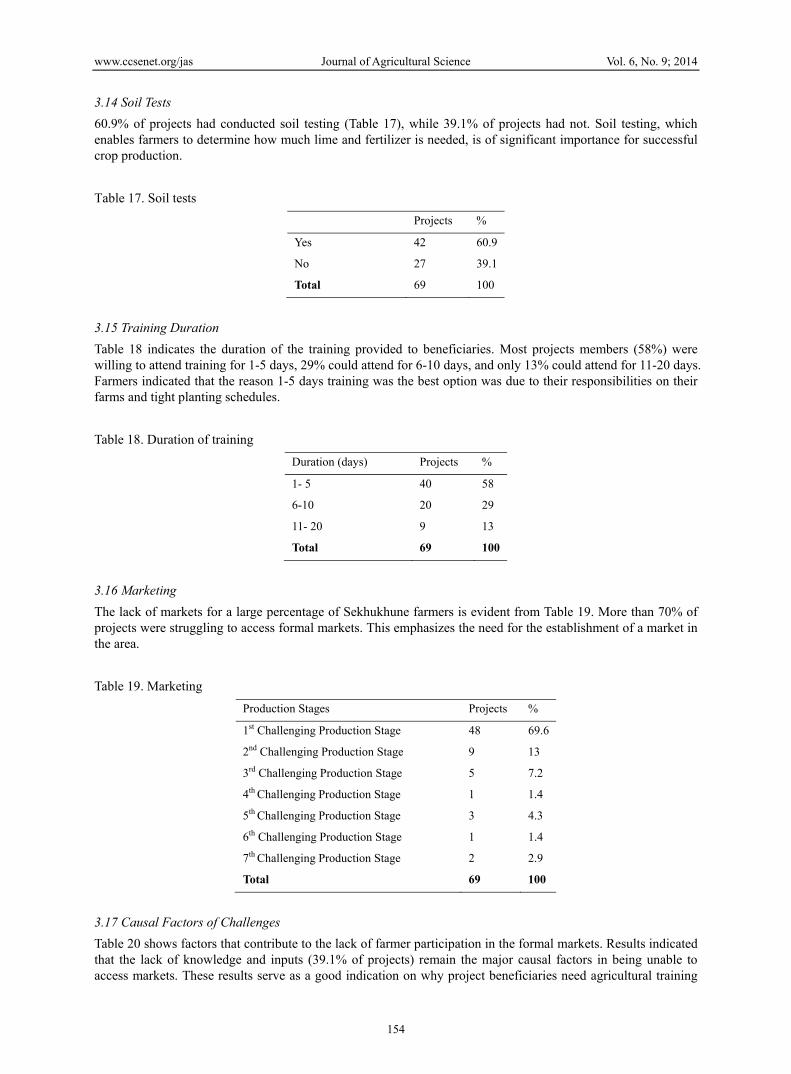
3.14 Soil Tests
60.9% of projects had conducted soil testing (Table 17), while 39.1% of projects had not. Soil testing, which enables farmers to determine how much lime and fertilizer is needed, is of significant importance for successful crop production.
Table 17. Soil tests
Projects %
Yes 42 60.9
No 27 39.1
Total 69 100
3.15 Training Duration
Table 18 indicates the duration of the training provided to beneficiaries. Most projects members (58%) were willing to attend training for 1-5 days, 29% could attend for 6-10 days, and only 13% could attend for 11-20 days. Farmers indicated that the reason 1-5 days training was the best option was due to their responsibilities on their farms and tight planting schedules.
Table 18. Duration of training
Duration (days) Projects %
1- 5 40 58
6-10 20 29
11- 20 9 13
Total 69 100
3.16 Marketing
The lack of markets for a large percentage of Sekhukhune farmers is evident from Table 19. More than 70% of projects were struggling to access formal markets. This emphasizes the need for the establishment of a market in the area.
Table 19. Marketing
Production Stages Projects %
1st Challenging Production Stage 48 69.6
2nd Challenging Production Stage 9 13
3rd Challenging Production Stage 5 7.2
4th Challenging Production Stage 1 1.4
5th Challenging Production Stage 3 4.3
6th Challenging Production Stage 1 1.4
7th Challenging Production Stage 2 2.9
Total 69 100
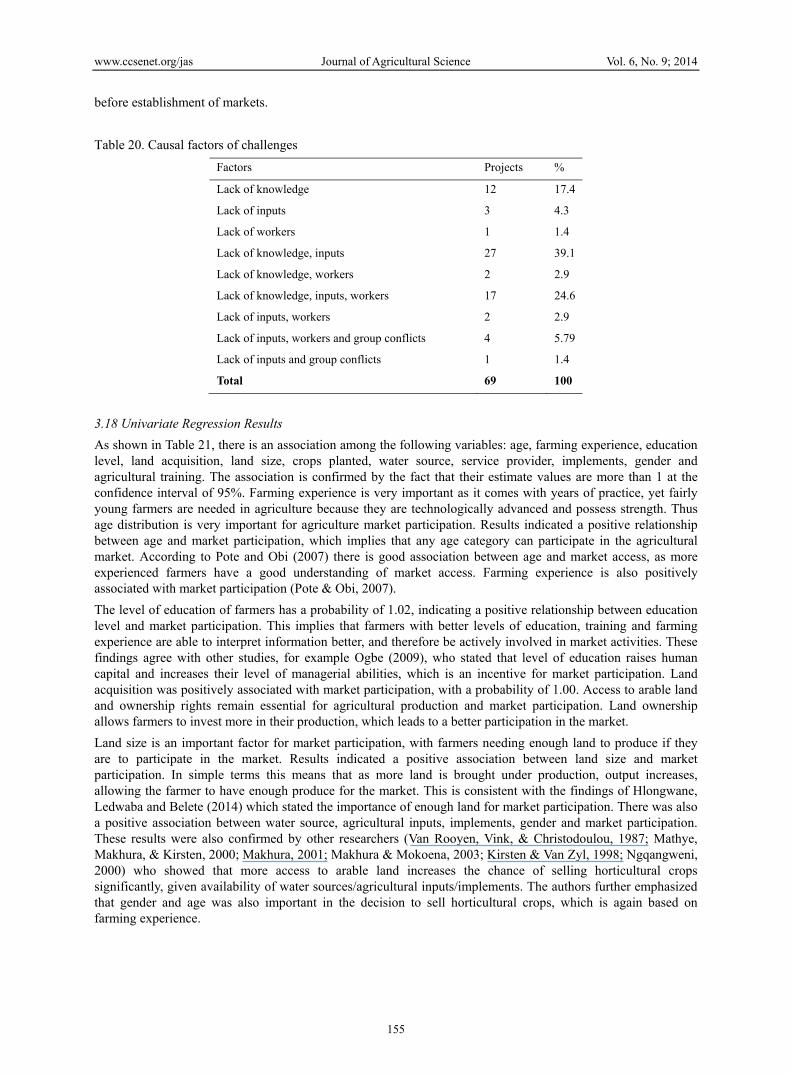
3.17 Causal Factors of Challenges
Table 20 shows factors that contribute to the lack of farmer participation in the formal markets. Results indicated that the lack of knowledge and inputs (39.1% of projects) remain the major causal factors in being unable to access markets. These results serve as a good indication on why project beneficiaries need agricultural training
www.ccsenet.org/jas Journal of Agricultural Science Vol. 6, No. 9; 2014
155
before establishment of markets.
Table 20. Causal factors of challenges
Factors Projects %
Lack of knowledge 12 17.4
Lack of inputs 3 4.3
Lack of workers 1 1.4
Lack of knowledge, inputs 27 39.1
Lack of knowledge, workers 2 2.9
Lack of knowledge, inputs, workers 17 24.6
Lack of inputs, workers 2 2.9
Lack of inputs, workers and group conflicts 4 5.79
Lack of inputs and group conflicts 1 1.4
Total 69 100
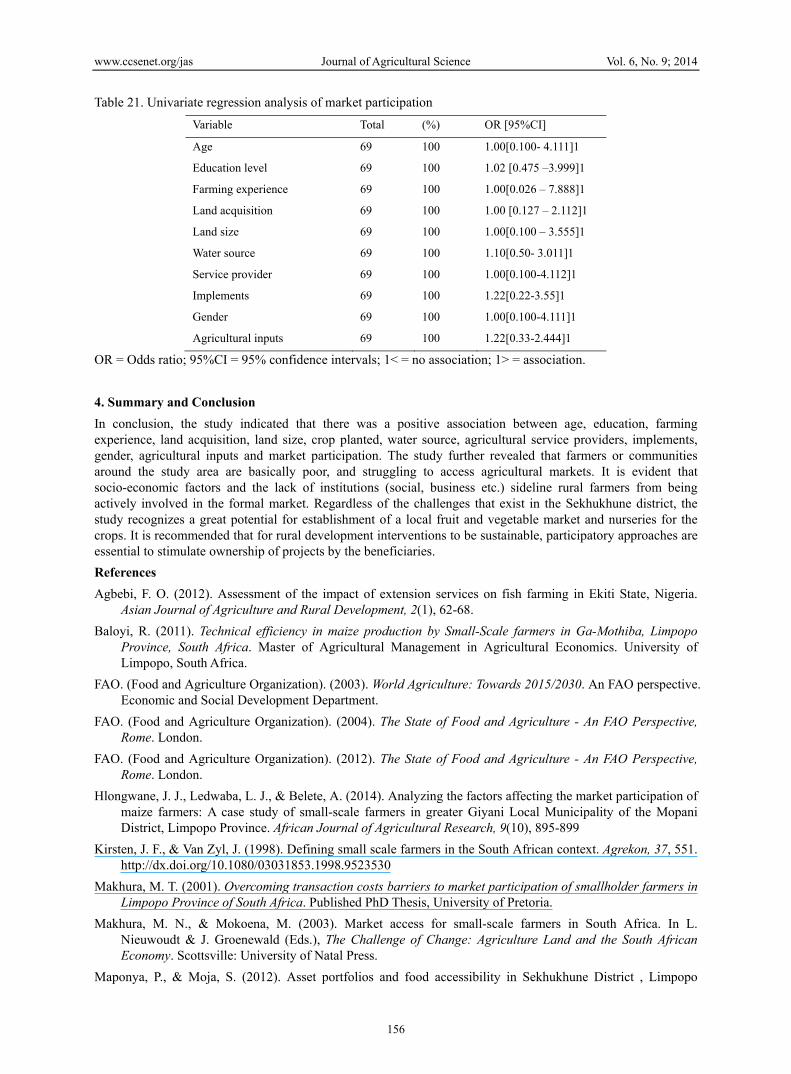
3.18 Univariate Regression Results
As shown in Table 21, there is an association among the following variables: age, farming experience, education level, land acquisition, land size, crops planted, water source, service provider, implements, gender and agricultural training. The association is confirmed by the fact that their estimate values are more than 1 at the confidence interval of 95%. Farming experience is very important as it comes with years of practice, yet fairly young farmers are needed in agriculture because they are technologically advanced and possess strength. Thus age distribution is very important for agriculture market participation. Results indicated a positive relationship between age and market participation, which implies that any age category can participate in the agricultural market. According to Pote and Obi (2007) there is good association between age and market access, as more experienced farmers have a good understanding of market access. Farming experience is also positively associated with market participation (Pote & Obi, 2007).
The level of education of farmers has a probability of 1.02, indicating a positive relationship between education level and market participation. This implies that farmers with better levels of education, training and farming experience are able to interpret information better, and therefore be actively involved in market activities. These findings agree with other studies, for example Ogbe (2009), who stated that level of education raises human capital and increases their level of managerial abilities, which is an incentive for market participation. Land acquisition was positively associated with market participation, with a probability of 1.00. Access to arable land and ownership rights remain essential for agricultural production and market participation. Land ownership allows farmers to invest more in their production, which leads to a better participation in the market.
Land size is an important factor for market participation, with farmers needing enough land to produce if they are to participate in the market. Results indicated a positive association between land size and market participation. In simple terms this means that as more land is brought under production, output increases, allowing the farmer to have enough produce for the market. This is consistent with the findings of Hlongwane, Ledwaba and Belete (2014) which stated the importance of enough land for market participation. There was also a positive association between water source, agricultural inputs, implements, gender and market participation. These results were also confirmed by other researchers (Van Rooyen, Vink, & Christodoulou, 1987; Mathye, Makhura, & Kirsten, 2000; Makhura, 2001; Makhura & Mokoena, 2003; Kirsten & Van Zyl, 1998; Ngqangweni, 2000) who showed that more access to arable land increases the chance of selling horticultural crops significantly, given availability of water sources/agricultural inputs/implements. The authors further emphasized that gender and age was also important in the decision to sell horticultural crops, which is again based on farming experience.
www.ccsenet.org/jas Journal of Agricultural Science Vol. 6, No. 9; 2014
156
Table 21. Univariate regression analysis of market participation
Variable Total (%) OR [95%CI]
Age 69 100 1.00[0.100- 4.111]1
Education level 69 100 1.02 [0.475 –3.999]1
Farming experience 69 100 1.00[0.026 – 7.888]1
Land acquisition 69 100 1.00 [0.127 – 2.112]1
Land size 69 100 1.00[0.100 – 3.555]1
Water source 69 100 1.10[0.50- 3.011]1
Service provider 69 100 1.00[0.100-4.112]1
Implements 69 100 1.22[0.22-3.55]1
Gender 69 100 1.00[0.100-4.111]1
Agricultural inputs 69 100 1.22[0.33-2.444]1
OR = Odds ratio; 95%CI = 95% confidence intervals; 1< = no association; 1> = association.
4. Summary and Conclusion
In conclusion, the study indicated that there was a positive association between age, education, farming experience, land acquisition, land size, crop planted, water source, agricultural service providers, implements, gender, agricultural inputs and market participation. The study further revealed that farmers or communities around the study area are basically poor, and struggling to access agricultural markets. It is evident that socio-economic factors and the lack of institutions (social, business etc.) sideline rural farmers from being actively involved in the formal market. Regardless of the challenges that exist in the Sekhukhune district, the study recognizes a great potential for establishment of a local fruit and vegetable market and nurseries for the crops. It is recommended that for rural development interventions to be sustainable, participatory approaches are essential to stimulate ownership of projects by the beneficiaries.
References
Agbebi, F. O. (2012). Assessment of the impact of extension services on fish farming in Ekiti State, Nigeria. Asian Journal of Agriculture and Rural Development, 2(1), 62-68.
Baloyi, R. (2011). Technical efficiency in maize production by Small-Scale farmers in Ga-Mothiba, Limpopo Province, South Africa. Master of Agricultural Management in Agricultural Economics. University of Limpopo, South Africa.
FAO. (Food and Agriculture Organization). (2003). World Agriculture: Towards 2015/2030. An FAO perspective. Economic and Social Development Department.
FAO. (Food and Agriculture Organization). (2004). The State of Food and Agriculture - An FAO Perspective, Rome. London.
FAO. (Food and Agriculture Organization). (2012). The State of Food and Agriculture - An FAO Perspective, Rome. London.
Hlongwane, J. J., Ledwaba, L. J., & Belete, A. (2014). Analyzing the factors affecting the market participation of maize farmers: A case study of small-scale farmers in greater Giyani Local Municipality of the Mopani District, Limpopo Province. African Journal of Agricultural Research, 9(10), 895-899
Kirsten, J. F., & Van Zyl, J. (1998). Defining small scale farmers in the South African context. Agrekon, 37, 551. http://dx.doi.org/10.1080/03031853.1998.9523530
Makhura, M. T. (2001). Overcoming transaction costs barriers to market participation of smallholder farmers in Limpopo Province of South Africa. Published PhD Thesis, University of Pretoria.
Makhura, M. N., & Mokoena, M. (2003). Market access for small-scale farmers in South Africa. In L. Nieuwoudt & J. Groenewald (Eds.), The Challenge of Change: Agriculture Land and the South African Economy. Scottsville: University of Natal Press.
Maponya, P., & Moja, S. (2012). Asset portfolios and food accessibility in Sekhukhune District , Limpopo
www.ccsenet.org/jas Journal of Agricultural Science Vol. 6, No. 9; 2014
157
Province. Journal of Agricultural Science, 4(12), 144-153.
Mathye, M. M., Makhura, M. T., & Kirsten, J. F. (2000). Transaction costs in the marketing of bananas:explaining market participation of smallholders in the Northern Province. Paper presented at the 38th annual AEASA conference. Sun City 27-29, September 2000.
Ngqangweni, S. (2000). Promoting income and employment growth in the rural economy of Eastern Cape through smallholder agriculture. PhD Thesis, Pretoria, South Africa.
Ogbe, S. E. (2009). Determinants of microcredit and microfinance outreach to farmers in Abia State; a case study of national special programme on food security. MSc Thesis, Department of Agricultural Economics, Michael Okpara University of Agriculture, Umudike, Nigeria.
Oladele, O. I. (2011). Contribution of Indigenous Vegetables and Fruits to Poverty Alleviation in Oyo State, Nigeria. Journal of Human Ecology, 34(1), 1-6.
Osci-Bimpch, G. (2013). Building resiliency for upcoming challenges: The need to restore confidence in smallholder farmers. Agriculture Research report (Ghana). Retrieved 15 May, 2014, from http://gh.sendwestafrica.org
Pote, P. T., & Obi, A. (2007). Technical constraints to smallholder agriculture and their implication for market access: Case study of Nkonkobe municipality, Eastern Cape, South Africa. Department of Agricultural Economics and Extension, University of Fort Hare.
Randrianarisoa, C., & Minten, B. (2005). Getting the inputs right for improved agricultural productivity in Madagascar, Which inputs matter and Are the poor different? Agricultural and Poverty in Eastern Africa. World Bank, Washington D.
Simonyan, J. B., Olukosi, J. O., & Omolehin, R. A. (2010). Socio-economic determinants of farmer’s participation in Fadama II project in Kaduna state, Nigeria. Journal of Food and Fiber Production, 1, 592-601.
StatsSA. (Statistics South Africa). (2011). Community survey 2007. Statistics South Africa, Pretoria.
Van Rooyen, C. J., Vink, N., & Christodoulou, N. T. (1987). Access to the agricultural market for small farmers in Southern Africa: the farmer support programme. Development Southern Africa, 4(2), 207-223. http://dx.doi.org/10.1080/03768358708439312
Copyrights
Copyright for this article is retained by the author(s), with first publication rights granted to the journal.
This is an open-access article distributed under the terms and conditions of the Creative Commons Attribution license (http://creativecommons.org/licenses/by/3.0/).
Related Documents