The Essentials of Long The Essentials of Long Combination Vehicles Combination Vehicles Presented to FHWA Talking Freight May 20, 2009 John Woodrooffe

The Essentials of Long Combination Vehicles Presented to FHWA Talking Freight May 20, 2009 John Woodrooffe.
Dec 28, 2015
Welcome message from author
This document is posted to help you gain knowledge. Please leave a comment to let me know what you think about it! Share it to your friends and learn new things together.
Transcript

The Essentials of Long The Essentials of Long Combination Vehicles Combination Vehicles
Presented toFHWA Talking Freight
May 20, 2009
John Woodrooffe
Probability of crash/exposure
Exposure
Proba
bilit
y of
inju
ry/c
rash
Goal: To Shrink the “ICE” cube
Injuries
Crashes
Exposure

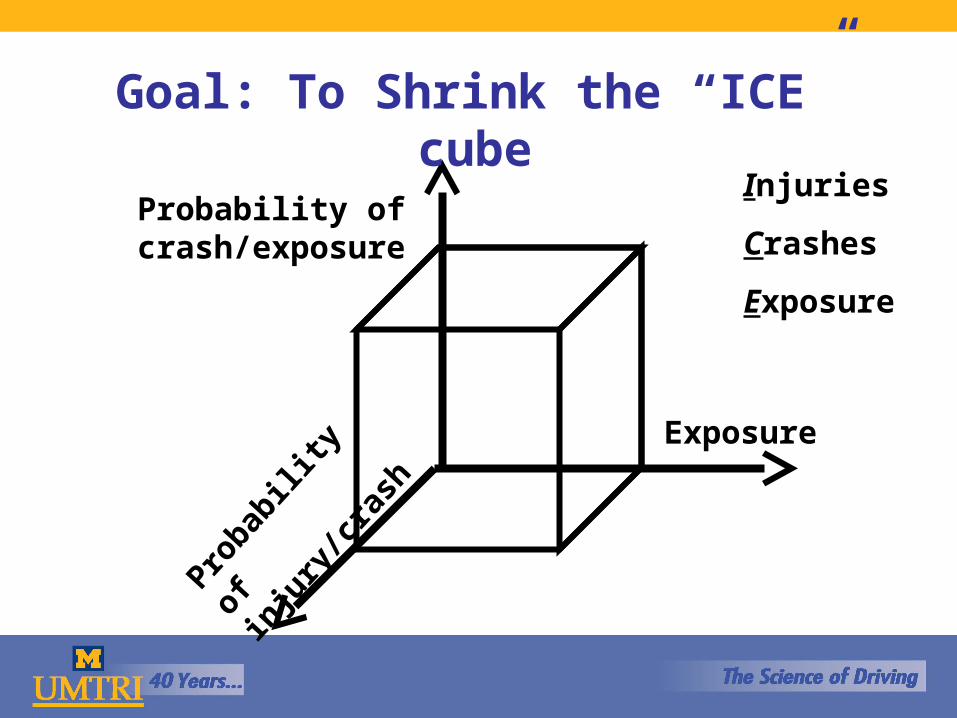
Technology
Human Policy
Transport Efficiency & Safety
Contribution to SafetyContribution to Safety
Time
Sa
fety
Be
nefit
Pre
sent
tim
e
Human
Technology
PolicyState, NHTSA, FMCSA
FHWA, Fleet

The LCV TaskThe LCV Task
Differentiate between the low density cube limited freight task and the high density mass limited freight task Vehicles are very different Efficiencies and benefits are very different
This discussion focuses on the cube limited freight task - LCVs

Vehicle Dynamic PerformanceVehicle Dynamic Performance
Performance based methods exist to evaluate vehicle dynamic behavior
Coupling methods have a significant influence on vehicle stability performance
Longer trailers tend to be less dynamically sensitive

A-Train
B-Train
C-TrainC-Train

KEY PERFORMANCE MEASURESKEY PERFORMANCE MEASURES
Steady-state roll stability rearward amplification load transfer ratio high-seed offtracking high-speed transient offtracking high speed friction utilization low-speed offtracking low-speed friction utilization

Load Transfer Ratio
0.5447
0.919
0.5599
0.524
0.533
0.6118
1
0.298
0.628
0.742
0.598
0.271
0 0.1 0.2 0.3 0.4 0.5 0.6 0.7 0.8 0.9 1
Tractor Semi Trailer 80,000 lbs
STAA Double 80,000 lbs
Turnpike Double 45' 129,000 lbs
Turnpike Double 48' 129,000 lbs
Rocky MD 117,000 lbs
Rocky MD 113,000 lbs
Triple A-train 118,500 lbs
Triple C-train 118,500 lbs
Truck Tank Trailer 114,300 lbs
Truck Tank Trailer ext 114,300 lbs
Rocky MD tanker 117,000 lbs
B-train tanker 117,000 lbs
Better <<< Load Transfer Ratio
FailPass

Load Transfer Ratio vs Total Payload Length
0.2
0.4
0.6
0.8
50 55 60 65 70 75 80
Total Payload Length (ft)
Load
Tra
nsfe
r R
atio

Load Transfer Ratio vs GVW
0.2
0.4
0.6
0.8
100000 110000 120000 130000
Gross Vehicle Weight (lbs)
Load
Tra
nsfe
r R
atio
For Varying GVW Conditions Tied to the Bridge Formula

Surplus Brake CapacitySurplus Brake Capacity
0
10
20
30
40
30,000 40,000 50,000 60,000
Gross Vehicle Weight (kg)
Bra
ke S
urpl
us (
%)

0
10
20
30
40
50
60
All LCVs Tractor semi
Cra
sh ra
te p
er 1
00 m
illion
km
Fatal
Injury
PDO
LCV Safety Performance LCV Safety Performance (benefits are strongly linked to policy)(benefits are strongly linked to policy)
Source: Alberta LCV Safety Study
(Woodrooffe & Associates)

Alberta Study ConclusionsAlberta Study Conclusions
The Alberta LCV fleet crash rate is 5 times better than tractor semi-trailers
The LCV safety improvement is attributed to special permit road transport policy
42% of LCV collisions occurred under adverse conditions
Further improvements in safety performance of LCV’s can be expected if more aggressive weather restrictions were applied

Special Permit ManagementSpecial Permit Management
Acceptance into the program require a minimum performance threshold
Require special safety technologies on vehicle Regular incident reporting by carriers important
to ensure maximum benefit Highway safety and weight violation information
linked to performance evaluation Meaningful enforcement is essential The system should foster pride – it should be
seen as a privilege and not a right

Best Practice Managed LCV BenefitsBest Practice Managed LCV Benefits
Factors Benefit
Truck VMT reduction 44%
Cost saving to shipper 29%
Reduction in fuel, CO2 and NOX emissions 32%
Reduction in road consumption 40%
Exposure crash reduction 44%
Policy affected crash rate reduction (excluding VMT exposure reduction benefits)
5 times

What we have learnedWhat we have learned Managed LCV operations have a significantly better safety
record than normal trucks (5 – 7 times) Other benefits include:
Reduced fuel use (strategically significant 30% ) Reduced emissions CO2 and NOX (30%) Reduction in road consumption 40% Truck VMT reduction 44%
• Congestion benefits• Driver shortage & training benefits
Societal value of the LCV is very high with wide ranging benefits including environmental impact, fuel supply and safety.

Friendly Truck Vehicle TechnologiesFriendly Truck Vehicle TechnologiesAdd More BenefitsAdd More Benefits
Roll Stability Systems and Electronic Stability Systems
Lane Departure Warning Systems
Forward Collision Warning Systems with Adaptive Cruise Control
23
1
2
31
4
4
Vehicle diagnostic and location systems

Applying Cost-Benefit MethodologyApplying Cost-Benefit Methodology- - Defining Societal ValueDefining Societal Value - -
Indirect Benefits
AnticipatedPayback Period
and ROI
Total CostsTotal Benefits
Direct Savings
Number ofcrashes
Preventableby LDWS
Cost of Crashes
Improved Competitiveness
Driver Retention& Training costs
Reduced Insurance Cost
Indirect Benefits
AnticipatedNational Transport
Efficiency Gain
Total CostsTotal Benefits
Direct Savings
Value ofcrashes
Prevented
Fuel, Operation, Maintenance & Road Savings
Improved Competitiveness
Reduced Carbon & Emissions
ReducedCongestion

Conclusion - Possible U.S. ApplicationConclusion - Possible U.S. Application Create a special “friendly truck” category Vehicles must comply with performance measure Fitted with advanced technologies (ESC, forward
collision, speed limiters, active driver and vehicle monitoring devices)
Like all moving and vehicle violations monitored and referenced
Minimum driver experience requirements Expect a factor of 10 reduction in crash rates for
this vehicle class compared with tractor semi-trailer

More InformationMore Information
OECD Study – Heavy Vehicles: Operational and productivity Improvements Safety and productivity analysis – 40 vehicles
from 10 countries Effects of regulatory measures Possible regulatory and operational
improvements
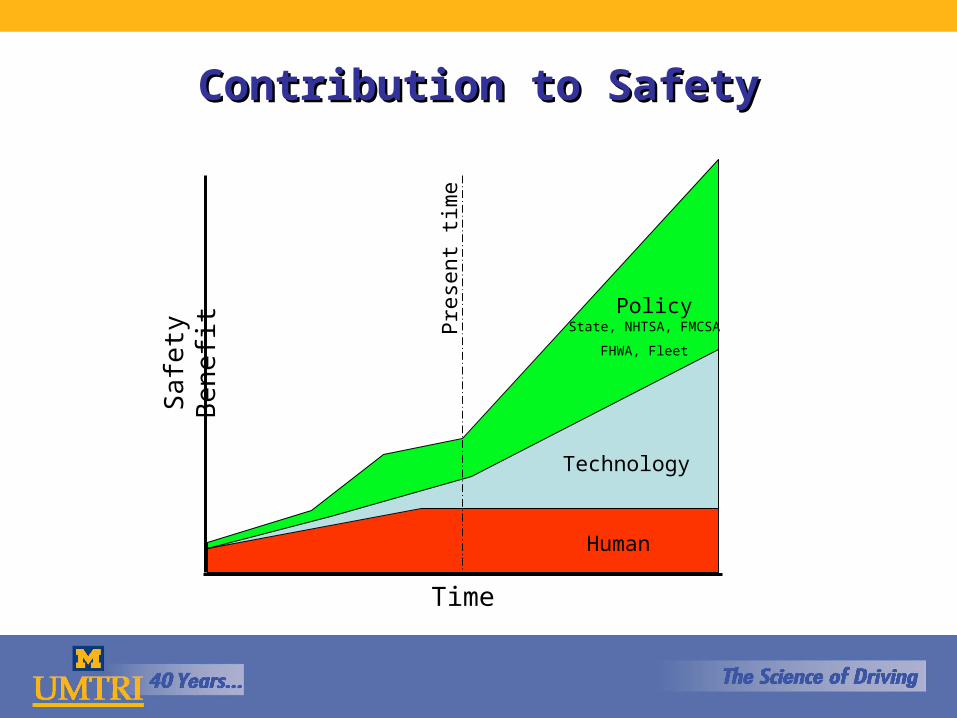
International conference on efficient, safe International conference on efficient, safe and sustainable truck transportation systemsand sustainable truck transportation systems
At UMTRI June 15, 16 & 17At UMTRI June 15, 16 & 17
www.magictrucks.orgwww.magictrucks.org
Related Documents