THE EPIDEMIOLOGY AND OUTCOMES OF CRITICAL ILLNESS IN MANITOBA April 2012 Manitoba Centre for Health Policy Department of Community Health Sciences Faculty of Medicine, University of Manitoba Authors: Allan Garland, MD, MA Randy Fransoo, PhD Kendiss Olafson, MD, MPH Clare Ramsey, MD, MSc Marina Yogendren, MSc Daniel Chateau, PhD Kari-Lynne McGowan, MSc

Welcome message from author
This document is posted to help you gain knowledge. Please leave a comment to let me know what you think about it! Share it to your friends and learn new things together.
Transcript

THE EPIDEMIOLOGY AND OUTCOMES OF CRITICAL ILLNESS IN MANITOBAApril 2012
Manitoba Centre for Health PolicyDepartment of Community Health SciencesFaculty of Medicine, University of Manitoba
Authors: Allan Garland, MD, MA Randy Fransoo, PhD Kendiss Olafson, MD, MPH Clare Ramsey, MD, MSc Marina Yogendren, MSc Daniel Chateau, PhD Kari-Lynne McGowan, MSc

This report is produced and published by the Manitoba Centre for Health Policy (MCHP). It is also available in PDF format on our website at: http://mchp-appserv.cpe.umanitoba.ca/deliverablesList.html
Information concerning this report or any other report produced by MCHP can be obtained by contacting:
Manitoba Centre for Health Policy Dept. of Community Health SciencesFaculty of Medicine, University of Manitoba4th Floor, Room 408727 McDermot AvenueWinnipeg, Manitoba, CanadaR3E 3P5
Email: [email protected] Phone: (204) 789-3819 Fax: (204) 789-3910
How to cite this report:
Garland A, Fransoo R, Olafson K, Ramsey C, Yogendren M, Chateau D, McGowan K. The Epidemiology and Outcomes of Critical Illness in Manitoba. Winnipeg, MB: Manitoba Centre for Health Policy, April 2012.
Legal Deposit:Manitoba Legislative LibraryNational Library of Canada
ISBN 978-1-896489-62-9
©Manitoba HealthThis report may be reproduced, in whole or in part, provided the source is cited.
1st printing (April 2012)
This work was supported through funding provided by the Department of Health of the Province of Manitoba to the University of Manitoba (HIPC # 2008/2009-15). The results and conclusions are those of the authors and no official endorsement by Manitoba Health was intended or should be inferred. Data used in this study are from the Population Health Research Data Repository housed at the Manitoba Centre for Health Policy, University of Manitoba and were derived from data provided by Manitoba Health, WRHA, and the Canadian Census.

i
About the Manitoba Centre For Health Policy
The Manitoba Centre for Health Policy (MCHP) is located within the Department of Community Health Sciences, Faculty of Medicine, University of Manitoba. The mission of MCHP is to provide accurate and timely information to healthcare decision–makers, analysts and providers, so they can offer services which are effective and efficient in maintaining and improving the health of Manitobans. Our researchers rely upon the unique Population Health Research Data Repository (Repository) to describe and explain patterns of care and profiles of illness, and to explore other factors that influence health, including income, education, employment, and social status. This Repository is unique in terms of its comprehensiveness, degree of integration, and orientation around an anonymized population registry.
Members of MCHP consult extensively with government officials, healthcare administrators, and clinicians to develop a research agenda that is topical and relevant. This strength, along with its rigorous academic standards, enables MCHP to contribute to the health policy process. MCHP undertakes several major research projects, such as this one, every year under contract to Manitoba Health. In addition, our researchers secure external funding by competing for research grants. We are widely published and internationally recognized. Further, our researchers collaborate with a number of highly respected scientists from Canada, the United States, Europe, and Australia.
We thank the University of Manitoba, Faculty of Medicine, Health Research Ethics Board for their review of this project. MCHP complies with all legislative acts and regulations governing the protection and use of sensitive information. We implement strict policies and procedures to protect the privacy and security of anonymized data used to produce this report and we keep the provincial Health Information Privacy Committee informed of all work undertaken for Manitoba Health.

ii
AcknowledgementsWe thank the Advisory Group for their input, expertise, and contribution to this research: Dayle Ellis, Bruce Light, Michael Moffat, Bojan Paunovic, Charles Penner, Dan Roberts, Betty Lou Rock, Damon Scales, and Marc Silva.
We thank those who helped us organize and understand the data files as they were incorporated into the Repository at MCHP: Gail Grimsen (Health Sciences Centre), Penny Klassen (Manitoba Health), Bev McIntyre (Manitoba Health), Julie Mojica (University of Manitoba Department of Medicine), William Peeler (then at MCHP), and Marc Silva (Manitoba Health). Members of The Need To Know Team also assisted with confirming the Intensive Care Units operating in each Regional Health Authority in Manitoba.
We would like to thank Angela Bailly for editing the document and linking of the data to the created tables and graphs. We would also like to thank the staff at MCHP who contributed to this report: Songul Bozat–Emre, Sara Dueck, Jessica Jarmasz, Ina Koseva, Leanne Rajotte, Stephanie Smith, and Eleanor Van Delden.
Dr. Malcolm Doupe of MCHP provided a detailed review and valuable feedback, as did our external reviewers Dr. Kevin Laupland (University of Calgary) and Dr. Hannah Wunsch (Columbia University).
We acknowledge the Faculty of Medicine Research Ethics Board for their review of this project. The Health Information Privacy Committee of Manitoba Health is kept informed of all MCHP deliverables. The Health Information Privacy Committee number for this project is HIPC 2008/2009 –15. Strict policies and procedures were followed in producing this report to protect the privacy and security of the Repository data.
We acknowledge the financial support of the Department of Health of the Province of Manitoba. The results and conclusions are those of the authors and no official endorsement by Manitoba Health is intended or should be inferred. This report was prepared at the request of Manitoba Health as part of the contract between the University of Manitoba and Manitoba Health.

iii
Table of ContentsAcknowledgements ................................................................................................................................................. ii
Executive Summary ................................................................................................................................................. xvii
Introduction ............................................................................................................................................................. 1
Objective ......................................................................................................................................................................................................1
General Methods ......................................................................................................................................................................................1
Important Technical Note ......................................................................................................................................................................3
Specific Aim 1: Linking the Datasets ...................................................................................................................... 5
Statement of the Specific Aim .............................................................................................................................................................5
Summary of the Specific Aim ..............................................................................................................................................................5
Methods .......................................................................................................................................................................................................5
Results ...........................................................................................................................................................................................................5
Results Part 1: Preliminary Processing of the Hospital Abstracts...................................................................................5
Results Part 2: Preliminary Identification of Linkage between the WICUDB and the Hospital Abstracts .....6
Results Part 3: Addressing the 180 WICUDB Records that Linked to Two Hospital Abstracts ..........................7
Results Part 4: Addressing the 12 WICUDB Records that Linked to Three Hospital Abstracts ...........................7
Results Part 5: Assess How the Linked Records from Parts 2–4 Match on Seven Identifying Variables ........8
Results Part 6: Clarifying Manitoba Residency Status ........................................................................................................9
Specific Aim 2: Validating the Data ........................................................................................................................ 11
Statement of the Specific Aim .............................................................................................................................................................11
Summary of the Specific Aim ..............................................................................................................................................................11
Rationale and Methods ..........................................................................................................................................................................11
Results ...........................................................................................................................................................................................................13
Results Part 1 – Assessment of the Accuracy of Hospital Abstracts to Identify ICU–Containing Hospitalizations .................................................................................................................................................................................13
Results Part 2 – Assessment of the Hospital Abstracts for Identifying the Number of ICU Admissions and the Accuracy of ICU Entry and Separation Timing ....................................................................................................16
Specific Aim 3: Creating Episodes of Hospital and ICU Care ............................................................................... 21
Statement of the Specific Aim .............................................................................................................................................................21
Summary of the Specific Aim ..............................................................................................................................................................21

iv
Methods .......................................................................................................................................................................................................22
Methods Part 1: Constructing Hospital Episodes for Manitobans ................................................................................22
Methods Part 2: Constructing ICU Episodes for Manitobans ..........................................................................................23
Methods Part 3: Constructing Hospital and ICU Episodes for Non–Manitobans ...................................................24
Results ...........................................................................................................................................................................................................25
Results Part 1: Use Hospital Abstracts to Identify ICU Care in Hospitals Not Included in the WICUDB .........25
Results Part 2: Construct Hospital Episodes from Individual Hospital Abstracts for Manitobans ...................27
Results Part 3: Construct ICU Episodes from Individual ICU Records for Manitobans .........................................29
Results Part 4: Construct ICU and Hospital Episodes from Individual Records for Non–Manitobans ...........30
Additional Discussion of Specific Aim 3 ..........................................................................................................................................33
Specific Aim 4: Population–Based Description of ICU Use and ICU Patients ..................................................... 35
Statement of the Specific Aim .............................................................................................................................................................35
Summary of the Specific Aim ..............................................................................................................................................................35
Methods .......................................................................................................................................................................................................36
Methods: Definitions, Preliminary Steps, and General Methods ...................................................................................36
Methods: ICU Bed Use and Estimation of Need for ICU Beds .........................................................................................37
Methods: Patient Characteristics ................................................................................................................................................41
Methods: Chronic Comorbid Health Conditions ................................................................................................................42
Methods: Characteristics of the Acute Illness .......................................................................................................................45
Results ...........................................................................................................................................................................................................46
Results Part 1: ICU Use .....................................................................................................................................................................46
Results Part 2: ICU versus Hospital Use.....................................................................................................................................53
Results Part 3: ICU Patient Count and Bed Use .....................................................................................................................55
Results Part 4 – Patient Characteristics and Population–Based Incidence of ICU Care Among Manitobans ..........................................................................................................................................................................................60
Results Part 5 – Patient Characteristics for Non–Manitobans .........................................................................................73
Results Part 6 – Comorbidities .....................................................................................................................................................74
Results Part 7 – Type and Severity of Acute Illness ..............................................................................................................82
Specific Aim 5: Outcomes and Post–ICU Resource Use ........................................................................................ 103
Statement of the Specific Aim .............................................................................................................................................................103
Summary of the Specific Aim ..............................................................................................................................................................103

v
Methods .......................................................................................................................................................................................................104
Methods: Mortality Outcomes Among Those with ICU Care ..........................................................................................104
Methods: Lengths of Stay ..............................................................................................................................................................104
Methods: Post–Hospital Healthcare Resource Use .............................................................................................................105
Methods: Other Outcomes ...........................................................................................................................................................108
Results ...........................................................................................................................................................................................................108
Results Part 1: Mortality Outcomes ...........................................................................................................................................108
Results Part 2: Length of Stay Outcomes .................................................................................................................................117
Results Part 3: Post–Hospital Resource Use Among Hospital Survivors of Urban ICU Care ...............................127
Specific Aim 6: Assessing for Disparities in Rates of ICU Care ............................................................................. 133
Statement of the Specific Aim .............................................................................................................................................................133
Summary of the Specific Aim ..............................................................................................................................................................133
Rationale and Methods ..........................................................................................................................................................................134
Results ...........................................................................................................................................................................................................137
Discussion ...................................................................................................................................................................................................144
Glossary .................................................................................................................................................................. 147
Reference List ........................................................................................................................................................... 160
Appendix 1: Additional Information Related to Specific Aim 1 .......................................................................... 165
Appendix 2: Additional Information Related to Specific Aim 2 ......................................................................... 167
Appendix 3: Additional Information Related to Specific Aim 3 ......................................................................... 167
Appendix 4: Additional Information Related to Specific Aim 4 ......................................................................... 172
Appendix 5: Additional Information Related to Specific Aim 5 ......................................................................... 176
Appendix 6: Additional Information Related to Specific Aim 6 ......................................................................... 193
Recent MCHP Publications ...................................................................................................................................... 196

vi
List of FiguresFigure 4.1 Number of ICU Episodes by Year .....................................................................................................................49
Figure 4.2 Mean and Median Length of ICU Episodes by Year..................................................................................50
Figure 4.3 Total Number of Days of ICU Care Provided by Year ................................................................................50
Figure 4.4 Unadjusted Rates of ICU Care Among Manitobans, per 1,000 Population, by Year and Sex ..62
Figure 4.5 Unweighted Average Value, 1999/2000–2007/08, of Age–Specific Incidence Rates of ICU Care for Manitobans ........................................................................................................................................................65
Figure 4.6 Selected Age–Specific Incidence Rates of All ICU Care by Year ..........................................................65
Figure 4.7 Age–Adjusted Rates of ICU Care for Manitobans by Income Quintiles ...........................................69
Figure 4.8 APACHE II Acute Physiology Score for ICU Episodes that Began in a Database Hospital by Year .........................................................................................................................................................................96
Figure 5.1 Kaplan–Meier Survival Curves after ICU Care, for Manitobans, over Nine Years (1999/2000–2007/08) ..........................................................................................................................................109
Figure 5.2 Kaplan–Meier Survival Curves after ICU Care, for Manitobans, over Nine Years (1999/2000 – 2007/08), Truncated at 200 days ........................................................................................110
Figure 5.3 Mortality Rates for Manitobans Admitted to ICUs by Year ...................................................................111
Figure 5.4 Unweighted Average Hospital Mortality Rate over Nine Years (1999/2000–2007/08) as a Function of Patient Age for Manitobans Admitted to Manitoba ICUs by Year..............................116
Figure 5.5 Mean and Median Lengths of ICU Episodes for Manitobans by Age ...............................................124
Figure 5.6 Mean and Median Lengths of ICU–Containing Hospital Episodes for Manitobans, by Age ...124
Figure 6.1 Population–Based Rates of Urban ICU Care (per 1,000 Population) by Age and Sex.................138
Figure 6.2 Hospitalization–Based Rates of Urban ICU Care (per 100 Non–Obstetrical Hospitalizations) by Age and Sex ........................................................................................................................................................138
Figure 6.3 Critical Illness–Based Rates of Urban ICU Care (per 100 ICU Admission Pool Members) by Age and Sex .......................................................................................................................................................140
Figure 6.4 Male to Female Ratios of Three Different Rates of Urban ICU Care by Age ....................................140
Figure 6.5 Age–Adjusted Comparison of Population–Based Rates of Urban ICU Care by Income Quintile ................................................................................................................................................141
Figure 6.6 Age–Adjusted Comparison of Critical Illness–Based Rates of Urban ICU Care by Income Quintiles ..............................................................................................................................................142

vii
List of TablesTable 1.1 Interim Summary of Linkage between the Winnipeg ICU Database (WICUDB) and the Hospital Abstracts after Preliminary Processing ........................................................................................6
Table 1.2 Summary of Preliminary Linkage between the Winnipeg ICU Database (WICUDB) Records and the Hospital Abstracts Based on Entry and Separation Dates ....................................................8
Table 1.3 Linkage between the Winnipeg ICU Database (WICUDB) and Hospital Abstracts Using Primary Identifying Variables ............................................................................................................................9
Table 1.4 Final Summary of Linkage between the Winnipeg ICU Database (WICUDB) and the Hospital Abstracts ....................................................................................................................................................................9
Table 1.5 Provincial Residency Status of Linked Winnipeg ICU Database Records and Hospital Abstracts ....................................................................................................................................................................10
Table 2.1 Number of Separate Winnipeg ICU Database (WICUDB) Records Contained Within Hospital Abstracts ....................................................................................................................................................................13
Table 2.2 Performance Parameters for Identification of any ICU Care Within Hospital Abstracts Prior to April 1, 2004 (Pre–2004) ......................................................................................................................................15
Table 2.3 Performance Parameters for Identification of any ICU Care Within Hospital Abstracts After April 1, 2004 (Post–2004) ...................................................................................................................................15
Table 2.4 Sensitivity of the Administrative Data for Identifying ICU Care from the Validation Cohort ..14
Table 2.5 Comparison of the Number of ICU Admissions from Hospital Abstract Service Codes with the Number of ICU Admissions from Winnipeg ICU Database (WICUDB) (Pre–2004) ...............17
Table 2.6 Comparison of the Number of ICU Admissions from Hospital Abstract Special Care Unit (SCU) Codes with the Number of ICU Admissions from the Winnipeg ICU Database (WICUDB) (Post–2004) ...............................................................................................................................................................17
Table 2.7 Pre–2004 Agreement in Timing of ICU Entry and ICU Separation Between the Winnipeg ICU Database (WICUDB) and Hospital Abstracts.......................................................................................18
Table 2.8 Post–2004 Agreement in Timing of ICU Entry and ICU Separation Between the Winnipeg ICU Database (WICUDB)and Hospital Abstracts ................................................................................................18
Table 2.9 Pre–2004 Agreement in Timing of ICU Entry and ICU Separation Between the Winnipeg ICU Database (WICUDB) and Hospital Abstracts ...............................................................................................19
Table 2.10 Post–2004 Agreement in Timing of ICU Entry and ICU Separation Between the Winnipeg ICU Database and the Hospital Abstracts.............................................................................................................19
Table 3.1 Hospitals Containing ICU Beds Not Included in the Winnipeg ICU Database...............................25
Table 3.2 ICU–Containing Hospital Abstracts from Manitoba Hospitals Not Included in the Winnipeg ICU Database ............................................................................................................................................................26
Table 3.3 ICU–Containing Hospital Abstracts by Residency Status and Hospital Type ................................26
Table 3.4 Brandon Regional Health Centre ICU Admissions ....................................................................................27

viii
Table 3.5 ICU–Containing Hospital Abstracts for Manitobans by the Number of ICU Records per Hospital Abstract ....................................................................................................................................................28
Table 3.6 ICU–Containing Hospital Abstracts for Manitobans by Hospital Location ....................................28
Table 3.7 ICU–Containing Hospital Episodes for Manitobans by the Number of Hospital Abstracts per Hospital Episode .....................................................................................................................................................29
Table 3.8 ICU–Containing Hospital Episodes for Manitobans by the Number of ICU Records per Hospital Episode .......................................................................................................................................................................29
Table 3.9 ICU Episodes for Manitobans by the Number of ICU Records per ICU Episode ...........................30
Table 3.10 ICU–Containing Hospital Episodes for Manitobans by the Number of ICU Episodes per Hospital Episode .....................................................................................................................................................30
Table 3.11 ICU–Containing Hospital Abstracts for Non–Manitobans by the Number of ICU Records per Hospital Abstract and Hospital Type ..............................................................................................................31
Table 3.12 ICU Episodes in Non–Database Hospitals for Non–Manitobans by the Number of ICU Records per ICU Episode .......................................................................................................................................................32
Table 3.13 ICU Episodes in Database Hospitals for Non–Manitobans by the Number of ICU Records per ICU Episode ...............................................................................................................................................................32
Table 3.14 ICU–Containing Hospital Episodes in Database Hospitals for Non–Manitobans by the Number of ICU Records and the Number of Hospital Abstracts per Hospital Episode ...............................32
Table 3.15 ICU Episodes and ICU–Containing Hospital Episodes by Provincial Residency Status .............34
Table 3.16 ICU Episodes and ICU–Containing Hospital Episodes Containing Multiple Elements by Provincial Residency Status ...............................................................................................................................34
Table 4.1 Number of Available ICU Beds in Manitoba, 2007/08 ............................................................................39
Table 4.2 Example Comparing Regionalized Daily Peak Bed Occupancy (DPBO) (Method 2) and Hospital–Level DPBO (Method 3) for Calculating Regional ICU Bed Usage Over One Week ..41
Table 4.3 Measures of Comorbidity Used in this Report ...........................................................................................42
Table 4.4 Frequency (Percent) of Charlson Comorbidities for Manitobans at Level of ICU Episodes .....44
Table 4.5 Plx™ Complexity Levels of ICU Episodes by Year ......................................................................................46
Table 4.6 ICU Episodes and ICU–Containing Hospital Episodes by Provincial Residency Status .............47
Table 4.7 ICU Episodes and ICU–Containing Hospital Episodes Containing Multiple Elements by Provincial Residency Status ...............................................................................................................................47
Table 4.8 Number and Length of ICU Episodes by Year and Residency Status ................................................48
Table 4.9 Number and Length of ICU Episodes for Manitobans ............................................................................48
Table 4.10 Number and Length of ICU Episodes for Non–Manitobans .................................................................49
Table 4.11 Cumulative ICU Time by Hospital Location .................................................................................................51

ix
Table 4.12 ICU Length of Stay (LOS) for ICU Episodes with Time in the Intermediate ICU (IICU) at Health Sciences Centre .......................................................................................................................................................51
Table 4.13 Number and Length of ICU Episodes by ICU Type ...................................................................................52
Table 4.14 Hospital and ICU Lengths of Stay (LOS) for ICU–Containing Hospital Episodes ..........................53
Table 4.15 Hospital and ICU Lengths of Stay (LOS) for ICU–Containing Hospital Episodes by Year...........53
Table 4.16 Cumulative ICU and Acute Hospital Lengths of Stay .............................................................................54
Table 4.17 ICU Bed Use According to Yearly Average Bed–Days (Method 1) by Region, 1999/2000–2006/07 ..............................................................................................................................................55
Table 4.18 ICU Bed Use According to Hospital–Level Daily Peak Bed Occupancy (Method 3) by Region, 1999/2000-2006/07 ...............................................................................................................................................56
Table 4.19 ICU Bed Use According to Region-Level Daily Peak Bed Occupancy (Method 2) by Region, 1999/2000–2006/07 ..............................................................................................................................................56
Table 4.20 Provincial ICU Bed Use According to Provincial Daily Peak Bed Occupancy (Method 4), 1999/2000–2006/07 ..............................................................................................................................................57
Table 4.21 Comparison of Four Methods of Assessing ICU Bed Use by Region, 2006/07 ..............................57
Table 4.22 Median Value of Daily Peak Bed Occupancy of ICU Beds Calculated at the Hospital Level (Method 3) by Region, 2006/07 ........................................................................................................................58
Table 4.23 Unadjusted Rates of ICU Care for Manitobans by Year and Sex ..........................................................61
Table 4.24 Unadjusted Rates of ICU Care in Urban Hospitals (Winnipeg and Brandon) for Manitobans by Year and Sex .......................................................................................................................................................61
Table 4.25 Age of Manitobans Admitted to ICUs by Year ............................................................................................62
Table 4.26 Age of Manitobans Admitted to ICUs by Year and Sex ...........................................................................63
Table 4.27 Age Distribution of Manitoban ICU Patients by Year ...............................................................................63
Table 4.28 Age–Specific Rates of ICU Care Among Manitobans by Year ..............................................................64
Table 4.29 Age–Specific Rates of ICU Care in Urban Hospitals (Winnipeg and Brandon) Among Manitobans by Year ...............................................................................................................................................64
Table 4.30 Temporal Trends in Age–Specific Rates of ICU Care forManitobans by Age Groups .................66
Table 4.31 Adjusted Rate of ICU Care for Manitobans by Year and Regional Health Authority (RHA) of Residency ..................................................................................................................................................................67
Table 4.32 Adjusted Rate of ICU Care for Manitobans by Year and Residency Location.................................68
Table 4.33 Adjusted Rate of Urban ICU Care for Manitobans by Year and Residency Location ...................68
Table 4.34 Percentage of Persons Receiving ICU Care Who Had Any Urban ICU Care by Year and Residency Location ...............................................................................................................................................69
Table 4.35 Adjusted Rates of ICU Care for Manitobans by Year and Income Quintiles ...................................70
x
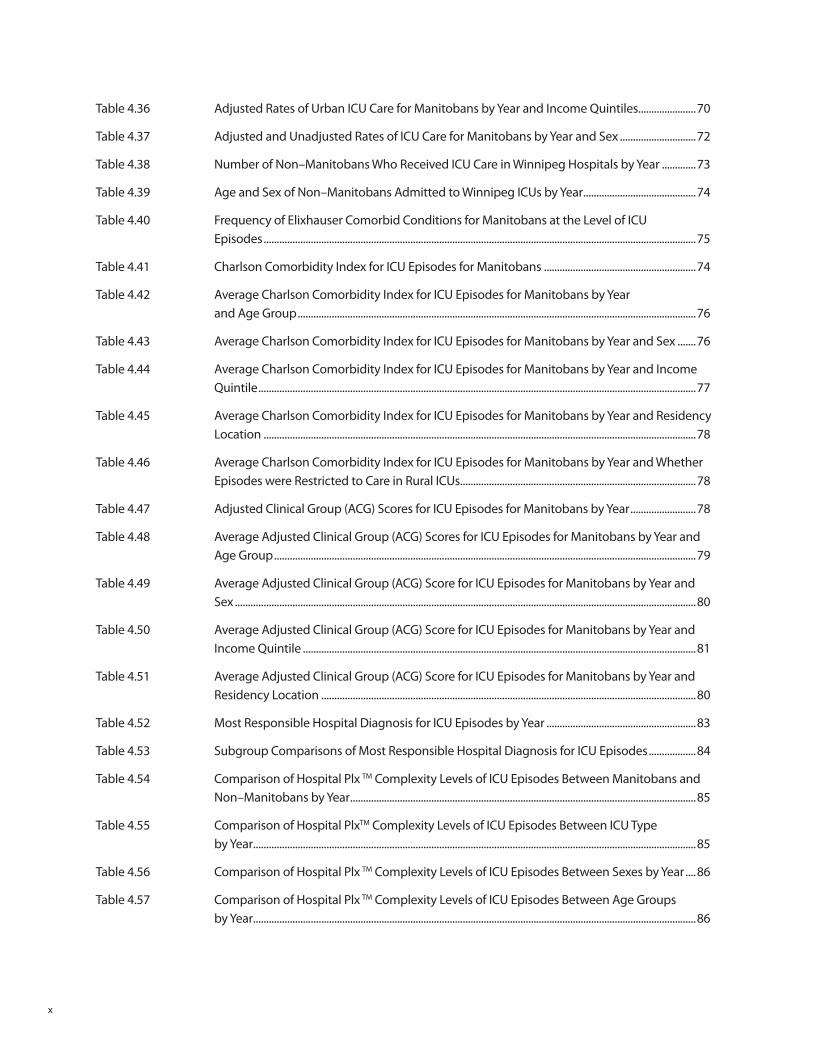
Table 4.36 Adjusted Rates of Urban ICU Care for Manitobans by Year and Income Quintiles......................70
Table 4.37 Adjusted and Unadjusted Rates of ICU Care for Manitobans by Year and Sex .............................72
Table 4.38 Number of Non–Manitobans Who Received ICU Care in Winnipeg Hospitals by Year .............73
Table 4.39 Age and Sex of Non–Manitobans Admitted to Winnipeg ICUs by Year ...........................................74
Table 4.40 Frequency of Elixhauser Comorbid Conditions for Manitobans at the Level of ICU Episodes .....................................................................................................................................................................75
Table 4.41 Charlson Comorbidity Index for ICU Episodes for Manitobans ..........................................................74
Table 4.42 Average Charlson Comorbidity Index for ICU Episodes for Manitobans by Year and Age Group ........................................................................................................................................................76
Table 4.43 Average Charlson Comorbidity Index for ICU Episodes for Manitobans by Year and Sex .......76
Table 4.44 Average Charlson Comorbidity Index for ICU Episodes for Manitobans by Year and Income Quintile .......................................................................................................................................................................77
Table 4.45 Average Charlson Comorbidity Index for ICU Episodes for Manitobans by Year and Residency Location .....................................................................................................................................................................78
Table 4.46 Average Charlson Comorbidity Index for ICU Episodes for Manitobans by Year and Whether Episodes were Restricted to Care in Rural ICUs..........................................................................................78
Table 4.47 Adjusted Clinical Group (ACG) Scores for ICU Episodes for Manitobans by Year .........................78
Table 4.48 Average Adjusted Clinical Group (ACG) Scores for ICU Episodes for Manitobans by Year and Age Group .................................................................................................................................................................79
Table 4.49 Average Adjusted Clinical Group (ACG) Score for ICU Episodes for Manitobans by Year and Sex ................................................................................................................................................................................80
Table 4.50 Average Adjusted Clinical Group (ACG) Score for ICU Episodes for Manitobans by Year and Income Quintile ......................................................................................................................................................81
Table 4.51 Average Adjusted Clinical Group (ACG) Score for ICU Episodes for Manitobans by Year and Residency Location ...............................................................................................................................................80
Table 4.52 Most Responsible Hospital Diagnosis for ICU Episodes by Year .........................................................83
Table 4.53 Subgroup Comparisons of Most Responsible Hospital Diagnosis for ICU Episodes ..................84
Table 4.54 Comparison of Hospital Plx TM Complexity Levels of ICU Episodes Between Manitobans and Non–Manitobans by Year ....................................................................................................................................85
Table 4.55 Comparison of Hospital PlxTM Complexity Levels of ICU Episodes Between ICU Type by Year .........................................................................................................................................................................85
Table 4.56 Comparison of Hospital Plx TM Complexity Levels of ICU Episodes Between Sexes by Year ....86
Table 4.57 Comparison of Hospital Plx TM Complexity Levels of ICU Episodes Between Age Groups by Year .........................................................................................................................................................................86

xi
Table 4.58 Comparison of Hospital Plx TM Complexity Levels of ICU Episodes Between Residency Locations by Year ....................................................................................................................................................86
Table 4.59 Comparison of Hospital Plx TM Complexity Levels of ICU Episodes Between Income Quintiles by Year .........................................................................................................................................................................87
Table 4.60 Percentage of ICU Episodes with Greater then 96 hours of Mechanical Ventilation by Provincial Residency Status, Type of ICU , and Year .......................................................................................................87
Table 4.61 Resource Intensity Weights (RIW TM) of ICU Episodes by Provincial Residency Status, Type of ICU , and Year ............................................................................................................................................................88
Table 4.62 Yearly Counts of ICU Admission Diagnoses by ICD–9 Categories for ICU Episodes that Began in Database Hospitals ................................................................................................................................................90
Table 4.63 Yearly Percentages of ICU Admission Diagnoses by ICD–9 Categories for ICU Episodes that Began in a Database Hospital ...........................................................................................................................91
Table 4.64 Ranking of Primary Reasons for ICU Admission for ICU Episodes that Began in a Database Hospital, Selected Years .......................................................................................................................................92
Table 4.65 Yearly Counts of Selected ICU Admission Diagnoses for ICU Episodes that Began in Database Hospitals ....................................................................................................................................................................93
Table 4.66 Yearly Percentages of Selected ICU Admission Diagnoses for ICU Episodes that Began in a Database Hospital ..................................................................................................................................................94
Table 4.67 Diagnostic Category of ICU Episodes Beginning in Database Hospitals for Manitobans by Year...............................................................................................................................................................................95
Table 4.68 Comparison of ICU and Hospital Diagnostic Category Percentages ................................................95
Table 4.69 APACHE II Acute Physiology Scores and Total APACHE II Scores for ICU Episodes that Began in Database Hospitals by Year ................................................................................................................................97
Table 4.70 Mean APACHE II Acute Physiology Score and Total APACHE II Score for ICU Episodes that Began in Database Hospitals by ICU Admission Diagnosis Category and Year ............................97
Table 4.71 Average APACHE II Acute Physiology Scores for ICU Episodes that Began in Database Hospitals by Sex and Year .......................................................................................................................................................98
Table 4.72 Average APACHE II Acute Physiology Scores for ICU Episodes that Began in Database Hospitals by Sex, ICU Admission Diagnosis Category, and Year .............................................................................98
Table 4.73 Average APACHE II Acute Physiology Scores for ICU Episodes that Began in Database Hospitals by Age Group and Year ........................................................................................................................................99
Table 4.74 Average APACHE II Acute Physiology Score for ICU Episodes that Began in Database Hospitals by Provincial Residency Status and Year .......................................................................................................100
Table 4.75 Average APACHE II Acute Physiology Scores for ICU Episodes that Began in Database Hospitals by Income Quintiles and Year............................................................................................................................100

xii
Table 4.76 Average APACHE II Acute Physiology Scores for ICU Episodes that Began in Database Hospitals by Residency Location and Year .......................................................................................................................101
Table 5.1 Mortality Rates (%) for All Patients (Manitobans and Non–Manitobans) Admitted to Manitoba ICUs by Year ..............................................................................................................................................................110
Table 5.2 Mortality Rates (%) for Manitobans Admitted to Manitoba ICUs by Year .......................................111
Table 5.3 Unadjusted Hospital Mortality Rates (%) of Patients Admitted to ICUs by Manitoba Residency Status and Year ........................................................................................................................................................113
Table 5.4 Unadjusted Hospital Mortality Rates (%) for Manitobans Admitted to Manitoba ICUs by Year ........................................................................................................................................................................113
Table 5.5 Unadjusted Hospital Mortality Rate (%) for Manitobans Admitted to Manitoba ICUs by Year and Residency Location ......................................................................................................................................114
Table 5.6 Unadjusted Hospital Mortality Rate (%) for Manitobans Whose Index ICU Episode Included Any Time in an Urban ICU by Year and Residency Location .................................................................114
Table 5.7 Unadjusted Hospital Mortality Rate (%) for Manitobans Admitted to Manitoba ICUs by Year and Income Quintile .............................................................................................................................................115
Table 5.8 Hospital Mortality Rate (%) for Manitobans Admitted to Manitoba ICUs by Year and Age Group .................................................................................................................................................................115
Table 5.9 Linear Regression Results, for Manitobans, of Yearly Age–Specific Hospital Mortality Rates Versus Time ...............................................................................................................................................................116
Table 5.10 Unadjusted Hospital Mortality Rate (%) for Manitobans Admitted to Manitoba ICUs, Limited to ICU Episodes that Began in Database Hospitals, by Fiscal Year and ICU Admission Diagnosis Type .............................................................................................................................................................................117
Table 5.11 Length of ICU Episodes, in Days, by Year and Provincial Residency Status ....................................117
Table 5.12 Length of ICU–Containing Hospital Episodes, in Days, by Year and Provincial Residency Status ...........................................................................................................................................................................118
Table 5.13 Length of ICU Episodes, in Days, by Year ......................................................................................................119
Table 5.14 Length of ICU–Containing Hospital Episodes, in Days, by Year...........................................................120
Table 5.15 Length of ICU Episodes for Manitobans, in Days, by Year ......................................................................121
Table 5.16 Length of ICU–Containing Hospital Episodes for Manitobans, in Days, by Year ..........................121
Table 5.17 Length of ICU Episodes for Manitobans, in Days, by Year and Sex ....................................................122
Table 5.18 Length of ICU–Containing Hospital Episodes for Manitobans, in Days, by Year and Sex .........122
Table 5.19 Length of ICU Episodes for Manitobans, in Days, by Year and Type of ICU ....................................123
Table 5.20 Length of ICU–Containing Hospital Episodes for Manitobans, in Days, by Year and Type of ICU ...............................................................................................................................................................123

xiii
Table 5.21 Length of ICU Episodes that Began in Database Hospitals, for Manitobans, in Days, by Year and Type of ICU Admission Diagnosis .................................................................................................125
Table 5.22 Length of ICU–Containing Hospital Episodes that Began in Database Hospitals, for Manitobans, in Days, by Year and Type of ICU ............................................................................................125
Table 5.23 Post–Hospital Medical Resource Use in the 365 days after Hospital Discharge for Hospital Episodes that Contained Urban ICU Care ....................................................................................................127
Table 5.24 Home Care Use in the One Year After Hospital Discharge, as a Function of Home Care Status at the Time of Hospital Admission and Whether or not the Hospital EpisodeContained Care in an Urban ICU ..................................................................................................................................................................128
Table 5.25 Comparison of Patients’ Pre–Hospital and Post–Hospital Locations ................................................128
Table 5.26 Comparison of Patients’ Locations Pre–Hospital and Three Months Post–Hospital ...................129
Table 5.27 Comparison of Medical Resource Use in the One Year After Hospital Discharge Between Hospital Episodes that Did and Did Not Include Urban ICU Care ......................................................130
Table 6.1 Comparison of the Three Different Rates of Urban ICU Care by Sex and Age...............................139
Table 6.2 Age–Adjusted Comparison of the Three Different Rates of Urban ICU Care by Residency Location and Year ...................................................................................................................................................143
Appendix Table A1.1 Winnipeg Regional Health Authority Patients Transferred Directly To and/or From a Non–Manitoba Hospital ......................................................................................................................................166
Appendix Table A2 .1 Canadian Institute for Health Information (CIHI) Special Care Unit (SCU) Codes ........................167
Appendix Table A3.1 Designation Codes Used in Hospital Abstracts to Indicate Location of Patients Before and After Hospitalization .............................................................................................................................................167
Appendix Table A3.2 Acute Care Hospitals in Manitoba ...................................................................................................................168
Appendix Table A3.3 Distribution for Manitobans of Time Intervals Separating Successive ICU Records within Hospital Episodes Containing Multiple ICU Records ...............................................................................170
Appendix Table A3.4 Number of ICU–Containing Hospital Abstracts for Hospitals Not Included in the Winnipeg ICU Database ....................................................................................................................................................................170
Appendix Table A3.5 Augmented Summary of Findings Related to ICU Episodes and ICU–Containing Hospital Episodes .....................................................................................................................................................................171
Appendix Table A4.1 Diagnostic Codes from Winnipeg ICU Database .......................................................................................172
Appendix Table A4.2 Unadjusted Rate of ICU Care for Manitobans by Year and Regional Health Authority (RHA) of Residency ..................................................................................................................................................................173
Appendix Table A4.3 Unadjusted Rate of ICU Care for Manitobans by Year and Residency Location ...........................174
Appendix Table A4.4 Unadjusted Rate of Urban ICU Care for Manitobans by Year and Residency Location .............174
Appendix Table A4.5 Unadjusted Rate of ICU Care for Manitobans by Year and Income Quintiles ................................175
Appendix Table A4.6 Unadjusted Rate of Urban ICU Care in for Manitobans by Year and Income Quintiles .............175

xiv
Appendix Table A5.1 Age–Adjusted Hospital Mortality Rates (%) of Patients Admitted to ICUs by Manitoba Residency Status and Year ..................................................................................................................................176
Appendix Table A5.2 Age–Adjusted Hospital Mortality Rates (%) for Manitobans Admitted to Manitoba ICUs by Year .........................................................................................................................................................................176
Appendix Table A5.3 Age–Adjusted Hospital Mortality Rate (%) for Manitobans Admitted to Manitoba ICUs by Year and Residency Location ......................................................................................................................................177
Appendix Table A5.4 Age–Adjusted Hospital Mortality Rate (%) for Manitobans whose Index ICU Episode Included any Time in an Urban ICU by Year and Residency Location ..................................................................177
Appendix Table A5.5 Age–Adjusted Hospital Mortality Rate (%) for Manitobans Admitted to Manitoba ICUs by Year and Income Quintile .............................................................................................................................................178
Appendix Table A5.6 Age–Adjusted Hospital Mortality Rate (%) for Manitobans Admitted to Manitoba ICUs, Limited to ICU Episodes that Began in DBHs, by Year and ICU Admission Diagnosis Type ......................179
Appendix Table A5.7 Unadjusted ICU Mortality Rates (%) for All Patients Admitted to Manitoba ICUs by Year and Provincial Residency Status ...............................................................................................................................179
Appendix Table A5.8 Unadjusted ICU Mortality Rates (%) for Manitobans Admitted to Manitoba ICUs by Year and Type of ICU ................................................................................................................................................................180
Appendix Table A5.9 Unadjusted Mortality Rates (%) at 30 Days After ICU Admission for Manitobans Admitted to Manitoba ICUs by Year and Sex ........................................................................................................................180
Appendix Table A5.10 Unadjusted Mortality Rates (%) at 30 Days After ICU Admission for Manitobans Admitted to Manitoba ICUs by Year and ICU Type .............................................................................................................181
Appendix Table A5.11 Mortality Rates (%) at 30 Days After ICU Admission for Manitobans Admitted to Manitoba ICUs by Year and Age Group ..............................................................................................................................181
Appendix Table A5.12 Linear Regression Results, for Manitobans, of Age–Specific 30–Day Mortality Rates Versus Time (Years) ............................................................................................................................................................182
Appendix Table A5.13 Unadjusted Mortality Rates (%) at 180 Days After ICU Admission for Manitobans Admitted to Manitoba ICUs by Year and Sex .......................................................................................................................182
Appendix Table A5.14 Unadjusted Mortality Rates (%) at 180 Days After ICU Admission for Manitobans Admitted to Manitoba ICUs by Year and ICU Type ...........................................................................................................183
Appendix Table A5.15 Mortality Rates (%) at 180 Days After ICU Admission for Manitobans Admitted to Manitoba ICUs by Year and Age Group ............................................................................................................................183
Appendix Table A5.16 Linear Regression Results, for Manitobans, of Yearly Age–Specific 180–Day Mortality Rates Versus Time (Years) ..............................................................................................................................................184
Appendix Table A5.17 Length of ICU Episodes for Manitobans, in Days, by Year and Age .................................................185
Appendix Table A5.18 Length of ICU–Containing Hospital Episodes for Manitobans, in Days, by Year and Age .....186
Appendix Table A5.19 Annual Medical Resource in the General Population of Manitoba, Aged 17 and Older ........187

xv
Appendix Table A5.20 Linear Regression Models of the Number of Outpatient Physician Visits in the One Year After Hospital Discharge .............................................................................................................................................188
Appendix Table A5.21 Linear Regression Models of Outpatient Pharmacy Expenditures in the One Year After Hospital Discharge .............................................................................................................................................190
Appendix Table A5.22 Zero–Inflated Regression Modelling of Hospital Use in the One Year After Hospital Discharge with Analysis Limited to Initial Hospital Episodes for Each Individual (N=319,465) ...............192
Appendix Table A6.1 Number (Percent) of Deaths Among Manitobans, Aged 17 and Older, Who had been in Identified Palliative Care at any Time During the Two Years Prior to Death by Age Group and Year...............................................................................................................................................................................193
Appendix Table A6.2 Size of the Estimated ICU Admission Pool by Year and Age .................................................................194
Appendix Table A6.3 Comparison of Three Different Rates of Urban ICU Care by Income Quintile ...............................195

xvi
AcronymsACG – Adjusted Clinical GroupAPACHE II – Acute Physiology and Chronic Health Evaluation IIAPS – Acute Physiology ScoreCI – Confidence intervals CIHI – Canadian Institute for Health Information CMG PlxTM – Case Mix Group with Complexity Overlay1
CMGTM – Case Mix Group2
DBH – Database hospitalDPBO – Daily Peak Bed Occupancy DPIN – Drug Prescription Information Network EIAP – Estimated ICU Admission PoolEMS – Emergency Medical ServicesGEE – General Estimating Equations HIM – Health Information Management ICD – 10 – CA – International Classification of Diseases, 10th Revision with Canadian EnhancementsICD – 9 – CM – International Classification of Diseases, 9th Revision with Clinical ModificationsICU – Intensive Care UnitIICU – Intermediate Intensive Care UnitLOS – Length of StayMCHP – Manitoba Centre for Health PolicyOOPUI – Out of Province Unique IdentifierPCH – Personal Care HomePHIN – Personal Health Identification NumberRHA – Regional Health AuthorityRIWTM – Resource Intensity Weight3 SCU – Special Care UnitSES – Socioeconomic StatusWICUDB – Winnipeg Intensive Care Unit DatabaseWRHA – Winnipeg Regional Health Authority
Footnotes1CMG Plx TM is a registered trademark of the Canadian Institute for Health Information2CMGTM is a registered trademark of the Canadian Institute for Health Information3RIW TM is a registered trademark of the Canadian Institute for Health Information

xvii
Executive Summary
ObjectiveThis report was conducted at the Manitoba Centre for Health Policy (MCHP) on behalf of Manitoba Health. Its broad goals were to:
1. Bring the Winnipeg ICU Database into the Population Health Research Data Repository (the Repository) held at the Manitoba Centre for Health Policy
2. Link the Winnipeg ICU Database to administrative health data already held in the Repository3. Do the first comprehensive assessment of the epidemiology and outcomes of ICU care in Manitoba
This report provides a comprehensive, population–based evaluation of the epidemiology and outcomes of care provided in Intensive Care Units (ICUs) among people aged 17 and older in Manitoba, over the nine years from 1999/2000 to 2007/08. The care of critically ill patients occurs primarily in ICUs, and the report concentrates on that care. The report is organized into six Specific Aims; the first three aims describe the process of creating the data infrastructure needed to assess ICU use and outcomes, which are detailed in the final three aims.
The value of this report derives from the importance of ICU care, the assessment of a broad range of endpoints relevant to patients and to society, and the nature of the data. Unlike the data used in most studies of critical illness or ICU care, our population–based data allow determination of incidence (not just number of cases) and mortality (as compared to case–fatality rates or the percent of people with a certain condition who die over a certain period of time); it eliminates concerns about selection bias. In addition, age– and sex–standardization can be performed to allow like–comparison among different regions and time periods.
We limited analyses of ICU pts through Mar 31 2008 because we wanted to look at health service use for one year after ICU admission, and the most recent data available at the start of this project was until March 31, 2009.
Background and RelevanceCritical illness cared for in ICUs is important to people and to society. It is common and increasing in frequency and severity as the population ages. ICU care is expensive and increasingly so. Most importantly, critical illness is associated with much human suffering. Even beyond the death that often results, ICU survivors commonly suffer long–term negative effects on physical, mental, and emotional functioning; decreased quality of life; and declines in economic well–being and social functioning. And in addition to adversely affecting patients, critical illness often has detrimental effects on the loved ones of the patients.
Most research about critical illness and ICU care has used data from one or a few ICUs over limited time periods. Fewer studies have used larger ICU databases; but these are rare and few are population–based. A population–based approach to studying ICU care has important advantages including:
• Greater applicability and generalizability • The ability of large data sets to identify smaller effects • The ability of population–based administrative datasets to address a much wider range of questions than is
possible with other types of data
Our ability to study ICU care is enhanced by the fact that there are no Canadian cities with population over 15,000, nor any Canadian hospital with a trained ICU physician, within 240 kilometers of any of Manitoba’s borders. Accordingly, except for those travelling when they become ill, virtually all Manitobans needing ICU care receive it in Manitoba.

xviii
Data InfrastructureThe two main sources of data for this work were the Winnipeg ICU Database and the Population Health Research Data Repository. The linking of these two sources was highly successful with accurate identification in both data sources exceeding 99%. This linkage produced a powerful tool for studying ICU care that combines the universality and comprehensiveness of administrative data with the detailed clinical information of a clinical database. This tool provides a unique resource, which has enabled the creation of this report, and will make possible future research into critical illness and ICU care in Manitoba.
In the process of linking and validating our data, we showed that information contained in the administrative data (hospital abstracts) was, by itself, highly accurate for identifying ICU care. Since all provinces report common data elements to the Canadian Institute for Health Information, this finding means that policy–makers, administrators, and researchers throughout Canada can reliably use provincial and national administrative health data to identify and quantify aspects of ICU use and care.
ICU Bed SupplyIn 2007/08, Manitoba had 118 designated ICU beds; 82 in the six hospitals in Winnipeg, nine in the Brandon General Hospital, and 27 (23%) distributed in nine rural hospitals. Of these, only the 91 beds in the urban hospitals of Winnipeg and Brandon are staffed by certified ICU physicians and specially trained ICU nurses and are capable of caring indefinitely for critically ill patients requiring artificial life support. The rural ICUs often transfer their sickest patients to urban hospitals.
These 118 ICU beds represent 9.8 beds per 1,000 people, which is lower than the average value of 13.5 per 1,000 people for all of Canada. Although these figures might raise concern about the adequacy of ICU bed supply in Manitoba, in Specific Aim 4 we performed detailed analysis of ICU bed use, taking advantage of the unique data available in Manitoba, and using novel methods to overcome limitations of previous studies. Those analyses showed that in 2007/08, Manitoba’s actual ICU bed use reached full capacity on less than 5% of days in Winnipeg and less than 1% of days in other parts of the province.
One of the striking aspects of ICU bed demand and deciding on the number of ICU beds needed is the large fluctuation in the number of patients needing ICU care from day–to–day and at different locations throughout the province. The issues related to having sufficient capacity to handle sudden increases in bed demand are magnified in times of epidemics requiring increased ICU resources. A notable example is the H1N1 influenza epidemic in 2009/10, which occurred after this report’s study period. Therefore the results in this report provide baseline results against which analyses of that pandemic experience could be compared. Additional considerations relevant to estimating the number of ICU beds needed are discussed in Part 3 of Specific Aim 4.
Volume of ICU Care ProvidedFrom 1999/2000 through 2007/08, ICU care in Manitoba amounted to approximately 6,300 episodes each year, equalling approximately 26,000 patient–days of ICU care per year. Of these, 5% were for non–Manitobans and slightly over half of the non–Manitobans were from Ontario.
Population–Based Rates of ICU CareOver the study period, 0.6% of adult Manitobans were admitted to ICUs each year. This was 0.5% if limited to care in the urban ICUs. This rate increased steeply with age, such that over 2% of Manitobans, aged 75 and older, were admitted to ICUs each year. Of note, the population–based rates of ICU care for Manitobans decreased slightly with time over the nine–year study period, mostly in the first four years.

xix
Repeated need for ICU care was common. One–sixth of ICU episodes were for people who had previously been in a Manitoba ICU during the nine–year study period. Ten percent of people who survived an episode of urban ICU care were readmitted to an urban ICU during the following 12 months.
There were some notable differences in the population–based rates of ICU care between different subgroups (e.g., by sex, age, etc.). Before describing these differences, however, it must be emphasized that while population–based rates of medical care are appropriate measures of use, they are not the most appropriate way to assess for disparities in care, as discussed below.
Differences in Population–Based Rates of ICU Care • There was a marked difference in population–based rates by sex, with men consistently comprising 60% of
ICU patients. This difference has been seen in most prior studies from Canada and elsewhere. • Population–based rates of ICU care increased steeply with advancing age, peaking at approximately age 80,
and then declined as age increased further. This decline in population–based rates of ICU care in the oldest age groups has been reported in data from Calgary, but not in Olmsted County, Minnesota, where the age–specific rates continued to increase in the oldest age group.
• Population–based rates declined over the nine years among patients aged 50 and older. These decreasing rates with time were more marked among those in older age groups.
• Population–based rates of ICU care differed according to income quintile, a proxy for socioeconomic status (SES), with higher rates of ICU use among those living in areas with lower average household income for both urban and rural dwellers. This observation mirrors the relationship between SES and overall hospitalization rates in Manitoba.
A Better Method for Assessing Disparities in ICU CareAs noted above, population–based rates may be misleading to assess for disparities in ICU use, e.g., by sex, area of residence, or SES. For example, if men had higher rates of critical illness, then higher population–based rates of ICU care would be appropriate, and not represent a disparity. Accordingly, we created and evaluated a new way of looking at ICU use—the rate of ICU care relative to the number of persons who “should” have been admitted to ICUs; we refer to this new kind of rate as the critical illness–based rate of ICU care.
There were important differences in the two different kinds of rates of ICU care: • The substantial excess of men over women in population–based rates of ICU care was largely eliminated
when using the more appropriate critical illness–based rates. Concern about sex–related disparities in ICU care is greatly reduced by this finding.
• Population–based rates of ICU care were consistently higher for those in lower income quintiles, but critical illness–based rates showed the opposite relationship of being slightly lower among those in lower income quintiles. This finding is similar to previous research from MCHP which documented lower use of diagnostic imaging among those in lower income quintiles.
• While urban and rural residents did not differ consistently in their population–based rates of ICU care, critical illness–based rates were consistently lower for rural residents.
While these findings demonstrate the necessity of using an appropriate method for evaluating disparities in ICU care, it is important to recognize that such disparities could be due to any combination of three explanations:
1. Insufficient use of ICU care in groups with lower rates2. Excessive use of ICU care in groups with higher rates3. Limited ability of our new critical illness–based rates of ICU care to properly account for important
confounding factors Our findings do not permit us to identify which explanation or explanations account for these findings.

xx
Patient and Illness CharacteristicsThe average age of patients admitted to ICUs was 64 years. As discussed above, men accounted for 60% of ICU patients. Manitobans admitted to ICUs showed substantial burdens of comorbidities—higher than that seen among ICU patients reported elsewhere in Canada.
Cardiovascular conditions were the predominant cause of ICU admissions, comprising approximately 60% of all ICU patients. Other top categories of illness prompting ICU admission were the category that includes consequences of severe infection (12%), followed by respiratory disorders (12%) and trauma/poisonings (7%). The most notable trends over the study period were a substantial decline in ICU admissions related to cardiovascular conditions (consistent with documented decreases in heart attack and stroke rates) and a substantial increase in infections, including sepsis (a consequence of severe infection).
The average severity of acute illness at the time of ICU admission increased slightly over the nine–year study period. Surprisingly, it differed little with age. As measured by the APACHE II Acute Physiology Score, the severity of critical illness in the Winnipeg ICUs was lower than has been described in most, but not all, similar studies from Canada. The low overall scores were largely due to the high number of patients with cardiovascular diagnoses, who on average had low levels of severity.
Mortality RatesApproximately 17% of Manitoba ICU patients died in the hospital, and another 2.7% died within six months. These figures are similar to those reported in Ontario, Alberta, and Austria. There was little in the way of overall time trends in our mortality rates.
Length of Stay in ICUsThe average length of stay (LOS) in ICUs over the study period was 4.1 days. This number increased slowly but steadily over time. In combination with the slight decline in yearly number of ICU episodes, there were 9.7% more ICU bed–days provided in 2007/08 than in 1999/2000, for an average yearly increase of 1.2%. As the median ICU LOS remained relatively stable throughout the study period, the rising mean LOS primarily represents an increase in the number of long–stay patients. Indeed, though only 1% of patients remained in ICU longer than one month, the frequency of such long–stay patients increased over the study period.
Put into the larger perspective of hospital use, in 2007/08, ICU beds accounted for 3.3% of adult acute care hospital beds in the province while ICU care accounted for 2.4% of all acute hospital patient–days. Among hospital episodes that included ICU care, an average of 32% of hospital time was spent in ICU.
Healthcare Use after ICU CareA unique aspect of this report is the analysis of health service use among survivors of urban ICU care. Such use in the 12 months following urban ICU admission was substantial, but remarkably similar to hospitalized patients whose care did not require urban ICU admission. The most notable difference was that urban ICU patients were more likely than non–ICU hospitalized patients to be readmitted to an urban ICU in the year after discharge. Measures of one–year post–discharge physician visits, hospital admission, use of home care, and prescription drugs were remarkably similar between the two groups.
xxi
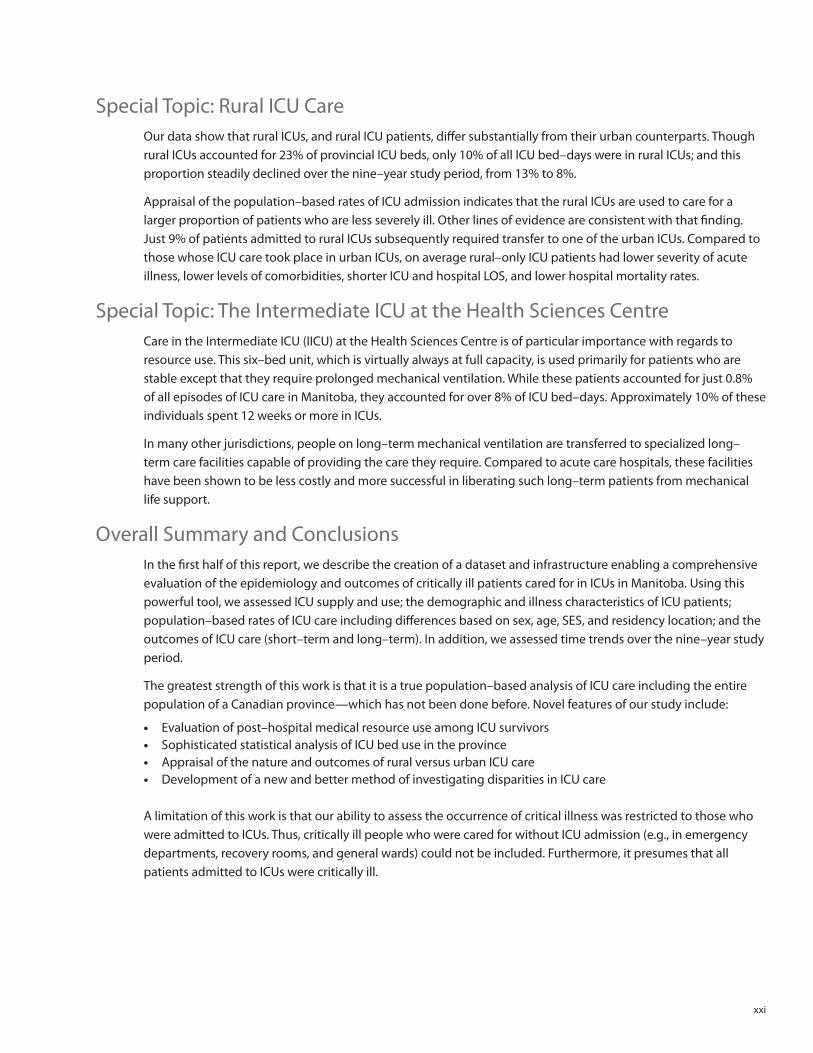
Special Topic: Rural ICU CareOur data show that rural ICUs, and rural ICU patients, differ substantially from their urban counterparts. Though rural ICUs accounted for 23% of provincial ICU beds, only 10% of all ICU bed–days were in rural ICUs; and this proportion steadily declined over the nine–year study period, from 13% to 8%.
Appraisal of the population–based rates of ICU admission indicates that the rural ICUs are used to care for a larger proportion of patients who are less severely ill. Other lines of evidence are consistent with that finding. Just 9% of patients admitted to rural ICUs subsequently required transfer to one of the urban ICUs. Compared to those whose ICU care took place in urban ICUs, on average rural–only ICU patients had lower severity of acute illness, lower levels of comorbidities, shorter ICU and hospital LOS, and lower hospital mortality rates.
Special Topic: The Intermediate ICU at the Health Sciences CentreCare in the Intermediate ICU (IICU) at the Health Sciences Centre is of particular importance with regards to resource use. This six–bed unit, which is virtually always at full capacity, is used primarily for patients who are stable except that they require prolonged mechanical ventilation. While these patients accounted for just 0.8% of all episodes of ICU care in Manitoba, they accounted for over 8% of ICU bed–days. Approximately 10% of these individuals spent 12 weeks or more in ICUs.
In many other jurisdictions, people on long–term mechanical ventilation are transferred to specialized long–term care facilities capable of providing the care they require. Compared to acute care hospitals, these facilities have been shown to be less costly and more successful in liberating such long–term patients from mechanical life support.
Overall Summary and ConclusionsIn the first half of this report, we describe the creation of a dataset and infrastructure enabling a comprehensive evaluation of the epidemiology and outcomes of critically ill patients cared for in ICUs in Manitoba. Using this powerful tool, we assessed ICU supply and use; the demographic and illness characteristics of ICU patients; population–based rates of ICU care including differences based on sex, age, SES, and residency location; and the outcomes of ICU care (short–term and long–term). In addition, we assessed time trends over the nine–year study period.
The greatest strength of this work is that it is a true population–based analysis of ICU care including the entire population of a Canadian province—which has not been done before. Novel features of our study include:
• Evaluation of post–hospital medical resource use among ICU survivors • Sophisticated statistical analysis of ICU bed use in the province • Appraisal of the nature and outcomes of rural versus urban ICU care • Development of a new and better method of investigating disparities in ICU care
A limitation of this work is that our ability to assess the occurrence of critical illness was restricted to those who were admitted to ICUs. Thus, critically ill people who were cared for without ICU admission (e.g., in emergency departments, recovery rooms, and general wards) could not be included. Furthermore, it presumes that all patients admitted to ICUs were critically ill.

xxii

Manitoba Centre for Health Policy 1
The Epidemiology and Outcomes of Critical Illness in Manitoba
Introduction
ObjectiveThis report was conducted at the Manitoba Centre for Health Policy (MCHP)1 on behalf of Manitoba Health, the healthcare arm of the provincial government. Its broad goals were to:
1. Bring the Winnipeg ICU Database (WICUDB) into the Population Health Research Data Repository (the Repository) held at the Manitoba Centre for Health Policy
2. Link the WICUDB to administrative health data already held in the Repository3. Do the first comprehensive assessment of the epidemiology and outcomes of ICU care in Manitoba
This report provides a comprehensive, population–based evaluation of the epidemiology and outcomes of care provided in Intensive Care Units (ICUs) among persons aged 17 and older in Manitoba, over the nine years (April 1– March 31) 1999/2000–2007/08. The care of critically ill patients occurs primarily in ICUs, and the report concentrates on that care. The report is organized into six Specific Aims; the first three aims describe the process of creating the data infrastructure needed to assess ICU use and outcomes, which are detailed in the final three aims.
The value of this report derives from the importance of ICU care, the assessment of a broad range of endpoints relevant to patients and to society, and the nature of the data. Unlike the data used in most studies of critical illness or ICU care, our population–based data allow determination of incidence (not just number of cases) and mortality (as compared to case–fatality rates or the percent of people with a certain condition who die over a certain period of time); it eliminates concerns about selection bias. In addition, age– and sex–standardization can be performed to allow like–comparison among different regions and time periods.
We limited analyses of ICU pts through Mar 31 2008 because we wanted to look at health service use for one year after ICU admission, and the most recent data available at the start of this project was until March 31, 2009.
General MethodsThis study was conducted at the Manitoba Centre for Health Policy (MCHP), which is a research unit in the Department of Community Health Sciences in the University of Manitoba’s Faculty of Medicine. MCHP develops and maintains the comprehensive Population Health Research Data Repository (the Repository). All data management, programming, and analyses were performed using SAS® version 9.2. Most of these data are derived from records that are collected in order to administer the universal healthcare system within Manitoba. The Repository contains information of key interest to health planners and includes de–identified person–level data such as birth and mortality, contacts with physicians and hospitals, pharmaceutical dispensing, use of home care services and personal care homes (PCHs), and area–level data such as average household income by dissemination area from the Canadian Census.
The following database files were used for analyses in this report:
• Medical Services (for visits to physicians outside of those occurring in hospitals) • Provider Registry (to identify the type of provider)
1 Terms in bold type face are defined in the Glossary at the end of this report.

2 University of Manitoba
Introduction
• Hospital Abstracts (for hospital discharges) • Manitoba Health Insurance Registry (for data on the time a person is registered as a resident of
Manitoba, as well as their age, sex, area of residence, and marital status) • Vital Statistics Mortality (for deaths and causes of death) • Drug Program Information Network (DPIN) data, for prescriptions dispensed from community–
based pharmacies • Public use Census files (for neighbourhood–level income quintile information) • Home Care (for use of home care both provincially and in the Winnipeg Regional Health Authority) • Long–Term Care (for the use of personal care homes) • Critical Care/Intensive Care Database (referred to in this report as the Winnipeg Critical Care
Database (WICUDB))
The principal Repository database file used for this project is the hospital abstracts (hospital claims) database. The database contains data about all admissions to Manitoba hospitals from 1971 onwards and is collected by data abstractors located in every provincial hospital. These abstractors are centrally trained and use uniform definitions, data collection methods, and data entry software. Each hospital abstract includes information about the entire time a person spends in a single hospital; accordingly, a new hospital abstract is created when a patient is transferred from one hospital to another.
In contrast to the Repository, which is an administrative database, the WICUDB is a clinical database. It contains detailed clinical information about all adult ICU admissions in the Winnipeg Regional Health Authority (WRHA). When it came into existence on July 11, 1988, it only included information from two ICUs at the Health Sciences Centre. From June 1, 1999 onwards, information from all adult ICUs within the WRHA have been included in the WICUDB. Six Winnipeg hospitals contain adult ICUs—the Health Sciences Centre, St. Boniface General Hospital, Seven Oaks General Hospital, Concordia Hospital, Victoria General Hospital, and the Grace Hospital. Of note, the Misericordia Health Centre contained a medical–surgical ICU that closed in early 1999 and was never included in the WICUDB.
The data for the WICUDB is collected from the hospital chart by a group of specially trained nurses during a patient’s ICU stay. Identifying information collected includes: Personal Health Identification Number (PHIN), hospital identifier, hospital chart number, first name, last name, date of birth, and province (or country) of residency. The data undergo extensive testing to ensure that the data are reliable and valid, with considerable effort spent to validate the patient identifiers. Validation for new records within the WICUDB includes assessing whether meaningfully likely combinations of these identifiers already exist within it. Every three months data is sent to Manitoba Health for further validation against the Manitoba Health Insurance Registry. When this process, described in Appendix 1.1, identifies errors such as missing or incorrect PHINS, corrections are then made directly in the WICUDB where possible. Those WICUDB records, which after validation at Manitoba Health still do not have a PHIN associated with them, are assigned a unique identifier, referred to as the pseudo–PHIN. A majority of the records assigned a pseudo–PHIN are for patients who were non–Manitoba residents.
The WICUDB data used in this report were transferred via Manitoba Health to the MCHP Repository in two batches. Manitoba Health performed an additional validation of the WICUDB against the Manitoba Health Insurance Registry (Appendix 1.2). This validation process was more permissive, allowing for less strict matching than the one referred to above that is performed regularly (Appendix 1.1); it identified some PHINs that had been not been identified by the previous validation. This validation/processing

Manitoba Centre for Health Policy 3
The Epidemiology and Outcomes of Critical Illness in Manitoba
resulted in the WICUDB dataset upon which all further work for this report was done. Once the validation of the WICUDB was complete, these data were de–identified; and to permit linkage across database file, a scrambled PHIN was assigned. In the remainder of the report, we use PHIN to refer to scrambled PHIN.
Five additional notes are in order:
1. We considered a hospital to be an “acute care hospital” if so designated by Manitoba Health. 2. Throughout this document, rates were suppressed (that is, not reported) where the counts upon
which the rates are based represent five events or less (unless the rate is truly 0, in which case it can be reported). This is to avoid breeches of confidentiality and is similar to the way in which Statistics Canada reports data. Throughout the report, the letter “s” indicates a suppressed rate.
3. Our use of the terms “entry” and “separation” refer exclusively to the start and end times of individual ICU records and hospital abstracts. A distinct terminology for when records started/ended was necessary because the existence of inter–ICU and inter–hospital transfers means that episodes of ICU and hospital care could be made up of multiple ICU records and hospital abstracts. Thus we reserved the terms “admission” and “discharge” for whole episodes of care while “entry” and “separation” refer to individual records and abstracts. When an episode of care was comprised of a single record or abstract, these two sets of definitions coincided.
4. We note that the period covered by the analysis in this report does not include the H1N1 influenza epidemic that led to a surge in ICU admissions over the winter of 2009/10. Therefore the results in this report provide baseline results against which analyses of that pandemic experience could be compared.
5. Unless otherwise specified, year(s) refers to fiscal year(s) (April 1–March 31).
Important Technical NoteAfter this work was virtually completed, we became aware of a data issue with relevance to some of our analyses. Specifically, erroneous information had indicated that June 1, 1998 was the date that all adult ICUs in the WRHA came to be included in the WICUDB. However, in fact, the actual date was one–year later, on June 1, 1999.
As of June 1, 1998, only three ICUs were included in the WICUDB—the Medical, Surgical and Intermediate ICUs at the Health Sciences Centre. The ICU at the Grace Hospital was included as of October of 1998. Other ICUs in the WRHA (medical–surgical ICUs at Concordia Hospital, Seven Oaks General Hospital, and Victoria General Hospital; the Coronary Care Unit at Health Sciences Centre; and all ICUs at St. Boniface General Hospital) were not included in the WICUDB until June 1, 1999.
The most important potential consequence of this error relates to the epidemiologic and clinical findings contained in Specific Aims 4–6, which comprise the main results of this report. Those aims concentrate on nine years, 1999/2000–2007/08. Accordingly, the data we report for 1999/2000 fails to include ICU admissions for the first two months of that year at the ICUs that were not included in the ICU database until June 1, 1999. Using data from the following year, we can estimate the inaccuracy of quantifying ICU care due to this error. In 2000/01 those ICUs accounted for 69% of WICUDB records. Accordingly, the two months of missed data accounted for approximately 2/12 x 69% = 11.5% of WICUDB records in 1999/2000. Since, as shown in Table 4.11, Winnipeg ICUs accounted for approximately 84% of all provincial ICU care around that period, the undercounting of cumulative ICU care across the province in 1999/2000 was approximately 11.5% of 84%, or 9.7%.

4 University of Manitoba
Introduction
For many of the results in Specific Aims 4–6, we show the data by year. In those analyses only the 1999/2000 portion suffers from this undercounting, by approximately 10%. For analyses that used data over the entire nine–year study period, the undercounting would amount to approximately 1% of all ICU care. The type of analysis which is the most affected by this error is quantification of ICU care; there is no reason to expect systematic alteration of other parameters (e.g., LOS, mortality rates, etc.).
Unlike the small expected influence of this data error for Specific Aims 4–6, it could have been a major issue in Specific Aim 2, where we assessed the accuracy of administrative data for identifying ICU care, using the WICUDB as the reference standard. Originally, we performed those analyses for the period June 1, 1998 to March 31, 2008. However, as explained above, during the initial 10 months of that period the WICUDB only included a minority of Winnipeg ICUs. This would generate falsely negative identifications of ICU care from the administrative data, leading to incorrectly low positive predictive values in the pre–2004 period. For example, the actual positive predictive value of the administrative data for indicating ICU care in that time period was approximately 98% (Table 2.2), while the erroneous starting date led to a value of 84%.
Because of the magnitude of this problem, we recalculated and report all the analyses in Specific Aim 2 using the correct time period, i.e., starting June 1, 1999. Since Specific Aim 2 was built on results from Specific Aim 1, we also reanalyzed and report Aim 1 using the correct date of June 1, 1999 as when all Winnipeg ICUs came to be included in the WICUDB. In light of the expected small influence of the data error on results from Specific Aims 4–6, and given our time constraints for this report, we did not reanalyze those results and used April 1, 1999 as the starting point for those evaluations.

Manitoba Centre for Health Policy 5
The Epidemiology and Outcomes of Critical Illness in Manitoba
Specific Aim 1: Linking the Datasets
Statement of the Specific AimTo link the two databases that comprise the material for this report, the Winnipeg Intensive Care Unit database (WICUDB) and the hospital abstract database file.
Summary of the Specific Aim • There were 62,973 WICUDB records for patients aged 17 and older with ICU entry on or after July 11,
1988 and ICU separation on or before March 31, 2008. • For 62,436 (99.15%) of these, we were able to identify a one –to–one linkage to a hospital abstract
that matched on at least six of the seven individual identifiers and had provincial residency status determined with good reliability.
• For the subset of 48,326 WICUDB records for patients aged 17 and older with ICU entry on or after June 1, 1999 and ICU separation on or before March 31, 2008, we found 47,932 (99.18%) with a one–to–one linkage. These linked WICUDB–hospital abstract provide the material for subsequent Specific Aims.
MethodsThe goal of this Specific Aim was to create appropriate one–to–one links between individual ICU records in the WICUDB and individual hospital abstract records for patients who were aged 17 and older at the time of hospital entry. We chose age 17 because occasionally, individuals under 18 were admitted to adult ICUs, and preliminary analysis indicated that 65% of the patients under 18 in the WICUDB were 17.
For this Specific Aim, the primary unit of measure was WICUDB records. For each ICU record in the WICUDB we looked for the hospital abstract that contained that ICU stay. Because March 31, 2008 was the latest hospital separation date available at the beginning of this project, we limited the WICUDB records to those with ICU separation on or before March 31, 2008. Hospital abstracts eligible to be linked to those WICUDB records had hospital separations occurring from April 1, 1987 to March 31, 2008. The rationale for going back to hospital abstracts with hospital separation as early as April 1, 1987 was to ensure including those hospital abstracts that could correspond to the earliest WICUDB records.
In addition to evaluating all the ICU records in the WICUDB, we also singled out the subset of WICUDB records with ICU entry on or after June 1, 1999 and ICU separation on or before March 31, 2008, as this represents available data including all the ICUs in the WRHA. We refer to this data as being from the Inclusive Time Interval. However, unless otherwise stated, all WICUDB records with ICU separation on or before March 31, 2008 were addressed in this Specific Aim.
ResultsThis Specific Aim has six parts.
Results Part 1: Preliminary Processing of the Hospital Abstracts
Two preliminary steps in processing the hospital abstracts were done before attempting linkage with the WICUDB.
1. Hospital abstracts that did not represent inpatient hospitalizations (e.g., outpatient surgeries) were excluded
2. Duplicate hospital abstracts, identified as identical on five items—PHIN, hospital, hospital chart number, hospital entry date, and hospital separation date—were excluded.

6 University of Manitoba
Specific Aim 1: Linking the Datasets
Results Part 2: Preliminary Identification of Linkage between the WICUDB and the Hospital Abstracts
WICUDB records form the starting point for all further steps in this Specific Aim. There were 63,113 records with ICU separation on or before March 31, 2008. Of these 48,390 (76.7%) were from the Inclusive Time Interval. We excluded 140 WICUDB records (64 from the Inclusive Time Interval) because those patients were aged 16 and younger at the time of hospital admission; leaving 62,973 WICUDB records for analysis (48,326 from the Inclusive Time Interval).
This initial step in linking the WICUDB with hospital abstracts began with linking them by hospital, hospital chart number, and either one of:
1. ICU entry date occurring on or after hospital entry and on or before hospital separation2. ICU separation date occurring on or after hospital entry and on or before hospital separation
This resulted in all but 1,118 of the 62,978 WICUDB records linking to at least one hospital abstract.
Next, these 1,118 WICUDB records that did not link to a hospital abstract in the previous step were linked by PHIN and either one of:
1. ICU entry date occurring on or after hospital entry and ICU entry date occurring on or before hospital separation
2. ICU separation date occurring on or after hospital entry and ICU separation date occurring on or before hospital separation
There were only 284 WICUDB records that still did not link to a hospital abstract; of these, 253 were from the Inclusive Time Interval. It is likely that many of these failed to link to a hospital abstract because the corresponding hospital abstract was not yet included in our data due to a hospital separation date after March 31, 2008. These 284 WICUDB were therefore eliminated. Table 1.1 shows the linkage summary of this preliminary processing.
Table 1.1: Interim Summary of Linkage between the Winnipeg ICU Database (WICUDB) and the Hospital Abstracts after Preliminary Processing
All Inclusive Time Interval*Total WICUDB records (all ages) 63,113 48,390 -records of patients younger than 17 140 64WICUDB records for patients aged 17 and older 62,973 48,326 -linked to one hospital abstract 62,497 47,941 -linked to two hospital abstracts 180 123 -linked to three hospital abstracts 12 9 -did not link to any hospital abstracts 284 253* Inclusive time interval includes ICU entry on or after June 1, 1999 and ICU separation on or before March 31, 2008
Source: Manitoba Centre for Health Policy, 2012
Table 1.1: Interim Summary of Linkage between the Winnipeg ICU Database (WICUDB) and the Hospital Abstracts after Preliminary Processing

Manitoba Centre for Health Policy 7
The Epidemiology and Outcomes of Critical Illness in Manitoba
Results Part 3: Addressing the 180 WICUDB Records that Linked to Two Hospital Abstracts
For the 180 WICUDB records that linked to two distinct hospital abstracts, six patterns were identified. In the descriptions below, we refer to the paired hospital abstracts as Abstract 1 and Abstract 2. The following is a list of the patterns that occurred:
1. For 126 of the 180 WICUDB records, the hospital separation date for Abstract 1 was the same day as the hospital entry date for Abstract 2. In 115 of these cases, the ICU entry and separation dates fell entirely within just one of the two hospital abstracts, with the ICU stay either ending or beginning on the single day shared by abstracts. For these 115, the link was made with the abstract that contained the entire ICU stay. The other 11 cases were eliminated as we were unable to easily identify a single hospital abstract to link to. Specifically:
a. In nine of the 11 cases, the ICU entry date was the same as the ICU separation date and that day was the single day the two hospital abstracts had in common.
b. In two of the 11 cases, the ICU entry date was within Abstract 1 and the ICU separation date was within Abstract 2.
2. For 25 of the 180 WICUDB records, Abstract 1 and Abstract 2 had the same hospital entry dates but different hospital separation dates. For 24 of the 25 records, Abstract 1 had hospital entry date that was the same as its hospital separation date, and the ICU entry and separation dates fell entirely within Abstract 2; therefore, the ICU record was linked to Abstract 2. The remaining one ICU record was eliminated as the ICU entry and separation dates were contained within the hospital entry and separation dates of both hospital abstracts.
3. For 20 of the 180 WICUDB records, Abstract 1 and Abstract 2 had identical hospital entry and hospital separation dates. Since none of these were from the Inclusive Time Interval, all were eliminated.
4. For six of the 180 WICUDB records, Abstract 1 ended before Abstract 2 began and had a gap of at least one day in between. By looking at the dates of ICU entry and separation and using the hospital codes to identify hospitals that do not have any ICUs, it was possible to determine which hospital abstract correctly linked to the WICUDB record for all of these.
5. Three of the 180 WICUDB records had one of two other patterns: a. Abstract 1 began first, ending after Abstract 2 began, but before Abstract 2 endedb. Abstract 1 began before Abstract 2 began, but both ended on the same day
By comparing the ICU entry and separation dates with the hospital entry and separation dates, it was possible to determine which hospital abstract linked to the ICU event for all but one of these records. That single WICUDB record was eliminated.
Results Part 4: Addressing the 12 WICUDB Records that Linked to Three Hospital Abstracts
For 11 of these 12 WICUDB records, the ICU entry and separation dates fell entirely within the hospital entry and separation dates of only one of the three hospital abstracts, so it was linked to that hospital abstract record. The single remaining WICUDB record was eliminated. The linkage summary to this point is shown in Table 1.2.

8 University of Manitoba
Specific Aim 1: Linking the Datasets
AllInclusive Time
Interval*Eligible WICUDB records (aged 17 and older) 62,973 48,326
WICUDB records eliminated due to: -failure to link to any hospital abstract 284 253 -matching to two or more hospital abstracts and could not be easily clarified 34 11
Total WICUDB records eliminated 318 26462,655 48,062
99.50% 99.45%
Source: Manitoba Centre for Health Policy, 2012
Table 1-2. Summary of linkage between WICUDB and PHADB after Part 4
WICUDB records linked to a unique hospital abstract
Table 1.2: Summary of Preliminary Linkage between the Winnipeg ICU Database (WICUDB) Records and the Hospital Abstracts Based Entry and Separation Dates
* Inclusive time interval includes ICU entry on or after June 1, 1999 and ICU separation on or before March 31, 2008
Results Part 5: Assess How the Linked Records from Parts 2–4 Match on Seven Identifying Variables
The next step was to ensure that the linked WICUDB records and the hospital abstracts represented the same person. Seven identifying variables were used:
1. Hospital 2. Hospital Chart Number–a unique number within each hospital identifying a specific individual
patient3. ICU entry date–match if it was on or after hospital entry date and on or before hospital separation
date4. ICU separation date–match if it was on or after hospital entry date and on or before hospital
separation date5. Sex6. Birth year7. Birth month
It was decided a priori to accept links that were matched on any six of these seven identifiers. Only 219 of 62,655 WICUDB records (0.35%) that had linked with a hospital abstract in Results Part 4 failed to match on six of these seven identifiers, meaning 62,436 WICUDB records did match on six or seven of these identifying variables. As a preliminary step towards separately assessing Manitobans and non–Manitobans, the data are shown in Table 1.3 according to whether the paired WICUDB records and Hospital Abstracts did/did not match on PHIN. Of note, only 8 of the 175 that did not match on PHIN but matched on 6 of the 7 other identifier items were for Manitobans; thus, in effect, the criteria used for Manitobans was that they matched on 7 of 8 identifiers, including PHIN.
Table 1.2: Summary of Preliminary Linkage between the Winnipeg ICU Database (WICUDB) Records and the Hospital Abstracts Based on Entry and Separation Dates

Manitoba Centre for Health Policy 9
The Epidemiology and Outcomes of Critical Illness in Manitoba
Of the 2,538 that matched on six of the seven items, the item that they failed to match on was:
1. Hospital—02. Hospital Chart Number—7713. ICU entry date—1554. ICU separation date—1305. Sex—1036. Birth year—7731. Birth month—606
The linkage summary to this point is shown in Table 1.4.
Table 1.3: Linkage between the Winnipeg ICU Database (WICUDB) and Hospital Abstracts Using Primary Identifying Variables†
PHIN Match Without a PHIN Match TotalWICUDB records linked to a unique hospital abstract 58,608 4,047 62,655 -matched on five or less identifying variables 177 42 219 -matched on six identifying variables 2,363 175 2,538 -matched on seven identifying variables 56,068 3,830 59,898
58,431 4,005 62,43699.70% 98.96% 99.65%
PHIN = Personal Health Information Number Source: Manitoba Centre for Health Policy, 2012
Table 1.3: Linkage between the Winnipeg ICU Database (WICUDB) and Hospital Abstracts Using Primary Identifying Variables†
WICUDB records linked to a unique hospital abstract and matched on six or seven identifying variables
†The seven identifying variables used are hospital, hospital chart number, ICU entry date, ICU separation date, sex, birth year, and birth month
Table 1.4: Final Summary of Linkage between the Winnipeg ICU Database (WICUDB) and the Hospital Abstracts
AllInclusive Time
Interval*Eligible WICUDB records (aged 17 and older) 62,973 48,326WICUDB records linked to a unique hospital abstract 62,655 48,062
62,436 47,93299.15% 99.18%
Source: Manitoba Centre for Health Policy, 2012
Table 1.4: Final Summary of Linkage between the Winnipeg ICU Database (WICUDB) and the Hospital Abstracts
WICUDB records linked to a unique hospital abstract and matched on six or seven identifying variables
* Inclusive time interval includes ICU entry on or after June 1, 1999 and ICU separation on or before March 31, 2008
Since the results of this linkage were excellent, we did not need to allow for entry or separation dates that were displaced by one day; preliminary analysis revealed that allowing such leeway gained only an additional 12 linked records.
Results Part 6: Clarifying Manitoba Residency Status
We determined Manitoba residency status because many of our analyses were separated by this factor. We used the presence of a PHIN in the hospital abstract to identify residency in Manitoba. While technically this distinction could more properly be referred to as being a registrant or non–registrant in the Manitoba Health registry, for the purpose of this work we will refer to this as Manitobans and non–Manitobans.
The PHIN is initially recorded by the data abstractors at each hospital and is then validated using a two–step process. The first step is done at the hospitals at the time of abstraction using their client registries. The second step occurs at Manitoba Health using a matching algorithm (similar, but not identical to, the algorithm in Appendix 1.1) to ensure the correct PHIN using name, sex, and date of birth.
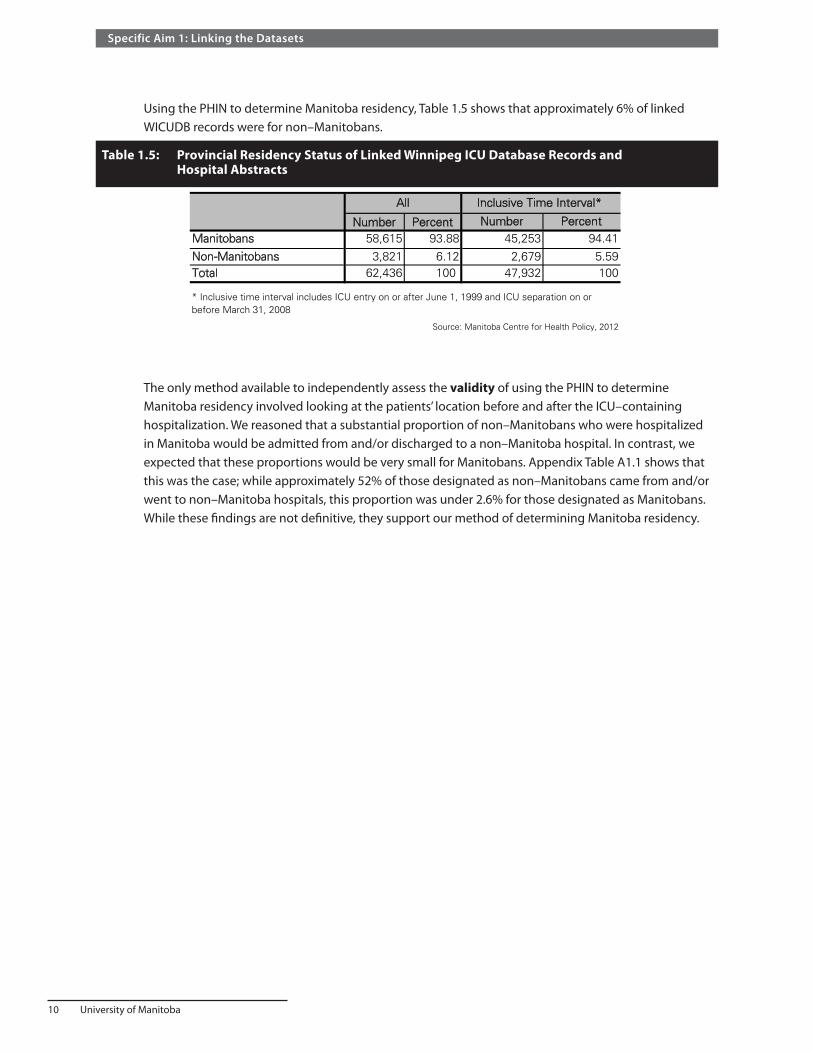
10 University of Manitoba
Specific Aim 1: Linking the Datasets
Using the PHIN to determine Manitoba residency, Table 1.5 shows that approximately 6% of linked WICUDB records were for non–Manitobans.
The only method available to independently assess the validity of using the PHIN to determine Manitoba residency involved looking at the patients’ location before and after the ICU–containing hospitalization. We reasoned that a substantial proportion of non–Manitobans who were hospitalized in Manitoba would be admitted from and/or discharged to a non–Manitoba hospital. In contrast, we expected that these proportions would be very small for Manitobans. Appendix Table A1.1 shows that this was the case; while approximately 52% of those designated as non–Manitobans came from and/or went to non–Manitoba hospitals, this proportion was under 2.6% for those designated as Manitobans. While these findings are not definitive, they support our method of determining Manitoba residency.
Table 1.5: Provincial Residency Status of Linked Winnipeg ICU Database Records and Hospital Abstracts
Number Percent Number PercentManitobans 58,615 93.88 45,253 94.41
Non-Manitobans 3,821 6.12 2,679 5.59Total 62,436 100 47,932 100
Source: Manitoba Centre for Health Policy, 2012
* Inclusive time interval includes ICU entry on or after June 1, 1999 and ICU separation on or before March 31, 2008
All Inclusive Time Interval*
Table 1.5: Provincial Residency Status of Linked Winnipeg ICU Database Records and Hospital Abstracts
~

Manitoba Centre for Health Policy 11
The Epidemiology and Outcomes of Critical Illness in Manitoba
Specific Aim 2: Validating the Data
Statement of the Specific AimAssess the accuracy of the hospital abstract database for identifying the existence and timing of ICU care.
Summary of the Specific Aim • Elements contained in the hospital abstracts can be used to accurately identify hospital abstracts
that included time in an ICU. • Information contained in the hospital abstracts can be used to accurately identify the timing of ICU
entry and ICU separation, though only for the hospitalizations containing a single ICU stay. • These findings show that the hospital abstract database can be used to reliably identify ICU care in
hospitals not included in the WICUDB.
Rationale and MethodsWe refer to the six Winnipeg hospitals included in the WICUDB as the database hospitals (DBHs).
• Health Sciences Centre • St. Boniface General Hospital • Seven Oaks General Hospital • Concordia Hospital • Victoria General Hospital • Grace Hospital
All other Manitoba hospitals will be referred to as non–DBHs. From June 1, 1999 onwards, the WICUDB included all ICUs in these hospitals.
Our ability to describe the population–based epidemiology of ICU care in Manitoba using the WICUDB is limited by the fact that the WICUDB only includes patients admitted to ICUs in DBHs and only included all of those as of June 1, 1999. This limitation would be overcome if the hospital abstract database could accurately identified ICU care in non–DBHs, though such information would lack the detailed clinical information about ICU care available in the WICUDB.
Therefore, using the WICUDB as the reference standard, we sought variables contained in the hospital abstracts to identify patients who spent time in an ICU during hospitalization. Towards this purpose, the data were randomly divided into two halves. One–half was used for the training cohort for testing the predictive accuracy of the hospital abstract variables; the other half served as a validation cohort for independently assessing their ability to identify ICU care. In Specific Aim 3 we used these variables to identify ICU care in the rest of province, i.e., in non–DBHs.
For Specific Aim 2, the hospital abstract was the basic unit of study; and in order to allow for possible linkage with WICUDB records, we restricted hospital abstracts to those with a hospital entry on or after June 1, 1999 and a hospital separation on or before March 31, 2008. The hospital entry restriction derived from the fact that June 1, 1999 is the date when all six DBHs were included in the WICUDB; the hospital separation restriction represents the final hospital separation date present in the Hospital Abstracts at the time we commenced work on this project.

12 University of Manitoba
Specific Aim 2: Validating the Data
On April 1, 2004 major changes were made to the structure and data elements contained in hospital abstracts in Manitoba, in order to adhere to the updated Canadian Institute for Health Information (CIHI) reporting standards. The period prior to April 1, 2004 will be referred to as pre–2004, while the period starting on April 1, 2004 will be called post–2004. The change relevant to this Specific Aim is that post–2004 data collection efforts for the hospital abstract database capture different and more detailed information about ICU use. We performed analyses separately for pre–2004 and post–2004 periods.
Consistent with the previous standard for data reporting, in the pre–2004 period, Manitoba Health only reported to CIHI whether hospitalizations included any time in a special care unit (SCU), defined as “inpatient units specifically designed, staffed and equipped for the continuous observation and treatment of critically ill patients”, including all types of intensive care units, as well as intermediate care, or step–down units (Canadian Institute for Health Information, 2005). As no other specific data elements pertaining to ICU care were mandated by CIHI in the pre–2004 period, there were no standardized methods for determining how and when hospitalized patients were admitted to SCUs. In Manitoba, determination of whether the hospitalizations included any time in a SCU in pre–2004 hospital abstracts was made by reference to the service code fields recorded by hospital chart abstractors. These numerical codes represent the sequence of physician groups (e.g., surgery, cardiology, etc.) who sequentially assumed principal care responsibilities during the course of the hospitalization. There were a maximum of six service codes included in each hospital abstract in the pre–2004 period. Attached to each service code was the date on which that physician service took over principal responsibility for inpatient care, allowing identification of both the starting and ending dates of care under each service. In addition, each service code could include subservice codes that identified whether a patient under that physician service was in an ICU (subservice code 90) or a step–down unit (subservice code 91). For example, the service code for cardiology is 12 and a patient cared for in an ICU by the cardiology service would have a complete service code of 12.90.
In order to obtain more detailed information about critically ill patients, starting in 2002, CIHI changed its reporting requirements for SCUs. These reporting standards required the reporting of the specific type of SCU (Appendix Table A2.1) and the dates of entry and separation for each SCU stay. Manitoba adopted this new standard on April 1, 2004 (i.e., post–2004) and added these specific data elements to its hospital abstracts. All hospital data collectors in Manitoba use the same computer data entry software (Med2020 Healthcare Software, Ottawa, ON), and implementation of the new reporting requirements included:
• Up to six separate SCU codes within a hospitalization • The field cannot be left blank—when a hospitalization included no SCU admissions it required entry
of a specific code indicating this fact • SCU entry and separation dates must accompany each SCU entry
We expressed the accuracy of the hospital abstracts for identifying ICU–containing hospitalizations as the sensitivity, specificity, positive predictive value, and negative predictive value of the variables derived from the hospital abstracts, with respect to the true status of ICU admission as determined from the WICUDB. These parameters are accompanied by 95% confidence intervals (CI), calculated using exact binomial statistics. To identify pre–2004 ICU stays from the hospital abstracts, we used a variable representing whether any of the service codes listed in a hospital abstract included the ICU subservice code (excluding pediatric service codes). Post–2004, we used a variable representing the existence of any SCU episodes excluding those for pediatric ICUs, neonatal ICUs, or step–down units (Appendix Table A2.1).
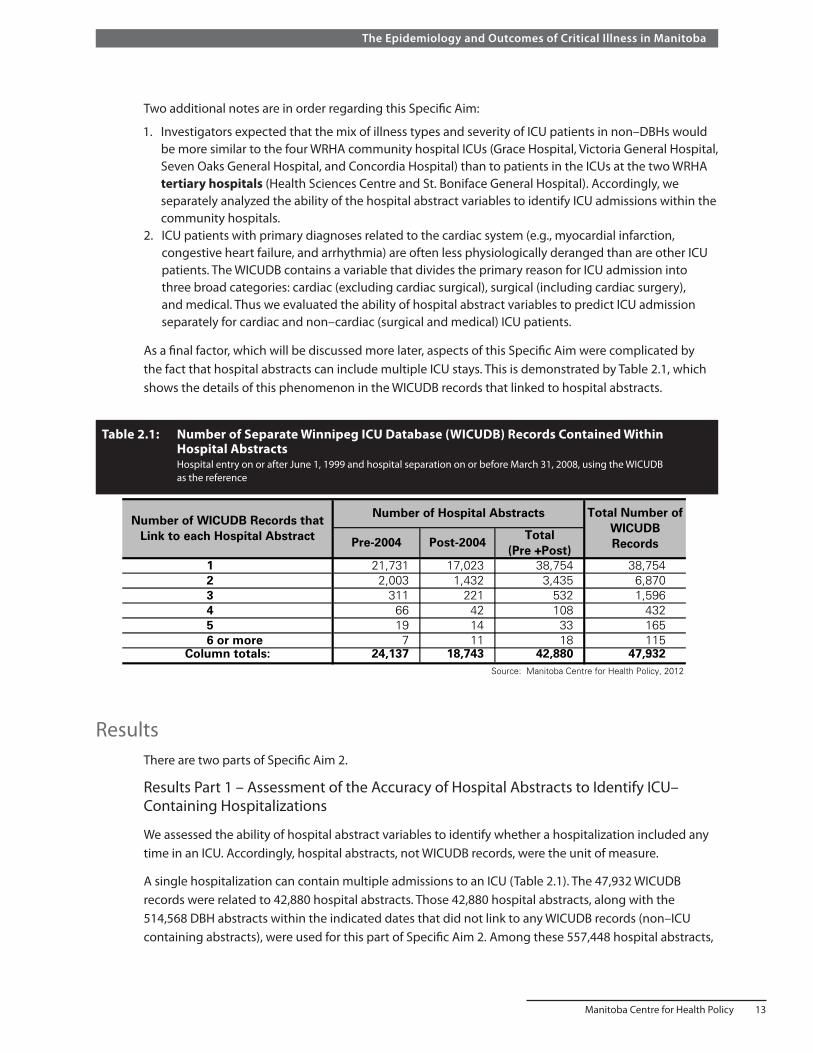
Manitoba Centre for Health Policy 13
The Epidemiology and Outcomes of Critical Illness in Manitoba
Two additional notes are in order regarding this Specific Aim:
1. Investigators expected that the mix of illness types and severity of ICU patients in non–DBHs would be more similar to the four WRHA community hospital ICUs (Grace Hospital, Victoria General Hospital, Seven Oaks General Hospital, and Concordia Hospital) than to patients in the ICUs at the two WRHA tertiary hospitals (Health Sciences Centre and St. Boniface General Hospital). Accordingly, we separately analyzed the ability of the hospital abstract variables to identify ICU admissions within the community hospitals.
2. ICU patients with primary diagnoses related to the cardiac system (e.g., myocardial infarction, congestive heart failure, and arrhythmia) are often less physiologically deranged than are other ICU patients. The WICUDB contains a variable that divides the primary reason for ICU admission into three broad categories: cardiac (excluding cardiac surgical), surgical (including cardiac surgery), and medical. Thus we evaluated the ability of hospital abstract variables to predict ICU admission separately for cardiac and non–cardiac (surgical and medical) ICU patients.
As a final factor, which will be discussed more later, aspects of this Specific Aim were complicated by the fact that hospital abstracts can include multiple ICU stays. This is demonstrated by Table 2.1, which shows the details of this phenomenon in the WICUDB records that linked to hospital abstracts.
Table 2.1: Number of Separate Winnipeg ICU Database (WICUDB) Records Contained Within Hospital Abstracts Hospital entry on or after June 1, 1999 and hospital separation on or before March 31, 2008, using the WICUDB as the reference
Total (Pre +Post)
1 21,731 17,023 38,754 38,7542 2,003 1,432 3,435 6,8703 311 221 532 1,5964 66 42 108 4325 19 14 33 1656 or more 7 11 18 115
Column totals: 24,137 18,743 42,880 47,932Source: Manitoba Centre for Health Policy, 2012
Table 2.1: Number of Separate Winnipeg ICU Database (WICUDB) Records Contained Within Hospital Abstracts
Hospital entry on or after June 1, 1999 and hospital separation on or before March 31, 2008, using the WICUDB as the reference
Number of WICUDB Records that Link to each Hospital Abstract
Number of Hospital Abstracts Total Number of WICUDB Records Pre-2004 Post-2004
ResultsThere are two parts of Specific Aim 2.
Results Part 1 – Assessment of the Accuracy of Hospital Abstracts to Identify ICU–Containing Hospitalizations
We assessed the ability of hospital abstract variables to identify whether a hospitalization included any time in an ICU. Accordingly, hospital abstracts, not WICUDB records, were the unit of measure.
A single hospitalization can contain multiple admissions to an ICU (Table 2.1). The 47,932 WICUDB records were related to 42,880 hospital abstracts. Those 42,880 hospital abstracts, along with the 514,568 DBH abstracts within the indicated dates that did not link to any WICUDB records (non–ICU containing abstracts), were used for this part of Specific Aim 2. Among these 557,448 hospital abstracts,

14 University of Manitoba
Specific Aim 2: Validating the Data
Summary and discussion of Results Part 1 The analysis showed that both the service codes (pre–2004) and SCU codes (post–2004) contained in hospital abstracts were highly accurate in identifying whether patients were admitted to ICUs. In both periods, over 97% of those identified by the hospital abstracts as having had ICU care actually did, and the accuracy in identifying hospital abstracts without an ICU admission exceeded 99.5%. This superb accuracy of the hospital abstracts in identifying ICU care means that we have the ability to identify ICU care throughout the province and over the entire study period, even in hospitals not included in the WICUDB.
308,395 (55.3%) occurred pre–2004 and 249,053 (44.7%) post–2004. The four community hospitals accounted for 126,536 (41.0%) of pre–2004 hospital abstracts and 92,983 (37.3%) post–2004. Overall, 42,880 (7.7%) of these hospital abstracts included ICU time.
These hospital abstracts were randomly divided in half to form the training and validation cohorts. Table 2.2 and Table 2.3 show the performance of the hospital abstract variables in correctly identifying whether hospital abstracts from DBHs included any time in an adult ICU.
The following findings are evident:
• Performance was practically identical for the training and validation data cohorts • Performance in the four community hospitals was very similar to that in the two tertiary care
hospitals • The ability of the service codes (pre–2004) to identify ICU care was very similar to that of the SCU
codes (post–2004) • While all sensitivities and specificities exceeded 95%, the specificities were even higher, being close
to 100% • While all positive predictive values and negative predictive values exceeded 97%, the negative
predictive values were even higher, being close to 100%
The reason for ICU admission (cardiac versus non–cardiac) is available only for those who were in an ICU (i.e., hospital abstracts linked to WICUDB records) as this information is derived from the WICUDB. For examining the validity of the hospital abstract data within the cardiac versus non cardiac patients, we were limited to calculating the sensitivity of the ICU subservice code and SCU variables. Table 2.4 shows the sensitivity in the validation cohort for pre–2004 and post–2004 periods. The sensitivity is similar in both time periods and both patient types and consistently exceeds 95%.
Table 2.4: Sensitivity of the Administrative Data for Identifying ICU Care from the Validation Cohort
Time Period ICU Admission Reason Sensitivity Percent (95% CI)
pre-2004 cardiac 96.0 (95.5,96.4) pre-2004 non-cardiac 96.4 (96.1,96.7) post-2004 cardiac 95.6 (95.0,96.2) post-2004 non-cardiac 97.7 (97.4,98.0)
pre-2004 refers before April 1, 2004post-2004 refers to on or after April 1, 2004
Source: Manitoba Centre for Health Policy, 2012
Table 2.4: Sensitivity of the Administrative Data for Identifying ICU Care from the Validation Cohort

Manitoba Centre for Health Policy 15
The Epidemiology and Outcomes of Critical Illness in Manitoba
Tabl
e 2.
2:
Perf
orm
ance
Par
amet
ers
for I
dent
ifica
tion
of a
ny IC
U C
are
Wit
hin
Hos
pita
l Abs
trac
ts P
rior
to A
pril
1, 2
004
(Pre
–200
4)
As
deriv
ed fr
om s
ervi
ce c
odes
Tabl
e 2.
3:
Perf
orm
ance
Par
amet
ers
for I
dent
ifica
tion
of a
ny IC
U C
are
Wit
hin
Hos
pita
l Abs
trac
ts A
fter
Apr
il 1,
200
4 (P
ost–
2004
)
As
deriv
ed fr
om S
peci
al C
are
Uni
t (SC
U) c
odes
Dat
a P
ortio
nH
ospi
tal
Type
Num
ber
of IC
U
Con
tain
ing
Hos
pita
l A
bstr
acts
Num
ber
of N
on-
ICU
Con
tain
ing
Hos
pita
l Abs
trac
ts
Sen
sitiv
ity P
erce
nt (9
5% C
I)S
peci
ficity
Per
cent
(95%
CI)
Pos
itive
Pre
dict
ive
Val
ue
Per
cent
(95%
CI)
Neg
ativ
e P
redi
ctiv
e V
alue
P
erce
nt (9
5% C
I)
trai
ning
com
mun
ity4,
417
58,8
5296
.9 (9
6.4,
97.4
) 99
.9 (9
9.9,
99.9
) 98
.4 (9
8.0,
98.8
) 99
.8 (9
9.7,
99.8
) va
lidat
ion
com
mun
ity4,
416
58,8
5196
.4 (9
5.9,
97.0
) 99
.9 (9
9.9,
99.9
) 98
.7 (9
8.3,
99.0
) 99
.7 (9
9.7,
99.8
) tr
aini
ngte
rtia
ry7,
652
83,2
7896
.0 (9
5.5,
96.4
) 99
.8 (9
9.8,
99.8
) 97
.7 (9
7.4,
98.0
) 99
.6 (9
9.6,
99.7
) va
lidat
ion
tert
iary
7,65
283
,277
96.5
(96.
0,96
.9)
99.8
(99.
8,99
.8)
97.8
(97.
5,98
.1)
99.7
(99.
6,99
.7)
trai
ning
both
12,0
6914
2,13
096
.3 (9
6.0,
96.7
) 99
.8 (9
9.8,
99.9
) 97
.9 (9
7.7,
98.2
) 99
.7 (9
9.7,
99.7
) va
lidat
ion
both
12,0
6814
2,12
896
.4 (9
6.1,
96.8
) 99
.8 (9
9.8,
99.9
) 98
.1 (9
7.9,
98.4
) 99
.7 (9
9.7,
99.7
) S
ourc
e: M
anito
ba C
entr
e fo
r H
ealth
Pol
icy,
201
2
Tabl
e 2
.2: P
erfo
rman
ce P
aram
eter
s fo
r Id
entif
icat
ion
of a
ny IC
U C
are
With
in H
ospi
tal A
bstr
acts
Prio
r to
Apr
il 1,
200
4 (P
re-2
004)
As
deriv
ed f
rom
ser
vice
cod
es
Dat
a P
ortio
nH
ospi
tal T
ype
Num
ber
of IC
U
Con
tain
ing
Hos
pita
l A
bstr
acts
Num
ber
of N
on-
ICU
Con
tain
ing
Hos
pita
l A
bstr
acts
Sen
sitiv
ity P
erce
nt (9
5% C
I)S
peci
ficity
Per
cent
(95%
CI)
Pos
itive
P
redi
ctiv
e V
alue
P
erce
nt (9
5% C
I)
Neg
ativ
e P
redi
ctiv
e V
alue
P
erce
nt (9
5% C
I)
trai
ning
com
mun
ity3,
200
43,2
9296
.7 (9
6.1,
97.3
) 10
0 (9
9.9,
100)
99
.5 (9
9.2,
99.7
) 99
.8 (9
9.7,
99.8
) va
lidat
ion
com
mun
ity3,
199
43,2
9295
.7 (9
5.0,
96.4
) 99
.9 (9
9.9,
100)
99
.2 (9
8.8,
99.5
) 99
.7 (9
9.6,
99.7
) tr
aini
ngte
rtia
ry6,
172
71,8
6397
.9 (9
7.5,
98.2
) 99
.9 (9
9.9,
99.9
) 98
.5 (9
8.2,
98.8
) 99
.8 (9
9.8,
99.9
) va
lidat
ion
tert
iary
6,17
271
,863
97.6
(97.
2,98
.0)
99.8
(99.
8,99
.9)
98.1
(97.
8,98
.5)
99.8
(99.
8,99
.8)
trai
ning
both
9,37
211
5,15
597
.5 (9
7.2,
97.8
) 99
.9 (9
9.9,
99.9
) 98
.8 (9
8.6,
99.1
) 99
.8 (9
9.8,
99.8
) va
lidat
ion
both
9,37
111
5,15
597
.0 (9
6.6,
97.3
) 99
.9 (9
9.9,
99.9
) 98
.5 (9
8.2,
98.7
) 99
.8 (9
9.7,
99.8
) S
ourc
e: M
anito
ba C
entr
e fo
r H
ealth
Pol
icy,
201
2
Tabl
e 2.
3: P
erfo
rman
ce P
aram
eter
s fo
r Id
entif
icat
ion
of a
ny IC
U C
are
With
in H
ospi
tal A
bstr
acts
Aft
er A
pril
1, 2
004
(Pos
t-20
04)
As
deriv
ed f
rom
Spe
cial
Car
e U
nit
(SC
U) c
odes

16 University of Manitoba
Specific Aim 2: Validating the Data
Before implementation of the updated CIHI reporting requirements for ICU care, there were no national standardized methods for determining whether patients were admitted to ICUs. Therefore, our finding that Manitoba’s methodology was highly accurate in the pre–2004 period does not provide assurance that similar accuracy would be reproduced in other provinces before the new reporting methodology was implemented. However, the updated CIHI requirements did mandate collection of specific data elements that should ensure similarly high accuracy throughout Canada.
In the only other published study on this topic, Scales et al. used Ontario databases to assess the accuracy of administrative data in identifying ICU admissions (Scales, Guan, Martin, & Redelmeier, 2006). Compared to our findings, they had a much lower positive predictive values in the time before and after the reporting change (35% and 84%, respectively). The difference is likely related to the fact that the external ICU database they used as the reference standard did not include all ICUs in the jurisdiction studied. Their finding that the positive predictive value from the earlier period was much lower than from the later period likely reflects a less effective methodology for identifying ICU care in administrative data in Ontario compared to Manitoba before the change in CIHI reporting requirements.
Results Part 2 – Assessment of the Hospital Abstracts for Identifying the Number of ICU Admissions and the Accuracy of ICU Entry and Separation Timing
The main goal of this part of the Specific Aim was to use the linked WICUDB–hospital abstract records to assess the accuracy of the hospital abstracts for the timing of ICU entry and ICU separation. For this purpose the unit of measure was individual ICU records, not hospital abstracts, as was the case in Part 1 of this Specific Aim. Also, for this analysis the data were not divided into training and validation cohorts.
Regarding the timing of ICU entry and separation, the WICUDB contains dates and times. Pre–2004 hospital abstracts contain only the dates, and post–2004 abstracts identify the dates and times. In both time periods we calculated the difference in ICU timing between from the WICUDB record and the corresponding hospital abstract. ICU timing from pre–2004 hospital abstracts was derived from the chronological sequence of service code starting dates in the hospital abstracts and the difference expressed in days. ICU timing from post–2004 hospital abstracts was taken from the timing information associated with each SCU episode in the hospital abstracts and the difference expressed in hours.
Each hospitalization can contain multiple, separate ICU stays, complicating this analysis. We expected that the accuracy of the hospital abstracts for determining the timing of ICU entry and separation would be less accurate when there were multiple ICU stays within a given hospitalization, and even less accurate if the number of ICU stays recorded in the hospital abstracts differs from the number of ICU stays recorded in the WICUDB. Table 2.1 shows the number of ICU admissions within hospitalizations, as determined from the WICUDB. In assessing the ability of the hospital abstract data to reflect these numbers, each hospital abstract can contain up to four ICU service codes (pre–2004) or six SCU codes (post–2004). As shown in Table 2.5 and Table 2.6, the number of ICU stays contained within a hospitalization as determined from the WICUDB sometimes differed from the number indicated in the hospital abstracts.

Manitoba Centre for Health Policy 17
The Epidemiology and Outcomes of Critical Illness in Manitoba
Table 2.5 and Table 2.6 show that:
• The most common type of mismatch was that the number of ICU stays indicated by the hospital abstracts was smaller than the number obtained from the WICUDB.
• A small number of hospital abstracts incorrectly recorded no ICU stays (876 of 24,137 (3.6%) in the pre–2004 period; 522 of 18,743 (2.8%) in the post–2004 period).
• More than 98% of ICU–containing hospitalizations in DBHs included just one or two ICU stays (23,734 of 24,137 (98.3%) in the pre–2004 period; 18,455 of 18,743 (98.5%) in the post–2004 period).
• The number of ICU stays indicated by the hospital abstracts was incorrect for a substantial minority of hospitalizations containing three or more ICU stays. The more detailed data (suppressed due to small numbers) showed that the degree of this inaccuracy increased with the number of actual ICU records contained in a hospitalization.
Despite these problems, the hospital abstracts correctly identified the number of ICU stays for a large majority of ICU–containing hospitalizations (22,342 of 24,137 (92.6%) in the pre–2004 period; 17,542 of 18,743 (93.6%) in the post–2004 period).
Table 2.5: Comparison of the Number of ICU Admissions from Hospital Abstract Service Codes with the Number of ICU Admissions from Winnipeg ICU Database (WICUDB) (Pre–2004)
0 1 2 3 or more864 20,665 193 9 21,731
3.98% 95.09% 0.89% 0.04% 100%12 425 1,549 17 2,003
0.60% 21.22% 77.33% 0.85% 100%0 46 137 128 311
0.00% 14.79% 44.05% 41.16% 100%0 11 42 39 92
0.00% 11.96% 45.65% 42.39% 100%
876 21,147 1,921 193 24,1373.63% 87.61% 7.96% 0.80% 100%
Row percentages are shown Source: Manitoba Centre for Health Policy, 2012
Column Totals
Number of ICU Subservice Codes Within Hospital Abstracts
2
3
4 or more
Number of ICU Admissionsas Determined from the
WICUDBRow Totals
1
Table 2.5: Comparison of the Number of ICU Admissions from Hospital Abstract Service Codes with the Number of ICU Admissions from Winnipeg ICU Database (WICUDB) (Pre-2004)
Table 2.6: Comparison of the Number of ICU Admissions from Hospital Abstract Special Care Unit (SCU) Codes with the Number of ICU Admissions from the Winnipeg ICU Database (WICUDB) (Post–2004)
Row0 1 2 3 or more Totals
516 16,212 247 48 17,0233.03% 95.24% 1.45% 0.28% 100%
6 207 1,154 65 1,4320.42% 14.46% 80.59% 4.54% 100%
0 10 57 221 2880.00% 3.47% 19.79% 76.74% 100%
522 16,429 1,458 334 18,7432.79% 87.65% 7.78% 1.78% 100%
Row percentages are shown
Source: Manitoba Centre for Health Policy, 2012
Column Totals
Number of SCU Codes Within Hospital Abstracts
Table 2.6: Comparison of the of Number ICU Admissions from Hospital Abstract Special Care Unit (SCU) Codes with the Number of ICU Admissions from the Winnipeg ICU Database (WICUDB) (Post-2004)
3 or more
Number of ICU Admissionsas Determined from the WICUDB
1
2

18 University of Manitoba
Specific Aim 2: Validating the Data
For ICU timing, we first assessed the accuracy of ICU timing within hospital abstracts that correctly identified that only a single ICU stay occurred. Table 2.5 and Table 2.6 show that this situation represented a majority of ICU–containing hospital abstracts, 20,665 of 24,137 (85.62%) in the pre–2004 period and 16,212 of 18,743 (86.50%) in the post–2004 period. Table 2.7 and Table 2.8 show the comparisons between the two data sources.
Table 2.7: Pre–2004 Agreement in Timing of ICU Entry and ICU Separation Between the Winnipeg ICU Database (WICUDB) and Hospital Abstracts Where both databases identified a single ICU stay
Number Percent Number Percent≤ -3 41 0.20 193 0.93-2 19 0.09 177 0.86-1 730 3.53 645 3.120 19,528 94.50 18,905 91.481 311 1.50 510 2.472 15 0.07 76 0.37≥ 3 21 0.10 159 0.77
Column percentages are shown.
Source: Manitoba Centre for Health Policy, 2012
Table 2-7. Agreement between timing of ICU entry and ICU separation from the WICUDB vs. the PHADB, pri
ICU Separation Date DifferenceICU Entry Date Difference
WICUDB Records (Total Number=20,665)Difference in Days
(WICUDB - Hospital Abstracts)
Table 2.7: Pre-2004 Agreement in Timing of ICU Entry and ICU Separation Between the Winnipeg ICU Database (WICUDB) and Hospital Abstracts
Where both databases identified a single ICU stay
Table 2.8: Post–2004 Agreement in Timing of ICU Entry and ICU Separation Between the Winnipeg ICU Database (WICUDB)and Hospital Abstracts Where both databases identified a single ICU stay
Number Percent Number Percent
-24 to -72 19 0.12 93 0.57-8 to -24 18 0.11 122 0.750 to -8 248 1.53 323 1.99
0 2,786 17.18 2,374 14.640 to 8 12,800 78.95 12,839 79.198 to 24 223 1.38 227 1.40
24 to 48 85 0.52 115 0.7148 to 72 9 0.06 37 0.23≥72 24 0.15 82 0.51
Source: Manitoba Centre for Health Policy, 2012
Table 2.8: Post-2004 Agreement in Timing of ICU Entry and ICU Separation Between the Winnipeg ICU Database (WICUDB)and Hospital Abstracts
Where both databases identified a single ICU stay
Difference in Hours (WICUDB - Hospital
Abstracts)
WICUDB Records (Total Number=16,212)
ICU Entry Date Difference ICU Separation Date Difference
Pre–2004, we found agreement within one day for 99.5% of ICU entries and 97.1% of ICU separations. Post–2004, there was agreement within eight hours for 97.7% of ICU entries and 95.8% of ICU separations. For comparison with the pre–2004 figures, there was agreement post–2004 within 24 hours for 99.2% of ICU entries and 98.0% of ICU separations.
We next evaluated the accuracy of the administrative data in determining the timing of ICU entry and ICU separation when the hospital abstracts correctly identified that two separate ICU stays occurred (Table 2.9 and Table 2.10).
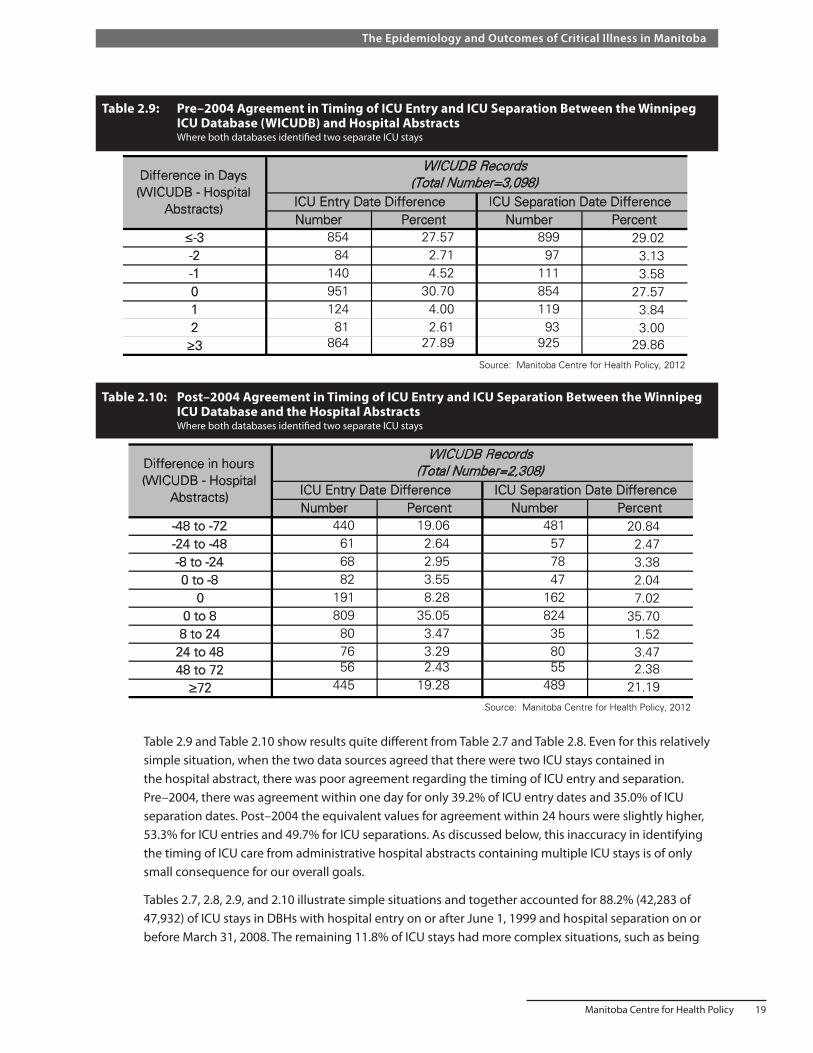
Manitoba Centre for Health Policy 19
The Epidemiology and Outcomes of Critical Illness in Manitoba
Table 2.9 and Table 2.10 show results quite different from Table 2.7 and Table 2.8. Even for this relatively simple situation, when the two data sources agreed that there were two ICU stays contained in the hospital abstract, there was poor agreement regarding the timing of ICU entry and separation. Pre–2004, there was agreement within one day for only 39.2% of ICU entry dates and 35.0% of ICU separation dates. Post–2004 the equivalent values for agreement within 24 hours were slightly higher, 53.3% for ICU entries and 49.7% for ICU separations. As discussed below, this inaccuracy in identifying the timing of ICU care from administrative hospital abstracts containing multiple ICU stays is of only small consequence for our overall goals.
Tables 2.7, 2.8, 2.9, and 2.10 illustrate simple situations and together accounted for 88.2% (42,283 of 47,932) of ICU stays in DBHs with hospital entry on or after June 1, 1999 and hospital separation on or before March 31, 2008. The remaining 11.8% of ICU stays had more complex situations, such as being
Table 2.9: Pre–2004 Agreement in Timing of ICU Entry and ICU Separation Between the Winnipeg ICU Database (WICUDB) and Hospital Abstracts Where both databases identified two separate ICU stays
Table 2.10: Post–2004 Agreement in Timing of ICU Entry and ICU Separation Between the Winnipeg ICU Database and the Hospital Abstracts Where both databases identified two separate ICU stays
Number Percent Number Percent≤-3 854 27.57 899 29.02-2 84 2.71 97 3.13-1 140 4.52 111 3.580 951 30.70 854 27.571 124 4.00 119 3.842 81 2.61 93 3.00≥3 864 27.89 925 29.86
Source: Manitoba Centre for Health Policy, 2012
Difference in Days (WICUDB - Hospital
Abstracts) ICU Entry Date Difference ICU Separation Date Difference
WICUDB Records (Total Number=3,098)
Table 2.9: Pre-2004 Agreement in Timing of ICU Entry and ICU Separation Between the Winnipeg ICU Database (WICUDB) and Hospital Abstracts
Where both databases identified two separate ICU stays
Number Percent Number Percent-48 to -72 440 19.06 481 20.84-24 to -48 61 2.64 57 2.47-8 to -24 68 2.95 78 3.380 to -8 82 3.55 47 2.04
0 191 8.28 162 7.020 to 8 809 35.05 824 35.70
8 to 24 80 3.47 35 1.5224 to 48 76 3.29 80 3.4748 to 72 56 2.43 55 2.38≥72 445 19.28 489 21.19
Source: Manitoba Centre for Health Policy, 2012
WICUDB Records (Total Number=2,308)
ICU Separation Date DifferenceICU Entry Date Difference
Difference in hours (WICUDB - Hospital
Abstracts)
Table 2.10: Post-2004 Agreement in Timing of ICU Entry and ICU Separation Between the Winnipeg ICU Database and the Hospital Abstracts
Where both databases identified two separate ICU stays

20 University of Manitoba
Specific Aim 2: Validating the Data
contained in hospital abstracts with more than two ICU stays or when the two data sources indicated differing numbers of ICU stays. Such ICU stays likely had even more discrepancies in timing between the two data sources; for this reason, we did not evaluate them further.
Summary and discussion of Results Part 2Both pre–2004 and post–2004, the hospital abstracts were highly accurate in identifying the timing of ICU entry and ICU separation; but this was true only for the simplest situation where a hospital abstract contained a single ICU stay. For pre–2004 in DBHs, this simple situation encompassed 90.0% (21,731 of 24,137) of ICU–containing hospital abstracts and 80.3% (21,731 of 27,072) of ICU records; the comparable data, post–2004 were 90.8% (17,023 of 18,743) of hospital abstracts and 81.6% (17,023 of 20,860) of ICU records (Table 2.1). However, because we have the WICUDB, the inaccuracy of hospital abstracts to identify ICU care is much less of a practical problem for our purposes that it may seem. Specifically, we only need the hospital abstracts to identify ICU care in non–DBHs. High accuracy is nonetheless expected because just 3.1% (508 out of 16,173) of those ICU–containing hospital abstracts contained multiple ICU stays (Table 3.2). Thus, we can achieve high accuracy in identifying the presence and timing of ICU care using the WICUDB in DBHs and hospital abstracts in the rest of the province’s hospitals.
Manitoba Centre for Health Policy 21
The Epidemiology and Outcomes of Critical Illness in Manitoba
Specific Aim 3: Creating Episodes of Hospital and ICU Care
Statement of the Specific AimTo combine separate hospital abstracts into appropriate episodes of hospital care and similarly to combine separate ICU records into episodes of ICU care.
An episode of acute hospital care refers to the total continuous period spent in one or more hospitals after initial entry to hospital. When this period includes time in multiple hospitals, inter–hospital transfers occur between them. Patients may undergo inter–hospital transfer for a number of reasons, commonly related to bed availability or to obtaining medical services unavailable at the current hospital. We consider a hospital episode to end by death or discharge from the hospital to anywhere except another acute care hospital.
Since the database of hospital abstracts contains a separate hospital abstract for the time in each hospital, it is sometimes necessary to combine multiple hospital abstracts to construct the entire hospital episode. Similarly, an episode of ICU care can include time in multiple ICUs, either different ICUs at a single hospital and/or in different hospitals. For all further aims of this report, hospital and ICU episodes were the most relevant measures; therefore in this Specific Aim, we constructed those episodes from the individual hospital abstracts and individual ICU records.
Since the WICUDB identifies ICU care only within the six DBHs, we needed to identify ICU care in hospitals not included in the WICUDB. This was done in Part 1 of this Specific Aim by using methodology developed in Specific Aim 2.
It is important to note that the approaches taken for combining individual abstracts/records into episodes of hospital and ICU care were necessarily different for Manitobans and non–Manitobans.
Summary of the Specific AimUsing specified rules, we combined separate hospital abstracts into episodes of hospital care and separate ICU records into episodes of ICU care. This was done for hospitalizations with a hospital entry on or after June 1, 1998 and a hospital separation on or before March 31, 2008.
We first used methods from Specific Aim 2 to identify ICU care provided outside of the six hospitals included in the WICUDB. We found that hospitals not included in the WICUDB represented 25.1% (16,742 of 66,724) of all ICU records and 26.6% (16,173 of 60,807) of all ICU–containing hospital abstracts. Using these data, in the time period of interest, we identified 59,984 episodes of ICU care, which were contained in 56,907 hospital episodes.
Our ability to identify episodes of care for non–Manitobans was limited because they lack a unique identifier (or PHIN) in the Repository. However, this limitation will have minimal influence on subsequent analyses as:
• Non–Manitobans accounted for just 5% of ICU use in Manitoba. • Non–Manitobans receiving ICU care in non–DBHs accounted for just 15% (438 of 2,859) of non–
Manitobans in provincial ICUs, i.e., 0.77% of total ICU–containing hospital episodes in the province. • While it could lead to an under–estimation of the number of ICU and hospital episodes for non–
Manitobans, it would not affect analysis of cumulative ICU use as measured in ICU bed–days. • It will not affect any of our population–based analyses, which will be limited to Manitobans.
22 University of Manitoba
Specific Aim 3: Creating Episodes of Hospital and ICU Care
MethodsMethods Part 1: Constructing Hospital Episodes for Manitobans
Constructing hospital episodes was facilitated by the fact that in the administrative data, Manitobans have a unique PHIN that allowed us to identify all hospital abstracts for each individual. Using the combination rules discussed below, we constructed hospital episodes from the hospital abstracts for each individual.
The hospital abstract variables used to identify inter–hospital transfer were the timing of hospital entry and separation and information about the locations of the patient before and after hospitalization. Hospital separation codes (Appendix Table A3.1) indicate the type of location the patient was discharged to, e.g., home or another hospital. These codes are different in the pre–2004 and post–2004 periods. In addition, each hospital abstract contains TransferFrom and TransferTo variables intended to identify the specific institution the patient came from or went to; unfortunately, those two data fields are often not completed even when applicable. Since, like all data, the timing and location information is sometimes recorded incorrectly, a certain leeway was needed in using them to identify inter–hospital transfers. In discussing two hospital abstracts for the same Manitoban, we refer to the earlier–starting one as Abstract 1 and the later–starting one as Abstract 2.
Two hospital abstracts representing entry to acute care hospitals were considered to be part of a single hospital episode if any of the three following combination rules were met:
A. Abstract 2 had dates that were entirely contained within those of Abstract 1. Specifically: the entry date for Abstract 2 was on or after the entry date for Abstract 1 AND the separation date for Abstract 2 was on or before the separation date for Abstract 1. This allows for situations when a patient in Hospital 1 is temporarily sent to Hospital 2 for a specific purpose (e.g., a specialized procedure), and the patient then returns to Hospital 1.
B. Abstract 1 indicated a transfer to another acute care hospital AND the hospital entry date of Abstract 2 was two or less calendar days after the separation date of Abstract 1. The indication in Abstract 1 of transfer could be either or both of:
i. Hospital separation code indicating transfer to another acute care hospital (Appendix Table A3.1—pre–2004 disposition code 6, post–2004 code 01)
ii. TransferTo code indicating the patient went to any other acute care hospital in Manitoba (Appendix Table A3.1), though not necessarily the hospital of the later abstract. It was not required that the correct hospital be listed in the TransferTo field as we expected inaccuracy in recording that information.
The two day interval was chosen to allow appropriate combination of hospital abstracts with an expected degree of occasional miscoding of the timing of hospital entry and/or separation (especially those occuring just before or just after midnight).
C. Abstract 1 did not indicate transfer to another acute care hospital (i.e., both subcriteria in B were false) AND Abstract 2 had an entry date two or less calendar days after the separation date of Abstract 1 AND the TransferFrom field of Abstract 2 indicated transfer directly from another acute care hospital in Manitoba (Appendix Table A3.2). Because we expected some inaccuracy in recording which hospital a patient was transferred from, we did not require that the acute care hospital in the TransferFrom field be the actual hospital from Abstract 1.

Manitoba Centre for Health Policy 23
The Epidemiology and Outcomes of Critical Illness in Manitoba
The two hospital abstracts were considered parts of distinct hospital episodes (i.e., not combined) in the following two conditions:
1. The hospital entry date of Abstract 2 was more than two calendar days after the separation date of Abstract 1.
2. The hospital entry date of Abstract 2 was two or less calendar days after the separation date of Abstract 1 AND Abstract 1 did not indicate transfer to another acute care hospital AND the TransferFrom field of Abstract 2 was either empty or did not indicate transfer from an acute care hospital.
The process of combining hospital abstracts into ICU–containing hospital episodes began by identifying all hospital abstracts for Manitobans with hospital entry date beginning on or after June 1, 1998 and separation date on or before March 31, 2008. For each individual these hospital abstracts were arranged by ascending hospital entry dates, considered in chronological sequence, and then combination rules A–C were applied. The final result for each patient was one or more hospital episodes. Each was constructed from one or multiple hospital abstracts. Finally, only hospital episodes that contained at least one ICU record were retained for further analysis.
Methods Part 2: Constructing ICU Episodes for Manitobans
We used an “outside–in” approach to constructing ICU episodes for Manitobans, using the hospital episode (outside) as the starting point for the ICU episodes contained within it (inside). This was possible because Specific Aims 1 and 2 allowed the linkage of ICU records to the hospital abstract within which they were contained. Accordingly, after creating the hospital episodes for Manitobans, to construct the ICU episode(s) contained within a given hospital episode, we only had to consider the ICU records associated with the specific hospital abstracts comprising that hospital episode.
For hospital episodes containing multiple ICU records, we assessed whether those ICU records represented one or more ICU episodes. The information used to decide whether two ICU records contained within a single hospital episode were part of the same episode of ICU care was the length of time between the prior ICU separation and the next ICU entry.
Clearly, two ICU records representing a direct inter–ICU transfer should be considered part of the same ICU episode, but to do this we had to address:
i. The possibility of inter–ICU transfer with a substantial delay, such as an intervening surgery, or transport from an ICU in a remote hospital
ii. Occasional inaccuracy of recorded times/dates (especially around midnight)iii. The recognized occurrence of transfer to an ICU in another hospital (e.g., to perform specific
procedures) while the ICU bed in the sending hospital is held for the patient’s planned return after the procedure
iv. The fact that pre–2004 hospital abstracts contain the dates, but not times of ICU entry and separation
For calculating the period of time between ICU records from a DBH, we used the date/time of ICU entry and separation derived from the WICUDB. For ICU records from a non–DBH, we used the timing of ICU entry and separation from the hospital abstract; these included only dates pre–2004 and both date and time for post–2004 data. So, in order to calculate period of time in hours for pre–2004 ICU care in non–DBHs, we assigned ICU entry or separation to have occurred at noon. Though assessment of

24 University of Manitoba
Specific Aim 3: Creating Episodes of Hospital and ICU Care
average LOS using such a consistent assignment has little systematic bias (Marik & Hedman, 2000), a consequence of item (iv) is that a patient undergoing direct ICU–to–ICU transfer who left the sending ICU at 11:50 pm and arrived at the accepting ICU at 12:10 am would be assigned a gap of 24 hours. We note that (ii) and (iii) can lead to an inter–ICU gap of less than zero (Appendix Table A3.3).
The major complicating factor in trying to combine ICU records is that hospital abstracts, the only source of information about ICU stays in non–DBHs, do not indicate whether a patient who left the ICU was transferred to another ICU. This makes it impossible to distinguish between ICU readmission after being out of an ICU, as opposed to an inter–ICU transfer with a delay due to any of the factors mentioned above. While longer gaps are less likely to represent inter–ICU transfers, this is not definitive. ICU readmissions do sometimes occur after a very brief time on a hospital ward; some inter–ICU transfers are separated by relatively long gaps; there is the occasional inaccuracy of recorded times/dates.
Moving forward in constructing the hospital episodes was facilitated by recognition that our reason for combining ICU records within a hospital episode was to identify conceptual episodes of ICU care, even if such an episode was interrupted by a reasonably brief period elsewhere, such as on a ward. This determination was motivated by data showing that ICU readmission after a shorter period is more likely to be for the same reason as the prior ICU stay (Rosenberg, Hofer, Hayward, Strachan, & Watts, 2001). Using the distributions of the gap durations on our data (Appendix Table A3.3) and the above considerations, successive ICU records contained within a hospital episode were considered part of the same ICU episode if the later ICU record began less than 48 hours after the earlier ICU record ended.
Methods Part 3: Constructing Hospital and ICU Episodes for Non–Manitobans
The main challenge regarding hospital and ICU episodes for non–Manitobans is that in our data sources they lack a unique, global identifier similar to the PHIN. Consequently, the hospital abstracts, which are de–identified and lack distinguishing information such as names, provide no straightforward way to track an individual when the person is transferred between hospitals. However, the native WICUDB is not de–identified; and in it non–Manitobans are assigned an Out of Province Unique Identifier (OOPUI), allowing for the identification of individuals in that database. Each time a record is added to the WICUDB for a non–Manitoban, a search is done by name and date of birth to identify prior WICUDB records for that person. If any are found, the prior OOPUI is assigned to that new WICUDB record. If no matches are found, then a new OOPUI is assigned.
Using the OOPUI, we can track non–Manitobans who were transferred from an ICU in a DBH to another ICU in a DBH. The limits of the OOPUI to track inter–hospital transfers is illustrated by a situation where a patient is admitted to ICUs in two DBHs with a time period between the two ICU admissions; in that situation we have no way of knowing whether that individual was in another hospital (DBH or non–DBH) in between the two ICU admissions. Furthermore, the OOPUI cannot track a patient between non–DBHs or between a DBH and a non–DBH.
Accordingly, the only accurate indicator of an inter–hospital transfer for non–Manitobans was the presence of an ICU–to–ICU transfer between two DBHs, as indicated in the WICUDB. In this situation, we considered that successive WICUDB records for a patient with the same OOPUI were part of the same ICU episode if the later ICU record began less than 48 hours after the earlier ICU record ended. When this occurred, the two hospital abstracts that contained those two ICU records were taken to be part of the same hospital episode. In comparison to the methods used for Manitobans (see above), we refer to this process of first linking ICU records and then linking the associated hospital abstracts as the “inside–out” approach.
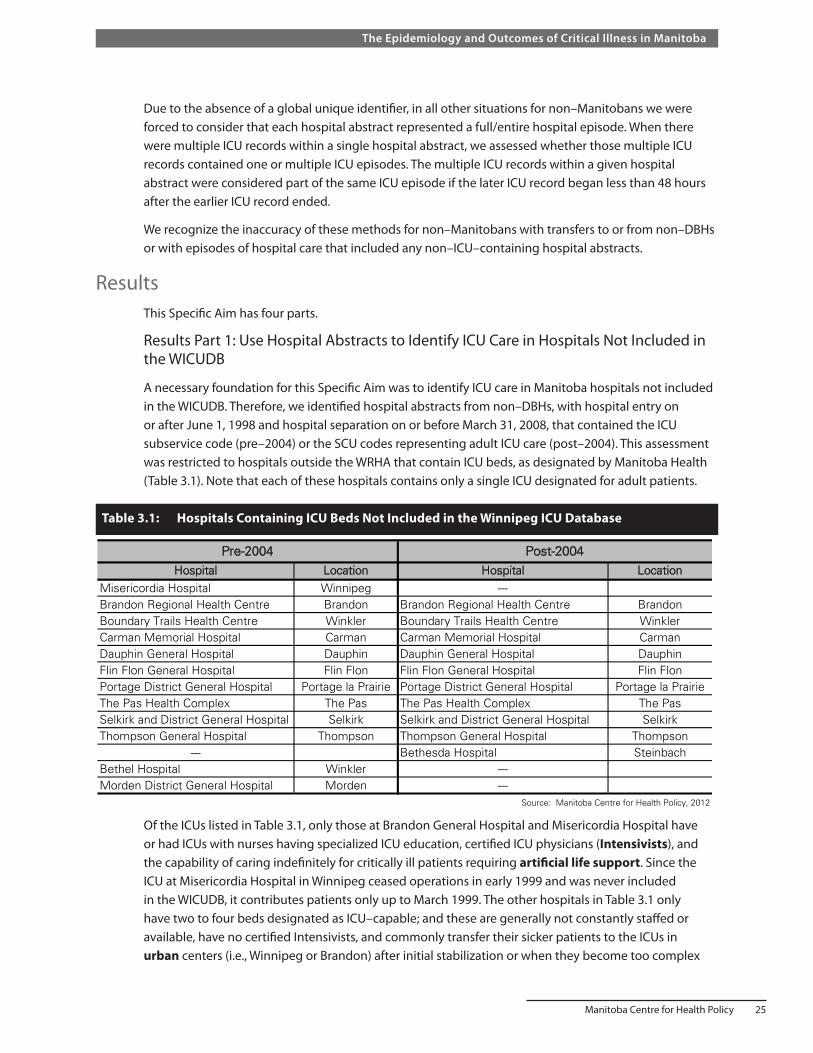
Manitoba Centre for Health Policy 25
The Epidemiology and Outcomes of Critical Illness in Manitoba
Due to the absence of a global unique identifier, in all other situations for non–Manitobans we were forced to consider that each hospital abstract represented a full/entire hospital episode. When there were multiple ICU records within a single hospital abstract, we assessed whether those multiple ICU records contained one or multiple ICU episodes. The multiple ICU records within a given hospital abstract were considered part of the same ICU episode if the later ICU record began less than 48 hours after the earlier ICU record ended.
We recognize the inaccuracy of these methods for non–Manitobans with transfers to or from non–DBHs or with episodes of hospital care that included any non–ICU–containing hospital abstracts.
ResultsThis Specific Aim has four parts.
Results Part 1: Use Hospital Abstracts to Identify ICU Care in Hospitals Not Included in the WICUDB
A necessary foundation for this Specific Aim was to identify ICU care in Manitoba hospitals not included in the WICUDB. Therefore, we identified hospital abstracts from non–DBHs, with hospital entry on or after June 1, 1998 and hospital separation on or before March 31, 2008, that contained the ICU subservice code (pre–2004) or the SCU codes representing adult ICU care (post–2004). This assessment was restricted to hospitals outside the WRHA that contain ICU beds, as designated by Manitoba Health (Table 3.1). Note that each of these hospitals contains only a single ICU designated for adult patients.
Table 3.1: Hospitals Containing ICU Beds Not Included in the Winnipeg ICU Database
Hospital Location Hospital LocationMisericordia Hospital Winnipeg ---Brandon Regional Health Centre Brandon Brandon Regional Health Centre BrandonBoundary Trails Health Centre Winkler Boundary Trails Health Centre WinklerCarman Memorial Hospital Carman Carman Memorial Hospital CarmanDauphin General Hospital Dauphin Dauphin General Hospital DauphinFlin Flon General Hospital Flin Flon Flin Flon General Hospital Flin FlonPortage District General Hospital Portage la Prairie Portage District General Hospital Portage la PrairieThe Pas Health Complex The Pas The Pas Health Complex The PasSelkirk and District General Hospital Selkirk Selkirk and District General Hospital SelkirkThompson General Hospital Thompson Thompson General Hospital Thompson
--- Bethesda Hospital SteinbachBethel Hospital Winkler ---Morden District General Hospital Morden ---
Source: Manitoba Centre for Health Policy, 2012
Pre-2004 Post-2004
Table 3.1: Hospitals Containing ICU Beds Not Included in the Winnipeg ICU Database
Of the ICUs listed in Table 3.1, only those at Brandon General Hospital and Misericordia Hospital have or had ICUs with nurses having specialized ICU education, certified ICU physicians (Intensivists), and the capability of caring indefinitely for critically ill patients requiring artificial life support. Since the ICU at Misericordia Hospital in Winnipeg ceased operations in early 1999 and was never included in the WICUDB, it contributes patients only up to March 1999. The other hospitals in Table 3.1 only have two to four beds designated as ICU–capable; and these are generally not constantly staffed or available, have no certified Intensivists, and commonly transfer their sicker patients to the ICUs in urban centers (i.e., Winnipeg or Brandon) after initial stabilization or when they become too complex

26 University of Manitoba
Specific Aim 3: Creating Episodes of Hospital and ICU Care
for local management. The number of ICU–containing hospital abstracts from non–DBHs with hospital entry on or after June 1, 1998 and hospital separation on or before March 31, 2008 is shown in Table 3.2. Appendix Table A3.4 provides this information by hospital. There were 16,742 separate ICU records contained within 16,173 hospital abstracts during this time period with just 508 (3.1%) of those hospital abstracts containing multiple ICU records.
Table 3.2: ICU–Containing Hospital Abstracts from Manitoba Hospitals Not Included in the Winnipeg ICU Database Hospital entry on or after June 1, 1998 and hospital separation on or before March 31, 2008
1 2 3 or morePre-2004
1,893 122 2792.7% 6.0% 1.3%
239 11 095.6% 4.4% 0.0%7,658 169 12
97.7% 2.2% 0.2%9,790 302 39
96.6% 3.0% 0.4%Post-2004
1,225 42 1095.9% 3.3% 0.8%4,650 108 7
97.6% 2.3% 0.1%5,875 150 17
97.2% 2.5% 0.3%15,665 452 5696.9% 2.8% 0.3%
Row percentages are shown
Source: Manitoba Centre for Health Policy, 2012
Other hospitals 4,765
Subtotal 6,042
Total for Both Periods
16,173
Other hospitals 7,839
Subtotal 10,131
Brandon 1,277
Total Number of Hospital Abstracts
Brandon 2,042
Misericordia 250
Number of Separate ICU Records Within the Hospital Abstracts
Table 3.2: ICU-Containing Hospital Abstracts from Manitoba Hospitals Not Included in the Winnipeg ICU Database
Hospital entry on or after June 1, 1998 and hospital separation on or before March 31, 2008
Table 3.3: ICU–Containing Hospital Abstracts by Residency Status and Hospital Type Hospital entry on or after June 1, 1998 and hospital separation on or before March 31, 2008
Residency Status Database HospitalsNon-Database
HospitalsTotal
42,140 15,735 57,87594.41% 97.29% 95.18%
2,494 438 2,9325.59% 2.71% 4.82%
Total 44,634 16,173 60,807
Column percentages are shown
Source: Manitoba Centre for Health Policy, 2012
Manitobans
Non-Manitobans
Table 3.3: ICU-Containing Hospital Abstracts by Residency Status and Hospital Type Hospital entry on or after June 1, 1998 and hospital separation on or before March 31, 2008
Table 3.3 summarizes all ICU–containing hospital abstracts used subsequently in this report by residency status and type of hospital. This table combines data from Tables 2.1 and 3.2.

Manitoba Centre for Health Policy 27
The Epidemiology and Outcomes of Critical Illness in Manitoba
The only available independent assessment of the accuracy of ICU record counts identified from hospital abstracts comes from the ICU at Brandon Regional Health Centre. In that ICU, the unit clerks and nurses manually record each new ICU entry in a paper logbook. Brandon’s ICU supplied us with those counts organized by year, according to dates of ICU entry. Comparison of that data with the numbers identified from the hospital abstracts shows a reassuring agreement in numbers of patients entering that ICU (Table 3.4).
Table 3.4: Brandon Regional Health Centre ICU Admissions Local ICU records compared to hospital abstracts
Hospital Abstracts ICU Logbook2003/04 344 342 -2 -0.62004/05 345 354 9 2.52005/06 309 321 12 3.72006/07 342 357 15 4.2
Source: Manitoba Centre for Health Policy, 2012
Table 3.4: Brandon Regional Health Centre ICU Admissions Local ICU records compared to hospital abstracts
YearNumber of ICU Admissions
as Derived from: Absolute Difference
Percent Difference
Summary and discussion of Results Part 1Specific Aim 2 showed how hospital abstracts can be used to accurately identify time spent in an ICU. Using this methodology, in non–DBHs we identified 16,742 ICU records contained within 16,173 hospital abstracts with hospital entry on or after June 1, 1998 and hospital separation on or before March 31, 2008. Combined with the 49,982 ICU records contained within 44,634 hospital abstracts in DBHs during that period (Table 2.1), we found that 16,742 of 66,724 ICU records (25.1%) and 16,173 of 60,807 ICU–containing hospital abstracts (26.6%) in Manitoba came from hospitals not included in the WICUDB.
Results Part 2: Construct Hospital Episodes from Individual Hospital Abstracts for Manitobans
Of 60,807 ICU–containing hospital abstracts with hospital entry on or after June 1, 1998 and hospital separation on or before March 31, 2008 (Table 3.3), 57,875 of the abstracts were for Manitobans. The number of ICU records contained within those 57,875 hospital abstracts ranged from one to eight; 53,291 (92.1%) included a single ICU record; 753 (1.3%) had greater than two ICU records (Table 3.5). The hospital distribution of Manitobans’ ICU–containing hospitalizations (Table 3.6) indicates that almost three–quarters were in DBHs, with almost half of the total in the two tertiary care hospitals in Winnipeg.
There were 43,821 unique persons represented by these 57,875 ICU–containing hospital abstracts. These 43,821 persons had a total of 198,832 hospital abstracts representing entry to Manitoba acute care hospitals (Appendix Table A3.2) with hospital entry date on or after June 1, 1998 and hospital separation date on or before March 31, 2008. Upon applying hospital combination rules (A–C) to these 198,832 hospital abstracts, a total of 23,876 combinations were made with a breakdown of:
• 334 (1.4%) Type A • 22,387 (93.8%) Type B • 1155 (4.8%) Type C
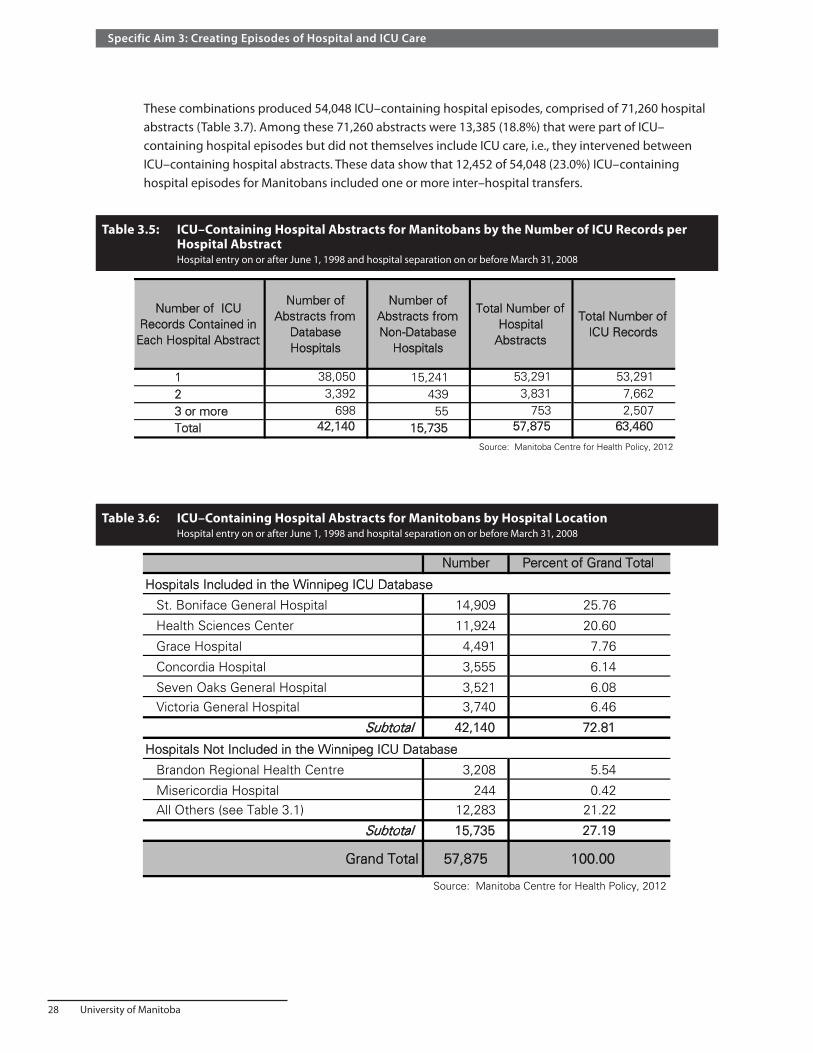
28 University of Manitoba
Specific Aim 3: Creating Episodes of Hospital and ICU Care
These combinations produced 54,048 ICU–containing hospital episodes, comprised of 71,260 hospital abstracts (Table 3.7). Among these 71,260 abstracts were 13,385 (18.8%) that were part of ICU–containing hospital episodes but did not themselves include ICU care, i.e., they intervened between ICU–containing hospital abstracts. These data show that 12,452 of 54,048 (23.0%) ICU–containing hospital episodes for Manitobans included one or more inter–hospital transfers.
Table 3.5: ICU–Containing Hospital Abstracts for Manitobans by the Number of ICU Records per Hospital Abstract Hospital entry on or after June 1, 1998 and hospital separation on or before March 31, 2008
Number of ICU Records Contained in
Each Hospital Abstract
Number of Abstracts from
Database Hospitals
Number of Abstracts from Non-Database
Hospitals
Total Number of Hospital
Abstracts
Total Number of ICU Records
1 38,050 15,241 53,291 53,2912 3,392 439 3,831 7,6623 or more 698 55 753 2,507Total 42,140 15,735 57,875 63,460
Source: Manitoba Centre for Health Policy, 2012
Table 3.5: ICU-Containing Hospital Abstracts for Manitobans by the Number of ICU Records per Hospital Abstract
Hospital entry on or after June 1, 1998 and hospital separation on or before March 31, 2008
Table 3.6: ICU–Containing Hospital Abstracts for Manitobans by Hospital Location Hospital entry on or after June 1, 1998 and hospital separation on or before March 31, 2008
Number Percent of Grand Total
Hospitals Included in the Winnipeg ICU Database
St. Boniface General Hospital 14,909 25.76
Health Sciences Center 11,924 20.60
Grace Hospital 4,491 7.76
Concordia Hospital 3,555 6.14
Seven Oaks General Hospital 3,521 6.08 Victoria General Hospital 3,740 6.46
Subtotal 42,140 72.81
Hospitals Not Included in the Winnipeg ICU Database
Brandon Regional Health Centre 3,208 5.54
Misericordia Hospital 244 0.42 All Others (see Table 3.1) 12,283 21.22
Subtotal 15,735 27.19
Grand Total 57,875 100.00
Source: Manitoba Centre for Health Policy, 2012
Table 3.6: ICU-Containing Hospital Abstracts for Manitobans by Hospital Location Hospital entry on or after June 1, 1998 and hospital separation on or before March 31, 2008

Manitoba Centre for Health Policy 29
The Epidemiology and Outcomes of Critical Illness in Manitoba
Results Part 3: Construct ICU Episodes from Individual ICU Records for Manitobans
Table 3.8 displays ICU–containing hospital episodes for Manitobans according to the number of separate ICU records per hospital episode. Conforming to the rules discussed previously, we sought to combine ICU records within the 7,246 (13.4%) ICU–containing hospital episodes that contained multiple ICU records; this relatively small percent greatly diminished the overall impact of any errors that resulted from the combination rules used.
Linking ICU records when a later ICU record began less than 48 hours after an earlier record ended led to the 63,460 ICU records being incorporated into 57,009 distinct ICU episodes (Table 3.9). Thus, among Manitobans 5,371 ICU episodes (9.4%) included inter–ICU transfers, with 899 ICU episodes (1.6%) having two or more such transfers. Finally, Table 3.10 shows that 2,630 of these 54,048 ICU–containing hospital episodes (4.9%) contained multiple ICU episodes; 269 such hospital episodes (0.5%) had three or more ICU episodes.
Table 3.7: ICU–Containing Hospital Episodes for Manitobans by the Number of Hospital Abstracts per Hospital Episode Hospital entry on or after June 1, 1998 and hospital separation on or before March 31, 2008
Number PercentTotal
NumberPercent
1 41,596 76.96 41,596 58.372 8,715 16.12 17,430 24.463 3,083 5.70 9,249 12.984 421 0.78 1,684 2.365 158 0.29 790 1.116 45 0.08 270 0.387 16 0.03 112 0.168 6 0.01 48 0.079 or more (range 9-14) 8 0.01 81 0.11Total 54,048 100.00 71,260 100.00
Column percentages are shown Source: Manitoba Centre for Health Policy, 2012
Table 3.7: ICU-Containing Hospital Episodes for Manitobans by the Number of Hospital Abstracts per Hospital Episode
Hospital entry on or after June 1, 1998 and hospital separation on or before March 31, 2008
Hospital Episodes Hospital AbstractsNumber of Hospital Abstracts
Comprising the Hospital Episode
Table 3.8: ICU–Containing Hospital Episodes for Manitobans by the Number of ICU Records per Hospital Episode Hospital entry on or after June 1, 1998 and hospital separation on or before March 31, 2008
Number PercentTotal
NumberPercent
1 46,802 86.59 46,802 73.752 5,641 10.44 11,282 17.783 1,225 2.27 3,675 5.794 267 0.49 1068 1.685 75 0.14 375 0.596 19 0.04 114 0.187 13 0.02 91 0.148 or more (range 8-11) 6 0.01 53 0.08Total 54,048 100.00 63,460 100.00
Column percentages are shown. Source: Manitoba Centre for Health Policy, 2012
Hospital Episodes ICU Records
Table 3.8: ICU-Containing Hospital Episodes for Manitobans by the Number of ICU Records per Hospital Episode
Hospital entry on or after June 1, 1998 and hospital separation on or before March 31, 2008
Number of ICU Records Contained in Each Hospital Episode
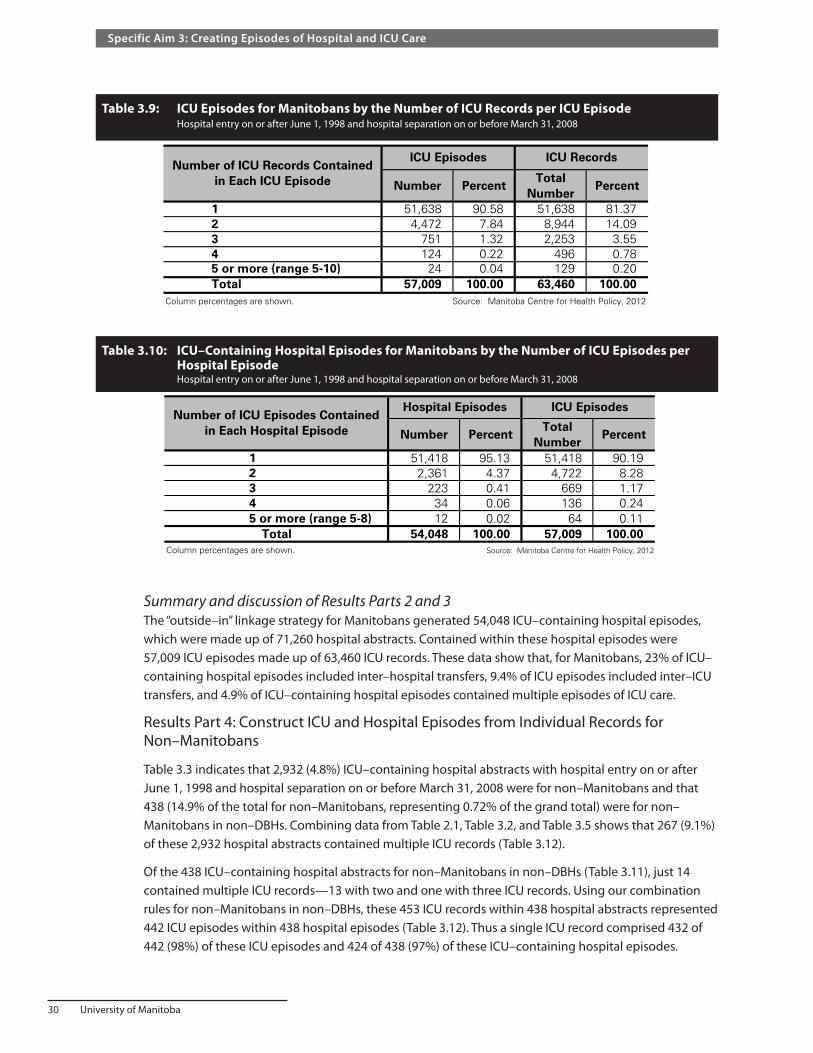
30 University of Manitoba
Specific Aim 3: Creating Episodes of Hospital and ICU Care
Summary and discussion of Results Parts 2 and 3The “outside–in” linkage strategy for Manitobans generated 54,048 ICU–containing hospital episodes, which were made up of 71,260 hospital abstracts. Contained within these hospital episodes were 57,009 ICU episodes made up of 63,460 ICU records. These data show that, for Manitobans, 23% of ICU–containing hospital episodes included inter–hospital transfers, 9.4% of ICU episodes included inter–ICU transfers, and 4.9% of ICU–containing hospital episodes contained multiple episodes of ICU care.
Results Part 4: Construct ICU and Hospital Episodes from Individual Records for Non–Manitobans
Table 3.3 indicates that 2,932 (4.8%) ICU–containing hospital abstracts with hospital entry on or after June 1, 1998 and hospital separation on or before March 31, 2008 were for non–Manitobans and that 438 (14.9% of the total for non–Manitobans, representing 0.72% of the grand total) were for non–Manitobans in non–DBHs. Combining data from Table 2.1, Table 3.2, and Table 3.5 shows that 267 (9.1%) of these 2,932 hospital abstracts contained multiple ICU records (Table 3.12).
Of the 438 ICU–containing hospital abstracts for non–Manitobans in non–DBHs (Table 3.11), just 14 contained multiple ICU records—13 with two and one with three ICU records. Using our combination rules for non–Manitobans in non–DBHs, these 453 ICU records within 438 hospital abstracts represented 442 ICU episodes within 438 hospital episodes (Table 3.12). Thus a single ICU record comprised 432 of 442 (98%) of these ICU episodes and 424 of 438 (97%) of these ICU–containing hospital episodes.
Table 3.9: ICU Episodes for Manitobans by the Number of ICU Records per ICU Episode Hospital entry on or after June 1, 1998 and hospital separation on or before March 31, 2008
Table 3.10: ICU–Containing Hospital Episodes for Manitobans by the Number of ICU Episodes per Hospital Episode Hospital entry on or after June 1, 1998 and hospital separation on or before March 31, 2008
Number PercentTotal
NumberPercent
1 51,638 90.58 51,638 81.372 4,472 7.84 8,944 14.093 751 1.32 2,253 3.554 124 0.22 496 0.785 or more (range 5-10) 24 0.04 129 0.20Total 57,009 100.00 63,460 100.00
Column percentages are shown. Source: Manitoba Centre for Health Policy, 2012
Table 3.9: ICU Episodes for Manitobans by the Number of ICU Records per ICU Episode
Hospital entry on or after June 1, 1998 and hospital separation on or before March 31, 2008
ICU Episodes ICU RecordsNumber of ICU Records Contained
in Each ICU Episode
Number PercentTotal
NumberPercent
1 51,418 95.13 51,418 90.192 2,361 4.37 4,722 8.283 223 0.41 669 1.174 34 0.06 136 0.245 or more (range 5-8) 12 0.02 64 0.11
Total 54,048 100.00 57,009 100.00Column percentages are shown. Source: Manitoba Centre for Health Policy, 2012
Table 3.10: ICU-Containing Hospital Episodes for Manitobans by the Number of ICU Episodes per Hospital Episode
Hospital entry on or after June 1, 1998 and hospital separation on or before March 31, 2008
Hospital Episodes ICU EpisodesNumber of ICU Episodes Contained
in Each Hospital Episode

Manitoba Centre for Health Policy 31
The Epidemiology and Outcomes of Critical Illness in Manitoba
Tabl
e 3.
11:
ICU
–Con
tain
ing
Hos
pita
l Abs
trac
ts fo
r Non
–Man
itob
ans
by th
e N
umbe
r of I
CU R
ecor
ds p
er H
ospi
tal A
bstr
act a
nd H
ospi
tal T
ype
H
ospi
tal e
ntry
on
or a
fter
June
1, 1
998
and
hosp
ital s
epar
atio
n on
or b
efor
e M
arch
31,
200
8
Nu
mb
er
Per
cen
tC
um
ula
tive
N
um
ber
P
erce
nt
Nu
mb
er
Per
cen
tC
um
ula
tive
N
um
ber
P
erce
nt
Nu
mb
er
Per
cen
tC
um
ula
tive
N
um
ber
P
erce
nt
12,
241
89.8
62,
241
79.7
242
496
.80
424
93.6
02,
665
90.8
92,
665
81.6
52
or
mo
re25
310
.14
570
20.2
814
3.20
296.
4026
79.
1159
918
.35
To
tal
2,49
410
0.00
2,81
110
0.00
438
100.
0045
310
0.00
2,93
210
0.00
3,26
410
0.00
Col
umn
perc
enta
ges
are
show
n.S
ourc
e: M
anito
ba C
entr
e fo
r H
ealth
Pol
icy,
201
2
Tab
le 3
.11:
ICU
-Co
nta
inin
g H
osp
ital
Ab
stra
cts
for
No
n-M
anit
ob
ans
by
the
Nu
mb
er o
f IC
U R
eco
rds
per
Ho
spit
al A
bst
ract
an
d H
osp
ital
Typ
eH
ospi
tal e
ntry
on
or a
fter
Jun
e 1,
199
8 an
d ho
spita
l sep
arat
ion
on o
r be
fore
Mar
ch 3
1, 2
008
Dat
abas
e H
osp
ital
sN
on
-Dat
abas
e H
osp
ital
sD
atab
ase
and
No
n-D
atab
ase
Ho
spit
als
Ho
spit
al A
bst
ract
sIC
U R
eco
rds
Ho
spit
al A
bst
ract
sIC
U R
eco
rds
Ho
spit
al A
bst
ract
sIC
U R
eco
rds
Nu
mb
er o
f IC
U R
eco
rds
Co
nta
ined
in
Eac
h
Ho
spit
al
Ab
stra
ct

32 University of Manitoba
Specific Aim 3: Creating Episodes of Hospital and ICU Care
Using our combination rules for non–Manitobans in DBHs, the 2,811 ICU records within 2,494 hospital abstracts represented 2,533 ICU episodes within 2,421 hospital episodes (Table 3.13 and Table 3.14). Thus a single ICU record comprised 2,293 of 2,533 (91%) of these ICU episodes and 2,116 of 2,421 (87%) of these ICU–containing hospital episodes.
Table 3.12: ICU Episodes in Non–Database Hospitals for Non–Manitobans by the Number of ICU Records per ICU Episode Hospital entry on or after June 1, 1998 and hospital separation on or before March 31, 2008
Table 3.13: ICU Episodes in Database Hospitals for Non–Manitobans by the Number of ICU Records per ICU Episode Hospital entry on or after June 1, 1998 and hospital separation on or before March 31, 2008
Table 3.14: ICU–Containing Hospital Episodes in Database Hospitals for Non–Manitobans by the Number of ICU Records and the Number of Hospital Abstracts per Hospital Episode Hospital entry on or after June 1, 1998 and hospital separation on or before March 31, 2008
Number PercentCumulative
Number Percent
1 432 97.74 432 95.362 or 3 10 2.26 21 4.64Total 442 100.00 453 100.00
Column percentages are shown Source: Manitoba Centre for Health Policy, 2012
Table 3.12: ICU Episodes in Non-Database Hospitals for Non-Manitobans by the Number of ICU Records per ICU Episode
Hospital entry on or after June 1, 1998 and hospital separation on or before March 31, 2008
ICU Episodes ICU RecordsNumber of ICU Records
Contained in Each ICU Episode
Number PercentCumulative
NumberPercent
1 2,293 90.53 2,293 81.572 211 8.33 422 15.013 23 0.91 69 2.454-6 6 0.24 27 0.96Total 2,533 100.00 2,811 100.00
Column percentages are shown Source: Manitoba Centre for Health Policy, 2012
Table 3.13: ICU Episodes in Database Hospitals for Non-Manitobans by the Number of ICU Records per ICU Episode
Hospital entry on or after June 1, 1998 and hospital separation on or before March 31, 2008
ICU Episodes ICU RecordsNumber of ICU Records Contained
in Each ICU Episode
1 2- 3 Number Percent2,116 0 2,116 87.40
193 53 246 10.1643 16 59 2.44
Number 2,352 69Percent 97.15 2.85
Final row and column percentages are fractions of the total 2,421 ICU-containing hospital episodes
Source: Manitoba Centre for Health Policy, 2012
Total2,421
100.00
Number of Hospital Abstracts per Hospital Episode
23 - 7
Table 3.14: ICU-Containing Hospital Episodes in Database Hospitals for Non-Manitobans by the Number of ICU Records and the Number of Hospital Abstracts per Hospital
Episode Hospital entry on or after June 1, 1998 and hospital separation on or before March 31, 2008
Number of ICU Records per Hospital Episode
Total Hospital Episodes
1

Manitoba Centre for Health Policy 33
The Epidemiology and Outcomes of Critical Illness in Manitoba
Summary and discussion of Results Part 4Our linkage strategy for non–Manitobans generated 2,859 ICU–containing hospital episodes, which contained 2,975 ICU episodes made up of 3,264 ICU records. Among these records, abstracts, and episodes, 13.9–15.3% were from non–DBHs. These data show that for non–Manitobans, 69 of 2,859 ICU–containing hospital episodes (2.4%, all from DBHs due to the limitations from non–DBHs as discussed) included transfers between Manitoba hospitals; 250 of 2,975 ICU episodes (8.4%, 240 from DBHs and 10 from non–DBHs) included inter–ICU transfers; and 98 of 2,859 of ICU–containing hospital episodes (3.4%, 94 from DBHs and four from non–DBHs) contained multiple ICU episodes.
Additional Discussion of Specific Aim 3Using data from the WICUDB and the hospital abstracts, we identified 59,984 episodes of ICU care, contained in 56,907 hospital episodes during the nine–year study period (Table 3.15, Table 3.16, and Appendix Table A3.5). Non–Manitobans accounted for approximately 5% of ICU use in the province (Table 3.15). The proportion of these non–Manitobans who received ICU care in non–DBHs was 15.3% (438 of 2,859, Appendix Table A3.5), representing just 0.77% of all ICU–containing hospital episodes in the province.
A potentially important issue for this Specific Aim was our choice that two records were considered to be part of the same episode of ICU or hospital care if the recorded time between the end of the first record and the start of the second record was less than 48 hours (or two calendar days). This is a generous interval and other choices, such as 24 hours, could have been made. Choosing a longer interval will result in some readmissions being miscoded as being part of the same episode of care. On the other hand, choosing a shorter interval will result in some inter–ICU and/or inter–hospital transfers being miscoded as being part of separate episodes of care. Our choice of the 48 hours interval, rather than 24 hours, was based on several considerations.
• As hospital abstracts in the pre–2004 period included dates without times of entry and separation, it was necessary that the allowed inter–record time interval be at least one calendar day or 24 hours; otherwise transfers that began before midnight and ended after midnight would all be misclassified as separate episodes of care.
• We lengthened this required minimum interval to allow for an expected, occasional miscoding by plus or minus one day of hospital entry or separation timing.
• We recognized, most importantly, that our reason for combining records into an episode of care was to identify conceptual episodes of care, i.e., two records could reasonably be considered part of the same episode of illness if it was likely that the reasons for the two admissions were the same. This was motivated by data showing that ICU readmission after a shorter interval is more likely to be for the same reason as the prior ICU stay (Rosenberg et al., 2001). Accordingly, we were more willing to accept inaccurately combining two separate episodes separated by less than 48 hours, than inaccurately dividing a single episode into two.
• Relatively little error results from the choice of a 48 hours versus 24 hour threshold, as only 6.7% of all time intervals between ICU records were in this range (Appendix Table A3.3).
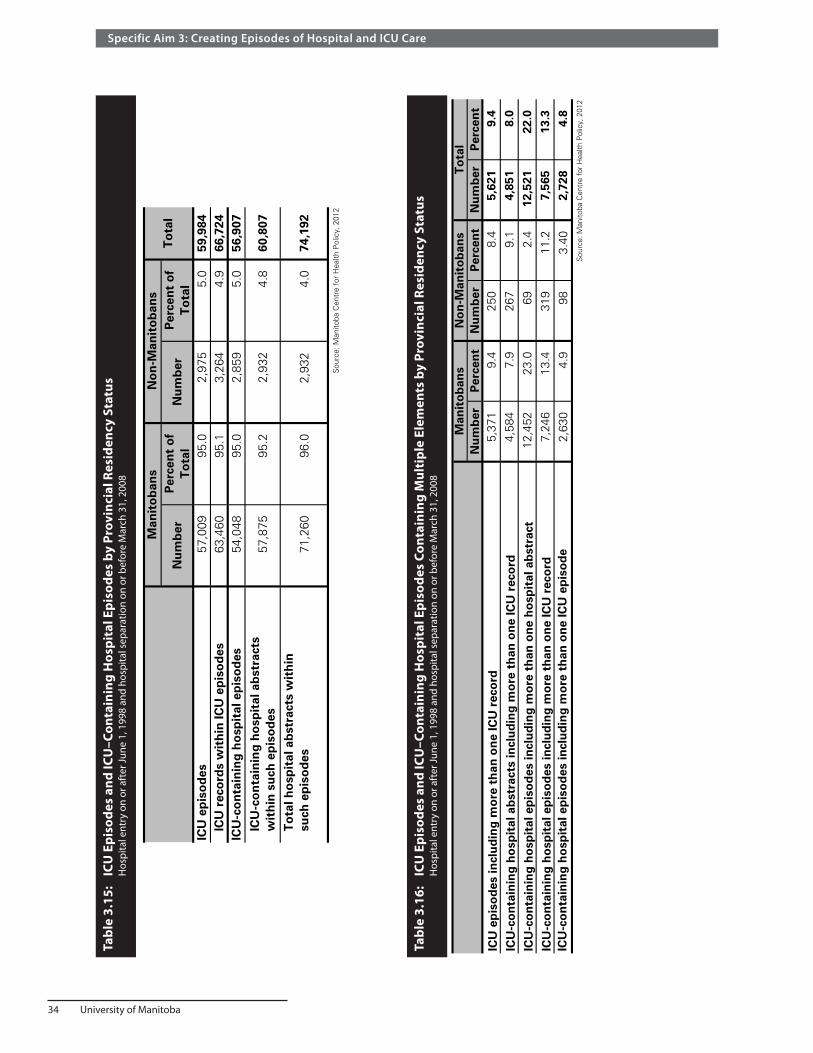
34 University of Manitoba
Specific Aim 3: Creating Episodes of Hospital and ICU Care
Tabl
e 3.
15:
ICU
Epi
sode
s an
d IC
U–C
onta
inin
g H
ospi
tal E
piso
des
by P
rovi
ncia
l Res
iden
cy S
tatu
s
Hos
pita
l ent
ry o
n or
aft
er Ju
ne 1
, 199
8 an
d ho
spita
l sep
arat
ion
on o
r bef
ore
Mar
ch 3
1, 2
008
Tabl
e 3.
16:
ICU
Epi
sode
s an
d IC
U–C
onta
inin
g H
ospi
tal E
piso
des
Cont
aini
ng M
ulti
ple
Elem
ents
by
Prov
inci
al R
esid
ency
Sta
tus
H
ospi
tal e
ntry
on
or a
fter
June
1, 1
998
and
hosp
ital s
epar
atio
n on
or b
efor
e M
arch
31,
200
8
Nu
mb
erP
erce
nt
of
To
tal
Nu
mb
erP
erce
nt
of
To
tal
ICU
ep
iso
des
57,0
0995
.02,
975
5.0
59,9
84IC
U r
eco
rds
wit
hin
ICU
ep
iso
des
63,4
6095
.13,
264
4.9
66,7
24IC
U-c
on
tain
ing
ho
spit
al e
pis
od
es54
,048
95.0
2,85
95.
056
,907
ICU
-co
nta
inin
g h
osp
ital
ab
stra
cts
wit
hin
su
ch e
pis
od
es57
,875
95.2
2,93
24.
860
,807
To
tal h
osp
ital
ab
stra
cts
wit
hin
su
ch e
pis
od
es IC
U-c
on
tain
ing
h
osp
ital
ep
iso
des
71,2
6096
.02,
932
4.0
74,1
92
Sou
rce:
Man
itoba
Cen
tre
for
Hea
lth P
olic
y, 2
012
Tab
le 3
.15:
IC
U E
pis
od
es a
nd
ICU
-Co
nta
inin
g H
osp
ital
Ep
iso
des
by
Pro
vin
cial
Res
iden
cy S
tatu
sH
ospi
tal e
ntry
on
or a
fter
Jun
e 1,
199
8 an
d ho
spita
l sep
arat
ion
on o
r be
fore
Mar
ch 3
1, 2
008
Man
ito
ban
sN
on
-Man
ito
ban
sT
ota
l
Nu
mb
er
Per
cen
tN
um
ber
P
erce
nt
Nu
mb
er
Per
cen
t
ICU
ep
iso
des
incl
ud
ing
mo
re t
han
on
e IC
U r
eco
rd5,
371
9.4
250
8.4
5,62
19.
4
ICU
-co
nta
inin
g h
osp
ital
ab
stra
cts
incl
ud
ing
mo
re t
han
on
e IC
U r
eco
rd4,
584
7.9
267
9.1
4,85
18.
0
ICU
-co
nta
inin
g h
osp
ital
ep
iso
des
incl
ud
ing
mo
re t
han
on
e h
osp
ital
ab
stra
ct12
,452
23.0
692.
412
,521
22.0
ICU
-co
nta
inin
g h
osp
ital
ep
iso
des
incl
ud
ing
mo
re t
han
on
e IC
U r
eco
rd7,
246
13.4
319
11.2
7,56
513
.3IC
U-c
on
tain
ing
ho
spit
al e
pis
od
es in
clu
din
g m
ore
th
an o
ne
ICU
ep
iso
de
2,63
04.
998
3.40
2,72
84.
8S
ourc
e: M
anito
ba C
entr
e fo
r H
ealth
Pol
icy,
201
2
Tab
le 3
.16:
ICU
Ep
iso
des
an
d IC
U-C
on
tain
ing
Ho
spit
al E
pis
od
es C
on
tain
ing
Mu
ltip
le E
lem
ents
by
Pro
vin
cial
Res
iden
cy S
tatu
sH
ospi
tal e
ntry
on
or a
fter
Jun
e 1,
199
8 an
d ho
spita
l sep
arat
ion
on o
r be
fore
Mar
ch 3
1, 2
008
Man
ito
ban
sN
on
-Man
ito
ban
sT
ota
l

Manitoba Centre for Health Policy 35
The Epidemiology and Outcomes of Critical Illness in Manitoba
Specific Aim 4: Population–Based Description of ICU Use and ICU Patients
Statement of the Specific AimTo quantify ICU use and the characteristics and illnesses of ICU patients.
Summary of the Specific AimThis Specific Aim covers a large amount of information including:
• ICU bed supply and use • Demographic and chronic health characteristics of ICU patients • Population–based rates of ICU care, including trends over time, and differences related to sex, age,
socioeconomic status (SES), and residency location • Types and severity of acute illness related to ICU care, including trends over time and significant
differences between subgroups of patients
In 2007 Manitoba had 9.8 ICU beds per 100,000 population for the entire province and 13.4 in the WRHA. Comparatively the Canadian average is 13.5. On an annual basis, there were approximately 6,300 episodes of ICU care in the province. Five percent of these episodes were for non–Manitobans. Repeated use of ICU was not rare with approximately 16% of ICU patients having been in an ICU before. Cumulative ICU bed–days increased a modest 1.2% annually over the study period. Rural ICUs accounted for 23% of ICU beds but only 10% of total ICU bed–days.
A detailed analysis of ICU bed use showed considerable fluctuation in day–to–day ICU demand. For example, in 2006/07 ICU bed use reached full capacity on less than 5% of days in Winnipeg and less than 1% of days in other parts of the province. An important implication of fluctuation in bed demand is that estimates of ICU bed needs derived from yearly averages significantly underestimate actual needs by not allowing for adequate capacity when there is a sudden increase in demand, referred to as “surge capacity”. Determining ICU bed needs is a complex exercise that must take account of a number of considerations in addition to actual use.
Over the study period, 0.6% of adult Manitobans were admitted to ICUs each year. This was 0.5% if limited to care in the high–intensity (urban) ICUs. This rate increased steeply with age, with over 2% of Manitobans aged 75 and older being admitted to ICUs each year. The population–based rates of ICU care for Manitobans decreased slightly with time over the nine–year period of analysis. There were marked differences in the population–based rates of ICU care between different subgroups, e.g., by sex, age, etc.
The average age of patients admitted to ICUs was 64. Men accounted for 60% of ICU patients. Manitobans admitted to ICUs showed substantial burdens of comorbidities. Cardiovascular conditions were the most common cause of ICU admissions, comprising approximately 60% of all ICU patients. Other top categories of illness prompting ICU admission were the category that includes consequences of severe infection (12%), followed by respiratory disorders (12%) and trauma/poisonings (7%). The most notable trends over the study period were a substantial decline in ICU admissions related to cardiovascular conditions (consistent with documented decreases in heart attack and stroke rates) and a substantial increase in disorders related to infections or sepsis (a consequence of severe infection).Average severity of acute illness at the time of ICU admission increased slightly over the nine–year study period. Surprisingly, it differed little with age.

36 University of Manitoba
Specific Aim 4: Population–Based Description of ICU Use and ICU Patients
In addition, these analyses have shown that rural and urban ICUs are utilized quite differently. First, the severity of acute illness and burden of comorbidity was, on average, much lower for ICU episodes limited to rural ICUs when compared to those that included any time in an urban ICU. Second, rural residents experienced higher population–based rates of ICU use. Together, these analyses indicate that many or most patients admitted to rural ICUs are less ill than those in urban ICUs.
MethodsMethods: Definitions, Preliminary Steps, and General Methods
For this and the subsequent Specific Aims, we restricted the data to ICU–containing hospital episodes with final hospital separation during the nine years 1999/2000 to 2007/08, inclusive. Thus, in comparison to the time span evaluated in Specific Aim 3, we removed from consideration hospital episodes with entry on or after June 1, 1998 and separation on or before March 31, 1999, and the ICU episodes contained therein. This simplified and improved subsequent analyses because:
• The remaining data represented nine complete years of data • It ensured that during our entire study period the WICUDB included all ICUs in Winnipeg by
excluding the brief period during which the ICU at Misericordia Hospital was in existence but not included in the WICUDB, i.e., before it was permanently closed in March 1999.
• By excluding from consideration the 10 months of data from June 1, 1998 to March 31, 1999, we ensured that information about ICU care in DBHs would be available unless a hospital episode had exceeded 10 months in duration.
We note again that the time span covered did not include the H1N1 influenza outbreak that occurred during 2009/10. Therefore the results in this report provide baseline results against which analyses of that pandemic experience could be compared.
Some of the analyses in Specific Aims 4–6 assessed changes over the nine complete years of data. We assigned hospital episodes, and the ICU episodes contained within them, to a given year if the final hospital discharge date was within the year boundaries. While this does not precisely provide the number of hospital or ICU days in that year, it is a consistent approach that does not bias time series results and is also convenient, practical, and commonly used.
As previously discussed, the only ICUs in the province with the personnel and equipment to indefinitely care for critically ill patients requiring artificial life support are in the six DBHs in Winnipeg and the ICU at the Brandon Regional Health Centre. These ICUs, which we refer to as the urban or high–intensity ICUs, have nurse to patient ratios between one–to–one and one–to–two. All other ICUs in Manitoba, which we refer to as being the rural or low–intensity ICUs, have lower nurse to patient ratios and are able to care for patients on artificial life support, such as mechanical ventilation, only for limited amounts of time. We planned separate analyses of these subsets, based on our a priori hypothesis that patients whose ICU care was confined to rural ICUs substantially differed from those who needed care in high–intensity ICUs.
With the hospital and ICU episodes identified in Specific Aim 3, as made up of hospital abstracts and ICU records respectively, we refer to the initial entry date of an entire episode as the admission date. Similarly, the final separation date of an entire episode will be referred to as the discharge date.

Manitoba Centre for Health Policy 37
The Epidemiology and Outcomes of Critical Illness in Manitoba
A few comments are in order regarding ICU length of stay (LOS) in this Specific Aim where the goal of tracking LOS was to calculate cumulative use of medical resources. Toward this end, LOS for an ICU episode was taken as the sum of LOS of the individual ICU records comprising the ICU episode. The starting and ending points of ICU records in DBHs derive from the WICUDB and thus include dates and times. For ICU records in non–DBHs the starting and ending points of ICU records come from hospital abstracts; thus while these included dates and times post–2004, only dates were recorded pre–2004. Accordingly, ICU entry and separation from hospital abstracts pre–2004 were taken to have occurred, respectively, at noon and 11:59 a.m. Lastly, while all lengths of stay are expressed in days, this does not mean the same thing for all intervals. LOS based on differences in dates and times represent the true fraction of 24 hours of time. However, for LOS based on differences in dates, the number reflects whole or partial calendar days; for example, a hospital LOS of two days means the patient was in the hospital for all or parts of two successive calendar days, and thus the true interval could be anywhere from 2–48 hours. It is known that for cumulative data, errors in mean LOS resulting from such inaccuracy are minor (Jegers, Edbrooke, Hibbert, Chalfin, & Burchardi, 2002). We note that this method for ICU LOS is different than we use in Specific Aim 5 where the goal of tracking LOS was to identify the interval over which individual patients needed ICU care. In both Specific Aim 4 and Specific Aim 5, the LOS for a hospital episode was taken as the interval between the hospital admission date/time and the hospital discharge date/time.
We calculated the population–based rate of ICU care for each year as the number of unique individuals who had one or more ICU episodes during that year divided by the number of Manitobans aged 17 and older in that year, as obtained from the Registry. Rates of ICU care for specific subsets of people (e.g., men or those 60–64 years old) were similarly calculated using the analogously defined numerators and denominators.
For rates of ICU care by categories other than age (i.e., sex, SES, residency location), we present age–adjusted values unless otherwise indicated. This was done in order to account for differing age structures between categories. Age–adjustment was performed using the method of direct age–adjustment relative to the Manitoba population in 2007/08 (Gordis, 2000). For some of the data tables in this Specific Aim, unadjusted versions are presented in the Appendix 4.
Statistical comparisons used t–tests for means and Fisher’s exact test or Chi–square tests for proportions.
Methods: ICU Bed Use and Estimation of Need for ICU Beds
Administrators commonly use ICU patient count data to estimate the need for ICU beds under the reasonable assumption that bed use reflects bed demand. This effort is complicated by the fact that ICU use (demand) fluctuates greatly over short timescales of hours to days. However, attempts to estimate the number of beds needed often use measurements of bed use averaged over much longer timescales, typically a year. We compared different methods for calculating ICU bed use, and present those data as part of the basis for estimating the number of ICU beds needed. Potential limitations of using count data to estimate bed needs are elaborated in the Summary and Discussion of Part 3 of this Specific Aim.
To clarify the details of actual use of ICU beds, we used ICU entry and separation timing to calculate the maximum number of beds simultaneously occupied at any point throughout the day. This was calculated separately for each day in each hospital or cumulatively for all hospitals in a defined geographic region. This parameter, which we have named the Daily Peak Bed Occupancy (DPBO), is the maximum number of ICU beds simultaneously occupied at any time during that day.

38 University of Manitoba
Specific Aim 4: Population–Based Description of ICU Use and ICU Patients
For the six DBHs, the WICUDB was the source of the ICU entry and separation timing. For all other hospitals we derived that information from the hospital abstracts, as validated in Specific Aim 2. This was straightforward for post–2004 period, where both the date and time of ICU entry and ICU separation were recorded. In the pre–2004 period, where hospital abstracts only contain dates, we assigned ICU entry and separation as having occurred at noon, except when they were on the same calendar day. That situation was addressed by reference to the finding that the mean ICU LOS for such patients was, in the post–2004 period, 6 hours; extrapolating this to pre–2004 data, such patients were assigned ICU entry at noon and ICU separation at 6 p.m. The final detail for this calculation recognizes that there could be inaccuracy in count calculations due to omission of ICU patients not included in our data due to discharge after March 31, 2008. For this reason, we excluded the final one–year of data from these calculations, leaving the eight years 1999/2000–2006/07 for these analyses.
A key, but variable, feature in these analyses was the level of conglomeration across individual ICUs. Conglomeration of multiple ICUs indicates that they were considered to function as if they were a single ICU. The practical implication of conglomeration across hospitals is that any patient needing ICU admission at a hospital whose ICU is at capacity could be admitted without difficulty to an ICU bed in one of the other related ICUs that still has an opening. Thus, there would be no difficulty admitting new ICU patients across any of the conglomerated ICUs or hospitals until all the conglomerated ICU beds were filled. Accordingly, there is an unfettered ability to transfer patients from any of the conglomerated ICUs to any other.
For this Specific Aim, we always assumed conglomeration of ICUs within a given hospital; noting that this only applied to the two hospitals with multiple ICUs—St. Boniface General Hospital and the Health Sciences Centre (Table 4.1). For some of these analyses, we assumed conglomeration of ICU beds at the level of geographic regions or the entire province. We defined five regions for this purpose:
• Winnipeg with 11 ICUs within six hospitals • Brandon with a single ICU in one hospital • North with three ICUs in three hospitals • Mid with two ICUs in two hospitals • Rural South with four ICUs in four hospitals
The North, Mid and Rural South regions are all rural in nature. Similar to conglomeration within a hospital, conglomeration of ICUs within a region having ICUs in multiple hospitals assumes that they functioned as if they were a single ICU, comprised of all the ICU beds in all the hospitals in that region.
We assessed four different methods of calculating ICU bed use:
Method 1: Yearly Average Bed–Days MethodEach patient’s ICU LOS was calculated as the period between the ICU admission time/date and the ICU discharge time/date. ICU LOS was expressed as days (or portions of days). For each year, for each hospital or region, we summed the ICU LOS across all individuals to generate the annual cumulative ICU patient–days. Using this calculation and accounting for leap years:
Yearly average ICU bed use = Annual cumulative ICU patient–days / 365.25
We performed this calculation separately for each year. In addition to the yearly values, we calculated the unweighted average over the eight–year period of this analysis.

Manitoba Centre for Health Policy 39
The Epidemiology and Outcomes of Critical Illness in Manitoba
Tabl
e 4.
1:
Num
ber o
f Ava
ilabl
e IC
U B
eds
in M
anit
oba,
200
7/08
Tabl
e 4.
1: N
umbe
r of
Ava
ilabl
e IC
U B
eds
in M
anito
ba, 2
007/
08A
ggre
gate
A
rea
RH
AH
ospi
tal
Uni
tW
inni
peg
Med
ical
ICU
10(8
.5)
Sur
gica
l IC
U10
(8.5
)C
oron
ary
Car
e U
nit
3(2
.5)
Inte
rmed
iate
ICU
6(5
.1)
Med
ical
Sur
gica
l IC
U10
(8.5
)C
ardi
ac S
urgi
cal I
CU
10(8
.5)
Cor
onar
y C
are
Uni
t6
(5.1
)S
even
Oak
s G
ener
al H
ospi
tal
Com
bine
d M
edic
al S
urgi
cal U
nit
7(5
.9)
Gra
ce H
ospi
tal
Com
bine
d M
edic
al S
urgi
cal U
nit
7(5
.9)
Vic
toria
Gen
eral
Hos
pita
lC
ombi
ned
Med
ical
Sur
gica
l Uni
t6
(5.1
)C
onco
rdia
Hos
pita
lC
ombi
ned
Med
ical
Sur
gica
l Uni
t7
(5.9
)B
rand
onB
rand
on G
ener
al H
ospi
tal
Com
bine
d M
edic
al S
urgi
cal U
nit
9(7
.6)
9 1(7
7.1)
Bou
ndar
y Tr
ails
Hea
lth C
entr
e C
ombi
ned
Med
ical
Sur
gica
l Uni
t4
(3.4
)C
arm
an M
emor
ial H
ospi
tal
Com
bine
d M
edic
al S
urgi
cal U
nit
2(1
.7)
Por
tage
Dis
tric
t G
ener
al H
ospi
tal
Com
bine
d M
edic
al S
urgi
cal U
nit
4(3
.4)
Sou
th E
astm
anB
ethe
sda
Hos
pita
l C
ombi
ned
Med
ical
Sur
gica
l Uni
t3
(2.5
)In
terla
keS
elki
rk a
nd D
istr
ict
Gen
eral
Hos
pita
l C
ombi
ned
Med
ical
Sur
gica
l Uni
t2
(1.7
)P
arkl
and
Dau
phin
Reg
iona
l Hea
lth C
entr
eC
ombi
ned
Med
ical
Sur
gica
l Uni
t4
(3.4
)B
urnt
woo
dTh
omps
on G
ener
al H
ospi
tal
Com
bine
d M
edic
al S
urgi
cal U
nit
3(2
.5)
Flin
Flo
n G
ener
al H
ospi
tal I
nc.
Com
bine
d M
edic
al S
urgi
cal U
nit
2(1
.7)
The
Pas
Hea
lth C
ompl
ex
Com
bine
d M
edic
al S
urgi
cal U
nit
3(2
.5)
2 7(2
2.9)
118
Sou
rce:
Man
itoba
Cen
tre
for
Hea
lth P
olic
y, 2
012
Nor
-Man
Cen
tral
Rur
al S
outh
Sub
tota
l of
Rur
al S
outh
, Mid
and
Nor
th IC
U B
eds
Tota
l Num
ber
of IC
U B
eds
Thes
e nu
mbe
rs r
epre
sent
the
max
imum
num
ber
of b
eds
equi
pped
for
ICU
car
e; t
he a
ctua
l num
ber
avai
labl
e ca
n be
sm
alle
r. I
nfor
mat
ion
abou
t ru
ral I
CU
s ob
tain
ed f
rom
Man
itoba
Hea
lth b
ed m
ap.
Info
rmat
ion
abou
t ur
ban
ICU
s ob
tain
ed f
rom
Man
itoba
Hea
lth b
ed m
ap a
nd d
irect
dis
cuss
ion
with
ICU
nur
sing
man
ager
s.
Mid
Nor
th
Num
ber
(%) o
f IC
U B
eds
Urb
an
Sub
tota
l of
Urb
an IC
U b
eds
Hea
lth S
cien
ces
Cen
tre
St.
Bon
iface
Gen
eral
Hos
pita
l

40 University of Manitoba
Specific Aim 4: Population–Based Description of ICU Use and ICU Patients
This calculation has been used to estimate the number of ICU beds required by use of the Hill–Burton formula (Department of Health, 2000):
Number of ICU beds required = Yearly average ICU bed use Optimal occupancy rate
We used an optimal ICU occupacy rate of 80%, derived from data indicating that average ICU bed occupancy exceeding that value is associated with an unacceptable frequency of having to turn patients away due to being full and worse patient outcomes (Iapichino et al., 2004; McManus, Long, Cooper, & Litvak, 2004). This method, which attempts to allow for fluctuating demand via use of the single value for optimal occupancy rate, has been shown to be problematic (de Bruin, van Rossum, Visser, & Koole, 2007).
Method 2: Region–Level DPBO MethodFor each of the five geographic regions, the region–level method considered ICU beds as being freely shared or conglomerated within that region, producing bed use at the regional level. For each region, for each day, we calculated the region–level DPBO, i.e., irrespective of hospital or ICU identity within that region. The distribution of the 365 values of the DPBO for a year represents the daily fluctuations in regional ICU bed use during that year. For example, the 95th percentile of this distribution is the number of occupied ICU beds in the region that was exceeded on no more than 5% of days (i.e., 18 days per year). We calculated the median, 95th percentile, 99th percentile, and maximum values of the regionally conglomerated DPBO. We performed these calculations separately for each year and took the unweighted average over the eight–year period of this analysis.
Method 3: Hospital–Level DPBO MethodThe hospital–level method considered each hospital to be a self–contained entity, i.e., needing to fulfill its own demands for ICU beds entirely by itself. It conglomerated ICU beds only within hospitals. For each hospital, for each day, we calculated the hospital–level DPBO. The distribution of the 365 values of the DPBO for a year represents the daily fluctuations in that hospital’s ICU bed use during that year. The DPBO value for a given region on a given day was taken as the sum across all the hospitals in that region of the DPBO values for the individual hospitals. We calculated the median, 95th percentile, 99th percentile, and maximum values of this regional value of the hospital–level DPBO. We performed these calculations separately for each year and took the unweighted average over the eight–year period of this analysis.
The importance of the level of ICU conglomeration on DPBO is illustrated by two examples using a hypothetical region containing two hospitals each with a single four bed ICU. In the first example, we show how ICU conglomeration can influence the regional DPBO for a single day due to fluctuation in patient count over the course of the day. Consider a day where the ICU in Hospital A was full in the morning but had only two patients in the afternoon, while the ICU in Hospital B had one patient in the morning but was full in the afternoon. On that day there were never more than six patients in the eight beds at any given time; and, thus, the region–level DPBO (Method 2) for the region for that day, which considers these two ICUs to be conglomerated, was six. However, on that day each hospital had a hospital–level DPBO of four, so that the hospital–level DPBO (Method 3) for that region for that day was eight. For the second example, we show how ICU conglomeration can influence the distribution of the regional DPBO even without fluctuations in patient numbers over the course of a day. Table 4.2 lists the hospital–level DPBOs for each day of a single week. The final row shows that at no time during the week

Manitoba Centre for Health Policy 41
The Epidemiology and Outcomes of Critical Illness in Manitoba
were there more than six patients occupying ICU beds in the region; and, thus, the maximum value of the region–level DPBO (Method 2) for the region over that week was six. However, over the course of the week, each of the two hospitals had a DPBO of four, so that the hospital–level DPBO (Method 3) for that region for that week was eight.
Method 4: Provincial DPBO MethodThe provincial method considered ICU beds in the entire province as being shared or conglomerated and calculated bed use at the provincial level. For the whole province, for each day, we calculated the provincial DPBO, i.e., irrespective of hospital or regional identity. The distribution of the 365 values of the DPBO for a year identifies the daily fluctuations in provincial ICU bed use during that interval. We calculated the median, 95th percentile, 99th percentile, and maximum values of the regionally conglomerated DPBO. We performed these calculations separately for each year and took the unweighted average over the eight–year period of this analysis.
Methods: Patient Characteristics
To describe the characteristics of patients undergoing ICU care we assessed their age, sex, residency location, and SES. Characteristics of individuals with multiple ICU episodes in a given time interval were assessed only for the initial episode in that interval.
To be consistent with the method used for determining age in the general Manitoba population, the age of ICU patients was calculated as of December 31 of the year in question.
For Manitobans, residency location was assessed using the postal code of residence, as of December 31 of the year in question, listed in the Repository. Residency was then assigned to one of the 11 Regional Health Authorities (RHAs) in the province. The 11 RHAs were aggregated into five categories:
• Winnipeg RHA • Brandon RHA • Rural South RHAs (Assiniboine, Central, South Eastman) • North RHAs (NOR–MAN, Churchill, Burntwood) • Mid RHAs (Parkland, Interlake, North Eastman)
Additionally, these categories were further grouped into urban RHAs (Winnipeg and Brandon) and rural RHAs (the other nine RHAs) Since the administrative database contains no specific residency information for non–Manitobans, we could only assess residency for those in the WICUDB, i.e., for patients with ICU care in DBHs. We divided it into the Canadian provinces/territories, the United States, and other locations outside of Canada.
Table 4.2: Example Comparing Regionalized Daily Peak Bed Occupancy (DPBO) (Method 2) and Hospital–Level DPBO (Method 3) for Calculating Regional ICU Bed Usage Over One Week
Hospital Day 1 Day 2 Day 3 Day 4 Day 5 Day 6 Day 7Maximum Number of Beds Occupied at Any Point During this Week
Maximum ICU beds in use during that day
Hospital A DPBO 2 1 3 4 2 3 2 4 Hospital B DPBO 2 3 3 1 2 1 4 4Sum 4 4 6 5 4 4 6 8
Source: Manitoba Centre for Health Policy, 2012
Table 4.2: Example Comparing Regionalized Daily Peak Bed Occupancy (DPBO) (Method 2) and Hospital-Level DPBO (Method 3) for Calculating Regional ICU Bed Usage Over One Week
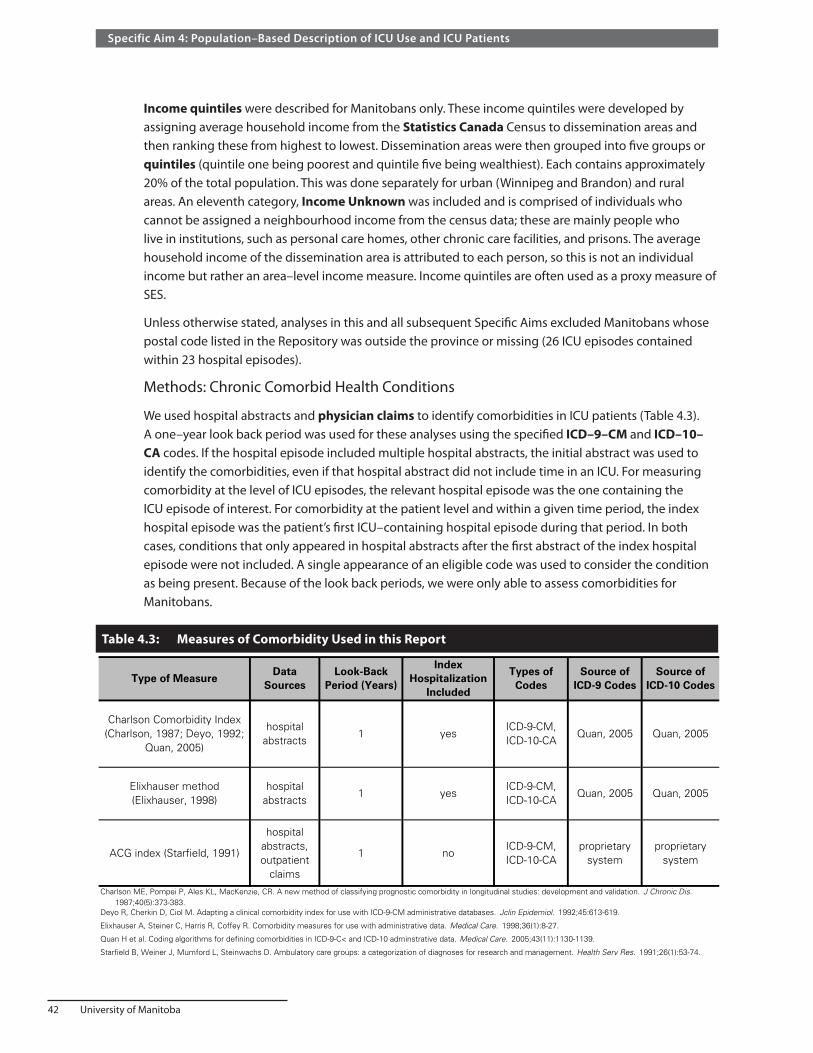
42 University of Manitoba
Specific Aim 4: Population–Based Description of ICU Use and ICU Patients
Income quintiles were described for Manitobans only. These income quintiles were developed by assigning average household income from the Statistics Canada Census to dissemination areas and then ranking these from highest to lowest. Dissemination areas were then grouped into five groups or quintiles (quintile one being poorest and quintile five being wealthiest). Each contains approximately 20% of the total population. This was done separately for urban (Winnipeg and Brandon) and rural areas. An eleventh category, Income Unknown was included and is comprised of individuals who cannot be assigned a neighbourhood income from the census data; these are mainly people who live in institutions, such as personal care homes, other chronic care facilities, and prisons. The average household income of the dissemination area is attributed to each person, so this is not an individual income but rather an area–level income measure. Income quintiles are often used as a proxy measure of SES.
Unless otherwise stated, analyses in this and all subsequent Specific Aims excluded Manitobans whose postal code listed in the Repository was outside the province or missing (26 ICU episodes contained within 23 hospital episodes).
Methods: Chronic Comorbid Health Conditions
We used hospital abstracts and physician claims to identify comorbidities in ICU patients (Table 4.3). A one–year look back period was used for these analyses using the specified ICD–9–CM and ICD–10–CA codes. If the hospital episode included multiple hospital abstracts, the initial abstract was used to identify the comorbidities, even if that hospital abstract did not include time in an ICU. For measuring comorbidity at the level of ICU episodes, the relevant hospital episode was the one containing the ICU episode of interest. For comorbidity at the patient level and within a given time period, the index hospital episode was the patient’s first ICU–containing hospital episode during that period. In both cases, conditions that only appeared in hospital abstracts after the first abstract of the index hospital episode were not included. A single appearance of an eligible code was used to consider the condition as being present. Because of the look back periods, we were only able to assess comorbidities for Manitobans.
Table 4.3: Measures of Comorbidity Used in this ReportTable 4.3: Measures of Comorbidity Used in this Report
ACG index (Starfield, 1991)
hospital abstracts, outpatient
claims
1 noICD-9-CM, ICD-10-CA
proprietary system
proprietary system
Source: Manitoba Centre for Health Policy, 2012
Charlson ME, Pompei P, Ales KL, MacKenzie, CR. A new method of classifying prognostic comorbidity in longitudinal studies: development and validation. J Chronic Dis. 1987;40(5):373-383.Deyo R, Cherkin D, Ciol M. Adapting a clinical comorbidity index for use with ICD-9-CM administrative databases. Jclin Epidemiol. 1992;45:613-619.
Elixhauser A, Steiner C, Harris R, Coffey R. Comorbidity measures for use with administrative data. Medical Care. 1998;36(1):8-27.
Quan H et al. Coding algorithms for defining comorbidities in ICD-9-C< and ICD-10 adminstrative data. Medical Care. 2005;43(11):1130-1139.
Starfield B, Weiner J, Mumford L, Steinwachs D. Ambulatory care groups: a categorization of diagnoses for research and management. Health Serv Res. 1991;26(1):53-74.
Elixhauser method (Elixhauser, 1998)
hospital abstracts
1 yes Quan, 2005ICD-9-CM,ICD-10-CA
Type of MeasureData
SourcesLook-Back
Period (Years)Types of
Codes
Charlson Comorbidity Index (Charlson, 1987; Deyo, 1992;
Quan, 2005)
hospital abstracts
1 yes
Index Hospitalization
Included
Source of ICD-10 Codes
ICD-9-CM, ICD-10-CA
Quan, 2005 Quan, 2005
Quan, 2005
Source of ICD-9 Codes
Manitoba Centre for Health Policy 43
The Epidemiology and Outcomes of Critical Illness in Manitoba
We used three systems of assessing comorbidity. First, we used the Charlson Comorbidity Index, as adapted by Deyo et al. for use with hospital administrative data. This index identifies 17 comorbidities and applies weights to produce a single score ranging from 0 to 32, which correlates with clinical outcomes such as mortality (Charlson, Pompei, Ales, & MacKenzie, 1987; Deyo, Cherkin, & Ciol, 1992; Quan et al., 2005). Within the 17 conditions are three mutually exclusive pairs:
• Diabetes with or without chronic complications • Liver disease graded as either mild or moderate/severe • Cancer or metastatic carcinoma
Second, we used the Elixhauser Comorbidity Index developed by Elixhauser et al. (1998). This method uses hospital administrative data to identify 31 conditions related to relevant hospital outcomes. Within these 31 conditions are three mutually exclusive pairs:
• Diabetes with chronic complications compared versus without chronic complications • Hypertension with chronic complications versus without chronic complications • Solid tumor with metastatic cancer versus without metastases
We used Quan’s ICD–10–CA and enhanced ICD–9–CM coding for identifying the individual Charlson and Elixhauser comorbidities (Quan et al., 2005).
Within our study period, Manitoba Health recognized that the coding of diabetes in hospital abstracts was inconsistent. Accordingly, in 2006/07 it created updated coding guidelines for diabetes, which are reflected by the shift between the subcategories of diabetes evident in our data (Table 4.4, final two columns of second and third data rows). Since the distinction between diabetes with and without complications was flawed before 2006/07, we collapsed those two categories. We generated a Charlson score weight of 1.77 for the combined diabetes category, calculated as the original weights of the individual categories (one and two, respectively), taken in proportion to their frequencies after the change in coding rules.
We used a third system, The Johns Hopkins Adjusted Clinical Group® (ACG®) Case–Mix System, versions 8 and 9 (Johns Hopkins University ACG Case–Mix System, 2009). ACGs use age, sex, and diagnoses to generate a score, ranging from 100 (most healthy) to 5070 (least healthy) for adults. This system was initially designed to predict future healthcare resource use but it also relates to mortality (Reid, Roos, MacWilliam, Frohlich, & Black, 2002). The ACG system has a one–year look back period and excludes diagnostic codes from the index hospitalization. We also excluded codes related to birth (ICD–9–CM diagnosis code V27, ICD–10–CM code Z37; Manitoba physician claim tariffs 8501, 8507, 8509, 8540, 8400, 8401, 8402, and 8416), since the ACG system assigns a high value to childbirth, which very rarely results in a need for ICU care.

44 University of Manitoba
Specific Aim 4: Population–Based Description of ICU Use and ICU Patients
Tabl
e 4.
4:
Freq
uenc
y (P
erce
nt) o
f Cha
rlso
n Co
mor
bidi
ties
for M
anit
oban
s at
Lev
el o
f ICU
Epi
sode
s
Perc
ent o
f ICU
epi
sode
s fo
r whi
ch th
e pa
tient
s ha
d th
at c
ondi
tion
1999
/200
0-20
05/0
620
06/0
7-20
07/0
8M
yoca
rdia
l Inf
arct
ion
38.6
239
.69
39.8
538
.75
36.7
135
.06
33.0
833
.89
33.2
437
.40
33.5
6D
iabe
tes
with
com
plic
atio
ns3.
554.
604.
914.
604.
916.
728.
5021
.78
25.2
14.
9423
.50
Dia
bete
s w
ithou
t co
mpl
icat
ions
19.2
019
.63
20.6
220
.39
23.1
522
.53
19.4
98.
515.
3320
.97
6.92
Con
gest
ive
Hea
rt F
ailu
re28
.53
28.3
929
.90
29.4
426
.81
26.0
224
.22
22.8
023
.85
27.2
323
.85
Chr
onic
Pul
mon
ary
Dis
ease
16.9
615
.79
16.2
815
.70
14.8
214
.26
15.0
613
.54
12.9
215
.53
13.2
3R
enal
Dis
ease
7.10
8.15
9.20
9.68
9.26
11.9
311
.66
11.7
611
.29
10.1
411
.53
Can
cer
6.25
5.99
5.75
5.41
5.23
6.13
5.61
5.95
5.74
5.77
5.84
Met
asta
tic C
arci
nom
a2.
892.
772.
622.
372.
883.
092.
882.
492.
502.
792.
49C
ereb
rova
scul
ar D
isea
se9.
439.
239.
097.
937.
728.
067.
097.
237.
068.
367.
15P
erip
hera
l Vas
cula
r D
isea
se10
.53
10.4
49.
629.
548.
428.
066.
956.
696.
559.
086.
62M
oder
ate
or S
ever
e Li
ver
Dis
ease
1.25
0.84
1.16
1.23
1.30
1.84
2.14
1.76
1.83
1.41
1.80
Mild
Liv
er D
isea
se2.
011.
741.
911.
732.
021.
421.
691.
661.
821.
791.
74P
eptic
Ulc
er D
isea
se3.
062.
802.
522.
782.
762.
742.
452.
822.
802.
732.
82P
arap
legi
a an
d H
emip
legi
a1.
311.
531.
651.
831.
641.
952.
031.
952.
171.
712.
06D
emen
tia0.
960.
900.
870.
920.
752.
552.
332.
151.
971.
402.
06C
onne
ctiv
e Ti
ssue
Dis
ease
/Rhe
umat
ic D
isea
se1.
472.
101.
942.
041.
931.
631.
551.
701.
751.
761.
75A
IDS
/HIV
0.16
0.10
0.14
0.12
0.05
0.09
0.14
0.16
0.12
0.12
0.14
Sha
ded
row
s re
pres
ent
mut
ually
exc
lusi
ve p
airs
of
cond
ition
s di
scus
sed
furt
her
with
in t
he t
ext
Sou
rce:
Man
itoba
Cen
tre
for
Hea
lth P
olic
y, 2
012
Tabl
e 4.
4: F
requ
ency
(Per
cent
) of
Cha
rlson
Com
orbi
ditie
s fo
r M
anito
bans
at
Leve
l of
ICU
Epi
sode
s P
erce
nt o
f IC
U e
piso
des
for
whi
ch t
he p
atie
nts
had
that
con
ditio
n
Com
orbi
d C
ondi
tion
1999
/200
020
00/0
120
01/0
220
02/0
3 U
nwei
ghte
d A
vera
ges
2003
/04
2004
/05
2005
/06
2006
/07
2007
/08
Manitoba Centre for Health Policy 45
The Epidemiology and Outcomes of Critical Illness in Manitoba
Methods: Characteristics of the Acute Illness
For every ICU episode we sought to identify the type and severity of the single main illness that necessitated ICU care. This goal was only possible when the ICU care began in a DBH, since the WICUDB identifies the main reason for ICU admission, while hospital abstracts do not.
Among the six WICUDB data fields reserved for admission diagnoses, one is specifically designated as representing the primary reason for ICU admission. That diagnosis was considered to be the main reason for ICU admission. The WICUDB uses a customized diagnostic coding system that we manually mapped to ICD–9–CM codes. For most of our reporting and analysis, these numerous diagnoses were collapsed into the 18 main ICD–9–CM chapter headings (Centers for Medicare and Medicaid Services (CMS) & National Center for Health Statistics (NCHS), 2005). For some analyses we defined specific diagnostic entities using the WICUDB’s diagnostic system (Appendix Table A4.1). For other analyses we used a field in the WICUDB that divides the primary reason for ICU admission into three mutually exclusive categories:
1. Cardiac causes —this excludes cardiac surgery2. Surgical causes —this includes cardiac surgery3. Medical (nonsurgical) causes
Our primary indicator of the severity of acute illness, as taken from the WICUDB, was the APACHE II Acute Physiology Score (APS), which measure the severity of physiologic derangement on a scale of 0 (least deranged/severe) to 60 (most deranged/severe). It is based on the values of 12 clinical measurements made during the initial 24 hours in the ICU (Knaus, Draper, & Zimmerman, 1985). When a patient had multiple WICUDB records contained in the time period of interest or comprising an ICU episode, we used information from the first such record to represent the severity of illness at initial ICU entry.
For ICU episodes that began in hospitals not included in the WICUDB, we were limited to the information contained in hospital abstracts. We used the Most Responsible Diagnosis field (Canadian Institute for Health Information, 2005) from the hospital abstract containing the start of that period of ICU care. As the Most Responsible Diagnosis was designed to represent the diagnosis responsible for the majority of the hospital stay, it is not necessarily related to the reason for ICU admission. These numerous diagnoses were likewise collapsed into the 18 main ICD–9–CM chapter headings (Canadian Institute for Health Information, 2009). To assess the corresponding severity of illness, we obtained three data items from that hospital abstract–Complexity Level Overlay(PlxTM), Resource Intensity Weight (RIWTM), and whether the patient underwent more than 96 hours of mechanical ventilation within a single hospital abstract. The Complexity Level methodology and RIW are measures devised by CIHI as indicators of hospital resource use (Canadian Institute for Health Information, 2005). Plx methodology assigns a Complexity Level to each case. It is an integer, ranging one to four, and is based on the Most Responsible Diagnosis, the use of mechanical ventilation for greater than 96 hours, the transfer between medical services, the patient’s age, and the patient’s comorbidities.
• A value of one means no complexity • Two indicates complexity related to chronic condition(s) • Three indicates a complexity related to serious/important condition(s) • A value of four relates to a potentially life–threatening conditions(s)

46 University of Manitoba
Specific Aim 4: Population–Based Description of ICU Use and ICU Patients
These Complexity Levels could only be used to make subgroup comparisons within years. We could not use them to analyze changes over time or for multivariable modelling across years as there was a large increase in the Complexity Levels starting in 2004/05 (Table 4.5), coincident with major changes in hospital data coding in Manitoba. This increase in Complexity Levels is almost certainly a result of this coding change rather than a true change in severity of illness. Additionally, in 2006/07, the use of Complexity Levels in the hospital abstracts was discontinued. RIWs are a continuous, relative measure based on diagnosis, age, interventions performed, health status, and discharge status. Higher values correspond to higher predicted resource use in hospital. Similar to Complexity Levels, RIWs could only be used to make subgroup comparisons within years as there was also a large increase in RIWs starting in 2004/05. The third element of hospital abstract data that we used to assess the severity of illness was whether the patient underwent more than 96 hours of mechanical ventilation within a single hospital abstract. When a patient had multiple hospital abstracts within the time period or episode of interest, we used information from the hospital abstract that contained the start of that period or episode.
Table 4.5: Plx™ Complexity Levels of ICU Episodes by Year From hospital abstracts in which the ICU episode began
1999/2000 6,658 59.90 15.41 9.78 13.04 1.88 1.75
2000/01 7,058 60.00 15.37 9.21 13.87 1.54 1.77
2001/02 6,536 55.94 17.00 10.25 15.24 1.58 1.85
2002/03 6,078 55.82 16.35 10.30 15.86 1.66 1.86
2003/04 6,221 54.94 15.88 10.30 16.89 1.98 1.89
2004/05 6,030 43.75 14.61 13.52 26.27 1.86 2.23
2005/06 6,069 41.87 17.50 13.17 25.41 2.06 2.232006/07 6,076 40.49 17.31 13.43 26.43 2.34 2.26Data combines Manitobans and non-Manitobans.
Abrupt change in 2004/05 due to a change in data collection methods
Source: Manitoba Centre for Health Policy, 2012
Table 4.5: Plx™ Complexity Levels of ICU Episodes by Year From hospital abstracts in which the ICU episode began
1(Percent)
2(Percent)
3(Percent)
4(Percent)
Missing(Percent)
YearNumber of
ICU Episodes
Complexity Level
Mean of Non-Missing Values
ResultsThis Specific Aim has seven parts.
Results Part 1: ICU Use
Using a combination of the Manitoba Health bed map and direct telephone discussion with ICU nursing directors, we determined that in 2007 there were 118 beds equipped for ICU care in Manitoba (Table 4.1), of which 27 (23%) were located in rural hospitals. Using population data from 2007, this represents 9.8 ICU beds per 100,000 population for the whole province and 13.4 in the WRHA (Manitoba Health and Healthy Living, 2008).
Tables 4.6 and 4.7 summarize ICU statistics over the study period. They show that over the nine years 41,833 unique Manitobans had 54,140 separate episodes of ICU care, contained within 51,255 hospital episodes. Of these 54,140 ICU episodes, 10,060 (18.58%) were restricted to rural ICUs, 43,070 (79.55%)

Manitoba Centre for Health Policy 47
The Epidemiology and Outcomes of Critical Illness in Manitoba
were restricted to urban ICUs, and in the remaining 1,010 (1.87%) episodes patients started out in rural ICUs and were transferred to an urban ICU. Accordingly, 9.12% (1,010 of 11,070) of all ICU episodes that began in rural ICUs were transferred to urban ICUs. It is additionally notable that:
• 5.0% of ICU episodes in the province were provided to non–Manitobans • 15.8% of the Manitobans who received ICU care had two or more ICU–containing hospital episodes • 4.9% of ICU–containing hospital episodes included more than one distinct episode of ICU care
Tabl
e 4.
6:
ICU
Epi
sode
s an
d IC
U–C
onta
inin
g H
ospi
tal E
piso
des
by P
rovi
ncia
l Res
iden
cy S
tatu
s
Hos
pita
l ent
ry o
n or
aft
er A
pril
1, 1
999
and
hosp
ital s
epar
atio
n on
or b
efor
e M
arch
31,
200
8
Num
ber
Per
cent
of
Tota
lN
umbe
rP
erce
nt o
f To
tal
Uni
que
indi
vidu
als
rece
ivin
g IC
U c
are
41,8
3394
.32,
548
5.7
44,3
81I C
U e
piso
des
54,1
4095
.02,
837
5.0
56,9
77
IC
U r
ecor
ds w
ithin
ICU
epi
sode
s60
,396
95.1
3,11
64.
963
,512
I CU
-con
tain
ing
hosp
ital e
piso
des
51,2
5595
.02,
724
5.0
53,9
79
IC
U-c
onta
inin
g ho
spita
l abs
trac
ts w
ithin
the
ICU
con
tain
ing
hosp
ital e
piso
des
55,0
1595
.22,
797
4.8
57,8
12
Tot
al h
ospi
tal a
bstr
acts
with
in t
he IC
U-c
onta
inin
g
hos
pita
l epi
sode
s67
,641
96.0
2,79
74.
070
,438
Thes
e da
ta d
o no
t ex
clud
e th
e 26
ICU
epi
sode
s fo
r M
anito
bans
lack
ing
a pr
ovin
cial
pos
tal c
ode
Sou
rce:
Man
itoba
Cen
tre
for
Hea
lth P
olic
y, 2
012
Tabl
e 4.
6: IC
U E
piso
des
and
ICU
-Con
tain
ing
Hos
pita
l Epi
sode
s by
Pro
vinc
ial R
esid
ency
Sta
tus
Hos
pita
l ent
ry o
n or
aft
er A
pril
1, 1
999
and
hosp
ital s
epar
atio
n on
or
befo
re M
arch
31,
200
8
Man
itoba
nsN
on-M
anito
bans
Tota
l
Tabl
e 4.
7:
ICU
Epi
sode
s an
d IC
U–C
onta
inin
g H
ospi
tal E
piso
des
Cont
aini
ng M
ulti
ple
Elem
ents
by P
rovi
ncia
l Res
iden
cy S
tatu
s
Hos
pita
l ent
ry o
n or
aft
er A
pril
1, 1
999
and
hosp
ital s
epar
atio
n on
or b
efor
e M
arch
31,
200
8
Num
ber
Per
cent
Num
ber
Per
cent
Num
ber
Per
cent
Indi
vidu
als
with
mor
e th
an o
ne IC
U e
piso
de8,
360
20.0
226
8.9
8,58
619
.3I n
divi
dual
s w
ith m
ore
than
one
ICU
-con
tain
ing
hosp
ital e
piso
de6,
601
15.8
142
5.6
6,74
315
.2I C
U e
piso
des
incl
udin
g m
ore
than
one
ICU
rec
ord
5,20
59.
624
18.
55,
446
9.6
ICU
-con
tain
ing
hosp
ital a
bstr
acts
incl
udin
g m
ore
than
one
ICU
rec
ord
4,41
78.
025
59.
14,
672
8.1
I CU
-con
tain
ing
hosp
ital e
piso
des
incl
udin
g m
ore
than
one
hos
pita
l abs
trac
t11
,814
23.0
692.
511
,883
22.0
I CU
-con
tain
ing
hosp
ital e
piso
des
incl
udin
g m
ore
than
one
ICU
rec
ord
7,02
513
.730
711
.27,
332
13.6
ICU
-con
tain
ing
hosp
ital e
piso
des
incl
udin
g m
ore
than
one
ICU
epi
sode
2,55
95.
095
3.5
2,65
44.
9Th
ese
data
do
not
excl
ude
the
26 IC
U e
piso
des
for
Man
itoba
ns la
ckin
g a
prov
inci
al p
osta
l cod
eS
ourc
e: M
anito
ba C
entr
e fo
r H
ealth
Pol
icy,
201
2
Man
itoba
nsN
on-M
anito
bans
Tota
l
Tabl
e 4.
7: IC
U E
piso
des
and
ICU
-Con
tain
ing
Hos
pita
l Epi
sode
s C
onta
inin
g M
ultip
le E
lem
ents
, by
Pro
vinc
ial R
esid
ency
sta
tus
Hos
pita
l ent
ry o
n or
aft
er A
pril
1, 1
999
and
hosp
ital s
epar
atio
n on
or
befo
re M
arch
31,
200
8

48 University of Manitoba
Specific Aim 4: Population–Based Description of ICU Use and ICU Patients
Tables 4.8–4.10 and Figures 4.1–4.3 provide data on ICU LOS. When assessed by ICU LOS, again non–Manitobans consumed approximately 5% of ICU resources. Overall, the average ICU episode LOS was approximately four days, with a median LOS of slightly over two days. There were slight differences between Manitobans and non–Manitobans. While the number of yearly ICU episodes was relatively stable since 2002/03, the average ICU LOS progressively increased with time, resulting in a modest increase over time in cumulative, yearly ICU bed–days. The increase amounted to 9.7% more ICU bed–days in 2007/08 than in 1999/2000 for an average yearly increase of 1.2%. As the median ICU LOS was stable over the study period, the observed increase in the mean LOS values indicates an increase in long ICU episodes. Indeed, while the 99th percentile of ICU LOS over the entire nine years was 33 days, this value increased from 25 days in 1999/2000 to 37 days in 2007/08.
Table 4.8: Number and Length of ICU Episodes by Year and Residency Status Length of stay (LOS) in days*
NumberPercent for
Non-Manitobans
All ManitobansNon-
ManitobansDays
Percent for Non-
Manitobans1999/2000 6,664 4.9 3.68 3.68 3.69 2.22 106.57 24,495 4.9
2000/01 7,061 5.4 3.72 3.73 3.49 2.13 142.64 26,260 5.1
2001/02 6,539 4.7 3.90 3.90 4.03 2.13 186.75 25,531 4.9
2002/03 6,079 4.8 4.04 4.06 3.72 2.19 170.11 24,565 4.4
2003/04 6,223 5.1 4.05 4.07 3.62 2.15 151.00 25,206 4.5
2004/05 6,030 4.5 4.36 4.38 4.04 2.57 158.08 26,292 4.2
2005/06 6,072 5.2 4.33 4.29 4.98 2.36 194.82 26,288 5.9
2006/07 6,082 4.9 4.51 4.52 4.24 2.32 227.39 27,428 4.6
2007/08 6,227 5.4 4.32 4.33 4.04 2.10 223.46 26,877 5.0
All 9 years 56,977 5.0 4.09 4.09 3.97 2.23 227.39 232,940 4.8
*These data do not exclude the 26 ICU episodes for Manitobans lacking a provincial postal code Source: Manitoba Centre for Health Policy, 2012
Table 4.8: Number and Length of ICU Episodes by Year and Residency Status Length of stay (LOS) in days*
Mean ICU Length of Stay (LOS) Cumulative ICU LOSMedian ICU LOS
Maximum ICU LOS
ICU Episodes
Year
Table 4.9: Number and Length of ICU Episodes for Manitobans Length of stay (LOS) in hours unless otherwise stated*
MeanStandard Deviation
25th
Percentile Median 75th
PercentileMaximum Hours Days
1999/2000 6,340 88.20 133.51 24.00 53.92 99.71 2,557.62 559,202 23,300
2000/01 6,677 89.57 140.13 24.00 51.25 99.00 3,423.25 598,037 24,918
2001/02 6,231 93.55 164.03 24.00 51.13 96.92 4,482.00 582,926 24,289
2002/03 5,789 97.37 181.20 24.00 52.58 97.00 4,082.67 563,692 23,487
2003/04 5,907 97.77 159.25 24.00 52.38 106.75 3,624.00 577,518 24,063
2004/05 5,758 105.01 166.25 26.25 61.85 118.08 3,793.88 604,638 25,193
2005/06 5,759 103.06 174.56 25.73 56.35 113.17 4,675.67 593,515 24,730
2006/07 5,787 108.56 207.99 25.15 55.17 112.33 5,457.40 628,230 26,176
2007/08 5,892 103.96 196.28 23.63 50.33 110.25 5,363.08 612,532 25,522
All 9 years 54,140 98.27 170.07 24.00 53.52 106.29 5,457.43 5,320,291 221,679
*These data do not exclude the 26 ICU episodes for Manitobans lacking a provincial postal code
Source: Manitoba Centre for Health Policy, 2012
Number of ICU
EpisodesYear
Table 4.9: Number and Length of ICU Episodes for Manitobans Length of stay (LOS) in hours unless otherwise stated*
ICU Length of Stay (LOS) Cumulative ICU LOS

Manitoba Centre for Health Policy 49
The Epidemiology and Outcomes of Critical Illness in Manitoba
Table 4.10: Number and Length of ICU Episodes for Non–Manitobans Length of stay (LOS) in hours unless otherwise stated
MeanStandard Deviation
25th
Percentile Median 75th
PercentileMaximum Hours Days
1999/2000 324 88.48 111.61 24.00 48.54 96.00 832.42 28,667 1,194
2000/01 384 83.84 154.41 24.00 48.08 94.58 2,033.08 32,194 1,341
2001/02 308 96.78 214.47 24.00 51.67 96.13 2,829.58 29,809 1,242
2002/03 290 89.18 137.03 24.00 49.71 93.50 1,433.25 25,862 1,078
2003/04 316 86.76 126.58 23.89 47.54 94.17 1,136.95 27,417 1,142
2004/05 272 96.91 126.57 22.25 50.80 120.88 907.92 26,360 1,098
2005/06 313 119.47 187.12 27.40 60.75 132.58 1,798.58 37,393 1,558
2006/07 295 101.86 145.37 24.00 62.75 120.25 1,445.40 30,048 1,252
2007/08 335 97.04 139.40 22.53 51.43 111.25 1,526.20 32,507 1,354
All 9 years 2,837 95.26 152.57 24.00 51.17 104.25 2,829.58 270,258 11,261
Source: Manitoba Centre for Health Policy, 2012
Table 4.10: Number and Length of ICU Episodes for Non-Manitobans Length of stay (LOS) in hours unless otherwise stated
YearNumber of
ICU Episodes
ICU Length of Stay (LOS) Cumulative ICU LOS
Figure 4.1: Number of ICU Episodes by Year Patients with Final Hospital Discharge Occurring Between 1999/2000–2007/08
0
1,000
2,000
3,000
4,000
5,000
6,000
7,000
8,000
1999/2000 2000/01 2001/02 2002/03 2003/04 2004/05 2005/06 2006/07 2007/08
Nu
mb
er o
f IC
U E
pis
od
es
Year
Figure 4.1: Number of ICU Episodes by YearPatients with Final Hospital Discharge Occurring Between 1999/2000-2007/08
Source: Manitoba Centre for Health Policy, 2012

50 University of Manitoba
Specific Aim 4: Population–Based Description of ICU Use and ICU Patients
Figure 4.2: Mean and Median Length of ICU Episodes by Year Patients with Final Hospital Discharge Occurring Between 1999/2000–2007/08
Figure 4.3: Total Number of Days of ICU Care Provided by Year Patients with Final Hospital Discharge Occurring Between 1999/2000–2007/08
0.0
0.5
1.0
1.5
2.0
2.5
3.0
3.5
4.0
4.5
5.0
1999/2000 2000/01 2001/02 2002/03 2003/04 2004/05 2005/06 2006/07 2007/08
Len
gth
of
ICU
Ep
iso
de
(Day
s)
Year
Mean ICU LOS
Median ICU LOS
Figure 4.2: Mean and Median Length of ICU Episodes by YearPatients with Final Hospital Discharge Occurring Between 1999/2000-2007/08
Source: Manitoba Centre for Health Policy, 2012
0
5,000
10,000
15,000
20,000
25,000
30,000
1999/2000 2000/01 2001/02 2002/03 2003/04 2004/05 2005/06 2006/07 2007/08
Cu
mu
lati
ve IC
U L
OS
Year
Figure 4.3: Total Number of Days of ICU Care Provided by YearPatients with Final Hospital Discharge Occurring Between 1999/2000-2007/08
Source: Manitoba Centre for Health Policy, 2012
Figure 4.3: Total Number of Days of ICU Care Provided by YearPatients with Final Hospital Discharge Occurring Between 1999/2000-2007/08
Source: Manitoba Centre for Health Policy, 2012

Manitoba Centre for Health Policy 51
The Epidemiology and Outcomes of Critical Illness in Manitoba
Table 4.11 shows that approximately 10% of all ICU time occurred in the rural ICUs. Rural ICU time progressively and substantially declined over the nine years, while ICU time in the urban centers (Winnipeg and Brandon) grew modestly. Of note, while rural ICUs contained 23% (27 of 118) adult ICU beds in the province in 2007/08 (Table 4.1), they accounted for just 7.9% of ICU bed–days in 2007/08. This discrepancy indicates a much lower per–bed use of ICU resources in the rural ICUs, as further explored in Part 3 of this Specific Aim.
Table 4.11: Cumulative ICU Time by Hospital Location*
All ICUs
Days Percent Days Percent Days Percent Days
1999/2000 3,136 12.8 1,483 6.1 19,876 81.1 24,495
2000/01 3,169 12.1 1,482 5.6 21,609 82.3 26,260
2001/02 2,696 10.6 1,457 5.7 21,378 83.7 25,531
2002/03 2,645 10.8 1,323 5.4 20,597 83.8 24,565
2003/04 2,769 11.0 1,380 5.5 21,057 83.5 25,206
2004/05 2,622 10.0 1,579 6.0 22,091 84.0 26,292
2005/06 2,484 9.4 1,277 4.9 22,527 85.7 26,288
2006/07 2,273 8.3 1,530 5.6 23,626 86.1 27,428
2007/08 2,115 7.9 1,606 6.0 23,155 86.2 26,877
All 9 years 23,909 10.3 13,116 5.6 195,915 84.1 232,940
Unit of measure is ICU records. Time in days. Row percentages are shown*
*These data do not exclude the 26 ICU episodes for Manitobans lacking a provincial postal code
Source: Manitoba Centre for Health Policy, 2012
Table 4.11: Cumulative ICU Time by Hospital Location
Rural ICUs Brandon ICU Winnipeg ICUsYear
Of particular interest are patients who spent time in the Intermediate ICU (IICU) at the Health Sciences Centre. The IICU is a six–bed unit designed primarily for patients whose other critical conditions have resolved but have respiratory failure requiring prolonged mechanical ventilator support. Patients admitted to IICU commonly have very long ICU stays both prior to being transferred into the IICU and in the IICU itself. Inclusion of IICU patients would therefore be expected to increase any ICU LOS calculations in which they were included. Comparison of episodes including IICU care (Table 4.12) with the overall data (Table 4.8) shows that 0.8% of ICU episodes (453 of 56,977) included time in IICU. Episodes including IICU stays had an average total ICU LOS of 42.5 days, which was split approximately equally between the IICU and other ICUs. Episodes including IICU stays accounted for 8.3% (19,256 of 232,940 days) of all cumulative ICU days in the province.
Table 4.12: ICU Length of Stay (LOS) for ICU Episodes with Time in the Intermediate ICU (IICU) at Health Sciences Centre Hospital discharge 1999/2000–2007/08 LOS in days*
Number of ICU episodes 453 453 Mean (SD) ICU LOS 19.58 (18.14) 42.51 (32.85)Median ICU LOS 15.69 34.60
Maximum ICU LOS 152.00 227.39
Cumulative ICU LOS 8,870.10 19,255.51
*These data do not exclude the 26 ICU episodes for Manitobans lacking a provincial postal code
Source: Manitoba Centre for Health Policy, 2012
Time in All ICUs Including IICU
Time in IICU
Table 4.12: ICU Length of Stay (LOS) for ICU Episodes with Time in the Intermediate ICU (IICU) at Health Sciences Centre
Hospital discharge 1999/2000-2007/08 LOS in days*

52 University of Manitoba
Specific Aim 4: Population–Based Description of ICU Use and ICU Patients
Also, we separately assessed ICU episodes that took place exclusively in rural ICUs. The rationale for this was that since only the urban ICUs have the resources to care for the sickest patients, rural–only episodes would likely be quite different from those that included any time in an urban ICU. Indeed, rural–only ICU episodes accounted for approximately 18% of ICU episodes, but on average they were half the duration of those that had any time in urban ICUs (Table 4.13).
Table 4.13: Number and Length of ICU Episodes by ICU Type Hospital discharge 1999/2000–2007/08 Length of stay (LOS) in days*
Rural ICUs OnlyAny Urban ICU with or without rural
ICU careAny ICU
Manitobans
Number of ICU episodes 10,060 44,080 54,140 18.6
Mean ICU LOS 2.23 4.52 4.09
Median ICU LOS 1.75 2.59 2.23
Maximum ICU LOS 73.00 227.39 227.39
Cumulative ICU LOS 22,437 199,242 221,679 10.1Non-Manitobans
Number of ICU episodes 264 2,573 2,837 9.3
Mean ICU LOS 1.63 4.21 3.97
Median ICU LOS 1.00 2.33 2.13
Maximum ICU LOS 13.00 117.90 117.90
Cumulative ICU LOS 431 10,830 11,261 3.8All
Number of ICU episodes 10,324 46,653 56,977 18.1
Mean ICU LOS 2.22 4.50 4.00
Median ICU LOS 1.72 2.58 2.23
Maximum ICU LOS 73.00 227.39 227.39
Cumulative ICU LOS 22,868 210,072 232,940 9.8
Percent for Non-Manitobans -Number of ICU episodes 2.6 5.5 5.0 -Cumulative ICU LOS 1.9 5.2 4.8 ICU episodes are the unit of measure.
*These data do not exclude the 26 ICU episodes for Manitobans lacking a provincial postal code
Source: Manitoba Centre for Health Policy, 2012
ICU Episode Included Time in: Percent of Rural ICU
Only
Table 4.13: Number and Length of ICU Episodes by ICU TypeHospital discharge 1999/2000-2007/08
Length of stay (LOS) in days*
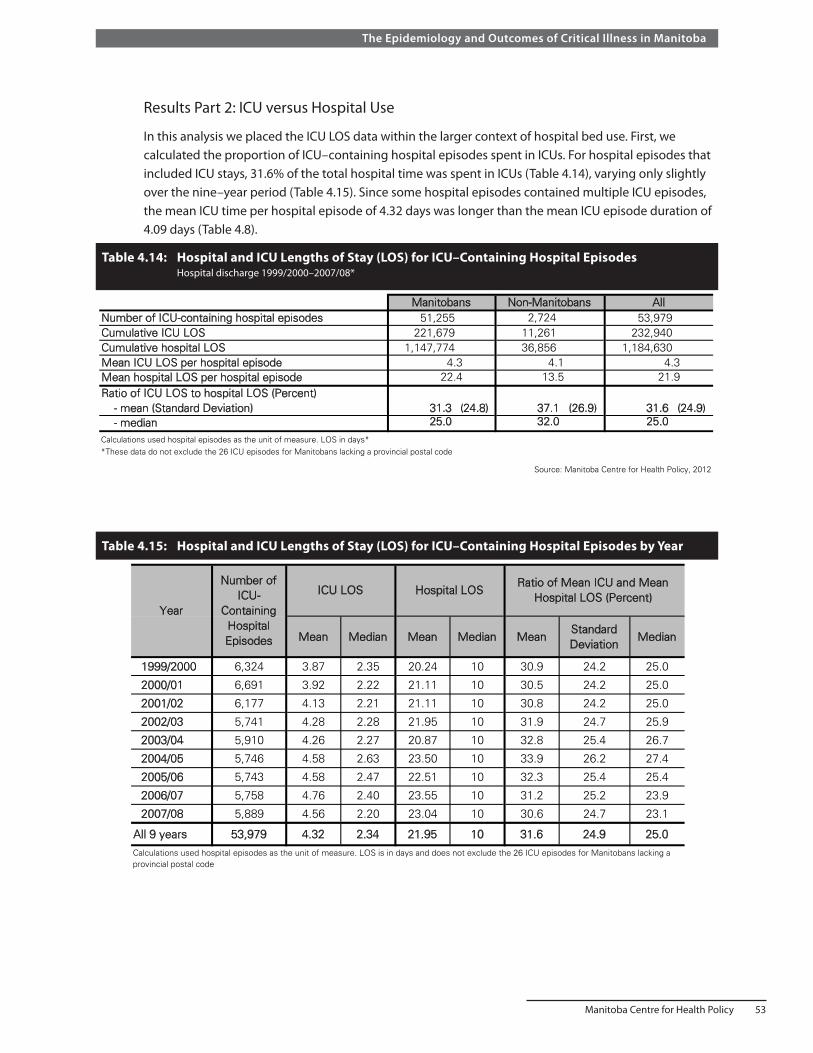
Manitoba Centre for Health Policy 53
The Epidemiology and Outcomes of Critical Illness in Manitoba
Results Part 2: ICU versus Hospital Use
In this analysis we placed the ICU LOS data within the larger context of hospital bed use. First, we calculated the proportion of ICU–containing hospital episodes spent in ICUs. For hospital episodes that included ICU stays, 31.6% of the total hospital time was spent in ICUs (Table 4.14), varying only slightly over the nine–year period (Table 4.15). Since some hospital episodes contained multiple ICU episodes, the mean ICU time per hospital episode of 4.32 days was longer than the mean ICU episode duration of 4.09 days (Table 4.8).
Table 4.14: Hospital and ICU Lengths of Stay (LOS) for ICU–Containing Hospital Episodes Hospital discharge 1999/2000–2007/08*
Table 4.15: Hospital and ICU Lengths of Stay (LOS) for ICU–Containing Hospital Episodes by Year
Number of ICU-containing hospital episodesCumulative ICU LOSCumulative hospital LOSMean ICU LOS per hospital episodeMean hospital LOS per hospital episodeRatio of ICU LOS to hospital LOS (Percent) - mean (Standard Deviation) - median 25.0 32.0 25.0
Calculations used hospital episodes as the unit of measure. LOS in days**These data do not exclude the 26 ICU episodes for Manitobans lacking a provincial postal code
Source: Manitoba Centre for Health Policy, 2012
(24.9)
Table 4.14: Hospital and ICU Lengths of Stay (LOS) for ICU-Containing Hospital Episodes Hospital discharge 1999/2000-2007/08*
31.3 (24.8) 37.1 (26.9) 31.6
Manitobans Non-Manitobans All
4.113.5
4.321.9
4.322.4
53,979232,940
1,184,630
51,255221,679
1,147,774
2,72411,26136,856
Mean Median Mean Median MeanStandard Deviation
Median
1999/2000 6,324 3.87 2.35 20.24 10 30.9 24.2 25.0
2000/01 6,691 3.92 2.22 21.11 10 30.5 24.2 25.0
2001/02 6,177 4.13 2.21 21.11 10 30.8 24.2 25.0
2002/03 5,741 4.28 2.28 21.95 10 31.9 24.7 25.9
2003/04 5,910 4.26 2.27 20.87 10 32.8 25.4 26.7
2004/05 5,746 4.58 2.63 23.50 10 33.9 26.2 27.4
2005/06 5,743 4.58 2.47 22.51 10 32.3 25.4 25.4
2006/07 5,758 4.76 2.40 23.55 10 31.2 25.2 23.9
2007/08 5,889 4.56 2.20 23.04 10 30.6 24.7 23.1
All 9 years 53,979 4.32 2.34 21.95 10 31.6 24.9 25.0Calculations used hospital episodes as the unit of measure. LOS is in days and does not exclude the 26 ICU episodes for Manitobans lacking a provincial postal code
Table 4.15: Hospital and ICU Lengths of Stay (LOS) for ICU-Containing Hospital Episodes by Year
Number of ICU-
Containing Hospital Episodes
ICU LOS Hospital LOSRatio of Mean ICU and Mean
Hospital LOS (Percent)Year

54 University of Manitoba
Specific Aim 4: Population–Based Description of ICU Use and ICU Patients
Summary and discussion of Results Parts 1 and 2These initial parts of Specific Aim 4 outline the scale of ICU care in Manitoba for the nine–year period, 1999/2000–2007/08. The 118 certified ICU beds in the province is a per capita supply of 9.8 ICU beds per 100,000 population (or 13.4 in the WRHA). Of these ICU beds, 23% are located in rural hospitals. This represents a lower per capita supply of ICU beds than in most of Canada. Comparable values are 14.8 reported for Ontario (Bell, Robinson, & Steering Committee Co–Chairs, 2005), 13.5 for all of Canada (excluding Quebec), 20.0 for the United States, and 3.5–24.6 for selected European countries (Wunsch et al., 2008).
There were approximately 6,300 ICU episodes per year of which approximately 5% were for non–Manitobans. Also, a substantial fraction of ICU episodes were among people who have been in a Manitoba ICU before.
Table 4.16: Cumulative ICU and Acute Hospital Lengths of Stay
Hospital-Days ICU-Days
1999/2000 76,925 964,057 24,495 2.542000/01 76,619 1,113,003 26,260 2.362001/02 75,603 1,070,188 25,531 2.392002/03 74,385 1,051,123 24,565 2.342003/04 75,425 1,067,357 25,206 2.362004/05 77,401 1,095,931 26,292 2.402005/06 78,087 1,075,211 26,288 2.442006/07 77,743 1,088,309 27,428 2.522007/08 77,198 1,055,847 26,877 2.55
All 9 years 689,386 9,581,026 232,940 2.43
Unit of measure for calculation of hospital-days is hospital abstracts
Source: Manitoba Centre for Health Policy, 2012
Table 4.16: Cumulative ICU and Acute Hospital Lengths of Stay
YearCumulative
Number of Hospital Episodes
ICU-Days as Percent of
Hospital-Days
Next, including all hospitalizations in Manitoba during the study period, we calculated the percent of acute hospital patient–days in Manitoba that were spent in ICUs. Table 4.16 indicates that this was 2.4%; a value identical to an estimate generated as a product of the 31.6% of ICU days to hospital days (Table 4.14) and the 7.69% of all hospital abstracts that included any ICU records, per Specific Aim 2.
The 2.55% of total hospital bed–days in Manitoba spent in ICU beds in 2007/08 (Table 4.16) can be compared to the ratio of ICU beds to hospital beds for that year, which was 3.27% (Personal communication, Health Information Management, Manitoba Health).

Manitoba Centre for Health Policy 55
The Epidemiology and Outcomes of Critical Illness in Manitoba
The average ICU LOS was 4.1 days and increased steadily over time, mainly due to an increase in those with long LOS. The rising mean ICU LOS, in combination with relatively unchanging yearly count of ICU episodes, led to a modest increase of 1.2% per year in cumulative use of ICU beds. Approximately 10% of all ICU time was spent in the rural ICUs, though this portion steadily declined over the nine–year period. While ICU episodes located solely in rural ICUs accounted for 18% of all ICU episodes, they only accounted for 10% of cumulative ICU time.
When looking at hospital bed use, ICU beds accounted for 3.3% of adult acute care hospital beds in the province in 2007. While ICU care accounted for just 2.6% of all acute hospital patient–days, it accounted for 32% of hospital days for those whose hospital episodes included time in an ICU.
We also showed that patients admitted to the IICU at the Health Sciences Centre used a disproportionate amount of resources. This six–bed unit is primarily used for patients needing prolonged mechanical ventilator support. While representing 0.8% of ICU episodes, they accounted for 8.3% of cumulative time in provincial ICUs and had an average ICU LOS of 42.5 days. In many other jurisdictions, such patients are transferred to specialized long–term care facilities; and existing data indicates that compared to acute care hospitals, such long–term care facilities are less costly and more successful in liberating those people from mechanical life support.
Results Part 3: ICU Patient Count and Bed Use
The period included in this part of the analysis was 1999/2000–2006/07. Yearly average ICU bed use in each geographic region is shown in Table 4.17. Mirroring the data in Table 4.11, average use increased over the years in Winnipeg ICUs, decreased over time in the rural ICUs, and remained approximately unchanged in the Brandon ICU. As estimated by the yearly average bed–days method (Method 1), the numbers of ICU beds needed are the values in Table 4.17, divided by 0.8.
Table 4.17: ICU Bed Use According to Yearly Average Bed–Days (Method 1) by Region, 1999/2000–2006/07
Year Winnipeg Brandon Rural South Mid North Sum1999/2000 51.5 4.0 3.8 3.2 1.2 63.82000/01 55.8 4.0 3.7 3.1 1.7 68.22001/02 55.4 3.8 3.6 2.9 0.9 66.52002/03 53.7 3.5 3.8 2.7 0.6 64.32003/04 54.8 3.7 3.1 2.8 1.6 65.92004/05 57.7 4.3 2.7 3.1 1.3 69.02005/06 57.6 3.3 2.8 2.5 1.5 67.72006/07 61.6 3.9 2.6 2.7 0.9 71.7
Unweighted average 56.0 3.8 3.2 2.9 1.2 67.1Source: Manitoba Centre for Health Policy, 2012
Table 4.17: ICU Bed Use According to Yearly Average Bed-Days (Method 1) by Region,1999/2000-2006/07

56 University of Manitoba
Specific Aim 4: Population–Based Description of ICU Use and ICU Patients
Tables 4.18, 4.19, and 4.20, represent diff ering levels of ICU bed conglomeration; they show values from the observed distribution of DPBO, reported by geographic region. As expected, conglomeration on larger scales resulted in lower values of DPBO.
Ta
ble
4.1
8:
IC
U B
ed
Use
Ac
co
rdin
g t
o H
osp
ita
l–L
ev
el
Da
ily
Pe
ak
Be
d O
cc
up
an
cy
(M
eth
od
3)
by
Re
gio
n,
19
99
/20
00
–2
00
6/0
7
The
four
val
ues
in e
ach
cell
are
the
med
ian,
95t
h pe
rcen
tile,
99t
h pe
rcen
tile,
and
max
imum
of h
ospi
tal d
aily
pea
k be
d oc
cupa
ncy,
whi
ch a
re s
umm
ed
ov
er e
ach
regi
ons’
hosp
itals
Ye
ar
19
99
/20
00
67,
78,
82,
845,
7,10
,10
5,11
,14
,17
3,7,
9,9
1,8,
8,9
81,
111,
123,
129
20
00
/01
60,
76,
82,
824,
6,7,
85,
10,
13,
163,
7,8,
102,
7,9,
1174
,10
6,11
9,12
72
00
1/0
262
,76
,81
,88
5,6,
7,8
5,14
,17
,20
3,6,
7,8
1,4,
7,8
76,
106,
119,
132
20
02
/03
59,
73,
78,
804,
6,7,
75,
10,
12,
144,
7,7,
90,
3,6,
672
,99
,11
0,11
62
00
3/0
462
,77
,82
,88
4,7,
7,8
4,10
,11
,13
3,7,
7,8
2,5,
7,9
75,
106,
114,
126
20
04
/05
64,
77,
80,
855,
7,8,
94,
9,9,
124,
7,9,
101,
4,6,
878
,10
4,11
2,12
42
00
5/0
664
,78
,82
,87
4,7,
8,8
4,9,
10,
123,
7,8,
92,
5,6,
777
,10
6,11
4,12
32
00
6/0
767
,81
,86
,95
4,7,
8,8
4,8,
10,
114,
6,7,
91,
3,4,
680
,10
5,11
5,12
9
Un
we
igh
ted
av
era
ge
s6
3.1
,7
7.0
,8
1.6
,8
6.1
4.4
,6
.6,
7.8
,8
.34
.5,
10
.1,
12
.0,
14
.43
.4,
6.8
,7
.8,
9.0
1.3
,4
.9,
6.6
,8
.07
6.6
,1
05
.4,
11
5.8
,1
25
.8
Sou
rce:
Man
itoba
Cen
tre
for
Hea
lth P
olic
y, 2
012
Win
nip
eg
Bra
nd
on
No
rth
Mid
Ru
ral
So
uth
Su
m
Ta
ble
4.1
9:
IC
U B
ed
Use
Ac
co
rdin
g t
o R
eg
ion
-Le
ve
l D
ail
y P
ea
k B
ed
Oc
cu
pa
nc
y (
Me
tho
d 2
) b
y R
eg
ion
, 1
99
9/2
00
0–
20
06
/07
Th
e fo
ur v
alue
s in
eac
h ce
ll ar
e th
e m
edia
n, 9
5th
perc
entil
e, 9
9th
perc
entil
e, a
nd m
axim
um o
f the
regi
onal
dai
ly p
eak
bed
occu
panc
y
YYea
r19
99/2
000
61,
69,
72,
73,
5,7,
9,10
,5,
8,9,
11,
4,6,
7,8,
1,4,
5,7,
76,
94,
102,
109,
2000
/01
59,
66,
69,
70,
4,6,
7,8,
5,8,
9,9,
3,6,
7,8,
2,5,
6,8,
73,
91,
98,
103,
2001
/02
60,
67,
72,
76,
5,6,
7,8,
4,8,
10,
11,
3,5,
6,6,
1,3,
5,6,
73,
89,
100,
107,
2002
/03
57,
63,
66,
70,
4,6,
7,7,
4,7,
8,11
,3,
5,7,
7,1,
3,4,
5,69
,84
,92
,10
0,20
03/0
459
,67
,70
,72
,4,
7,7,
8,4,
6,7,
8,3,
5,6,
7,2,
4,5,
5,72
,89
,95
,10
0,20
04/0
560
,68
,71
,73
,5,
7,8,
9,4,
6,7,
8,4,
6,7,
8,2,
4,4,
4,75
,91
,97
,10
2,20
05/0
662
,69
,74
,77
,4,
7,8,
8,4,
6,7,
9,3,
6,7,
7,2,
3,4,
5,75
,91
,10
0,10
6,20
06/0
764
,72
,74
,77
,4,
7,8,
8,4,
6,7,
7,3,
6,7,
7,1,
3,4,
4,76
,94
,10
0,10
3,U
nwei
ghte
d A
vera
ge60
.3,
67.6
,71
.0,
73.5
,4.
4,6.
6,7.
6,8.
3,4.
3,7.
0,8.
1,9.
6,3.
3,5.
6,6.
8,7.
3,1.
5,3.
6,4.
6,5.
5,73
.6,
90.4
,98
.0,
103.
8,S
ourc
e: M
anito
ba C
entr
e fo
r H
ealth
Pol
icy,
201
2
Win
nipe
gB
rand
onN
orth
Mid
Rur
al S
outh
Sum
Tabl
e 4.
19: I
CU
Bed
Use
Acc
ordi
ng t
o R
egio
naliz
ed D
aily
Pea
k B
ed O
ccup
ancy
(Met
hod
2) b
y R
egio
n, 1
999/
2000
-200
6/07
SA 4.indd 56 18/04/2012 2:30:41 PM

Manitoba Centre for Health Policy 57
The Epidemiology and Outcomes of Critical Illness in Manitoba
Table 4.20: Provincial ICU Bed Use According to Provincial Daily Peak Bed Occupancy (Method 4), 1999/2000–2006/07
Year Median 95th Percentile 99th Percentile Maximum1999/2000 74 86 90 902000/01 71 81 85 872001/02 71 81 86 902002/03 68 75 79 822003/04 71 82 84 862004/05 72 82 85 862005/06 73 82 89 942006/07 74 83 86 92
Unweighted average 67.6 77.4 81.6 85.1Source: Manitoba Centre for Health Policy, 2012
Table 4.20: Provincial ICU Bed Use According to Provincial Daily Peak Bed Occupancy (Method 4), 1999/2000-2006/07
Table 4.21 compares all four methods of assessing ICU bed use for 2006/07. Under the reasonable assumption that bed use reflects bed demand, these numbers provide a starting basis for estimating the number of ICU beds needed in each geographic region. For example, the 95th percentile of the DPBO in a region provides the number of ICU beds in use in that region that was exceeded on 5% of days in that year, i.e., 18 days. These data indicate that:
• Fewer beds are needed if it is acceptable to exceed supply on a greater number of days per year • Fewer beds are needed with effective conglomeration of ICU beds across larger areas (i.e., hospital
versus region versus province) • The estimate of ICU beds needed derived from the average use over the year (Method 1) is lower
than those provided by the other methods
Comparison of Methods 2 and 3 indicates that fewer ICU beds are needed if multiple hospitals are able to freely share them, effectively operating as a single, large ICU instead of requiring each hospital to independently have enough ICU beds to cope with a surge in local demand. However, as elaborated in the Summary and Discussion of Results Part 3, there are considerations besides bed use that enter into determining how many ICU beds are needed.
Table 4.21: Comparison of Four Methods of Assessing ICU Bed Use by Region, 2006/07
Method Winnipeg Brandon Rural South Mid North SumActual Number of ICU beds at the start of 2007/08 82 9 13 6 8 118Method 1. Yearly Average bed-days method Average beds used 62 4 3 3 1 72 Estimated beds needed = average used/0.80 77 5 3 3 1 90Method 2. Regional peak daily bed occupancy method 95th percentile 72 7 6 6 3 94 99th percentile 74 8 7 7 4 100 Maximum 77 8 7 7 4 103Method 3. Hospital peak daily bed occupancy method 95th percentile 81 7 8 6 3 105 99th percentile 86 8 10 7 4 115 Maximum 95 8 11 9 6 129Method 4. Provincial peak daily bed occupancy method 95th percentile n.a. n.a. n.a. n.a. n.a. 83 99th percentile n.a. n.a. n.a. n.a. n.a. 86 Maximum n.a. n.a. n.a. n.a. n.a. 85
Source: Manitoba Centre for Health Policy, 2012
Table 4.21: Comparison of Four Methods of Assessing ICU Bed Use by Region, 2006/07

58 University of Manitoba
Specific Aim 4: Population–Based Description of ICU Use and ICU Patients
Lastly, Table 4.22 shows the median values for 2006/07 of DPBO, combined at the level of hospitals, and reported by region. In the Rural South region, for example, the median DPBO value of four indicates that approximately 70% of the 13 ICU beds in that region were empty more than half the time. Indeed, ICU beds in the four regions besides Winnipeg had low occupancy much of the time. However, the necessity of having sufficient capacity to deal with surges in demand means that median or mean calculations are inadequate. Instead, to avoid exceeding ICU bed capacity more than 18 days per year in 2006/07, the Rural South region needed eight ICU beds (Table 4.21), not the four beds indicated by using median values. To avoid exceeding ICU capacity more than four days per year, it needed ten ICU beds.
Table 4.22: Median Value of Daily Peak Bed Occupancy of ICU Beds Calculated at the Hospital Level (Method 3) by Region, 2006/07
Winnipeg Brandon Rural South Mid North SumActual Number of ICU beds, at start of 2007/08 82 9 13 6 8 118Median number of beds in use 67 4 4 4 1 80Percent of occupancy based on median beds in use 82 44 31 67 13 68
Source: Manitoba Centre for Health Policy, 2012
Table 4.22: Median Value of Daily Peak Bed Occupancy of ICU Beds Calculated at the Hospital Level (Method 3) by Region, 2006/07
Summary and discussion of Results Parts 3In this section we used patient census data to quantify ICU use. These data were expressed both as yearly averages and as the distribution of fluctuating daily counts. We presented the distributional information at three different levels of conglomeration of ICU beds: individual hospitals, geographic regions, and the entire province. Such conglomeration attempts to simulate bed count data as if ICUs in different hospitals shared ICU beds, i.e., as if they all were part of a single ICU comprised of all the ICU beds in the individual hospitals.
Comparison shows that average use statistics (yearly average bed–days method (Method 1), Table 4.17) fail to represent the large fluctuations in ICU bed use (e.g., hospital–level DPBO (Method 3), Table 4.18) (DeLia, 2006). For example, in Winnipeg during 2006/07, the number of ICU beds in use, averaged over the entire year, was only 62. However, the median value of the DPBO was 67; and on 5% of days during that year, there were 81 or more ICU patients simultaneously using ICU beds in Winnipeg.
Next, our analysis also indicates increasing efficiency from greater degrees of conglomeration. Using province–wide 2006/07 data for illustration, we consider maximum ICU patient count data. The largest number of patients occupying ICU beds on any day of that year was 85 (Method 4, Table 4.20). However, the sum across hospitals of each hospital’s yearly maximum ICU count was 129 (Method 3, Table 4.18). For conglomeration at the regional level (Method 2, Table 4.19), the maximum count value of 104 was intermediate between these other two values. Thus, consistent with the results of statistical modelling (de Bruin et al., 2007), and the simulated example of Table 4.2, our data shows that sharing of ICU beds allows a system to better handle surges in demand.
An accurate assessment of the number of ICU beds needed is important to society. Too few beds results in the inability to provide care to some critically ill patients, while too many ICU beds wastes expensive resources. While ICU bed use data is the starting point for evaluating the number of beds needed, there are other important considerations, discussed below.
The analysis of patient count data for estimating the number of ICU beds needed is dependent both on the level of conglomeration of ICUs and on the frequency threshold for reaching total bed capacity. Reaching full capacity is problematic because at that point the system is unable to care for additional critically ill patients. If reaching full capacity is acceptable if it occurs on less than 5% of days, in 2006/07

Manitoba Centre for Health Policy 59
The Epidemiology and Outcomes of Critical Illness in Manitoba
the WRHA (which had 82 ICU beds that year) needed 81 ICU beds if each hospital were required to deal independently with its own demand, but only 72 beds if all WRHA hospitals were able to effectively share ICU bed resources. If instead reaching full capacity is acceptable only if it occurs on less than 1% of days, in 2006/07 Winnipeg needed 86 beds if the six hospitals were considered separately and 74 beds if their ICUs could effectively share beds and function as if it were a single large ICU.
Due to the distances in Manitoba, such sharing of ICU beds is only practical within Winnipeg hospitals. This is facilitated by the fact that the six Winnipeg hospitals are managed by a single medical and administrative authority and are all within a 30 minute driving distance of one another.
Since there are delays and barriers to movement of patients between hospitals and ICUs even with regionalization in a small geographic area, it seems likely that the actual number of ICU beds needed falls somewhere between the estimates of Methods 2 and 3; being closer to Method 2 with more seamless and effective sharing of beds. Additionally, the number of ICU beds needed is higher if we want a lower frequency of days when sudden increases in demand exceeds bed supply. Again using 2006/07 data as an example, if we desired that situation to occur less than 1% of days (4 days per year), instead of less than 5% of the time (18 days per year ), the number of ICU beds needed by the province would increase from 105 to 115 using Method 3, and from 94 to 100 using Method 2.
In the rural areas of the province, where hospitals are separated by long distances, such movement of ICU patients is not practical and hospitals must be nearly independent in supplying their own ICU needs; accordingly, the number of ICU beds needed is better represented by the estimates of Method 3. However, even when possible, there are delays and barriers to movement of patients between hospitals and ICUs even with effective regionalized care systems located in a small geographic area. Also, ICU–to–ICU transfers may be associated with poorer patient outcomes (Combes, Luyt, Trouillet, Chastre, & Gibert, 2005; Escarce & Kelley, 1990). Accordingly, the number of ICU beds needed in the more integrated hospital system such as in the WRHA likely falls between the estimates of Methods 2 and 3.
The effect of planning that accounts for the natural fluctuations in demand for ICU beds is accentuated for smaller ICUs in isolated areas. An unavoidable consequence of providing such hospitals with enough ICU beds to independently deal with their own surges in demand is that their average or median bed occupancy is very low (Table 4.22). Our data indicates that to allow each hospital in rural Manitoba to independently manage its own ICU surge demand, 17 ICU beds were needed if it was considered acceptable for the need for ICU beds to threaten to exceed supply less than 18 days a year; and 25 beds were required if it was acceptable to the need for ICU beds threaten to supply less than four days yearly (Table 4.18). In comparison, there were 27 rural ICU beds in 2006/07. Another consideration relevant to ICU bed numbers in rural hospitals is that these hospitals sometimes use the ICU–capable beds to care for non–ICU patients who require a higher level of nursing care or monitoring than is available on their regular wards. These considerations imply that it is incorrect to conclude that low median occupancy rates indicate that even fewer ICU beds in those sites would be sufficient.
A caveat in comparing estimated bed needs to the actual number of beds (Table 4.21) is that the actual number of beds is derived from the Manitoba Health bed map. The bed map likely overestimates the true (and fluctuating) availability of ICU beds, as it does not account for bed closures due to maintenance or beds that are unavailable due to lack of nursing or medical staff.
60 University of Manitoba
Specific Aim 4: Population–Based Description of ICU Use and ICU Patients
While patient count information is the starting point for estimating the number of ICU beds needed, there are other important considerations whose omission can lead to underestimating or overestimating ICU bed needs. There are four reasons that the patient count data may underestimate the number of beds needed.
1. Patients otherwise needing ICU care may be triaged away from ICU when all available beds are filled. The finding by Strauss et al. that, on average, sicker patients were admitted to ICU during periods of bed scarcity is consistent with triaging away less sick patients who would otherwise have been admitted to ICU (Strauss, LoGerfo, Yeltatzie, Temkin, & Hudson, 1986). Also, mathematical modelling shows that the rate at which potential patients are triaged away from ICU increases during times of restricted bed availability (McManus et al., 2004).
2. Even without outright refusals for ICU care, ICU performance and outcomes are suboptimal if ICU occupancy is too high (Chrusch, Olafson, McMillan, Roberts, & Gray, 2009; de Bruin et al., 2007; Department of Health, 2000; Iapichino et al., 2004; McManus et al., 2004). An ICU at or near capacity often must delay accepting a new patient until an existing patient can be transferred out of ICU. Such delays may result in adverse medical consequences (Chalfin, Trzeciak, Likourezos, Baumann, & Dellinger, 2007).
3. When a new patient needs care in an ICU that is at capacity, usually the “least sick” existing patient is transferred out to another hospital ward. That person may still warrant ICU care, and premature transfer under such “bed pressure” can result in adverse clinical outcomes (Chrusch et al., 2009; Daly, Beale, & Chang, 2001; Goldfrad & Rowan, 2000).
4. There are practical difficulties and inefficiencies that result when ICUs operate at or very near capacity. For example, since it typically requires one hour for cleaning and otherwise preparing a recently–used ICU room for a new patient, there are additional delays in accepting new patients when an ICU is at capacity. The magnitude of these difficulties is higher in ICUs with fewer beds and with higher patient turnover rates (de Bruin et al., 2007).
Patient count data can also overestimate the number of patients needing ICU care. This occurs when availability of regular ward beds are the limiting factor in transferring patients out of ICU. In such circumstances, patients remain in ICU longer than their medical situations require. This phenomenon may also worsen patients’ outcomes (Garland & Connors, 2008).
ICU count data is the starting point for assessing the number of ICU beds needed in Manitoba. However, in doing so planners must determine or take account of:
• The acceptable frequency threshold for triaging patients away from ICU due to being at capacity • The practicalities and consequences of ICU bed sharing across hospitals • The fact that operating near capacity results in suboptimal performance and outcomes • The availability of regular ward and intermediate care (step–down) beds to which ICU patients can
be transferred once the need for ICU care has passed
Results Part 4 – Patient Characteristics and Population–Based Incidence of ICU Care Among Manitobans
For this section, unique persons are the unit of measure within each year; thus a given person is included only once in each year that he/she had any ICU care. Data are presented separately for Manitobans and non–Manitobans, and population–based incidence rates of ICU care can be calculated only for Manitobans. For data presented by sex, income quintiles, and residency location, we use age–adjusted rates of ICU care unless otherwise indicated, with unadjusted rates shown in tables in the Appendix 4.
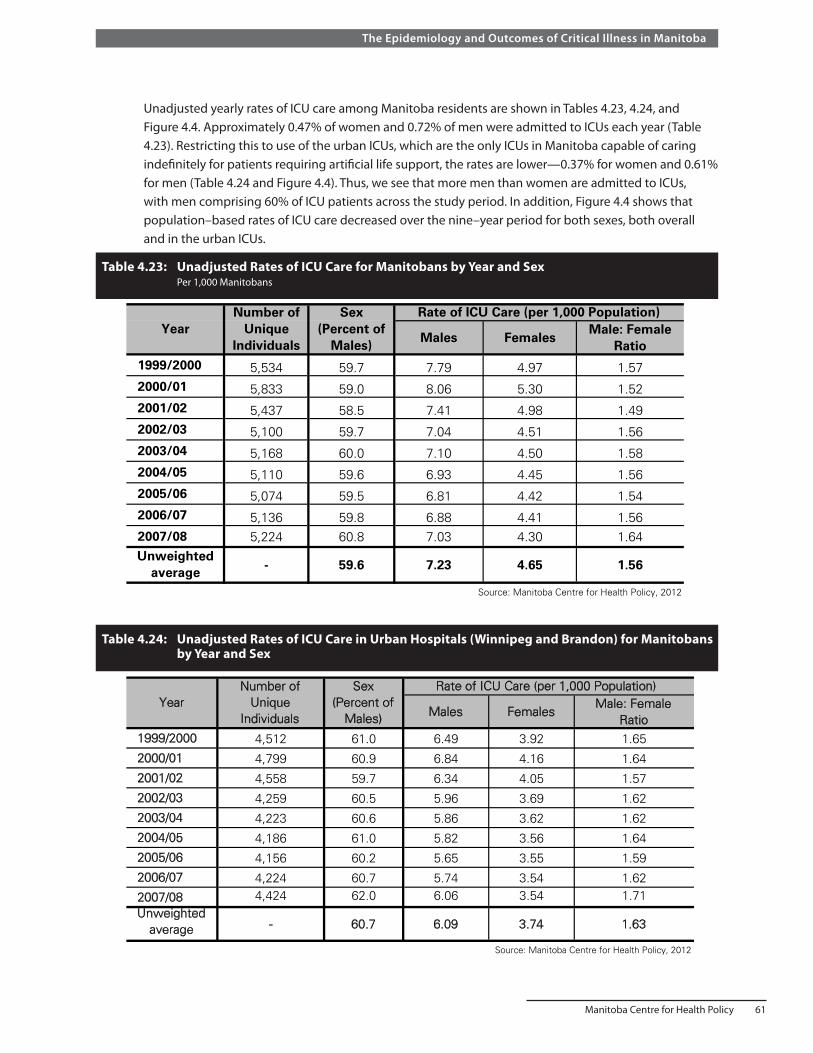
Manitoba Centre for Health Policy 61
The Epidemiology and Outcomes of Critical Illness in Manitoba
Unadjusted yearly rates of ICU care among Manitoba residents are shown in Tables 4.23, 4.24, and Figure 4.4. Approximately 0.47% of women and 0.72% of men were admitted to ICUs each year (Table 4.23). Restricting this to use of the urban ICUs, which are the only ICUs in Manitoba capable of caring indefinitely for patients requiring artificial life support, the rates are lower—0.37% for women and 0.61% for men (Table 4.24 and Figure 4.4). Thus, we see that more men than women are admitted to ICUs, with men comprising 60% of ICU patients across the study period. In addition, Figure 4.4 shows that population–based rates of ICU care decreased over the nine–year period for both sexes, both overall and in the urban ICUs.
Table 4.23: Unadjusted Rates of ICU Care for Manitobans by Year and Sex Per 1,000 Manitobans
Males FemalesMale: Female
Ratio1999/2000 5,534 59.7 7.79 4.97 1.572000/01 5,833 59.0 8.06 5.30 1.522001/02 5,437 58.5 7.41 4.98 1.492002/03 5,100 59.7 7.04 4.51 1.562003/04 5,168 60.0 7.10 4.50 1.582004/05 5,110 59.6 6.93 4.45 1.562005/06 5,074 59.5 6.81 4.42 1.542006/07 5,136 59.8 6.88 4.41 1.562007/08 5,224 60.8 7.03 4.30 1.64Unweighted
average - 59.6 7.23 4.65 1.56
Source: Manitoba Centre for Health Policy, 2012
YearNumber of
Unique Individuals
Rate of ICU Care (per 1,000 Population)Sex (Percent of
Males)
Table 4.23: Unadjusted Rates of ICU Care for Manitobans by Year and Sex Per 1,000 Manitobans
Table 4.24: Unadjusted Rates of ICU Care in Urban Hospitals (Winnipeg and Brandon) for Manitobans by Year and Sex
Males FemalesMale: Female
Ratio1999/2000 4,512 61.0 6.49 3.92 1.65
2000/01 4,799 60.9 6.84 4.16 1.64
2001/02 4,558 59.7 6.34 4.05 1.57
2002/03 4,259 60.5 5.96 3.69 1.62
2003/04 4,223 60.6 5.86 3.62 1.62
2004/05 4,186 61.0 5.82 3.56 1.64
2005/06 4,156 60.2 5.65 3.55 1.59
2006/07 4,224 60.7 5.74 3.54 1.62
2007/08 4,424 62.0 6.06 3.54 1.71Unweighted
average - 60.7 6.09 3.74 1.63
Source: Manitoba Centre for Health Policy, 2012
Table 4.24: Unadjusted Rates of ICU Care in Urban Hospitals (Winnipeg and Brandon) for Manitobans by Year and Sex
YearNumber of
Unique Individuals
Sex (Percent of
Males)
Rate of ICU Care (per 1,000 Population)

62 University of Manitoba
Specific Aim 4: Population–Based Description of ICU Use and ICU Patients
Figure 4.4: Unadjusted Rates of ICU Care Among Manitobans, per 1,000 Population, by Year and Sex Data shown separately for all ICU care, and care restricted to the urban ICUs (Winnipeg and Brandon)
0
1
2
3
4
5
6
7
8
9
10
1999/2000 2000/01 2001/02 2002/03 2003/04 2004/05 2005/06 2006/07 2007/08
Rat
e p
er 1
,000
Po
pu
lati
on
Year
Males All ICU
Male Urban ICU
Female All ICU
Female Urban ICU
Source: Manitoba Centre for Health Policy, 2012
Figure 4.4: Unadjusted Rates of ICU Care Among Manitobans, per 1,000 Population, by Year and Sex
The age of ICU patients is shown in Table 4.25, Table 4.26, and Table 4.27. Age decreased very slightly over the study period, with mean values of 63–65 years and median values of 66–68 years. Table 4.26 shows that, on average, women admitted to ICUs were slightly but significantly older than men.
Table 4.25: Age of Manitobans Admitted to ICUs by Year
MeanStandard Deviation Median
1999/2000 5,534 65.0 16.2 68 55.0 - 77.0
2000/01 5,833 65.4 16.3 69 56.0 - 77.0
2001/02 5,437 65.4 15.9 68 55.0 - 77.0
2002/03 5,100 64.7 16.2 68 54.0 - 77.0
2003/04 5,168 64.4 16.4 67 54.0 - 77.0
2004/05 5,110 64.3 16.6 66 54.0 - 77.0
2005/06 5,074 63.8 16.5 66 53.0 - 77.0
2006/07 5,136 64.0 16.8 66 54.0 - 77.0
2007/08 5,224 63.7 16.5 66 54.0 - 76.0Source: Manitoba Centre for Health Policy, 2012
YearNumber of
Unique Individuals
Age
Table 4.25: Age of Manitobans Admitted to ICUs by Year
Interquartile Range

Manitoba Centre for Health Policy 63
The Epidemiology and Outcomes of Critical Illness in Manitoba
Tabl
e 4.
26:
Age
of M
anit
oban
s A
dmit
ted
to IC
Us
by Y
ear a
nd S
ex
Num
ber
of U
niqu
e In
divi
dual
sM
ean
Sta
ndar
d D
evia
tion
Med
ian
Num
ber
of U
niqu
e In
divi
dual
sM
ean
Sta
nd
ard
Dev
iati
on
Med
ian
1 999
/200
0 *
3,30
664
.015
.667
54-
762,
228
66.5
16.9
7157
-79
2 000
/01
*3,
444
63.9
15.8
6754
-76
2,38
967
.516
.771
58-
79
2 001
/02
*3,
182
64.3
15.4
6654
-76
2,25
566
.916
.671
57-
79
2 002
/03
*3,
044
63.5
15.7
6654
-75
2,05
666
.516
.770
56-
79
2 003
/04
*3,
100
63.4
15.8
6653
-76
2,06
866
.017
.170
56-
79
2 004
/05
*3,
047
63.6
15.8
6554
-76
2,06
365
.517
.669
55-
79
2 005
/06
*3,
017
63.1
15.9
6553
-76
2,05
764
.817
.468
53-
78
2 006
/07
*3,
069
62.9
16.1
6453
-75
2,06
765
.617
.768
55-
792 0
07/0
8 *
3,17
862
.615
.663
53-
752,
046
65.4
17.6
6955
-79
Unw
eigh
ted
aver
age
--63
.5--
65.4
--66
.1--
69.7
* p<
0.00
1 fo
r co
mpa
rison
of
mal
e vs
. fem
ale
mea
n va
lues
, t-t
est
Sou
rce:
Man
itoba
Cen
tre
for
Hea
lth P
olic
y, 2
012
--
Inte
rqu
arti
leR
ang
e
Fem
ales
--
Tabl
e 4.
26: A
ge o
f M
anito
bans
Adm
itted
to
ICU
s by
Yea
r an
d S
ex
Yea
rM
ales
Inte
rqua
rtile
R
ange
Tabl
e 4.
27:
Age
Dis
trib
utio
n of
Man
itob
an IC
U P
atie
nts
by Y
ear
Valu
es a
re c
olum
n pe
rcen
tage
s
Age
Gro
upU
nwei
ghte
d(Y
ears
of
Age
)A
vera
ge
17-2
42.
242.
431.
952.
312.
502.
252.
402.
612.
762.
38
25-2
91.
661.
411.
491.
331.
301.
681.
521.
621.
701.
52
30-3
41.
791.
391.
601.
651.
951.
822.
112.
141.
881.
81
35-3
92.
642.
622.
042.
612.
423.
133.
052.
732.
162.
60
40-4
43.
653.
753.
643.
864.
514.
133.
863.
914.
363.
97
45-4
95.
084.
975.
336.
025.
715.
176.
585.
765.
595.
58
50-5
46.
796.
947.
637.
337.
597.
577.
887.
878.
157.
53
55-5
97.
758.
198.
889.
378.
829.
6310
.17
10.0
510
.15
9.22
60-6
49.
639.
079.
238.
969.
4810
.49
9.36
10.5
711
.10
9.77
65-6
912
.03
11.3
011
.50
10.8
210
.91
10.5
710
.86
10.5
110
.51
11.0
0
70-7
414
.11
13.8
012
.86
13.5
712
.75
11.1
512
.24
11.0
811
.93
12.6
1
75-7
915
.23
15.0
414
.46
13.4
513
.43
13.0
111
.90
12.2
512
.27
13.4
5
80-8
49.
8710
.66
10.8
011
.00
11.0
111
.02
9.99
9.54
9.04
10.3
2
85-8
95.
336.
226.
335.
515.
555.
895.
706.
646.
345.
9590
+2.
192.
192.
262.
202.
072.
492.
362.
732.
072.
28
All
100.
0010
0.00
100.
0010
0.00
100.
0010
0.00
100.
0010
0.00
100.
0010
0.00
Sou
rce:
Man
itoba
Cen
tre
for
Hea
lth P
olic
y, 2
012
Tabl
e 4.
27: A
ge D
istr
ibut
ion
of M
anito
ban
ICU
Pat
ient
s by
Yea
r V
alue
s ar
e co
lum
n pe
rcen
tage
s
1999
/200
020
00/0
120
01/0
220
02/0
320
03/0
420
04/0
520
05/0
620
06/0
720
07/0
8

64 University of Manitoba
Specific Aim 4: Population–Based Description of ICU Use and ICU Patients
Both the proportion of ICU patients (Table 4.27) and the incidence of ICU care (Table 4.28, Table 4.29, and Figure 4.5) increased steeply over age 40, peaked at age 75–84, and then declined as age rose further. Approximately 2% of Manitobans aged 75 and older were admitted to an ICU each year. In addition, for older people we observed a trend over time in the rates of ICU care (Figure 4.6). A simple analysis regressing yearly incidence rates versus time showed that admission rates declined significantly over time among people aged 50 and older (Table 4.30). This difference could reflect decreasing rates of critical illness, changes over time in the willingness or desire for ICU care among older patients, or changes in ICU access for older critically ill people.
Table 4.28: Age–Specific Rates of ICU Care Among Manitobans by Year Per 1,000 population
Age Group Unweighted(Years of Age) Average
17-24 1.00 1.14 0.84 0.93 1.00 0.89 0.93 1.02 1.08 0.98
25-29 1.20 1.08 1.08 0.91 0.89 1.14 1.03 1.10 1.15 1.07
30-34 1.25 1.04 1.14 1.09 1.31 1.22 1.41 1.46 1.29 1.25
35-39 1.54 1.65 1.25 1.56 1.53 2.01 1.99 1.80 1.44 1.64
40-44 2.23 2.38 2.13 2.11 2.46 2.24 2.13 2.26 2.64 2.29
45-49 3.44 3.46 3.39 3.51 3.33 2.94 3.66 3.21 3.13 3.34
50-54 5.31 5.50 5.52 4.93 5.06 4.84 4.88 4.83 4.96 5.09
55-59 7.94 8.62 8.22 7.63 6.93 7.19 7.24 7.09 7.21 7.56
60-64 12.04 11.73 10.92 9.62 9.97 10.47 9.04 9.72 9.71 10.36
65-69 16.03 16.03 15.34 13.67 13.81 13.22 13.22 12.66 12.39 14.04
70-74 20.37 21.11 18.41 18.24 17.69 15.35 16.93 15.62 17.17 17.88
75-79 24.84 25.89 23.37 20.72 21.11 20.51 18.71 19.52 19.84 21.61
80-84 24.52 26.97 24.69 22.70 22.40 21.67 19.47 18.93 18.43 22.20
85-89 21.60 26.10 24.40 19.81 20.09 21.12 19.40 22.12 20.31 21.6690+ 17.74 18.01 16.87 14.78 13.59 15.20 14.02 15.76 11.91 15.32
Source: Manitoba Centre for Health Policy, 2012
Table 4.28: Age-Specific Rates of ICU Care Among Manitobans by YearPer 1,000 population
1999/2000 2000/01 2001/02 2002/03 2003/04 2004/05 2005/06 2006/07 2007/08
Table 4.29: Age–Specific Rates of ICU Care in Urban Hospitals (Winnipeg and Brandon) Among Manitobans by Year Per 1,000 population
UnweightedAverage
17-24 0.70 0.86 0.72 0.69 0.75 0.69 0.67 0.74 0.81 0.74
25-29 0.96 0.83 0.80 0.74 0.63 0.88 0.80 0.85 0.86 0.81
30-34 0.96 0.84 0.93 0.90 0.98 1.01 1.13 1.14 1.00 0.99
35-39 1.24 1.35 1.00 1.31 1.10 1.51 1.46 1.56 1.22 1.31
40-44 1.72 1.84 1.76 1.73 1.94 1.80 1.74 1.90 2.24 1.85
45-49 2.98 2.82 2.84 2.93 2.79 2.38 2.89 2.60 2.71 2.77
50-54 4.38 4.52 4.68 4.31 4.13 3.96 4.10 4.10 4.41 4.29
55-59 6.61 7.18 7.04 6.43 5.84 5.99 6.05 6.05 6.39 6.40
60-64 10.05 10.00 9.62 7.96 8.49 8.95 7.53 8.46 8.63 8.85
65-69 13.41 13.40 13.40 11.91 11.61 11.04 11.42 10.86 10.33 11.93
70-74 16.88 17.73 15.49 15.34 14.98 13.12 14.02 13.10 14.71 15.04
75-79 20.30 21.70 19.51 17.82 17.61 17.12 15.93 15.73 16.99 18.08
80-84 19.94 21.55 20.07 18.33 17.52 17.36 15.90 14.72 15.11 17.83
85-89 16.62 20.85 19.22 15.09 14.91 16.00 14.77 17.06 16.01 16.7390+ 11.29 13.51 11.93 11.22 10.92 10.65 9.58 10.69 7.94 10.86
Source: Manitoba Centre for Health Policy, 2012
Table 4.29: Age-Specific Rates of ICU Care in Urban Hospitals (Winnipeg and Brandon) Among Manitobans by YearPer 1,000 population
1999/2000 2000/01 2001/02 2002/03 2003/04 2004/05 2005/06 2006/07 2007/08Age Group (Years of Age)

Manitoba Centre for Health Policy 65
The Epidemiology and Outcomes of Critical Illness in Manitoba
Figure 4.5: Unweighted Average Value, 1999/2000–2007/08, of Age–Specific Incidence Rates of ICU Care for Manitobans Data shown separately for all ICU care, and care restricted to the urban ICUs (Winnipeg and Brandon)
Figure 4.6: Selected Age–Specific Incidence Rates of All ICU Care by Year
0
4
8
12
16
20
24
17-24 25-29 30-34 35-39 40-44 45-49 50-54 55-59 60-64 65-69 70-74 75-79 80-84 85-89 90+
Rat
e p
er 1
,000
Po
pu
lati
on
Age (Years)
All ICU Care
Urban ICU Care
Source: Manitoba Centre for Health Policy, 2012
Figure 4.5: Unweighted Average Value, 1999/2000-2007/08, of Age-Specific Incidence Rates of ICU Care for
0
5
10
15
20
25
30
1999/2000 2000/01 2001/02 2002/03 2003/04 2004/05 2005/06 2006/07 2007/08
Rat
e p
er 1
,000
Po
pu
lati
on
Year
80-84
70-74
60-64
50-54
40-44
30-34
Source: Manitoba Centre for Health Policy, 2012
Age
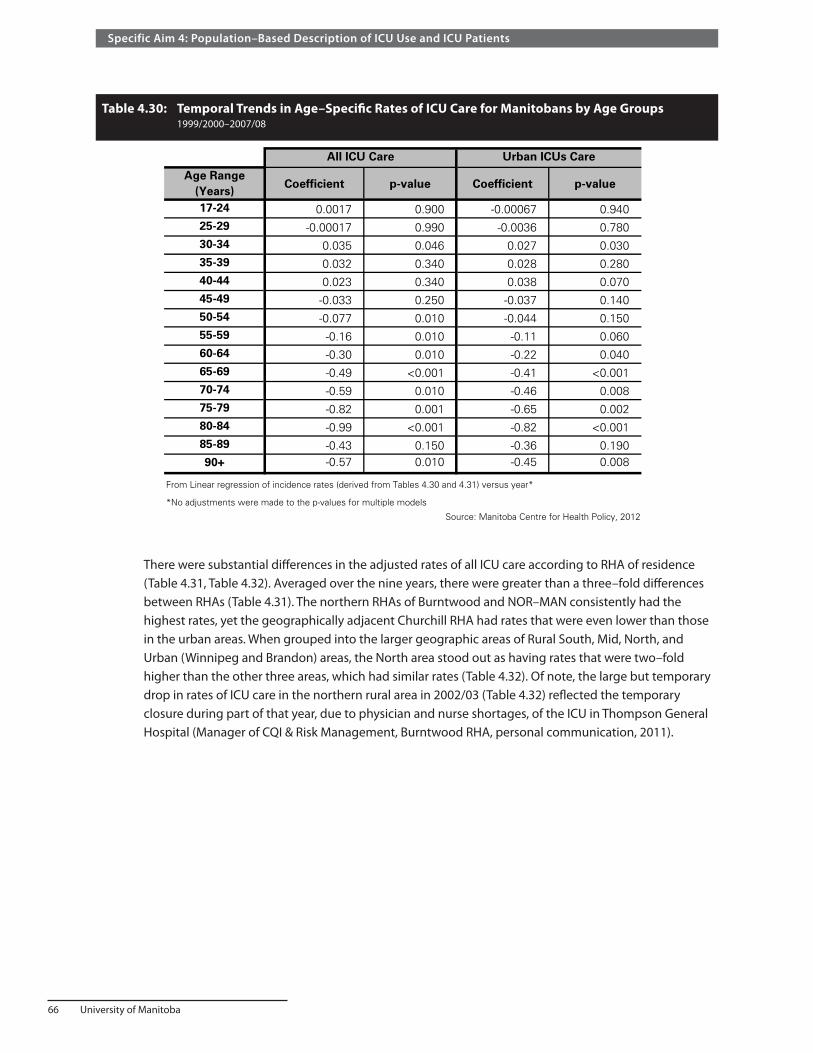
66 University of Manitoba
Specific Aim 4: Population–Based Description of ICU Use and ICU Patients
Table 4.30: Temporal Trends in Age–Specific Rates of ICU Care for Manitobans by Age Groups 1999/2000–2007/08
Age Range (Years)
Coefficient p-value Coefficient p-value
17-24 0.0017 0.900 -0.00067 0.94025-29 -0.00017 0.990 -0.0036 0.78030-34 0.035 0.046 0.027 0.03035-39 0.032 0.340 0.028 0.28040-44 0.023 0.340 0.038 0.07045-49 -0.033 0.250 -0.037 0.14050-54 -0.077 0.010 -0.044 0.15055-59 -0.16 0.010 -0.11 0.06060-64 -0.30 0.010 -0.22 0.04065-69 -0.49 <0.001 -0.41 <0.00170-74 -0.59 0.010 -0.46 0.00875-79 -0.82 0.001 -0.65 0.00280-84 -0.99 <0.001 -0.82 <0.00185-89 -0.43 0.150 -0.36 0.19090+ -0.57 0.010 -0.45 0.008
*No adjustments were made to the p-values for multiple models
Source: Manitoba Centre for Health Policy, 2012
All ICU Care Urban ICUs Care
Table 4.30: Temporal Trends in Age-Specific Rates of ICU Care for Manitobans by Age Groups
1999/2000-2007/08
From Linear regression of incidence rates (derived from Tables 4.30 and 4.31) versus year*
There were substantial differences in the adjusted rates of all ICU care according to RHA of residence (Table 4.31, Table 4.32). Averaged over the nine years, there were greater than a three–fold differences between RHAs (Table 4.31). The northern RHAs of Burntwood and NOR–MAN consistently had the highest rates, yet the geographically adjacent Churchill RHA had rates that were even lower than those in the urban areas. When grouped into the larger geographic areas of Rural South, Mid, North, and Urban (Winnipeg and Brandon) areas, the North area stood out as having rates that were two–fold higher than the other three areas, which had similar rates (Table 4.32). Of note, the large but temporary drop in rates of ICU care in the northern rural area in 2002/03 (Table 4.32) reflected the temporary closure during part of that year, due to physician and nurse shortages, of the ICU in Thompson General Hospital (Manager of CQI & Risk Management, Burntwood RHA, personal communication, 2011).
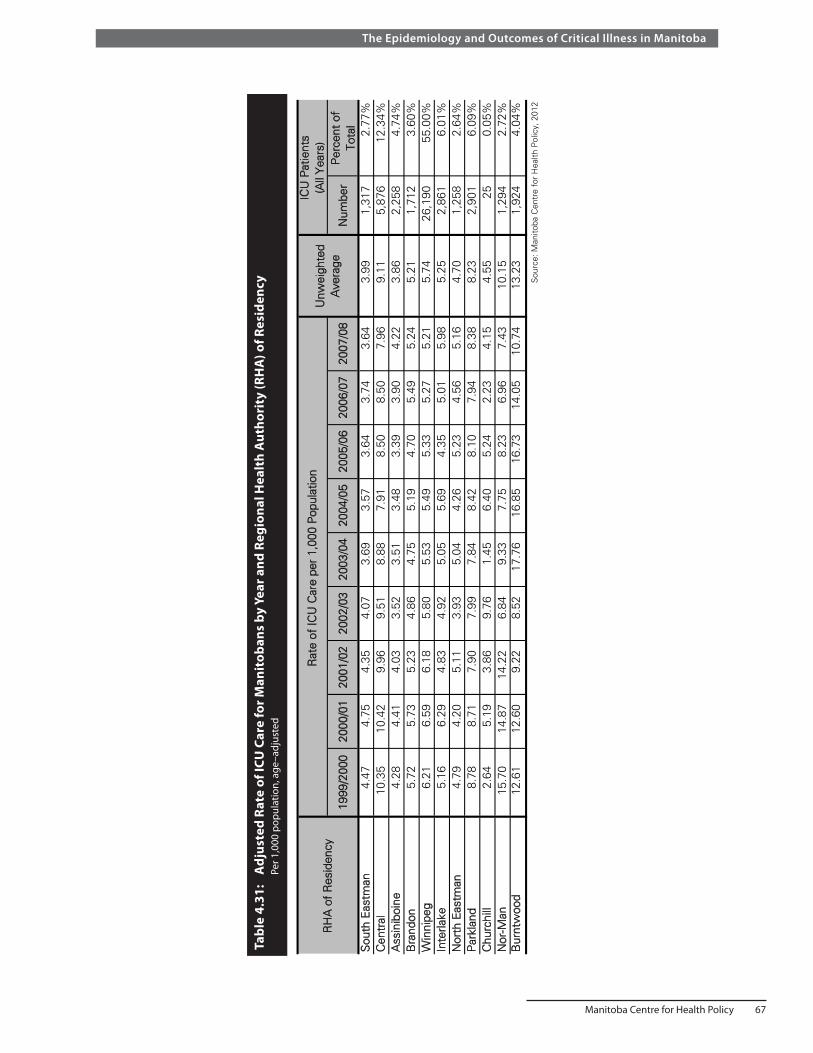
Manitoba Centre for Health Policy 67
The Epidemiology and Outcomes of Critical Illness in Manitoba
Tabl
e 4.
31:
Adj
uste
d Ra
te o
f ICU
Car
e fo
r Man
itob
ans
by Y
ear a
nd R
egio
nal H
ealt
h A
utho
rity
(RH
A) o
f Res
iden
cy
Pe
r 1,0
00 p
opul
atio
n, a
ge–a
djus
ted
1999
/200
020
00/0
120
01/0
220
02/0
320
03/0
420
04/0
520
05/0
620
06/0
720
07/0
8N
umbe
r P
erce
nt o
f T o
tal
Sou
th E
astm
an4.
474.
754.
354.
073.
693.
573.
643.
743.
643.
991,
317
2.77
%C
entr
al10
.35
10.4
29.
969.
518.
887.
918.
508.
507.
969.
115,
876
12.3
4%A
ssin
iboi
ne4.
284.
414.
033.
523.
513.
483.
393.
904.
223.
862,
258
4.74
%B
rand
on5.
725.
735.
234.
864.
755.
194.
705.
495.
245.
211,
712
3.60
%W
inni
peg
6.21
6.59
6.18
5.80
5.53
5.49
5.33
5.27
5.21
5.74
26,1
9055
.00%
I nte
rlake
5.16
6.29
4.83
4.92
5.05
5.69
4.35
5.01
5.98
5.25
2,86
16.
01%
Nor
th E
astm
an4.
794.
205.
113.
935.
044.
265.
234.
565.
164.
701,
258
2.64
%P
arkl
and
8.78
8.71
7.90
7.99
7.84
8.42
8.10
7.94
8.38
8.23
2,90
16.
09%
Chu
rchi
ll2.
645.
193.
869.
761.
456.
405.
242.
234.
154.
5525
0.05
%N
or-M
an15
.70
14.8
714
.22
6.84
9.33
7.75
8.23
6.96
7.43
10.1
51,
294
2.72
%B
urnt
woo
d12
.61
12.6
09.
228.
5217
.76
16.8
516
.73
14.0
510
.74
13.2
31,
924
4.04
%
Sou
rce:
Man
itoba
Cen
tre
for
Hea
lth P
olic
y, 2
012
Tabl
e 4.
31: A
djus
ted
Rat
e of
ICU
Car
e fo
r M
anito
bans
by
Yea
r an
d R
egio
nal H
ealth
Aut
horit
y (R
HA
) of
Res
iden
cy P
er 1
,000
pop
ulat
ion,
age
-adj
uste
d
RH
A o
f R
esid
ency
Rat
e of
ICU
Car
e pe
r 1,
000
Pop
ulat
ion
ICU
Pat
ient
s ( A
ll Y
ears
)U
nwei
ghte
d A
vera
ge

68 University of Manitoba
Specific Aim 4: Population–Based Description of ICU Use and ICU Patients
Table 4.32: Adjusted Rate of ICU Care for Manitobans by Year and Residency Location Per 1,000 population, age–adjusted
A different pattern appears when looking only at the urban ICUs, which alone are capable of caring for the sickest patients (Table 4.33). Compared to urban residents, those in the South Rural and Mid areas had 30–40% lower population–based rates of urban ICU care, while those in the North had rates 10% higher. The main difference is that rates of urban ICU care among rural residents seen in Table 4.33 are all substantially lower than the rates of all (urban and/or rural) ICU care in those areas shown in Table 4.32.
Comparing the unadjusted rates of ICU care shown in Appendix Table A4.3 and Appendix Table A4.4 allows for the analysis of people residing in each geographic region who received ICU care in urban versus rural ICUs. This indicates (Table 4.34) that 56–66% of rural residents receiving ICU care had at least some of that care provided in an urban ICU, while 34–44% of rural residents admitted to ICUs were cared for entirely in rural ICUs in a given year. Taken together, rates of ICU care among urban and rural residents suggest that the two types of ICUs are used differently, specifically that rural ICUs are used to care for larger proportions of patients who are less ill; subsequent analysis of types and severity of acute illness (Part 7 of this Specific Aim) further validate this finding.
Table 4.33: Adjusted Rate of Urban ICU Care for Manitobans by Year and Residency Location Per 1,000 population, age–adjusted
Year Rural South Mid North Urban
1999/2000 3.88 3.90 6.77 6.12
2000/01 3.86 4.31 6.70 6.48
2001/02 3.74 3.92 7.01 6.06
2002/03 3.32 3.60 5.18 5.67
2003/04 3.26 3.88 6.10 5.42
2004/05 2.94 3.99 5.66 5.40
2005/06 3.15 3.75 6.14 5.19
2006/07 3.25 3.61 6.13 5.20
2007/08 3.50 4.35 6.00 5.15
Unweighted Average 3.43 3.92 6.19 5.63
Source: Manitoba Centre for Health Policy, 2012
Table 4.33: Adjusted Rate of Urban ICU Care for Manitobans by Year and Residency Location
Per 1,000 population, age-adjusted
Year Rural South Mid North Urban
1999/2000 6.76 6.24 13.81 6.18
2000/01 6.93 6.60 13.66 6.53
2001/02 6.54 5.85 11.42 6.12
2002/03 6.05 5.59 7.96 5.74
2003/04 5.74 5.89 12.99 5.48
2004/05 5.30 6.16 11.85 5.47
2005/06 5.54 5.69 11.95 5.28
2006/07 5.76 5.78 10.34 5.28
2007/08 5.61 6.47 9.06 5.21
Unweighted Average 6.03 6.03 11.45 5.70Source: Manitoba Centre for Health Policy, 2012
Table 4.32: Adjusted Rate of ICU Care for Manitobans by Year and Residency Location
Per 1,000 population, age-adjusted

Manitoba Centre for Health Policy 69
The Epidemiology and Outcomes of Critical Illness in Manitoba
Table 4.34: Percentage of Persons Receiving ICU Care Who Had Any Urban ICU Care by Year and Residency Location
Year Rural South Mid North Urban
1999/2000 57.0 62.5 48.4 99.0
2000/01 55.3 65.5 49.5 99.2
2001/02 57.0 66.9 61.8 99.1
2002/03 54.5 64.6 66.9 98.9
2003/04 56.6 65.8 45.7 98.9
2004/05 55.2 64.7 47.7 98.7
2005/06 56.6 66.5 50.5 98.3
2006/07 56.0 63.1 61.7 98.5
2007/08 62.2 67.9 68.4 98.8
Unweighted Average 56.7 65.3 55.6 98.8
Values derived as a quotient of those from Tables A4.3 and A4.4
Source: Manitoba Centre for Health Policy, 2012
Table 4.34: Percentage of Persons Receiving ICU Care Who Had Any Urban ICU Care by Year and Residency Location
There are also differences in the rates of ICU care according to income, with higher rates among those with lower average household income in both urban and rural areas (Table 4.35, Table 4.36, Figure 4.7). As expected, very high rates of ICU care were seen among patients whose average household income is unknown, which primarily represents institutionalized persons. In addition, higher population–based higher rates of ICU care were seen among those in lower income quintiles, though this gradient was more consistent and stronger for urban residents.
Figure 4.7: Age–Adjusted Rates of ICU Care for Manitobans by Income Quintiles Mean values over the nine years (1999/2000 – 2007/08) are shown
0
4
8
12
16
20
Urban 1(Lowest)
Urban 2 Urban 3 Urban 4 Urban 5(Highest)
Rural 1(Lowest)
Rural 2 Rural 3 Rural 4 Rural 5(Highest)
IncomeUnknown
Rat
e p
er 1
,000
Po
pu
lati
on
Income Quintile
All ICUUrban ICU
Source: Manitoba Centre for Health Policy, 2012
Figure 4.7: Age-Adjusted Rates of ICU Care for Manitobans by Income QuintilesMean values over the nine years (1999/2000 - 2007/08) are shown

70 University of Manitoba
Specific Aim 4: Population–Based Description of ICU Use and ICU Patients
Tabl
e 4.
35:
Adj
uste
d Ra
tes
of IC
U C
are
for M
anit
oban
s by
Yea
r and
Inco
me
Qui
ntile
s
1999
/200
020
00/0
120
01/0
220
02/0
320
03/0
420
04/0
520
05/0
620
06/0
720
07/0
8U
nwei
ghte
d A
vera
geN
umbe
rP
erce
nt
of T
otal
Urb
an 1
st (lo
wes
t)8.
538.
968.
157.
958.
517.
187.
137.
397.
597.
937,
770
16.3
2U
rban
2nd
6.39
7.11
6.54
6.04
5.41
5.84
5.59
5.57
5.18
5.96
5,76
112
.10
Urb
an 3
rd5.
946.
185.
945.
604.
954.
785.
084.
774.
925.
355,
297
11.1
2U
rban
4th
5.61
5.56
5.39
4.79
4.46
4.63
4.43
4.54
4.70
4.90
4,25
48.
93U
rban
5th
(hig
hest
)4.
665.
294.
854.
624.
244.
413.
984.
053.
564.
413,
660
7.69
Rur
al 1
st (lo
wes
t)10
.75
10.8
88.
729.
089.
929.
439.
419.
219.
009.
604,
938
10.3
7R
ural
2nd
6.60
7.14
6.95
6.00
6.03
5.84
6.36
6.44
6.12
6.39
4,21
58.
85R
ural
3rd
5.61
5.77
5.42
5.02
5.86
5.15
4.98
5.34
5.63
5.42
3,60
97.
58R
ural
4th
6.89
7.21
6.54
5.81
5.76
5.18
5.28
5.27
5.78
5.97
3,60
17.
56R
ural
5th
(hig
hest
)7.
177.
006.
525.
675.
876.
105.
625.
415.
386.
083,
097
6.50
Inco
me
Unk
now
n15
.47
14.7
212
.98
17.6
315
.49
18.2
415
.33
16.2
317
.27
15.9
31,
414
2.97
Last
col
umn
is n
ot u
niqu
e pe
rson
s, a
s a
pers
on m
ay b
e in
an
ICU
in m
ultip
le y
ears
Sou
rce:
Man
itoba
Cen
tre
for
Hea
lth P
olic
y, 2
012
Tabl
e 4.
35: A
djus
ted
Rat
es o
f IC
U C
are
for
Man
itoba
ns b
y Y
ear
and
Inco
me
Qui
ntile
s
Inco
me
Qui
ntile
Rat
e of
ICU
Car
e pe
r 1,
000
Pop
ulat
ion,
Age
-Adj
uste
dIC
U P
atie
nts
(All
Yea
rs)
Tabl
e 4.
36:
Adj
uste
d Ra
tes
of U
rban
ICU
Car
e fo
r Man
itob
ans
by Y
ear a
nd In
com
e Q
uint
iles
Pe
r 1,0
00 p
opul
atio
n, a
ge–a
djus
ted
Inco
me
Qui
ntile
1999
/200
020
00/0
120
01/0
220
02/0
320
03/0
420
04/0
520
05/0
620
06/0
720
07/0
8U
nwei
ghte
d A
vera
geU
rban
1st
(low
est)
8.44
8.85
8.04
7.87
8.44
7.12
7.04
7.24
7.51
7.84
Urb
an 2
nd6.
377.
106.
495.
995.
365.
785.
535.
545.
155.
92
Urb
an 3
rd5.
906.
175.
915.
544.
924.
754.
984.
734.
895.
31
Urb
an 4
th5.
595.
545.
364.
764.
454.
604.
404.
504.
664.
88U
rban
5th
(hig
hest
)4.
665.
274.
844.
574.
224.
373.
954.
013.
534.
38
Rur
al 1
st (lo
wes
t)5.
485.
115.
215.
054.
904.
924.
664.
805.
015.
02
Rur
al 2
nd3.
624.
014.
283.
353.
153.
173.
513.
773.
953.
65
Rur
al 3
rd3.
713.
893.
423.
603.
923.
403.
303.
263.
923.
60
Rur
al 4
th3.
944.
063.
842.
953.
673.
133.
473.
503.
923.
61R
ural
5th
(hig
hest
)4.
524.
824.
093.
783.
623.
853.
933.
484.
044.
01
I nco
me
Unk
now
n10
.77
12.0
311
.06
15.9
511
.95
14.7
312
.53
13.8
314
.64
13.0
6S
ourc
e: M
anito
ba C
entr
e fo
r H
ealth
Pol
icy,
201
2
Tabl
e 4.
36: A
djus
ted
Rat
es o
f U
rban
ICU
Car
e fo
r M
anito
bans
by
Yea
r an
d In
com
e Q
uint
iles
Per
1,0
00 p
opul
atio
n, a
ge-a
djus
ted

Manitoba Centre for Health Policy 71
The Epidemiology and Outcomes of Critical Illness in Manitoba
Summary and discussion of Results Part 4The rates of ICU care in Manitoba are high, with approximately 0.47% of women and 0.72% of men admitted to ICUs each year. The population–based rates of ICU care for Manitobans decreased over the nine–year period of analysis. These rates can be compared to other published population–based data. Rates for Manitobans of both sexes are approximately double those in the Calgary Health Region (Laupland, 2004); however, part of this difference is explained by the exclusion of coronary care units in the Calgary data, which comprised 21% of male and 17% of female admissions to Winnipeg ICUs from 2000/01–2007/08. On the other hand, age–specific rates in Olmsted County, Minnesota are approximately double those in Manitoba (Seferian & Afessa, 2006). There are three possible explanations for such differences between locales.
1. Differences in ascertainment of ICU care in population–based data such as ours versus data which is not population–based
2. Differences in the rates of critical illness between populations (Angus et al., 2001; Behrendt, 2000; Bersten, Edibam, Hunt, & Moran, 2002; Dombrovskiy, Martin, Sunderram, & Paz, 2005; Finfer et al., 2004; Sundararajan, Macisaac, Presneill, Cade, & Visvanathan, 2005)
3. ICU use is influenced by factors other than the rates of critical illness. Data support the claim that "the culture of medicine itself assures that available capacity is utilized" (Wennberg, Fisher, Goodman, & Skinner, 2008). In areas with a higher supply of ICU beds, their use is extended to patients who are less severely ill than in areas with a lower supply. For example, with ICU bed supply being 1.5 times higher in the United States than Canada (Wunsch et al., 2008), calculations based on published data indicates that 16–34% of ICU patients in the U.S. require mechanical ventilatory life support (Carson, Cox, Holmes, Howard, & Carey, 2006; Groeger et al., 1993; Wunsch et al., 2008), compared with over 50% in Canada (Needham, Bronskill, Sibbald, Pronovost, & Laupacis, 2004; Wunsch et al., 2008).
We found a marked sex difference in ICU care, with men being admitted to ICUs more commonly than women, comprising 60% of ICU patients across the study period. This male predominance has been seen in most (Dodek, Kozak, Norena, & Wong, 2009; Dombrovskiy et al., 2005; Fowler et al., 2007; Iwashyna, 2004; Laupland, Karmali, Kirkpatrick, Crowshoe, & Hameed, 2006; Valentin, Jordan, Lang, Hiesmayr, & Metnitz, 2003), but not all (Seferian & Afessa, 2006) prior studies. This phenomenon could represent:
• Confounding by variables that differ between the sexes, such as rates of comorbidities • True differences in rates of critical illness even after accounting for differences in comorbidities, etc. • Differing willingness in men versus women to receive the type of aggressive care provided in ICUs • Differences between the sexes in access to the entry points to ICU care, i.e., emergency
departments and hospital wards • Differences in ICU access provided to women versus men after admission to emergency departments
and hospital wards
In regards to the possibility of true differences in rates of critical illness, it is important to recognize how population–based rates can misleadingly suggest the presence of disparities in healthcare. An example is sex disparities in use of cardiac catheterization, a procedure mainly performed to assess the presence of ischemic heart disease. In every age group, the population–based rates of cardiac catheterizations are higher in men than women. However, Fransoo et al. have recently shown that this is misleading (2010). By normalizing the age and sex–specific counts of that procedure by the age and sex–specific rates of acute myocardial infarctions (an index that is highly correlated with the rate of ischemic heart disease), they showed that the rates of cardiac catheterization are indistinguishable for the two sexes in every age group. Additional analysis of this issue in ICU care is explored in Specific Aim 6.

72 University of Manitoba
Specific Aim 4: Population–Based Description of ICU Use and ICU Patients
We identified two age–related phenomena in the population–based incidence of ICU care. First, the rates increased steeply with advancing age, peaking at approximately age 80, and then declined as age increased further. Second, over the nine–year study period, the rates declined among patients aged 50 and older, with faster declines as age increased. While these phenomena could be due to actual declines in the rates of critical illness in older age groups or over time, they could also represent changes either in peoples’ willingness to receive ICU care or in ICU access for older critically ill persons. For comparison, lower rates of ICU care among persons in the oldest age groups was seen in Calgary (Laupland, 2004), but not in Olmsted County, Minnesota, where the age–specific rates continued to increase in those age groups (Seferian & Afessa, 2006).
We also found that the rates of ICU care differed, in a complex fashion, according to residency location. While rural residents (especially those in the North) were admitted to ICUs more frequently than urban residents, South and Mid residents were admitted less frequently to the urban ICUs, which alone are able to care for the sickest patients. Among other things, these findings suggest is that rural and urban ICUs are used differently, specifically that rural ICUs are used to care for larger proportions of patients who are less ill. This is further substantiated by results from subsequent parts of this Specific Aim showing that patients whose ICU care was provided entirely in rural ICUs had lower burdens of comorbidities and lower severity of acute illness, compared to people who received urban ICU care.
Lastly, we found differences in rates of ICU care according to SES, with higher rates among those residing in areas with lower average household income, in both urban and rural settings. This observation mirrors the relationship between SES and hospitalization rates in Manitoba (Fransoo et al., 2009).
Though the observed differences in population–based rates of ICU care between subgroups (e.g., men and women) are not incorrect, they can be confounded by interactions between the various demographic factors, e.g., sex and age. Men comprise approximately 60% of ICU patients (Table 4.23); however, because women outlive men on average, the sexes have different age distributions. In fact, the unadjusted male to female rate ratio of 1.56 underestimates the true male predominance of ICU care, as the adjusted ratio is 1.80 (Table 4.37). Additional analysis of this issue in ICU care is explored in Specific Aim 6.
Table 4.37: Adjusted and Unadjusted Rates of ICU Care for Manitobans by Year and Sex* Per 1,000 population
Male Female Male:Female Ratio Male Female Male:Female Ratio
1999/2000 7.79 4.97 1.57 8.83 4.78 1.85
2000/01 8.06 5.30 1.52 9.10 5.06 1.80
2001/02 7.41 4.98 1.49 8.35 4.76 1.75
2002/03 7.04 4.51 1.56 7.80 4.29 1.82
2003/04 7.10 4.50 1.58 7.81 4.27 1.83
2004/05 6.93 4.45 1.56 7.59 4.25 1.79
2005/06 6.81 4.42 1.54 7.37 4.22 1.75
2006/07 6.88 4.41 1.56 7.37 4.16 1.772007/08 7.03 4.30 1.64 7.45 4.06 1.83
Unweighted Average
7.23 4.65 1.56 7.96 4.43 1.80
*Unadjusted values are from Table 4.14
Source: Manitoba Centre for Health Policy, 2012
YearUnadjusted Age-Adjusted
Table 4.37: Adjusted and Unadjusted Rates of ICU Care for Manitobans by Year and Sex* Per 1,000 population
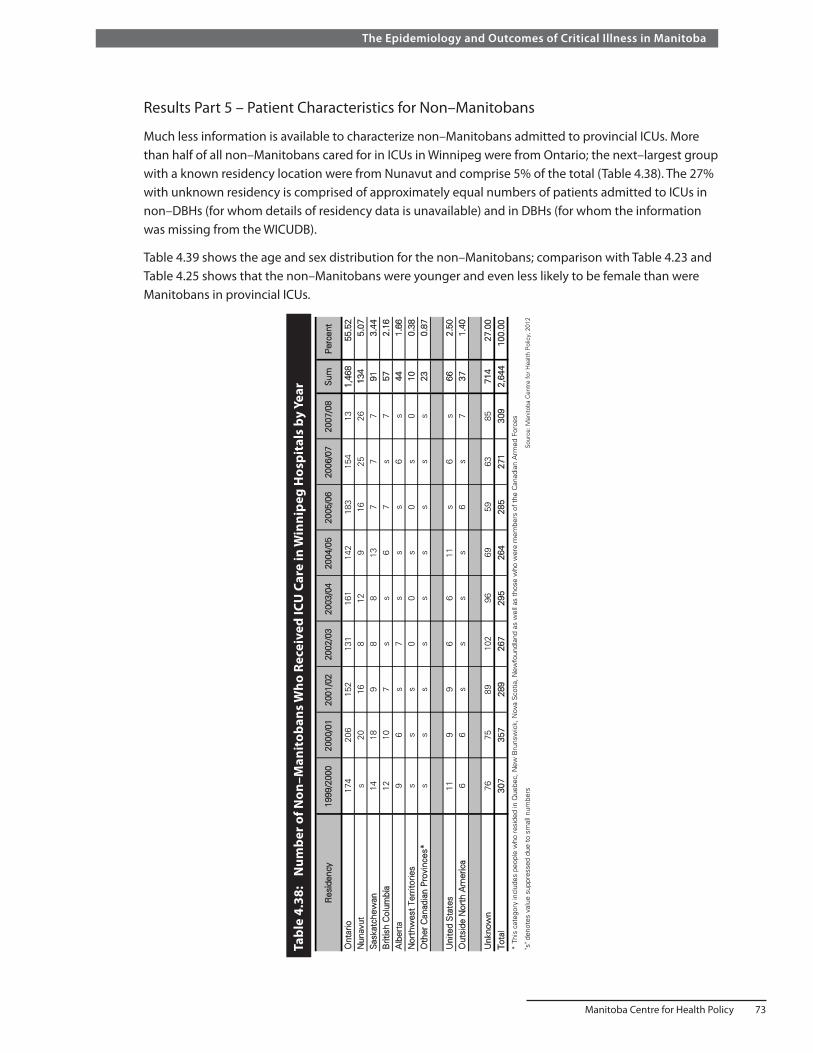
Manitoba Centre for Health Policy 73
The Epidemiology and Outcomes of Critical Illness in Manitoba
Results Part 5 – Patient Characteristics for Non–Manitobans
Much less information is available to characterize non–Manitobans admitted to provincial ICUs. More than half of all non–Manitobans cared for in ICUs in Winnipeg were from Ontario; the next–largest group with a known residency location were from Nunavut and comprise 5% of the total (Table 4.38). The 27% with unknown residency is comprised of approximately equal numbers of patients admitted to ICUs in non–DBHs (for whom details of residency data is unavailable) and in DBHs (for whom the information was missing from the WICUDB).
Table 4.39 shows the age and sex distribution for the non–Manitobans; comparison with Table 4.23 and Table 4.25 shows that the non–Manitobans were younger and even less likely to be female than were Manitobans in provincial ICUs.
Tabl
e 4.
38:
Num
ber o
f Non
–Man
itob
ans W
ho R
ecei
ved
ICU
Car
e in
Win
nipe
g H
ospi
tals
by
Year
Ont
ario
174
206
152
131
161
142
183
154
131,
468
55.5
2N
unav
uts
2016
812
916
2526
134
5.07
Sas
katc
hew
an14
189
88
137
77
913.
44B
ritis
h C
olum
bia
1210
7s
s6
7s
757
2.16
Alb
erta
96
s7
ss
s6
s44
1.66
Nor
thw
est
Terr
itorie
ss
ss
00
s0
s0
100.
38O
ther
Can
adia
n P
rovi
nces
*s
ss
ss
ss
ss
230.
87
Uni
ted
Sta
tes
119
96
611
s6
s66
2.50
Out
side
Nor
th A
mer
ica
66
ss
ss
6s
737
1.40
Unk
now
n76
7589
102
9669
5963
8571
427
.00
Tota
l30
735
728
926
729
526
428
527
130
92,
644
100.
00
"s" d
enot
es v
alue
sup
pres
sed
due
to s
mal
l num
bers
Sou
rce:
Man
itoba
Cen
tre
for
Hea
lth P
olic
y, 2
012
* Th
is c
ateg
ory
incl
udes
peo
ple
who
res
ided
in Q
uebe
c, N
ew B
runs
wic
k, N
ova
Sco
tia, N
ewfo
undl
and
as w
ell a
s th
ose
who
wer
e m
embe
rs o
f th
e C
anad
ian
Arm
ed F
orce
s
Tabl
e 4.
38: N
umbe
r of
Non
-Man
itoba
ns W
ho R
ecei
ved
ICU
Car
e in
Win
nipe
g H
ospi
tals
by
Yea
r
Res
iden
cy19
99/2
000
2000
/01
2001
/02
2002
/03
2003
/04
2004
/05
2005
/06
2006
/07
2007
/08
Sum
Per
cent

74 University of Manitoba
Specific Aim 4: Population–Based Description of ICU Use and ICU Patients
Summary and discussion of Results Parts 5More than half of non–Manitobans admitted to provincial ICUs are from Ontario. The non–Manitobans were younger and even less likely to be female than were Manitoban ICU patients.
Results Part 6 – Comorbidities
For these analyses, ICU episodes were the unit of measure. The frequency of individual comorbidities are shown in Table 4.4 and Table 4.40. Mean Charlson Comorbidity Index scores in Manitobans were approximately 2.1 (Table 4.41). As measured by this index, average comorbidity index score increased linearly with age until age 70, after which it plateaued, and even declined in the oldest age groups (Table 4.42).
Table 4.39: Age and Sex of Non–Manitobans Admitted to Winnipeg ICUs by Year
MeanStandard Deviation
Median
1999/2000 307 66.45 61.8 16.8 65 51 - 74
2000/01 357 61.90 59.4 17.4 62 48 - 72
2001/02 289 65.40 58.9 16.5 61 48 - 72
2002/03 267 67.79 58.5 16.1 59 49 - 70
2003/04 295 68.47 58.7 16.3 61 49 - 71
2004/05 264 62.88 59.7 17.6 62 48 - 74
2005/06 285 69.12 60.2 16.0 62 51 - 72
2006/07 271 63.10 58.0 17.0 59 48 - 71
2007/08 309 67.64 59.8 16.1 62 48 - 72Source: Manitoba Centre for Health Policy, 2012
YearNumber of Individuals
AgeSex (Percent of
Males)
Table 4.39: Age and Sex of Non-Manitobans Admitted to Winnipeg ICUs by Year
Interquartile Range
Table 4.41: Charlson Comorbidity Index for ICU Episodes for Manitobans
YearNumber of ICU
EpisodesMean
Standard Deviation
MedianInterquartile
Range
1999/2000 6,334 2.03 1.91 1.77 1 - 32000/01 6,674 2.05 1.89 1.77 1 - 32001/02 6,228 2.10 1.93 1.77 1 - 32002/03 5,788 2.05 1.89 1.77 1 - 32003/04 5,905 2.05 1.94 1.77 1 - 32004/05 5,758 2.16 2.03 1.77 1 - 32005/06 5,756 2.07 1.98 1.77 1 - 32006/07 5,781 2.07 1.98 1.77 1 - 32007/08 5,890 2.06 1.96 1.77 1 - 3
Source: Manitoba Centre for Health Policy, 2012
Table 4.41: Charlson Comorbidity Index for ICU Episodes for Manitobans
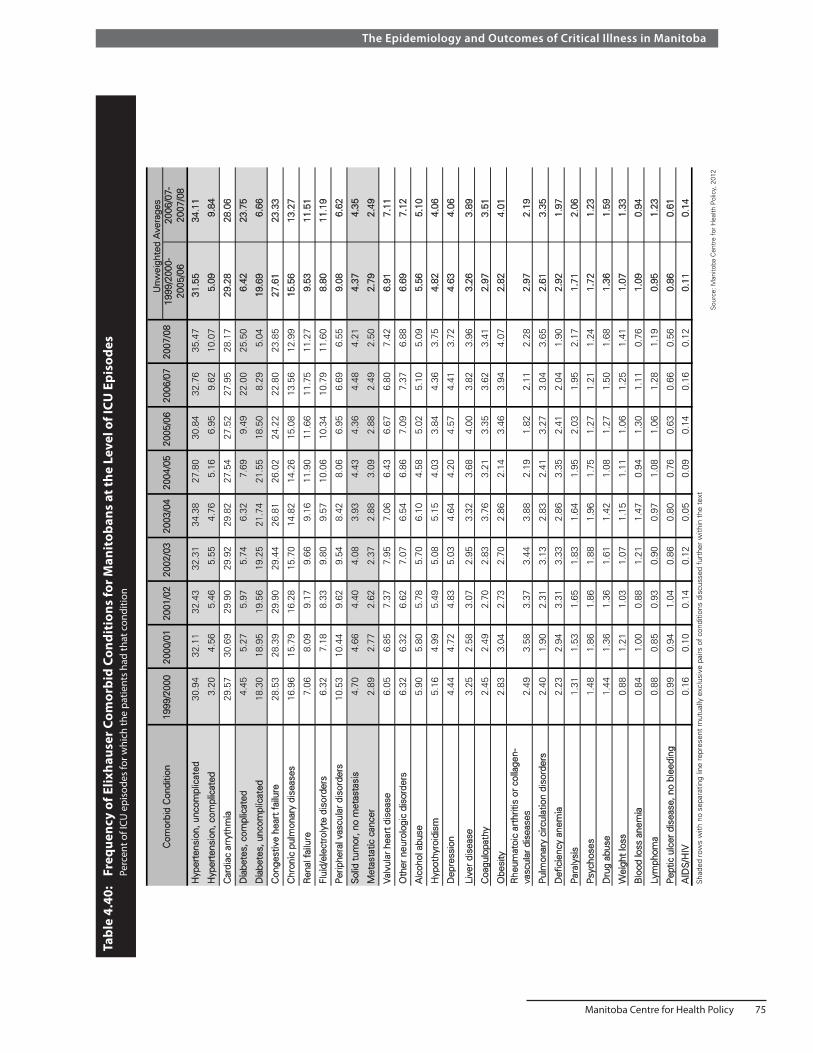
Manitoba Centre for Health Policy 75
The Epidemiology and Outcomes of Critical Illness in Manitoba
Tabl
e 4.
40:
Freq
uenc
y of
Elix
haus
er C
omor
bid
Cond
itio
ns fo
r Man
itob
ans
at th
e Le
vel o
f ICU
Epi
sode
s
Perc
ent o
f ICU
epi
sode
s fo
r whi
ch th
e pa
tient
s ha
d th
at c
ondi
tion
1999
/200
0-20
05/0
620
06/0
7-20
07/0
8
Hyp
erte
nsio
n, u
ncom
plic
ated
30.9
432
.11
32.4
332
.31
34.3
827
.80
30.8
432
.76
35.4
731
.55
34.1
1
Hyp
erte
nsio
n, c
ompl
icat
ed3.
204.
565.
465.
554.
765.
166.
959.
6210
.07
5.09
9.84
Car
diac
arr
ythm
ia29
.57
30.6
929
.90
29.9
229
.82
27.5
427
.52
27.9
528
.17
29.2
828
.06
Dia
bete
s, c
ompl
icat
ed4.
455.
275.
975.
746.
327.
699.
4922
.00
25.5
06.
4223
.75
Dia
bete
s, u
ncom
plic
ated
18.3
018
.95
19.5
619
.25
21.7
421
.55
18.5
08.
295.
0419
.69
6.66
Con
gest
ive
hear
t fa
ilure
28.5
328
.39
29.9
029
.44
26.8
126
.02
24.2
222
.80
23.8
527
.61
23.3
3
Chr
onic
pul
mon
ary
dise
ases
16.9
615
.79
16.2
815
.70
14.8
214
.26
15.0
813
.56
12.9
915
.56
13.2
7
Ren
al f
ailu
re7.
068.
099.
179.
669.
1611
.90
11.6
611
.75
11.2
79.
5311
.51
Flui
d/el
ectr
olyt
e di
sord
ers
6.32
7.18
8.33
9.80
9.57
10.0
610
.34
10.7
911
.60
8.80
11.1
9
Per
iphe
ral v
ascu
lar
diso
rder
s10
.53
10.4
49.
629.
548.
428.
066.
956.
696.
559.
086.
62
Sol
id t
umor
, no
met
asta
sis
4.70
4.66
4.40
4.08
3.93
4.43
4.36
4.48
4.21
4.37
4.35
Met
asta
tic c
ance
r2.
892.
772.
622.
372.
883.
092.
882.
492.
502.
792.
49
Val
vula
r he
art
dise
ase
6.05
6.85
7.37
7.95
7.06
6.43
6.67
6.80
7.42
6.91
7.11
Oth
er n
euro
logi
c di
sord
ers
6.32
6.32
6.62
7.07
6.54
6.86
7.09
7.37
6.88
6.69
7.12
Alc
ohol
abu
se5.
905.
805.
785.
706.
104.
585.
025.
105.
095.
565.
10
Hyp
othy
roid
ism
5.16
4.99
5.49
5.08
5.15
4.03
3.84
4.36
3.75
4.82
4.06
Dep
ress
ion
4.44
4.72
4.83
5.03
4.64
4.20
4.57
4.41
3.72
4.63
4.06
Live
r di
seas
e3.
252.
583.
072.
953.
323.
684.
003.
823.
963.
263.
89
Coa
gulo
path
y2.
452.
492.
702.
833.
763.
213.
353.
623.
412.
973.
51
Obe
sity
2.83
3.04
2.73
2.70
2.86
2.14
3.46
3.94
4.07
2.82
4.01
Rhe
umat
oic
arth
ritis
or
colla
gen-
vasc
ular
dis
ease
s2.
493.
583.
373.
443.
882.
191.
822.
112.
282.
972.
19
Pul
mon
ary
circ
ulat
ion
diso
rder
s2.
401.
902.
313.
132.
832.
413.
273.
043.
652.
613.
35
Def
icie
ncy
anem
ia2.
232.
943.
313.
332.
863.
352.
412.
041.
902.
921.
97
Par
alys
is1.
311.
531.
651.
831.
641.
952.
031.
952.
171.
712.
06
Psy
chos
es1.
481.
861.
861.
881.
961.
751.
271.
211.
241.
721.
23
Dru
g ab
use
1.44
1.36
1.36
1.61
1.42
1.08
1.27
1.50
1.68
1.36
1.59
Wei
ght
loss
0.88
1.21
1.03
1.07
1.15
1.11
1.06
1.25
1.41
1.07
1.33
Blo
od lo
ss a
nem
ia0.
841.
000.
881.
211.
470.
941.
301.
110.
761.
090.
94
Lym
phom
a0.
880.
850.
930.
900.
971.
081.
061.
281.
190.
951.
23
Pep
tic u
lcer
dis
ease
, no
blee
ding
0.99
0.94
1.04
0.86
0.80
0.76
0.63
0.66
0.56
0.86
0.61
AID
S/H
IV0.
160.
100.
140.
120.
050.
090.
140.
160.
120.
110.
14S
hade
d ro
ws
with
no
sepa
ratin
g lin
e re
pres
ent
mut
ually
exc
lusi
ve p
airs
of
cond
ition
s di
scus
sed
furt
her
with
in t
he t
ext
Sou
rce:
Man
itoba
Cen
tre
for
Hea
lth P
olic
y, 2
012
Tabl
e 4.
40: F
requ
ency
of
Elix
haus
er C
omor
bid
Con
ditio
ns f
or M
anito
bans
at
the
Leve
l of
ICU
Epi
sode
s
Per
cent
of
ICU
epi
sode
s fo
r w
hich
the
pat
ient
s ha
d th
at c
ondi
tion
Com
orbi
d C
ondi
tion
Unw
eigh
ted
Ave
rage
s 19
99/2
000
2000
/01
2001
/02
2002
/03
2003
/04
2004
/05
2005
/06
2006
/07
2007
/08

76 University of Manitoba
Specific Aim 4: Population–Based Description of ICU Use and ICU Patients
Average Charlson comorbidity scores were similar between males and females (Table 4.43). There was a clear gradient in comorbid illness with income quintile such that higher burdens of comorbidities were seen in ICU patients with lower average household incomes (Table 4.44). On average, ICU patients living in urban areas had greater burdens of comorbidities than did those living in rural areas of the province (Table 4.45). Lastly, the burden of comorbidity for ICU episodes that were delivered entirely in rural ICUs was lower than that for episodes that included time in any of the urban ICUs (Table 4.46).
Table 4.42: Average Charlson Comorbidity Index for ICU Episodes for Manitobans by Year and Age Group
Age Group (Years)
1999/2000 2000/01 2001/02 2002/03 2003/04 2004/05 2005/06 2006/07 2007/08 Unweighted Average
17-24 0.64 0.53 0.62 0.64 0.68 0.59 0.68 0.49 0.61 0.61
25-29 0.99 0.80 0.74 0.76 0.95 0.46 0.97 0.85 0.76 0.81
30-34 0.87 0.92 0.68 0.96 1.07 1.18 1.04 0.93 1.30 0.99
35-39 1.22 1.23 1.30 1.12 1.16 1.20 1.13 1.14 0.96 1.16
40-44 1.59 1.37 1.27 1.31 1.16 1.41 1.53 1.66 1.40 1.41
45-49 1.64 1.54 1.85 1.50 1.52 1.53 1.65 1.41 1.54 1.58
50-54 1.70 1.72 1.84 1.76 1.99 1.76 1.88 1.87 1.87 1.82
55-59 1.94 2.04 1.97 2.18 2.11 2.17 2.03 2.07 2.17 2.07
60-64 2.17 2.10 2.33 2.03 2.29 2.07 2.28 2.36 2.29 2.21
65-69 2.21 2.28 2.40 2.44 2.30 2.52 2.17 2.27 2.28 2.32
70-74 2.42 2.27 2.24 2.35 2.36 2.70 2.43 2.52 2.31 2.40
75-79 2.25 2.40 2.34 2.39 2.32 2.50 2.42 2.38 2.36 2.37
80-84 2.24 2.34 2.44 2.29 2.34 2.55 2.44 2.26 2.36 2.36
85-89 2.12 2.23 2.29 2.28 2.05 2.47 2.31 2.29 2.26 2.26
90+ 1.93 2.25 2.13 1.68 2.12 2.47 2.16 1.97 1.99 2.08Source: Manitoba Centre for Health Policy, 2012
Table 4.42: Average Charlson Comorbidity Index for ICU Episodes for Manitobans by Year and Age Group
Table 4.43: Average Charlson Comorbidity Index for ICU Episodes for Manitobans by Year and Sex
Year Males Females Female:Male Ratio p-Value
1999/2000 2.07 1.97 0.95 0.05*2000/01 2.04 2.07 1.01 0.552001/02 2.10 2.12 1.01 0.672002/03 1.98 2.16 1.09 0.0006*2003/04 2.03 2.10 1.03 0.172004/05 2.13 2.21 1.04 0.142005/06 2.06 2.09 1.02 0.502006/07 2.07 2.07 1.00 0.992007/08 2.03 2.10 1.03 0.22
Unweighted average 2.06 2.10 1.02
*p-value < 0.05, by t-test for comparison between Males and Females
Source: Manitoba Centre for Health Policy, 2012
Table 4.43: Average Charlson Comorbidity Index for ICU Episodes for Manitobans by Year and Sex

Manitoba Centre for Health Policy 77
The Epidemiology and Outcomes of Critical Illness in Manitoba
Tabl
e 4.
44:
Ave
rage
Cha
rlso
n Co
mor
bidi
ty In
dex
for I
CU E
piso
des
for M
anit
oban
s by
Yea
r and
Inco
me
Qui
ntile
Inco
me
Qui
ntile
s19
99/2
000
2000
/01
2001
/02
2002
/03
2003
/04
2004
/05
2005
/06
2006
/07
2007
/08
Unw
eigh
ted
Ave
rage
Urb
an 1
st (lo
wes
t)2.
382.
362.
442.
322.
232.
502.
412.
262.
212.
34U
rban
2nd
2.18
2.28
2.30
2.08
2.18
2.33
2.30
2.26
2.14
2.23
Urb
an 3
rd2.
062.
072.
152.
272.
282.
282.
252.
202.
122.
19U
rban
4th
1.98
1.98
2.12
2.14
2.18
2.06
2.16
2.03
2.13
2.09
Urb
an 5
th(h
ighe
st)
1.87
2.02
1.95
2.00
2.00
2.22
1.75
2.05
2.04
1.99
Rur
al 1
st (lo
wes
t)2.
061.
982.
182.
002.
181.
951.
982.
062.
202.
07R
ural
2nd
1.87
1.90
2.01
1.98
1.78
1.97
2.01
1.93
1.90
1.93
Rur
al 3
rd1.
761.
851.
681.
731.
911.
891.
801.
781.
911.
81R
ural
4th
1.85
1.73
1.74
1.78
1.76
1.98
1.79
1.73
1.83
1.80
Rur
al 5
th (h
ighe
st)
1.68
1.83
1.80
1.65
1.53
1.75
1.73
1.88
1.71
1.73
Inco
me
Unk
now
n2.
392.
102.
232.
292.
112.
602.
012.
292.
222.
25S
ourc
e: M
anito
ba C
entr
e fo
r H
ealth
Pol
icy,
201
2
Tabl
e 4.
44: A
vera
ge C
harls
on C
omor
bidi
ty In
dex
for
ICU
Epi
sode
s fo
r M
anito
bans
by
Yea
r an
d In
com
e Q
uint
ile
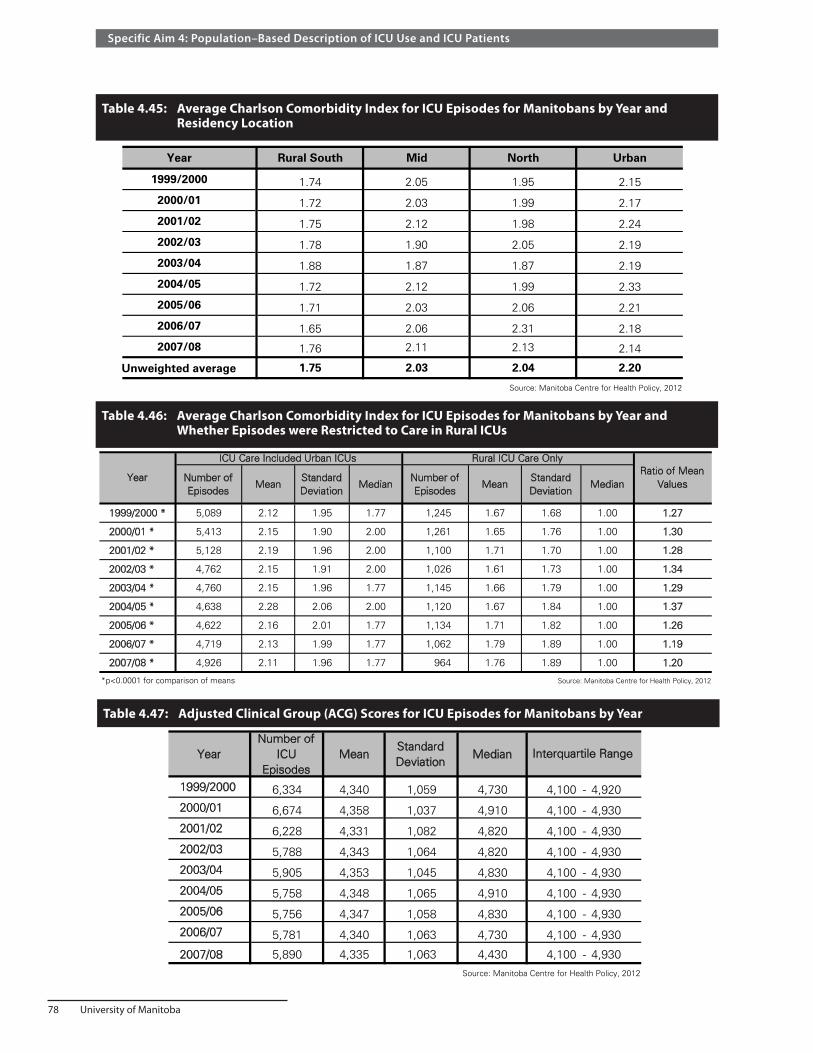
78 University of Manitoba
Specific Aim 4: Population–Based Description of ICU Use and ICU Patients
Table 4.45: Average Charlson Comorbidity Index for ICU Episodes for Manitobans by Year and Residency Location
Year Rural South Mid North Urban
1999/2000 1.74 2.05 1.95 2.15
2000/01 1.72 2.03 1.99 2.17
2001/02 1.75 2.12 1.98 2.24
2002/03 1.78 1.90 2.05 2.19
2003/04 1.88 1.87 1.87 2.19
2004/05 1.72 2.12 1.99 2.33
2005/06 1.71 2.03 2.06 2.21
2006/07 1.65 2.06 2.31 2.18
2007/08 1.76 2.11 2.13 2.14
Unweighted average 1.75 2.03 2.04 2.20
Source: Manitoba Centre for Health Policy, 2012
Table 4.45: Average Charlson Comorbidity Index for ICU Episodes for Manitobans by Year and Residency Location
Table 4.46: Average Charlson Comorbidity Index for ICU Episodes for Manitobans by Year and Whether Episodes were Restricted to Care in Rural ICUs
Number of Episodes
MeanStandard Deviation
MedianNumber of Episodes
MeanStandard Deviation
Median
1999/2000 * 5,089 2.12 1.95 1.77 1,245 1.67 1.68 1.00 1.27
2000/01 * 5,413 2.15 1.90 2.00 1,261 1.65 1.76 1.00 1.30
2001/02 * 5,128 2.19 1.96 2.00 1,100 1.71 1.70 1.00 1.28
2002/03 * 4,762 2.15 1.91 2.00 1,026 1.61 1.73 1.00 1.34
2003/04 * 4,760 2.15 1.96 1.77 1,145 1.66 1.79 1.00 1.29
2004/05 * 4,638 2.28 2.06 2.00 1,120 1.67 1.84 1.00 1.37
2005/06 * 4,622 2.16 2.01 1.77 1,134 1.71 1.82 1.00 1.26
2006/07 * 4,719 2.13 1.99 1.77 1,062 1.79 1.89 1.00 1.19
2007/08 * 4,926 2.11 1.96 1.77 964 1.76 1.89 1.00 1.20
*p<0.0001 for comparison of means Source: Manitoba Centre for Health Policy, 2012
Year
ICU Care Included Urban ICUs Rural ICU Care OnlyRatio of Mean
Values
Table 4.46: Average Charlson Comorbidity Index for ICU Episodes for Manitobans by Year and Whether Episodes were Restricted to Care in Rural ICUs
Table 4.47: Adjusted Clinical Group (ACG) Scores for ICU Episodes for Manitobans by Year
YearNumber of
ICU Episodes
MeanStandard Deviation
Median
1999/2000 6,334 4,340 1,059 4,730 4,100 - 4,9202000/01 6,674 4,358 1,037 4,910 4,100 - 4,9302001/02 6,228 4,331 1,082 4,820 4,100 - 4,9302002/03 5,788 4,343 1,064 4,820 4,100 - 4,9302003/04 5,905 4,353 1,045 4,830 4,100 - 4,9302004/05 5,758 4,348 1,065 4,910 4,100 - 4,9302005/06 5,756 4,347 1,058 4,830 4,100 - 4,9302006/07 5,781 4,340 1,063 4,730 4,100 - 4,930
2007/08 5,890 4,335 1,063 4,430 4,100 - 4,930Source: Manitoba Centre for Health Policy, 2012
Table 4.47: Adjusted Clinical Group (ACG) Scores for ICU Episodes for Manitobans by Year
Interquartile Range

Manitoba Centre for Health Policy 79
The Epidemiology and Outcomes of Critical Illness in Manitoba
ACG scores are shown in Table 4.47. ACG scores increased with increasing age and then plateaued (Table 4.48). Unlike Charlson scores, women’s ACG were consistently and significantly higher, though only slightly, than for men (Table 4.49). Like Charlson scores, ACG scores were slightly lower for those in the highest income quintiles (Table 4.50). However, the geographic gradient present in Charlson data was not evident in the ACG scores (Table 4.51).
Tabl
e 4.
48:
Ave
rage
Adj
uste
d Cl
inic
al G
roup
(ACG
) Sco
res
for I
CU E
piso
des
for M
anit
oban
s by
Yea
r and
Age
Gro
up
Ag
e G
rou
p
(Yea
rs)
1999
/200
020
00/0
120
01/0
220
02/0
320
03/0
420
04/0
520
05/0
620
06/0
720
07/0
8U
nw
eig
hte
d
Ave
rag
e
17-2
43,
637
3,33
23,
551
3,44
13,
585
3,52
23,
426
3,48
73,
562
3,50
5
25-2
93,
959
4,05
73,
708
3,81
23,
885
3,60
03,
720
3,81
73,
819
3,82
0
30-3
43,
721
3,49
53,
553
3,87
43,
958
3,67
93,
874
3,97
43,
878
3,77
8
35-3
93,
888
4,17
33,
939
4,00
73,
807
3,99
13,
955
3,80
63,
913
3,94
2
40-4
43,
966
3,93
63,
773
3,89
94,
007
3,95
23,
983
3,99
83,
976
3,94
3
45-4
93,
922
4,04
94,
136
4,01
53,
993
3,99
04,
235
4,12
43,
894
4,04
0
50-5
44,
128
4,07
24,
228
4,19
74,
279
4,09
44,
161
4,22
64,
136
4,16
9
55-5
94,
178
4,28
94,
202
4,22
04,
293
4,25
64,
253
4,22
34,
270
4,24
3
60-6
44,
270
4,30
54,
322
4,28
64,
311
4,34
24,
366
4,40
54,
428
4,33
7
65-6
94,
482
4,48
64,
389
4,44
44,
460
4,51
24,
473
4,40
44,
473
4,45
8
70-7
44,
501
4,56
14,
449
4,47
64,
532
4,55
54,
496
4,52
74,
497
4,51
0
75-7
94,
555
4,53
84,
585
4,56
24,
537
4,56
74,
566
4,51
94,
568
4,55
5
80-8
44,
578
4,54
04,
497
4,59
14,
557
4,61
04,
584
4,57
74,
583
4,56
8
85-8
94,
545
4,51
94,
531
4,60
24,
557
4,60
24,
573
4,57
84,
498
4,55
6
90+
4,49
24,
553
4,41
94,
521
4,53
14,
486
4,51
84,
470
4,44
84,
493
Sou
rce:
Man
itoba
Cen
tre
for
Hea
lth P
olic
y, 2
012
Tab
le 4
.48:
Ave
rag
e A
dju
sted
Clin
ical
Gro
up
(A
CG
) S
core
s fo
r IC
U E
pis
od
es f
or
Man
ito
ban
s b
y Y
ear
and
Ag
e G
rou
p

80 University of Manitoba
Specific Aim 4: Population–Based Description of ICU Use and ICU Patients
Table 4.49: Average Adjusted Clinical Group (ACG) Score for ICU Episodes for Manitobans by Year and Sex
Year Males Females Female:Male ratio1999/2000 * 4,256 4,468 1.052000/01 * 4,269 4,488 1.052001/02 * 4,256 4,436 1.042002/03 * 4,246 4,484 1.062003/04 * 4,265 4,485 1.052004/05 * 4,254 4,488 1.062005/06 * 4,244 4,498 1.062006/07 * 4,234 4,499 1.062007/08 * 4,245 4,475 1.05
Unweighted average 4,252 4,480 1.05* p-value < 0.0001 for comparison between sexes, by t-test
Source: Manitoba Centre for Health Policy, 2012
Table 4.49: Average Adjusted Clinical Group (ACG) Score Index for ICU Episodes for Manitobans by Year and Sex
Table 4.51: Average Adjusted Clinical Group (ACG) Score for ICU Episodes for Manitobans by Year and Residency Location
Year Rural South Mid North Urban1999/2000 4,349 4,340 4,122 4,3662000/01 4,367 4,327 4,287 4,3722001/02 4,317 4,343 4,279 4,3382002/03 4,407 4,224 4,213 4,3582003/04 4,312 4,381 4,315 4,3652004/05 4,309 4,375 4,233 4,3672005/06 4,297 4,403 4,267 4,3612006/07 4,305 4,454 4,211 4,3382007/08 4,291 4,384 4,213 4,347
Unweighted average 4,328 4,359 4,238 4,357Source: Manitoba Centre for Health Policy, 2012
Table 4.51: Average Adjusted Clinical Group (ACG) Score for ICU Episodes for Manitobans by Year and Residency Location

Manitoba Centre for Health Policy 81
The Epidemiology and Outcomes of Critical Illness in Manitoba
Tabl
e 4.
50:
Ave
rage
Adj
uste
d Cl
inic
al G
roup
(ACG
) Sco
re fo
r ICU
Epi
sode
s fo
r Man
itob
ans
by Y
ear a
nd In
com
e Q
uint
ile
Inco
me
Qui
ntile
s 19
99/2
000
2000
/01
2001
/02
2002
/03
2003
/04
2004
/05
2005
/06
2006
/07
2007
/08
Unw
eigh
ted
Ave
rage
Urb
an 1
st (lo
wes
t)4,
451
4,37
94,
429
4,36
94,
402
4,43
74,
490
4,36
64,
394
4,41
3U
rban
2nd
4,35
84,
368
4,36
14,
362
4,29
04,
332
4,31
24,
309
4,26
54,
329
Urb
an 3
rd4,
345
4,36
94,
287
4,40
44,
354
4,37
14,
331
4,35
34,
303
4,34
6U
rban
4th
4,29
94,
336
4,22
84,
219
4,42
34,
315
4,28
54,
284
4,38
94,
309
Urb
an 5
th (h
ighe
st)
4,33
84,
362
4,27
54,
362
4,32
84,
275
4,29
84,
329
4,31
24,
320
Rur
al 1
st (lo
wes
t)4,
309
4,31
54,
335
4,31
44,
451
4,37
54,
313
4,39
54,
373
4,35
3R
ural
2nd
4,32
34,
399
4,41
74,
358
4,28
14,
289
4,40
04,
322
4,30
94,
344
Rur
al 3
rd4,
261
4,35
44,
254
4,26
94,
413
4,36
34,
377
4,42
04,
368
4,34
2R
ural
4th
4,39
54,
447
4,22
44,
375
4,31
84,
358
4,24
14,
296
4,30
54,
329
Rur
al 5
th (h
ighe
st)
4,23
64,
133
4,33
84,
258
4,12
94,
193
4,28
34,
236
4,15
44,
218
Inco
me
Unk
now
n4,
207
4,54
24,
453
4,52
04,
392
4,45
84,
412
4,45
04,
570
4,44
5S
ourc
e: M
anito
ba C
entr
e fo
r H
ealth
Pol
icy,
201
2
Tabl
e 4.
50: A
vera
ge A
djus
ted
Clin
ical
Gro
up (A
CG
) Sco
re f
or IC
U E
piso
des
for
Man
itoba
ns b
y Y
ear
and
Inco
me
Qui
ntile

82 University of Manitoba
Specific Aim 4: Population–Based Description of ICU Use and ICU Patients
Summary and discussion of Results Parts 6Manitobans admitted to ICUs showed substantial burdens of comorbidity; their average Charlson comorbidity index score of 2.1 was substantially higher than the mean values of 1.0–1.5 reported from British Columbia and Ontario (Dodek et al., 2009; Fowler et al., 2007). This index quadrupled from the youngest to ages 70–74, after which it declined. This late decline in Charlson scores among those admitted to ICUs likely reflects selective decisions to forego ICU care among the most elderly patients with greater burdens of comorbidities. There were differences in the burden of comorbidities according to income quintile and residency location, but not sex.
Results Part 7 – Type and Severity of Acute Illness
For these analyses, ICU episodes were the unit of measure. We first evaluated the types of illness for all patients in all provincial ICUs, using information from hospital abstracts. Table 4.52 shows the Most Responsible Hospital Diagnosis recorded in the hospital abstract that contained the onset of each ICU episode. Only four diagnostic categories individually accounted for greater than 5% of ICU episodes: circulatory (55%), respiratory (9%), injury or trauma or poisonings (9%), and digestive disorders (7%). Using the change in yearly number of cases from 1999/2000–2001/02 to 2005/06–2007/08 to evaluate trends over the nine–year period, we see that there were substantial changes over time (Table 4.52, final column). Notable among these trends was a large decline in ICU admissions related to cardiovascular conditions and a tripling in the relative contribution of infectious disorders.

Manitoba Centre for Health Policy 83
The Epidemiology and Outcomes of Critical Illness in Manitoba
Tabl
e 4.
52:
Mos
t Res
pons
ible
Hos
pita
l Dia
gnos
is fo
r ICU
Epi
sode
s by
Yea
r
Unw
eigh
ted
Ave
rage
Circ
ulat
ory
syst
em58
.91
58.7
057
.22
56.6
354
.86
53.1
051
.05
50.5
150
.76
54.6
4-1
2.9
Res
pira
tory
sys
tem
7.83
7.47
8.48
9.48
9.48
9.22
9.21
8.82
9.46
8.83
15.6
Inju
ry a
nd p
oiso
ning
8.41
8.27
7.53
7.45
8.36
8.76
8.55
11.0
89.
738.
6821
.3
Dig
estiv
e sy
stem
6.49
6.06
6.44
6.35
6.37
6.48
7.27
6.90
6.78
6.57
10.3
Neo
plas
ms
5.15
4.76
4.35
4.16
4.28
5.14
4.56
4.39
4.18
4.55
-7.9
Sym
ptom
s, s
igns
, oth
er c
ondi
tions
4.37
4.21
4.25
3.60
4.39
3.13
2.92
2.57
2.43
3.54
-38.
3
End
o, n
utrit
iona
l, m
etab
, im
mun
ity1.
651.
761.
962.
112.
352.
943.
253.
042.
672.
4166
.9
Infe
ctio
us a
nd p
aras
itic
0.98
1.01
1.56
1.53
1.43
2.64
3.51
3.79
4.35
2.31
228.
2
Fact
ors
influ
enci
ng h
ealth
sta
tus
0.84
2.28
2.85
2.96
2.67
2.67
2.97
1.58
1.78
2.29
6.0
Gen
itour
inar
y sy
stem
1.56
1.49
1.38
1.48
1.46
1.31
1.52
1.86
1.86
1.55
18.3
Ner
vous
sys
tem
and
sen
se o
rgan
s1.
201.
361.
271.
561.
351.
641.
961.
511.
731.
5135
.8
Mus
culo
skel
. and
con
nect
ive
tissu
e0.
780.
750.
840.
870.
950.
951.
041.
701.
961.
0998
.3
Men
tal D
isor
ders
0.93
0.82
0.93
0.89
1.13
1.09
1.27
1.30
1.06
1.05
35.4
Pre
gnan
cy a
nd c
hild
birt
h0.
260.
280.
200.
250.
290.
380.
380.
300.
470.
3155
.4
Ski
n an
d su
bcut
aneo
us t
issu
e0.
140.
350.
240.
260.
260.
280.
210.
280.
160.
24-1
1.0
Blo
od a
nd b
lood
-for
min
g or
gans
0.35
0.24
0.37
0.21
0.14
0.18
0.13
0.13
0.22
0.22
-50.
0
Con
geni
tal a
nom
alie
s0.
170.
180.
140.
200.
240.
080.
210.
250.
390.
2173
.5V
alue
s ar
e co
lum
n pe
rcen
tage
s, e
xcep
t fo
r fin
al c
olum
nS
ourc
e: M
anito
ba C
entr
e fo
r H
ealth
Pol
icy,
201
2
Fina
l col
umn
is t
he f
ract
iona
l cha
nge
betw
een
the
unw
eigh
ted
mea
ns o
f th
e fin
al t
hree
yea
rs a
nd t
he in
itial
thr
ee y
ears
of
data
; e.g
. a v
alue
of
+10
0% in
dica
tes
a do
ublin
g of
the
rel
ativ
e co
ntrib
utio
n of
a d
iagn
ostic
ca
tego
ry o
ver
that
tim
e
Tabl
e 4.
52: M
ost
Res
pons
ible
Hos
pita
l Dia
gnos
is f
or IC
U E
piso
des
by Y
ear
ICD
-9-C
M D
iagn
ostic
Cat
egor
yP
erce
nt o
f C
hang
e19
99/2
000
2000
/01
2001
/02
2002
/03
2003
/04
2004
/05
2005
/06
2006
/07
2007
/08

84 University of Manitoba
Specific Aim 4: Population–Based Description of ICU Use and ICU Patients
Manitobans and non–Manitobans in provincial ICUs had a similar distribution of hospital diagnostic categories (Table 4.53); the most notable differences were that non–Manitobans more commonly had a Most Responsible Hospital Diagnosis related to the cardiovascular system and to injury, trauma, or poisoning. The Most Responsible Diagnoses for ICU care delivered entirely in rural ICUs was surprisingly similar to those for urban ICU care; rural ICU diagnoses were less likely to be related to neoplasms and respiratory problems and more likely to be related to symptoms, signs, and ill–defined conditions (Table 4.53).
Tabl
e 4.
53:
Subg
roup
Com
pari
sons
of M
ost R
espo
nsib
le H
ospi
tal D
iagn
osis
for I
CU E
piso
des
H
ospi
tal d
isch
arge
on
or a
fter
Apr
il 1,
199
9 an
d on
or b
efor
e M
arch
31,
200
8
ICD
-9-C
M D
iagn
ostic
Cat
egor
yM
anito
bans
Non
-Man
itoba
nsD
iffer
ence
(Man
itoba
ns -
Non
-Man
itoba
ns)
Any
Urb
an IC
UR
ural
ICU
s O
nly
Diff
eren
ce (A
ny U
rban
ICU
- R
ural
ICU
onl
y)
Infe
ctio
us a
nd p
aras
itic
2.31
2.29
0.02
2.63
0.86
1.77
N
eopl
asm
s4.
584.
020.
565.
002.
582.
41*
End
ocrin
e, n
utrit
iona
l, m
etab
olic
, im
mun
ity2.
432.
090.
352.
093.
87-1
.78
Blo
od a
nd b
lood
-for
min
g or
gans
0.23
0.10
0.12
0.19
0.35
-0.1
6M
enta
l Dis
orde
rs1.
060.
710.
350.
921.
62-0
.70
Ner
vous
sys
tem
and
sen
se o
rgan
s1.
531.
170.
361.
630.
990.
64C
ircul
ator
y sy
stem
54.5
656
.15
-1.6
054
.64
54.6
8-0
.04
Res
pira
tory
sys
tem
8.85
8.45
0.40
9.33
6.50
2.83
*D
iges
tive
syst
em6.
645.
381.
266.
417.
30-0
.89
Gen
itour
inar
y sy
stem
1.57
1.10
0.47
1.59
1.36
0.22
Pre
gnan
cy a
nd c
hild
birt
h0.
310.
36-0
.05
0.26
0.55
-0.2
9S
kin
and
subc
utan
eous
tis
sue
0.24
0.35
-0.1
10.
240.
25-0
.01
Mus
culo
skel
etal
& c
onne
ctiv
e tis
sue
1.10
0.82
0.28
1.19
0.62
0.57
Con
geni
tal a
nom
alie
s0.
210.
25-0
.04
0.25
0.02
0.23
Sym
ptom
s, s
igns
, ill-
defin
ed c
ondi
tions
3.51
4.10
-0.5
92.
488.
32-5
.85*
I nju
ry, t
raum
a an
d po
ison
ing
8.56
11.1
2-2
.56*
8.83
8.05
0.77
F act
ors
influ
enci
ng h
ealth
sta
tus
2.33
1.55
0.78
2.34
2.07
0.26
*Abs
olut
e va
lue
of d
iffer
ence
bet
wee
n su
bgro
ups
exce
eded
2%
Sou
rce:
Man
itoba
Cen
tre
for
Hea
lth P
olic
y, 2
012
Tabl
e 4.
53: S
ubgr
oup
Com
paris
ons
of M
ost
Res
pons
ible
Hos
pita
l Dia
gnos
is f
or IC
U E
piso
des
Hos
pita
l dis
char
ge o
n or
aft
er A
pril
1, 1
999
and
on o
r be
fore
Mar
ch 3
1, 2
008
Val
ues
repr
esen
ts t
he a
vera
ge, o
ver
all 9
fis
cal y
ears
, of
the
perc
enta
ge f
or t
hat
diag
nost
ic c
ateg
ory
for
the
subg
roup
indi
cate
d

Manitoba Centre for Health Policy 85
The Epidemiology and Outcomes of Critical Illness in Manitoba
Since the CIHI Complexity Levels have the limitations discussed previously, we only present them for 1999/2000–2006/07 (Table 4.5) and limit interpretation to comparisons within individual years. Non–Manitobans were not consistently different than Manitobans with respect to this measure of severity (Table 4.54). However, Complexity Scores were much lower for those whose ICU care was delivered in rural ICUs (Table 4.55); the highest level of complexity was more than seven–fold less common in rural ICUs. Complexity scores presented by patient demographic characteristics showed:
• Women’s scores were generally slightly higher than men’s (Table 4.56) • Scores varied by age —lower for those aged 45–54 than for the younger and older age groups
(Table 4.57) • Urban residents had higher scores than rural residents (Table 4.58) • Scores were higher for patients in lower income quintiles and those for whom income was unknown
(Table 4.59)
Tabl
e 4.
54:
Com
pari
son
of H
ospi
tal P
lx TM
Com
plex
ity
Leve
ls o
f ICU
Epi
sode
s B
etw
een
Man
itob
ans
an
d N
on–M
anit
oban
s by
Yea
r
Aver
age
valu
es s
how
n
Tabl
e 4.
55:
Com
pari
son
of H
ospi
tal P
lxTM
Com
plex
ity
Leve
ls o
f ICU
Epi
sode
s B
etw
een
ICU
Typ
e†
by Y
ear
Av
erag
e va
lues
sho
wn
Yea
rM
anito
bans
Non
-Man
itoba
nsM
anito
ban:
Non
-M
anito
ban
Rat
ioM
anito
bans
Non
-Man
itoba
nsM
anito
ban:
Non
-M
anito
ban
Rat
io19
99/2
000
1.76
1.75
1.00
12.9
015
.74
0.82
2000
/01
1.76
1.81
0.98
13.7
116
.67
0.82
2001
/02
1.85
1.79
1.03
15.2
215
.58
0.98
2002
/03
1.86
1.85
1.00
15.9
314
.48
1.10
2 003
/04
1.89
1.85
1.02
16.8
817
.09
0.99
2004
/05
2.23
2.22
1.00
26.2
925
.74
1.02
2005
/06
† 2.
222.
340.
9525
.31
27.1
60.
93
2006
/07
2.27
2.19
1.04
26.5
723
.73
1.12
Unw
eigh
ted
Ave
rage
1.00
0.97
† p=
0.00
5 by
χ2 t
est
on c
ateg
oriz
ed n
on-m
issi
ng v
alue
s; a
ll ot
her
pairw
ise
p-va
lues
>0.
05S
ourc
e: M
anito
ba C
entr
e fo
r H
ealth
Pol
icy,
201
2
Mea
n V
alue
Per
cent
with
a V
alue
of
4 (M
ost
Sev
ere
Cat
egor
y)
Tabl
e 4.
54: C
ompa
rison
of
Hos
pita
l P
lxTM
Com
plex
ity L
evel
s of
ICU
Epi
sode
s B
etw
een
Man
itoba
ns a
nd N
on-M
anito
bans
by
Yea
rA
vera
ge v
alue
s sh
own
Yea
rA
ny U
rban
ICU
Rur
al IC
U O
nly
Man
itoba
n:N
on-
Man
itoba
n R
atio
Any
Urb
an IC
UR
ural
ICU
Onl
yM
anito
ban:
Non
-M
anito
ban
Rat
io19
99/2
000
*1.
871.
281.
4615
.80
1.55
10.2
1
2000
/01
*1.
881.
271.
4816
.56
2.06
8.02
2001
/02
*1.
961.
321.
4817
.99
2.12
8.50
2002
/03
*1.
971.
331.
4918
.71
2.36
7.93
2003
/04
*2.
021.
321.
5320
.34
2.20
9.24
2004
/05
*2.
411.
421.
7031
.18
5.18
6.02
2005
/06
*2.
411.
421.
7030
.30
4.29
7.05
2006
/07
*2.
431.
491.
6330
.80
6.21
4.96
Unw
eigh
ted
Ave
rage
1.56
7.74
* p<
.000
1 by
χ2 t
est
for
com
paris
on o
f ca
tego
rized
non
-mis
sing
val
ues
† R
ural
ICU
onl
y re
fers
to
ICU
epi
sode
s en
tirel
y sp
ent
in R
ural
ICU
s; a
ny U
rban
ICU
ref
ers
to e
piso
des
that
incl
uded
any
tim
e in
urb
an IC
U(s
)S
ourc
e: M
anito
ba C
entr
e fo
r H
ealth
Pol
icy,
201
2
Mea
n V
alue
Per
cent
with
a V
alue
of
4 (M
ost
Sev
ere
Cat
egor
y)
Tabl
e 4.
55: C
ompa
rison
of
Hos
pita
l Plx
TM C
ompl
exity
Lev
els
of IC
U E
piso
des
Bet
wee
n IC
U T
ype
† by
Yea
rav
erag
e va
lues
sho
wn

86 University of Manitoba
Specific Aim 4: Population–Based Description of ICU Use and ICU Patients
Table 4.56: Comparison of Hospital Plx TM Complexity Levels of ICU Episodes Between Sexes by Year Average values shown
Table 4.57: Comparison of Hospital Plx TM Complexity Levels of ICU Episodes Between Age Groups by Year Average values shown
Confidential
Year Males Females Female:Male Ratio
1999/2000 1.76 1.75 0.99
2000/01 † 1.75 1.78 1.02
2001/02 * 1.80 1.92 1.07
2002/03 † 1.83 1.90 1.04
2003/04 † 1.86 1.94 1.04
2004/05 * 2.17 2.32 1.07
2005/06 * 2.18 2.30 1.06
2006/07 † 2.22 2.34 1.05Unweighted average 1.94 2.03 1.04
* p<.001; † p=0.05 by χ2 test for comparison of categorized non-missing values All other p-values > 0.05 Source: Manitoba Centre for Health Policy, 2012
Table 4.56: Comparison of Hospital PlxTM Complexity Levels of ICU Episodes Between Sexes by Year
average values shown
P:\Deliverables‐Ongoing\ICU\Book\Tables and Graphs\SA4\SA4_Tables_Figures_Set_2_Excel_jjSA4_Tables_Figures_Set_2_Excel_jjTable 4.56
Age Group (Years)
1999/2000* 2000/01* 2001/02* 2002/03* 2003/04* 2004/05* 2005/06* 2006/07*Unweighted
Average17-24 1.79 1.97 1.92 1.78 2.04 2.04 1.94 2.04 1.94
25-29 1.97 2.10 1.93 1.89 1.92 1.99 2.02 1.96 1.97
30-34 1.87 1.89 1.95 1.70 1.87 2.14 2.17 2.15 1.97
35-39 1.78 1.78 2.02 1.94 1.82 1.94 1.99 1.96 1.90
40-44 1.70 1.67 1.72 1.77 1.80 2.06 2.09 2.24 1.88
45-49 1.68 1.67 1.72 1.65 1.67 2.10 2.00 2.01 1.81
50-54 1.66 1.52 1.68 1.74 1.74 1.99 2.06 2.11 1.81
55-59 1.65 1.77 1.83 1.82 1.77 2.07 2.10 2.13 1.89
60-64 1.72 1.73 1.77 1.76 1.79 2.13 2.22 2.28 1.92
65-69 1.73 1.71 1.85 1.81 1.89 2.28 2.19 2.30 1.97
70-74 1.76 1.73 1.90 1.89 1.93 2.37 2.31 2.32 2.03
75-79 1.78 1.76 1.88 2.01 1.97 2.40 2.39 2.34 2.07
80-84 1.85 1.93 1.90 2.02 2.08 2.41 2.38 2.49 2.13
85-89 1.82 1.90 1.99 1.90 2.03 2.44 2.49 2.47 2.13
90+ 1.88 1.98 1.79 1.81 2.06 2.17 2.58 2.40 2.08
*" indicates p-value < 0.0001 across age groups for each fiscal year (χ2 test) Source: Manitoba Centre for Health Policy, 2012
Table 4.57: Comparison of Hospital Plx TM Complexity Levels of ICU Episodes Between Age Groups by YearAverage values shown
Table 4.58: Comparison of Hospital Plx TM Complexity Levels of ICU Episodes Between Residency Locations by Year Average values shown
Year Rural South Mid North Urban Non-Manitobans
1999/2000* 1.62 1.79 1.54 1.82 1.75
2000/01* 1.56 1.72 1.52 1.87 1.81
2001/02* 1.67 1.77 1.65 1.95 1.79
2002/03* 1.66 1.77 1.75 1.96 1.85
2003/04* 1.71 1.76 1.55 2.03 1.85
2004/05* 1.85 2.04 1.93 2.44 2.22
2005/06* 1.87 2.13 1.85 2.42 2.34
2006/07* 1.89 2.12 2.16 2.45 2.19
Unweighted Average 1.73 1.89 1.74 2.12 1.94
"*" indicates p-value < 0.0001 across locations groups (χ2 test) Source: Manitoba Centre for Health Policy, 2012
Table 4.58: Comparison of Hospital Plx TM Complexity Levels of ICU Episodes Between Residency Locations by YearAverage values shown

Manitoba Centre for Health Policy 87
The Epidemiology and Outcomes of Critical Illness in Manitoba
Tabl
e 4.
59:
Com
pari
son
of H
ospi
tal P
lx TM
Com
plex
ity
Leve
ls o
f ICU
Epi
sode
s B
etw
een
Inco
me
Qui
ntile
s by
Yea
r
Aver
age
valu
es s
how
n
Inco
me
Qui
ntile
s 19
99/2
000*
2000
/01*
2001
/02*
2002
/03*
2003
/04*
2004
/05*
2005
/06*
2006
/07*
Unw
eigh
ted
Ave
rage
Urb
an 1
st (lo
wes
t)1.
971.
972.
032.
022.
082.
592.
532.
472.
21
Urb
an 2
nd1.
731.
841.
981.
932.
022.
432.
402.
482.
10
Urb
an 3
rd1.
771.
821.
941.
961.
972.
372.
432.
502.
10
Urb
an 4
th1.
691.
801.
831.
822.
072.
222.
332.
332.
01
Urb
an 5
th (h
ighe
st)
1.76
1.71
1.73
1.88
1.91
2.29
2.21
2.34
1.98
Rur
al 1
st (lo
wes
t)1.
631.
631.
771.
711.
691.
971.
942.
031.
80
Rur
al 2
nd1.
601.
621.
771.
671.
681.
941.
932.
101.
79
Rur
al 3
rd1.
721.
651.
751.
921.
731.
941.
991.
911.
83
Rur
al 4
th1.
691.
521.
591.
601.
711.
981.
922.
041.
76
Rur
al 5
th (h
ighe
st)
1.70
1.63
1.59
1.67
1.66
1.82
2.02
1.95
1.75
Inco
me
Unk
now
n2.
102.
302.
342.
362.
222.
732.
582.
692.
42
Non
-Man
itoba
ns1.
751.
811.
791.
851.
852.
222.
342.
191.
97"*
" ind
icat
es p
-val
ue <
0.0
001
acro
ss q
uint
iles
(χ2
test
)S
ourc
e: M
anito
ba C
entr
e fo
r H
ealth
Pol
icy,
201
2
Tabl
e 4.
59: C
ompa
rison
of
Hos
pita
l Plx
TM C
ompl
exity
Lev
els
of IC
U E
piso
des
Bet
wee
n In
com
e Q
uint
iles
by Y
ear
Ave
rage
val
ues
show
n
Man
ito
ban
sN
on
-M
anit
ob
ans
Man
ito
ban
:No
n-
Man
ito
ban
Rat
ioA
ny
Urb
an IC
UR
ura
l IC
U O
nly
An
y U
rban
ICU
:Ru
ral
ICU
On
ly R
atio
1999
/200
07.
487.
3410
.19
0.72
9.19
0.39
*24
2000
/01
7.44
7.37
8.59
0.86
9.11
0.08
*11
4
2001
/02
8.45
8.46
8.12
1.04
10.1
80.
18 *
57
2002
/03
8.52
8.55
7.93
1.08
10.3
00.
09 *
114
2003
/04
9.24
9.14
11.0
80.
8211
.41
0.00
*∞
2004
/05
9.75
9.67
11.4
00.
8511
.94
0.35
*34
2005
/06
10.3
610
.02
16.6
1 †
0.60
12.7
00.
26 *
49
2006
/07
11.1
311
.04
12.8
80.
8613
.51
0.09
*15
0
2007
/08
11.6
511
.53
13.7
30.
8413
.79
0.3
*46
Un
wei
gh
ted
ave
rag
e0.
8573
* p<
.000
1S
ourc
e: M
anito
ba C
entr
e fo
r H
ealth
Pol
icy,
201
2
† p=
.001
(Fis
her’
s ex
act
test
)al
l oth
er p
air
wis
e p-
valu
es>
0.05
¥ R
ural
ICU
onl
y re
fers
to
ICU
epi
sode
s en
tirel
y sp
ent
in r
ural
ICU
s; A
ny U
rban
ICU
ref
ers
to e
piso
des
that
incl
uded
tim
e in
urb
an IC
U(s
)
Yea
rA
llC
om
par
ing
Man
ito
ban
s an
d N
on
-Man
ito
ban
s (P
erce
nt)
Co
mp
arin
g L
oca
tio
n o
f IC
U C
are
(Per
cen
t)
Tab
le 4
.60:
Per
cen
tag
e o
f IC
U E
pis
od
es w
ith
Gre
ater
th
en 9
6 h
ou
rs o
f M
ech
anic
al V
enti
lati
on
by
Pro
vin
cial
Res
iden
cy S
tatu
s, T
ype
of
ICU
¥ , an
d Y
ear
Tabl
e 4.
60:
Perc
enta
ge o
f ICU
Epi
sode
s w
ith
Gre
ater
than
96
hour
s of
Mec
hani
cal V
enti
lati
on b
y Pr
ovin
cial
Res
iden
cy S
tatu
s, T
ype
of IC
U ¥
, an
d Ye
ar

88 University of Manitoba
Specific Aim 4: Population–Based Description of ICU Use and ICU Patients
Mechanical ventilation exceeding 96 hours (Table 4.60) and RIW (Table 4.61) also indicated lower severity of acute illness for those whose ICU care was entirely provided in rural hospitals. For example, the proportion of ICU patients who received at least 96 hours of mechanical ventilation was more than 70–fold higher in urban ICUs than rural ICUs. There was also a substantial increase over the study period in patients undergoing prolonged mechanical ventilation (Table 4.60).
Tabl
e 4.
61:
Reso
urce
Inte
nsit
y W
eigh
ts (R
IW TM
) of I
CU E
piso
des
by P
rovi
ncia
l Res
iden
cy S
tatu
s, T
ype
of
ICU
¥, a
nd Y
ear
Man
ito
ban
sN
on
-Man
ito
ban
sM
anit
ob
an:N
on
-M
anit
ob
an R
atio
An
y U
rban
ICU
Ru
ral I
CU
On
lyA
ny
Urb
an IC
U:R
ura
l IC
U O
nly
Rat
io
1999
/200
03.
503.
523.
00 †
1.18
4.00
1.42
*2.
82
2000
/01
4.38
4.38
4.38
1.00
5.03
1.51
*3.
32
2001
/02
4.50
4.55
3.64
†1.
255.
131.
52 *
3.37
2002
/03
4.17
4.19
3.78
1.11
4.74
1.46
*3.
24
2003
/04
3.90
3.91
3.74
1.04
4.50
1.33
*3.
37
2004
/05
4.61
4.65
3.87
†1.
205.
321.
56 *
3.41
2005
/06
4.67
4.59
6.10
‡0.
755.
361.
66 *
3.24
2006
/07
4.80
4.82
4.44
1.09
5.49
1.61
*3.
40
2007
/08
5.65
5.70
4.84
‡1.
186.
411.
63 *
3.94
Un
wei
gh
ted
ave
rag
e1.
093.
35*
p<.0
001
Sou
rce:
Man
itoba
Cen
tre
for
Hea
lth P
olic
y, 2
012
† p<
.01
‡ p<
.05
(t-t
est)
all o
ther
pai
r w
ise
p-va
lues
>0.
05¥
Rur
al IC
U o
nly
refe
rs t
o IC
U e
piso
des
entir
ely
spen
t in
rur
al IC
Us;
Any
Urb
an IC
U r
efer
s to
epi
sode
s th
at in
clud
ed t
ime
in u
rban
ICU
(s)
Yea
rA
ll
Co
mp
arin
g M
anit
ob
ans
and
No
n-M
anit
ob
ans
Co
mp
arin
g L
oca
tio
n o
f IC
U C
are
Tab
le 4
.61:
Res
ou
rce
Inte
nsi
ty W
eig
hts
(R
IWT
M)
of
ICU
Ep
iso
des
by
Pro
vin
cial
Res
iden
cy S
tatu
s, T
ype
of
ICU
¥ , an
d Y
ear
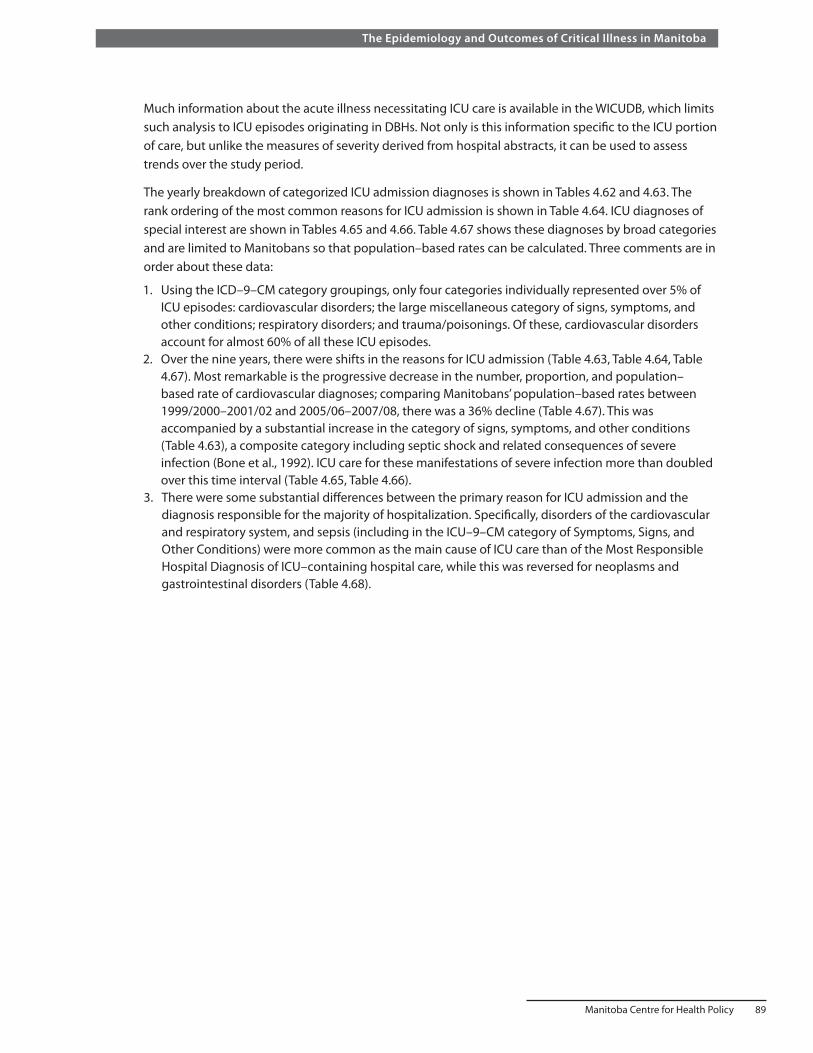
Manitoba Centre for Health Policy 89
The Epidemiology and Outcomes of Critical Illness in Manitoba
Much information about the acute illness necessitating ICU care is available in the WICUDB, which limits such analysis to ICU episodes originating in DBHs. Not only is this information specific to the ICU portion of care, but unlike the measures of severity derived from hospital abstracts, it can be used to assess trends over the study period.
The yearly breakdown of categorized ICU admission diagnoses is shown in Tables 4.62 and 4.63. The rank ordering of the most common reasons for ICU admission is shown in Table 4.64. ICU diagnoses of special interest are shown in Tables 4.65 and 4.66. Table 4.67 shows these diagnoses by broad categories and are limited to Manitobans so that population–based rates can be calculated. Three comments are in order about these data:
1. Using the ICD–9–CM category groupings, only four categories individually represented over 5% of ICU episodes: cardiovascular disorders; the large miscellaneous category of signs, symptoms, and other conditions; respiratory disorders; and trauma/poisonings. Of these, cardiovascular disorders account for almost 60% of all these ICU episodes.
2. Over the nine years, there were shifts in the reasons for ICU admission (Table 4.63, Table 4.64, Table 4.67). Most remarkable is the progressive decrease in the number, proportion, and population–based rate of cardiovascular diagnoses; comparing Manitobans’ population–based rates between 1999/2000–2001/02 and 2005/06–2007/08, there was a 36% decline (Table 4.67). This was accompanied by a substantial increase in the category of signs, symptoms, and other conditions (Table 4.63), a composite category including septic shock and related consequences of severe infection (Bone et al., 1992). ICU care for these manifestations of severe infection more than doubled over this time interval (Table 4.65, Table 4.66).
3. There were some substantial differences between the primary reason for ICU admission and the diagnosis responsible for the majority of hospitalization. Specifically, disorders of the cardiovascular and respiratory system, and sepsis (including in the ICU–9–CM category of Symptoms, Signs, and Other Conditions) were more common as the main cause of ICU care than of the Most Responsible Hospital Diagnosis of ICU–containing hospital care, while this was reversed for neoplasms and gastrointestinal disorders (Table 4.68).

90 University of Manitoba
Specific Aim 4: Population–Based Description of ICU Use and ICU Patients
Tabl
e 4.
62:
Year
ly C
ount
s of
ICU
Adm
issi
on D
iagn
oses
by
ICD
–9 C
ateg
orie
s fo
r ICU
Epi
sode
s th
at B
egan
in D
atab
ase
Hos
pita
ls
Unw
eigh
ted
Ave
rage
Circ
ulat
ory
syst
em3,
050
3,35
93,
118
2,92
62,
769
2,55
02,
595
2,46
92,
686
2,83
6
Sym
ptom
s, s
igns
, oth
er c
ondi
tions
504
571
550
443
498
567
557
644
734
563
Res
pira
tory
sys
tem
503
517
568
602
553
573
543
545
549
550
Inju
ry a
nd p
oiso
ning
321
327
309
281
353
303
325
395
357
330
Dig
estiv
e sy
stem
200
195
159
137
147
166
174
154
144
164
End
ocrin
e, n
utrit
iona
l, m
etab
olic
, im
mun
ity84
8274
7910
195
105
112
8891
Ner
vous
sys
tem
and
sen
se o
rgan
s64
6883
6768
7110
390
113
81
Gen
itour
inar
y sy
stem
6148
4236
4649
5155
5149
Mus
culo
skel
etal
and
con
nect
ive
tissu
e16
2917
2624
4531
3231
28
Neo
plas
ms
2321
713
1419
97
1514
Ski
n an
d su
bcut
aneo
us t
issu
es
76
910
79
178
9
Fact
ors
influ
enci
ng h
ealth
sta
tus
09
s0
67
1111
7
Men
tal D
isor
ders
ss
ss
s6
ss
ss
Blo
od a
nd b
lood
-for
min
g or
gans
ss
ss
ss
6s
ss
Pre
gnan
cy a
nd c
hild
birt
hs
ss
ss
ss
ss
s
Con
geni
tal a
nom
alie
s0
ss
s0
s0
ss
s
Infe
ctio
us a
nd p
aras
itic
0s
0s
ss
ss
ss
Tota
l num
ber
of IC
U e
piso
des
4,84
05,
247
4,95
14,
626
4,59
84,
466
4,52
34,
542
4,80
3--
Val
ues
are
year
ly c
ount
s
"s" d
enot
es v
alue
sup
pres
sed
due
to s
mal
l num
bers
Sou
rce:
Man
itoba
Cen
tre
for
Hea
lth P
olic
y, 2
012
ICD
-9 D
iagn
ostic
Cat
egor
y
Tabl
e 4.
62: Y
early
Cou
nts
of IC
U A
dmis
sion
Dia
gnos
es b
y IC
D-9
Cat
egor
ies
for
ICU
Epi
sode
s th
at B
egan
in D
atab
ase
Hos
pita
ls
1999
/200
020
00/0
120
01/0
220
02/0
320
03/0
420
04/0
520
05/0
620
06/0
720
07/0
8

Manitoba Centre for Health Policy 91
The Epidemiology and Outcomes of Critical Illness in Manitoba
Tabl
e 4.
63:
Year
ly P
erce
ntag
es o
f ICU
Adm
issi
on D
iagn
oses
by
ICD
–9 C
ateg
orie
s fo
r ICU
Epi
sode
s th
at B
egan
in a
Dat
abas
e H
ospi
tal
ICD
-9 D
iagn
ostic
Cat
egor
y19
99/2
000
2000
/01
2001
/02
2002
/03
2003
/04
2004
/05
2005
/06
2006
/07
2007
/08
Unw
eigh
ted
Ave
rage
Circ
ulat
ory
syst
em63
.02
64.0
262
.98
63.2
560
.22
57.1
057
.37
54.3
655
.92
59.8
0
Sym
ptom
s, s
igns
, oth
er c
ondi
tions
10.4
110
.88
11.1
19.
5810
.83
12.7
012
.31
14.1
815
.28
11.9
2
Res
pira
tory
sys
tem
10.3
99.
8511
.47
13.0
112
.03
12.8
312
.01
12.0
011
.43
11.6
7
Inju
ry a
nd p
oiso
ning
6.63
6.23
6.24
6.07
7.68
6.78
7.19
8.70
7.43
6.99
Dig
estiv
e sy
stem
4.13
3.72
3.21
2.96
3.20
3.72
3.85
3.39
3.00
3.46
End
ocrin
e, n
utrit
iona
l, m
etab
olic
, im
mun
ity1.
741.
561.
491.
712.
202.
132.
322.
471.
831.
94
Ner
vous
sys
tem
and
sen
se o
rgan
s1.
321.
301.
681.
451.
481.
592.
281.
982.
351.
71
Gen
itour
inar
y sy
stem
1.26
0.91
0.85
0.78
1.00
1.10
1.13
1.21
1.06
1.03
Mus
culo
skel
etal
and
con
nect
ive
tissu
e0.
330.
550.
340.
560.
521.
010.
690.
700.
650.
59
Neo
plas
ms
0.48
0.40
0.14
0.28
0.30
0.43
0.20
0.15
0.31
0.30
Ski
n an
d su
bcut
aneo
us t
issu
e0.
100.
130.
120.
190.
220.
160.
200.
370.
170.
18
Fact
ors
influ
enci
ng h
ealth
sta
tus
0.00
0.17
0.10
0.00
0.13
0.16
0.18
0.24
0.23
0.13
Men
tal D
isor
ders
0.04
0.10
0.04
0.06
0.11
0.13
0.07
0.09
0.10
0.08
Blo
od a
nd b
lood
-for
min
g or
gans
0.10
0.06
0.08
0.02
0.04
0.07
0.13
0.07
0.10
0.07
Pre
gnan
cy a
nd c
hild
birt
h0.
040.
040.
080.
020.
020.
070.
070.
040.
080.
05
Con
geni
tal a
nom
alie
s0.
000.
020.
060.
020.
000.
070.
000.
020.
020.
02
Infe
ctio
us a
nd p
aras
itic
0.00
0.06
0.00
0.02
0.02
0.02
0.02
0.02
0.02
0.02
Val
ues
are
colu
mn
perc
enta
ges
Sou
rce:
Man
itoba
Cen
tre
for
Hea
lth P
olic
y, 2
012
Tabl
e 4.
63: Y
early
Per
cent
ages
of
ICU
Adm
issi
on D
iagn
oses
by
ICD
–9 C
ateg
orie
s fo
r IC
U E
piso
des
that
Beg
an in
a D
atab
ase
Hos
pita
l

92 University of Manitoba
Specific Aim 4: Population–Based Description of ICU Use and ICU Patients
Table 4.64: Ranking of Primary Reasons for ICU Admission for ICU Episodes that Began in a Database Hospital, Selected Years All diagnostic categories representing more than 1.0% of ICU episodes are shown
Diagnostic Category 1999/2000 2003/04 2007/08
Myocardial infarction 1 1 2
Coronary artery bypass 2 2 1
Cardiac arrest 3 3 4
Unstable angina 4 13 19
Congestive heart failure 5 4 5
Septic shock 6 5 3
Bradyarrythmias 7 7 10
Tachyarrythmias 8 9 9
Pneumonia, NOS 9 6 12
Abdominal aortic aneurysm repair 10 17 --
Postoperative respiratory failure 11 11 14
COPD 12 10 11
Acute coronary insufficiency 13 -- --
Cardiogenic shock 14 12 8
Coronary angiogram 15 8 6
Aortic valve replacement 16 14 7
Noncardiac chest pain 17 -- --
Mitral valve replacement -- 15 13
Exploratory laparotomy -- 16 --
Drug overdose -- 18 18
Other respiratory problems -- -- 15
Hypovolemic shock -- -- 16
Seizure -- -- 17
Nosocomial pneumonia -- -- 20Source: Manitoba Centre for Health Policy, 2012
Table 4.64: Ranking of Primary Reasons for ICU Admission for ICU Episodes that Began in a Database Hospital, Selected Years
All diagnostic categories representing more than 1.0% of ICU episodes are shown
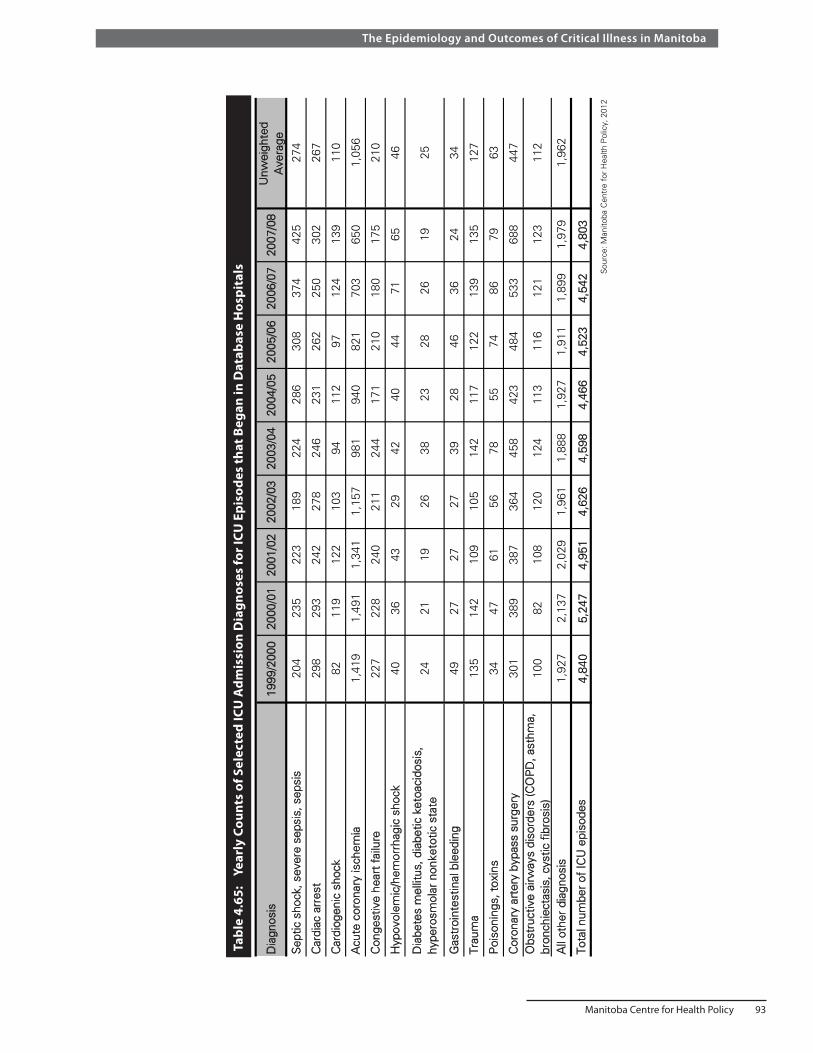
Manitoba Centre for Health Policy 93
The Epidemiology and Outcomes of Critical Illness in Manitoba
Tabl
e 4.
65:
Year
ly C
ount
s of
Sel
ecte
d IC
U A
dmis
sion
Dia
gnos
es fo
r ICU
Epi
sode
s th
at B
egan
in D
atab
ase
Hos
pita
ls
Dia
gnos
is19
99/2
000
2000
/01
2001
/02
2002
/03
2003
/04
2004
/05
2005
/06
2006
/07
2007
/08
Unw
eigh
ted
Ave
rage
Sep
tic s
hock
, sev
ere
seps
is, s
epsi
s20
423
522
318
922
428
630
837
442
527
4
Car
diac
arr
est
298
293
242
278
246
231
262
250
302
267
Car
diog
enic
sho
ck82
119
122
103
9411
297
124
139
110
Acu
te c
oron
ary
isch
emia
1,41
91,
491
1,34
11,
157
981
940
821
703
650
1,05
6
Con
gest
ive
hear
t fa
ilure
227
228
240
211
244
171
210
180
175
210
Hyp
ovol
emic
/hem
orrh
agic
sho
ck40
3643
2942
4044
7165
46
Dia
bete
s m
ellit
us, d
iabe
tic k
etoa
cido
sis,
h y
pero
smol
ar n
onke
totic
sta
te24
2119
2638
2328
2619
25
Gas
troi
ntes
tinal
ble
edin
g49
2727
2739
2846
3624
34
T rau
ma
135
142
109
105
142
117
122
139
135
127
Poi
soni
ngs,
tox
ins
3447
6156
7855
7486
7963
Cor
onar
y ar
tery
byp
ass
surg
ery
301
389
387
364
458
423
484
533
688
447
Obs
truc
tive
airw
ays
diso
rder
s (C
OP
D, a
sthm
a,
bron
chie
ctas
is, c
ystic
fib
rosi
s)10
082
108
120
124
113
116
121
123
112
All
othe
r di
agno
sis
1,92
72,
137
2,02
91,
961
1,88
81,
927
1,91
11,
899
1,97
91,
962
T ota
l num
ber
of IC
U e
piso
des
4,84
05,
247
4,95
14,
626
4,59
84,
466
4,52
34,
542
4,80
3
Sou
rce:
Man
itoba
Cen
tre
for
Hea
lth P
olic
y, 2
012
Tabl
e 4.
65: Y
early
Cou
nts
of S
elec
ted
ICU
Adm
issi
on D
iagn
oses
for
ICU
Epi
sode
s th
at B
egan
in D
atab
ase
Hos
pita
ls

94 University of Manitoba
Specific Aim 4: Population–Based Description of ICU Use and ICU Patients
Tabl
e 4.
66:
Year
ly P
erce
ntag
es o
f Sel
ecte
d IC
U A
dmis
sion
Dia
gnos
es fo
r ICU
Epi
sode
s th
at B
egan
in a
Dat
abas
e H
ospi
tal
Dia
gnos
is19
99/2
000
2000
/01
2001
/02
2002
/03
2003
/04
2004
/05
2005
/06
2006
/07
2007
/08
Unw
eigh
ted
Ave
rage
Sep
tic s
hock
, sev
ere
seps
is, s
epsi
s4.
214.
484.
504.
094.
876.
416.
818.
248.
845.
83
Car
diac
arr
est
6.16
5.58
4.89
6.01
5.35
5.17
5.79
5.50
6.29
5.64
Car
diog
enic
sho
ck1.
692.
272.
462.
232.
042.
512.
142.
732.
892.
33
Acu
te c
oron
ary
isch
emia
29.3
228
.42
27.0
925
.01
21.3
421
.05
18.1
515
.48
13.5
322
.15
Con
gest
ive
hear
t fa
ilure
4.69
4.35
4.85
4.56
5.31
3.83
4.64
3.96
3.64
4.43
Hyp
ovol
emic
/hem
orrh
agic
sho
ck0.
830.
690.
870.
630.
910.
900.
971.
561.
350.
97
Dia
bete
s m
ellit
us, d
iabe
tic k
etoa
cido
sis,
hy
pero
smol
ar n
onke
totic
sta
te0.
500.
400.
380.
560.
830.
520.
620.
570.
400.
53
Gas
troi
ntes
tinal
ble
edin
g1.
010.
510.
550.
580.
850.
631.
020.
790.
500.
72
Trau
ma
2.79
2.71
2.20
2.27
3.09
2.62
2.70
3.06
2.81
2.69
Poi
soni
ngs,
tox
ins
0.70
0.90
1.23
1.21
1.70
1.23
1.64
1.89
1.64
1.35
Cor
onar
y ar
tery
byp
ass
surg
ery
6.22
7.41
7.82
7.87
9.96
9.47
10.7
011
.73
14.3
29.
50
Obs
truc
tive
airw
ays
diso
rder
s (C
OP
D, a
sthm
a,
bron
chie
ctas
is, c
ystic
fib
rosi
s)2.
071.
562.
182.
592.
702.
532.
562.
662.
562.
38
All
othe
r di
agno
sis
39.8
240
.72
40.9
742
.38
41.0
543
.15
42.2
541
.81
41.2
041
.48
Val
ues
are
colu
mn
perc
enta
ges.
Sou
rce:
Man
itoba
Cen
tre
for
Hea
lth P
olic
y, 2
012
Tabl
e 4.
66: Y
early
Per
cent
ages
of
Sel
ecte
d IC
U A
dmis
sion
Dia
gnos
es f
or IC
U E
piso
des
that
Beg
an in
a D
atab
ase
Hos
pita
l

Manitoba Centre for Health Policy 95
The Epidemiology and Outcomes of Critical Illness in Manitoba
Table 4.67: Diagnostic Category of ICU Episodes Beginning in Database Hospitals for Manitobans by Year* Includes only the first such ICU episode of each year for a given patient
NumberUnadjusted
Rate*Number
Unadjusted Rate*
NumberUnadjusted
Rate*
1999/2000 1,682 1.93 1,188 1.36 1,315 1.51
2000/01 1,788 2.04 1,260 1.44 1,446 1.65
2001/02 1,663 1.89 1,217 1.38 1,389 1.57
2002/03 1,492 1.68 1,155 1.30 1,343 1.51
2003/04 1,373 1.53 1,239 1.38 1,354 1.51
2004/05 1,281 1.43 1,293 1.44 1,332 1.48
2005/06 1,232 1.36 1,366 1.50 1,312 1.44
2006/07 1,165 1.27 1,390 1.52 1,409 1.54
2007/08 1,025 1.10 1,444 1.56 1,683 1.81
† Includes cardiac surgical diagnoses Source: Manitoba Centre for Health Policy, 2012
* Per 1,000 population
Table 4.67: Diagnostic Category of ICU Episodes Beginning in Database Hospitals for Manitobans by Year*
Includes only the first such ICU episode of each year for a given patient
Cardiac Diagnoses Medical Diagnoses Surgical Diagnoses †
Year
Table 4.68: Comparison of ICU and Hospital Diagnostic Category Percentages Values are column percentages of unweighted averages over 1999/2000–2007/08
Symptoms, signs, other conditions 11.92 2.48 9.44
Circulatory system 59.80 54.64 5.16
Respiratory system 11.67 9.33 2.34
Nervous system and sense organs 1.71 1.63 0.09
Skin and subcutaneous tissue 0.18 0.24 -0.06
Blood and blood-forming organs 0.07 0.19 -0.12
Endocrine, nutritional, metabolic, immunity 1.94 2.09 -0.15
Pregnancy and childbirth 0.05 0.26 -0.21
Congenital anomalies 0.02 0.25 -0.22
Genitourinary system 1.03 1.59 -0.55
Musculoskeletal & connective tissue 0.59 1.19 -0.60
Mental Disorders 0.08 0.92 -0.84
Injury and poisoning 6.99 8.83 -1.83
Factors influencing health status 0.13 2.34 -2.20
Infectious and parasitic 0.02 2.63 -2.61
Digestive system 3.46 6.41 -2.95
Neoplasms 0.30 5.00 -4.70
The ICU diagnosis column is for episodes that began in Database Hospitals Source: Manitoba Centre for Health Policy, 2012
The hospital diagnosis column is restricted to ICU episodes that included any time in an urban ICU
ICU Admission Diagnostic Category
Hospital Most Responsible Diagnosis Category
Difference in Percent (ICU - Hospital)
Table 4.68: Comparison of ICU and Hospital Diagnostic Category Percentages Values are column percentages of unweighted averages over 1999/2000-2007/08
Severity of acute illness at initial ICU admission, as measured by the APACHE II APS and the Total APACHE II score, for ICU episodes beginning in a DBH is shown in Table 4.69. These parameters can be used to assess time trends. The APACHE II APS increased during the first half of the study period, after which it plateaued (Figure 4.8). This increase over time was statistically significant, but quite modest in size. These scores were lowest for those with cardiac diagnoses, highest for those with medical diagnoses,

96 University of Manitoba
Specific Aim 4: Population–Based Description of ICU Use and ICU Patients
and intermediate for those with surgical diagnoses (Table 4.70). While women had consistently and significantly higher APACHE II scores than men (Table 4.71), this difference was most pronounced for those with cardiac diagnoses. There was no difference between men and women for those with medical diagnoses (Table 4.72).
Looking at the APACHE II APS for ICU episodes that began in DBHs by sociodemographic characteristics identified:
• The degree of physiologic derangement related to acute illness varied remarkably little with age, though severity was highest among the youngest ICU patients (Table 4.73).
• Severity scores for Manitobans was slightly, but consistently, higher than for non–Manitobans (Table 4.74).
• Patients in lower income quintiles had higher severity of illness (Table 4.75), as did those living in the North (Table 4.76).
Figure 4.8: APACHE II Acute Physiology Score for ICU Episodes that Began in a Database Hospital by Year
0
2
4
6
8
10
12
14
1999/2000 2000/01 2001/02 2002/03 2003/04 2004/05 2005/06 2006/07 2007/08
AP
AC
HE
II A
cute
Ph
ysio
log
y S
core
Year
Mean
Source: Manitoba Centre for Health Policy, 2012
Figure 4.8: APACHE II Acute Physiology Score for ICU Episodes that Began in a Database Hospital, by Year
Regression Line:Slope= + 0.18 points / yearAdjusted r2 = 0.73, p=0.002

Manitoba Centre for Health Policy 97
The Epidemiology and Outcomes of Critical Illness in Manitoba
Tabl
e 4.
69:
APA
CHE
II A
cute
Phy
siol
ogy
Scor
es a
nd T
otal
APA
CHE
II Sc
ores
for I
CU E
piso
des
that
Beg
an in
Dat
abas
e H
ospi
tals
by
Year
Tabl
e 4.
70:
Mea
n A
PACH
E II
Acu
te P
hysi
olog
y Sc
ore
and
Tota
l APA
CHE
II Sc
ore
for I
CU E
piso
des
that
Beg
an in
Dat
abas
e H
ospi
tals
by
ICU
Adm
issi
on D
iagn
osis
Cat
egor
y an
d Ye
ar
Mea
nS
tand
ard
Dev
iatio
nM
edia
nM
ean
Sta
ndar
d D
evia
tion
Med
ian
1999
/200
04,
840
10.2
07.
138
5-
1314
.92
7.85
139
-19
2 000
/01
5,24
710
.18
6.88
85
-13
14.9
67.
6813
10-
19
2 001
/02
4,95
110
.58
7.05
96
-14
15.3
37.
8014
10-
19
2 002
/03
4,62
610
.96
7.26
96
-14
15.7
48.
0314
10-
20
2 003
/04
4,59
811
.41
7.20
106
-15
16.0
17.
8115
10-
20
2 004
/05
4,46
611
.55
7.33
106
-15
16.0
98.
0515
10-
20
2 005
/06
4,52
311
.48
7.24
106
-15
16.0
87.
8715
10-
20
2 006
/07
4,54
211
.60
7.45
106
-15
16.1
38.
0915
10-
21
2 007
/08
4,80
311
.28
7.26
106
-15
15.8
97.
8515
10-
20
Sou
rce:
Man
itoba
Cen
tre
for
Hea
lth P
olic
y, 2
012
Yea
rN
umbe
r o f
ICU
E
piso
des
Acu
te P
hysi
olog
y S
core
Tota
l AP
AC
HE
II S
core
Tabl
e 4.
69: A
PA
CH
E II
Acu
te P
hysi
olog
y S
core
s an
d To
tal A
PA
CH
E II
Sco
res
for
ICU
Epi
sode
s th
at B
egan
in D
atab
ase
Hos
pita
ls b
y Y
ear
Inte
rqua
rtile
Ran
geIn
terq
uart
ile R
ange
Dia
gnos
tic C
ateg
ory
1999
/200
020
00/0
120
01/0
220
02/0
320
03/0
420
04/0
520
05/0
620
06/0
720
07/0
8U
nwei
ghte
d A
vera
ge
Car
diac
5.76
5.87
6.11
6.11
6.33
6.05
6.00
5.68
5.47
5.93
Med
ical
15.0
515
.09
15.1
815
.72
15.2
715
.68
15.5
015
.62
15.0
415
.35
Sur
gica
l†11
.39
11.0
411
.68
12.0
012
.65
12.6
612
.15
12.2
411
.52
11.9
2
Car
diac
10.4
010
.47
10.7
510
.75
10.8
510
.51
10.4
910
.16
10.2
310
.51
Med
ical
20.0
820
.22
20.1
420
.86
20.1
220
.58
20.4
220
.49
19.9
320
.32
Sur
gica
l†15
.93
15.7
516
.37
16.6
217
.11
16.9
316
.52
16.4
615
.83
16.3
9
† In
clud
es c
ardi
ac s
urgi
cal d
iagn
oses
S
ourc
e: M
anito
ba C
entr
e fo
r H
ealth
Pol
icy,
201
2
Acu
te P
hysi
olog
y S
core
Tota
l AP
AC
HE
II S
core
Tabl
e 4.
70: M
ean
AP
AC
HE
II A
cute
Phy
siol
ogy
Sco
re a
nd T
otal
AP
AC
HE
II S
core
for
ICU
Epi
sode
s th
at B
egan
in D
atab
ase
Hos
pita
ls
by IC
U A
dmis
sion
Dia
gnos
is C
ateg
ory
and
Yea
r
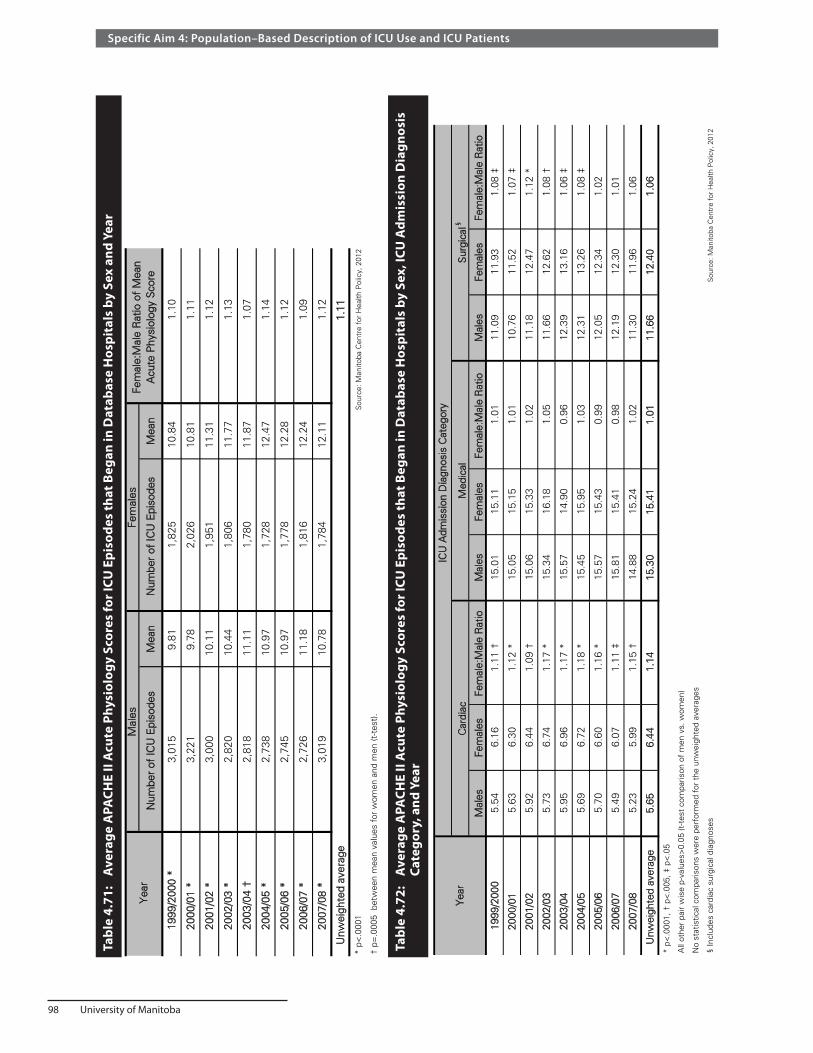
98 University of Manitoba
Specific Aim 4: Population–Based Description of ICU Use and ICU Patients
Tabl
e 4.
72:
Ave
rage
APA
CHE
II A
cute
Phy
siol
ogy
Scor
es fo
r ICU
Epi
sode
s th
at B
egan
in D
atab
ase
Hos
pita
ls b
y Se
x, IC
U A
dmis
sion
Dia
gnos
is
Ca
tego
ry, a
nd Y
ear
Tabl
e 4.
71:
Ave
rage
APA
CHE
II A
cute
Phy
siol
ogy
Scor
es fo
r ICU
Epi
sode
s th
at B
egan
in D
atab
ase
Hos
pita
ls b
y Se
x an
d Ye
ar
Num
ber
of IC
U E
piso
des
Mea
nN
umbe
r of
ICU
Epi
sode
sM
ean
1999
/200
0 *
3,01
59.
811,
825
10.8
41.
10
2 000
/01
*3,
221
9.78
2,02
610
.81
1.11
2001
/02
*3,
000
10.1
11,
951
11.3
11.
12
2 002
/03
*2,
820
10.4
41,
806
11.7
71.
13
2 003
/04
†2,
818
11.1
11,
780
11.8
71.
07
2 004
/05
*2,
738
10.9
71,
728
12.4
71.
14
2 005
/06
*2,
745
10.9
71,
778
12.2
81.
12
2006
/07
*2,
726
11.1
81,
816
12.2
41.
09
2 007
/08
*3,
019
10.7
81,
784
12.1
11.
12
Unw
eigh
ted
aver
age
1.11
* p<
.000
1 S
ourc
e: M
anito
ba C
entr
e fo
r H
ealth
Pol
icy,
201
2
† p=
.000
5 b
etw
een
mea
n va
lues
for
wom
en a
nd m
en (t
-tes
t).
Yea
rM
ales
Fem
ales
Fem
ale:
Mal
e R
atio
of
Mea
n A
cute
Phy
siol
ogy
Sco
re
Tabl
e 4.
71: A
vera
ge A
PA
CH
E II
Acu
te P
hysi
olog
y S
core
s fo
r IC
U E
piso
des
that
Beg
an in
Dat
abas
e H
ospi
tals
by
Sex
and
Yea
r
Mal
esFe
mal
esFe
mal
e:M
ale
Rat
ioM
ales
Fem
ales
Fem
ale:
Mal
e R
atio
Mal
esFe
mal
esFe
mal
e:M
ale
Rat
io
1999
/200
05.
546.
161.
11 †
15.0
115
.11
1.01
11.0
911
.93
1.08
‡
2000
/01
5.63
6.30
1.12
*15
.05
15.1
51.
0110
.76
11.5
21.
07 ‡
2001
/02
5.92
6.44
1.09
†15
.06
15.3
31.
0211
.18
12.4
71.
12 *
2002
/03
5.73
6.74
1.17
*15
.34
16.1
81.
0511
.66
12.6
21.
08 †
2003
/04
5.95
6.96
1.17
*15
.57
14.9
00.
9612
.39
13.1
61.
06 ‡
2004
/05
5.69
6.72
1.18
*15
.45
15.9
51.
0312
.31
13.2
61.
08 ‡
2005
/06
5.70
6.60
1.16
*15
.57
15.4
30.
9912
.05
12.3
41.
02
2006
/07
5.49
6.07
1.11
‡15
.81
15.4
10.
9812
.19
12.3
01.
01
2007
/08
5.23
5.99
1.15
†14
.88
15.2
41.
0211
.30
11.9
61.
06
Unw
eigh
ted
aver
age
5.65
6.44
1.14
15.3
015
.41
1.01
11.6
612
.40
1.06
* p<
.000
1, †
p<
.005
, ‡ p
<.0
5
All
othe
r pa
ir w
ise
p-va
lues
>0.
05 (t
-tes
t co
mpa
rison
of
men
vs.
wom
en)
No
stat
istic
al c
ompa
rison
s w
ere
perf
orm
ed f
or t
he u
nwei
ghte
d av
erag
es
§ In
clud
es c
ardi
ac s
urgi
cal d
iagn
oses
S
ourc
e: M
anito
ba C
entr
e fo
r H
ealth
Pol
icy,
201
2
Tabl
e 4.
72: A
vera
ge A
PA
CH
E II
Acu
te P
hysi
olog
y S
core
s fo
r IC
U E
piso
des
that
Beg
an in
Dat
abas
e H
ospi
tals
by
Sex
, IC
U A
dmis
sion
Dia
gnos
is C
ateg
ory,
and
Y
ear
Yea
r
ICU
Adm
issi
on D
iagn
osis
Cat
egor
y
Car
diac
Med
ical
Sur
gica
l§

Manitoba Centre for Health Policy 99
The Epidemiology and Outcomes of Critical Illness in Manitoba
Tabl
e 4.
73:
Ave
rage
APA
CHE
II A
cute
Phy
siol
ogy
Scor
es fo
r ICU
Epi
sode
s th
at B
egan
in D
atab
ase
Hos
pita
ls b
y A
ge G
roup
and
Yea
r
Age
Gro
up (Y
ears
)19
99/2
000
2000
/01
2001
/02
2002
/03
2003
/04
2004
/05
2005
/06
2006
/07
2007
/08
Unw
eigh
ted
Ave
rage
17-2
412
.89
13.8
313
.53
13.4
414
.88
14.8
615
.28
14.5
814
.48
14.2
0
25-2
913
.23
12.5
513
.41
13.8
415
.12
14.1
913
.98
13.6
812
.81
13.6
4
30-3
413
.46
13.5
411
.07
13.0
513
.75
14.4
513
.49
14.6
911
.76
13.2
5
35-3
911
.16
11.6
612
.91
13.8
212
.25
13.4
312
.79
12.6
112
.35
12.5
5
40-4
411
.17
9.75
10.8
411
.16
12.4
111
.05
12.3
311
.82
11.8
311
.37
45-4
99.
569.
3710
.24
10.3
611
.23
11.0
711
.52
11.5
610
.81
10.6
3
50-5
49.
349.
1710
.20
10.5
810
.90
10.9
411
.00
11.2
410
.29
10.4
1
55-5
99.
849.
599.
6810
.73
10.7
910
.80
10.9
410
.95
10.1
410
.38
60-6
49.
459.
6810
.04
10.1
710
.80
10.4
810
.90
11.0
511
.37
10.4
4
65-6
99.
639.
8710
.35
11.0
210
.84
11.1
510
.73
10.8
011
.21
10.6
2
70-7
410
.19
10.0
010
.33
10.5
011
.01
11.6
511
.78
11.6
911
.14
10.9
2
75-7
910
.37
10.3
310
.62
11.1
011
.16
12.0
311
.29
12.0
311
.41
11.1
5
80-8
410
.00
10.6
210
.81
10.9
011
.64
11.8
211
.40
11.5
611
.32
11.1
2
85-8
911
.11
10.2
711
.56
11.2
812
.16
11.5
811
.77
11.0
112
.46
11.4
7
90+
11.2
910
.78
11.2
510
.12
13.1
711
.85
11.5
512
.98
12.1
111
.68
Sou
rce:
Man
itoba
Cen
tre
for
Hea
lth P
olic
y, 2
012
Tabl
e 4.
73: A
vera
ge A
PA
CH
E II
Acu
te P
hysi
olog
y S
core
s fo
r IC
U E
piso
des
that
Beg
an in
Dat
abas
e H
ospi
tals
by
Age
Gro
up a
nd
Ye a
r

100 University of Manitoba
Specific Aim 4: Population–Based Description of ICU Use and ICU Patients
Man
itoba
ns:N
on-M
anito
bans
Num
ber
of IC
U E
piso
des
Mea
nN
umbe
r of
ICU
Epi
sode
sM
ean
Rat
io
1999
/200
0 *
4,57
510
.25
265
9.38
1.09
2 000
/01
4,92
210
.22
325
9.55
1.07
2 001
/02
*4,
688
10.6
326
39.
631.
10
2 002
/03
4,37
810
.96
248
10.9
21.
00
2003
/04
4,33
011
.44
268
10.8
71.
05
2 004
/05
4,22
011
.58
246
10.9
41.
06
2 005
/06
4,23
111
.48
292
11.5
50.
99
2 006
/07
4,27
811
.64
264
11.0
61.
05
2 007
/08
4,50
611
.32
297
10.5
91.
07
Unw
eigh
ted
Ave
rage
11.0
610
.50
1.05
* p<
0.05
bet
wee
n m
ean
valu
es f
or M
anito
bans
vs.
non
-Man
itoba
ns, b
y t-
test
.
No
stat
istic
al c
ompa
rison
s pe
rfor
med
for
the
unw
eigh
ted
aver
ages
Sou
rce:
Man
itoba
Cen
tre
for
Hea
lth P
olic
y, 2
012
Fisc
al Y
ear
Man
itoba
nsN
on-M
anito
bans
Tabl
e 4.
74: A
vera
ge A
PA
CH
E II
Acu
te P
hysi
olog
y S
core
for
ICU
Epi
sode
s th
at B
egan
in D
atab
ase
Hos
pita
ls b
y P
rovi
ncia
l Res
iden
cy
Sta
tus
and
Yea
rTa
ble
4.74
: A
vera
ge A
PACH
E II
Acu
te P
hysi
olog
y Sc
ore
for I
CU E
piso
des
that
Beg
an in
Dat
abas
e H
ospi
tals
by
Prov
inci
al R
esid
ency
Stat
us a
nd Y
ear
Tabl
e 4.
75:
Ave
rage
APA
CHE
II A
cute
Phy
siol
ogy
Scor
es fo
r ICU
Epi
sode
s th
at B
egan
in D
atab
ase
Hos
pita
ls b
y In
com
e Q
uint
iles
and
Year
Inco
me
Qui
ntile
s 19
99/2
000*
2000
/01*
2001
/02*
2002
/03*
2003
/04*
2004
/05*
2005
/06
†20
06/0
7*20
07/0
8*U
nwei
ghte
d A
vera
ge
Urb
an 1
st (lo
wes
t)10
.88
10.8
710
.80
11.4
512
.06
12.0
712
.13
12.0
412
.22
11.6
1
Urb
an 2
nd10
.28
9.83
10.5
910
.18
11.5
411
.30
11.0
312
.01
11.2
110
.89
Urb
an 3
rd9.
419.
6510
.44
11.0
911
.07
11.4
611
.20
11.4
410
.40
10.6
8
Urb
an 4
th9.
139.
6110
.39
10.1
310
.99
10.7
411
.00
11.0
611
.14
10.4
7U
rban
5th
(hig
hest
)9.
329.
299.
3510
.32
9.99
10.7
110
.81
10.6
110
.38
10.0
9
Rur
al 1
st (lo
wes
t)11
.26
12.3
711
.44
12.0
511
.98
12.4
912
.10
12.4
613
.10
12.1
4
Rur
al 2
nd10
.27
10.0
611
.62
11.0
711
.47
11.4
010
.70
12.0
110
.86
11.0
5
Rur
al 3
rd10
.49
10.6
910
.39
11.1
411
.80
11.8
911
.67
11.4
310
.63
11.1
3
Rur
al 4
th11
.13
10.4
110
.34
11.4
911
.92
13.0
611
.52
10.9
210
.98
11.3
1
Rur
al 5
th (h
ighe
st)
9.86
9.80
10.4
310
.63
11.1
110
.72
12.1
511
.12
10.5
810
.71
Inco
me
Unk
now
n15
.34
13.2
813
.73
13.8
312
.55
12.9
813
.26
13.8
614
.06
13.6
5
Non
-Man
itoba
ns9.
389.
559.
6310
.92
10.8
710
.94
11.5
511
.06
10.5
910
.50
Com
paris
on a
cros
s qu
intil
es (A
NO
VA
): *
p <
0.0
01, †
p =
0.0
02
No
stat
istic
al c
ompa
rison
s pe
rfor
med
for
the
unw
eigh
ted
aver
ages
Sou
rce:
Man
itoba
Cen
tre
for
Hea
lth P
olic
y, 2
012
Tabl
e 4.
75: A
vera
ge A
PA
CH
E II
Acu
te P
hysi
olog
y S
core
s fo
r IC
U E
piso
des
that
Beg
an in
Dat
abas
e H
ospi
tals
by
Inco
me
Qui
ntile
s an
d Y
ear

Manitoba Centre for Health Policy 101
The Epidemiology and Outcomes of Critical Illness in Manitoba
Table 4.76: Average APACHE II Acute Physiology Scores for ICU Episodes that Began in Database Hospitals by Residency Location and Year
Year Rural South Mid North Urban Non-Manitobans
1999/2000* 10.20 10.98 10.86 10.12 9.38
2000/01* 10.23 10.61 11.84 10.08 9.55
2001/02* 10.71 10.89 11.53 10.54 9.63
2002/03* 11.17 10.46 13.80 10.86 10.92
2003/04 11.34 11.60 12.72 11.36 10.87
2004/05* 11.23 12.06 13.46 11.45 10.94
2005/06* 10.86 12.07 12.44 11.41 11.55
2006/07 11.11 11.59 12.72 11.64 11.06
2007/08* 10.44 11.30 13.02 11.34 10.59
Unweighted average 10.81 11.29 12.49 10.98 10.50
Comparison across quintiles (ANOVA): * p < 0.05 Source: Manitoba Centre for Health Policy, 2012
Table 4.76: Average APACHE II Acute Physiology Scores for ICU Episodes that Began in Database Hospitals by Residency Location and Year
Summary and discussion of Results Parts 7The four most common categories of hospital–level diagnoses for ICU patients were circulatory disorders (55%), respiratory disorders (9%), injury or trauma or poisonings (9%), and digestive disorders (7%). The top categories for the primary reasons for admission to ICUs in DBHs were cardiovascular disorders (60%); followed by the miscellaneous category of signs, symptoms, and other conditions (12%, which includes sepsis and related diagnoses); respiratory disorders (12%); and trauma/poisonings (7%). The most notable trends over time were a substantial decline in the number ICU admissions related to cardiovascular conditions and a doubling of ICU care related to infections or sepsis.
Severity of acute illness was lower for those in higher income quintiles and those whose ICU care was able to be entirely delivered in rural hospitals. Surprisingly, severity of illness differed little with age. Average severity of acute illness at ICU admission, as measured by the APACHE II system, was low in comparison to most (Billington, Zygun, Stelfox, & Peets, 2009; Dodek et al., 2009; Laupland, 2004), but not all (Fowler et al., 2007) other studies from Canada. However, the low overall scores were largely due to very low values among patients with nonsurgical cardiac diagnoses. Severity of acute illness was higher for women than men in the cardiac and surgical categories, but not among those with medical diagnoses. In light of the lower scores for those with cardiac diagnoses, one explanation for this phenomenon could be the lower rates of cardiac disease among women (American Heart Association Statistics Committee and Stroke Statistics Subcommittee, 2009; National Heart, 2006). However, this cannot be the entire explanation as mean APACHE II APS scores were significantly greater for women than men separately within the cardiac and surgical categories.

102 University of Manitoba

Manitoba Centre for Health Policy 103
The Epidemiology and Outcomes of Critical Illness in Manitoba
Specific Aim 5: Outcomes and Post–ICU Resource Use
Statement of the Specific AimTo assess outcomes and resource use related to ICU care both short–term and long–term.
Summary of the Specific AimMortality is high among people receiving ICU care. Approximately 17% died in the hospital and another 2.7% died within six months. Mortality after ICU care appears to have two phases—a higher rate of death in the one to three months after admission and a much lower rate thereafter. We hypothesize that the high early rate primarily relates to the acute illness, while the lower subsequent rate is mainly determined by age and comorbidities.
After age–adjustment, there were no statistically significant differences in hospital mortality rates among female versus male ICU patients. Hospital mortality after ICU care was higher among urban residents living in lower income areas, but this gradient was absent among rural residents. There was little in the way of overall time trends in our mortality data, but additional analyses adjusting for multiple potential confounding variables would be necessary to clarify this issue.
The mean and median ICU LOS were 3.7 and 2.1 days, respectively. The mean increased slightly over the nine–year study period, while the median was quite stable. Surprisingly, ICU LOS varied relatively little with age. On average, patients admitted to ICUs with medical types of acute conditions remained in ICU almost two days longer than those with cardiac or surgical problems.
While medical resource use in the year following urban ICU care was substantial, it differed surprisingly little from that of hospitalized people who did not require ICU care. These differences were even smaller after adjustment for patient and illness characteristics. Likewise, while survivors of urban ICU care had increased use of home care and Personal Care Homes (PCH), these increases were not larger than for hospitalized adults in general. The most notable difference in post–hospital resource was that those with urban ICU care in the index hospitalization had a four–fold higher use of subsequent urban ICU care.
The findings about patient and illness characteristics from Specific Aim 4 combined with the outcomes data in Specific Aim 5 provide a consistent view of rural ICUs. The rural ICUs comprise approximately 23% of provincial ICU beds. One–fifth of all ICU episodes in the province were restricted to rural ICUs; while for another 2% of episodes, patients were initially admitted to rural ICUs and then transferred to an urban ICU. Overall, 9% of patients initially admitted to rural ICUs were subsequently transferred to urban ICUs, and ICU care restricted to rural ICUs accounted for approximately 40% of all ICU care for rural residents. The proportion of all ICU time accounted for by rural ICUs was approximately 10%, but this decreased over the study period. Percent occupancy rates of rural ICUs were low, much lower than that in urban ICUs. While the overall rate of ICU admission for rural residents was higher than for urban residents, their rates of urban ICU admission were generally lower. This suggested that rural ICUs are used to care for larger proportions of patients who are less ill. Consistent with this, compared to people who received care in urban ICUs, rural–only ICU patients had, on average, lower levels of comorbidities, lower severity of acute illness, shorter ICU and hospital LOS, and lower hospital mortality rates. Although they did not differ substantially in regards to the distribution of major categories of hospital diagnosis, these categories are very broad; it remains possible that there were differences at deeper levels of specification. These data indicate that many or most patients admitted to rural ICUs in Manitoba are less ill than those in urban ICUs and would likely be cared for on general wards in the urban hospitals.

104 University of Manitoba
Specific Aim 5: Outcomes and Post–ICU Resource Use
MethodsMethods: Mortality Outcomes Among Those with ICU Care
Since a given individual may have multiple episodes of ICU or hospital care but can die only once, it is important to avoid bias in calculation of mortality rates. Thus, in any given time interval, we limited consideration to each individual’s initial episode of care. Accordingly, mortality rates were at the person level, calculated as the proportion of those who died among persons who had ICU care in the interval of interest. Survival time was taken as the time from ICU admission until death. The Vital Statistics Mortality file includes Manitobans whose deaths occurred in Canada but outside the province. These were included, with patients being censored on March 31, 2009. Specified mortality time points were: death in ICU, in hospital, at 30 days, and 180 days. In addition, we created Kaplan–Meier survival curves for the entire study period, counting from each person’s initial ICU episode in that interval. Data for calculating 30 day, 180 day, and subsequent mortality was obtained from the Vital Statistics Mortality file and, therefore, were only available for Manitobans. Hospital and ICU mortality could be calculated for all patients, both Manitobans and non–Manitobans, since this information is included in hospital abstracts or WICUDB records. Hospital mortality was obtained from the disposition field of the final hospital abstract of the ICU–containing hospital episode.
Our method for evaluating ICU mortality depended on whether the final record of the ICU episode was from the WICUDB. For ICU episodes that ended in a DBH, we used the vital status field of that WICUDB record. For ICU episodes ending in non–DBHs, we derived this information from the final ICU–containing hospital abstract. If that abstract indicated death in hospital, we then needed to evaluate whether the death was in ICU or not. This was done using different methods pre–2004 and post–2004. Post–2004 hospital abstracts contain ICU entry and separation times, and we considered a patient to have died in ICU if the time of hospital death and the ending time of the ICU care were within six hours of one another. Pre–2004 abstracts contain dates but no times, so we used the sequential service codes to infer location of death. Specifically, it was taken that the person died in ICU if the final service code in the hospital abstract was the ICU service, while it was taken that the person survived the ICU if there were any additional service codes after the final ICU service code.
Because of the possibility of systematic differences in age between subgroups (e.g., males versus females), unless otherwise stated, all statistical comparisons of mortality rates between subgroups were age–adjusted. This adjustment was done using logistic regression modelling of hospital mortality, including the subgroups of interest and categorized age in the model. For a given subgroup analysis (e.g., males versus females), we included data from all study years into a single regression model. The coefficient and p–value of the subgroup variable of interest represents the age–adjusted difference in hospital mortality. In this Specific Aim, we report mortality rates unadjusted for age. For comparison, when indicated, we include age–adjusted tables in Appendix 5, using the method of direct age adjustment with the general Manitoba population in 2007/08 as the reference population.
Methods: Lengths of Stay
In this Specific Aim, we calculated ICU and hospital LOS for the purpose of identifying the total duration of episodes of care. ICU LOS was calculated at the level of the ICU episode; hospital LOS was calculated at the level of the hospital episode, which means that a given individual could be included multiple times in LOS calculations. In this Specific Aim, the LOS of an ICU episode was taken as the time elapsed from initial ICU entry until final ICU exit; note that this is a different method than was used in Specific Aim 4. LOS of a hospital episode was calculated as the interval from initial hospital entry until final

Manitoba Centre for Health Policy 105
The Epidemiology and Outcomes of Critical Illness in Manitoba
hospital exit. As discussed previously, for the pre–2004 period, when hospital abstracts included dates without times, all times were considered to be noon. Hospital LOS for episodes starting and ending on the same calendar day was taken as six hours in the pre–2004 period (the average value obtained in the post–2004 period when both dates and times were recorded in hospital abstracts). For ICU records from DBHs, we used the WICUDB as the source for the ICU entry and separation dates/times; while for ICU records in non–DBHs, we obtained the ICU timing from the hospital abstracts.
We report LOS separately for those patients whose ICU episodes included any time in the six–bed IICU at the Health Sciences Centre. The IICU primarily accepts patients from other Winnipeg ICUs who are expected to have a prolonged need for advanced care, most commonly due to persistent respiratory failure requiring prolonged mechanical ventilator support.
Because of the possibility of systematic differences in age between subgroups (e.g., males versus females), we report age–adjusted comparisons of LOS. This adjustment done using median (quantile) regression modelling of ICU or hospital LOS, including the subgroups of interest and categorized age in the model. For a given subgroup analysis we included data from all study years into a single regression model. The coefficient and p–value of the subgroup variable represents the age–adjusted difference in LOS. In the body of this Specific Aim we report LOS unadjusted for age. For comparison, when indicated, we include age–adjusted tables in Appendix 5, using the method of direct age–adjustment, with the general Manitoba population in 2007/08 as the reference population.
Methods: Post–Hospital Healthcare Resource Use
For the purpose of this report, long–term resource use means use of health services during the one year after hospital discharge. It was calculated at the level of hospital episodes and was limited to episodes in which the patient left the hospital alive.
For all elements of resource use other than home care, the data is available to March 31, 2009; and we evaluated all nine years of hospital episodes. As home care data was only available to March 31, 2007, evaluation of post–hospital home care use was restricted to hospital episodes ending on or before March 31, 2006 (1999/2000–2005/06). Unlike the yearly data presented in most of the other portions of this report, long–term resource use is reported for all years together.
Four exclusions were made for this analysis:
1. Non–Manitobans could not be included because as the Repository only contains comprehensive information about Manitobans.
2. Hospital episodes for childbirth were excluded as they comprise a large proportion of hospitalizations with substantial post–hospital resource use, but it is very uncommon for them to require ICU care. As a result, this evaluation excluded the rare ICU episodes among mothers that occurred in direct relation to birth events.
3. People who died on the day they left the hospital were excluded.4. Manitobans,who the Repository indicated had provincial health coverage that ended prior to the
start of their index hospital episode were excluded. We included people who were recorded to have moved out of the province or died during the one–year post–hospital period, and their resource use was pro–rated (annualized) to the post–hospital interval prior to death or moving away from Manitoba.
Resource use was assessed during an interval of 365 days beginning from the date of leaving the hospital alive. Because some hospital survivors die shortly afterwards while others survive for the entire year of interest, we calculated annualized rates of post–hospital resource use using the proportion of

106 University of Manitoba
Specific Aim 5: Outcomes and Post–ICU Resource Use
the post–hospital year for which the person remained alive. For example, an individual who survived the entire post–hospital year and had four physician visits in that time would have an annualized value of four; while a person who survived three months during which he had four physician visits was assigned an annualized value of 16.
We assessed the following five measures of post–hospital health resource use:
1. Outpatient physician care: Proportion having at least one outpatient physician care visit and the annualized number of such visits. We note that while almost all physician visits in Manitoba are included in the Repository, outpatient visits to CancerCare Manitoba and a few other subspecialty outpatient clinics are not included in these data (e.g., the Multiple Sclerosis Clinic at the Health Sciences Centre). Thus, our data will underestimate this measure of resource use for some patients with cancer and a few other diseases.
2. Outpatient prescription medication use: Proportion receiving at least one prescription dispensed from a community pharmacy and the annualized total cost of these prescription pharmaceuticals. This includes both medication acquisition costs and fees charged by pharmacies. This information is obtained from the Drug Prescription Information Network (DPIN) database, using methodology previously described (Metge et al., 1999). Values are reported in 2008 Canadian dollars, using the prescribed medicines portion of the Manitoba consumer price index as reported by Statistics Canada (Statistics Canada, 2006). We note two limitations of this measure to capture all outpatient medications used in the year after the index hospitalization. The DPIN database does not include prescription medications obtained for persons in some rural PCHs; and prior to 2005, DPIN data did not capture all prescription medications provided to residents of some First Nations communities. It is estimated that these account for approximately 20% in the Burntwood and NOR–MAN RHAs (Fransoo, 2009). Hospital care: Proportion having any hospital care and the average annualized number of hospital days
3. ICU admissions: Proportion having any ICU admissions4. Home care use: Proportion having any home care use
The focus of these analyses was post–hospital resource use after hospital episodes that included urban ICU care. We excluded rural–only ICU care from these analyses because, as already shown in this report, these ICUs differ substantially from urban ICUs as patients are substantially less sick and experience better outcomes. Instead, hospital episodes with ICU care restricted to rural hospitals were included in the comparison group of those without urban ICU care.
We compared post–hospital resource use among survivors of hospitalizations that included urban ICU care to those who survived hospitalization without such care and to values in the general population. We calculated unadjusted resource use, including those who had no use. In addition, we used two different statistical modelling strategies to make adjusted comparisons of post–hospital resource use. The first modelling strategy included all hospital episodes for Manitobans aged 17 and older during the study period, 1999/2000–2007/08. To account for correlated outcomes for individuals with multiple hospitalizations, we used General Estimating Equations (GEE) with an exchangeable correlation matrix (Hardin & Hilbe, 2003).
The second modelling strategy avoided such correlation by limiting consideration to each individual’s initial hospital episode. In both these models, the dependent variables were actual resource use, instead of the annualized version.

Manitoba Centre for Health Policy 107
The Epidemiology and Outcomes of Critical Illness in Manitoba
The independent variables in these models were:
• Whether the hospital episode included any urban ICU care —the variable of primary interest in this analysis
• Proportion of the post–hospital year the patient survived and was resident in Manitoba—to adjust for differing follow–up time between individuals
• Age—see comments below for more details • Sex • Income Quintile, a proxy measure of SES—as urban and rural quintiles of average household income
by Census Dissemination Area • Comorbid conditions —the presence of 31 pre–existing comorbidities using the same methodology
as in Specific Aim 4 (Elixhauser et al., 1998) • Most Responsible Hospital Diagnosis—categorized as ICD–9–CM chapters with cardiovascular
disorders as the reference group • Hospital discharge to a healthcare institution (e.g., PCH) versus community living • Hospital LOS of the index hospitalization
We used linear regression for the models quantifying outpatient physician visits and pharmacy costs and negative binomial regression for modelling hospital days. Because the DPIN database does not include prescription medications for persons in some PCHs, we excluded from the pharmacy cost model people who were institutionalized immediately prior to hospital admission.
Appropriate specification of age in GEE models must account for the fact that the data represent repeated measures over time. A potential problem is that persons with repetitive hospital episodes ages over these episodes and that age is a determinant of post–hospital resource use. Thus, there could be two distinct age effects: between–person effects that indicate the mean difference in resource use between cohorts of people at different ages and within–person effects that indicate how resource use changes for a given person after repeated hospitalizations as he/she ages. To account for these two sources of variation, two age variables were created for each hospital episode:
1. initial age was the age of the unique individual at his/her first hospital episode in the data set2. age deviation was difference in age of that individual between his/her first episode and the episode
under consideration
For example, an individual admitted to hospital three times, at ages 45, 46, and 52, would have a value of 45 for the initial age variable of all three episodes, while the ‘age deviation’ variable of the three episodes would have values of 0, 1, and 7, respectively.
Because more than half of hospital survivors had no hospitalizations in the year after discharge from the index hospitalization, we fitted a zero–inflated model with a negative binomial distribution for that outcome. Because implementation of zero–inflated GEE models has not been incorporated into SAS, we calculated this model only for each individual’s initial hospital episode. Computational limitations required us to omit hospital diagnosis and post–hospital location from this model and to group the comorbidities into a smaller number of categories.
In these models, we assessed for multicollinearity using variance inflation factors (Fox, 1991); none exceeded a value of 2.3, indicating no significant multicollinearity in the data.

108 University of Manitoba
Specific Aim 5: Outcomes and Post–ICU Resource Use
Methods: Other Outcomes
Whether critical illness requiring ICU care influences the ability of people to live independently is a relevant outcome. Clear determination of that influence is complicated by three factors:
1. Some people were not living independently prior to their urban ICU–containing hospitalization.2. Some people who survive critical illness are too debilitated to go home; and upon hospital discharge
they temporarily live in a long–term care facility before returning to independent living.3. Some people are discharged home but soon discover that independent living is untenable .
To clarify this issue, we compared pre–hospital living situation with the living situation immediately post–hospital and at three months post–discharge. Living situations were categorized as living in healthcare institutions versus community living. The healthcare institutions considered were all PCHs and the four long–term care facilities in the province (Riverview Health Center and Deer Lodge Centre in Winnipeg and facilities in Cartwright and Hartney). This data set did not include Selkirk Mental Health Centre, the only long–term psychiatric centre in the province, or St. Amant Centre, the only long–term health centre in the province for the developmentally disabled. Living situations for all three time points were determined using data from the Long Term Care database and hospital abstracts. To allow for errors in data entry, differences of plus or minus two days were allowed between the time points of institutional entry or exit.
ResultsThis Specific Aim has three parts.
Results Part 1: Mortality Outcomes
Kaplan–Meier curves of survival after people’s initial ICU admission (Figure 5.1 and 5.2) shows high initial rates of death after ICU admission, which then declined between 30 and 180 days and, subsequently, remained at the lower rates. Median survival after a first episode of urban ICU care was 5.62 years (95% confidence interval, 5.51–5.77) while after the first episode of care confined to rural ICUs it was longer, at 7.47 years (7.17–7.69).

Manitoba Centre for Health Policy 109
The Epidemiology and Outcomes of Critical Illness in Manitoba
Figure 5.1: Kaplan–Meier Survival Curves after ICU Care, for Manitobans, over Nine Years (1999/2000–2007/08) For each of the two curves, only the initial ICU episode of that type, for each individual, was included; patients with separate ICU episodes in both categories are included in both curves. Survival was calculated from date of initial ICU admission.
0.00
0.10
0.20
0.30
0.40
0.50
0.60
0.70
0.80
0.90
1.00
0 200 400 600 800 1,000 1,200 1,400 1,600 1,800 2,000 2,200 2,400 2,600 2,800 3,000 3,200 3,400 3,600
Su
rviv
al F
ract
ion
Time After ICU Admissions (Days)
Urban ICU Care With or Without Rural ICU Care
Only Rural ICU Care
Figure 5.1: Kaplan-Meier Survival Curves after ICU Care, for Manitobans, over Nine Years (1999/2000-2007/08)For each of the two curves, only the initial ICU episode of that type, for each individual, was included; patients with separate ICU episodes in both categories are
Source: Manitoba Centre for Health Policy, 2012
30 Days
180 Days

110 University of Manitoba
Specific Aim 5: Outcomes and Post–ICU Resource Use
Comparison of ICU, hospital, 30 day and 180 day mortality rates are shown in Figure 5.3 and Tables 5.1 and 5.2. Approximately 17% of ICU patients died before leaving the hospital and another 2.7% died within six months. The finding that hospital mortality exceeded 30 day mortality is due to the number of persons who remained in hospital greater than 30 days and died there; of the 47,616 persons represented in Table 5.2, 1,266 died in the hospital but were still alive and in the hospital 30 days after ICU entry; the mean (median) hospital LOS for those 1,266 people was 92.5 (65.0) days.
0.70
0.75
0.80
0.85
0.90
0.95
1.00
0 50 100 150 200
Su
rviv
al F
ract
ion
Time After ICU Admission (Days)
Urban ICU Care With or Without Rural ICU Care
Only Rural ICU Care
Source: Manitoba Centre for Health Policy, 2012
Figure 5.2: Kaplan-Meier Survival Curves after ICU Care, for Manitobans, over Nine Years (1999/2000 - 2007/08), Truncated at 200 days
180 Days
30 Days
Figure 5.2: Kaplan–Meier Survival Curves after ICU Care, for Manitobans, over Nine Years (1999/2000 – 2007/08), Truncated at 200 days For each of the two curves, only the initial ICU episode of that type, for each individual, was included; patients with separate ICU episodes in both categories are included in both curves. Survival was calculated from date of initial ICU admission
Table 5.1: Mortality Rates (%) for All Patients (Manitobans and Non–Manitobans) Admitted to Manitoba ICUs by Year For each individual, only their first episode of ICU care in each year is considered
Year Number of People ICU Mortality Rate Hospital Mortality Rate1999/2000 5,841 8.70 16.212000/01 6,190 9.10 16.032001/02 5,726 8.64 16.032002/03 5,367 8.18 16.322003/04 5,463 9.54 17.212004/05 5,374 10.40 18.032005/06 5,359 9.91 16.852006/07 5,407 9.43 16.962007/08 5,533 9.69 16.27
Unweighted Average 9.29 16.66Source: Manitoba Centre for Health Policy, 2012
Table 5.1: Mortality Rates (%) for All Patients (Manitobans and Non-Manitobans) Admitted to Manitoba ICUs by Year
For each individual, only their first episode of ICU care in each year is considered

Manitoba Centre for Health Policy 111
The Epidemiology and Outcomes of Critical Illness in Manitoba
Figure 5.3 shows that mortality at all four time points shifted upwards starting in 2003. Using simple linear regressions on these rates, with each year as a single data point, the increase was statistically significant only for ICU mortality (0.17% per year, p=0.047).
Table 5.2: Mortality Rates (%) for Manitobans Admitted to Manitoba ICUs by Year For each individual, only their first episode of ICU care in each year is considered
ICU Hospital 30 days 180 days
1999/2000 5,534 8.78 16.53 14.53 19.35
2000/01 5,833 9.19 16.36 14.37 19.39
2001/02 5,437 8.70 16.33 14.29 19.20
2002/03 5,100 8.27 16.75 14.24 19.94
2003/04 5,168 9.69 17.69 15.60 20.16
2004/05 5,110 10.39 18.30 15.91 21.51
2005/06 5,074 9.93 17.11 14.82 19.89
2006/07 5,136 9.54 17.41 14.56 19.53
2007/08 5,224 9.92 16.79 14.72 18.93
Unweighted Average -- 9.38 17.03 14.78 19.77
Source: Manitoba Centre for Health Policy, 2012
Table 5.2: Mortality Rates (%) for Manitobans Admitted to Manitoba ICUs by Year
For each individual, only their first episode of ICU care in each year is considered
YearNumber of
People
Mortality Endpoints
Figure 5.3: Mortality Rates for Manitobans Admitted to ICUs by Year For each individual, only their first episode of ICU care is considered in each year
0
5
10
15
20
25
1999/2000 2000/01 2001/02 2002/03 2003/04 2004/05 2005/06 2006/07 2007/08
Mo
rtal
ity
Rat
e (P
erce
nt)
Year
ICU Mortality
Hospital Mortality
30 Day Mortality
180 Day Mortality
Source: Manitoba Centre for Health Policy, 2012
Figure 5.3: Mortality Rates for Manitobans Admitted to ICUs by Year

112 University of Manitoba
Specific Aim 5: Outcomes and Post–ICU Resource Use
As hospital mortality is the most common outcome used in studies of ICU care, we chose this parameter for more extensive analysis. Specifically, we looked at six different comparisons
1. Manitobans versus non–Manitobans—Manitobans consistently had substantially higher hospital mortality rates than did non–Manitobans (Table 5.3). This finding, however, could be confounded by the fact that non–Manitobans are commonly transferred out of Manitoba to complete their hospital care once sufficiently recovered. Subsequent comparisons were confined to Manitobans.
2. Rural versus Urban ICU care—We looked at those who received rural ICU care only versus those who received urban ICU care (Table 5.4, top portion). As described in Specific Aim 4, patients who received care only in rural ICUs had less comorbidity and less severe illness (Tables 4.46 and 4.55); they also had significantly lower hospital mortality rates (mean 8.4% versus 19.0%). It was not surprising then that hospital mortality after ICU care for rural residents was substantially lower than for urban residents (Table 5.5), and that this difference was greatly attenuated when including only ICU care provided in urban hospitals (Table 5.6).
3. Income Quintile—Hospital mortality progressively decreased with increasing average household income among urban residents, but not among rural residents (Table 5.7). Mortality was highest among those in the Income Unknown category, primarily representing those residing in institutions (personal care homes, long–term care facilities, and prisons (Table 5.7, final row)).
4. Sex—Hospital mortality was slightly but not significantly higher for women than men (Table 5.4). While this difference by sex is consistent with the findings that women had higher severity of acute illness (Tables 4.56 and 4.71), the lack of statistical significance after age–adjustment (p=0.16) indicates that it is confounded by the fact that women, on average, are older at ICU admission (Table 4.26).
5. Age—Hospital mortality was strongly related to age. The death rates were similar for people aged 17–54, after which the rates increased rapidly with age (Table 5.8, Figure 5.4). Trending age–specific mortality rates over time weakly suggests declining rates over the study period among those younger than 45, and rising rates over time among those over 65 (Table 5.9).
6. Type of Medical Problem—This was limited to those whose index ICU episodes began in DBHs. We evaluated mortality according to the type of medical problem requiring ICU care—nonsurgical cardiac, medical, and surgical. Averaged over the study period, those with nonsurgical cardiac, medical, and surgical problems had, respectively, hospital mortality rates of 6%, 36%, and 16% (Table 5.10). Linear regression showed that hospital mortality changed significantly over time for all three categories. Though mortality rates were much lower for nonsurgical cardiac diagnoses, they significantly increased over time (+0.18% per year, p=0.03), while hospital mortality decreased over time for medical (–0.63% per year, p=0.01) and surgical (–0.45% per year, p=0.02) conditions.

Manitoba Centre for Health Policy 113
The Epidemiology and Outcomes of Critical Illness in Manitoba
Tabl
e 5.
3:
Una
djus
ted
Hos
pita
l Mor
talit
y Ra
tes
(%) o
f Pat
ient
s A
dmit
ted
to IC
Us
by M
anit
oba
Resi
denc
y St
atus
and
Yea
r
For e
ach
indi
vidu
al, o
nly
thei
r firs
t epi
sode
of I
CU c
are
in e
ach
year
is c
onsi
dere
d
Num
ber
of P
atie
nts
5,84
16,
190
5,72
65,
367
5,46
35,
374
5,35
95,
407
5,53
3--
Per
cent
Man
itoba
ns94
.74
94.2
394
.95
95.0
394
.60
95.0
994
.68
94.9
994
.42
--
Mor
talit
y R
ate,
Man
itoba
ns16
.53
16.3
616
.33
16.7
517
.69
18.3
017
.11
17.4
116
.79
17.0
3*
Mor
talit
y R
ate,
Non
-Man
itoba
ns10
.42
10.6
410
.38
8.24
8.81
12.8
812
.28
8.49
7.44
9.95
Rat
io o
f M
orta
lity
Rat
esM
anito
ban:
Non
-Man
itoba
n1.
591.
541.
572.
032.
011.
421.
392.
052.
26--
* p<
0.00
01 f
or d
iffer
ence
bet
wee
n M
anito
bans
and
Non
-Man
itoba
ns, b
y ag
e-ad
just
ed lo
gist
ic r
egre
ssio
n, o
ver
all 9
yea
rs
Sou
rce:
Man
itoba
Cen
tre
for
Hea
lth P
olic
y, 2
012
2007
/08
Unw
eigh
ted
Ave
rage
Tabl
e 5.
3: U
nadj
uste
d H
ospi
tal M
orta
lity
Rat
es (%
) of
Pat
ient
s A
dmitt
ed t
o IC
Us
by M
anito
ba R
esid
ency
Sta
tus
and
Yea
r F
or e
ach
indi
vidu
al, o
nly
thei
r fir
st e
piso
de o
f IC
U c
are
in e
ach
year
is c
onsi
dere
d
1999
/200
020
00/0
120
01/0
220
02/0
320
03/0
420
04/0
520
05/0
620
06/0
7
Tabl
e 5.
4:
Una
djus
ted
Hos
pita
l Mor
talit
y Ra
tes
(%) f
or M
anit
oban
s A
dmit
ted
to M
anit
oba
ICU
s by
Yea
r
For e
ach
indi
vidu
al, o
nly
thei
r firs
t epi
sode
of I
CU c
are
in e
ach
year
is c
onsi
dere
d
Unw
eigh
ted
Ave
rage
Num
ber
of P
atie
nts
5,53
45,
833
5,43
75,
100
5,16
85,
110
5,07
45,
136
5,22
4--
Per
cent
With
Rur
al IC
U C
are
Onl
y19
.518
.517
.217
.319
.519
.319
.618
.616
.6--
Mor
talit
y R
ate,
Rur
al IC
U O
nly
7.13
6.67
7.61
9.09
8.05
8.53
9.75
9.83
9.32
8.44
*M
orta
lity
Rat
e, In
clud
ed U
rban
ICU
Car
e18
.81
18.5
618
.14
18.3
420
.01
20.6
318
.919
.14
18.2
818
.98
Rat
io o
f M
orta
lity
Rat
es, R
ural
Onl
y:N
ot R
ural
Onl
y0.
380.
360.
420.
500.
400.
410.
520.
510.
51--
Per
cent
of
Mal
es59
.759
.058
.559
.760
.059
.659
.559
.860
.8--
Mor
talit
y R
ate,
Mal
es16
.61
15.5
915
.08
15.4
417
.03
17.5
915
.78
17.0
115
.76
16.2
1†M
orta
lity
Rat
e, F
emal
es16
.43
17.4
618
.09
18.6
818
.67
19.3
419
.06
1818
.38
18.2
3R
atio
of
Mor
talit
y R
ates
, Mal
e:Fe
mal
e1.
010.
890.
830.
830.
910.
910.
830.
950.
86--
* p<
0.00
01 f
or d
iffer
ence
bet
wee
n ru
ral-o
nly
ICU
car
e vs
. urb
an IC
U c
are,
by
age-
adju
sted
logi
stic
reg
ress
ion,
ove
r al
l ni
ne y
ears
Sou
rce:
Man
itoba
Cen
tre
for
Hea
lth P
olic
y, 2
012
† p=
0.16
for
diff
eren
ce b
etw
een
mal
es v
s. f
emal
es, b
y ag
e-ad
just
ed lo
gist
ic r
egre
ssio
n, o
ver
all n
ine
year
s
2007
/08
Tabl
e 5.
4: U
nadj
uste
d H
ospi
tal M
orta
lity
Rat
es (%
) for
Man
itoba
ns A
dmitt
ed t
o M
anito
ba IC
Us
by Y
ear
For
each
indi
vidu
al, o
nly
thei
r fir
st e
piso
de o
f IC
U c
are
in e
ach
year
is c
onsi
dere
d
1999
/200
020
00/0
120
01/0
220
02/0
320
03/0
420
04/0
520
05/0
620
06/0
7

114 University of Manitoba
Specific Aim 5: Outcomes and Post–ICU Resource Use
Table 5.5: Unadjusted Hospital Mortality Rate (%) for Manitobans Admitted to Manitoba ICUs by Year and Residency Location For each individual, only their first episode of ICU care in each year is considered
Rural South Mid North Urban
1999/2000 12.00 15.74 9.34 19.272000/01 12.37 14.06 12.25 18.762001/02 14.62 14.03 11.56 17.962002/03 12.36 12.92 16.14 19.162003/04 16.02 14.15 10.82 20.102004/05 13.51 14.71 15.72 21.042005/06 12.93 15.16 12.89 19.552006/07 13.36 15.32 14.49 19.682007/08 10.84 14.32 13.23 19.91
Unweighted Average * 13.11 14.49 12.94 19.49* p<0.0001 for difference among the four locations, by age-adjusted logistic regression, over all nine years
Source: Manitoba Centre for Health Policy, 2012
Table 5.5: Unadjusted Hospital Mortality Rate (%) for Manitobans Admitted to Manitoba ICUs by Year and Residency Location
For each individual, only their first episode of ICU care in each year is considered
YearResidency Location
Table 5.6: Unadjusted Hospital Mortality Rate (%) for Manitobans Whose Index ICU Episode Included Any Time in an Urban ICU by Year and Residency Location For each individual, only their first episode of urban ICU care in each year is considered
Rural South Mid North Urban
1999/2000 16.46 19.70 13.81 19.442000/01 18.33 16.38 19.90 18.862001/02 20.35 15.79 17.73 18.082002/03 15.27 14.67 20.61 19.312003/04 21.22 17.28 19.77 20.262004/05 17.14 17.96 29.88 21.142005/06 15.56 17.44 20.90 19.632006/07 16.99 17.19 18.05 19.942007/08 13.05 15.72 15.74 20.03
Unweighted Average * 17.15 16.90 19.60 19.63
Source: Manitoba Centre for Health Policy, 2012
YearResidency Location
Table 5.6: Unadjusted Hospital Mortality Rate (%) for Manitobans Whose Index ICU Episode Included Any Time in an Urban ICU by Year
and Residency LocationFor each individual, only their first episode of urban ICU care in each year is considered.
* p=<0.0001 for difference among the four locations, by age-adjusted logistic regression, over all nine years

Manitoba Centre for Health Policy 115
The Epidemiology and Outcomes of Critical Illness in Manitoba
Tabl
e 5.
7:
Una
djus
ted
Hos
pita
l Mor
talit
y Ra
te (%
) for
Man
itob
ans
Adm
itte
d to
Man
itob
a IC
Us
by Y
ear a
nd In
com
e Q
uint
ile
For e
ach
indi
vidu
al, o
nly
thei
r firs
t epi
sode
of I
CU c
are
in e
ach
year
is c
onsi
dere
d
Inco
me
Unw
eigh
ted
Qui
ntile
Ave
rage
*
Urb
an 1
st (l
owes
t)23
.09
20.7
319
.71
21.6
620
.80
23.9
522
.54
18.9
422
.12
21.5
0
Urb
an 2
nd19
.35
18.0
116
.84
17.2
119
.24
21.8
219
.74
23.2
420
.38
19.5
4
Urb
an 3
rd18
.17
18.6
317
.85
20.8
221
.79
18.4
218
.47
21.2
718
.09
19.2
8
Urb
an 4
th14
.11
16.4
318
.35
17.3
520
.28
18.7
017
.41
16.7
719
.32
17.6
4
Urb
an 5
th (h
ighe
st)
15.6
016
.29
13.2
516
.05
17.2
418
.76
16.8
317
.89
18.1
816
.68
Rur
al 1
st (lo
wes
t)11
.57
11.6
814
.71
12.1
014
.21
13.2
612
.72
15.0
612
.25
13.0
6
Rur
al 2
nd10
.90
14.0
214
.44
10.6
313
.35
15.8
414
.32
15.1
511
.35
13.3
3
Rur
al 3
rd15
.89
16.3
114
.14
16.5
315
.37
13.8
013
.40
13.4
313
.02
14.6
5
Rur
al 4
th13
.21
12.3
611
.92
13.4
014
.55
15.7
313
.21
13.6
713
.27
13.4
8
Rur
al 5
th (h
ighe
st)
12.0
710
.44
13.3
012
.82
13.9
512
.61
15.9
011
.46
13.1
912
.86
Inco
me
Unk
now
n27
.03
23.6
126
.25
21.1
320
.86
24.4
119
.39
20.0
018
.35
22.3
4*
p<0.
0001
for
diff
eren
ce a
mon
g th
e 11
gro
ups,
by
age-
adju
sted
logi
stic
reg
ress
ion,
ove
r al
l nin
e ye
ars
Sou
rce:
Man
itoba
Cen
tre
for
Hea
lth P
olic
y, 2
012
Tabl
e 5.
7: U
nadj
uste
d H
ospi
tal M
orta
lity
Rat
e (%
) for
Man
itoba
ns A
dmitt
ed t
o M
anito
ba IC
Us
by Y
ear
and
Ave
rage
Hou
seho
ld
Inco
me
Qui
ntile
For
each
indi
vidu
al, o
nly
thei
r fir
st e
piso
de o
f IC
U c
are
in e
ach
year
is c
onsi
dere
d
1999
/200
020
00/0
120
01/0
220
02/0
320
03/0
420
04/0
520
05/0
620
06/0
720
07/0
8
Tabl
e 5.
8:
Hos
pita
l Mor
talit
y Ra
te (%
) for
Man
itob
ans
Adm
itte
d to
Man
itob
a IC
Us
by Y
ear a
nd A
ge G
roup
Fo
r eac
h in
divi
dual
, onl
y th
eir fi
rst e
piso
de o
f ICU
car
e in
eac
h ye
ar is
con
side
red
Age
Gro
up
1999
/200
020
00/0
120
01/0
220
02/0
320
03/0
420
04/0
520
05/0
620
06/0
720
07/0
8U
nwei
ghte
d A
vera
ge R
ate
17-2
911
.11
9.38
11.2
36.
9913
.78
11.4
48.
048.
295.
159.
49
30-3
912
.65
13.2
514
.65
10.6
012
.83
9.49
8.02
8.40
8.06
10.8
8
40-4
410
.89
9.59
8.59
10.1
56.
877.
119.
187.
968.
778.
79
45-4
97.
8310
.69
11.3
88.
7910
.85
8.71
12.5
710
.81
14.3
810
.67
50-5
49.
849.
887.
4711
.76
12.2
49.
0411
.75
11.6
39.
8610
.39
55-5
913
.75
11.3
09.
9410
.88
12.0
613
.41
10.8
513
.57
12.6
412
.04
60-6
412
.76
11.5
314
.74
12.4
711
.63
13.2
512
.42
13.6
312
.41
12.7
6
65-6
915
.17
13.0
514
.24
16.3
013
.83
14.4
417
.42
16.8
515
.85
15.2
4
70-7
416
.77
15.5
316
.17
18.5
019
.58
22.2
819
.97
18.8
017
.34
18.3
3
75-7
920
.28
19.6
119
.47
19.6
819
.31
24.6
621
.52
20.3
522
.46
20.8
2
80-8
421
.79
25.7
222
.32
27.9
928
.65
28.4
224
.65
26.7
328
.39
26.0
7
85-8
931
.19
29.2
031
.98
26.6
932
.06
33.8
931
.49
31.6
727
.79
30.6
6
90+
31.4
035
.94
31.7
129
.46
50.4
737
.01
35.8
336
.43
37.0
436
.14
Sou
rce:
Man
itoba
Cen
tre
for
Hea
lth P
olic
y, 2
012
Tabl
e 5.
8: H
ospi
tal M
orta
lity
Rat
e (%
) for
Man
itoba
ns A
dmitt
ed t
o M
anito
ba IC
Us
by Y
ear
and
Age
Gro
upFo
r ea
ch in
divi
dual
, onl
y th
eir
first
epi
sode
of
ICU
car
e in
eac
h ye
ar is
con
side
red

116 University of Manitoba
Specific Aim 5: Outcomes and Post–ICU Resource Use
Figure 5.4: Unweighted Average Hospital Mortality Rate over Nine Years (1999/2000–2007/08) as a Function of Patient Age for Manitobans Admitted to Manitoba ICUs by Year For each individual, only their first episode of ICU care in each year is considered
0
5
10
15
20
25
30
35
40
17-29 30-39 40-44 45-49 50-54 55-59 60-64 65-69 70-74 75-79 80-84 85-89 90+
Ho
spit
al M
ort
alit
y (
Per
cen
t)
Age Group (Years)
Source: Manitoba Centre for Health Policy, 2012
Figure 5.4: Unweighted Average Hospital Mortality Rate over Nine Years (1999/2000 -- 2007/08) as a Function of
Table 5.9: Linear Regression Results, for Manitobans, of Yearly Age–Specific Hospital Mortality Rates Versus Time
17-29 -0.4835 0.17230-39 -0.7884 0.003*40-44 -0.2535 0.15245-49 0.4815 0.06150-54 0.1864 0.39655-59 0.1121 0.56560-64 0.0175 0.90365-69 0.3106 0.10370-74 0.3911 0.16675-79 0.3338 0.15780-84 0.5754 0.09185-89 0.0005 0.99890+ 0.6633 0.433
* p<0.05Source: Manitoba Centre for Health Policy, 2012
Table 5.9: Linear Regression Results, for Manitobans, of Yearly Age-Specific Hospital Mortality Rates Versus Time
Age GroupYearly Percentage Change in
Hospital Mortality Ratep-value

Manitoba Centre for Health Policy 117
The Epidemiology and Outcomes of Critical Illness in Manitoba
Findings from the other mortality time points (Appendix Tables A5.7–A5.16) are consistent with the hospital mortality findings.
Results Part 2: Length of Stay Outcomes
Since we anticipated that LOS would be severely skewed upwards by inclusion of patients who spent time in the IICU at the Health Sciences Centre, we calculated LOS separately for those with and without such care. For Manitobans whose ICU care did not include time in IICU, average and median ICU LOS were 3.7 and 2.1 days, respectively (Table 5.11). Average and median hospital LOS were 20.6 and 9.0 days, respectively (Table 5.12).
LOS results were quite long for the small cohort whose ICU care included any time in the IICU. Those patients had mean and median ICU LOS of 42 and 35 days, respectively (Table 5.13); their mean and median hospital LOS were 132 and 89 days, respectively (Table 5.14).
Table 5.10: Unadjusted Hospital Mortality Rate (%) for Manitobans Admitted to Manitoba ICUs, Limited to ICU Episodes that Began in Database Hospitals, by Fiscal Year and ICU Admission Diagnosis Type For each individual, only their first episode of ICU care in each year is considered
Cardiac Medical Surgical1999/2000 5.89 37.29 17.572000/01 5.76 37.94 15.842001/02 5.17 35.25 16.702002/03 5.63 37.40 15.642003/04 6.41 36.88 16.252004/05 7.18 37.28 16.522005/06 6.82 32.94 14.862006/07 6.78 32.45 15.402007/08 6.63 33.17 11.82
Unweighted Average *
6.25 35.62 15.62
Source: Manitoba Centre for Health Policy, 2012
Table 5.10: Unadjusted Hospital Mortality Rate (%) for Manitobans Admitted to Manitoba ICUs, Limited to ICU Episodes that Began in Database Hospitals, by Fiscal Year and ICU Admission Diagnosis
TypeFor each individual, only their first episode of ICU care in each year is considered
YearType of ICU Admission Diagnosis
* p<0.0001 for difference among the 3 types of admission diagnoses, by age-adjusted logistic regression, over all nine years

118 University of Manitoba
Specific Aim 5: Outcomes and Post–ICU Resource Use
Table 5.12: Length of ICU–Containing Hospital Episodes, in Days, by Year and Provincial Residency Status Excludes episodes with any time in the Intermediate ICU at the Health Sciences Centre
Number Mean Median Number Mean Median
1999/2000 5,946 18.77 9.00 5.00 -- 18.00 309 10.61 7.00 4.00 -- 13.002000/01 6,275 19.47 9.00 5.00 -- 19.00 365 12.03 8.00 4.00 -- 13.002001/02 5,851 19.92 9.00 4.00 -- 20.00 291 10.01 7.00 4.00 -- 12.002002/03 5,435 20.85 9.00 4.00 -- 20.00 275 10.81 7.00 3.00 -- 13.002003/04 5,550 19.62 9.00 4.00 -- 19.00 300 11.29 7.00 3.00 -- 12.002004/05 5,428 22.00 9.00 4.00 -- 20.00 265 11.72 7.00 4.00 -- 14.002005/06 5,401 20.92 9.00 4.00 -- 21.00 291 13.92 8.00 4.00 -- 16.002006/07 5,420 21.71 9.00 5.00 -- 22.00 280 13.95 8.00 4.00 -- 14.002007/08 5,523 21.75 9.00 4.00 -- 21.00 321 12.12 7.00 4.00 -- 14.00
Unweighted Average
-- 20.56 9.00* -- 11.83 7.33*
*p=<0.0001, for comparing median values over all 9 years, by age-adjusted median regressionSource: Manitoba Centre for Health Policy, 2012
--- ---
Table 5.12: Length of ICU-Containing Hospital Episodes, in Days, by Year and Provincial Residency Status
Excludes episodes with any time in the Intermediate ICU at the Health Sciences Centre
YearManitobans Non-Manitobans
Interquartile Range
Interquartile Range
Number Mean Median Number Mean Median
1999/2000 6,269 3.24 2.01 1.00 -- 4.00 318 3.44 2.08 1.23 -- 4.182000/01 6,628 3.33 2.00 1.00 -- 4.00 381 3.11 2.08 1.00 -- 3.922001/02 6,197 3.50 2.00 1.00 -- 4.00 305 3.40 2.44 1.20 -- 4.012002/03 5,756 3.67 2.03 1.00 -- 4.00 289 3.79 2.46 1.18 -- 3.892003/04 5,849 3.54 2.00 1.00 -- 4.00 312 3.52 1.97 0.99 -- 3.822004/05 5,705 3.91 2.42 1.02 -- 4.68 269 3.79 2.08 0.92 -- 4.742005/06 5,708 3.85 2.17 1.00 -- 4.44 308 4.39 2.52 1.14 -- 5.402006/07 5,727 3.93 2.13 0.98 -- 4.26 295 4.29 2.61 1.00 -- 5.012007/08 5,850 3.83 2.00 0.95 -- 4.16 332 3.78 2.11 0.94 -- 4.48
Unweighted Average
-- 3.65 2.08* -- 3.72 2.26*
*p=0.0009, for comparing median values over all 9 years, by age-adjusted median regression Source: Manitoba Centre for Health Policy, 2012
-- --
Table 5.11: Length of ICU Episodes, in Days, by Year and Provincial Residency Status Excludes episodes with any time in the Intermediate ICU at the Health Sciences Centre
YearManitobans Non-Manitobans
Interquartile Range
Interquartile Range
Table 5.11: Length of ICU Episodes, in Days, by Year and Provincial Residency Status Excludes episodes with any time in the Intermediate ICU at the Health Sciences Centre

Manitoba Centre for Health Policy 119
The Epidemiology and Outcomes of Critical Illness in Manitoba
Table 5.13: Length of ICU Episodes, in Days, by Year Limited to episodes with any time in the Intermediate ICU (IICU) at the Health Sciences Centre
YearNumber of
ICU Episodes
Parameter MeanStandard Deviation
Median Maximum
Total ICU time 25.4 20.4 22.1 11.0 34.7 102.0ICU time excluding IICU time 13.2 11.1 9.7 5.2 19.1 56.4
Total ICU time 41.3 29.5 34.6 21.2 48.8 142.6ICU time excluding IICU time 20.8 18.1 15.7 7.8 29.1 73.5
Total ICU time 50.1 40.0 39.6 23.3 78.0 186.9ICU time excluding IICU time 29.3 31.6 20.5 9.1 40.4 152.0
Total ICU time 45.9 42.6 33.3 17.0 53.0 170.1ICU time excluding IICU time 19.7 15.0 16.6 7.7 26.8 58.8
Total ICU time 35.5 27.7 30.0 16.8 47.5 151.0ICU time excluding IICU time 19.0 20.6 12.4 7.0 22.9 134.4
Total ICU time 38.0 24.0 33.3 20.7 49.2 105.2ICU time excluding IICU time 17.3 11.5 14.3 8.1 24.3 52.1
Total ICU time 42.2 35.4 33.9 21.8 47.0 194.8ICU time excluding IICU time 18.1 13.7 18.5 6.1 23.2 60.9
Total ICU time 47.5 37.1 42.7 23.4 59.4 227.4ICU time excluding IICU time 21.0 13.5 18.7 10.8 27.1 63.3
Total ICU time 55.4 43.5 43.0 26.6 66.9 223.5ICU time excluding IICU time 24.7 24.3 15.7 11.7 29.4 116.5
Total ICU time 42.4 -- 34.7 -- --ICU time excluding IICU time 20.4 -- 15.8 -- --
the difference between pairs of rows is the time spent in Intermediate ICU Source: Manitoba Centre for Health Policy, 2012
1999/2000 71
2000/01 49
2001/02 34
Table 5.13: Length of ICU Episodes, in Days, by YearLimited to episodes with any time in the Intermediate ICU (IICU) at the Health Sciences Centre
Interquartile Range
---Unweighted
Average
2005/06 53
2006/07 54
2007/08 43
2002/03 33
2003/04 60
2004/05 56
ICU LOS differed only slightly by provincial residency status (Table 5.11). However, median hospital LOS of Manitobans who received ICU care was 1.7 days longer than for non–Manitobans (Table 5.12), possibly reflecting, at least in part, transfer back to their home provinces to complete their hospitalizations once sufficiently stable.
Subsequent analyses of the length of episodes of care were limited to Manitobans and excluded episodes containing any time in the IICU. Mean LOS gradually but significantly increased over the study period (Tables 5.15 and 5.16); linear regression on the yearly values showed that average ICU LOS increased over time by two hours per year (p=0.001), while hospital LOS increased 8.7 hours per year (p=0.003). These increases in mean values were not accompanied by increases over time in median values, indicating an increasing number of episodes of ICU and ICU–containing hospital care with relatively long LOS.
Age–adjusted, median LOS values were slightly but significantly longer for woman, while women’s median hospital LOS was longer by 1.8 days (Tables 5.17 and 5.18). Other findings regarding LOS include:
• Consistently shorter LOS associated with ICU care limited to rural hospitals (Tables 5.19 and 5.20). The observed difference between average ICU LOS (one to two days shorter) versus median ICU LOS (0.2–0.5 days shorter) indicate that much of the longer ICU LOS in urban ICUs can be attributed to a minority of urban ICU patients with long ICU stays, i.e., LOS outliers.
• ICU LOS varied little with age, except for a decline among the most elderly (Appendix Table A5.17, Figure 5.5), while hospital LOS generally increased with age (Appendix Table A5.18, Figure 5.6)
• ICU LOS was substantially longer for medical than nonsurgical cardiac or surgical conditions (Table 5.21), while hospital LOS was substantially shorter for nonsurgical cardiac conditions than for medical or surgical conditions (Table 5.22). Again, the greater differences in average than mean LOS indicate that LOS outliers account for much of these differences.

120 University of Manitoba
Specific Aim 5: Outcomes and Post–ICU Resource Use
Table 5.14: Length of ICU–Containing Hospital Episodes, in Days, by Year Limited to episodes with any time in the Intermediate ICU (IICU) at the Health Sciences Centre
YearNumber of
HospitalEpisodes
Parameter MeanStandard Deviation
Median Maximum
Total hospital time 104.95 98.98 69.50 43.00 126.00 570.00Excluding IICU time 86.90 93.53 56.80 33.30 91.57 545.98Total hospital time 163.94 178.84 83.50 55.00 225.50 744.00
Excluding IICU time 143.11 178.88 67.51 31.17 189.25 709.07Total hospital time 147.38 103.26 126.00 70.50 183.00 397.00
Excluding IICU time 123.51 94.88 105.15 55.33 154.50 387.13Total hospital time 133.17 151.18 79.50 46.00 160.00 774.00
Excluding IICU time 104.36 135.17 58.69 37.98 133.03 705.86Total hospital time 89.09 79.39 67.50 37.00 106.00 379.00
Excluding IICU time 71.23 73.62 50.04 27.36 86.07 304.36Total hospital time 127.19 118.59 82.00 50.00 157.00 571.00
Excluding IICU time 103.34 106.47 62.22 34.98 129.07 478.14Total hospital time 135.96 134.92 95.50 47.00 181.50 621.00
Excluding IICU time 108.43 121.96 64.21 29.98 145.95 487.05Total hospital time 153.74 135.24 107.00 65.00 220.00 659.00
Excluding IICU time 123.73 124.63 82.91 35.27 177.07 534.14Total hospital time 133.21 104.71 87.00 60.00 200.00 512.00
Excluding IICU time 100.84 101.88 55.77 25.05 155.21 495.00
-- Total hospital time 132.07 -- 88.6 -- --
Excluding IICU time 107.27 -- 67.0 -- --
the difference between pairs of rows is the time spent in Intermediate ICU Source: Manitoba Centre for Health Policy, 2012
Table 5.14: Length of ICU-Containing Hospital Episodes, in Days, by YearLimited to episodes with any time in the Intermediate ICU (IICU) at the Health Sciences Centre
1999/2000
2000/01
2001/02
Unweighted Average
2005/06
2006/07
2007/08
2002/03
2003/04
2004/05
64
48
32
30
58
53
48
53
43
Interquartile Range

Manitoba Centre for Health Policy 121
The Epidemiology and Outcomes of Critical Illness in Manitoba
Table 5.15: Length of ICU Episodes for Manitobans, in Days, by Year Excludes episodes with any time in the Intermediate ICU at the Health Sciences Centre
YearNumber of
ICU Episodes
Mean Median Maximum
1999/2000 6,269 3.24 2.01 1.00 -- 4.00 100.002000/01 6,628 3.33 2.00 1.00 -- 4.00 73.002001/02 6,197 3.50 2.00 1.00 -- 4.00 122.272002/03 5,756 3.67 2.03 1.00 -- 4.00 147.112003/04 5,849 3.54 2.00 1.00 -- 4.00 82.872004/05 5,705 3.91 2.42 1.02 -- 4.68 158.082005/06 5,708 3.85 2.17 1.00 -- 4.44 82.722006/07 5,727 3.93 2.13 0.98 -- 4.26 142.162007/08 5,850 3.83 2.00 0.95 -- 4.16 84.01
Unweighted Average
-- 3.65 2.08 --
Source: Manitoba Centre for Health Policy, 2012
Table 5.15: Length of ICU Episodes for Manitobans, in Days, by Yearexcludes episodes with any time in the Intermediate ICU at the Health Sciences Centre
Interquartile Range
--
Table 5.16: Length of ICU–Containing Hospital Episodes for Manitobans, in Days, by Year Excludes episodes with any time in the Intermediate ICU at the Health Sciences Centre
YearNumber of
Hospital Episodes
Mean Median Maximum
1999/2000 5,946 18.77 9 5.00 -- 18.00 6062000/01 6,275 19.47 9 5.00 -- 19.00 4592001/02 5,851 19.92 9 4.00 -- 20.00 9512002/03 5,435 20.85 9 4.00 -- 20.00 5332003/04 5,550 19.62 9 4.00 -- 19.00 6742004/05 5,428 22.00 9 4.00 -- 20.00 2,0442005/06 5,401 20.92 9 4.00 -- 21.00 7912006/07 5,420 21.71 9 5.00 -- 22.00 1,0442007/08 5,523 21.75 9 4.00 -- 21.00 820
Unweighted Average
-- 20.56 9.00 --
Source: Manitoba Centre for Health Policy, 2012
Table 5.16: Length of ICU-Containing Hospital Episodes for Manitobans, in Days, by YearExcludes episodes with any time in the Intermediate ICU at the Health Sciences Centre
Interquartile Range
--

122 University of Manitoba
Specific Aim 5: Outcomes and Post–ICU Resource Use
Table 5.17: Length of ICU Episodes for Manitobans, in Days, by Year and Sex Excludes episodes with any time in the Intermediate ICU at the Health Sciences Centre
Mean Median Mean Median
1999/2000 6,269 60.2 3.19 2.00 1.00 -- 4.00 3.32 2.04 1.00 -- 4.00
2000/01 6,628 59.2 3.30 2.00 1.00 -- 3.96 3.37 2.00 1.00 -- 4.00
2001/02 6,197 58.6 3.40 2.00 1.00 -- 4.00 3.63 2.00 1.00 -- 4.00
2002/03 5,756 59.4 3.69 2.00 1.00 -- 4.00 3.64 2.08 1.00 -- 4.00
2003/04 5,849 60.1 3.39 2.00 1.00 -- 4.00 3.77 2.00 1.00 -- 4.23
2004/05 5,705 59.9 3.89 2.38 1.02 -- 4.63 3.94 2.47 1.03 -- 4.77
2005/06 5,708 59.6 3.63 2.08 0.98 -- 4.13 4.18 1.64 1.08 -- 4.83
2006/07 5,727 59.8 3.82 2.07 0.97 -- 4.11 4.10 2.24 1.00 -- 4.58
2007/08 5,850 61.1 3.65 1.94 0.93 -- 3.97 4.11 2.14 0.99 -- 4.67Unweighted
Average-- 59.8 3.55 2.05* 3.79 2.07*
*p=0.0004, for comparing median values over all 9 years, by age-adjusted median regressionSource: Manitoba Centre for Health Policy, 2012
Table 5.17: Length of ICU Episodes for Manitobans, in Days, by Year and SexExcludes episodes with any time in the Intermediate ICU at the Health Sciences Centre
Interquartile Range
Male
Interquartile Range
FemaleYear Number
Percent of Males
Table 5.18: Length of ICU–Containing Hospital Episodes for Manitobans, in Days, by Year and Sex Excludes episodes with any time in the Intermediate ICU at the Health Sciences Centre
Mean Median Mean Median
1999/2000 5,946 60.0 17.26 8.00 5.00 -- 17.00 21.02 10.00 2.00 -- 20.00
2000/01 6,275 59.1 18.27 9.00 5.00 -- 18.00 21.21 10.00 5.00 -- 21.00
2001/02 5,851 58.5 17.96 8.00 4.00 -- 18.00 22.69 10.00 5.00 -- 23.00
2002/03 5,435 59.4 18.92 8.00 4.00 -- 18.00 23.67 10.00 4.00 -- 22.00
2003/04 5,550 60.1 17.75 8.00 4.00 -- 17.00 22.43 10.00 4.00 -- 23.00
2004/05 5,428 60.0 20.21 8.00 5.00 -- 18.00 24.68 10.00 4.00 -- 24.00
2005/06 5,401 59.4 19.52 9.00 4.00 -- 19.00 22.96 10.00 5.00 -- 25.00
2006/07 5,420 59.7 19.44 8.00 4.00 -- 19.00 25.07 11.00 5.00 -- 27.00
2007/08 5,523 61.0 20.10 9.00 4.00 -- 19.00 24.34 10.00 5.00 -- 25.00Unweighted
Average-- 59.7 18.83 8.33* 23.12 10.11*
*p=<0.0001, for comparing median values over all 9 years, by age-adjusted median regressionSource: Manitoba Centre for Health Policy, 2012
--
Male
--
Female
Interquartile Range
Year NumberPercent
of Males
Interquartile Range
Table 5.18: Length of ICU-Containing Hospital Episodes for Manitobans, in Days, by Year and SexExcludes episodes with any time in the Intermediate ICU at the Health Sciences Centre

Manitoba Centre for Health Policy 123
The Epidemiology and Outcomes of Critical Illness in Manitoba
Table 5.19: Length of ICU Episodes for Manitobans, in Days, by Year and Type of ICU Excludes episodes with any time in the Intermediate ICU at the Health Sciences Centre
Mean Median Mean Median
1999/2000 6,269 19.9 2.34 2.00 1.00 -- 3.00 3.47 2.32 1.00 -- 4.17
2000/01 6,628 19.0 2.33 2.00 1.00 -- 3.00 3.56 2.20 1.00 -- 4.15
2001/02 6,197 17.8 2.30 2.00 1.00 -- 3.00 3.76 2.17 1.00 -- 4.08
2002/03 5,756 17.8 2.40 2.00 1.00 -- 3.00 3.94 2.23 1.02 -- 4.14
2003/04 5,849 19.6 2.27 2.00 1.00 -- 3.00 3.85 2.24 1.00 -- 4.46
2004/05 5,705 19.6 2.22 1.72 0.86 -- 2.93 4.33 2.72 1.11 -- 5.18
2005/06 5,708 19.9 2.10 1.64 1.08 -- 2.72 4.29 2.08 1.07 -- 5.00
2006/07 5,727 18.5 2.03 1.55 1.00 -- 2.77 4.37 2.43 1.04 -- 4.88
2007/08 5,850 16.5 2.06 1.64 0.75 -- 2.77 4.18 2.10 0.97 -- 4.73Unweighted
Average-- 18.7 2.23 1.84* 3.97 2.28*
Source: Manitoba Centre for Health Policy, 2012*p=<0.0001, for comparing median values over all 9 years, by age-adjusted median regression
Table 5.19: Length of ICU Episodes for Manitobans, in Days, by Year and Type of ICUExcludes episodes with any time in the Intermediate ICU at the Health Sciences Centre
--
Interquartile Range
Anytime in Urban ICU's
--
Year NumberPercent of Rural ICU
Only
Only Rural ICU's Interquartile
Range
Table 5.20: Length of ICU–Containing Hospital Episodes for Manitobans, in Days, by Year and Type of ICU Excludes episodes with any time in the Intermediate ICU at the Health Sciences Centre
Mean Median Mean Median
1999/2000 5,946 20.35 11.39 5.00 2.00 -- 10.00 20.65 10.00 6.00 -- 20.002000/01 6,275 19.57 10.22 5.00 2.00 -- 9.00 21.72 10.00 6.00 -- 21.002001/02 5,851 18.12 10.37 5.00 2.00 -- 9.00 22.04 10.00 5.00 -- 23.002002/03 5,435 18.36 11.67 5.00 2.00 -- 10.00 22.92 10.00 5.00 -- 22.002003/04 5,550 19.95 9.96 5.00 2.00 -- 10.00 22.02 10.00 5.00 -- 22.002004/05 5,428 20.12 11.20 5.00 3.00 -- 10.00 24.72 10.00 5.00 -- 23.002005/06 5,401 20.16 12.25 6.00 3.00 -- 10.00 23.10 11.00 5.00 -- 25.002006/07 5,420 19.08 13.54 5.00 3.00 -- 10.00 23.63 11.00 5.00 -- 24.002007/08 5,523 16.60 12.66 6.00 3.00 -- 11.00 23.57 11.00 5.00 -- 24.00
Unweighted Average
-- 19.1 11.47 5.22* 22.71 10.33*
*p=<0.0001, for comparing median values over all 9 years, by age-adjusted median regressionSource: Manitoba Centre for Health Policy, 2012
Interquartile Range
Table 5.20: Length of ICU-Containing Hospital Episodes for Manitobans, in Days, by Year and Type of ICUExcludes episodes with any time in the Intermediate ICU at the Health Sciences Centre
Year NumberPercent of Rural ICU Only
Only Rural ICU's Interquartile
Range
Anytime in Urban ICU's

124 University of Manitoba
Specific Aim 5: Outcomes and Post–ICU Resource Use
Figure 5.5: Mean and Median Lengths of ICU Episodes for Manitobans by Age Values shown are unweighted averages over all 9 years (1999/2000 –2007/08) Excludes Episodes with any time in the Intermediate ICU at the Health Sciences Centre
Figure 5.6: Mean and Median Lengths of ICU–Containing Hospital Episodes for Manitobans, by Age Values shown are unweighted averages over all 9 years. (1999/2000 –2007/08) Excludes episodes with any time in the Intermediate ICU at the Health Sciences Centre
0.0
0.5
1.0
1.5
2.0
2.5
3.0
3.5
4.0
4.5
17-29 30-39 40-44 45-49 50-54 55-59 60-64 65-69 70-74 75-79 80-84 85-89 90+
Len
gth
of
Sta
y (D
ays)
Age Group
ICU Mean Length of Stay
ICU Median Length of Stay
Source: Manitoba Centre for Health Policy, 2012
Figure 5.5: Mean and Median Lengths of ICU Episodes for Manitobans by Age
0
5
10
15
20
25
30
35
17-29 30-39 40-44 45-49 50-54 55-59 60-64 65-69 70-74 75-79 80-84 85-89 90+
Len
gth
of
Sta
y (D
ays)
Age Group
Hospital Mean Length of Stay
Hospital Median Length of Stay
Source: Manitoba Centre for Health Policy, 2012
Figure 5.6: Mean and Median Lengths of ICU-Containing Hospital Episodes for Manitobans, by Age

Manitoba Centre for Health Policy 125
The Epidemiology and Outcomes of Critical Illness in Manitoba
Tabl
e 5.
21:
Leng
th o
f ICU
Epi
sode
s th
at B
egan
in D
atab
ase
Hos
pita
ls, f
or M
anit
oban
s, in
Day
s, b
y Ye
ar a
nd T
ype
of IC
U A
dmis
sion
Dia
gnos
is
Excl
udes
epi
sode
s w
ith a
ny ti
me
in th
e In
term
edia
te IC
U a
t the
Hea
lth S
cien
ces
Cent
re
Tabl
e 5.
22:
Leng
th o
f ICU
–Con
tain
ing
Hos
pita
l Epi
sode
s th
at B
egan
in D
atab
ase
Hos
pita
ls, f
or M
anit
oban
s, in
Day
s, b
y Ye
ar a
nd T
ype
of IC
U
Adm
issi
on D
iagn
osis
Ex
clud
es e
piso
des
with
any
tim
e in
the
Inte
rmed
iate
ICU
at t
he H
ealth
Sci
ence
s Ce
ntre
Per
cen
t o
f T
ota
lM
ean
Med
ian
Per
cen
t o
f T
ota
lM
ean
Med
ian
Per
cen
t o
f T
ota
lM
ean
Med
ian
1999
/200
04,
465
41.5
912
.15
8.00
5.00
--13
.00
28.2
923
.93
11.0
04.
00--
25.0
030
.12
28.5
214
.00
7.00
--30
.00
2000
/01
4,79
741
.11
13.9
58.
005.
00--
15.0
027
.73
25.4
212
.00
5.00
--27
.00
31.1
727
.57
13.0
07.
00--
28.0
020
01/0
24,
555
39.8
913
.46
7.00
4.00
--15
.00
28.5
625
.51
12.0
05.
00--
28.0
031
.55
29.9
714
.00
7.00
--30
.00
2002
/03
4,22
438
.49
12.5
16.
004.
00--
13.0
029
.07
26.6
213
.00
5.00
--28
.50
32.4
330
.84
15.0
08.
00--
30.0
020
03/0
44,
245
35.5
211
.58
7.00
4.00
--12
.00
31.5
226
.38
12.0
05.
00--
27.0
032
.96
27.3
714
.00
7.00
--29
.00
2004
/05
4,11
933
.96
13.1
46.
004.
00--
12.0
032
.92
27.2
513
.00
5.00
--28
.00
33.1
132
.54
14.0
07.
00--
30.0
020
05/0
64,
141
32.5
812
.67
7.00
4.00
--14
.00
34.9
425
.81
13.0
05.
00--
29.0
032
.48
27.7
414
.00
7.00
--30
.00
2006
/07
4,16
030
.05
11.8
67.
004.
00--
13.0
035
.48
28.1
013
.00
5.00
--31
.00
34.4
727
.80
13.0
07.
00--
28.0
020
07/0
84,
380
25.5
713
.37
6.00
4.00
--13
.00
34.9
526
.56
13.0
05.
00--
28.0
039
.47
26.3
012
.00
6.00
--25
.00
Un
wei
gh
ted
Ave
rag
e --
35.4
212
.74
6.89
31.5
026
.18
12.4
433
.09
28.7
413
.67
Sou
rce:
Man
itoba
Cen
tre
for
Hea
lth P
olic
y, 2
012
----
--
Med
ical
Tab
le 5
.22:
Len
gth
of
ICU
-Co
nta
inin
g H
osp
ital
Ep
iso
des
th
at B
egan
in D
atab
ase
Ho
spit
als,
fo
r M
anit
ob
ans,
in D
ays,
by
Yea
r an
d T
ype
of
ICU
Ad
mis
sio
n D
iag
no
sis
Exc
lude
s ep
isod
es w
ith a
ny t
ime
in t
he In
term
edia
te IC
U a
t th
e H
ealth
Sci
ence
s C
entr
e
Yea
r
Nu
mb
er
of
Ho
spit
al
Ep
iso
des
Inte
rqu
arti
le
Ran
ge
Car
dia
c
Inte
rqu
arti
le
Ran
ge
Inte
rqu
arti
le
Ran
ge
Su
rgic
al
Per
cen
t o
f T
ota
lM
ean
Med
ian
Per
cen
t o
f T
ota
lM
ean
Med
ian
Per
cen
t o
f T
ota
lM
ean
Med
ian
1999
/200
04,
762
41.6
23.
342.
791.
69--
4.36
28.0
33.
992.
691.
17--
5.01
30.3
42.
991.
310.
83--
3.11
2000
/01
5,12
641
.32
3.26
2.69
1.59
--4.
0727
.47
4.53
2.82
1.19
--5.
8531
.21
2.97
1.36
0.83
--3.
0020
01/0
24,
883
39.7
93.
102.
571.
50--
3.82
28.0
84.
702.
691.
14--
5.52
32.1
33.
651.
460.
84--
3.54
2002
/03
4,52
837
.88
2.88
2.38
1.50
--3.
6728
.98
5.46
2.93
1.34
--6.
1733
.15
3.77
1.59
0.84
--3.
6420
03/0
44,
525
35.4
03.
062.
461.
38--
3.90
31.2
05.
032.
911.
28--
6.14
33.3
93.
401.
700.
85--
3.76
2004
/05
4,38
033
.63
3.65
2.93
1.78
--4.
7532
.69
5.57
3.16
1.36
--7.
0333
.68
3.54
1.79
0.86
--3.
9720
05/0
64,
431
32.2
73.
482.
761.
54--
4.23
34.6
95.
363.
161.
48--
6.46
33.0
43.
781.
730.
88--
3.82
2006
/07
4,44
229
.92
3.38
2.66
1.53
--4.
1535
.55
5.70
2.96
1.47
--6.
3334
.53
3.80
1.76
0.88
--3.
9020
07/0
84,
688
25.8
53.
162.
251.
13--
3.92
34.8
35.
623.
001.
37--
6.85
39.3
13.
391.
680.
89--
3.65
Un
wei
gh
ted
Ave
rag
e --
35.3
03.
262.
6131
.28
5.11
2.92
33.4
23.
481.
60
Sou
rce:
Man
itoba
Cen
tre
for
Hea
lth P
olic
y, 2
012
Inte
rqu
arti
le
Ran
ge
Car
dia
c
Inte
rqu
arti
le
Ran
ge
Inte
rqu
arti
le
Ran
ge
--
Med
ical
--
Su
rgic
al
--
Tab
le 5
.21:
Len
gth
of
ICU
Ep
iso
des
th
at B
egan
in D
atab
ase
Ho
spit
als,
fo
r M
anit
ob
ans,
in D
ays,
by
Yea
r an
d T
ype
of
ICU
Ad
mis
sio
n D
iag
no
sis
Exc
lude
s ep
isod
es w
ith a
ny t
ime
in t
he In
term
edia
te IC
U a
t th
e H
ealth
Sci
ence
s C
entr
e
Yea
rN
um
ber
o
f IC
U
Ep
iso
des

126 University of Manitoba
Specific Aim 5: Outcomes and Post–ICU Resource Use
We note that differing methods of calculating ICU LOS led to slightly different numbers for LOS in Specific Aim 4 and Specific Aim 5. In Specific Aim 4, we summed the lengths of the individual ICU records; in Specific Aim 5, we took the interval between initial ICU entry and final ICU separation. The method used in Specific Aim 4 was longer by a handful of hours. In 1999/2000 for example, the 6,340 ICU episodes among Manitobans were reported in Specific Aim 4 (Table 4.9) as having a mean ICU LOS of 88.2 hours; this is compared with the value calculated from Tables 5.11 and 5.13 in Specific Aim 5 of 83.8 hours.
Summary and discussion of Results Parts 1 and 2Mortality is high among people receiving ICU care. Approximately 17% died in the hospital and another 2.7% died within six months. These figures are not dissimilar from those reported in Ontario, Alberta, and Austria (Fowler et al., 2007; Laupland, 2004; Valentin et al., 2003). Mortality after ICU care appears to have two phases, with a higher rate of death in the first one to three months after admission and a much lower subsequent rate. Based on published evidence (Garland et al., 2004; Johnston et al., 2002), we can hypothesize that the type and severity of acute illness are the most important determinants of early death, while age and the presence of comorbidities are more important determinants among hospital survivors.
The much lower mortality among patients whose ICU care was provided exclusively in rural hospitals was expected based on our findings that those patients had less comorbidities and lower severity of acute illness compared to patients admitted to urban ICUs. After age adjustment, the slightly higher hospital mortality rates among female ICU patients was not statistically significant.
We observed that hospital mortality was higher among urban residents living in lower income areas, but this gradient was absent among rural residents. While higher mortality in critically ill urban residents living in low income areas might be due to their higher degrees of comorbidity and severity of acute illness (Tables 4.44, 4.59, and 4.75), we note that similar gradients in comorbidity and severity of illness exist for rural dwellers who did not experience a corresponding gradient in mortality. This rural-urban difference may also be related to the higher variability of household income levels within each of the rural income quintiles, compared with the urban quintiles (in which household income levels tend to be closer to others in the same area).
There was little in the way of overall time trends in our mortality data, but additional analyses adjusting for multiple potential confounding variables, such as changes over time in the types or severity of illness or in the proportion of people living in institutions, would be necessary to clarify this issue.
The mean and median LOS in provincial ICUs were 3.7 and 2.1 days, respectively. The slight increase over the study period in the mean ICU LOS, with no systematic change in the median, indicates an increase in episodes with long LOS. As expected, LOS was shorter for ICU episodes limited to rural ICUs. Surprisingly, ICU LOS varied relatively little with age. On average, patients admitted to ICUs in the Winnipeg DBHs with medical types of acute conditions remained in ICU almost two days longer than those with nonsurgical cardiac or surgical problems.
There were substantial differences in mortality rates for different subsets of ICU patients. While the lower mortality of non–Manitobans was consistent across years, an unknown amount of this difference might be due to the practice of transferring non–Manitobans back to their home provinces to complete their hospital care. Since we lack long–term survival data for non–Manitobans, we cannot assess the influence of this occurrence.

Manitoba Centre for Health Policy 127
The Epidemiology and Outcomes of Critical Illness in Manitoba
Results Part 3: Post–Hospital Resource Use Among Hospital Survivors of Urban ICU Care
As discussed above, we excluded rural–only ICU care from these analyses because patients able to receive all their ICU care in rural ICUs were substantially less sick and had better outcomes than those who received care in the urban ICUs.
Over the nine years, 1999/2000–2007/08, Manitobans aged 17 and older experienced 778,811 non–obstetrical episodes of acute hospital care. Patients in 736,249 (94.54%) of these hospital episodes left the hospital alive. In additional to obstetrical episodes and episodes resulting in death, we excluded from these analysis episodes where death occurred on the day of hospital discharge (681 episodes) and those where the Registry indicated that the Manitoba Health coverage ended prior to the start of the index hospital episode (583 episodes). Thus, we performed further analysis of post–hospital medical resource use on 734,985 hospital episodes, of which (4.28%) contained urban ICU care. For most of this section, we compare annualized resource use after the 31,486 hospital episodes that included urban ICU care versus the 703,499 hospital episodes that did not use such care.
Resource use in the year after urban ICU–containing hospital episodes is shown in Table 5.23. Notable findings include:
• 41% were hospitalized • 10% were readmitted to an ICU • 98% had subsequent outpatient physician visits • 96% used prescription medications with mean annualized pharmacy costs of $2,862 per person • 27% used home care services
Table 5.23: Post–Hospital Medical Resource Use in the 365 days after Hospital Discharge for Hospital Episodes that Contained Urban ICU Care
ParameterPhysician
Visits
Medication Costs
($CAD 2008)
Hospital Days
ICU UseHomecare
Use
Percent with Any 97.8 96.2 40.7 10.4 26.5
Mean 16.7 2,862 15.5 -- --Standard deviation 14.0 4,234 42.6 -- --Median 14.0 2,036 0.0 -- --Interquartile range 9.0-21.0 956-3,527 0.0-9.0 -- --90th percentile 30.0 5,752 41.0 -- --95th percentile 37.0 7,795 87.0 -- --
Source: Manitoba Centre for Health Policy, 2012
Annualized values
Table 5.23: Post-Hospital Medical Resource Use in the 365 days after Hospital Discharge for Hospital Episodes that Contained Urban ICU Care
Includes the 31,486 non-obstetrical hospital episodes during 1999/2000-2007/08 discharged alive from hospital except for Homecare, which was limited to the 24,564 epidosodes during 1999/2000-2005/06Statistics include those with values of zero
Hospitalization requiring urban ICU care led to a substantial increase in home care use (Table 5.24). While 13% (3,299 of 24,564) of these urban ICU survivors were enrolled in home care before hospitalization, 27% (6,517) used such services at some time during the post–hospital year; this 14% increase was more than triple the 4% increase for hospitalized people not admitted to urban ICUs. In addition, 24% of urban ICU survivors who were not using home care at the time of hospitalization used it in the post–hospital year (5,025 of 21,265); the comparable value for those hospitalizations that did not need urban ICU care was significantly lower, though still quite large, at 16% (72,195 of 459,338; p<0.001).

128 University of Manitoba
Specific Aim 5: Outcomes and Post–ICU Resource Use
Table 5.24: Home Care Use in the One Year After Hospital Discharge, as a Function of Home Care Status at the Time of Hospital Admission and Whether or not the Hospital Episode Contained Care in an Urban ICU For those discharged alive from hospital, 1999/2000 through 2005/06
Yes No Total Yes No Total p-value *Number 1,492 1,807 3,299 43,351 51,038 94,389Row Percent 45.23 54.77 100.00 45.93 54.07 100.00Number 5,025 16,240 21,265 72,195 387,143 459,338Row Percent 23.63 76.37 100.00 15.72 84.28 100.00Number 6,517 18,047 24,564 115,546 438,181 553,727Row Percent 26.53 73.47 100.00 20.87 79.13 100.00
Source: Manitoba Centre for Health Policy, 2012
Hospital Episodes with Urban ICU Care
All Other Hospital Episodes
Registered with Home Care at any time During the One
Year after Hospital Discharge
Table 5.24: Home Care Use in the One Year After Hospital Discharge, as a Function of Home Care Status at the Time of Hospital Admission and Whether or not the Hospital Episode Contained Care in an Urban ICU
For those discharged alive from hospital, 1999/2000 through 2005/06
Total <.0001
0.43
<.0001Not Registered with Home Care at Time of Hospital
*p-values (Fisher’s exact test) compare post-hospital use of home care between those with vs. without urban ICU care, according to pre-hospital home care status
Registered with Home Care at any time During the One
Year after Hospital Discharge
Registered with Home Care at Time of Hospital Admission
We also assessed whether ICU care altered people’s ability to live at home versus living in an institution such as a PCH. At the time of hospital admission 1.2% (378 of 31,486) of hospital survivors of urban ICU care were not living at home, while 1.5% (473 of 31,108) who had been living at home prior to hospitalization were not able to return home at hospital discharge (Table 5.25). Three months after hospital discharge, 4.0% (1,249 of 31,486) of hospital survivors of urban ICU care had died and 2.5% (782) were alive but not living at home (Table 5.26). In comparison, among hospitalized people who did not require urban ICU care (Tables 5.25 and 5.26), 2.5% (17,541 of 703,499) were not living at home before hospital admission, 1.7% (11,708 of 685,958) who lived at home pre–hospital were not able to return to home after hospital discharge, 4.3% (30,121 of 703,499) died within three months, and 3.8% (26,825 of 703,499) were no longer living at home at three months. The most obvious difference was a higher rate of those living in an institution three months after hospital discharge for those without, versus with, urban ICU care (3.8% versus 2.5%, respectively); this is mostly attributable to the fact that twice as many (2.5% versus 1.2%) of those without urban ICU care were living in an institution before hospitalization. However, even among those living at home before hospitalization, hospitalized patients not needing urban ICU care had higher rates of living in an institution at three months (2.1% versus 1.6%).
Table 5.25: Comparison of Patients’ Pre–Hospital and Post–Hospital Locations For those discharged alive from hospital, 1999/2000 through 2007/08
Home Not Home Total Home Not Home TotalNumber 30,635 473 31,108 674,250 11,708 685,958Row Percent 98.48 1.52 100 98.29 1.71 100Number s 374 s 102 17,439 17,541Row Percent s s 100 0.58 99.42 100Number s 847 s 674,352 29,147 703,499Row Percent s s 100 95.86 4.14 100
s indicates suppressed due to small numbers Source: Manitoba Centre for Health Policy, 2012
Hospital Episodes with Urban ICU Care
All Other Hospital Episodes
Post-Hospital Location Post-Hospital Location
Table 5.25: Comparison of Patients’ Pre-Hospital and Post-Hospital LocationsFor those discharged alive from hospital, 1999/2000 through 2007/08
Pre-Hospital Location
Not Home
Total
Home

Manitoba Centre for Health Policy 129
The Epidemiology and Outcomes of Critical Illness in Manitoba
Table 5.26: Comparison of Patients’ Locations Pre–Hospital and Three Months Post–Hospital For those discharged alive from hospital, 1999/2000 through 2007/08
Dead Home Not Home Total Dead Home Not Home Total
Number 1,161 29,445 502 31,108 25,376 646,237 14,345 685,958Row Percent 3.73 94.65 1.61 100.00 3.70 94.21 2.09 100.00Number 88 10 280 378 4,745 316 12,480 17,541Row Percent 23.28 2.65 74.07 100.00 27.05 1.80 71.15 100.00Number 1,249 29,455 782 31,486 30,121 646,553 26,825 703,499Row Percent 3.97 93.55 2.48 100.00 4.28 91.91 3.81 100.00
Source: Manitoba Centre for Health Policy, 2012*p-values (Fisher’s exact test) compare post-hospital status between those with vs. without urban ICU care, according to pre-hospital status
Table 5.26: Comparison of Patients’ Locations Pre-Hospital and Three Months Post-HospitalFor those discharged alive from hospital, 1999/2000 through 2007/08
Total
Hospital Episodes with Urban ICU Care All Other Hospital Episodes
Status Three Months Post-Hospital Discharge
Status Three Months Post-Hospital Discharge
Not Home
Pre-Hospital Location
Home
Even before adjustment for confounding variables, resource use after hospitalization depended little on whether patients had been in an urban ICU or not (Table 5.27). Because of the very large sample size, some of these parameters were statistically significantly different despite differences being quite small. For example, 97.8% of survivors of urban ICU care had at least one physician visit in the year post–discharge, compared to 96.7% of those who survived hospitalization that did not include urban ICU care. The largest observed differences were in pharmaceutical costs (mean values of $2,682 versus $2,288) and the proportion readmitted to urban ICUs in the post–hospital year (10.4% versus 2.8%). In contrast, unadjusted annualized use of healthcare resources was substantially larger for those who had been hospitalized than for the general adult population (Table 5.27, Appendix Table A5.19).
Because of the potential for confounding differences in comparing resource use among people whose hospitalizations did versus did not include urban ICU care, we conducted adjusted analyses of some of these parameters. The multivariable regression models of resource use among hospital survivors excluded three hospital episodes that either had invalid postal codes or were missing a most responsible hospital diagnosis. In interpreting these results, it is important to recognize that our large sample size conferred statistical significance on differences that are of little consequence.
The GEE model of outpatient physician visits in the one–year after hospitalization (Appendix Table A5.20) shows that, after adjustment for other variables, hospitalization including urban ICU care was associated with less than one additional yearly physician visit, compared to hospitalized patients without any urban ICU care (p<0.0001). This is less than half the difference in the unadjusted analysis (Table 5.27). Other findings from this model include:
• No difference by sex • Little effect by income quintile among those living at home • Approximately two more physician visits per year for those whose income is unknown (primarily,
those living in institutions) • Surprisingly little independent influence of comorbidities or Most Responsible Hospital Diagnosis
(e.g., an average of 0.5 additional yearly physician visits for those with pre–existing liver disease)
In this model, only the within–person effect of age was statistically significant, indicating that after adjustment for other covariates, a given individual’s rate of physician visits decreased very slightly with subsequent hospitalizations as he/she aged.

130 University of Manitoba
Specific Aim 5: Outcomes and Post–ICU Resource Use
Ta
ble
5.2
7:
C
om
pa
riso
n o
f M
ed
ica
l R
eso
urc
e U
se i
n t
he
On
e Y
ea
r A
fte
r H
osp
ita
l D
isc
ha
rge
Be
twe
en
Ho
spit
al
Ep
iso
de
s th
at
Did
an
d D
id N
ot
In
clu
de
Urb
an
IC
U C
are
Fo
r tho
se d
isch
arge
d al
ive
from
hos
pita
l, 19
99/2
000
thro
ugh
2007
/08
exce
pt fo
r hom
ecar
e us
e, w
hich
incl
udes
199
9/20
00 th
roug
h 20
05/0
6.Ri
ghtm
ost s
ectio
n, fo
r the
ent
ire
adul
t pop
ulat
ion,
is n
ot a
nnua
lized
. Des
crip
tive
stat
istic
s in
clud
e th
ose
with
val
ues
of z
ero.
Pe
rce
nt
Wit
h A
ny
Me
dia
nIQ
RM
ea
nP
erc
en
t
Wit
h A
ny
Me
dia
nIQ
RM
ea
nP
erc
en
t
Wit
h A
ny
Me
an
Ph
ysic
ian
Vis
its
97.8
†14
.0 ‡
9.0-
21.0
16.7
96.7
11.0
6.0-
19.0
14.2
81.7
§5.
3 §
Me
dic
ati
on
Co
sts
*96
.2 †
2,03
6 †
956-
3,52
728
6293
.311
8522
8-29
4522
8871
.9 §
545
§H
osp
ita
l-D
ay
s40
.7 ‡
0.0
‡0.
0-9.
015
.541
.10.
00.
0-10
.017
.07.
7 §
1.0
§U
rba
n I
CU
use
10.4
†--
----
2.8
----
--0.
59 ||
--
Ho
me
ca
re c
ase
use
26.5
†--
----
20.9
----
--1.
9 §
--
*Cos
t in
200
8 C
anad
ian
Dol
laS
ourc
e: M
anito
ba C
entr
e fo
r H
ealth
Pol
icy,
201
† p<
0.00
1, ‡
p>
0.05
, com
pare
d to
com
para
ble
valu
e fo
r ho
spita
l epi
sode
s no
t in
clud
ing
urba
n IC
U c
are
(Fis
her’
s ex
act
test
, t-t
est)
||
Unw
eigh
ted
aver
age
over
199
9/20
00-2
007/
08 o
f ye
arly
rat
es, d
eriv
ed f
rom
dat
a us
ed t
o m
ake
Tabl
e 4.
23
§ Unw
eigh
ted
aver
age
over
199
9/20
00-2
007/
08 o
f ye
arly
rat
es, d
eriv
ed f
rom
pop
ulat
ion
repo
sito
ry (A
ppen
dix
Tabl
e A
5.19
)
Ho
sp
ita
l E
pis
od
es n
ot
Co
nta
inin
g
Urb
an
IC
U C
are
Pa
ram
ete
r(N
=3
1,4
86
; A
nn
ua
lize
d V
alu
es)
(N=
70
3,1
99
; A
nn
ua
lize
d V
alu
es)
Urb
an
IC
U C
on
tain
ing
Ho
sp
ita
l
Ep
iso
de
sA
ll M
an
ito
ba
ns
Ag
ed
17
an
d O
lde
r
SA 5.indd 130 18/04/2012 2:29:12 PM

Manitoba Centre for Health Policy 131
The Epidemiology and Outcomes of Critical Illness in Manitoba
The simpler model including only each individual’s initial hospitalization over the study period (Appendix Table A5.20) also shows that urban ICU care was associated with about one extra physician visit per year among hospital survivors.
The GEE model of one–year post–hospital outpatient pharmaceutical expenditures, which excluded people living in institutions at hospital admission, is shown in Appendix Table A5.21. It indicates no significant difference in outpatient pharmaceutical costs between those who received urban ICU care and those hospitalized patients who did not (difference of $17, p=0.41). Thus, almost all of the $576 difference in means observed in the unadjusted analysis (Table 5.27) can be attributed to identifiable differences between the two groups of patients. Other findings from this model include:
• No difference by sex • Higher outpatient pharmaceutical costs for people living in lower urban income quintiles, but no
consistent rural income quintile effect • Lower outpatient pharmaceutical costs for those discharged to institutions • Higher outpatient pharmaceutical costs among those with certain comorbidities, especially AIDS
and malignancies • Relatively small differences by Most Responsible Hospital Diagnosis
Also, in this model of post–hospital pharmaceutical expenditures, the within–person influence of age on costs was 10–fold higher than the between–person age effect. Specifically a given individual’s pharmaceutical costs increased by $252 for each year of age in subsequent hospitalizations, while among different individuals such costs were only higher by $24 for each year of age difference. In the model limited to initial hospital episodes (Appendix Table A5.21), urban ICU care was associated with $169 higher post–hospital pharmacy costs (p<0.0001).
Because a majority of hospital survivors had no re–hospitalizations in the subsequent year after hospital discharge, we used a zero–inflated model of the number of subsequent hospital–days. This necessitated limiting consideration to each individual’s initial hospital episode during the study period, omitting hospital diagnosis and post–hospital location from the model, and grouping the comorbidities into a smaller number of categories. This kind of model is a special type having two linked parts; one part is a logistic model which approximately indicates whether there were any subsequent hospital days and the other part is a negative binomial model for the number of hospital days, taking account of the fact that many patients had none. The logistic part generates odds ratios, while the negative binomial part generates multiplicative ratios for the number of yearly hospital days.
This model of subsequent hospital use is shown in Appendix Table A5.22. It shows that hospitalizations including time in an urban ICU had significantly higher odds (by 5%) for subsequent hospitalization; but, curiously, the number of hospital days was lower (by a multiplicative factor of 0.81) than for people whose hospital care included time in an urban ICU. It also showed:
• Lower risk of hospital readmission with longer survival after the index hospital episode • Men had slightly lower likelihood for readmission and, among those that had readmissions, men had
slightly fewer hospital days in the year after hospital discharge • Rural residents were more likely to be readmitted • A number of comorbidities were highly associated with greater need for hospital care during the
year after discharge from the index hospitalization

132 University of Manitoba
Specific Aim 5: Outcomes and Post–ICU Resource Use
Summary and discussion of Results Part 3While medical resource use in the year following urban ICU care was substantial, it differed surprisingly little from that of hospitalized people who did not require ICU care. These differences were even smaller after adjustment for patient and illness characteristics. Likewise, while survivors of urban ICU care had increased use of home care and living in PCHs, these increases were not larger than for hospitalized adults in general. The most notable difference in post–hospital resource use between those whose index hospitalization did versus did not include urban ICU care was that the those that included urban ICU care had four–fold higher use of subsequent urban ICU care.
Manitoba Centre for Health Policy 133
The Epidemiology and Outcomes of Critical Illness in Manitoba
Specific Aim 6: Assessing for Disparities in Rates of ICU Care
Statement of the Specific AimFurther exploration of the differences in population–based rates of ICU care by sex, age, residency location, and SES with the goal of assessing for disparities in rates of ICU care.
Summary of the Specific AimIn this Specific Aim, we created a new way of looking at ICU use as the rate of ICU care relative to the number of persons who “should” have been admitted to ICUs, what we have called the Estimated ICU Admission Pool (EIAP). Since the ICU Admission Pool is derived from the number of people who developed critical illness, we refer to the new type of rate as the critical illness–based rate of ICU care. We compared critical illness–based rates to the usual population–based rates of ICU care. Because most patients in the rural ICUs in Manitoba would be cared for on regular wards in the urban hospitals, we limited consideration to those admitted to the urban ICUs.
The purpose of developing this new measure was to assess for disparities in ICU use between groups, e.g., men versus women. The fundamental problem with using the standard population–based rates of medical care to evaluate for disparities in use is that they cannot account for differences in the need for care between groups; our construct of critical illness–based rates of ICU care is a better way of adjusting for such differences.
Using this new method, we showed that the substantially higher population–based rate of ICU care for men versus women was largely eliminated when using the more appropriate critical illness–based rates. Accordingly, concern about a sex–related disparity in ICU care is greatly reduced by this finding.
Turning our attention to differences in rates of ICU care by income quintile, critical illness–based rates provided a different picture compared to population–based rates. While the population–based rates of ICU care were higher for those in lower income quintiles, the critical illness–based rates showed the opposite relationship, being somewhat lower among those in lower income quintiles. This finding is consistent with previous research from MCHP which documented lower use of diagnostic imaging among those in lower income quintiles (Demeter, Reed, Lix, MacWilliam, & Leslie, 2005). Also, while people living in PCHs and other institutions had the highest population–based use of ICU care, they had the lowest critical illness–based use.
Lastly, looking at differences by residency location, we found that while urban and rural residents did not differ consistently in their population–based rates of urban ICU care, critical illness–based rates were consistently lower for rural residents. Although this could be related to the long travel distances between rural and urban parts of the province, one might then expect a gradient with the most distant Northern areas having the lowest rates, which was not seen. It is relevant to bear in mind that this analysis involved only use of urban ICUs, so rural residents’ use of rural ICU beds would reduce this gap.
In interpreting the observed disparities between groups in critical illness–based rates of ICU care, it is important to recognize that such findings could be due to any combination of: insufficient use of ICU care in groups with lower rates, excessive use of ICU care in groups with higher rates, and limited ability of our analyses to properly account for important confounding factors. While our findings raise concerns about the lower rates of urban ICU use by rural residents and those living in low–income areas, they do not permit us to identify the explanation(s) for these findings.
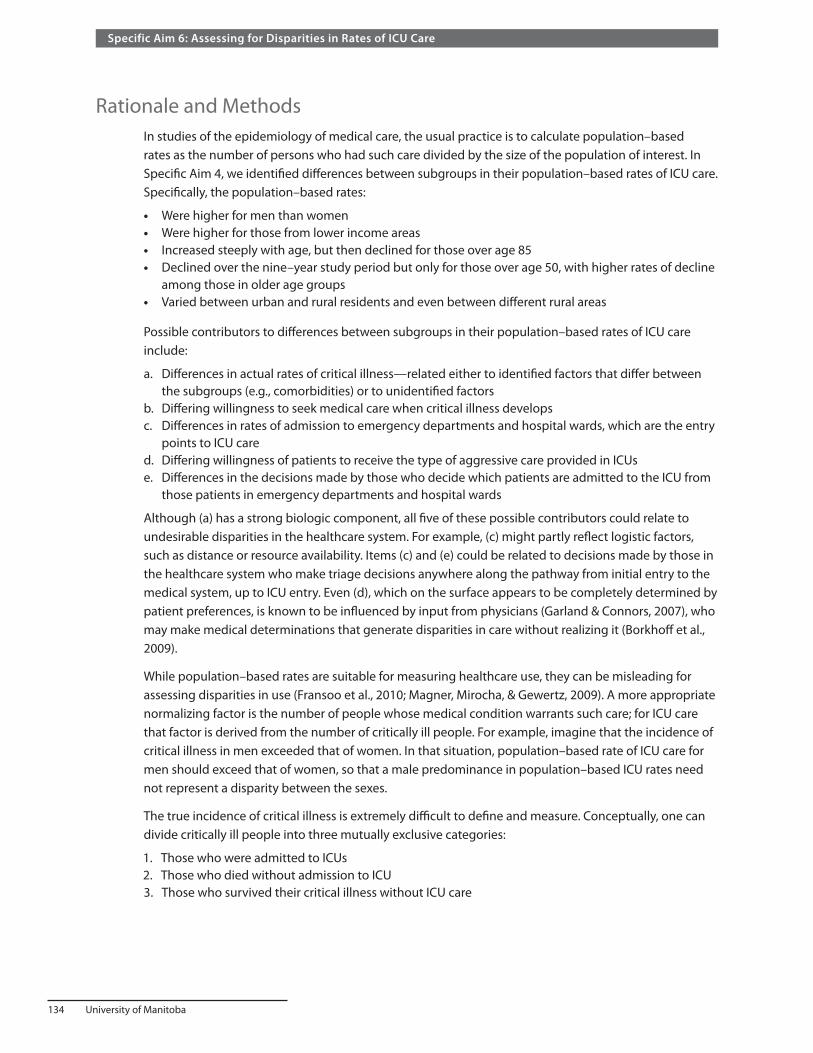
134 University of Manitoba
Specific Aim 6: Assessing for Disparities in Rates of ICU Care
Rationale and MethodsIn studies of the epidemiology of medical care, the usual practice is to calculate population–based rates as the number of persons who had such care divided by the size of the population of interest. In Specific Aim 4, we identified differences between subgroups in their population–based rates of ICU care. Specifically, the population–based rates:
• Were higher for men than women • Were higher for those from lower income areas • Increased steeply with age, but then declined for those over age 85 • Declined over the nine–year study period but only for those over age 50, with higher rates of decline
among those in older age groups • Varied between urban and rural residents and even between different rural areas
Possible contributors to differences between subgroups in their population–based rates of ICU care include:
a. Differences in actual rates of critical illness—related either to identified factors that differ between the subgroups (e.g., comorbidities) or to unidentified factors
b. Differing willingness to seek medical care when critical illness developsc. Differences in rates of admission to emergency departments and hospital wards, which are the entry
points to ICU care d. Differing willingness of patients to receive the type of aggressive care provided in ICUse. Differences in the decisions made by those who decide which patients are admitted to the ICU from
those patients in emergency departments and hospital wards
Although (a) has a strong biologic component, all five of these possible contributors could relate to undesirable disparities in the healthcare system. For example, (c) might partly reflect logistic factors, such as distance or resource availability. Items (c) and (e) could be related to decisions made by those in the healthcare system who make triage decisions anywhere along the pathway from initial entry to the medical system, up to ICU entry. Even (d), which on the surface appears to be completely determined by patient preferences, is known to be influenced by input from physicians (Garland & Connors, 2007), who may make medical determinations that generate disparities in care without realizing it (Borkhoff et al., 2009).
While population–based rates are suitable for measuring healthcare use, they can be misleading for assessing disparities in use (Fransoo et al., 2010; Magner, Mirocha, & Gewertz, 2009). A more appropriate normalizing factor is the number of people whose medical condition warrants such care; for ICU care that factor is derived from the number of critically ill people. For example, imagine that the incidence of critical illness in men exceeded that of women. In that situation, population–based rate of ICU care for men should exceed that of women, so that a male predominance in population–based ICU rates need not represent a disparity between the sexes.
The true incidence of critical illness is extremely difficult to define and measure. Conceptually, one can divide critically ill people into three mutually exclusive categories:
1. Those who were admitted to ICUs2. Those who died without admission to ICU3. Those who survived their critical illness without ICU care

Manitoba Centre for Health Policy 135
The Epidemiology and Outcomes of Critical Illness in Manitoba
Comments are necessary about each of these. First, although we often consider that ICU admission is synonymous with critical illness, there is a high degree of variation in the threshold for admission to different ICUs. For example, while there would likely be a consensus among intensivists that a person needing invasive mechanical ventilator support for severe pneumonia is critically ill and “needs” ICU care, such a consensus would be less likely for a patient needing noninvasive mechanical ventilator support for a mild exacerbation of smoking–related lung disease. Our own data (Specific Aim 4) shows that patients in rural ICUs in Manitoba are, on average, much less severely ill than are those in the urban ICUs, suggesting that many people admitted to rural ICUs would be cared for on regular wards in the urban hospitals. Because there are no well–accepted thresholds for ICU admission and ICUs differ substantially in the severity of illness needed to gain entry, there is no well–accepted, comprehensive definition of what constitutes critical illness. Accordingly, we chose to operationally accept that a patient was critically ill if he/she was admitted to one of the urban ICUs in Manitoba.
Second is the concept that all deaths are associated with critical illness, though it may be very brief (e.g., a person who suffered death outside the hospital from trauma or an acute coronary event). We consider it justifiable to consider these as cases of critical illness by recognizing that if such a person, rather than being dead at the time of discovery, had instead been close to death when discovered, they might well have survived long enough to be admitted to an ICU.
We can accurately quantify categories (1) and (2) of critically ill people using available databases, but category (3), those who survived critical illness without ICU care, is problematic. It comprises two subsets of people: those who developed critical illness and survived with medical care provided outside of an ICU (e.g., on regular hospital wards) and those whose critical illness resolved without any medical care. The latter subgroup is likely extremely small, but survival rates may not be trivial for some severely ill patients cared for entirely on regular hospital wards (Sinuff, Kahnamoui, Cook, Luce, & Levy, 2004). Unfortunately, our data does not provide a way to estimate the number of people who survived critical illness without any ICU care, in regular hospital wards or elsewhere.
An important concern in developing a normalizing factor for assessing disparities in ICU use is whether and how to limit consideration to people who “should” have been admitted to those ICUs. Operationally, this amounts to excluding those who were not candidates for ICU care from the subset who died without ICU care (category #2, above). This includes those who:
a. Died so quickly that there was not time to get to an ICUb. Died and did not desire ICU care—including but not limited to those in palliative care programsc. Died and might have desired ICU care, but were not accepted into ICU by those who make ICU
admitting decisions
While for our purpose it does seem desirable to limit consideration to people who “should” have been admitted to ICUs, there is a potential disadvantage of doing so. Excluding any of subgroups (a)–(c) eliminates the chances of identifying disparities that can influence those issues. For example, people who live in remote communities may have less access to timely care for catastrophic illness of rapid onset, which results in a higher rate of death before being able to access medical care. Additionally patients’ decisions that they do not desire life–supporting care is substantially influenced by their physicians (Garland & Connors, 2007), who sometimes make treatment determinations biased by factors such as sex without realizing it (Borkhoff et al., 2009).

136 University of Manitoba
Specific Aim 6: Assessing for Disparities in Rates of ICU Care
Of the three subgroups (a)–(c), we have no information that allows us to estimate the size of subgroup (c). Although we can estimate subgroup (b) from palliative care codes within the provincial health data repository, this misses individuals not desiring ICU care who were not enrolled in formal palliative care programs and has potential for biases and other limitations (Downar, Sibbald, & Lazar, 2010). Finally, we can estimate the size of subgroup (a) from information supplied by Manitoba’s Department of Emergency Medical Services (EMS) (Brenda Gregory, personal communication, 2011). Their analysis indicated that, in 2009, there were 838 EMS calls in which the patient was dead at the scene. This is 8.7% of the 9,666 Manitobans who died in 2007/08 without admission to urban ICUs (Appendix Table A6.1, final row). However, this estimate does not take account of people who died after EMS arrived on the scene but before they could get to an ICU and those deaths for whom EMS were never called at all. Because EMS is not linked with the ICU or hospital abstract databases, we were not able to exclude such “dead on arrival” patients from our analysis of the incidence rates of critical illness.
Understanding these limitations, and recognizing that most people admitted to rural ICUs would be cared for on regular wards in urban hospitals, we developed a new normalizing factor for the purpose of assessing disparities in ICU use, calculated as the sum of:
• Persons who were admitted to an urban ICU in that year • Those who died in that year without being admitted to an urban ICU, excluding deaths for people
known to be in palliative care in the two years prior to death
This factor is designed to estimate the number of critically ill people in that year who “should” have been admitted to the urban ICUs which are high–intensity and full–service. We call this sum the Estimated ICU Admission Pool (EIAP). As detailed above, the EIAP is only an estimate of the number of potential ICU patients because it:
• Includes people who died before they were able to get to an urban ICU • Includes those who died and had not desired ICU care, but were not enrolled in a formal palliative
program • Excludes those who survived critical illness without urban ICU care
Though imperfect, the face validity of the EIAP makes it superior to the population size as a normalizing factor to assess for disparities in ICU use. Dividing the number of patients admitted to urban ICUs by the EIAP produces a new kind of rate, which approximates the proportion of ICU–appropriate critically ill patients who were admitted to urban ICUs. Because the EIAP is a modified version of the incidence of critical illness, we will refer to this ratio as the critical illness–based rate of ICU care.
For calculation of the EIAP, we identified those in palliative care either during hospitalization or in the community. Palliative care in hospital was identified by the presence of hospital diagnosis codes (ICD–9–CM code V66.7, ICD–10–CA code Z51.5) or Manitoba hospital abstract service codes indicating primary responsibility for hospital care under the palliative care service. Outpatient palliative care was identified by presence of palliative care codes in the Long–Term Care database or identification in the DPIN database of medication payment under the palliative care program.
We compared three different rates of urban ICU care generated by forming the quotient of urban ICU care with three different normalizing denominators:
1. Provincial population counts—resulting in urban ICU use per 1,000 population, called the population–based rates of urban ICU care
2. Provincial counts of non–obstetrical hospitalization—resulting in ICU use per 100 people hospitalized for reasons other than childbirth, called the hospitalization–based rates of urban ICU care

Manitoba Centre for Health Policy 137
The Epidemiology and Outcomes of Critical Illness in Manitoba
3. The EIAP—resulting in ICU use per 100 people who experienced ICU–appropriate critical illness, called the critical illness–based rates of urban ICU care
These yearly rates were calculated at the level of individuals each year. We calculated the second of these quotients to allow for comparison with previously published data that used that parameter (Dodek et al., 2009).
Because of the possibility of systematic differences in age between subgroups, we report age–adjusted rates of ICU care. Age–adjusted rates were calculated by the method of direct age adjustment with the general Manitoba population of 2007/08 as reference. For statistical comparisons between subgroups, we used regression modelling of urban ICU care with the independent variables being the subgroups of interest and categorized age. For a given subgroup analysis, we included data from the entire study period into a single regression model. In these models, the overall p–value of the variable representing the subgroup(s) of interest represents the age–adjusted difference in rates of urban ICU care.
ResultsWhile one of the two major portions of the EIAP were people who died without having experienced urban ICU care, we excluded such people if they were in palliative care. This exclusion was substantial—by 2007/08 almost one–third of those who died were in palliative care programs (Appendix Table A6.1). The lower proportion of identified palliative care among the most elderly dying patients likely reflects limitations on aggressive medical therapy without formal identification of having been in palliative care, which is one of the inaccuracies of our ability to exclude all people who were not candidates for urban ICU care.
The size of the EIAP increased rapidly with age (Appendix Table A6.2). The proportion of this pool that died without urban ICU care declined with age until 50, remaining fairly constant at approximately 35% until it then started to increase again after age 65; 90% of such people 85 and older were not admitted to urban ICUs.
To evaluate for disparities in ICU care by sex, we evaluated the three different rates of urban ICU care by sex and age (Table 6.1, Figures 6.1–6.3). The three graphs show important differences. Population–based rates of urban ICU care dramatically increased with age up to 80 for both sexes, and then plateaued or declined (Figure 6.1). Similarly, hospitalization–based rates of urban ICU care increased steeply with age and began to decrease after 65 for men and 75 for women (Figure 6.2). In contrast, critical illness–based rates of urban ICU care had a very different shape, remaining relatively flat until they began to decline after 60 for both sexes (Figure 6.3).
The male to female ratios of these different rates of urban ICU care help clarify these data (Table 6.1, Figure 6.4). When compared to the population, or to hospitalized people, men substantially outnumbered women in urban ICUs. While this might suggest a disparity in ICU care between men and women, a more appropriate representation emerges from evaluating the fraction of the ICU Admission Pool who were admitted to urban ICUs. When assessed relative to this estimate of the number of critically ill people who “should” have been admitted to urban ICUs, the excess of men suggested by the other two parameters almost entirely disappears. With the more appropriate normalization:
• 15–19% more women than men were admitted to urban ICUs for those aged 17–34 • Men and women aged 35–80 were admitted in nearly equal proportions • As age increased above 80, a small but increasing number of men compared to women were
admitted to urban ICUs
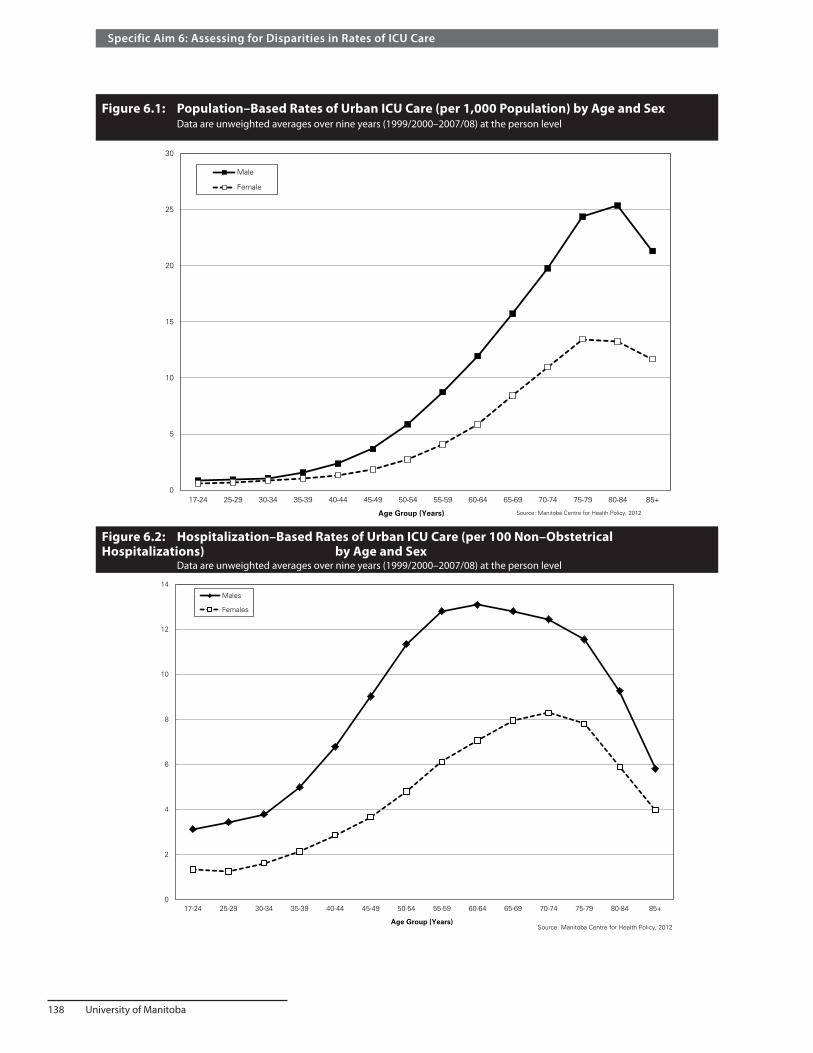
138 University of Manitoba
Specific Aim 6: Assessing for Disparities in Rates of ICU Care
Figure 6.1: Population–Based Rates of Urban ICU Care (per 1,000 Population) by Age and Sex Data are unweighted averages over nine years (1999/2000–2007/08) at the person level
0
5
10
15
20
25
30
17-24 25-29 30-34 35-39 40-44 45-49 50-54 55-59 60-64 65-69 70-74 75-79 80-84 85+
Male
Female
Age Group (Years)
Rat
e p
er 1
,000
po
pu
lati
on
Source: Manitoba Centre for Health Policy, 2012
Figure 6.2: Hospitalization–Based Rates of Urban ICU Care (per 100 Non–Obstetrical Hospitalizations) by Age and Sex Data are unweighted averages over nine years (1999/2000–2007/08) at the person level
0
2
4
6
8
10
12
14
17-24 25-29 30-34 35-39 40-44 45-49 50-54 55-59 60-64 65-69 70-74 75-79 80-84 85+
Males
Females
Age Group (Years)Source: Manitoba Centre for Health Policy, 2012
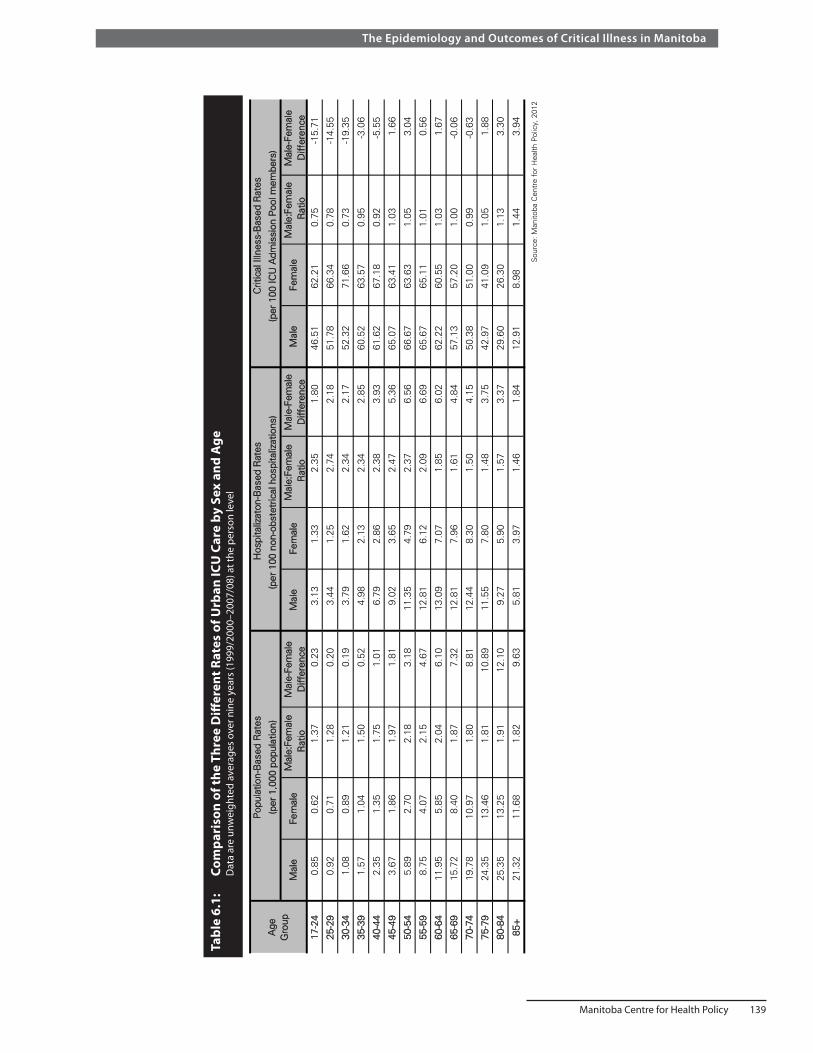
Manitoba Centre for Health Policy 139
The Epidemiology and Outcomes of Critical Illness in Manitoba
Tabl
e 6.
1:
Com
pari
son
of th
e Th
ree
Diff
eren
t Rat
es o
f Urb
an IC
U C
are
by S
ex a
nd A
ge
Dat
a ar
e un
wei
ghte
d av
erag
es o
ver n
ine
year
s (1
999/
2000
–200
7/08
) at t
he p
erso
n le
vel
Mal
e:Fe
mal
eM
ale-
Fem
ale
Mal
e:Fe
mal
eM
ale-
Fem
ale
Mal
e:Fe
mal
eM
ale-
Fem
ale
Rat
ioD
iffer
ence
Rat
ioD
iffer
ence
Rat
ioD
iffer
ence
17-2
40.
850.
621.
370.
233.
131.
332.
351.
8046
.51
62.2
10.
75-1
5.71
2 5-2
90.
920.
711.
280.
203.
441.
252.
742.
1851
.78
66.3
40.
78-1
4.55
3 0-3
41.
080.
891.
210.
193.
791.
622.
342.
1752
.32
71.6
60.
73-1
9.35
3 5-3
91.
571.
041.
500.
524.
982.
132.
342.
8560
.52
63.5
70.
95-3
.06
4 0-4
42.
351.
351.
751.
016.
792.
862.
383.
9361
.62
67.1
80.
92-5
.55
4 5-4
93.
671.
861.
971.
819.
023.
652.
475.
3665
.07
63.4
11.
031.
66
5 0-5
45.
892.
702.
183.
1811
.35
4.79
2.37
6.56
66.6
763
.63
1.05
3.04
5 5-5
98.
754.
072.
154.
6712
.81
6.12
2.09
6.69
65.6
765
.11
1.01
0.56
6 0-6
411
.95
5.85
2.04
6.10
13.0
97.
071.
856.
0262
.22
60.5
51.
031.
67
6 5-6
915
.72
8.40
1.87
7.32
12.8
17.
961.
614.
8457
.13
57.2
01.
00-0
.06
7 0-7
419
.78
10.9
71.
808.
8112
.44
8.30
1.50
4.15
50.3
851
.00
0.99
-0.6
3
7 5-7
924
.35
13.4
61.
8110
.89
11.5
57.
801.
483.
7542
.97
41.0
91.
051.
88
8 0-8
425
.35
13.2
51.
9112
.10
9.27
5.90
1.57
3.37
29.6
026
.30
1.13
3.30
8 5+
21.3
211
.68
1.82
9.63
5.81
3.97
1.46
1.84
12.9
18.
981.
443.
94
Sou
rce:
Man
itoba
Cen
tre
for
Hea
lth P
olic
y, 2
012
Fem
ale
Tabl
e 6.
1: C
ompa
rison
of
the
Thre
e D
iffer
ent
Rat
es o
f U
rban
ICU
Car
e by
Sex
and
Age
D
ata
are
unw
eigh
ted
aver
ages
ove
r ni
ne y
ears
(199
9/20
00-2
007/
08) a
t th
e pe
rson
leve
l
Hos
pita
lizat
on-B
ased
Rat
esC
ritic
al Il
lnes
s-B
ased
Rat
es
(per
100
ICU
Adm
issi
on P
ool m
embe
rs)
(per
100
non
-obs
tetr
ical
hos
pita
lizat
ions
)(p
er 1
,000
pop
ulat
ion)
Pop
ulat
ion-
Bas
ed R
ates
Age
Gro
upM
ale
Fem
ale
Mal
eFe
mal
eM
ale
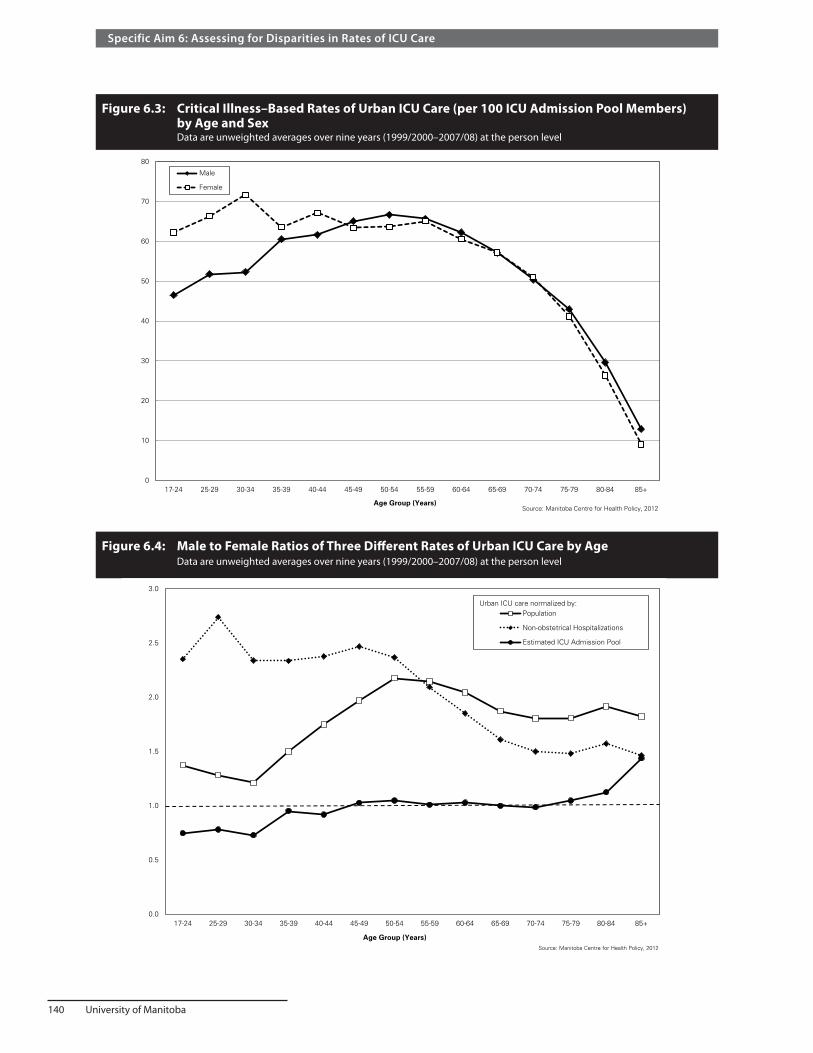
140 University of Manitoba
Specific Aim 6: Assessing for Disparities in Rates of ICU Care
Figure 6.3: Critical Illness–Based Rates of Urban ICU Care (per 100 ICU Admission Pool Members) by Age and Sex Data are unweighted averages over nine years (1999/2000–2007/08) at the person level
Figure 6.4: Male to Female Ratios of Three Different Rates of Urban ICU Care by Age Data are unweighted averages over nine years (1999/2000–2007/08) at the person level
0
10
20
30
40
50
60
70
80
17-24 25-29 30-34 35-39 40-44 45-49 50-54 55-59 60-64 65-69 70-74 75-79 80-84 85+
Male
Female
Age Group (Years)Source: Manitoba Centre for Health Policy, 2012
0.0
0.5
1.0
1.5
2.0
2.5
3.0
17-24 25-29 30-34 35-39 40-44 45-49 50-54 55-59 60-64 65-69 70-74 75-79 80-84 85+
Population
Non-obstetrical Hospitalizations
Estimated ICU Admission Pool
Age Group (Years)Source: Manitoba Centre for Health Policy, 2012
Urban ICU care normalized by:

Manitoba Centre for Health Policy 141
The Epidemiology and Outcomes of Critical Illness in Manitoba
Figure 6.5: Age–Adjusted Comparison of Population–Based Rates of Urban ICU Care by Income Quintile Data are unweighted averages over nine years of data (1999/2000––2007/08) at the person levels
Next we assessed for disparities in urban ICU care by average household income. We see (Figure 6.5, Appendix Table A6.3) that age–adjusted, population–based rates of urban ICU care:
• Declined with rising income • Were generally higher for urban than for rural residents • Were highest among those with unknown income, which largely comprise residents of institutions
including PCHs
However, ICU care relative to the proportion of the EIAP (Figure 6.6, Appendix Table A6.3) provides substantially different messages, showing:
• Higher age–adjusted rates of urban ICU care among those living in areas with higher average household income
• People living in institutions had the lowest rate of such care • Higher rates of urban ICU care for urban than rural residents
Finally, we used assessed urban ICU use by residency location (Table 6.2). Population–based rates of urban ICU care varied substantially by location. Those living in the North had the highest rates, followed by those living in Urban areas; those in the Mid and South Rural areas had much lower population–based rates. However, rates of urban ICU care among those in the ICU Admission Pool were significantly lower for residents in all three rural areas than for those living in urban areas.
0
2
4
6
8
10
12
14
Urban 1(lowest)
Urban 2 Urban 3 Urban 4 Urban 5(highest)
Rural 1(lowest)
Rural 2 Rural 3 Rural 4 Rural 5(highest)
IncomeUnknown
Income Quintile (Average Household Income)
Rat
e o
fU
rban
ICU
Car
e p
er 1
,000
Po
pu
lati
on
Figure 6.5: Age-adjusted Comparison of Population-Based Rates of Urban ICU care, by Income QuintileData are unweighted averages over nine years (1999/2000-2007/08)
*p<0.0001, within urban or rural quintiles, by grouped negative binomial regression model of urban ICU care, adjusting for categorized age, over all nine years, 1999/00-2007/08
Source: Manitoba Centre for Health Policy, 2012
**
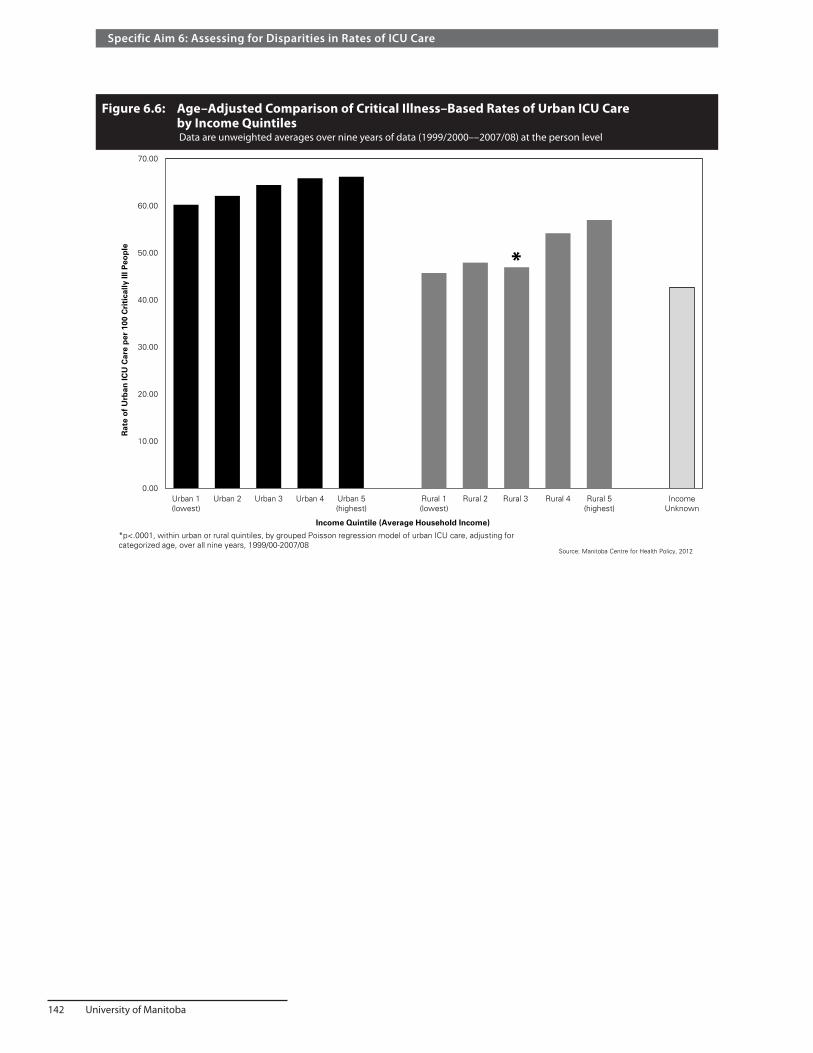
142 University of Manitoba
Specific Aim 6: Assessing for Disparities in Rates of ICU Care
Figure 6.6: Age–Adjusted Comparison of Critical Illness–Based Rates of Urban ICU Care by Income Quintiles Data are unweighted averages over nine years of data (1999/2000––2007/08) at the person level
0.00
10.00
20.00
30.00
40.00
50.00
60.00
70.00
Urban 1(lowest)
Urban 2 Urban 3 Urban 4 Urban 5(highest)
Rural 1(lowest)
Rural 2 Rural 3 Rural 4 Rural 5(highest)
IncomeUnknown
Income Quintile (Average Household Income)
Rat
e o
fU
rban
ICU
Car
e p
er 1
00 C
riti
cally
Ill P
eop
leFigure 6.6: Age-Adjusted Comparison of Critical Illness-Based Rates of Urban ICU Care by Income Quintiles
Data are unweighted averages over nine years of data (1999/2000--2007/08) at the person level
*p<.0001, within urban or rural quintiles, by grouped Poisson regression model of urban ICU care, adjusting for categorized age, over all nine years, 1999/00-2007/08
Source: Manitoba Centre for Health Policy, 2012
*

Manitoba Centre for Health Policy 143
The Epidemiology and Outcomes of Critical Illness in Manitoba
Tabl
e 6.
2:
Age
–Adj
uste
d Co
mpa
riso
n of
the
Thre
e D
iffer
ent R
ates
of U
rban
ICU
Car
e by
Res
iden
cy L
ocat
ion
and
Year
D
ata
are
at th
e pe
rson
leve
l
Rur
alR
ural
Rur
alS
outh
Sou
thS
outh
1999
/00
3.63
3.67
6.15
5.61
3.29
3.44
4.03
6.96
50.3
045
.68
47.3
759
.33
2 000
/01
3.64
4.00
6.53
5.81
3.50
3.85
4.53
7.28
49.4
147
.77
48.9
261
.23
2 001
/02
3.46
3.66
6.59
5.49
3.34
3.74
4.62
7.21
50.4
647
.54
51.8
061
.01
2 002
/03
3.10
3.35
5.04
5.19
3.20
3.48
3.67
7.17
50.1
846
.50
46.6
961
.39
2 003
/04
3.05
3.59
5.68
4.97
3.25
3.67
4.01
6.83
49.9
549
.13
47.5
060
.91
2 004
/05
2.79
3.77
5.19
4.90
3.26
4.17
3.62
7.21
49.4
251
.40
45.5
059
.99
2 005
/06
3.02
3.57
5.85
4.73
3.48
3.82
4.00
7.25
54.7
347
.19
48.6
161
.67
2 006
//07
3.03
3.38
5.98
4.69
3.82
3.73
4.28
7.36
54.0
849
.56
51.8
465
.36
2 007
/08
3.34
4.06
5.93
4.70
3.97
4.37
4.23
7.86
54.0
249
.26
50.8
063
.47
Unw
eigh
ted
aver
age
p-va
lue
1999
/00
0.65
0.65
1.10
10.
470.
490.
581
0.85
0.77
0.80
12 0
00/0
10.
630.
691.
121
0.48
0.53
0.62
10.
810.
780.
801
2 001
/02
0.63
0.67
1.20
10.
460.
520.
641
0.83
0.78
0.85
12 0
02/0
30.
600.
650.
971
0.45
0.49
0.51
10.
820.
760.
761
2 003
/04
0.61
0.72
1.14
10.
480.
540.
591
0.82
0.81
0.78
12 0
04/0
50.
570.
771.
061
0.45
0.58
0.50
10.
820.
860.
761
2 005
/06
0.64
0.75
1.24
10.
480.
530.
551
0.89
0.77
0.79
12 0
06//0
70.
650.
721.
281
0.52
0.51
0.58
10.
830.
760.
791
2 007
/08
0.71
0.86
1.26
10.
510.
560.
541
0.85
0.78
0.80
1U
nwei
ghte
dav
erag
eS
ourc
e: M
anito
ba C
entr
e fo
r H
ealth
Pol
icy,
201
2
Tabl
e 6.
2:
Age
-Adj
uste
d C
ompa
rison
of
the
Thre
e D
iffer
ent
Rat
es o
f U
rban
ICU
Car
e by
Res
iden
cy L
ocat
ion
and
Yea
r D
ata
are
at t
he p
erso
n le
vel
Fisc
al Y
ear
Val
ues
from
abo
ve, e
xpre
ssed
as
a fr
actio
n of
the
Urb
an v
alue
0.63
0.72
1.15
10.
480.
530.
571
0.83
0.78
0.79
1
48.7
861
.60
<.0
001
<.0
001
0.00
3
3.81
4.11
7.24
51.3
948
.22
3.23
3.67
5.88
5.12
3.46
Crit
ical
Illn
ess-
Bas
ed R
ates
(per
100
ICU
Adm
issi
on P
ool
mem
bers
)
Mid
Nor
thU
rban
Mid
Nor
thU
rban
Mid
Nor
thU
rban
Pop
ulat
ion-
Bas
ed R
ates
(per
1,0
00 p
opul
atio
n)H
ospi
taliz
aton
-Bas
ed R
ates
(per
100
non
-obs
tetr
ical
hosp
italiz
atio
ns)

144 University of Manitoba
Specific Aim 6: Assessing for Disparities in Rates of ICU Care
Discussion In this Specific Aim, we created and evaluated a new way of looking at ICU use as the rate of ICU care relative to the number of persons who “should” have been admitted to ICUs—what we have called the Estimated ICU Admission Pool (EIAP). Since the EIAP is derived from the number of people who developed critical illness, we refer to the new type of rate as the critical illness–based rate of ICU care. We compared critical illness–based rates to the usual population–based rates of ICU care. Because most patients in rural ICUs in Manitoba would be cared for on regular wards in the urban hospitals, we limited consideration to those admitted to the urban ICUs.
The purpose of developing this new measure was to better assess for disparities in ICU use between groups, e.g., men versus women. The fundamental problem with using population–based rates of medical care to evaluate for such disparities is that they cannot account for differences in need for care between groups. For example, the higher population–based rates of cardiac interventions among men does not represent a disparity because it can be accounted for by the higher rates of cardiac disease in men (Fransoo et al., 2010). Our construct of critical illness–based rates of ICU care follows the same principle.
While our analysis found similar critical illness–based rates of urban ICU care for men and women age 35 to 80, there were differences in both younger and older age groups. We can speculate about the explanation for the observed differences at the extremes of age. The higher proportion of critically ill women than men in the youngest age groups who received care in urban ICUs might reflect an excess of traumatic or violence–related out of hospital deaths that occurred among men. This is consistent with data indicating that 70% of trauma deaths in Canada are men and that one–quarter of trauma deaths occur before hospital admission (Anderson & Smith, 2005; Canadian Institute for Health Information, 2010). A speculative but plausible explanation for the male predominance of urban ICU patients in the oldest age groups could be that widowed people are less likely to desire aggressive or invasive medical care. Since women generally outlive men, more elderly women are widows and such a phenomenon would generate the observed effect; this would be consistent with other data showing differences in healthcare use relating to widowhood (Christakis & Iwashyna, 1998; Christakis & Iwashyna, 2003; Elwert & Christakis, 2008; Iwashyna & Christakis, 2003; Weitzen, Teno, Fennell, & Mor, 2003).
The high population–based rate of urban ICU care for those in long–term care facilities probably reflects their generally high amounts of chronic and acute illness; while their lower critical illness–based rate likely reflects philosophical decisions, outside of formal palliative care programs, to limit use of aggressive, life supporting medical therapies in this elderly, debilitated population.
It is important to recognize that observed differences between groups in critical illness–based rates of ICU care have three possible explanations, which are not mutually exclusive. 1. Groups with lower rates may have received insufficient ICU care for their needs. 2. Groups with higher rates could have been admitted to ICUs more frequently than was necessary or
appropriate. 3. Our new normalizing factor for calculating these rates, the EIAP, could fail to account for important
confounding factors. While we believe that the face validity of this new type of rate makes it a superior method for identifying disparities in ICU use, we recognize that there is no perfect way to identify the true number of people who “should” have been admitted to the urban ICUs.
Furthermore, our methods cannot distinguish between inadequate use for one group and excessive use for another. While our findings raise concerns about the lower critical illness–based rates of urban ICU use by rural residents and those living in low–income areas, they do not permit us to identify the explanation(s) for these findings.

Manitoba Centre for Health Policy 145
The Epidemiology and Outcomes of Critical Illness in Manitoba
We tried to exclude critically ill people who were not candidates for urban ICU care from the EIAP. While there is good rationale behind this effort, it is fraught with difficulties and potential biases. One problem is the likelihood that some people were not candidates because they had inadequate ICU access. For example, out of hospital death in remote geographic regions can, in part, reflect problems with ready access to advanced care. Also patients’ decisions that they do not desire life–supporting care is influenced by physicians (Garland & Connors, 2007), and it has been shown that physicians may make biased determinations without realizing it (Borkhoff et al., 2009). Also, ICU triage decisions made independently by the ICU gatekeepers are highly subjective. Thus our estimate of the ICU Admission Pool as those who “should” have been admitted to urban ICUs is imperfect. However, compared to population–based rates, it is a superior way of assessing for disparities in ICU care. The finding that this new normalizing factor virtually eliminated the sex–related difference in population–based rates of urban ICU care is empiric evidence of the value of this new approach.
Our analysis of sex–related rates of urban ICU care based on the new normalizing factor diverge importantly from most prior studies, and our own findings, that men have higher population–based rates of ICU use than do women (Dodek et al., 2009; Fowler et al., 2007; Laupland, 2004; Seferian & Afessa, 2006; Valentin et al., 2003). The results based on population–based rates are often interpreted as indicating a disparity in access for women. However, our findings that critically ill men and women have essentially equivalent critical illness–based rates of urban ICU care argues against such disparity, similar to the analysis of cardiac care by Fransoo et al. (2010).
We also calculated sex–specific rates of urban ICU care normalized to the sex ratio of non–obstetrical hospitalized patients in order to make comparison with the work of Dodek et al. (2009). In their data, the male predominance of population–based rates of ICU care was substantially reduced when taking account of the excess of men admitted to British Columbia hospitals. Similar analysis of our data did not find such an effect.
The new analysis of ICU use by SES also alters conclusions about ICU use. While the population–based rates indicate higher urban ICU use among those from lower income areas, the critical illness–based rates show the reverse—lower urban ICU use by those from lower income areas. Another finding is that while the institutionalized group (mostly PCH residents) had the highest population–based rate of urban ICU care, they had the lowest critical illness–based rate. The high population–based rate of ICU care is consistent with the fact that people in this group are generally elderly and debilitated and accordingly suffer a high rate of serious acute illness. However, their low critical illness–based rate of urban ICU care likely relates to decisions made to limit aggressive medical care and eschew ICUs.
Our new analysis also shows that critically ill rural residents had lower critical illness–based rates of urban ICUs. While this finding suggests the presence of disparity, it could be confounded by the fact that we excluded ICU care provided in the nine rural hospitals with ICUs. Our rationale for that exclusion was sound: most rural ICU patients are not critically ill by the standards of the high–intensity (urban) centres. However, some rural ICU patients are critically ill, and our inability to tease out that subset accounts for some of the systematically lower critical illness–based rates of ICU care among rural residents.
We also evaluated, but have not shown the data for, a simpler alternative to our use of the estimated incidence of critical illness—normalizing by the number of deaths in the population, which has been used to evaluate medical resource use for critically ill people (Wiener, Chacko, Cron, & Cohen, 2007). In our data, normalizing to the number of deaths gave results by sex and SES that were qualitatively similar to the critical illness–based rates, though with slightly higher male to female ratios (data not shown).

146 University of Manitoba

Manitoba Centre for Health Policy 147
The Epidemiology and Outcomes of Critical Illness in Manitoba
GlossaryAccuracyValidity, the degree to which the information correctly describes the phenomena it was designed to measure. It is usually characterized in terms of error in statistical estimates and is traditionally decomposed into bias (systematic error) and variance (random error) components. It may also be described in terms of the major sources of error that potentially cause inaccuracy (e.g., coverage, sampling, nonresponse, response).
Acute Care Hospitals Hospitals providing acute care services such as emergency services and general medical and surgical treatment for acute disorders. Excludes long term and rehabilitation hospitals (e.g., Deer Lodge, Riverview) and special purpose facilities such as the Manitoba Adolescent Treatment Centre and Eden Mental Health Centre.
Acute Myocardial Infarction (AMI) Also known as a heart attack, a myocardial infarction occurs when the heart muscle (the myocardium) experiences sudden (acute) deprivation of circulating blood. The interruption of blood is usually caused by formation of a blood clot in abnormally narrowed coronary arteries.
Acute Physiology Score A component of the APACHE II classification system which measures the physiological condition of the critically ill patients in intensive care units.
Adjusted Clinical Group® (ACG®) SystemA risk adjustment tool developed to measure the illness burden (morbidity) of individual patients and enrolled populations. This system quantifies morbidity by grouping individuals based on their age, gender and medical diagnoses assigned by their healthcare providers over a defined time period (typically one year).
Administrative DataInformation collected, usually by government, for some administrative purpose– (e.g., keeping track of the population eligible for certain benefits, paying doctors or hospitals), but not primarily for research or surveillance purposes" (Spasoff, 1999). Manitoba Centre for Health Policy’s research uses administrative data from hospital abstracts, physician billing claims, claims for prescription drugs, and other health related data. Using these data, researchers can study the utilization of health resources over time and the variations in rates within and across the provinces.
Administrative Health Data – see Administrative Data
Age–Adjusted – see also Rate AdjustmentAdjusted for age
Age–Standardized – see Age–Adjusted and Rate Adjustment
APACHE IIAcute Physiology and Chronic Health Evaluation II, is a severity–of–disease classification system calculated using information from the first 24 hours after admission to an intensive care unit. This system takes into account the patient’s age, chronic health conditions and physiological variables (the acute physiology score). Higher scores correspond to more severe disease and a higher risk of death.

148 University of Manitoba
Glossary
Artificial Life SupportA spectrum of therapies and techniques used to maintain life after the failure of one or more vital organs. Prominent among these techniques is mechanical ventilation.
Average–Household IncomeThe average household income is the mean income of households at the neighbourhood level from the Canadian Census. In the census, a household refers to all persons who live within the same dwelling, regardless of their relationship to each other. Household income is the sum of incomes of all persons in the household. Individual level household income values are not available, so residents are assigned the average household income of the neighbourhood in which they reside. – Values were assigned at the dissemination area where available. Statistics Canada suppresses average household income values for DAs with populations less than 250 persons. In these cases, the average household income value at the Census Subdivision (CSD) level was imputed. A further imputation was required for some First Nations communities: northern and southern First Nations communities (north or south of the 60th parallel, respectively) with suppressed average household income at both the DA and CSD level were assigned the weighted mean value of average household income of the northern or southern First Nations communities with non–missing average household income.
Bed Map – see Bed Supply
Bed Supply Manitoba Health maintains information about the supply of hospital beds located in each region, expressed as beds per region and beds per 1,000 population.
Canadian Classification of Health Interventions (CCI) A classification system for coding healthcare procedures in Canada, used in companion with the International Classification of Diseases, version 10, with Canadian Enhancements (ICD–10–CA).
Canadian Institute for Health Information (CIHI) An independent, not–for–profit organization that provides essential data and analysis on Canada’s health system and the health of Canadians.
CancerAn abnormal growth of cells which tend to proliferate in an uncontrolled way, and in some cases, to metastasize (spread). Cancer can involve any tissue of the body and have many different forms in each body area. Most cancers are named for the type of cell or organ in which they start.
CancerCare ManitobaHealth services organization responsible for cancer prevention, detection, care, research, and education throughout Manitoba. Previously called the Manitoba Cancer Treatment and Research Foundation (MCTRF).
Cardiac CatheterizationThe most accurate method for evaluating and defining ischemic heart disease (IHD), also known as coronary artery disease (CAD). Cardiac catheterization is used to identify the location and severity of CAD. During cardiac catheterization, a small catheter (a thin hollow tube with a diameter of 2–3 mm) is inserted through the skin into an artery in the groin or the arm. Guided with the assistance of a fluoroscope (a special x–ray viewing instrument), the catheter is then advanced to the opening of the coronary arteries, the vessels supplying blood to the heart. When the catheter is used to inject radiographic contrast (a solution containing iodine, which is easily visualized with x–ray images) into

Manitoba Centre for Health Policy 149
The Epidemiology and Outcomes of Critical Illness in Manitoba
each coronary artery, the cardiac catheterization is termed coronary angiography. The images that are produced are called the angiogram, which shows the extent and severity of blockages in coronary arteries.
Case Mix Groups (CMG™)A Canadian patient classification system developed by the Canadian Institute for Health Information (CIHI), based on most responsible diagnosis, used to group and describe types of inpatients discharged from acute care hospitals. Each patient case is initially assigned to one of 25 mutually exclusive major clinical categories (MCC), which are based on body systems (e.g., circulatory, respiratory); then further classified as medical or surgical; and finally the CMG is assigned to create homogeneous groups. Cases within the same CMG are subsequently assigned to typical or atypical categories and classified according to age group and complexity level.
Case Mix Groups with Complexity Overlay (CMG Plx™)A modification to the Case Mix Group (CMG)™ system made in 1997, to reflect case complexity (the effect of comorbidities and complications). Each case within a given CMG™ is assigned a level from 1 to 4, with 4 being the highest level of complexity.
CensusAn official count of a population, often including demographic information such as age, sex, employment, and income. Statistics Canada conducts a Census every five years. It takes account of all persons living in Canada, including any individuals residing in Canada on a temporary basis. The Census also includes Canadians abroad on military missions or on merchant vessels that are registered in Canada (Statistics Canada, 2006).
Census Subdivision (CSD)Statistics Canada defined as municipalities or their equivalent (e.g., Indian reserves, Indian settlements, and unorganized territories).
Charlson Comorbidity IndexContains 19 categories of comorbidity, originally based on ICD–9–CM diagnoses and procedure codes, and their associated weights that provide an overall comorbidity score to reflect the cumulative increased likelihood of one–year mortality. The index has been updated for use with ICD–10–CA coding (Quan et al., 2005).
Clinical DatabaseAn organized collection of information that are usually collected by those in the medical community. These data are commonly used for quality improvement and research purposes.
Comorbidity/ComorbiditiesPresence of one or more chronic medical conditions known to increase risk of death that exist in addition to the most significant condition (usually recorded as the most responsible diagnosis on hospital discharge abstracts) that causes a patient's stay in the hospital. The number of comorbid conditions is used to provide an indication of the health status (and risk of death) of patients. In other words, comorbidity is an indicator of the differential utilization of hospital care.
Confidence IntervalsThe computed interval with a given probability that the true value of a variable (e.g., a mean or rate) is contained within the interval. For example, a 95% CI would have a 95% probability of containing the true population value. The Confidence Limits are the lower and upper boundaries of a confidence interval or the values that define the range of a confidence interval.

150 University of Manitoba
Glossary
Critical IllnessRefers to any type of acute medical condition that by its nature and/or severity threatens life or limb or negatively affects the ability of the vital organs to perform their functions.
Critical Illness–Based Rate of ICU Care The rate of ICU care relative to the number of persons who “should” have been admitted to ICUs, as reflected by the Estimated ICU Admission Pool.
Crude RateThe number of events in a given population over a certain period of time. In epidemiology, crude rates are helpful in determining the burden of disease and/or number of residents with that condition or procedure. These rates could potentially be affected by the age and sex distribution of an area; hence in our study, as much as possible, we report adjusted rates to allow fair comparisons between areas.
Daily Peak Bed Occupancy (DPBO)The maximum number of ICU beds simultaneously occupied at any time during that day.
Data SuppressionData is suppressed when the number of persons or events involved is five or less in order to avoid potential identification of individuals in an area. Data is not suppressed when the actual event count is zero. This process of suppressing data is conducted to protect the anonymity of study participants
Database Hospitals (DBH)Hospitals included in the WICUDB, specifically the Health Sciences Centre, St. Boniface General Hospital, Seven Oaks General Hospital, Concordia Hospital, Victoria General Hospital, and Grace Hospital.
De–Identified – see De–Identified Individual Level Information
De–Identified Individual Level InformationInformation about an individual that has been modified or from which identifying or potentially identifying information has been removed in a way that minimizes the likelihood that an individual's identity can be determined by any reasonably foreseeable method. Methods of de–identifying information can include scrambling or encrypting identifying or potentially identifying information" (from section 1.01 (d) within An Agreement Respecting Access to Manitoba Health Information at the Manitoba Centre for Health Policy (University of Manitoba) for Research Being Conducted by University Researchers Within The Secure Data Environment of MCHP – http://umanitoba.ca/admin/vp_admin/ofp/legal/media/MCHP_UofM_Researchers_2010.doc. Accessed December 8, 2010
Diabetes/Diabetes Mellitus
A chronic medical condition in which the pancreas no longer produces enough insulin (Type I Diabetes) or when cells stop responding to the insulin that is produced (Type II Diabetes), so that glucose in the blood cannot be absorbed into the cells of the body.
Direct Standardization of RatesThe specific rates in a study population are adjusted, using as weights the distribution of a specified standard population. The directly standardized rate represents what the crude rate would have been in the study population if that population had the same distribution as the standard population with respect to the variable(s) for which the adjustment or standardization was carried out.
Dissemination Area (DA)"A small, relatively stable geographic unit composed of one or more blocks. It is the smallest standard geographic area for which all census data are disseminated. DAs cover all the territory of Canada. [In

Manitoba Centre for Health Policy 151
The Epidemiology and Outcomes of Critical Illness in Manitoba
2001] The DA replaces the Enumeration Area (EA) as a basic unit for dissemination." (from StatsCan Website – Definition of Dissemination Area http://www12.statcan.ca/english/census01/Products/Reference/dict/geo021.htm. Accessed July 31, 2007).
Drug Programs Information Network (DPIN)An electronic, on–line, point–of–sale drug database. It links all community pharmacies (but not pharmacies in hospitals or nursing homes/personal care homes) and captures information about all Manitoba residents, including most prescriptions dispensed to status Indians. DPIN contains information such as unique patient identification, age, birthdate, sex, medication history, over–the–counter (OTC) medication history, patient postal code, new drugs prescribed, date dispensed, and unique pharmacy identification number. DPIN is maintained by the Government of Manitoba's Ministry of Health.
Elixhauser Comorbidity IndexA measurement tool that identifies 31 comorbid (i.e., co–existing) conditions using ICD–9–CM codes. This instrument has been adapted for use with administrative data sets. The index has been updated for use with ICD–10–CA coding (Quan et al., 2005).
Emergency Department Hospital units that are intended to provide rapid access to essential care for acutely ill patients.
EpidemicAn outbreak of a disease that affects many people simultaneously, at a frequency higher than expected.
Epidemiology The study of the transmission and control of disease and of the health status of a population
Episode – see Episodes of Care
Episode of CareDefined as a continuous time in a hospital or an ICU, irrespective of direct transfers between hospitals and/or ICUs
Estimated ICU Admission Pool (EIAP) Factor designed for this report to estimate the number of critically ill people in that year who “should” have been admitted to a high–intensity ICU. It is calculated by summing the number of people who were admitted to an urban ICU in that year and the number of people who died in that year without being admitted to an urban ICU, excluding deaths for people known to be in palliative care in the two years prior to death This is only an estimate of the number of potential ICU patients because it: 1) includes people who died before they were able to get to an urban ICU, 2) includes those who died and had not desired ICU care, but were not enrolled in a formal palliative program, and 3) excludes those who survived critical illness without urban ICU care.
Exact Binomial StatisticsA test of the statistical significance of deviations from a theoretically expected binomial distribution of observations into two or more categories. Unlike a chi–square goodness–of–fit test, exact tests are accurate even for data that have few observations in each cell
Fiscal Year For most Canadian government agencies and healthcare institutions, the fiscal year is defined as starting April 1 and ending the following year at March 31. For example, the 2005/06 fiscal year would be April 1, 2005 to March 31, 2006, inclusive.

152 University of Manitoba
Glossary
General Estimating EquationsA method of estimation used in the analysis of clustered data, which consists of repeated measures of an individual or cluster of individuals. These repeated measures from any one individual or cluster are correlated with each other and are therefore no longer independent. GEEs use the data to estimate the correlation between a single individual or cluster's response and provide a correct estimate of each effect's variance.
Heart Attack – see Acute Myocardial Infarction
Home CareHealth services provided free–of–charge to residents of all ages within their own homes based on assessed need and taking into account other resources available to the individual including families, community resources, and other programs. Reassessments at pre–determined intervals are the basis for decisions by case managers to discharge individuals from the program or to change the type or amount of service delivered.
Hospital AbstractA form/computerized record filled out upon a patient's discharge (separation) from an acute care hospital. The abstract contains information from the patient's medical record based on their stay in hospital, such as gender, residence (postal code), diagnoses and procedure codes, admission and discharge dates, length of stay, and service type (inpatient, day surgery, outpatient). Abstract records are stored in the Hospital Abstracts Database.
HypertensionOften referred to as high blood pressure. The "tension" in hypertension describes the vascular tone of the smooth muscles in the artery and arteriole walls. Hypertension is a major health problem, especially because it often has no symptoms. If left untreated, hypertension can lead to heart attack, stroke, enlarged heart, or kidney damage.
ICD–10–CAAcronym for International Classification of Diseases, 10th Revision with Canadian Enhancements (ICD–10–CA), which is based on the 10th version of the ICD (International Classification of Disease) coding system. It is developed by the World Health Organization and is used to classify diseases and related health problems (morbidity), but includes enhancements developed by Canadian Institute for Health Information (CIHI) for use in Canadian hospitals and other medical facilities. The Canadian Classification of Health Interventions (CCI) is the companion classification system to ICD–10–CA for coding procedures in Canada. ICD–10–CA and CCI are being used on Manitoba hospital abstracts beginning April 1, 2004.
ICD–9–CMAcronym for International Classification of Diseases, 9th Revision with Clinical Modifications (ICD–9–CM), which is the 9th version of the ICD (International Classification of Disease) coding system (with Clinical Modifications). It is developed by the World Health Organization and is used to classify diseases, health conditions, and procedures. This version was used extensively in Canadian hospitals. As of April 1, 2004, Manitoba hospitals replaced ICD–9–CM with ICD–10–CA for coding diagnoses and the Canadian Classification of Health Interventions for coding procedures.
IncidenceThe number of new cases of a specific disease/condition/event over a specified time period. The incidence rate uses new cases in the numerator; individuals with a history of the disease/condition are not included. The denominator for incidence rates is the population at risk.

Manitoba Centre for Health Policy 153
The Epidemiology and Outcomes of Critical Illness in Manitoba
Inclusive Time IntervalICU entry occurring on or after June 1, 1999 and ICU separation on or before March 31, 2008 (
Income QuintilesA method to measure the average (mean) household income of residents, ranking them from poorest to wealthiest and then grouping them into five income quintiles (one being poorest and five being wealthiest). Each quintile contains approximately 20% of the population. The income quintile measure is derived from Statistics Canada Census data by aggregating household income to the dissemination area and then ranking neighbourhoods by income quintile. Income quintiles are available for both urban and rural populations. Income quintiles are often used as a proxy measure of socioeconomic status.
Income UnknownRefers to those individuals who cannot be assigned a neighbourhood income from census data. Individuals included in the Income Unknown group include: residents of long–term care facilities, residents of some personal care homes, residents of psychiatric facilities, federal and long–term prisoners, wards of the Public Trustee and Child and Family Services, and residents of various areas reporting no income in the census. This category added to the ten Income Quintiles includes all Manitoba residents. NOTE: For the census, Statistics Canada suppresses average household income values for dissemination areas with populations less than 250 persons: these are grouped into income unknown for analyses using the census.
Inpatient – see Inpatient Hospitalization
Inpatient HospitalizationHospital stays in which patients are formally admitted to a hospital.
Intensive Care Unit (ICU)A hospital unit which specifically provides medical care to seriously ill patients.
IntensivistA physician who specializes in the care of critically ill patients, usually in an intensive care unit
Intermediate Care Unit A hospital unit designed for patients who are too ill to be cared for on regular wards, but do not require the highly specialized services that can only be provided in Intensive Care Units. Sometimes referred to as a step–down unit.
Intermediate ICU (IICU) In Manitoba, this refers to a specialized type of Intermediate Care Unit, a six–bed hospital unit at the Health Sciences Centre that is primarily for patients who are stable except that they require prolonged mechanical ventilation.
Ischemic Heart Disease (IHD)Ischemia is a condition in which the blood flow (and thus oxygen) is restricted to a part of the body. Cardiac ischemia is the name for lack of blood flow and oxygen to the heart muscle. Thus, the term 'ischemic heart disease' refers to heart problems caused by narrowed heart arteries. When arteries are narrowed, less blood and oxygen reaches the heart muscle. This is also called coronary artery disease and coronary heart disease. It can ultimately lead to heart attack.
Kaplan–Meier CurveA non–parametric analysis of data that deals with time until the occurrence of any well–defined event, such as death. This analysis is not based on any assumption of the distribution of the survival times.

154 University of Manitoba
Glossary
Length of Stay (LOS)The duration of care counted from admission to separation (discharge) for residents within a healthcare facility. In this report, both hospital LOS and ICU LOS are calculated
Linkage – see Record Linkage
Logistic RegressionThe regression technique used when the outcome is a binary, or dichotomous, variable. Logistic regression models the probability of an event as a function of other factors. Note that these models are only able to state that there is a relationship ("association") between the explanatory and the outcome variables. This is not necessarily a causal relationship. The explanatory variable may be associated with an increase or decrease (not that it caused the increase or decrease).
Manitoba Centre for Health Policy (MCHP)A unit within the Department of Community Health Sciences, Faculty of Medicine, University of Manitoba. MCHP is active in health services research, evaluation, and policy analysis, concentrating on using the Manitoba Health database to describe and explain patterns of care and profiles of health and illness.
Manitoba HealthA provincial government department responsible for providing healthcare services in Manitoba.
Manitoba Health Insurance Registy(Also known as the Master Registry and the Manitoba Health Services Insurance Plan (MHSIP) Registration File) It is a longitudinal population–based registry of all individuals who have been registered with Manitoba Health at some point since 1970. It includes date fields for registration, birth, entry into province, migration in/out of province, and death. It provides the needed follow–up information to track residents for longitudinal and intergenerational analyses. Primary identification is achieved by two numbers: every family in Manitoba is assigned a family registration number, and every individual is assigned a unique Personal Health Identification Number (PHIN) by the Ministry of Health
Mechanical VentilationA method to mechanically assist or replace spontaneous breathing with a machine designed to move breathable air into and out of the lungs
MedianThe middle of an ordered set of scores. It is a more appropriate measure than the mean when analyzing highly skewed distributions because it is less influenced by extreme outliers.
MidAn aggregate geographical area which includes all of the Regional Health Authorities (RHAs) in central Manitoba: Interlake, North Eastman, and Parkland
MorbidityMorbidity is any departure, subjective or objective, from a state of physiological or psychological well–being (i.e., sickness or illness).

Manitoba Centre for Health Policy 155
The Epidemiology and Outcomes of Critical Illness in Manitoba
Most Responsible Hospital DiagnosisThe one diagnosis which describes the most significant condition of a patient which causes his stay in hospital. In cases where multiple diagnoses may be classified as "most responsible", the diagnosis causing the greatest length of stay is coded as "most responsible". Several studies have shown similarities between this diagnosis, principal diagnosis, and primary diagnosis.
Negative Binomial DistributionA discrete probability distribution appropriate for analyzing count data when an event is relatively rare, but is highly variable over the entire population. The negative binomial distribution is often employed in regression analyses when the data is over–dispersed.
Negative Predictive ValueThe negative predictive value of a test is the probability that the patient will not have the disease/condition when restricted to all patients/subjects who test negative. You can compute the negative predictive value as NPV = TN / (TN + FN) where TN and FN are the number of true negative and false negative results, respectively. Notice that the denominator for negative predictive value is the number of patients/subjects who test negative
NorthAn aggregate geography which includes all of the Regional Health Authorities (RHAs) in northern Manitoba: Burntwood, NOR–MAN, and Churchill.
Out of Province Unique Identifier (OOPUI)An identifier assigned to non–Manitobans in the WICUDB allowing for the identification of individuals in that database. Each time a record is added to the WICUDB for a non–Manitoban, a search is done by name and date of birth to identify prior WICUDB records for that person. If any are found, the prior OOPUI is assigned to that new WICUDB record. If no matches are found, then a new OOPUI is assigned.
OutpatientA patient who receives treatment or surgery from a hospital, but who is not admitted as an inpatient.
Palliative CareCare aimed at alleviating suffering—physical, emotional, psychosocial, or spiritual—rather than curing
Percentile Percentiles are values that divide a set of observations into 100 equal parts. The percentile rank is the proportion of values in a distribution that a specific value is greater than or equal to. For example, the 95th percentile refers to an observation or datum that ranks 95th among the 100 observations and the 99th percentile refers to an observation or datum that ranks 99th among the 100 observations.
Personal Care Homes (PCH) Residential facilities for predominantly older persons with chronic illness or disability, also known as nursing homes. They may be proprietary (for profit) or non–proprietary. Non–proprietary PCHs may further be classified as secular or ethno–cultural (associated with a particular religious faith or language other than English) as well as either freestanding or juxtaposed with an acute care facility. In order to be admitted to a PCH, an application form must be completed and reviewed by a panel which determines whether the person requires admission.

156 University of Manitoba
Glossary
Personal Health Identification Number (PHIN)A unique numeric identifier assigned by Manitoba Health to every person registered for health insurance in Manitoba and to non–residents who are treated at facilities that submit claims electronically. Introduced as a linkage key in 1984, it was issued to the public in 1994 as the basic access identifier for the Pharmacare/ Drug Programs Information Network (DPIN). At MCHP, PHIN is either a scrambled version of the Manitoba Health PHIN or an alphanumeric identifier assigned via the Research Registry to individuals who do not have scrambled numeric PHINs.
Physician Claims Claims (billings) for payment submitted to the provincial government by individual physicians for services they provide. Fee–for–service physicians receive payment based on these claims; while physicians who are salaried, sessional, or hired on contract submit claims for administrative purposes only (sometimes referred to as "shadow billing"). The physician claims are collected and stored in the Medical Services Database, which is part of the Population Health Research Data Repository.
PneumoniaInflammation of the lungs caused by any infectious agent, including bacteria, virses, or fungi.
Population Health Research Data Repository (Repository)A comprehensive collection of administrative, registry, survey, and other databases primarily comprised of residents of Manitoba. This repository is housed at the Manitoba Centre for Health Policy (MCHP). It was developed to describe and explain patterns of healthcare and profiles of health and illness, facilitating inter–sectoral research in areas such as healthcare, education, and social services. The administrative health database, for example, holds records for virtually all contacts with the provincial healthcare system, the Manitoba Health Services Insurance Plan (including physicians, hospitals, personal care homes, home care, and pharmaceutical prescriptions) of all registered individuals. MCHP acts as a trustee or steward of the information in the Repository for agencies such as Manitoba Health.
Population–BasedThe experience of ALL individuals in a group are tracked regardless of where the use (or death) occurs. Events that occur outside the geographic area are attributed back to the population group to which individuals belong
Positive Predictive ValueThe positive predictive value of a test is the probability that the patient/subject has the disease/condition when restricted to those patients/subjects who test positive. This term is sometimes abbreviated as PPV. You can compute the positive predictive value as PPV = TP / (TP + FP) where TP and FP are the number of true positive and false positive results, respectively. Notice that the denominator for positive predictive value is the number of patients/subjects who test positive.
Pre–2004 – See also Post–2004The period of time ending on March 31, 2004, corresponding to hospital coding using ICD–9–CM.
Predictive AccuracyAccuracy of predicted or estimated values in a statistical model or equation.
Post–2004 – See also Pre–2004The period of time beginning in April 1, 2004, corresponding to hospital coding using ICD–10–CA.

Manitoba Centre for Health Policy 157
The Epidemiology and Outcomes of Critical Illness in Manitoba
QuintileThe unit obtained by dividing something into five equal groups.
Rate AdjustmentRates of events that are mathematically modified to remove the effects of different population structures that influence overall rates. Also called Rate Standardization or Standardized Rates. Adjusted rates are estimates of what an area's rate might have been, if that area's age and sex distribution was the same as that for the province overall. This adjustment is done to ensure that rates for different areas can be fairly compared—knowing that the demographic profile of the two areas is not affecting the comparison. Adjusted rates allow comparisons of rates across areas by removing the effects of demographic differences.
Record LinkageA set of techniques to match, or link, records from one file with those from another. Information on the same individual in two or more files can be merged into one file by matching the records on a set of common identifiers.
Region of ResidenceThe area where people live at any given point in time and where their health service use is allocated, regardless of where the service was provided. Regions are assigned according to the municipal code for the last region of residence on a claim or prior to admission to a hospital or personal care home. For determining residency in Regional Health Authorities (RHAs), either postal code or municipality code is used.
Regional Health Authority (RHA)Regional governance structure set up by the province to be responsible for the delivery and administration of health services in specified areas. In Manitoba, as of July 1, 2002, there are 11 RHAs: Winnipeg, Brandon, South Eastman, Assiniboine, Central, Parkland, North Eastman, Interlake, Burntwood, NOR–MAN, and Churchill.
Registration NumberA six–digit number assigned by Manitoba Health to identify family units receiving care. Also known as REGNO. Individuals within a family are assigned a unique Personal Health Identification Number (PHIN) for identifying services provided to that individual.
RegressionA statistical approach that looks to find the best mathematical relationship between a single, dependent y–variable as a function of one or more x–variables (independent variables). (Last, 1995).
Repository– See Population Health Research Data Repository (Repository)
Residency Location – See Region of Residence
Resource Intensity Weights (RIW™) The relative case weights for CMGs™ used to measure the intensity of resource use (relative cost) associated with different diagnostic, surgical procedures and demographic characteristics of an individual. RIWs™ are assigned according to the CMG to which an individual is assigned as well as their age, health status, and discharge status and are based upon micro–costing. In this report, we have used RIWs™ assigned using the CMG Plx™ methodology.

158 University of Manitoba
Glossary
Rural SouthAn aggregate geography which includes all of the Regional Health Authorities (RHAs) in the south and the middle of the province of Manitoba except the two urban centres of Winnipeg and Brandon. The RHAs included are: South Eastman, Central, and Assiniboine.
SAS®Statistical Analysis Software, a statistical software package for analyzing data.
SensitivityOne of two indices (the other is specificity) used to evaluate the accuracy of a test that predicts dichotomous outcomes (e.g., logistic regression). It is the number of "true positives" (those testing positive who have the disease) divided by all those with the disease.
SeparationA separation from a healthcare facility occurs anytime a patient (or resident) leaves because of death, discharge, sign–out against medical advice, or transfer. The number of separations is the most commonly used measure of the utilization of hospital services. Separations, rather than admissions, are used because hospital abstracts for inpatient care are based on information gathered at the time of discharge. In some cases, both inpatient and surgical outpatient records are included. In addition, hospital separations may not include newborn separations, since this would essentially result in a double counting (the mother and the baby being discharged).
SepsisRefers to a constellation of clinical signs (e.g., rapid heart rate, fever, elevated white blood cell count) that is due to infection.
Service CodesA numeric field identifying the hospital service to which the patient was admitted. For example, neonatal intensive care is coded as 54.90. Codes must correspond to the Patient Service codes in Appendix E of the Hospital Abstract User Manual (HAUM).
Sex–Adjusted – see also Rate AdjustmentAdjusted for sex.
Sex–Standardized – see Sex–Adjusted and Rate Adjustment
Socioeconomic Status (SES)Characteristics of economic, social, and physical environments in which individuals live and work, as well as their demographic characteristics.
Special Care Unit (SCU)Inpatient units specifically designed, staffed and equipped for the continuous observation and treatment of critically ill patients, including all types of intensive care units, as well as intermediate care or step–down units.
SpecificityOne of two indices (the other is sensitivity) used to evaluate the accuracy of a test that predicts dichotomous outcomes (e.g., logistic regression). It is the number of "true negatives" (those testing negative who do not have the disease) divided by all those without the disease.

Manitoba Centre for Health Policy 159
The Epidemiology and Outcomes of Critical Illness in Manitoba
Statistics Canada The federal government agency commissioned with producing statistics to help better understand Canada’s population, resources, economy, society, and culture. See their website: http://www.statcan.gc.ca.
Step–down Unit –see Intermediate Care Unit
StrokeThe rapidly developing loss of brain function due to an interruption in the supply of blood to the brain. It occurs when there is a sudden death of brain cells due to a lack of oxygen when the blood flow to the brain is impaired by blockage or rupture of an artery to the brain. Symptoms depend on the area of the brain affected. The most common symptom is weakness or paralysis of one side of the body with partial or complete loss of voluntary movement or sensation in a leg or arm. Other common symptoms include speech problems, weak facial muscles, numbness, and tingling. A stroke involving the base of the brain can affect balance, vision, swallowing, breathing, and consciousness.
Suppressed – see Data Suppression
Tertiary HospitalsFacilities that provide medical care that requires highly specialized skills, technology, and support services. In Manitoba, the only tertiary hospitals are Health Sciences Centre and St. Boniface General Hospital.
TriageThe process of selecting and prioritizing patients (e.g., in an emergency department) based on the urgency of their need for care.
Unadjusted Rates – see Crude Rate
UrbanAn aggregate geography which includes the two urban Regional Health Authorities in Manitoba: Winnipeg and Brandon.
ValidityIn statistics a valid measure is one which is measuring what it is supposed to measure. Validity implies reliability (accuracy). A valid measure must be reliable, but a reliable measure need not be valid. Validity refers to getting results that accurately reflect the concept being measured.
Winnipeg ICU Database (WICUDB)A clinical database which contains detailed clinical information about all adult ICU admissions in the Winnipeg Regional Health Authority (WRHA). When it came into existence on July 11, 1988 it only included information from two ICUs at the Health Sciences Centre. From June 1, 1999 onwards, information from all adult ICUs within the WRHA have been included in the WICUDB. Six Winnipeg hospitals contain adult ICUs –– the Health Sciences Centre, St. Boniface General Hospital, Seven Oaks General Hospital, Concordia Hospital, Victoria General Hospital, and the Grace Hospital.
Zero–Inflated ModelA type of regression model used to analyze a dependent variable that has excess zero values. Zero–Inflated models assume that the data are a mixture of two separate data generation processes: one generates only zeros and the other process generates non–zero counts.
160 University of Manitoba
Reference List
Reference ListAmerican Heart Association Statistics Committee and Stroke Statistics Subcommittee. Heart Disease and Stroke Statistics––2010 Update. A Report From the American Heart Association. American Heart Association. 2009. http://circ.ahajournals.org/cgi/content/abstract/CIRCULATIONAHA.109.192667v1. Accessed November 16, 2010.
Anderson R, Smith B. Deaths: Leading Causes for 2002 Centers for Disease Control. National Vital Statistics Reports. 2005;53(17).
Angus DC, Linde–Zwirble WT, Lidicker J, Clermont G, Carcillo J, Pinsky MR. Epidemiology of severe sepsis in the United States: analysis of incidence, outcome, and associated costs of care. Crit Care Med. 2001;29(7):1303–1310.
Behrendt CE. Acute respiratory failure in the United States: incidence and 31–day survival. Chest. 2000;118(4):1100–1105.
Bell R, Robinson L, Steering Committee Co–Chairs. Final Report of the Ontario Critical Care Steering Committee, March 2005. Ontario Ministry of Health and Long–Term Care. 2005. http://www.ontla.on.ca/library/repository/mon/12000/256909.pdf.
Bersten AD, Edibam C, Hunt T, Moran J. Incidence and mortality of acute lung injury and the acute respiratory distress syndrome in three Australian States. Am J Respir Crit Care Med. 2002;165(4):443–448.
Billington EO, Zygun DA, Stelfox HT, Peets AD. Intensivists' base specialty of training is associated with variations in mortality and practice patterns. Crit Care. 2009;13(6):R209.
Bone RC, Balk RA, Cerra FB, et al. Definitions for sepsis and organ failure and guidelines for the use of innovative therapies in sepsis. The ACCP/SCCM Consensus Conference Committee. American College of Chest Physicians/Society of Critical Care Medicine. Chest. 1992;101(6):1644–1655.
Borkhoff CM, Hawker GA, Kreder HJ, Glazier RH, Mahomed NN, Wright JG. Patients' gender affected physicians' clinical decisions when presented with standardized patients but not for matching paper patients. J Clin Epidemiol. 2009;62(5):527–541.
Canadian Institute for Health Information. Inpatient hospitalizations and average length of stay trends in Canada, 2003–2004 and 2004–2005: Taking a snapshot of the mix of patients being hospitalized in Canada. CIHI. 2005. http://secure.cihi.ca/cihiweb/products/hmdb_analysis_in_brief_e.pdf. Accessed July 29, 2010.
Canadian Institute for Health Information. 2004 Report: Major Injury in Canada. CIHI. 2010. http://secure.cihi.ca/cihiweb/products/NTR_MajorInjuryinCanada_2004.pdf. Accessed June 6, 2010.
Canadian Institute for Health Information. DAD Resource Intensity Weights and Expected Length of Stay. Ottawa, ON: CIHI; 2005.
Canadian Institute for Health Information. International Statistical Classification of Diseases and Related Health Problems Volume 1 – Tabular List. Ottawa, ON: CIHI; 2009.
Carson SS, Cox CE, Holmes GM, Howard A, Carey TS. The changing epidemiology of mechanical ventilation: a population–based study. J Intensive Care Med. 2006;21(3):173–182.

Manitoba Centre for Health Policy 161
The Epidemiology and Outcomes of Critical Illness in ManitobaThe Epidemiology and Outcomes of Critical Illness in Manitoba
Centers for Medicare and Medicaid Services (CMS), National Center for Health Statistics (NCHS). ICD–9–CM Official Guidelines for Coding and Reporting. Washington, DC: US Department of Health and Human Services; 2005.
Chalfin DB, Trzeciak S, Likourezos A, Baumann BM, Dellinger RP. Impact of delayed transfer of critically ill patients from the emergency department to the intensive care unit. Crit Care Med. 2007;35(6):1477–1483.
Charlson ME, Pompei P, Ales KL, MacKenzie CR. A new method of classifying prognostic comorbidity in longitudinal studies: development and validation. J Chronic Dis. 1987;40(5):373–383.
Christakis NA, Iwashyna TJ. Spousal illness burden is associated with delayed use of hospice care in terminally ill patients. J Palliat Med. 1998;1(1):3–10.
Christakis NA, Iwashyna TJ. The health impact of healthcare on families: a matched cohort study of hospice use by decedents and mortality outcomes in surviving, widowed spouses. Soc Sci Med. 2003;57(3):465–475.
Chrusch CA, Olafson KP, McMillan PM, Roberts DE, Gray PR. High occupancy increases the risk of early death or readmission after transfer from intensive care. Crit Care Med. 2009;37(10):2753–2758.
Combes A, Luyt CE, Trouillet JL, Chastre J, Gibert C. Adverse effect on a referral intensive care unit's performance of accepting patients transferred from another intensive care unit. Crit Care Med. 2005;33(4):705–710.
Daly K, Beale R, Chang RW. Reduction in mortality after inappropriate early discharge from intensive care unit: logistic regression triage model. BMJ. 2001;322(7297):1274–1276.
de Bruin AM, van Rossum AC, Visser MC, Koole GM. Modeling the emergency cardiac in–patient flow: an application of queuing theory. Healthcare Manag Sci. 2007;10(2):125–137.
DeLia D. Annual bed statistics give a misleading picture of hospital surge capacity. Ann Emerg Med. 2006;48(4):384–8, 388.
Demeter S, Reed M, Lix L, MacWilliam L, Leslie W. Socioeconomic status and the utilization of diagnostic imaging in an urban setting. Can Med Assoc J. 2005;173(10):1173–1177.
Department of Health. Comprehensive Critical Care: A Review of Adult Critical Care Services. Department of Health. 2000. http://www.dh.gov.uk/prod_consum_dh/groups/dh_digitalassets/@dh/@en/documents/digitalasset/dh_4082872.pdf. Accessed November 16, 2010.
Deyo RA, Cherkin DC, Ciol MA. Adapting a clinical comorbidity index for use with ICD–9–CM administrative databases. J Clin Epidemiol. 1992;45(6):613–619.
Dodek P, Kozak JF, Norena M, Wong H. More men than women are admitted to 9 intensive care units in British Columbia. J Crit Care. 2009;24(4):630–638.
Dombrovskiy VY, Martin AA, Sunderram J, Paz HL. Facing the challenge: decreasing case fatality rates in severe sepsis despite increasing hospitalizations. Crit Care Med. 2005;33(11):2555–2562.
Downar J, Sibbald R, Lazar NM. Ethical considerations for classifying patients as 'palliative' when calculating Hospital Standardised Mortality Ratios. J Med Ethics. 2010;36(7):387–390.

162 University of Manitoba
Reference List
Elixhauser A, Steiner C, Harris DR, Coffey RM. Comorbidity measures for use with administrative data. Med Care. 1998;36(1):8–27.
Elwert F, Christakis NA. The effect of widowhood on mortality by the causes of death of both spouses. Am J Public Health. 2008;98(11):2092–2098.
Escarce JJ, Kelley MA. Admission source to the medical intensive care unit predicts hospital death independent of APACHE II score. JAMA. 1990;264(18):2389–2394.
Finfer S, Bellomo R, Lipman J, French C, Dobb G, Myburgh J. Adult–population incidence of severe sepsis in Australian and New Zealand intensive care units. Intensive Care Med. 2004;30(4):589–596.
Fowler RA, Sabur N, Li P, et al. Sex–and age–based differences in the delivery and outcomes of critical care. CMAJ. 2007;177(12):1513–1519.
Fox J. Regression Diagnositics. London, UK: Sage Publications; 1991.
Fransoo R, Martens P, Burland E, The Need to Know Team, Prior H, Burchill C. Manitoba RHA Indicators Atlas 2009. Manitoba Centre for Health Policy. 2009. http://mchp–appserv.cpe.umanitoba.ca/reference/RHA_Atlas_Report.pdf. Accessed November 16, 2010.
Fransoo R, Martens P, The Need To Know Team, et al. Age difference key to understanding gender difference in cardiac intervention rates after acute myocardial infarction. Healthcare Policy. 2010;6(1):88–103.
Garland A, Connors AF. Physicians' influence over decisions to forego life support. J Palliat Med. 2007;10(6):1298–1305.
Garland A, Connors AF. Optimal Timing of Transfer out of ICU. Am J Respir Crit Care Med. 2008;177(Abstracts):A126.
Garland A, Dawson NV, Altmann I, et al. Outcomes up to 5 years after severe, acute respiratory failure. Chest. 2004;126(6):1897–1904.
Goldfrad C, Rowan K. Consequences of discharges from intensive care at night. Lancet. 2000;355(9210):1138–1142.
Gordis L. Epidemiology. Philadelphia, PA: W. B. Saunders; 2000.
Groeger JS, Guntupalli KK, Strosberg M, et al. Descriptive analysis of critical care units in the United States: patient characteristics and intensive care unit utilization. Crit Care Med. 1993;21(2):279–291.
Hardin J, Hilbe J. General Estimating Equations. Boca Raton, FL: Chapman & Hall/CRC; 2003.
Iapichino G, Gattinoni L, Radrizzani D, et al. Volume of activity and occupancy rate in intensive care units. Association with mortality. Intensive Care Med. 2004;30(2):290–297.
Iwashyna TJ. Critical care use during the course of serious illness. Am J Respir Crit Care Med. 2004;170(9):981–986.
Iwashyna TJ, Christakis NA. Marriage, widowhood, and health–care use. Soc Sci Med. 2003;57(11):2137–2147.

Manitoba Centre for Health Policy 163
The Epidemiology and Outcomes of Critical Illness in ManitobaThe Epidemiology and Outcomes of Critical Illness in Manitoba
Jegers M, Edbrooke DL, Hibbert CL, Chalfin DB, Burchardi H. Definitions and methods of cost assessment: an intensivist's guide. ESICM section on health research and outcome working group on cost effectiveness. Intensive Care Med. 2002;28(6):680–685.
Johns Hopkins University ACG Case–Mix System. What are the Elements of the ACG System? John Hopkins University. 2009. http://www.acg.jhsph.edu/html/WhatAreACGElements.htm. Accessed September 16, 2009.
Johnston JA, Wagner DP, Timmons S, Welsh D, Tsevat J, Render ML. Impact of different measures of comorbid disease on predicted mortality of intensive care unit patients. Med Care. 2002;40(10):929–940.
Knaus WA, Draper EA, Zimmerman JE. APACHE II: a severity of disease classification system. Crit Care Med. 1985;13(10):818–829.
Last JM. A Dictionary of Epidemiology. New York, NY: Oxford University Press; 1995.
Laupland KB. Population–based epidemiology of intensive care: critical importance of ascertainment of residency status. Crit Care. 2004;8(6):R431–R436.
Laupland KB, Karmali S, Kirkpatrick AW, Crowshoe L, Hameed SM. Distribution and determinants of critical illness among status Aboriginal Canadians. A population–based assessment. J Crit Care. 2006;21(3):243–247.
Magner D, Mirocha J, Gewertz BL. Regional variation in the utilization of carotid endarterectomy. J Vasc Surg. 2009;49(4):893–901.
Manitoba Health and Healthy Living. Manitoba Health and Healthy Living Population Report– June 1, 2008. 2008. http://www.gov.mb.ca/health/population/2008/pr2008.pdf. Accessed July 29, 2009.
Marik PE, Hedman L. What's in a day? Determining intensive care unit length of stay. Crit Care Med. 2000;28(6):2090–2093.
McManus ML, Long MC, Cooper A, Litvak E. Queuing theory accurately models the need for critical care resources. Anesthesiology. 2004;100(5):1271–1276.
Metge C, Black C, Peterson S, Kozyrskyj A, Roos NP, Bogdanovic B. Analysis of Patterns of Pharmaceutical Use in Manitoba, 1996 Key Findings: A POPULIS Project. Manitoba Centre for Health Policy and Evaluation. 1999. http://mchp–appserv.cpe.umanitoba.ca/reference/dpin.pdf. Accessed July 29, 2010.
National Heart LaBI. Incidence and Prevalence: 2006 Chart Book on Cardiovascular and Lung Diseases. Bethesda, MD: National Institutes of Health; 2006.
Needham DM, Bronskill SE, Sibbald WJ, Pronovost PJ, Laupacis A. Mechanical ventilation in Ontario, 1992–2000: incidence, survival, and hospital bed utilization of noncardiac surgery adult patients. Crit Care Med. 2004;32(7):1504–1509.
Quan H, Sundararajan V, Halfon P, et al. Coding algorithms for defining comorbidities in ICD–9–CM and ICD–10 administrative data. Med Care. 2005;43(11):1130–1139.
Reid RJ, Roos NP, MacWilliam L, Frohlich N, Black C. Assessing population healthcare need using a claims–based ACG morbidity measure: a validation analysis in the Province of Manitoba. Health Serv Res. 2002;37(5):1345–1364.

164 University of Manitoba
Reference List
Rosenberg AL, Hofer TP, Hayward RA, Strachan C, Watts CM. Who bounces back? Physiologic and other predictors of intensive care unit readmission. Crit Care Med. 2001;29(3):511–518.
Scales D, Guan J, Martin C, Redelmeier, D. Administrative data accurately identified intensive care unit admissions in Ontario. J Clin Epidemiol 2006;59(8):802–807.
Seferian EG, Afessa B. Demographic and clinical variation of adult intensive care unit utilization from a geographically defined population. Crit Care Med. 2006;34(8):2113–2119.
Sinuff T, Kahnamoui K, Cook DJ, Luce JM, Levy MM. Rationing critical care beds: a systematic review. Crit Care Med. 2004;32(7):1588–1597.
Spasoff RA. Epidemiologic Methods for Health Policy. New York, NY: Oxford University Press; 1999.
Statistics Canada. CANSIM Table 326–0021. Statistics Canada. 2006. http://estat.statcan.gc.ca. Accessed July 7, 2010.
Strauss MJ, LoGerfo JP, Yeltatzie JA, Temkin N, Hudson LD. Rationing of intensive care unit services. An everyday occurrence. JAMA. 1986;255(9):1143–1146.
Sundararajan V, Macisaac CM, Presneill JJ, Cade JF, Visvanathan K. Epidemiology of sepsis in Victoria, Australia. Crit Care Med. 2005;33(1):71–80.
Valentin A, Jordan B, Lang T, Hiesmayr M, Metnitz PG. Gender–related differences in intensive care: a multiple–center cohort study of therapeutic interventions and outcome in critically ill patients. Crit Care Med. 2003;31(7):1901–1907.
Weitzen S, Teno JM, Fennell M, Mor V. Factors associated with site of death: a national study of where people die. Med Care. 2003;41(2):323–335.
Wennberg J, Fisher E, Goodman D, Skinner J. Tracking the care of patients with severe chronic illness: The Darmouth Atlas of Healthcare 2008. Lebanon, NH: Trustees of Dartmouth College; 2008.
Wiener B, Chacko S, Cron SG, Cohen MZ. Guideline development and education to insure accurate and consistent pulmonary artery wedge pressure measurement by nurses in intensive care units. Dimens Crit Care Nurs. 2007;26(6):263–268.
Wunsch H, Angus DC, Harrison DA, et al. Variation in critical care services across North America and Western Europe. Crit Care Med. 2008;36(10):2787–2789.

Manitoba Centre for Health Policy 165
The Epidemiology and Outcomes of Critical Illness in ManitobaThe Epidemiology and Outcomes of Critical Illness in Manitoba
Appendix 1.1: WRHA Critical Care Validation Process—Linkages to Manitoba Health Insurance Registry Performed Regularly
Validation completed by Health Information Management at Manitoba Health. Every four to six weeks, the WRHA provides to Health Information Management (HIM) at Manitoba Health, a file of newly admitted patients to WRHA ICUs for validation purposes. The validation process involves the crosschecking of names, PHIN, and date of birth data in the WICUDB with the Manitoba Health Insurance Registry. The WRHA makes changes in the WICUDB for any inconsistencies HIM indicates in the crosschecking. Fields in the file from the WRHA used for linkages are PHIN, surname, given name, date of birth, and sex.
The validation process involves the following linkages, in order of how they are performed (the fields used in the linkages are listed):
1. PHIN, surname, given name, date of birth, sex • Matches in ‘linkage 1’ are given a match indicator of ‘1’ (PHIN used in linkage).
2. Non matches from step 1 are then linked on PHIN, surname, given name, sex • Matches in ‘linkage 2’ are given a match indicator of ‘1’ (PHIN used in linkage).
3. Non matches from step 2 are then linked on PHIN, surname, date of birth, sex • Matches in ‘linkage 3’ are given a match indicator of ‘1’ (PHIN used in linkage). Also, the given
name from the Manitoba Health Insurance Registry is provided.4. Non matches from step 3 are then linked on PHIN, surname, sex
• Matches in ‘linkage 4’ are given a match indicator of ‘1’ (PHIN used in linkage). Also, the given name and date of birth from the Manitoba Health Insurance Registry are provided.
The remaining linkages are visually verified
5. Non matches from step 4 are then linked on PHIN, year of birth • Using a ‘Proc Print’ in SAS, the fields from the WICUDB and the Manitoba Health Insurance
Registry are visually verified and then those records determined to be matches are kept. • Matches in ‘linkage 5’ are given a match indicator of ‘1’ (PHIN used in linkage). Also, the
surname, given name, date of birth and sex from the Manitoba Health Insurance Registryare provided.
6. Non matches from step 5 are then linked on Surname, first character of given name, year of birth, month of birth, sex
• Using a ‘Proc Print’ in SAS, the fields from the WICUDB and the Manitoba Health Insurance Registry are visually verified and those records determined to be matches are kept.
• Matches in ‘linkage 6’ are given a match indicator of ‘2’ (PHIN not used in linkage). Also, the PHIN, surname, given name, date of birth, and sex from the Manitoba Health Insurance Registry are provided.
7. Non matches from step 6 are then linked on Surname and alternate surname field on Manitoba Health Insurance Registry, year of birth
• Using a ‘Proc Print’ in SAS, the fields from the WICUDB and the Manitoba Health Manitoba Health Insurance Registry are visually verified and those records determined to be matches are kept.
• Matches in ‘linkage 7’ are given a match indicator of ‘2’ (PHIN not used in linkage). Also, the PHIN, surname, given name, date of birth, and sex from the Manitoba Health Manitoba Health Insurance Registry are provided.
The linkage process is now done. Any outstanding non matches are given a match indicator of ‘0’. The resulting matched and non–matched records are provided back to the WRHA.
Appendix 1: Additional Information Related to Specific Aim 1

166 University of Manitoba
Appendices
Appendix 1.2: WRHA Critical Care Validation Process—Linkages to Manitoba Health Insurance Registry Performed when Transferring WICUDB Data to MCHP
Validation supervised by HIM at Manitoba Health
Purpose of Linkage:
• To update missing data on new WICUDB records since previous linkage
Datasets:
• WICUDB records • Medical Patient Registry Manitoba Health Insurance Registry snapshot • Manitoba Health hospital abstracts with ICU admission
Linkage:
Step 1. Exclude all records previously checked by HIM with valid PHINsStep 2. By surname, given (including initials), full birth dateStep 3. By surname, full birth date, sex Step 4. By SOUNDEX (surname), full birth date, sex, COMPARE (given)Step 5. By SOUNDEX (surname),sex, COMPARE (given), birth year, birth month, Step 6. By full birth date, sex, COMPARE (given)Step 7. By sex, full birth date, facility, admit and separation date (against hospital abstracts)
NOTE: ALL matches found in steps 2 through 7 were visually verified.
Appendix Table A1.1: Winnipeg Regional Health Authority Patients Transferred Directly To and/or From a Non–Manitoba Hospital For hospital abstracts linked to Winnipeg ICU Database records
Number Percent Number PercentHospital abstracts -All 3,821 58,615 -Inclusive time interval* 2,679 45,253 a. Transferred from an out of province hospital -All 1,729 45.25 886 1.51 -Inclusive time interval* 1,187 44.31 777 1.72b. Transferred to an out of province hospital -All 956 25.02 568 0.97 -Inclusive time interval* 673 25.12 480 1.06c. Both (a) and (b) -All 686 17.95 122 0.21 -Inclusive time interval* 485 18.10 101 0.22d. Either (a) or (b) -All 1,999 52.32 1,332 2.27 -Inclusive time interval* 1,375 51.33 1,156 2.55
Source: Manitoba Centre for Health Policy, 2012
Non-Manitobans Manitobans
Appendix Table A1.1: Winnipeg Regional Health Authority Patients Transferred Directly To and/or From a Non-Manitoba Hospital
For hospital abstracts linked to Winnipeg ICU Database records
* Inclusive time interval includes ICU entry on or after June 1, 1999 and ICU separation on or before March 31, 2008

Manitoba Centre for Health Policy 167
The Epidemiology and Outcomes of Critical Illness in Manitoba
Appendix 2: Additional Information Related to Specific Aim 2
Appendix 3: Additional Information Related to Specific Aim 3
Appendix Table A2 .1: Canadian Institute for Health Information (CIHI) Special Care Unit (SCU) Codes
SCU Code Type of Nursing Unit 10 Medical Intensive Care Nursing Unit20 Surgical Intensive Care Nursing Unit25 Trauma Intensive Care Nursing Unit30 Combined Medical/Surgical Intensive Care Nursing Unit35 Burn Intensive Care Nursing Unit40 Cardiac Intensive Care Nursing Unit Surgery45 Coronary Intensive Care Nursing Unit Medical50 Neonatal Intensive Care Nursing Unit 60 Neurosurgery Intensive Care Nursing Unit70 Pediatric Intensive Care Nursing Unit80 Respirology Intensive Care Nursing Unit90 Step Down Medical Unit95 Step Down Surgical Unit
Source: Manitoba Centre for Health Policy, 2012
Appendix Table A2 .1: Canadian Institute for Health Information (CIHI) Special Care Unit (SCU) codes
Appendix Table A3.1: Designation Codes Used in Hospital Abstracts to Indicate Location of Patients Before and After Hospitalization
0 D Direct1 Direct E Emergency2 Emergency N Newborn
S StillbornP Day ProcedureC Clinic
1 Medical discharge 01 Transferred to an acute care inpatient institution 2 Medical discharge without authorization 02 Transferred to continuing care3 Death in less than 48 hours 03 Transferred to other4 Death in more than 48 hours 04 Discharged to home or home setting with support services5 To Home Care program 05 Discharged home (no support service required)6 Transferred 06 Left against medical advice7 Admission after day surgery 07 Died8 Newborn to Child and Family Services / private adoption 08 Cadaveric donor admitted for organ/tissue retrieval9 Pediatric discharge to Child and Family Services 09 Stillbirth
10 Newborn discharged to Child and Family Services11 Private adoption of newborn
A hospital disposition code of “6” in pre-2004 was taken to represent transfer to another acute care facility
Source: Manitoba Centre for Health Policy, 2012
Appendix Table A3.1: Designation Codes Used in Hospital Abstracts to Indicate Location of Patients Before and After Hospitalization
Pre-2004 Post-2004
Hospital Separation
Codes
Hospital Entry Codes

168 University of Manitoba
Appendices
Appendix Table A3.2: Acute Care Hospitals in Manitoba
Code Hospital Name Location1 Brandon General Hospital Brandon3 Grace General Hospital Winnipeg4 Misericordia Hospital Winnipeg5 St. Boniface General Hospital Winnipeg7 Victoria General Hospital Winnipeg9 Concordia Hospital Winnipeg11 Seven Oaks General Hospital Winnipeg16 Health Sciences Centre Winnipeg102 Altona Community Memorial Health Centre Altona103 Arborg and District Health Centre Arborg106 Baldur Health District Baldur107 Beausejour Hospital District No. 29 Beausejour108 Benito Health Centre Benito109 Bethel Hospital Winkler110 Bethesda Hospital Steinbach111 Snow Lake Medical Nursing Unit Snow Lake113 Boissevain Health Centre District Boissevain114 Boundary Trails Health Centre Winkler116 Carman Memorial Hospital Carman118 Winnipegosis General Hospital Winnipegosis119 Rock Lake Health District Crystal City122 Dauphin Regional Health Centre Dauphin123 Deloraine Health Centre Deloraine124 Centre Medico-Social Desalaberry District Health Centre St.Pierre-Jolys125 Eden Mental Health Centre Winkler128 E.M. Crowe Memorial Hospital (Lakeshore District Health System) Eriksdale129 Erickson District Health Centre Eriickson130 Churchill Health Centre Churchill131 Emerson Hospital (Red River Valley Health District Inc.) Emerson134 Flin Flon General Hospital Inc. Flin Flon135 Carberry Plains District Health Centre Carberry136 Gillam Hospital Gillam137 Gilbert Plains Health Centre Inc. Gilbert Plains138 Seven Regions Health Centre Gladstone139 Glenboro Health District Glenboro140 Grandview District Hospital Grandview143 Hamiota District Health Centre Hamiota144 Teulon-Hunter Memorial Health District Teulon146 Johnson Memorial Hospital Gimli147 Lorne Memorial Hospital Swan Lake148 Tri-Lake Health District Killarney149 Lynn Lake District Hospital Lynn Lake150 McCreary/Alonsa Health Centre McCreary151 Pembina-Manitou Hospital Manitou152 Minnedosa Health District Minnedosa153 Morden Health District Morden154 Morris General Hospital (Red River Valley Health District) Morris155 Leaf Rapids Health Centre Leaf Rapids156 MacGregor and District Health Centre MacGregor158 Neepawa Hospital District No. 9 (Neepawa District Memorial Hospital) Neepawa159 Notre Dame Medical Nursing Inc. Notre Dame de Lourdes161 Pine Falls Health Complex (Pine Falls General Hospital) Pine Falls162 Portage District General Hospital Portage la Prairie163 Pinawa Hospital (Winnipeg River Health District) Pinawa164 Reston District Health Centre Reston165 Roblin District Health Centre Roblin166 Riverdale Health Services District Rivers167 Rossburn District Health Centre Rossburn169 Russell District Health Centre (Russell Hospital District No. 4) Russell170 The Pas Health Complex Inc. The Pas171 Birtle Health Services District Birtle172 Ste. Rose General Hospital Ste. Rose du Lac173 Selkirk and District General Hospital Selkirk174 Shoal Lake-Strathclair Health Centre Shoal Lake175 Souris Health District Souris176 Stonewall and District Health Centre Stonewall177 Swan River Valley Hospital Swan River178 Lakeshore District Health System Inc. (Lakeshore General Hospital) Ashern179 Ste. Anne Hospital Ste. Anne180 Health District No 10 Virden181 Vita and District Health Centre Inc. Vita182 St. Claude Health District St. Claude183 Tiger Hills Health District Treherne184 Melita Health Centre (South West Health District) Melita185 Whitemouth District Health Centre Whitemouth186 Wawanesa and District Memorial Health Centre Wawanesa187 Thompson General Hospital Thompson202 Shilo Military Hospital Shilo204 Gypsumville Medical Care Unit Gypsumville210 Percy E. Moore Hospital Hodgson212 Norway House Hospital Norway House
Source: Manitoba Centre for Health Policy, 2012
Appendix Table A3.2: Acute Care Hospitals in Manitoba

Manitoba Centre for Health Policy 169
The Epidemiology and Outcomes of Critical Illness in Manitoba
Code Hospital Name Location1 Brandon General Hospital Brandon3 Grace General Hospital Winnipeg4 Misericordia Hospital Winnipeg5 St. Boniface General Hospital Winnipeg7 Victoria General Hospital Winnipeg9 Concordia Hospital Winnipeg11 Seven Oaks General Hospital Winnipeg16 Health Sciences Centre Winnipeg102 Altona Community Memorial Health Centre Altona103 Arborg and District Health Centre Arborg106 Baldur Health District Baldur107 Beausejour Hospital District No. 29 Beausejour108 Benito Health Centre Benito109 Bethel Hospital Winkler110 Bethesda Hospital Steinbach111 Snow Lake Medical Nursing Unit Snow Lake113 Boissevain Health Centre District Boissevain114 Boundary Trails Health Centre Winkler116 Carman Memorial Hospital Carman118 Winnipegosis General Hospital Winnipegosis119 Rock Lake Health District Crystal City122 Dauphin Regional Health Centre Dauphin123 Deloraine Health Centre Deloraine124 Centre Medico-Social Desalaberry District Health Centre St.Pierre-Jolys125 Eden Mental Health Centre Winkler128 E.M. Crowe Memorial Hospital (Lakeshore District Health System) Eriksdale129 Erickson District Health Centre Eriickson130 Churchill Health Centre Churchill131 Emerson Hospital (Red River Valley Health District Inc.) Emerson134 Flin Flon General Hospital Inc. Flin Flon135 Carberry Plains District Health Centre Carberry136 Gillam Hospital Gillam137 Gilbert Plains Health Centre Inc. Gilbert Plains138 Seven Regions Health Centre Gladstone139 Glenboro Health District Glenboro140 Grandview District Hospital Grandview143 Hamiota District Health Centre Hamiota144 Teulon-Hunter Memorial Health District Teulon146 Johnson Memorial Hospital Gimli147 Lorne Memorial Hospital Swan Lake148 Tri-Lake Health District Killarney149 Lynn Lake District Hospital Lynn Lake150 McCreary/Alonsa Health Centre McCreary151 Pembina-Manitou Hospital Manitou152 Minnedosa Health District Minnedosa153 Morden Health District Morden154 Morris General Hospital (Red River Valley Health District) Morris155 Leaf Rapids Health Centre Leaf Rapids156 MacGregor and District Health Centre MacGregor158 Neepawa Hospital District No. 9 (Neepawa District Memorial Hospital) Neepawa159 Notre Dame Medical Nursing Inc. Notre Dame de Lourdes161 Pine Falls Health Complex (Pine Falls General Hospital) Pine Falls162 Portage District General Hospital Portage la Prairie163 Pinawa Hospital (Winnipeg River Health District) Pinawa164 Reston District Health Centre Reston165 Roblin District Health Centre Roblin166 Riverdale Health Services District Rivers167 Rossburn District Health Centre Rossburn169 Russell District Health Centre (Russell Hospital District No. 4) Russell170 The Pas Health Complex Inc. The Pas171 Birtle Health Services District Birtle172 Ste. Rose General Hospital Ste. Rose du Lac173 Selkirk and District General Hospital Selkirk174 Shoal Lake-Strathclair Health Centre Shoal Lake175 Souris Health District Souris176 Stonewall and District Health Centre Stonewall177 Swan River Valley Hospital Swan River178 Lakeshore District Health System Inc. (Lakeshore General Hospital) Ashern179 Ste. Anne Hospital Ste. Anne180 Health District No 10 Virden181 Vita and District Health Centre Inc. Vita182 St. Claude Health District St. Claude183 Tiger Hills Health District Treherne184 Melita Health Centre (South West Health District) Melita185 Whitemouth District Health Centre Whitemouth186 Wawanesa and District Memorial Health Centre Wawanesa187 Thompson General Hospital Thompson202 Shilo Military Hospital Shilo204 Gypsumville Medical Care Unit Gypsumville210 Percy E. Moore Hospital Hodgson212 Norway House Hospital Norway House
Source: Manitoba Centre for Health Policy, 2012
Appendix Table A3.2: Acute Care Hospitals in Manitoba

170 University of Manitoba
Appendices
Appendix Table A3.3: Distribution for Manitobans of Time Intervals Separating Successive ICU Records within Hospital Episodes Containing Multiple ICU Records Time interval = ICU entry of later ICU record – ICU separation of earlier ICU record; hospital separation on or before March 31, 2008
Time Interval (Hours) Number Percent Cumulative Percentinterval ≤0 726 7.7 7.7
0 < interval ≤ 12 4,575 48.6 56.3
12 < interval ≤24 519 5.5 61.8
24 < interval ≤ 36 365 3.9 65.7
36 < interval ≤ 48 266 2.8 68.5
48 < interval ≤ 72 411 4.4 72.9
72 < interval ≤ 96 310 3.3 76.2
interval > 96 2,240 23.8 100.0
Total 9,412 100.0 100.0
Source: Manitoba Centre for Health Policy, 2012
Appendix Table A3.3: Distribution for Manitobans of Time Intervals Separating Successive ICU Records within Hospital Episodes Containing Multiple ICU Records
Time interval = ICU entry of later ICU record - ICU separation of earlier ICU record; hospital separation on or before March 31, 2008
Appendix Table A3.4: Number of ICU–Containing Hospital Abstracts for Hospitals Not Included in the Winnipeg ICU Database Hospital entry on or after June 1, 1998 and hospital separation on or before March 31, 2008
Hospital Number Hospital Number
Misericordia Hospital 250 ---
Brandon Regional Health Centre 2,042 Brandon Regional Health Centre 1,277
Boundary Trails Health Centre 769 Boundary Trails Health Centre 1,162
Carman Memorial Hospital 523 Carman Memorial Hospital 115
Dauphin General Hospital 1683 Dauphin General Hospital 1,107
Flin Flon General Hospital 314 Flin Flon General Hospital 12
Portage District General Hospital 1,746 Portage District General Hospital 1,072
The Pas Health Complex 762 The Pas Health Complex 256
Selkirk and District General Hospital 458 Selkirk and District General Hospital 428
Thompson General Hospital 685 Thompson General Hospital 613
--- Bethesda Hospital 0
Bethel Hospital 214 ---
Morden District General Hospital 685 ---
Subtotal 10,131 Subtotal 6,042
Source: Manitoba Centre for Health Policy, 2012
Pre-2004 Post-2004
Appendix Table A3.4: Number of ICU-Containing Hospital Abstracts for Hospitals Not Included in the Winnipeg ICU Database
Hospital entry on or after June 1, 1998 and hospital separation on or before March 31, 2008

Manitoba Centre for Health Policy 171
The Epidemiology and Outcomes of Critical Illness in Manitoba
App
endi
x Ta
ble
A3.
5:
Aug
men
ted
Sum
mar
y of
Fin
ding
s Re
late
d to
ICU
Epi
sode
s an
d IC
U–C
onta
inin
g H
ospi
tal E
piso
des
Hos
pita
l ent
ry o
n or
aft
er Ju
ne 1
, 199
8 an
d ho
spita
l sep
arat
ion
or b
efor
e M
arch
31,
200
8
ICU
rec
ords
ICU
-con
tain
ing
hosp
ital a
bstr
acts
ICU
epi
sode
sH
ospi
tal e
piso
des
Hos
pita
l abs
trac
ts w
ithin
hos
pita
l epi
sode
sN
umbe
rP
erce
ntN
umbe
rP
erce
ntN
umbe
rP
erce
ntN
umbe
rP
erce
ntN
umbe
rP
erce
ntIC
U-c
onta
inin
g ho
spita
l abs
trac
ts w
ith m
ore
than
o n
e IC
U r
ecor
d4,
584
7.9
253
10.1
143.
226
79.
14,
851
8
I CU
epi
sode
s w
ith m
ore
than
one
ICU
rec
ord
5,37
19.
424
09.
510
2.3
250
8.4
5,62
19.
4
Hos
pita
l epi
sode
s w
ith m
ore
than
one
hos
pita
l a b
stra
ct12
,452
2369
2.9
00
692.
412
,521
20.9
Hos
pita
l epi
sode
s w
ith m
ore
than
one
ICU
re
cord
7,24
613
.430
512
.614
3.2
319
11.2
7,56
513
.3
Hos
pita
l epi
sode
s w
ith m
ore
than
one
ICU
e p
isod
e2,
630
4.9
989.
42,
728
4.8
's' i
ndic
ates
sup
pres
sed
due
to s
mal
l num
bers
Sou
rce:
Man
itoba
Cen
tre
for
Hea
lth P
olic
y, 2
012
Gra
nd T
otal
sN
on-M
anito
bans
Man
itoba
nsD
atab
ase
Hos
pita
lsN
on-D
atab
ase
Hos
pita
lsTo
tal
63,4
6057
,875
57,0
0954
,048
71,2
6043
843
8
2,81
12,
494
2,53
32,
421
2,49
4
ss
App
endi
x Ta
ble
A3.
5: A
ugm
ente
d S
umm
ary
of F
indi
ngs
Rel
ated
to
ICU
Epi
sode
s an
d IC
U-C
onta
inin
g H
ospi
tal E
piso
des
Hos
pita
l ent
ry a
fter
Jun
e 1,
199
8 an
d ho
spita
l sep
arat
ion
or b
efor
e M
arch
31,
200
8
66,7
2460
,807
59,9
8456
,907
74,1
92
3,26
42,
932
2,97
52,
859
2,93
2
453
438
442

172 University of Manitoba
Appendices
Appendix 4: Additional Information Related to Specific Aim 4
App
endi
x Ta
ble
A4.
1:
Dia
gnos
tic
Code
s fr
om W
inni
peg
ICU
Dat
abas
e
U
sed
to d
efine
spe
cific
dia
gnos
tic e
ntiti
es
Dia
gnos
tic E
ntity
Cod
es In
clud
ed
Adu
lt re
spira
tory
dis
tres
s sy
ndro
me
2.00
, 2.0
1S
eptic
sho
ck44
.xx
Sev
ere
seps
is45
.xx
Sep
ticem
ia46
.xx
AID
S, H
IV87
.xx,
88.
xxC
ardi
ac a
rres
t10
0.xx
Car
diog
enic
sho
ck10
1.xx
Acu
te c
oron
ary
isch
emia
102.
xx, 1
51.x
x, 1
52.x
x, 1
55.x
x, 7
63.2
0C
onge
stiv
e he
art
failu
re10
3.xx
, 763
.40,
763
.41
Hyp
ovol
emic
/hem
orrh
agic
sho
ck13
6.xx
Dia
bete
s, in
clud
ing
diab
etic
ket
oaci
dosi
s an
d no
nket
otic
hyp
eros
mol
ar s
tate
300.
xx, 3
01.x
x, 3
02.x
x
GI B
leed
ing
401.
xx, 4
02.x
xTr
aum
a60
0.00
to
699.
99P
oiso
ning
s, t
oxin
s (e
xclu
ding
adv
erse
dru
g re
actio
ns)
450.
00 t
o 49
9.99
Cor
onar
y ar
tery
byp
ass
graf
ting
750.
xxO
bstr
uctiv
e ai
rway
dis
ease
, inc
ludi
ng a
sthm
a, C
OP
D,
cyst
ic f
ibro
sis,
bro
nchi
ecta
sis
3.00
, 3.8
7, 3
.88,
3.8
9, 6
.00,
6.8
7, 6
.88,
6.8
9, 8
.00,
8.8
7, 8
.88,
8.8
9 17
.00,
17.
87, 1
7.88
, 17.
89, 1
8.00
, 18
.87,
18.
88, 1
8.89
Upp
er a
irway
dis
orde
rs, i
nclu
ding
pos
tope
rativ
e (e
xclu
ding
tra
uma)
20.0
0, 2
1.00
, 23.
00, 2
3.02
, 23.
04, 2
3.06
, 23.
07, 2
3.08
, 23.
09, 2
3.10
, 23.
11, 2
3.12
23.
13, 2
3.15
, 23.
90,
24.0
3, 2
4.07
, 24.
09H
epat
ic d
isor
ders
, inc
ludi
ng a
cute
, chr
onic
,
pr
imar
y liv
er c
ance
r, li
ver
tran
spla
ntat
ion,
co
mpl
icat
ions
of
liver
dis
ease
(exc
ludi
ng t
raum
a)
76.0
0, 2
19.0
7, 3
32.0
3, 4
04.0
0, 4
04.0
1 40
4.02
, 404
.90,
405
.00,
407
.00,
407
.01,
407
.02,
407
.03,
407
.87,
40
7.88
, 40
7.89
, 40
8.00
, 40
8.01
, 40
8.03
, 40
8.07
, 40
8.08
, 40
8.09
, 40
8.10
, 40
8.11
, 40
8.12
, 40
8.13
, 40
8.87
, 40
8.88
, 40
8.89
, 40
8.90
, 42
9.00
, 42
9.01
, 44
9.23
, 517
.00,
710
.00,
710
.01,
710
.02,
710
.03,
71
0.05
, 71
0.06
, 71
0.90
, 794
.20,
794
.27,
794
.28,
800
.00,
800
.02
Sou
rce:
Man
itoba
Cen
tre
for
Hea
lth P
olic
y, 2
012
App
endi
x Ta
ble
A4.
1: D
iagn
ostic
Cod
es f
rom
Win
nipe
g IC
U D
atab
ase
Use
d to
def
ine
spec
ific
diag
nost
ic e
ntiti
es

Manitoba Centre for Health Policy 173
The Epidemiology and Outcomes of Critical Illness in Manitoba
App
endi
x Ta
ble
A4.
2:
Una
djus
ted
Rate
of I
CU C
are
for M
anit
oban
s by
Yea
r and
Reg
iona
l Hea
lth
Aut
hori
ty (R
HA
) of R
esid
ency
Per 1
,000
pop
ulat
ion
1999
/200
020
00/0
120
01/0
220
02/0
320
03/0
420
04/0
520
05/0
620
06/0
720
07/0
8N
umbe
r P
erce
nt o
f To
tal
Sou
th E
astm
an3.
864.
093.
833.
513.
263.
173.
203.
313.
213.
491,
317
0.03
Cen
tral
10.3
010
.26
9.83
9.39
8.74
7.76
8.40
8.45
7.93
9.01
5,87
60.
12
Ass
inib
oine
5.11
5.24
4.91
4.14
4.16
4.03
4.06
4.69
5.05
4.60
2,25
80.
05
Bra
ndon
5.49
5.53
5.13
4.80
4.71
5.04
4.58
5.32
5.08
5.07
1,71
20.
04
Win
nipe
g5.
926.
325.
945.
635.
395.
375.
255.
225.
195.
5826
,190
0.55
I nte
rlake
5.10
6.33
4.87
5.08
5.21
5.91
4.61
5.34
6.47
5.44
2,86
10.
06
Nor
th E
astm
an4.
604.
014.
923.
885.
034.
205.
364.
555.
364.
661,
258
0.03
Par
klan
d10
.46
10.3
29.
339.
149.
309.
929.
629.
5410
.04
9.74
2,90
10.
06
Chu
rchi
ll2.
705.
474.
076.
651.
344.
184.
312.
892.
823.
8325
0.00
Nor
-Man
12.3
411
.70
11.4
15.
367.
696.
197.
056.
036.
448.
241,
294
0.03
Bur
ntw
ood
6.80
7.13
5.11
5.56
9.96
9.12
9.23
8.29
6.73
7.55
1,92
40.
00
Sou
rce:
Man
itoba
Cen
tre
for
Hea
lth P
olic
y, 2
012
Rat
e of
ICU
Car
e pe
r 1,
000
Pop
ulat
ion
ICU
Pat
ient
s R
HA
of
Res
iden
cy
App
endi
x Ta
ble
A4.
2: U
nadj
uste
d R
ate
of IC
U C
are
for
Man
itoba
ns b
y Y
ear
and
Reg
iona
l Hea
lth A
utho
rity
(RH
A) o
f R
esid
ency
Per
1,0
00 p
opul
atio
n
Unw
eigh
ted
Ave
rage

174 University of Manitoba
Appendices
Appendix Table A4.3: Unadjusted Rate of ICU Care for Manitobans by Year and Residency Location Per 1,000 population
Appendix Table A4.4: Unadjusted Rate of Urban ICU Care for Manitobans by Year and Residency Location Per 1,000 population
YearRural South
Mid North Total Rural UrbanRural:Urban
Ratio
1999/2000 4.00 4.06 4.29 4.06 5.83 0.70
2000/01 3.93 4.51 4.38 4.20 6.22 0.68
2001/02 3.85 4.10 4.63 4.05 5.83 0.69
2002/03 3.40 3.82 3.68 3.59 5.51 0.65
2003/04 3.34 4.13 4.09 3.73 5.29 0.71
2004/05 2.99 4.25 3.79 3.55 5.27 0.67
2005/06 3.23 4.08 4.22 3.67 5.11 0.72
2006/07 3.33 3.95 4.56 3.72 5.14 0.72
2007/08 3.61 4.84 4.49 4.17 5.12 0.81
Unweighted Average 3.52 4.19 4.24 3.86 5.48 0.70
Total rural is a true weighted average of the three rural areasSource: Manitoba Centre for Health Policy, 2012
Appendix Table A4.4: Unadjusted Rate of Urban ICU Care for Manitobans by Year and Residency Location
Per 1,000 population
YearRural South
Mid North Total Rural
UrbanRural:Urban
Ratio
1999/2000 7.02 6.50 8.86 7.09 5.89 1.20
2000/01 7.11 6.89 8.85 7.27 6.27 1.16
2001/02 6.76 6.12 7.48 6.63 5.88 1.13
2002/03 6.24 5.91 5.50 6.02 5.57 1.08
2003/04 5.91 6.28 8.97 6.46 5.34 1.21
2004/05 5.42 6.56 7.94 6.18 5.35 1.16
2005/06 5.71 6.13 8.35 6.22 5.20 1.20
2006/07 5.95 6.25 7.38 6.26 5.22 1.20
2007/08 5.80 7.13 6.57 6.38 5.18 1.23
Unweighted Average 6.21 6.42 7.77 6.50 5.55 1.17
Total rural is a true weighted average of the three rural areas
Source: Manitoba Centre for Health Policy, 2012
Appendix Table A4.3: Unadjusted Rate of ICU Care for Manitobans by Year and Residency Location Per 1,000 population

Manitoba Centre for Health Policy 175
The Epidemiology and Outcomes of Critical Illness in Manitoba
App
endi
x Ta
ble
A4.
5:
Una
djus
ted
Rate
of I
CU C
are
for M
anit
oban
s by
Yea
r and
Inco
me
Qui
ntile
s
App
endi
x Ta
ble
A4.
6:
Una
djus
ted
Rate
of U
rban
ICU
Car
e in
for M
anit
oban
s by
Yea
r and
Inco
me
Qui
ntile
s
Pe
r 1,0
00 p
opul
atio
n
1999
/200
020
00/0
120
01/0
220
02/0
320
03/0
420
04/0
520
05/0
620
06/0
720
07/0
8U
nwei
ghte
d A
vera
geN
umbe
rP
erce
nt
of T
otal
Urb
an 1
st (lo
wes
t)8.
639.
108.
147.
778.
267.
056.
957.
327.
377.
847,
770
16.3
2U
rban
2nd
6.18
6.79
6.21
5.81
5.21
5.67
5.43
5.38
4.99
5.74
5,76
112
.10
Urb
an 3
rd5.
725.
985.
765.
494.
874.
725.
094.
814.
985.
275,
297
11.1
2U
rban
4th
4.62
4.61
4.59
4.23
3.93
4.14
4.01
4.19
4.41
4.30
4,25
48.
93U
rban
5th
(hig
hest
)3.
724.
173.
903.
763.
723.
863.
573.
673.
283.
743,
660
7.69
Rur
al 1
st (lo
wes
t)9.
779.
768.
378.
229.
068.
908.
948.
818.
668.
944,
938
10.3
7R
ural
2nd
7.19
7.94
7.19
6.57
6.65
6.28
6.95
7.05
6.73
6.95
4,21
58.
85R
ural
3rd
6.09
6.21
5.83
5.44
6.31
5.53
5.34
5.79
6.11
5.85
3,60
97.
58R
ural
4th
6.67
6.94
6.37
5.60
5.63
5.19
5.32
5.33
5.95
5.89
3,60
17.
56R
ural
5th
(hig
hest
)5.
495.
475.
374.
404.
794.
894.
724.
384.
524.
893,
097
6.50
Inco
me
Unk
now
n17
.20
17.6
016
.87
17.8
317
.55
23.9
518
.54
16.8
918
.88
18.3
71,
414
2.97
Last
col
umn
is n
ot u
niqu
e pe
rson
s, a
s a
pers
on m
ay b
e in
an
ICU
in m
ultip
le y
ears
Sou
rce:
Man
itoba
Cen
tre
for
Hea
lth P
olic
y, 2
012
App
endi
x Ta
ble
A4.
5: U
nadj
uste
d R
ate
of IC
U C
are
for
Man
itoba
ns b
y Y
ear
and
Inco
me
Qui
ntile
s
ICU
Pat
ient
s (A
ll Y
ears
)In
com
e Q
uint
ileR
ate
of IC
U C
are
per
1,00
0 P
opul
atio
n
Inco
me
Qui
ntile
1999
/200
020
00/0
120
01/0
220
02/0
320
03/0
420
04/0
520
05/0
620
06/0
720
07/0
8U
nwei
ghte
d A
vera
geU
rban
1st
(low
est)
8.54
9.01
8.05
7.69
8.19
6.99
6.87
7.16
7.29
7.75
Urb
an 2
nd6.
156.
786.
155.
775.
175.
605.
375.
344.
965.
70
Urb
an 3
rd5.
695.
975.
735.
434.
844.
705.
004.
774.
945.
23
Urb
an 4
th4.
604.
594.
574.
203.
924.
123.
984.
144.
374.
28
Urb
an 5
th(h
ighe
st)
3.72
4.15
3.89
3.71
3.70
3.83
3.54
3.63
3.25
3.71
Rur
al 1
st (lo
wes
t)4.
984.
584.
964.
564.
524.
604.
394.
544.
814.
66
Rur
al 2
nd3.
994.
474.
423.
633.
433.
403.
824.
154.
373.
96
Rur
al 3
rd4.
074.
213.
703.
944.
273.
693.
553.
544.
263.
91
Rur
al 4
th3.
863.
973.
812.
903.
623.
203.
543.
574.
073.
62R
ural
5th
(hig
hest
)3.
483.
863.
453.
063.
023.
033.
172.
923.
443.
27
I nco
me
Unk
now
n11
.62
13.5
714
.55
15.6
914
.02
19.2
214
.94
13.8
616
.01
14.8
3
Sou
rce:
Man
itoba
Cen
tre
for
Hea
lth P
olic
y, 2
012
App
endi
x Ta
ble
A4.
6: U
nadj
uste
d R
ate
of U
rban
ICU
Car
e in
for
Man
itoba
ns b
y Y
ear
and
Inco
me
Qui
ntile
sP
er 1
,000
pop
ulat
ion

176 University of Manitoba
Appendices
Appendix 5: Additional Information Related to Specific Aim 5
App
endi
x Ta
ble
A5.
1:
Age
–Adj
uste
d H
ospi
tal M
orta
lity
Rate
s (%
) of P
atie
nts
Adm
itte
d to
ICU
s by
Man
itob
a Re
side
ncy
Stat
us a
nd Y
ear
For e
ach
indi
vidu
al, o
nly
thei
r firs
t epi
sode
of I
CU c
are
in e
ach
year
is c
onsi
dere
d
App
endi
x Ta
ble
A5.
2:
Age
–Adj
uste
d H
ospi
tal M
orta
lity
Rate
s (%
) for
Man
itob
ans
Adm
itte
d to
Man
itob
a IC
Us
by Y
ear
For e
ach
indi
vidu
al, o
nly
thei
r firs
t epi
sode
of I
CU c
are
in e
ach
year
is c
onsi
dere
d
Num
ber
of P
atie
nts
5,84
16,
190
5,72
65,
367
5,46
35,
374
5,35
95,
407
5,53
3--
Per
cent
Man
itoba
ns94
.794
.295
.095
.094
.695
.194
.795
.094
.4
Rat
e, M
anito
bans
12.7
712
.32
12.8
211
.65
13.6
912
.61
11.9
512
.04
11.3
212
.35
Rat
e, N
on-M
anito
bans
7.36
10.8
010
.12
6.55
8.06
10.0
611
.81
9.35
6.43
8.95
Rat
io o
f R
ates
Man
itoba
n:N
on
1.74
1.14
1.27
1.78
1.70
1.25
1.01
1.29
1.76
Sou
rce:
Man
itoba
Cen
tre
for
Hea
lth P
olic
y, 2
012
2005
/06
2006
/07
2007
/08
Unw
eigh
ted
Ave
rage
App
endi
x Ta
ble
A5.
1: A
ge-A
djus
ted
Hos
pita
l Mor
talit
y R
ates
(%) o
f P
atie
nts
Adm
itted
to
ICU
s by
Man
itoba
Res
iden
cy S
tatu
s an
d Y
ear
For
eac
h in
divi
dual
, onl
y th
eir
first
epi
sode
of
ICU
car
e in
eac
h ye
ar is
con
side
red
1999
/200
020
00/0
120
01/0
220
02/0
320
03/0
420
04/0
5
Unw
eigh
ted
Ave
rage
Num
ber
of P
atie
nts
5,53
45,
833
5,43
75,
100
5,16
85,
110
5,07
45,
136
5,22
4--
Per
cent
With
Rur
al IC
U C
are
Onl
y19
.518
.517
.217
.319
.519
.319
.618
.616
.6--
Rat
e, R
ural
ICU
Onl
y3.
372.
862.
893.
873.
603.
364.
704.
554.
883.
79R
ate,
Incl
uded
Urb
an IC
U C
are
15.4
214
.72
15.0
513
.39
16.6
815
.09
14.0
513
.79
12.7
114
.54
Rat
io o
f R
ates
, Rur
al O
nly:
Not
Rur
al O
nly
0.22
0.19
0.19
0.29
0.22
0.22
0.33
0.33
0.38
--
Per
cent
of
Mal
es59
.759
.058
.559
.760
.059
.659
.559
.860
.8--
Rat
e, M
ales
12.0
012
.67
11.5
710
.60
13.8
211
.67
10.7
812
.13
11.3
211
.84
Rat
e, F
emal
es14
.33
12.0
614
.68
13.6
013
.54
14.0
813
.89
12.2
612
.15
13.4
0R
atio
of
Rat
es, M
ale:
Fem
ale
0.84
1.05
0.79
0.78
1.02
0.83
0.78
0.99
0.93
--S
ourc
e: M
anito
ba C
entr
e fo
r H
ealth
Pol
icy,
201
2
2006
/07
2007
/08
App
endi
x Ta
ble
A5.
2: A
ge-A
djus
ted
Hos
pita
l Mor
talit
y R
ates
(%) f
or M
anito
bans
Adm
itted
to
Man
itoba
ICU
s by
Yea
rFo
r ea
ch in
divi
dual
, onl
y th
eir
first
epi
sode
of
ICU
car
e in
eac
h ye
ar is
con
side
red
1999
/200
020
00/0
120
01/0
220
02/0
320
03/0
420
04/0
520
05/0
6

Manitoba Centre for Health Policy 177
The Epidemiology and Outcomes of Critical Illness in Manitoba
Appendix Table A5.3: Age–Adjusted Hospital Mortality Rate (%) for Manitobans Admitted to Manitoba ICUs by Year and Residency Location For each individual, only their first episode of ICU care in each year is considered
Rural South
Mid North Urban
1999/2000 10.82 9.81 7.70 15.212000/01 9.25 10.07 10.29 14.422001/02 12.48 10.22 10.23 13.962002/03 6.81 6.96 17.72 13.722003/04 10.50 9.56 8.75 17.102004/05 10.90 8.02 13.24 14.402005/06 8.26 11.42 9.26 14.072006/07 9.86 11.54 12.88 12.952007/08 6.16 8.36 10.48 13.81
Unweighted Average
9.45 9.55 11.17 14.40
Source: Manitoba Centre for Health Policy, 2012
Appendix Table A5.3: Age-Adjusted Hospital Mortality Rate (%) for Manitobans Admitted to Manitoba ICUs by Year and Residency
Location For each individual, only their first episode of ICU care in each year is considered
YearResidency Location
Appendix Table A5.4: Age–Adjusted Hospital Mortality Rate (%) for Manitobans whose Index ICU Episode Included any Time in an Urban ICU by Year and Residency Location For each individual, only their first episode of urban ICU care in each year is considered
Rural South
Mid North Urban
1999/2000 16.44 12.73 13.37 15.582000/01 14.88 13.17 18.43 14.582001/02 19.74 12.93 16.78 14.232002/03 9.93 9.08 21.49 13.942003/04 16.25 12.45 16.14 17.462004/05 17.93 10.51 26.79 14.752005/06 12.80 15.65 13.98 14.282006/07 13.94 15.24 16.85 13.302007/08 7.76 9.23 14.95 13.97
Unweighted Average 14.41 12.33 17.64 14.68Source: Manitoba Centre for Health Policy, 2012
Appendix Table A5.4: Age-Adjusted Hospital Mortality Rate (%) for Manitobans whose Index ICU Episode Included any Time in an Urban
ICU by Year and Residency Location For each individual, only their first episode of urban ICU care in each year is considered
YearResidency Location

178 University of Manitoba
Appendices
App
endi
x Ta
ble
A5.
5:
Age
–Adj
uste
d H
ospi
tal M
orta
lity
Rate
(%) f
or M
anit
oban
s A
dmit
ted
to M
anit
oba
ICU
s by
Yea
r and
Inco
me
Qui
ntile
For e
ach
indi
vidu
al, o
nly
thei
r firs
t epi
sode
of I
CU c
are
in e
ach
year
is c
onsi
dere
d
Inco
me
Un
wei
gh
ted
Qu
inti
leA
vera
ge
Urb
an 1
st (
low
est)
18.8
614
.57
17.8
316
.50
18.3
815
.61
17.0
113
.85
16.8
616
.61
Urb
an 2
nd
15.1
712
.89
10.8
313
.02
16.4
715
.17
14.6
313
.20
11.0
413
.60
Urb
an 3
rd12
.78
16.4
912
.88
12.8
520
.91
13.6
211
.21
15.1
612
.30
14.2
4
Urb
an 4
th10
.02
11.3
215
.42
8.68
18.6
110
.03
13.4
87.
8115
.19
12.2
8
Urb
an 5
th (
hig
hes
t)10
.48
15.5
310
.87
10.8
310
.02
17.6
911
.88
15.0
610
.38
12.5
3
Ru
ral 1
st (l
ow
est)
8.32
7.53
10.6
89.
369.
739.
557.
0711
.92
9.35
9.28
Ru
ral 2
nd
10.5
56.
6912
.08
9.05
10.4
510
.21
8.12
12.5
37.
439.
68
Ru
ral 3
rd8.
7211
.09
9.57
7.42
9.36
8.77
9.32
9.61
5.52
8.82
Ru
ral 4
th12
.78
16.4
912
.88
12.8
520
.91
13.6
211
.21
15.1
612
.30
14.2
4
Ru
ral 5
th (h
igh
est)
9.50
11.6
19.
458.
2910
.68
12.5
910
.91
11.3
98.
9210
.37
Inco
me
Un
kno
wn
23.4
929
.99
13.6
819
.43
7.06
15.1
116
.94
11.8
714
.93
16.9
5S
ourc
e: M
anito
ba C
entr
e fo
r H
ealth
Pol
icy,
201
2
Ap
pen
dix
Tab
le A
5.5:
Ag
e-A
dju
sted
Ho
spit
al M
ort
alit
y R
ate
(%)
for
Man
ito
ban
s A
dm
itte
d t
o M
anit
ob
a IC
Us
by
Yea
r an
d
Inco
me
Qu
inti
leFo
r ea
ch in
divi
dual
, onl
y th
eir
first
epi
sode
of
ICU
car
e in
eac
h ye
ar is
con
side
red
1999
/200
020
00/0
120
01/0
220
02/0
320
03/0
420
04/0
520
05/0
620
06/0
720
07/0
8

Manitoba Centre for Health Policy 179
The Epidemiology and Outcomes of Critical Illness in Manitoba
Appendix Table A5.6: Age–Adjusted Hospital Mortality Rate (%) for Manitobans Admitted to Manitoba ICUs, Limited to ICU Episodes that Began in DBHs, by Year and ICU Admission Diagnosis Type For each individual, only their first episode of ICU care in each year is considered
Appendix Table A5.7: Unadjusted ICU Mortality Rates (%) for All Patients Admitted to Manitoba ICUs by Year and Provincial Residency Status For each individual, only their first episode of ICU care in each year is considered
Number ICU Mortality
RateNumber
ICU Mortality Rate
1999/2000 5,534 8.78 307 7.172000/01 5,833 9.19 357 7.562001/02 5,437 8.70 289 7.612002/03 5,100 8.27 267 6.372003/04 5,168 9.69 295 6.782004/05 5,110 10.39 264 10.612005/06 5,074 9.93 285 9.472006/07 5,136 9.54 271 7.382007/08 5,224 9.92 309 5.83
Unweighted Average
-- 9.38 -- 7.64
Source: Manitoba Centre for Health Policy, 2012
Year
Manitobans Non-Manitobans
Appendix Table A5.7: Unadjusted ICU Mortality Rates (%) for All Patients Admitted to Manitoba ICUs by Year and Provincial
Residency statusFor each individual, only their first episode of ICU care in each year is considered
Cardiac Medical Surgical1999/2000 6.68 28.65 15.152000/01 1.86 27.55 15.232001/02 1.86 27.07 14.002002/03 2.10 26.99 11.452003/04 6.79 27.16 14.992004/05 5.16 26.83 12.042005/06 3.10 23.11 12.802006/07 2.64 22.05 13.182007/08 2.36 21.88 10.20
Unweighted Average
3.62 25.70 13.23
Source: Manitoba Centre for Health Policy, 2012
Appendix Table A5.6: Age-Adjusted Hospital Mortality Rate (%) for Manitobans Admitted to Manitoba ICUs, Limited to ICU Episodes that Began in DBHs, by Year
and ICU Admission Diagnosis TypeFor each individual, only their first episode of ICU care in each year is
considered
YearType of ICU Admission Diagnosis

180 University of Manitoba
Appendices
Appendix Table A5.8: Unadjusted ICU Mortality Rates (%) for Manitobans Admitted to Manitoba ICUs by Year and Type of ICU For each individual, only their first episode of ICU care in each year is considered
Number ICU Mortality Rate Number ICU Mortality Rate1999/2000 1,080 1.85 4,454 10.462000/01 1,080 1.85 4,753 10.862001/02 933 2.79 4,504 9.922002/03 880 2.39 4,220 9.502003/04 1,006 2.39 4,162 11.462004/05 985 2.84 4,125 12.192005/06 995 4.12 4,079 11.352006/07 956 4.39 4,180 10.722007/08 869 4.37 4,355 11.02
Unweighted Average
-- 3.00 -- 10.83
Source: Manitoba Centre for Health Policy, 2012
YearRural ICU Care Only Any Urban ICU Care
Appendix Table A5.8: Unadjusted ICU Mortality Rates (%) for Manitobans Admitted to Manitoba ICUs by Year and Type of ICUFor each individual, only their first episode of ICU care in each year is considered
Appendix Table A5.9: Unadjusted Mortality Rates (%) at 30 Days After ICU Admission for Manitobans Admitted to Manitoba ICUs by Year and Sex For each individual, only their first episode of ICU care in each year is considered
Number ICU Mortality Rate Number ICU Mortality Rate
1999/2000 3,306 14.40 2,228 14.722000/01 3,444 13.70 2,389 15.322001/02 3,182 13.17 2,255 15.882002/03 3,044 13.37 2,056 15.522003/04 3,100 15.10 2,068 16.342004/05 3,047 15.20 2,063 16.972005/06 3,017 13.79 2,057 16.332006/07 3,069 14.50 2,067 14.662007/08 3,178 13.75 2,046 16.23
Unweighted Average
-- 14.11 -- 15.77
Source: Manitoba Centre for Health Policy, 2012
YearMales Females
Appendix Table A5.9: Unadjusted Mortality Rates (%) at 30 Days After ICU Admission for Manitobans Admitted to Manitoba ICUs by Year and Sex
For each individual, only their first episode of ICU care in each year is considered

Manitoba Centre for Health Policy 181
The Epidemiology and Outcomes of Critical Illness in Manitoba
Appendix Table A5.10: Unadjusted Mortality Rates (%) at 30 Days After ICU Admission for Manitobans Admitted to Manitoba ICUs by Year and ICU Type For each individual, only their first episode of ICU care in each year is considered
Number ICU Mortality Rate Number ICU Mortality Rate1999/2000 1,080 6.39 4,454 16.502000/01 1,080 5.93 4,753 16.282001/02 933 6.54 4,504 15.902002/03 880 8.07 4,220 15.522003/04 1,006 7.65 4,162 17.522004/05 985 8.22 4,125 17.752005/06 995 8.74 4,079 16.302006/07 956 9.52 4,180 15.722007/08 869 8.40 4,355 15.98
Unweighted Average
-- 7.72 -- 16.39
Source: Manitoba Centre for Health Policy, 2012
YearRural ICU Care Only Any Urban ICU Care
Appendix Table A5.10: Unadjusted Mortality Rates (%) at 30 Days After ICU Admission for Manitobans Admitted to Manitoba ICUs by Year and ICU Type
For each individual, only their first episode of ICU care in each year is considered
17-29 10.19 8.48 10.70 6.45 12.76 10.95 8.04 8.29 4.72 8.9530-39 11.43 13.25 12.63 8.29 11.50 8.30 6.87 6.40 6.16 9.4340-44 8.91 7.76 8.59 9.64 6.44 6.16 9.69 6.47 8.77 8.0545-49 5.69 9.31 10.00 7.49 9.49 8.71 12.28 9.12 13.36 9.4950-54 9.04 8.64 6.99 8.29 10.20 8.53 10.25 9.90 9.15 9.0055-59 12.35 9.83 9.32 9.62 10.09 11.59 9.30 12.60 11.13 10.6560-64 11.63 10.40 12.55 10.94 10.41 10.63 10.74 11.42 10.52 11.0365-69 12.61 12.14 12.48 14.13 12.41 12.04 13.61 13.70 14.03 13.0270-74 14.21 13.91 13.73 16.33 17.15 21.23 17.71 14.76 15.89 16.1075-79 18.15 16.88 16.79 15.74 17.15 22.26 19.04 16.85 19.66 18.0680-84 19.96 22.99 19.59 24.24 24.43 23.62 20.71 21.02 23.94 22.2885-89 27.12 23.42 27.03 22.78 28.92 27.57 25.26 29.03 23.87 26.1190+ 28.10 30.47 28.46 25.00 47.66 29.13 33.33 29.29 30.56 31.33
Source: Manitoba Centre for Health Policy, 2012
2007/08Unweighted
Average Rate
Appendix Table A5.11: Mortality Rates (%) at 30 Days After ICU Admission for Manitobans Admitted to Manitoba ICUs by Year and Age Group
For each individual, only their first episode of ICU care in each year is considered
Age Group 1999/2000 2000/01 2001/02 2002/03 2003/04 2004/05 2005/06 2006/07
Appendix Table A5.11: Mortality Rates (%) at 30 Days After ICU Admission for Manitobans Admitted to Manitoba ICUs by Year and Age Group For each individual, only their first episode of ICU care in each year is considered

182 University of Manitoba
Appendices
Appendix Table A5.12: Linear Regression Results, for Manitobans, of Age–Specific 30–Day Mortality Rates Versus Time (Years)
17-29 -0.387 0.24830-39 -0.885 0.002*40-44 -0.095 0.63045-49 0.598 0.031*50-54 0.183 0.19255-59 0.089 0.62860-64 -0.089 0.37265-69 0.175 0.10870-74 0.369 0.25875-79 0.283 0.30280-84 0.194 0.47785-89 0.085 0.80190+ 0.336 0.717
* p<0.05Source: Manitoba Centre for Health Policy, 2012
Appendix Table A5.12: Linear Regression Results, for Manitobans, of Age-Specific 30-Day Mortality
Rates Versus Time (Years)
Age Group Slope p-value
Appendix Table A5.13: Unadjusted Mortality Rates (%) at 180 Days After ICU Admission for Manitobans Admitted to Manitoba ICUs by Year and Sex For each individual, only their first episode of ICU care in each year is considered
Number ICU Mortality Rate Number ICU Mortality Rate
1999/2000 3,306 19.06 2,228 19.792000/01 3,444 18.58 1,131 20.552001/02 3,182 18.23 2,255 20.582002/03 3,044 18.63 2,056 21.892003/04 3,100 19.13 2,068 21.712004/05 3,047 20.61 2,063 22.832005/06 3,017 18.13 2,057 22.462006/07 3,069 18.83 2,067 20.562007/08 3,178 17.75 2,046 20.77
Unweighted Average
-- 18.77 -- 21.24
Source: Manitoba Centre for Health Policy, 2012
YearMales Females
Appendix Table A5.13: Unadjusted Mortality Rates (%) at 180 Days After ICU Admission for Manitobans Admitted to Manitoba ICUs by Year and Sex
For each individual, only their first episode of ICU care in each year is considered

Manitoba Centre for Health Policy 183
The Epidemiology and Outcomes of Critical Illness in Manitoba
Appendix Table A5.14: Unadjusted Mortality Rates (%) at 180 Days After ICU Admission for Manitobans Admitted to Manitoba ICUs by Year and ICU Type For each individual, only their first episode of ICU care in each year is considered
Number ICU Mortality Rate Number ICU Mortality Rate
1999/2000 1,080 9.54 4,454 21.732000/01 1,080 9.81 4,753 21.572001/02 933 10.29 4,504 21.052002/03 880 12.73 4,220 21.452003/04 1,006 10.74 4,162 22.442004/05 985 13.20 4,125 23.492005/06 995 12.36 4,079 21.722006/07 956 12.87 4,180 21.052007/08 869 11.74 4,355 20.37
Unweighted Average
11.48 -- 21.65
Source: Manitoba Centre for Health Policy, 2012
YearRural ICU Care Only Any Urban ICU Care
Appendix Table A5.14: Unadjusted Mortality Rates (%) at 180 Days After ICU Admission for Manitobans Admitted to Manitoba ICUs by Year and ICU
TypeFor each individual, only their first episode of ICU care in each year is considered
Appendix Table A5.15: Mortality Rates (%) at 180 Days After ICU Admission for Manitobans Admitted to Manitoba ICUs by Year and Age Group For each individual, only their first episode of ICU care in each year is considered
UnweightedAverage Rate
17-29 11.11 10.27 12.30 7.53 14.80 11.44 9.05 8.29 5.58 10.04
30-39 13.06 13.25 15.15 11.06 13.72 11.07 9.54 7.60 8.53 11.44
40-44 11.88 10.50 10.61 11.17 8.15 9.48 11.73 10.45 9.65 10.40
45-49 9.61 11.38 13.10 9.77 11.53 9.47 14.37 12.50 15.07 11.87
50-54 10.11 11.11 9.88 13.10 12.50 11.63 12.75 12.87 10.09 11.56
55-59 15.38 14.23 13.04 13.18 13.16 14.84 12.98 14.92 14.53 14.03
60-64 14.82 15.69 16.53 15.75 13.47 15.67 14.11 15.65 13.62 15.03
65-69 17.57 15.33 17.12 18.84 17.55 17.22 20.69 18.70 17.67 17.85
70-74 20.74 18.63 18.17 22.98 21.85 26.67 22.54 24.01 19.42 21.67
75-79 24.67 22.69 23.16 24.05 22.91 30.23 25.99 24.01 27.15 24.98
80-84 26.37 31.19 26.41 31.91 32.16 32.50 28.60 29.80 32.20 30.13
85-89 35.59 35.26 38.37 33.81 38.68 39.20 37.37 35.19 31.72 36.13
90+ 37.19 41.41 34.15 36.61 54.21 42.52 38.33 40.00 40.74 40.57Source: Manitoba Centre for Health Policy, 2012
2007/08
Appendix Table A5.15: Mortality Rates (%) at 180 Days After ICU Admission for Manitobans Admitted to Manitoba ICUs by Year and Age Group
For each individual, only their first episode of ICU care in each year is considered
Age Group 1999/2000 2000/01 2001/02 2002/03 2003/04 2004/05 2005/06 2006/07

184 University of Manitoba
Appendices
Appendix Table A5.16: Linear Regression Results, for Manitobans, of Yearly Age–Specific 180–Day Mortality Rates Versus Time (Years)
17-29 -0.511 0.16530-39 -0.771 0.006*40-44 -0.142 0.38545-49 0.457 0.08350-54 0.158 0.38455-59 0.003 0.98060-64 -0.164 0.26565-69 0.268 0.17270-74 0.242 0.50975-79 0.428 0.19380-84 0.402 0.22985-89 -0.205 0.55890+ 0.405 0.619
* p<0.05Source: Manitoba Centre for Health Policy, 2012
Appendix Table A5.16: Linear Regression Results, for Manitobans, of Yearly Age-Specific 180-Day
Mortality Rates Versus Time (Years)
Age Group Slope p-value
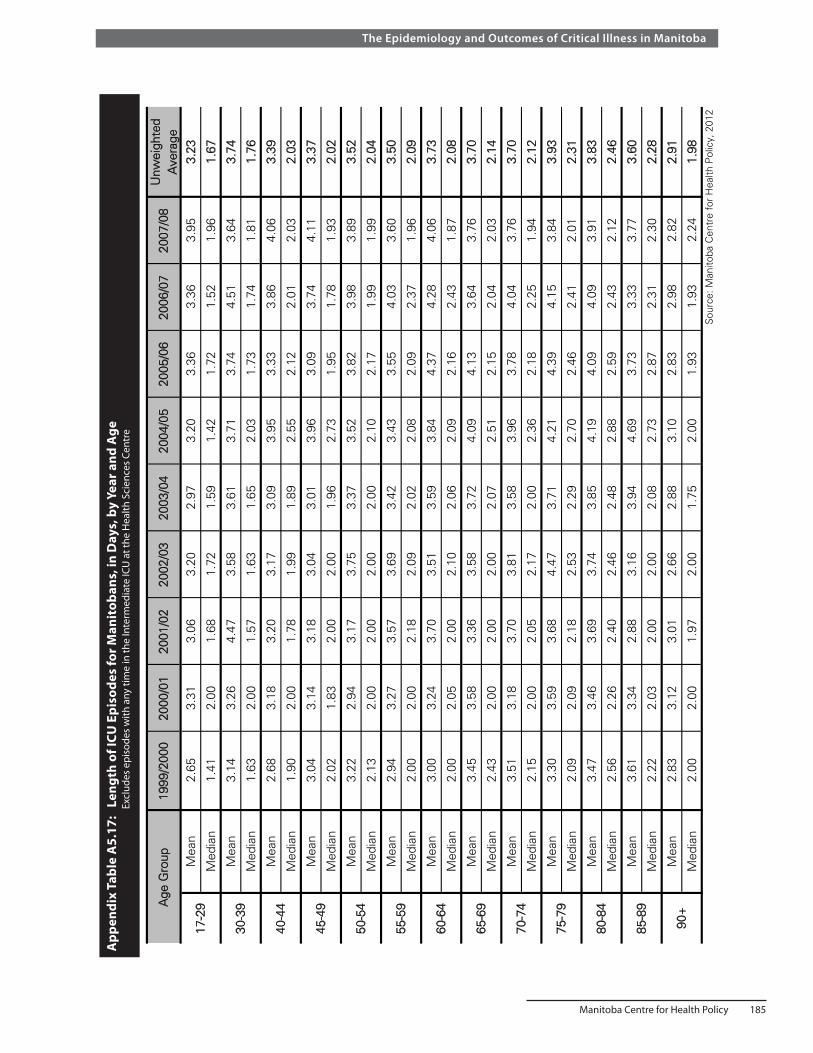
Manitoba Centre for Health Policy 185
The Epidemiology and Outcomes of Critical Illness in Manitoba
App
endi
x Ta
ble
A5.
17:
Len
gth
of IC
U E
piso
des
for M
anit
oban
s, in
Day
s, b
y Ye
ar a
nd A
ge
E
xclu
des
epis
odes
with
any
tim
e in
the
Inte
rmed
iate
ICU
at t
he H
ealth
Sci
ence
s Ce
ntre
Unw
eigh
ted
Ave
rage
Mea
n2.
653.
313.
063.
202.
973.
203.
363.
363.
953.
23
Med
ian
1.41
2.00
1.68
1.72
1.59
1.42
1.72
1.52
1.96
1.67
Mea
n3.
143.
264.
473.
583.
613.
713.
744.
513.
643.
74
Med
ian
1.63
2.00
1.57
1.63
1.65
2.03
1.73
1.74
1.81
1.76
Mea
n2.
683.
183.
203.
173.
093.
953.
333.
864.
063.
39
Med
ian
1.90
2.00
1.78
1.99
1.89
2.55
2.12
2.01
2.03
2.03
Mea
n3.
043.
143.
183.
043.
013.
963.
093.
744.
113.
37
Med
ian
2.02
1.83
2.00
2.00
1.96
2.73
1.95
1.78
1.93
2.02
Mea
n3.
222.
943.
173.
753.
373.
523.
823.
983.
893.
52
Med
ian
2.13
2.00
2.00
2.00
2.00
2.10
2.17
1.99
1.99
2.04
Mea
n2.
943.
273.
573.
693.
423.
433.
554.
033.
603.
50
Med
ian
2.00
2.00
2.18
2.09
2.02
2.08
2.09
2.37
1.96
2.09
Mea
n3.
003.
243.
703.
513.
593.
844.
374.
284.
063.
73
Med
ian
2.00
2.05
2.00
2.10
2.06
2.09
2.16
2.43
1.87
2.08
Mea
n3.
453.
583.
363.
583.
724.
094.
133.
643.
763.
70
Med
ian
2.43
2.00
2.00
2.00
2.07
2.51
2.15
2.04
2.03
2.14
Mea
n3.
513.
183.
703.
813.
583.
963.
784.
043.
763.
70
Med
ian
2.15
2.00
2.05
2.17
2.00
2.36
2.18
2.25
1.94
2.12
Mea
n3.
303.
593.
684.
473.
714.
214.
394.
153.
843.
93
Med
ian
2.09
2.09
2.18
2.53
2.29
2.70
2.46
2.41
2.01
2.31
Mea
n3.
473.
463.
693.
743.
854.
194.
094.
093.
913.
83
Med
ian
2.56
2.26
2.40
2.46
2.48
2.88
2.59
2.43
2.12
2.46
Mea
n3.
613.
342.
883.
163.
944.
693.
733.
333.
773.
60
Med
ian
2.22
2.03
2.00
2.00
2.08
2.73
2.87
2.31
2.30
2.28
Mea
n2.
833.
123.
012.
662.
883.
102.
832.
982.
822.
91
Med
ian
2.00
2.00
1.97
2.00
1.75
2.00
1.93
1.93
2.24
1.98
Sou
rce:
Man
itoba
Cen
tre
for
Hea
lth P
olic
y, 2
012
80-8
4
85-8
9
90+
Age
Gro
up
55-5
9
60-6
4
65-6
9
70-7
4
75-7
9
17-2
9
30-3
9
40-4
4
45-4
9
50-5
4
App
endi
x Ta
ble
A5.
17: L
engt
h of
ICU
Epi
sode
s fo
r M
anito
bans
, in
Day
s, b
y Y
ear
and
Age
E
xclu
des
epis
odes
with
any
tim
e in
the
Inte
rmed
iate
ICU
at
the
Hea
lth S
cien
ces
Cen
tre
1999
/200
020
00/0
120
01/0
220
02/0
320
03/0
420
04/0
520
05/0
620
06/0
720
07/0
8
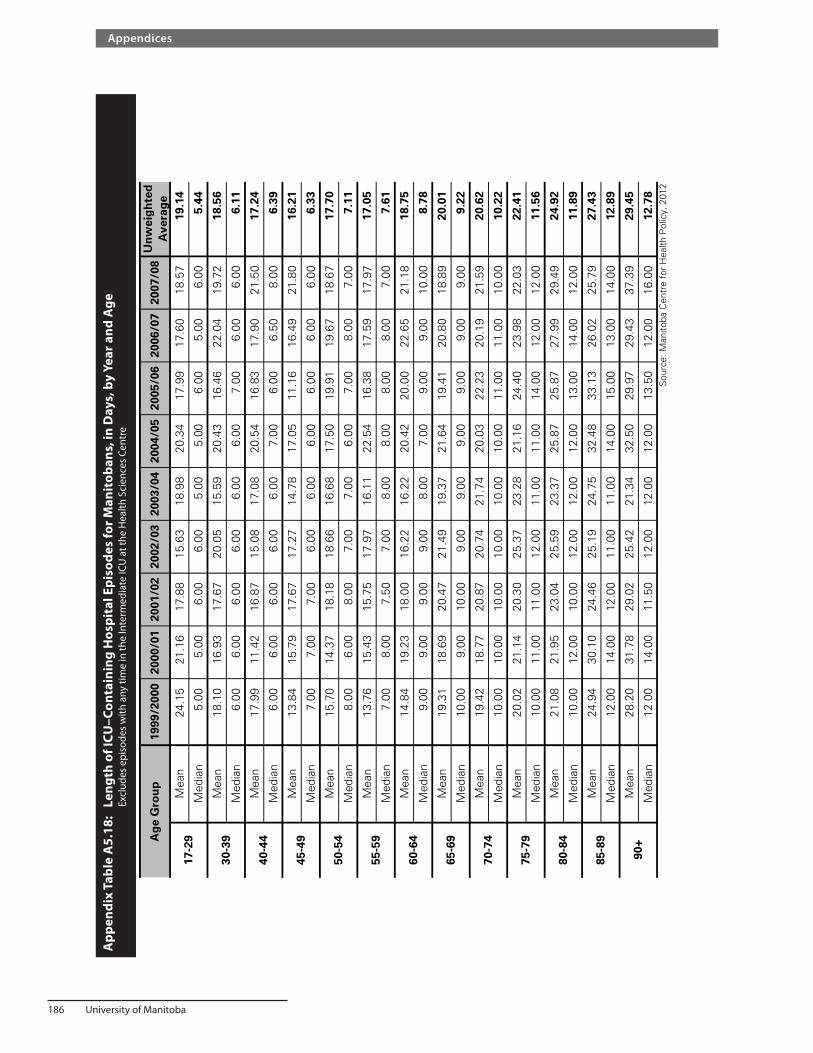
186 University of Manitoba
Appendices
App
endi
x Ta
ble
A5.
18:
Len
gth
of IC
U–C
onta
inin
g H
ospi
tal E
piso
des
for M
anit
oban
s, in
Day
s, b
y Ye
ar a
nd A
ge
Excl
udes
epi
sode
s w
ith a
ny ti
me
in th
e In
term
edia
te IC
U a
t the
Hea
lth S
cien
ces
Cent
re
Un
wei
gh
ted
Ave
rag
eM
ean
24.1
521
.16
17.8
815
.63
18.9
820
.34
17.9
917
.60
18.5
719
.14
Med
ian
5.00
5.00
6.00
6.00
5.00
5.00
6.00
5.00
6.00
5.44
Mea
n18
.10
16.9
317
.67
20.0
515
.59
20.4
316
.46
22.0
419
.72
18.5
6
Med
ian
6.00
6.00
6.00
6.00
6.00
6.00
7.00
6.00
6.00
6.11
Mea
n17
.99
11.4
216
.87
15.0
817
.08
20.5
416
.83
17.9
021
.50
17.2
4
Med
ian
6.00
6.00
6.00
6.00
6.00
7.00
6.00
6.50
8.00
6.39
Mea
n13
.84
15.7
917
.67
17.2
714
.78
17.0
511
.16
16.4
921
.80
16.2
1
Med
ian
7.00
7.00
7.00
6.00
6.00
6.00
6.00
6.00
6.00
6.33
Mea
n15
.70
14.3
718
.18
18.6
616
.68
17.5
019
.91
19.6
718
.67
17.7
0
Med
ian
8.00
6.00
8.00
7.00
7.00
6.00
7.00
8.00
7.00
7.11
Mea
n13
.76
15.4
315
.75
17.9
716
.11
22.5
416
.38
17.5
917
.97
17.0
5
Med
ian
7.00
8.00
7.50
7.00
8.00
8.00
8.00
8.00
7.00
7.61
Mea
n14
.84
19.2
318
.00
16.2
216
.22
20.4
220
.00
22.6
521
.18
18.7
5
Med
ian
9.00
9.00
9.00
9.00
8.00
7.00
9.00
9.00
10.0
08.
78
Mea
n19
.31
18.6
920
.47
21.4
919
.37
21.6
419
.41
20.8
018
.89
20.0
1
Med
ian
10.0
09.
0010
.00
9.00
9.00
9.00
9.00
9.00
9.00
9.22
Mea
n19
.42
18.7
720
.87
20.7
421
.74
20.0
322
.23
20.1
921
.59
20.6
2
Med
ian
10.0
010
.00
10.0
010
.00
10.0
010
.00
11.0
011
.00
10.0
010
.22
Mea
n20
.02
21.1
420
.30
25.3
723
.28
21.1
624
.40
23.9
822
.03
22.4
1
Med
ian
10.0
011
.00
11.0
012
.00
11.0
011
.00
14.0
012
.00
12.0
011
.56
Mea
n21
.08
21.9
523
.04
25.5
923
.37
25.8
725
.87
27.9
929
.49
24.9
2
Med
ian
10.0
012
.00
10.0
012
.00
12.0
012
.00
13.0
014
.00
12.0
011
.89
Mea
n24
.94
30.1
024
.46
25.1
924
.75
32.4
833
.13
26.0
225
.79
27.4
3
Med
ian
12.0
014
.00
12.0
011
.00
11.0
014
.00
15.0
013
.00
14.0
012
.89
Mea
n28
.20
31.7
829
.02
25.4
221
.34
32.5
029
.97
29.4
337
.39
29.4
5
Med
ian
12.0
014
.00
11.5
012
.00
12.0
012
.00
13.5
012
.00
16.0
012
.78
Sou
rce:
Man
itoba
Cen
tre
for
Hea
lth P
olic
y, 2
012
Ap
pen
dix
Tab
le A
5.18
: Len
gth
of
ICU
-Co
nta
inin
g H
osp
ital
Ep
iso
des
fo
r M
anit
ob
ans,
in D
ays,
by
Yea
r an
d A
ge
Exc
lude
s ep
isod
es w
ith a
ny t
ime
in t
he In
term
edia
te IC
U a
t th
e H
ealth
Sci
ence
s C
entr
e
1999
/200
020
00/0
120
01/0
220
02/0
320
03/0
420
04/0
520
05/0
620
06/0
720
07/0
8A
ge
Gro
up
17-2
9
30-3
9
40-4
4
45-4
9
50-5
4
80-8
4
85-8
9
90+
55-5
9
60-6
4
65-6
9
70-7
4
75-7
9

Manitoba Centre for Health Policy 187
The Epidemiology and Outcomes of Critical Illness in Manitoba
App
endi
x Ta
ble
A5.
19:
Ann
ual M
edic
al R
esou
rce
in th
e G
ener
al P
opul
atio
n of
Man
itob
a, A
ged
17 a
nd O
lder
Par
amet
er
1999
/200
020
00/0
120
01/0
220
02/0
320
03/0
420
04/0
520
05/0
620
06/0
720
07/0
8U
nwei
ghte
d A
vera
ge R
ate
Phy
sici
an V
isits
81.9
82.0
81.9
81.8
81.8
81.4
81.9
81.9
80.3
81.7
Pre
scrip
tion
Cos
ts71
.071
.671
.471
.471
.772
.072
.672
.672
.771
.9
Hos
pita
l Day
s8.
28.
07.
97.
77.
77.
57.
57.
47.
37.
7
Hom
ecar
e U
se3.
01.
42.
31.
71.
61.
51.
7--
--1.
9
Phy
sici
an V
isits
6.4
6.4
6.5
6.5
6.5
6.4
6.4
6.4
6.0
6.4
Pre
scrip
tion
cost
s54
1.0
591.
664
5.3
727.
278
2.9
817.
185
8.7
902.
394
5.5
756.
8
Hos
pita
l day
s11
.713
.313
.012
.913
.013
.313
.113
.313
.112
.9
Phy
sici
an V
isits
5.3
5.3
5.3
5.3
5.3
5.2
5.3
5.2
5.7
5.3
Pre
scrip
tion
Cos
ts38
3.8
423.
346
0.9
519.
156
1.4
588.
362
3.7
655.
168
7.1
544.
7
Hos
pita
l day
s1.
01.
11.
01.
01.
01.
01.
01.
01.
01.
0S
ourc
e: M
anito
ba C
entr
e fo
r H
ealth
Pol
icy,
201
2
App
endi
x Ta
ble
A5.
19: A
nnua
l Med
ical
Res
ourc
e in
the
Gen
eral
Pop
ulat
ion
of M
anito
ba, A
ged
17 a
nd O
lder
Perc
ent W
ith A
ny
Mea
n A
mon
g Th
ose
Who
Had
Any
Mea
n A
mon
g A
ll In
clud
ing
Thos
e W
ho H
ad N
one

188 University of Manitoba
Appendices
Appendix Table A5.20: Linear Regression Models of the Number of Outpatient Physician Visits in the One Year After Hospital Discharge
Coefficient Coefficient(Number of visits) (Number of visits)
Urban ICU care while in hospital 0.91 0.79 , 1.02 <.0001 1.34 1.19 , 1.48 <.0001Time (fraction of 1 year) 17.66 17.44 , 17.88 <.0001 13.60 13.40 , 13.79 <.0001Initial age [model A] or Age [model B](years) -0.02 -0.16 , 0.12 0.74 0.060 0.059 , 0.062 <.0001Age deviation [model A only] (years) -0.04 -0.06 , -0.02 0.0001 -- -- , -- --Male sex -1.31 -4.16 , 1.53 0.37 -0.97 -1.03 , -0.91 <.0001Income Quintile Urban 1 (lowest) reference -- reference -- Urban 2 -0.05 -0.33 , 0.24 0.76 -0.62 -0.74 , -0.51 <.0001 Urban 3 -0.09 -0.41 , 0.23 0.59 -0.52 -0.63 , -0.40 <.0001 Urban 4 0.03 -0.33 , 0.39 0.88 -0.80 -0.92 , -0.68 <.0001 Urban 5 (highest) 0.55 0.18 , 0.91 0.003 -0.75 -0.88 , -0.63 <.0001 Rural 1 (lowest) -0.17 -0.60 , 0.26 0.45 -2.19 -2.31 , -2.07 <.0001 Rural 2 -0.30 -0.74 , 0.15 0.19 -2.04 -2.16 , -1.92 <.0001 Rural 3 0.003 -0.42 , 0.43 0.99 -1.84 -1.96 , -1.71 <.0001 Rural 4 0.23 -0.20 , 0.66 0.30 -1.62 -1.75 , -1.49 <.0001 Rural 5 (highest) 0.22 -0.23 , 0.68 0.34 -1.70 -1.84 , -1.57 <.0001 Income Unknown 1.74 1.36 , 2.13 <.0001 -1.00 -1.24 , -0.76 <.0001Discharged to other than home 4.30 4.04 , 4.57 <.0001 2.80 2.58 , 3.02 <.0001Hospital length of stay (days) 0.009 0.007 , 0.010 <.0001 0.001 0.000 , 0.002 0.06Most responsible hospital diagnosis category: Cardiovascular disease reference -- reference -- Neoplasms -0.14 -0.27 , -0.01 0.04 -1.93 -2.10 , -1.76 <.0001 Blood and Blood-Forming Organs -0.14 -0.39 , 0.11 0.26 1.01 0.61 , 1.42 <.0001 Mental Disorders -0.22 -0.41 , -0.03 0.02 1.31 1.13 , 1.50 <.0001 Endocrine, Nutritional, Metabolic, Immunity -0.25 -0.41 , -0.08 0.003 -0.65 -0.89 , -0.42 <.0001 Congenital Anomalies -0.36 -1.00 , 0.29 0.28 -1.28 -1.86 , -0.69 <.0001 Skin and Subcutaneous Tissue -0.47 -0.71 , -0.24 <.0001 -0.97 -1.22 , -0.72 <.0001 Symptoms, Signs, and Ill-defined conditions -0.66 -0.77 , -0.55 <.0001 -0.47 -0.62 , -0.32 <.0001 Nervous System and Sense Organs -0.82 -1.02 , -0.62 <.0001 -0.51 -0.72 , -0.29 <.0001 Respiratory System -0.85 -0.96 , -0.74 <.0001 -1.23 -1.38 , -1.08 <.0001 Injury and Poisoning -0.92 -1.03 , -0.81 <.0001 -2.11 -2.24 , -1.99 <.0001 Genitourinary System -0.97 -1.10 , -0.84 <.0001 -2.11 -2.25 , -1.98 <.0001 Infectious and Parasitic Diseases -1.09 -1.32 , -0.87 <.0001 -1.58 -1.87 , -1.30 <.0001 Digestive System -1.16 -1.26 , -1.05 <.0001 -2.22 -2.34 , -2.10 <.0001 Musculoskeletal and Connective Tissue -1.20 -1.33 , -1.07 <.0001 -1.25 -1.39 , -1.11 <.0001 Factors Influencing Health Status -1.43 -1.54 , -1.32 <.0001 -1.92 -2.07 , -1.76 <.0001 Complications of Pregnancy, and Childbirth -2.06 -2.28 , -1.84 <.0001 -4.00 -4.16 , -3.84 <.0001 Conditions Originating in Perinatal Period -2.72 -5.91 , 0.46 0.09 3.37 2.12 , 4.62 <.0001
----
-- --
Variable p-value p-value95% CI 95% CI
Appendix Table A5.20: Linear Regression Models of the Number of Outpatient Physician Visits in the One Year After Hospital Discharge
Model AGEE* Model of all Hospital Episodes
N=657,256
Model BModel of Initial Hospital Episodes
N=294,905

Manitoba Centre for Health Policy 189
The Epidemiology and Outcomes of Critical Illness in Manitoba
Pre-existing comorbid disorders: Metastatic cancer 1.82 1.55 , 2.09 <.0001 7.23 7.01 , 7.46 <.0001 Solid tumor without metastasis 1.13 0.94 , 1.32 <.0001 4.22 4.04 , 4.40 <.0001 Lymphoma 1.09 0.51 , 1.67 0.0002 6.88 6.46 , 7.30 <.0001 Paralysis 0.53 0.12 , 0.94 0.01 -0.31 -0.67 , 0.05 0.09 Liver disease 0.50 0.03 , 0.96 0.04 3.69 3.36 , 4.01 <.0001 Obesity 0.38 -0.03 , 0.78 0.07 1.12 0.82 , 1.41 <.0001 Deficiency anemia 0.34 -0.01 , 0.68 0.06 0.50 0.19 , 0.81 0.002 Rheumatoid arthritis/collagen-vascular disease 0.29 -0.07 , 0.65 0.12 3.44 3.17 , 3.71 <.0001 Coagulopathy 0.27 -0.22 , 0.76 0.27 1.87 1.45 , 2.28 <.0001 Peptic ulcer disease without bleeding 0.26 -0.36 , 0.88 0.41 1.76 1.29 , 2.23 <.0001 Valvular heart disease 0.17 -0.13 , 0.48 0.27 2.31 2.03 , 2.58 <.0001 Arrythmia 0.16 0.01 , 0.31 0.04 0.92 0.79 , 1.05 <.0001 Blood loss anemia 0.10 -0.40 , 0.61 0.69 0.21 -0.27 , 0.69 0.38 Hypertension, uncomplicated 0.07 -0.04 , 0.18 0.19 0.55 0.45 , 0.64 <.0001 Congestive heart failure 0.04 -0.10 , 0.18 0.57 0.60 0.45 , 0.75 <.0001 Chronic pulmonary disease 0.04 -0.14 , 0.22 0.70 1.13 0.99 , 1.28 <.0001 Depression 0.02 -0.21 , 0.26 0.84 2.96 2.78 , 3.13 <.0001 Drug abuse 0.005 -0.47 , 0.48 0.98 1.84 1.56 , 2.11 <.0001 Other neurologic disorders -0.06 -0.32 , 0.20 0.64 1.11 0.92 , 1.31 <.0001 Hypothyroidism -0.07 -0.34 , 0.19 0.59 0.28 0.06 , 0.49 0.01 Renal failure -0.16 -0.43 , 0.12 0.26 3.11 2.83 , 3.40 <.0001 Diabetes, uncomplicated -0.17 -0.36 , 0.02 0.08 2.30 2.18 , 2.41 <.0001 Pulmonary circulation disorders -0.19 -0.62 , 0.24 0.39 1.89 1.49 , 2.28 <.0001 Hypertension, complicated -0.24 -0.58 , 0.10 0.16 0.09 -0.28 , 0.46 0.63 AIDS/HIV -0.27 -2.59 , 2.06 0.82 3.34 2.04 , 4.63 <.0001 Peripheral vascular disease -0.30 -0.54 , -0.05 0.02 1.02 0.78 , 1.25 <.0001 Alcohol abuse -0.35 -0.65 , -0.05 0.02 -0.80 -0.97 , -0.62 <.0001 Fluid and electrolyte disorders -0.41 -0.58 , -0.24 <.0001 0.18 -0.01 , 0.37 0.06 Diabetes, complicated -0.44 -0.72 , -0.16 0.002 3.53 3.30 , 3.76 <.0001 Weight loss -0.50 -1.13 , 0.13 0.12 -0.15 -0.70 , 0.41 0.61 Psychoses -0.58 -0.95 , -0.21 0.002 -0.12 -0.36 , 0.12 0.34*GEE = Generalized Estimating Equation Source: Manitoba Centre for Health Policy, 2012

190 University of Manitoba
Appendices
Appendix Table A5.21: Linear Regression Models of Outpatient Pharmacy Expenditures in the One Year After Hospital Discharge
Coefficient Coefficient($CAD 2008) ($CAD 2008)
Urban ICU care while in hospital 17 23 , 57 0.41 169 124 , 214 <.0001Time (fraction of 1 year) 4,100 4,012 , 4,189 <.0001 2,052 1,990 , 2,115 <.0001Initial age [model A] or Age [model B](years) 24 13 , 36 <.0001 12 11 , 12 <.0001Age deviation [model A only] (years) 252 243 , 261 <.0001 -- -- , -- --Male sex 38 -331 , 407 0.84 -71 -90 , -52 <.0001Income Quintile Urban 1 (lowest) reference -- reference -- Urban 2 -41 -140 , 58 0.42 -70 -105 , -35 <.0001 Urban 3 -105 -199 , -11 0.03 -28 -63 , 8 0.13 Urban 4 -174 -293 , -55 0.004 -65 -102 , -27 0.0007 Urban 5 (highest) -205 -338 , -71 0.003 -27 -65 , 11 0.17 Rural 1 (lowest) -37 -186 , 112 0.63 -206 -243 , -170 <.0001 Rural 2 53 -89 , 195 0.47 -134 -171 , -98 <.0001 Rural 3 -50 -184 , 84 0.46 -135 -172 , -98 <.0001 Rural 4 6 -133 , 145 0.94 -127 -165 , -88 <.0001 Rural 5 (highest) -34 -185 , 116 0.66 -83 -123 , -42 <.0001Discharged to other than home -235 -301 , -168 <.0001 -338 -418 , -259 <.0001Hospital length of stay (days) 2 1 , 2 <.0001 2 1 , 2 <.0001Most responsible hospital diagnosis category: Cardiovascular disease reference -- reference -- Conditions Originating in Perinatal Period 261 -133 , 656 0.19 -807 -1,188 , -425 <.0001 Blood and blood-forming organs 15 -130 , 160 0.84 210 85 , 336 0.001 Endocrine, Nutritional, Metabolic and Immunity -4 -57 , 50 0.89 -134 -206 , -61 0.0003 Infectious and Parasitic Diseases -39 -160 , 82 0.53 -393 -481 , -305 <.0001 Neoplasms -57 -119 , 6 0.07 -482 -535 , -430 <.0001 Mental Disorders -75 -134 , -16 0.01 -109 -168 , -51 0.0003 Respiratory System -75 -113 , -37 0.0001 -238 -285 , -191 <.0001 Nervous System and Sense Organs -110 -177 , -43 0.001 -247 -314 , -180 <.0001 Symptoms, Signs, and Ill-defined conditions -111 -144 , -79 <.0001 -373 -419 , -327 <.0001 Musculoskeletal System and Connective Tissue -144 -187 , -101 <.0001 -397 -441 , -354 <.0001 Skin and Subcutaneous Tissue -150 -220 , -80 <.0001 -465 -542 , -388 <.0001 Factors Influencing Health Status -163 -201 , -125 <.0001 -316 -364 , -268 <.0001 Complications of Pregnancy, Childbirth and Puerperium -172 -231 , -112 <.0001 -877 -926 , -828 <.0001 Injury and Poisoning -174 -215 , -132 <.0001 -638 -678 , -599 <.0001 Digestive System -183 -216 , -151 <.0001 -504 -541 , -466 <.0001 Genitourinary System -184 -228 , -139 <.0001 -597 -639 , -554 <.0001 Congenital Anomalies -273 -487 , -58 0.01 -641 -819 , -462 <.0001
-- --
Appendix Table A5.21: Linear Regression Models of Outpatient Pharmacy Expenditures in the One Year After Hospital Discharge
Model BModel of Initial Hospital Episodes
N=288,367
----
Variable p-value p-value95% CI 95% CI
N=637,058
Model AGEE* Model of all Hospital Episodes

Manitoba Centre for Health Policy 191
The Epidemiology and Outcomes of Critical Illness in Manitoba
Pre-existing comorbid disorders: AIDS/HIV 4,200 2,122 , 6,277 <.0001 12,397 11,998 , 12,796 <.0001 Metastatic cancer 928 811 , 1,045 <.0001 1,659 1,590 , 1,728 <.0001 Lymphoma 641 380 , 901 <.0001 3,049 2,920 , 3,178 <.0001 Pulmonary circulation disorders 385 160 , 610 0.0008 842 719 , 965 <.0001 Diabetes, complicated 271 192 , 350 <.0001 1,331 1,260 , 1,403 <.0001 Renal failure 249 165 , 333 <.0001 1,804 1,714 , 1,894 <.0001 Solid tumor without metastasis 201 127 , 275 <.0001 673 618 , 728 <.0001 Other neurologic disorders 198 100 , 295 <.0001 1,024 962 , 1,085 <.0001 Rheumatoid arthritis/collagen-vascular disease 168 0 , 335 0.05 1,027 944 , 1,111 <.0001 Obesity 164 36 , 292 0.01 269 179 , 360 <.0001 Diabetes, uncomplicated 160 107 , 213 <.0001 878 842 , 913 <.0001 Congestive heart failure 159 112 , 206 <.0001 200 154 , 246 <.0001 Blood loss anemia 154 -35 , 342 0.11 116 -33 , 265 0.13 Psychoses 146 33 , 259 0.01 1,177 1,100 , 1,255 <.0001 Depression 144 87 , 202 <.0001 549 494 , 604 <.0001 Chronic pulmonary disease 125 70 , 179 <.0001 497 453 , 541 <.0001 Weight loss 117 -70 , 304 0.22 -42 -219 , 136 0.65 Peptic ulcer disease without bleeding 108 -31 , 247 0.13 294 150 , 439 <.0001 Liver disease 107 -39 , 253 0.15 621 520 , 722 <.0001 Hypertension, complicated 88 -29 , 204 0.14 340 226 , 454 <.0001 Deficiency anemia 55 -52 , 163 0.31 -73 -170 , 24 0.14 Hypertension, uncomplicated 53 20 , 87 0.002 338 309 , 367 <.0001 Valvular heart disease 39 -68 , 146 0.48 -78 -164 , 8 0.07 Paralysis 38 -94 , 170 0.57 151 35 , 266 0.01 Drug abuse 18 -91 , 127 0.75 313 229 , 397 <.0001 Coagulopathy 15 -176 , 206 0.88 345 217 , 473 <.0001 Fluid and electrolyte disorders 3 -53 , 58 0.92 93 34 , 153 0.002 Arrythmia -1 -75 , 72 0.97 -60 -100 , -19 0.004 Hypothyroidism -53 -120 , 14 0.12 21 -48 , 89 0.55 Peripheral vascular disease -62 -127 , 4 0.06 -37 -109 , 34 0.31 Alcohol abuse -149 -215 , -83 <.0001 -471 -525 , -417 <.0001*GEE = Generalized Estimating Equation
Source: Manitoba Centre for Health Policy, 2012

192 University of Manitoba
Appendices
Appendix Table A5.22: Zero–Inflated Regression Modelling of Hospital Use in the One Year After Hospital Discharge with Analysis Limited to Initial Hospital Episodes for Each Individual (N=319,465) The left half is the logistic model for the presence of any hospitalization. The right half is the negative binomial model for the number of hospital–days
Urban ICU care while in hospital 1.05 1.01 , 1.10 0.01 0.81 0.76 , 0.86 <.0001Time (fraction of 1 year) 0.16 0.16 , 0.17 <.0001 0.99 0.91 , 1.08 0.83Age (years) 1.01 1.01 , 1.02 <.0001 1.03 1.03 , 1.04 <.0001Male sex 0.98 0.96 , 1.00 0.02 0.96 0.94 , 0.99 0.01Income Quintile Urban 1 (lowest) reference -- reference -- Urban 2 0.88 0.85 , 0.91 <.0001 0.93 0.88 , 0.98 0.007 Urban 3 0.87 0.84 , 0.90 <.0001 0.87 0.83 , 0.92 <.0001 Urban 4 0.81 0.78 , 0.84 <.0001 0.78 0.73 , 0.83 <.0001 Urban 5 (highest) 0.77 0.74 , 0.81 <.0001 0.68 0.64 , 0.73 <.0001 Rural 1 (lowest) 1.40 1.35 , 1.45 <.0001 0.75 0.71 , 0.79 <.0001 Rural 2 1.24 1.19 , 1.28 <.0001 0.75 0.71 , 0.79 <.0001 Rural 3 1.22 1.18 , 1.27 <.0001 0.80 0.75 , 0.84 <.0001 Rural 4 1.11 1.07 , 1.15 <.0001 0.79 0.74 , 0.83 <.0001 Rural 5 (highest) 1.00 0.96 , 1.04 0.92 0.71 0.66 , 0.76 <.0001 Income Unknown 0.69 0.65 , 0.73 <.0001 0.64 0.58 , 0.70 <.0001Hospital length of stay (days) 0.9995 0.9992 , 0.9998 0.001 1.007 1.006 , 1.007 <.0001Pre-existing comorbid disorders:Pulmonary circulation disorders 1.08 0.96 , 1.21 0.19 1.11 0.95 , 1.30 0.18Peripheral vascular disease 1.62 1.52 , 1.73 <.0001 1.41 1.31 , 1.51 <.0001Cardiac diseases or hypertension 1.25 1.22 , 1.28 <.0001 0.99 0.96 , 1.02 0.63Paralysis 1.03 0.93 , 1.14 0.63 1.48 1.28 , 1.72 <.0001Other neurological disorders 1.43 1.35 , 1.51 <.0001 1.66 1.54 , 1.78 <.0001Chronic pulmonary disease 1.63 1.57 , 1.70 <.0001 1.16 1.10 , 1.21 <.0001Diabetes 1.39 1.35 , 1.43 <.0001 1.34 1.29 , 1.40 <.0001Hypothyroidism 1.01 0.95 , 1.07 0.78 1.09 1.01 , 1.18 0.04Renal Failure 2.47 2.28 , 2.67 <.0001 1.62 1.50 , 1.74 <.0001Liver Disease 2.01 1.83 , 2.21 <.0001 1.50 1.34 , 1.67 <.0001Peptic ulcer disease without bleeding 1.47 1.28 , 1.68 <.0001 1.16 0.98 , 1.38 0.09AIDS/HIV 2.93 2.04 , 4.19 <.0001 4.29 2.93 , 6.28 <.0001Malignancies 2.21 2.14 , 2.28 <.0001 1.54 1.48 , 1.60 <.0001Rheumatoid arthritis/collagen-vascular disease 1.47 1.36 , 1.59 <.0001 1.58 1.43 , 1.74 <.0001Coagulopathy 1.41 1.25 , 1.59 <.0001 1.18 1.00 , 1.38 0.045Obesity 0.96 0.88 , 1.05 0.39 1.27 1.12 , 1.45 0.0003Weight loss 1.45 1.24 , 1.70 <.0001 1.43 1.20 , 1.71 <.0001Fluid and Electrolyte Disorders 1.16 1.10 , 1.23 <.0001 1.32 1.23 , 1.41 <.0001Anemias 1.45 1.34 , 1.56 <.0001 1.20 1.09 , 1.31 0.0001Substance abuse 1.42 1.36 , 1.48 <.0001 1.38 1.29 , 1.48 <.0001Depression or psychosis 1.62 1.56 , 1.68 <.0001 3.15 2.99 , 3.32 <.0001
Source: Manitoba Centre for Health Policy, 2012
-- --
Presence of Any Hospitalization Number of Hospital-Days
Appendix Table A5.22: Zero-Inflated Regression Modelling of Hospital Use in the One Year After Hospital Discharge with Analysis Limited to Initial Hospital Episodes for Each Individual (N=319,465)
The left half is the logistic model for the presence of any hospitalization. The right half is the negative binomial model for the number of hospital-days
Variable p-value p-valueRate RatioOdds Ratio 95% CI 95% CI

Manitoba Centre for Health Policy 193
The Epidemiology and Outcomes of Critical Illness in Manitoba
Appendix 6: Additional Information Related to Specific Aim 6A
ppen
dix
Tabl
e A
6.1:
N
umbe
r (Pe
rcen
t) o
f Dea
ths
Am
ong
Man
itob
ans,
Age
d 17
and
Old
er, W
ho h
ad b
een
in Id
enti
fied
Palli
ativ
e
Care
at a
ny T
ime
Dur
ing
the
Two
Year
s Pr
ior t
o D
eath
by
Age
Gro
up a
nd Y
ear
1999
/200
020
00/0
120
01/0
220
02/0
320
03/0
420
04/0
520
05/0
620
06/0
720
07/0
8
Num
ber
1610
1211
1813
2134
22P
erce
nt6.
584.
265.
635.
377.
535.
688.
9414
.59
9.24
Num
ber
1515
912
1311
1922
17P
erce
nt14
.56
14.5
67.
6313
.33
13.1
311
.22
19.7
922
.68
20.0
0N
umbe
r 19
1931
2636
3345
4848
Per
cent
12.6
712
.42
23.1
316
.99
27.0
719
.53
30.4
135
.82
26.8
2N
umbe
r 47
3053
3954
4090
7184
Per
cent
20.6
114
.85
22.2
719
.90
26.2
119
.14
35.8
631
.98
35.2
9N
umbe
r 66
6764
7775
9311
612
611
6P
erce
nt21
.50
22.3
322
.46
25.4
123
.29
30.9
036
.71
39.2
538
.93
Num
ber
7192
111
9697
119
165
172
168
Per
cent
19.1
423
.53
28.3
224
.06
28.7
028
.74
39.7
639
.18
39.3
4N
umbe
r 11
212
213
215
712
117
117
023
822
4P
erce
nt23
.88
23.6
926
.99
28.9
725
.42
33.2
736
.56
45.6
840
.29
Num
ber
155
178
155
164
202
198
217
319
271
Per
cent
21.0
625
.32
23.8
524
.59
30.4
730
.46
34.7
248
.55
41.0
6N
umbe
r 17
419
121
920
124
223
933
136
536
2P
erce
nt17
.18
19.3
323
.27
21.4
125
.05
24.9
035
.18
42.5
443
.61
Num
ber
208
244
254
246
253
274
384
477
466
Per
cent
14.0
717
.50
19.4
618
.91
19.3
321
.99
30.7
440
.63
39.5
6N
umbe
r 15
819
619
624
725
427
638
251
651
8P
erce
nt10
.54
12.5
812
.80
15.4
915
.52
16.5
523
.77
32.7
433
.86
Num
ber
9910
014
114
215
819
725
239
639
1P
erce
nt6.
426.
138.
608.
999.
8512
.29
16.3
824
.43
24.4
5N
umbe
r 41
6780
7898
9713
929
032
2P
erce
nt2.
824.
364.
924.
665.
545.
347.
9315
.34
17.4
2N
umbe
r 11
8113
3114
5714
9616
2117
6123
3130
7430
09P
erce
nt12
.31
13.7
115
.24
15.5
116
.61
17.8
324
.18
31.5
531
.13
T ota
l dea
ths
Num
ber
9591
9709
9560
9643
9761
9877
9639
9743
9666
Sou
rce:
Man
itoba
Cen
tre
for
Hea
lth P
olic
y, 2
012
App
endi
x Ta
ble
A6.
1:
Num
ber
(Per
cent
) of
Dea
ths
Am
ong
Man
itoba
ns, A
ged
17 a
nd O
lder
, Who
had
bee
n in
Iden
tifie
d P
allia
tive
Car
e at
a n
y Ti
me
Dur
ing
the
Two
Yea
rs P
rior
to D
eath
by
Age
Gro
up a
nd Y
ear
Age
gro
up (y
ears
)
90+
All
ages
60-6
4
65-6
9
70-7
4
75-7
9
80-8
4
85-8
9
55-5
9
17-3
4
35-3
9
40-4
4
45-4
9
50-5
4

194 University of Manitoba
Appendices
App
endi
x Ta
ble
A6.
2:
Size
of t
he E
stim
ated
ICU
Adm
issi
on P
ool b
y Ye
ar a
nd A
geA
ppen
dix
Tabl
e A
6.2:
Siz
e of
the
Est
imat
ed IC
U A
dmis
sion
Poo
l by
Yea
r an
d A
ge
Age
Unw
eigh
ted
Gro
upA
vera
ge
17-2
41.
451.
571.
361.
361.
421.
391.
341.
351.
481.
412 5
-29
1.52
1.47
1.36
1.24
1.21
1.52
1.43
1.48
1.58
1.42
3 0-3
41.
681.
521.
531.
511.
631.
611.
911.
871.
681.
663 5
-39
1.96
2.12
1.99
2.03
1.96
2.39
2.32
2.33
1.96
2.12
4 0-4
42.
913.
032.
652.
892.
803.
042.
732.
713.
552.
924 5
-49
4.89
4.49
4.54
4.35
4.09
3.98
4.31
3.94
4.10
4.30
5 0-5
47.
267.
017.
036.
646.
735.
996.
145.
996.
126.
545 5
-59
10.9
211
.33
10.8
410
.22
8.63
9.26
8.92
8.93
9.20
9.80
6 0-6
416
.37
17.0
115
.71
14.5
914
.25
14.1
812
.10
12.4
912
.99
14.4
16 5
-69
24.7
023
.81
23.3
221
.87
20.8
419
.92
19.2
417
.36
17.5
620
.96
7 0-7
434
.87
34.8
031
.29
30.9
730
.57
28.8
227
.90
24.2
425
.10
29.8
47 5
-79
51.8
949
.98
46.0
045
.13
44.9
641
.76
38.7
634
.51
35.2
843
.14
80-8
474
.23
72.9
069
.29
66.7
665
.28
64.4
858
.80
52.2
750
.52
63.8
485
+14
8.17
153.
5215
1.90
147.
6814
7.87
145.
8013
1.76
126.
8911
7.39
141.
22
17-2
451
.67
45.4
147
.37
49.1
346
.99
50.5
650
.29
45.5
145
.45
48.0
42 5
-29
37.0
743
.24
41.1
840
.22
48.3
542
.11
43.9
342
.86
45.9
042
.76
3 0-3
442
.86
44.9
239
.32
40.5
240
.00
37.4
040
.69
38.3
040
.16
40.4
63 5
-39
36.7
636
.22
49.7
235
.26
44.1
036
.84
37.0
233
.70
37.6
638
.59
4 0-4
440
.68
39.4
333
.60
40.0
030
.94
40.9
136
.26
29.8
836
.93
36.5
14 5
-49
39.0
037
.23
37.5
332
.63
31.7
740
.34
33.0
834
.07
33.7
735
.49
5 0-5
439
.69
35.4
733
.46
35.1
238
.58
33.8
233
.20
31.5
427
.95
34.3
15 5
-59
39.4
936
.62
35.0
137
.03
32.3
935
.33
32.2
832
.31
30.4
734
.55
6 0-6
438
.62
41.2
038
.78
45.4
540
.43
36.9
137
.74
32.3
833
.51
38.3
46 5
-69
45.7
143
.72
42.5
345
.53
44.3
044
.59
40.4
037
.30
41.1
342
.80
7 0-7
451
.61
49.0
650
.51
50.4
751
.01
54.4
949
.95
45.9
841
.38
49.3
87 5
-79
60.8
756
.59
57.6
060
.51
60.8
359
.01
58.8
354
.41
51.8
457
.83
8 0-8
473
.14
70.4
371
.04
72.5
573
.16
73.0
772
.96
71.8
470
.09
72.0
38 5
+89
.98
88.0
388
.98
90.7
090
.88
90.3
890
.23
88.3
988
.82
89.6
0S
ourc
e: M
anito
ba C
entr
e fo
r H
ealth
Pol
icy,
201
2
Siz
e of
the
ICU
Adm
issi
on P
ool p
er 1
,000
pop
ulat
ion
Per
cent
age
of t
he IC
U A
dmis
sion
Poo
l who
die
d w
ithou
t an
y ur
ban
ICU
car
e du
ring
that
yea
r
2004
/05
2005
/06
2006
/07
2007
/08
1999
/200
020
00/0
120
01/0
220
02/0
320
03/0
4

Manitoba Centre for Health Policy 195
The Epidemiology and Outcomes of Critical Illness in Manitoba
Appendix Table A6.3: Comparison of Three Different Rates of Urban ICU Care by Income Quintile Data are age–adjusted unweighted averages over nine years (1999/2000–2007/08), at the person level
Income Quintile
Population-based rates
(per 1,000 population)
Hospitalizaton-based rates
(per 100 non-obstetrical hospitalizations)
Critical illness-based rates
(per 100 ICU Admission Pool members)
Urban 1st (lowest) 7.31 8.31 60.26Urban 2nd 5.33 7.46 62.16Urban 3rd 4.75 6.79 64.47Urban 4th 4.37 6.80 65.89Urban 5th 3.81 6.30 66.19p-value <.0001 -- 0.002
Rural 1st (lowest) 4.82 3.73 45.78Rural 2nd 3.44 3.18 47.98Rural 3rd 3.38 3.33 47.00Rural 4th 3.36 3.76 54.20Rural 5th (highest) 3.65 4.62 57.02p-value <.0001 -- 0.90
Income Unknown 12.90 7.52 42.70Source: Manitoba Centre for Health Policy, 2012
Appendix Table A6.3: Comparison of Three Different Rates of Urban ICU Care, by Income Quintile
Data are age-adjusted unweighted averages over nine years (1999/2000-2007/08), at the person level

196 University of Manitoba
Recent MCHP Publications
2011Adult Obesity in Manitoba: Prevalence, Associations, and Outcomes by Randy Fransoo, Patricia Martens, Heather Prior, Dan Chateau, Chelsey McDougall, Jennifer Schultz, Kari–Lynne McGowan, and Angela Bailly
Manitoba Immunization Study by Tim Hilderman, Alan Katz, Shelley Derksen, Kari–Lynne McGowan, Dan Chateau, Carol Kurbis, Sandra Allison, Ruth–Ann Soodeen, and Jocelyn Nicole Reimer
Population Aging and the Continuum of Older Adult Care in Manitoba by Malcolm Doupe, Randy Fransoo, Dan Chateau, Natalia Dik, Charles Burchill, Ruth–Ann Soodeen, Songul Bozat–Emre, and Wendy Guenette
2010Pharmaceutical Use in Manitoba: Opportunities to Optimize Use by Colette Raymond, Silvia Alessi–Severini, Colleen Metge, Matthew Dahl, Jennifer Schultz, and Wendy Guenette
Evaluation of the Healthy Baby Program by Marni Brownell, Mariette Chartier, Wendy Au, and Jennifer Schultz
Health Inequities in Manitoba: Is the Socioeconomic Gap in Health Widening or Narrowing Over Time? by Patricia Martens, Marni Brownell, Wendy Au, Leonard MacWilliam, Heather Prior, Jennifer Schultz, Wendy Guenette, Lawrence Elliott, Shelley Buchan, Marcia Anderson, Patricia Caetano, Colleen Metge, Rob Santos, and Karen Serwonka
Physician Integrated Network Baseline Evaluation: Linking Electronic Medical Records and Administrative Data by Alan Katz, Bogdan Bogdanovic, and Ruth–Ann Soodeen
Profile of Metis Health Status and Healthcare Utilization in Manitoba: A Population–Based Study by Patricia Martens, Judith Bartlett, Elaine Burland, Heather Prior, Charles Burchill, Shamima Huq, Linda Romphf, Julianne Sanguins, Sheila Carter, and Angela Bailly The Additional Cost of Chronic Disease in Manitoba by Gregory Finlayson, Okechukwu Ekuma, Marina Yogendran, Elaine Burland, and Evelyn Forget
2009Effects of Manitoba Pharmacare Formulary Policy on Utilization of Prescription Medications by Anita Kozyrskyj, Colette Raymond, Matt Dahl, Oke Ekuma, Jenn Schultz, Mariana Sklepowich, and Ruth Bond
Manitoba RHA Indicators Atlas 2009 by Randy Fransoo, Patricia Martens, Elaine Burland, The Need to Know Team, Heather Prior, and Charles Burchill
Composite Measures/Indices of Health and Health System Performance by Colleen Metge, Dan Chateau, Heather Prior, Ruth–Ann Soodeen, Carolyn De Coster, and Louis Barre

Manitoba Centre for Health Policy 197
The Direct Cost of Hospitalizations in Manitoba, 2005/06 by Greg Finlayson, Julene Reimer, Matthew Stargardter, and Kari–Lynne McGowan
Physician Resource Projection Models by Alan Katz, Bogdan Bogdanovic, Oke Ekuma, Ruth–Ann Soodeen, Dan Chateau, and Chris Burnett
2008Manitoba Child Health Atlas Update by Marni Brownell, Carolyn De Coster, Robert Penfold, Shelley Derksen, Wendy Au, Jennifer Schultz, and Matthew Dahl
An Initial Analysis of Emergency Departments and Urgent Care in Winnipeg, by Malcolm Doupe, Anita Kozyrskyj, Ruth–Ann Soodeen, Shelley Derksen, Charles Burchill, and Shamima Huq
What Works? A First Look at Evaluating Manitoba's Regional Health Programs and Policies at the Population Level, by Patricia Martens, Randy Fransoo, The Need to Know Team, Elaine Burland, Heather Prior, Charles Burchill, Linda Romphf, Dan Chateau, Angela Bailly, and Carole Ouelette
2007Next Steps in the Provincial Evaluation of the BabyFirst program: Measuring Early Impacts on Outcomes Associated with Child Maltreatment by Marni Brownell, Rob Santos, Anita Kozyrskyj, Noralou Roos, Wendy Au, Natalia Dik, Mariette Chartier, Darlene Gerard, Okechukwu Ekuma, Monica Sirski, Nadine Tonn, and Jennifer Schultz
Allocating Funds for Healthcare in Manitoba Regional Health Authorities: A First Step—Population–Based Funding by Gregory S Finlayson, Evelyn Forget, Okechukwu Ekuma, Shelley Derksen, Ruth Bond, Patricia Martens, and Carolyn De Coster
Waiting Times for Surgery, Manitoba: 1999/2000 to 2003/04 by Carolyn De Coster, Dan Chateau, Matt Dahl, Ruth–Ann Soodeen, and Nancy McKeen
2006Using Administrative Data to Develop Indicators of Quality Care in Personal Care Homes by Malcolm Doupe, Marni Brownell, Anita Kozyrskyj, Natalia Dik, Charles Burchill, Matt Dahl, Dan Chateau, Carolyn De Coster, Aynslie Hinds, and Jennifer Bodnarchuk
Profiling Primary Care Practice in Manitoba by Norman Frohlich, Alan Katz, Carolyn De Coster, Natalia Dik, Ruth–Ann Soodeen, Diane Watson, and Bogdan Bogdanovic
Defining and Validating Chronic Diseases: An Administrative Data Approach by Lisa Lix, Marina Yogendran, Charles Burchill, Colleen Metge, Nancy McKeen, David Moore, and Ruth Bond
Application of Patient Safety Indicators in Manitoba: A First Look by Sharon Bruce, Heather Prior, Alan Katz, Mark Taylor, Steven Latosinsky, Patricia Martens, Carolyn De Coster, Marni Brownell, Ruth–Ann Soodeen, and Carmen Steinbach

198 University of Manitoba

Copies of MCHP publications are available for download free of charge at: http://mchp-appserv.cpe.umanitoba.ca/deliverablesList.html
Hard copies of our reports are available free of charge, by contacting us at:Mail: 408 Brodie Centre, 727 McDermot Avenue Winnipeg, Manitoba, Canada R3E 3P5Email: [email protected]: (204) 789-3819Fax: (204) 789-3910
Related Documents