Research Papers in Environmental and Spatial Analysis No. 129 THE ‘EMULATOR EFFECT’ OF THE URUGUAY ROUND ON U.S. REGIONALISM * * * * Marco Fugazza † United Nations Conference on Trade and Development, Geneva, Switzerland Frédéric Robert-Nicoud London School of Economics, United Kingdom; CEPR, London, UK This version: September 2008 ISBN: 978-0-85328-123-8 ABSTRACT In this paper we investigate whether multilateral trade liberalisation undermines or encourages preferential trade liberalisation. We use highly disaggregated data at the tariff-line level and find an ‘emulator effect’ of multilateral trade liberalisation on preferential trade agreements. Indeed, our regression results show that products for which the U.S. agreed to cut its MFN rate substantially between the end of the Tokyo and Uruguay Rounds of GATT negotiations (1979-1994) are also the products for which subsequent tariff cuts on a preferential basis are boldest. In this sense, regionalism complements multilateralism. Our empirical investigations also reveal that sectoral differences are important determinants of the preference margin, as well as the identity of trading partners. When crossed with the results of Limão (2006) and others on the causal link between regionalism and multilateral liberalisations in the realm of the GATT/WTO institutional framework, our results establish that the multilateral trading system and the incentives to expand regionalism interact in complex ways. JEL F13, F14, F15, N70 Keywords: Regionalism, Multilateralism, Stumbling bloc, Uruguay Round. * We are grateful to Alessandro Nicita and Ugo Panizza for their comments on the very first version of the paper. Part of this project was conducted when the second authors was visiting UNCTAD. † Corresponding author. UNCTAD, Palais.des Nations, CH–1211 Geneva 10, Switzerland. Phone: +4122 917772. Fax: ++ 9070044. Email: [email protected] .

Welcome message from author
This document is posted to help you gain knowledge. Please leave a comment to let me know what you think about it! Share it to your friends and learn new things together.
Transcript
Research Papers in Environmental and Spatial Analysis No. 129
THE ‘EMULATOR EFFECT’ OF THE URUGUAY ROUND ON U.S.
REGIONALISM∗∗∗∗
Marco Fugazza† United Nations Conference on Trade and Development, Geneva, Switzerland
Frédéric Robert-Nicoud
London School of Economics, United Kingdom; CEPR, London, UK
This version: September 2008
ISBN: 978-0-85328-123-8
ABSTRACT
In this paper we investigate whether multilateral trade liberalisation undermines or encourages preferential trade liberalisation. We use highly disaggregated data at the tariff-line level and find an ‘emulator effect’ of multilateral trade liberalisation on preferential trade agreements. Indeed, our regression results show that products for which the U.S. agreed to cut its MFN rate substantially between the end of the Tokyo and Uruguay Rounds of GATT negotiations (1979-1994) are also the products for which subsequent tariff cuts on a preferential basis are boldest. In this sense, regionalism complements multilateralism. Our empirical investigations also reveal that sectoral differences are important determinants of the preference margin, as well as the identity of trading partners. When crossed with the results of Limão (2006) and others on the causal link between regionalism and multilateral liberalisations in the realm of the GATT/WTO institutional framework, our results establish that the multilateral trading system and the incentives to expand regionalism interact in complex ways.
JEL F13, F14, F15, N70 Keywords: Regionalism, Multilateralism, Stumbling bloc, Uruguay Round.
∗ We are grateful to Alessandro Nicita and Ugo Panizza for their comments on the very first version of the paper. Part of this project was conducted when the second authors was visiting UNCTAD.
† Corresponding author. UNCTAD, Palais.des Nations, CH–1211 Geneva 10, Switzerland. Phone: +4122 917772. Fax: ++ 9070044. Email: [email protected].

THE EMULATOR EFFECT OF THE URUGUAY ROUND
2
1. INTRODUCTION
One striking feature of the current world trade system is the explosion of regionalism,
that is, the growth in the number of preferential trade agreements (PTAs). Only 37
such agreements were in place at the launch of the World Trade Organisation (WTO)
in 1994. In July 2007, 380 PTAs had been notified to the GATT/WTO and 205 of
them were in force.1 Though such numbers should be treated with caution for a
variety of reasons (Baldwin 2007), it is beyond doubt that these numbers are growing.
What is driving this growing proliferation of PTAs? Are regionalism and
multilateralism substitutes or complements? Answering such questions is important,
not least because several scholars fear that regionalism is a dynamic substitute, or
stumbling block, to multilateral free trade and a menace to the multilateral trading
system incarnated by the GATT/WTO (Bhagwati 1991, Levy 1997, Bagwell and
Staiger 1998, Krishna 1998, McLaren 2002).
In this paper, we study the ‘substitute vs. complement’ question from the opposite
angle: we assert, as Ethier (1998), that ‘regionalism is an endogenous response to the
multilateral trading system (Ethier 1998: 1216). Our research question is thus: is
multilateralism driving the proliferation of PTAs in any way?
This question has received surprisingly little academic interest so far. To the best of
our knowledge, Ethier (1998) and Freund’s (2000a) theoretical papers are unique
exceptions. Our paper studies this question from an empirical perspective, focusing on
the United States.
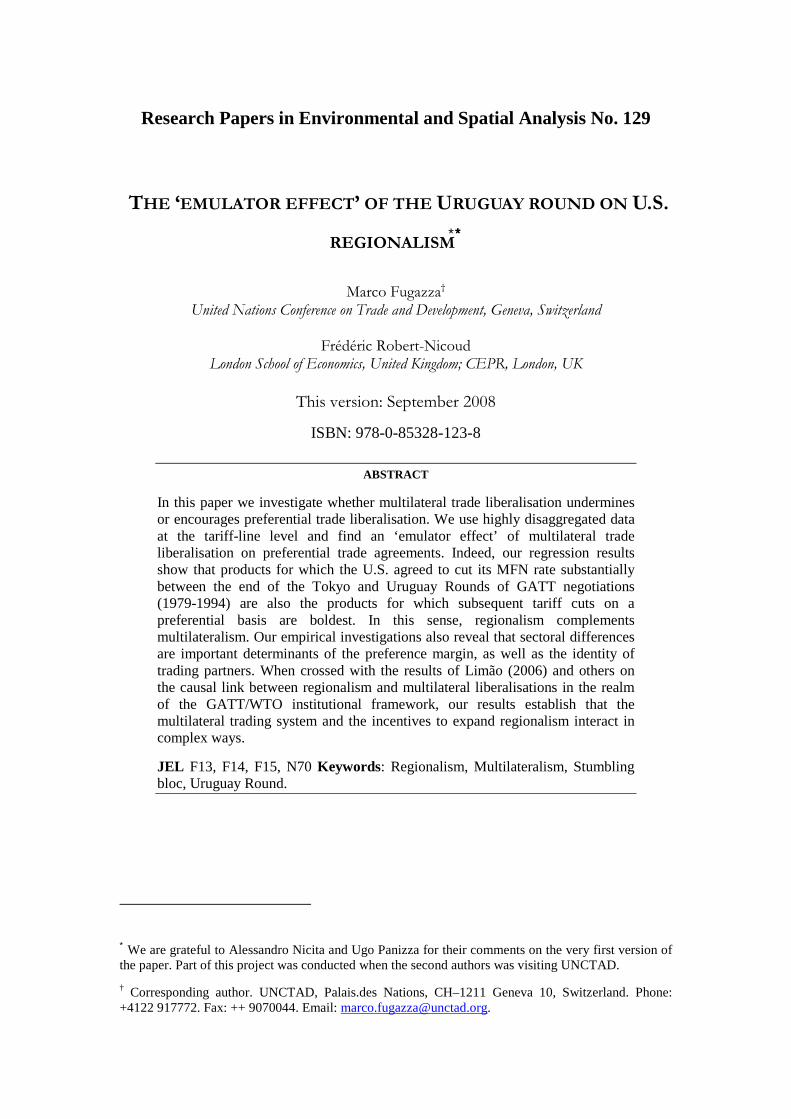
Figure 1 illustrates the fact that U.S. tariffs, both preferential and multilateral, are
falling over time. Is there any (causal) link between the two series?
Figure 1 about here
According to received wisdom, PTAs are a way for countries that are frustrated with
the painfully slow pace of the Doha round (launched in December 2001) or pundits
who expect the Doha round to collapse altogether to overcome these problems and
1 PTAs are also known as regional trade agreements (RTAs) in WTO terminology. They include customs union (about 10% of such PTAs) and free-trade areas (FTAs) and partial scope agreements (90%). Source for figures: ‘WTO regional trade agreements’ website, updated July 2008: http://www.wto.org/english/tratop_e/region_e/region_e.htm.
THE EMULATOR EFFECT OF THE URUGUAY ROUND
3
liberalise their bilateral trade faster than in the multilateral forum (The Economist
2008). It is also conceivable that any multilateral trade deal leaves bargaining
currency on the table; some subsets of countries have then some incentives to cut
bilateral tariffs beyond the multilateral level. Consequently, this line of thinking
would interpret the wave of regionalism that followed the conclusion of the Uruguay
Round in December 1994 as a consequence of the limitations of the Uruguay Round.
A logical corollary is that preferential margins should be systematically larger for
tariff lines on which the multilateral cut has been shallowest.
If this view is right, then regionalism is a substitute, albeit imperfect, to
multilateralism. Being part of a PTA represents for a WTO member a departure from
the guiding principle of non-discrimination defined in Article I of GATT, Article II of
GATS, and elsewhere. The consequence for the avowed aim of the GATT/WTO
would then be quite grim: the world renounces to global free trade. Regionalism is
one defining symptom of this scourge.
In this paper, we question this view. Specifically, we use highly disaggregated data
for the preference margins granted by the United States to their PTA partners as of
1996, as well as data for the multilateral tariff cut agreed during the Uruguay Round
(1994). Our data set comprises 8,661 tariff lines and ten PTAs that run from 1996 to
2007, totalling 28,454 observations for our reference sample.2 We chose this time
period so that we can be confident that Uruguay Round negotiators were negotiating
multilateral cuts without having these PTA ‘concessions’ at the back of their mind at
the time. We then run a regression at the good-partner level of the form:
(preference margin) (multilateral cut) controlsβ ε= + + (1)
(‘controls’ include a battery of fixed effects that minimise the omitted variable bias).
If the estimated β is negative, then preference margins are highest for tariff lines
(what we refer to as ‘goods’) that had the shallowest multilateral cuts and this would
support the ‘substitution’ hypothesis. However, our data strongly reject this
hypothesis: for the U.S. trade policy at least, the current wave of regionalism is, if
2 An observation is a combination tariff line × partner for which a preference margin has been negotiated. Most tariff lines are included in at least one PTA. See section 3 for details.
THE EMULATOR EFFECT OF THE URUGUAY ROUND
4
anything, a complement to past cuts granted at the multilateral level (all our estimates
of β are positive). Few goods are included in all PTAs and most goods are included in
only a few PTAs. We exploit this variation to run a regression at the good level of the
form:
(#preference margins) (multilateral cut) controlsγ ξ= + + (2)
Here we find that the number of times a good is included in a PTA (i.e. the frequency
at which the U.S. grants a preference margin on this good to its PTA partners) is
increasing in the MFN tariff cut. Therefore, both pieces of evidence suggest that past
multilateral cuts acted as dynamic complements for current PTA preference margins.
We refer to (1) as the intensive margin of the emulator effect of multilateralism on
regionalism and we interpret (2) as its extensive margin. We expect it to vary across
industries, PTAs and other dimensions. We run a series of extensions to account for
such heterogeneity in various ways; our regressions reject the emulator effect in none
of them.3
In the first of this series of extensions, we allow β to vary across the ten PTAs of our
sample; we find that the ‘emulator effect’ is strongest for the generalised system of
preferences (GSP) for least developed countries (LDCs) entered into force in 1997
and weakest for the bilateral trade agreement with Australia that entered into force in
2006. Second, we allow the intercept and the β for agricultural goods to be different
from the constant and the coefficient for non-agricultural ones: we find that the
average preferential margin granted for the former set of goods is lower than for the
latter, but we find that the emulator effect is much stronger for the agricultural goods
than for the non-agricultural ones; the estimated β is significant for both types of
goods at the one percent confidence level. Third, we expect the determinants of
preference margins for intermediates goods and final goods might be quite different;
we thus break the sample into seven categories, loosely regrouped in three ‘meta-
categories’ (final goods, intermediate goods and the rest). In all seven of them, the
estimated β’s are all positive in a statistical sense. A clear pattern also emerges: the
emulator effect is strongest for intermediate goods and weakest for final goods. One
3 To keep the paper within reasonable length, we conduct our robustness check exercises for the intensive margin only.

THE EMULATOR EFFECT OF THE URUGUAY ROUND
5
possible explanation for this is that the emulator effect is non-linear. To check for this,
we run a quantile regression: interestingly, we find that the emulator effect is lowest
for the smallest preference margins and it is highest for the largest ones. It is
statistically negative for none of the quantiles.4 As a further robustness check, we also
run our regressions in logs. The overall fit is lower, but the emulator effect also finds
strong support in this final specification.5
Finally, our dataset reveals that only a subset of tariff lines are affected by a PTA and
that very few tariff lines are affected by all PTAs in our sample. The selection of
goods into a given PTA is unlikely to be exogenous. We thus re-run our baseline
regression using a two-step Heckman procedure. Our regressions confirm the
existence of a bias but the coefficient of interest remains positive (its magnitude is
reduced by only 20%).
To summarise our findings, in virtually any specification that we estimate in this
paper, we find that tariff cuts negotiated at the multilateral level triggered a positive,
subsequent response at the preferential level.
From our empirical exercise, we thus conclude that the current wave of regionalism
reflects the past success of the GATT/WTO more than the limitations of the Uruguay
round or the current stalemate of the Doha round. This does not call for complacency
in the current context of WTO director Pascal Lamy’s attempt to save the Doha round,
but instead suggests some caution before interpreting the current wave of regionalism
as the consequence of a failure of the multilateral trading system. We view our paper
as a first step towards understanding the causes of regionalism.
The section in the immediate sequel introduces the theoretical backdrop for our work.
Section 3 introduces our dataset and some summary statistics. Section 4 presents our
estimation strategy. Section 5 contains our benchmark regression results, followed by
a series of extensions and robustness checks in Section 6. Section 7 discusses our
4 We also run distinct quintile regressions for each of the seven categories. Two patterns emerge, which are in line with our previous findings. First, the estimated β is positive for all of the 7x5 = 35 quintiles, but two (the first two quintiles of ‘consumption goods’). Second, the estimated β is rising monotonically with the quintile for all of the seven categories.
5 We also run the log specification using quantile regressions: we find that the relationship does not have a constant elasticity, so we stick with our regression in levels in the core of the paper.

THE EMULATOR EFFECT OF THE URUGUAY ROUND
6
findings and broadens the perspective to include the recent evidence on the stumbling
bloc versus building bloc controversy.
2. THEORETICAL BACKDROP
Are multilateral and regional trade agreements complements or substitutes? Does
multilateralism stimulate or impede regionalism?6 This question receives a large
coverage in the media but it is largely neglected in the academic literature. Ethier
(1998) are Freund’s (2000a) theoretical papers are rare exceptions.7 Ethier (1998)
combines a trade theory with a theory of vertical foreign direct investments to show
that when the market for final goods expands as a result of multilateral trade
liberalisation among rich countries, then the demand for intermediate goods rises and
this may encourage the formation of PTAs in which a rich country sources the
production of intermediate inputs to the developing PTA partner. By contrast, Freund
(2000), develops an oligopolistic model of intra-industry trade à-la Brander and
Krugman (1983), which is well-suited to study rich-rich PTAs by construction (see
Krishna 1998). In her model, the preferential and the external tariff are complements:
an exogenous reduction of either makes a reduction of the other more desirable.8 She
then extends her static framework to a repeated game and goes on to show that an
exogenous reduction of the multilateral tariff makes a PTA more likely to be
sustainable (in game theoretical terms). Thus, albeit for different reasons, all three
models vindicate the idea that a multilateral move towards freer trade increases the
incentive to form preferential agreements. Our data (described in Section 3) comprises
6 A large literature has addressed the symmetric question: is regionalism a building or a stumbling block towards multilateral free trade? We cover some of the findings of this body of research in Section 7.
7 Maggi and Rodriguez-Clare (1998) and Ornelas (2005b) study the impact of regionalism on the incentives to adopt multilateral free/freer trade; interestingly, the decision to adopt an FTA is endogenous in their models.
8 To understand this result, consider her three-country symmetric model. Two countries may form a PTA and impose a bilateral tariff τ on each other’s exports; the multilateral tariff governing any other bilateral trade relation is t, with t > τ. Governments maximise social welfare (consumer surplus + producer surplus + tariff revenue). If, say, t falls then imports from the third country increase in each PTA member country, which reduces profits, consumer surplus and tariff revenue. A marginal symmetric reduction of τ may reduce profits further but it unambiguously increases consumer surplus and tariff revenues. As a result, the optimal τ is increasing in t. The same qualitative result obtains in a customs union; see Freund (2000, p364). A companion paper to this one provides evidence for this effect for the U.S. (Fugazza and Robert-Nicoud 2008).
THE EMULATOR EFFECT OF THE URUGUAY ROUND
7
PTAs formed between the U.S. at one end and both developing and rich countries at
the other end. Our empirical evidence is consistent with this positive equilibrium
relationship.
These models are static in essence: Ethier’s (1998) model is akin to a one-shot
sequential game and Freund (2000) focuses on stationary equilibria of her dynamic
game. However, one predominant pattern of worldwide tariff data is that virtually any
bilateral or multilateral tariff goes down over time (recall Figure 1). In addition,
multilateral tariff are negotiated under the strict and – in order to satisfy the unanimity
rule – time consuming auspices of the GATT/WTO, whereas countries can start
negotiating preferential tariffs more easily and more frequently. Thus, we assess that a
reasonable assumption is that multilateral and preferential tariffs are chosen
sequentially. In particular, multilateral free trade is typically not an available option
while countries negotiate a PTA.9 So far, existing theories that explicitly seek to
understand why tariffs are falling over time do not address the interaction between
preferential and multilateral tariffs (Staiger 1995, Maggi and Rodriguez-Clare 2007,
Baldwin and Robert-Nicoud 2007) and some static models that do address such
interactions do make the assumption that multilateral free trade is on the table.
To overcome these limitations, Robert-Nicoud (2008) extends the Krishna-Freund-
Ornelas oligopolistic framework to a dynamic setting, where the distinction between
the extensive margin of trade (i.e. the number of trading firms) and the intensive
margin of trade (i.e. the volume of trade by firm) is explicitly introduced.10 Such
extensions allow one to study the dynamics of trade liberalisation and the two-way
interaction between PTA and multilateral tariffs sparked by the political-economy
model. To see this, assume that the extensive margin of trade adjusts more slowly
than the intensive margin, an assumption that can easily be rationalised.11 Since one
margin of adjustment is not available in the short run, the oligopoly’s attitude to any
9 Of course, unilateral free trade is an option. Actually, many countries (mostly developing) apply tariffs rates (‘applied rates’) that are below the tariff ceiling negotiated under the GATT/WTO (‘bound rates’).
10 See Maggi and Rodriguez-Clare (1998) for a similar approach in a competitive model.
11 Specifically, it takes time and real resources to establish trading relations and enter new markets; see Baldwin (1989). Rauch (1999) asserts that networks are important for establishing trading relations in differentiated products and provides evidence consistent with this view.
THE EMULATOR EFFECT OF THE URUGUAY ROUND
8
kind of trade liberalisation is more hostile than in the long run. The model predicts
that a lower external (or MFN) tariff makes it more likely that the PTA members
bilaterally decrease their internal tariff. This is consistent with the relationship that our
paper uncovers.
3. DATA & SUMMARY STATISTICS
There are three types of negotiated tariffs: the bound MFN tariffs (BMFN), the
applied MFN tariff (AMFN) and the preferential tariff. As already mentioned, the
tariff of interest to WTO negotiators is the BMFN tariff. Tariffs cuts observed during
GATT/WTO trade negotiations refer to cuts in the BMFN tariffs. The AMFN tariff
could be no higher than the BMFN and its level is (unilaterally) chosen by the
imposing country. In the case of the United States (and others), the BMFN and
AMFN tariffs coincide exactly and are usually decreasing in the post-Uruguay round
period, so we refer to them as the MFN tariff for short. Our key explanatory variable,
denoted by MFN∆ , is defined as the (non-negative) difference between the Uruguay
and Tokyo MFN rates.
Each preferential tariff, if it exists at all, is PTA-specific. We define the preferential
margin as the (non-negative) difference between the MFN tariff and the preferential
tariff prevailing at the end of the implementation period (when available) and we
denote it by PT∆ . Specifically, we observe in our sample that many preferential
tariffs are falling over time before stabilising at a constant level. When this is the case,
we take this constant level to construct our ‘preference margin’ variable. Our sample
ends in 2007, however, and for some PTAs the preferential tariffs are still falling at
this time. We shall conduct robustness checks that exclude such PTAs from our
reference sample.
For our empirical purposes, an observation in our reference sample is a combination
tariff line × partner such that (i) the preference margin is positive, (ii) the MFN rate in
the final year of observation is positive and (iii) the PTA was negotiated after 1994
(the conclusion of the Uruguay round). Our reference sample comprises 3,455 such
tariff lines for a total of 28,454 observations. Condition (i) implies that we study the
determinants of the preference margin conditional on a preference margin being
granted to a given partner. If the MFN tariff rate is zero, the preferential rate cannot

THE EMULATOR EFFECT OF THE URUGUAY ROUND
9
be lower than the MFN rate (trivially). This binding constraint on the preference
margin, if not taken into account, would induce a bias in our regressions; however,
there are no observations that simultaneously satisfy (i) and violate (ii) in our
reference sample, so we may not worry further about this source of bias. We relax
conditions (i) and (ii) in robustness checks below. Finally, we impose condition (iii)
so as to eliminate an obvious source of reverse causality bias from our regressions.
The main sources for data are the UNCTAD-TRAINS and the WTO-CTS Bound
Duty Rates databases. Both databases provide information at the legal tariff line level
(8-digit the HS nomenclature) – what we refer to as goods below. There are 8,661
such tariff lines in the unrestricted database. The WTO-CTS database provides
information on bound rates negotiated at the Tokyo round and those negotiated at the
Uruguay round. Hence, the difference between these two rates corresponds to the
effective reduction in bound tariffs negotiated during the Uruguay round. The
database also provides information on the implementation period of bound tariff
reductions that were negotiated during the Uruguay round. The implicit rule revealed
by analysing the data indicates that the absolute yearly cut in the MFN tariffs
corresponds to the overall negotiated cut divided by the number of years of
implementation. For instance, if MFN rates are falling from 20 to 10 percent over a
period of 10 years then, the implicit implementation framework would stipulate a
reduction of 1 point percentage each year. Lines subject to non-ad valorem duties
were not included in the original dataset; such tariff lines account for around 8% of
HS 6-digit subheading in 2006 according to the World Tariff Profiles (2007).
The UNCTAD-TRAINS database includes MFN applied rates and preferential rates.
The period informed is 1996-2007. Preferential Trade Agreements covered in the
database are: the Generalized System of Preferences (1976), Israel (1985), Caribbean
Basin Economic Recovery Act (1986), Andean Trade Preference Act (1992), NAFTA
(1994), GSP for Least Developed Countries (1997), the African Growth and
Opportunity Act (2000), Caribbean Basin Trade Partnership Act (2000), Jordan
(2001), Chile (2004), Singapore (2004), Morocco (2006), Bahrain (2006), Australia
(2005), Dominican Republic-Central American FTA (2006). Preferences margins are
computed over the whole period of investigation, namely any period between 1996
and 2007. From the exhaustive list above, we exclude the PTAs that were negotiated
before the end of the Uruguay round (1994). For the remainder of the paper, we refer

THE EMULATOR EFFECT OF THE URUGUAY ROUND
10
to the set of countries belonging to one of these PTAs as a ‘partner’ or ‘partnership’
and we index such partnerships with the subscript{1,...,10}p ∈ ; note that ‘p’ is also a
mnemonic for ‘PTA’. Table 1 reports the ten partnership included in our reference
sample.
Table 1 about here
Concerning non-tariff measures (NTMs), we use information available in the
TRAINS database. We focus on NTMs classified as Technical Measures (chapter 8)
in the UNCTAD Coding System of Trade Control Measures. This covers inter alia
both sanitary and phyto-sanitary (SPS) and technical barriers to trade (TBT) type of
measures. Data are available only for the year 1999.
Table 2 provides summary statistics for the main variables used in estimations
(detailed definitions for each variable are provided in Appendix Table A1). The mean
MFN tariff agreed during the Tokyo round of multilateral trade negotiations (ending
in 1979) is 9.81 percents for our sample mean; the mean MFN tariff for the Uruguay
round is 6.63. The first cell of the table reports that the mean MFN cut is 3.18, which
is the difference between the two previous numbers. The mean preference margin,
which is the mean of the difference between the preferential rate in the final year of
observation minus the Uruguay MFN rate, is equal to 6.17. In other words,
preferential cuts are on average bolder than multilateral cuts. The second column
reports the standard deviations and, together with the third and fourth columns,
suggests that there is substantial variation to exploit. We should also notice that MFN
cuts on tariff lines included in PTAs are strictly positive. This means that zero MFN
cuts are perfectly associated with zero preference margins.
We also use sectoral output data for our two-step Heckman robustness check. The
data are imported from the UNIDO Industrial Statistics database (INDSTAT4-Rev3).
The use of sectoral output based on UNIDO data unfortunately limits the sectors
covered to manufacturing according to the ISIC classification at the four-digit level.
Table 2 about here
THE EMULATOR EFFECT OF THE URUGUAY ROUND
11
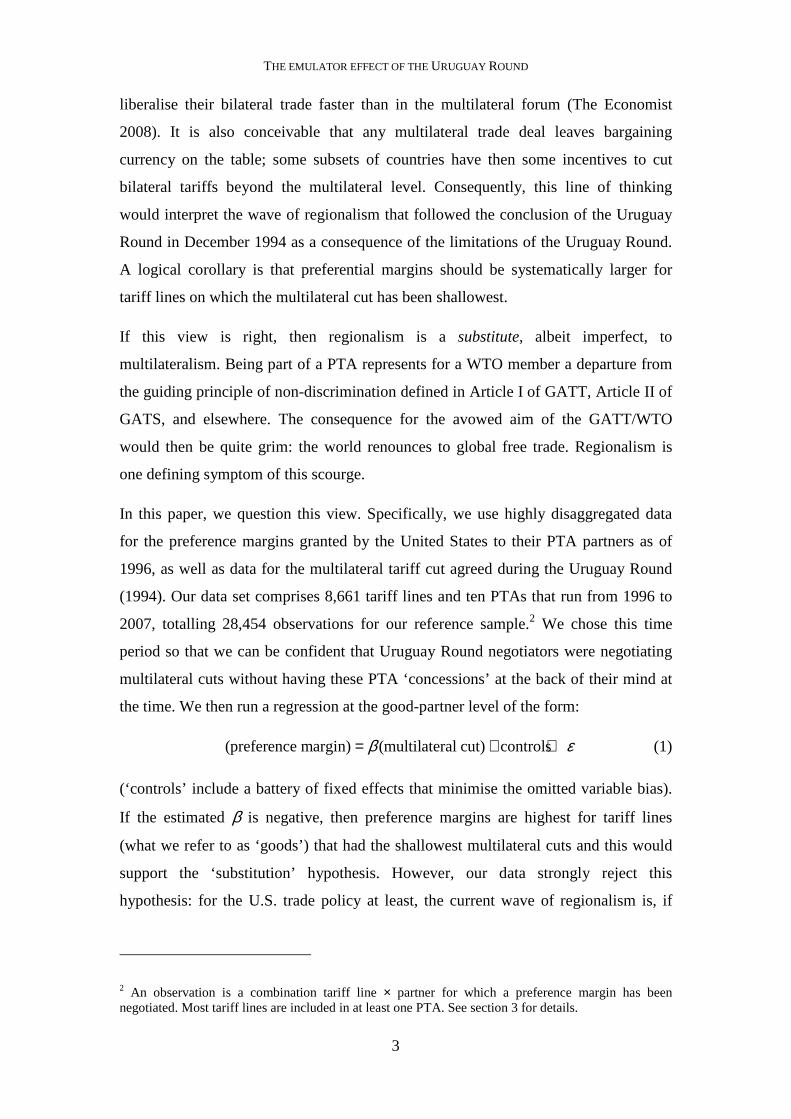
Figure 2 illustrates the key information uncovered in Table 3, which breaks down the
information from Table 2 in distinguishing between agricultural goods and non-
agricultural ones.12 The information summarised in this table reveals that agricultural
goods are quite different from non-agricultural ones in two respects at least. First, by
any of the measures reported in this table, agricultural goods are more protected than
non-agricultural ones at any point in time; this is true both at the preferential and at
the multilateral levels. Second, MFN tariff cuts and preferential margins are boldest
for agricultural products by any measure. In a sense, there is some ‘trade
liberalisation’ catching-up for these goods. We shall exploit this source of variation in
some of our regressions below.
Table 3 about here
Figure 2 about here
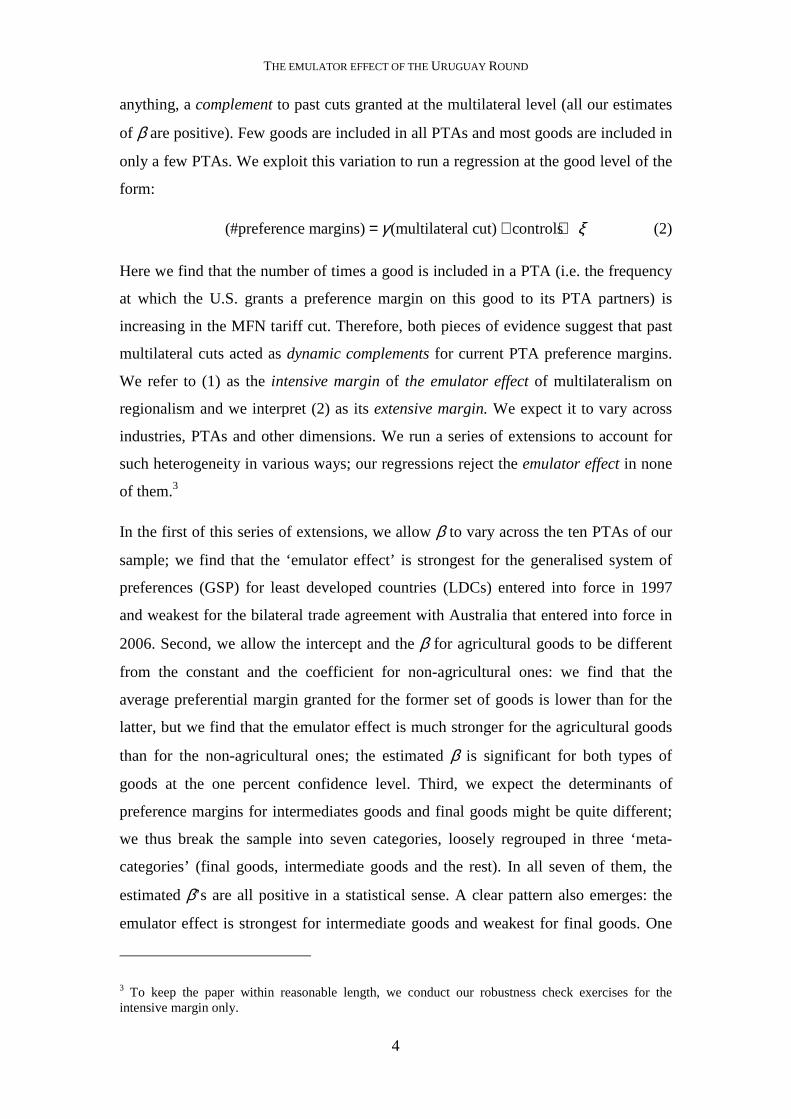
Figure 3 reports the number of tariff lines with a preference margin broken down by
PTA. We observe that the number of tariff lines subject to a PTA varies from a low
2,325 for the generalised system of preferences (GSP) for least developed countries
(LDCs) to a maximum of 3,219 for Chile (CHL). The Duty Rate database reports that
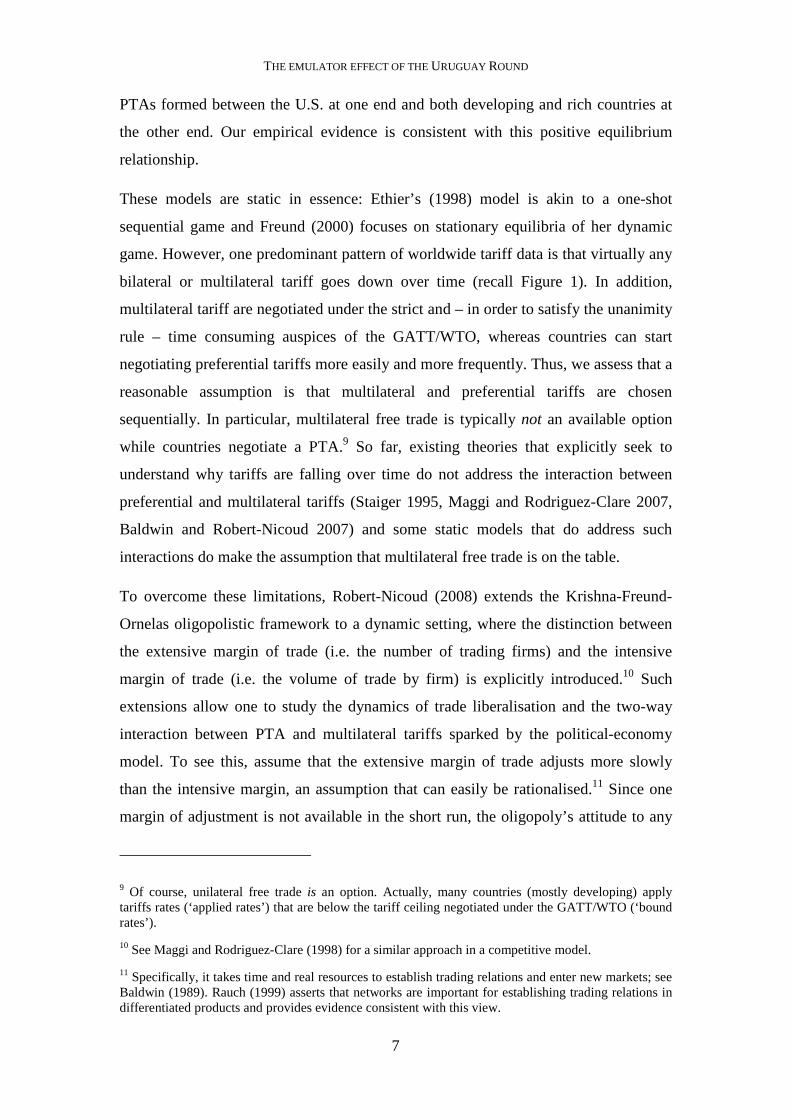
3,455 (39.9%) tariff lines (‘goods’) out of 8,661 are subject to a PTA. Figure 4 reports
the frequency analysis of tariff lines included in the various PTAs signed by the U.S.
For instance, less then 1% of the tariff lines subject to a PTA (18 out of 3,455) appear
in only one post-Uruguay round PTA and 40% of them (1,407 out of 3,455) appear in
all of them. The last column and bottom lines of Table 4 (in appendix) encompass the
information illustrated in Figure 3 and Figure 4, respectively. We shall control for
these variations across partners and tariff lines in our empirical analysis.
Table 4 about here
Figure 3 about here
Figure 4 about here
12 The distinction between agricultural and non-agricultural goods follows the classification used in trade negotiation at the WTO. See for instance the World Tariff Profiles (2006) for a detailed description based on the Harmonized System Nomenclature 2002.

THE EMULATOR EFFECT OF THE URUGUAY ROUND
12
4. ESTIMATION STRATEGY
As mentioned previously, estimates are for the U.S. trade policy; in other words, the
U.S. is the importing country in all that follows.
Let p denote partners (individual countries or members of a specific PTA), g denote
each good and G denote sectors (HS-2 in the benchmark regressions and HS-4 in
robustness-check specifications).13 We denote the set of all goods by Γ; then G is a
partition of Γ and (with some slight abuse of notation) we use ( )G g to denote the
sector in which good g is classified. Thus, G is also a mapping : good sectorG → .
Emulator effect: the intensive margin. In our baseline specification we run the
following regression:
, ( ) ,g p p G g g g pPT f f MFNβ ε∆ = + + ∆ + (3)
where , , ,g p g t g pPT MFN PT∆ = − is the preferential margin applied by the U.S. on
imports of good g from country {1,...,10}p ∈ in the final year t ( 1997t ≥ in our
sample); it is defined as the (non-negative) difference between the (applied) MFN
tariff prevailing when the PTA enters into force (i.e. in some year tτ ≤ ) and the
preferential tariff being applied in the final year t that we observe in our sample.
Notice that the MFN rate it is always larger or equal to the bound rate negotiated
during the Uruguay round. In a similar way, the corresponding MFN tariff-cut,
Tokyo Uruguayg g gMFN MFN MFN∆ ≡ − , is defined as the Tokyo-Round MFN tariff (as
agreed in 1979) minus the Uruguay-Round MFN tariff (as agreed in 1994). We use
the negotiated MFN tariff rates. Finally, εg,p is an error term assumed to be
independently and identically distributed from some distribution with finite first and
second moments.
We must assume that gMFN∆ is exogenous in order to obtain consistent and unbiased
estimates from (3). The heart of our identification strategy rests on the timing of
13 There are 97 HS-2 sectors and 636 HS-4 sectors in our benchmark sample. We use HS-2 dummies in our benchmark regressions to save degrees of freedom and to save on computational power. In this, we also follow Limão (2006). We later run our most basic regressions with HS-4 dummies as robustness checks.

THE EMULATOR EFFECT OF THE URUGUAY ROUND
13
events. We limit our sample to the ten PTAs, listed in Table 1, which entered into
force after the conclusion of the Uruguay round in 1994. This sample selection is
expeted to eliminate any reverse-causality bias for two main reasons: first between
1994 and 2000 no new trade agreements had been implemented by the U.S., with the
unique exception of an extension of the GSP scheme granted to LDCs. Such an
extension is pretty unlikely to have influenced negotiations during the Uruguay round.
Second, no trade agreement signed in the post Uruguay round period had actually
been negotiated in the pre Uruguay round period. The Clinton administration did
undertake talks to form a Free Trade Area of the Americas (FTAA) and to sign a trade
agreement with the Asian Pacific Economic Cooperation (APEC) country members in
1994. However, it is unlikely that those talks had any influence on the tariff
reductions negotiated at the Uruguay round. On one hand, no agreement has been
reached yet in the context of FTAA negotiations. On the other hand the APEC forum
held in Bogor in 1994 signed a declaration to work toward free trade in the region by
2010 for developed countries and by 2020 for all member-countries. A sixteen-year
time frame makes any influence of those talks on tariff cuts defined the Uruguay
round quite implausible. What is usually recognized is that the APEC summit together
with NAFTA helped "squeeze the European Union to complete the Uruguay round of
GATT".14
We introduce sector fixed effects ( )G gf in (3) to capture two dimensions of
unobserved heterogeneity. Indeed, if an omitted variable affects PT∆ and MFN∆
simultaneously, then regressing the former on the later will cause a spurious
correlation. Some political economy determinants (lobbying) of tariffs could
constitute this omitted variable, as suggested in our theoretical discussion in the
introduction. The determinants of comparative advantage are another source of
omitted variable bias. Since we have a cross section of observations, we cannot
include goods fixed effects in (3). Insofar such unobserved shocks are common to
goods within sectors, then including ( )G gf in (3) corrects for this source of omitted
variable bias. It is also reasonable to assume that lobbying takes place at the sector
14 Robert Zoellick (2001) statement then-USTR.
THE EMULATOR EFFECT OF THE URUGUAY ROUND
14
level. It is also reasonable to assume that the level of aggregation at which the forces
of comparative advantage are operating is best approximated by the sector.
We also include partner dummies pf in (3) to capture bargaining power of the partner
and all other partner-specific considerations that arise during the negotiation of the
PTA; such considerations can be trade- and non-trade related (Limão 2007). We
expect a stronger bargaining position to translate into a larger average margin of
preference. Partner dummies (together with sector dummies) can also reflect
reciprocity of the agreement, that is, the preference margin given to US products.
Indeed, the reciprocity ‘rule’ may vary across agreements; there is for instance no
explicit reciprocity in the GSP scheme for LDCs (Romalis 2007). More reciprocity
(larger preference margins in partner markets) should lead to larger preference
margin. In addition, exchange of concessions may be implemented at different levels,
from the most highly disaggregated level (i.e. goods) to the HS-2 sectoral level, or a
combination of the two. This flexibility in the framing of exchange of concessions
was not encountered in the GATT/Uruguay round negotiations as described in Finger
and al. (1996). We do not disentangle reciprocity from bargaining power because it is
unclear whether a low bargaining position also means more reciprocity. We assume
that our partner and sector fixed effects together absorb these various effects. We later
consider various extensions of our benchmark specification to account for various
bargaining-power-reciprocity schemes and associations.
Pursuing the logic of removing any possible element of reverse-causality further, we
only consider tariff lines with implementation starting in 1995 and no later. That is to
say that we drop all negotiations post Uruguay round or that could be seen as a
continuation of the round. This is the case of tariff reductions implemented under the
agreement on trade in information technology products (ITA) concluded at the
Singapore Ministerial Conference in December 1996. These tariff lines represent less
than 1 % of observations in the reference sample and less than 2% in the whole
sample; thus this attrition is minimal. To attenuate concerns related to the selection
bias of our sample, we later run regressions that include all data available as a
robustness check of our results. In order to eliminate issues possibly related to data

THE EMULATOR EFFECT OF THE URUGUAY ROUND
15
truncation, we restrict our reference sample to strictly positive MFN cuts
observations.15 Overall, we reduce the size of our sample by around 10%.
To summarize, we run (3) for the observations that are subject to a preferential
margin. That is, (3) being a conditional regression, it estimates the intensive margin of
the emulator effect. However, in order to obtain an unbiased and efficient estimate of
β, we must assume that the observations for which the preference margin is strictly
positive are randomly generated. This is a strong assumption. Therefore, in an
extension we run a two-step regression, where the first step consists in estimating:
, ( ) 0 ,Pr{ 0}g p p G g g g pPT F F MFNα µ∆ > = + + + +g 1X α (4)
where Xg is a set of good-characteristics (like production and employment) and MFNg
is the relevant tariff level. The economic logic for the latter determinant of
,Pr{ 0}g pPT∆ > is the following: when the multilateral tariff is low to start with, there
is not much preference margin to be granted. Thus, the likelihood that a preference
margin is being granted should be increasing in the manoeuvre margin, i.e. the MFN
tariff. Taken literally, no existing theory has anything to say about the probability that
a good is included in a PTA but probabilistic interpretations of Ornelas (2005b) and
Freund’s (2000) models are consistent with this view. We then run a modified version
of (3),
, , ( ) ,ˆ0g p g p p G g g g g pPT PT f f MFN bmβ ε∆ ∆ > = + + ∆ + + (5)
where ˆ gm is the inverse Mills ratio estimated from the first stage. Although this
estimation strategy is attractive from an economic point of view, the statistical
properties of US tariff data push us to consider it as a robustness check only. We
mentioned previously that all tariff lines with a zero Uruguay MFN bound rate are
never included in any PTA. As they represent more than 70% of the tariff lines not
included in any PTA, correcting for the selection bias may result simply in accounting
for the presence of MFN duty free lines which by definition could be excluded from
any trade arrangement as they do not represent any potential for preferential access.
15 This is always the case for preferences margins by definition.
THE EMULATOR EFFECT OF THE URUGUAY ROUND
16
Emulator effect: the extensive margin. As underlined in section 3 no positive
preference margin is observed on tariff lines where the MFN cut is zero. This suggests
that zero MFN cuts are likely to predict almost perfectly the non inclusion of a tariff
line in a given PTA. Hence, as a separate piece of evidence that the selection of a
tariff line is not random we regress the number of times good g is being selected in
any PTA on sector dummies and gMFN∆ , namely
, ( ) ,#{ : 0}g p G g g g pp PT f MFNγ ε∆ ≥ = + ∆ + (6)
Estimating (6) by OLS would yield biased results, though, because the left hand side
variable is a count variable. To address this issue, we use Poisson estimation
techniques. The generic Poisson specification assumes that the relationship between
the number of PTAs per line and its determinants is based on a constant semi-
elasticity model which implies estimating,
( ), ( ) ,#{ : 0} expg p G g g g pp PT f MFNγ ε∆ ≥ = + ∆ + (7)
For the sake of comparison with (6), we also assume that the underlying relationship
between the number of PTAs per line and its determinants remains strictly linear. That
is, we estimate
( ) ( ), ( ) ,exp #{ : 0} expg p G g g g pp PT f MFNγ ε∆ ≥ = + ∆ + (8)
The results of these regressions will inform us about the extensive margin of the
emulator effect of multilateral trade agreements on preferential margins.
5. RESULTS
Baseline regressions. The results of our baseline regression are presented in the first
column of Table 5. Specifically, we obtain (using ‘^’ for estimated values):
( ) gpGppg MFNffPT ∆++=∆∧
)53.11(, 216.0ˆˆ (9)
Our estimate for β, ˆ .216β = , is precisely estimated, for the robust t-statistics (in
parenthesis) is above 11, thus the estimated β is positive well beyond the one percent
THE EMULATOR EFFECT OF THE URUGUAY ROUND
17
level of confidence.16 Putting this in perspective, consider the effect of reducing the
MFN tariff rate by one standard error. Then, a 3.39% MFN tariff cut between the
Tokyo and Uruguay Rounds is associated with an extra (.216)(3.39%) = .73% tariff
cut at the preferential level, which represents 15% of the standard error of the
preferential margin at the sample average. Our regression explains fully 31.1% of the
variation in our sample (adjusted-R2), which is quite substantial.17 Therefore, we
conclude that the emulator effect of multilateral trade liberalisation on regionalism
finds strong support in the data, that is, the past success of multilateralism is at least
partly responsible for the current wave of U.S. regionalism; but also that sector
characteristics and partner attributes are responsible for a large part of it. We then run
the regression excluding Morocco, Bahrain and DR/CAFTA from the sample on the
grounds that these were not fully implemented by 2006; we obtain 274.ˆ =β (not
reported in Table 5).
Table 5 about here
The second column of Table 5 reports estimations including the goods for which the
MFN rate is zero in the final year of observation. Since preferential rates cannot be
larger than MFN rates, the corresponding preferential rates must be equal to zero, too.
This introduces a downward bias in our estimates. This is confirmed by the fact that
ˆ .204β = (t-stat. 11.85) in this case, which is statistically significantly lower than
ˆ .216β = obtained in column (1). Despite this downward bias, the qualitative result
whereby more MFN liberalisation is associated with more Preferential liberalisation is
strongly supported.
Figure 5 about here
Partner-specific ββββ. Partner bargaining power could not only affect the overall
average margin of preferences but also the influence of the MFN cuts. Also, Foreign
16 As MFN rates by definition are the same for all country partners, intra country group correlation is likely to be present. With cluster-robust standard errors estimation the coefficent remains significant beyond the one-percent level although we observe an important drop of the t-statistic to 5.36.
17 The adjusted R2 we report is the ‘true’ one: if one excludes the constant and include ten fixed effects (one for each partner p) to the regression, then a software like STATA® (the one we use) reports an artificially inflated R2, in our case: R2 = .74. The true one, R2=.31, is substantially lower.

THE EMULATOR EFFECT OF THE URUGUAY ROUND
18
lobbies might influence U.S. policy in differently (Gawande, Krishna and Robbins
2006). Thus, in the third column of Table 5, we allow the coefficient β to vary across
partners; specifically, we run
, ( ) ,g p p G g p g g pPT f f MFNβ ε∆ = + + ∆ + (10)
Figure 5 illustrates the point estimates as well as the 95- and 99 percent confidence
intervals; the dashed line reports the point estimate ˆ .216β = of the pooled regression
(9) in order to ease comparison. The effect is strongest for GSP for LDCs
( GSPˆ .708β = ). The effect is weakest for Singapore (the point estimate, though
positive, is not different from zero in a statistical sense) and for Bahrain, Morocco and
DR/CAFTA. We briefly study the determinants of the variation across partners in
section 6.
Table 6 about here
Agriculture-specific ββββ. Agricultural goods are distinct from others in many ways.
Industrialised countries impose systematically higher tariffs on such goods. The U.S.
is no exception, as can be seen from Table 3. Therefore, we allow the relationship
between the MFN cuts and the preferential margins to be specific to the type of good.
Table 6 reports the results. In column (1), we simply regress equation (3), adding an
agricultural dummy, ‘AGRI’. The point estimate for β, ˆ .214β = , is not different from
ˆ .216β = in (9) in a statistical sense. The AGRI dummy is negative, indicating that, on
average, tariffs cuts have been lower for agricultural goods once unobserved sector
and partner characteristics are controlled for in the regression. This contradicts the
message conveyed by the (unconditional) first moments of the distribution of cuts of
Table 3. We next allow both the intercept and the coefficient to differ for agricultural
goods. Specifically, we run
( ), ( ) ( )
( ) ( ) ,1
g p p G g AGRI AGRI g
AGRI AGRI g g NON AGRI AGRI g g g p
PT f f f I
I MFN I MFNβ β ε−
∆ = + +
+ ∆ + − ∆ + (11)
where ( ) 1AGRI gI = if good g is classified as an agricultural product and ( ) 0AGRI gI =
otherwise. The results, reported in column (2) of Table 6, indicate that the impact of
MFN cuts is stronger for agricultural goods (ˆ .652AGRIβ = against ˆ .131NON AGRIβ − =

THE EMULATOR EFFECT OF THE URUGUAY ROUND
19
for non-agricultural products) although the observed preferences margins are smaller
ceteris paribus (the agricultural dummy has a negative coefficient which significantly
undermines the impact of MFN cuts). Thus, including this distinction leaves the
qualitative effect unaffected but it also shows that the emulator effect is sector-
specific. That is to say, the political and economic forces that shape trade policy vary
across sectors.
Figure 6 about here
Sector-specific ββββ. The previous regression shows that the quantitative emulator effect
varies across the type of goods. Therefore, we now allow the coefficients to vary
across our 97 HS-2 sector and run
, ( ) ( ) ( ) ,g p p G g G g G g g g pPT f f I MFNβ ε∆ = + + ∆ + (12)
where ( ) 1G gI = if good g belongs to sector G and ( ) 0G gI = otherwise. We do not
report the 97 estimated coefficients here, for obvious reasons, but Figure 6 illustrates
the results and reveals that the emulator effect operates in most HS-2 sectors; the
emulator effect is rejected in only 13% of the sectors.18 In Figure 6, we have ordered
the 97 sector-specific estimates in increasing order of ˆGβ . We also report the 95 and
99 percent confidence intervals. Some ˆGβ ’s are not precisely estimated, for some
sectors have relatively few tariff lines affected by a PTA and/or little variation.
Extensive margin. A separate piece of evidence in favour of the emulator effect
comes from estimating (6) . Specifically, we estimate the effect of the MFN cut on the
number of times a tariff line appears in any of the ten PTAs of our reference sample.
In other words, we assess the extensive margin of the emulator effect. Our Poisson
estimations as specified in (7) and (8) give a positive coefficient significant at the 1%
level, as shown respectively in columns 1 and 2 of table 7.19 Therefore, all
18 Out of the 97 HS-2 sectors, 49 sectors (51%) have an estimated β that is larger than zero at the one percent level (at the five percent level , this number rises to 51 sectors), 13 sectors have an estimated β that is negative at the one percent confidence level and a third of sectors (33 in total) with an estimated β that is not different from zero. Of these 33 sectors, 12 were dropped by STATA® (their β could not be estimated for lack of sufficient variation).
19 As a check we also estimated (6) using standard robust OLS. We obtained a positive coefficient equal to 0.79 significant at the one percent level.

THE EMULATOR EFFECT OF THE URUGUAY ROUND
20
specifications indicate that the larger the MFN cut on a given good, the more often it
will be included in a PTA. We interpret this result as evidence of an extensive margin
of the emulator effect: tariff lines with bolder MFN cuts negotiated during the
Uruguay round are more frequently included in PTAs.
Table 7 about here
6. EXTENSIONS AND ROBUSTNESS CHECKS
In this section we consider several extensions of regressions (3) and (10). As we shall
see, the qualitative result whereby multilateral liberalisations emulated preferential
tariff reductions is unaffected. The quantitative emulator effect also remains of the
same order of magnitude.
Table 8 about here
Bargaining power. We first seek to refine our econometric specification to account
for bargaining power and reciprocity. Results are reported in column (1) of Table 8.
We assert that the partner’s GDP (scaled by the U.S. one), is a reasonable proxy.20
However, we have no prior as to the sign of the coefficient on GDPp/GDPUS because
this proxy captures effects that potentially work in opposite directions. The
benchmark β in (9) and the explanatory power are both unchanged in this
specification. The sign of the coefficient of the relative GDP variable is negative
( ˆ .503GDPβ = − ) and precisely estimated. In plain English, preferences margins are
smaller for bigger countries. This suggests that the likely interaction between
bargaining power and reciprocity mechanisms dominates the effect of the bargaining
power alone. Alternatively, it may also be the case that relative GDP may also proxy
the competition threat of the trade partner for domestic industries. A larger partner
GDP (smaller GDP difference) could reflect similar industrial structures and thus
20 In the results we report in column (1), we use the GDPp/GDPUS ratio prevailing the year before the signing of the trade agreement. In unreported regressions, we run alternative regressions using several Gross Domestic Product measures: Purchasing Power Parity (PPP) $US, in per capita units expressed in current and PPP $US. In any of these regressions, the coefficient on MFN cuts is statistically indistinguishable from .216 and the explanatory power of the specification remains identical to that of the benchmark. The sign of the coefficient of the relative GDP variable is negative throughout and the coefficient is always precisely estimated.

THE EMULATOR EFFECT OF THE URUGUAY ROUND
21
more competition from foreign firms for domestic ones. As a consequence, it would
not be surprising to find lower overall average preferences margins for trade partners,
which are closer on GDP measures ground. We also run a regression similar to
column (1) with the addition of an interaction term between relative GDP and the
MFN cut. Results (not reported in the table) show that this leaves the coefficients of
column (1) virtually unaffected ( .221β = and ˆ .491GDPβ = − in this case).
NTBs. We next control for the presence of NTBs (i.e. technical barriers in our
database). The corresponding additional dummy does not affect the coefficient on
MFN cuts as shown in column (2) of Table 8. The adjusted R2 remains the same as in
the benchmark regression. We obtain a positive and significant coefficient for the
NTBs dummy (ˆ .181NTBd = ). This indicates that the preference margin is larger in the
presence of an NTB. In column (3), we also the NTB dummy with the coefficient on
MFN cuts (not reported). The coefficients on MFN cuts are equal to .299N NTBβ − =
and ˆ .097NTBβ = for tariff lines unaffected by technical barriers and tariff lines
affected by a technical barrier, respectively. The coefficient of the NTB dummy
remains positive ( .083NTBd = ). Thus, the average preference margin is larger on tariff
lines affected by a NTB but the emulator effect is weaker. This suggests that such
tariff lines got relatively large tariff cuts at the multilateral level, which is consistent
with the view that technical barriers often replace tariff barriers. The adjusted R2
remains equal to 0.31.
Figure 7 about here
Categories of goods. Column (4) of Table 8 reports the results of regressing (3) using
HS-4 dummies instead of HS-2 sector dummies. There are 636 such sectors. The
resulting estimated coefficient decreases (ˆ .175β = ) but remains positive. Column (5)
replaces the sector dummies by dummies reflecting the type of goods. This
classification counts 7 categories: Basic manufacturing, Consumption goods,
Equipment goods, Intermediate goods, Mixed products, Primary goods, and a residual
category (which includes only 38 observations). The coefficient on MFN cuts is equal
to 0.289, which is larger than in our baseline regression. The adjusted R2 falls to 15%.
All category dummies are positive (the benchmark category is Basic manufacturing)
except that corresponding to Equipment goods. This means that all categories but
THE EMULATOR EFFECT OF THE URUGUAY ROUND
22
Equipment Goods have a preferential margin larger than the one observed for the
Basic Manufacturing category. We further interact the good category variable with the
MFN cuts one to qualify the result above. We do not report the seven coefficients in
the table but we report them in Figure 7 (we report both the point estimates of the β’s
and the 95 and 99 percent confidence intervals). An interesting pattern emerges: on
the whole, final goods (‘Consumption goods’ and ‘Basic manufacturing’) get a lower
β than intermediate inputs (‘Intermediate goods’, ‘Equipment goods’ and ‘Primary
goods’).21 Thus, the emulator effect is strongest for intermediate inputs. This is
consistent with the view that downstream sectors lobby actively against protecting
upstream sectors (Gawande and Bandyopadhyay 2000), extended to a dynamic sense.
Figure 8 about here
Quantile regressions. Our regressions by type of goods, by sector and by partner,
suggest that β is not the same throughout the sample. If tariff lines subject to a PTA
are not randomly assigned but vary systematically with the preference margin, then
this calls for a quantile regression. Thus we run (3) not conditioning on the mean of
the distribution but on deciles (Koenker and Basset 1978). Figure 8 illustrates the
results (the decile-specificβ ’s are reported on the vertical axis). A clear pattern
emerges: the emulator effect is tiny (and marginally significant) for the lowest decile
and rises monotonically to above .5 for the highest one ( 523.ˆ9. =β ). In plain English,
the emulator effect is strongest for the largest preference margins. This suggests that
the emulator effect dampens the variation by MFN cut. It is all the more noticeable,
then, to see this effect emerging in the pooled regression reported in (9). We also run
distinct quintile regressions for each of the seven categories. Two patterns emerge,
which are in line with our previous findings. First, the estimated β is positive for all of
the 7x5 = 35 quintiles but two (the first two quintiles of ‘consumption goods’).
Second, the estimated β is rising monotonically with the quintile for all of the seven
categories.
21 Goods that belong to the ‘Mixed’ and ‘NES’ categories can not easily be categorised as either final goods or intermediate inputs.
THE EMULATOR EFFECT OF THE URUGUAY ROUND
23
Final MFN rate. In our estimations so far, the tariff rate retained for computing the
preference margin in PTAs is the AMFN rate prevailing at the time of entry into force
of the PTA. As a robustness check, we use instead the MFN rate that shall prevail at
the end of its implementation period, as negotiated during the Uruguay round. After
all, trade negotiators expect this rate to prevail eventually as they negotiate PTA rates.
As should be expected, the coefficient of MFN cuts decreases but, atˆ .123β = , it
remains positive and significantly different from zero. Details of this regression are
reported in column (6) of Table 8.
Full sample. Results obtained for the whole original sample using the benchmark
specification (3) are reported in the next column of Table 8. Our preferred
specification uses only a subset of available data in order to avoid an upward bias: in
some instances, the MFN rate is zero in the final year of the implementation of the
PTA. When this happens, the PTA tariff that year is constrained from above and the
preference margin is constrained from below. In column (7), ˆ .349β = is significantly
larger than the one obtained in (9), confirming the existence of an upward bias.
Restricted sample. Finally, we exclude two PTAs from our sample, the GSP for
LDCs (1997) and AGOA (2000) because such agreements have a large number of
duty free tariff lines so as to ensure that the emulator effect is not being identified by a
special case. The result of the regression on this restricted sample is reported in
column (8) of Table 8. Our main effect remains positive and it is only slightly
weakened ( .181β = ).
Table 9 about here
Selection bias. Not all the tariff lines (forty percent) are affected by a PTA (Table 4,
Figure 3 and Figure 4). In addition, two thirds of the tariff lines that are affected by
some PTA are included in only a fraction of the ten PTAs of our sample. What are the
determinants of including a tariff line in a PTA? To answer this question, we run a
Probit on (4). Results are reported in Table 9. All the specifications we run (the result
of some of them are not being reported here) suggest the existence of a systematic
selection of tariff lines into PTAs: the α ’s are all significant different from zero (the
coefficient of the Inverse Mill's Ratio -IMR- variable is always negative and highly
significant). We first run (4) using the full sample, excluding the UNIDO controls Xg.
THE EMULATOR EFFECT OF THE URUGUAY ROUND
24
Results are reported in column (1). We find that the probability that a tariff line is
selected into a PTA is positively associated with the MFN tariff level: that is to say,
countries that negotiate a PTA are more likely to include goods that have a high MFN
tariff to start with. These are the goods for which they have the largest margin of
manoeuvre.22 We also find that some observations have been dropped for some sector
dummies perfectly predict the selection into not being part of any PTA (this happens
for tariff lines with little variation and/or few observations). Two solutions are
available when running the second step (5): either we drop such observations or we
attribute them a predicted value for the first stage of { } 01.0Pr , =>∆∧
pgPT , i.e. almost
zero23. We report the results of the latter only.24 We run (5) on the full sample in
column (1a), whereas we run (5) on our reference sample in column (1b). In both
cases, ˆ .216β < in a statistical sense25; this reveals the existence of a systematic
downward bias. Nevertheless, the emulator effect of multilateral trade liberalisation
on preferential margins remains positive, even after controlling for the fact that
negotiating partners chose to cut tariffs where there is the largest margin to grant
‘concessions’. Columns (2a) and (2b) replicate the two-step procedure of columns
(1a) and (1b), respectively, adding the UNIDO sector controls. Since the UNIDO
variables (output, employment, wages, value added) are collinear, we use output only.
Running (4), the estimated coefficient is negative, indicating that the U.S. is more
likely to grant preferential access in the sectors where the stakes (in terms of output,
employment, wages or value added) are lowest.26 The estimated coefficients for (5)
are ˆ .202β = and ˆ .189β = for the ‘UNIDO-full’ and ‘UNIDO-reference’ samples,
respectively. The downward bias is much smaller, but one should recall that using
22 As far as the US are concerned, the average Uruguay MFN rate is equal to 2.06 for those lines not included in any PTA. The corresponding figure jumps to 6.63 for those lines included in at least one PTA. Standard deviations are respectively 6.37 and 6.86.
23 A comparable approach is adopted for instance in Helpman, Melitz and Rubinstein (2008).
24 When we chose the former the estimated coefficient for β falls to .13.
25 Results reported in Table 9 are obtained with standard OLS robust estimation. We have also computed bootstrapped standard errors as the inverse Mill's ratio is an estimated variable. Standard errors based on 500 replications hardly vary from the ones reported in table 9 and do not affect any coefficient significance test, at any level.
26 This is in line with the findings of e.g. Trefler (1993).

THE EMULATOR EFFECT OF THE URUGUAY ROUND
25
UNIDO controls requires one to scale down the samples – which may introduce a bias
on its own.27
Alternative specifications. We conclude with a series of simple robustness checks on
the benchmark regression that we do not report in tables. Specifically, we first
estimate the following within-estimator:
within within, ( ) , ,p g p G g p g g pPT f MFNβ ε∆ ∆ = + ∆ ∆ +% (13)
where
within within, , ,pp g p g p p g gPT PT PT MFN MFN MNF∆ ∆ ≡ ∆ − ∆ ∆ ∆ ≡ ∆ − ∆
and
,1 1,p p
g gp g p gg g
PT PT MFN MFN= =
∆ ≡ ∆ ∆ ≡ ∆∑ ∑ .
In words, within, , pp g p g pPT PT PT∆ ∆ ≡ ∆ − ∆ and within
p g gMFN MFN MNF∆ ∆ ≡ ∆ − ∆ are
the difference between tariff cuts at the good-level and the sample average
(preferential and multilateral, respectively). Also, pPT∆ is defined as the average
preferential margins granted to partner p and p
g is the number of goods included in
the preferential trading agreement p; MNF∆ is defined analogously. Clearly, if the
ε’s are i.i.d., then (13) is equivalent to (3); indeed, running (13), we obtain .216β =
(t-stat. 11.52), which are identical to the values obtained in (9). In a similar spirit, we
also estimate the ‘diff-in-diff’:
( )within within within within, , ,p g p p p p g p g pPT PT MFN MFNγ γβ ε∆ ∆ − ∆ ∆ = ∆ ∆ − ∆ ∆ + (14)
for any g and γ such that g γ≠ and ( ) ( )G g G γ= . In this case, we find that 216.ˆ =β
(t-stat. 11.48).28
27 As a further robustness check (unreported), we run (3) adding UNIDO controls (i.e. output). The reported estimated coefficient rises to .246 (t-stat = 13.15). The coefficient on output is negative (t-stat = .3.66). The adjusted R2 is equal to .31. We then run both (4) and (5) with the UNIDO control; the estimated β is equal to .202 (UNIDO-full sample) and .189 (UNIDO-restricted sample). The t-stats are 13.31 and 11.98, respectively.

THE EMULATOR EFFECT OF THE URUGUAY ROUND
26
Table 10 about here
A final robustness check consists of using annual rates cuts rather absolute ones. This
is motivated by the fact underlined previously that the time length and path of
implementation are pre-determined. Annual rate cuts are obtained by dividing the
simple difference between two rates by the number of years it takes to obtain a flat
tariff profile (the tariff rate becomes constant). A similar path can be attributed to
PTAs implementation. Regression results are reported in Table 10. In the benchmark
specification (column 1), the coefficient of the annual rate of the MFN cut is equal to
0.46 with a standard deviation of 0.025: larger annual cuts in MFN bound rates imply
larger annual preference margins. Column (2) and (3) includes the AGRI dummy and
its interaction with the speed of MFN cuts variable. The speed of preferential margins
implementation is slower for agricultural goods and the impact of the speed of MFN
cuts is comparable to any other good.
7. CONCLUSIONS
This paper investigates the empirical relationship between cuts in MFN bound rates
negotiated during the Uruguay Round of the GATT (1986-1994) and preferences
margins given to PTAs partners in the aftermath of its completion. Our empirical
investigation focuses on the United States using official tariff line level data. Our
results reveal that an ‘emulator effect’ of multilateral trade negotiations on
preferential agreements is at work: multilateralism and regionalism appear as
‘dynamic complements’. Indeed, preferences margins are larger the larger the cut in
MFN bound rates. Moreover, a tariff line is included in a larger number of PTAs the
larger the cut in MFN bound rates. Therefore, we can state that the past success of
multilateralism is at least partly responsible for the current wave of U.S. regionalism.
Our empirical results also indicate that although preference margins are on average
smaller for agricultural products, the emulator effect for those products is strong
relative to non agricultural products. When we control for the length of the
28 Regressing deviations from the mean implies regressing values that have been computed. Therefore, we have also bootstraped the errors to obtain unbiased estimations of the standard errors. The estimated coefficient remains unchanged and it t-statistic varies around 11.50 depending to the number of replications.

THE EMULATOR EFFECT OF THE URUGUAY ROUND
27
implementation period, we find that the emulator effect is stronger for non-
agricultural products. Together, these findings suggest that the emulator effect is
slower for agricultural products. We conduct several other extensions. In one of them,
we find that the emulator effect is stronger for intermediate inputs than for final
goods.
To the best of our knowledge, our paper is unique in looking at the causal relationship
from multilateralism to regionalism. The existing empirical literature, only
burgeoning, is exclusively looking at the relationship running the other way (Limão
2006, Limão and Karacaovali 2007, Estevadeordal et al. forthcoming). This line of
research is motivated by the view expressed in numerous theoretical contributions that
regionalism has a ‘stumbling block’ effect on multilateral trade liberalisation
(Bhagwati 1991). If the stumbling block hypothesis is correct, then the proliferation of
PTAs involving at least one WTO member is guilty of slowing down and threatening
the (by now interrupted) ‘Doha round’ of negotiations at the GATT/WTO. Trade
negotiators should then urge to reach a final agreement in order to contain the
stumbling impact of forthcoming PTAs (e.g. the FTA between the US and Malaysia
whose negotiations are in active mode). This point of view is consistent with the
argument that NAFTA and discussions with APEC countries gave the US leverage on
the EU within negotiations at Uruguay round.
A related and pessimistic received wisdom, which runs in the other direction, is that
the explosion of regionalism is a symptom of the difficulties encountered by the Doha
round. However, the fact that multilateral trade negotiations may be seen a strong
instigator of the current wave of regionalism could also lead us to think that delayed
negotiations are not necessarily reflecting any stumbling block effect of PTAs. Rather
it could reflect political/negotiations slowness due to a multilateral agenda which has
become more ambitious than it would have been without growing regionalism.
Moreover, trade negotiations appear to take place in a context where political
leadership is lacking (Irwin, Mavroidis and Sykes 2008)..
This paper questions this received wisdom and shows that (recent) trade liberalisation
negotiated between the U.S. and various small sets of countries was boldest for those
goods for which the tariffs had been reduced most sharply during the Uruguay round
of multilateral trade liberalisation that ended in 1994. Such dynamic
THE EMULATOR EFFECT OF THE URUGUAY ROUND
28
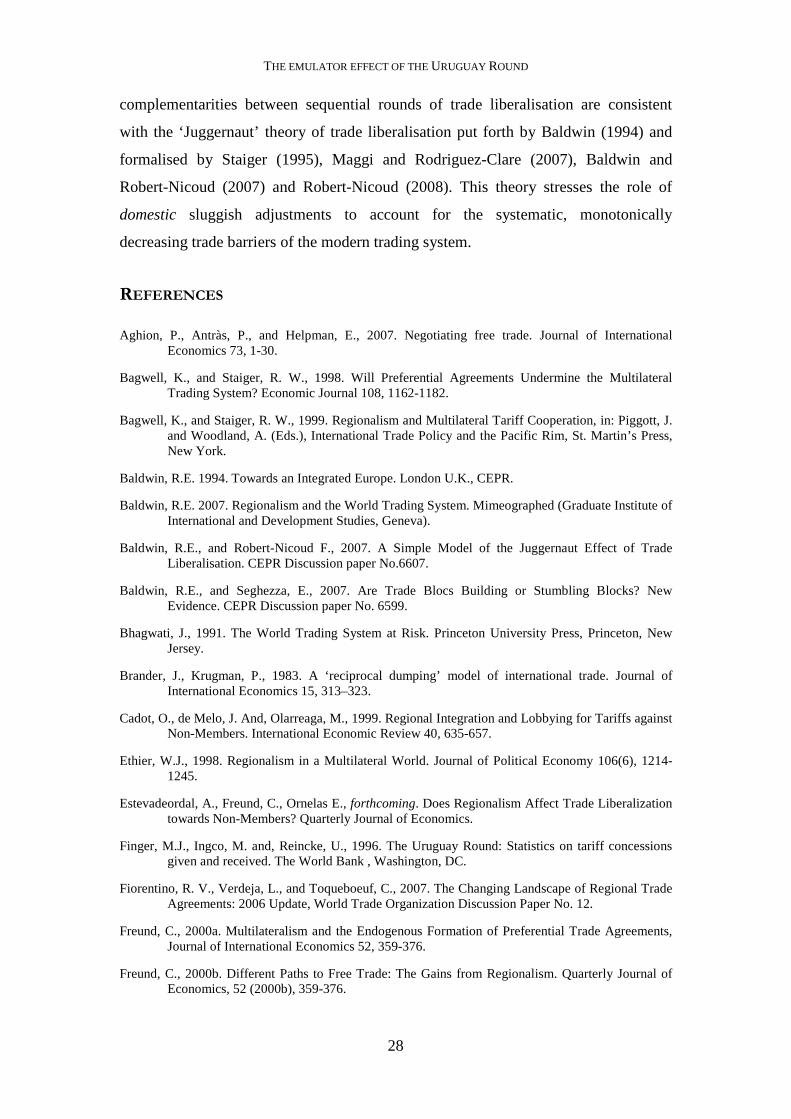
complementarities between sequential rounds of trade liberalisation are consistent
with the ‘Juggernaut’ theory of trade liberalisation put forth by Baldwin (1994) and
formalised by Staiger (1995), Maggi and Rodriguez-Clare (2007), Baldwin and
Robert-Nicoud (2007) and Robert-Nicoud (2008). This theory stresses the role of
domestic sluggish adjustments to account for the systematic, monotonically
decreasing trade barriers of the modern trading system.
REFERENCES
Aghion, P., Antràs, P., and Helpman, E., 2007. Negotiating free trade. Journal of International Economics 73, 1-30.
Bagwell, K., and Staiger, R. W., 1998. Will Preferential Agreements Undermine the Multilateral Trading System? Economic Journal 108, 1162-1182.
Bagwell, K., and Staiger, R. W., 1999. Regionalism and Multilateral Tariff Cooperation, in: Piggott, J. and Woodland, A. (Eds.), International Trade Policy and the Pacific Rim, St. Martin’s Press, New York.
Baldwin, R.E. 1994. Towards an Integrated Europe. London U.K., CEPR.
Baldwin, R.E. 2007. Regionalism and the World Trading System. Mimeographed (Graduate Institute of International and Development Studies, Geneva).
Baldwin, R.E., and Robert-Nicoud F., 2007. A Simple Model of the Juggernaut Effect of Trade Liberalisation. CEPR Discussion paper No.6607.
Baldwin, R.E., and Seghezza, E., 2007. Are Trade Blocs Building or Stumbling Blocks? New Evidence. CEPR Discussion paper No. 6599.
Bhagwati, J., 1991. The World Trading System at Risk. Princeton University Press, Princeton, New Jersey.
Brander, J., Krugman, P., 1983. A ‘reciprocal dumping’ model of international trade. Journal of International Economics 15, 313–323.
Cadot, O., de Melo, J. And, Olarreaga, M., 1999. Regional Integration and Lobbying for Tariffs against Non-Members. International Economic Review 40, 635-657.
Ethier, W.J., 1998. Regionalism in a Multilateral World. Journal of Political Economy 106(6), 1214-1245.
Estevadeordal, A., Freund, C., Ornelas E., forthcoming. Does Regionalism Affect Trade Liberalization towards Non-Members? Quarterly Journal of Economics.
Finger, M.J., Ingco, M. and, Reincke, U., 1996. The Uruguay Round: Statistics on tariff concessions given and received. The World Bank , Washington, DC.
Fiorentino, R. V., Verdeja, L., and Toqueboeuf, C., 2007. The Changing Landscape of Regional Trade Agreements: 2006 Update, World Trade Organization Discussion Paper No. 12.
Freund, C., 2000a. Multilateralism and the Endogenous Formation of Preferential Trade Agreements, Journal of International Economics 52, 359-376.
Freund, C., 2000b. Different Paths to Free Trade: The Gains from Regionalism. Quarterly Journal of Economics, 52 (2000b), 359-376.

THE EMULATOR EFFECT OF THE URUGUAY ROUND
29
Fugazza, M. and Robert-Nicoud, F., Multilateralism and the Endogenous Formation of Preferential Trade Agreements: Evidence from the United States. Mimeographed (UNCTAD and LSE).
Gawande, K. and Bandyopadhyay, U., 2000. Is Protection for Sale? Evidence on the Grossman-Helpman Theory of Endogenous Protection. Review of Economics and Statistics 82(1), 139-152.
Gawande, K., Krishna, P. and Robbins, M.J., 2006. Foreign Lobbies and U.S. Trade Policy. Review of Economics and Statistics 88(3), 563-571.
Grossman, G.M. and Helpman, E., 1994. Protection For Sale. American Economic Review 84(4), 833-850.
Grossman, G.M. and Helpman, E., 1995. The Politics of Free-Trade Agreements. American Economic Review 85(4), 667-690.
Helpman, E., Melitz, M. and Rubinstein, Y., 2008. Estimating Trade Flows: Trading Partners and Trading Volumes. Quarterly Journal of Economics 123, 441-487.
Irwin, A. D., Mavroidis, P. C. and Sykes A. O., 2008. The Genesis of the GATT. New York: Cambridge University Press.
Koemker, R. and Bassett, G., 1978. Regression Quantiles. Econometrica 46(1), 33-50.
Krishna, P., 1998. Regionalism and Multilateralism: A Political Economy Approach, Quarterly Journal of Economics 113, 227-252.
Levy, P., 1997. A Political Analysis of Free Trade Agreements. American Economic Review 87, 506-519.
Limão, N., 2006. Preferential Trade Agreements as Stumbling Blocks for Multilateral Trade Liberalization: Evidence for the U.S. American Economic Review 96(3), 896-914.
Limão, N., 2007. Are Preferential Trade Agreements with Non-Trade Objectives a Stumbling Block for Multilateral Trade Liberalization? Review of Economic Studies 74(3), 821-855.
Limão, N. and, Karacaovali, B., 2007. The Clash of Liberalizations: Preferential vs. Multilateral Trade Liberalization in the European Union. Journal of International Economics 74(2), 299-327.
Maggi, G., and Rodríguez-Clare, A., 1998. The Value of Trade Agreements in the Presence of Political Pressures. Journal of Political Economy 106(3), 574-601.
Maggi, G., and Rodríguez-Clare, A., 2007. A Political-Economy Theory of Trade Agreements, American Economic Review 97, 1374-1406.
McLaren, J., 2002. A Theory of Insidious Regionalism. Quarterly Journal of Economics, 118, 571-608.
Ornelas, E., 2005a. Rent Destruction and the Political Viability of Free Trade Agreements. Quarterly Journal of Economics 120, 1475-1506.
Ornelas, E., 2005b. Endogenous free trade agreements and the multilateral trading system. Journal of International Economics 67, 471-497.
Robert-Nicoud, F., 2008. Lobbying and the intensive and extensive margins of trade liberalisation, manuscript, London School of Economics.
Romalis, J., 2007. Market Access, Openness and Growth, NBER Working Paper 13048.
Saggi, K., 2006. Preferential Trade Agreements and Multilateral Tariff Cooperation. International Economic Review 47(1), 29-57.
Staiger, R., 1995. A Theory of Gradual Trade Liberalization," in: Deardorff, A., Levinsohn, J. and Stern, R. (Eds.), New Directions in Trade Theory, University of Michigan Press.

THE EMULATOR EFFECT OF THE URUGUAY ROUND
30
Trefler D,, 1993. Trade Liberalization and the Theory of Endogenous Protection: An Econometric Study of U.S Import Policy. Journal of Political Economy, 101, 138-160.
The Economist, 2008. Who Runs The World? The Economist 388(8587), 37-40.
World Trade Organization, United Conference on Trade and Development, International Trade Centre. 2007. World Tariff Profiles 2006. WTO, UNCTAD and ITC, Geneva.
Zoellick R. B., 2001. 2001 Trade Policy Agenda and 2000 Annual Report. Office of the United States Trade Representative, Washington D.C.

THE EMULATOR EFFECT OF THE URUGUAY ROUND
31
FIGURES
Figure 1. Tariffs are falling over time (US data - simple averages)
Final Bound Rate
23
45
6 (
%)
1989
1990
1991
1992
1993
1994
1995
1996
1997
1998
1999
2000
2001
2002
2003
2004
2005
2006
2007
year
MFN Applied Tariff Effectively Applied Tariff
Source: UNCTAD-TRAINS
Note: The effectively applied tariff is defined as the lowest available tariff. If a preferential tariff
exists, it is used as the effectively applied tariff. Otherwise, the MFN applied tariff is used.
Figure 2. Average ad-valorem tariffs: Agri vs. non-agri.
-3.89
-6.78
2.04
12.6
8.71
-3.07
-6.09
.56
9.39
6.32
-50
510
15A
d-va
lore
m ta
riffs
and
cut
s (in
per
cent
)
AGRI Non-AGRI
MFN cutPref. Margin
Pref. RateTokyo
UruguayMFN cut
Pref. MarginPref. Rate
TokyoUruguay
Note: Tokyo and Uruguay are MFN Bound rates

THE EMULATOR EFFECT OF THE URUGUAY ROUND
32
Figure 3. Number of tariff lines included in PTAs, by PTA 0
1,00
02,
000
3,00
04,
000
Num
ber
of ta
riff l
ines
incl
uded
AGOA AUS All BHR CAFTA CBT CHL JRD LDC MAR SGPPTAs
Figure 4. Number of tariff lines included in PTAs, by frequency
050
01,
000
1,50
0N
umbe
r of
tarif
f lin
es in
PT
As
1 2 3 4 5 6 7 8 9 10

THE EMULATOR EFFECT OF THE URUGUAY ROUND
33
Figure 5. Partner-specific coefficients -.
20
.2.4
.6.8
beta
AUS BHR CHL JOR MAR SGP AGOA CAFTA CBTGSP-LDC
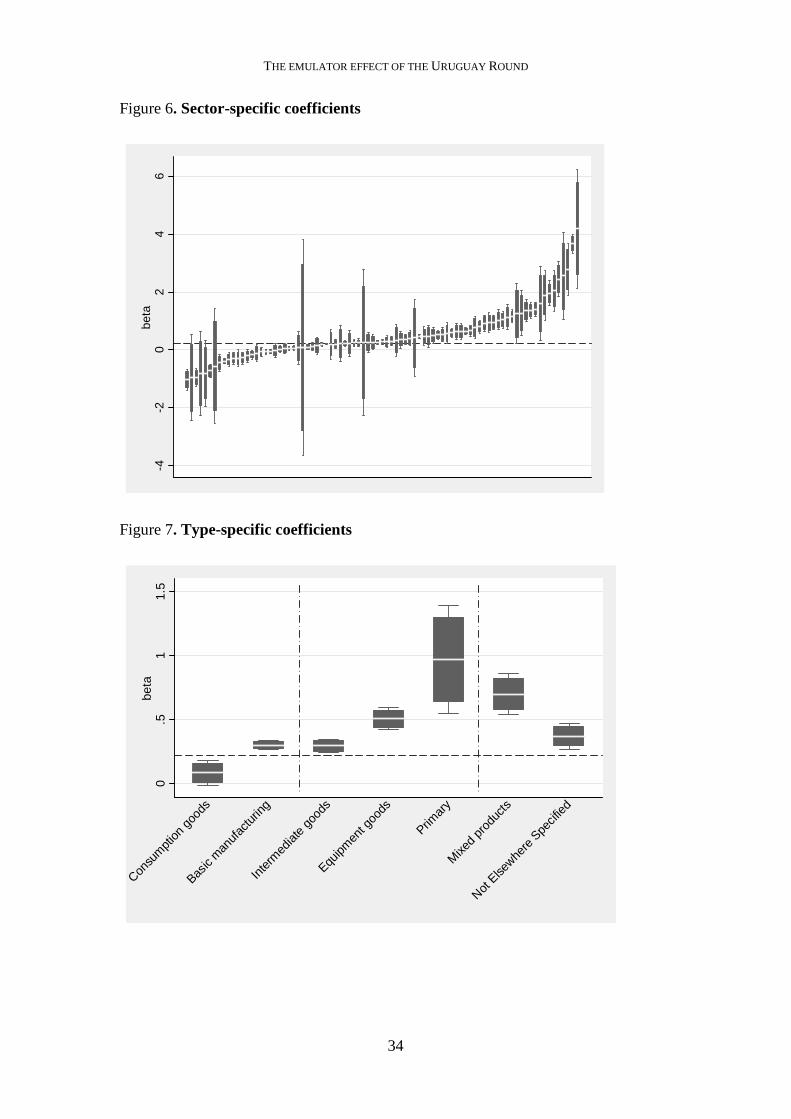
THE EMULATOR EFFECT OF THE URUGUAY ROUND
34
Figure 6. Sector-specific coefficients
-4-2
02
46
beta
Figure 7. Type-specific coefficients
0.5
11.
5be
ta
Consu
mpt
ion g
oods
Basic
man
ufac
turin
g
Inte
rmed
iate
good
s
Equipm
ent g
oods
Primar
y
Mixe
d pr
oduc
ts
Not Else
where
Spe
cified

THE EMULATOR EFFECT OF THE URUGUAY ROUND
35
Figure 8. Quantile regression: coefficients
0.00
0.10
0.20
0.30
0.40
0.50
beta
0 .2 .4 .6 .8 1Quantile
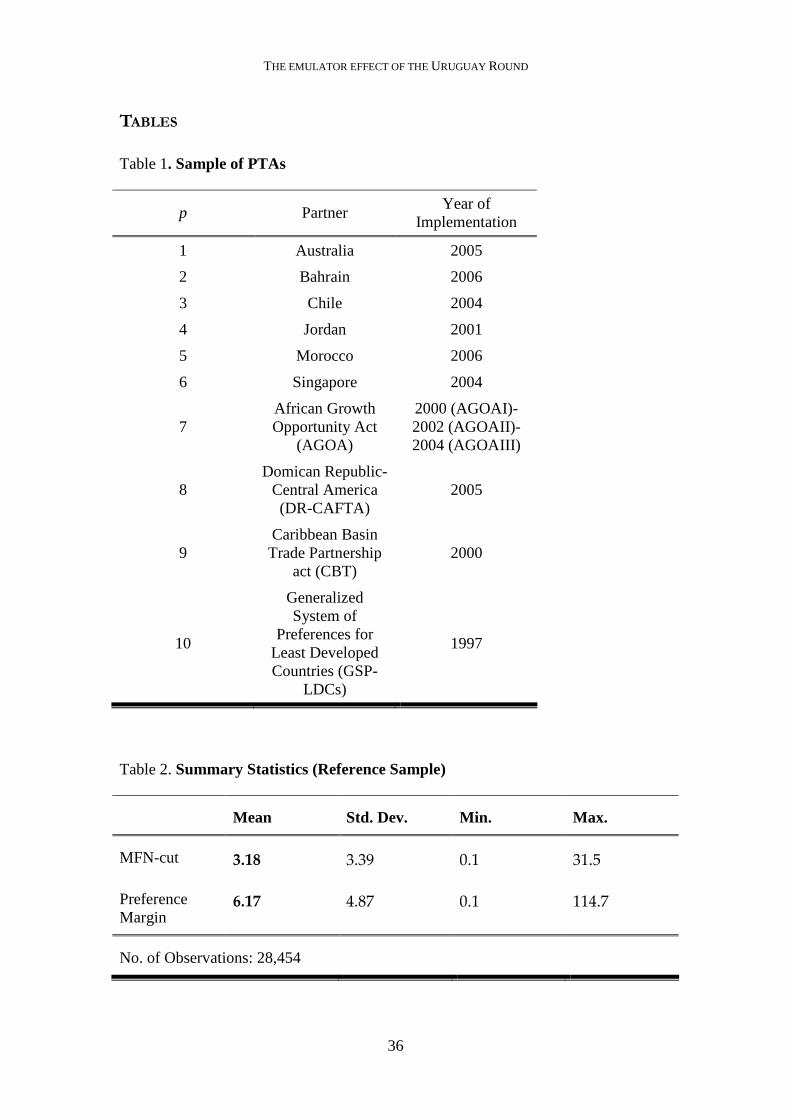
THE EMULATOR EFFECT OF THE URUGUAY ROUND
36
TABLES
Table 1. Sample of PTAs
p Partner Year of
Implementation
1 Australia 2005
2 Bahrain 2006
3 Chile 2004
4 Jordan 2001
5 Morocco 2006
6 Singapore 2004
7 African Growth Opportunity Act
(AGOA)
2000 (AGOAI)-2002 (AGOAII)-2004 (AGOAIII)
8 Domican Republic-
Central America (DR-CAFTA)
2005
9 Caribbean Basin Trade Partnership
act (CBT) 2000
10
Generalized System of
Preferences for Least Developed Countries (GSP-
LDCs)
1997
Table 2. Summary Statistics (Reference Sample)
Mean Std. Dev. Min. Max.
MFN-cut 3.18 3.39 0.1 31.5
Preference Margin
6.17 4.87 0.1 114.7
No. of Observations: 28,454

THE EMULATOR EFFECT OF THE URUGUAY ROUND
37
Table 3. Summary Statistics (Reference Sample): Agri. vs. Non-agri.
Agricultural goods Non-agricultural goods
Mean a Median a Mean b Median b Mean a Median a Mean b Median b
BMFN Uruguay
9.52
(16.)
6.4 8.71
(13.65)
6.4 6.47
(4.94)
5.5 6.32
(4.89)
5.5
BMFN Tokyo
13.48
(18.71)
10 12.6
(16.07)
10 9.55
(6.27)
7.5 9.39
(6.2)
7.2
MFN-cut 3.96
(3.93) 3
3.89
(3.78) 3
3.07
(3.37)
1.9 3.07
(3.32)
2
Preference Rate
2.04
(9.85)
0 .56
(2.08)
0
Preference Margin
6.78
(6.53)
5.4 6.09
(4.59)
4.9
a Number of agricultural goods: 384. Number of non-agricultural goods: 3,058. Each good (tariff line) gets an equal weight.
b Number of observations (agricultural goods): 3,428. Number of observations (non-agricultural goods): 25,026. Each tariff line × partner gets an equal weight.
Note. The figures for the Preference Rate and Margin in column (a) are not well defined since there can be up to 10 different Preference Rates and Margins in our sample of ten partnerships.

THE EMULATOR EFFECT OF THE URUGUAY ROUND
38
Table 4. Frequency of tariff lines with a preferential tariff rate
Frequency of partners
1 2 3 4 5 6 7 8 9 10 Total
AUS 0 0 0 5 73 39 584 878 208 1,407 3,194
BHR 0 0 0 0 0 4 437 330 208 1,407 2,386
CHL 0 0 2 6 82 50 588 878 206 1,407 3,219
JRD 4 0 2 8 82 53 576 878 208 1,407 3,218
MAR 0 0 0 1 73 40 583 877 208 1,407 3,189
SGP 0 0 2 6 73 50 581 878 208 1,407 3,205
AGOA 4 8 173 3 9 20 148 781 203 1,407 2,756
CAFTA 0 0 0 0 0 1 437 330 208 1,407 2,383
CBT 7 18 173 4 9 47 153 646 208 1,407 2,672
LDC 3 14 173 3 9 20 141 548 7 1,407 2,325
All 18 20 175 9 82 54 604 878 208 1,407 3,455
(%) 0.5 0.6 5.1 0.3 2.4 1.6 17.5 25.4 6.0 40.7 100
Notes. The dataset contains 3,455 unique tariff lines. Each cell informs about the frequency of tariff line × partner pairs. For instance, the first column reveals that there are 4 tariff lines that are subject to the U.S.-JORDAN (JRD) PTA and no other. Likewise, there are respectively 3 tariff lines that are unique to the U.S. GSP for LDCs (LDC). The fourth column reveals that there are five tariff lines that are subject to the U.S.-Australia PTA as well three other PTAs (hence the column's name 4).

THE EMULATOR EFFECT OF THE URUGUAY ROUND
39
Table 5. Benchmark regressions
diffPREF (1) (2) (3)
diffMFN 0.216 0.203
(11.53)** (11.75)**
AUSTRALIA*d iffMFN 0.076
(2.38)*
BARHAIN*diffMFN 0.093
(2.46)*
CHILE*diffMFN 0.206
(4.26)**
JORDAN*diffMFN 0.449
(4.38)**
MOROCCO*diffMFN 0.068
(2.77)**
SINGAPORE*diffMFN 0.059
-0.95
AGOA*diffMFN 0.291
(8.21)**
CAFTA*di ffMFN 0.089
(2.93)**
CBT/DR*diffMFN 0.387
(11.69)**
GSP-LDCs*diffMFN 0.708
(13.23)**
Industry dummies Yes Yes Yes
Partner dummies Yes Yes Yes
Observations 28454 31239 28454
Parameters 96 96 105
R-squared Adjusted 0.31 0.33 0.33
Robust t statistics in parentheses;* significant at 5%; ** significant at 1%

THE EMULATOR EFFECT OF THE URUGUAY ROUND
40
Table 6. Regressions by type of products (agri. vs. non-agri)
diffPREF (1) (2)
diffMFN 0.214
(11.38)**
AGRI -1.547 -2.997
(10.28)** (-10.26)**
AGRI*diffMFN 0.652
(6.59)**
NON-AGRI*diffMFN 0.131
(12.38)**
Industry dummies Yes Yes
Observations 28454 28454
Parameters 97 98
R-squared Adjusted 0.31 0.33
Robust t statistics in parentheses ;* significant at 5%; ** significant at 1%
Table 7. Regressions on the extensive margin (number of PTAs per tariff line)
(1) (2)
diffMFN 0.11 0.12
(17.71)** (15.14)**
Industry dummies Yes Yes
Observations 8,661 8,661
Parameters 98 98
Pseudo R-squared
0.25 0.28
Robust t statistics in parentheses ;* significant at 5%; ** significant at 1%

THE EMULATOR EFFECT OF THE URUGUAY ROUND
41
Table 8. Extensions and robustness checks (I)
GDP NTB NTB HS-4 sector
dummies
Stage of
production
Uruguay
rates
Whole
sample
Restricted
sample
diffPREF (1) (2) (3) (4) (5) (6) (7) (8)
diffMFN 0.216 0.216 0.175 0.289 0.123 0.349 0.181
(11.5)** (11.52)** (3.74)** (15.95)** (6.51)** (19.09)** (8.70)**
GDPp/GDPUS -.503
(-21.63)**
Dummy NTB
(dNTB)
0.181
(2.24)*
0.833
(6.31)**
dNTB *
diffMFN
0.097
(2.87)**
(1-dNTB) *
diffMFN
0.299
(14.59)**
Industry Yes Yes Yes Yes No Yes Yes Yes
Partner Yes Yes Yes Yes Yes Yes Yes Yes
Observations 28454 28454 28454 28454 28454 28454 49303 23413
Parameters 97 97 97 653 17 96 102 94
R-squared
Adjusted
0.31 0.31 0.32 0.44 0.15 0.28 0.33 0.30

THE EMULATOR EFFECT OF THE URUGUAY ROUND
42
Table 9. Selection
First Stage
(1) (2)
MFNUruguay 0.587 0.617
(154.29)** (153.37)**
UNIDO - 6.54e-12
(19.76)**
Observations 52,510 44,050
Pseudo-R2 0.72 0.67
Second Stage
(1a) (1b) (2a) (2b)
diffMFN 0.194 0.173 0.202 0.189
(10.71)** (9.63)** (13.31)** (11.98)**
IMR -7.887 -8.131 -7.675 -7.558
(56.99)** (56.91)** (95.63)** (88.11)**
Observations 34,118 28,454 24,845 20,824
R-squared
Adjusted 0.39 0.38 0.47 0.45
Robust t statistics in parentheses ;* significant at 5%; ** significant at 1%

THE EMULATOR EFFECT OF THE URUGUAY ROUND
43
Table 10. Extensions and robustness checks (II)
SdiffPREF (1) (2) (3)
SdiffMFN 0.46 0.458
(10.09)** (10.05)**
AGRI -0.324 -0.251
(-5.38)** (-3.27)**
AGRI*diffMFN 0.359
(6.19)**
NAGRI*diffMFN 0.491
(8.64)**
Industry dummies Yes Yes Yes
Observations 20408 20408 20408
Parameters 96 97 98
R-squared Adjusted 0.45 0.45 0.45
Robust t statistics in parentheses;* significant at 5%; ** significant at 1%
Related Documents

![The Effects of the Uruguay Round: Empirical Evidence … The Effects of the Uruguay Round: Evidence from US Industry “...[The GATT]... could add as much as one hundred to two hundred](https://static.cupdf.com/doc/110x72/5acca49d7f8b9ad13e8d140a/the-effects-of-the-uruguay-round-empirical-evidence-the-effects-of-the-uruguay.jpg)