Bureau of Labor Statistics Washington, D.C. 20212 Technical information: Household data: (202) 691-6378 USDL 09-0224 http://www.bls.gov/cps/ Establishment data: (202) 691-6555 Transmission of material in this release http://www.bls.gov/ces/ is embargoed until 8:30 A.M. (EST), Media contact: (202) 691-5902 Friday, March 6, 2009. THE EMPLOYMENT SITUATION: FEBRUARY 2009 Nonfarm payroll employment continued to fall sharply in February (-651,000), and the unemploy- ment rate rose from 7.6 to 8.1 percent, the Bureau of Labor Statistics of the U.S. Department of Labor reported today. Payroll employment has declined by 2.6 million in the past 4 months. In February, job losses were large and widespread across nearly all major industry sectors. Unemployment (Household Survey Data) The number of unemployed persons increased by 851,000 to 12.5 million in February, and the un- employment rate rose to 8.1 percent. Over the past 12 months, the number of unemployed persons has increased by about 5.0 million, and the unemployment rate has risen by 3.3 percentage points. (See table A-1.) The unemployment rate continued to trend upward in February for adult men (8.1 percent), adult women (6.7 percent), whites (7.3 percent), blacks (13.4 percent), and Hispanics (10.9 percent). The jobless rate for teenagers was little changed at 21.6 percent. The unemployment rate for Asians was 6.9 percent in February, not seasonally adjusted. (See tables A-1, A-2, and A-3.) News United States Department of Labor Chart 1. Unemployment rate, seasonally adjusted, March 2006 – February 2009 4.0 4.5 5.0 5.5 6.0 6.5 7.0 7.5 8.0 8.5 9.0 9.5 10.0 Percent Millions Chart 2. Nonfarm payroll employment, seasonally adjusted, March 2006 – February 2009 2009 2009 2007 2007 2008 2008 122.0 124.0 126.0 128.0 130.0 132.0 134.0 136.0 138.0 140.0 142.0 2007 2007 2008 2008 2009 2009

Welcome message from author
This document is posted to help you gain knowledge. Please leave a comment to let me know what you think about it! Share it to your friends and learn new things together.
Transcript
Bureau of Labor Statistics Washington, D.C. 20212
Technical information: Household data: (202) 691-6378 USDL 09-0224 http://www.bls.gov/cps/ Establishment data: (202) 691-6555 Transmission of material in this release http://www.bls.gov/ces/ is embargoed until 8:30 A.M. (EST), Media contact: (202) 691-5902 Friday, March 6, 2009.
THE EMPLOYMENT SITUATION: FEBRUARY 2009
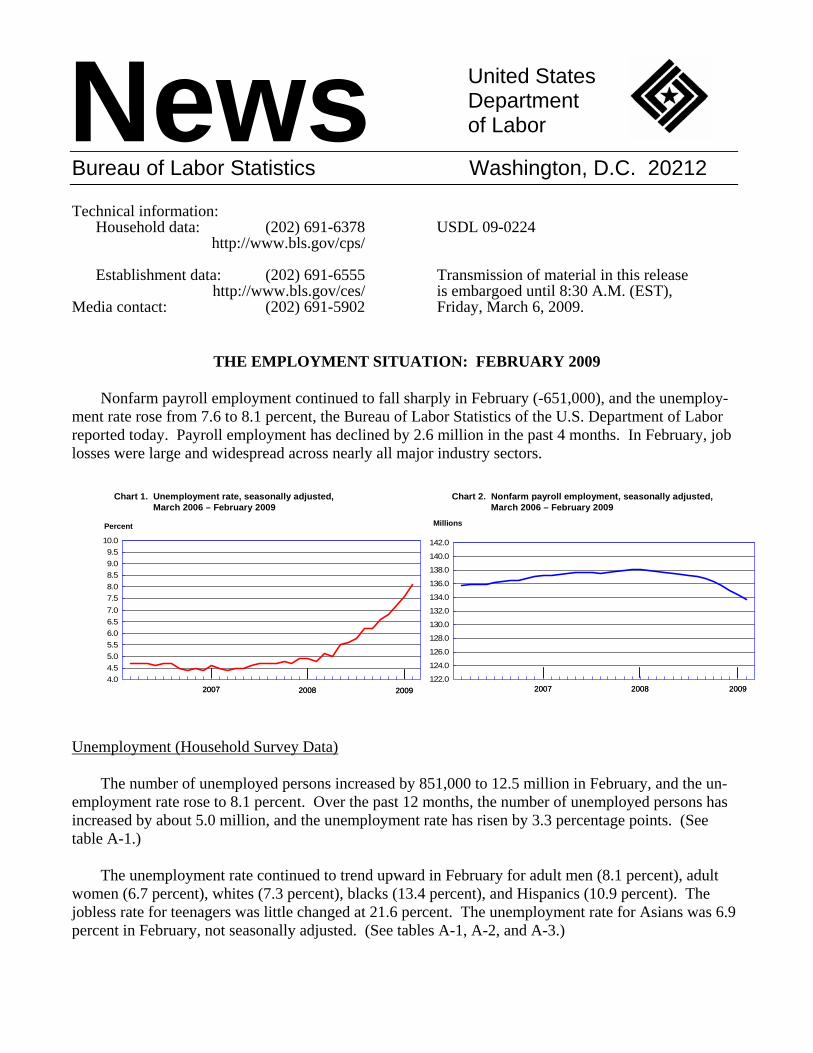
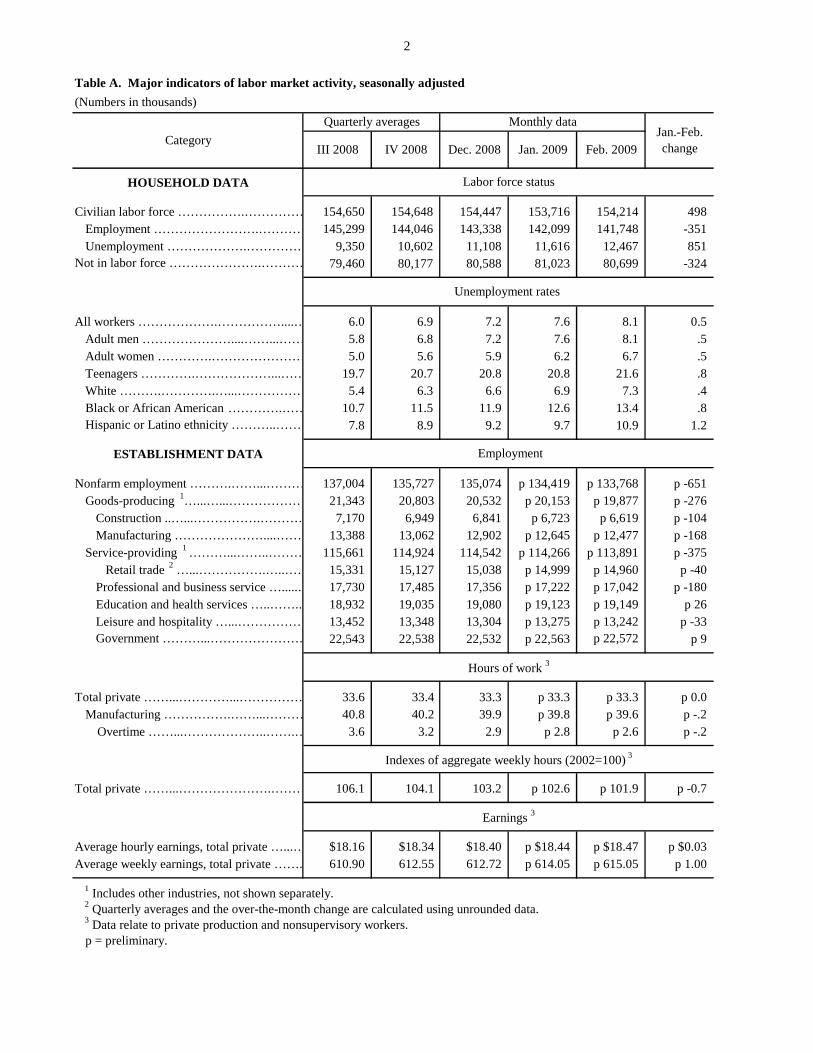
Nonfarm payroll employment continued to fall sharply in February (-651,000), and the unemploy-ment rate rose from 7.6 to 8.1 percent, the Bureau of Labor Statistics of the U.S. Department of Labor reported today. Payroll employment has declined by 2.6 million in the past 4 months. In February, job losses were large and widespread across nearly all major industry sectors. Unemployment (Household Survey Data)
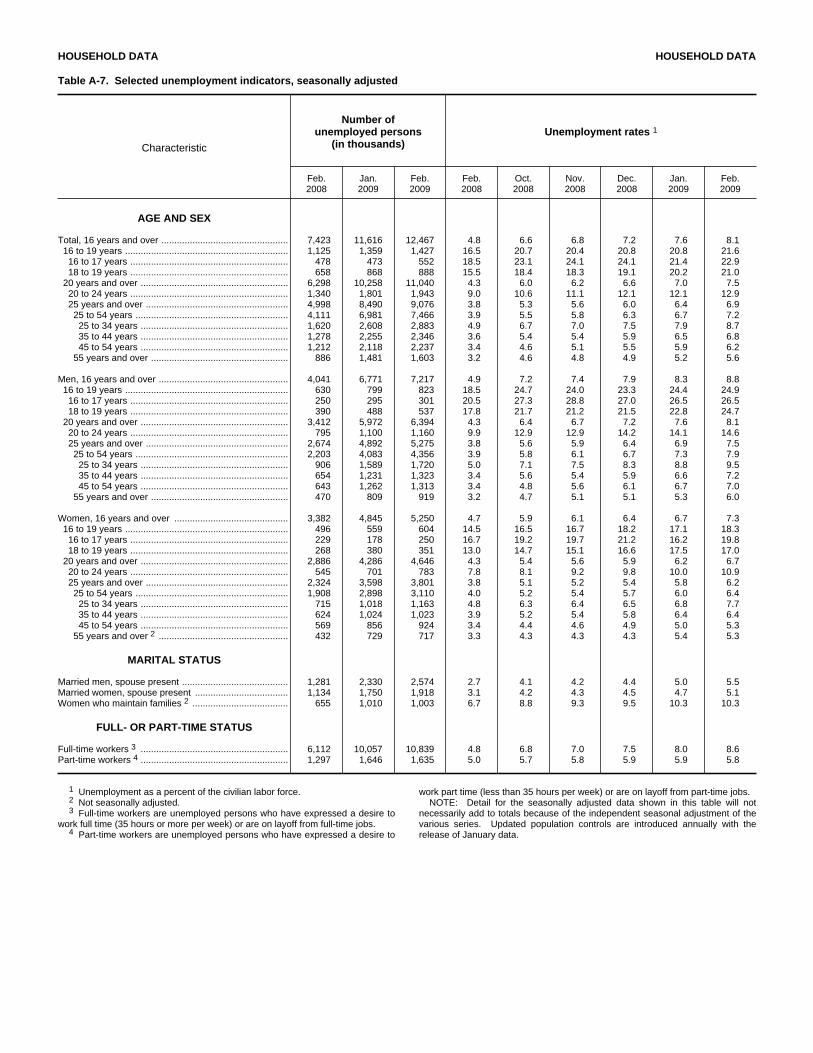
The number of unemployed persons increased by 851,000 to 12.5 million in February, and the un-employment rate rose to 8.1 percent. Over the past 12 months, the number of unemployed persons has increased by about 5.0 million, and the unemployment rate has risen by 3.3 percentage points. (See table A-1.)
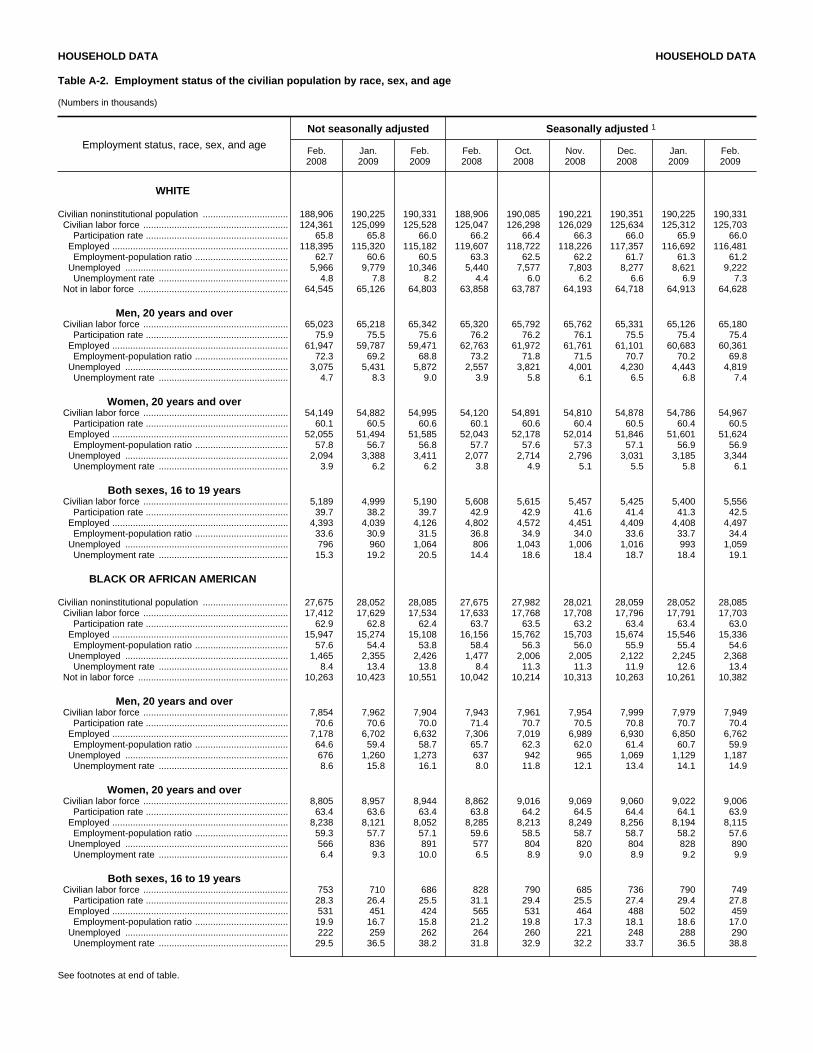
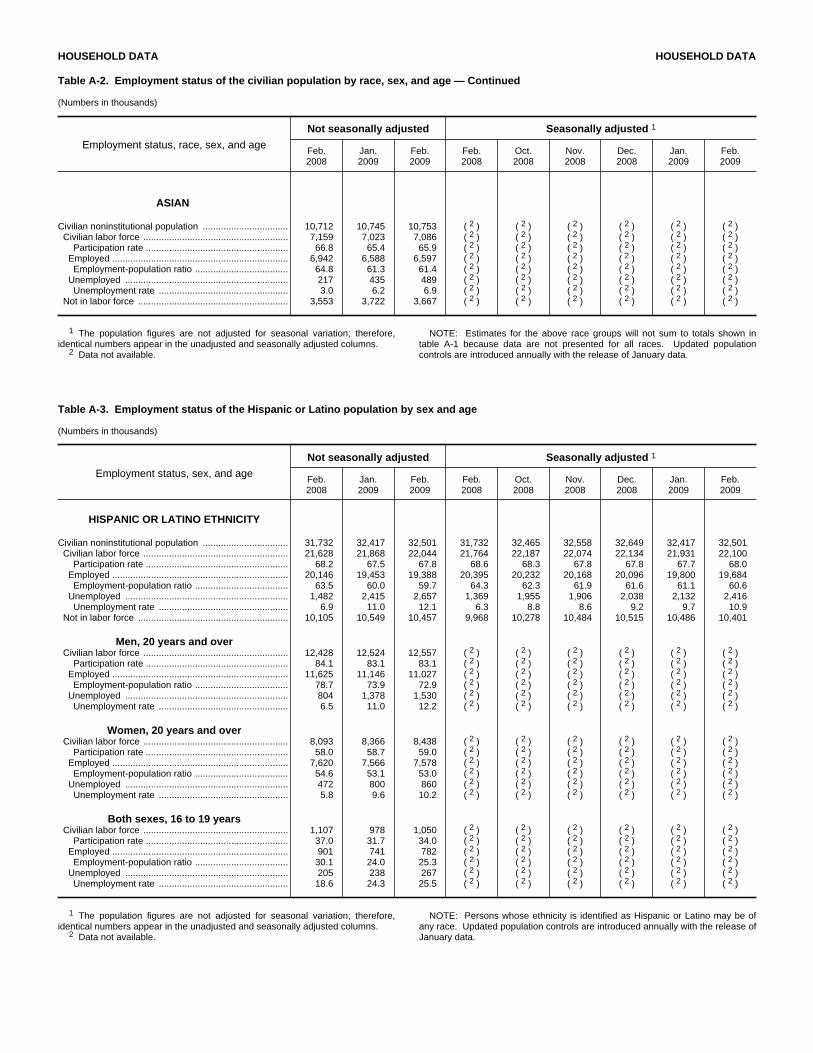
The unemployment rate continued to trend upward in February for adult men (8.1 percent), adult women (6.7 percent), whites (7.3 percent), blacks (13.4 percent), and Hispanics (10.9 percent). The jobless rate for teenagers was little changed at 21.6 percent. The unemployment rate for Asians was 6.9 percent in February, not seasonally adjusted. (See tables A-1, A-2, and A-3.)
News
United States Department of Labor
Chart 1. Unemployment rate, seasonally adjusted,March 2006 – February 2009
4.04.55.05.56.06.57.07.58.08.59.09.5
10.0
Percent Millions
Chart 2. Nonfarm payroll employment, seasonally adjusted, March 2006 – February 2009
2009200920072007 20082008122.0
124.0
126.0
128.0
130.0
132.0
134.0
136.0
138.0
140.0
142.0
20072007 20082008 20092009
2
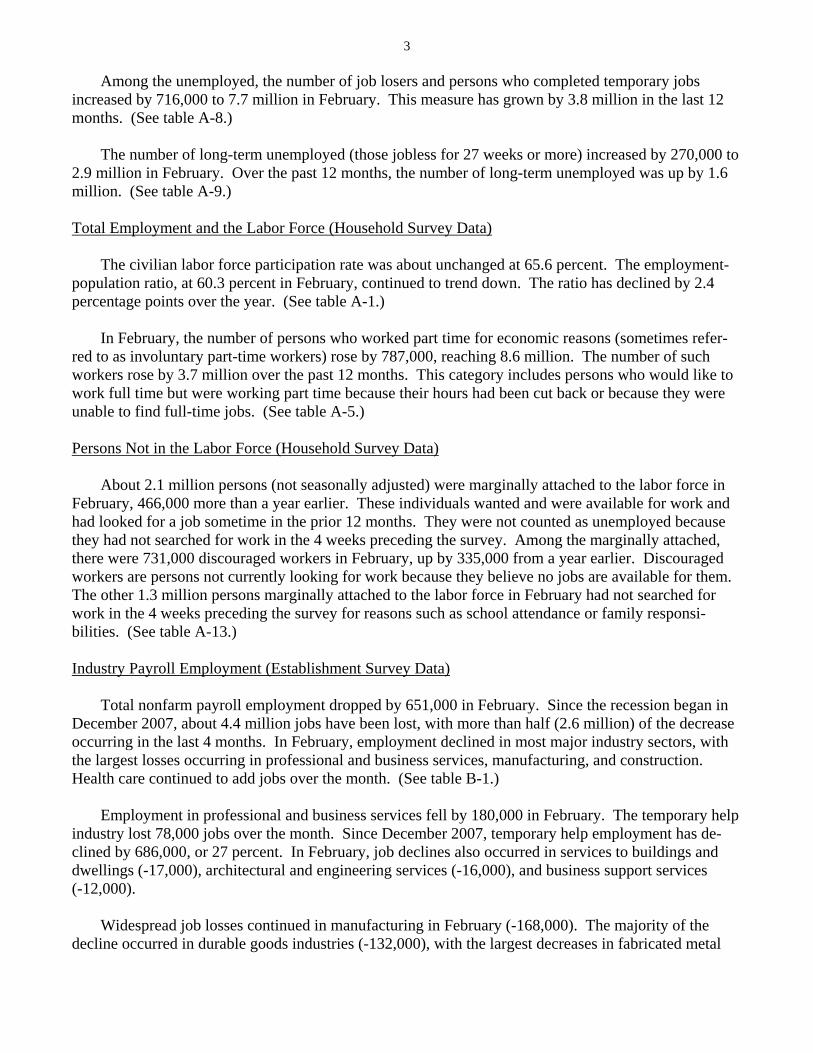
Table A. Major indicators of labor market activity, seasonally adjusted(Numbers in thousands)
HOUSEHOLD DATA
Civilian labor force …………….…………… 154,650 154,648 154,447 153,716 154,214 498Employment …………………….………… 145,299 144,046 143,338 142,099 141,748 -351Unemployment ……………….…………… 9,350 10,602 11,108 11,616 12,467 851
Not in labor force ………………….………… 79,460 80,177 80,588 81,023 80,699 -324
All workers ……………….……………....… 6.0 6.9 7.2 7.6 8.1 0.5Adult men …………………....……...…… 5.8 6.8 7.2 7.6 8.1 .5Adult women ………….…………………… 5.0 5.6 5.9 6.2 6.7 .5Teenagers ………….………………...…… 19.7 20.7 20.8 20.8 21.6 .8White ……….………….…...……………… 5.4 6.3 6.6 6.9 7.3 .4Black or African American ………….…… 10.7 11.5 11.9 12.6 13.4 .8Hispanic or Latino ethnicity ………..…… 7.8 8.9 9.2 9.7 10.9 1.2
ESTABLISHMENT DATA
Nonfarm employment ……….……...……… 137,004 135,727 135,074 p 134,419 p 133,768 p -651Goods-producing 1…...…...……………… 21,343 20,803 20,532 p 20,153 p 19,877 p -276
Construction ..…...…………….………… 7,170 6,949 6,841 p 6,723 p 6,619 p -104Manufacturing …………………....…… 13,388 13,062 12,902 p 12,645 p 12,477 p -168
Service-providing 1 ………...……..……… 115,661 114,924 114,542 p 114,266 p 113,891 p -375 Retail trade 2 …...…………….…..…… 15,331 15,127 15,038 p 14,999 p 14,960 p -40Professional and business service ….....… 17,730 17,485 17,356 p 17,222 p 17,042 p -180Education and health services …..…….… 18,932 19,035 19,080 p 19,123 p 19,149 p 26Leisure and hospitality …...……………. 13,452 13,348 13,304 p 13,275 p 13,242 p -33Government ………...…………………… 22,543 22,538 22,532 p 22,563 p 22,572 p 9
Total private ……...…………...…………… 33.6 33.4 33.3 p 33.3 p 33.3 p 0.0Manufacturing …………….……...……… 40.8 40.2 39.9 p 39.8 p 39.6 p -.2
Overtime ……...………………..…….… 3.6 3.2 2.9 p 2.8 p 2.6 p -.2
Total private ……...………………….……… 106.1 104.1 103.2 p 102.6 p 101.9 p -0.7
Average hourly earnings, total private …...… $18.16 $18.34 $18.40 p $18.44 p $18.47 p $0.03Average weekly earnings, total private ……. 610.90 612.55 612.72 p 614.05 p 615.05 p 1.00
Feb. 2009III 2008 IV 2008 Dec. 2008 Jan. 2009
p = preliminary.
Jan.-Feb. change
Hours of work 3
1 Includes other industries, not shown separately.2 Quarterly averages and the over-the-month change are calculated using unrounded data.3 Data relate to private production and nonsupervisory workers.
CategoryQuarterly averages Monthly data
Indexes of aggregate weekly hours (2002=100) 3
Earnings 3
Employment
Labor force status
Unemployment rates
3
Among the unemployed, the number of job losers and persons who completed temporary jobs increased by 716,000 to 7.7 million in February. This measure has grown by 3.8 million in the last 12 months. (See table A-8.)
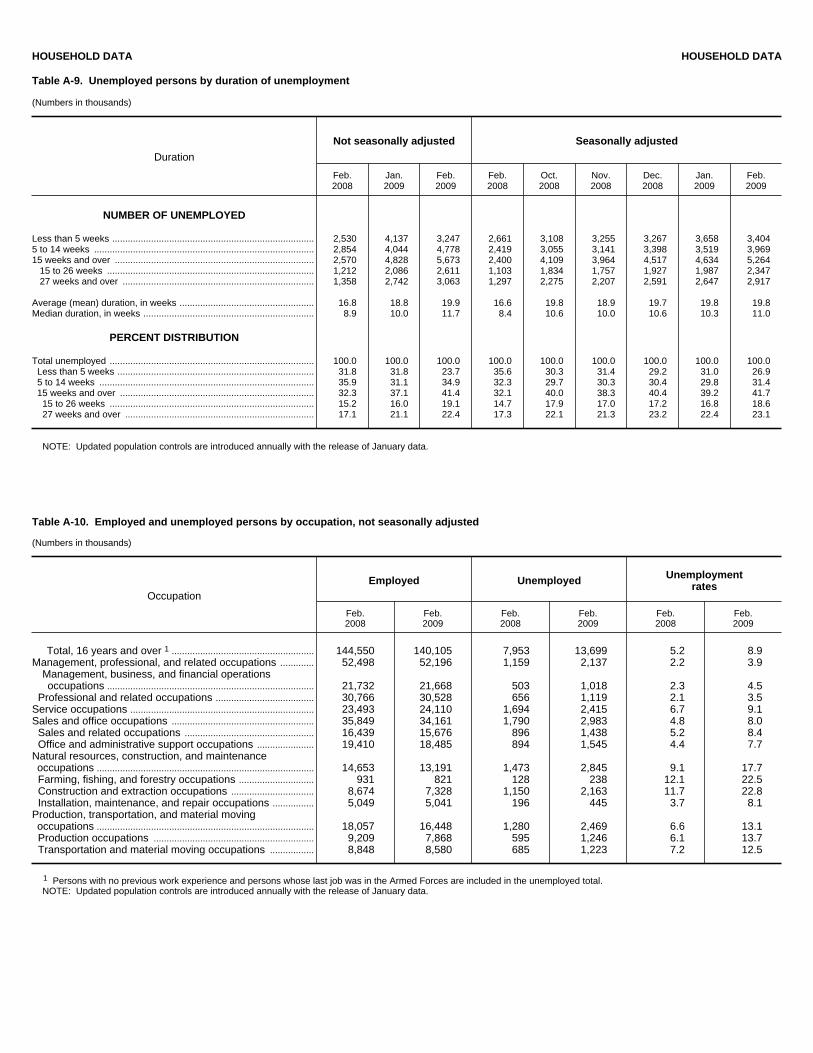
The number of long-term unemployed (those jobless for 27 weeks or more) increased by 270,000 to 2.9 million in February. Over the past 12 months, the number of long-term unemployed was up by 1.6 million. (See table A-9.) Total Employment and the Labor Force (Household Survey Data)
The civilian labor force participation rate was about unchanged at 65.6 percent. The employment-population ratio, at 60.3 percent in February, continued to trend down. The ratio has declined by 2.4 percentage points over the year. (See table A-1.)
In February, the number of persons who worked part time for economic reasons (sometimes refer-red to as involuntary part-time workers) rose by 787,000, reaching 8.6 million. The number of such workers rose by 3.7 million over the past 12 months. This category includes persons who would like to work full time but were working part time because their hours had been cut back or because they were unable to find full-time jobs. (See table A-5.) Persons Not in the Labor Force (Household Survey Data)
About 2.1 million persons (not seasonally adjusted) were marginally attached to the labor force in February, 466,000 more than a year earlier. These individuals wanted and were available for work and had looked for a job sometime in the prior 12 months. They were not counted as unemployed because they had not searched for work in the 4 weeks preceding the survey. Among the marginally attached, there were 731,000 discouraged workers in February, up by 335,000 from a year earlier. Discouraged workers are persons not currently looking for work because they believe no jobs are available for them. The other 1.3 million persons marginally attached to the labor force in February had not searched for work in the 4 weeks preceding the survey for reasons such as school attendance or family responsi-bilities. (See table A-13.) Industry Payroll Employment (Establishment Survey Data)
Total nonfarm payroll employment dropped by 651,000 in February. Since the recession began in December 2007, about 4.4 million jobs have been lost, with more than half (2.6 million) of the decrease occurring in the last 4 months. In February, employment declined in most major industry sectors, with the largest losses occurring in professional and business services, manufacturing, and construction. Health care continued to add jobs over the month. (See table B-1.)
Employment in professional and business services fell by 180,000 in February. The temporary help
industry lost 78,000 jobs over the month. Since December 2007, temporary help employment has de-clined by 686,000, or 27 percent. In February, job declines also occurred in services to buildings and dwellings (-17,000), architectural and engineering services (-16,000), and business support services (-12,000).
Widespread job losses continued in manufacturing in February (-168,000). The majority of the decline occurred in durable goods industries (-132,000), with the largest decreases in fabricated metal

4
products (-28,000) and machinery (-25,000). Employment in nondurable goods manufacturing declined by 36,000 over the month.
The construction industry lost 104,000 jobs in February. Employment in the industry has fallen by 1.1 million since peaking in January 2007. Two-fifths of that decline occurred over the last 4 months. Employment fell sharply in both the residential and nonresidential components of the industry in February.
Employment in truck transportation declined by 33,000 in February; the industry has lost 138,000
jobs since the start of the recession in December 2007. Nearly two-thirds of the decline (-88,000) occurred over the last 4 months. The information industry continued to lose jobs (-15,000). Over the last 4 months, employment in the industry has decreased by 76,000, with about two-fifths of the decline occurring in publishing.
Employment in financial activities continued to decline in February (-44,000). The number of jobs in this industry has dropped by 448,000 since an employment peak in December 2006, with half of this loss occurring in the past 6 months. In February, job losses occurred in real estate (-11,000); credit intermediation (-11,000); and securities, commodity contracts, and investments (-8,000).
Retail trade employment fell by 40,000 over the month and has declined by 608,000 since Decem-ber 2007. In February, employment decreased in automobile dealerships (-9,000), sporting goods (-9,000), furniture and home furnishing stores (-8,000), and building material and garden supply stores (-7,000). Employment in wholesale trade fell by 37,000 over the month, with nearly all of the decline occurring in durable goods.
Employment in leisure and hospitality continued to trend down over the month (-33,000), with about half of the decrease in the accommodation industry (-18,000).
Health care continued to add jobs in February, with a gain of 27,000. Job growth occurred in ambulatory health care (16,000) and in hospitals (7,000).
The change in total nonfarm employment for December was revised from -577,000 to -681,000 and the change for January was revised from -598,000 to -655,000. Monthly revisions result from additional sample reports and the monthly recalculation of seasonal factors. Weekly Hours (Establishment Survey Data)
In February, the average workweek for production and nonsupervisory workers on private nonfarm payrolls was 33.3 hours for the third month in a row. Both the manufacturing workweek and factory overtime decreased by 0.2 hour over the month to 39.6 and 2.6 hours, respectively. (See table B-2.)
The index of aggregate weekly hours of production and nonsupervisory workers on private nonfarm
payrolls fell by 0.7 percent in February. The manufacturing index declined by 2.0 percent over the month. (See table B-5.)
5
Hourly and Weekly Earnings (Establishment Survey Data)
In February, average hourly earnings of production and nonsupervisory workers on private nonfarm payrolls rose by 3 cents, or 0.2 percent, seasonally adjusted. Over the past 12 months, average hourly earnings increased by 3.6 percent, and average weekly earnings rose by 2.1 percent. (See table B-3.)
______________________________
The Employment Situation for March 2009 is scheduled to be released on Friday, April 3, at 8:30 A.M. (EDT).
6
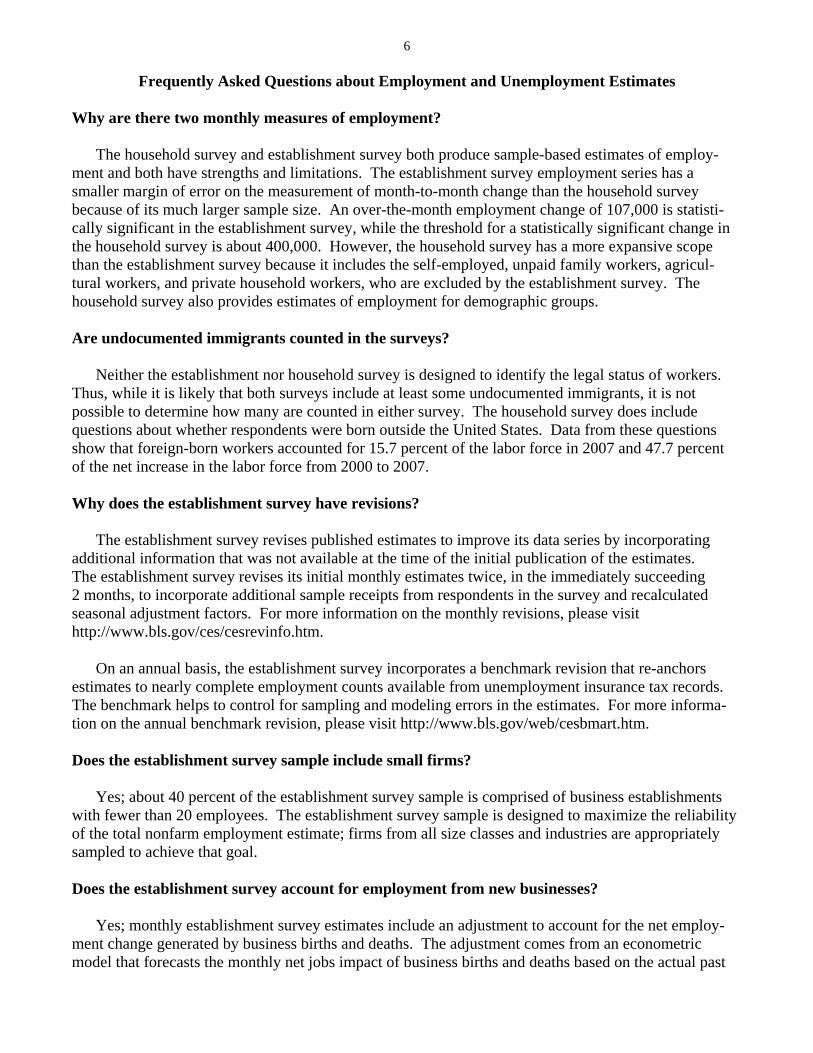
Frequently Asked Questions about Employment and Unemployment Estimates
Why are there two monthly measures of employment?
The household survey and establishment survey both produce sample-based estimates of employ-ment and both have strengths and limitations. The establishment survey employment series has a smaller margin of error on the measurement of month-to-month change than the household survey because of its much larger sample size. An over-the-month employment change of 107,000 is statisti-cally significant in the establishment survey, while the threshold for a statistically significant change in the household survey is about 400,000. However, the household survey has a more expansive scope than the establishment survey because it includes the self-employed, unpaid family workers, agricul-tural workers, and private household workers, who are excluded by the establishment survey. The household survey also provides estimates of employment for demographic groups. Are undocumented immigrants counted in the surveys?
Neither the establishment nor household survey is designed to identify the legal status of workers. Thus, while it is likely that both surveys include at least some undocumented immigrants, it is not possible to determine how many are counted in either survey. The household survey does include questions about whether respondents were born outside the United States. Data from these questions show that foreign-born workers accounted for 15.7 percent of the labor force in 2007 and 47.7 percent of the net increase in the labor force from 2000 to 2007. Why does the establishment survey have revisions?
The establishment survey revises published estimates to improve its data series by incorporating additional information that was not available at the time of the initial publication of the estimates. The establishment survey revises its initial monthly estimates twice, in the immediately succeeding 2 months, to incorporate additional sample receipts from respondents in the survey and recalculated seasonal adjustment factors. For more information on the monthly revisions, please visit http://www.bls.gov/ces/cesrevinfo.htm.
On an annual basis, the establishment survey incorporates a benchmark revision that re-anchors
estimates to nearly complete employment counts available from unemployment insurance tax records. The benchmark helps to control for sampling and modeling errors in the estimates. For more informa- tion on the annual benchmark revision, please visit http://www.bls.gov/web/cesbmart.htm. Does the establishment survey sample include small firms?
Yes; about 40 percent of the establishment survey sample is comprised of business establishments with fewer than 20 employees. The establishment survey sample is designed to maximize the reliability of the total nonfarm employment estimate; firms from all size classes and industries are appropriately sampled to achieve that goal.
Does the establishment survey account for employment from new businesses?
Yes; monthly establishment survey estimates include an adjustment to account for the net employ-ment change generated by business births and deaths. The adjustment comes from an econometric model that forecasts the monthly net jobs impact of business births and deaths based on the actual past
7
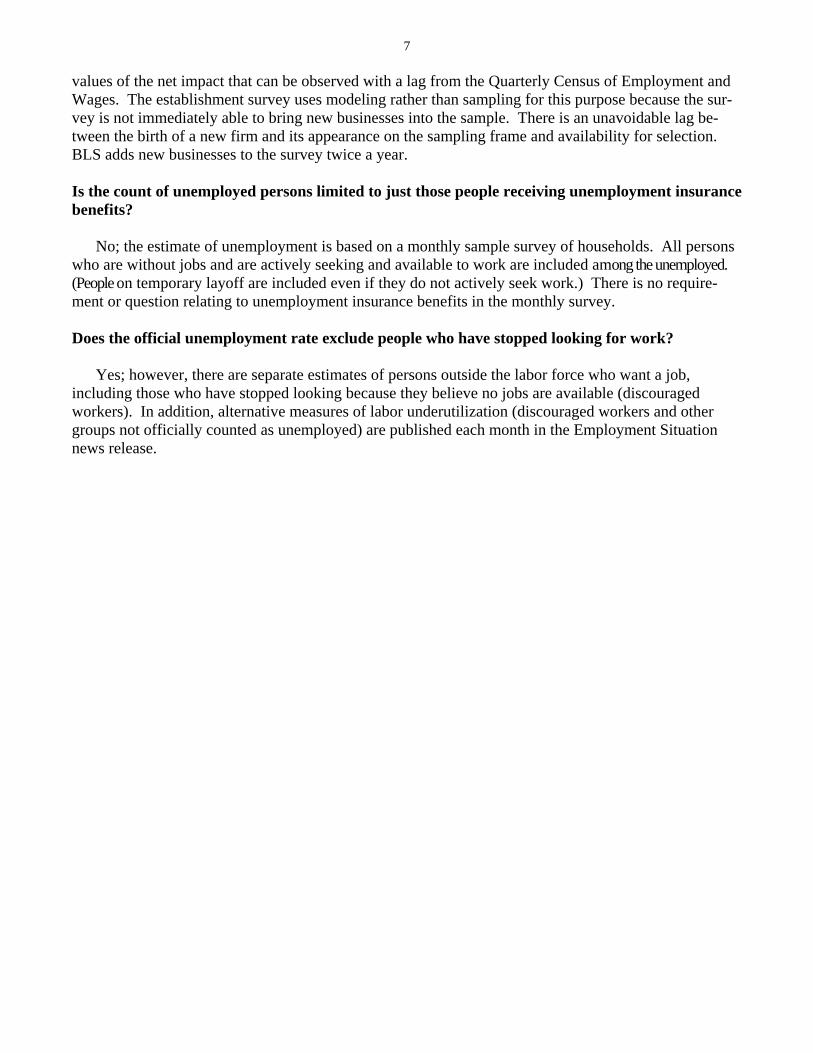
values of the net impact that can be observed with a lag from the Quarterly Census of Employment and Wages. The establishment survey uses modeling rather than sampling for this purpose because the sur-vey is not immediately able to bring new businesses into the sample. There is an unavoidable lag be-tween the birth of a new firm and its appearance on the sampling frame and availability for selection. BLS adds new businesses to the survey twice a year.
Is the count of unemployed persons limited to just those people receiving unemployment insurance benefits?
No; the estimate of unemployment is based on a monthly sample survey of households. All persons who are without jobs and are actively seeking and available to work are included among the unemployed. (People on temporary layoff are included even if they do not actively seek work.) There is no require-ment or question relating to unemployment insurance benefits in the monthly survey.
Does the official unemployment rate exclude people who have stopped looking for work?
Yes; however, there are separate estimates of persons outside the labor force who want a job, including those who have stopped looking because they believe no jobs are available (discouraged workers). In addition, alternative measures of labor underutilization (discouraged workers and other groups not officially counted as unemployed) are published each month in the Employment Situation news release.

Technical Note
This news release presents statistics from two major surveys, the Current Population Survey (household survey) and the Current Employment Statistics survey (establishment survey). The household survey provides the information on the labor force, employment, and unemployment that appears in the A tables, marked HOUSEHOLD DATA. It is a sample survey of about 60,000 households conducted by the U.S. Census Bureau for the Bureau of Labor Statistics (BLS).
The establishment survey provides the information on the employment, hours, and earnings of workers on nonfarm payrolls that appears in the B tables, marked ESTABLISH-MENT DATA. This information is collected from payroll records by BLS in cooperation with state agencies. The sample includes about 160,000 businesses and government agencies covering approximately 400,000 individual work-sites. The active sample includes about one-third of all non-farm payroll workers. The sample is drawn from a sampling frame of unemployment insurance tax accounts.
For both surveys, the data for a given month relate to a particular week or pay period. In the household survey, the reference week is generally the calendar week that contains the 12th day of the month. In the establishment survey, the reference period is the pay period including the 12th, which may or may not correspond directly to the calendar week.
Coverage, definitions, and differences between sur-veys
Household survey. The sample is selected to reflect
the entire civilian noninstitutional population. Based on responses to a series of questions on work and job search activities, each person 16 years and over in a sample household is classified as employed, unemployed, or not in the labor force.
People are classified as employed if they did any work at all as paid employees during the reference week; worked in their own business, profession, or on their own farm; or worked without pay at least 15 hours in a family business or farm. People are also counted as employed if they were temporarily absent from their jobs because of illness, bad weather, vacation, labor-management disputes, or personal reasons.
People are classified as unemployed if they meet all of the following criteria: They had no employment during the reference week; they were available for work at that time; and they made specific efforts to find employment sometime during the 4-week period ending with the reference week. Persons laid off from a job and expecting recall need not be looking for work to be counted as unemployed. The unemployment data derived from the household survey in no way depend upon the eligibility for or receipt of unemployment insurance benefits.
The civilian labor force is the sum of employed and unemployed persons. Those not classified as employed or unemployed are not in the labor force. The unemployment rate is the number unemployed as a percent of the labor
force. The labor force participation rate is the labor force as a percent of the population, and the employment-population ratio is the employed as a percent of the population.
Establishment survey. The sample establishments are
drawn from private nonfarm businesses such as factories, offices, and stores, as well as federal, state, and local government entities. Employees on nonfarm payrolls are those who received pay for any part of the reference pay period, including persons on paid leave. Persons are counted in each job they hold. Hours and earnings data are for private businesses and relate only to production workers in the goods-producing sector and nonsupervisory workers in the service-providing sector. Industries are classified on the basis of their principal activity in accordance with the 2007 version of the North American Industry Classification System.
Differences in employment estimates. The numerous
conceptual and methodological differences between the household and establishment surveys result in important distinctions in the employment estimates derived from the surveys. Among these are:
• The household survey includes agricultural workers,
the self-employed, unpaid family workers, and private household workers among the employed. These groups are excluded from the establishment survey.
• The household survey includes people on unpaid
leave among the employed. The establishment survey does not.
• The household survey is limited to workers 16 years
of age and older. The establishment survey is not limited by age.
• The household survey has no duplication of
individuals, because individuals are counted only once, even if they hold more than one job. In the establishment survey, employees working at more than one job and thus appearing on more than one payroll would be counted separately for each appearance.
Seasonal adjustment
Over the course of a year, the size of the nation's labor force and the levels of employment and unemployment undergo sharp fluctuations due to such seasonal events as changes in weather, reduced or expanded production, harvests, major holidays, and the opening and closing of schools. The effect of such seasonal variation can be very large; seasonal fluctuations may account for as much as 95 percent of the month-to-month changes in unemployment.
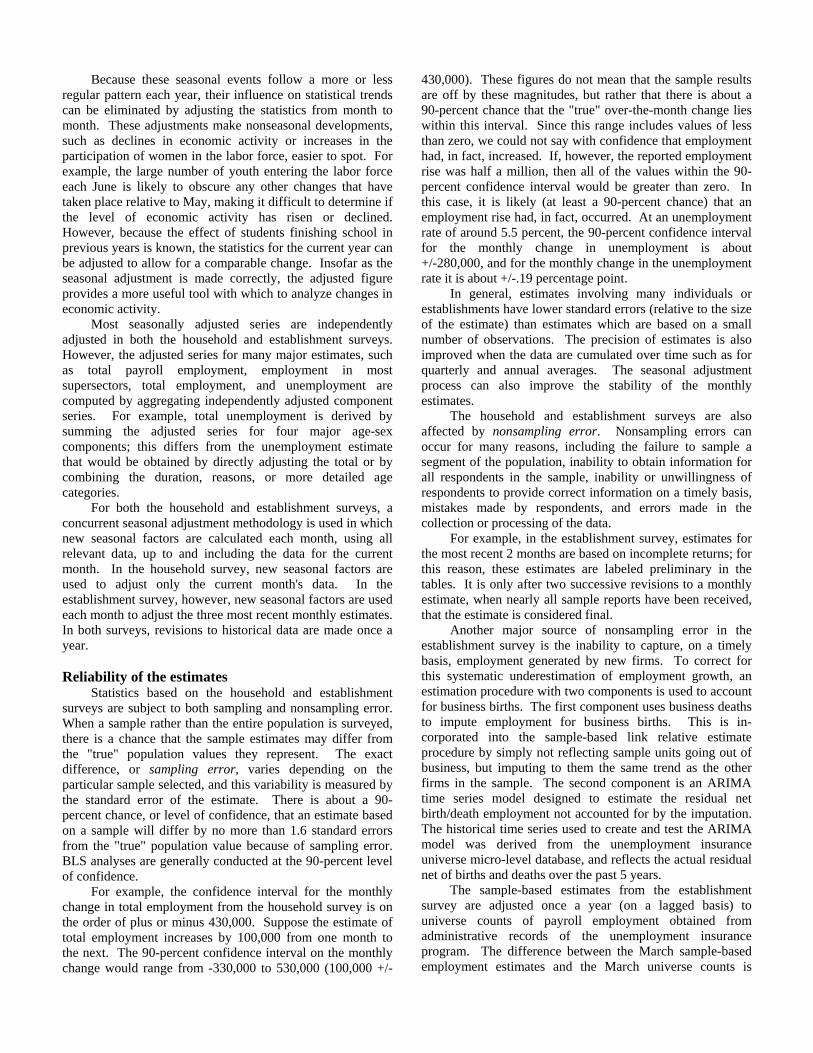
Because these seasonal events follow a more or less regular pattern each year, their influence on statistical trends can be eliminated by adjusting the statistics from month to month. These adjustments make nonseasonal developments, such as declines in economic activity or increases in the participation of women in the labor force, easier to spot. For example, the large number of youth entering the labor force each June is likely to obscure any other changes that have taken place relative to May, making it difficult to determine if the level of economic activity has risen or declined. However, because the effect of students finishing school in previous years is known, the statistics for the current year can be adjusted to allow for a comparable change. Insofar as the seasonal adjustment is made correctly, the adjusted figure provides a more useful tool with which to analyze changes in economic activity.
Most seasonally adjusted series are independently adjusted in both the household and establishment surveys. However, the adjusted series for many major estimates, such as total payroll employment, employment in most supersectors, total employment, and unemployment are computed by aggregating independently adjusted component series. For example, total unemployment is derived by summing the adjusted series for four major age-sex components; this differs from the unemployment estimate that would be obtained by directly adjusting the total or by combining the duration, reasons, or more detailed age categories.
For both the household and establishment surveys, a concurrent seasonal adjustment methodology is used in which new seasonal factors are calculated each month, using all relevant data, up to and including the data for the current month. In the household survey, new seasonal factors are used to adjust only the current month's data. In the establishment survey, however, new seasonal factors are used each month to adjust the three most recent monthly estimates. In both surveys, revisions to historical data are made once a year.
Reliability of the estimates
Statistics based on the household and establishment surveys are subject to both sampling and nonsampling error. When a sample rather than the entire population is surveyed, there is a chance that the sample estimates may differ from the "true" population values they represent. The exact difference, or sampling error, varies depending on the particular sample selected, and this variability is measured by the standard error of the estimate. There is about a 90-percent chance, or level of confidence, that an estimate based on a sample will differ by no more than 1.6 standard errors from the "true" population value because of sampling error. BLS analyses are generally conducted at the 90-percent level of confidence.
For example, the confidence interval for the monthly change in total employment from the household survey is on the order of plus or minus 430,000. Suppose the estimate of total employment increases by 100,000 from one month to the next. The 90-percent confidence interval on the monthly change would range from -330,000 to 530,000 (100,000 +/-
430,000). These figures do not mean that the sample results are off by these magnitudes, but rather that there is about a 90-percent chance that the "true" over-the-month change lies within this interval. Since this range includes values of less than zero, we could not say with confidence that employment had, in fact, increased. If, however, the reported employment rise was half a million, then all of the values within the 90-percent confidence interval would be greater than zero. In this case, it is likely (at least a 90-percent chance) that an employment rise had, in fact, occurred. At an unemployment rate of around 5.5 percent, the 90-percent confidence interval for the monthly change in unemployment is about +/-280,000, and for the monthly change in the unemployment rate it is about +/-.19 percentage point.
In general, estimates involving many individuals or establishments have lower standard errors (relative to the size of the estimate) than estimates which are based on a small number of observations. The precision of estimates is also improved when the data are cumulated over time such as for quarterly and annual averages. The seasonal adjustment process can also improve the stability of the monthly estimates.
The household and establishment surveys are also affected by nonsampling error. Nonsampling errors can occur for many reasons, including the failure to sample a segment of the population, inability to obtain information for all respondents in the sample, inability or unwillingness of respondents to provide correct information on a timely basis, mistakes made by respondents, and errors made in the collection or processing of the data.
For example, in the establishment survey, estimates for the most recent 2 months are based on incomplete returns; for this reason, these estimates are labeled preliminary in the tables. It is only after two successive revisions to a monthly estimate, when nearly all sample reports have been received, that the estimate is considered final.
Another major source of nonsampling error in the establishment survey is the inability to capture, on a timely basis, employment generated by new firms. To correct for this systematic underestimation of employment growth, an estimation procedure with two components is used to account for business births. The first component uses business deaths to impute employment for business births. This is in-corporated into the sample-based link relative estimate procedure by simply not reflecting sample units going out of business, but imputing to them the same trend as the other firms in the sample. The second component is an ARIMA time series model designed to estimate the residual net birth/death employment not accounted for by the imputation. The historical time series used to create and test the ARIMA model was derived from the unemployment insurance universe micro-level database, and reflects the actual residual net of births and deaths over the past 5 years.
The sample-based estimates from the establishment survey are adjusted once a year (on a lagged basis) to universe counts of payroll employment obtained from administrative records of the unemployment insurance program. The difference between the March sample-based employment estimates and the March universe counts is

known as a benchmark revision, and serves as a rough proxy for total survey error. The new benchmarks also incorporate changes in the classification of industries. Over the past decade, absolute benchmark revisions for total nonfarm employment have averaged 0.2 percent, with a range from 0.1 percent to 0.6 percent.
Other information Information in this release will be made available to
sensory impaired individuals upon request. Voice phone: (202) 691-5200; TDD message referral phone: 1-800-877-8339.
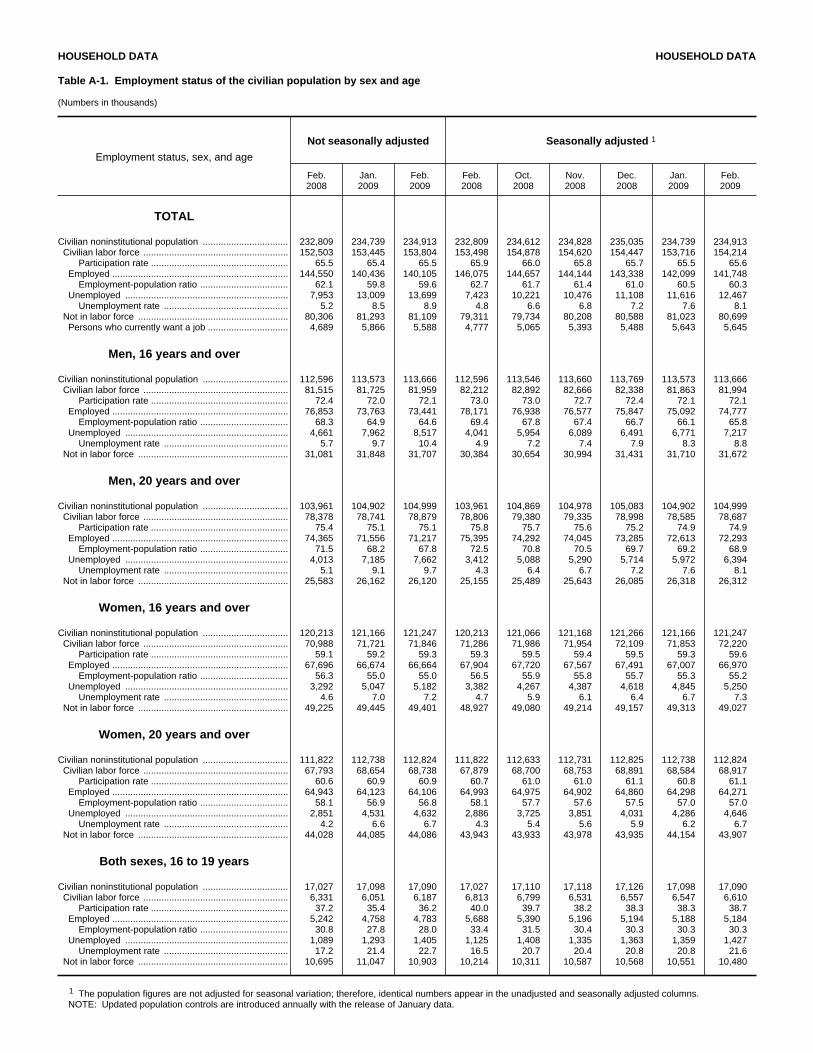
HOUSEHOLD DATA HOUSEHOLD DATA
Table A-1. Employment status of the civilian population by sex and age
(Numbers in thousands)
Employment status, sex, and age
Not seasonally adjusted Seasonally adjusted 1
Feb.2008
Jan.2009
Feb.2009
Feb.2008
Oct.2008
Nov.2008
Dec.2008
Jan.2009
Feb.2009
TOTAL
Civilian noninstitutional population ................................. 232,809 234,739 234,913 232,809 234,612 234,828 235,035 234,739 234,913 Civilian labor force ........................................................ 152,503 153,445 153,804 153,498 154,878 154,620 154,447 153,716 154,214 Participation rate ..................................................... 65.5 65.4 65.5 65.9 66.0 65.8 65.7 65.5 65.6 Employed .................................................................... 144,550 140,436 140,105 146,075 144,657 144,144 143,338 142,099 141,748 Employment-population ratio .................................. 62.1 59.8 59.6 62.7 61.7 61.4 61.0 60.5 60.3 Unemployed ............................................................... 7,953 13,009 13,699 7,423 10,221 10,476 11,108 11,616 12,467 Unemployment rate ................................................ 5.2 8.5 8.9 4.8 6.6 6.8 7.2 7.6 8.1 Not in labor force .......................................................... 80,306 81,293 81,109 79,311 79,734 80,208 80,588 81,023 80,699 Persons who currently want a job ............................... 4,689 5,866 5,588 4,777 5,065 5,393 5,488 5,643 5,645
Men, 16 years and over
Civilian noninstitutional population ................................. 112,596 113,573 113,666 112,596 113,546 113,660 113,769 113,573 113,666 Civilian labor force ........................................................ 81,515 81,725 81,959 82,212 82,892 82,666 82,338 81,863 81,994 Participation rate ..................................................... 72.4 72.0 72.1 73.0 73.0 72.7 72.4 72.1 72.1 Employed .................................................................... 76,853 73,763 73,441 78,171 76,938 76,577 75,847 75,092 74,777 Employment-population ratio .................................. 68.3 64.9 64.6 69.4 67.8 67.4 66.7 66.1 65.8 Unemployed ............................................................... 4,661 7,962 8,517 4,041 5,954 6,089 6,491 6,771 7,217 Unemployment rate ................................................ 5.7 9.7 10.4 4.9 7.2 7.4 7.9 8.3 8.8 Not in labor force .......................................................... 31,081 31,848 31,707 30,384 30,654 30,994 31,431 31,710 31,672
Men, 20 years and over
Civilian noninstitutional population ................................. 103,961 104,902 104,999 103,961 104,869 104,978 105,083 104,902 104,999 Civilian labor force ........................................................ 78,378 78,741 78,879 78,806 79,380 79,335 78,998 78,585 78,687 Participation rate ..................................................... 75.4 75.1 75.1 75.8 75.7 75.6 75.2 74.9 74.9 Employed .................................................................... 74,365 71,556 71,217 75,395 74,292 74,045 73,285 72,613 72,293 Employment-population ratio .................................. 71.5 68.2 67.8 72.5 70.8 70.5 69.7 69.2 68.9 Unemployed ............................................................... 4,013 7,185 7,662 3,412 5,088 5,290 5,714 5,972 6,394 Unemployment rate ................................................ 5.1 9.1 9.7 4.3 6.4 6.7 7.2 7.6 8.1 Not in labor force .......................................................... 25,583 26,162 26,120 25,155 25,489 25,643 26,085 26,318 26,312
Women, 16 years and over
Civilian noninstitutional population ................................. 120,213 121,166 121,247 120,213 121,066 121,168 121,266 121,166 121,247 Civilian labor force ........................................................ 70,988 71,721 71,846 71,286 71,986 71,954 72,109 71,853 72,220 Participation rate ..................................................... 59.1 59.2 59.3 59.3 59.5 59.4 59.5 59.3 59.6 Employed .................................................................... 67,696 66,674 66,664 67,904 67,720 67,567 67,491 67,007 66,970 Employment-population ratio .................................. 56.3 55.0 55.0 56.5 55.9 55.8 55.7 55.3 55.2 Unemployed ............................................................... 3,292 5,047 5,182 3,382 4,267 4,387 4,618 4,845 5,250 Unemployment rate ................................................ 4.6 7.0 7.2 4.7 5.9 6.1 6.4 6.7 7.3 Not in labor force .......................................................... 49,225 49,445 49,401 48,927 49,080 49,214 49,157 49,313 49,027
Women, 20 years and over
Civilian noninstitutional population ................................. 111,822 112,738 112,824 111,822 112,633 112,731 112,825 112,738 112,824 Civilian labor force ........................................................ 67,793 68,654 68,738 67,879 68,700 68,753 68,891 68,584 68,917 Participation rate ..................................................... 60.6 60.9 60.9 60.7 61.0 61.0 61.1 60.8 61.1 Employed .................................................................... 64,943 64,123 64,106 64,993 64,975 64,902 64,860 64,298 64,271 Employment-population ratio .................................. 58.1 56.9 56.8 58.1 57.7 57.6 57.5 57.0 57.0 Unemployed ............................................................... 2,851 4,531 4,632 2,886 3,725 3,851 4,031 4,286 4,646 Unemployment rate ................................................ 4.2 6.6 6.7 4.3 5.4 5.6 5.9 6.2 6.7 Not in labor force .......................................................... 44,028 44,085 44,086 43,943 43,933 43,978 43,935 44,154 43,907
Both sexes, 16 to 19 years
Civilian noninstitutional population ................................. 17,027 17,098 17,090 17,027 17,110 17,118 17,126 17,098 17,090 Civilian labor force ........................................................ 6,331 6,051 6,187 6,813 6,799 6,531 6,557 6,547 6,610 Participation rate ..................................................... 37.2 35.4 36.2 40.0 39.7 38.2 38.3 38.3 38.7 Employed .................................................................... 5,242 4,758 4,783 5,688 5,390 5,196 5,194 5,188 5,184 Employment-population ratio .................................. 30.8 27.8 28.0 33.4 31.5 30.4 30.3 30.3 30.3 Unemployed ............................................................... 1,089 1,293 1,405 1,125 1,408 1,335 1,363 1,359 1,427 Unemployment rate ................................................ 17.2 21.4 22.7 16.5 20.7 20.4 20.8 20.8 21.6 Not in labor force .......................................................... 10,695 11,047 10,903 10,214 10,311 10,587 10,568 10,551 10,480
1 The population figures are not adjusted for seasonal variation; therefore, identical numbers appear in the unadjusted and seasonally adjusted columns.NOTE: Updated population controls are introduced annually with the release of January data.
HOUSEHOLD DATA HOUSEHOLD DATA
Table A-2. Employment status of the civilian population by race, sex, and age
(Numbers in thousands)
Employment status, race, sex, and age
Not seasonally adjusted Seasonally adjusted 1
Feb.2008
Jan.2009
Feb.2009
Feb.2008
Oct.2008
Nov.2008
Dec.2008
Jan.2009
Feb.2009
WHITE
Civilian noninstitutional population ................................. 188,906 190,225 190,331 188,906 190,085 190,221 190,351 190,225 190,331 Civilian labor force ........................................................ 124,361 125,099 125,528 125,047 126,298 126,029 125,634 125,312 125,703 Participation rate ....................................................... 65.8 65.8 66.0 66.2 66.4 66.3 66.0 65.9 66.0 Employed .................................................................... 118,395 115,320 115,182 119,607 118,722 118,226 117,357 116,692 116,481 Employment-population ratio .................................... 62.7 60.6 60.5 63.3 62.5 62.2 61.7 61.3 61.2 Unemployed ............................................................... 5,966 9,779 10,346 5,440 7,577 7,803 8,277 8,621 9,222 Unemployment rate .................................................. 4.8 7.8 8.2 4.4 6.0 6.2 6.6 6.9 7.3 Not in labor force .......................................................... 64,545 65,126 64,803 63,858 63,787 64,193 64,718 64,913 64,628
Men, 20 years and over Civilian labor force ........................................................ 65,023 65,218 65,342 65,320 65,792 65,762 65,331 65,126 65,180 Participation rate ....................................................... 75.9 75.5 75.6 76.2 76.2 76.1 75.5 75.4 75.4 Employed .................................................................... 61,947 59,787 59,471 62,763 61,972 61,761 61,101 60,683 60,361 Employment-population ratio .................................... 72.3 69.2 68.8 73.2 71.8 71.5 70.7 70.2 69.8 Unemployed ............................................................... 3,075 5,431 5,872 2,557 3,821 4,001 4,230 4,443 4,819 Unemployment rate .................................................. 4.7 8.3 9.0 3.9 5.8 6.1 6.5 6.8 7.4
Women, 20 years and over Civilian labor force ........................................................ 54,149 54,882 54,995 54,120 54,891 54,810 54,878 54,786 54,967 Participation rate ....................................................... 60.1 60.5 60.6 60.1 60.6 60.4 60.5 60.4 60.5 Employed .................................................................... 52,055 51,494 51,585 52,043 52,178 52,014 51,846 51,601 51,624 Employment-population ratio .................................... 57.8 56.7 56.8 57.7 57.6 57.3 57.1 56.9 56.9 Unemployed ............................................................... 2,094 3,388 3,411 2,077 2,714 2,796 3,031 3,185 3,344 Unemployment rate .................................................. 3.9 6.2 6.2 3.8 4.9 5.1 5.5 5.8 6.1
Both sexes, 16 to 19 years Civilian labor force ........................................................ 5,189 4,999 5,190 5,608 5,615 5,457 5,425 5,400 5,556 Participation rate ....................................................... 39.7 38.2 39.7 42.9 42.9 41.6 41.4 41.3 42.5 Employed .................................................................... 4,393 4,039 4,126 4,802 4,572 4,451 4,409 4,408 4,497 Employment-population ratio .................................... 33.6 30.9 31.5 36.8 34.9 34.0 33.6 33.7 34.4 Unemployed ............................................................... 796 960 1,064 806 1,043 1,006 1,016 993 1,059 Unemployment rate .................................................. 15.3 19.2 20.5 14.4 18.6 18.4 18.7 18.4 19.1
BLACK OR AFRICAN AMERICAN
Civilian noninstitutional population ................................. 27,675 28,052 28,085 27,675 27,982 28,021 28,059 28,052 28,085 Civilian labor force ........................................................ 17,412 17,629 17,534 17,633 17,768 17,708 17,796 17,791 17,703 Participation rate ....................................................... 62.9 62.8 62.4 63.7 63.5 63.2 63.4 63.4 63.0 Employed .................................................................... 15,947 15,274 15,108 16,156 15,762 15,703 15,674 15,546 15,336 Employment-population ratio .................................... 57.6 54.4 53.8 58.4 56.3 56.0 55.9 55.4 54.6 Unemployed ............................................................... 1,465 2,355 2,426 1,477 2,006 2,005 2,122 2,245 2,368 Unemployment rate .................................................. 8.4 13.4 13.8 8.4 11.3 11.3 11.9 12.6 13.4 Not in labor force .......................................................... 10,263 10,423 10,551 10,042 10,214 10,313 10,263 10,261 10,382
Men, 20 years and over Civilian labor force ........................................................ 7,854 7,962 7,904 7,943 7,961 7,954 7,999 7,979 7,949 Participation rate ....................................................... 70.6 70.6 70.0 71.4 70.7 70.5 70.8 70.7 70.4 Employed .................................................................... 7,178 6,702 6,632 7,306 7,019 6,989 6,930 6,850 6,762 Employment-population ratio .................................... 64.6 59.4 58.7 65.7 62.3 62.0 61.4 60.7 59.9 Unemployed ............................................................... 676 1,260 1,273 637 942 965 1,069 1,129 1,187 Unemployment rate .................................................. 8.6 15.8 16.1 8.0 11.8 12.1 13.4 14.1 14.9
Women, 20 years and over Civilian labor force ........................................................ 8,805 8,957 8,944 8,862 9,016 9,069 9,060 9,022 9,006 Participation rate ....................................................... 63.4 63.6 63.4 63.8 64.2 64.5 64.4 64.1 63.9 Employed .................................................................... 8,238 8,121 8,052 8,285 8,213 8,249 8,256 8,194 8,115 Employment-population ratio .................................... 59.3 57.7 57.1 59.6 58.5 58.7 58.7 58.2 57.6 Unemployed ............................................................... 566 836 891 577 804 820 804 828 890 Unemployment rate .................................................. 6.4 9.3 10.0 6.5 8.9 9.0 8.9 9.2 9.9
Both sexes, 16 to 19 years Civilian labor force ........................................................ 753 710 686 828 790 685 736 790 749 Participation rate ....................................................... 28.3 26.4 25.5 31.1 29.4 25.5 27.4 29.4 27.8 Employed .................................................................... 531 451 424 565 531 464 488 502 459 Employment-population ratio .................................... 19.9 16.7 15.8 21.2 19.8 17.3 18.1 18.6 17.0 Unemployed ............................................................... 222 259 262 264 260 221 248 288 290 Unemployment rate .................................................. 29.5 36.5 38.2 31.8 32.9 32.2 33.7 36.5 38.8
See footnotes at end of table.
HOUSEHOLD DATA HOUSEHOLD DATA
Table A-2. Employment status of the civilian population by race, sex, and age — Continued
(Numbers in thousands)
Employment status, race, sex, and age
Not seasonally adjusted Seasonally adjusted 1
Feb.2008
Jan.2009
Feb.2009
Feb.2008
Oct.2008
Nov.2008
Dec.2008
Jan.2009
Feb.2009
ASIAN
Civilian noninstitutional population ................................. 10,712 10,745 10,753 2( ) 2( ) 2( ) 2( ) 2( ) 2( ) Civilian labor force ........................................................ 7,159 7,023 7,086 2( ) 2( ) 2( ) 2( ) 2( ) 2( ) Participation rate ....................................................... 66.8 65.4 65.9 2( ) 2( ) 2( ) 2( ) 2( ) 2( ) Employed .................................................................... 6,942 6,588 6,597 2( ) 2( ) 2( ) 2( ) 2( ) 2( ) Employment-population ratio .................................... 64.8 61.3 61.4 2( ) 2( ) 2( ) 2( ) 2( ) 2( ) Unemployed ............................................................... 217 435 489 2( ) 2( ) 2( ) 2( ) 2( ) 2( ) Unemployment rate .................................................. 3.0 6.2 6.9 2( ) 2( ) 2( ) 2( ) 2( ) 2( ) Not in labor force .......................................................... 3,553 3,722 3,667 2( ) 2( ) 2( ) 2( ) 2( ) 2( )
1 The population figures are not adjusted for seasonal variation; therefore,identical numbers appear in the unadjusted and seasonally adjusted columns.
2 Data not available.
NOTE: Estimates for the above race groups will not sum to totals shown intable A-1 because data are not presented for all races. Updated populationcontrols are introduced annually with the release of January data.
Table A-3. Employment status of the Hispanic or Latino population by sex and age
(Numbers in thousands)
Employment status, sex, and age
Not seasonally adjusted Seasonally adjusted 1
Feb.2008
Jan.2009
Feb.2009
Feb.2008
Oct.2008
Nov.2008
Dec.2008
Jan.2009
Feb.2009
HISPANIC OR LATINO ETHNICITY
Civilian noninstitutional population ................................. 31,732 32,417 32,501 31,732 32,465 32,558 32,649 32,417 32,501 Civilian labor force ........................................................ 21,628 21,868 22,044 21,764 22,187 22,074 22,134 21,931 22,100 Participation rate ....................................................... 68.2 67.5 67.8 68.6 68.3 67.8 67.8 67.7 68.0 Employed .................................................................... 20,146 19,453 19,388 20,395 20,232 20,168 20,096 19,800 19,684 Employment-population ratio .................................... 63.5 60.0 59.7 64.3 62.3 61.9 61.6 61.1 60.6 Unemployed ............................................................... 1,482 2,415 2,657 1,369 1,955 1,906 2,038 2,132 2,416 Unemployment rate .................................................. 6.9 11.0 12.1 6.3 8.8 8.6 9.2 9.7 10.9 Not in labor force .......................................................... 10,105 10,549 10,457 9,968 10,278 10,484 10,515 10,486 10,401
Men, 20 years and over Civilian labor force ........................................................ 12,428 12,524 12,557 2( ) 2( ) 2( ) 2( ) 2( ) 2( ) Participation rate ....................................................... 84.1 83.1 83.1 2( ) 2( ) 2( ) 2( ) 2( ) 2( ) Employed .................................................................... 11,625 11,146 11,027 2( ) 2( ) 2( ) 2( ) 2( ) 2( ) Employment-population ratio .................................... 78.7 73.9 72.9 2( ) 2( ) 2( ) 2( ) 2( ) 2( ) Unemployed ............................................................... 804 1,378 1,530 2( ) 2( ) 2( ) 2( ) 2( ) 2( ) Unemployment rate .................................................. 6.5 11.0 12.2 2( ) 2( ) 2( ) 2( ) 2( ) 2( )
Women, 20 years and over Civilian labor force ........................................................ 8,093 8,366 8,438 2( ) 2( ) 2( ) 2( ) 2( ) 2( ) Participation rate ....................................................... 58.0 58.7 59.0 2( ) 2( ) 2( ) 2( ) 2( ) 2( ) Employed .................................................................... 7,620 7,566 7,578 2( ) 2( ) 2( ) 2( ) 2( ) 2( ) Employment-population ratio .................................... 54.6 53.1 53.0 2( ) 2( ) 2( ) 2( ) 2( ) 2( ) Unemployed ............................................................... 472 800 860 2( ) 2( ) 2( ) 2( ) 2( ) 2( ) Unemployment rate .................................................. 5.8 9.6 10.2 2( ) 2( ) 2( ) 2( ) 2( ) 2( )
Both sexes, 16 to 19 years Civilian labor force ........................................................ 1,107 978 1,050 2( ) 2( ) 2( ) 2( ) 2( ) 2( ) Participation rate ....................................................... 37.0 31.7 34.0 2( ) 2( ) 2( ) 2( ) 2( ) 2( ) Employed .................................................................... 901 741 782 2( ) 2( ) 2( ) 2( ) 2( ) 2( ) Employment-population ratio .................................... 30.1 24.0 25.3 2( ) 2( ) 2( ) 2( ) 2( ) 2( ) Unemployed ............................................................... 205 238 267 2( ) 2( ) 2( ) 2( ) 2( ) 2( ) Unemployment rate .................................................. 18.6 24.3 25.5 2( ) 2( ) 2( ) 2( ) 2( ) 2( )
1 The population figures are not adjusted for seasonal variation; therefore,identical numbers appear in the unadjusted and seasonally adjusted columns.
2 Data not available.
NOTE: Persons whose ethnicity is identified as Hispanic or Latino may be ofany race. Updated population controls are introduced annually with the release ofJanuary data.

HOUSEHOLD DATA HOUSEHOLD DATA
Table A-4. Employment status of the civilian population 25 years and over by educational attainment
(Numbers in thousands)
Educational attainment
Not seasonally adjusted Seasonally adjusted
Feb.2008
Jan.2009
Feb.2009
Feb.2008
Oct.2008
Nov.2008
Dec.2008
Jan.2009
Feb.2009
Less than a high school diplomaCivilian labor force .......................................................... 11,898 12,192 11,898 12,112 12,390 12,185 12,108 12,024 11,955 Participation rate ......................................................... 45.5 46.6 46.1 46.3 48.3 47.2 46.4 45.9 46.4 Employed ...................................................................... 10,878 10,437 10,097 11,221 11,106 10,899 10,793 10,577 10,445 Employment-population ratio ...................................... 41.6 39.9 39.2 42.9 43.3 42.2 41.4 40.4 40.5 Unemployed ................................................................. 1,020 1,755 1,801 891 1,284 1,286 1,315 1,446 1,510 Unemployment rate .................................................... 8.6 14.4 15.1 7.4 10.4 10.6 10.9 12.0 12.6
High school graduates, no college 1Civilian labor force .......................................................... 38,002 39,009 38,497 38,064 38,428 38,271 38,656 38,675 38,463 Participation rate ......................................................... 62.5 62.9 62.3 62.6 62.6 62.3 62.5 62.4 62.2 Employed ...................................................................... 35,954 35,394 34,791 36,287 35,939 35,643 35,683 35,599 35,270 Employment-population ratio ...................................... 59.1 57.1 56.3 59.7 58.5 58.1 57.6 57.4 57.1 Unemployed ................................................................. 2,048 3,616 3,706 1,777 2,489 2,628 2,972 3,075 3,193 Unemployment rate .................................................... 5.4 9.3 9.6 4.7 6.5 6.9 7.7 8.0 8.3
Some college or associate degreeCivilian labor force .......................................................... 36,237 36,366 37,267 36,379 36,820 37,120 37,049 36,693 37,362 Participation rate ......................................................... 71.6 71.4 71.9 71.9 71.5 71.6 72.0 72.0 72.1 Employed ...................................................................... 34,766 33,870 34,421 35,007 34,867 35,077 34,969 34,433 34,738 Employment-population ratio ...................................... 68.7 66.5 66.4 69.2 67.7 67.7 68.0 67.6 67.1 Unemployed ................................................................. 1,471 2,496 2,846 1,372 1,954 2,043 2,080 2,260 2,624 Unemployment rate .................................................... 4.1 6.9 7.6 3.8 5.3 5.5 5.6 6.2 7.0
Bachelor’s degree and higher 2Civilian labor force .......................................................... 45,339 45,132 45,078 45,244 45,454 45,232 45,182 45,208 45,027 Participation rate ......................................................... 78.3 77.6 77.7 78.1 77.7 77.7 77.9 77.8 77.6 Employed ...................................................................... 44,405 43,269 43,190 44,311 44,044 43,794 43,517 43,474 43,177 Employment-population ratio ...................................... 76.7 74.4 74.5 76.5 75.3 75.3 75.0 74.8 74.4 Unemployed ................................................................. 934 1,863 1,888 933 1,410 1,438 1,665 1,735 1,850 Unemployment rate .................................................... 2.1 4.1 4.2 2.1 3.1 3.2 3.7 3.8 4.1
1 Includes persons with a high school diploma or equivalent.2 Includes persons with bachelor’s, master’s, professional, and doctoral degrees. NOTE: Updated population controls are introduced annually with the release of January data.

HOUSEHOLD DATA HOUSEHOLD DATA
Table A-5. Employed persons by class of worker and part-time status
(In thousands)
Category
Not seasonally adjusted Seasonally adjusted
Feb.2008
Jan.2009
Feb.2009
Feb.2008
Oct.2008
Nov.2008
Dec.2008
Jan.2009
Feb.2009
CLASS OF WORKER
Agriculture and related industries ................................... 1,999 1,988 1,961 2,208 2,177 2,206 2,191 2,149 2,148 Wage and salary workers ............................................. 1,173 1,106 1,126 1,311 1,313 1,267 1,264 1,233 1,244 Self-employed workers ................................................. 808 860 817 865 827 915 925 903 875 Unpaid family workers .................................................. 18 22 18 1( ) 1( ) 1( ) 1( ) 1( ) 1( )
Nonagricultural industries ............................................... 142,551 138,449 138,144 143,878 142,566 141,901 141,047 139,952 139,579 Wage and salary workers ............................................. 133,159 129,888 129,232 134,277 133,694 132,983 132,082 131,110 130,465 Government ................................................................ 21,209 21,142 21,158 21,219 21,539 21,431 21,395 21,237 21,192 Private industries ........................................................ 111,950 108,746 108,075 113,052 112,170 111,542 110,684 109,997 109,311 Private households ................................................... 763 749 719 1( ) 1( ) 1( ) 1( ) 1( ) 1( ) Other industries ........................................................ 111,187 107,997 107,356 112,283 111,279 110,677 109,863 109,217 108,574 Self-employed workers ................................................. 9,292 8,520 8,859 9,418 8,852 8,816 8,940 8,816 8,962 Unpaid family workers .................................................. 100 41 53 1( ) 1( ) 1( ) 1( ) 1( ) 1( )
PERSONS AT WORK PART TIME 2
All industries:Part time for economic reasons .................................. 5,114 8,829 9,170 4,890 6,848 7,323 8,038 7,839 8,626 Slack work or business conditions ........................... 3,534 6,909 7,067 3,294 4,953 5,399 6,020 5,766 6,443 Could only find part-time work ................................. 1,260 1,593 1,827 1,241 1,514 1,585 1,617 1,667 1,764
Part time for noneconomic reasons ............................ 19,847 19,051 19,296 19,317 19,083 18,886 18,922 18,864 18,855
Nonagricultural industries:Part time for economic reasons .................................. 5,007 8,675 9,053 4,790 6,742 7,209 7,932 7,705 8,543 Slack work or business conditions ........................... 3,459 6,797 6,989 3,234 4,889 5,304 5,938 5,660 6,390 Could only find part-time work ................................. 1,255 1,583 1,822 1,230 1,499 1,579 1,619 1,658 1,760
Part time for noneconomic reasons ............................ 19,524 18,734 18,977 18,980 18,808 18,635 18,642 18,567 18,562
1 Data not available.2 Persons at work excludes employed persons who were absent from their
jobs during the entire reference week for reasons such as vacation, illness, orindustrial dispute. Part time for noneconomic reasons excludes persons whousually work full time but worked only 1 to 34 hours during the reference week for
reasons such as holidays, illness, and bad weather.NOTE: Detail for the seasonally adjusted data shown in this table will not
necessarily add to totals because of the independent seasonal adjustment of thevarious series. Updated population controls are introduced annually with therelease of January data.

HOUSEHOLD DATA HOUSEHOLD DATA
Table A-6. Selected employment indicators
(In thousands)
Characteristic
Not seasonally adjusted Seasonally adjusted
Feb.2008
Jan.2009
Feb.2009
Feb.2008
Oct.2008
Nov.2008
Dec.2008
Jan.2009
Feb.2009
AGE AND SEX
Total, 16 years and over ................................................. 144,550 140,436 140,105 146,075 144,657 144,144 143,338 142,099 141,748 16 to 19 years ............................................................... 5,242 4,758 4,783 5,688 5,390 5,196 5,194 5,188 5,184 16 to 17 years ............................................................. 1,884 1,547 1,667 2,105 1,933 1,791 1,779 1,741 1,854 18 to 19 years ............................................................. 3,358 3,210 3,116 3,597 3,469 3,408 3,413 3,441 3,348 20 years and over ......................................................... 139,308 135,679 135,323 140,388 139,267 138,948 138,144 136,911 136,564 20 to 24 years ............................................................. 13,304 12,709 12,823 13,627 13,528 13,443 13,374 13,050 13,157 25 years and over ....................................................... 126,003 122,970 122,500 126,687 125,833 125,422 124,748 123,911 123,302 25 to 54 years ........................................................... 99,503 95,921 95,530 100,105 98,803 98,373 97,651 96,693 96,255 25 to 34 years ......................................................... 31,307 30,060 30,003 31,617 31,122 31,070 30,864 30,449 30,369 35 to 44 years ......................................................... 33,741 32,034 31,844 33,871 33,176 32,883 32,691 32,308 31,999 45 to 54 years ......................................................... 34,456 33,827 33,683 34,618 34,505 34,420 34,097 33,936 33,888 55 years and over ..................................................... 26,500 27,049 26,970 26,581 27,029 27,049 27,096 27,218 27,047
Men, 16 years and over .................................................. 76,853 73,763 73,441 78,171 76,938 76,577 75,847 75,092 74,777 16 to 19 years ............................................................... 2,488 2,207 2,224 2,777 2,646 2,531 2,562 2,479 2,484 16 to 17 years ............................................................. 827 695 716 968 895 800 847 818 837 18 to 19 years ............................................................. 1,662 1,512 1,508 1,798 1,751 1,728 1,712 1,654 1,640 20 years and over ......................................................... 74,365 71,556 71,217 75,395 74,292 74,045 73,285 72,613 72,293 20 to 24 years ............................................................. 6,996 6,458 6,565 7,215 6,974 6,965 6,863 6,723 6,784 25 years and over ....................................................... 67,369 65,098 64,652 68,149 67,372 67,039 66,456 65,879 65,479 25 to 54 years ........................................................... 53,417 50,844 50,461 54,036 53,090 52,740 52,128 51,480 51,125 25 to 34 years ......................................................... 17,042 16,189 16,111 17,356 17,064 16,979 16,789 16,461 16,449 35 to 44 years ......................................................... 18,255 17,226 16,989 18,399 17,962 17,816 17,663 17,452 17,144 45 to 54 years ......................................................... 18,120 17,429 17,360 18,281 18,065 17,944 17,676 17,567 17,532 55 years and over ..................................................... 13,952 14,253 14,191 14,113 14,282 14,299 14,328 14,399 14,354
Women, 16 years and over ............................................ 67,696 66,674 66,664 67,904 67,720 67,567 67,491 67,007 66,970 16 to 19 years ............................................................... 2,754 2,551 2,559 2,911 2,744 2,665 2,632 2,709 2,699 16 to 17 years ............................................................. 1,058 853 951 1,137 1,038 990 932 923 1,017 18 to 19 years ............................................................. 1,696 1,699 1,607 1,799 1,718 1,680 1,701 1,787 1,708 20 years and over ......................................................... 64,943 64,123 64,106 64,993 64,975 64,902 64,860 64,298 64,271 20 to 24 years ............................................................. 6,308 6,250 6,258 6,412 6,553 6,478 6,510 6,327 6,372 25 years and over ....................................................... 58,634 57,872 57,848 58,538 58,460 58,383 58,292 58,032 57,823 25 to 54 years ........................................................... 46,086 45,077 45,069 46,070 45,713 45,634 45,523 45,213 45,131 25 to 34 years ......................................................... 14,265 13,871 13,892 14,261 14,058 14,091 14,075 13,988 13,920 35 to 44 years ......................................................... 15,486 14,808 14,854 15,472 15,215 15,067 15,027 14,856 14,855 45 to 54 years ......................................................... 16,336 16,398 16,322 16,337 16,440 16,476 16,421 16,369 16,356 55 years and over ..................................................... 12,548 12,795 12,778 12,468 12,747 12,750 12,769 12,819 12,693
MARITAL STATUS
Married men, spouse present ......................................... 45,949 44,425 44,248 46,146 45,787 45,610 45,182 44,712 44,502Married women, spouse present .................................... 35,727 35,325 35,550 35,720 35,590 35,649 35,632 35,375 35,563Women who maintain families ........................................ 9,051 8,751 8,705 1( ) 1( ) 1( ) 1( ) 1( ) 1( )
FULL- OR PART-TIME STATUS
Full-time workers 2 ......................................................... 119,452 113,815 112,947 121,374 119,304 118,413 116,865 115,794 114,853Part-time workers 3 ......................................................... 25,098 26,621 27,158 24,688 25,452 25,577 26,250 26,200 26,590
MULTIPLE JOBHOLDERS
Total multiple jobholders ................................................. 7,610 7,258 7,676 7,607 7,551 7,410 7,352 7,441 7,626 Percent of total employed ........................................... 5.3 5.2 5.5 5.2 5.2 5.1 5.1 5.2 5.4
1 Data not available.2 Employed full-time workers are persons who usually work 35 hours or more
per week.3 Employed part-time workers are persons who usually work less than 35
hours per week.
NOTE: Detail for the seasonally adjusted data shown in this table will notnecessarily add to totals because of the independent seasonal adjustment of thevarious series. Updated population controls are introduced annually with therelease of January data.
HOUSEHOLD DATA HOUSEHOLD DATA
Table A-7. Selected unemployment indicators, seasonally adjusted
Characteristic
Number ofunemployed persons
(in thousands)Unemployment rates 1
Feb.2008
Jan.2009
Feb.2009
Feb.2008
Oct.2008
Nov.2008
Dec.2008
Jan.2009
Feb.2009
AGE AND SEX
Total, 16 years and over ................................................. 7,423 11,616 12,467 4.8 6.6 6.8 7.2 7.6 8.1 16 to 19 years ............................................................... 1,125 1,359 1,427 16.5 20.7 20.4 20.8 20.8 21.6 16 to 17 years ............................................................. 478 473 552 18.5 23.1 24.1 24.1 21.4 22.9 18 to 19 years ............................................................. 658 868 888 15.5 18.4 18.3 19.1 20.2 21.0 20 years and over ......................................................... 6,298 10,258 11,040 4.3 6.0 6.2 6.6 7.0 7.5 20 to 24 years ............................................................. 1,340 1,801 1,943 9.0 10.6 11.1 12.1 12.1 12.9 25 years and over ....................................................... 4,998 8,490 9,076 3.8 5.3 5.6 6.0 6.4 6.9 25 to 54 years ........................................................... 4,111 6,981 7,466 3.9 5.5 5.8 6.3 6.7 7.2 25 to 34 years ......................................................... 1,620 2,608 2,883 4.9 6.7 7.0 7.5 7.9 8.7 35 to 44 years ......................................................... 1,278 2,255 2,346 3.6 5.4 5.4 5.9 6.5 6.8 45 to 54 years ......................................................... 1,212 2,118 2,237 3.4 4.6 5.1 5.5 5.9 6.2 55 years and over ..................................................... 886 1,481 1,603 3.2 4.6 4.8 4.9 5.2 5.6
Men, 16 years and over .................................................. 4,041 6,771 7,217 4.9 7.2 7.4 7.9 8.3 8.8 16 to 19 years ............................................................... 630 799 823 18.5 24.7 24.0 23.3 24.4 24.9 16 to 17 years ............................................................. 250 295 301 20.5 27.3 28.8 27.0 26.5 26.5 18 to 19 years ............................................................. 390 488 537 17.8 21.7 21.2 21.5 22.8 24.7 20 years and over ......................................................... 3,412 5,972 6,394 4.3 6.4 6.7 7.2 7.6 8.1 20 to 24 years ............................................................. 795 1,100 1,160 9.9 12.9 12.9 14.2 14.1 14.6 25 years and over ....................................................... 2,674 4,892 5,275 3.8 5.6 5.9 6.4 6.9 7.5 25 to 54 years ........................................................... 2,203 4,083 4,356 3.9 5.8 6.1 6.7 7.3 7.9 25 to 34 years ......................................................... 906 1,589 1,720 5.0 7.1 7.5 8.3 8.8 9.5 35 to 44 years ......................................................... 654 1,231 1,323 3.4 5.6 5.4 5.9 6.6 7.2 45 to 54 years ......................................................... 643 1,262 1,313 3.4 4.8 5.6 6.1 6.7 7.0 55 years and over ..................................................... 470 809 919 3.2 4.7 5.1 5.1 5.3 6.0
Women, 16 years and over ............................................ 3,382 4,845 5,250 4.7 5.9 6.1 6.4 6.7 7.3 16 to 19 years ............................................................... 496 559 604 14.5 16.5 16.7 18.2 17.1 18.3 16 to 17 years ............................................................. 229 178 250 16.7 19.2 19.7 21.2 16.2 19.8 18 to 19 years ............................................................. 268 380 351 13.0 14.7 15.1 16.6 17.5 17.0 20 years and over ......................................................... 2,886 4,286 4,646 4.3 5.4 5.6 5.9 6.2 6.7 20 to 24 years ............................................................. 545 701 783 7.8 8.1 9.2 9.8 10.0 10.9 25 years and over ....................................................... 2,324 3,598 3,801 3.8 5.1 5.2 5.4 5.8 6.2 25 to 54 years ........................................................... 1,908 2,898 3,110 4.0 5.2 5.4 5.7 6.0 6.4 25 to 34 years ......................................................... 715 1,018 1,163 4.8 6.3 6.4 6.5 6.8 7.7 35 to 44 years ......................................................... 624 1,024 1,023 3.9 5.2 5.4 5.8 6.4 6.4 45 to 54 years ......................................................... 569 856 924 3.4 4.4 4.6 4.9 5.0 5.3 55 years and over 2 .................................................. 432 729 717 3.3 4.3 4.3 4.3 5.4 5.3
MARITAL STATUS
Married men, spouse present ......................................... 1,281 2,330 2,574 2.7 4.1 4.2 4.4 5.0 5.5Married women, spouse present .................................... 1,134 1,750 1,918 3.1 4.2 4.3 4.5 4.7 5.1Women who maintain families 2 ..................................... 655 1,010 1,003 6.7 8.8 9.3 9.5 10.3 10.3
FULL- OR PART-TIME STATUS
Full-time workers 3 ......................................................... 6,112 10,057 10,839 4.8 6.8 7.0 7.5 8.0 8.6Part-time workers 4 ......................................................... 1,297 1,646 1,635 5.0 5.7 5.8 5.9 5.9 5.8
1 Unemployment as a percent of the civilian labor force.2 Not seasonally adjusted.3 Full-time workers are unemployed persons who have expressed a desire to
work full time (35 hours or more per week) or are on layoff from full-time jobs.4 Part-time workers are unemployed persons who have expressed a desire to
work part time (less than 35 hours per week) or are on layoff from part-time jobs.NOTE: Detail for the seasonally adjusted data shown in this table will not
necessarily add to totals because of the independent seasonal adjustment of thevarious series. Updated population controls are introduced annually with therelease of January data.

HOUSEHOLD DATA HOUSEHOLD DATA
Table A-8. Unemployed persons by reason for unemployment
(Numbers in thousands)
Reason
Not seasonally adjusted Seasonally adjusted
Feb.2008
Jan.2009
Feb.2009
Feb.2008
Oct.2008
Nov.2008
Dec.2008
Jan.2009
Feb.2009
NUMBER OF UNEMPLOYED
Job losers and persons who completed temporary jobs 4,471 8,633 9,098 3,865 5,811 6,156 6,471 6,980 7,696On temporary layoff .................................................... 1,351 2,251 2,052 982 1,367 1,413 1,524 1,441 1,488Not on temporary layoff .............................................. 3,120 6,382 7,047 2,883 4,443 4,744 4,946 5,539 6,208
Permanent job losers .............................................. 2,204 4,923 5,466 1( ) 1( ) 1( ) 1( ) 1( ) 1( )Persons who completed temporary jobs ................ 916 1,460 1,581 1( ) 1( ) 1( ) 1( ) 1( ) 1( )
Job leavers ..................................................................... 802 920 841 780 946 940 1,007 917 820Reentrants ...................................................................... 2,139 2,791 2,929 2,096 2,650 2,655 2,777 2,751 2,834New entrants .................................................................. 542 665 830 660 825 760 829 780 1,005
PERCENT DISTRIBUTION
Total unemployed ........................................................... 100.0 100.0 100.0 100.0 100.0 100.0 100.0 100.0 100.0Job losers and persons who completed temporaryjobs ............................................................................. 56.2 66.4 66.4 52.2 56.8 58.6 58.4 61.1 62.3On temporary layoff .................................................. 17.0 17.3 15.0 13.3 13.4 13.4 13.8 12.6 12.0Not on temporary layoff ............................................ 39.2 49.1 51.4 39.0 43.4 45.1 44.6 48.5 50.2
Job leavers ................................................................... 10.1 7.1 6.1 10.5 9.2 8.9 9.1 8.0 6.6Reentrants .................................................................... 26.9 21.5 21.4 28.3 25.9 25.3 25.1 24.1 22.9New entrants ................................................................ 6.8 5.1 6.1 8.9 8.1 7.2 7.5 6.8 8.1
UNEMPLOYED AS A PERCENT OF THE CIVILIAN LABOR FORCE
Job losers and persons who completed temporaryjobs ............................................................................. 2.9 5.6 5.9 2.5 3.8 4.0 4.2 4.5 5.0
Job leavers ................................................................... .5 .6 .5 .5 .6 .6 .7 .6 .5Reentrants .................................................................... 1.4 1.8 1.9 1.4 1.7 1.7 1.8 1.8 1.8New entrants ................................................................ .4 .4 .5 .4 .5 .5 .5 .5 .7
1 Data not available.NOTE: Updated population controls are introduced annually with the release of January data.
HOUSEHOLD DATA HOUSEHOLD DATA
Table A-9. Unemployed persons by duration of unemployment
(Numbers in thousands)
Duration
Not seasonally adjusted Seasonally adjusted
Feb.2008
Jan.2009
Feb.2009
Feb.2008
Oct.2008
Nov.2008
Dec.2008
Jan.2009
Feb.2009
NUMBER OF UNEMPLOYED
Less than 5 weeks .............................................................................. 2,530 4,137 3,247 2,661 3,108 3,255 3,267 3,658 3,4045 to 14 weeks ..................................................................................... 2,854 4,044 4,778 2,419 3,055 3,141 3,398 3,519 3,96915 weeks and over ............................................................................. 2,570 4,828 5,673 2,400 4,109 3,964 4,517 4,634 5,264 15 to 26 weeks ................................................................................ 1,212 2,086 2,611 1,103 1,834 1,757 1,927 1,987 2,347 27 weeks and over .......................................................................... 1,358 2,742 3,063 1,297 2,275 2,207 2,591 2,647 2,917
Average (mean) duration, in weeks .................................................... 16.8 18.8 19.9 16.6 19.8 18.9 19.7 19.8 19.8Median duration, in weeks .................................................................. 8.9 10.0 11.7 8.4 10.6 10.0 10.6 10.3 11.0
PERCENT DISTRIBUTION
Total unemployed ............................................................................... 100.0 100.0 100.0 100.0 100.0 100.0 100.0 100.0 100.0 Less than 5 weeks ............................................................................ 31.8 31.8 23.7 35.6 30.3 31.4 29.2 31.0 26.9 5 to 14 weeks ................................................................................... 35.9 31.1 34.9 32.3 29.7 30.3 30.4 29.8 31.4 15 weeks and over ........................................................................... 32.3 37.1 41.4 32.1 40.0 38.3 40.4 39.2 41.7 15 to 26 weeks ............................................................................... 15.2 16.0 19.1 14.7 17.9 17.0 17.2 16.8 18.6 27 weeks and over ......................................................................... 17.1 21.1 22.4 17.3 22.1 21.3 23.2 22.4 23.1
NOTE: Updated population controls are introduced annually with the release of January data.
Table A-10. Employed and unemployed persons by occupation, not seasonally adjusted
(Numbers in thousands)
OccupationEmployed Unemployed Unemployment
rates
Feb.2008
Feb.2009
Feb.2008
Feb.2009
Feb.2008
Feb.2009
Total, 16 years and over 1 ....................................................... 144,550 140,105 7,953 13,699 5.2 8.9Management, professional, and related occupations ............. 52,498 52,196 1,159 2,137 2.2 3.9
Management, business, and financial operationsoccupations ................................................................................ 21,732 21,668 503 1,018 2.3 4.5
Professional and related occupations ...................................... 30,766 30,528 656 1,119 2.1 3.5Service occupations ....................................................................... 23,493 24,110 1,694 2,415 6.7 9.1Sales and office occupations ....................................................... 35,849 34,161 1,790 2,983 4.8 8.0 Sales and related occupations .................................................. 16,439 15,676 896 1,438 5.2 8.4 Office and administrative support occupations ...................... 19,410 18,485 894 1,545 4.4 7.7Natural resources, construction, and maintenanceoccupations .................................................................................... 14,653 13,191 1,473 2,845 9.1 17.7
Farming, fishing, and forestry occupations ............................. 931 821 128 238 12.1 22.5 Construction and extraction occupations ................................ 8,674 7,328 1,150 2,163 11.7 22.8 Installation, maintenance, and repair occupations ................ 5,049 5,041 196 445 3.7 8.1Production, transportation, and material movingoccupations .................................................................................... 18,057 16,448 1,280 2,469 6.6 13.1
Production occupations .............................................................. 9,209 7,868 595 1,246 6.1 13.7 Transportation and material moving occupations ................. 8,848 8,580 685 1,223 7.2 12.5
1 Persons with no previous work experience and persons whose last job was in the Armed Forces are included in the unemployed total.NOTE: Updated population controls are introduced annually with the release of January data.

HOUSEHOLD DATA HOUSEHOLD DATA
Table A-11. Unemployed persons by industry and class of worker, not seasonally adjusted
Industry and class of worker
Number ofunemployed
persons(in thousands)
Unemploymentrates
Feb.2008
Feb.2009
Feb.2008
Feb.2009
Total, 16 years and over 1 .................................................... 7,953 13,699 5.2 8.9Nonagricultural private wage and salary workers .................... 6,564 11,469 5.5 9.6 Mining, quarrying, and oil and gas extraction ......................... 16 63 2.2 7.6 Construction .................................................................................. 1,118 2,025 11.4 21.4 Manufacturing ............................................................................... 820 1,822 5.0 11.5 Durable goods ............................................................................ 481 1,219 4.6 11.9 Nondurable goods ..................................................................... 339 603 5.7 10.8 Wholesale and retail trade ......................................................... 1,007 1,847 4.9 8.9 Transportation and utilities ......................................................... 289 563 4.6 9.1 Information ..................................................................................... 193 224 5.8 7.1 Financial activities ........................................................................ 323 637 3.4 6.7 Professional and business services ......................................... 866 1,512 6.2 10.8 Education and health services .................................................. 562 847 2.9 4.1 Leisure and hospitality ................................................................ 1,056 1,477 8.5 11.4 Other services ............................................................................... 313 453 5.1 7.3Agriculture and related private wage and salary workers ...... 135 251 10.9 18.8Government workers ..................................................................... 372 563 1.7 2.6Self employed and unpaid family workers ................................. 340 586 3.2 5.7
1 Persons with no previous work experience are included in the unemployed total.NOTE: Updated population controls are introduced annually with the release of January data. Effective with January 2009 data, industries reflect the introduction of the 2007
Census industry classification system into the Current Population Survey. This industry classification system is derived from the 2007 North American Industry ClassificationSystem. No historical data have been revised.
Table A-12. Alternative measures of labor underutilization
(Percent)
Measure
Not seasonally adjusted Seasonally adjusted
Feb.2008
Jan.2009
Feb.2009
Feb.2008
Oct.2008
Nov.2008
Dec.2008
Jan.2009
Feb.2009
U-1 Persons unemployed 15 weeks or longer, as a percent of thecivilian labor force ..................................................................... 1.7 3.1 3.7 1.6 2.7 2.6 2.9 3.0 3.4
U-2 Job losers and persons who completed temporary jobs, as apercent of the civilian labor force .............................................. 2.9 5.6 5.9 2.5 3.8 4.0 4.2 4.5 5.0
U-3 Total unemployed, as a percent of the civilian labor force(official unemployment rate) ................................................. 5.2 8.5 8.9 4.8 6.6 6.8 7.2 7.6 8.1
U-4 Total unemployed plus discouraged workers, as a percent of thecivilian labor force plus discouraged workers ........................... 5.5 8.9 9.3 5.1 6.9 7.1 7.6 8.0 8.5
U-5 Total unemployed, plus discouraged workers, plus all othermarginally attached workers, as a percent of the civilian laborforce plus all marginally attached workers ................................ 6.2 9.7 10.1 5.8 7.6 7.9 8.3 8.8 9.3
U-6 Total unemployed, plus all marginally attached workers, plustotal employed part time for economic reasons, as a percentof the civilian labor force plus all marginally attached workers 9.5 15.4 16.0 9.0 12.0 12.6 13.5 13.9 14.8
NOTE: Marginally attached workers are persons who currently are neitherworking nor looking for work but indicate that they want and are available for a joband have looked for work sometime in the recent past. Discouraged workers, asubset of the marginally attached, have given a job-market related reason for notlooking currently for a job. Persons employed part time for economic reasons are
those who want and are available for full-time work but have had to settle for apart-time schedule. For more information, see "BLS introduces new range ofalternative unemployment measures," in the October 1995 issue of the MonthlyLabor Review. Updated population controls are introduced annually with therelease of January data.

HOUSEHOLD DATA HOUSEHOLD DATA
Table A-13. Persons not in the labor force and multiple jobholders by sex, not seasonally adjusted
(Numbers in thousands)
Category
Total Men Women
Feb.2008
Feb.2009
Feb.2008
Feb.2009
Feb.2008
Feb.2009
NOT IN THE LABOR FORCE
Total not in the labor force .................................................................. 80,306 81,109 31,081 31,707 49,225 49,401 Persons who currently want a job ...................................................... 4,689 5,588 2,073 2,633 2,616 2,956
Marginally attached to the labor force 1 ........................................ 1,585 2,051 775 1,051 810 1,000Reason not currently looking:
Discouragement over job prospects 2 .................................. 396 731 248 450 148 281Reasons other than discouragement 3 ................................. 1,189 1,320 527 601 662 719
MULTIPLE JOBHOLDERS
Total multiple jobholders 4 .................................................................. 7,610 7,676 3,682 3,703 3,928 3,973 Percent of total employed ............................................................... 5.3 5.5 4.8 5.0 5.8 6.0
Primary job full time, secondary job part time ................................. 4,157 4,054 2,256 2,107 1,901 1,947 Primary and secondary jobs both part time .................................... 1,792 1,886 529 628 1,263 1,258 Primary and secondary jobs both full time ...................................... 255 235 166 154 89 80 Hours vary on primary or secondary job ......................................... 1,371 1,437 713 777 658 660
1 Data refer to persons who have searched for work during the prior 12 months andwere available to take a job during the reference week.
2 Includes thinks no work available, could not find work, lacks schooling or training,employer thinks too young or old, and other types of discrimination.
3 Includes those who did not actively look for work in the prior 4 weeks for suchreasons as school or family responsibilities, ill health, and transportation problems, as
well as a small number for which reason for nonparticipation was not determined.4 Includes persons who work part time on their primary job and full time on their
secondary job(s), not shown separately.NOTE: Updated population controls are introduced annually with the release of
January data.
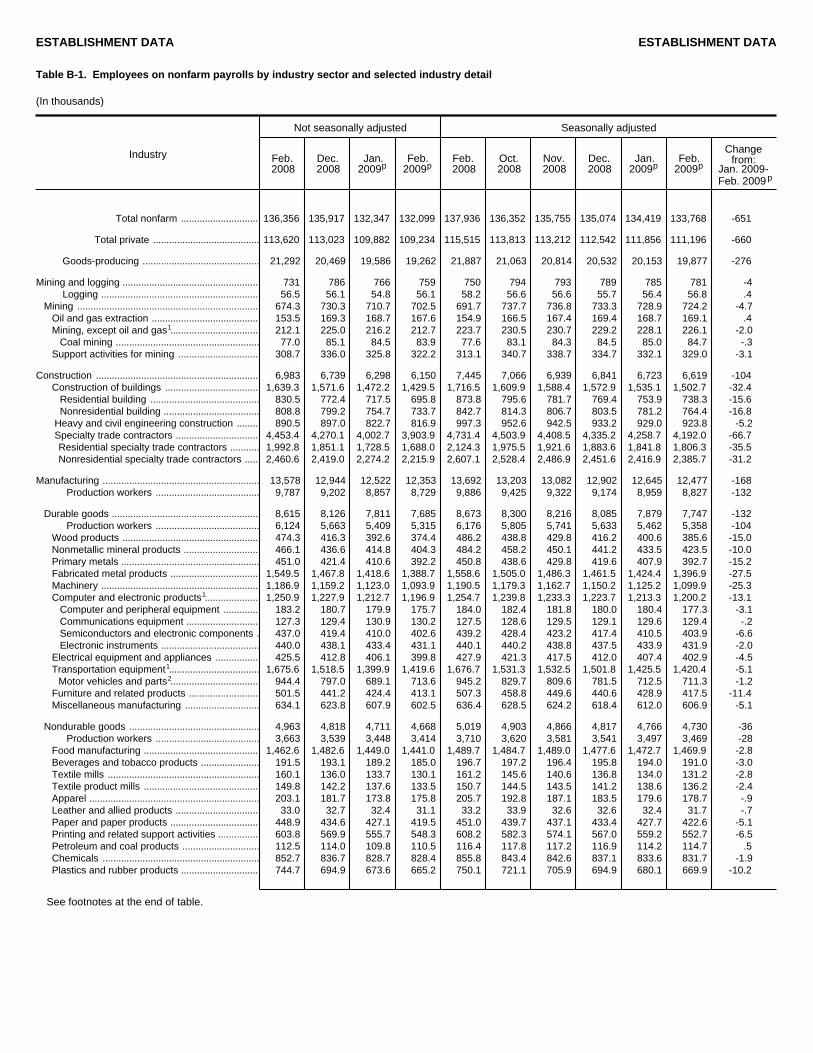
ESTABLISHMENT DATA ESTABLISHMENT DATA
Table B-1. Employees on nonfarm payrolls by industry sector and selected industry detail
(In thousands)
Industry
Not seasonally adjusted Seasonally adjusted
Feb. 2008
Dec. 2008
Jan. 2009p
Feb. 2009p
Feb. 2008
Oct. 2008
Nov. 2008
Dec. 2008
Jan. 2009p
Feb. 2009p
Changefrom:
Jan. 2009-Feb. 2009p
Total nonfarm ............................. 136,356 135,917 132,347 132,099 137,936 136,352 135,755 135,074 134,419 133,768 -651
Total private ........................................ 113,620 113,023 109,882 109,234 115,515 113,813 113,212 112,542 111,856 111,196 -660
Goods-producing ............................................ 21,292 20,469 19,586 19,262 21,887 21,063 20,814 20,532 20,153 19,877 -276
Mining and logging ................................................... 731 786 766 759 750 794 793 789 785 781 -4Logging ........................................................... 56.5 56.1 54.8 56.1 58.2 56.6 56.6 55.7 56.4 56.8 .4
Mining .................................................................... 674.3 730.3 710.7 702.5 691.7 737.7 736.8 733.3 728.9 724.2 -4.7Oil and gas extraction ........................................ 153.5 169.3 168.7 167.6 154.9 166.5 167.4 169.4 168.7 169.1 .4
1Mining, except oil and gas ................................. 212.1 225.0 216.2 212.7 223.7 230.5 230.7 229.2 228.1 226.1 -2.0Coal mining ...................................................... 77.0 85.1 84.5 83.9 77.6 83.1 84.3 84.5 85.0 84.7 -.3
Support activities for mining .............................. 308.7 336.0 325.8 322.2 313.1 340.7 338.7 334.7 332.1 329.0 -3.1
Construction ............................................................. 6,983 6,739 6,298 6,150 7,445 7,066 6,939 6,841 6,723 6,619 -104Construction of buildings ................................... 1,639.3 1,571.6 1,472.2 1,429.5 1,716.5 1,609.9 1,588.4 1,572.9 1,535.1 1,502.7 -32.4
Residential building ......................................... 830.5 772.4 717.5 695.8 873.8 795.6 781.7 769.4 753.9 738.3 -15.6Nonresidential building .................................... 808.8 799.2 754.7 733.7 842.7 814.3 806.7 803.5 781.2 764.4 -16.8
Heavy and civil engineering construction ........ 890.5 897.0 822.7 816.9 997.3 952.6 942.5 933.2 929.0 923.8 -5.2Specialty trade contractors ............................... 4,453.4 4,270.1 4,002.7 3,903.9 4,731.4 4,503.9 4,408.5 4,335.2 4,258.7 4,192.0 -66.7Residential specialty trade contractors ........... 1,992.8 1,851.1 1,728.5 1,688.0 2,124.3 1,975.5 1,921.6 1,883.6 1,841.8 1,806.3 -35.5Nonresidential specialty trade contractors ..... 2,460.6 2,419.0 2,274.2 2,215.9 2,607.1 2,528.4 2,486.9 2,451.6 2,416.9 2,385.7 -31.2
Manufacturing ........................................................... 13,578 12,944 12,522 12,353 13,692 13,203 13,082 12,902 12,645 12,477 -168Production workers ....................................... 9,787 9,202 8,857 8,729 9,886 9,425 9,322 9,174 8,959 8,827 -132
Durable goods ....................................................... 8,615 8,126 7,811 7,685 8,673 8,300 8,216 8,085 7,879 7,747 -132Production workers ....................................... 6,124 5,663 5,409 5,315 6,176 5,805 5,741 5,633 5,462 5,358 -104
Wood products ................................................... 474.3 416.3 392.6 374.4 486.2 438.8 429.8 416.2 400.6 385.6 -15.0Nonmetallic mineral products ............................ 466.1 436.6 414.8 404.3 484.2 458.2 450.1 441.2 433.5 423.5 -10.0Primary metals .................................................... 451.0 421.4 410.6 392.2 450.8 438.6 429.8 419.6 407.9 392.7 -15.2Fabricated metal products ................................. 1,549.5 1,467.8 1,418.6 1,388.7 1,558.6 1,505.0 1,486.3 1,461.5 1,424.4 1,396.9 -27.5Machinery ........................................................... 1,186.9 1,159.2 1,123.0 1,093.9 1,190.5 1,179.3 1,162.7 1,150.2 1,125.2 1,099.9 -25.3
1Computer and electronic products .................... 1,250.9 1,227.9 1,212.7 1,196.9 1,254.7 1,239.8 1,233.3 1,223.7 1,213.3 1,200.2 -13.1Computer and peripheral equipment ............. 183.2 180.7 179.9 175.7 184.0 182.4 181.8 180.0 180.4 177.3 -3.1Communications equipment ........................... 127.3 129.4 130.9 130.2 127.5 128.6 129.5 129.1 129.6 129.4 -.2Semiconductors and electronic components . 437.0 419.4 410.0 402.6 439.2 428.4 423.2 417.4 410.5 403.9 -6.6Electronic instruments ..................................... 440.0 438.1 433.4 431.1 440.1 440.2 438.8 437.5 433.9 431.9 -2.0
Electrical equipment and appliances ................ 425.5 412.8 406.1 399.8 427.9 421.3 417.5 412.0 407.4 402.9 -4.51Transportation equipment .................................. 1,675.6 1,518.5 1,399.9 1,419.6 1,676.7 1,531.3 1,532.5 1,501.8 1,425.5 1,420.4 -5.12Motor vehicles and parts ................................. 944.4 797.0 689.1 713.6 945.2 829.7 809.6 781.5 712.5 711.3 -1.2
Furniture and related products .......................... 501.5 441.2 424.4 413.1 507.3 458.8 449.6 440.6 428.9 417.5 -11.4Miscellaneous manufacturing ............................ 634.1 623.8 607.9 602.5 636.4 628.5 624.2 618.4 612.0 606.9 -5.1
Nondurable goods ................................................. 4,963 4,818 4,711 4,668 5,019 4,903 4,866 4,817 4,766 4,730 -36Production workers ....................................... 3,663 3,539 3,448 3,414 3,710 3,620 3,581 3,541 3,497 3,469 -28
Food manufacturing ........................................... 1,462.6 1,482.6 1,449.0 1,441.0 1,489.7 1,484.7 1,489.0 1,477.6 1,472.7 1,469.9 -2.8Beverages and tobacco products ...................... 191.5 193.1 189.2 185.0 196.7 197.2 196.4 195.8 194.0 191.0 -3.0Textile mills ......................................................... 160.1 136.0 133.7 130.1 161.2 145.6 140.6 136.8 134.0 131.2 -2.8Textile product mills ........................................... 149.8 142.2 137.6 133.5 150.7 144.5 143.5 141.2 138.6 136.2 -2.4Apparel ................................................................ 203.1 181.7 173.8 175.8 205.7 192.8 187.1 183.5 179.6 178.7 -.9Leather and allied products ............................... 33.0 32.7 32.4 31.1 33.2 33.9 32.6 32.6 32.4 31.7 -.7Paper and paper products ................................. 448.9 434.6 427.1 419.5 451.0 439.7 437.1 433.4 427.7 422.6 -5.1Printing and related support activities ............... 603.8 569.9 555.7 548.3 608.2 582.3 574.1 567.0 559.2 552.7 -6.5Petroleum and coal products ............................. 112.5 114.0 109.8 110.5 116.4 117.8 117.2 116.9 114.2 114.7 .5Chemicals ........................................................... 852.7 836.7 828.7 828.4 855.8 843.4 842.6 837.1 833.6 831.7 -1.9Plastics and rubber products ............................. 744.7 694.9 673.6 665.2 750.1 721.1 705.9 694.9 680.1 669.9 -10.2
See footnotes at the end of table.
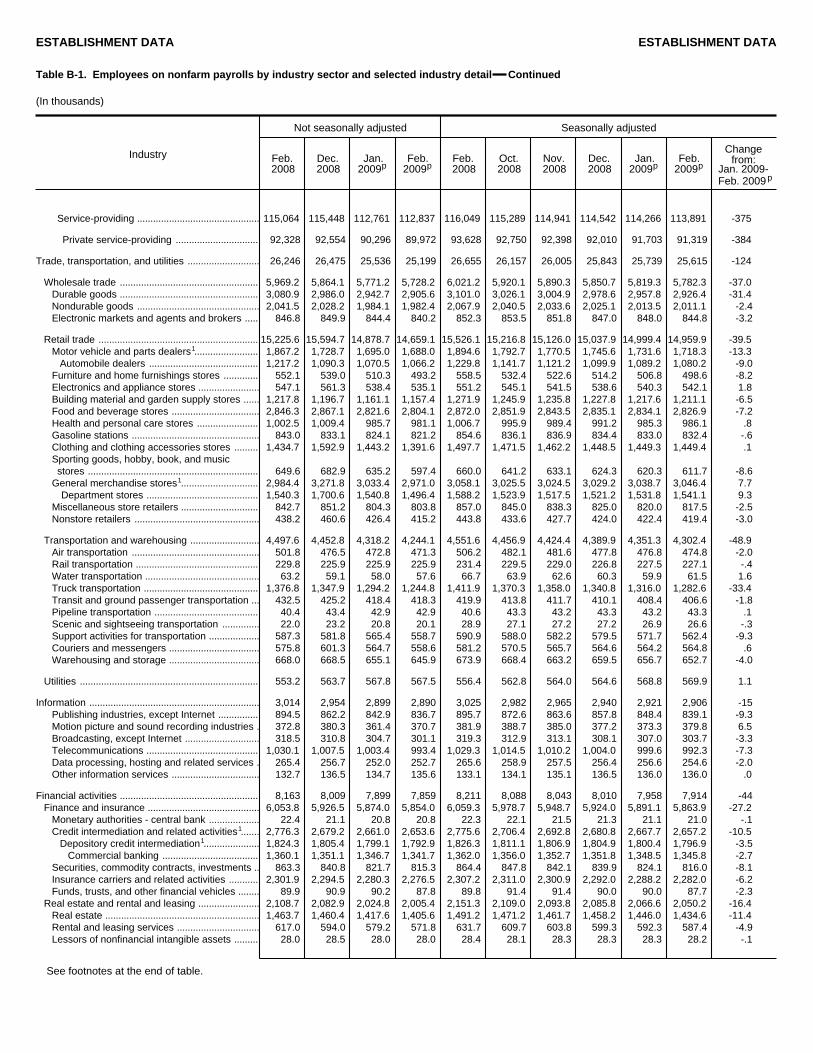
ESTABLISHMENT DATA ESTABLISHMENT DATA
Table B-1. Employees on nonfarm payrolls by industry sector and selected industry detail Continued
(In thousands)
Industry
Not seasonally adjusted Seasonally adjusted
Feb. 2008
Dec. 2008
Jan. 2009p
Feb. 2009p
Feb. 2008
Oct. 2008
Nov. 2008
Dec. 2008
Jan. 2009p
Feb. 2009p
Changefrom:
Jan. 2009-Feb. 2009p
Service-providing .............................................. 115,064 115,448 112,761 112,837 116,049 115,289 114,941 114,542 114,266 113,891 -375
Private service-providing ............................... 92,328 92,554 90,296 89,972 93,628 92,750 92,398 92,010 91,703 91,319 -384
Trade, transportation, and utilities ........................... 26,246 26,475 25,536 25,199 26,655 26,157 26,005 25,843 25,739 25,615 -124
Wholesale trade .................................................... 5,969.2 5,864.1 5,771.2 5,728.2 6,021.2 5,920.1 5,890.3 5,850.7 5,819.3 5,782.3 -37.0Durable goods .................................................... 3,080.9 2,986.0 2,942.7 2,905.6 3,101.0 3,026.1 3,004.9 2,978.6 2,957.8 2,926.4 -31.4Nondurable goods .............................................. 2,041.5 2,028.2 1,984.1 1,982.4 2,067.9 2,040.5 2,033.6 2,025.1 2,013.5 2,011.1 -2.4Electronic markets and agents and brokers ..... 846.8 849.9 844.4 840.2 852.3 853.5 851.8 847.0 848.0 844.8 -3.2
Retail trade ............................................................ 15,225.6 15,594.7 14,878.7 14,659.1 15,526.1 15,216.8 15,126.0 15,037.9 14,999.4 14,959.9 -39.51Motor vehicle and parts dealers ........................ 1,867.2 1,728.7 1,695.0 1,688.0 1,894.6 1,792.7 1,770.5 1,745.6 1,731.6 1,718.3 -13.3
Automobile dealers ......................................... 1,217.2 1,090.3 1,070.5 1,066.2 1,229.8 1,141.7 1,121.2 1,099.9 1,089.2 1,080.2 -9.0Furniture and home furnishings stores ............. 552.1 539.0 510.3 493.2 558.5 532.4 522.6 514.2 506.8 498.6 -8.2Electronics and appliance stores ....................... 547.1 561.3 538.4 535.1 551.2 545.1 541.5 538.6 540.3 542.1 1.8Building material and garden supply stores ...... 1,217.8 1,196.7 1,161.1 1,157.4 1,271.9 1,245.9 1,235.8 1,227.8 1,217.6 1,211.1 -6.5Food and beverage stores ................................. 2,846.3 2,867.1 2,821.6 2,804.1 2,872.0 2,851.9 2,843.5 2,835.1 2,834.1 2,826.9 -7.2Health and personal care stores ....................... 1,002.5 1,009.4 985.7 981.1 1,006.7 995.9 989.4 991.2 985.3 986.1 .8Gasoline stations ................................................ 843.0 833.1 824.1 821.2 854.6 836.1 836.9 834.4 833.0 832.4 -.6Clothing and clothing accessories stores ......... 1,434.7 1,592.9 1,443.2 1,391.6 1,497.7 1,471.5 1,462.2 1,448.5 1,449.3 1,449.4 .1Sporting goods, hobby, book, and musicstores ................................................................ 649.6 682.9 635.2 597.4 660.0 641.2 633.1 624.3 620.3 611.7 -8.6
1General merchandise stores ............................. 2,984.4 3,271.8 3,033.4 2,971.0 3,058.1 3,025.5 3,024.5 3,029.2 3,038.7 3,046.4 7.7Department stores .......................................... 1,540.3 1,700.6 1,540.8 1,496.4 1,588.2 1,523.9 1,517.5 1,521.2 1,531.8 1,541.1 9.3
Miscellaneous store retailers ............................. 842.7 851.2 804.3 803.8 857.0 845.0 838.3 825.0 820.0 817.5 -2.5Nonstore retailers ............................................... 438.2 460.6 426.4 415.2 443.8 433.6 427.7 424.0 422.4 419.4 -3.0
Transportation and warehousing .......................... 4,497.6 4,452.8 4,318.2 4,244.1 4,551.6 4,456.9 4,424.4 4,389.9 4,351.3 4,302.4 -48.9Air transportation ................................................ 501.8 476.5 472.8 471.3 506.2 482.1 481.6 477.8 476.8 474.8 -2.0Rail transportation .............................................. 229.8 225.9 225.9 225.9 231.4 229.5 229.0 226.8 227.5 227.1 -.4Water transportation ........................................... 63.2 59.1 58.0 57.6 66.7 63.9 62.6 60.3 59.9 61.5 1.6Truck transportation ........................................... 1,376.8 1,347.9 1,294.2 1,244.8 1,411.9 1,370.3 1,358.0 1,340.8 1,316.0 1,282.6 -33.4Transit and ground passenger transportation ... 432.5 425.2 418.4 418.3 419.9 413.8 411.7 410.1 408.4 406.6 -1.8Pipeline transportation ....................................... 40.4 43.4 42.9 42.9 40.6 43.3 43.2 43.3 43.2 43.3 .1Scenic and sightseeing transportation .............. 22.0 23.2 20.8 20.1 28.9 27.1 27.2 27.2 26.9 26.6 -.3Support activities for transportation ................... 587.3 581.8 565.4 558.7 590.9 588.0 582.2 579.5 571.7 562.4 -9.3Couriers and messengers .................................. 575.8 601.3 564.7 558.6 581.2 570.5 565.7 564.6 564.2 564.8 .6Warehousing and storage .................................. 668.0 668.5 655.1 645.9 673.9 668.4 663.2 659.5 656.7 652.7 -4.0
Utilities ................................................................... 553.2 563.7 567.8 567.5 556.4 562.8 564.0 564.6 568.8 569.9 1.1
Information ................................................................ 3,014 2,954 2,899 2,890 3,025 2,982 2,965 2,940 2,921 2,906 -15Publishing industries, except Internet ............... 894.5 862.2 842.9 836.7 895.7 872.6 863.6 857.8 848.4 839.1 -9.3Motion picture and sound recording industries . 372.8 380.3 361.4 370.7 381.9 388.7 385.0 377.2 373.3 379.8 6.5Broadcasting, except Internet ............................ 318.5 310.8 304.7 301.1 319.3 312.9 313.1 308.1 307.0 303.7 -3.3Telecommunications .......................................... 1,030.1 1,007.5 1,003.4 993.4 1,029.3 1,014.5 1,010.2 1,004.0 999.6 992.3 -7.3Data processing, hosting and related services . 265.4 256.7 252.0 252.7 265.6 258.9 257.5 256.4 256.6 254.6 -2.0Other information services ................................. 132.7 136.5 134.7 135.6 133.1 134.1 135.1 136.5 136.0 136.0 .0
Financial activities .................................................... 8,163 8,009 7,899 7,859 8,211 8,088 8,043 8,010 7,958 7,914 -44Finance and insurance .......................................... 6,053.8 5,926.5 5,874.0 5,854.0 6,059.3 5,978.7 5,948.7 5,924.0 5,891.1 5,863.9 -27.2
Monetary authorities - central bank ................... 22.4 21.1 20.8 20.8 22.3 22.1 21.5 21.3 21.1 21.0 -.11Credit intermediation and related activities ....... 2,776.3 2,679.2 2,661.0 2,653.6 2,775.6 2,706.4 2,692.8 2,680.8 2,667.7 2,657.2 -10.5
1Depository credit intermediation ..................... 1,824.3 1,805.4 1,799.1 1,792.9 1,826.3 1,811.1 1,806.9 1,804.9 1,800.4 1,796.9 -3.5Commercial banking .................................... 1,360.1 1,351.1 1,346.7 1,341.7 1,362.0 1,356.0 1,352.7 1,351.8 1,348.5 1,345.8 -2.7
Securities, commodity contracts, investments .. 863.3 840.8 821.7 815.3 864.4 847.8 842.1 839.9 824.1 816.0 -8.1Insurance carriers and related activities ........... 2,301.9 2,294.5 2,280.3 2,276.5 2,307.2 2,311.0 2,300.9 2,292.0 2,288.2 2,282.0 -6.2Funds, trusts, and other financial vehicles ........ 89.9 90.9 90.2 87.8 89.8 91.4 91.4 90.0 90.0 87.7 -2.3
Real estate and rental and leasing ....................... 2,108.7 2,082.9 2,024.8 2,005.4 2,151.3 2,109.0 2,093.8 2,085.8 2,066.6 2,050.2 -16.4Real estate .......................................................... 1,463.7 1,460.4 1,417.6 1,405.6 1,491.2 1,471.2 1,461.7 1,458.2 1,446.0 1,434.6 -11.4Rental and leasing services ............................... 617.0 594.0 579.2 571.8 631.7 609.7 603.8 599.3 592.3 587.4 -4.9Lessors of nonfinancial intangible assets ......... 28.0 28.5 28.0 28.0 28.4 28.1 28.3 28.3 28.3 28.2 -.1
See footnotes at the end of table.
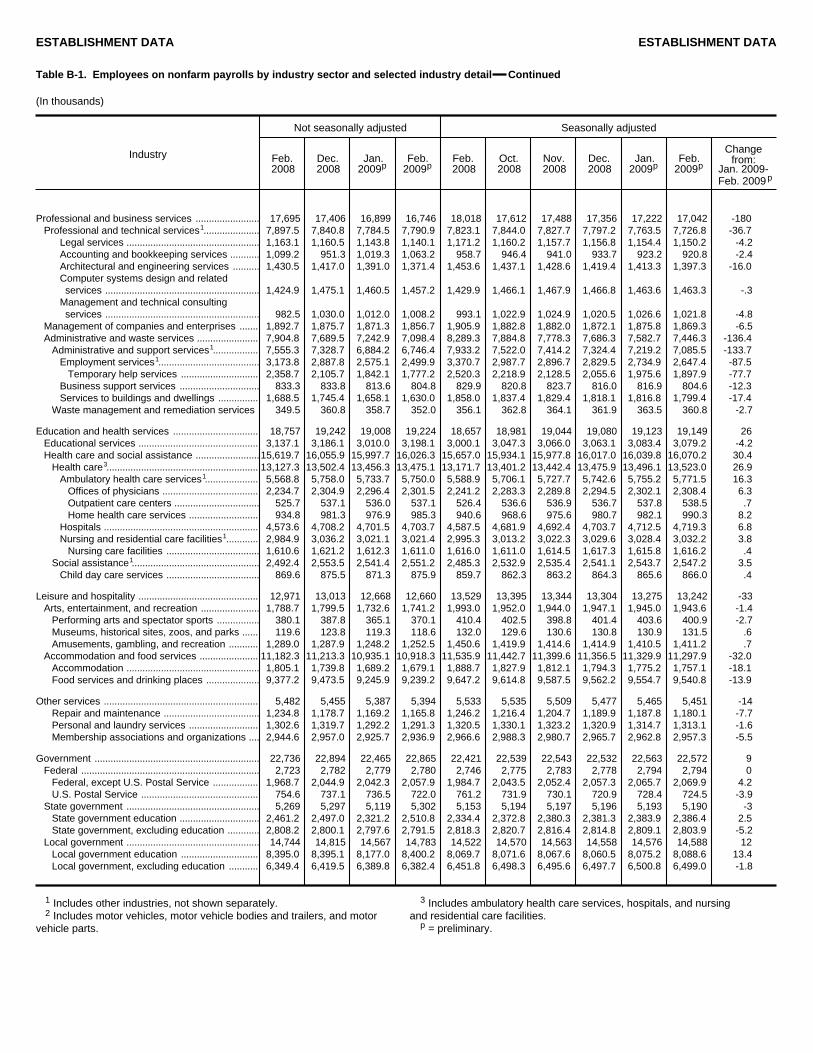
ESTABLISHMENT DATA ESTABLISHMENT DATA
Table B-1. Employees on nonfarm payrolls by industry sector and selected industry detail Continued
(In thousands)
Industry
Not seasonally adjusted Seasonally adjusted
Feb. 2008
Dec. 2008
Jan. 2009p
Feb. 2009p
Feb. 2008
Oct. 2008
Nov. 2008
Dec. 2008
Jan. 2009p
Feb. 2009p
Changefrom:
Jan. 2009-Feb. 2009p
Professional and business services ........................ 17,695 17,406 16,899 16,746 18,018 17,612 17,488 17,356 17,222 17,042 -1801Professional and technical services ..................... 7,897.5 7,840.8 7,784.5 7,790.9 7,823.1 7,844.0 7,827.7 7,797.2 7,763.5 7,726.8 -36.7
Legal services .................................................. 1,163.1 1,160.5 1,143.8 1,140.1 1,171.2 1,160.2 1,157.7 1,156.8 1,154.4 1,150.2 -4.2Accounting and bookkeeping services ........... 1,099.2 951.3 1,019.3 1,063.2 958.7 946.4 941.0 933.7 923.2 920.8 -2.4Architectural and engineering services .......... 1,430.5 1,417.0 1,391.0 1,371.4 1,453.6 1,437.1 1,428.6 1,419.4 1,413.3 1,397.3 -16.0Computer systems design and relatedservices .......................................................... 1,424.9 1,475.1 1,460.5 1,457.2 1,429.9 1,466.1 1,467.9 1,466.8 1,463.6 1,463.3 -.3
Management and technical consultingservices .......................................................... 982.5 1,030.0 1,012.0 1,008.2 993.1 1,022.9 1,024.9 1,020.5 1,026.6 1,021.8 -4.8
Management of companies and enterprises ....... 1,892.7 1,875.7 1,871.3 1,856.7 1,905.9 1,882.8 1,882.0 1,872.1 1,875.8 1,869.3 -6.5Administrative and waste services ....................... 7,904.8 7,689.5 7,242.9 7,098.4 8,289.3 7,884.8 7,778.3 7,686.3 7,582.7 7,446.3 -136.4
1Administrative and support services ................. 7,555.3 7,328.7 6,884.2 6,746.4 7,933.2 7,522.0 7,414.2 7,324.4 7,219.2 7,085.5 -133.71Employment services ...................................... 3,173.8 2,887.8 2,575.1 2,499.9 3,370.7 2,987.7 2,896.7 2,829.5 2,734.9 2,647.4 -87.5
Temporary help services ............................. 2,358.7 2,105.7 1,842.1 1,777.2 2,520.3 2,218.9 2,128.5 2,055.6 1,975.6 1,897.9 -77.7Business support services .............................. 833.3 833.8 813.6 804.8 829.9 820.8 823.7 816.0 816.9 804.6 -12.3Services to buildings and dwellings ............... 1,688.5 1,745.4 1,658.1 1,630.0 1,858.0 1,837.4 1,829.4 1,818.1 1,816.8 1,799.4 -17.4
Waste management and remediation services 349.5 360.8 358.7 352.0 356.1 362.8 364.1 361.9 363.5 360.8 -2.7
Education and health services ................................ 18,757 19,242 19,008 19,224 18,657 18,981 19,044 19,080 19,123 19,149 26Educational services ............................................. 3,137.1 3,186.1 3,010.0 3,198.1 3,000.1 3,047.3 3,066.0 3,063.1 3,083.4 3,079.2 -4.2Health care and social assistance ........................15,619.7 16,055.9 15,997.7 16,026.3 15,657.0 15,934.1 15,977.8 16,017.0 16,039.8 16,070.2 30.4
3Health care ......................................................... 13,127.3 13,502.4 13,456.3 13,475.1 13,171.7 13,401.2 13,442.4 13,475.9 13,496.1 13,523.0 26.91Ambulatory health care services .................... 5,568.8 5,758.0 5,733.7 5,750.0 5,588.9 5,706.1 5,727.7 5,742.6 5,755.2 5,771.5 16.3
Offices of physicians .................................... 2,234.7 2,304.9 2,296.4 2,301.5 2,241.2 2,283.3 2,289.8 2,294.5 2,302.1 2,308.4 6.3Outpatient care centers ................................ 525.7 537.1 536.0 537.1 526.4 536.6 536.9 536.7 537.8 538.5 .7Home health care services .......................... 934.8 981.3 976.9 985.3 940.6 968.6 975.6 980.7 982.1 990.3 8.2
Hospitals .......................................................... 4,573.6 4,708.2 4,701.5 4,703.7 4,587.5 4,681.9 4,692.4 4,703.7 4,712.5 4,719.3 6.81Nursing and residential care facilities ............ 2,984.9 3,036.2 3,021.1 3,021.4 2,995.3 3,013.2 3,022.3 3,029.6 3,028.4 3,032.2 3.8
Nursing care facilities ................................... 1,610.6 1,621.2 1,612.3 1,611.0 1,616.0 1,611.0 1,614.5 1,617.3 1,615.8 1,616.2 .41Social assistance ................................................ 2,492.4 2,553.5 2,541.4 2,551.2 2,485.3 2,532.9 2,535.4 2,541.1 2,543.7 2,547.2 3.5
Child day care services ................................... 869.6 875.5 871.3 875.9 859.7 862.3 863.2 864.3 865.6 866.0 .4
Leisure and hospitality ............................................. 12,971 13,013 12,668 12,660 13,529 13,395 13,344 13,304 13,275 13,242 -33Arts, entertainment, and recreation ...................... 1,788.7 1,799.5 1,732.6 1,741.2 1,993.0 1,952.0 1,944.0 1,947.1 1,945.0 1,943.6 -1.4
Performing arts and spectator sports ................ 380.1 387.8 365.1 370.1 410.4 402.5 398.8 401.4 403.6 400.9 -2.7Museums, historical sites, zoos, and parks ...... 119.6 123.8 119.3 118.6 132.0 129.6 130.6 130.8 130.9 131.5 .6Amusements, gambling, and recreation ........... 1,289.0 1,287.9 1,248.2 1,252.5 1,450.6 1,419.9 1,414.6 1,414.9 1,410.5 1,411.2 .7
Accommodation and food services ...................... 11,182.3 11,213.3 10,935.1 10,918.3 11,535.9 11,442.7 11,399.6 11,356.5 11,329.9 11,297.9 -32.0Accommodation .................................................. 1,805.1 1,739.8 1,689.2 1,679.1 1,888.7 1,827.9 1,812.1 1,794.3 1,775.2 1,757.1 -18.1Food services and drinking places .................... 9,377.2 9,473.5 9,245.9 9,239.2 9,647.2 9,614.8 9,587.5 9,562.2 9,554.7 9,540.8 -13.9
Other services .......................................................... 5,482 5,455 5,387 5,394 5,533 5,535 5,509 5,477 5,465 5,451 -14Repair and maintenance .................................... 1,234.8 1,178.7 1,169.2 1,165.8 1,246.2 1,216.4 1,204.7 1,189.9 1,187.8 1,180.1 -7.7Personal and laundry services .......................... 1,302.6 1,319.7 1,292.2 1,291.3 1,320.5 1,330.1 1,323.2 1,320.9 1,314.7 1,313.1 -1.6Membership associations and organizations .... 2,944.6 2,957.0 2,925.7 2,936.9 2,966.6 2,988.3 2,980.7 2,965.7 2,962.8 2,957.3 -5.5
Government .............................................................. 22,736 22,894 22,465 22,865 22,421 22,539 22,543 22,532 22,563 22,572 9Federal ................................................................... 2,723 2,782 2,779 2,780 2,746 2,775 2,783 2,778 2,794 2,794 0
Federal, except U.S. Postal Service ................. 1,968.7 2,044.9 2,042.3 2,057.9 1,984.7 2,043.5 2,052.4 2,057.3 2,065.7 2,069.9 4.2U.S. Postal Service ............................................ 754.6 737.1 736.5 722.0 761.2 731.9 730.1 720.9 728.4 724.5 -3.9
State government .................................................. 5,269 5,297 5,119 5,302 5,153 5,194 5,197 5,196 5,193 5,190 -3State government education .............................. 2,461.2 2,497.0 2,321.2 2,510.8 2,334.4 2,372.8 2,380.3 2,381.3 2,383.9 2,386.4 2.5State government, excluding education ............ 2,808.2 2,800.1 2,797.6 2,791.5 2,818.3 2,820.7 2,816.4 2,814.8 2,809.1 2,803.9 -5.2
Local government .................................................. 14,744 14,815 14,567 14,783 14,522 14,570 14,563 14,558 14,576 14,588 12Local government education ............................. 8,395.0 8,395.1 8,177.0 8,400.2 8,069.7 8,071.6 8,067.6 8,060.5 8,075.2 8,088.6 13.4Local government, excluding education ........... 6,349.4 6,419.5 6,389.8 6,382.4 6,451.8 6,498.3 6,495.6 6,497.7 6,500.8 6,499.0 -1.8
1 Includes other industries, not shown separately.2 Includes motor vehicles, motor vehicle bodies and trailers, and motor
vehicle parts.
3 Includes ambulatory health care services, hospitals, and nursingand residential care facilities.
p = preliminary.
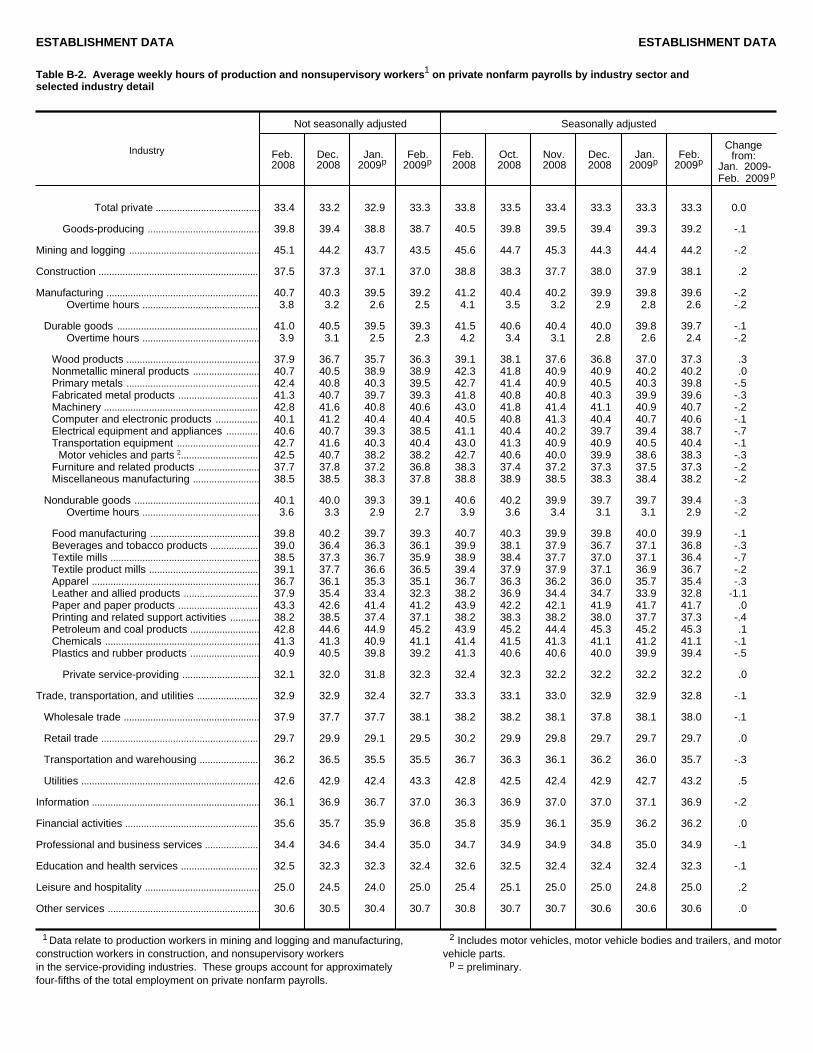
ESTABLISHMENT DATA ESTABLISHMENT DATA
Table B-2. Average weekly hours of production and nonsupervisory workers1 on private nonfarm payrolls by industry sector andselected industry detail
Industry
Not seasonally adjusted Seasonally adjusted
Feb. 2008
Dec. 2008
Jan. 2009p
Feb. 2009p
Feb. 2008
Oct. 2008
Nov. 2008
Dec. 2008
Jan. 2009p
Feb. 2009p
Changefrom:
Jan. 2009-Feb. 2009p
Total private ....................................... 33.4 33.2 32.9 33.3 33.8 33.5 33.4 33.3 33.3 33.3 0.0
Goods-producing .......................................... 39.8 39.4 38.8 38.7 40.5 39.8 39.5 39.4 39.3 39.2 -.1
Mining and logging ................................................. 45.1 44.2 43.7 43.5 45.6 44.7 45.3 44.3 44.4 44.2 -.2
Construction ............................................................ 37.5 37.3 37.1 37.0 38.8 38.3 37.7 38.0 37.9 38.1 .2
Manufacturing ......................................................... 40.7 40.3 39.5 39.2 41.2 40.4 40.2 39.9 39.8 39.6 -.2Overtime hours ............................................ 3.8 3.2 2.6 2.5 4.1 3.5 3.2 2.9 2.8 2.6 -.2
Durable goods ..................................................... 41.0 40.5 39.5 39.3 41.5 40.6 40.4 40.0 39.8 39.7 -.1Overtime hours ............................................ 3.9 3.1 2.5 2.3 4.2 3.4 3.1 2.8 2.6 2.4 -.2
Wood products .................................................. 37.9 36.7 35.7 36.3 39.1 38.1 37.6 36.8 37.0 37.3 .3Nonmetallic mineral products ......................... 40.7 40.5 38.9 38.9 42.3 41.8 40.9 40.9 40.2 40.2 .0Primary metals .................................................. 42.4 40.8 40.3 39.5 42.7 41.4 40.9 40.5 40.3 39.8 -.5Fabricated metal products .............................. 41.3 40.7 39.7 39.3 41.8 40.8 40.8 40.3 39.9 39.6 -.3Machinery .......................................................... 42.8 41.6 40.8 40.6 43.0 41.8 41.4 41.1 40.9 40.7 -.2Computer and electronic products ................ 40.1 41.2 40.4 40.4 40.5 40.8 41.3 40.4 40.7 40.6 -.1Electrical equipment and appliances ............ 40.6 40.7 39.3 38.5 41.1 40.4 40.2 39.7 39.4 38.7 -.7Transportation equipment ............................... 42.7 41.6 40.3 40.4 43.0 41.3 40.9 40.9 40.5 40.4 -.1
2Motor vehicles and parts .............................. 42.5 40.7 38.2 38.2 42.7 40.6 40.0 39.9 38.6 38.3 -.3Furniture and related products ....................... 37.7 37.8 37.2 36.8 38.3 37.4 37.2 37.3 37.5 37.3 -.2Miscellaneous manufacturing ......................... 38.5 38.5 38.3 37.8 38.8 38.9 38.5 38.3 38.4 38.2 -.2
Nondurable goods ............................................... 40.1 40.0 39.3 39.1 40.6 40.2 39.9 39.7 39.7 39.4 -.3Overtime hours ............................................ 3.6 3.3 2.9 2.7 3.9 3.6 3.4 3.1 3.1 2.9 -.2
Food manufacturing ......................................... 39.8 40.2 39.7 39.3 40.7 40.3 39.9 39.8 40.0 39.9 -.1Beverages and tobacco products .................. 39.0 36.4 36.3 36.1 39.9 38.1 37.9 36.7 37.1 36.8 -.3Textile mills ........................................................ 38.5 37.3 36.7 35.9 38.9 38.4 37.7 37.0 37.1 36.4 -.7Textile product mills ......................................... 39.1 37.7 36.6 36.5 39.4 37.9 37.9 37.1 36.9 36.7 -.2Apparel ............................................................... 36.7 36.1 35.3 35.1 36.7 36.3 36.2 36.0 35.7 35.4 -.3Leather and allied products ............................ 37.9 35.4 33.4 32.3 38.2 36.9 34.4 34.7 33.9 32.8 -1.1Paper and paper products .............................. 43.3 42.6 41.4 41.2 43.9 42.2 42.1 41.9 41.7 41.7 .0Printing and related support activities ........... 38.2 38.5 37.4 37.1 38.2 38.3 38.2 38.0 37.7 37.3 -.4Petroleum and coal products .......................... 42.8 44.6 44.9 45.2 43.9 45.2 44.4 45.3 45.2 45.3 .1Chemicals .......................................................... 41.3 41.3 40.9 41.1 41.4 41.5 41.3 41.1 41.2 41.1 -.1Plastics and rubber products .......................... 40.9 40.5 39.8 39.2 41.3 40.6 40.6 40.0 39.9 39.4 -.5
Private service-providing ............................. 32.1 32.0 31.8 32.3 32.4 32.3 32.2 32.2 32.2 32.2 .0
Trade, transportation, and utilities ....................... 32.9 32.9 32.4 32.7 33.3 33.1 33.0 32.9 32.9 32.8 -.1
Wholesale trade ................................................... 37.9 37.7 37.7 38.1 38.2 38.2 38.1 37.8 38.1 38.0 -.1
Retail trade ........................................................... 29.7 29.9 29.1 29.5 30.2 29.9 29.8 29.7 29.7 29.7 .0
Transportation and warehousing ...................... 36.2 36.5 35.5 35.5 36.7 36.3 36.1 36.2 36.0 35.7 -.3
Utilities ................................................................... 42.6 42.9 42.4 43.3 42.8 42.5 42.4 42.9 42.7 43.2 .5
Information ............................................................... 36.1 36.9 36.7 37.0 36.3 36.9 37.0 37.0 37.1 36.9 -.2
Financial activities .................................................. 35.6 35.7 35.9 36.8 35.8 35.9 36.1 35.9 36.2 36.2 .0
Professional and business services .................... 34.4 34.6 34.4 35.0 34.7 34.9 34.9 34.8 35.0 34.9 -.1
Education and health services ............................. 32.5 32.3 32.3 32.4 32.6 32.5 32.4 32.4 32.4 32.3 -.1
Leisure and hospitality ........................................... 25.0 24.5 24.0 25.0 25.4 25.1 25.0 25.0 24.8 25.0 .2
Other services ......................................................... 30.6 30.5 30.4 30.7 30.8 30.7 30.7 30.6 30.6 30.6 .0
1 Data relate to production workers in mining and logging and manufacturing,construction workers in construction, and nonsupervisory workersin the service-providing industries. These groups account for approximatelyfour-fifths of the total employment on private nonfarm payrolls.
2 Includes motor vehicles, motor vehicle bodies and trailers, and motorvehicle parts.
p = preliminary.
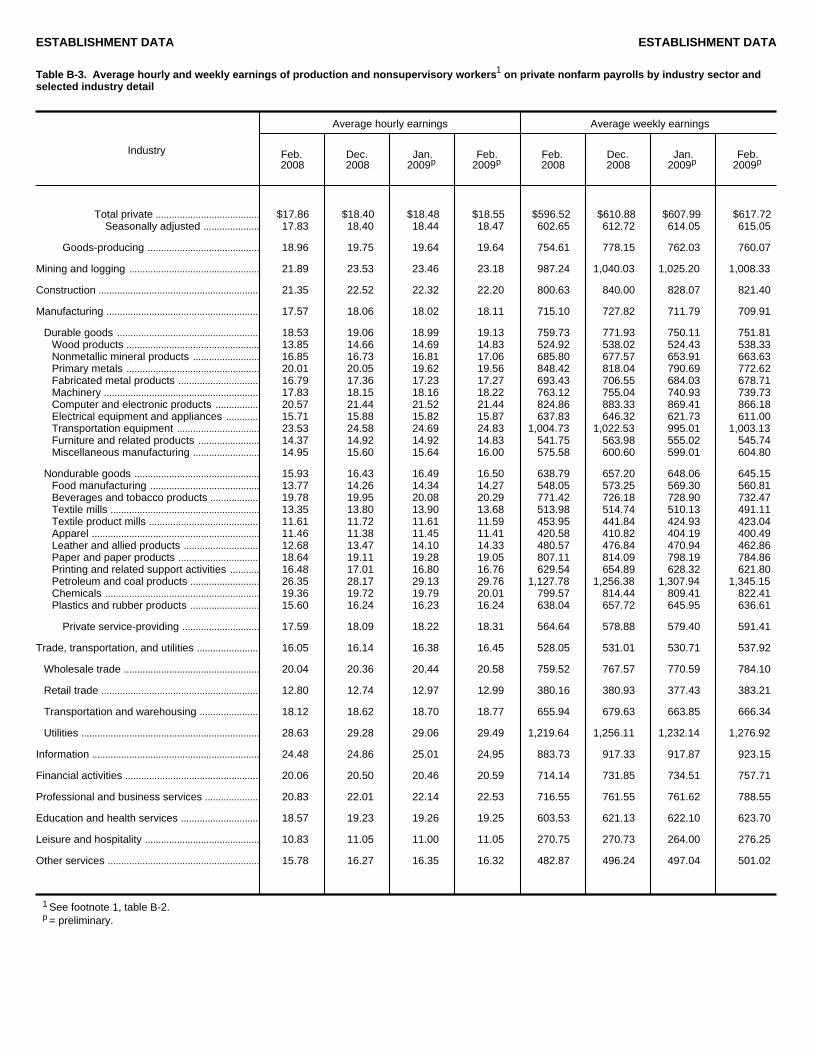
ESTABLISHMENT DATA ESTABLISHMENT DATA
Table B-3. Average hourly and weekly earnings of production and nonsupervisory workers1 on private nonfarm payrolls by industry sector and selected industry detail
Industry
Average hourly earnings Average weekly earnings
Feb. 2008
Dec. 2008
Jan. 2009p
Feb. 2009p
Feb. 2008
Dec. 2008
Jan. 2009p
Feb. 2009p
Total private ....................................... $17.86 $18.40 $18.48 $18.55 $596.52 $610.88 $607.99 $617.72Seasonally adjusted ..................... 17.83 18.40 18.44 18.47 602.65 612.72 614.05 615.05
Goods-producing .......................................... 18.96 19.75 19.64 19.64 754.61 778.15 762.03 760.07
Mining and logging ................................................. 21.89 23.53 23.46 23.18 987.24 1,040.03 1,025.20 1,008.33
Construction ............................................................ 21.35 22.52 22.32 22.20 800.63 840.00 828.07 821.40
Manufacturing ......................................................... 17.57 18.06 18.02 18.11 715.10 727.82 711.79 709.91
Durable goods ..................................................... 18.53 19.06 18.99 19.13 759.73 771.93 750.11 751.81Wood products .................................................. 13.85 14.66 14.69 14.83 524.92 538.02 524.43 538.33Nonmetallic mineral products ......................... 16.85 16.73 16.81 17.06 685.80 677.57 653.91 663.63Primary metals .................................................. 20.01 20.05 19.62 19.56 848.42 818.04 790.69 772.62Fabricated metal products .............................. 16.79 17.36 17.23 17.27 693.43 706.55 684.03 678.71Machinery .......................................................... 17.83 18.15 18.16 18.22 763.12 755.04 740.93 739.73Computer and electronic products ................ 20.57 21.44 21.52 21.44 824.86 883.33 869.41 866.18Electrical equipment and appliances ............ 15.71 15.88 15.82 15.87 637.83 646.32 621.73 611.00Transportation equipment ............................... 23.53 24.58 24.69 24.83 1,004.73 1,022.53 995.01 1,003.13Furniture and related products ....................... 14.37 14.92 14.92 14.83 541.75 563.98 555.02 545.74Miscellaneous manufacturing ......................... 14.95 15.60 15.64 16.00 575.58 600.60 599.01 604.80
Nondurable goods ............................................... 15.93 16.43 16.49 16.50 638.79 657.20 648.06 645.15Food manufacturing ......................................... 13.77 14.26 14.34 14.27 548.05 573.25 569.30 560.81Beverages and tobacco products .................. 19.78 19.95 20.08 20.29 771.42 726.18 728.90 732.47Textile mills ........................................................ 13.35 13.80 13.90 13.68 513.98 514.74 510.13 491.11Textile product mills ......................................... 11.61 11.72 11.61 11.59 453.95 441.84 424.93 423.04Apparel ............................................................... 11.46 11.38 11.45 11.41 420.58 410.82 404.19 400.49Leather and allied products ............................ 12.68 13.47 14.10 14.33 480.57 476.84 470.94 462.86Paper and paper products .............................. 18.64 19.11 19.28 19.05 807.11 814.09 798.19 784.86Printing and related support activities ........... 16.48 17.01 16.80 16.76 629.54 654.89 628.32 621.80Petroleum and coal products .......................... 26.35 28.17 29.13 29.76 1,127.78 1,256.38 1,307.94 1,345.15Chemicals .......................................................... 19.36 19.72 19.79 20.01 799.57 814.44 809.41 822.41Plastics and rubber products .......................... 15.60 16.24 16.23 16.24 638.04 657.72 645.95 636.61
Private service-providing ............................. 17.59 18.09 18.22 18.31 564.64 578.88 579.40 591.41
Trade, transportation, and utilities ....................... 16.05 16.14 16.38 16.45 528.05 531.01 530.71 537.92
Wholesale trade ................................................... 20.04 20.36 20.44 20.58 759.52 767.57 770.59 784.10
Retail trade ........................................................... 12.80 12.74 12.97 12.99 380.16 380.93 377.43 383.21
Transportation and warehousing ...................... 18.12 18.62 18.70 18.77 655.94 679.63 663.85 666.34
Utilities ................................................................... 28.63 29.28 29.06 29.49 1,219.64 1,256.11 1,232.14 1,276.92
Information ............................................................... 24.48 24.86 25.01 24.95 883.73 917.33 917.87 923.15
Financial activities .................................................. 20.06 20.50 20.46 20.59 714.14 731.85 734.51 757.71
Professional and business services .................... 20.83 22.01 22.14 22.53 716.55 761.55 761.62 788.55
Education and health services ............................. 18.57 19.23 19.26 19.25 603.53 621.13 622.10 623.70
Leisure and hospitality ........................................... 10.83 11.05 11.00 11.05 270.75 270.73 264.00 276.25
Other services ......................................................... 15.78 16.27 16.35 16.32 482.87 496.24 497.04 501.02
1 See footnote 1, table B-2.p = preliminary.

ESTABLISHMENT DATA ESTABLISHMENT DATA
Table B-4. Average hourly earnings of production and nonsupervisory workers1 on private nonfarm payrolls by industry sector and selected industry detail, seasonally adjusted
Industry
Total private:
Feb. 2008
Oct. 2008
Nov. 2008
Dec. 2008
Jan. 2009p
Feb. 2009p
Percentchange from:Jan. 2009-Feb. 2009 p
Current dollars ................................................ $17.83 $18.28 $18.34 $18.40 $18.44 $18.47 0.2Constant (1982) dollars 2................................. 8.28 8.33 8.54 8.65 8.64 N.A.
..........................................................Goods-producing 19.07 19.56 19.63 19.69 19.72 19.78 .3
.................................................................Mining and logging 21.80 23.03 23.28 23.23 23.14 23.08 -.3
............................................................................Construction 21.48 22.17 22.28 22.41 22.41 22.37 -.2
.........................................................................Manufacturing 17.58 17.89 17.94 17.96 17.99 18.10 .6.....................................................4Excluding overtime 16.75 17.15 17.25 17.33 17.38 17.52 .8
.....................................................................Durable goods 18.53 18.84 18.91 18.94 18.98 19.11 .7
...............................................................Nondurable goods 15.95 16.35 16.37 16.39 16.45 16.52 .4
.............................................Private service-providing 17.51 17.97 18.03 18.10 18.14 18.17 .2
.......................................Trade, transportation, and utilities 16.04 16.23 16.29 16.31 16.36 16.38 .1
...................................................................Wholesale trade 20.03 20.22 20.29 20.31 20.39 20.45 .3
...........................................................................Retail trade 12.81 12.89 12.93 12.94 12.97 12.97 .0
......................................Transportation and warehousing 18.21 18.58 18.66 18.66 18.74 18.74 .0
...................................................................................Utilities 28.62 28.91 28.91 29.16 29.08 29.54 1.6
...............................................................................Information 24.48 24.99 24.94 24.91 24.94 24.94 .0
..................................................................Financial activities 20.04 20.43 20.41 20.53 20.50 20.48 -.1
....................................Professional and business services 20.69 21.63 21.78 21.97 22.03 22.20 .8
.............................................Education and health services 18.60 19.08 19.13 19.20 19.22 19.27 .3
...........................................................Leisure and hospitality 10.75 10.92 10.90 10.94 10.96 10.98 .2
.........................................................................Other services 15.85 16.24 16.29 16.29 16.33 16.32 -.1
3( )
1 See footnote 1, table B-2.2 The Consumer Price Index for Urban Wage Earners and Clerical Workers
(CPI-W) is used to deflate this series.3 Change was -0.1 percent from Dec. 2008 to Jan. 2009, the latest month
available.
4 Derived by assuming that overtime hours are paid at the rate of timeand one-half.
N.A. = not available.p = preliminary.

ESTABLISHMENT DATA ESTABLISHMENT DATA
Table B-5. Indexes of aggregate weekly hours of production and nonsupervisory workers1 on private nonfarm payrolls by industry sector andselected industry detail
(2002=100)
Industry
Not seasonally adjusted Seasonally adjusted
Feb. 2008
Dec. 2008
Jan. 2009p
Feb. 2009p
Feb. 2008
Oct. 2008
Nov. 2008
Dec. 2008
Jan. 2009p
Feb. 2009p
Percentchange from:Jan. 2009-Feb. 2009p
Total private ....................................... 104.3 103.4 99.3 99.9 107.6 105.0 104.1 103.2 102.6 101.9 -0.7
Goods-producing .......................................... 95.3 89.9 84.0 82.3 100.3 93.9 92.0 90.4 88.3 86.8 -1.7
Mining and logging ................................................. 130.9 138.1 132.8 130.8 136.9 140.6 143.2 139.1 139.7 138.1 -1.1
Construction ............................................................ 100.3 95.9 88.2 85.6 111.7 104.1 100.5 99.8 97.7 96.7 -1.0
Manufacturing ......................................................... 91.4 85.1 80.3 78.5 93.5 87.4 86.0 84.0 81.8 80.2 -2.0
Durable goods ..................................................... 94.3 86.2 80.3 78.5 96.3 88.5 87.1 84.6 81.7 79.9 -2.2Wood products .................................................. 78.0 66.5 60.7 58.8 83.0 72.7 70.5 66.7 64.2 62.2 -3.1Nonmetallic mineral products ......................... 87.2 81.8 74.2 72.2 94.8 89.6 86.3 84.0 81.0 79.0 -2.5Primary metals .................................................. 90.2 79.1 75.7 70.3 90.8 84.7 81.5 78.1 75.1 71.1 -5.3Fabricated metal products .............................. 103.2 95.2 89.4 86.4 105.1 98.1 96.6 93.8 90.2 87.5 -3.0Machinery .......................................................... 104.4 96.6 91.3 88.4 105.4 99.6 96.7 94.8 91.8 89.1 -2.9Computer and electronic products ................ 100.6 99.5 96.1 93.7 102.1 99.3 99.7 96.8 96.7 94.2 -2.6Electrical equipment and appliances ............ 87.5 86.2 81.9 78.4 89.2 87.3 86.1 83.8 82.2 79.6 -3.2Transportation equipment ............................... 95.7 81.4 71.8 73.8 96.4 81.0 81.0 79.0 73.5 73.6 .1
2Motor vehicles and parts .............................. 81.7 63.9 51.4 53.3 82.0 66.3 63.9 61.3 53.6 53.2 -.7Furniture and related products ....................... 77.6 67.0 63.2 60.7 79.9 69.7 67.4 66.1 64.4 62.3 -3.3Miscellaneous manufacturing ......................... 88.9 87.0 84.3 83.0 89.9 89.0 87.1 85.9 85.3 84.3 -1.2
Nondurable goods ............................................... 86.5 83.4 79.8 78.6 88.7 85.7 84.2 82.8 81.8 80.5 -1.6Food manufacturing ......................................... 97.5 99.9 96.4 94.8 101.9 100.4 99.3 98.6 98.7 98.4 -.3Beverages and tobacco products .................. 85.5 86.9 84.8 83.9 90.6 91.4 91.6 89.3 90.3 89.7 -.7Textile mills ........................................................ 51.0 40.7 39.6 37.7 51.7 45.3 42.6 40.7 40.0 38.5 -3.8Textile product mills ......................................... 71.7 66.1 61.9 60.3 72.7 68.3 67.5 65.0 63.4 61.9 -2.4Apparel ............................................................... 58.4 51.0 47.4 47.6 59.1 54.9 52.7 51.3 49.5 48.8 -1.4Leather and allied products ............................ 68.3 64.1 60.0 55.2 69.9 69.3 62.0 62.5 60.7 57.6 -5.1Paper and paper products .............................. 84.5 81.4 77.4 75.3 86.1 81.5 80.9 79.8 78.2 76.9 -1.7Printing and related support activities ........... 87.6 82.1 77.6 75.9 88.4 83.9 82.5 80.6 78.9 76.9 -2.5Petroleum and coal products .......................... 95.8 94.4 87.4 86.5 101.7 102.8 98.6 98.4 93.6 91.8 -1.9Chemicals .......................................................... 94.5 92.1 89.9 90.5 95.1 94.0 93.4 91.8 91.4 90.8 -.7Plastics and rubber products .......................... 89.1 81.0 76.9 74.8 90.8 85.1 82.9 80.2 78.2 76.1 -2.7
Private service-providing ............................. 106.8 107.1 103.6 104.8 109.6 108.2 107.5 107.0 106.7 106.2 -.5
Trade, transportation, and utilities ....................... 102.0 103.4 97.8 97.3 105.2 102.4 101.4 100.6 100.2 99.3 -.9
Wholesale trade ................................................... 107.9 105.6 103.4 103.5 110.0 108.0 107.0 105.5 105.5 104.4 -1.0
Retail trade ........................................................... 98.1 101.8 94.2 93.9 102.0 98.9 97.9 97.1 96.9 96.6 -.3
Transportation and warehousing ...................... 106.9 106.7 100.5 98.7 109.8 106.1 104.5 104.2 102.7 100.6 -2.0
Utilities ................................................................... 96.6 99.8 99.3 101.2 97.6 98.8 98.7 100.2 100.2 101.6 1.4
Information ............................................................... 99.3 99.9 97.3 97.8 100.2 100.8 100.2 99.6 99.1 98.1 -1.0
Financial activities .................................................. 106.6 105.6 104.8 106.9 108.0 107.4 107.3 106.2 106.5 106.0 -.5
Professional and business services .................... 112.1 110.5 106.1 106.9 115.5 112.9 112.0 110.8 110.5 108.8 -1.5
Education and health services ............................. 115.0 117.4 116.1 117.8 114.7 116.5 116.6 116.9 117.2 117.0 -.2
Leisure and hospitality ........................................... 104.5 103.2 98.2 102.2 111.2 109.0 108.2 107.8 106.7 107.3 .6
Other services ......................................................... 98.1 97.3 95.8 96.9 99.8 99.7 99.1 98.3 98.0 97.7 -.3
1 See footnote 1, table B-2.2 Includes motor vehicles, motor vehicle bodies and trailers, and
motor vehicle parts.p = preliminary.NOTE: The index of aggregate weekly hours are calculated by dividing
the current months estimates of aggregate hours by thecorresponding 2002 annual average levels. Aggregate hours estimatesare the product of estimates of average weekly hours and productionand nonsupervisory worker employment.
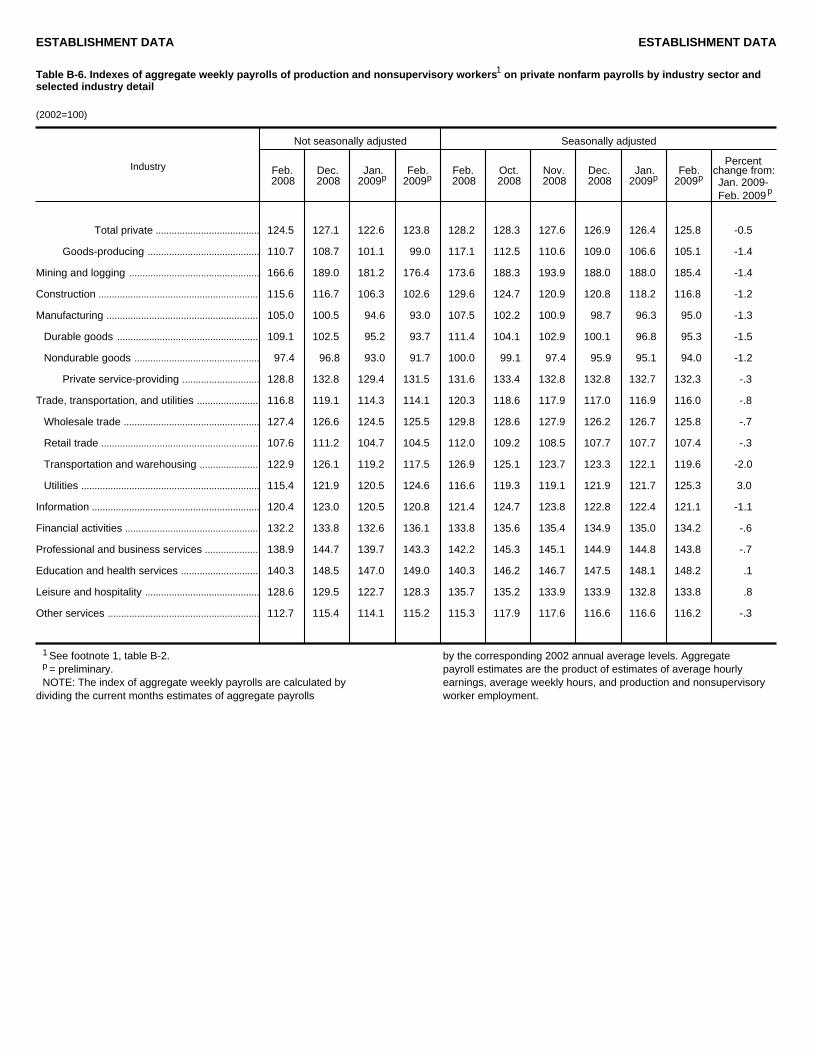
ESTABLISHMENT DATA ESTABLISHMENT DATA
Table B-6. Indexes of aggregate weekly payrolls of production and nonsupervisory workers1 on private nonfarm payrolls by industry sector andselected industry detail
(2002=100)
Industry
Not seasonally adjusted Seasonally adjusted
Feb. 2008
Dec. 2008
Jan. 2009p
Feb. 2009p
Feb. 2008
Oct. 2008
Nov. 2008
Dec. 2008
Jan. 2009p
Feb. 2009p
Percentchange from:Jan. 2009-Feb. 2009p
.......................................Total private 124.5 127.1 122.6 123.8 128.2 128.3 127.6 126.9 126.4 125.8 -0.5
..........................................Goods-producing 110.7 108.7 101.1 99.0 117.1 112.5 110.6 109.0 106.6 105.1 -1.4
.................................................Mining and logging 166.6 189.0 181.2 176.4 173.6 188.3 193.9 188.0 188.0 185.4 -1.4
............................................................Construction 115.6 116.7 106.3 102.6 129.6 124.7 120.9 120.8 118.2 116.8 -1.2
.........................................................Manufacturing 105.0 100.5 94.6 93.0 107.5 102.2 100.9 98.7 96.3 95.0 -1.3
.....................................................Durable goods 109.1 102.5 95.2 93.7 111.4 104.1 102.9 100.1 96.8 95.3 -1.5
...............................................Nondurable goods 97.4 96.8 93.0 91.7 100.0 99.1 97.4 95.9 95.1 94.0 -1.2
.............................Private service-providing 128.8 132.8 129.4 131.5 131.6 133.4 132.8 132.8 132.7 132.3 -.3
.......................Trade, transportation, and utilities 116.8 119.1 114.3 114.1 120.3 118.6 117.9 117.0 116.9 116.0 -.8
...................................................Wholesale trade 127.4 126.6 124.5 125.5 129.8 128.6 127.9 126.2 126.7 125.8 -.7
...........................................................Retail trade 107.6 111.2 104.7 104.5 112.0 109.2 108.5 107.7 107.7 107.4 -.3
......................Transportation and warehousing 122.9 126.1 119.2 117.5 126.9 125.1 123.7 123.3 122.1 119.6 -2.0
...................................................................Utilities 115.4 121.9 120.5 124.6 116.6 119.3 119.1 121.9 121.7 125.3 3.0
...............................................................Information 120.4 123.0 120.5 120.8 121.4 124.7 123.8 122.8 122.4 121.1 -1.1
..................................................Financial activities 132.2 133.8 132.6 136.1 133.8 135.6 135.4 134.9 135.0 134.2 -.6
....................Professional and business services 138.9 144.7 139.7 143.3 142.2 145.3 145.1 144.9 144.8 143.8 -.7
.............................Education and health services 140.3 148.5 147.0 149.0 140.3 146.2 146.7 147.5 148.1 148.2 .1
...........................................Leisure and hospitality 128.6 129.5 122.7 128.3 135.7 135.2 133.9 133.9 132.8 133.8 .8
.........................................................Other services 112.7 115.4 114.1 115.2 115.3 117.9 117.6 116.6 116.6 116.2 -.3
1 See footnote 1, table B-2.p = preliminary.NOTE: The index of aggregate weekly payrolls are calculated by
dividing the current months estimates of aggregate payrolls
by the corresponding 2002 annual average levels. Aggregatepayroll estimates are the product of estimates of average hourlyearnings, average weekly hours, and production and nonsupervisoryworker employment.
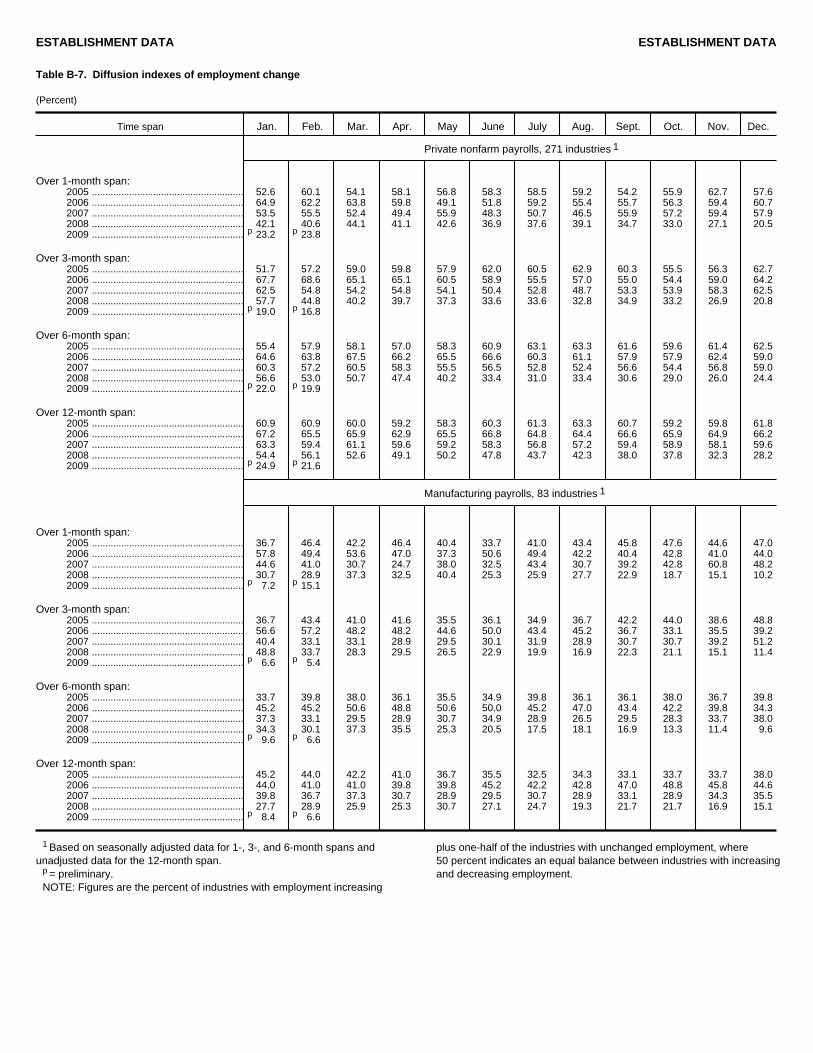
ESTABLISHMENT DATA ESTABLISHMENT DATA
Table B-7. Diffusion indexes of employment change
(Percent)
Jan. Feb. Mar. Apr. May June July Aug. Sept. Oct. Nov. Dec.
Private nonfarm payrolls, 271 industries
Manufacturing payrolls, 83 industries
1
1
Over 1-month span:
Over 3-month span:
Over 6-month span:
Over 12-month span:
Over 1-month span:
Over 3-month span:
Over 6-month span:
Over 12-month span:
Time span
2005 ......................................................... 52.6 60.1 54.1 58.1 56.8 58.3 58.5 59.2 54.2 55.9 62.7 57.62006 ......................................................... 64.9 62.2 63.8 59.8 49.1 51.8 59.2 55.4 55.7 56.3 59.4 60.72007 ......................................................... 53.5 55.5 52.4 49.4 55.9 48.3 50.7 46.5 55.9 57.2 59.4 57.92008 ......................................................... 42.1 40.6 44.1 41.1 42.6 36.9 37.6 39.1 34.7 33.0 27.1 20.52009 ......................................................... p 23.2 p 23.8
2005 ......................................................... 51.7 57.2 59.0 59.8 57.9 62.0 60.5 62.9 60.3 55.5 56.3 62.72006 ......................................................... 67.7 68.6 65.1 65.1 60.5 58.9 55.5 57.0 55.0 54.4 59.0 64.22007 ......................................................... 62.5 54.8 54.2 54.8 54.1 50.4 52.8 48.7 53.3 53.9 58.3 62.52008 ......................................................... 57.7 44.8 40.2 39.7 37.3 33.6 33.6 32.8 34.9 33.2 26.9 20.82009 ......................................................... p 19.0 p 16.8
2005 ......................................................... 55.4 57.9 58.1 57.0 58.3 60.9 63.1 63.3 61.6 59.6 61.4 62.52006 ......................................................... 64.6 63.8 67.5 66.2 65.5 66.6 60.3 61.1 57.9 57.9 62.4 59.02007 ......................................................... 60.3 57.2 60.5 58.3 55.5 56.5 52.8 52.4 56.6 54.4 56.8 59.02008 ......................................................... 56.6 53.0 50.7 47.4 40.2 33.4 31.0 33.4 30.6 29.0 26.0 24.42009 ......................................................... p 22.0 p 19.9
2005 ......................................................... 60.9 60.9 60.0 59.2 58.3 60.3 61.3 63.3 60.7 59.2 59.8 61.82006 ......................................................... 67.2 65.5 65.9 62.9 65.5 66.8 64.8 64.4 66.6 65.9 64.9 66.22007 ......................................................... 63.3 59.4 61.1 59.6 59.2 58.3 56.8 57.2 59.4 58.9 58.1 59.62008 ......................................................... 54.4 56.1 52.6 49.1 50.2 47.8 43.7 42.3 38.0 37.8 32.3 28.22009 ......................................................... p 24.9 p 21.6
2005 ......................................................... 36.7 46.4 42.2 46.4 40.4 33.7 41.0 43.4 45.8 47.6 44.6 47.02006 ......................................................... 57.8 49.4 53.6 47.0 37.3 50.6 49.4 42.2 40.4 42.8 41.0 44.02007 ......................................................... 44.6 41.0 30.7 24.7 38.0 32.5 43.4 30.7 39.2 42.8 60.8 48.22008 ......................................................... 30.7 28.9 37.3 32.5 40.4 25.3 25.9 27.7 22.9 18.7 15.1 10.22009 ......................................................... p 7.2 p 15.1
2005 ......................................................... 36.7 43.4 41.0 41.6 35.5 36.1 34.9 36.7 42.2 44.0 38.6 48.82006 ......................................................... 56.6 57.2 48.2 48.2 44.6 50.0 43.4 45.2 36.7 33.1 35.5 39.22007 ......................................................... 40.4 33.1 33.1 28.9 29.5 30.1 31.9 28.9 30.7 30.7 39.2 51.22008 ......................................................... 48.8 33.7 28.3 29.5 26.5 22.9 19.9 16.9 22.3 21.1 15.1 11.42009 ......................................................... p 6.6 p 5.4
2005 ......................................................... 33.7 39.8 38.0 36.1 35.5 34.9 39.8 36.1 36.1 38.0 36.7 39.82006 ......................................................... 45.2 45.2 50.6 48.8 50.6 50.0 45.2 47.0 43.4 42.2 39.8 34.32007 ......................................................... 37.3 33.1 29.5 28.9 30.7 34.9 28.9 26.5 29.5 28.3 33.7 38.02008 ......................................................... 34.3 30.1 37.3 35.5 25.3 20.5 17.5 18.1 16.9 13.3 11.4 9.62009 ......................................................... p 9.6 p 6.6
2005 ......................................................... 45.2 44.0 42.2 41.0 36.7 35.5 32.5 34.3 33.1 33.7 33.7 38.02006 ......................................................... 44.0 41.0 41.0 39.8 39.8 45.2 42.2 42.8 47.0 48.8 45.8 44.62007 ......................................................... 39.8 36.7 37.3 30.7 28.9 29.5 30.7 28.9 33.1 28.9 34.3 35.52008 ......................................................... 27.7 28.9 25.9 25.3 30.7 27.1 24.7 19.3 21.7 21.7 16.9 15.12009 ......................................................... p 8.4 p 6.6
1 Based on seasonally adjusted data for 1-, 3-, and 6-month spans andunadjusted data for the 12-month span.
p = preliminary.NOTE: Figures are the percent of industries with employment increasing
plus one-half of the industries with unchanged employment, where50 percent indicates an equal balance between industries with increasingand decreasing employment.
Related Documents


