The Emerging Risk Environment in China Dr. Guangping (Peter G.) Zhang Deputy Director General China Banking Regulatory Commissio n Shanghai Bureau Asia-Pacific Finance and Developme nt Center June 18, 2008

The Emerging Risk Environment in China Dr. Guangping (Peter G.) Zhang Deputy Director General China Banking Regulatory Commission Shanghai Bureau Asia-Pacific.
Dec 21, 2015
Welcome message from author
This document is posted to help you gain knowledge. Please leave a comment to let me know what you think about it! Share it to your friends and learn new things together.
Transcript

The Emerging Risk Environment in China
Dr. Guangping (Peter G.) ZhangDeputy Director General
China Banking Regulatory CommissionShanghai Bureau
Asia-Pacific Finance and Development CenterJune 18, 2008

Major Contents Risk Management Instruments in ChinaOn-shore Products
FX Forwards (Merchant & Inter-bank), FX Swaps, Bond Forwards, IRS, Stock Warrants
Off-shore Products Foreign CNY Derivatives
Non-deliverable Forwards (NDF), Non-deliverable Options (NDO), Non-deliverable IRS (NIRS),H share stocks, Index futures and Options
Risk Management Supervision & Related Issues BASEL II Implementation Difficulties for Risk Management Practices in China Lack of Options Market and Implied Volatilities Low Liquidities of OTC Products Product Design & Pricing

CNY Forwards (Merchant)
PBOC: “The Tentative Administrative Methods for RMB Forward Settlement” January 18, 1997
BOC: April 1st , 1997
CCB: April, 2003
ICBC: April, 2003
ABC : April, 2003

China Foreign Exchange Trade Center (CFETCS)
China Foreign Exchange Trade Center (CFETCS) was authorized to trade CNY forwards on August 15, 2005
CNY/USDCNY/JPYCNY/HKDCNY/Euro

China Foreign Exchange Trade Center (CFETCS)
Trading has not been active at CFETCS,Trading turnover in
1Q2006 RMB3420 million (430 million USD); 2Q2006 RMB7210 million (900 million USD)3Q2006 RMB31.5 billion (3.98 biillion USD)4Q2006 8.75 billion USD1Q2007 5.323 billion USD 2Q2007 5.347 billion USD3Q2007 4.323 billion USD4Q2007 7.391 billion USD2006 $14.06 billion; 2007 $22.384 billion

Liquidity of CNY Forwards (Merchant)BIS 2007: Daily Average FX Trading in April 2007 $9 billion (spot, forwards and swaps 61.4%, 31.3% and 7.4%), thusTotal forwards 9*31.3% = $2.817 billion daily average in April 2007, $59.157 billion in April 2007; April 2007 Forwards Inter-bank = $1.996; thus April 2007 forwards merchant trading 59.157-1.996 = $57.161 billion in April 2007; total forwards merchant around $680 billion for 2007, total forwards including inter-bank about $703 billion for 2007, or about 32.3% of total trade value of $2.175 trillion in 2007, compared to international ratio around 150%

Foreign Exchange Swaps Trading
3Q2006 15.6 billion USD4Q2006 31.4 billion USD 2006 50.9 billion USD1Q2007 55.7 billion USD 2Q2007 77.7 billion USD3Q2007 100.6 billion USD4Q2007 81.58 billion USD2007 total $315.58 billionMerely 17.6% of daily FX swaps trading
in April 2007

Other CNY Derivatives in China
• Interest Rate Swaps– SHIBOR Swaps
• Bond Forwards Wealth Management Products Deposits with embedded options Deposits linked to Libor, commodity
indexes, stock indexes, etc.

IRS Trading
CNY (billion) $ billion
1Q2007 39.364 5.18 2Q2007 63.902 8.41 3Q2007 62.253 8.19 4Q2007 53.171 6.99
2007 218.69 28.77

Offshore CNY Derivative Products
Non-deliverable Forwards NDF
Non-deliverable Options NDO
Non-deliverable Forward Options NDFO
Non-deliverable CNY Swaps NDS
Non-deliverable FX Swaps
Non-deliverable IRS NIRS
Structured Notes
Deposits with embedded Options

CNY NDF-most Popular Product offshoreCame into existence in 1996 before Asian financial crisis, yet liquidity was extremely low
Liquidity began to pick up late in 2002
Trading turnover estimated around US$150- 180 billion in 2003 & 2004!
around US$250 billion in 2005
around US$300 billion in 2006
around US$360 billion in 2007

Revaluation Pips
(9000)(8000)(7000)(6000)(5000)(4000)(3000)(2000)(1000)
2002
-12-
2
2003
-4-2
2003
-8-2
2003
-12-
2
2004
-4-2
2004
-8-2
2004
-12-
2
2005
-4-2
2005
-8-2
2005
-12-
2
2006
-4-2
2006
-8-2
2006
-12-
2
2007
-4-2
2007
-8-2
2007
-12-
2
2008
-4-2

CNY/USD Historical Volatilities
0. 000. 020. 040. 060. 080. 100. 120. 140. 160. 180. 20
01-2
-6
01-5
-6
01-8
-6
01-1
1-6
02-2
-6
02-5
-6
02-8
-6
02-1
1-6
03-2
-6
03-5
-6
03-8
-6
03-1
1-6
04-2
-6

CNY/USD Historical Volatilities
0. 0%0. 5%1. 0%1. 5%2. 0%2. 5%3. 0%3. 5%4. 0%4. 5%5. 0%20
05-8
-5
2005
-11-
5
2006
-2-5
2006
-5-5
2006
-8-5
2006
-11-
5
2007
-2-5
2007
-5-5
2007
-8-5
2007
-11-
5
2008
-2-5
2008
-5-5

CNY/USD Historical VolatilitiesCompared to Euro & Yen Vols
0%10%20%30%40%50%60%70%80%
2005
-8-5
2005
-10-
5
2005
-12-
5
2006
-2-5
2006
-4-5
2006
-6-5
2006
-8-5
2006
-10-
5
2006
-12-
5
2007
-2-5
2007
-4-5
2007
-6-5
2007
-8-5
2007
-10-
5
2007
-12-
5
2008
-2-5
2008
-4-5
2008
-6-5

Appreciation and Further Expectation for RMB
2%4%6%8%
10%12%14%16%18%20%22%24%26%28%30%
2005
-8-1
2005
-10-
1
2005
-12-
1
2006
-2-1
2006
-4-1
2006
-6-1
2006
-8-1
2006
-10-
1
2006
-12-
1
2007
-2-1
2007
-4-1
2007
-6-1
2007
-8-1
2007
-10-
1
2007
-12-
1
2008
-2-1
2008
-4-1
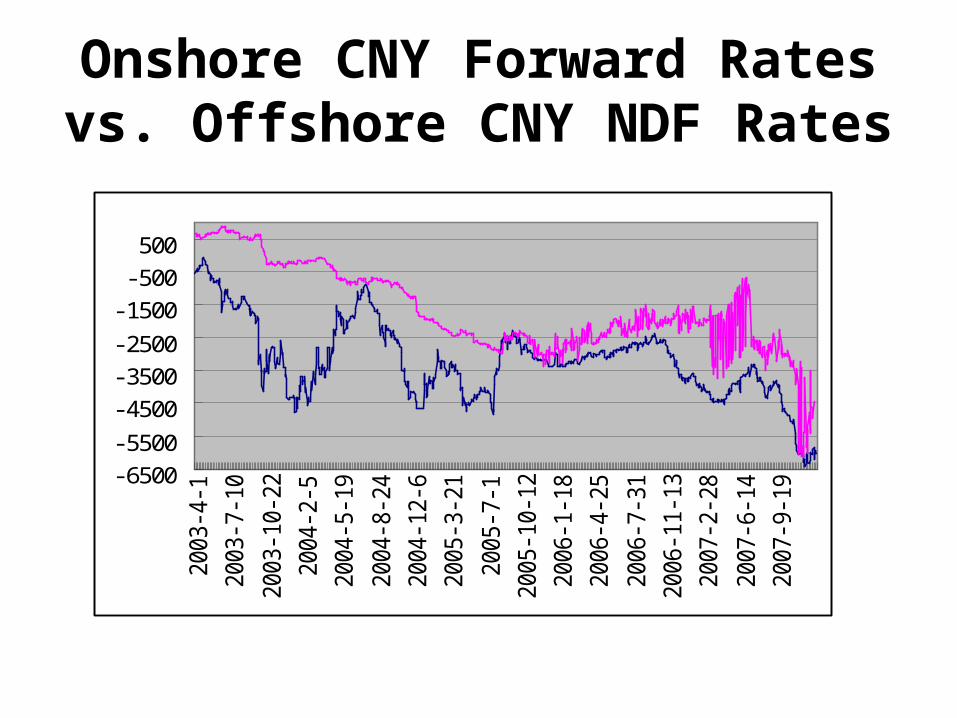
Onshore CNY Forward Rates vs. Offshore CNY NDF Rates
-6500-5500
-4500-3500-2500
-1500-500500
2003
-4-1
2003
-7-1
0
2003
-10-
22
2004
-2-5
2004
-5-1
9
2004
-8-2
4
2004
-12-
6
2005
-3-2
1
2005
-7-1
2005
-10-
12
2006
-1-1
8
2006
-4-2
5
2006
-7-3
1
2006
-11-
13
2007
-2-2
8
2007
-6-1
4
2007
-9-1
9

BASEL II Implementation in China
Major Chinese Banks are Required to Implement BASEL II by 2010
Market Risk Management
Credit Risk Management

Future Market DemandHedging CNY FX Risk
-Steady Growth of Foreign Trade
-Expansion of QDIIs
-International Investments
-Foreign Participation of Domestic Capital Market, Banking Industry
Need to Develop the Options Market

Challenges for Market Risk Management in China
• Construction of reliable Yield Curve
• Interest Rate Liberalization
• Structuring and Pricing Capacity
• Market Risk Management Models (VaR)

Challenges for Market Risk Management in China
• Lack of Exchange Trade Options
• No Implied Volatilities
• Low Liquidity of Existing Products

Comparisons with Indian Rupee Derivatives Markets
Average Daily Trading Value of Foreign Exchange in China & India
Foreign Exchange Trading ($billion)
SpotsOutright
Forwards
Foreign Exchan
ge Swaps
China 9 5.53 2.82 0.67
India 34 14.48 9.35 10.13
China 61.4% 31.3% 7.4%
India 42.6% 27.5% 29.8%
Word 3210 32.6% 11.7% 55.6%
Average Daily IR derivatives in April$ 1 billion in 2004 and $ 3 billion in 2007, India,
---in China

“Exotic Options” 1997(1st),1998(2nd), 2008(3rd)
“Chinese Yuan Derivative Products”(English,400p)
World ScientificOctober 2004 (Peter G. Zhang)
Chinese Yuan Derivative Products
China Financial Press (in Chinese,900p), May 2006;
2nd Edition (around 1300p), April 2008

Thank You!
Related Documents


