The Emergence and Effects of the Ultra-Low Cost Carrier (ULCC) Business Model in the U.S. Airline Industry Alexander R. Bachwich a,* , Michael D. Wittman a a Massachusetts Institute of Technology, International Center for Air Transportation 77 Massachusetts Avenue, Building 35-217, Cambridge, MA 02139 Abstract The effects of “low-cost carriers” (LCCs) such as Southwest Airlines and JetBlue Airways on the competitive landscape of the U.S. airline industry have been thoroughly documented in the academic literature and the popular press. However, the more recent emergence of another distinct airline business model—the “ultra-low-cost carrier” (ULCC)—has received considerably less attention. By focusing on cost efficiencies and unbundled service offerings, the ULCCs have been able to undercut the fares of both traditional network and low-cost carriers in the markets they serve. In this paper, we conduct an analysis of ULCCs in the U.S. aviation industry and demonstrate how these carriers’ business models, costs, and effects on air transportation markets differ from those of the traditional LCCs. We first describe the factors that have enabled ULCCs to achieve a cost advantage over traditional LCCs and network legacy carriers. Then, using econometric models, we examine the effects of ULCC and LCC presence, entry, and exit on base airfares in 3,004 U.S. air transportation markets from 2010 – 2015. We find that in 2015, ULCC presence in a market was associated with market base fares 21% lower than average, as compared to an 8% average reduction for LCC presence. We also find that while ULCC and LCC entry both result in a 14% average reduction in fares one year after entry, ULCCs are three times as likely to abandon a market within two years of entry than are the LCCs. The results suggest that the ULCCs represent a distinct business model from traditional LCCs and that as the ULCCs grow, they will continue to play a unique and increasingly important role in the U.S. airline industry. Keywords: ultra-low-cost carriers, low-cost carriers, airline business models, market entry, market presence, airline costs 1. Introduction For decades, the U.S. airline industry has been undeniably shaped by the growth of “low- cost carriers” (LCCs) like Southwest Airlines and JetBlue Airways. With lower unit costs than traditional network legacy carriers like American Airlines and Delta Air Lines, LCCs have been * Corresponding author. Tel: +1 617 253 1820 Email addresses: [email protected] (Alexander R. Bachwich), [email protected] (Michael D. Wittman) Preprint submitted to Elsevier October 17, 2016

Welcome message from author
This document is posted to help you gain knowledge. Please leave a comment to let me know what you think about it! Share it to your friends and learn new things together.
Transcript
The Emergence and Effects of the Ultra-Low Cost Carrier (ULCC)Business Model in the U.S. Airline Industry
Alexander R. Bachwicha,∗, Michael D. Wittmana
aMassachusetts Institute of Technology, International Center for Air Transportation77 Massachusetts Avenue, Building 35-217, Cambridge, MA 02139
Abstract
The effects of “low-cost carriers” (LCCs) such as Southwest Airlines and JetBlue Airwayson the competitive landscape of the U.S. airline industry have been thoroughly documented inthe academic literature and the popular press. However, the more recent emergence of anotherdistinct airline business model—the “ultra-low-cost carrier” (ULCC)—has received considerablyless attention. By focusing on cost efficiencies and unbundled service offerings, the ULCCs havebeen able to undercut the fares of both traditional network and low-cost carriers in the marketsthey serve.
In this paper, we conduct an analysis of ULCCs in the U.S. aviation industry and demonstratehow these carriers’ business models, costs, and effects on air transportation markets differ fromthose of the traditional LCCs. We first describe the factors that have enabled ULCCs to achievea cost advantage over traditional LCCs and network legacy carriers. Then, using econometricmodels, we examine the effects of ULCC and LCC presence, entry, and exit on base airfares in3,004 U.S. air transportation markets from 2010 – 2015. We find that in 2015, ULCC presence ina market was associated with market base fares 21% lower than average, as compared to an 8%average reduction for LCC presence. We also find that while ULCC and LCC entry both result ina 14% average reduction in fares one year after entry, ULCCs are three times as likely to abandon amarket within two years of entry than are the LCCs. The results suggest that the ULCCs representa distinct business model from traditional LCCs and that as the ULCCs grow, they will continueto play a unique and increasingly important role in the U.S. airline industry.
Keywords: ultra-low-cost carriers, low-cost carriers, airline business models, market entry,
market presence, airline costs
1. Introduction
For decades, the U.S. airline industry has been undeniably shaped by the growth of “low-
cost carriers” (LCCs) like Southwest Airlines and JetBlue Airways. With lower unit costs than
traditional network legacy carriers like American Airlines and Delta Air Lines, LCCs have been
∗Corresponding author. Tel: +1 617 253 1820Email addresses: [email protected] (Alexander R. Bachwich), [email protected] (Michael D. Wittman)
Preprint submitted to Elsevier October 17, 2016
able to offer lower fares in the markets they serve and operate business models that are markedly
different than their legacy counterparts (Windle and Dresner, 1999; Morrison, 2001; Tretheway,
2004; Gillen, 2005; Hofer et al., 2008). As LCCs matured, they continued to grow in size—the
number of airports with LCC market share of over 20% nearly quadrupled between 1990 and 2008
(ben Abda et al., 2008). Today, Southwest Airlines rivals the legacy U.S. carriers in both fleet size
and passenger traffic, and recent studies have shown that as LCC costs have continued to rise, their
pricing power in air transportation markets has started to wane (Wittman and Swelbar, 2013; bin
Salam and McMullen, 2013).
While dozens of academic studies and several books have examined the rise of LCCs in the
United States and across the world, significantly less attention has been paid to a new airline
business model that has emerged in the United States over the last decade: the ultra-low-cost
carrier (ULCC). As the costs of traditional LCCs continued to increase and as their business
models started to converge with those of the traditional network carriers (Tsoukalas et al., 2008),
the ULCCs—Allegiant Air, Spirit Airlines, and Frontier Airlines—have filled the void that the
LCCs left in the low-fare sector of the U.S. airline industry. By keeping their labor costs low,
unbundling their fare products, and focusing on strategies that increase return on invested capital,
ULCCs have been able to offer low base fares in the markets they serve. Customers have responded
to these low fare offerings, and in recent years, these three carriers were among the most profitable
in the nation and have had the highest domestic load factors among U.S. airlines (Nicas, 2012,
2013).
Yet despite their increasingly significant role in the U.S. airline industry, even many recent
studies on the U.S. airline industry continue to either ignore ULCCs or group these carriers together
with traditional LCCs like Southwest and JetBlue (de Wit and Zuidberg, 2012; Chang and Yu,
2014), suggesting that the ULCC business model remains poorly defined and unrecognized in the
academic and business literature.
In this paper, we provide the first in-depth analysis of the ultra-low cost carrier business model
in the United States, and show how this model differs in cost and revenue strategies from those
of traditional LCCs and network legacy carriers (NLCs). We discuss the factors that have allowed
ULCCs to achieve and retain a significant cost advantage over the traditional LCCs and the NLCs.
Then, using data on ULCC and LCC market presence, entry, and exit outcomes over a six-year
period, and market airfares from 2010-2015, we show that ULCC presence has a significantly greater
effect on reducing average base fares in U.S. domestic airline markets than presence by the more
mature LCCs.
The remainder of the paper is structured as follows: in Section 2, we review the history of
ULCCs in the United States and describe their key characteristics. We focus on the strategic
decisions that have enabled the ULCCs to create a cost advantage over traditional LCCs in the
United States. In Section 3, we use econometric models to estimate the effects of LCC and ULCC
presence and entry on market prices in 3,004 origin-destination markets over a six year period from
2
2010-2015. Section 4 concludes and discusses how the ULCC model can be factored into future
analyses of the U.S. airline industry.
2. Emergence of the ULCC business model
2.1. Background
The term “Ultra-Low-Cost Carrier” has become increasingly commonplace in the U.S. airline
industry since being popularized by Spirit Airlines’ former CEO Ben Baldanza in 2010. U.S. carriers
such as Frontier Airlines, Spirit Airlines, and Allegiant Air have been referred to as ULCCs by
media outlets such as the Wall Street Journal and Forbes (Nicas, 2012; Martin, 2016). In a 2014
report, the U.S. Government Accountability Office (GAO) noted that Spirit and Allegiant are often
referred to as ULCCs, in part due to their lower base fares and their high fees for ancillary services.
(GAO, 2014).
Other attempts to define ULCCs have relied on qualitative characteristics such as a strategic
focus on price (vs. passenger experience), or lack of interline agreements (Thomas and Catlin,
2014). However, these qualitative characteristics do not allow us to distinctly define ULCCs. For
instance, Southwest does not maintain interline agreements, much like ULCCs, but Southwest’s
business model is different in other ways from ULCCs such as Spirit.
In this section, we provide a brief outline of the evolution of the ULCC business model, from
its beginnings with Ryanair in the early 1990s. We also propose a comprehensive definition of the
ULCC model, wherein: (1) ULCCs achieve significantly lower costs than LCCs or other network
carriers; (2) ULCCs agressively collect ancillary revenue for unbundled services; and (3) ULCCs
lag LCCs in total system unit revenue, despite their collection of ancillary revenue. Through an
analysis of U.S. carriers, we find that in 2015 three carriers meet these criteria: Allegiant, Frontier,
and Spirit.
As noted in the introduction, there is limited literature on ULCCs, and only a small subset of
this work focuses on carriers in the United States. In a study of European airlines, Klophaus et
al. (2012) recognize that there exists significant heterogeneity of business models within the LCC
segment. They define a quantitative consolidated LCC index that can be used to classify carriers
based on their adherence to core facets of the LCC business model, e.g. fleet homogeneity, checked
baggage fees, and simplified fare structures. The highest scoring airlines on the index, including
Ryanair and Wizz Air, were referred to as “pure LCCs,” which would be similar to the ULCC
model in the U.S.
In the United States, one of the few papers focusing on a ULCC specifically is Rosenstein
(2013), who argues in a case study that Spirit Airlines has diverged from traditional LCCs such as
Southwest Airlines on the basis of Spirit’s extremely low “unbundled” fares and their aggressive
collection of ancillary revenues. Jiang (2014) highlights ULCCs as a separate category in an
3
analysis of airline productivity and cost performance, but does not provide a framework for the
classification of carriers into the three types studied: ULCCs, LCCs, and Network Legacy Carriers
(NLCs). Only a basic qualitative analysis is used to classify airlines into these categories, similar
to the methods used in the GAO report (GAO, 2014).
2.2. Evolution of the ULCC model
In order to understand how the ULCC business model has evolved into its present form, it is
useful to examine the development of the LCC business model, as parallels can be drawn between
the origins of the two models. Since the deregulation of the U.S. airline industry in 1978, airlines
have been able to compete on both price and frequency in domestic markets. This new freedom
was a major contributing factor to the well-documented rise of the LCC business model in the
United States, starting with Southwest Airlines’ expansion in the 1980s (Francis et al., 2006; ben
Abda et al., 2008; Gross and Luck, 2013). By streamlining operations (i.e. operating a single
fleet type, developing point-to-point networks, etc.), LCCs were able to achieve lower unit costs
than NLCs. This enabled the LCCs to offer lower fares while, in most cases, still maintaining
profitability. Some LCCs developed innovative policies to increase revenue by charging for services
that were provided free of charge by network carriers. For example, People Express, founded in
1981, introduced a $3 checked baggage fee and charged for onboard snack/meal service (Gross and
Luck, 2013). Arguably, carriers like People Express were the first to incorporate some aspects of
the ULCC model, such as the generation of additional revenues through ancillary fees.
However, the first airline to sustainably operate using a ULCC-like model was not in United
States, but in Europe. In the early 1990s, facing losses, the Irish carrier Ryanair restructured
its business model to incorporate the features that would soon become hallmarks of ULCCs. By
charging for ancillary services such as onboard food and beverage, and offering base fares starting
from £59 (later decreasing to 99p by 2005), Ryanair pioneered the aggressive pricing strategy -
charging for every ancillary item such as boarding passes and airport counter check-in - that is a
major facet of the ULCC model today. A competing airline, easyJet, also began practicing some
of the same strategies in European markets.
In the mid 2000s, as the gap between the unit costs of LCCs and NLCs in the U.S. narrowed
(Tsoukalas et al., 2008), a market opportunity emerged for a new type of carrier with a focus on
low costs to undercut even the LCCs’ internal cost structure. Allegiant Air and Spirit Airlines
were the first two carriers in the United States to begin the transition to the ULCC model of lower
unit costs, ancillary revenue collection, and reduced base fares.
Allegiant Air, which commenced operations in 1998, was initially focused on the Las Vegas,
Nevada and Lake Tahoe casino charter markets. After declaring bankruptcy and reorganizing in
2001, Allegiant began its transition to the ULCC model. As part of this transition, a key priority
was growing ancillary revenue collection. In 2003, Allegiant collected $3.40 in ancillary revenue
4
per scheduled passenger according to filings with the U.S. Securities and Exchange Commission
(SEC). By 2007, Allegiant’s ancillary revenue had grown to $21.53 per passenger segment. Around
this time, in late 2006, Spirit Airlines (previously a small LCC based in Detroit) also began its
transition to the ULCC model. By introducing checked baggage fees and charging for onboard
food and beverage, Spirit collected $10.96 in ancillary revenue per passenger segment in 2007.
By charging for more ancillary services, these carriers could maintain passenger revenue while
offering lower base fares, thus ensuring their itineraries would be among the first listed on internet
distribution sites (e.g. Expedia), attracting more traffic (Belobaba et al., 2009).
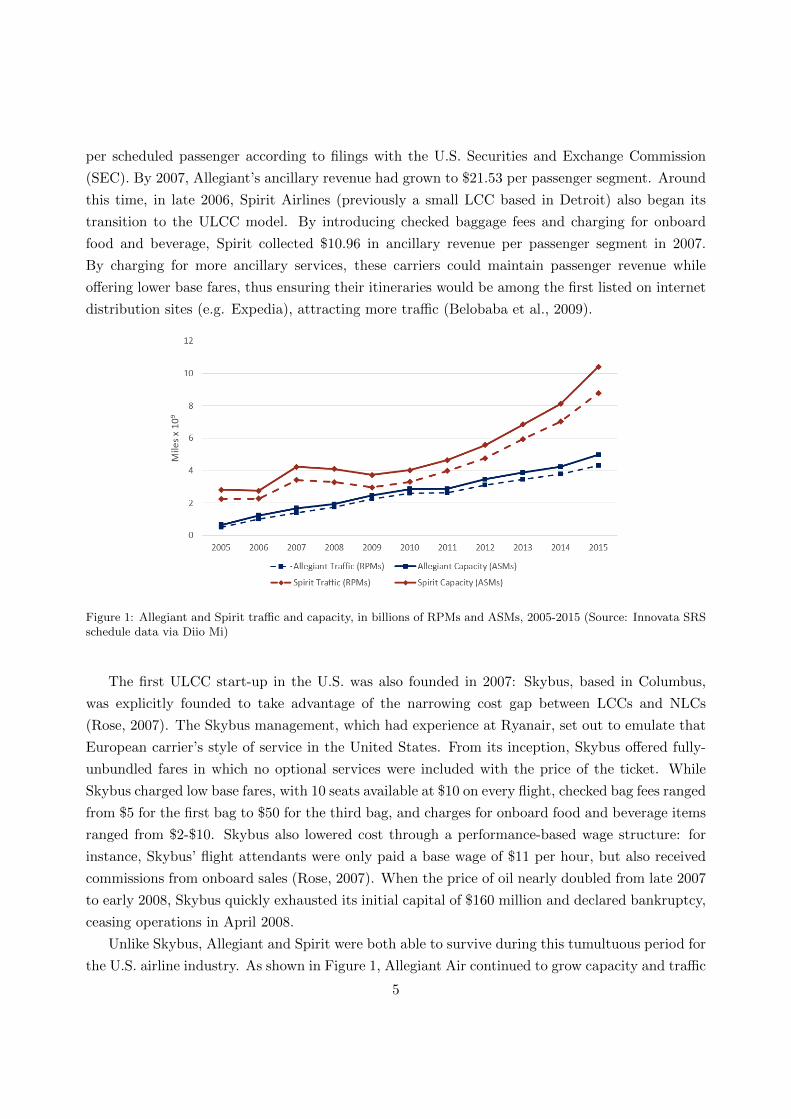
Figure 1: Allegiant and Spirit traffic and capacity, in billions of RPMs and ASMs, 2005-2015 (Source: Innovata SRSschedule data via Diio Mi)
The first ULCC start-up in the U.S. was also founded in 2007: Skybus, based in Columbus,
was explicitly founded to take advantage of the narrowing cost gap between LCCs and NLCs
(Rose, 2007). The Skybus management, which had experience at Ryanair, set out to emulate that
European carrier’s style of service in the United States. From its inception, Skybus offered fully-
unbundled fares in which no optional services were included with the price of the ticket. While
Skybus charged low base fares, with 10 seats available at $10 on every flight, checked bag fees ranged
from $5 for the first bag to $50 for the third bag, and charges for onboard food and beverage items
ranged from $2-$10. Skybus also lowered cost through a performance-based wage structure: for
instance, Skybus’ flight attendants were only paid a base wage of $11 per hour, but also received
commissions from onboard sales (Rose, 2007). When the price of oil nearly doubled from late 2007
to early 2008, Skybus quickly exhausted its initial capital of $160 million and declared bankruptcy,
ceasing operations in April 2008.
Unlike Skybus, Allegiant and Spirit were both able to survive during this tumultuous period for
the U.S. airline industry. As shown in Figure 1, Allegiant Air continued to grow capacity and traffic
5
every year 2005-2015, including during the 2008-2009 period which represented a global recession
and a time of contraction for most U.S. carriers. Allegiant also remained profitable every year over
the 2005-2015 timeframe. Spirit Airlines, although experiencing a temporary cut in capacity and
traffic during the recession, quickly began growing capacity and filed an initial public offering in
2010. The airline has since been profitably growing traffic (exceeding 10% annual traffic growth
every year since 2010) and capacity through 2015 at rates exceeding the NLCs and LCCs.
The third present-day ULCC in the U.S. is Frontier Airlines. The modern Frontier Airlines was
founded in 1994 as an LCC based in Denver. Most of its flights were oriented around its Denver hub
until the carrier declared bankruptcy in April 2008. While in bankruptcy, Frontier was acquired by
Republic Airways, a regional carrier that primarily operated feeder flights for the NLCs. Frontier
went through an extended period of restructuring by Republic, and was eventually acquired by a
private equity firm. Frontier then began its transformation into a ULCC, much like Spirit five years
earlier. By 2014, Allegiant, Frontier, and Spirit had the lowest unit costs of the major US carriers,
as we show in Section 2.3, while also offering fully unbundled fares and aggressively collecting
ancillary revenue (including charging for carry-on baggage and all seat assignments).
2.3. Characteristics of the ULCC model
As noted in Klophaus et al. (2012), previous efforts to classify LCCs involved evaluating carriers
on the basis of a variety of mostly qualitative characteristics. Despite the similarities between the
development of LCCs and ULCCs, qualitative characteristics alone are not sufficient to define the
ULCC business model. Thus, a more data-driven definition of the ULCC model is needed. We
propose that an airline is a ULCC if:
1. It has significantly lower costs than even other “low-cost” carriers;
2. It generates a significant portion of its operating revenue through the sale of unbundled,
ancillary services; and
3. As a result of lower base fares, it realizes lower unit revenues than other carriers, even when
ancillary revenues are taken into account.
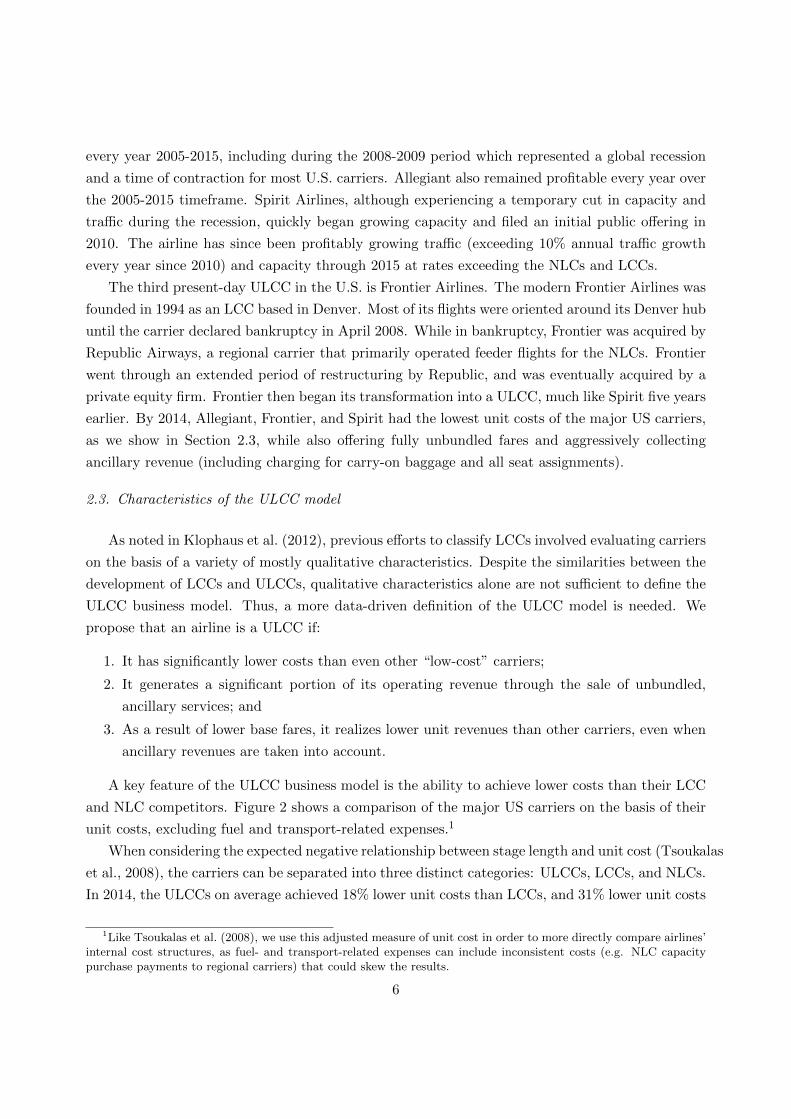
A key feature of the ULCC business model is the ability to achieve lower costs than their LCC
and NLC competitors. Figure 2 shows a comparison of the major US carriers on the basis of their
unit costs, excluding fuel and transport-related expenses.1
When considering the expected negative relationship between stage length and unit cost (Tsoukalas
et al., 2008), the carriers can be separated into three distinct categories: ULCCs, LCCs, and NLCs.
In 2014, the ULCCs on average achieved 18% lower unit costs than LCCs, and 31% lower unit costs
1Like Tsoukalas et al. (2008), we use this adjusted measure of unit cost in order to more directly compare airlines’internal cost structures, as fuel- and transport-related expenses can include inconsistent costs (e.g. NLC capacitypurchase payments to regional carriers) that could skew the results.
6
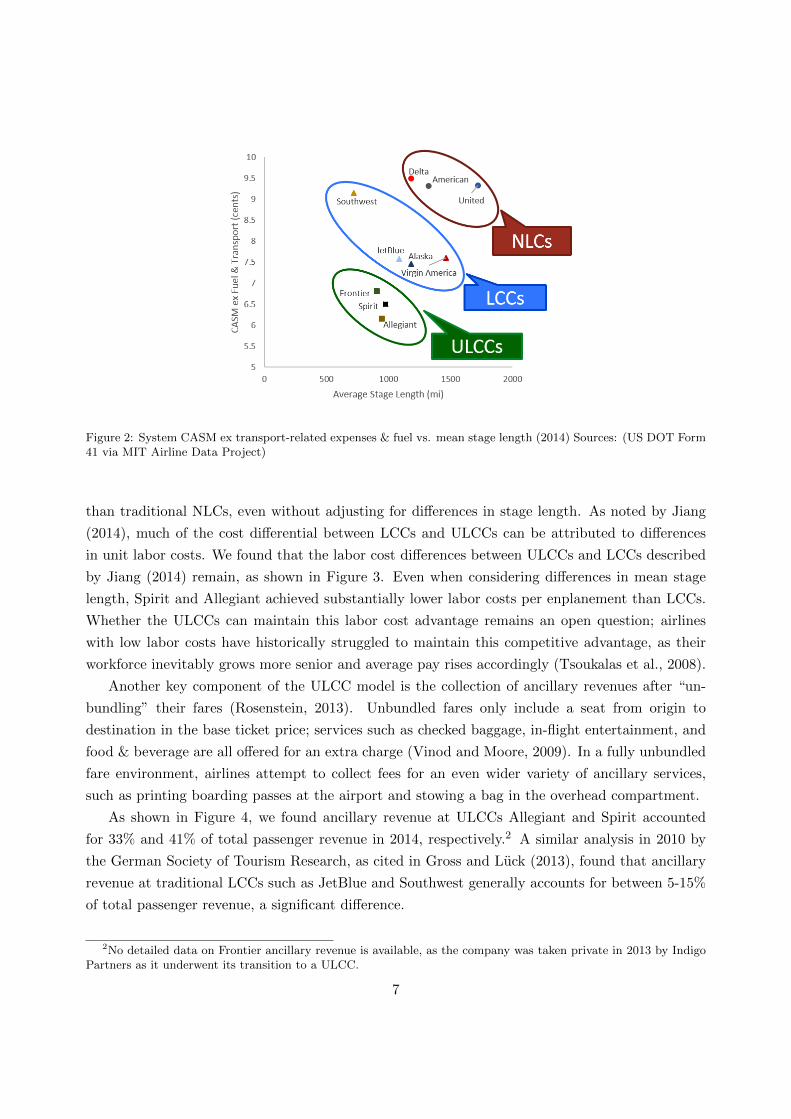
Figure 2: System CASM ex transport-related expenses & fuel vs. mean stage length (2014) Sources: (US DOT Form41 via MIT Airline Data Project)
than traditional NLCs, even without adjusting for differences in stage length. As noted by Jiang
(2014), much of the cost differential between LCCs and ULCCs can be attributed to differences
in unit labor costs. We found that the labor cost differences between ULCCs and LCCs described
by Jiang (2014) remain, as shown in Figure 3. Even when considering differences in mean stage
length, Spirit and Allegiant achieved substantially lower labor costs per enplanement than LCCs.
Whether the ULCCs can maintain this labor cost advantage remains an open question; airlines
with low labor costs have historically struggled to maintain this competitive advantage, as their
workforce inevitably grows more senior and average pay rises accordingly (Tsoukalas et al., 2008).
Another key component of the ULCC model is the collection of ancillary revenues after “un-
bundling” their fares (Rosenstein, 2013). Unbundled fares only include a seat from origin to
destination in the base ticket price; services such as checked baggage, in-flight entertainment, and
food & beverage are all offered for an extra charge (Vinod and Moore, 2009). In a fully unbundled
fare environment, airlines attempt to collect fees for an even wider variety of ancillary services,
such as printing boarding passes at the airport and stowing a bag in the overhead compartment.
As shown in Figure 4, we found ancillary revenue at ULCCs Allegiant and Spirit accounted
for 33% and 41% of total passenger revenue in 2014, respectively.2 A similar analysis in 2010 by
the German Society of Tourism Research, as cited in Gross and Luck (2013), found that ancillary
revenue at traditional LCCs such as JetBlue and Southwest generally accounts for between 5-15%
of total passenger revenue, a significant difference.
2No detailed data on Frontier ancillary revenue is available, as the company was taken private in 2013 by IndigoPartners as it underwent its transition to a ULCC.
7
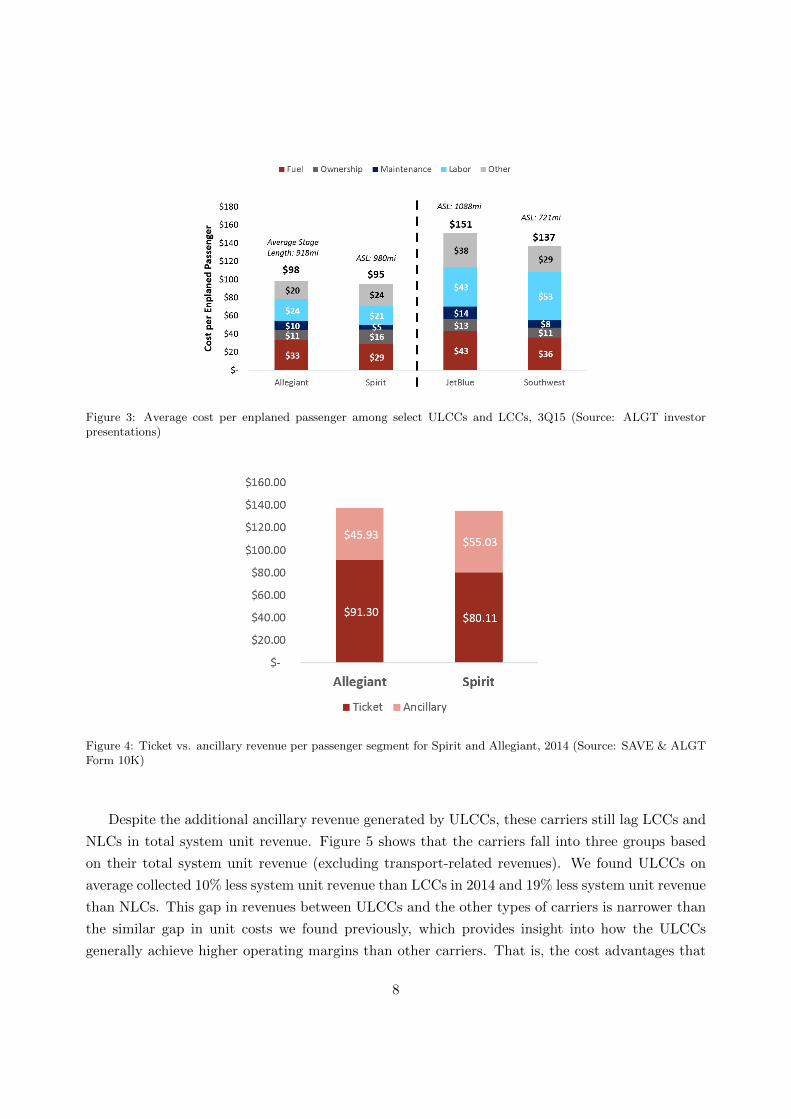
Figure 3: Average cost per enplaned passenger among select ULCCs and LCCs, 3Q15 (Source: ALGT investorpresentations)
Figure 4: Ticket vs. ancillary revenue per passenger segment for Spirit and Allegiant, 2014 (Source: SAVE & ALGTForm 10K)
Despite the additional ancillary revenue generated by ULCCs, these carriers still lag LCCs and
NLCs in total system unit revenue. Figure 5 shows that the carriers fall into three groups based
on their total system unit revenue (excluding transport-related revenues). We found ULCCs on
average collected 10% less system unit revenue than LCCs in 2014 and 19% less system unit revenue
than NLCs. This gap in revenues between ULCCs and the other types of carriers is narrower than
the similar gap in unit costs we found previously, which provides insight into how the ULCCs
generally achieve higher operating margins than other carriers. That is, the cost advantages that
8
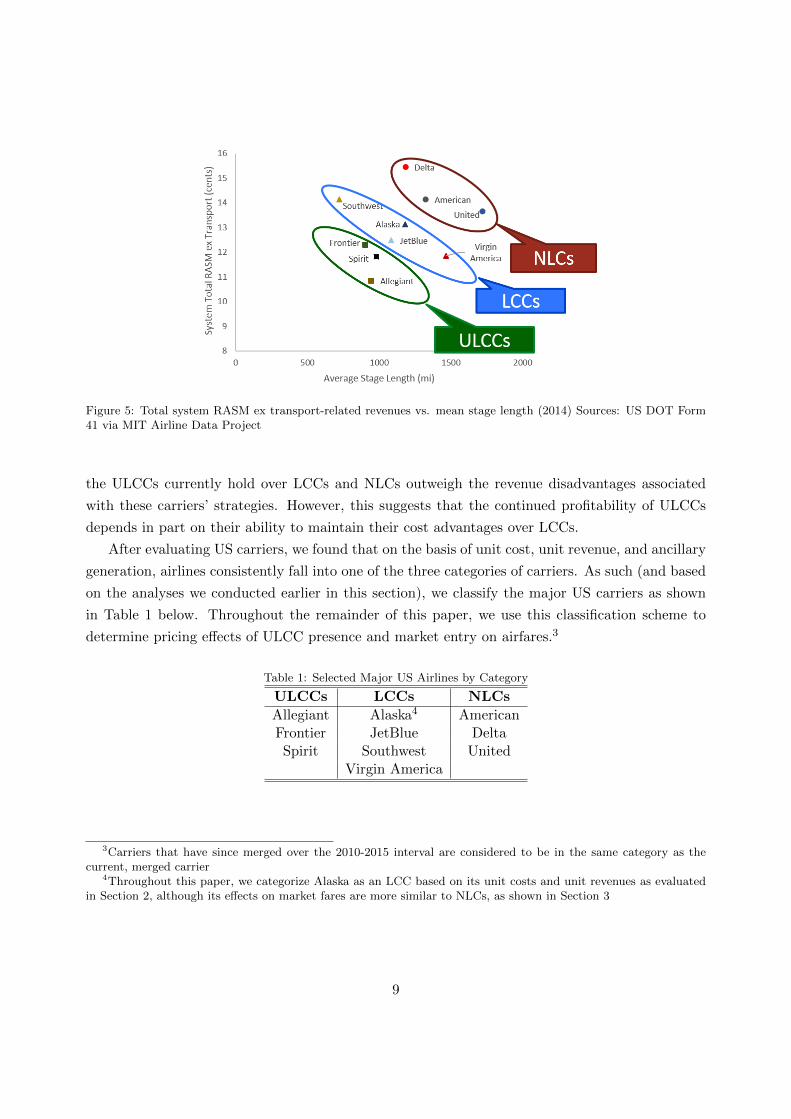
Figure 5: Total system RASM ex transport-related revenues vs. mean stage length (2014) Sources: US DOT Form41 via MIT Airline Data Project
the ULCCs currently hold over LCCs and NLCs outweigh the revenue disadvantages associated
with these carriers’ strategies. However, this suggests that the continued profitability of ULCCs
depends in part on their ability to maintain their cost advantages over LCCs.
After evaluating US carriers, we found that on the basis of unit cost, unit revenue, and ancillary
generation, airlines consistently fall into one of the three categories of carriers. As such (and based
on the analyses we conducted earlier in this section), we classify the major US carriers as shown
in Table 1 below. Throughout the remainder of this paper, we use this classification scheme to
determine pricing effects of ULCC presence and market entry on airfares.3
Table 1: Selected Major US Airlines by Category
ULCCs LCCs NLCs
Allegiant Alaska4 AmericanFrontier JetBlue DeltaSpirit Southwest United
Virgin America
3Carriers that have since merged over the 2010-2015 interval are considered to be in the same category as thecurrent, merged carrier
4Throughout this paper, we categorize Alaska as an LCC based on its unit costs and unit revenues as evaluatedin Section 2, although its effects on market fares are more similar to NLCs, as shown in Section 3
9
3. ULCC pricing effects
3.1. Background
As established in Section 2, ULCCs have emerged as a separate and distinct business model
from LCCs in the U.S. In this section, we aim to determine the effects of ULCC presence, entry, and
exit on base market airfares.5 Furthermore, we compare the pricing effects of ULCCs and LCCs
to determine whether the inherent differences in their internal cost structure lead to differences in
external impacts on the U.S. air transportation system.
Many papers have examined the effects of the presence of different types of airlines on market
airfares in the United States. Brueckner et al. (2013); bin Salam and McMullen (2013); Wittman
and Swelbar (2013); and Kwoka et al. (2016) have all found that LCC presence in a market tends
to lower average fares in that market. However, Wittman and Swelbar (2013) and bin Salam and
McMullen (2013) both found that the effects of certain LCCs on average fares has diminished over
time. In these types of papers, ULCCs like Allegiant and Frontier are typically omitted (Daraban
and Fournier, 2008; Tan, 2016) or treated alongside other LCCs (Brueckner et al., 2013; Kwoka
et al., 2016). In this section, we also consider the effects of airline presence on average market
airfares, but address this gap in the literature by considering the ULCCs as a separate category.
The other component of our analysis on ULCC pricing effects involves measuring the impact
of carrier exit/entry on airfares. Past work on LCC market entry has mainly focused on the
well-documented “Southwest effect,” in which market airfares decrease and traffic increases as a
result of Southwest Airlines entry (Windle and Dresner, 1995; Morrison, 2001). In a later analysis,
Goolsbee and Syverson (2008) found that the Southwest effect could extend to adjacent markets
prior to entry by Southwest. Morrison and Winston (1995) also examined exit by LCCs, and found
that market fares tended to rise when an LCC discontinued service in the market.
More recently, Daraban and Fournier (2008) studied entry and exit of multiple LCCs and found,
contra Morrison and Winston (1995), that fares remained lower after Southwest Airlines exited.
Other recent studies, including Huschelrath and Muller (2013) and Tan (2016), have also confirmed
that LCC market entry leads to greater decreases in fares than NLC entry. Following these works,
we investigate the effects of market entry and exit on market airfares while maintaining ULCCs
as a separate category. We hypothesize that ULCC entry will (1) produce a downward pressure
on average market fares; and (2) the downward pressure on market fares exerted by ULCC upon
market entry will be greater than that exerted by LCCs.
3.2. Models
We use a two-way fixed effects econometric model to isolate the effects of ULCC and/or LCC
presence on base market airfares. The dependent variable in our regressions is the natural log of
5We cannot consider total fares with ancillary fees included because they are not reported by the DOT on amarket level. However, a comparison of base airfares is useful as it represents the cost to the consumer for the coreproduct of air transportation.
10
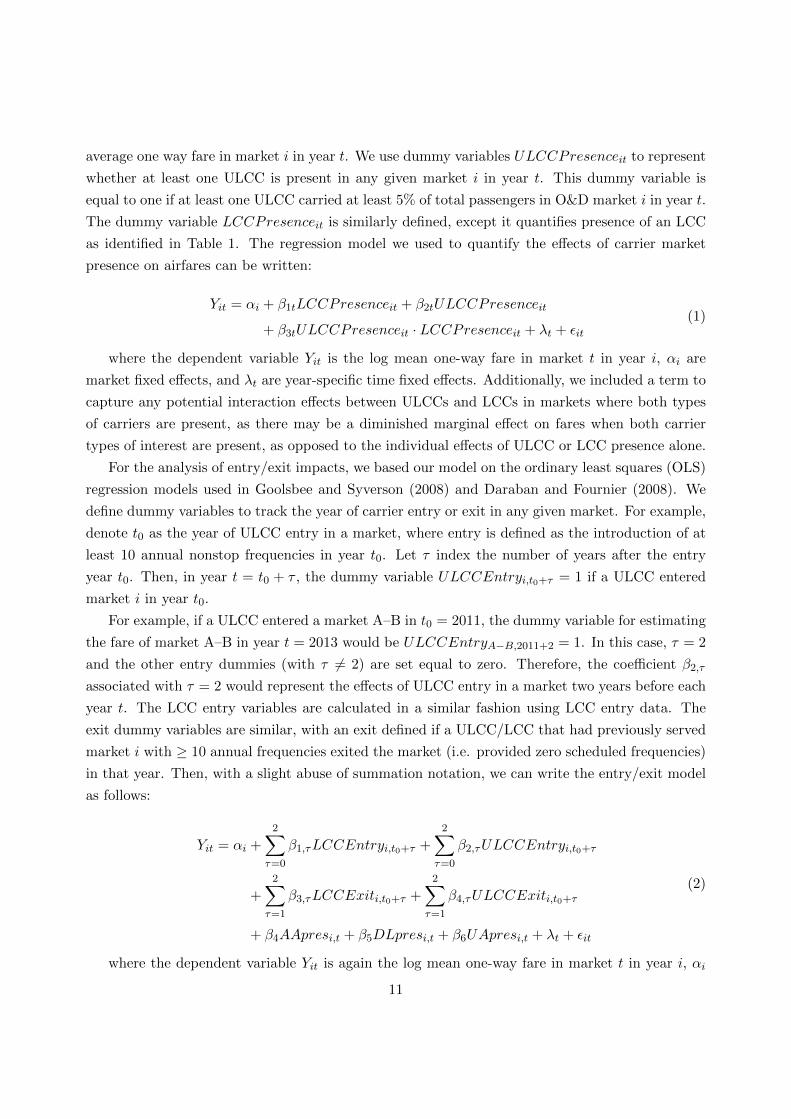
average one way fare in market i in year t. We use dummy variables ULCCPresenceit to represent
whether at least one ULCC is present in any given market i in year t. This dummy variable is
equal to one if at least one ULCC carried at least 5% of total passengers in O&D market i in year t.
The dummy variable LCCPresenceit is similarly defined, except it quantifies presence of an LCC
as identified in Table 1. The regression model we used to quantify the effects of carrier market
presence on airfares can be written:
Yit = αi + β1tLCCPresenceit + β2tULCCPresenceit
+ β3tULCCPresenceit · LCCPresenceit + λt + εit(1)
where the dependent variable Yit is the log mean one-way fare in market t in year i, αi are
market fixed effects, and λt are year-specific time fixed effects. Additionally, we included a term to
capture any potential interaction effects between ULCCs and LCCs in markets where both types
of carriers are present, as there may be a diminished marginal effect on fares when both carrier
types of interest are present, as opposed to the individual effects of ULCC or LCC presence alone.
For the analysis of entry/exit impacts, we based our model on the ordinary least squares (OLS)
regression models used in Goolsbee and Syverson (2008) and Daraban and Fournier (2008). We
define dummy variables to track the year of carrier entry or exit in any given market. For example,
denote t0 as the year of ULCC entry in a market, where entry is defined as the introduction of at
least 10 annual nonstop frequencies in year t0. Let τ index the number of years after the entry
year t0. Then, in year t = t0 + τ , the dummy variable ULCCEntryi,t0+τ = 1 if a ULCC entered
market i in year t0.
For example, if a ULCC entered a market A–B in t0 = 2011, the dummy variable for estimating
the fare of market A–B in year t = 2013 would be ULCCEntryA−B,2011+2 = 1. In this case, τ = 2
and the other entry dummies (with τ 6= 2) are set equal to zero. Therefore, the coefficient β2,τ
associated with τ = 2 would represent the effects of ULCC entry in a market two years before each
year t. The LCC entry variables are calculated in a similar fashion using LCC entry data. The
exit dummy variables are similar, with an exit defined if a ULCC/LCC that had previously served
market i with ≥ 10 annual frequencies exited the market (i.e. provided zero scheduled frequencies)
in that year. Then, with a slight abuse of summation notation, we can write the entry/exit model
as follows:
Yit = αi +
2∑τ=0
β1,τLCCEntryi,t0+τ +
2∑τ=0
β2,τULCCEntryi,t0+τ
+
2∑τ=1
β3,τLCCExiti,t0+τ +
2∑τ=1
β4,τULCCExiti,t0+τ
+ β4AApresi,t + β5DLpresi,t + β6UApresi,t + λt + εit
(2)
where the dependent variable Yit is again the log mean one-way fare in market t in year i, αi
11
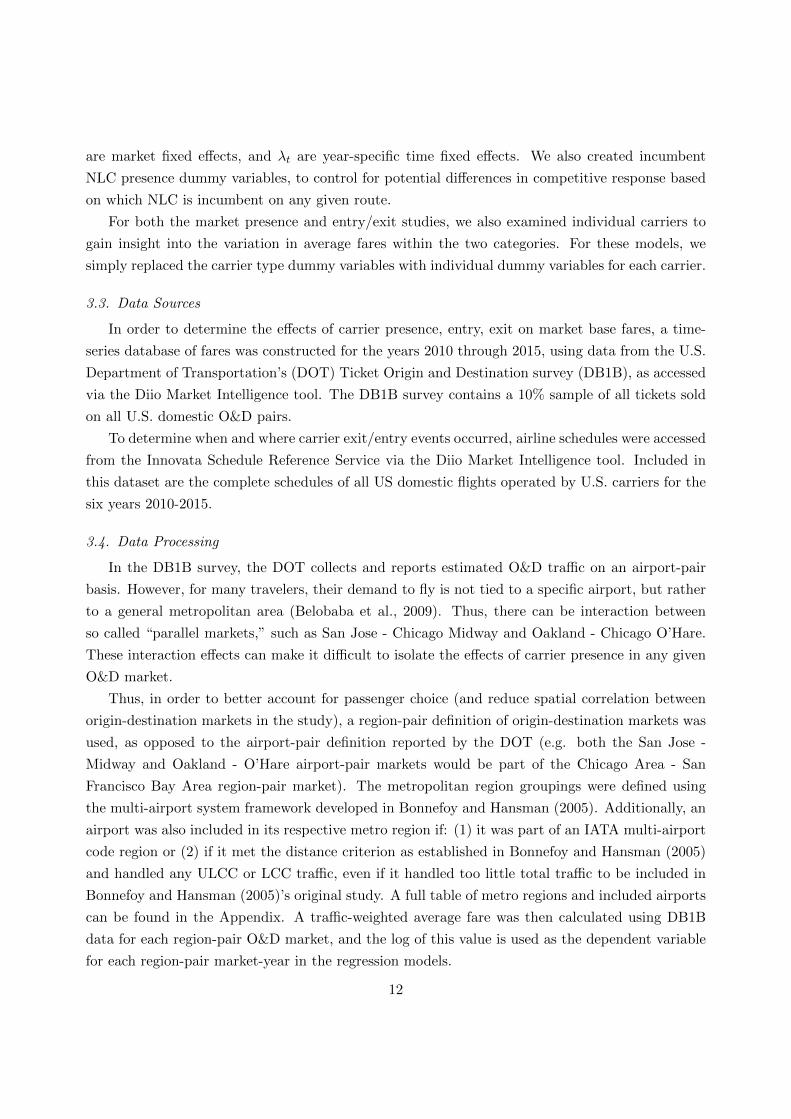
are market fixed effects, and λt are year-specific time fixed effects. We also created incumbent
NLC presence dummy variables, to control for potential differences in competitive response based
on which NLC is incumbent on any given route.
For both the market presence and entry/exit studies, we also examined individual carriers to
gain insight into the variation in average fares within the two categories. For these models, we
simply replaced the carrier type dummy variables with individual dummy variables for each carrier.
3.3. Data Sources
In order to determine the effects of carrier presence, entry, exit on market base fares, a time-
series database of fares was constructed for the years 2010 through 2015, using data from the U.S.
Department of Transportation’s (DOT) Ticket Origin and Destination survey (DB1B), as accessed
via the Diio Market Intelligence tool. The DB1B survey contains a 10% sample of all tickets sold
on all U.S. domestic O&D pairs.
To determine when and where carrier exit/entry events occurred, airline schedules were accessed
from the Innovata Schedule Reference Service via the Diio Market Intelligence tool. Included in
this dataset are the complete schedules of all US domestic flights operated by U.S. carriers for the
six years 2010-2015.
3.4. Data Processing
In the DB1B survey, the DOT collects and reports estimated O&D traffic on an airport-pair
basis. However, for many travelers, their demand to fly is not tied to a specific airport, but rather
to a general metropolitan area (Belobaba et al., 2009). Thus, there can be interaction between
so called “parallel markets,” such as San Jose - Chicago Midway and Oakland - Chicago O’Hare.
These interaction effects can make it difficult to isolate the effects of carrier presence in any given
O&D market.
Thus, in order to better account for passenger choice (and reduce spatial correlation between
origin-destination markets in the study), a region-pair definition of origin-destination markets was
used, as opposed to the airport-pair definition reported by the DOT (e.g. both the San Jose -
Midway and Oakland - O’Hare airport-pair markets would be part of the Chicago Area - San
Francisco Bay Area region-pair market). The metropolitan region groupings were defined using
the multi-airport system framework developed in Bonnefoy and Hansman (2005). Additionally, an
airport was also included in its respective metro region if: (1) it was part of an IATA multi-airport
code region or (2) if it met the distance criterion as established in Bonnefoy and Hansman (2005)
and handled any ULCC or LCC traffic, even if it handled too little total traffic to be included in
Bonnefoy and Hansman (2005)’s original study. A full table of metro regions and included airports
can be found in the Appendix. A traffic-weighted average fare was then calculated using DB1B
data for each region-pair O&D market, and the log of this value is used as the dependent variable
for each region-pair market-year in the regression models.
12
Also, as mentioned in Section 3.3, the DB1B data is itself extrapolated from a random 10%
sample of all tickets sold. As a result, the mean airfares for very small markets with only a
few observations in the DB1B data could be skewed as a result of sampling bias. Therefore, for
the purposes of this study, we included region-pair market i in our market presence sample if
estimated traffic in market i averaged at least than 20 passengers daily each way (PDEW) in that
year, resulting in Npres = 16, 127 market-year observations for the market presence analysis. For
the exit-entry analysis, we included all O&D markets with 20 or more PDEW in at least one of
the years in the five-year study in our dataset, to allow us to compare fares before and after entry
in smaller markets that saw stimulation as a result of new service. This results in Nent = 14, 539
market-year observations for the exit-entry study, spanning five years and 3,004 unique markets.
Finally, using the Innovata schedule data, a market entry/exit database was built to determine
which markets experienced carrier entry/exit in any given year, both on an aggregate (e.g. ULCC
or LCC entry) and an individual carrier basis. The market entry/exit dummy variables described
in Section 3.2 were then calculated using this database.
3.5. Descriptive Statistics
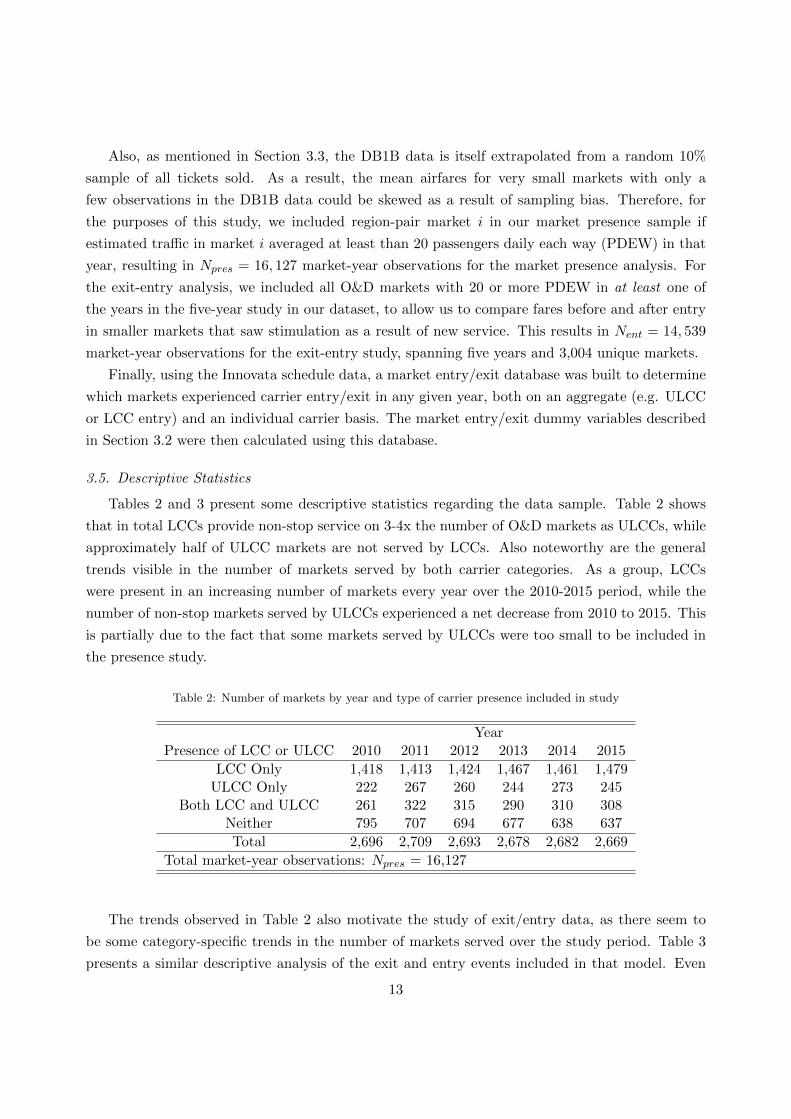
Tables 2 and 3 present some descriptive statistics regarding the data sample. Table 2 shows
that in total LCCs provide non-stop service on 3-4x the number of O&D markets as ULCCs, while
approximately half of ULCC markets are not served by LCCs. Also noteworthy are the general
trends visible in the number of markets served by both carrier categories. As a group, LCCs
were present in an increasing number of markets every year over the 2010-2015 period, while the
number of non-stop markets served by ULCCs experienced a net decrease from 2010 to 2015. This
is partially due to the fact that some markets served by ULCCs were too small to be included in
the presence study.
Table 2: Number of markets by year and type of carrier presence included in study
YearPresence of LCC or ULCC 2010 2011 2012 2013 2014 2015
LCC Only 1,418 1,413 1,424 1,467 1,461 1,479ULCC Only 222 267 260 244 273 245
Both LCC and ULCC 261 322 315 290 310 308Neither 795 707 694 677 638 637
Total 2,696 2,709 2,693 2,678 2,682 2,669
Total market-year observations: Npres = 16,127
The trends observed in Table 2 also motivate the study of exit/entry data, as there seem to
be some category-specific trends in the number of markets served over the study period. Table 3
presents a similar descriptive analysis of the exit and entry events included in that model. Even
13
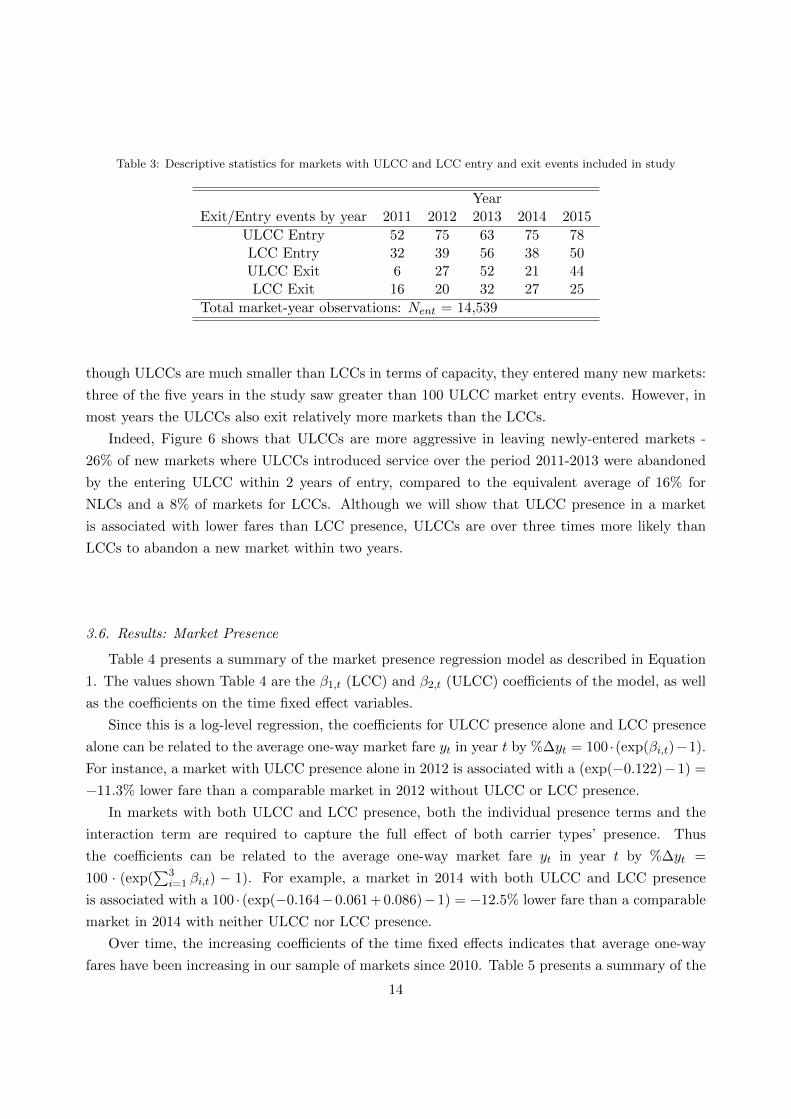
Table 3: Descriptive statistics for markets with ULCC and LCC entry and exit events included in study
YearExit/Entry events by year 2011 2012 2013 2014 2015
ULCC Entry 52 75 63 75 78LCC Entry 32 39 56 38 50ULCC Exit 6 27 52 21 44LCC Exit 16 20 32 27 25
Total market-year observations: Nent = 14,539
though ULCCs are much smaller than LCCs in terms of capacity, they entered many new markets:
three of the five years in the study saw greater than 100 ULCC market entry events. However, in
most years the ULCCs also exit relatively more markets than the LCCs.
Indeed, Figure 6 shows that ULCCs are more aggressive in leaving newly-entered markets -
26% of new markets where ULCCs introduced service over the period 2011-2013 were abandoned
by the entering ULCC within 2 years of entry, compared to the equivalent average of 16% for
NLCs and a 8% of markets for LCCs. Although we will show that ULCC presence in a market
is associated with lower fares than LCC presence, ULCCs are over three times more likely than
LCCs to abandon a new market within two years.
3.6. Results: Market Presence
Table 4 presents a summary of the market presence regression model as described in Equation
1. The values shown Table 4 are the β1,t (LCC) and β2,t (ULCC) coefficients of the model, as well
as the coefficients on the time fixed effect variables.
Since this is a log-level regression, the coefficients for ULCC presence alone and LCC presence
alone can be related to the average one-way market fare yt in year t by %∆yt = 100 ·(exp(βi,t)−1).
For instance, a market with ULCC presence alone in 2012 is associated with a (exp(−0.122)−1) =
−11.3% lower fare than a comparable market in 2012 without ULCC or LCC presence.
In markets with both ULCC and LCC presence, both the individual presence terms and the
interaction term are required to capture the full effect of both carrier types’ presence. Thus
the coefficients can be related to the average one-way market fare yt in year t by %∆yt =
100 · (exp(∑3
i=1 βi,t) − 1). For example, a market in 2014 with both ULCC and LCC presence
is associated with a 100 · (exp(−0.164−0.061 + 0.086)−1) = −12.5% lower fare than a comparable
market in 2014 with neither ULCC nor LCC presence.
Over time, the increasing coefficients of the time fixed effects indicates that average one-way
fares have been increasing in our sample of markets since 2010. Table 5 presents a summary of the
14
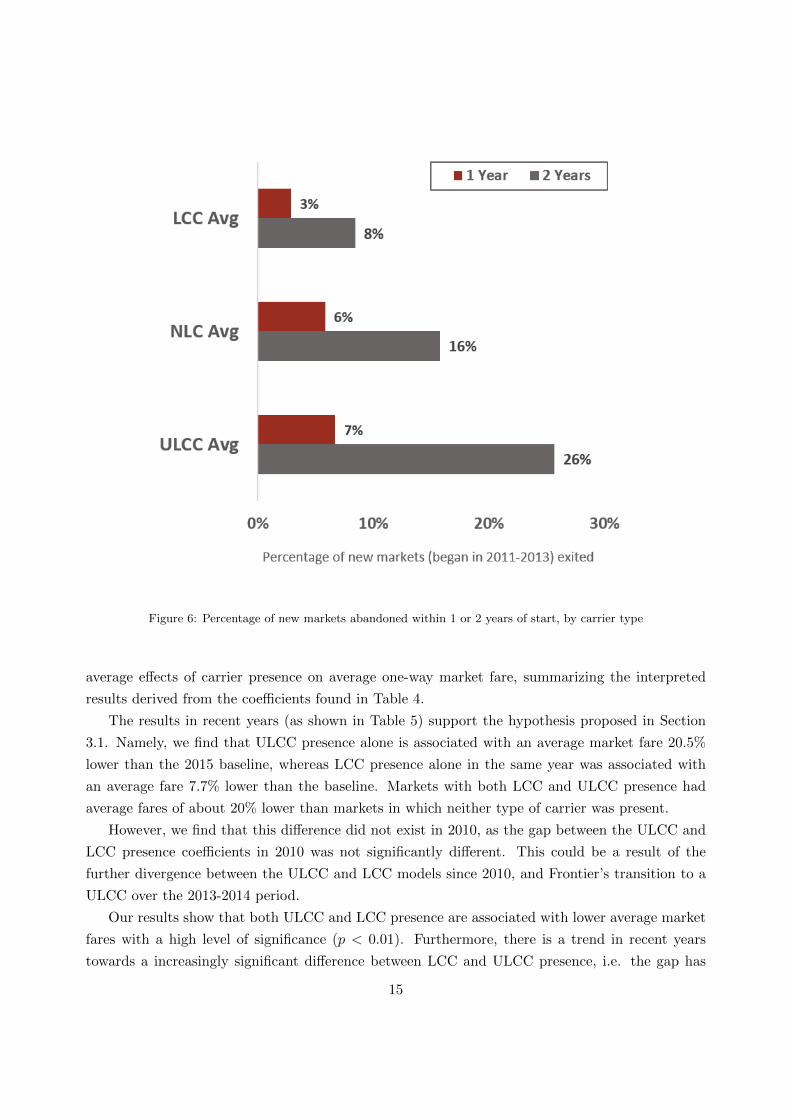
Figure 6: Percentage of new markets abandoned within 1 or 2 years of start, by carrier type
average effects of carrier presence on average one-way market fare, summarizing the interpreted
results derived from the coefficients found in Table 4.
The results in recent years (as shown in Table 5) support the hypothesis proposed in Section
3.1. Namely, we find that ULCC presence alone is associated with an average market fare 20.5%
lower than the 2015 baseline, whereas LCC presence alone in the same year was associated with
an average fare 7.7% lower than the baseline. Markets with both LCC and ULCC presence had
average fares of about 20% lower than markets in which neither type of carrier was present.
However, we find that this difference did not exist in 2010, as the gap between the ULCC and
LCC presence coefficients in 2010 was not significantly different. This could be a result of the
further divergence between the ULCC and LCC models since 2010, and Frontier’s transition to a
ULCC over the 2013-2014 period.
Our results show that both ULCC and LCC presence are associated with lower average market
fares with a high level of significance (p < 0.01). Furthermore, there is a trend in recent years
towards a increasingly significant difference between LCC and ULCC presence, i.e. the gap has
15
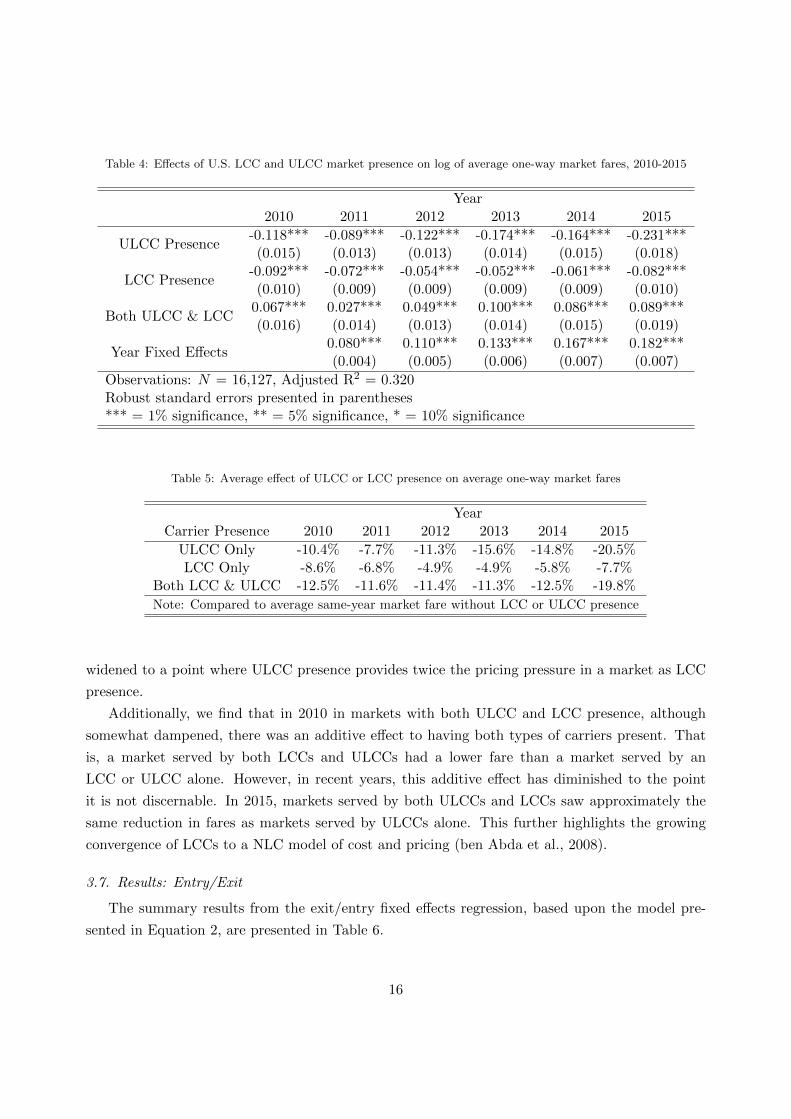
Table 4: Effects of U.S. LCC and ULCC market presence on log of average one-way market fares, 2010-2015
Year2010 2011 2012 2013 2014 2015
ULCC Presence-0.118*** -0.089*** -0.122*** -0.174*** -0.164*** -0.231***(0.015) (0.013) (0.013) (0.014) (0.015) (0.018)
LCC Presence-0.092*** -0.072*** -0.054*** -0.052*** -0.061*** -0.082***(0.010) (0.009) (0.009) (0.009) (0.009) (0.010)
Both ULCC & LCC0.067*** 0.027*** 0.049*** 0.100*** 0.086*** 0.089***(0.016) (0.014) (0.013) (0.014) (0.015) (0.019)
Year Fixed Effects0.080*** 0.110*** 0.133*** 0.167*** 0.182***(0.004) (0.005) (0.006) (0.007) (0.007)
Observations: N = 16,127, Adjusted R2 = 0.320Robust standard errors presented in parentheses*** = 1% significance, ** = 5% significance, * = 10% significance
Table 5: Average effect of ULCC or LCC presence on average one-way market fares
YearCarrier Presence 2010 2011 2012 2013 2014 2015
ULCC Only -10.4% -7.7% -11.3% -15.6% -14.8% -20.5%LCC Only -8.6% -6.8% -4.9% -4.9% -5.8% -7.7%
Both LCC & ULCC -12.5% -11.6% -11.4% -11.3% -12.5% -19.8%
Note: Compared to average same-year market fare without LCC or ULCC presence
widened to a point where ULCC presence provides twice the pricing pressure in a market as LCC
presence.
Additionally, we find that in 2010 in markets with both ULCC and LCC presence, although
somewhat dampened, there was an additive effect to having both types of carriers present. That
is, a market served by both LCCs and ULCCs had a lower fare than a market served by an
LCC or ULCC alone. However, in recent years, this additive effect has diminished to the point
it is not discernable. In 2015, markets served by both ULCCs and LCCs saw approximately the
same reduction in fares as markets served by ULCCs alone. This further highlights the growing
convergence of LCCs to a NLC model of cost and pricing (ben Abda et al., 2008).
3.7. Results: Entry/Exit
The summary results from the exit/entry fixed effects regression, based upon the model pre-
sented in Equation 2, are presented in Table 6.
16
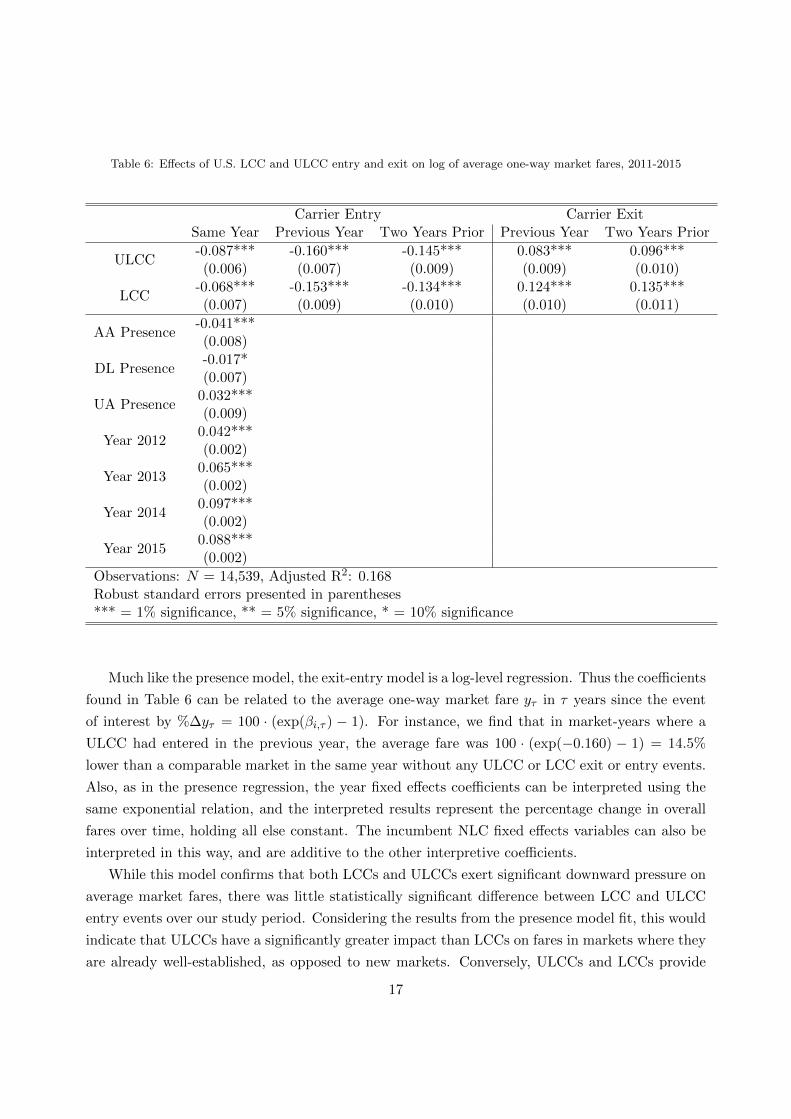
Table 6: Effects of U.S. LCC and ULCC entry and exit on log of average one-way market fares, 2011-2015
Carrier Entry Carrier ExitSame Year Previous Year Two Years Prior Previous Year Two Years Prior
ULCC-0.087*** -0.160*** -0.145*** 0.083*** 0.096***(0.006) (0.007) (0.009) (0.009) (0.010)
LCC-0.068*** -0.153*** -0.134*** 0.124*** 0.135***(0.007) (0.009) (0.010) (0.010) (0.011)
AA Presence-0.041***(0.008)
DL Presence-0.017*(0.007)
UA Presence0.032***(0.009)
Year 20120.042***(0.002)
Year 20130.065***(0.002)
Year 20140.097***(0.002)
Year 20150.088***(0.002)
Observations: N = 14,539, Adjusted R2: 0.168Robust standard errors presented in parentheses*** = 1% significance, ** = 5% significance, * = 10% significance
Much like the presence model, the exit-entry model is a log-level regression. Thus the coefficients
found in Table 6 can be related to the average one-way market fare yτ in τ years since the event
of interest by %∆yτ = 100 · (exp(βi,τ ) − 1). For instance, we find that in market-years where a
ULCC had entered in the previous year, the average fare was 100 · (exp(−0.160) − 1) = 14.5%
lower than a comparable market in the same year without any ULCC or LCC exit or entry events.
Also, as in the presence regression, the year fixed effects coefficients can be interpreted using the
same exponential relation, and the interpreted results represent the percentage change in overall
fares over time, holding all else constant. The incumbent NLC fixed effects variables can also be
interpreted in this way, and are additive to the other interpretive coefficients.
While this model confirms that both LCCs and ULCCs exert significant downward pressure on
average market fares, there was little statistically significant difference between LCC and ULCC
entry events over our study period. Considering the results from the presence model fit, this would
indicate that ULCCs have a significantly greater impact than LCCs on fares in markets where they
are already well-established, as opposed to new markets. Conversely, ULCCs and LCCs provide
17
approximately the same downward pressure on market fares after entry in a new market.
Although this result is contrary to our initial hypothesis, we propose two possible explanations
for this result. First, the ULCCs’ presence in the markets they enter may be too small to result in
significant changes to the average market airfare, even if the ULCCs’ prices are much lower than
those of incumbent NLCs or LCCs. ULCCs are still relatively small players in terms of overall
capacity; in 2014, according to DOT T-100 data, ULCCs represented only 4.9% of domestic ASMs,
while LCCs provided approximately 29% of U.S. domestic ASMs. Additionally, ULCCs provide
relatively low frequency on routes they serve - only 15% of ULCC stations were served by more
than four daily flights from any given ULCC, and 53% saw less-than-daily service. This suggests
that ULCC traffic makes up a small percentage of total traffic in entered markets, minimizing the
effects of low ULCC base fares on the average market fare.
Second, the NLCs and LCCs may not respond aggressively to the ULCC entry. In this situation,
even though a ULCC may enter a market with low base fares on their flights, the presence of other
carriers in the market that do not price match the ULCCs leads to the same net effect on the
market base fares as an LCC entry.6 In many markets, these two factors work in tandem to reduce
the impact of ULCC entry on average market base fare, leading to the results observed in Table 6.
The coefficients of the individual carrier model fit, presented in Table 7 also provide some
insight into the entry/exit effects. The same general trends observed in the aggregate categorical
model are present, with four out of six LCC and ULCC carriers providing approximately the same
pricing pressure.
However, Allegiant is a clear outlier, providing nearly twice the pricing pressure as the nearest
carrier in the year of entry. Allegiant’s network strategy skews towards serving small-to-midsize
markets, such as Las Vegas, Nevada, to Rapid City, South Dakota, where Allegiant provides a
significant proportion of overall market capacity. 72.4% of Allegiant’s ASMs originate at an airport
designated as a small or non hub airport by the FAA.7 Conversely, Spirit and Frontier target larger
markets, such as Denver to Chicago, where the carriers provide only a small fraction of the overall
market capacity. This lends support to the “relative capacity” hypothesis outlined previously:
Even though ULCCs may enter new markets and provide lower base fares than LCCs, they may
not provide enough capacity to affect the average market fare. Further work is recommended to
fully understand why these differences between carriers and between market presence and market
entry can be observed.
6This effect may diminish in the future, as American Airlines and other NLCs are beginning to respond ULCCsby matching fares on some routes (CAPA, 2015).
7In the FAA National Plan of Integrated Airport Systems, an airport is designated as a small hub if it accountsfor at least 0.05% but less than 0.25% of national enplanements. Similarly, an airport is designated a non hub if itaccounts for at least 10,000 annual enplanements but less than 0.05% of national enplanements.
18
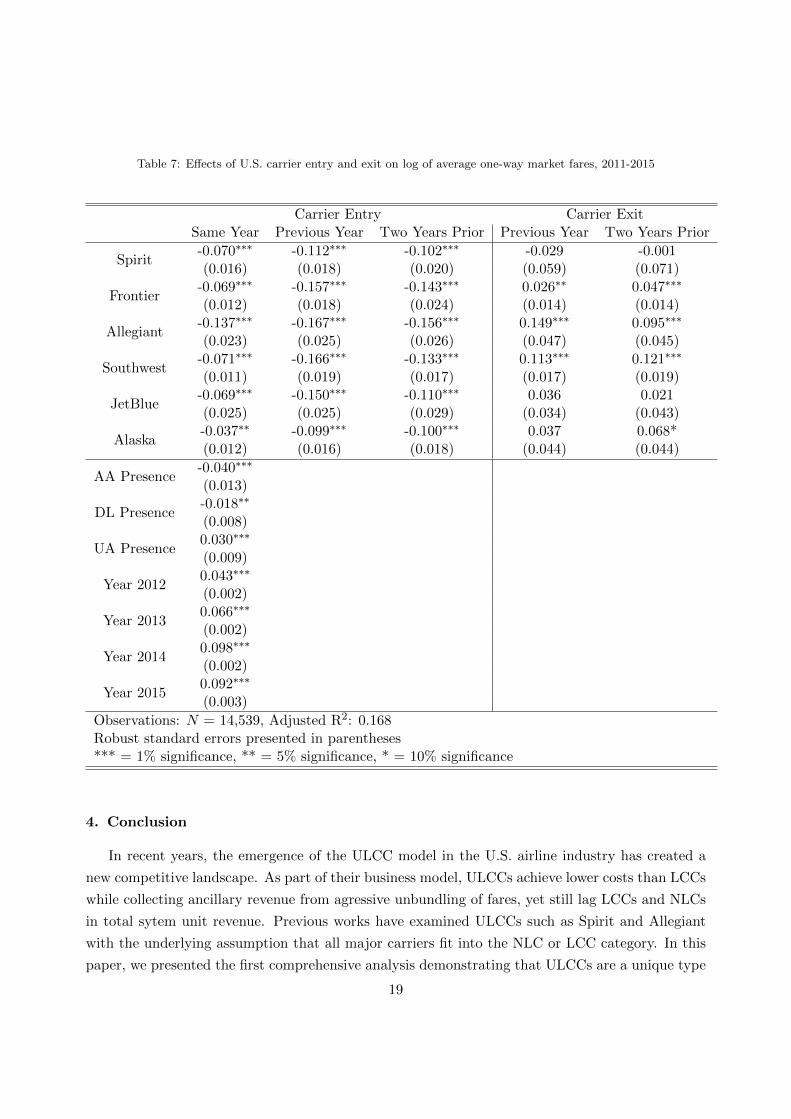
Table 7: Effects of U.S. carrier entry and exit on log of average one-way market fares, 2011-2015
Carrier Entry Carrier ExitSame Year Previous Year Two Years Prior Previous Year Two Years Prior
Spirit-0.070∗∗∗ -0.112∗∗∗ -0.102∗∗∗ -0.029 -0.001(0.016) (0.018) (0.020) (0.059) (0.071)
Frontier-0.069∗∗∗ -0.157∗∗∗ -0.143∗∗∗ 0.026∗∗ 0.047∗∗∗
(0.012) (0.018) (0.024) (0.014) (0.014)
Allegiant-0.137∗∗∗ -0.167∗∗∗ -0.156∗∗∗ 0.149∗∗∗ 0.095∗∗∗
(0.023) (0.025) (0.026) (0.047) (0.045)
Southwest-0.071∗∗∗ -0.166∗∗∗ -0.133∗∗∗ 0.113∗∗∗ 0.121∗∗∗
(0.011) (0.019) (0.017) (0.017) (0.019)
JetBlue-0.069∗∗∗ -0.150∗∗∗ -0.110∗∗∗ 0.036 0.021(0.025) (0.025) (0.029) (0.034) (0.043)
Alaska-0.037∗∗ -0.099∗∗∗ -0.100∗∗∗ 0.037 0.068*(0.012) (0.016) (0.018) (0.044) (0.044)
AA Presence-0.040∗∗∗
(0.013)
DL Presence-0.018∗∗
(0.008)
UA Presence0.030∗∗∗
(0.009)
Year 20120.043∗∗∗
(0.002)
Year 20130.066∗∗∗
(0.002)
Year 20140.098∗∗∗
(0.002)
Year 20150.092∗∗∗
(0.003)
Observations: N = 14,539, Adjusted R2: 0.168Robust standard errors presented in parentheses*** = 1% significance, ** = 5% significance, * = 10% significance
4. Conclusion
In recent years, the emergence of the ULCC model in the U.S. airline industry has created a
new competitive landscape. As part of their business model, ULCCs achieve lower costs than LCCs
while collecting ancillary revenue from agressive unbundling of fares, yet still lag LCCs and NLCs
in total sytem unit revenue. Previous works have examined ULCCs such as Spirit and Allegiant
with the underlying assumption that all major carriers fit into the NLC or LCC category. In this
paper, we presented the first comprehensive analysis demonstrating that ULCCs are a unique type
19
of carrier, distinct from LCCs in both internal structure and effects on air travel markets.
We proposed a new categorical definition for ULCCs as airlines which (1) have significantly
lower unit costs than LCCs; (2) derive a significantly higher proportion of revenue from ancillary
revenue than LCCs; and (3) despite increased ancillary revenue generation, ULCCs still lag LCCs
in total unit revenue. These fundamental differences suggest that the ULCC model is distinct and
separate from the LCC model, and thus that ULCCs can potentially affect the air transportation
system in different ways than LCCs.
Additionally, the impact of ULCC presence on average market fares has overtaken that of the
LCCs, and has increased over time. In 2015, ULCC presence on a given region-pair market with no
LCC presence was associated with a 20.5% lower mean fare than a market only served by NLCs,
as compared to a 7.7% lower mean fare associated with LCC presence in a market without ULCC
presence. However, in newly-entered markets, although both ULCCs and LCCs lower average fares
upon market entry by approximately 8% in the year of entry, the differences in impact between
carrier types were not statistically significant. As part of the entry-exit study, we found that
ULCCs abandon 26% of new markets within two years of entry, a market attrition rate three times
higher than that of LCCs.
As ULCCs emerge as a distinct business model in the US airline industry, they merit closer
study and attention. As ULCCs continue to grow their domestic capacity, their actions are likely
to have an increasingly significant impact on the industry. Much like the earlier development of the
LCC model, the emergence of ULCCs will affect policy decisions and the competitive landscape in
the industry. It will be key for policy makers and industry leaders to gain an understanding of how
NLCs and LCCs might react to the growth of ULCCs, whether the ULCC model is a sustainable
in its current state, and whether any communities are negatively impacted by these changes. Thus,
it is important to understand the ULCC business model and the impact ULCCs have on the air
transportation system at large, and future work should aim to investigate more fully the effects of
ULCCs on various industry stakeholders at a market, airport, and national level.
Acknowledgments: The authors would like to acknowledge the guidance and support pro-
vided by Peter Belobaba and by members of the MIT Airline Industry Consortium.
20
References
ben Abda, M., P.P. Belobaba, and W.S. Swelbar. 2008. Impacts of LCC growth on domestic traffic and fares at
largest US airports. Journal of Air Transport Management 18(1): 21-25.
bin Salam, S. and B. McMullen. 2013. Is there still a Southwest effect? Transportation Research Record: Journal of
the Transportation Research Board 2325: 1-8.
Belobaba, P.P., A. Odoni, and C. Barnhart, (Eds.). 2009. The global airline industry. Wiley, Chichester UK.
Bonnefoy, P.A. and R.J. Hansman. 2005. Emergence of secondary airports and dynamics of regional airport systems
in the United States. Massachusetts Institute of Technology International Center for Air Transportation White
Paper No. ICAT-2005-02.
Brueckner, J.K., D. Lee, and E. S. Singer. 2013. Airline competition and domestic US airfares: A comprehensive
reappraisal. Economics of Transportation 2: 1-17.
CAPA Centre for Aviation. 2015. US major airlines recognize the ULCC threat; marketplace dynamics will change;
but beware cost creep. CAPA Aviation Analysis Report 4 Nov 2015.
Chang, Y.-C. and M.-M. Yu. 2014. Measuring production and consumption efficiencies using the slack-based measure
network data envelopment analysis approach: the case of low-cost carriers. Journal of Advanced Transportation
48(1): 15-31.
Daraban, B. and G.M. Fournier. 2008. Incumbent responses to low-cost airline entry and exit: A spatial autoregressive
panel data analysis. Research in Transportation Economics 24(2008): 15-24.
de Wit, J.G. and J. Zuidberg. 2012. The growth limits of the low-cost carrier model. Journal of Air Transport
Management 21: 17-23.
Francis, G., I. Humphreys, S. Ison, M. Aicken. 2006. Where next for low cost airlines? A spatial and temporal
comparative study. Journal of Transport Geography 14(2): 83-94.
Gillen, D. 2005. Airline business models and networks: Regulation, competition and evolution in aviation markets.
Review of Network Economics 5(4): 366-385.
Goolsbee, A. and C. Syverson. 2008. How do incumbents respond to the threat of entry? Evidence from the major
airlines. Quarterly Journal of Economics, 11/2008.
Gross, S., and M. Luck. (Eds.). 2013. The low cost carrier worldwide. Ashgate, Farnham UK.
Hofer, C., R.J. Windle, and M. Dresner. 2008. Competitive responses to low cost carrier entry. Transportation
Research Part E 44(5): 864-882.
Huschelrath, K. and K. Muller. 2013. Patterns and Effects of Entry in U.S. Airline Markets. Journal of International
Competition and Trade 13: 221-253.
Jiang, Q. 2014. The evolution of U.S. airlines’ productivity and cost performance from 2004 to 2012. Unpublished
master’s thesis, Massachusetts Institute of Technology.
Klophaus, R., R. Conrady, and Fichert, F. 2012. Low cost carriers going hybrid: Evidence from Europe. Journal of
Air Transport Management 23: 54-58.
Kwoka, J., K. Hearle, and P. Alepin. 2016. From the Fringe to the Forefront: Low Cost Carriers and Airline Price
Determination. Review of Industrial Organization 48(3): 247-268.
Martin, G. 2016. Customer complaints surge as passengers resist airline mergers and ultra low cost carriers. Forbes,
24 Feb 2016.
Morrison, S. and C. Winston. 1995. The Evolution of the Airline Industry, The Brookings Institution, Washington,
DC.
Morrison, S.A. 2001. Actual, adjacent, and potential competition: Estimating the full effect of Southwest Airlines.
Journal of Transport Economics and Policy 35(2): 239-256.
Nicas, J. 2012. A stingy Spirit lifts airline’s profit. Wall Street Journal, 11 May 2012.
Nicas, J. 2013. Allegiant Air: The tardy, gas-guzzling, most profitable airline in America. Wall Street Journal, 4 June
2013.
21
Rose, M. 2007. Skybus’ planned Tuesday start shows promise. Columbus Dispatch, 5 November 2007.
Rosenstein, D. E. 2013. The changing low-cost airline model model: An analysis of Spirit Airlines. Purdue Aviation
Technology Graduate Student Publications. Paper 19.
Thomas, J. and B. Catlin. 2014. Aviation insights review: The future of airline business models, which will win?
L.E.K. Consulting Executive Insights 16(34).
Tretheway, M. 2004. Distortions of airline revenues: why the network airline business model is broken. Journal of
Air Transport Management 10(1): 3-14.
Tsoukalas, G., P.P. Belobaba, and W.S. Swelbar. 2008. Cost convergance in the US airline industry: An analsysis of
unit costs 1995-2006. Journal of Air Transport Management 14(4): 179-187.
U.S. Government Accountability Office. 2014. Airline competition: The average number of competitors in markets
serving the majority of passengers has changed little in recent years, but stakeholders voice concerns about
competition. GAO Report 14-515.
Tan, K.M. Incumbent Response to Entry by Low-Cost Carriers in the U.S. Airline Industry. Southern Economic
Journal 82(3): 874-892.
Vinod, R. and K. Moore. 2009. Promoting branded fare families and ancillary services: Merchandising and its impacts
on the travel value chain. Journal of Revenue and Pricing Management 8(2): 174-186.
Windle, R. and M. Dresner. 1995. The short and long run effects of entry on US domestic air routes. Transportation
Journal 35(2): 14-25.
Windle, R. and M. Dresner. 1999. Competitive responses to low cost carrier entry. Transportation Research Part E
35(1): 59-75.
Wittman, M.D. and W.S. Swelbar. 2013. Evolving trends of US domestic airfares: The impacts of competition, consol-
idation, and low-cost carriers. Massachusetts Institute of Technology International Center for Air Transportation
White Paper No. ICAT-2013-05.
Wittman, M.D. 2015. Computing the Sample Rates Necessary for BTS DB1B Average Fare Estimates for Small
Airports. Massachusetts Institute of Technology International Center for Air Transportation Working Paper.
22
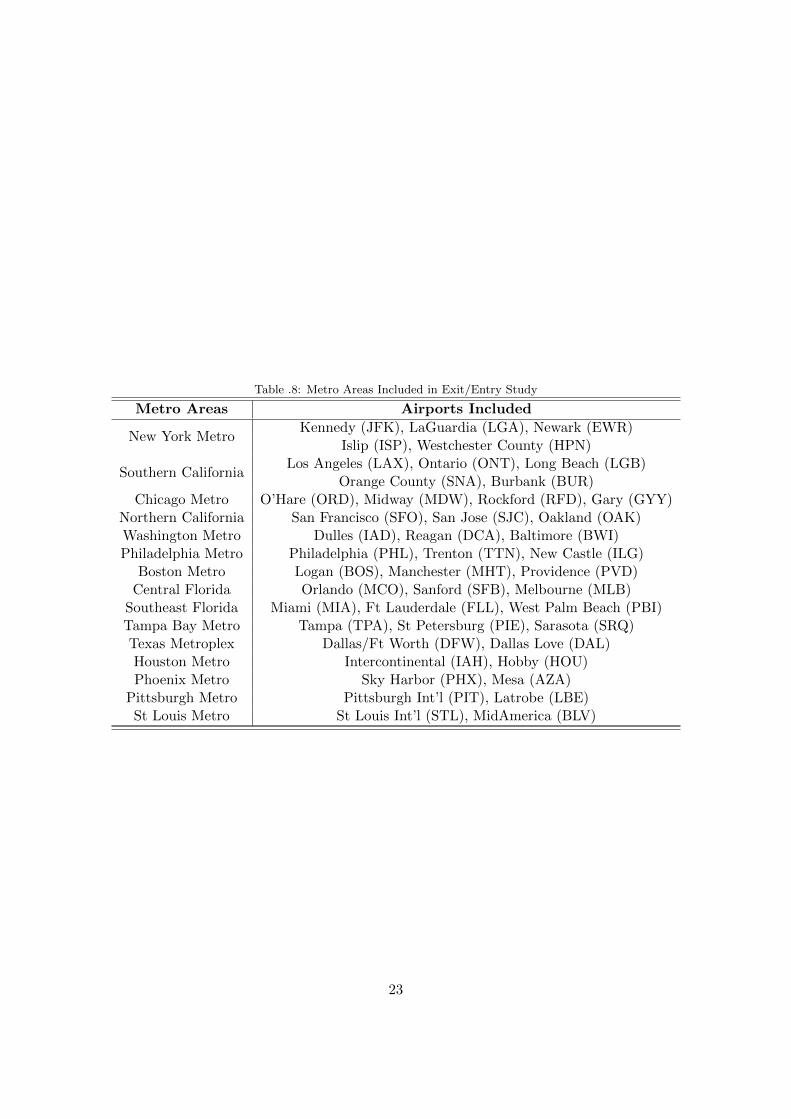
Table .8: Metro Areas Included in Exit/Entry Study
Metro Areas Airports Included
New York MetroKennedy (JFK), LaGuardia (LGA), Newark (EWR)
Islip (ISP), Westchester County (HPN)
Southern CaliforniaLos Angeles (LAX), Ontario (ONT), Long Beach (LGB)
Orange County (SNA), Burbank (BUR)Chicago Metro O’Hare (ORD), Midway (MDW), Rockford (RFD), Gary (GYY)
Northern California San Francisco (SFO), San Jose (SJC), Oakland (OAK)Washington Metro Dulles (IAD), Reagan (DCA), Baltimore (BWI)Philadelphia Metro Philadelphia (PHL), Trenton (TTN), New Castle (ILG)
Boston Metro Logan (BOS), Manchester (MHT), Providence (PVD)Central Florida Orlando (MCO), Sanford (SFB), Melbourne (MLB)
Southeast Florida Miami (MIA), Ft Lauderdale (FLL), West Palm Beach (PBI)Tampa Bay Metro Tampa (TPA), St Petersburg (PIE), Sarasota (SRQ)Texas Metroplex Dallas/Ft Worth (DFW), Dallas Love (DAL)Houston Metro Intercontinental (IAH), Hobby (HOU)Phoenix Metro Sky Harbor (PHX), Mesa (AZA)
Pittsburgh Metro Pittsburgh Int’l (PIT), Latrobe (LBE)St Louis Metro St Louis Int’l (STL), MidAmerica (BLV)
23
Related Documents