DISCUSSION PAPER SERIES Forschungsinstitut zur Zukunft der Arbeit Institute for the Study of Labor The Elite Illusion: Achievement Effects at Boston and New York Exam Schools IZA DP No. 6790 August 2012 Atila Abdulkadiroğlu Joshua D. Angrist Parag A. Pathak

Welcome message from author
This document is posted to help you gain knowledge. Please leave a comment to let me know what you think about it! Share it to your friends and learn new things together.
Transcript

DI
SC
US
SI
ON
P
AP
ER
S
ER
IE
S
Forschungsinstitut zur Zukunft der ArbeitInstitute for the Study of Labor
The Elite Illusion: Achievement Effects atBoston and New York Exam Schools
IZA DP No. 6790
August 2012
Atila AbdulkadiroğluJoshua D. AngristParag A. Pathak

The Elite Illusion: Achievement Effects at
Boston and New York Exam Schools
Atila Abdulkadiroğlu Duke University
Joshua D. Angrist
MIT, NBER and IZA
Parag A. Pathak MIT and NBER
Discussion Paper No. 6790 August 2012
IZA
P.O. Box 7240 53072 Bonn
Germany
Phone: +49-228-3894-0 Fax: +49-228-3894-180
E-mail: [email protected]
Any opinions expressed here are those of the author(s) and not those of IZA. Research published in this series may include views on policy, but the institute itself takes no institutional policy positions. The Institute for the Study of Labor (IZA) in Bonn is a local and virtual international research center and a place of communication between science, politics and business. IZA is an independent nonprofit organization supported by Deutsche Post Foundation. The center is associated with the University of Bonn and offers a stimulating research environment through its international network, workshops and conferences, data service, project support, research visits and doctoral program. IZA engages in (i) original and internationally competitive research in all fields of labor economics, (ii) development of policy concepts, and (iii) dissemination of research results and concepts to the interested public. IZA Discussion Papers often represent preliminary work and are circulated to encourage discussion. Citation of such a paper should account for its provisional character. A revised version may be available directly from the author.

IZA Discussion Paper No. 6790 August 2012
ABSTRACT
The Elite Illusion: Achievement Effects at Boston and New York Exam Schools*
Parents gauge school quality in part by the level of student achievement and a school’s racial mix. The importance of school characteristics in the housing market can be seen in the jump in house prices at school district boundaries where peer characteristics change. The question of whether schools with more attractive peers are really better in a value-added sense remains open, however. This paper uses a fuzzy regression-discontinuity design to evaluate the causal effects of peer characteristics. Our design exploits admissions cutoffs for Boston and New York City’s heavily over-subscribed exam schools. Successful applicants near admissions cutoffs for the least selective of these schools move from schools with scores near the bottom of the state SAT score distribution to a school with scores near the median. Successful applicants near admissions cutoffs for the most selective of these schools move from above-average schools to schools with students drawn from the extreme upper tail. Exam school students can also expect to study with fewer nonwhite classmates than unsuccessful applicants. Our estimates suggest that the marked changes in peer characteristics at exam school admissions cutoffs have little causal effect on test scores or college quality. JEL Classification: I21, I28, C21 Keywords: human capital, peer effects, school quality Corresponding author: Joshua D. Angrist MIT Economics E52-391 77 Massachusetts Ave. Cambridge, MA, 02142 USA E-mail: [email protected]
* Our thanks to Kamal Chavda, Jack Yessayan, and the Boston Public Schools; and to Jennifer Bell-Ellwanger, Thomas Gold, Jesse Margolis, and the New York City Department of Education, for graciously sharing their data. The views expressed here are those of the authors and do not reflect the views of either the Boston Public Schools or the NYC Department of Education. We’re grateful for comments from participants in the June 2010 Tel-Aviv Frontiers in the Economics of Education conference, the Summer 2011 NBER Labor Studies workshop, and the December 2011 HongKong Human Capital Symposium. Thanks also go to Jonah Rockoff for comments and data on teacher tenure in NYC. We’re also grateful to Daron Acemoglu, Gary Chamberlain, Yingying Dong, Glenn Ellison, and Guido Imbens for many helpful discussions. Weiwei Hu and Miikka Rokkanen provided superb research assistance. Pathak thanks the Graduate School of Business at Stanford University, where parts of this work were completed, and the NSF for financial support.

1 Introduction
A three bedroom house on the northern edge of Newton, Massachusetts costs $412,000 (in 2008
dollars), while across the street, in Waltham, a similar place can be had for $316,000.1 Black (1999)
attributes this and many similar Massachusetts contrasts to differences in perceived school quality.
Indeed, 92 percent of Newton’s high school students are graded proficient in math, while only 78
percent are proficient in Waltham. These well-controlled comparisons suggest something changes at
school district boundaries. Parents looking for a home are surely aware of achievement differences
between Newton and Waltham, and many are willing to pay a premium to see their children attend
what appear to be better schools. At the same time, it’s clear that differences in achievement levels
can be a highly misleading guide to value-added, a possibility suggested by theoretical and empirical
analyses in Rothstein (2006), Hastings, Kane, and Staiger (2009), and MacLeod and Urquiola (2009),
among others.
Similar observations can be made regarding racial composition and home prices. For over a half-
century, American education policy has struggled with the challenge of racial integration. The view
that racial mixing contributes to learning motivates a range of social interventions ranging from busing
and court supervision of school assignment, to Boston’s iconic Metco program, which sends minority
children to mostly white suburban districts. In this context as well, home-buying parents vote with
their housing dollars – typically for more white classmates – as shown recently by Boustan (2012)
using cross-border comparisons in the spirit of Black (1999).2
An ideal experiment designed to reveal causal effects of peer characteristics would randomly assign
the opportunity to attend schools with high-achieving peers and fewer minority classmates. The
subjects of such a study should be a set of families likely to take advantage of such an opportunity.
Imagine sampling parents in real estate offices choosing between homes in Newton and Waltham. We
might randomly offer a subset of those who settle for Waltham a voucher that entitles them to send
their children to Newton schools in spite of their Waltham address. This manipulation bears some
resemblance to the Moving to Opportunity (MTO) experiment, which randomly allocated housing
vouchers valid only in low-poverty neighborhoods. MTO was a complicated intervention, however,
that did not seek to manipulate the school environment in particular. In fact, peer achievement
changed surprisingly little for most school children in the MTO treatment group (see Kling, Liebman,
and Katz (2007) and Sanbonmatsu, Ludwig, Katz, Gennetian, Duncan, Kessler, McDade, and Lindau
(2011)).
While a perfect peer characteristics experiment seems hard to engineer, an important set of existing
institutions induces quasi-experimental variation that comes close to the ideal experiment. A network
of selective public schools in Boston and New York known as exam schools offer public school students
the opportunity to attend schools with much higher achieving peers. Moreover, in these mostly
1These are average prices of 42 three bedroom units in Newton and 27 units in Waltham, separated by 0.1 miles orless, as quoted on Greater Boston’s Multiple Listing Service for transactions between 1998-2008.
2Guryan (2004) finds that court-order integration schemes increase nonwhite high school graduation rates withouthurting whites, but evidence on the achievement consequences of busing for racial balance is mixed (Hoxby (2000) is aseminal study; see also references in Angrist and Lang (2004)).
1

nonwhite districts, exam schools have a markedly higher proportion of white classmates than do the
public schools that applicants are otherwise likely to attend. Of course, exam school admissions
are not made by random assignment; rather, students are selected by an admissions test with sharp
cutoffs for each school and cohort. This paper exploits these admissions cutoffs in a fuzzy regression
continuity design (RD) that identifies causal effects of peer achievement and racial composition for
applicants to the six traditional exam schools operating in Boston and New York. Application of RD
in this context generates a number of methodological challenges related to the real-world messiness of
school assignment and the exclusion restrictions used to interpret 2SLS estimates. Solutions for these
problems are detailed in the sections that follow.
2 Institutional Background
Boston’s three exam schools span grades 7-12. The best-known is the Boston Latin School, which
enrolls about 2,400 students. Seen by many as the crown jewel of Boston’s public school system,
Boston Latin School was named a top 20 U.S. high school in the inaugural 2007 U.S. News & World
Report school rankings. Founded in 1635, the Boston Latin School is America’s first public school and
the oldest still open (Goldin and Katz, 2008).3 Boston Latin School is a model for other exam schools,
including the Brooklyn Latin School, recently opened in New York (Jan, 2006). The second oldest
Boston exam school is Boston Latin Academy, formerly the Girls’ Latin School. Opened in 1877,
Latin Academy first admitted boys in 1972 and currently enrolls about 1,700 students. The John D.
O’Bryant High School of Mathematics and Science (formerly Boston Technical High) is Boston’s third
exam school; O’Bryant opened in 1893 and now enrolls about 1,200 students.
New York’s three original academic exam schools are Stuyvesant High School, Bronx High School
of Science, and Brooklyn Technical High School, each spanning grades 9-12. The New York exam
schools were established in the first half of the 20th century and share a number of features with
Boston’s exam schools. Stuyvesant and Bronx Science appear on Newsweek’s list of elite public high
schools and all three have been in the U.S. News & World Report rankings. Stuyvesant enrolls just
over 3,000 students, Bronx Science enrolls 2,600-2,800 students, and Brooklyn Tech has about 4,500
students. New York opened three new exam schools in 2002: the High School for Math, Science and
Engineering at City College, the High School of American Studies at Lehman College, and Queens
High School for the Sciences at York College. In 2005, Staten Island Technical High School converted
to exam status, while the Brooklyn Latin School opened in 2006. The admissions process for these new
schools is the same as for the three original exam schools, but we omit the new schools because they are
not as well established as New York’s traditional exam schools, and some have unusual characteristics
such as small enrollment. Finally, we’ve structured the New York analysis to parallel that for Boston.4
3Boston Latin School was established one year before Harvard College. Local lore has it that Harvard was foundedto give graduates of Latin a place to continue their studies.
4Estimates including New York’s new exam schools are similar to those generated by the three-school sample. Otherselective New York public schools include the Fiorello H. LaGuardia High School, which focuses on visual and performingarts and admits students by audition, and Hunter College High School, which uses a unique admissions procedure andis not operated by the New York Department of Education.
2
Boston Public Schools span a range of peer achievement unique among American urban districts.
Like many urban students elsewhere in the U.S., Boston exam school applicants who fail to enroll in
an exam school end up at schools with average SAT scores well below the state average, in this case,
at schools close to the 5th percentile of the distribution of school averages in the state. By contrast,
O’Bryant’s average SAT falls at the 40th percentile of the state distribution of averages, a big step up
from the overall BPS average, but not elite in an absolute sense. Successful Boston Latin Academy
applicants find themselves at a school with average SATs around the 80th percentile of the distribution
of school means, while the average SAT at the Boston Latin School is the fourth highest among public
schools in the state.
Data from New York’s exam schools enrich this picture by allowing us to evaluate the impact of
peer exposure in the extreme upper tail. The least selective of New York’s three traditional exam
schools, Brooklyn Tech, is attended by students with average SATs at around the 99th percentile of
the distribution of average SATs in New York state, a level comparable to the Boston Latin School.
Successful applicants to Brooklyn Tech typically move from schools where peer achievement is around
the 30th percentile of the school average SAT distribution. Students at the two most selective New
York exam schools are exposed to the brightest of classmates, with the Bronx Science average at
percentile 99.9, while Stuyvesant has the highest average SAT scores in New York state, placing it
among the top 5 public schools nationwide.
As far as we know, ours is one of two RD analyses of achievement effects at highly selective
U.S. exam schools. In independent contemporaneous work, Dobbie and Fryer (2011) estimate the
reduced-form impact of admissions offers at New York exam schools; their analysis shows no impact
on college enrollment or quality. Selective high schools have also been studied elsewhere. Pop-Eleches
and Urquiola (2010) estimate the effects of attending selective high schools in Romania, where the
admissions process is similar to that used by Boston’s exam schools. Selective Romanian high schools
appear to boost scores on the high-stakes Romanian Baccalaureate test. Jackson (2010) similarly
reports large score gains for those attending a selective school in Trinidad and Tobago. On the other
hand, Clarke (2008) finds only modest score gains at selective UK schools. Likewise, using admissions
lotteries to analyze the consequences of selective middle school attendance in China, Zhang (2010)
finds no achievement gains for students randomly offered seats at a selective school. In contrast with
our work, none of these studies interpret the reduced-form impact of exam school offers as operating
through specific causal channels for which there is a clear first stage.5
Selective institutions are more commonly found in American higher education than at the sec-
ondary level. Dale and Krueger (2002) compare students who were accepted by the same sets of
colleges but made different choices in terms of selectivity. Perhaps surprisingly, this comparison shows
no earnings advantage for those who went to more selective schools, with the possible exceptions of
minority and first-generation college applicants in more recent data (Dale and Krueger, 2011). In con-
trast with the Dale and Krueger results, Hoekstra (2009) reports that graduates of a state university’s
5Pop-Eleches and Urquiola (2010) report a peer achievement first-stage in their analysis of Romanian selective schools,but the effect of a Romanian exam school offer on peer composition is small and, as the authors note, unlikely to explainany exam school reduced form.
3

relatively selective flagship campus earn more later on than those who went elsewhere.
Finally, a large literature looks at peer effects in educational settings. Examples include Hoxby
(2000), Hanushek, Kain, Markman, and Rivkin (2003), Angrist and Lang (2004), Hoxby and Weingarth
(2006), Lavy, Silva, and Weinhardt (2009), Ammermueller and Pischke (2009), Imberman, Kugler, and
Sacerdote (2012), and Carrell, Sacerdote, and West (2012). Findings in the voluminous education peer
effects literature are mixed and not easily summarized. It seems fair to say, however, that the likelihood
of omitted variables bias in naive estimates motivates much of the econometric agenda in this context.
Economists have also studied tracking. A recent randomized evaluation from Kenya looks at tracking
as well as peer effects, finding gains from the former but contradictory evidence on the latter (Duflo,
Dupas, and Kremer, 2011).
The exam schools of interest here are also associated with marked changes in peers’ racial mix. In
our fuzzy RD setup, which uses exam school admissions offers to construct instrumental variables for
peer characteristics, enrollment compliers at Boston Latin Academy are exposed to a peer group that
falls from two-thirds to 40 percent black and Hispanic, while the proportion minority falls by half,
from 40 to 20, for Latin School compliers.
Changes in peer composition are not necessarily the only component of the education production
function associated with changes attendance at the exam schools in our sample. Still, our research
design holds many potential confounders fixed, including family background, ability, and residential
sorting. The principle source of omitted variables bias, interpreted here as violations of an exclusion
restriction, are changes in resources or curriculum. We argue that any bias from omission of these
factors is likely to be positive, reinforcing our interpretation of the findings as offering little evidence
for peer achievement or racial composition effects on state test scores, PSAT, SAT, and AP scores, or
college quality. We also show that 2SLS estimates are free of omitted variables bias if other changes
are themselves a consequence of peer composition. Importantly, most of the 2SLS estimates reported
here are reasonably precise; we can rule out relatively modest peer composition effects.
The next section describes Boston data and school assignment. A complication here is Boston’s
deferred acceptance (DA) assignment algorithm. As a preliminary to the estimation of causal effects,
we develop an empirical strategy that embeds DA in an RD framework.
3 Boston Data and Admissions Process
3.1 Data
We obtained registration and demographic information for BPS students from 1997-2009. BPS reg-
istration data are used to determine whether and for how many years a student was enrolled at a
Boston exam school. Demographic information in the BPS file includes race, sex, and subsidized
lunch, limited English proficiency, and special education status.
BPS demographic and registration information were merged with Massachusetts Comprehensive
Assessment System (MCAS) scores using student identification numbers.6 The MCAS database con-
6MCAS is a state-mandated series of achievement tests used to assess Adequate Yearly Progress (AYP) for purposes
4

tains raw scores for math, English Language Arts (ELA), Writing, and Science. MCAS tests are taken
each spring, typically in grades 3-8 and 10. The current testing regime covers math and English in
grade 7, 8, and 10 (in earlier years, there were fewer tests). Baseline (i.e., pre-application) scores for
grade 7 applicants are from 4th grade. Baseline English scores for 9th grade applicants come from
8th grade math and 7th grade English tests (the 8th grade English exam was introduced in 2006).
We lose some applicants with missing baseline scores. Other outcomes include the Preliminary SAT
(PSAT), the SAT Reasoning Test, and Advanced Placement exams from the College Board. For the
purposes of our analysis, scores were standardized by subject, grade, and year to have mean zero and
unit variance in the BPS population. Data on college enrollment come from the National Student
Clearinghouse, as reported to BPS for their students.
Our analysis file combines student registration, test scores, and college outcome files with the BPS
exam school applicant file. The exam school applicant file records grade, year, sending school, ap-
plicants’ preference ranking of exam schools, applicants’ Independent Schools Entrance Exam (ISEE)
test scores, and each exam school’s ranking of its applicants. It’s this ranking variable that determines
exam school admissions decisions.
Our analysis sample includes BPS-enrolled students who applied for exam school seats in 7th grade
from 1997-2008 or in 9th grade from 2001-2007. We focus on applicants enrolled in BPS at the time
of application because we’re interested in how an exam school education compares to a traditional
BPS education. Moreover, private school applicants are much more likely to remain outside the BPS
district and hence out of our sample if they fail to get an exam school offer (about 45% of Boston
exam school applicants come from private schools). The 10% of applicants who apply to transfer from
one exam school to another are also omitted. Table A1 reports additional details on demographic
characteristics and baseline scores for all BPS students and Boston exam school samples. The Boston
data appendix explains the analysis file further, and describes test coverage and application timing in
detail. Figure A1 also provides information on the determinants of the application decision, illustrating
a steep gradient linking baseline MCAS scores and the decision to apply for an exam school seat. Most
applicants apply to all three schools. Figure A2 shows that stronger applicants rank more selective
schools more highly.7
3.2 Exam school admissions
Boston exam school admissions are based on the student-proposing DA algorithm, using student
preferences and school-specific rankings of applicants. DA complicates RD because it loosens the direct
link between the running variable and school admissions offers. Our econometric strategy therefore
begins by constructing analysis samples that restore a direct link, so that offers are sharp around
cutoffs. This approach seems likely to be useful elsewhere, since DA is now used for school assignment
in Chicago, Denver, New York City, Newark, and in more than a hundred districts throughout England
(Abdulkadiroglu, Pathak, and Roth, 2009; Pathak and Sonmez, 2008, 2011), as well as Boston.
of No Child Left Behind (NCLB) and includes a high-stakes exit exam in 10th grade.7Figure A1 plots application probabilities against 4th grade MCAS for a sample of non-LEP and non-special education
Boston 6th graders, while Figure A2 plots the probability of ranking a school first conditional on applying.
5

Boston residents interested in an exam school seat take the ISEE in the fall of the school year before
they would like to transfer. We focus on those applying for seats in 7th and 9th grade (O’Bryant also
accepts a handful of 10th graders). Successful 7th grade applicants transfer out of middle school, while
9th grade applicants are picking a high school. Exam school applicants also submit an official GPA
report, based on grades through the most recent fall term. Finally, exam school applicants are asked
to rank up to three exam schools. Each exam school running variable is a composite constructed as a
weighted average of applicants’ standardized math and English GPA, along with standardized scores
on the four parts of the ISEE (verbal, quantitative, reading, and math).
Let pik denote student i’s kth choice and represent i’s preference list by pi = (pi1, pi2, pi3), where
pik = 0 if the student’s rank order list is not complete. Applicants are ranked only for schools to
which they’ve applied, so applicants with the same GPA and ISEE scores might be ranked differently
at different schools depending on where they fall in each school’s applicant pool.8 Let cik denote
student i’s school-k specific ranking based on i’s composite score (where higher is better) and write
the vector of ranks as ci = (ci1, ci2, ci3), where cik is missing if student i did not rank school k.
Assignment is determined by student-proposing DA with student preferences over the three schools,
school capacities, and students’ (rank-ordered) school-specific composites as parameters. The algo-
rithm works as follows:
Round 1: Each student applies to her first choice school. Each school rejects the lowest-ranking
students in excess of its capacity, with the rest provisionally admitted (students not rejected at
this step may be rejected in later steps.)
Round ` > 1: Students rejected in Round `-1 apply to their next most preferred school (if any).
Each school considers these students and provisionally admitted students from the previous
round together, rejecting the lowest-ranking students in excess of capacity, producing a new
provisional admit list (again, students not rejected at this step may be rejected in later steps.)
The algorithm terminates when either every student is matched to a school or every unmatched student
has been rejected by every school he has ranked.
Let τk denote the lowest ranked student offered a seat at school k. We center school-specific
composite ranks around this cutoff using:
rik =100
Nk× (cik − τk), (1)
where Nk is the number of students who ranked school k. Scaled school-specific ranks rik equal zero
at the cutoff for school k, with non-negative values indicating students who ranked and qualified for
admission at that school. A dummy variable qi(k) = 1[cik ≥ τk] indicates that student i qualified for
school k by clearing τk (when k is not ranked by i, qi(k) is zero).
8School-specific running variables arise because schools standardize GPA and ISEE scores among only their applicants,implicitly generating school-specific weights in the composite formula.
6

Students who ranked and qualified for a school are not offered a seat at that school if they obtain
an offer at a more preferred school. With three schools ranked, applicant i can obtain an offer at
school k in three ways:
• The applicant ranks school k as her top choice and qualifies: ({pi1 = k} ∩ {qi(k) = 1}).
• The applicant doesn’t qualify for her top choice, ranks school k as her second choice, and qualifies
there: ({qi(pi1) = 0} ∩ {pi2 = k} ∩ {qi(k) = 1}).
• The applicant doesn’t qualify at her top two choices, ranks school k as her third choice, and
qualifies there: ({qi(pi1) = qi(pi2) = 0} ∩ {pi3 = k} ∩ {qi(k) = 1}).
To summarize these relationships, let Oi denote the identity of student i’s offer, with the convention
that Oi = 0 means the student receives no offer.9 DA then produces the following offer rule:
Oi =J∑
j=1
pijqi(pij)
[j−1∏`=1
(1− qi(pi`))].
The sample for whom offers at school k are sharp in the sense of being deterministically linked
with k’s running variable - a group we refer to as the sharp sample for school k - is the union of three
sets of applicants:
• Applicants who rank k first, so (pi1 = k)
• Applicants who didn’t qualify for their top choice and rank k second, so (qi(pi1) = 0 ∩ pi2 = k)
• Applicants who didn’t quality for their top two choices and rank k third, so ((qi(pi1) = qi(pi2) =
0) ∩ pi3 = k).
Applicants can be in multiple sharp samples. For example, a student who ranked Boston Latin
first, but did not qualify there, is also in the sharp sample for Latin Academy if Latin Academy is her
second choice.
An offer dummy Zik indicates applicants offered a seat at school k, defined separately for each
school and sharp sample. This is the instrumental variable in the fuzzy RD strategy used here. Note
that Zik = 0 for a student who qualifies at k, but is not in the k sharp sample. Within sharp
samples, the discontinuity sample consists of applicants ranked in the interval [−20,+20]. Applicants
outside this “Boston window” are well below or well above the relevant cutoffs. At the same time, the
[−20,+20] window is wide enough to allow for reasonably precise inference.
Figure 1A plots offers as a function of scaled composite ranks in sharp samples, confirming the
sharpness of offers in these samples. Plotted points are conditional means for all applicants in a one-
unit binwidth similar to the empirical conditional mean functions reported in Lee, Moretti, and Butler
(2004) and a conditional mean function smoothed using local linear regression (LLR). Specifically, for
9For the purposes of this formula, we adopt the convention that∏0
`=1 a` = 1.
7

school k, data in the Boston window were used to construct estimates of E[yi|rik], where yi is the
dependent variable and rik is the running variable. The LLR smoother uses the edge kernel,
Kh(rik) = 1{∣∣∣rik
h
∣∣∣ ≤ 1}·(
1−∣∣∣rikh
∣∣∣),where h is the bandwidth. In a RD context, LLR has been shown to produce estimates with good
properties at boundary points (Hahn, Todd, and van der Klaauw (2001) and Porter (2003)). The
bandwidth used here is a version of the DesJardins and McCall (2008) bandwidth, studied by Im-
bens and Kalyanaraman (2010) (IK), who derive optimal bandwidths for sharp RD using a mean
square-error loss function with a regularization adjustment (hereafter, DM). This DM smoother (which
generates somewhat more stable estimates than the bandwidth IK prefer) is also used to construct
non-parametric RD estimates, below.
In sharp samples, offers are determined by the running variable, but exam school enrollment
remains fuzzy, that is, probabilistic. Specifically, not all offers are accepted. Figure 1B shows that
applicants scoring just above admissions cutoffs are much more likely to enroll in a given school than
are those just below, but enrollment rates among the offered are below one. Enrollment rates at
other schools also change around each school-specific cutoff. Figure 1C puts these pieces together by
plotting the probability of enrollment in any exam school. Overall exam school enrollment jumps at
the O’Bryant and Latin Academy cutoffs, but changes little at the Latin School cutoff because those
to the left of this cutoff are very likely to enroll in either O’Bryant or Latin Academy.
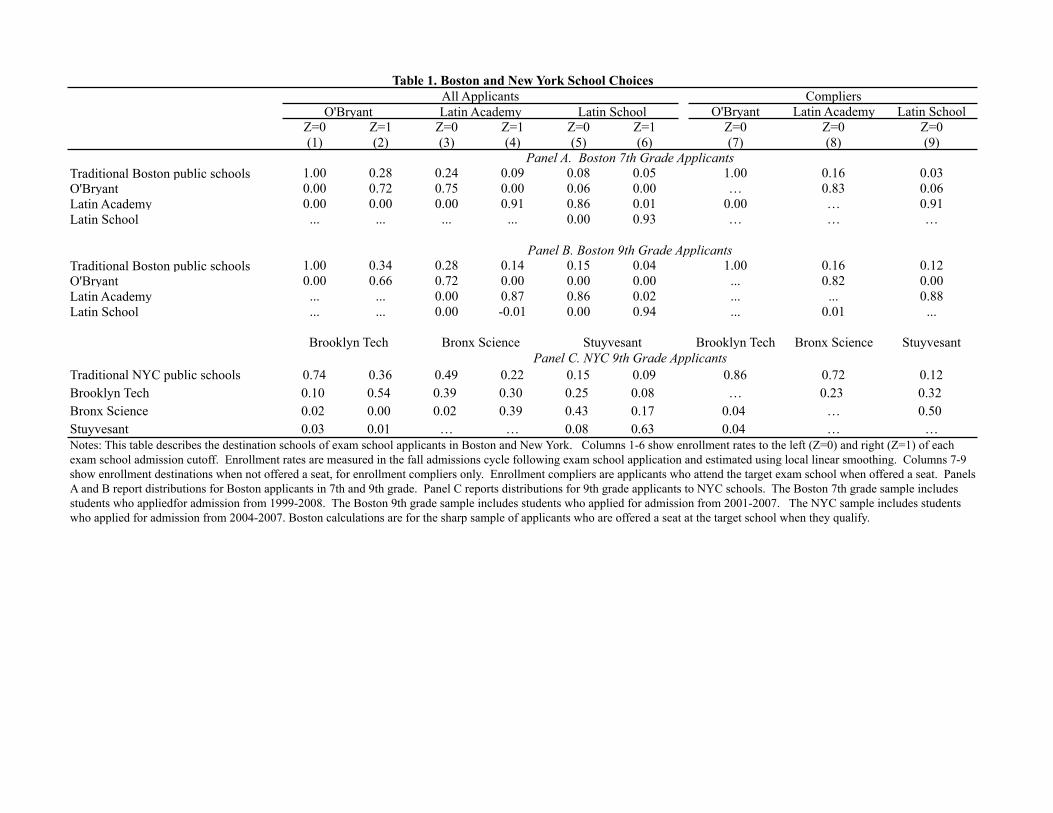
The effect of qualification on enrollment is detailed further in Table 1. This table reports LLR
estimates of school-specific enrollment rates in the neighborhood of each school’s cutoff. Among
qualifying 7th grade applicants in the O’Bryant sharp sample, 72% enroll in O’Bryant, while the
remaining 28% enroll in a regular BPS school. 91% of those qualifying at Latin Academy enroll there
the following fall, while 93% qualifying at Latin School enroll there. Many of those not offered seats at
one exam school end up in another, mostly the next school down in the hierarchy of school selectivity.
Our fuzzy RD strategy uses exam school offer dummies as instruments for exam school exposure.
Table 1 therefore also describes destination schools in the relevant subpopulation of compliers associ-
ated with this approach. Here, compliers are defined as applicants to school k who enroll there when
offered, but go elsewhere otherwise. Complier enrollment outcomes are estimated using the IV strategy
described in Abadie (2003), where a school-specific enrollment dummy is the endogenous variable.10
Column (7) of Table 1 shows that among O’Bryant compliers, the counterfactual for everyone is reg-
ular public school. Among Latin Academy compliers, the counterfactual is mostly O’Bryant, while
among Latin School compliers, the counterfactual is mostly Latin Academy. This serves to highlight
the progressive nature of the Boston exam school “experiment”: only among O’Bryant compliers do
we get to compare exam school and traditional public school directly. At the same time, as we show
below, movement up the ladder of exam school selectivity in both cities is associated with dramatic
10Specifically, compliers are defined as follows. Let D1i denote exam school enrollment status when the instrument Zi
is switched on and D0i denote exam school enrollment status when the instrument Zi is switched off. Compliers haveD1i = 1 and D0i = 0. Although the compliant population cannot be enumerated, characteristics of this population arenon-parametrically identified and easily estimated.
8

changes in peer composition.
3.3 The Exam School Environment
The peer achievement first stage behind our fuzzy RD identification strategy is described in Figure
2A. This figure plots peer mean baseline math scores for applicants in the sharp sample who are on
either side of admissions cutoffs (the peer mean is the average baseline score of same-grade peers in
the school enrolled in the year following the year of exam-school application). Baseline peer means
jump by roughly half a standard deviation at each admissions cutoff. In other words, among already
positively selected exam school applicants, peers at Latin Academy are ahead of non-exam BPS peers
by a full standard deviation, while peers at Latin School are ahead of non-exam BPS peers by about
1.5σ. The jump in peer mean ELA scores (not shown) is similar to that for math.
The proportion nonwhite among exam school students has often been a lightning rod for contro-
versy. Beginning in the 1970s, Boston’s court-mandated desegregation plan maintained the proportion
black and Hispanic in exam schools at roughly 35%. Racial preferences were challenged in 1996, how-
ever, and Boston exam school admissions have ignored race since 1999 (Boston Public Schools, 2007).
In our sample, drawn from years after racial preferences were abandoned, the proportion of black and
Hispanic peers drops sharply at exam school cutoffs, a fact documented in Figure 2B. The proportion
non-white falls by about 10 percentage points at the O’Bryant cutoff, with even larger drops at the
Latin Academy and Latin School cutoff, on the order of 25 percent.
Additional features of the exam school environment are summarized in Table 2, focusing on enroll-
ment compliers as in columns (7)-(9) of Table 1. Table 2 documents marked shifts in peer achievement
and racial composition captured graphically in Figure 2. Other contrasts between the exam school
environment and regular public schools are less systematic. Class sizes for middle school applicants
tend to be larger at exam schools, but differences in size shrink in grade 9 and change little at the
Latin School cutoff. Likewise (see Table 7 below), among New York schools, only the Bronx Science
cutoff induces an marked increase, while class size falls slightly at Stuyvesant. Exam school teachers
tend to be older than regular public school teachers, as can be seen at the O’Bryant cutoff, but teacher
age changes little at the Latin Academy and Latin School cutoffs.
The large and systematic changes in peer composition at each cutoff and entry point motivate
our focus on peers as the primary mediator of the exam school treatment. Before turning to a 2SLS
analysis that treats peer composition as the primary causal channel for exam school effects, however,
we begin with reduced form estimates.
4 Reduced Form Achievement Effects
4.1 Boston Estimates
We constructed parametric and non-parametric RD estimates of the effect of an exam school offer
using the normalized composite rank as the running variable. We refer to this initial set of estimates
as “reduced form” because they capture the overall effect of an exam school offer, without adjustment
9

for the relationship between offers and mediating variables. As noted in the recent RD survey by
Lee and Lemieux (2010), parametric and non-parametric approaches are complementary, providing a
mutually reinforcing specification check.
The parametric estimating equation for applicants in the sharp sample at school k is
yitk = αtk +∑j
δjkdij + (1− Zik)f0k(rik) + Zikf1k(rik) + ρkZik + ηitk, (2)
where the variable Zik is an indicator for cik ≤ τk and the coefficient of interest is ρk. Equation
(2) controls for test year effects at school k, denoted αtk, and for the year and grade of application,
indicated by dummies, dij . (These are included for consistency with some of the over-identified 2SLS
models discussed below.)11 The effects of the running variable at school k are controlled by a pair of
third-order polynomials that differ on either side of the cutoff, specifically
fjk(rik) = πjkrik + ξjkr2ik + ψjkr
3ik; j = 0, 1. (3)
Non-parametric estimates differ from parametric in three ways. First, they narrow the Boston win-
dow when the optimal data-driven bandwidth falls below 20.12 Second, our non-parametric estimates
use a tent-shaped edge kernel centered at admissions cutoffs instead of the uniform kernel implicit
in parametric estimation. Finally, non-parametric models control for linear functions of the running
variable only, omitting higher-order terms. We can write the non-parametric estimating equation as
yitk = αtk +∑j
δjkdij + γ0k(1− Zik)rik + γ1kZikrik + ρkZik + ηitk,
= αtk +∑j
δjkdij + γ0krik + γ∗kZikrik + ρkZik + ηitk (4)
for each of the three schools indexed by k. Non-parametric RD estimates come from a kernel-weighted
least squares fit of equation (4).
MCAS Scores
Except in the plots for 10th grade English, which show jumps at two out of three cutoffs, visual
reduced forms offer little evidence of marked discontinuities in MCAS scores. This can be seen in in
Figures 3A and 3B for middle school and Figures 4A and 4B for high school. Jumps in smoothed
scores at admissions cutoffs constitute non-parametric estimates of the effect of an exam school offer
in the sharp sample. The corresponding estimates, reported in Table 3, tell the same story. Few of
the estimates are significantly different from zero and some of the significant effects at Latin School
are negative (for example, Latin School effects on 10th grade math and middle school English). Most
of the estimates are small and some are precise enough to support a conclusion of no effect.
11The over-identified 2SLS models discussed in Section 5 use interactions between exam offer and applicant cohort asadditional instruments.
12The DM bandwidths for Table 3 range from about 9.6 to 36.9.
10

In an effort to increase precision, we also constructed estimates pooling applicants to all three
Boston exam schools. The pooled estimating equations are the same as equations (2) and (4), but with
a single offer effect, ρ. These specifications interact all control variables, including running variables,
with application-school dummies.13 The kernel weight for the stack becomes Khk(rik) where school k’s
bandwidth hk is estimated separately in a preliminary step. Because the pooled model includes a full
set of main effects and interactions for school-specific subsamples, we can think of the estimate of ρ in
this stack as a variance-of-treatment-weighted average of school-specific estimates.14 Note that some
students appear in more than one sharp sample; each student contributes up to three observations
for each outcome. Our inference framework takes account of this by clustering standard errors by
student.
Paralleling the pattern shown in the Boston reduced form figures, offer effects from the stacked
models, reported in columns labeled “All Schools” in Table 3, are mostly small, with few significantly
different from zero.15 The large significant estimate for 10th grade English scores, a result generated
by both parametric and non-parametric models, is partly offset by marginally significant negative
effects on 7th and 8th grade English, so that when all scores are pooled the overall estimate is close
to zero (scores from different years and grades are stacked in much the same way that schools are
stacked). Importantly, the combination of school- and score-pooling generates precise estimates, with
standard errors on the order of 0.027 for math and 0.028 for English.
Estimates for black and Hispanic applicants to exam schools, reported in appendix Table A4, are
in line with the full-sample findings for math and middle-school ELA scores. Also, consistent with
the full-sample results for 10th grade ELA, an exam school education seems especially likely to boost
10th grade English scores for blacks and Hispanics, with an estimated effect of 0.17σ, but there are
some significant negative estimates as well.
Appendix A reports results from an exploration of possible threats to a causal interpretation of
the reduced form estimates in Table 3. Specifically we look for differential attrition (i.e., missing score
data) to the right and left of exam school cutoffs (see Table A2) and for discontinuities in covariates
(see Table A3). Receipt of an exam school offer makes attrition somewhat less likely, but the gaps
are small and unlikely to impart substantial selection bias in estimates that ignore them.16 A handful
of covariate contrasts also pop up as significantly different from zero, but the spotty nature of these
gaps seem consistent with the notion that comparisons to the left and right of exam school admissions
cutoffs are indeed a good experiment.
A related threat to validity comes from the possibility that marginal students switch out of exam
schools at an unusually high rate. If school switching is harmful, excess switching might account for
findings showing little in the way of score gains. As it turns out, however, exam school applicants who
clear admissions cutoffs are less likely to switch through grade 12 than are traditional BPS students.
13In the stacked analysis, an observation from the sharp sample for school k is associated with the running variablefor that school. Other running variables are switched off for that observation by virtue of the interactions.
14Variance-weighting is a property of regression models with saturated controls; see, e.g., Angrist (1998).15Unreported estimates for HS MCAS Science tests offer little evidence of positive effects.16Lee (2009) bounds confirm this. Also worth noting is the fact that F-tests for the joint significance of differential
attrition in MCAS reduced forms generate p-values of about 0.2 or higher.
11

The impact on 9-12 persistence increases by about around 6 percentage points for successful 9th grade
applicants, while 7-12 persistence increases by 25 percent among 7th grade applicants, though this
later increase is due in part to the fact that exam school students do not switch schools in grade 9.17
High Achievers
In effort to provide additional evidence on effects across quantiles of the applicant ability distribution,
we exploit the fact any single test is necessarily a noisy measure of ability. Although we can’t construct
(non-parametric) RD estimates for, say, O’Bryant students with ISEE scores in the upper tail of the
score distribution, we can look separately at subsamples of students with especially high baseline
MCAS scores. This approach operationalizes a suggestion in Section 3.3 of Lee and Lemieux (2010)’s
recent survey of RD methods, which points out that a test score running variable can be seen as a
noisy measure of an underlying ability control. Here, we exploit the fact that some in the high-baseline
group are ultra-high achievers who earned marginal ISEE scores by chance.
The average baseline score for students in the upper half of the baseline MCAS distribution (among
all applicants) hovers around 1.2−1.4σ in both math and English. Table 4 shows that this is remarkably
close to the average baseline achievement level among students enrolled in exam schools. Importantly,
MCAS scores remain informative even for these high achievers: no more than one third top out
in the sense of testing at the Advanced (highest) MCAS proficiency level. Likewise, MCAS remains
informative even for applicants in the upper baseline MCAS quartile, where average baseline scores are
0.5-0.6σ beyond those of the average among students enrolled in exam schools at grade 7. (Note also
that applicants in these groups are exposed to almost exactly the same changes in peer composition
as applicants in the full sample.)
Perhaps surprisingly, RD estimates for applicants in the upper half and upper quartile of the
baseline score distribution come out similar to those for the full sample. These results, reported in
columns (3) and (5) of Table 4, are mostly negative with few significantly different from zero. The
exception again is a significant positive effect for 10th grade ELA. At the same time, the sample of
high achievers generates a significant negative estimate of effects on middle school ELA – an effect of
roughly the same magnitude as the positive ELA estimate for 10th graders. Thus, even in a sample
of ultra high (baseline) achievers, there is little evidence of a consistent exam school boost.
PSAT, SAT, and AP Exam Scores
With the exception of the 10th grade test that also serves an as an exit exam, MCAS scores are only
indirectly linked to ultimate educational attainment. We therefore look at other indicators of human
capital and learning. The first of these is the PSAT, which serves as a warmup for the SAT and is
used in the National Merit scholarship program; the second is the SAT.18
17These estimates come from a non-parametric reduced form analysis similar to that used to construct the covariatebalance and attrition estimates in the appendix.
18The correlation between 10th grade MCAS math and PSAT or SAT is about 0.7; the correlation for English issimilar. These estimates come from models that control for application cohort and grade, test year, and demographics(race, gender, free lunch).
12

SAT and PSAT tests are usually taken towards the end of high school, so scores are unavailable
for the youngest applicant cohorts in our sample (appendix Table C2 lists the cohorts contributing
to each analysis sample). In March 2005, the College Board added a writing section to the SAT.
Since the writing section does not appear in earlier years, we focus on the sum of Critical Reading
(Verbal) and Mathematics scores, also known as the SAT Reasoning score. The average PSAT score
for applicants in the Boston window (Critical Reading and Math) is 91.3, while the average SAT score
is 1019. These can be compared with 2010 national average PSAT and SAT scores of 94 and 1017. As
with MCAS outcomes, PSAT and SAT scores are standardized to have mean zero and unit variance
among all test-takers in a given year.
About 70-80 percent of exam school applicants take the PSAT. O’Bryant offers increase PSAT
taking by about 6 points, but the estimated impact is zero in the All Schools models. These results
can be seen in Panel A of Table 5. Panel B of this table shows that exam school offers have no impact
on the likelihood applicants take the SAT. Selection bias in the sample of test takers therefore seems
unlikely to be a concern. Consistent with the MCAS results, there is no gain in either PSAT or SAT
results for test-takers near admissions cutoffs.
Motivated by the prevalence of AP courses in the Boston exam school curriculum, we estimated
exam school effects for AP participation rates and scores. As with the PSAT/SAT analysis, younger
cohorts are excluded since these tests are usually taken in grades 11-12 (again, appendix Table C2
gives details). AP tests are scored on a scale of 1-5, with some colleges granting credit for subjects in
which an applicant scores at least 3 or 4. At the high end, Latin School students take an average of
three to four AP exams.
Table 5 reports estimated AP effects on scores summed over all AP exams, as well as for a subset
of the most popular exams, defined as those taken by at least 500 students in our BPS score file. This
restriction narrows the set of exams to include widely-assessed subjects like math, science, english,
history, and economics, but omits music and art.19 Exam school offers fail to increase the number
of tests taken, though the sum of scores goes up at O’Bryant. The sum of scores on the most
commonly taken and probably the most substantively important tests are unaffected by exam school
qualification.20
Post-Secondary Outcomes
BPS matches data on seniors to National Student Clearinghouse (NSC) files, which record information
on enrollment at over 90 percent of American 4-year colleges and universities (coverage details appear
in Appendix Table C5). We used the BPS-NSC match to look at college attendance, excluding post-
secondary institutions that focus on technical and vocational training. Most Boston exam school
applicants go to college; roughly 60 percent to the left of the O’Bryant cutoff, and 90 percent to the
19Tests with at least 500 takers are Calculus AB/BC, Statistics, Biology, Chemistry, Physics B/C, English Languageand Composition, English Literature and Composition, European History, US Government and Politics, US History,Microeconomics, and Macroeconomics.
20There is also no evidence that exam offers increase test-taking on AP science, technology, engineering, and mathe-matics fields.
13
right of the Latin School cutoff. At the same time, Table 6, which reports estimated effects on post-
secondary outcomes, shows little evidence of an exam school treatment effect on college enrollment or
quality.21
4.2 New York Estimates
First stage and reduced form estimates for New York are presented in a format like that used for
Boston. New York data come from three sources: enrollment and registration files containing demo-
graphic information and attendance records; application and assignment files; and the Regents exam
file. Our analysis covers four 9th grade applicant cohorts (from 2004-2007), with follow up test score
information through 2009. The New York data appendix explains how these files were processed.
The New York exam school admissions process is simpler than the Boston process because selection
is based solely on the Specialized High School Achievement Test (SHSAT), whereas Boston schools
rely on school-specific composites. New York 8th graders interested in an exam school seat take
the SHSAT and submit an application listing school preferences (we omit a handful of 9th grade
applicants). Students are ordered by SHSAT scores. Seats are then allocated down this ranking, with
the top scorer getting his first choice, the second highest scorer get his most preferred choice among
schools with remaining seats, and so on. There is no corresponding “sharp sample” for New York
exam school applicants, since New York applicants rank many schools, both exams and others, and
we have no information on rankings beyond the fact of an application.22
New York admissions are based on a single underlying running variable, unlike the school-specific
running variables in Boston. As in Boston, however, we standardized and centered the running variable
separately for each New York school. Stuyvesant is the most competitive exam school, so the minimum
score needed to obtain an offer exceeds the minimum at Bronx Science and Brooklyn Technical.
School-specific running variables are constructed as in Boston (equation 1). These normalized running
variables equal zero at each cutoff, with positive values indicating applicants offered a seat. Also as in
Boston, applicants might qualify for placement at one school, but rank a less competitive school first
and get an offer at that school instead.
New York cutoffs are typically separated by six standardized rank units, so the estimation window
for each of the New York schools is set at [+6,−6]. The New York window is narrower than the Boston
window of +/-20 but still includes many more applicants.
Figure 5A shows how New York offers are related to the running variable. Here, the dots indicate
averages in half-unit bins, while smoothing uses LLR with the DM bandwidth generated in the esti-
mation sample. Own-school offers jump at each cutoff. Unlike in Boston, however, offer rates among
qualified applicants are less than one because the sample here is not sharp; that is, some New York
21Selectivity is defined by Barron’s. Boston University and Northeastern University are examples of “Highly Compet-itive” schools. The University of Massachusetts-Boston and Emmanuel College are “Competitive.”
22The NYC exam school assignment mechanism is a serial dictatorship with students ordered by SHSAT score. Studentsapply for exam schools at the same time that they rank regular New York high schools, and may receive offers from both.Abdulkadiroglu, Pathak, and Roth (2009) describe how exam school admissions interact with admissions at regular highschools. In the notation introduced in Section 3, the information available for New York is Zik, but the underlyingorderings pi are not.
14

applicants who qualify at the focal school in each panel have ranked another school at which they
qualify higher. Five or six points to the right of the Brooklyn Tech and Bronx Science cutoffs, offers
at the next most selective exam school up replace those at the focal school in each panel.
Offers at each exam school lead to enrollment at that school, though the offer-to-enrollment con-
version rate differs across schools. This pattern is documented in Figure 5B. The enrollment jumps
at the Brooklyn Tech and Bronx Science cutoffs are lower than the corresponding offer jumps, though
both of these enrollment jumps remain substantial. The Stuyvesant enrollment jump is about as large
as the offer jump, implying that nearly all applicants offered a seat at Stuyvesant choose to enroll
there.
New York has considerable school choice, with other selective schools outside the set of traditional
exam schools. Admission to one of the three traditional exam schools schools is nevertheless associated
with a sharp jump in peer achievement, as can be seen in Figure 6A. The average baseline math score
of peers increases by about 0.5σ at the Brooklyn Tech cutoff. The jump is smaller for Bronx Science
and Stuyvesant, though still substantial at about 0.2σ. Peer means for English move similarly. As at
Boston’s exam school cutoffs, qualification for a New York exam school induces a sharp drop in the
proportion of peers who are nonwhite. This can be seen in Figure 6B, which shows a 20 percentage
point drop at Brooklyn Tech, and 10 percentage point drops at Bronx Science and Stuyvesant.
New York’s exam schools expose successful applicants to a number of changes in school environ-
ment, but here too the largest and most consistent changes involve peer achievement and race. This
can be seen in Table 7, which characterizes the changes in school environment experience by New York
exam school enrollment compliers. Class size changes less at New York exam school cutoffs than at
Boston’s.
Finally, like Boston, reduced form estimates for New York offer little evidence that exam schools
boost achievement. This is apparent in Figures 7A and 7B, which plot performance on the Advanced
Math and English components of the New York Regents exam against the standardized New York
running variables. This pattern is echoed in Table 8, which reports parametric and DM estimates of
offer effects on Advanced Math and English as well as for other Regents test outcomes. The estimates
here come from equations similar to (2) and (4) fit to samples of New York applicants in a [−6,+6]
interval. These estimates are precise enough to rule out even modest score gains. For example, the
DM estimate of the effect on English scores in the stacked sample is 0.01σ, with a standard error also
around 0.01. The few significant pooled estimates in Table 8 are negative.
5 Peers in Education Production
The reduced form estimates reported here show little evidence of an impact of exam school offers on
test scores and post-secondary outcomes. Exam school offer effects are relevant for policy questions
related to exam school expansion, including contemporary proposals to lower admissions cutoffs and
increase the number of exam school seats.23 At the same time, we’re also interested in the general
23Vaznis (2009) discusses efforts to add 6th grade cohorts at Boston exams, while Hernandez (2008) reports on proposalsto increase minority representation at New York’s exam schools. Further afield, Lutton (2012) describes a proposed exam
15

lessons that might emerge from an exam school analysis.
What is the exam school treatment? An overall change in school quality is hard to document or
even define, but it’s clear that exam school students gain the opportunity to study with high-achieving
achieving peers. The peer achievement effects documented here emerge at each exam school admissions
cutoff. In other words, each cutoff induces a “peer achievement experiment,” in spite of the fact that
overall exam school admission probabilities jump markedly only at cutoffs for the least selective schools
(O’Bryant in Boston and Brooklyn Tech in New York). Jumps in peer achievement allow us to identify
causal peer effects. Moreover, because the six exam school cutoffs under consideration intersect the
applicant ability distribution over a wide range, we’re in a position to consider the extent to which
peer effects interact with applicants’ own ability.
In addition to manipulating peer achievement, admissions cutoffs induce a sharp change in racial
composition, with large shifts at each cutoff. The exam school racial mix partly reflects the selective
admissions policies that drive peer achievement. Because white applicants have higher test scores than
do nonwhites (in this case, black and Hispanic applicants), the enrolled population is disproportion-
ately white. Successful exam school applicants therefore receive the same sort of treatment generated
by our imaginary voucher experiment for Waltham homeowners on the Newton line: the opportunity
to attend school with fewer minority as well as higher-achieving classmates. These observations lead
to 2SLS specifications that take peer characteristics as the primary causal channel mediating exam
school offer effects.
The 2SLS estimates of peer achievement and racial composition effects reported here come from
specifications and samples paralleling those used for the pooled reduced form estimates reported in
Table 3 and 8 (pooling applicant grades and test years, as well as schools). All controls, including year
and grade of test, application cohort effects, and own- and other-school running variable controls, are
subsumed in a vector Xitj , with conformable coefficient vector Γj . The 2SLS second stage can then
be written,
yitj = Γ′jXitj + θpit + εitj , (5)
where pit are the endogenous variables to be instrumented and θ is the causal effect of interest.
The corresponding first stage equations include the same controls plus offer dummies as excluded
instruments.
A simple causal model of education production facilitates interpretation of 2SLS estimates of
equation (5). Let mi denote a k-dimensional vector of education inputs measured in the exam school
entry grade. These include peer achievement and race, measures of school quality, and teacher effects.
Our goal is to identify the causal impacts of variation in a subset of these inputs at a specific point in the
education profile, holding earlier inputs and family background fixed.24 A parsimonious representation
school expansion in Chicago.24Todd and Wolpin (2003) discuss the conceptual distinction between this type of interruption-based causal relationship
and a complete cumulative education production function.
16

of the education production function is:
yi = π′mi + ηi,
where ηi is the random part of potential outcomes under alternative assignments of the input bundle,
mi. We partition mi into observed peer achievement and racial composition, denoted pi, and k − 2
unobserved inputs, wi. That is,
mi = [p′i w′i]′,
so that
yi = β′pi + γ′wi + ηi, (6)
where wi is defined so that γ is positive.
The q × 1 (q ≥ 2) instrument vector in this context, zi, indicates exam school offers. Offers are
assumed to be independent of potential outcomes (ηi), without necessarily satisfying an exclusion
restriction. In other words, exam school offers, taken to be as good as randomly assigned in a non-
parametric RD setup, lead to exam school enrollment, which in turn changes peer characteristics
and perhaps other features of the school environment, denoted by wi. We summarize these changes
through the following first-stage relationships:
pi = θ′1zi + ν1i
wi = θ′2zi + ν2i,
where first-stage residuals are orthogonal to the instruments by construction, but possibly correlated
with ηi. The proposition below characterizes the causal effects captured by 2SLS given this structure:
Proposition 1. 2SLS estimates using zi as an instrument for pi in (6) omitting wi identify β + δ′γ,
where δ is the population 2SLS coefficient vector from a regression of wi on pi, using zi as instruments.
This is a 2SLS version of the omitted variables bias formula (see, for example, Angrist and Krueger,
1992). Proposition 1 implies that if δ is positive (because exam schools have better unmeasured
inputs), 2SLS estimates of peer effects omitting wi tend to be too big. The notion that omitted
variables are likely to be beneficial seems reasonable in this context; among other distinctions, Boston
and New York exam schools feature, to varying degrees, a rich array of course offerings, relatively
modern facilities, and a challenging curriculum meant to prepare students for college.
An alternative interpretation under somewhat stronger assumptions is based on the notion that any
input correlated with exam school offers is itself caused by pi. In other words, the relationship between
wi and exam school offers is a result of the effect of exam school attendance on peer characteristics
(exam school curricula are challenging because exam school students are high-achieving; the prevalence
of nonwhite students affects course content). Suppose the causal effect of pi on wi is described by a
17

linear constant effects model with coefficient vector λ. Then we have,
wi = λpi + ξi,
E[ziξi] = 0. (7)
This assumption generates a triangular structure which implies that 2SLS estimates combine both the
direct and indirect effects of peers, as described in Proposition 2:
Proposition 2. Given (7), 2SLS using zi as the instrument vector for pi in (6) omitting wi identifies
β + λ′γ, the sum of direct and indirect effects of peers, with no omitted variables bias.
Proposition 2 is a consequence of the fact that under assumption (7), δ becomes λ, the causal effect of
pi on wi. When other inputs are causally downstream to peer characteristics, 2SLS estimates of peer
effects omitting wi capture the total impact of randomly assigning pi.
Estimates
To maximize precision and to facilitate exploration of models with multiple endogenous variables, we
constructed 2SLS estimates using a combined Boston and New York sample, with six offer dummies as
instruments. The 2SLS specifications parallel those used to construct the single-city stacked (reduced
form) estimates, except that the stack now includes six schools. In addition to estimates using one offer
dummy for each school as instruments, we also report 2SLS estimates from more heavily over-identified
models adding interactions between offers and applicant cohort to the instrument list.
Table 9 reports first-stage estimates and the associated F statistics (adjusted, where appropriate,
for multiple endogenous variables), as well as second stage estimates. Consistent with the figures, the
first stage estimates show large, precisely estimated offer effects on on peer achievement and racial
composition. For example, an O’Bryant offer increases average baseline peer scores by over two-thirds
of a standard deviation, while the peer achievement gain is about 0.4σ at the Latin Academy cutoff,
and 0.6σ at the Latin School cutoff. Peer achievement also shifts sharply at New York cutoffs, though
less than in Boston. First-stages for racial composition show that offers induce a 12-24 percentage
point reduction in the proportion of non-white classmates at each Boston cutoff, and a 7-13 percentage
point reduction in New York.
Consistent with the reduced form offer estimates discussed in the previous section, 2SLS estimates
treating peer achievement as the single endogenous variable show no evidence of a statistically sig-
nificant peer effect. Importantly, however, the 2SLS estimates and the associated standard errors in
Table 9, on the order of 0.03, also provide a basis for comparisons. For example, these estimates allow
us to reject the corresponding large positive OLS estimates of peer effects reported as a benchmark in
our working paper, Abdulkadiroglu, Angrist, and Pathak (2011)). The small peer effects in Table 9
are also significantly different from estimates of conceptually similar achievement peer effects reported
elsewhere. Examples include Hoxby (2000) (0.3-0.5σ), Hanushek, Kain, Markman, and Rivkin (2003)
(0.15-0.24σ), and many other studies summarized in Sacerdote’s (2011) recent survey.
18

2SLS estimates of racial composition effects, reported in columns (2) and (7), likewise show no
statistically significant evidence of a substantial impact, though these are less precisely estimated than
the corresponding peer achievement effects. At the same time, we can easily rule out large negative ef-
fects of proportion nonwhites. (Compare, for example, Hoxby (2000), which reports estimates ranging
from -1 to -2 for black and Hispanic third graders).
Models with two endogenous variables capture pairs of causal effects at the same time. These
models, identified by variation at 6 admissions cutoffs, allow for the possibility that causal channels
are reinforcing or offsetting in a scenario where both vary. We also introduce a secular exam school
effect parameterized as operating through years of exam school enrollment. The secular enrollment
effect provides a simple adjustment for possible violations of the exclusion restriction in models with
specific causal channels. Results from models with multiple endogenous variables are naturally less
precise than the estimates generated by models with a single channel. Except possibly for a marginally
significant positive effect of proportion nonwhite on math scores in column (3), multiple-endogenous-
variable estimates are consistent with those generated by models allowing only a single causal channel.
6 Summary and Conclusions
The results reported here suggest an exam school education produces only scattered gains for ap-
plicants, even among students with baseline scores close to or above the mean in the target school.
Because the exam school experience is associated with sharp increases in peer achievement, these
results weigh against the importance of peer effects in the education production function. Our results
also fail to uncover systematic evidence of racial composition effects. The outcome most strengthened
by exam school attendance appears to be the 10th grade ELA score, a result driven by gains for
minorities. Given the history of racial preferences (and their more recent elimination) in Boston’s
exam schools, this finding seems worth further exploration. Overall, however, while the exam school
students in our samples clearly have relatively good outcomes, most of these students would likely
have done well without the benefit of an exam school education.
Of course, test scores and peer effects are only part of the story. It may be that preparation for
exam school entrance is itself worthwhile. The RD design captures the impact of peer composition
and possibly other changes at admissions cutoffs, while ignoring effects common to applicants on both
sides. Likewise, unique features of an exam school education may boost achievement in specific areas.
Students who attend Boston Latin School almost certainly learn more Latin than they would have
otherwise. The many clubs and activities at some exam schools may expose students to ideas and
concepts not easily captured by achievement tests or our post-secondary outcomes. It’s also possible
that exam school graduates earn higher wages, a question we plan to explore in future work. Still,
the estimates reported here suggest any labor market gains come through channels other than peer
composition and increased cognitive achievement.
Our results are relevant to the economic debate over school choice, as developed in analyses by
Kane and Staiger (2002), Hastings, Kane, and Staiger (2009), Hsieh and Urquiola (2006), Rothstein
(2006), and MacLeod and Urquiola (2009), among others. As with the jump in house prices at district
19

boundaries, heavy rates of exam school over-subscription suggest that parents believe peer composition
matters a great deal. The fact that we can largely rule out achievement gains from peer composition
suggests that parents either mistakenly equate attractive peers with high value added, or that they
value exam schools for reasons other than their impact on learning. Both of these scenarios reduce
the likelihood that school choice has strong salutary demand-side effects on education production.
Finally, our study makes a number of methodological contributions. As school choice has prolifer-
ated, so too has the use of sophisticated assignment mechanisms such as deferred acceptance. We’ve
shown how to craft a sharp regression discontinuity design from a deferred-acceptance allocation of
students to schools. In the spirit of a suggestion by Lee and Lemieux (2010), we’ve also shown how
the presence of a second running variable with substantive content similar to the operational running
variable facilitates an exploration of the external validity of regression discontinuity estimates.
20
O'Bryant Latin Academy Latin SchoolZ=0 Z=1 Z=0 Z=1 Z=0 Z=1 Z=0 Z=0 Z=0(1) (2) (3) (4) (5) (6) (7) (8) (9)
Traditional Boston public schools 1.00 0.28 0.24 0.09 0.08 0.05 1.00 0.16 0.03O'Bryant 0.00 0.72 0.75 0.00 0.06 0.00 … 0.83 0.06Latin Academy 0.00 0.00 0.00 0.91 0.86 0.01 0.00 … 0.91Latin School ... ... ... ... 0.00 0.93 … … …
Traditional Boston public schools 1.00 0.34 0.28 0.14 0.15 0.04 1.00 0.16 0.12O'Bryant 0.00 0.66 0.72 0.00 0.00 0.00 ... 0.82 0.00Latin Academy ... ... 0.00 0.87 0.86 0.02 ... ... 0.88Latin School ... ... 0.00 -0.01 0.00 0.94 ... 0.01 ...
Brooklyn Tech Bronx Science Stuyvesant
Traditional NYC public schools 0.74 0.36 0.49 0.22 0.15 0.09 0.86 0.72 0.12 Brooklyn Tech 0.10 0.54 0.39 0.30 0.25 0.08 … 0.23 0.32Bronx Science 0.02 0.00 0.02 0.39 0.43 0.17 0.04 … 0.50Stuyvesant 0.03 0.01 … … 0.08 0.63 0.04 … …
Table 1. Boston and New York School Choices
Panel A. Boston 7th Grade Applicants
Panel B. Boston 9th Grade Applicants
Panel C. NYC 9th Grade Applicants
All Applicants CompliersO'Bryant Latin Academy Latin School
Brooklyn Tech Bronx Science Stuyvesant
Notes: This table describes the destination schools of exam school applicants in Boston and New York. Columns 1-6 show enrollment rates to the left (Z=0) and right (Z=1) of each exam school admission cutoff. Enrollment rates are measured in the fall admissions cycle following exam school application and estimated using local linear smoothing. Columns 7-9 show enrollment destinations when not offered a seat, for enrollment compliers only. Enrollment compliers are applicants who attend the target exam school when offered a seat. Panels A and B report distributions for Boston applicants in 7th and 9th grade. Panel C reports distributions for 9th grade applicants to NYC schools. The Boston 7th grade sample includes students who appliedfor admission from 1999-2008. The Boston 9th grade sample includes students who applied for admission from 2001-2007. The NYC sample includes students who applied for admission from 2004-2007. Boston calculations are for the sharp sample of applicants who are offered a seat at the target school when they qualify.

Z=0 Z=1 Z=0 Z=1 Z=0 Z=1(1) (2) (3) (4) (5) (6)
Baseline Peer Mean in Math -0.16 0.84 0.66 1.20 1.15 1.98Baseline Peer Mean in English -0.16 0.80 0.63 1.11 1.05 1.78Proportion Black or Hispanic 0.78 0.63 0.65 0.40 0.43 0.18
Proportion Free Lunch 0.77 0.68 0.68 0.45 0.48 0.27Proportion Female 0.46 0.56 0.55 0.56 0.56 0.55
Student/Teacher ratio 12.2 19.7 19.6 21.2 21.3 22.0Teachers licensed to teach assignment 88.9 97.4 96.2 95.4 96.2 96.2Teachers highly qualified in core subject 90.3 92.6 93.7 95.2 95.5 95.0
Proportion of teachers 40 and older 0.42 0.63 0.65 0.51 0.54 0.53Proportion of teachers 48 and older 0.28 0.51 0.52 0.38 0.41 0.41Proportion of teachers 56 and older 0.10 0.27 0.28 0.19 0.20 0.21
Baseline Peer Mean in Math -0.31 0.87 0.75 1.03 0.90 1.75Baseline Peer Mean in English -0.21 0.72 0.58 0.99 0.86 1.40Proportion Black or Hispanic 0.81 0.67 0.68 0.41 0.46 0.17
Proportion Free Lunch 0.57 0.55 0.49 0.45 0.43 0.26Proportion Female 0.48 0.58 0.58 0.58 0.58 0.55
Student/Teacher ratio 17.7 19.9 18.6 21.2 20.8 22.1Proportion of teachers licensed to teach assignment 0.86 0.98 0.97 0.95 0.95 0.96Proportion of teachers highly qualified in core subject 0.85 0.94 0.91 0.95 0.93 0.95
Proportion of teachers 40 and older 0.21 0.65 0.63 0.54 0.54 0.54Proportion of teachers 48 and older 0.17 0.52 0.51 0.40 0.41 0.42Proportion of teachers 56 and older 0.06 0.27 0.25 0.18 0.20 0.21Notes: This table shows descriptive statistics for Boston enrollment compliers to the left (Z=0) and right (Z=1) of admission cutoffs at the three Boston exam schools. Student-weighted average characteristics of teachers and schools were constructed from data posted at http://profiles.doe.mass.edu/ state_report/teacherdata.aspx. Teachers licensed in teaching assignment describes the percent of teachers who are licensed with Provisional, Initial, or Professional licensure to teach in the subject(s) in which they are posted. Core classes taught by highly qualified teachers is the percent of core academic classes (defined as English, reading or language arts, mathematics, science, foreign languages, civics and government, economics, arts, history, and geography) taught by highly qualified teachers (defined as teachers holding a Massachusetts teaching license and demonstrating subject matter competence in the areas they teach). Teacher data are for Fall 2003-8, except information on core academic teachers, which is for Fall 2003-6 and teacher age, which is for Fall 2007-8. For middle school applicants, peer baseline means are enrollment-weighted scores on 4th grade MCAS for Fall 2000-8. Peer baseline for 9th grade applicants comes from 8th grade MCAS for Fall 2002-8.
Table 2. Boston Complier Characteristics
Panel A. 7th Grade Applicants
Panel B. 9th Grade Applicants
O'Bryant Latin Academy Latin School

Latin Latin All Latin Latin AllApplication Test O'Bryant Academy School Schools O'Bryant Academy School SchoolsGrade Grade (1) (2) (3) (4) (5) (6) (7) (8)
7th 7th and 8th -0.128 -0.081 -0.015 -0.077 -0.087 -0.143* -0.001 -0.087**(0.101) (0.092) (0.098) (0.053) (0.069) (0.076) (0.062) (0.034)4035 4194 3776 12005 3621 3986 3066 10673
7th and 9th 10th 0.070 -0.090 -0.053 -0.014 0.060 -0.050 -0.076** -0.007(0.070) (0.080) (0.055) (0.038) (0.046) (0.044) (0.033) (0.027)3370 2702 2457 8529 3067 2022 1825 6914
7th and 9th 7th, 8th, and 10th -0.038 -0.085 -0.030 -0.051 -0.019 -0.115** -0.029 -0.057**(0.069) (0.065) (0.071) (0.038) (0.049) (0.050) (0.045) (0.023)7405 6896 6233 20534 6688 6008 4891 17587
7th 7th and 8th -0.060 -0.092 -0.183*** -0.109** -0.072* 0.011 -0.136*** -0.069***(0.078) (0.067) (0.067) (0.044) (0.040) (0.041) (0.038) (0.024)4139 4302 3790 12231 3930 3743 3524 11197
7th and 9th 10th 0.125 0.159 0.040 0.113** 0.152*** 0.181*** 0.012 0.122***(0.083) (0.105) (0.089) (0.057) (0.047) (0.064) (0.066) (0.037)3379 2707 2459 8545 3289 1781 1913 6983
7th and 9th 7th, 8th, and 10th 0.023 0.009 -0.098 -0.017 0.029 0.066 -0.090*** 0.002(0.056) (0.073) (0.064) (0.041) (0.033) (0.042) (0.033) (0.023)7518 7009 6249 20776 7219 5524 5437 18180
* significant at 10%; ** significant at 5%; *** significant at 1%
Notes: This table reports estimates of the effects of exam school offers on MCAS scores. The sample covers students within 20 standardized units of offer cutoffs. Parametric models include a cubic function of the running variable, allowed to differ on either side of offer cutoffs. Non-parametric estimates use the edge kernel, with bandwidth computed following DesJardins & McCall (2008) and Imbens and Kalyanaram (2012), as described in the text. Optimal bandwidths were computed separately for each school. Robust standard errors, clustered on year and school, are shown in parentheses. Standard errors for the all-school estimates and for those pooling outcomes also cluster on student. The sample size is reported below standard errors.
Table 3. Boston Reduced Form Estimates: MCAS Math and EnglishParametric Estimates Non-parametric (DM) Estimates
Panel A. Math
Panel B. English

Application TestBaseline mean for
enrolled Baseline mean Estimate Baseline mean EstimateGrade Grade (1) (2) (3) (4) (5)
7th 7th and 8th 1.436 1.534 -0.110*** 2.128 -0.036(0.041) (0.063)
4044 5255 5968 2620 2896
7th and 9th 10th 1.361 1.377 -0.020 1.853 0.003(0.024) (0.031)
3747 4626 4187 2607 2452
7th and 9th 7th, 8th, and 10th 1.357 1.461 -0.075*** 1.991 -0.018(0.027) (0.038)
5115 9881 10155 5227 5348
7th 7th and 8th 1.315 1.419 -0.079*** 1.847 -0.102**(0.029) (0.042)
4030 5840 6910 2971 3032
7th and 9th 10th 1.208 1.249 0.059 1.575 0.099**(0.038) (0.047)
3465 4345 4377 2474 2460
7th and 9th 7th, 8th, and 10th 1.234 1.346 -0.026 1.723 -0.010(0.027) (0.037)
4830 10185 11287 5445 5492
* significant at 10%; ** significant at 5%; *** significant at 1%
Notes: This table reports reduced form estimates for Boston exam school applicants with high baseline MCAS scores. The baseline mean reported in column 1 is the average baseline MCAS score for applicants who enroll in an exam school, conditional on inclusion in at least one school's discontinuity sample. Conditional-on-baseline estimates are non-parametric estimates in upper-half and upper-quartile subsamples, with bandwidth computed as for the all-schools results reported in Table 4.
Table 4. Boston Reduced Form Estimates for High AchieversConditional on Baseline Score
Baseline in Upper Half Baseline in Upper Quartile
A. Math
B. English

Latin Latin All Latin Latin AllApplication O'Bryant Academy School Schools O'Bryant Academy School SchoolsGrade (1) (2) (3) (4) (5) (6) (7) (8)
7th and 9th 0.062** 0.003 -0.065* 0.010 0.037 -0.011 0.032 0.024(0.026) (0.023) (0.037) (0.017) (0.042) (0.055) (0.061) (0.030)2683 2053 1795 6531 2670 1433 1351 5454
7th and 9th -0.008 0.017 0.012 0.004 0.045 -0.019 0.089 0.042(0.032) (0.028) (0.024) (0.018) (0.041) (0.050) (0.065) (0.033)2410 1683 1541 5634 2343 1425 1516 5284
7th and 9th 0.094 -0.164 0.106 0.029 0.780*** -0.542 0.105 0.271(0.124) (0.216) (0.164) (0.063) (0.281) (0.609) (0.539) (0.188)2543 1688 1822 6053 2540 1599 1405 5544
7th and 9th -0.014 -0.196 -0.196 -0.115* 0.416* -0.670 -0.399 -0.077(0.111) (0.191) (0.126) (0.062) (0.233) (0.540) (0.434) (0.163)2567 1674 1984 6225 2517 1583 1530 5630
* significant at 10%; ** significant at 5%; *** significant at 1%
Panel D. AP - Exams with 500+ Takers
Number of Exams Sum of Scores
Table 5. Boston Reduced Form Estimates: PSAT, SAT, and AP Scores
Notes: This table reports estimates of effects of exam school offers on PSAT, SAT, and AP test taking and scores. Each panel shows estimates for pooled 7th and 9th grade applicant samples. Panel D results are for AP tests with 500+ or more takers (Calculus AB/BC, Statistics, Biology, Chemistry, Physics B/C, English Language and Composition, English Literature and Composition, European History, US Government and Politics, US History, Microeconomics, and Macroeconomics). Outcome-specific non-parametric estimates, bandwidths, and standard errors were computed as for Table 3.
Panel A. PSAT
Panel B. SAT
Panel C. AP - All Exams
Probability Tested Test Score for Takers

Latin Latin All Latin Latin AllApplication O'Bryant Academy School Schools O'Bryant Academy School SchoolsGrade (1) (2) (3) (4) (5) (6) (7) (8)
7th and 9th -0.028 0.058 0.050 0.020 0.005 0.057* 0.057 0.033*(0.053) (0.064) (0.056) (0.030) (0.030) (0.032) (0.035) (0.018)2678 2159 2030 6867 2608 1876 1279 5763
7th and 9th -0.079 0.019 0.109* 0.003 -0.049 0.050 0.091** 0.013(0.070) (0.078) (0.064) (0.038) (0.043) (0.035) (0.037) (0.025)2678 2159 2030 6867 2654 2077 1403 6134
7th and 9th -0.110 0.011 0.110 -0.012 -0.105** 0.045 0.085* -0.012(0.080) (0.090) (0.083) (0.050) (0.048) (0.046) (0.047) (0.029)2678 2159 2030 6867 2522 2159 1304 5985
7th and 9th -0.074 0.049 0.025 -0.009 -0.069*** 0.044 -0.025 -0.023(0.049) (0.054) (0.083) (0.031) (0.023) (0.032) (0.048) (0.017)2678 2159 2030 6867 2640 2005 1490 6135
Table 6. Boston Reduced Form Estimates: Post-Secondary Outcomes
Notes: This table reports estimates of the effects of exam school offers on college enrollment using data from the National Student Clearinghouse. College selectivity is as classified by Barron's. Each panel shows estimates for pooled 7th and 9th grade applicants. Outcome-specific non-parametric estimates, bandwidths, and standard errors were computed as for Table 3.
* significant at 10%; ** significant at 5%; *** significant at 1%
Parametric Estimates Non-parametric (DM) Estimates
Panel A. Attended Any College
Panel B. Attended 4-Year College
Panel D. Attended Highly Competitive College
Panel C. Attended Competitive College

Z=0 Z=1 Z=0 Z=1 Z=0 Z=1(1) (2) (3) (4) (5) (6)
Baseline Peer Mean in Math 0.35 1.60 1.21 1.75 1.58 2.12Baseline Peer Mean in English 0.31 1.44 1.21 1.69 1.51 2.08Proportion Black or Hispanic 0.57 0.23 0.39 0.12 0.20 0.05
Proportion Free Lunch 0.65 0.61 0.60 0.65 0.64 0.68Proportion Female 0.53 0.41 0.52 0.45 0.46 0.43
Average English class size 29.3 31.8 27.1 31.8 31.0 29.1Average Math class size 29.0 31.1 27.8 31.6 30.9 33.0 Proportion of teachers fully licensed 0.96 0.97 0.97 0.97 0.97 0.99Proportion of teachers highly educated 0.45 0.59 0.51 0.60 0.60 0.64
Proportion of teachers with less than 3 years experience 0.13 0.07 0.12 0.12 0.10 0.07
Table 7. NYC Complier CharacteristicsBrooklyn Tech Bronx Science Stuyvesant
Notes: This table shows descriptive statistics for NYC exam school enrollment compliers to the left (Z=0) and right (Z=1) of admission cutoffs, using data on applicants for admission from 2004-7. Student-weighted average characteristics are reported for teachers and schools. Fully licensed teachers are those who have Provisional, Initial, or Professional licenses to teach in the subjects(s) posted. Highly educated teachers have Masters or other graduate degrees.

Brooklyn Tech Bronx Science Stuyvesant All Schools Brooklyn Tech Bronx Science Stuyvesant All Schools
(1) (2) (3) (4) (5) (6) (7) (8)
Math 0.048 -0.105* -0.05 -0.032 0.01 -0.132*** -0.045 -0.062***
(0.060) (0.054) (0.044) (0.027) (0.039) (0.033) (0.039) (0.018)
5116 4479 4259 13854 3990 4479 2915 11384
Advanced Math -0.081 -0.04 -0.023 -0.046 -0.013 -0.053 -0.026 -0.034
(0.072) (0.062) (0.040) (0.038) (0.047) (0.040) (0.026) (0.024)
6758 6605 7308 20671 4859 6605 5350 16814
English 0.03 -0.042 -0.02 -0.011 0.048 -0.011 -0.005 0.012
(0.051) (0.038) (0.033) (0.025) (0.038) (0.021) (0.022) (0.013)
5926 5506 5693 17125 5926 5506 5693 17125
Global History -0.112** -0.039 -0.008 -0.051** -0.060* -0.013 0.014 -0.02
(0.048) (0.036) (0.036) (0.023) (0.031) (0.027) (0.024) (0.014)
7540 7103 7635 22278 6920 7103 5918 19941
US History -0.100*** -0.012 0.032 -0.024 -0.036 -0.015 0.038 -0.006
(0.037) (0.030) (0.032) (0.023) (0.022) (0.021) (0.023) (0.014)
5316 5139 5486 15941 3886 5139 3913 12938
Living Environment -0.077** 0.069* -0.061* -0.024 -0.078*** 0.057** -0.032 -0.024**
(0.038) (0.037) (0.034) (0.020) (0.022) (0.024) (0.020) (0.012)
6980 6575 6991 20546 6980 5665 6991 19636
*significant at 10%; **significant at 5%; ***significant at 1%.
Table 8. NYC Reduced Form Estimates: Regents Exams
Parametric Estimates Non-parametric (DM) Estimates
Notes: This table reports estimates of the effect of New York exam school offers on Regents scores. The discontinuity sample includes applicants 5 standardized units from the
cutoff. Model parameterization and estimation procedures are the same as for Boston. Math scores are from Regents Math A (Elementary Algebra and Planar Geometry) or
Integrated Algebra I. Advanced Math scores are from Regents Math B (Intermediate Algebra and Trigonometry) or Geometry. The table reports robust standard errors, clustered
on year and school of test, in parentheses. Standard errors are also clustered on student when schools are stacked. Sample sizes for each outcome are reported below the
standard errors.

(1) (2) (3) (3) (4) (5) (6) (7) (8) (9) (10)
Peer mean -0.045 0.084 0.062 -0.046 0.002 0.005 -0.053(0.031) (0.113) (0.080) (0.045) (0.030) (0.061) (0.049)
Proportion nonwhite 0.173 0.633* 0.440 0.196 -0.034 0.014 0.032(0.114) (0.377) (0.286) (0.147) (0.101) (0.207) (0.132)
Years in exam school 0.001 0.009 0.047 0.023(0.038) (0.032) (0.033) (0.025)
Peer mean 76.4 6.7 9.6 61.9 40.9 5.0 22.8Proportion nonwhite 65.6 23.6 16.8 58.9 46.5 11.7 35.1Years in exam school 16.5 18.6 13.7 19.2
N 31862 33264 31862 31862 31862 33264 31171 32134 31171 31171 32134
O'Bryant 0.760*** -0.123*** 0.698*** -0.122***(0.071) (0.013) (0.065) (0.013)
Latin Academy 0.347*** -0.208*** 0.350*** -0.212***(0.075) (0.014) (0.066) (0.015)
Latin School 0.790*** -0.229*** 0.642*** -0.217***(0.040) (0.013) (0.037) (0.013)
Brooklyn Tech 0.494*** -0.137*** 0.520*** -0.153***(0.074) (0.024) (0.057) (0.022)
Bronx Science 0.175*** -0.101*** 0.158** -0.098***(0.067) (0.031) (0.074) (0.034)
Stuyvesant 0.264*** -0.066*** 0.255*** -0.060**(0.076) (0.022) (0.096) (0.029)
* significant at 10%; ** significant at 5%; *** significant at 1%
Table 9. 2SLS Estimates for Boston and New York
First stage Fs (models with cohort interactions)
Panel A: Boston
Panel B: NYC
First Stage Estimates (models without cohort interactions)
Notes: This table reports two-stage least squares (2SLS) estimates of the effects of peer characteristics on MCAS scores in a sample combining Boston and New York. Boston scores are from MCAS Math and English tests for all grades tested; NYC scores are Advanced Math (Regents Math B or Geometry) and Regents English. The table shows non-parametric estimates using bandwidths computed one school at a time. The 2SLS estimates and first-stage Fs reported here are from models that interact exam school offers with application cohort dummies. The first-stage coefficient estimates are from models without these interactions.
Math English
2SLS (models with cohort interactions)

0.2
.4.6
.81
−20 −10 0 10 20
O’Bryant
0.2
.4.6
.81
−20 −10 0 10 20
Latin Academy
0.2
.4.6
.81
−20 −10 0 10 20
Latin School
Figure 1A: Offers at Each Boston Exam School
0.2
.4.6
.81
−20 −10 0 10 20
O’Bryant
0.2
.4.6
.81
−20 −10 0 10 20
Latin Academy
0.2
.4.6
.81
−20 −10 0 10 20
Latin School
Figure 1B: Enrollment at Each Boston Exam School

0.2
.4.6
.81
−20 −10 0 10 20
O’Bryant
0.2
.4.6
.81
−20 −10 0 10 20
Latin Academy
0.2
.4.6
.81
−20 −10 0 10 20
Latin School
Figure 1C: Enrollment at Any Boston Exam School
−.5
0.5
11
.52
2.5
−20 −10 0 10 20
O’Bryant
−.5
0.5
11
.52
2.5
−20 −10 0 10 20
Latin Academy
−.5
0.5
11
.52
2.5
−20 −10 0 10 20
Latin School
Figure 2A: Baseline Peer Math Score at Boston Exam Schools

0.2
.4.6
.81
−20 −10 0 10 20
O’Bryant
0.2
.4.6
.81
−20 −10 0 10 20
Latin Academy
0.2
.4.6
.81
−20 −10 0 10 20
Latin School
Figure 2B: Proportion Black or Hispanic at Boston Exam Schools
−.5
0.5
11
.52
2.5
−20 −10 0 10 20
O’Bryant
−.5
0.5
11
.52
2.5
−20 −10 0 10 20
Latin Academy
−.5
0.5
11
.52
2.5
−20 −10 0 10 20
Latin School
Figure 3A: 7th and 8th Grade Math at Boston Exam Schools for 7th Grade Applicants
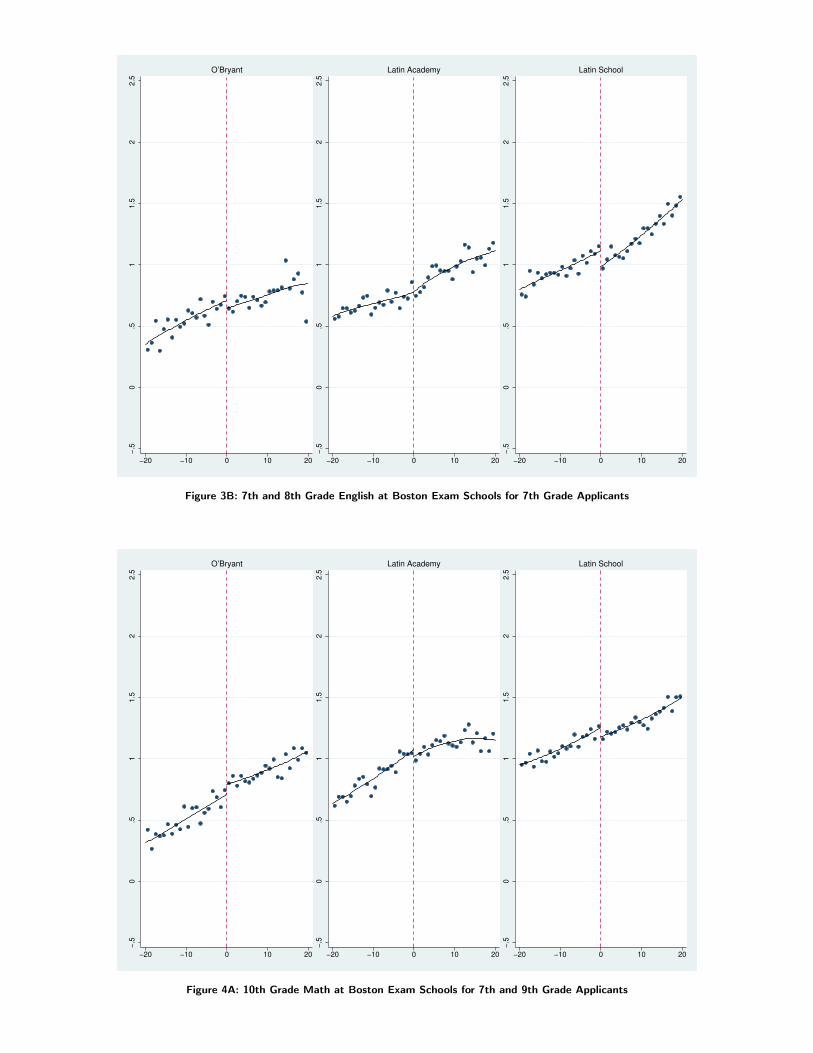
−.5
0.5
11
.52
2.5
−20 −10 0 10 20
O’Bryant
−.5
0.5
11
.52
2.5
−20 −10 0 10 20
Latin Academy
−.5
0.5
11
.52
2.5
−20 −10 0 10 20
Latin School
Figure 3B: 7th and 8th Grade English at Boston Exam Schools for 7th Grade Applicants
−.5
0.5
11
.52
2.5
−20 −10 0 10 20
O’Bryant
−.5
0.5
11
.52
2.5
−20 −10 0 10 20
Latin Academy
−.5
0.5
11
.52
2.5
−20 −10 0 10 20
Latin School
Figure 4A: 10th Grade Math at Boston Exam Schools for 7th and 9th Grade Applicants

−.5
0.5
11
.52
2.5
−20 −10 0 10 20
O’Bryant−
.50
.51
1.5
22
.5
−20 −10 0 10 20
Latin Academy
−.5
0.5
11
.52
2.5
−20 −10 0 10 20
Latin School
Figure 4B: 10th Grade English at Boston Exam Schools for 7th and 9th Grade Applicants
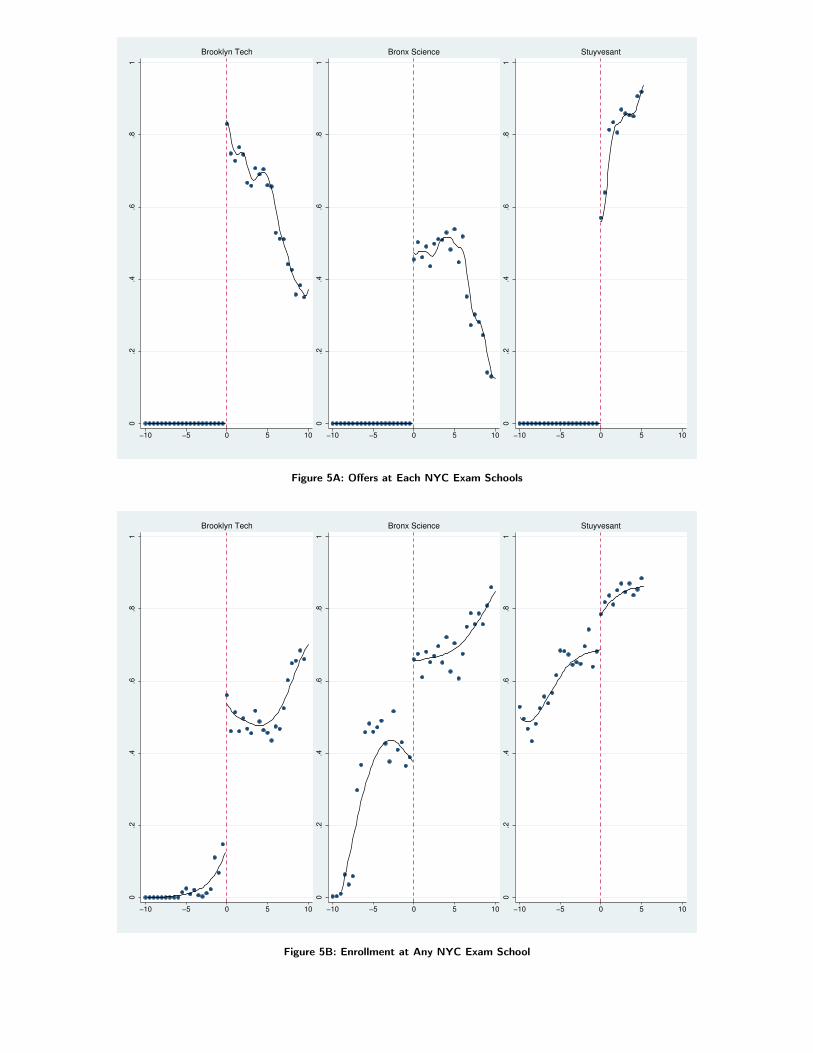
0.2
.4.6
.81
−10 −5 0 5 10
Brooklyn Tech
0.2
.4.6
.81
−10 −5 0 5 10
Bronx Science
0.2
.4.6
.81
−10 −5 0 5 10
Stuyvesant
Figure 5A: Offers at Each NYC Exam Schools
0.2
.4.6
.81
−10 −5 0 5 10
Brooklyn Tech
0.2
.4.6
.81
−10 −5 0 5 10
Bronx Science
0.2
.4.6
.81
−10 −5 0 5 10
Stuyvesant
Figure 5B: Enrollment at Any NYC Exam School

0.4
.81
.21
.62
−10 −5 0 5 10
Brooklyn Tech
0.4
.81
.21
.62
−10 −5 0 5 10
Bronx Science
0.4
.81
.21
.62
−10 −5 0 5 10
Stuyvesant
Figure 6A: Baseline Peer Math Score at NYC Exam Schools
0.2
.4.6
.81
−10 −5 0 5 10
Brooklyn Tech
0.2
.4.6
.81
−10 −5 0 5 10
Bronx Science
0.2
.4.6
.81
−10 −5 0 5 10
Stuyvesant
Figure 6B: Proportion Black or Hispanic at NYC Exam Schools

0.4
.81
.21
.62
−10 −5 0 5 10
Brooklyn Tech
0.4
.81
.21
.62
−10 −5 0 5 10
Bronx Science
0.4
.81
.21
.62
−10 −5 0 5 10
Stuyvesant
Figure 7A: Regents Advanced Math at NYC Exam Schools
0.4
.81
.21
.62
−10 −5 0 5 10
Brooklyn Tech
0.4
.81
.21
.62
−10 −5 0 5 10
Bronx Science
0.4
.81
.21
.62
−10 −5 0 5 10
Stuyvesant
Figure 7B: Regents English at NYC Exam Schools

References
Abadie, A. (2003): “Semiparametric instrumental variables estimation of treatment response mod-
els,” Journal of Econometrics, 113(2), 231–263.
Abdulkadiroglu, A., J. Angrist, and P. Pathak (2011): “The Elite Illusion: Achievement
Effects at Boston and New York Exam Schools,” NBER Working paper 17264.
Abdulkadiroglu, A., P. A. Pathak, and A. E. Roth (2009): “Strategy-proofness versus Effi-
ciency in Matching with Indifferences: Redesigning the New York City High School Match,” Amer-
ican Economic Review, 99(5), 1954–1978.
Ammermueller, A., and J.-S. Pischke (2009): “Peer Effects in European Primary Schools: Ev-
idence from the Progress in International Reading Literacy Study,” Journal of Labor Economics,
27(3), 315–348.
Angrist, J. D. (1998): “Estimating the Labor Market Impact of Voluntary Military Service Using
Social Security Data on Military Applicants,” Econometrica, 66(2), 249–288.
Angrist, J. D., and K. Lang (2004): “Does School Integration Generate Peer Effects? Evidence
from Boston’s Metco Program,” American Economic Review, 94(5), 1613–1634.
Black, S. (1999): “Do Better Schools Matter? Parental Valuation of Elementary Education,” Quar-
terly Journal of Economics, 114(2), 577–599.
Boustan, L. P. (2012): “School Desegregation and Urban Change: Evidence from City Boundaries,”
American Economic Journal: Applied Economics.
Carrell, S., B. Sacerdote, and J. West (2012): “From Natural Variation to Optimal Pol-
icy? An Unsuccessful Experiment in Using Peer Effects Estimates to Improve Student Outcomes,”
Unpublished paper, UC Davis.
Clarke, D. (2008): “Selective Schools and Academic Achievement,” IZA Discussion Paper 3182.
Dale, S., and A. B. Krueger (2002): “Estimating the payoff to attending a more selective college:
An application of selection on observables and unobservables,” Quarterly Journal of Economics,
117(4), 1491–1527.
(2011): “Estimating the Return to College Selectivity over the Career Using Administrative
Earnings Data,” Princeton University, Industrial Relations Working paper, 563.
DesJardins, S., and B. McCall (2008): “The Impact of Gates Millennium Scholars Program on
the Retenion, College Finance- and Work-Related Choices, and Future Educational Aspirations of
Low-Income Minority Students,” Unpublished manuscript, University of Michigan.
Dobbie, W., and R. G. Fryer (2011): “Exam High Schools and Academic Achievement: Evidence
from New York City,” NBER Working Paper 17286.
38

Duflo, E., P. Dupas, and M. Kremer (2011): “Peer Effects and the Impacts of Tracking: Evidence
from a Randomized Evaluation in Kenya,” American Economic Review, 101(5), 1739–1774.
Goldin, C., and L. F. Katz (2008): The Race between Education and Technology. Harvard Univer-
sity Press.
Guryan, J. (2004): “Desegregation and Black Dropout Rates,” American Economic Review, pp.
919–943.
Hahn, J., P. Todd, and W. van der Klaauw (2001): “Identification and Estimation of Treatment
Effects with a Regression Discontinuity Design,” Econometrica, 69(1), 201–209.
Hanushek, E. A., J. F. Kain, J. M. Markman, and S. G. Rivkin (2003): “Does peer ability
affect student achievement?,” Journal of Applied Econometrics, 18(5), 527–544.
Hastings, J., T. J. Kane, and D. O. Staiger (2009): “Heterogenous Preferences and the Efficacy
of Public School Choice,” Working paper, Yale University.
Hernandez, J. (2008): “Racial Imbalance Persists at Elite Public Schools,” New York Times,
N.Y./Region, November 7.
Hoekstra, M. (2009): “The Effect of Attending the Flagship State University on Earnings: A
Discontinuity-Based Approach,” Review of Economics and Statistics, 91(4), 717–724.
Hoxby, C. (2000): “Peer Effects in the Classroom: Learning from Gender and Race Variation,”
NBER Working paper 7867.
Hoxby, C., and G. Weingarth (2006): “Taking race out of the equation: School reassign-
ment and the structure of peer effects,” Working paper, Harvard University, Available at:
http://www.hks.harvard.edu/inequality/Seminar/Papers/Hoxby06.pdf.
Hsieh, C.-T., and M. Urquiola (2006): “The effects of generalized school choice on achievement
and stratification: Evidence from Chile’s voucher program,” Journal of Public Economics, 90, 1477–
1503.
Imbens, G., and K. Kalyanaraman (2010): “Optimal Bandwidth Choice for the Regression Dis-
continuity Estimator,” CEMMAP Working paper CWP05/10.
Imberman, S. A., A. Kugler, and B. Sacerdote (2012): “Katrina’s Children: Evidence on the
Structure of Peer Effects from Hurrican Evacuees,” forthcoming, American Economic Review.
Jackson, K. (2010): “Do Students Benefit from Attending Better Schools? Evidence from Rule-
Based Student Assignments in Trinidad and Tobago,” Economic Journal, 120, 1399–1429.
Jan, T. (2006): “Growing a Boston Latin in Brooklyn,” Boston Globe, Local Desk, March 4.
39
Kane, T. J., and D. O. Staiger (2002): “The Promise and Pitfalls of Using Imprecise School
Accountability Measures,” Journal of Economic Perspectives, 16(4), 91–114.
Kling, J. R., J. B. Liebman, and L. F. Katz (2007): “Expeirmental Analysis of Neighborhood
Effects,” Econometrica, pp. 83–119.
Lavy, V., O. Silva, and F. Weinhardt (2009): “The Good, The Bad, and the Average: Evidence
on the Scale and Nature of Ability Peer Effects,” NBER Working paper, No. 15600.
Lee, D., E. Moretti, and M. J. Butler (2004): “Do Voters Affect or Elect Policies? Evidence
from the U.S. House,” Quarterly Journal of Economics, 119(3), 807–860.
Lee, D. S. (2009): “Training, Wages, and Sample Selection: Estimating Sharp Bounds on Treatment
Effects,” RES, 76(3), 1071–1102.
Lee, D. S., and T. Lemieux (2010): “Regression Discontinuity Designs in Economics,” Journal of
Economic Literature, 48, 281–355.
Lutton, L. (2012): “Chicago will open more selective high schools,” WBEZ, Schools on the Line,
April 5.
MacLeod, B., and M. Urquiola (2009): “Anti-Lemons: School Reputation and Educational Qual-
ity,” NBER Working Paper, 15112.
Pathak, P. A., and T. Sonmez (2008): “Leveling the Playing Field: Sincere and Sophisticated
Players in the Boston Mechanism,” American Economic Review, 98(4), 1636–1652.
(2011): “School Admissions Reform in Chicago and England: Comparing Mechanisms by
their Vulnerability to Manipulation,” forthcoming, American Economic Review.
Pop-Eleches, C., and M. Urquiola (2010): “Going to a Better School: Effects and Behavioral
Responses,” Working paper, Columbia University.
Porter, J. (2003): “Estimation in the Regression Discontinuity Model,” Working paper, University
of Wisconsin.
Rothstein, J. (2006): “Good Principals or Good Peers: Parental Valuation of School Characteristics,
Tiebout Equilibrium, and the Incentive Effects of Competition Among Jurisdictions,” American
Economic Review, 96(4), 1333–1350.
Sanbonmatsu, L., J. Ludwig, L. Katz, L. A. Gennetian, G. J. Duncan, R. C. Kessler,
E. A. T. W. McDade, and S. T. Lindau (2011): “Moving to Opportunity for Fair Housing
Demonstration Program - Final Impacts Evaluation,” US Department of Housing & Urban Devel-
opment, PD&R.
Todd, P., and K. Wolpin (2003): “On the Specification and Estimation of the Production Function
for Cognitive Achievement,” Economic Journal, 113, F3–F33.
40

Vaznis, J. (2009): “Exam School Explore Adding Grade 6,” Boston Globe, Education Desk, June 9.
Zhang, H. (2010): “Magnet Schools and Student Achievement: Evidence from a Randomized Natural
Experiment in China,” Unpublished mimeo, Chinese University of Hong Kong.
41

Appendix for “The Elite Illusion: Achievement Effects
at Boston and New York Exam Schools”
A Additional Results for Boston
Information on Boston’s exam school applicants compared to the BPS applicant population is con-tained in Table A1. Non-exam BPS students are mostly minority and poor enough to qualify for asubsidized lunch. Black and Hispanic students are somewhat under-represented among exam schoolapplicants and students, but most exam school applicants are also poor. Not surprisingly, there arefew special education students in an exam school, though many exam school applicants and studentsare classified as limited English proficient. Exam school applicants are clearly a self-selected group,with markedly higher baseline scores than other BPS students. For example, grade 7 applicants’ 4thgrade math scores are almost 0.8σ higher than those of a typical BPS student. Offered students areeven more positively selected, with a score gap of 1.4σ in math and 1.3σ in English. Similarly largegaps emerge for 9th graders. Finally, note that there are many more exam school seats in grade 7than grade 9. As a result, the probability an applicant is offered a seat is much lower for 9th gradeapplicants.
The figures and estimates with test outcomes were constructed from samples of students whoapply to exam schools and for whom we have post-admissions test scores. Students near admissionscutoffs should be similar at the time of application if the regression discontinuity is to approximatean experimental design. Subsequent attrition may lead to differences in the follow-up sample, unlessthe attrition process is also random. In other words, a threat to our research design is differential andselective attrition by exam offer status. For instance, students just below the cutoff may be less likelyto be found than students above the cutoff if students below the cutoff leave the public school systemwhen they do not obtain an exam offer. Differential attrition generates selection bias which in turnmay compromise the estimates. One simple test for selection bias is to look at the effect offers haveon the likelihood that an applicant contributes MCAS scores to our sample. If differences in follow-uprates are small, then selection bias from differential attrition is also likely to be modest.
Table A2 reports the fraction of exam school applicants with follow-up scores in the discontinuitysample. Between 76-89% of applicants have a follow-up score. This relatively high follow-up rate islikely due to the requirement that our applicant sample is limited to students who were enrolled inBPS at baseline. Follow-up differentials are estimated using both the parametric and nonparametricapproach that parallels the estimates presented in Table 3. Most of the estimated differentials formath and English are small and not significantly different from zero using either the parametric ornonparametric method. While the follow up differential is 2.4-2.7% in the All Schools column, thisdifference seems unlikely to explain our findings as the most likely scenario is that relatively highachievers who miss the cutoff exit the public school system.
Another potential concern with our research design is that exam school offers are not the onlyvariable that changes in a discontinuous manner at admissions cutoffs. If covariates other than theranking of the applicant are used in the assignment mechanism, then these covariates may confound theinterpretation of test score differences at cutoffs as being based solely on exam school offers. The fact
1
that exam school admissions take place in the BPS central office suggest that it is unlikely that schoolshave much discretion in selecting which applicants obtain offers at particular schools. Nonetheless,discontinuities in the characteristics of applicants may arise in situations where the admissions processis compromised.
Table A3 briefly examines this possibility. This table shows estimates from models that parallel thereduced-form, but the dependent variables are covariates. There is little evidence of covariate balanceacross admissions cutoffs. Joint tests of significance of the coefficients suggest the few significantdifferences in covariates are chance findings.
Finally, Table A4 reports the analog of Table 3 for the sample of blacks and Hispanics in Boston.These results show no clear pattern, though, as noted in the text, there is reasonably strong evidencefor a gain in 10th grade ELA scores. There are also some significant negative effects.
B Additional Results for New York
Information on NYC’s exam school applicants compared to 8th graders in NYC public schools isreported in Table B1. As in Boston, New York exam school applicants are positively selected relativeto the population of New York 8th graders. Applicants’ baseline scores exceed those of other 8thgraders by about 0.7 − 0.8σ, while the score gap for offered students is 1.7 − 1.8σ. Exam schoolapplicants reflect the New York public school population in that a substantial fraction are eligible fora subsidized lunch. In contrast to Boston, however, only about 15% of New York’s offered studentsare black or Hispanic.
Table B2 reports estimates of NYC follow-up rates following Table A2. The follow-up rate is lowestfor math since many applicants take these Regents exams before 9th grade. For the other subjects,the follow-up rates range from 79-87%. For instance, 80% of students in at least one discontinuitysample have follow up Advanced Math scores, while 87% have follow-up English scores. While someof the attrition differentials are significantly different from zero at school cutoffs, in the All Schoolscolumn, the differences are relatively small. For instance, the follow-up differential for English is about2%, a result which is only significant with the non-parametric method. Advanced Math and GlobalHistory have attrition differences of about 3-4% in the All Schools model either with the parametric ornon-parametric method with most of this difference driven by students from the Brooklyn Technicalcutoff.
As in Boston, the NYC admissions process is run in the central office, suggesting limited scope forschool discretion in making assignments. In Table B3, we report differences in covariates on either sideof cutoffs which parallel those reported in Table A3. While students are more likely to be Hispanicand less likely to obtain a free lunch near the Stuyvesant cutoff, most of these differences are mutedwith the non-parametric estimates. Even though there are a few small differences at particular schoolcutoffs, the estimates from the All Schools model do not suggest discontinuous changes in covariates atoffer cutoffs. The p-values from the joint test that all covariate discontinuities are significant supportsthis conclusion in the All Schools model.
New York’s exam schools enroll fewer blacks and Hispanic students than in Boston’s exam schools.About 7.6% of enrolled students are black and 6.7% are Hispanic in New York, compared to 24% and15%, respectively for 7th graders in Boston. Unlike Boston, the NYC results for minorities in TableB4 do not support Regents achievement gains at exam schools. For instance, the impact on Englishfor black or Hispanic students is 0.02σ (with standard error 0.04). However, as in Boston, results forhigh baseline students in NYC offer no evidence of achievement gains for high achievers.
2

C Boston Data Appendix
Boston Public Schools is the source for four datasets: the exam school application file, the enroll-ment file which contains student demographic and school attendance information, the MassachusettsComprehensive Assessment System (MCAS) test score file, the College Board test file which con-tains PSAT, SAT and AP scores, and data from the National Student Clearinghouse. This appendixdescribes these data sets and the procedures used to construct the analysis sample.
C.1 Sources
Exam school application file
Data description and sample restrictions
The exam school application file contains a record for each student consisting of a registrationnumber, application year, grade, date of birth, preferences over three exam schools, and scores onthe ISEE verbal, quantitative, reading and math sections. Each record also includes the rank of eachstudent by the exam schools on their preference list and the school where the student receives an offer(if any). This dataset covers students in grades 7, 9, and 10 and application years 1997-2008. Sincethere are a small number of grade 10 applicants, we kept students applying for grades 7 and 9 only.
Table C1 indicates the steps involved in processing the exam application file. We excluded duplicateobservations, applicants from private schools and those who did not rank or were not ranked by anyexam school. We also dropped students who obtained an offer at an exam school that is not on theirpreference list.
Coding the offer variable
For each applicant, the exam school application file indicates whether the student receives an offerat one school on their preference list. For a given application year, grade, and school, we computed thelowest-ranked student to obtain an offer from that school. Each student is then coded as obtainingan offer at an exam school if her score is above this minimum cutoff for any school that is on herpreference list.
Enrollment file
Data description
The BPS enrollment file spans school years 1995-1996 through 2008-2009. Each record contains anend-of-year (June) snapshot for each student enrolled in Boston Public Schools, with unique studentidentifier (the BPS ID), the student’s grade and school, and demographic information.
Coding of demographics and attendance
The variables of interest in the enrollment file are grade, year, date of birth, sex, race, specialeducation (SPED) and limited English proficiency (LEP) status, subsidized lunch eligibility, andschool. Students are coded as attending an exam school if their year-end enrollment is at an examschool. Years at an exam school is the total number of years where a student is at an exam schoolat the end of the year. We transformed the enrollment file into a wide-format layout for each studentwhere we compute the grade and exam school years attended for a given year. Finally, we kept onlystudents that attend Boston Public Schools in 6th or 8th grade and use their demographic informationfrom that year.
3

MCAS test file
Data description and sample restrictions
Each record in the MCAS test file contains a student identifier (BPS ID) and scores on MCAStests in a given year. We used data from school years 1999-2000 through 2008-2009. The scores welook at are math and English Language Arts (ELA) for grades 4-10. The MCAS test file containsraw scores for all BPS test takers for math, English Language Arts, Writing, and Science. As shownin Table C2, the number of grades tested has increased over time. MCAS Math for grade 8 was thefirst examination offered in 1999. By the end of our data, there are tests for math and English testsat grade 7, 8, and 10. Baseline scores for grade 7 applicants are from 4th grade MCAS exams. For9th grade applicants, baseline math is from 8th grade math and baseline English is from 7th gradeEnglish, since the 8th grade English exam is first offered in 2006.
We standardized scores to have mean zero and standard deviation one within a subject-grade-yearamong all test-takers in Boston Public Schools. When there is more than one test score for a studentfor a particular subject, we used the first available score. Boston exam offers appear to boost graderepetition at some schools and cohorts, though not consistently. In any case, increased repetitionseems likely to boost scores if anything since repetition increases age at test.
College Board test file
Data description and sample restrictions
The College Board provides BPS with reports on the test performance of all BPS test-takers from2004-2005 through 2009-2010. These files come with the name, date of birth, address, gender, schoolof test, and test year for each exam. BPS matched the PSAT file for October 2004 and October 2005,the SAT file which is available from 2005-2009, and the Advanced Placement test file, available from2005-2009. The timing of these tests for our applicant cohorts is shown in Table C2.
The PSAT file is not matched to BPS student IDs for years 2006-2009, so we had to link CollegeBoard files to BPS files for these years. The address information in the College Board file is enteredby the test-taker and does not immediately concord with the BPS address system. There also appearto be small errors in the date of birth in the College Board file for similar reasons. Our procedure tomatch these files to the BPS registration files is as follows. First, we take all unique year, date of birth,gender, school of test, and zip code matches between the BPS registration file and the College BoardPSAT file. Among the remaining unmatched PSAT records, we take all unique year, date of birth,gender, and school of test matches between the two files. Finally, for the remaining unmatched PSATtest records, we hand-matched the records for these four years to the closest record in the registrationfile, attempting to correct mismatches due to address misspellings or typos in the date of birth.
BPS students take AP exams across a range of subjects. The tests with 500+ or more takers areCalculus AB, Statistics, Biology, Chemistry, Physics B, English Language and Composition, EnglishLiterature and Composition, European History, US Government and Politics, US History, Microeco-nomics, Macroeconomics, and Spanish Language. The other tests are Art History, Art: Drawing, Art:2D Design, Art: 3D design, Chinese Language and Culture, Computer Science A, Computer ScienceAB, Environmental Science, French Language, French Literature, German Language, ComparativeGovernment and Politics, Latin: Vergil, Latin: Literature, Calculus BC, Music Theory, Physics C:Mechanics, Physics C: Electricity and Magnetism, Spanish Literature, and World History.
We standardized the PSAT and SAT scores to have mean zero and standard deviation one withina year among all test-takers in Boston Public Schools. When there is more than one test score for astudent, we used the earliest available one. We only use applicant cohorts for whom we might expectto observe PSAT, SAT or AP exams; these are summarized in Table C2.
4

National Student Clearinghouse
Data description and sample restrictions
BPS matches data on seniors to National Student Clearinghouse (NSC) files, which record in-formation on enrollment at over 90 percent of American 4-year colleges and universities. We matchthese files to the Barron’s Profile of American Colleges, provided to us by David Deming in electronicform, to form our list of competitiveness. The most common colleges attended in our sample areBunker Hill Community College, University of Massachusetts Boston, University of MassachusettsAmherst, Roxbury Community College, Boston University, Massachusetts Bay Community College,Suffolk University, Boston College, Salem State University, and Northeastern University. Table C5shows the number of applicants we observe with NSC outcomes relative to the number of students weexpect (defined as those enrolled in BPS in grade 12).
C.2 Matching Data Sets
Match from the MCAS test file to the enrollment file
Match criteria
The MCAS test file and enrollment files are merged by grade, year, and BPS ID. Any test recordthat is not be matched to the enrollment file is dropped.
The exam applicant file is matched to the enrollment/MCAS file using an auxiliary table thatlinks exam registration number to BPS ID. This table provides a BPS ID for each exam registrationnumber. For a small number of cases, an exam registration number is matched to more than one BPSID. In these cases, we matched to the registration number to the BPS ID where the date of birth isthe same between the exam applicant and enrollment file.
Match rates
Table C3 reports match rates from exam applicant file to the enrollment/MCAS file. The overallmatch rate is 96.6 percent (13,730 out of 14,212) for grade 7 applicants and 99.6 (6,155 out of 6,181)for grade 9 applicants. The match rate for offered students in grade 7 is 96.9%, while the match ratefor students who were not offered is 96.3%. The lower match rates come from earlier application years1997-2000. The match rate for not offered is larger than for offered for three of these years, and thedifferences in match rates are small. For grade 9, where the application cohorts start in 2001, thematch rate for offered students is 99.9%, while for non-offered it is 99.5%. Applicants who are notmatched to the enrollment file at baseline are dropped as are applicants who enrolled in an exam schoolbefore application. This latter restriction only impacts grade 9 applicants, as can be seen comparingcolumns (7) and (8) of Table C1.
C.3 Construction of the Analysis Sample
The size of the final analysis sample is presented in column (8) of Table C1.
Stacking grades
Some of the analysis stacks grades and includes multiple test scores for individual students. Foreach student in an application year, Table C4 reports the number of students with at least one followup test score (column (2)). It also presents the number of test scores expected for each cohort andthe number of test scores observed for both math and English. For example, a 7th grade applicant
5

for the 2005-2006 school year contributes math scores in grade 7 (Spring 2006), 8 (Spring 2007), and10 (Spring 2009). Hence, we expect 3,285 math scores from the 1,095 applicants for this cohort, andwe observe at least one score for 1,001 students, which corresponds to a total of 2,650 student-scoreobservations. On the other hand, a 7th grade applicant for the previous school year contributes onefewer test score (no grade 7 math). Table C5 shows a related analysis of expected follow up for PSAT,SAT and AP scores, and the NSC outcomes.
D New York Data Appendix
The New York City Department of Education is the source for three datasets: the exam school applica-tion and Student Enrollment Office (formerly, OSEPO) files which contains demographic information,the registration file which contains school attendance information, and the NYSED and Regents testscore file. This appendix describes these data sets and details the procedures used to construct theanalysis sample.
D.1 Sources
Exam school application and Enrollment Office files
Data description and sample restrictions
The exam school application file is maintained by the Enrollment Office, which runs high schooladmissions. All applicants must take the Specialized High School Admissions Test (SHSAT) to applyto an exam school. On test day, students also submit a ranking of exam schools. At a later date,students are also required complete a New York City Public High School Admissions Application andsubmit it to their guidance counselor.
Several Enrollment Office files are used in the analysis. The first contains a record for each studentindexed by their ID number (OSISID) and their score on the SHSAT. For each student, the examschool offer file contains a list of the schools ranked and an indicator for the school at which thestudent obtains an offer (if any). The Enrollment Office student file has demographic informationsuch as grade, sex, race, home language code, and borough of residence for each student. There arealso separate files indicating special education and limited English proficiency for each student. Eachfile for a given application year contains an OSISID number for each student, which allows us to mergethe files together.
Registration and enrollment files
Data description and sample restrictions
The NYC registration file is from the Office of School Performance and Accountability and isavailable as part of data underlying school progress reports. The registration and enrollment coverall public school students in grades 9 to 12 for school years 2002-2003 through 2008-2009. This dataset includes each student’s NYC ID, grade, and current school as of October in the school year. Theregistration data are used to determine whether and for how many years a student enrolls in an examschool, where a student who is enrolled in October is counted as enrolling for the entire year. Startingin 2004-2005, there is a separate file which contains a list of all students who obtain a subsidizedschool lunch in that year. This variable is used to code subsidized lunch status for applicants usingthe application year. For applicants in 2003-2004, 2004-2005, and 2005-2006, we used the lunch statusrecord from 2004-2005. For application cohort in 2006-2007, we used the lunch status record from2005-2006.
6

Table D1 indicates the steps involved in processing the exam application file and merging it withthe Student Enrollment files. From the file of exam applicants, we eliminated private school applicants(based on whether their OSISID starts with the letter “A”) and those who do not submit a New YorkCity Public School Admissions Application (based on the Round 1 HS ranking file). The 4,000-5,000private school applicants are excluded because these students do not have a NYC ID at the time ofapplication, they do not have baseline information, and the relevant counterfactual for this populationis unlikely to be a regular NYC public high school. We also excluded students who did not rankat least one of the three original academic exam schools: Bronx Science, Brooklyn Technical, andStuyvesant.
Baseline test files
Data description and sample restrictions
The NYC Department of Education also provided us with NYSED grade 8 standardized exams inmath and English Language Arts for all public school students for years 2002-2003 through 2007-2008.These tests are taken in the winter of grade 8 and are required of all public school students in thestate. These tests serve as our baseline math and English scores.
Regents test file
Data description and sample restrictions
The NYC Regents test file contains the date and raw score for each tested student. Regents examsare mandatory state examinations where performance determines whether a student is eligible for ahigh school diploma in New York. There are Regents examinations in English, Global History, USHistory, and multiple exams in math and Science. A Regents exam typically has a multiple choicesection and a long answer or essay component, and each exam usually lasts for three hours. TheEnglish exam, however, consists of two three-hour pieces over two days. The exam has a locallygraded component and Dee, Jacob, McCrary, and Rockoff (2011) illustrate how test scores bunch nearperformance thresholds.
The New York State Board of Regents governs and designs the Regents exams. Starting in 2005,they started to modify the math exams. At the beginning of our sample, the two math exams wereElementary Algebra and Planar Geometry (Math A) and Intermediate Algebra and Trigonometry(Math B). Two new math exams, Integrated Algebra I (Math E) and Geometry (Math G), have sincebeen phased in. Since students typically either take Math A or Math E, we focus on the score onthe test taken first, taking the Math A score when both are contemporaneous. Likewise, studentstypically either take Math B or Math G, so we focus on the score which comes first, taking the MathB score when both are contemporaneous. We denote the first test outcome as ‘Math’ and the secondoutcome as ‘Advanced Math’. There are Regents science exams in Earth Science, Living Environment,Chemistry, and Physics. The science outcome we focus on is Living Environment because it is theonly Regents science exam required to obtain a state high school diploma.
In Table D3, for each test, we report the number of applicants and the number of test scores weobserve. English and U.S. History Regents exams are typically taken in 11th grade. For the 2006-2007applicants, we expect to observe these scores in the 2009-2010, a year after the Regents test score file’slast date. Even though there are a small number of students who take these exams before the 11thgrade, we do not examine Regents English and U.S. History outcomes for the 2006-2007 applicantcohort, since the vast majority do not.
Since students may take Regents exams multiple times, there can be multiple test scores perstudent in the Regents test file. Table D3 presents the number of students who have taken each exam
7

more than once among the exam applicant sample. This fraction is about 10%, with slightly higherretake rates for math and Global History. Some students may also take Regents exams before examschool enrollment. Table D3 shows the fraction of students who take exams before enrolling in anexam school. A large fraction of exam school applicants take math before enrolling. Most Regentsexams are offered in January, June, and August, with most students usually taking tests in June.
For some subjects, such as Global History, most applicants take the test at the end of 10th grade.For other tests, such as math (Math A or E), many students take the exam before entering high schooland some students take the exam multiple times. The exact number of students who take the exambefore 9th grade, the number who take the exam more than once after 9th grade, and the number whotake the exam on a date other than the most common date are presented in Table D3. For each testwhere there is a re-take, we only use the first test outcome. New York exam offers do not consistentlyboost grade repetition.
For each test, students who have scores before the 9th grade are omitted because they tested priorto potential exam enrollment. If a student takes the test more than once after 9th grade, we usedthe test score from the earliest date. There are a small number of cases where there is more than onescore on the same date, and this date is the first date after entering 9th grade. In some of these cases,there are two different test codes, where one code ends with a “2.” We used the score correspondingto the test that does not end with a “2.” Otherwise, we treated the score as missing.
For each subject, we standardized scores to have mean zero and standard deviation one withinyear-semester-subject among the universe of students: 8th graders from public school who participatedin Round 1 of the HS Admissions process, have valid demographic information, and did not take theSHSAT test in a previous year.
D.2 Matching Data Sets
Match between Exam Applicant file and Enrollment Office student file
We matched the exam application to the student file using the OSISID. Table D2 shows the matchrates. Nearly every student who has applied to an exam school can be matched to the correspondingEnrollment Office student file. The student file allows us to identify whether an applicant is in grade8 or 9. Since there are a limited number of 9th grade applicants for grade 10 spots, we kept onlystudents applying for grade 9. Finally, our sample is limited to first-time SHSAT takers.
Coding the offer variable
For each exam school and applicant year, the exam school offer file indicates the school at whicha student obtains an offer (if any). The offered school is the student’s most preferred school where astudent has a high enough SHSAT score. For each school, we computed the minimum score needed toobtain an offer at each exam school. We coded anyone with an SHSAT score above the lowest scoreoffered as having received an offer.
Coding Attendance
Students are coded as attending an exam school if they are enrolled at an exam school in theregistration file.
D.3 Construction of the Analysis Sample
After processing the exam application file, we next matched it to the registration file for grade 9. Anexam applicant may not match to the registration file if she leaves New York City’s Public Schoolsfollowing application. Such an applicant would not contribute any follow up scores.
8

To generate the final analysis dataset, we merged the student registration and test file with theexam application file. The exam application file contains the NYC ID, a list of exam schools that stu-dents have ranked, and the student’s raw SHSAT test score. This data spans four cycles of admissionsyears: 2003-04 through 2006-07.
Next, we merged baseline scores for students for whom they are available. Finally, we mergedthe dataset of cleaned Regents outcome scores. For each test, we compute the implied years of examschool attendance based on the test date and enrollment status. If a student took a Regents test inthe fall semester, we computed years assuming the exam date is January 31st. Otherwise, we computeyears assuming the exam date is June 1st. The resulting file is our analysis sample. An applicantwho is matched to the registration file for grade 9 may not contribute follow up scores if the applicantleaves New York City’s Public Schools before taking a Regents exam. The last column of Table D1indicates the sample of students who contribute at least one follow up score.
9

0.1
.2.3
.4
0 .2 .4 .6 .8 1MCAS Percentile
Baseline Math
0.1
.2.3
.4
0 .2 .4 .6 .8 1MCAS Percentile
Baseline English
O’Bryant Latin Academy Latin School
Figure A1: Probability of Applying to Exam School Conditional on Baseline Score (Middle School)
0.2
.4.6
.81
0 .2 .4 .6 .8 1MCAS Percentile
Baseline Math
0.2
.4.6
.81
0 .2 .4 .6 .8 1MCAS Percentile
Baseline English
O’Bryant Latin Academy Latin School
Figure A2: Probability Applicant Ranks Exam School First Conditional on Baseline Score (Middle School)

All Exam Offered Enrolled All Exam Offered EnrolledBoston Applicants Students Students Boston Applicants Students Students
(1) (2) (3) (4) (5) (6) (7) (8)
Female 0.478 0.539 0.563 0.565 0.476 0.540 0.614 0.602Black 0.476 0.376 0.240 0.237 0.505 0.493 0.361 0.367Hispanic 0.308 0.207 0.163 0.155 0.331 0.243 0.233 0.215Free Lunch 0.715 0.706 0.618 0.616 0.762 0.805 0.783 0.799LEP 0.200 0.141 0.113 0.113 0.181 0.130 0.117 0.133SPED¥ 0.230 0.044 0.008 0.008 0.250 0.079 0.019 0.015N 51480 11464 5441 4807 30484 5540 1461 1095
Math -0.017 0.758 1.399 1.436 -0.313 0.227 1.036 1.058English -0.020 0.725 1.286 1.315 -0.246 0.275 0.835 0.824N 37779 9423 4577 4055 27505 5461 1436 1081
¥ SPED only available for years 1999-2004.* Baseline scores available from 2000 onward for 6th grade and from 2002 onward for grade 8.
Notes: This table reports sample means for 1999-2008. The All Boston sample includes 6th and 8th grade students in Boston public schools who had not previously enrolled in any exam school. Exam Applicants are students with a valid application; offered students are applicants who receive an offer at any exam school; enrolled students are applicants who enrolled at any exam school in the following school year. Baseline Math and English scores for 7th grade applicants are from 4th grade. Baseline scores for 9th grade applicants are from middle school. LEP means Limited English Proficient. SPED means Special Education. N is the number of observations with at least one non-missing value for the variable listed.
Table A1. Descriptive Statistics for Boston Exam School Applicants7th Grade 9th Grade
A. Demographics
B. Baseline Scores*
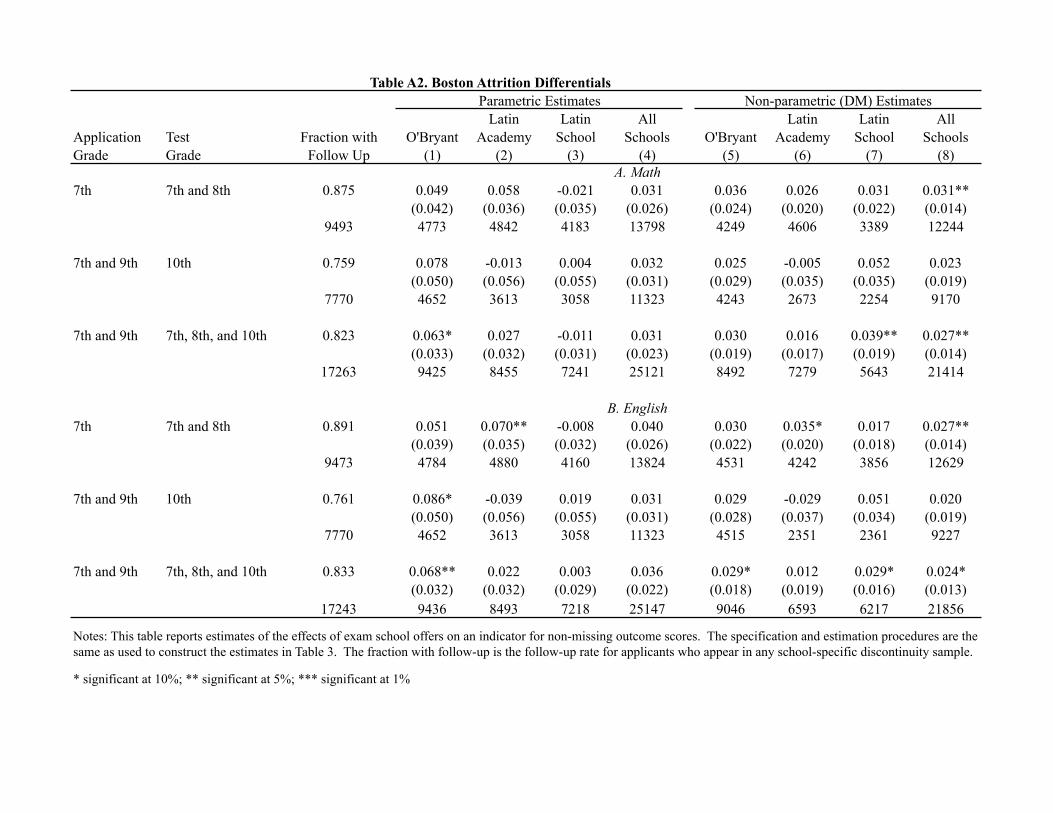
Latin Latin All Latin Latin AllApplication Test Fraction with O'Bryant Academy School Schools O'Bryant Academy School SchoolsGrade Grade Follow Up (1) (2) (3) (4) (5) (6) (7) (8)
7th 7th and 8th 0.875 0.049 0.058 -0.021 0.031 0.036 0.026 0.031 0.031**(0.042) (0.036) (0.035) (0.026) (0.024) (0.020) (0.022) (0.014)
9493 4773 4842 4183 13798 4249 4606 3389 12244
7th and 9th 10th 0.759 0.078 -0.013 0.004 0.032 0.025 -0.005 0.052 0.023(0.050) (0.056) (0.055) (0.031) (0.029) (0.035) (0.035) (0.019)
7770 4652 3613 3058 11323 4243 2673 2254 9170
7th and 9th 7th, 8th, and 10th 0.823 0.063* 0.027 -0.011 0.031 0.030 0.016 0.039** 0.027**(0.033) (0.032) (0.031) (0.023) (0.019) (0.017) (0.019) (0.014)
17263 9425 8455 7241 25121 8492 7279 5643 21414
7th 7th and 8th 0.891 0.051 0.070** -0.008 0.040 0.030 0.035* 0.017 0.027**(0.039) (0.035) (0.032) (0.026) (0.022) (0.020) (0.018) (0.014)
9473 4784 4880 4160 13824 4531 4242 3856 12629
7th and 9th 10th 0.761 0.086* -0.039 0.019 0.031 0.029 -0.029 0.051 0.020(0.050) (0.056) (0.055) (0.031) (0.028) (0.037) (0.034) (0.019)
7770 4652 3613 3058 11323 4515 2351 2361 9227
7th and 9th 7th, 8th, and 10th 0.833 0.068** 0.022 0.003 0.036 0.029* 0.012 0.029* 0.024*(0.032) (0.032) (0.029) (0.022) (0.018) (0.019) (0.016) (0.013)
17243 9436 8493 7218 25147 9046 6593 6217 21856
* significant at 10%; ** significant at 5%; *** significant at 1%
Notes: This table reports estimates of the effects of exam school offers on an indicator for non-missing outcome scores. The specification and estimation procedures are the same as used to construct the estimates in Table 3. The fraction with follow-up is the follow-up rate for applicants who appear in any school-specific discontinuity sample.
Table A2. Boston Attrition DifferentialsParametric Estimates Non-parametric (DM) Estimates
A. Math
B. English

Latin Latin All Latin Latin AllO'Bryant Academy School Schools O'Bryant Academy School Schools
Covariate Mean (1) (2) (3) (5) (5) (6) (7) (8)
Female 0.567 -0.055 -0.029 -0.023 -0.037 -0.023 0.054 0.054 0.022(0.061) (0.065) (0.070) (0.037) (0.036) (0.041) (0.043) (0.024)
7317 3694 3725 3232 10651 3367 2755 2441 8563
Black 0.312 0.060 0.024 0.009 0.033 -0.025 0.042 0.026 0.016(0.058) (0.060) (0.056) (0.034) (0.036) (0.031) (0.030) (0.019)
7309 3693 3722 3225 10640 3264 3722 3225 10211
Hispanic 0.195 -0.051 -0.061 -0.074 -0.061** -0.012 -0.038 -0.023 -0.024(0.051) (0.054) (0.053) (0.030) (0.028) (0.029) (0.031) (0.017)
7309 3693 3722 3225 10640 3693 3722 2971 10386
Free Lunch 0.682 0.013 -0.130** -0.123* -0.074** 0.011 -0.078*** -0.043 -0.035**(0.049) (0.056) (0.064) (0.031) (0.027) (0.030) (0.035) (0.018)
7317 3694 3725 3232 10651 3694 3725 3232 10651
LEP‡ 0.126 -0.015 -0.023 -0.138*** -0.054** 0.017 -0.025 -0.077*** -0.023*(0.042) (0.043) (0.037) (0.024) (0.023) (0.026) (0.021) (0.014)
7317 3694 3725 3232 10651 3694 2856 3087 9637
SPED¥ 0.015 -0.018 -0.014 -0.004 -0.012 -0.017 -0.004 0.010 -0.004(0.029) (0.015) (0.018) (0.013) (0.014) (0.008) (0.008) (0.006)
4493 2311 2249 1982 6542 2226 2249 1982 6457
Joint p-value 0.758 0.228 0.003 0.028 0.756 0.037 0.004 0.169
Female 0.602 -0.049 -0.017 0.009 -0.032 0.035 -0.064 -0.034 -0.005(0.084) (0.116) (0.169) (0.064) (0.049) (0.064) (0.099) (0.036)
2525 1978 978 754 3710 1875 978 501 3354
Black 0.415 0.040 0.054 -0.066 0.029 0.003 0.029 -0.096 -0.006(0.084) (0.111) (0.130) (0.061) (0.045) (0.087) (0.080) (0.036)
2522 1975 975 751 3701 1975 491 489 2955
Hispanic 0.232 -0.074 0.075 -0.069 -0.031 -0.005 0.047 0.032 0.013(0.071) (0.101) (0.134) (0.054) (0.043) (0.066) (0.090) (0.033)
2522 1975 975 751 3701 1787 651 402 2840
Free Lunch 0.789 -0.056 0.020 -0.309** -0.069 -0.001 0.076 -0.011 0.026(0.069) (0.085) (0.147) (0.051) (0.045) (0.050) (0.092) (0.031)
2525 1978 978 754 3710 1561 978 396 2935
LEP 0.118 0.000 -0.087 0.027 -0.021 0.023 -0.020 0.029 0.011(0.057) (0.074) (0.092) (0.042) (0.033) (0.043) (0.054) (0.024)
2525 1978 978 754 3710 1899 903 389 3191
SPED¥ 0.026 0.028 -0.002 -0.068 0.007 -0.002 -0.008 -0.013 -0.005(0.038) (0.027) (0.046) (0.024) (0.021) (0.013) (0.035) (0.015)
1364 1045 537 427 2009 1045 349 368 1762
Joint p-value 0.827 0.894 0.304 0.872 0.985 0.602 0.907 0.985
¥ SPED only available for years 1999-2004.* significant at 10%; ** significant at 5%; *** significant at 1%
Table A3. Boston Covariate DiscontinuitiesParametric Estimates Non-parametric (DM) Estimates
A. 7th Grade Applicants
B. 9th Grade Applicants
Notes: This table reports estimated discontinuities in covariates using models like those used to construct the reduced form estimates in Table 3. The joint p-value is from a F-test looking at all covariate discontinuities at once.

Latin Latin All Latin Latin AllApplication Test O'Bryant Academy School Schools O'Bryant Academy School SchoolsGrade Grade (1) (2) (3) (4) (5) (6) (7) (8)
7th 7th and 8th -0.250** -0.120 -0.129 -0.178** -0.143* -0.110 -0.042 -0.108**(0.127) (0.110) (0.164) (0.075) (0.077) (0.084) (0.089) (0.044)2580 2211 1308 6099 2206 1986 1291 5483
7th and 9th 10th 0.046 -0.178 -0.048 -0.042 0.029 -0.118* -0.084* -0.038(0.097) (0.111) (0.074) (0.068) (0.065) (0.068) (0.048) (0.044)2234 1444 903 4581 1806 1087 672 3565
7th and 9th 7th, 8th, and 10th -0.112 -0.144* -0.099 -0.120** -0.068 -0.113** -0.056 -0.081***(0.089) (0.082) (0.114) (0.055) (0.059) (0.053) (0.068) (0.031)4814 3655 2211 10680 4012 3073 1963 9048
7th 7th and 8th -0.053 -0.175** -0.255** -0.141** -0.049 -0.015 -0.124** -0.055(0.090) (0.089) (0.102) (0.059) (0.048) (0.062) (0.054) (0.034)2640 2260 1312 6212 2544 2204 1312 6060
7th and 9th 10th 0.150 0.240** -0.095 0.136* 0.180*** 0.218*** 0.046 0.166***(0.100) (0.109) (0.133) (0.073) (0.059) (0.076) (0.083) (0.043)2244 1446 904 4594 2101 955 675 3731
7th and 9th 7th, 8th, and 10th 0.041 -0.006 -0.198** -0.024 0.051 0.055 -0.072 0.026(0.076) (0.084) (0.093) (0.055) (0.042) (0.058) (0.051) (0.031)4884 3706 2216 10806 4645 3159 1987 9791
* significant at 10%; ** significant at 5%; *** significant at 1%
Notes: This table reports estimates of the effects of exam school offers on MCAS scores. The sample covers students within 20 standardized units of offer cutoffs. Parametric models include a cubic function of the running variable, allowed to differ on either side of offer cutoffs. Non-parametric estimates use the edge kernel, with bandwidth computed following DesJardins & McCall (2008). Optimal bandwidths were computed separately for each school. Robust standard errors, clustered on year and school are shown in parentheses. Standard errors for all school estimates and for those pooling outcomes also cluster on student. The number of observations is reported below standard errors.
Table A4. Boston Reduced Form Estimates for Blacks and Hispanics: MCAS Math and EnglishParametric Estimates Non-parametric (DM) Estimates
Panel A. Math
Panel B. English
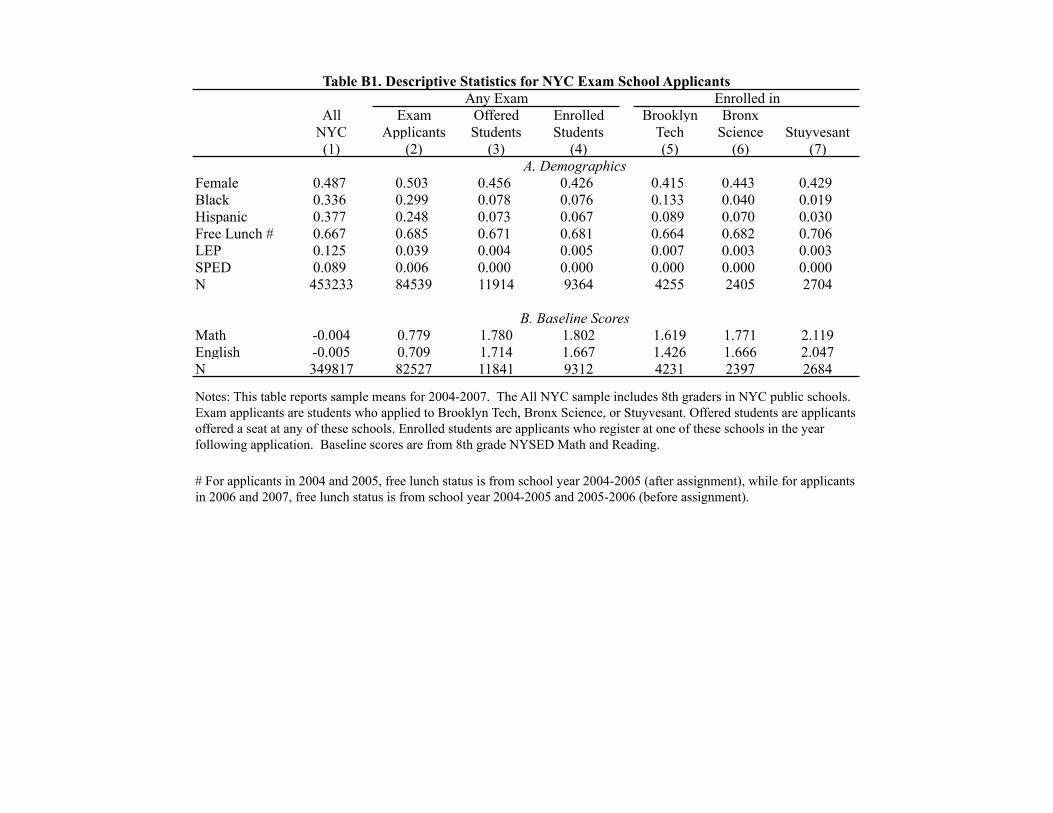
All Exam Offered Enrolled Brooklyn BronxNYC Applicants Students Students Tech Science Stuyvesant(1) (2) (3) (4) (5) (6) (7)
Female 0.487 0.503 0.456 0.426 0.415 0.443 0.429Black 0.336 0.299 0.078 0.076 0.133 0.040 0.019Hispanic 0.377 0.248 0.073 0.067 0.089 0.070 0.030Free Lunch # 0.667 0.685 0.671 0.681 0.664 0.682 0.706LEP 0.125 0.039 0.004 0.005 0.007 0.003 0.003SPED 0.089 0.006 0.000 0.000 0.000 0.000 0.000N 453233 84539 11914 9364 4255 2405 2704
Math -0.004 0.779 1.780 1.802 1.619 1.771 2.119English -0.005 0.709 1.714 1.667 1.426 1.666 2.047N 349817 82527 11841 9312 4231 2397 2684
# For applicants in 2004 and 2005, free lunch status is from school year 2004-2005 (after assignment), while for applicants in 2006 and 2007, free lunch status is from school year 2004-2005 and 2005-2006 (before assignment).
Table B1. Descriptive Statistics for NYC Exam School ApplicantsAny Exam Enrolled in
A. Demographics
B. Baseline Scores
Notes: This table reports sample means for 2004-2007. The All NYC sample includes 8th graders in NYC public schools. Exam applicants are students who applied to Brooklyn Tech, Bronx Science, or Stuyvesant. Offered students are applicants offered a seat at any of these schools. Enrolled students are applicants who register at one of these schools in the year following application. Baseline scores are from 8th grade NYSED Math and Reading.

(1) (2) (3) (4) (5) (6) (7) (8)Math 0.535 -0.068 0.04 0.042 0.005 0.016 0.016 0.053* 0.026*
(0.043) (0.045) (0.043) (0.025) (0.026) (0.023) (0.029) (0.015)18782 9181 8192 8434 25807 7126 8192 5757 21075
Advanced Math 0.799 0.101*** 0.038 -0.027 0.036* 0.074*** 0.022 0.008 0.033***(0.039) (0.035) (0.030) (0.020) (0.024) (0.018) (0.019) (0.012)
18782 9181 8192 8434 25807 6586 8192 6141 20919
English 0.871 0.014 0.054 0.016 0.027 0.026 0.02 0.026* 0.024**(0.035) (0.033) (0.029) (0.018) (0.018) (0.018) (0.015) (0.010)
13897 7032 6335 6309 19676 7032 6335 6309 19676
Global History 0.862 0.064* 0.052* 0.022 0.045*** 0.059*** 0.017 0.019 0.031***(0.034) (0.030) (0.026) (0.017) (0.018) (0.015) (0.016) (0.010)
18782 9181 8192 8434 25807 8407 8192 6506 23105
US History 0.810 0.029 0.06 -0.016 0.023 0.044* 0.031 0.009 0.029**(0.042) (0.040) (0.033) (0.022) (0.026) (0.021) (0.021) (0.013)
13897 7032 6335 6309 19676 5121 6335 4472 15928
Living Environment 0.794 -0.015 0.041 0.035 0.020 0.032* 0.012 0.004 0.016(0.037) (0.035) (0.033) (0.020) (0.019) (0.020) (0.016) (0.011)
18782 9181 8192 8434 25807 9181 7017 8434 24632
*significant at 10%; **significant at 5%; ***significant at 1%.
Stuyvesant All Schools
Notes: This table reports estimates of the effect of exam school offers on indicators for non-missing outcome scores. Models and estimation procedures are the same as for Table 8. The fraction with follow-up is the follow-up rate for applicants who appear in any school-specific discontinuity sample.
Table B2. New York Attrition DifferentialsParametric Estimates Non-parametric (DM) Estimates
Fraction with Follow Up
Brooklyn Tech
Bronx Science Stuyvesant All Schools Brooklyn
TechBronx
Science

(1) (2) (3) (4) (5) (6) (7) (8)Female 0.469 -0.005 -0.003 0.012 0.002 -0.006 -0.013 -0.018 -0.012
(0.044) (0.045) (0.043) (0.025) (0.022) (0.027) (0.022) (0.014)18782 9181 8192 8434 25807 9181 6768 8434 24383
Black 0.109 -0.046 -0.002 0.023 -0.008 -0.033* -0.002 0.014 -0.006(0.032) (0.028) (0.021) (0.016) (0.018) (0.015) (0.011) (0.009)
18782 9181 8192 8434 25807 7699 8192 7667 23558
Hispanic 0.107 0.030 -0.012 0.055*** 0.025 0.032** -0.013 0.005 0.008(0.031) (0.028) (0.020) (0.015) (0.016) (0.014) (0.011) (0.009)
18782 9181 8192 8434 25807 9181 8192 7786 25159
Free Lunch# 0.669 -0.013 0.058 -0.091** -0.018 -0.008 0.042* -0.034 0.001(0.041) (0.042) (0.040) (0.024) (0.022) (0.022) (0.022) (0.013)
18782 9181 8192 8434 25807 9139 8192 7944 25275
LEP 0.005 0.012** -0.002 0.001 0.004 0.000 -0.003 -0.002 -0.002(0.006) (0.004) (0.005) (0.003) (0.003) (0.003) (0.002) (0.002)
18782 9181 8192 8434 25807 8703 6675 8434 23812Joint test: p-value 0.228 0.775 0.016 0.393 0.262 0.316 0.384 0.722
* significant at 10%; ** significant at 5%; *** significant at 1%.
Stuyvesant All Schools
Notes: This table reports estimated discontinuities in covariates using models like those used to construct the reduced form estimates in Table 8. The joint p-value is from an F-test looking at all covariate discontinuities at once.
Table B3. New York Covariate DiscontinuitiesParametric Estimates Non-parametric (DM) Estimates
Mean of Variable
Brooklyn Tech Bronx Science Stuyvesant All Schools Brooklyn Tech Bronx Science

(1) (2) (3) (4) (5) (6) (7) (8) (9)Math 1.422 0.869 -0.055*** 1.493 0.925 -0.035* 1.243 0.711 0.013
(0.018) (0.019) (0.047)10523 9138 2722
Advanced Math 0.932 0.567 -0.029 1.024 0.635 -0.006 0.59 0.341 -0.008(0.023) (0.020) (0.053)16168 14612 3236
English 1.092 0.812 0.011 1.157 0.866 0.012 0.969 0.711 0.021(0.013) (0.017) (0.043)15450 10254 3457
Global History 1.231 0.837 -0.016 1.28 0.875 -0.019 1.076 0.712 -0.055(0.014) (0.014) (0.036)17569 13422 4321
US History 1.147 0.934 0.003 1.183 0.953 0.000 1.029 0.866 -0.007(0.015) (0.013) (0.032)11828 9331 3206
Living Environment 1.33 0.706 -0.021* 1.376 0.751 -0.019 1.175 0.559 -0.059-0.012 -0.014 -0.03718928 15343 3675
* significant at 10%; ** significant at 5%; *** significant at 1%
2201
Proportion above 85 on
Regents
Non-parametric (DM) Estimates
Notes: This table reports reduced form estimates for students with high baseline scores and for minorities like those used to construct the reduced form estimates in Table 8. Baseline means and the proportion of applicants above 85 are computed for those who belong to at least one discontinuity sample. Math scores are from either Regents Math A (Elementary Algebra and Planar Geometry) or Integrated Algebra I. Advanced Math scores are from either Regents Math B (Intermediate Algebra and Trigonometry) or Geometry.
2799
11333 8069 2486
Table B4. New York Reduced Form Estimates for SubgroupsHigh Baseline Scores
Upper Half Upper Quartile
9559 7071
Non-parametric (DM) Estimates
Baseline Mean
15007 8069 3246
10534 7546 2254
14580 11501
Black and Hispanic
14338 11081 2852
Baseline Mean
Proportion above 85 on
Regents
Non-parametric (DM) Estimates
Baseline Mean
Proportion above 85 on
Regents

Total number of records
Excluding duplicate
observations
Excluding applicants
from private schools
Excluding students who
did not rank an exam school
Excluding students who are not ranked
by an exam school
Excluding students who
obtain an offer at a school they do not
rank
Excluding students not matched to
Boston Public Schools at baseline
Excluding students
previously enrolled in
exam school
Excluding students with no observed
outcome MCAS test
scores(1) (2) (3) (4) (5) (6) (7) (8) (9)
1999 2353 2353 1353 1307 1307 1307 1180 1180 10002000 2283 2283 1252 1165 1165 1165 1125 1125 10322001 2317 2317 1299 1196 1196 1196 1193 1193 11002002 2365 2365 1304 1237 1236 1236 1235 1235 11182003 2494 2494 1386 1251 1251 1251 1240 1240 11272004 2217 2217 1206 1174 1174 1174 1172 1172 10832005 2062 2062 1116 1105 1105 1099 1095 1095 10012006 2079 2079 1184 1166 1166 1161 1158 1158 10522007 1992 1992 1086 1081 1080 1073 1068 1068 9742008 1874 1874 1050 1049 1040 1036 998 998 898
All Years 22036 22036 12236 11731 11720 11698 11464 11464 10385
2001 1520 1520 863 787 787 787 783 680 4962002 1607 1607 876 829 828 828 826 755 5532003 1750 1750 951 812 812 812 809 727 5462004 1723 1723 936 918 918 918 912 815 6312005 1630 1630 936 924 924 924 918 832 6422006 1729 1729 992 981 981 981 977 889 6772007 1684 1683 945 936 931 931 930 842 612
All Years 11643 11642 6499 6187 6181 6181 6155 5540 4157Notes: This table summarizes the steps going from the raw application data to the analysis sample.
Application Year
Table C1. Processing of Boston Exam School Application Data
A. 7th Grade Applicants
B. 9th Grade Applicants

Application Year
Math 7 Math 8 Math 10 English 7 English 8 English 10 PSAT SAT APYear (1) (2) (3) (4) (5) (6) (7) (8) (9)
1999 2001 2003 2003 20052000 2002 2004 2001 2004 2004 2006 20062001 2003 2005 2002 2005 2005 2007 20072002 2004 2006 2003 2006 2006 2008 20082003 2005 2007 2004 2007 2007 2009 20092004 2006 2008 2005 2006 2008 2008 2010 20102005 2006 2007 2009 2006 2007 2009 20092006 2007 2008 2007 20082007 2008 2009 2008 20092008 2009 2009
2001 2003 2003 2005 20052002 2004 2004 2004 2006 20062003 2005 2005 2005 2007 20072004 2006 2006 2006 2008 20082005 2007 2007 2007 2009 20092006 2008 2008 2008 2010 20102007 2009 2009 2009
Table C2. Data Structure and Test Outcomes for Boston
Notes: This table reports the applicant cohorts and test year outcomes. Application year refers to the fall of application year, while test outcome year refers to the spring of year. Test outcomes are available based on the schedule of the MCAS and availability of SAT, PSAT and AP score outcomes.
B. 9th Grade Applicants
A. 7th Grade Applicants

Total Offered Not Offered(1) (2) (3) (4)
1999 1307 0.903 0.919 0.8902000 1165 0.966 0.958 0.9722001 1196 0.997 0.996 0.9982002 1236 0.999 1.000 0.9992003 1251 0.991 0.996 0.9872004 1174 0.998 1.000 0.9972005 1099 0.996 0.996 0.9962006 1161 0.997 0.995 1.0002007 1073 0.995 1.000 0.9912008 1036 0.963 0.980 0.946
All Years 14212 0.966 0.969 0.963
2001 787 0.995 1.000 0.9932002 828 0.998 1.000 0.9972003 812 0.996 1.000 0.9952004 918 0.993 1.000 0.9922005 924 0.994 0.992 0.9942006 981 0.996 1.000 0.9942007 931 0.999 1.000 0.999
All Years 6181 0.996 0.999 0.995
Table C3. Match from Boston Exam Application to Enrollment Data Fraction with MatchNumber of
StudentsApplication Year
Notes: This table provides summary statistics on the match between the exam school application data and the Boston Public School enrollment file. The sample in column (1) is the sample in column (6) of Table C1.
A. 7th Grade Applicants
B. 9th Grade Applicants

(1) (2) (3) (4) (5) (6)
1999 1180 1000 2360 1765 1180 8002000 1125 1032 2250 1776 2250 17922001 1193 1100 2386 1843 2386 18972002 1235 1118 2470 1894 2470 19452003 1240 1127 2480 1897 2480 20062004 1172 1083 2344 1842 3516 28902005 1095 1001 3285 2650 3285 26502006 1158 1052 2316 2039 2316 20382007 1068 974 2136 1884 2136 18792008 998 898 998 895 998 897
All Years 11464 10385 23025 18485 23017 18794
2001 680 496 680 496 680 4952002 755 553 755 551 755 5502003 727 546 727 545 727 5432004 815 631 815 621 815 6302005 832 642 832 630 832 6362006 889 677 889 662 889 6732007 842 612 842 603 842 610
All Years 5540 4157 5540 4108 5540 4137
7th Grade
Notes: This table summarizes the observed test score outcomes for exam school applicants. The sample is restricted to students in column (8) of Table C1.
Table C4. Test Outcome Data for Boston Exam School Applicants
Application Year
Number of students
Number with an observed test
score
Number of Math test scores expected
Math test scores observed
English test scores observed
Number of English test scores
expected
9th Grade

(1) (2) (3) (4) (5) (6) (7) (8) (9)
1999 1,180 50 0 640 0 291 1,180 840 1,1802000 1,125 707 1,125 647 1,125 341 1,125 879 1,1252001 1,193 826 1,193 710 1,193 432 1,193 959 1,1932002 1,235 834 1,235 683 1,235 427 1,235 1053 1,2352003 1,240 844 1,240 687 1,240 481 1,240 1059 1,2402004 1,172 788 1,172 679 1,172 499 1,172 949 1,1722005 1,095 664 1,095 3 0 345 0 202 02006 1,158 10 0 0 0 14 0 137 02007 1,068 0 0 0 0 0 0 115 02008 998 0 0 0 0 0 0 0 0
All Years 11,464 4,723 7,060 4,049 5,965 2,830 7,145 6,193 7,145
2001 680 22 0 374 680 113 680 522 6802002 755 462 755 413 755 159 755 602 7552003 727 520 727 426 727 177 727 618 7272004 815 635 815 478 815 235 815 786 8152005 832 598 832 454 832 255 832 805 8322006 889 612 889 481 889 290 889 797 8892007 842 528 842 2 0 142 0 201 0
All Years 5,540 3,377 4,860 2,628 4,698 1,371 4,698 4,331 4,698
Table C5. Matching of College Board Test Outcome Data for Boston Applicants
Number with observed NSC
outcomes
Number with expected NSC
outcomes (enrolled as of
grade 12)
Number with an expected SAT
test score (enrolled as of
grade 11)
Number with an observed AP test
score
Number with an expected AP test score (enrolled as of grade 12)
Notes: This table summarizes the observed College Board test score outcomes for exam school applicants. The sample is restricted to students in column (8) of Table C1.
Application Year
Number of applicants
Number with an observed PSAT
test score
Number with an expected PSAT
test score (enrolled as of
grade 11)
Number with an observed SAT
test score
A. 7th Grade
B. 9th Grade

(1) (2) (3) (4) (5)2003-04 28,136 23,637 22,293 22,287 22,2052004-05 28,279 24,123 22,894 22,859 22,7762005-06 28,442 23,971 22,810 22,810 22,3762006-07 26,616 22,377 21,278 21,278 20,824All Years 111,473 94,108 89,275 89,234 88,181
(6) (7) (8) (9)2003-04 22,108 21,091 21,091 18,3612004-05 22,776 21,883 21,880 19,1062005-06 22,376 21,448 21,446 18,8422006-07 20,824 20,124 20,122 17,431All Years 88,084 84,546 84,539 73,740
Excluding students who did not rank Brooklyn
Tech, Bronx Science or Stuyvesant
Table D1. Processing of NYC Exam School Application Data
Notes: This table summarizes the steps going from raw application data to the analysis sample.
Application Year
Application Year
Total number of records
Excluding students not matched to student file
Excluding applicants from private schools
Excluding 9th graders
Excluding applicants not in Round 1 of the
application process
Excluding students who took SHSAT in previous
years
Excluding students who did not rank an exam
school
Excluding students without post-assignment numeric outcome test scores at all

Total Offered Not Offered(1) (2) (3) (4)
2003-04 22,205 0.996 0.997 0.9952004-05 22,776 1 1 12005-06 22,376 1 1 12006-07 20,824 1 1 1All Years 88,181 0.999 0.999 0.999
Table D2. Match from NYC Exam Application to Student DataFraction with Match
Application YearNumber of Students
Notes: This table reports the fraction of applicants with a match between the exam application file and the student demographic file. The sample corresponds to column (5) of Table D1.

2003-04 2004-05 2005-06 2006-07 All Years(1) (2) (3) (4) (5)
Number of applicants 21,091 21,880 21,446 20,122 84,539Number with score observed before treatment 2,685 3,157 3,673 3,975 13,490Number with score observed after treatment 15,055 15,307 14,206 12,492 57,060Number with different multiple scores observed after treatment 1,795 2,360 2,000 1,821 7,976Number with different multiple scores observed after treatment, on first date 3 20 10 2 35Number with score observed on most common date 5,822 5,873 6,078 8,033 25,806Number with score observed before most common date 3,522 3,875 4,348 2,022 13,767Number with score observed after most common date 5,711 5,559 3,779 2,437 17,486
Number of applicants 21,091 21,880 21,446 20,122 84,539Number with score observed before treatment 7 9 13 29 58Number with score observed after treatment 10,375 10,691 10,939 12,130 44,135Number with different multiple scores observed after treatment 1,469 1,750 898 235 4,352Number with different multiple scores observed after treatment, on first date 13 4 0 0 17Number with score observed on most common date 3,913 3,938 5,496 11,177 24,524Number with score observed before most common date 4,310 4,671 5,443 953 15,377Number with score observed after most common date 2,152 2,082 0 0 4,234
Number of applicants 21,091 21,880 21,446 20,122 84,539Number with score observed before treatment 2 1 0 n.a 14Number with score observed after treatment 16,847 17,322 17,202 n.a 54,410Number with different multiple scores observed after treatment 1,979 2,024 1,501 n.a 5,641Number with different multiple scores observed after treatment, on first date 11 3 0 n.a 14Number with score observed on most common date 9,333 8,614 8,985 n.a 29,389Number with score observed before most common date 1,829 2,587 2,705 n.a 7,703Number with score observed after most common date 5,685 6,120 5,512 n.a 17,317
Number of applicants 21,091 21,880 21,446 20,122 84,539Number with score observed before treatment 3 19 18 8 48Number with score observed after treatment 17,057 17,735 16,434 15,429 66,655Number with different multiple scores observed after treatment 2,321 2,882 1,771 203 7,177Number with different multiple scores observed after treatment, on first date 19 59 1 0 79Number with score observed on most common date 13,746 13,471 13,100 14,328 54,645Number with score observed before most common date 796 844 1,037 1,101 3,778Number with score observed after most common date 2,514 3,420 2,296 0 8,230
Number of applicants 21,091 21,880 21,446 20,122 84,539Number with score observed before treatment 41 23 91 n.a 256Number with score observed after treatment 15,766 16,015 14,270 n.a 47,906Number with different multiple scores observed after treatment 1,152 1,102 496 n.a 2,962Number with different multiple scores observed after treatment, on first date 20 0 3 n.a 23Number with score observed on most common date 10,252 10,365 11,844 n.a 33,431Number with score observed before most common date 1,464 2,068 2,426 n.a 6,013Number with score observed after most common date 4,049 3,582 0 n.a 8,461
Number of applicants 21,091 21,880 21,446 20,122 84,539Number with score observed before treatment 440 878 894 922 3,134Number with score observed after treatment 16,562 16,807 16,310 14,102 63,781Number with different multiple scores observed after treatment 1,356 1,807 1,484 977 5,624Number with different multiple scores observed after treatment, on first date 2 7 8 0 17Number with score observed on most common date 11,601 11,455 11,286 11,071 45,413Number with score observed before most common date 207 324 344 209 1,084Number with score observed after most common date 4,754 5,027 4,679 2,822 17,282
V. US History
VI. Living Environment
Notes: This table summarizes the match between Regents test score outcomes and exam school applicants. The sample is restricted to students in column (8) of Table D1.
Record Availability
Table D3. Match from NYC Exam Applicants to Regents Test Score OutcomesApplication School Year
I. Math
II. Advanced Math
III. English
IV. Global History
Related Documents