The Effects on Mathematics Performance of Personalizing Word Problems to Students’ Interests Audra Eileen Kosh A dissertation submitted to the faculty at the University of North Carolina at Chapel Hill in partial fulfillment of the requirements for the degree of Education in the Learning Sciences and Psychological Studies program in the School of Education. Chapel Hill 2016 Approved by: Gregory Cizek Sharon Derry Jeffrey Greene Catherine Scott A. Jackson Stenner brought to you by CORE View metadata, citation and similar papers at core.ac.uk provided by Carolina Digital Repository

Welcome message from author
This document is posted to help you gain knowledge. Please leave a comment to let me know what you think about it! Share it to your friends and learn new things together.
Transcript
The Effects on Mathematics Performance of Personalizing Word Problems to Students’
Interests
Audra Eileen Kosh
A dissertation submitted to the faculty at the University of North Carolina at Chapel Hill in
partial fulfillment of the requirements for the degree of Education in the Learning Sciences
and Psychological Studies program in the School of Education.
Chapel Hill
2016
Approved by:
Gregory Cizek
Sharon Derry
Jeffrey Greene
Catherine Scott
A. Jackson Stenner
brought to you by COREView metadata, citation and similar papers at core.ac.uk
provided by Carolina Digital Repository

ii
© 2016
Audra Eileen Kosh
ALL RIGHTS RESERVED
iii
ABSTRACT
Audra Eileen Kosh: The Effects on Mathematics Performance of Personalizing Word
Problems to Students’ Interests
(Under the direction of Dr. Gregory J. Cizek)
This study explored student performance on topic-personalized word problems
(TPWPs) in middle school mathematics whereby the context of a word problem was
customized to students’ self-selected interests (i.e., sports; movies, music, and television;
animals; travel; and science and technology). Using a within-subjects research design, 343
rising eighth-graders answered approximately 6,000 word problems – half of which were
TPWPs and half of which were generic word problems – in the context of a free, online
summer mathematics skills retention program for students. Research questions focused on
whether TPWPs triggered students’ situational interest and how accuracy and speed of word
problem responses differed between TPWPs and matched generic word problems. After
controlling for the mathematics content of the items (i.e., rates and ratios, integer operations,
and equations and inequalities), reading demand of the item stem, and students’ perceived
mathematics ability level, results of multilevel modeling indicated that students were more
likely to rate TPWPs as interesting as compared to generic word problems and that students
were more likely to answer items correctly when rating items as interesting. However, no
evidence was found that students were more likely to answer TPWPs correctly after
controlling for interest ratings. Results suggested that TPWPs triggered students’ situational
interest and that student interest relates to student performance indicators.

iv
To all of my teachers, in all of their many forms.
v
ACKNOWLEDGEMENTS
This dissertation would not have been possible without my many supporters. My
advisor, Dr. Gregory Cizek, and committee members, Dr. Sharon Derry, Dr. Jeffrey Greene,
Dr. Catherine Scott, and Dr. Jack Stenner, all provided valuable insight that guided the
direction of my work in addition to the training they provided me throughout my graduate
school journey. Also, a village of team members at MetaMetrics, Inc. made this study
possible, both through their contribution to implementing data collection and through support
of my intellectual development, including Amber Aguirre, Lisa Bickel, Allen Johnson, Steve
Lattanzio, Morris Lewis, David Lines, Qianqian Pan, Eric Petway, Ruth Price, Ellie Sanford-
Moore, Cameron Shirley, Mary Ann Simpson, Joe Sipper, Keith Solademi, Callie Totten, and
Sandra Totten. Additionally, former and current teachers Linda Brug, James Butler, and
Richard Kow provided ideas regarding ways to write mathematics word problems targeted to
specific interest categories, and Chris Wiesen and Katie Clark from the Odum Institute
provided statistical consulting and help with Qualtrics functionality, respectively. Most
importantly, I thank my parents for instilling a love of learning in me and for supporting me
in all of my life decisions.
vi
TABLE OF CONTENTS
Page
LIST OF TABLES .................................................................................................................... x
LIST OF FIGURES ............................................................................................................... xiii
Chapter 1: Introduction ............................................................................................................. 1
Introduction ........................................................................................................................... 1
The Mechanism of Action: How Interest Affects Learning .................................................. 4
Purpose and Research Questions........................................................................................... 7
Summary ............................................................................................................................... 8
Chapter 2: Literature Review .................................................................................................. 10
The Domain of Reading: How Interest Affects Learning ................................................... 10
Personalization of Mathematics Word Problems ................................................................ 12
Research on incidental personalization of word problems. ............................................. 12
Research on topic personalization of word problems. ..................................................... 15
How Interest and Choice Mediate Motivation, Learning, and Achievement Outcomes .... 18
Cognitive and behavioral outcomes associated with interest. ......................................... 19
Supporting students’ progressions to higher phases of interest. ...................................... 23
Features that Affect the Level of Challenge of Mathematics Word Problems ................... 24
Summary ............................................................................................................................. 30
Chapter 3: Method .................................................................................................................. 32
Procedures and Participants ................................................................................................ 32
vii
Development of Student Interest Categories ....................................................................... 38
Instrument Development ..................................................................................................... 42
Data Preparation .................................................................................................................. 57
Participants ...................................................................................................................... 57
Item and form characteristics .......................................................................................... 59
Item response times ......................................................................................................... 60
Data Analysis ...................................................................................................................... 65
Summary ............................................................................................................................. 68
Chapter 4: Results ................................................................................................................... 69
Descriptive Statistics ........................................................................................................... 69
Correlation Matrix ............................................................................................................... 73
RQ1: Rating TPWPs as Interesting ..................................................................................... 74
Summary of RQ1. ............................................................................................................ 80
RQ2: Accuracy of TPWPs .................................................................................................. 80
Summary of RQ2. ............................................................................................................ 84
RQ3: Response Time to TPWPs ......................................................................................... 85
Assessing assumptions of multilevel linear modeling. .................................................... 92
Summary of RQ3. ............................................................................................................ 94
Power Analysis .................................................................................................................... 95
Summary ........................................................................................................................... 101
Chapter 5: Discussion ........................................................................................................... 102
Significance and Implications of Results .......................................................................... 102
Discussion of RQ1. ........................................................................................................ 102
viii
Discussion of RQ2. ........................................................................................................ 104
Discussion of RQ3. ........................................................................................................ 105
Concluding remarks on results. ..................................................................................... 106
Challenges with Using TPWPs as an Instructional Strategy............................................. 107
Fit of mathematics content. ........................................................................................... 107
Potential of TPWPs to positively affect learning .......................................................... 109
The need for expert knowledge in interest categories. .................................................. 109
When to assume interest-specific prior knowledge. ...................................................... 110
Possible novelty effect. .................................................................................................. 110
Challenges with Using Technology to Create TPWPs...................................................... 111
Inaccurate interest survey responses. ............................................................................. 111
Modifying context of problem. ...................................................................................... 112
Use of gender pronouns. ................................................................................................ 113
Challenges with Conducting Research on TPWPs ........................................................... 113
Limitations of the Present Research Design ..................................................................... 116
Data collected after instruction occurred. ...................................................................... 116
Limitations of the interest categories. ............................................................................ 116
Limitations of the participant sample. ........................................................................... 117
Possible Hawthorne effect. ............................................................................................ 117
Future Research ................................................................................................................. 118
Modifications to research design in this study. ............................................................. 118
Exploring the possible mechanism of action. ................................................................ 119
Effects of TPWP on variables besides student performance. ........................................ 119
ix
Potential applications of TPWPs in student assessment. ............................................... 121
Summary ........................................................................................................................... 121
APPENDIX A: RECRUITMENT EMAILS ........................................................................ 124
Session One Recruitment Email ........................................................................................ 124
Session Two Recruitment Email ....................................................................................... 125
Session Three Recruitment Email ..................................................................................... 126
APPENDIX B: ITEMS USED FOR DATA COLLECTION............................................... 127
Session One Items ............................................................................................................. 127
Session Two Items ............................................................................................................ 133
Session Three Items .......................................................................................................... 139
APPENDIX C: TEXT COMPLEXITY OF ITEMS ............................................................. 145
APPENDIX D: ITEM STATISTICS .................................................................................... 148
REFERENCES ..................................................................................................................... 149
x
LIST OF TABLES
Table Page
1. Quantile Skills and Concepts in Each Data Collection Session ................................. 36
2. Frequency of Search Terms in Each Interest Category .............................................. 40
3. Example Generic and Personalized Word Problems ................................................... 46
4. Mean Lexile Measures of Item Stems ......................................................................... 47
5. Mean Number of Words in Item Stems ....................................................................... 47
6. Differences in Stem Word Counts Across Matched Word Problems .......................... 49
7. Count of Students by Interest Category, Week, and Type of First Problem ............... 52
8. Summary Item Statistics for Generic Problems and TPWPs by Session Number ...... 60
9. Variales Used in Multilevel Models ........................................................................... 67
10. Descriptive Statistics of Variables Used in Multilevel Models ................................. 70
11. Descriptive Statistics for Proportion of Problems Rated as Interesting..................... 71
12. Descriptive Statistics for Proportion of Correct Responses....................................... 71
13. Descriptive Statistics for Mean Response Time in Seconds...................................... 72
14. Correlation Matrix of Variables Used in Multilevel Models ..................................... 73
15. Unconditional Model for RQ1 ................................................................................... 75
16. Full Model for RQ1 ................................................................................................... 78
17. Final Model for RQ1.................................................................................................. 80
18. Unconditional Model for RQ2 ................................................................................... 81
19. Full Model for RQ2 ................................................................................................... 83
20. Final Model for RQ2.................................................................................................. 83
21. Unconditional Model for RQ3 ................................................................................... 88
xi
22. Full Model for RQ3 ................................................................................................... 91
23. Final Model for RQ3.................................................................................................. 91
24. Selected Values of Odds Ratio and Power for TPWP Effect in RQ1........................ 98
25. Selected Values of Odds Ratio and Power for TPWP Effect in RQ2........................ 99
26. Selected Values of Effect Size and Power for TPWP Effect in RQ3 ...................... 101
27. Example TPWPs with Factual Data ........................................................................ 115
B1. Generic Problem One and Matched TPWPs in Session One .................................. 127
B2. Generic Problem Two and Matched TPWPs in Session One ................................. 128
B3. Generic Problem Three and Matched TPWPs in Session One ............................... 129
B4. Generic Problem Four and Matched TPWPs in Session One ................................. 130
B5. Generic Problem Five and Matched TPWPs in Session One .................................. 131
B6. Generic Problem Six and Matched TPWPs in Session One ................................... 132
B7. Generic Problem One and Matched TPWPs in Session Two ................................. 133
B8. Generic Problem Two and Matcjed TPWPs in Session Two.................................. 134
B9. Generic Problem Three and Matched TPWPs in Session Two ............................... 135
B10. Generic Problem Four and Matched TPWPs in Session Two .............................. 136
B11. Generic Problem Five and Matched TPWPs in Session Two ............................... 137
B12. Generic Problem Six and Matched TPWPs in Session Two ................................. 138
B13. Generic Problem One and Matched TPWPs in Session Three ............................. 139
B14. Generic Problem Two and Matched TPWPs in Session Three ............................. 140
B15. Generic Problem Three and Matched TPWPs in Session Three ........................... 141
B16. Generic Problem Four and Matched TPWPs in Session Three ............................ 142
B17. Generic Problem Five and Matched TPWPs in Session Three ............................. 143
xii
B18. Generic Problem Six and Matched TPWPs in Session Three ............................... 144
C1. Lexile Level of Session One Item Stems ................................................................ 145
C2. Level Level of Session Two Item Stems ................................................................. 145
C3. Lexile Level of Session Three Item Stems.............................................................. 146
C4. Number of Words in Session One Item Stems ........................................................ 146
C5. Number of Words in Session Two Item Stems ....................................................... 147
C6. Number of Words in Session Three Item Stems ..................................................... 147
D1. Item Statistics .......................................................................................................... 148
xiii
LIST OF FIGURES
Figure Page
1. The four-phase model of interest development and associated outcomes. ................... 6
2. Number of participants in each state. .......................................................................... 34
3. Sample dashboard for the SMC. ................................................................................. 37
4. Sample introductory text to daily SMC activity. ........................................................ 38
5. Screenshot of sample student interest questionnaire. ................................................. 43
6. Example of item display for a generic word problem. ................................................ 51
7. Form design. ............................................................................................................... 54
8. Example of final webpage of instrument that provided feedback to students. ........... 55
9. Distribution of response time in seconds to items in session one.. ............................. 62
10. Distribution of response time in seconds to items in session two…........................... 63
11. Distribution of response time in seconds to items in session three............................. 64
12. Distribution of response time prior to log transformation. ......................................... 86
13. Distribution of response time after log transformation. .............................................. 87
14. Normal Q-Q plot of level 1 residuals for final model in RQ3. ................................... 93
15. Plot of level 1 standardized residuals for final model in RQ3. ................................... 94
16. Graph relating the odds ratio for the effect of TPWP to power in RQ1. .................... 97
17. Graph relating the odds ratio for the effect of TPWP to power in RQ2. .................... 99
18. Graph relating the effect size of TPWP to power in RQ3. ....................................... 100
19. Example geometry problem 1 ................................................................................... 108
20. Example geometry problem 2 ................................................................................... 108
1
Chapter 1: Introduction
Introduction
The Principles and Standards for School Mathematics (National Council of Teachers
of Mathematics, 2000) presents a set of mathematical process standards, one of which calls
for students to “recognize and apply mathematics in contexts outside of mathematics” (p.
64). One way that curricular materials require students to apply mathematical concepts to
real-life contexts is through word problems. Word problems are defined as text that
describes a situation whereby the student must infer mathematical relationships in order to
answer a question (Verschaffel, Greer, & Corte, 2000). In addition to providing students
with real-life scenarios, word problems are a beneficial instructional tool because they can
increase students’ motivation in mathematics by: 1) exemplifying how mathematics is
relevant in real-life, 2) providing a means to assess students based on their ability to solve
various problems applicable to real-life career tracks, 3) developing students’ general
problem-solving abilities both within and beyond mathematics, and 4) developing students’
mathematical knowledge at a conceptual level (Verschaffel, Greer, & Corte, 2000).
Despite the benefits of using word problems in mathematical curricular materials,
word problems create an ongoing challenge for students. In fact, in a survey of over 700
Algebra I teachers, respondents indicated that trouble with word problems was the greatest
struggle students face for Algebra preparedness, more so than manipulating variables,
fluency with fractions, decimals, negative numbers, and over a dozen other mathematical
skills (Hoffer, Venkataraman, Hedberg, & Shagle, 2007). Moreover, several studies have
2
shown how students fail to make sense of word problems and consequently provide answers
to absurd, illogical problems such as “There are 26 sheep and 10 goats on a ship. How old is
the captain?” (Verschaffel, Greer, & Corte, 2000, p. 4). In this example word problem, over
half of the first- and second-graders in the study’s sample added the numbers in the problem,
answering that the captain was 36 years old. This example shows that students learn and
routinely apply the rules of school mathematics, often without considering the context of the
problem and how the context informs the solution strategy; one such rule is that problems
have one single correct answer, usually obtained by adding, subtracting, multiplying, or
dividing the numbers in the problem (Verschaffel, Greer, & Corte, 2000).
One reason why many students struggle with word problems may be that word
problems often are not personally relevant to students, potentially resulting in low desire to
solve the problem and difficulty with making sense of the solution strategy due to the
problem’s irrelevance. As in the example cited above with goats and sheep on a ship, it is
doubtful that many elementary school students find themselves in a situation whereby they
need to either know the captain’s age or count how many animals are on a ship.
An obvious solution to enhancing word problem relevance would be to provide each
student with meaningful, real-life word problems so that all students have the opportunity to
see the relevance of mathematics to their unique lives. However, a challenging aspect of
providing students with meaningful, relevant problems is that a context which is relatable and
interesting for one student may not have the same effect for another student because students
have diverse backgrounds, cultures, experiences, prior knowledge, and interests, even within
students of a single classroom.
3
In contrast to providing students with personally-relevant word problems and because
general curriculum and assessment materials typically need to target a wide range of diverse
students, word problems found in instructional materials often include generic contexts in
order to increase the likelihood that all students understand the context of the problem.
Similarly, mathematics word problems included on large-scale achievement tests such as
those mandated at end-of-course or end-of-year for accountability purposes typically go
through a sensitivity review process to ensure that the words and context of the problem do
not favor or disadvantage any subgroup of students (e.g., English language learners, students
of high- or low-socioeconomic status). Thus, as a result of the need to ensure that all
students can interpret a word problem’s context equivalently, word problems in learning
materials often use generic contexts designed to apply to all students. For example,
Pythagorean theorem problems frequently include a ladder leaning against a wall; area and
perimeter problems often use garden plots or kitchen floors; and quadratic function problems
often use throwing balls or other projectiles.
The generic context of word problems is problematic for two reasons. First, when
students repeatedly see the same generic problems, students lose a valuable opportunity to
learn from contexts that are meaningful in their lives, with the result that students may view
mathematics as irrelevant and disconnected from everyday life. Second, because of the
repetition in generic word problem contexts, students may eventually learn which
mathematical concepts correspond to particular word problem contexts or key words without
understanding why a particular mathematical approach is relevant, such as recognizing that a
ladder leaning against a wall probably means the problem requires the Pythagorean theorem.
This unintentionally changes the instructional purpose and cognitive demand of the problem
4
because the student no longer needs to determine which mathematical concept most
appropriately solves a real-life problem. In this way, students learn to game the system and
become good at doing school rather than doing mathematics.
To avoid assigning all students generic word problems that fail to connect to students’
individual interests, curriculum designers could potentially create separate sets of problems
that use different contexts based on different student interests. Although it is possible that
students can still learn the common types of contexts associated with particular interest-
specific word problems, providing word problems across a range of interest categories and
personal preferences can result in a greater variety of mathematical applications and has the
added benefit of potentially helping students see how mathematics can be applied in their
unique lives according to topics of interest to the student.
The Mechanism of Action: How Interest Affects Learning
In addition to potentially providing a greater variety of mathematical applications and
making mathematics relevant for students, providing students’ with word problems
customized to their interests may also increase student performance in mathematics by
capitalizing on several cognitive and behavioral effects that occur when a student’s interest is
sparked (Hidi, 2006). As defined by Hidi, interest is “a unique motivational variable, as well
as a psychological state that occurs during interactions between persons and their objects of
interest, and is characterized by increased attention, concentration, and affect” (p. 70). Thus,
according to Hidi, interest by definition affects three states that may lead to greater academic
performance: heightened interest might serve to increase students’ attention to mathematics
word problems; it may promote greater concentration on the problem solving task; and it may
influence the extent to which the student finds enjoyment in solving mathematics word
5
problems. Moreover, interest has also been found to negatively correlate with cognitive load,
meaning that students working on a highly-interesting activity experience reduced cognitive
load that improves learning outcomes (Yen, Chen, Lai, & Chuang, 2015; Park, 2015). A full
review of empirical research supporting these claims regarding the learning effects associated
with interest is provided in Chapter 2.
Hidi and Renninger (2006) posed a model of interest development whereby interest
development progresses through four phases: Phase I- triggered situational interest, Phase II -
maintained situational interest, Phase III - emerging individual interest, and Phase IV- well-
developed individual interest. Phase I, triggered situational interest, “results from short-term
changes in affective and cognitive processing” as manifested through modifications to the
environment that spark personal relevance, surprising information, or other means (Hidi &
Renninger, 2006, p. 114). In Phase II, maintained situational interest, the situational interest
triggered in Phase I persists over a period of time, for example by providing a meaningful
activity that a student desires to fully complete. Phase III, emerging individual interest, is
when a student begins to see value in and associate positive feelings with a particular content
area; students in Phase III may reengage with activities within the content area without the
need for triggered or maintained situational interest. Finally, Phase IV, well-developed
individual interest, extends Phase III by characterizing students that will actively seek to
reengage with content and opt to choose a particular activity when given a choice of other
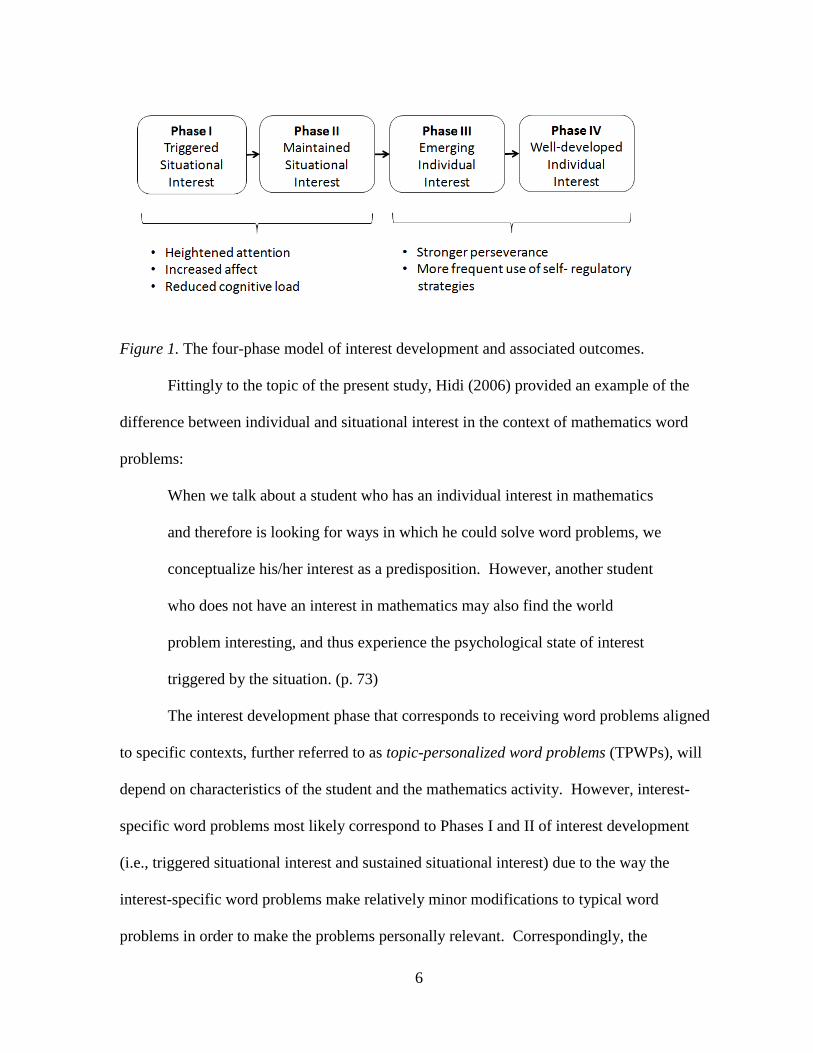
activities. Figure 1 shows the four phases of interest development and the cognitive and
behavioral characteristics associated with each phase; again, a full review of literature
regarding characteristics associated with interest follows in Chapter 2.
6
Figure 1. The four-phase model of interest development and associated outcomes.
Fittingly to the topic of the present study, Hidi (2006) provided an example of the
difference between individual and situational interest in the context of mathematics word
problems:
When we talk about a student who has an individual interest in mathematics
and therefore is looking for ways in which he could solve word problems, we
conceptualize his/her interest as a predisposition. However, another student
who does not have an interest in mathematics may also find the world
problem interesting, and thus experience the psychological state of interest
triggered by the situation. (p. 73)
The interest development phase that corresponds to receiving word problems aligned
to specific contexts, further referred to as topic-personalized word problems (TPWPs), will
depend on characteristics of the student and the mathematics activity. However, interest-
specific word problems most likely correspond to Phases I and II of interest development
(i.e., triggered situational interest and sustained situational interest) due to the way the
interest-specific word problems make relatively minor modifications to typical word
problems in order to make the problems personally relevant. Correspondingly, the
7
mechanism by which TPWPs may result in higher student performance is the increased affect
and attention along with reduced cognitive load characteristic of triggered and sustained
situational interest. It should be noted, though, that the triggered and sustained situational
interest sparked by TPWPs could progress to further stages of interest development for
students within mathematics; for example, if a student experienced positive feelings and
academic success with a TPWP activity, those feelings could carry into positive feelings
about mathematics holistically as a content area, beyond merely the feelings experienced
during a TPWP activity. These further-developed phases of interest could then also
capitalize on the benefits of enhanced persistence and use of self-regulatory strategies.
Purpose and Research Questions
The purpose of this study was to compare middle school students’ performance on
TPWPs to performance on matched generic word problems and to explore the possible
mechanism by which such word problems may result in increased student performance. The
research questions were:
RQ1: Are rising eighth-graders more likely to rate TPWPs as interesting as compared
to matched generic word problems?
RQ2: Are rising eighth-graders more likely to answer TPWPs correctly as compared
to matched generic word problems, and how do students’ interest ratings of problems relate
to the likelihood of answering the problem correctly?
RQ3: Do rising eighth-graders spend more or less time solving a TPWP as compared
to a matched generic problem, and how does amount of time solving each type of problem
relate to mathematical accuracy?
8
For RQ1, I hypothesized that students would rate TPWPs as more interesting than
matched generic word problems due to the aforementioned cognitive and behavioral benefits
of sparking students’ situational interest. For the same reasons, I hypothesized for RQ2 that
students would be more likely to answer a TPWP correctly as compared to a matched generic
problem and that favorable ratings of problems – either personalized or generic – would
correlate with the likelihood of answering the problem correctly. I posed RQ3 as an
exploratory question with no directional hypothesis. Although research on assessment shows
that the time spent responding to items generally negatively correlates with the item’s
difficulty (i.e., students solve items faster when the items are easier; Daniel & Embretson,
2010), Hidi and Ainley’s (2008) findings of increased persistence on interest-targeted tasks
provides support for the idea that students would spend more time on TPWPs due to showing
greater persistence, and thus have longer response times for TPWPs.
To answer the three research questions, I administered both TPWPs and generic word
problems to students and compared performance on both sets of problems in terms of
accuracy and speed, and I also collected item-level data regarding students’ interest in each
word problem. In subsequent chapters of this dissertation, I provide a more comprehensive
literature review; I describe the specific data sources and data collection methods used for
this study; I present the analytic approaches used and results of the analyses; and I provide
conclusions and implications of the findings.
Summary
In this study, I seek to inform middle school mathematics teaching and learning by
investigating whether or not students perform better when answering TPWPs as compared to
generic word problems. Due to the positive behavioral and cognitive outcomes associated
9
with sparking students’ interests, it is possible that students will perform better when
receiving word problems aligned to their interests. In addition to potentially raising student
achievement in mathematics, providing students with personalized word problems also has
the potential to overturn perceptions held by some students that mathematics is boring or
irrelevant (Brown, Brown, & Bibby, 2008).
If results show that TPWPs are indeed easier for students, then that supports the use
of topic personalization as a valuable instructional strategy for students. And, with the
growing availability of computers in schools and students’ homes (Lauman, 2000),
computer-based learning environments could programmatically design unique sets of word
problems for students based on their interests. The potential for this technology expands as
complimentary work on automatic item generation seeks to use natural language processing
to produce large banks of word problems (Deane & Sheehan, 2003).
On the other hand, if results do not show that personalized problems are easier for
students, then it would be valuable to learn that now before resources are spent developing
learning interventions based on TPWPs. It takes substantially more time by curriculum
experts, technology designers, and programmers to create multiple activities that can vary
based on student ability or interest; thus, if TPWPs are not indeed easier for students than
generic word problems, then there is arguably no need for educational technology designers
and item writers to continue investing time to develop TPWPs. Instead, resources could be
diverted from creating personalized problems to implementing alternative strategies to
support student learning in computer-based learning environments, such as identifying error
patterns in student responses in order to provide real-time feedback to students (O’Rourke,
Andersen, Gulwani, & Popovic, 2015).
10
Chapter 2: Literature Review
Four main bodies of literature provide background for this study. The first body of
literature summarizes empirical research regarding how interest affects student performance
and motivation within the domain of reading. The second body of literatures focuses on prior
research on the effectiveness of personalized word problems as an instructional strategy or
student motivator in mathematics. The third body of literature covers the mechanism by
which interest leads to desirable student outcomes (i.e., learning, achievement, engagement,
and motivation). Finally, the fourth section of literature consists of features of mathematics
tasks that affect the cognitive complexity of a task, which is important to this study in order
to understand how varying features of a mathematics problem can change the way students
interact with the problem.
The Domain of Reading: How Interest Affects Learning
Although topic-personalization in the field of mathematics word problems is
relatively new, researchers have long studied the effects of allowing students to choose
instructional materials that best match their interests in other content areas, particularly
reading. The idea is that, when given a choice about which text to read, students will select
texts that are more interesting and relevant to them, which in turns leads to the
aforementioned benefits of triggering situational interest and leading to sustained individual
interest. The effect of choice on student motivation and achievement within the domain of
reading has shown that providing students with a choice of which text to read positively
affects both motivation and reading comprehension. In a meta-analysis, Guthrie and
11
Humenick (2004) computed 46 effect sizes of experimental and quasi-experimental studies
that granted students a choice of texts and found average effect sizes of .95 and 1.2 for
student choice on motivation and reading comprehension, respectively.
In many of the studies included in Guthrie and Humenick’s (2004) review, motivation
was operationalized as the number of minutes students chose to read beyond the required
reading period when given a choice of other activities. For example, McLoyd (1979) asked
second- and third-graders to rank books in order from first-choice to last-choice and then
assigned half of the participants to read 250 words from their first-choice book and the other
half to read 250 words from their last-choice book. After students read 250 words, they were
given 10 minutes of free-time to either continue reading, play Scrabble, do crossword
puzzles, or do a math game. McLoyd’s results showed that students in the high-interest
condition (i.e., students that read their first-choice book) spent statistically significantly more
time reading than students in the low-interest condition, suggesting that students had greater
motivation to read when engaging with texts they found interesting. Similar studies have
since replicated McLoyd’s findings: for example, Flowerday, Schraw, and Stevens (2004)
found that undergraduate students’ situational interest in a text positively affected their
attitude toward completing a reading and writing task about the text.
In addition to the effect of choice on motivation to read, studies show that allowing
students to choose a text impacts achievement indicators. In a study of 84 third-graders
tasked with locating information in an expository text, Reynolds and Symons (2001) found
that students located answers to a four-question test statistically significantly faster when
given the option to choose the topic out of four possible topics as compared to students in a
control group that were assigned a text, even after controlling for prior knowledge and level
12
of interest in the topic. Students in the choice condition also answered more questions
correctly than students in the no-choice condition, though this difference was not statistically
significant. Thus, allowing students to choose instructional materials based on their interests
– as the current study will do in the field of mathematics word problems – appears to be a
promising instructional strategy.
Personalization of Mathematics Word Problems
Continuing beyond reading to mathematics, another body of research examines how
student achievement, engagement, and motivation are affected by personalization of
mathematics word problems. As mentioned in the previous chapter, TPWPs modify the
context of the word problem based on a students’ self-selected interest. Another type of
word problem, which I name incidentally-personalized word problems (IPWPs) merely
changes surface-level features of the problem (i.e., names of people, places, or favorite
things) without changing the context of the problem. For example, in an IPWP, the phrasing
“A teacher gave her class 12 cans of soda to share…” would be replaced with “Ms. Jones
gave her class 12 cans of Dr. Pepper…” where Ms. Jones is the name of the student’s teacher
and Dr. Pepper is the student’s favorite soda. This type of personalization is different from
the TPWPs proposed for this study because topic personalization requires giving students
different contexts based on their interests. Nevertheless, the literature on IPWPs provides
insight to inform this study.
Research on incidental personalization of word problems. Research on IPWPs has
largely occurred in two historical waves based on technology available at the time. Prior to
widespread computer use in classrooms and web-based learning environments, researchers
administered surveys to students and then manually modified word problems to create
13
personalized word problems. The problems were then distributed several days later through
paper and pencil testing. A major limitation of this wave of research is that personalizing
word problems without the aid of computers is extremely time consuming. Later, as
computer-based learning technologies proliferated, technology aided real-time creation of
personalized word problems based on information the student entered to the computer.
Research from the latter wave is relatively recent. Hence, there are fewer studies from the
second wave of research, but they tend to have larger sample sizes of both students and
problems due to increased efficiency in creating IPWPs.
Results from both phases of research indicated positive effects of incidental
personalization on student motivation and mixed effects on student achievement. In one of
the earliest studies on IPWPs, Anand and Ross (1987) randomly assigned fifth- and sixth-
graders to receive instructional materials consisting of either problems with generic contexts
(e.g., “There are 3 objects. Each one is cut in one-half. In all, how many pieces would there
be?”) or matched personalized word problems whereby the students’ favorite things and
friends’ names were substituted into the problem. Results showed that students receiving
IPWPs did statistically significantly better on a posttest and also had a more positive attitude
toward math after completing the unit as compared to the control group.
Several other studies have since replicated these findings by using one of two
common research designs. In the within-subjects approach, researchers have compared
student performance on assessments consisting of both IPWPs and generic word problems.
In the between-subjects design, as was the case in Anand and Ross’s (1987) study,
researchers randomly assign students to receive either personalized or generic instructional
materials and then both groups complete a common posttest to assess achievement and/or an
14
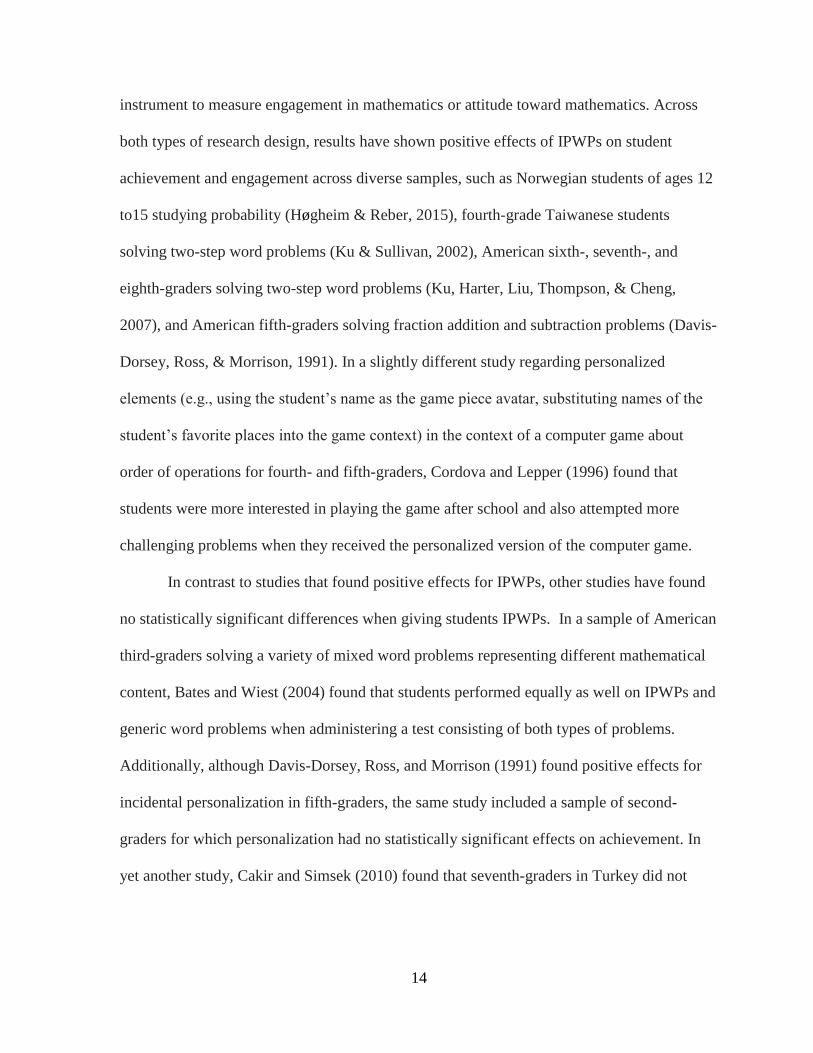
instrument to measure engagement in mathematics or attitude toward mathematics. Across
both types of research design, results have shown positive effects of IPWPs on student
achievement and engagement across diverse samples, such as Norwegian students of ages 12
to15 studying probability (Høgheim & Reber, 2015), fourth-grade Taiwanese students
solving two-step word problems (Ku & Sullivan, 2002), American sixth-, seventh-, and
eighth-graders solving two-step word problems (Ku, Harter, Liu, Thompson, & Cheng,
2007), and American fifth-graders solving fraction addition and subtraction problems (Davis-
Dorsey, Ross, & Morrison, 1991). In a slightly different study regarding personalized
elements (e.g., using the student’s name as the game piece avatar, substituting names of the
student’s favorite places into the game context) in the context of a computer game about
order of operations for fourth- and fifth-graders, Cordova and Lepper (1996) found that
students were more interested in playing the game after school and also attempted more
challenging problems when they received the personalized version of the computer game.
In contrast to studies that found positive effects for IPWPs, other studies have found
no statistically significant differences when giving students IPWPs. In a sample of American
third-graders solving a variety of mixed word problems representing different mathematical
content, Bates and Wiest (2004) found that students performed equally as well on IPWPs and
generic word problems when administering a test consisting of both types of problems.
Additionally, although Davis-Dorsey, Ross, and Morrison (1991) found positive effects for
incidental personalization in fifth-graders, the same study included a sample of second-
graders for which personalization had no statistically significant effects on achievement. In
yet another study, Cakir and Simsek (2010) found that seventh-graders in Turkey did not
15
show any greater achievement outcomes after receiving incidentally-personalized
instructional materials as compared to a control group.
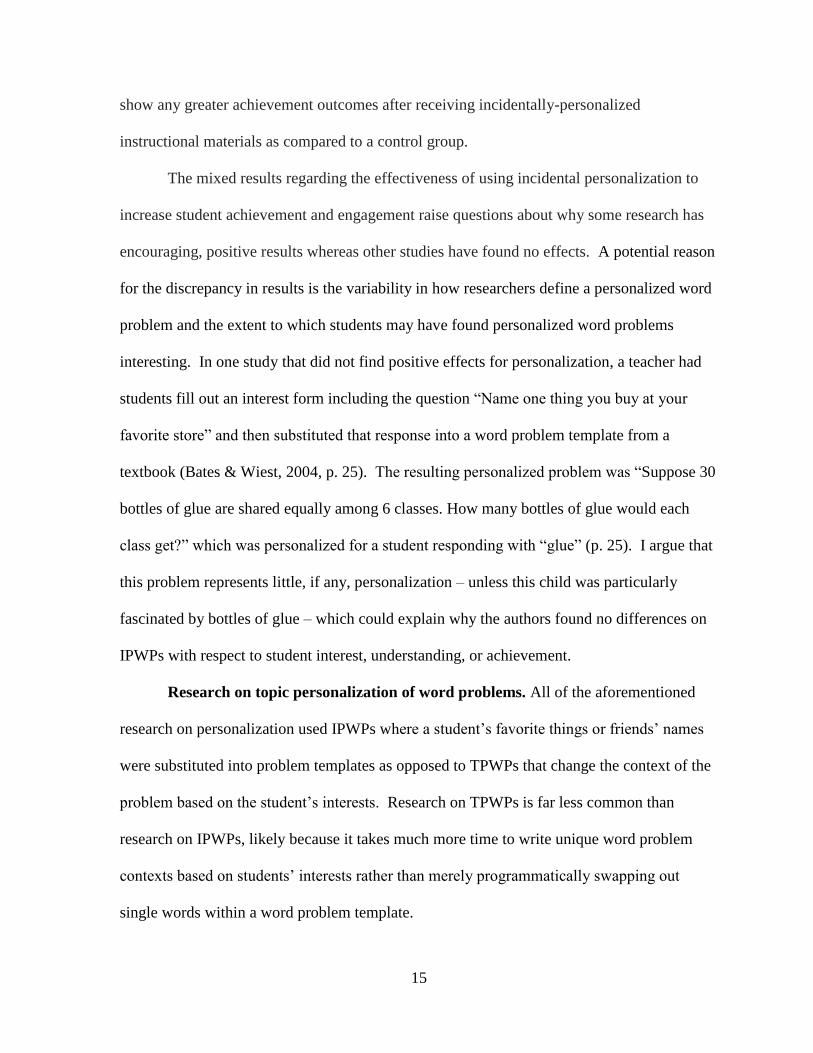
The mixed results regarding the effectiveness of using incidental personalization to
increase student achievement and engagement raise questions about why some research has
encouraging, positive results whereas other studies have found no effects. A potential reason
for the discrepancy in results is the variability in how researchers define a personalized word
problem and the extent to which students may have found personalized word problems
interesting. In one study that did not find positive effects for personalization, a teacher had
students fill out an interest form including the question “Name one thing you buy at your
favorite store” and then substituted that response into a word problem template from a
textbook (Bates & Wiest, 2004, p. 25). The resulting personalized problem was “Suppose 30
bottles of glue are shared equally among 6 classes. How many bottles of glue would each
class get?” which was personalized for a student responding with “glue” (p. 25). I argue that
this problem represents little, if any, personalization – unless this child was particularly
fascinated by bottles of glue – which could explain why the authors found no differences on
IPWPs with respect to student interest, understanding, or achievement.
Research on topic personalization of word problems. All of the aforementioned
research on personalization used IPWPs where a student’s favorite things or friends’ names
were substituted into problem templates as opposed to TPWPs that change the context of the
problem based on the student’s interests. Research on TPWPs is far less common than
research on IPWPs, likely because it takes much more time to write unique word problem
contexts based on students’ interests rather than merely programmatically swapping out
single words within a word problem template.
16
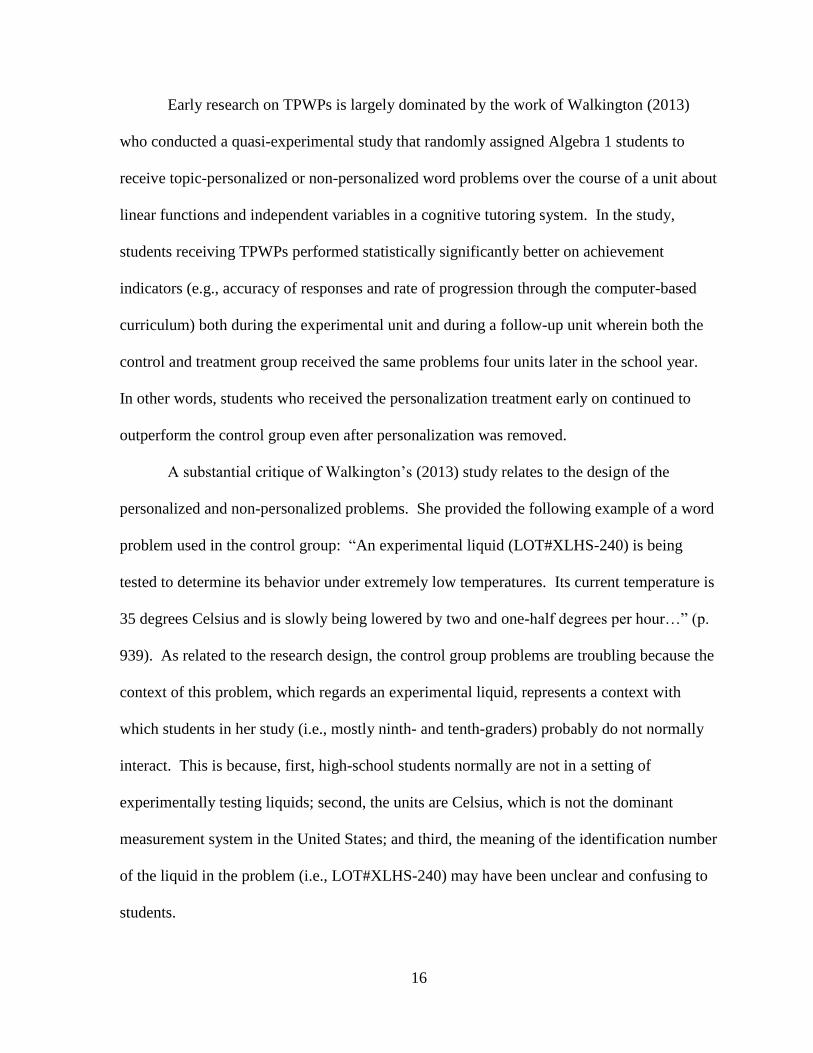
Early research on TPWPs is largely dominated by the work of Walkington (2013)
who conducted a quasi-experimental study that randomly assigned Algebra 1 students to
receive topic-personalized or non-personalized word problems over the course of a unit about
linear functions and independent variables in a cognitive tutoring system. In the study,
students receiving TPWPs performed statistically significantly better on achievement
indicators (e.g., accuracy of responses and rate of progression through the computer-based
curriculum) both during the experimental unit and during a follow-up unit wherein both the
control and treatment group received the same problems four units later in the school year.
In other words, students who received the personalization treatment early on continued to
outperform the control group even after personalization was removed.
A substantial critique of Walkington’s (2013) study relates to the design of the
personalized and non-personalized problems. She provided the following example of a word
problem used in the control group: “An experimental liquid (LOT#XLHS-240) is being
tested to determine its behavior under extremely low temperatures. Its current temperature is
35 degrees Celsius and is slowly being lowered by two and one-half degrees per hour…” (p.
939). As related to the research design, the control group problems are troubling because the
context of this problem, which regards an experimental liquid, represents a context with
which students in her study (i.e., mostly ninth- and tenth-graders) probably do not normally
interact. This is because, first, high-school students normally are not in a setting of
experimentally testing liquids; second, the units are Celsius, which is not the dominant
measurement system in the United States; and third, the meaning of the identification number
of the liquid in the problem (i.e., LOT#XLHS-240) may have been unclear and confusing to
students.
17
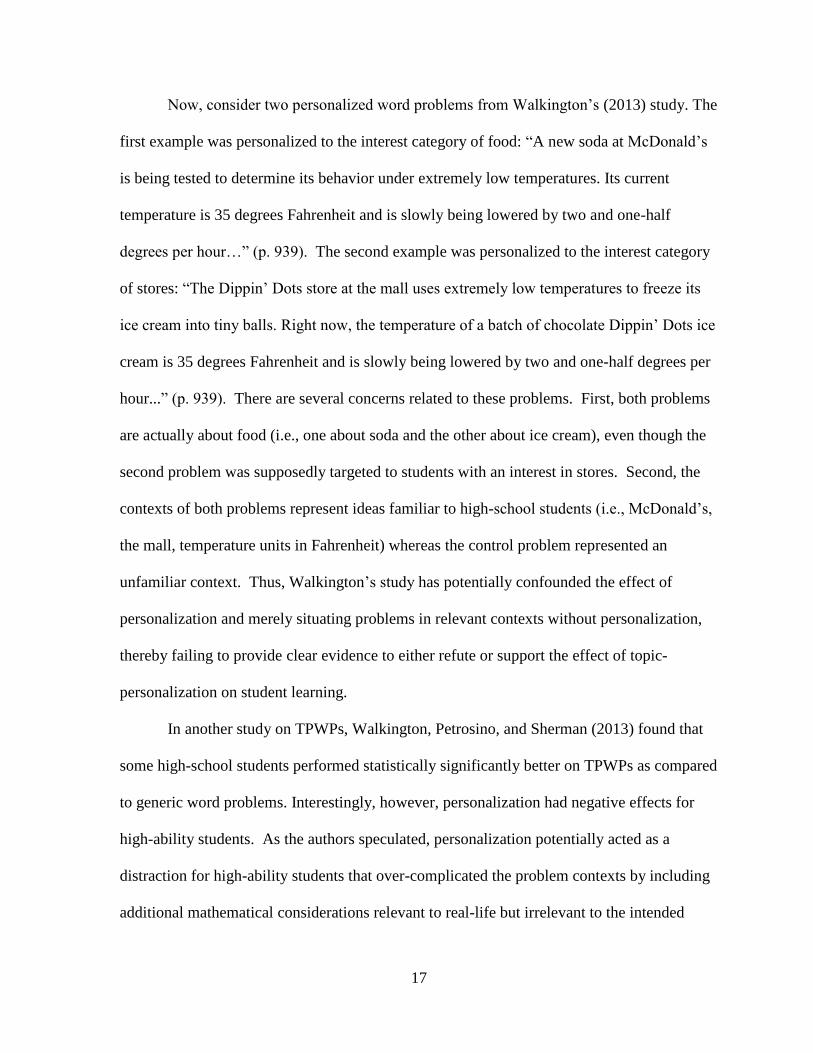
Now, consider two personalized word problems from Walkington’s (2013) study. The
first example was personalized to the interest category of food: “A new soda at McDonald’s
is being tested to determine its behavior under extremely low temperatures. Its current
temperature is 35 degrees Fahrenheit and is slowly being lowered by two and one-half
degrees per hour…” (p. 939). The second example was personalized to the interest category
of stores: “The Dippin’ Dots store at the mall uses extremely low temperatures to freeze its
ice cream into tiny balls. Right now, the temperature of a batch of chocolate Dippin’ Dots ice
cream is 35 degrees Fahrenheit and is slowly being lowered by two and one-half degrees per
hour...” (p. 939). There are several concerns related to these problems. First, both problems
are actually about food (i.e., one about soda and the other about ice cream), even though the
second problem was supposedly targeted to students with an interest in stores. Second, the
contexts of both problems represent ideas familiar to high-school students (i.e., McDonald’s,
the mall, temperature units in Fahrenheit) whereas the control problem represented an
unfamiliar context. Thus, Walkington’s study has potentially confounded the effect of
personalization and merely situating problems in relevant contexts without personalization,
thereby failing to provide clear evidence to either refute or support the effect of topic-
personalization on student learning.
In another study on TPWPs, Walkington, Petrosino, and Sherman (2013) found that
some high-school students performed statistically significantly better on TPWPs as compared
to generic word problems. Interestingly, however, personalization had negative effects for
high-ability students. As the authors speculated, personalization potentially acted as a
distraction for high-ability students that over-complicated the problem contexts by including
additional mathematical considerations relevant to real-life but irrelevant to the intended
18
context of the problem. Nevertheless, personalization was an effective instructional strategy
for lower-ability students. Their study, however, included only 24 students that solved word
problems in only three different contexts.
Finally, in an effort to reduce the time demands of constructing TPWPs, Walkington
and Bernacki (2015) conducted another study whereby students wrote their own algebra
problems utilizing contexts relevant to the students’ lives. The authors found that students
rated mathematics as more relevant to their lives after writing their own problems, but they
also found that problem writing was challenging for some students. For example, students
would write problems that did not represent the intended content, had no question, or were
not mathematically accurate.
How Interest and Choice Mediate Motivation, Learning, and Achievement Outcomes
One of the earliest pieces of scholarly work on interest and learning was John
Dewey’s (1913) book, Interest and Effort in Education. Dewey asserted that interest and
effort are inherently intertwined, meaning exertions of effort are always motivated by an
underlying interest. According to Dewey,
It is psychologically impossible to call forth any activity
without some interest. The theory of effort simply substitutes
one interest for another. It substitutes the impure interest of
fear of the teacher or hope of future reward for pure interest in
the material presented. (p. 2)
Dewey’s perspective on the strong relationship between interest and effort, and likewise the
relationship between both interest and effort to learning, set the groundwork for a body of
research in psychology and education about the psychological or behavioral mechanisms by
19
which interest may lead to learning.
Dewey (1913) distinguished between direct and indirect interest, which are largely
equivalent to extrinsic and intrinsic motivation, respectively. In modern literature, where
modern is relative to Dewey’s 1913 writings, researchers commonly distinguish between
situational interest and individual interest, as was described in Chapter 1 with the four-phase
model of interest development (Hidi & Renninger, 2006). On the one hand, individual
interest, also known as personal interest and similar to what Dewey called direct interest, is
“characterized by intrinsic desire to understand a particular topic that persists over time”
(Schraw & Lehman, 2001, p. 24). On the other hand, situational interest, which is similar to
what Dewey called indirect interest, is “transitory, environmentally activated, and context-
specific” (Schraw & Lehman, 2001, p. 24).
Cognitive and behavioral outcomes associated with interest. Because situational
interest is attached to features of the environment whereas individual interest is attached to
characteristics of the student, it is arguably easier for educators to manipulate situational
interest than it is to manipulate individual interest. Correspondingly, the context of this study
(i.e., providing students with word problems aligned to their interest) is one means of
manipulating situational interest, and researchers have documented several cognitive and
behavioral outcomes associated with triggering situational interest; these include reducing
cognitive load, heightening attention and concentration, and raising affect and hence
persistence.
Reduced cognitive load. One documented benefit of triggering situational interest, as
related to promoting effective learning, is the reduction of cognitive load (Park, 2015).
Cognitive load, defined as “a construct representing the load that performing a particular task
20
imposes on the cognitive system”, can limit learning when the cognitive load of an activity
interferes with the students’ ability to process all of the necessary information (Sweller, van
Merrienboer, & Paas, 1998, p. 266). Cognitive load can be classified as intrinsic, extraneous,
or germane cognitive load. Intrinsic cognitive load is load due to the difficulty of the learning
material, such as solving multistep mathematical problems versus single-step computations,
and can be quantified by the number of concepts or procedures a learner must simultaneously
process (Debue & van de Leemput, 2014; Sweller, van Merrienboer, & Paas, 1998).
Extraneous cognitive load is load caused by poor instructional design, such as providing a
student with word problems with multi-syllable names from unfamiliar ethnicities that are
difficult to pronounce. Finally, germane cognitive load is load experienced by learners when
processing intended learning goals into long-term memory and schemas, such as making
sense of a mathematical model that promotes conceptual understanding rather than
performing an algorithm without understanding the rational for why the algorithm works.
Accordingly, effective instructional designs should seek to reduce extraneous cognitive load
and increase germane cognitive load (Sweller, van Merrienboer, & Paas, 1998). Related to
germane cognitive load is the idea of generative cognitive processing, which is when a
student actively engages in activities of high germane cognitive load (DeLeeuw & Mayer,
2008). If a student experiences lack of interest, however, the student may experience
generative underutilization, which is when a student is capable of learning but does not exert
the necessary effort to accomplish the learning goal (Park, 2015).
Although research on the effects of situational interest on cognitive load is minimal at
this time, one study found a statistically significant negative correlation between situational
interest and perceived cognitive load, meaning students reported lower cognitive load when
21
expressing higher interest (Park, 2015). In a study of 127 undergraduates in a computer
literacy course, Park measured participants’ situational interest with Likert scales such as “I
was completely caught up in what I was studying” and likewise measured participants’
perceived cognitive load with an instrument asking participants to rate the amount of mental
effort expended on the learning task (p. 222). Park found a negative correlation (rxy = -.417,
p<.001 ) between perceived cognitive load and reported situational interest, implying that
triggering situational interest may have increased generative cognitive processing through the
mechanism of reducing cognitive load.
Taking a different methodological approach in the context of reading interesting
versus non-interesting literary passages, McDaniel, Waddil, Finstad, and Bourg (2000) asked
students to react to an audible tone that occurred throughout a students’ reading of a passage.
The student was told to press the spacebar key on a computer as soon as hearing the tone, and
the authors used reaction time to the tone as an indicator of cognitive resources spent on
reading the passage, with the idea that a faster reaction time is indicative of spending fewer
cognitive resources on reading the passage. The authors found that participants reacted faster
to the tones when reading interesting texts, which they claimed supported the idea that
interesting texts required fewer cognitive resources while reading.
Heightened attention and concentration. Although the theoretical literature supports
the conclusion that interest promotes heightened attention and concentration (Hidi & Ainley,
2008), competing explanations exist based on results from empirical studies about exactly
how interest relates to attention and concentration. From one perspective, increased interest
leading to heightened attention may result in students spending longer time on interesting
tasks because students feel motivated to work on the task longer. In a study where
22
participants read sentences of varying degrees of interest, Anderson (1982) found that fourth-
graders read interesting texts slower than non-interesting texts.
Alternatively, a student experiencing greater concentration due to peaked interest may
be able to process instructional materials faster, thus resulting in spending less time on an
interesting task as compared to a similar task that the student did not find interesting. In the
context of personalized mathematics word problems, Walkington (2015) found that students
in a treatment group answering TPWPs spent less time both reading and solving the
personalized problems as compared to students in a control group solving comparable non-
personalized word problems. Walkington concluded that interest-targeted word problems
increased students’ attention and engagement, as demonstrated by faster response times.
Greater positive affect leading to greater persistence. Yet another benefit of interest
is persistence, where a student continues to work on a task despite possibly encountering
struggles while working on the task; the relationship between interest and persistence has
been found to be mediated by affect. In a study by Ainley, Hidi, and Berndorff (2002), the
authors concluded that higher positive affect (i.e., associating positive feelings with a task)
was the mechanism by which interest led to greater persistence. In their study, 117 Australian
eighth-graders read four texts about different topics. For each text, students rated their topic
interest in the text, and affect was measured by students’ selection of which emotion they felt
after reading the text (e.g., bored or interested) and how strongly students felt the emotion.
The authors also collected data on persistence based on how many sections of the text the
student read. After considering a variety of structural equation models, the authors found
that “the strongest model linking topic interest and learning suggested that topic interest was
related to affective response, affect was then related to persistence with the text, and
23
persistence was related to learning” (p. 558). These findings suggest that students who
experienced more positive emotions with the text also read more of the text, and reading
more of the text was related to greater learning outcomes as measured by a reading
comprehension score.
Supporting students’ progressions to higher phases of interest. The likelihood that
interest-targeted activities will trigger the aforementioned benefits of reduced cognitive load,
increased attention and concentration, positive affect leading to persistence, and of use of
self-regulatory behaviors corresponds to a student’s phase of interest development. Reduced
cognitive load, positive affect, and heightened attention are mostly seen in Phase I and II of
the four-phase model of interest development (i.e., triggered and sustained situational
interest; Hidi & Renninger, 2006; Hidi, Renninger, & Krapp, 2004), whereas persistence and
use of self-regulatory strategies are mostly seen in Phases III and IV (i.e., emerging and well-
maintained individual interest; Hidi & Ainley, 2008). One psychological mechanism in
Phases I or II can evolve into another psychological mechanism in Phases III or IV, as is the
case with positive affect in Phases I and II leading to persistence in Phases III and IV.
Despite the benefits associated with each phase of interest development, many
students do not exhibit Phase III or Phase IV levels of individual interest. However, it is
possible to help students progress in their interest development in order to reach the higher
phases of interest and thus receive the positive benefits of those phases such as the use of
self-regulatory strategies. As recommended by Renninger and Hidi (2002) based on the
results of a case study showing how environmental factors triggered the situational interest of
a seventh-grader working on a science project, “support for students’ attention to and
achievement in working with less well-developed interest might usefully include multiple
24
instances of triggered situational interest and the inclusion of individual interest (e.g.,
opportunities to work with friends)” (p. 189). In other words, for students that do not have a
well-developed interest in a particular task or content domain, educators can help support
development of such interest by providing multiple opportunities for triggered interest
events, as could possibly be the case in providing students with TPWPs.
When attempting to move students to higher phases of interest development, one
instructional method is to provide students with choices related to learning activities, with the
assumption that students will choose materials that they find interesting. However, certain
conditions must be met in order for choice to intrinsically motivate students. Katz and Assor
(2007) proposed a conceptual framework consisting of three components to describe exactly
when choice benefits motivation and learning. First, the choices must relate to students’
interests. For example, a student may not care to choose which numbers should occur in a
mathematics worksheet but may care about which country he or she will study for a
geography assignment. Second, the number of choices must be constrained, as too many
choices can cause frustration. Last, choice should only be used if culturally-appropriate. For
example, in some cultures, choosing differently from others in a group might be a sign of
rebellious, unacceptable behavior, whereas in other cultures – especially Western cultures –
choice may present an opportunity to express individuality.
Features that Affect the Level of Challenge of Mathematics Word Problems
For the final section of this chapter, I review research about features of mathematics
tasks that affect the difficulty or cognitive complexity of word problems; research in this area
is critical in order to inform the research design which, as I will describe fully in Chapter 3,
25
used matched pairs of personalized and generic word problems that were matched based on
features predicted to affect the problem’s difficulty.
Researchers have investigated student performance on word problems or matched
symbol problems in school environments where mathematics tasks are typically fabricated to
align to a learning objective. In these studies, researchers typically express the level of
challenge of a mathematics problem through either item difficulty or cognitive complexity.
Item difficulty is a psychometric characteristic of a problem administered as a question on a
test, either represented by the percentage of examinees answering the problem correctly or
derived from an item response theory model. In either case, the difficulty of an item is a
quantitative index based on examinee item response data. Relatedly, the cognitive demand
or cognitive complexity of a task refers to the “cognitive processes in which students actually
engage as they go about working on the task” (Stein, Grover, & Henningsen, 1996, p. 461),
and is often expressed according to a taxonomy of increasingly complex levels such as
Boston and Smith’s (2009) rubric for classifying the cognitive demand of a mathematics task.
Regarding research on word problems in school contexts, Nathan and Koedinger
(2000) pointed out that teachers and researchers have a “symbol precedence model of
development algebraic reasoning” (p. 168), meaning they believe that students first learn how
to solve symbolic equations and then learn to solve story problems (i.e., word problems) by
using a strategy whereby the story context is translated into an equation and then solved. The
symbol-precedent view is corroborated in textbook design as well: in nine out of ten
textbooks analyzed by Nathan, Long, and Alibali (2002), equations were presented prior to
story problems. Moreover, the authors pointed out that story problems are often presented
toward the end of chapters as challenge problems.
26
The symbol-precedence view of mathematical development has been challenged,
however. In a study of high-school students, Koedinger and Nathan (2004) tested student
performance on three different types of problems matched for mathematical structure and
varied by presentation format: 1) story problems (e.g., a question about a waiter making tips
and an hourly rate), 2) word equations (e.g., Starting with $81.90, I subtract $66 and then
divide by 6. What number do I get?), and 3) symbolic equations (e.g., Solve for x: (81.90-
66)/6 = x). Students performed statistically significantly better on story problems and word
equations as compared to symbolic equations, but there were no statistically significant
differences on performance between story problems and word equations. The authors
concluded that presenting problems verbally as opposed to symbolically is the key
determinant of difficulty rather than the situational context.
A curiosity in Koedinger and Nathan’s (2004) study was that student success in story
problems and word equations was linked to the use of informal strategies such as guess-and-
check or unwinding (i.e., working backwards from the answer), but such strategies may not
be effective for more complex algebra problems. To test the hypothesis that there is a trade-
off between problem presentation and complexity, Koedinger, Alibali, and Nathan (2008)
conducted a follow-up study with more complicated problems tested on college students.
The 2008 study included double-reference problems where an unknown quantity is used
twice in the matched symbolic equation. For example, the problem “Roseanne just paid
$38.24 for new jeans. She got them at a 15% discount. What was the original price?”
translates to the equation x – 0.15x = 38.24 where the variable occurs twice (p. 370). As
expected, because these double-reference problems devalue informal strategies, results
showed that students performed better on symbolic equations than story problems.
27
Enright, Morley, and Sheehan (2002) conducted a study similar to those of Koedinger
and Nathan (2004, 2008) that examined the impact of particular story and equation problem
features on difficulty. The authors systematically varied characteristics of two sets of
algebraic word problems related to rates and probability in a sample of Graduate Record
Examination (GRE) examinees. For the rate problems, they varied whether the item included
variables or numbers, the context of the problem (i.e., cost or distance), and the level of
complexity of the constraints in the problem. The factor that impacted difficulty the most
was the presence of variables as opposed to numbers. Interestingly, the authors found that the
effect of context depended on whether or not variables were required: for rate problems
without variables, a cost context (e.g., prices with dollar signs to calculate a unit rate) made
the item statistically significantly easier than a distance context (e.g., miles per hour). But,
for items with variables, there was no statistically significant difference between cost and
distance rate problems. Similar to Nathan and Koedinger’s results, these results indicate that
context matters less for more mathematically complex problems such as problems using
variables as opposed to numbers.
For the probability problems in Enright and colleagues’ (2002) study, the authors also
varied whether the item was phrased as a problem about probability (i.e., What is the
probability of…) or percentage (i.e., Which percentage of…) and whether the context was a
real-life scenario or an abstract number context (e.g., An integer is chosen at random
from…). The authors also varied the complexity of counting when describing the sample
space in a probability item (e.g., integer between 200 and 399 versus integer beginning with
the digits 2 or 3 and ending with the digits 8 or 9). Results showed that complexity of
counting had the greatest impact on item difficulty and that items phrased as probability
28
questions were more difficult than items phrased as percentage questions. Real-life versus
abstract context had no statistically significant differences in item difficulty.
Additional studies of word problems further demonstrate how minor semantic
changes affect difficulty, particularly through the use of keywords that signal students to use
certain operations or strategies. Martin and Bassok (2005) defined translation cues as
“standardized phrases and keywords that are highly correlated with correct solutions” which
allow students to go directly from words to solution strategies with little need to interpret the
context of the word problem (p. 471). For example, students identify altogether to mean
addition, difference to mean subtraction, and times to mean multiplication.
Translation cue strategies can backfire when a mismatch exists between the
translation cue and solution strategy. For example, in the statement “There are six times as
many students (S) as professors (P)”, 37 percent of undergraduate engineering students
incorrectly translated this sentence to the corresponding expression, with the response 6S=P
accounting for 68 percent of the incorrect answers (Clement, 1982, p. 17). This type of error,
known as a reversal error, commonly occurs when the student tries to directly translate the
keywords in the statement to the expression without making sense of the relationship
between quantities. Another example of how semantics can complicate mathematics is the
commonly-cited bat and ball problem (i.e., A bat and a ball cost $1.10. The bat costs one
dollar more than the ball. How much does the ball cost?), for which over 50 % of students at
elite universities responded with the incorrect answer of ten cents (Kahneman, 2011).
To further investigate how students use word cues, Martin and Bassok (2005)
conducted a study to test their hypothesis that story problems also have semantic cues in
addition to translation cues that affect which strategies students use and the likelihood of a
29
correct response. They hypothesized that certain objects (e.g., blue marbles and red marbles)
represent symmetrical relationships usually modeled by addition or subtraction whereas other
objects (e.g., apples and baskets or chairs and tables) represent asymmetrical relationships
associated with multiplication and division. Problems have semantic alignment when the
symmetrical or asymmetrical relationship between the words in the problem matches the
correct solution strategy (Bassok, Chase, & Martin, 1998). Martin and Bassok (2005)
presented seventh-graders, ninth-graders, eleventh-graders, and college students with
different types of problems that varied in their semantic alignment and whether students were
asked to provide a numerical answer or write an expression or equation. As hypothesized,
semantic alignment affected whether students answered story problems correctly; more
students answered correctly to semantically aligned problems, as expected. However,
semantic alignment had no effect on expression or equation writing tasks. Also, although
students performed better on problems with semantic alignment, this effect was stronger for
younger students and diminished as age increased. These results imply that word cues matter
less for higher-ability students answering more complex questions, probably because the
mathematical complexity of the problem trumps context cues.
Koedinger, Alibali, and Nathan (2008) conducted similar research on word problem
phrasing with high-school and college algebra students. The authors tested for difficulty
differences between story-implicit problems expressed with everyday language of
mathematical operations (e.g., gave away, kept) and story-explicit problems that utilized
mathematics terminology (e.g., subtracted, added). They found no statistically significant
differences between performance on story-implicit versus story-explicit problems. However,
this result is likely due to the age of the participants. It is possible that younger students are
30
still developing understanding of mathematical terminology, as was the case in the
aforementioned lower-elementary and middle school examples, whereas high-school and
college students already have this foundational knowledge.
A synthesis of the above research on mathematics word problems reveals that the role
of context as a predictor of item difficulty cannot be summarized with a simple answer about
when context makes a problem more or less difficult. Instead, the context of a problem
interacts with other features of the problem and the student, with evidence supporting the
idea of a tradeoff between word problem context, mathematical complexity of the problem,
and the age and ability of the student. Research findings indicate that context affects lower-
level students more so than students completing higher-level mathematics.
Summary
In this chapter, I reviewed four bodies of literature that informed the work of this
dissertation. First, I presented evidence from the field of reading across pre-school through
college contexts to support the idea that motivation, learning, and achievement outcomes
increase when students read texts that they self-select as interesting to them. Second, I
reviewed research with mixed effects for using incidentally-personalized word problems, and
I presented the only two known studies claiming to use TPWPs, each of which had
substantial limitations. Third, I summarized literature about the cognitive processes that
mediate the relationship between interest and learning. Fourth, I reviewed features of
mathematics word problems that affect the difficulty of those problems, including subtle
differences in problem phrasing, vocabulary, and context.
To summarize the research most similar to the present study, research on personalized
word problems shows encouraging results in some cases but no statistically significant
31
differences as compared to generic word problems in other cases. I assert that a reason for
the discrepancy in results is due to the different ways in which authors have operationalized
both personalized and control problems, with differences due to incidentally-personalized
versus topic-personalized word problems and due to control problems situated in either
familiar or abstract contexts. Students’ perceptions of these personalized problems as
interesting or not could explain differences in the studies’ results. In my study, I will focus
on TPWPs. Currently, the only available research in this area is Walkington’s (2013) study
that used minimal context changes to personalized word problems and Walkington,
Petrosino, and Sherman’s (2013) study with a limited sample size. Additionally, previous
studies typically make the assumption that personalized word problems are interesting to
students; I do not make this assumption and instead collect data at the problem level about
which word problems students find interesting and how students’ ratings of word problem
interest influence student performance.
32
Chapter 3: Method
Using a within-subjects design whereby participants completed both TPWPs and
generic word problems, I compared students’ interest ratings, accuracy of responses, and
speed of responses of TPWPs to those of generic word problems. A description of the data
collection procedures, participants, instrument design, data preparation methods, and
analyses methods follows.
Procedures and Participants
Data collection for this study occurred within the context of a free online summer
program designed to prevent summer learning loss in mathematics. The summer program,
known as the Summer Math Challenge (SMC), was offered by MetaMetrics® to rising
second- through eighth-graders during six weeks of June and July, 2016. The SMC focused
on different learning standards each week as aligned to The Quantile® Framework for
Mathematics, a scale measuring task and concept difficulty that consists of approximately
550 Quantile Skills and Concepts (QSCs) reflecting the mathematical content students learn
in grades K-12 (MetaMetrics, Inc., 2011). The online program included instructional
resources, games, quizzes, and interactive activities for students to complete at home each
week. Participation was voluntary, and parents learned about the SMC through
announcements made to educational leaders at the state-, district-, or school-level.
Participants from the 2015 SMC were automatically enrolled in the 2016 SMC but could opt-
out if desired. Access to a computer with internet over the summer was required for
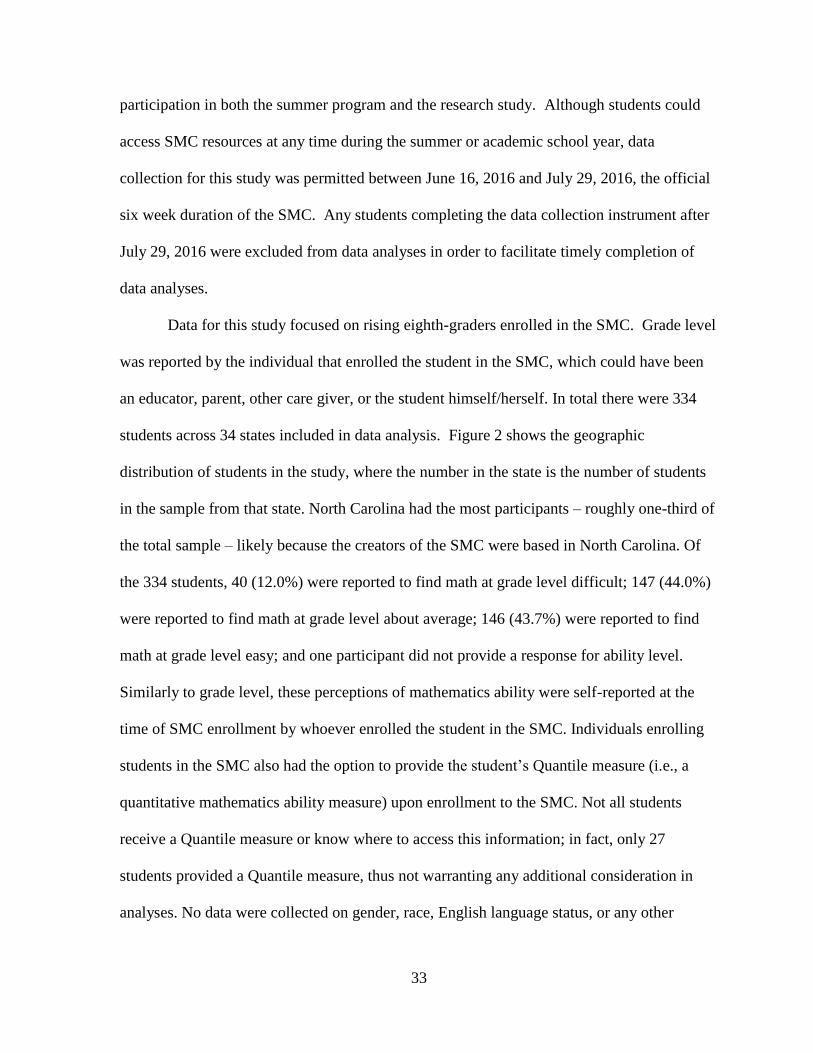
33
participation in both the summer program and the research study. Although students could
access SMC resources at any time during the summer or academic school year, data
collection for this study was permitted between June 16, 2016 and July 29, 2016, the official
six week duration of the SMC. Any students completing the data collection instrument after
July 29, 2016 were excluded from data analyses in order to facilitate timely completion of
data analyses.
Data for this study focused on rising eighth-graders enrolled in the SMC. Grade level
was reported by the individual that enrolled the student in the SMC, which could have been
an educator, parent, other care giver, or the student himself/herself. In total there were 334
students across 34 states included in data analysis. Figure 2 shows the geographic
distribution of students in the study, where the number in the state is the number of students
in the sample from that state. North Carolina had the most participants – roughly one-third of
the total sample – likely because the creators of the SMC were based in North Carolina. Of
the 334 students, 40 (12.0%) were reported to find math at grade level difficult; 147 (44.0%)
were reported to find math at grade level about average; 146 (43.7%) were reported to find
math at grade level easy; and one participant did not provide a response for ability level.
Similarly to grade level, these perceptions of mathematics ability were self-reported at the
time of SMC enrollment by whoever enrolled the student in the SMC. Individuals enrolling
students in the SMC also had the option to provide the student’s Quantile measure (i.e., a
quantitative mathematics ability measure) upon enrollment to the SMC. Not all students
receive a Quantile measure or know where to access this information; in fact, only 27
students provided a Quantile measure, thus not warranting any additional consideration in
analyses. No data were collected on gender, race, English language status, or any other
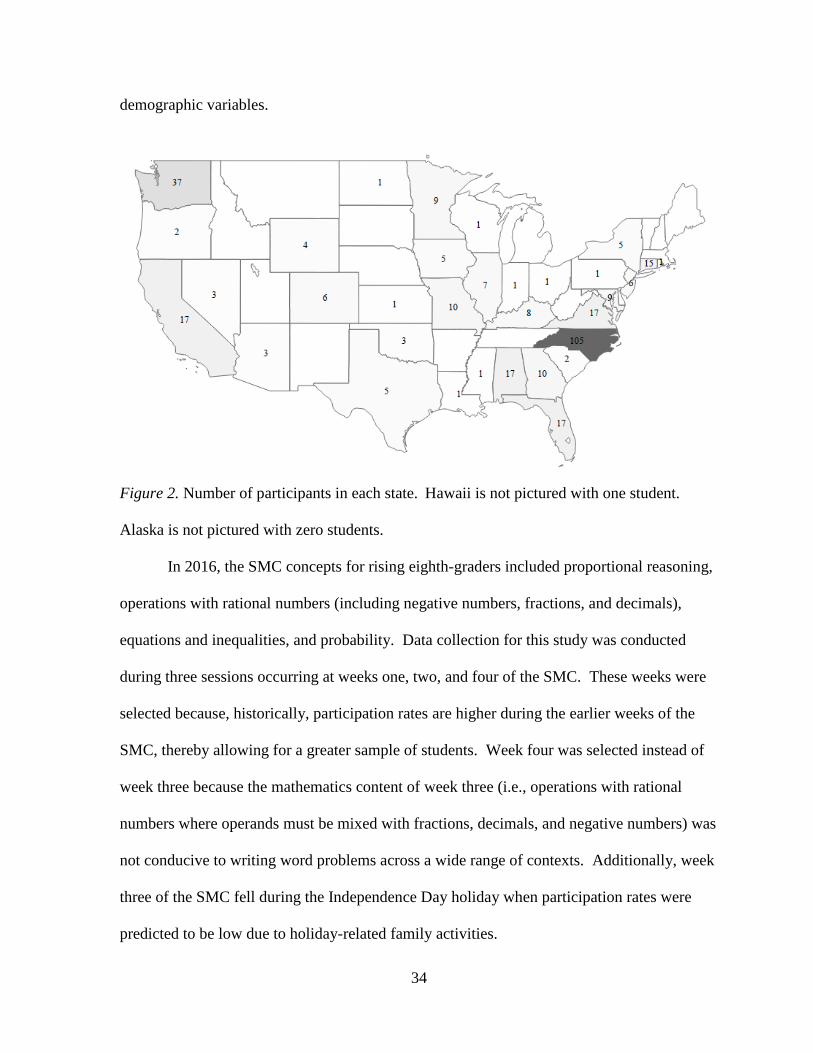
34
demographic variables.
Figure 2. Number of participants in each state. Hawaii is not pictured with one student.
Alaska is not pictured with zero students.
In 2016, the SMC concepts for rising eighth-graders included proportional reasoning,
operations with rational numbers (including negative numbers, fractions, and decimals),
equations and inequalities, and probability. Data collection for this study was conducted
during three sessions occurring at weeks one, two, and four of the SMC. These weeks were
selected because, historically, participation rates are higher during the earlier weeks of the
SMC, thereby allowing for a greater sample of students. Week four was selected instead of
week three because the mathematics content of week three (i.e., operations with rational
numbers where operands must be mixed with fractions, decimals, and negative numbers) was
not conducive to writing word problems across a wide range of contexts. Additionally, week
three of the SMC fell during the Independence Day holiday when participation rates were
predicted to be low due to holiday-related family activities.

35
Table 1 displays the mathematics topic for each of the data collection sessions along
with the relevant QSCs for that week’s topic that were used in data collection. These
particular content standards were chosen by a team of three mathematics subject matter
experts, including myself, based on the reasoning that the content represented skills typically
learned in seventh-grade that are most crucial for success in eighth-grade, as determined by
Common Core State Standards for Mathematics (CCSSM) documents that outline the major
concepts taught in seventh- and eighth-grade mathematics courses (National Governors
Association for Best Practices & Council of Chief State School Officers, 2010).
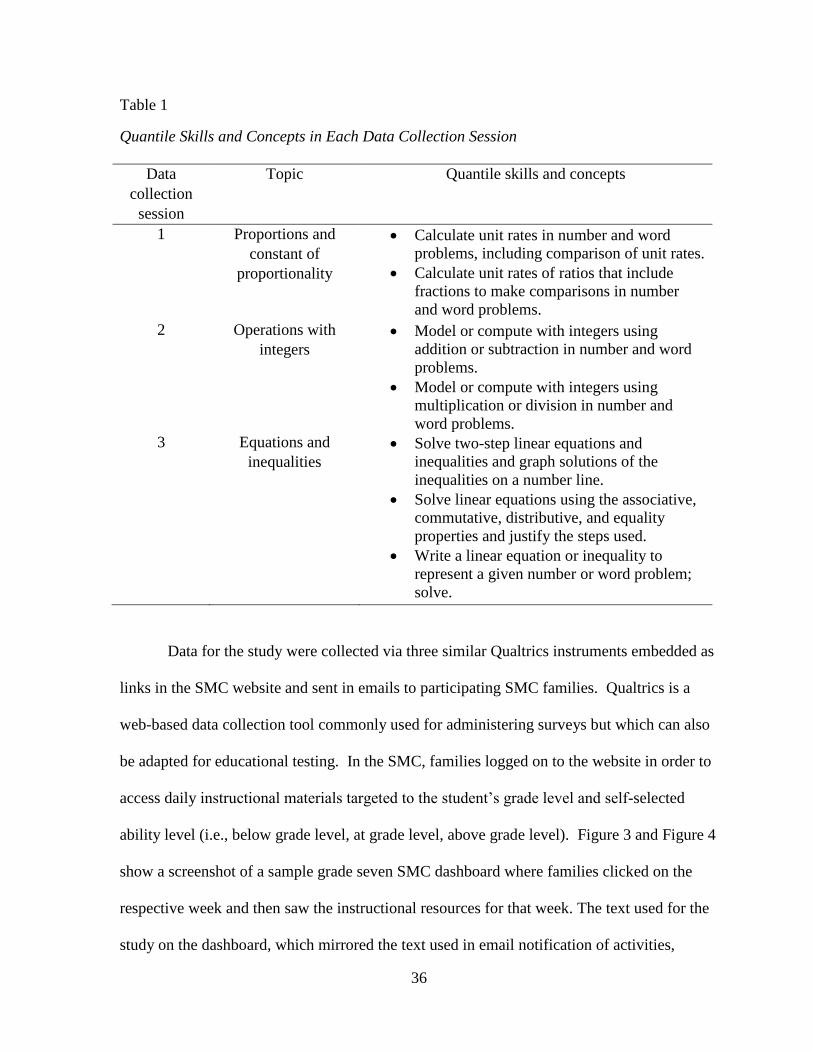
36
Table 1
Quantile Skills and Concepts in Each Data Collection Session
Data
collection
session
Topic Quantile skills and concepts
1 Proportions and
constant of
proportionality
Calculate unit rates in number and word
problems, including comparison of unit rates.
Calculate unit rates of ratios that include
fractions to make comparisons in number
and word problems.
2 Operations with
integers
Model or compute with integers using
addition or subtraction in number and word
problems.
Model or compute with integers using
multiplication or division in number and
word problems.
3 Equations and
inequalities
Solve two-step linear equations and
inequalities and graph solutions of the
inequalities on a number line.
Solve linear equations using the associative,
commutative, distributive, and equality
properties and justify the steps used.
Write a linear equation or inequality to
represent a given number or word problem;
solve.
Data for the study were collected via three similar Qualtrics instruments embedded as
links in the SMC website and sent in emails to participating SMC families. Qualtrics is a
web-based data collection tool commonly used for administering surveys but which can also
be adapted for educational testing. In the SMC, families logged on to the website in order to
access daily instructional materials targeted to the student’s grade level and self-selected
ability level (i.e., below grade level, at grade level, above grade level). Figure 3 and Figure 4
show a screenshot of a sample grade seven SMC dashboard where families clicked on the
respective week and then saw the instructional resources for that week. The text used for the
study on the dashboard, which mirrored the text used in email notification of activities,
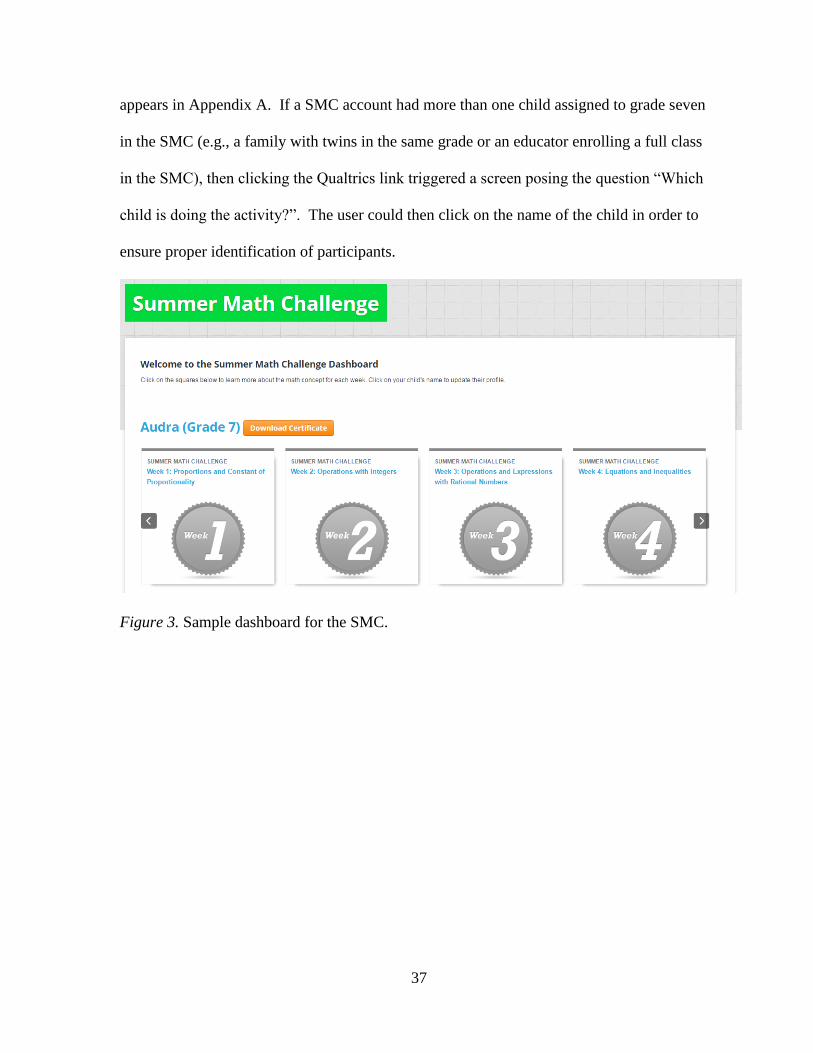
37
appears in Appendix A. If a SMC account had more than one child assigned to grade seven
in the SMC (e.g., a family with twins in the same grade or an educator enrolling a full class
in the SMC), then clicking the Qualtrics link triggered a screen posing the question “Which
child is doing the activity?”. The user could then click on the name of the child in order to
ensure proper identification of participants.
Figure 3. Sample dashboard for the SMC.
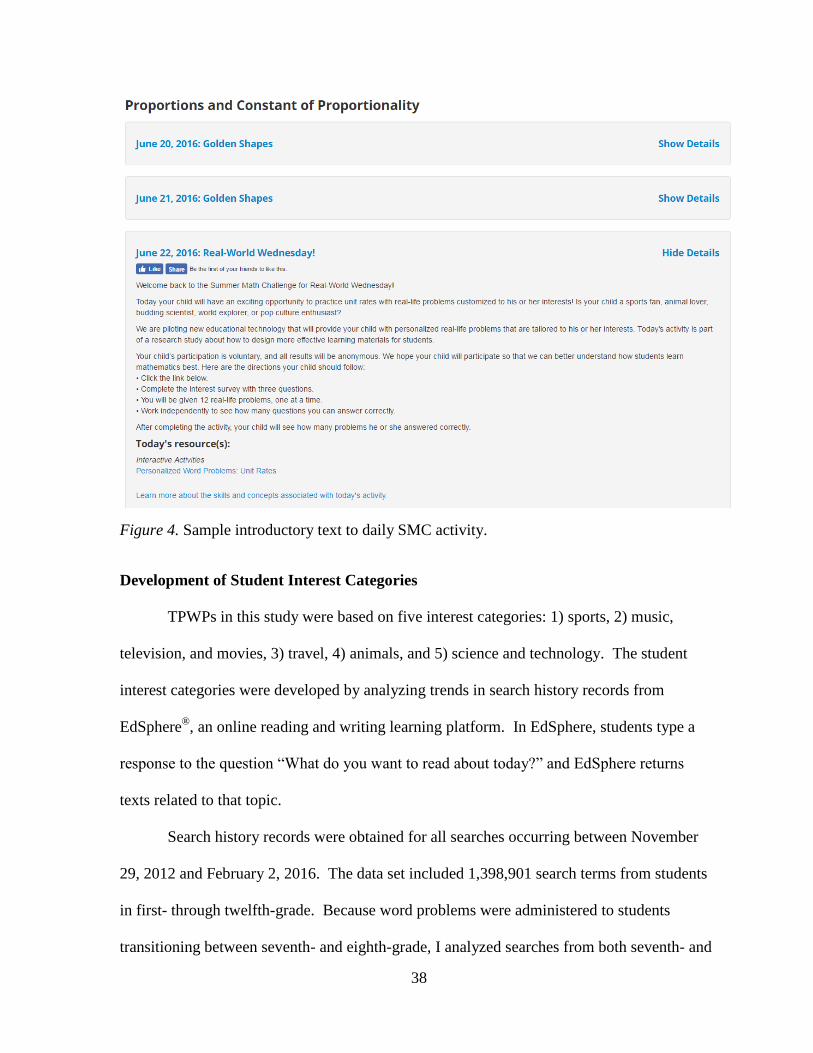
38
Figure 4. Sample introductory text to daily SMC activity.
Development of Student Interest Categories
TPWPs in this study were based on five interest categories: 1) sports, 2) music,
television, and movies, 3) travel, 4) animals, and 5) science and technology. The student
interest categories were developed by analyzing trends in search history records from
EdSphere®, an online reading and writing learning platform. In EdSphere, students type a
response to the question “What do you want to read about today?” and EdSphere returns
texts related to that topic.
Search history records were obtained for all searches occurring between November
29, 2012 and February 2, 2016. The data set included 1,398,901 search terms from students
in first- through twelfth-grade. Because word problems were administered to students
transitioning between seventh- and eighth-grade, I analyzed searches from both seventh- and
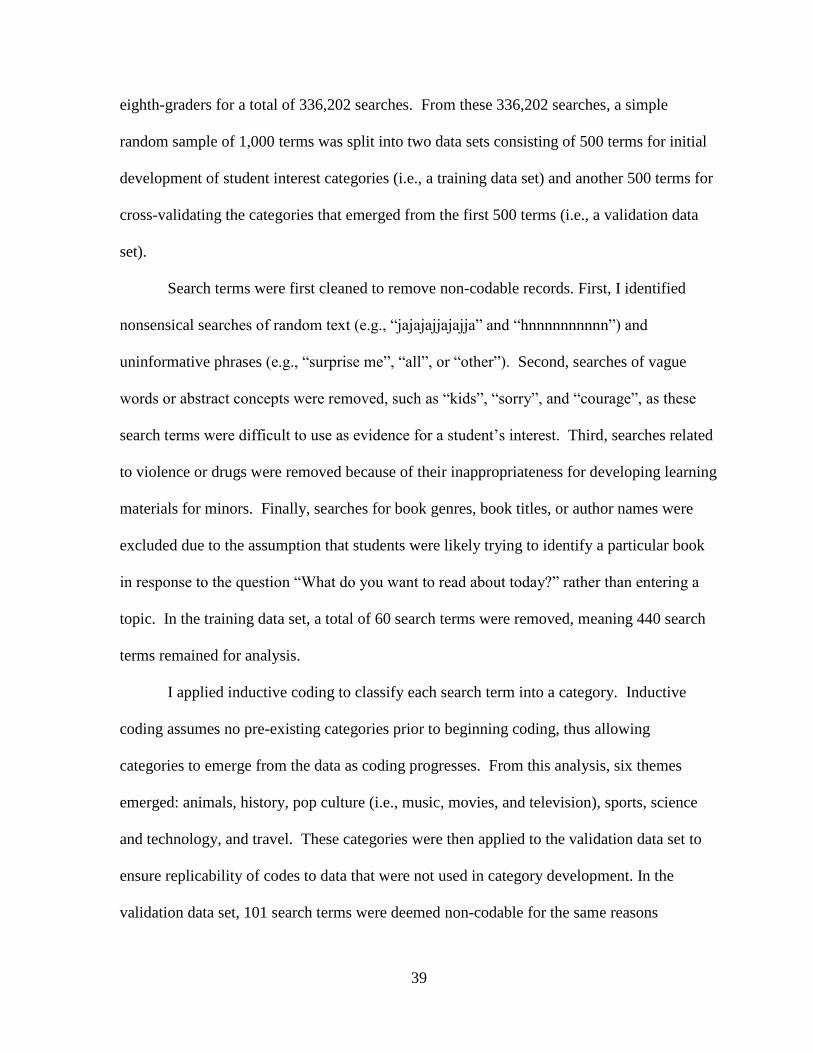
39
eighth-graders for a total of 336,202 searches. From these 336,202 searches, a simple
random sample of 1,000 terms was split into two data sets consisting of 500 terms for initial
development of student interest categories (i.e., a training data set) and another 500 terms for
cross-validating the categories that emerged from the first 500 terms (i.e., a validation data
set).
Search terms were first cleaned to remove non-codable records. First, I identified
nonsensical searches of random text (e.g., “jajajajjajajja” and “hnnnnnnnnnn”) and
uninformative phrases (e.g., “surprise me”, “all”, or “other”). Second, searches of vague
words or abstract concepts were removed, such as “kids”, “sorry”, and “courage”, as these
search terms were difficult to use as evidence for a student’s interest. Third, searches related
to violence or drugs were removed because of their inappropriateness for developing learning
materials for minors. Finally, searches for book genres, book titles, or author names were
excluded due to the assumption that students were likely trying to identify a particular book
in response to the question “What do you want to read about today?” rather than entering a
topic. In the training data set, a total of 60 search terms were removed, meaning 440 search
terms remained for analysis.
I applied inductive coding to classify each search term into a category. Inductive
coding assumes no pre-existing categories prior to beginning coding, thus allowing
categories to emerge from the data as coding progresses. From this analysis, six themes
emerged: animals, history, pop culture (i.e., music, movies, and television), sports, science
and technology, and travel. These categories were then applied to the validation data set to
ensure replicability of codes to data that were not used in category development. In the
validation data set, 101 search terms were deemed non-codable for the same reasons
40
described above, resulting in 399 codable search terms. Using the same categories developed
from the training data set (i.e., animals, history, pop culture, sports, science and technology,
and travel), 327 search terms fit within these categories. Table 2 presents the categories by
frequency count and by percentage of the total codable and uncategorized search terms, along
with examples of search terms from each category.
Table 2
Frequency of Search Terms in Each Interest Category
Interest
category Frequency
Cumulative
frequency
Percentage
of all
codable
terms Example search terms
History 81 81 20.3% Revolutionary war, Holocaust,
Articles of Confederation,
Middle Ages
Sports 72 153 18.0% soccer, Real Madrid, Babe
Ruth, summer olympics
Pop Culture 62 195 15.5% Star Wars, Sandra Bullock,
The Beatles, One Direction
Travel 41 236 10.3% New York City, Amazon
Forest, London, Washington
D.C.
Animals 38 274 9.5% animal sanctuaries, panda,
dogs, cheetahs
Science and
Technology
Uncategorized
33
72
307
399
8.3%
18.1%
nuclear fission, freshwater
ecosystems, Japan robotics,
erosion
teen driving, Valentine’s Day,
Guinness world records
Total 399 399 100.0%
Out of the 399 codable search terms, 72 (18.1%) did not fit into any of the six interest
categories. These 72 uncategorized terms were further analyzed to check for the possibility
of additional categories, but the diversity of the 72 terms was too vast to warrant a seventh
category, as the terms were unique phrases such as “teen driving”, “unsolved mysteries”,
“Guinness world records”, and “Valentine’s Day”. The closest theme emerging from the 72
41
uncategorized search terms was video games, but video games only represented seven
searches out of the 399 codable searches, which was not high enough to warrant an entirely
new interest category. Furthermore, the number of categories was intentionally minimized in
order to facilitate writing a feasible number of problems and to not diminish the motivational
effects of choice by providing too many options as described by Katz and Assor (2007).
Despite the six categories that emerged from the inductive coding, I removed history
as a category due to challenges related to combining history and mathematics in a meaningful
yet research-appropriate way. This decision was made after careful consideration and
consultation with two history teachers, including one middle school teacher with over ten
years of experience teaching eighth-grade American history in addition to another 10 years of
experience teaching Algebra 1 and one tenth-grade history teacher with over 25 years of
experience. Both teachers gave excellent suggestions for word problems within the realm of
the content for this study (i.e., given how far Lewis and Clark traveled over a certain period
of time, calculate how many miles they walked per day), however writing problems such as
these posed challenges related to the numbers used in the problems and other confounding
factors. Specifically, the history problems generally needed to be based on facts in order to
represent meaningful scenarios rather than fabricated numbers and contexts, and these
numbers could not be uniformly applied to the matched problems in other interest categories.
Additionally, writing problems based on history facts introduced a confounding variable of
whether the problem contained factual or fictional information, which could have potentially
affected results in a way that limited inferences made from data in this study. It was not
possible to make all problems factual due to the need to utilize the same numbers across sets
of matched problems in order to ensure consistent difficulty of mathematical tasks. To be
42
clear, I do not claim that history and mathematics lack interdisciplinary overlap; rather, for
the purpose of this study, it was not possible to write history word problems that preserved
the other features of the research design while still achieving meaningful word problems.
After removing history, the five remaining interest categories utilized in this study
were: 1) sports, 2) music, television, and movies, 3) travel, 4) animals, and 5) science and
technology. This study is the first – to my knowledge – to develop interest categories for
word problems based on empirical student data rather than researchers’ perceptions of
students’ interests.
Instrument Development
Students had the opportunity to complete an instrument administered through
Qualtrics consisting of 12 word problems – six TPWPs and six generic word problems –
once per week for three weeks for a total of 36 problems per student.
Student interest questionnaire. The instrument began with a student interest
questionnaire that asked students to select a name for themselves and the name of a friend
and then answer “Which topic most interests you?” by selecting either Sports; Music,
Movies, and Television; Science and Technology; Travel; or Animals. The interest categories
were displayed in random order. Figure 5 shows an example screenshot of the interest
questionnaire. For all questions, the instrument incorporated data validation so that the
participant would receive an error message if he or she did not provide a response.
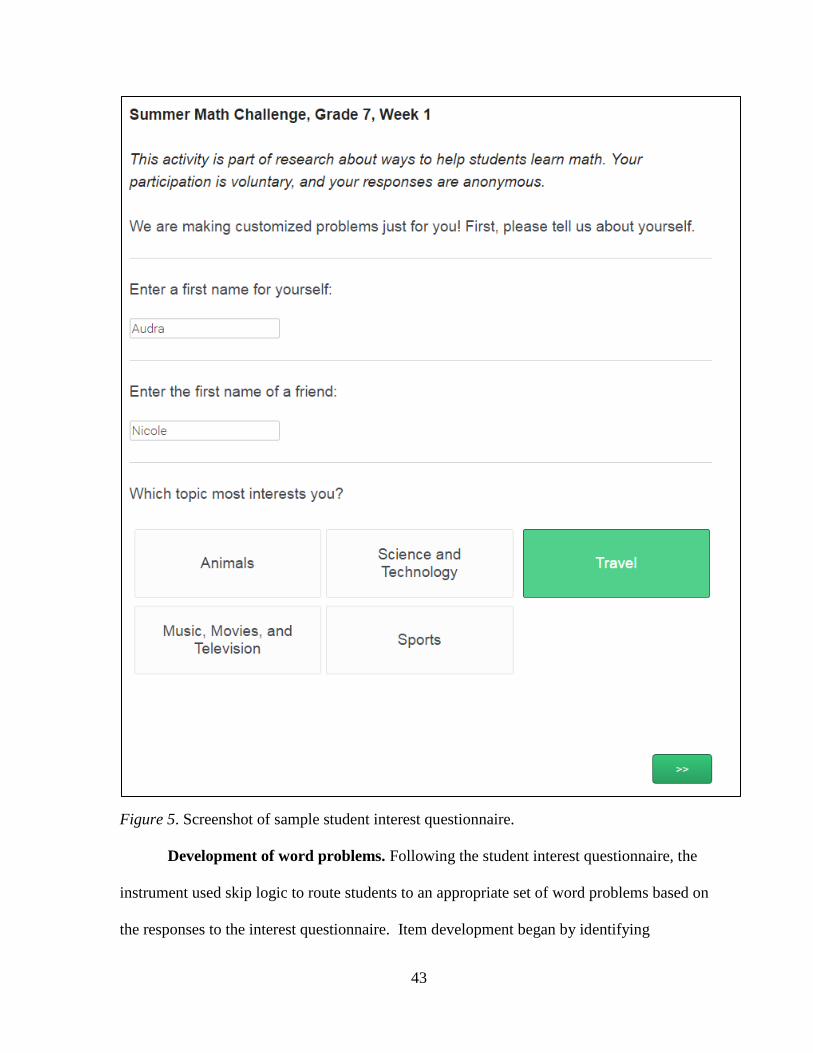
43
Figure 5. Screenshot of sample student interest questionnaire.
Development of word problems. Following the student interest questionnaire, the
instrument used skip logic to route students to an appropriate set of word problems based on
the responses to the interest questionnaire. Item development began by identifying
44
psychometrically well-performing selected-response items from a large bank of items
previously pretested through various K-12 testing programs. Items were selected as well-
performing items, known as exemplar items, based on the criteria that the item’s point-
biserial correlation was greater than or equal to .2 and the p-value of the item (i.e., the
percentage of examinees that answered the item correctly) was between .3 and .7 based on a
pretest sample of at least 1,500 seventh-graders. Additionally, the item must have been a
word problem that represented the same content standards as the respective week’s content in
the SMC. In a few cases, new items were written when an exemplar item was not available
that fit into the study constraints (e.g., when it was not possible to modify the interest
categories). Names included in generic items were modified in some cases in order to
minimize the likelihood that a generic word problem included a student’s actual name by
chance. This was done by changing common names (e.g., John, Ryan) in generic word
problems to names more frequently used in generations older than the study population (e.g.,
Phyllis, Marshall), including the formal salutation for an adult (e.g., Mr. Johnson) or by using
culturally-diverse names as is done in typical K-12 item development (e.g., Kianna).
Prior to writing items, I consulted with a former middle school science teacher for
content-specific suggestions on how to incorporate science ideas in the mathematics content
of the word problems. I also reviewed resources recommended by other teachers that
provide ideas for how to integrate mathematics into real-life scenarios, such as the IMAX
Educator Guides and the Washington Post Curriculum Guides. Using these ideas and my
own experience as both a former eighth-grade middle school mathematics teacher and current
mathematics item writer, I then modeled items for the study based on the identified exemplar
items, meaning the study items shared characteristics of the exemplar items such as type of
45
mathematical task, cognitive complexity level using Webb’s (1997) Depth of Knowledge
hierarchy, formatting and styles (e.g., italicizing variables in equations), sentence structure,
distractor rationales, number type (e.g., decimals to the tenths place, whole numbers that are
multiples of five, etc.), use of visual aids, etc.. All TPWPs were selected-response items with
four options in order to replicate the format of the exemplar items.
Each generic item had a matched TPWP. Pairs of matched items had similar features
theorized to predict difficulty, such as types of numbers, problem structures, distractor
rationales, text complexity of stem, number of words in stem, and formatting of answer
choices (e.g., presenting an answer as a single numeric value versus an expression to
represent a calculation). Table 3 displays an example of a generic item with a matched
TPWP for each interest category, where the place holder Student Name was filled with the
student’s response from the interest questionnaire. The full set of items is available in
Appendix B; some items are redacted for test security purposes, since some items may be on
current operational test forms. The generic word problem and matched TPWPs represented
the same type of mathematical task (i.e., choosing which set of items has the lowest unit rate
in the context of money). The problems also shared similar number structures (i.e., the dollar
values are two-digit whole numbers to the tenths place and the number of objects in each
answer choice is a whole number less than or equal to 20). Lastly, the stems had similar
sentence structure between generic word problems and their matched TPWPs.
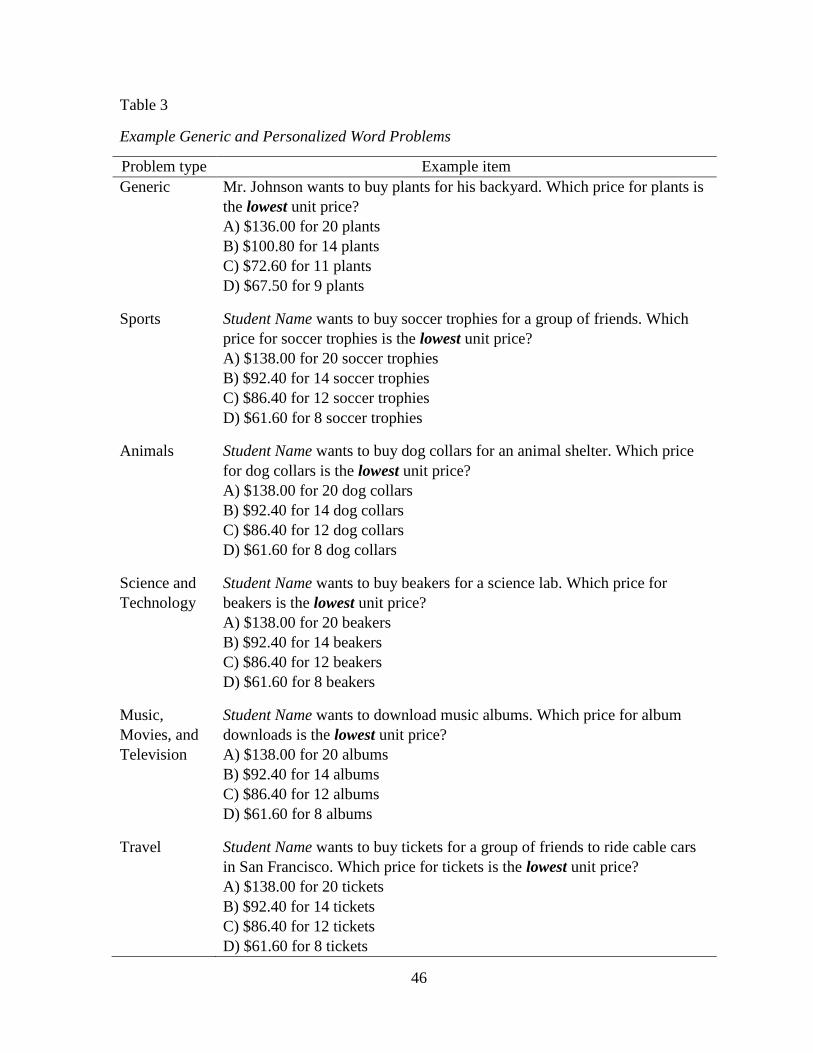
46
Table 3
Example Generic and Personalized Word Problems
Problem type Example item
Generic Mr. Johnson wants to buy plants for his backyard. Which price for plants is
the lowest unit price?
A) $136.00 for 20 plants
B) $100.80 for 14 plants
C) $72.60 for 11 plants
D) $67.50 for 9 plants
Sports Student Name wants to buy soccer trophies for a group of friends. Which
price for soccer trophies is the lowest unit price?
A) $138.00 for 20 soccer trophies
B) $92.40 for 14 soccer trophies
C) $86.40 for 12 soccer trophies
D) $61.60 for 8 soccer trophies
Animals Student Name wants to buy dog collars for an animal shelter. Which price
for dog collars is the lowest unit price?
A) $138.00 for 20 dog collars
B) $92.40 for 14 dog collars
C) $86.40 for 12 dog collars
D) $61.60 for 8 dog collars
Science and
Technology
Student Name wants to buy beakers for a science lab. Which price for
beakers is the lowest unit price?
A) $138.00 for 20 beakers
B) $92.40 for 14 beakers
C) $86.40 for 12 beakers
D) $61.60 for 8 beakers
Music,
Movies, and
Television
Student Name wants to download music albums. Which price for album
downloads is the lowest unit price?
A) $138.00 for 20 albums
B) $92.40 for 14 albums
C) $86.40 for 12 albums
D) $61.60 for 8 albums
Travel Student Name wants to buy tickets for a group of friends to ride cable cars
in San Francisco. Which price for tickets is the lowest unit price?
A) $138.00 for 20 tickets
B) $92.40 for 14 tickets
C) $86.40 for 12 tickets
D) $61.60 for 8 tickets
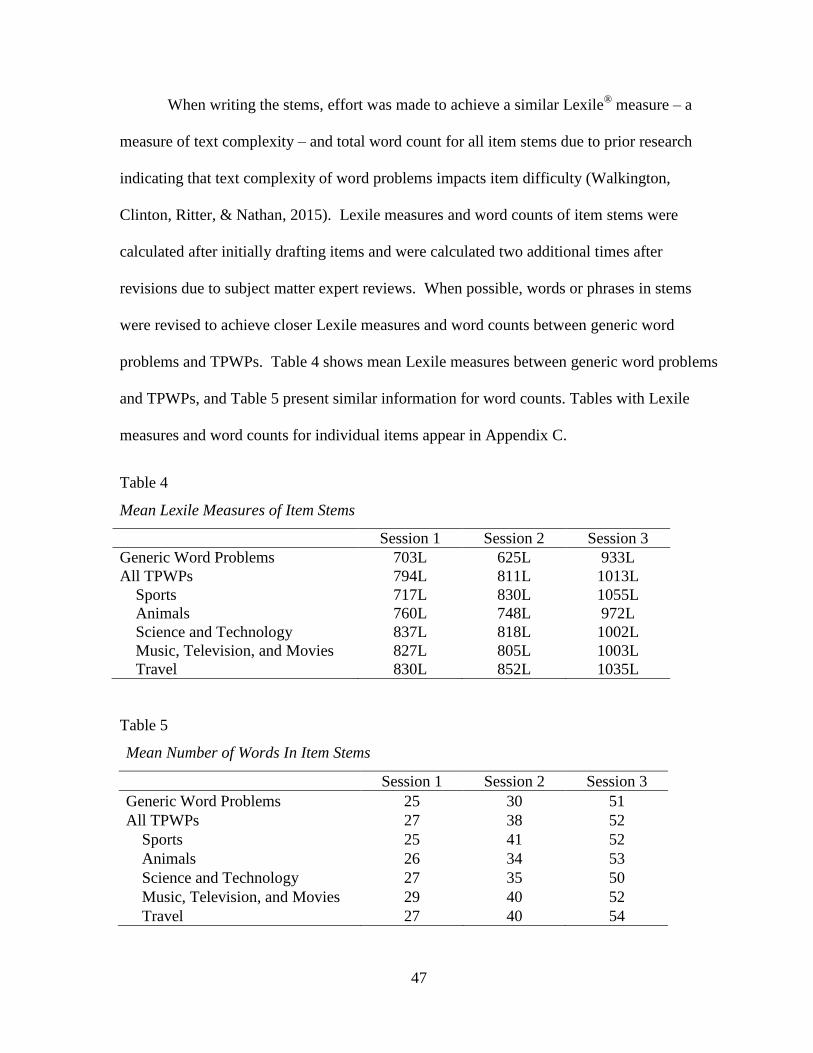
47
When writing the stems, effort was made to achieve a similar Lexile® measure – a
measure of text complexity – and total word count for all item stems due to prior research
indicating that text complexity of word problems impacts item difficulty (Walkington,
Clinton, Ritter, & Nathan, 2015). Lexile measures and word counts of item stems were
calculated after initially drafting items and were calculated two additional times after
revisions due to subject matter expert reviews. When possible, words or phrases in stems
were revised to achieve closer Lexile measures and word counts between generic word
problems and TPWPs. Table 4 shows mean Lexile measures between generic word problems
and TPWPs, and Table 5 present similar information for word counts. Tables with Lexile
measures and word counts for individual items appear in Appendix C.
Table 4
Mean Lexile Measures of Item Stems
Session 1 Session 2 Session 3
Generic Word Problems 703L 625L 933L
All TPWPs 794L 811L 1013L
Sports 717L 830L 1055L
Animals 760L 748L 972L
Science and Technology 837L 818L 1002L
Music, Television, and Movies 827L 805L 1003L
Travel 830L 852L 1035L
Table 5
Mean Number of Words In Item Stems
Session 1 Session 2 Session 3
Generic Word Problems 25 30 51
All TPWPs 27 38 52
Sports 25 41 52
Animals 26 34 53
Science and Technology 27 35 50
Music, Television, and Movies 29 40 52
Travel 27 40 54
48
As seen in the tables, both Lexile measures and word counts for TPWPs were slightly
higher than Lexile measures and word counts for generic word problems. Writing stems with
exactly comparable text complexity and length is nearly impossible because the personalized
nature of TPWPs requires unique language specific to the interest category. Generally, the
TPWPs stems were more complex because of context-specific words related to the interest
category. For example, science and technology word problems included words such as
beakers, bacteria, microscope, megabyte, and volcanic that generally result in higher Lexile
measures than words from the matched generic word problems such as pencils, dishes,
allowance, water, and lunch. However, for a student choosing science and technology as the
preferred interest category, that student might have more familiarity with science-specific
words which might cause those words to function similarly – in terms of text complexity – to
words in generic word problems. Thus, despite differences in Lexile measures across item
stems, the stems represent roughly equivalent reading difficulty to the greatest extent possible
while allowing for variation due to interest category and while preserving the sentence structure
and mathematical content of the item.
Likewise, word counts for TPWPs were also slightly higher than generic word
problems because of the need to provide enough context in the problem for the problem to be
considered targeted to the interest category. Also, in some cases, a TPWP required
additional words in order to provide enough background information for the student rather
than assuming prior knowledge about the interest category. For example, Table 6 shows an
example of a generic word problem and two matched TPWPs with varying stem lengths.
Differences in word length can be attributed to variation in phrases that are specific to the
topic. Although the item writing process included effort to achieve stems with similar word
counts, these items illustrate how TPWPs generally required more words in the stem than
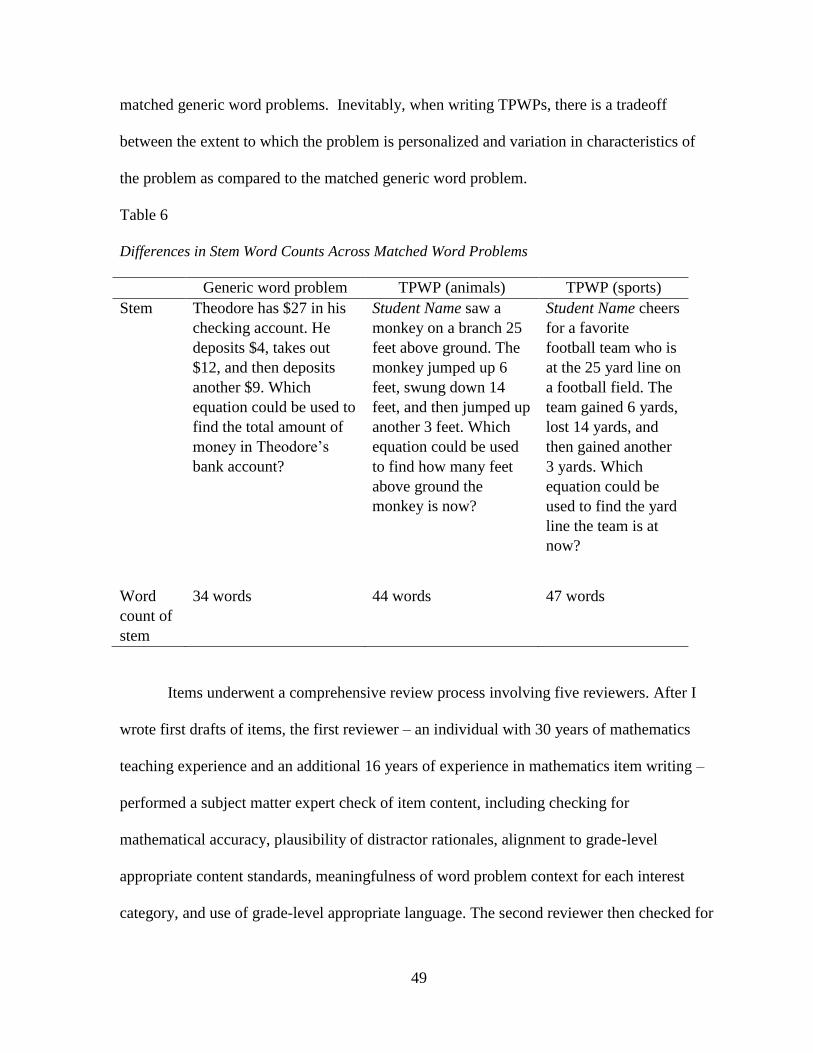
49
matched generic word problems. Inevitably, when writing TPWPs, there is a tradeoff
between the extent to which the problem is personalized and variation in characteristics of
the problem as compared to the matched generic word problem.
Table 6
Differences in Stem Word Counts Across Matched Word Problems
Generic word problem TPWP (animals) TPWP (sports)
Stem Theodore has $27 in his
checking account. He
deposits $4, takes out
$12, and then deposits
another $9. Which
equation could be used to
find the total amount of
money in Theodore’s
bank account?
Student Name saw a
monkey on a branch 25
feet above ground. The
monkey jumped up 6
feet, swung down 14
feet, and then jumped up
another 3 feet. Which
equation could be used
to find how many feet
above ground the
monkey is now?
Student Name cheers
for a favorite
football team who is
at the 25 yard line on
a football field. The
team gained 6 yards,
lost 14 yards, and
then gained another
3 yards. Which
equation could be
used to find the yard
line the team is at
now?
Word
count of
stem
34 words 44 words 47 words
Items underwent a comprehensive review process involving five reviewers. After I
wrote first drafts of items, the first reviewer – an individual with 30 years of mathematics
teaching experience and an additional 16 years of experience in mathematics item writing –
performed a subject matter expert check of item content, including checking for
mathematical accuracy, plausibility of distractor rationales, alignment to grade-level
appropriate content standards, meaningfulness of word problem context for each interest
category, and use of grade-level appropriate language. The second reviewer then checked for
50
spelling, grammar, punctuation, and consistency of language across item sets (e.g., if the
generic problem said “per week” as opposed to “each week”, then the TPWPs were reviewed
to make sure they all also said “per week”). Next, a third reviewer – an individual with nine
years of experience conducting sensitivity reviews on mathematics items – performed a
sensitivity review by checking for issues related to cultural appropriateness, gender
appropriateness (e.g., not writing any sports problems about baseball since girls typically
play softball instead of baseball) and vocabulary that may have been challenging or
confusing for English language learners. Revisions were made after receiving each
reviewer’s feedback. A fourth reviewer – an individual with 24 years of experience in
mathematics item writing – then performed a holistic check of all of the previously
mentioned criteria to ensure that revisions did not cause additional concerns and also that
TPWPs were situated in a plausible real-life context.
Form design. The generic and personalized items were grouped into forms with 12
items each, six of which were TPWPs based on the student’s responses to the interest
questionnaire and six of which were generic problems common to all students. The forms
each had a particular content theme based on the content for the designated SMC week:
session one, two, and three respectively included rates and ratios, integer operations, and
equations and inequalities. Each form began with the student interest questionnaire and then
presented the 12 word problems by alternating between a TPWP and a generic problem, with
one problem displayed per screen as demonstrated in Figure 6.
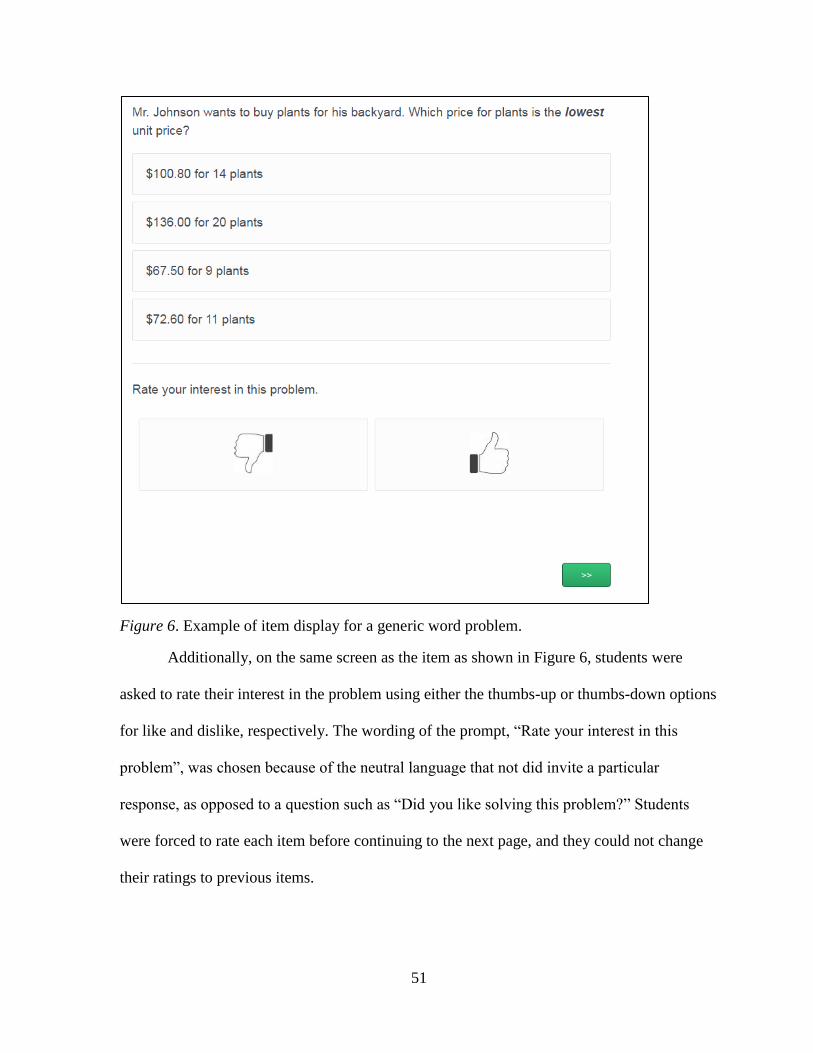
51
Figure 6. Example of item display for a generic word problem.
Additionally, on the same screen as the item as shown in Figure 6, students were
asked to rate their interest in the problem using either the thumbs-up or thumbs-down options
for like and dislike, respectively. The wording of the prompt, “Rate your interest in this
problem”, was chosen because of the neutral language that not did invite a particular
response, as opposed to a question such as “Did you like solving this problem?” Students
were forced to rate each item before continuing to the next page, and they could not change
their ratings to previous items.
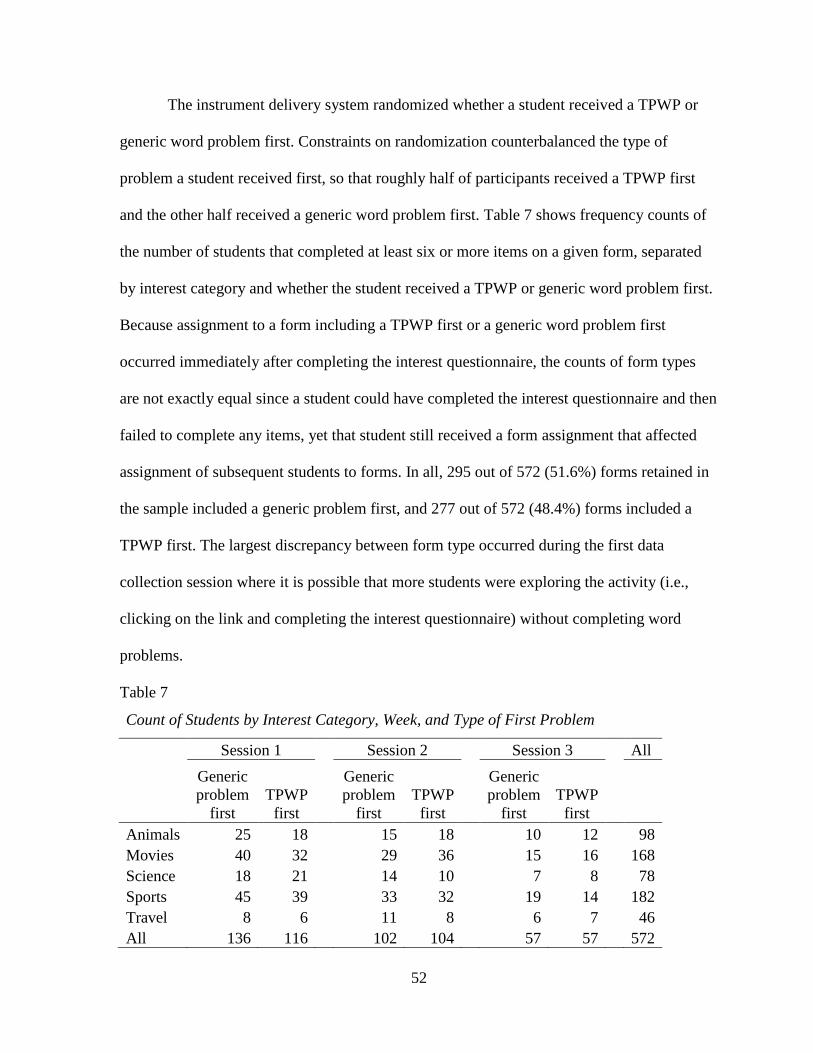
52
The instrument delivery system randomized whether a student received a TPWP or
generic word problem first. Constraints on randomization counterbalanced the type of
problem a student received first, so that roughly half of participants received a TPWP first
and the other half received a generic word problem first. Table 7 shows frequency counts of
the number of students that completed at least six or more items on a given form, separated
by interest category and whether the student received a TPWP or generic word problem first.
Because assignment to a form including a TPWP first or a generic word problem first
occurred immediately after completing the interest questionnaire, the counts of form types
are not exactly equal since a student could have completed the interest questionnaire and then
failed to complete any items, yet that student still received a form assignment that affected
assignment of subsequent students to forms. In all, 295 out of 572 (51.6%) forms retained in
the sample included a generic problem first, and 277 out of 572 (48.4%) forms included a
TPWP first. The largest discrepancy between form type occurred during the first data
collection session where it is possible that more students were exploring the activity (i.e.,
clicking on the link and completing the interest questionnaire) without completing word
problems.
Table 7
Count of Students by Interest Category, Week, and Type of First Problem
Session 1 Session 2 Session 3 All
Generic
problem
first
TPWP
first
Generic
problem
first
TPWP
first
Generic
problem
first
TPWP
first
Animals 25 18
15 18
10 12
98
Movies 40 32
29 36
15 16
168
Science 18 21
14 10
7 8
78
Sports 45 39
33 32
19 14
182
Travel 8 6
11 8
6 7
46
All 136 116
102 104
57 57
572
53
Because the TPWPs were matched to the generic word problems in terms of the type
of mathematical task, stem phrasing, and type of numbers, the items were ordered such that
no two matched items appeared next to each other. This minimized the possibility of a
student recognizing an item as similar to its matched item and possibly recalling a solution
strategy used on the matched item rather than thinking through how to solve the item as if it
had never been seen before. As an additional constraint on item ordering, the first six items
included three complete pairs of matched TPWPs and generic word problems, and the last six
items included the last three matched pairs. The rationale for including a complete set of
three matched pairs in the first half of the instrument was to maximize the use of data from
students that failed to complete the entire instrument. In other words, if a student completed
only half of the problems, the data from that student still contained a complete set of three
TPWPs and three matched generic items. Figure 7 shows the form design, where the labels
indicate which items are matched to each other. For example, Personalized 1 and Generic 1
are matched, Personalized 2 and Generic 2 are matched, etc..
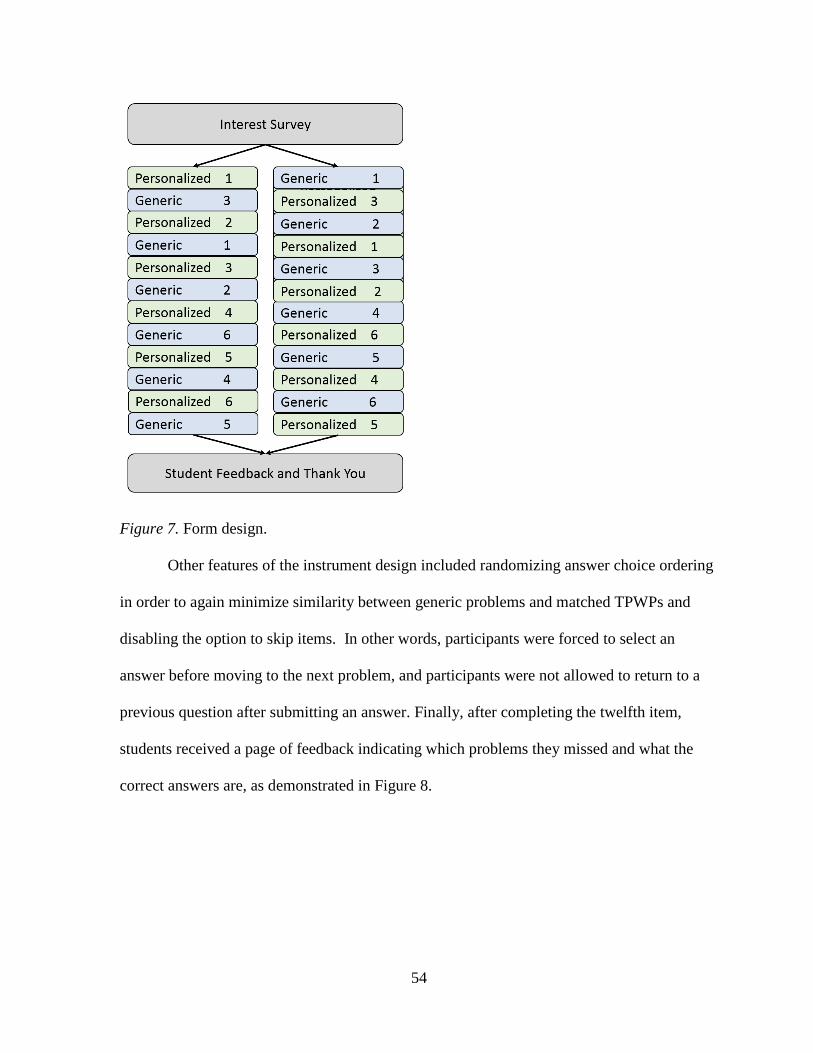
54
Figure 7. Form design.
Other features of the instrument design included randomizing answer choice ordering
in order to again minimize similarity between generic problems and matched TPWPs and
disabling the option to skip items. In other words, participants were forced to select an
answer before moving to the next problem, and participants were not allowed to return to a
previous question after submitting an answer. Finally, after completing the twelfth item,
students received a page of feedback indicating which problems they missed and what the
correct answers are, as demonstrated in Figure 8.
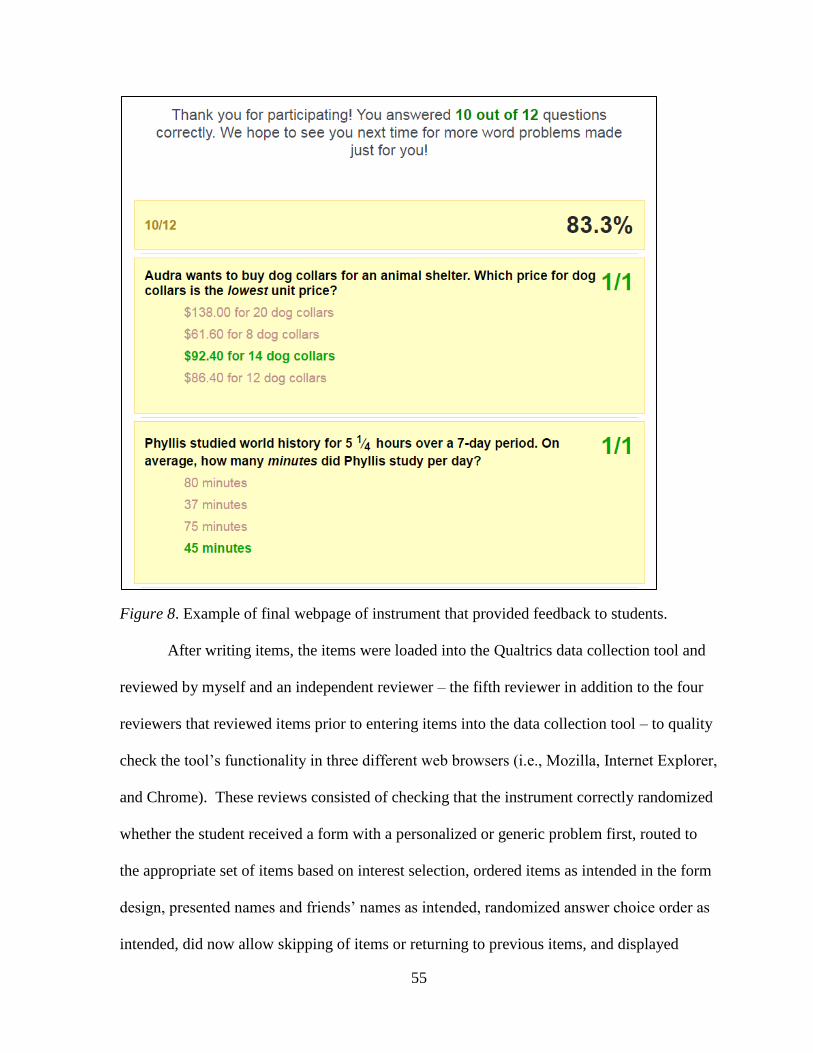
55
Figure 8. Example of final webpage of instrument that provided feedback to students.
After writing items, the items were loaded into the Qualtrics data collection tool and
reviewed by myself and an independent reviewer – the fifth reviewer in addition to the four
reviewers that reviewed items prior to entering items into the data collection tool – to quality
check the tool’s functionality in three different web browsers (i.e., Mozilla, Internet Explorer,
and Chrome). These reviews consisted of checking that the instrument correctly randomized
whether the student received a form with a personalized or generic problem first, routed to
the appropriate set of items based on interest selection, ordered items as intended in the form
design, presented names and friends’ names as intended, randomized answer choice order as
intended, did now allow skipping of items or returning to previous items, and displayed
56
appropriate feedback at completion of the activity. Both myself and the fifth reviewer
checked every version of the data collection instrument (i.e., two forms – generic word
problem first or TPWP first – per interest category across all three sessions for a total of 30
unique forms). Finally, as a last step, the items were cold solved in the data collection tool.
Cold solving is a process where individuals that had not previously seen the items and were
not familiar with the study design solved each item as a final holistic check. Cold solvers
checked for clarity of language, correct answer keys, and any other issues seen in the items
such as the possibility of two correct answers. Five unique reviewers unfamiliar with the
study cold solved one form per interest category per data collection session; the cold solvers
had not previously seen the items until this stage.
In addition to the previously-described item development and data collection tool
quality checking process, several procedures were undertaken in order to ensure data quality
once data collection began and after data were offloaded from the data collection tool. First,
several MetaMetrics employees signed up as students in the SMC, which allowed us to
receive daily SMC emails and access the SMC dashboard in the same manner as students.
We checked functionality of the data collection tool using multiple web browsers, computers,
and mobile devices during each week’s release through both the dashboard and the weekly
Wednesday email. Second, SMC participants had a means to report any technical issues
encountered while interacting with the SMC. Although minor problems were reported with
other SMC activities (i.e., broken web links, incorrect answer keys), no problems were
reported related to the data collection tool for this study. Finally, to ensure data quality of
scored responses, item keys were checked after data collection ended by both entering the
correct answer in the data collection tool and checking the offloaded data file and by
57
reviewing item data for indications of key errors (i.e., a higher percent of responses for an
answer other than the identified key). In summary, after a thorough quality checking
process, there were no known data collection issues that would have affected data quality.
Data Preparation
Data from all three sessions were merged together to create one data set. Within the
SMC, each student has a unique identification number assigned to him/her, though this
number is maintained in the website database and never shown to the website user. Qualtrics
has a feature known as embedded data that allowed for each student’s unique SMC
identification number to be passed to Qualtrics through a unique Qualtrics link assigned to
each student, which meant that the exported data set from Qualtrics included students’ SMC
identification numbers. These identification numbers permitted merging data from all three
data collection sessions into a single data set. This process also explains why the instrument
did not require students to provide any identifying information when accessing the Qualtrics,
though students did need to log-on to the SMC with a username and password.
Data from students’ responses to the SMC word problems were cleaned for issues
that would affect the validity of the data. Data cleaning considered characteristics of
participant responses (i.e., participants that rapidly guessed or failed to answer a sufficient
number of items) and characteristics of items (e.g., sufficiently high point-biserial
correlations).
Participants. In sessions one, two, and three, 411, 308, and 207 students accessed the
SMC link to the instrument and entered at least one response to the interest questionnaire,
respectively. In the case where a student accessed the instrument multiple times (e.g., to redo
the problems with a different category or different names), the student’s initial attempt was
58
retained and all subsequent attempts were omitted from data analysis based on a timestamp
indicating when the student accessed the link. This omission resulted in 341, 253, and 169
remaining students in sessions one, two, and three, respectively. Moreover, data were cleaned
according to three additional criteria: 1) the student entered valid names into the interest
questionnaire, as opposed to entering a string of symbols or numbers, 2) the students
completed at least the first six problems, as previously described, and 3) the student did not
rapidly guess on six or more problems, where a rapid guess was defined as spending less than
five seconds on an item’s page.
The criteria for flagging an item as a rapid guess was based on methods used by
Kong, Wise, and Bhola’s (2007) regarding setting a response time threshold for a rapid
guesses. In their work and other papers that use response time to identify rapid guesses, a
response is flagged as a rapid guess if the response time is less than a set threshold, and this
threshold may vary depending on features of the items or examinees (Setzer, Wise, van den
Heuvel, & Ling, 2013; Wise & DeMars, 2005; Wise & Kong, 2005; Wise, Pastor, & Kong,
2009). Two of the methods used by Kong, Wise, and Bhaola (2007) are the common
threshold method, where an item is flagged as a rapid guess if the response time is less than
three seconds, and the surface feature rule-based thresholds. In the surface feature rule-
based threshold, the response time threshold is based on the length of the stem or the
presence of ancillary information (e.g., tables, graphs) in the item, where stems with 200 or
fewer characters with no ancillary information – as was the case for almost all items in the
present study – are set with a three second threshold. Items with longer stems or items with
ancillary information may have longer thresholds. In the case of the present study, both the
common threshold method and the surface feature rule-based threshold result in a three
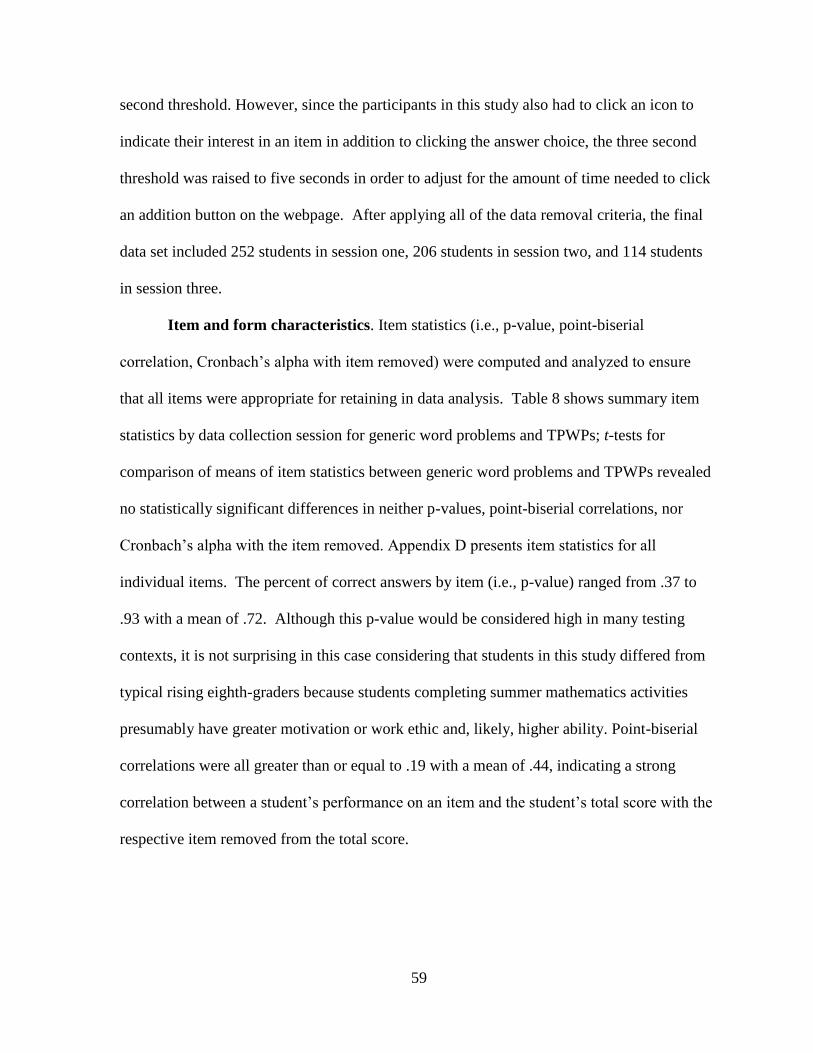
59
second threshold. However, since the participants in this study also had to click an icon to
indicate their interest in an item in addition to clicking the answer choice, the three second
threshold was raised to five seconds in order to adjust for the amount of time needed to click
an addition button on the webpage. After applying all of the data removal criteria, the final
data set included 252 students in session one, 206 students in session two, and 114 students
in session three.
Item and form characteristics. Item statistics (i.e., p-value, point-biserial
correlation, Cronbach’s alpha with item removed) were computed and analyzed to ensure
that all items were appropriate for retaining in data analysis. Table 8 shows summary item
statistics by data collection session for generic word problems and TPWPs; t-tests for
comparison of means of item statistics between generic word problems and TPWPs revealed
no statistically significant differences in neither p-values, point-biserial correlations, nor
Cronbach’s alpha with the item removed. Appendix D presents item statistics for all
individual items. The percent of correct answers by item (i.e., p-value) ranged from .37 to
.93 with a mean of .72. Although this p-value would be considered high in many testing
contexts, it is not surprising in this case considering that students in this study differed from
typical rising eighth-graders because students completing summer mathematics activities
presumably have greater motivation or work ethic and, likely, higher ability. Point-biserial
correlations were all greater than or equal to .19 with a mean of .44, indicating a strong
correlation between a student’s performance on an item and the student’s total score with the
respective item removed from the total score.
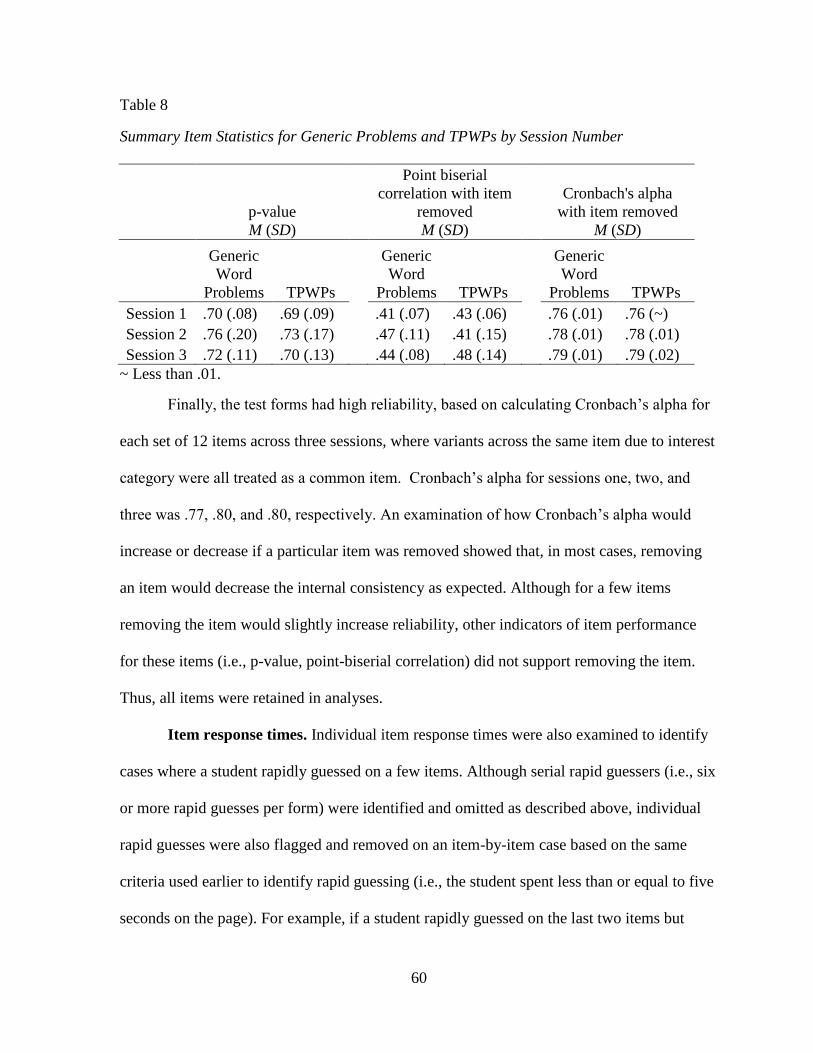
60
Table 8
Summary Item Statistics for Generic Problems and TPWPs by Session Number
p-value
M (SD)
Point biserial
correlation with item
removed
M (SD)
Cronbach's alpha
with item removed
M (SD)
Generic
Word
Problems TPWPs
Generic
Word
Problems TPWPs
Generic
Word
Problems TPWPs
Session 1 .70 (.08) .69 (.09)
.41 (.07) .43 (.06)
.76 (.01) .76 (~)
Session 2 .76 (.20) .73 (.17)
.47 (.11) .41 (.15)
.78 (.01) .78 (.01)
Session 3 .72 (.11) .70 (.13) .44 (.08) .48 (.14) .79 (.01) .79 (.02)
~ Less than .01.
Finally, the test forms had high reliability, based on calculating Cronbach’s alpha for
each set of 12 items across three sessions, where variants across the same item due to interest
category were all treated as a common item. Cronbach’s alpha for sessions one, two, and
three was .77, .80, and .80, respectively. An examination of how Cronbach’s alpha would
increase or decrease if a particular item was removed showed that, in most cases, removing
an item would decrease the internal consistency as expected. Although for a few items
removing the item would slightly increase reliability, other indicators of item performance
for these items (i.e., p-value, point-biserial correlation) did not support removing the item.
Thus, all items were retained in analyses.
Item response times. Individual item response times were also examined to identify
cases where a student rapidly guessed on a few items. Although serial rapid guessers (i.e., six
or more rapid guesses per form) were identified and omitted as described above, individual
rapid guesses were also flagged and removed on an item-by-item case based on the same
criteria used earlier to identify rapid guessing (i.e., the student spent less than or equal to five
seconds on the page). For example, if a student rapidly guessed on the last two items but
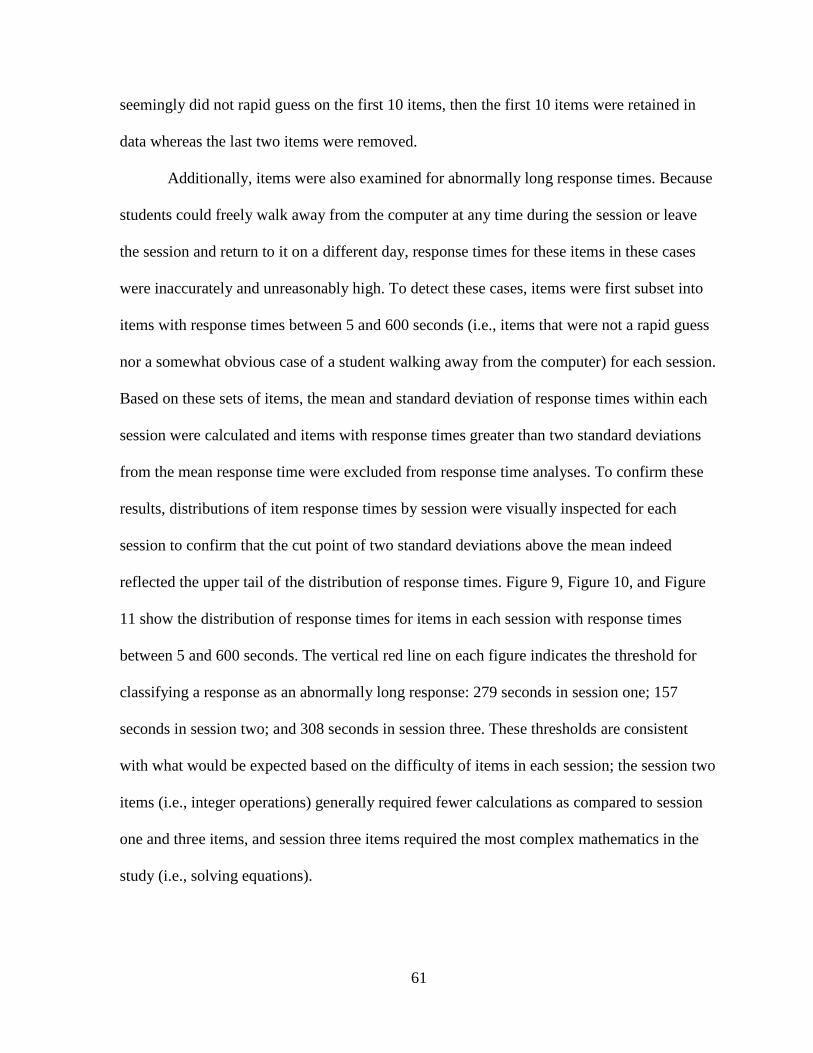
61
seemingly did not rapid guess on the first 10 items, then the first 10 items were retained in
data whereas the last two items were removed.
Additionally, items were also examined for abnormally long response times. Because
students could freely walk away from the computer at any time during the session or leave
the session and return to it on a different day, response times for these items in these cases
were inaccurately and unreasonably high. To detect these cases, items were first subset into
items with response times between 5 and 600 seconds (i.e., items that were not a rapid guess
nor a somewhat obvious case of a student walking away from the computer) for each session.
Based on these sets of items, the mean and standard deviation of response times within each
session were calculated and items with response times greater than two standard deviations
from the mean response time were excluded from response time analyses. To confirm these
results, distributions of item response times by session were visually inspected for each
session to confirm that the cut point of two standard deviations above the mean indeed
reflected the upper tail of the distribution of response times. Figure 9, Figure 10, and Figure
11 show the distribution of response times for items in each session with response times
between 5 and 600 seconds. The vertical red line on each figure indicates the threshold for
classifying a response as an abnormally long response: 279 seconds in session one; 157
seconds in session two; and 308 seconds in session three. These thresholds are consistent
with what would be expected based on the difficulty of items in each session; the session two
items (i.e., integer operations) generally required fewer calculations as compared to session
one and three items, and session three items required the most complex mathematics in the
study (i.e., solving equations).
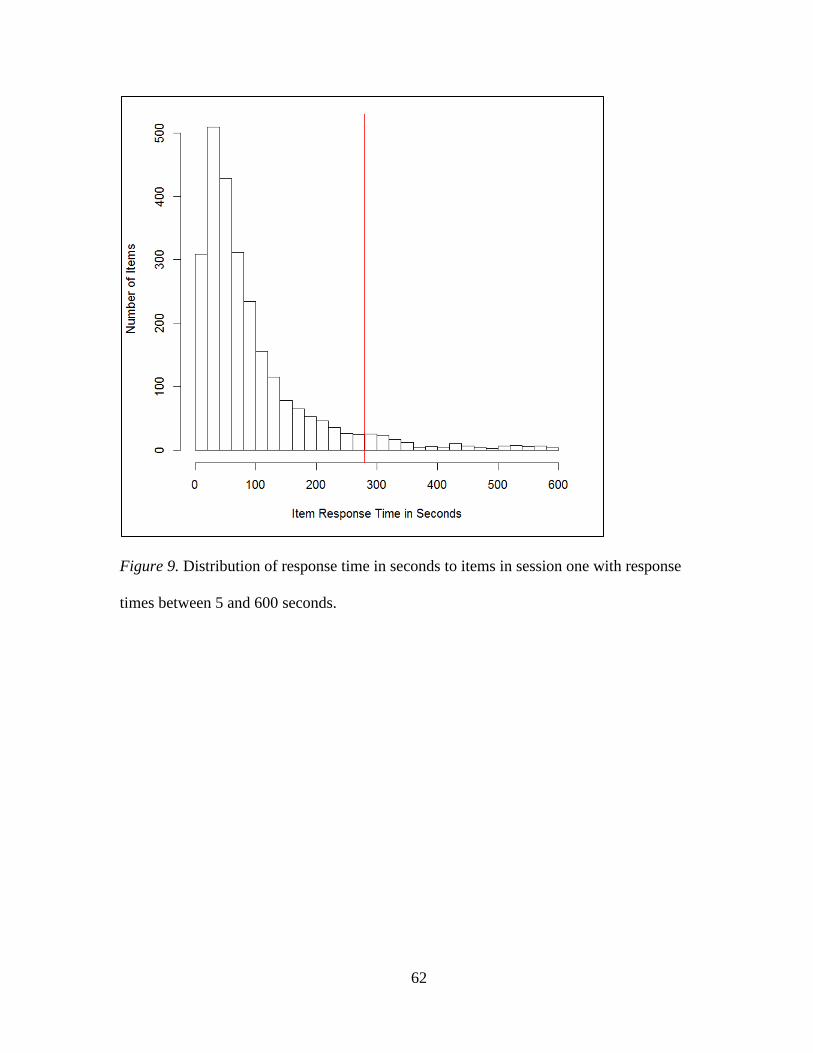
62
Figure 9. Distribution of response time in seconds to items in session one with response
times between 5 and 600 seconds.
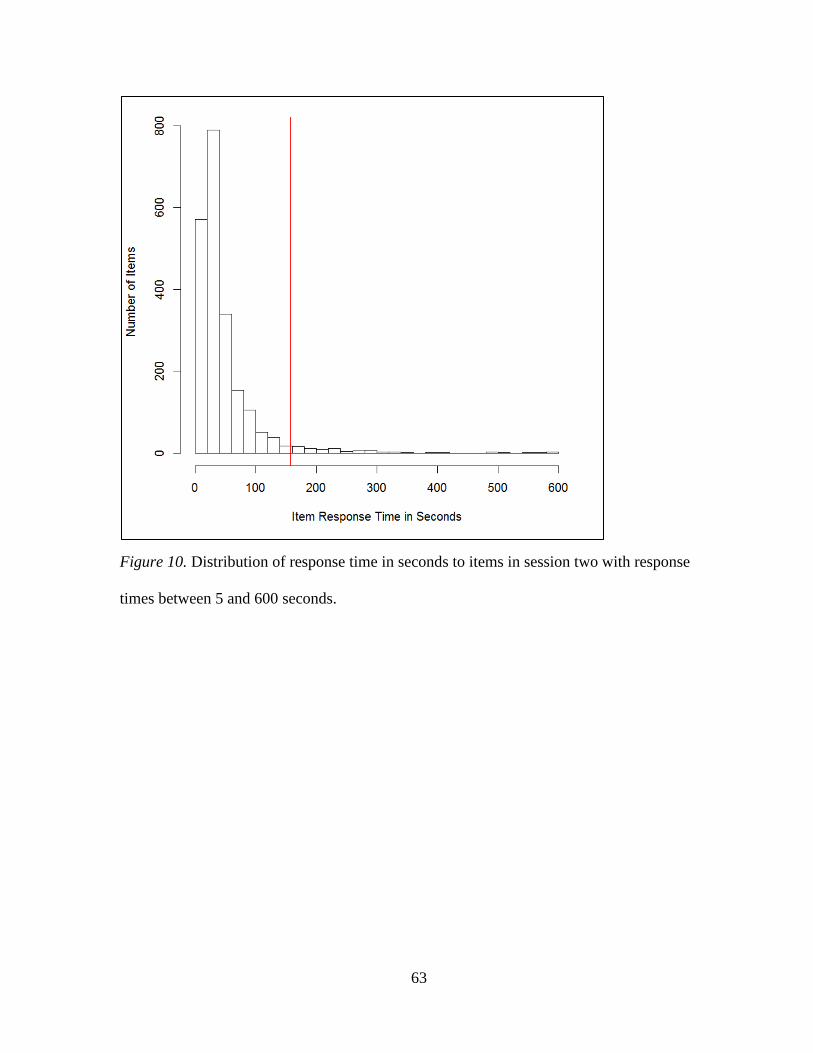
63
Figure 10. Distribution of response time in seconds to items in session two with response
times between 5 and 600 seconds.
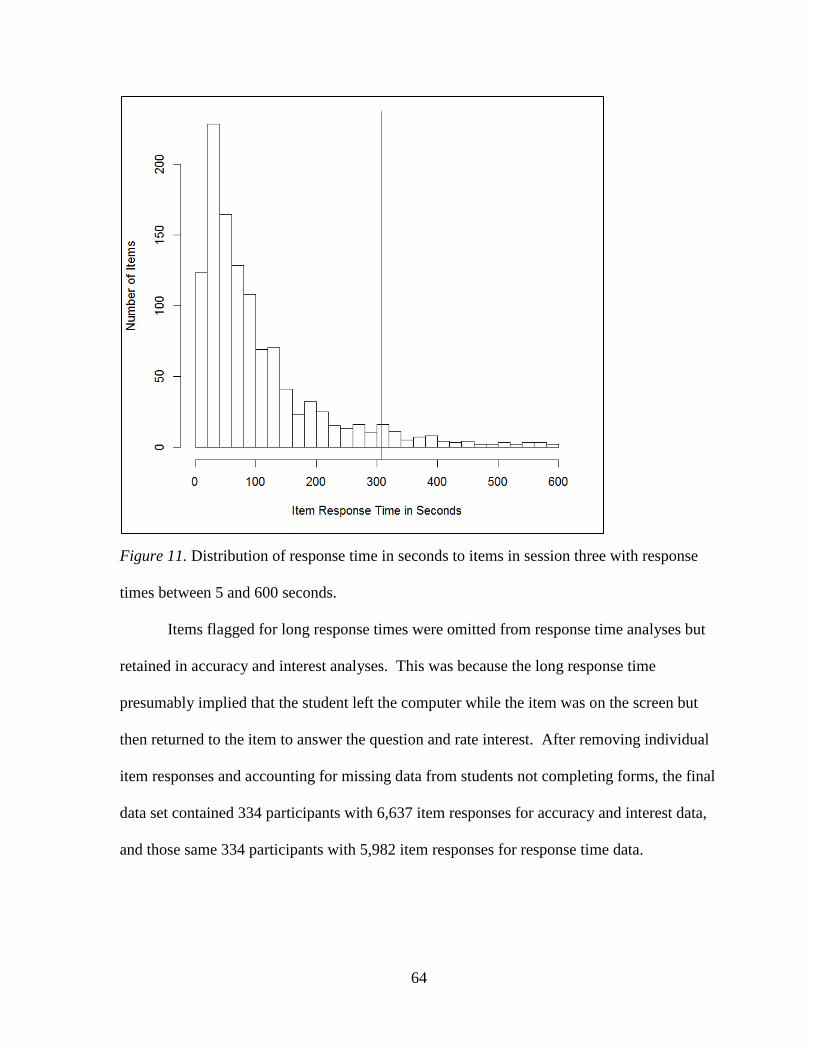
64
Figure 11. Distribution of response time in seconds to items in session three with response
times between 5 and 600 seconds.
Items flagged for long response times were omitted from response time analyses but
retained in accuracy and interest analyses. This was because the long response time
presumably implied that the student left the computer while the item was on the screen but
then returned to the item to answer the question and rate interest. After removing individual
item responses and accounting for missing data from students not completing forms, the final
data set contained 334 participants with 6,637 item responses for accuracy and interest data,
and those same 334 participants with 5,982 item responses for response time data.
65
Data Analysis
For RQ1 (”Are rising eighth-graders more likely to rate TPWPs as interesting as
compared to matched generic word problems?”) data were analyzed with a multilevel logistic
model, with items nested in student, where the dependent variable was whether the student
rated the problem as interesting or not and the independent variable of interest was whether
the item was a TPWP or a generic word problem. For RQ2 (”Are rising eighth-graders more
likely to answer TPWPs correctly as compared to matched generic word problems” and
”How do students’ interest ratings of problems relate to the likelihood of answering the
problem correctly?”) data were analyzed with a similar multilevel logistic model to that in
RQ1, where the student’s scored response (i.e., correct or incorrect) was the dependent
variable and the independent variables of interest were whether the item was a TPWP or a
generic word problem and whether the student rated the item as interesting or not. For RQ3
(“Do rising eighth-graders spend more or less time solving a TPWP as compared to a
matched generic problem?” and “How does amount of time solving each type of problem
relate to mathematical accuracy?”) data were analyzed with a multilevel linear model where
response time in seconds was the dependent variable. Again, the independent variable of
interest was whether or not the item was a TPWP or a generic word problem. For the second
part of RQ3 (“How does amount of time solving each type of problem relate to mathematical
accuracy?), the student’s score on the item was included as an independent variable to
determine how score related to response time.
For all three research questions, several control variables were included in models to
account for the type of content in the item (i.e., rates and ratios, integer operations, or
equations and inequalities), students’ perceived ability level, whether the item was answered

66
correctly or not, and several different types of interactions between these variables. Because
of variation in text complexity of the stems as described above, two control variables for text
complexity (i.e., Lexile measure of stem and number of words in stem) were also considered
in analyses. Table 9 describes the variables used and specifies whether the variable was
independent, dependent, or not included in each of the three research questions. R Version
3.3.1 was used for data preparation (e.g., item scoring, identifying rapid guesses) and
calculations of descriptive statistics and item statistics. Multilevel modeling was conducted
in HLM 7.
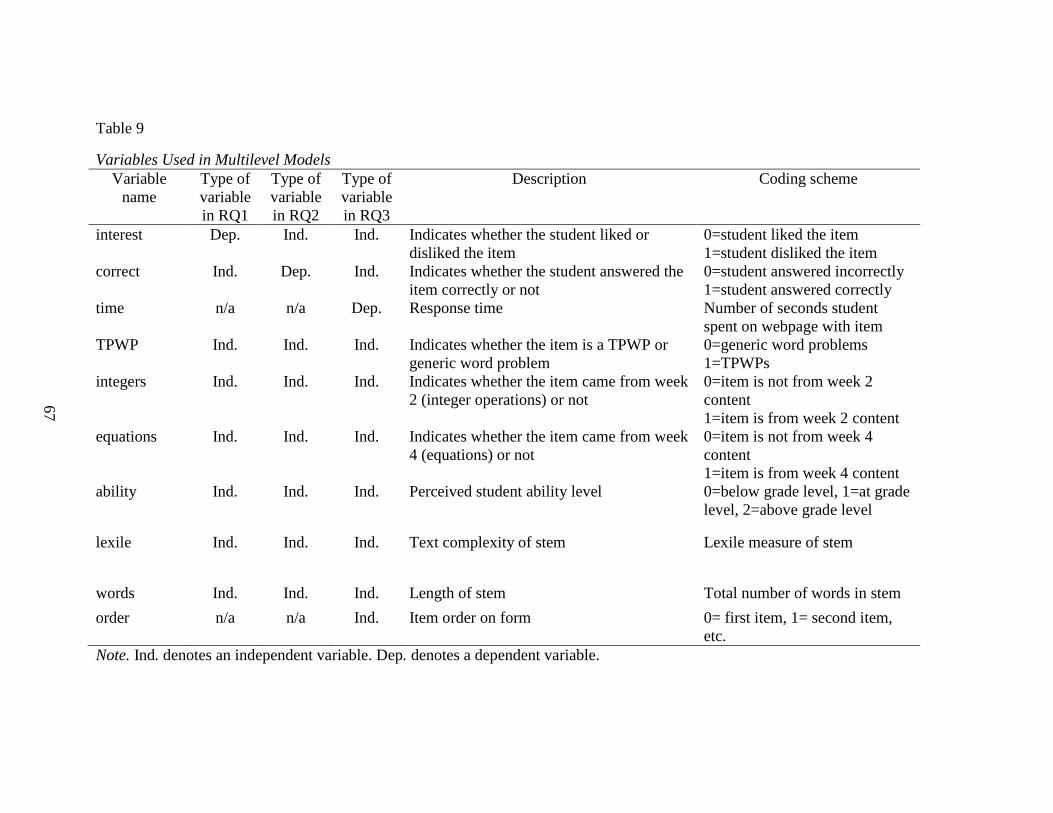
Table 9
Variables Used in Multilevel Models
Variable
name
Type of
variable
in RQ1
Type of
variable
in RQ2
Type of
variable
in RQ3
Description Coding scheme
interest Dep. Ind. Ind. Indicates whether the student liked or
disliked the item
0=student liked the item
1=student disliked the item
correct Ind. Dep. Ind. Indicates whether the student answered the
item correctly or not
0=student answered incorrectly
1=student answered correctly
time n/a n/a Dep. Response time Number of seconds student
spent on webpage with item
TPWP Ind. Ind. Ind. Indicates whether the item is a TPWP or
generic word problem
0=generic word problems
1=TPWPs
integers Ind. Ind. Ind. Indicates whether the item came from week
2 (integer operations) or not
0=item is not from week 2
content
1=item is from week 2 content
equations Ind. Ind. Ind. Indicates whether the item came from week
4 (equations) or not
0=item is not from week 4
content
1=item is from week 4 content
ability Ind. Ind. Ind. Perceived student ability level 0=below grade level, 1=at grade
level, 2=above grade level
lexile Ind. Ind. Ind. Text complexity of stem Lexile measure of stem
words Ind. Ind. Ind. Length of stem Total number of words in stem
order n/a n/a Ind. Item order on form 0= first item, 1= second item,
etc.
Note. Ind. denotes an independent variable. Dep. denotes a dependent variable.
67
68
Summary
Using a within-subjects design, 334 rising eighth-graders were administered roughly
6,000 TPWPs and generic word problems in the context of a free, publically-availably online
summer mathematics program. Problems were grouped into sets of 12 items – 6 TPWPs and
6 generic word problems – once a week for three weeks related to the content standards of
rates and ratios, integer operations, and equations and inequalities. Items were administered
through a computer-based test whereby students first completed an interest questionnaire and
then were routed to an appropriate form consisting of half TPWPs and half generic items in
alternating order, with counterbalancing such that roughly half of the forms administered a
TPWP first and the other half administered a generic word problem first. Data were analyzed
with a multilevel logistic model for RQ2 and RQ3 and with a multilevel linear model for
RQ3.
69
Chapter 4: Results
This chapter presents results of students’ interest in TPWPs and student performance
on TPWPs in terms of accuracy and speed of responses as compared to generic word
problems. First, descriptive statistics for variables used in multilevel models are presented,
followed by the null, full, and final models for each of the three research questions. The
chapter concludes with a power analysis.
Descriptive Statistics
Table 10 shows descriptive statistics for the variables used in multilevel models, with
the omission of the variables equations and integers as those variables were dummy coded to
reflect the data collection session. Because the variables correct and interest are coded as
zero or one, the mean of those variables is the percent of participants answering the item
correctly or rating the item as interesting, respectively. Thus, as seen in Table 10, the
descriptive statistics indicated that students answered 71% of items correctly and rated 70%
of items as interesting. By intentional design of the research study, 50% of items in the study
were TPWPs, hence a mean of .50 for tpwp. The mean Lexile level of items was 779L,
which corresponds to typical student reading ability estimates for students in grades four
through seven as quantified by norm-referenced ranges of Lexile levels measured during the
middle of the school year for readers falling between the 25th
and 75th
percentile of their
grade level (MetaMetrics, Inc., 2016). Because students in this study had completed grade
seven, the text demand of the items in the study was generally less than the expected reader
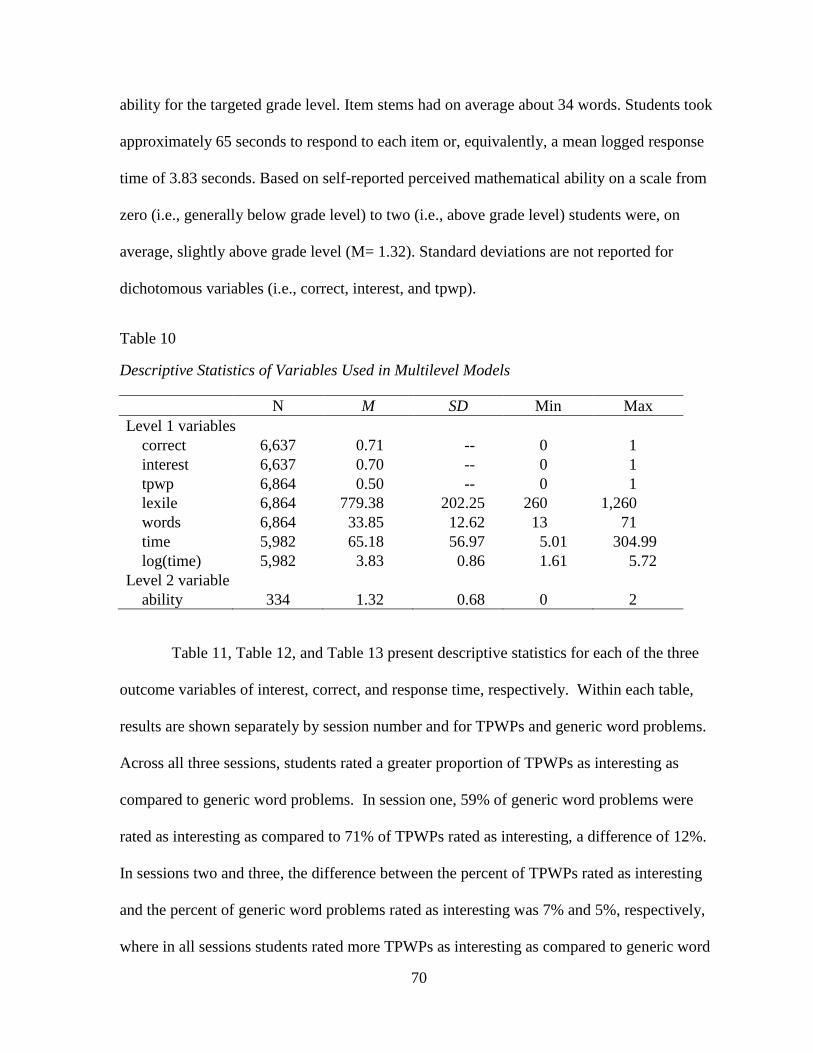
70
ability for the targeted grade level. Item stems had on average about 34 words. Students took
approximately 65 seconds to respond to each item or, equivalently, a mean logged response
time of 3.83 seconds. Based on self-reported perceived mathematical ability on a scale from
zero (i.e., generally below grade level) to two (i.e., above grade level) students were, on
average, slightly above grade level (M= 1.32). Standard deviations are not reported for
dichotomous variables (i.e., correct, interest, and tpwp).
Table 10
Descriptive Statistics of Variables Used in Multilevel Models
N M SD Min Max
Level 1 variables
correct 6,637 0.71 -- 0 1
interest 6,637 0.70 -- 0 1
tpwp 6,864 0.50 -- 0 1
lexile 6,864 779.38 202.25 260 1,260
words 6,864 33.85 12.62 13 71
time 5,982 65.18 56.97 5.01 304.99
log(time) 5,982 3.83 0.86 1.61 5.72
Level 2 variable
ability 334 1.32 0.68 0 2
Table 11, Table 12, and Table 13 present descriptive statistics for each of the three
outcome variables of interest, correct, and response time, respectively. Within each table,
results are shown separately by session number and for TPWPs and generic word problems.
Across all three sessions, students rated a greater proportion of TPWPs as interesting as
compared to generic word problems. In session one, 59% of generic word problems were
rated as interesting as compared to 71% of TPWPs rated as interesting, a difference of 12%.
In sessions two and three, the difference between the percent of TPWPs rated as interesting
and the percent of generic word problems rated as interesting was 7% and 5%, respectively,
where in all sessions students rated more TPWPs as interesting as compared to generic word
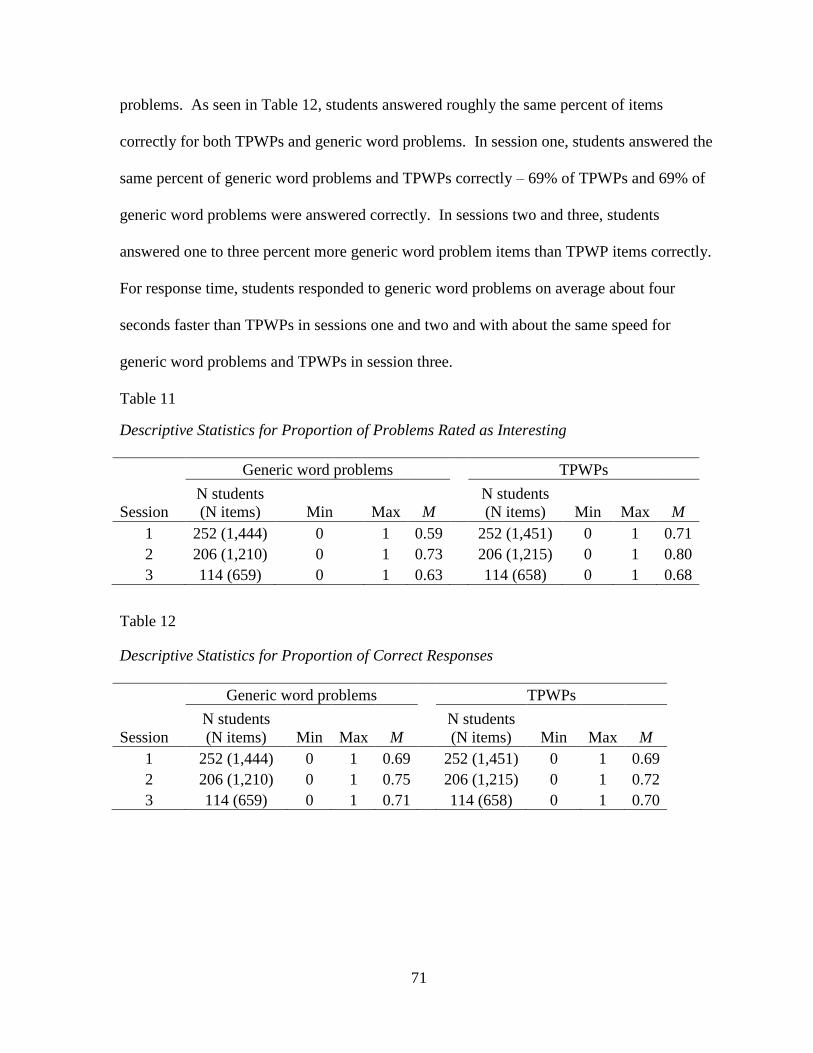
71
problems. As seen in Table 12, students answered roughly the same percent of items
correctly for both TPWPs and generic word problems. In session one, students answered the
same percent of generic word problems and TPWPs correctly – 69% of TPWPs and 69% of
generic word problems were answered correctly. In sessions two and three, students
answered one to three percent more generic word problem items than TPWP items correctly.
For response time, students responded to generic word problems on average about four
seconds faster than TPWPs in sessions one and two and with about the same speed for
generic word problems and TPWPs in session three.
Table 11
Descriptive Statistics for Proportion of Problems Rated as Interesting
Generic word problems TPWPs
Session
N students
(N items) Min Max M
N students
(N items) Min Max M
1 252 (1,444) 0 1 0.59
252 (1,451) 0 1 0.71
2 206 (1,210) 0 1 0.73
206 (1,215) 0 1 0.80
3 114 (659) 0 1 0.63 114 (658) 0 1 0.68
Table 12
Descriptive Statistics for Proportion of Correct Responses
Generic word problems TPWPs
Session
N students
(N items) Min Max M
N students
(N items) Min Max M
1 252 (1,444) 0 1 0.69
252 (1,451) 0 1 0.69
2 206 (1,210) 0 1 0.75
206 (1,215) 0 1 0.72
3 114 (659) 0 1 0.71 114 (658) 0 1 0.70
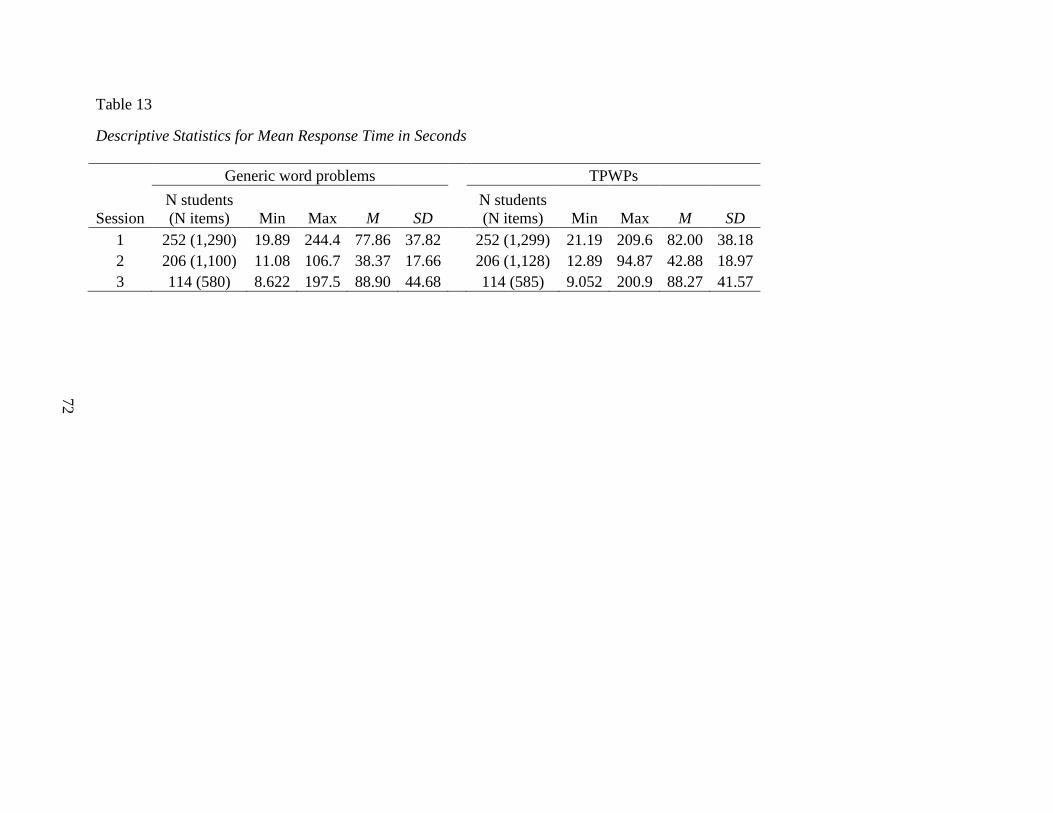
72
Table 13
Descriptive Statistics for Mean Response Time in Seconds
Generic word problems TPWPs
Session
N students
(N items) Min Max M SD
N students
(N items) Min Max M SD
1 252 (1,290) 19.89 244.4 77.86 37.82
252 (1,299) 21.19 209.6 82.00 38.18
2 206 (1,100) 11.08 106.7 38.37 17.66
206 (1,128) 12.89 94.87 42.88 18.97
3 114 (580) 8.622 197.5 88.90 44.68 114 (585) 9.052 200.9 88.27 41.57
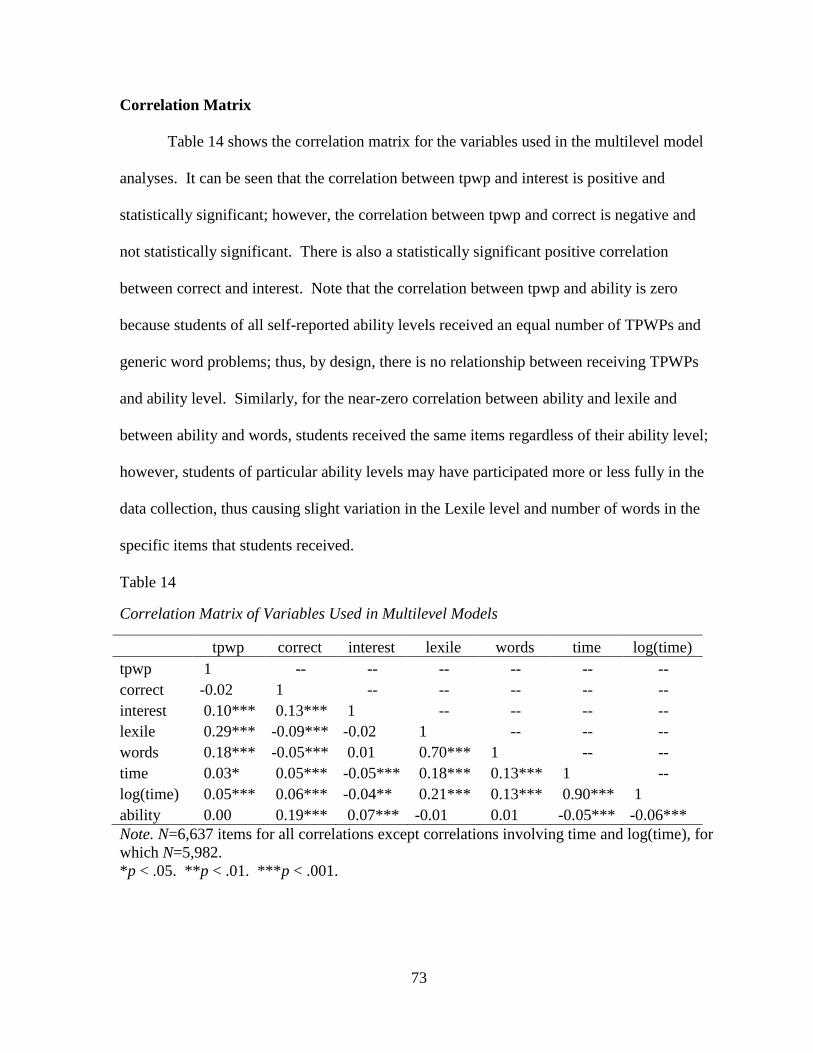
73
Correlation Matrix
Table 14 shows the correlation matrix for the variables used in the multilevel model
analyses. It can be seen that the correlation between tpwp and interest is positive and
statistically significant; however, the correlation between tpwp and correct is negative and
not statistically significant. There is also a statistically significant positive correlation
between correct and interest. Note that the correlation between tpwp and ability is zero
because students of all self-reported ability levels received an equal number of TPWPs and
generic word problems; thus, by design, there is no relationship between receiving TPWPs
and ability level. Similarly, for the near-zero correlation between ability and lexile and
between ability and words, students received the same items regardless of their ability level;
however, students of particular ability levels may have participated more or less fully in the
data collection, thus causing slight variation in the Lexile level and number of words in the
specific items that students received.
Table 14
Correlation Matrix of Variables Used in Multilevel Models
tpwp correct interest lexile words time log(time)
tpwp 1 -- -- -- -- -- --
correct -0.02 1 -- -- -- -- --
interest 0.10*** 0.13*** 1 -- -- -- --
lexile 0.29*** -0.09*** -0.02 1 -- -- --
words 0.18*** -0.05*** 0.01 0.70*** 1 -- --
time 0.03* 0.05*** -0.05*** 0.18*** 0.13*** 1 --
log(time) 0.05*** 0.06*** -0.04** 0.21*** 0.13*** 0.90*** 1
ability 0.00 0.19*** 0.07*** -0.01 0.01 -0.05*** -0.06***
Note. N=6,637 items for all correlations except correlations involving time and log(time), for
which N=5,982.
*p < .05. **p < .01. ***p < .001.
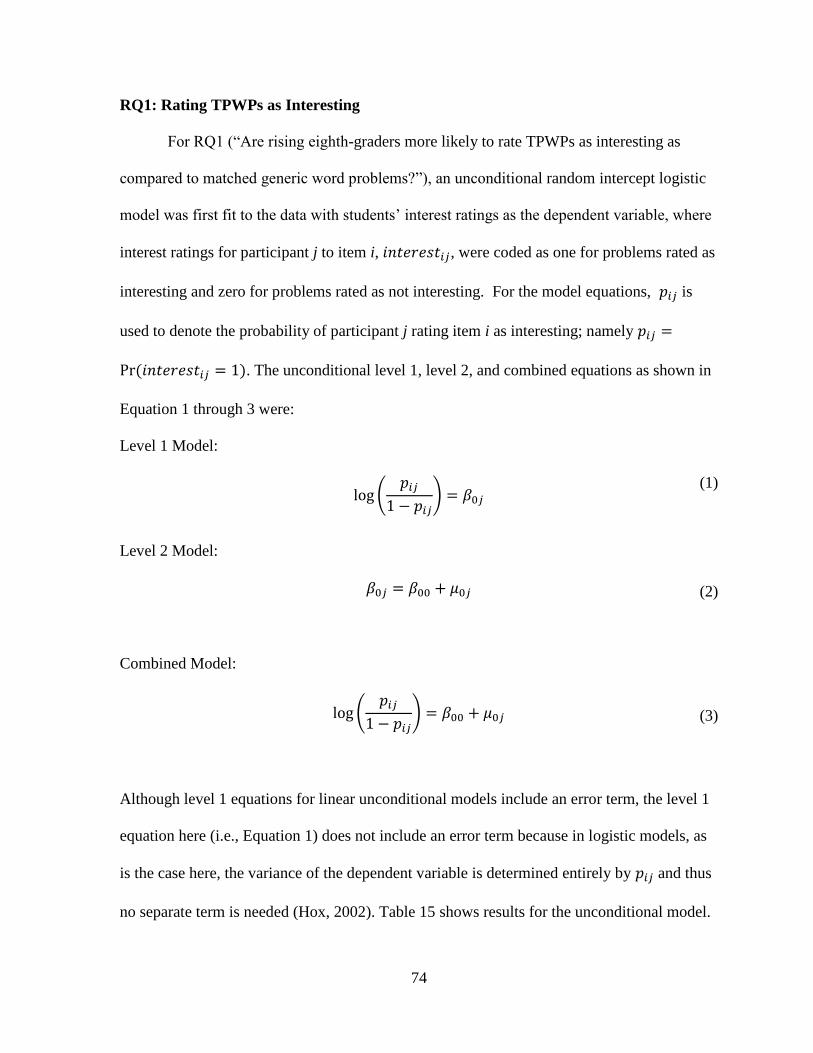
74
RQ1: Rating TPWPs as Interesting
For RQ1 (“Are rising eighth-graders more likely to rate TPWPs as interesting as
compared to matched generic word problems?”), an unconditional random intercept logistic
model was first fit to the data with students’ interest ratings as the dependent variable, where
interest ratings for participant j to item i, 𝑖𝑛𝑡𝑒𝑟𝑒𝑠𝑡𝑖𝑗, were coded as one for problems rated as
interesting and zero for problems rated as not interesting. For the model equations, 𝑝𝑖𝑗 is
used to denote the probability of participant j rating item i as interesting; namely 𝑝𝑖𝑗 =
Pr(𝑖𝑛𝑡𝑒𝑟𝑒𝑠𝑡𝑖𝑗 = 1). The unconditional level 1, level 2, and combined equations as shown in
Equation 1 through 3 were:
Level 1 Model:
log (
𝑝𝑖𝑗
1 − 𝑝𝑖𝑗) = 𝛽0𝑗
(1)
Level 2 Model:
𝛽0𝑗 = 𝛽00 + 𝜇0𝑗
(2)
Combined Model:
log (
𝑝𝑖𝑗
1 − 𝑝𝑖𝑗) = 𝛽00 + 𝜇0𝑗
(3)
Although level 1 equations for linear unconditional models include an error term, the level 1
equation here (i.e., Equation 1) does not include an error term because in logistic models, as
is the case here, the variance of the dependent variable is determined entirely by 𝑝𝑖𝑗 and thus
no separate term is needed (Hox, 2002). Table 15 shows results for the unconditional model.
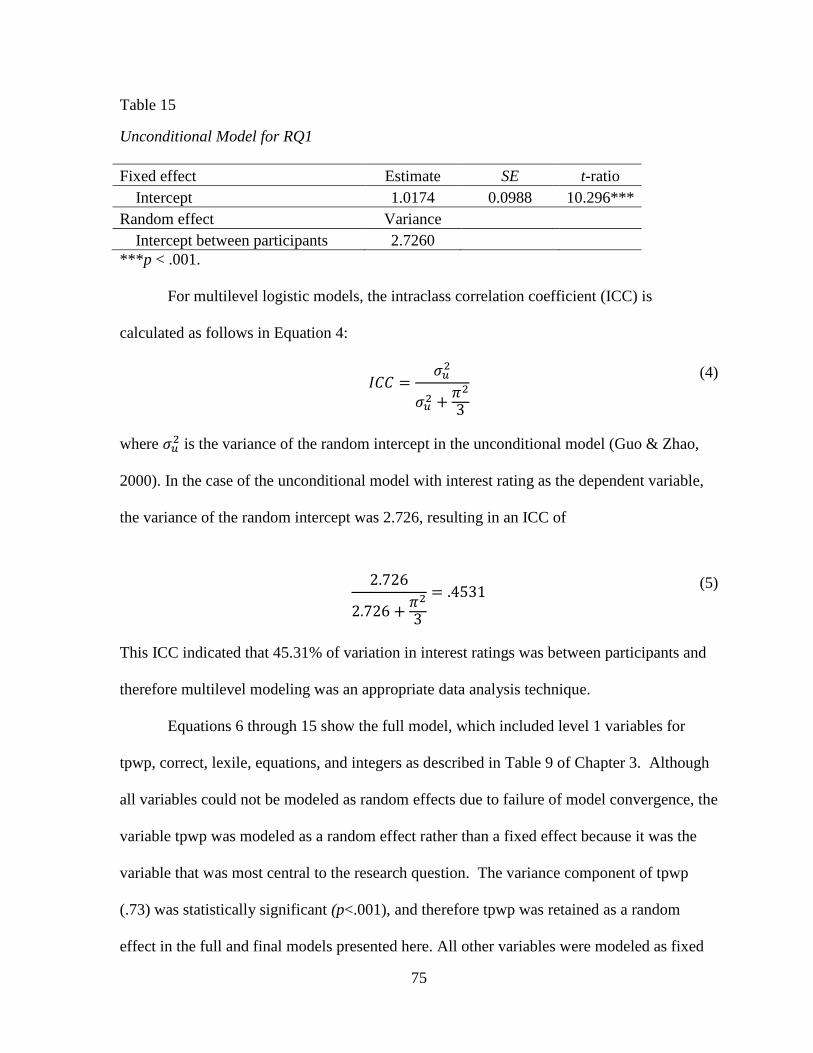
75
Table 15
Unconditional Model for RQ1
Fixed effect Estimate SE t-ratio
Intercept 1.0174 0.0988 10.296***
Random effect Variance
Intercept between participants 2.7260
***p < .001.
For multilevel logistic models, the intraclass correlation coefficient (ICC) is
calculated as follows in Equation 4:
𝐼𝐶𝐶 =
𝜎𝑢2
𝜎𝑢2 +𝜋2
3
(4)
where 𝜎𝑢2 is the variance of the random intercept in the unconditional model (Guo & Zhao,
2000). In the case of the unconditional model with interest rating as the dependent variable,
the variance of the random intercept was 2.726, resulting in an ICC of
2.726
2.726 +𝜋2
3
= .4531 (5)
This ICC indicated that 45.31% of variation in interest ratings was between participants and
therefore multilevel modeling was an appropriate data analysis technique.
Equations 6 through 15 show the full model, which included level 1 variables for
tpwp, correct, lexile, equations, and integers as described in Table 9 of Chapter 3. Although
all variables could not be modeled as random effects due to failure of model convergence, the
variable tpwp was modeled as a random effect rather than a fixed effect because it was the
variable that was most central to the research question. The variance component of tpwp
(.73) was statistically significant (p<.001), and therefore tpwp was retained as a random
effect in the full and final models presented here. All other variables were modeled as fixed
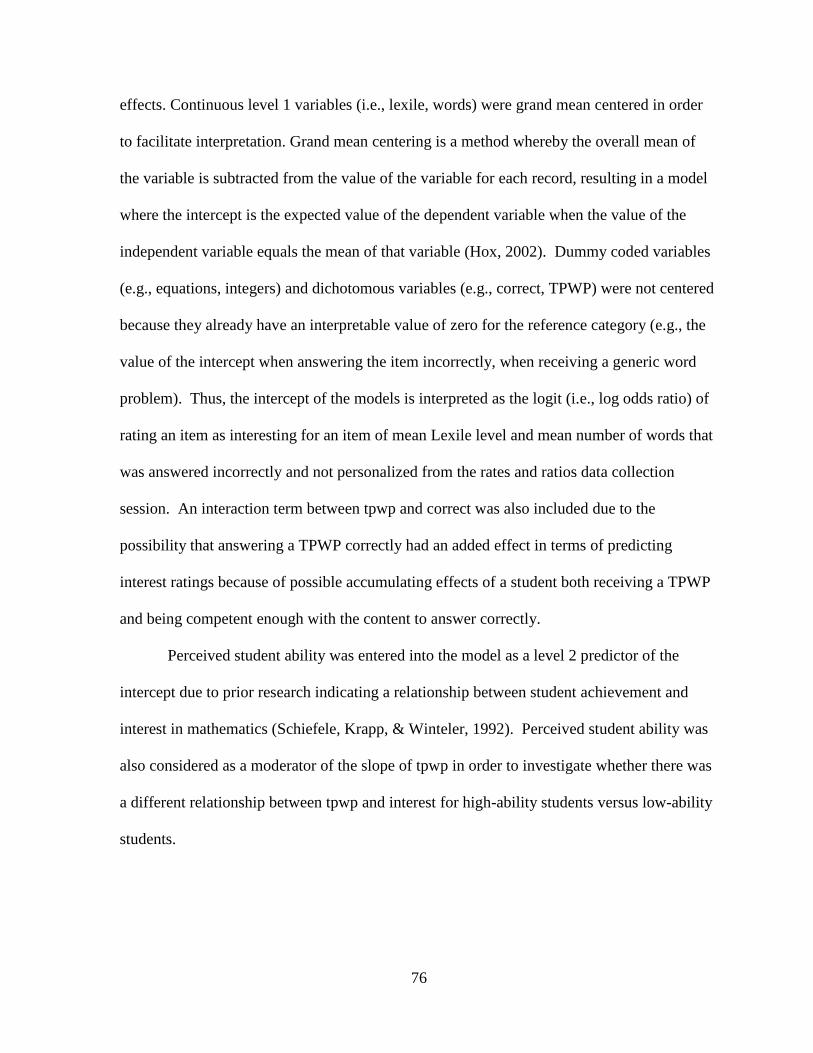
76
effects. Continuous level 1 variables (i.e., lexile, words) were grand mean centered in order
to facilitate interpretation. Grand mean centering is a method whereby the overall mean of
the variable is subtracted from the value of the variable for each record, resulting in a model
where the intercept is the expected value of the dependent variable when the value of the
independent variable equals the mean of that variable (Hox, 2002). Dummy coded variables
(e.g., equations, integers) and dichotomous variables (e.g., correct, TPWP) were not centered
because they already have an interpretable value of zero for the reference category (e.g., the
value of the intercept when answering the item incorrectly, when receiving a generic word
problem). Thus, the intercept of the models is interpreted as the logit (i.e., log odds ratio) of
rating an item as interesting for an item of mean Lexile level and mean number of words that
was answered incorrectly and not personalized from the rates and ratios data collection
session. An interaction term between tpwp and correct was also included due to the
possibility that answering a TPWP correctly had an added effect in terms of predicting
interest ratings because of possible accumulating effects of a student both receiving a TPWP
and being competent enough with the content to answer correctly.
Perceived student ability was entered into the model as a level 2 predictor of the
intercept due to prior research indicating a relationship between student achievement and
interest in mathematics (Schiefele, Krapp, & Winteler, 1992). Perceived student ability was
also considered as a moderator of the slope of tpwp in order to investigate whether there was
a different relationship between tpwp and interest for high-ability students versus low-ability
students.

77
Level 1 Model:
log (𝑝𝑖𝑗
1−𝑝𝑖𝑗)= π0i + π1i*(correctti) + π2i*(tpwpti) + π3i*(correct*tpwpti)
+ π4i*(lexileti) + π5i*(wordsti) + π6i*(equationsti) + π7i*(integersti)
(6)
Level 2 Model:
π0i = β00 + β01*(abilityi) + r0i (7)
π1i = β10 (8)
π2i = β20 + β21*(abilityi) + r2i (9)
π3i = β30 (10)
π4i = β40 (11)
π5i = β50 (12)
π6i = β60 (13)
π7i = β70 (14)
Combined Model:
log (𝑝𝑖𝑗
1−𝑝𝑖𝑗)= β00 + β01*abilityi + β10*correctti + β20*tpwpti
+ β21*abilityi*tpwpti +β30*correct*tpwpti + β40*lexileti
+ β50*wordsti + β60*equationsti + β70*integersti + r0i + r2i*tpwpti
(15)
Results from multilevel logistic models produced five outputs for each variable in the
model: 1) an estimate of the change in the dependent variable (i.e., change in logits) for each
change of one unit in the independent variable, 2) the standard error of the estimate, 3) a t-
ratio calculated as the estimate divided by the standard error, 4) a p-value for the t-ratio, and
5) the odds ratio, which is the exponentiated value of the estimate (i.e., if the estimate is x,
then the odds ratio is ex where e is the base of the natural logarithm) and defined as the ratio
of the odds of an event under a particular exposure (e.g., treatment condition) to the odds of
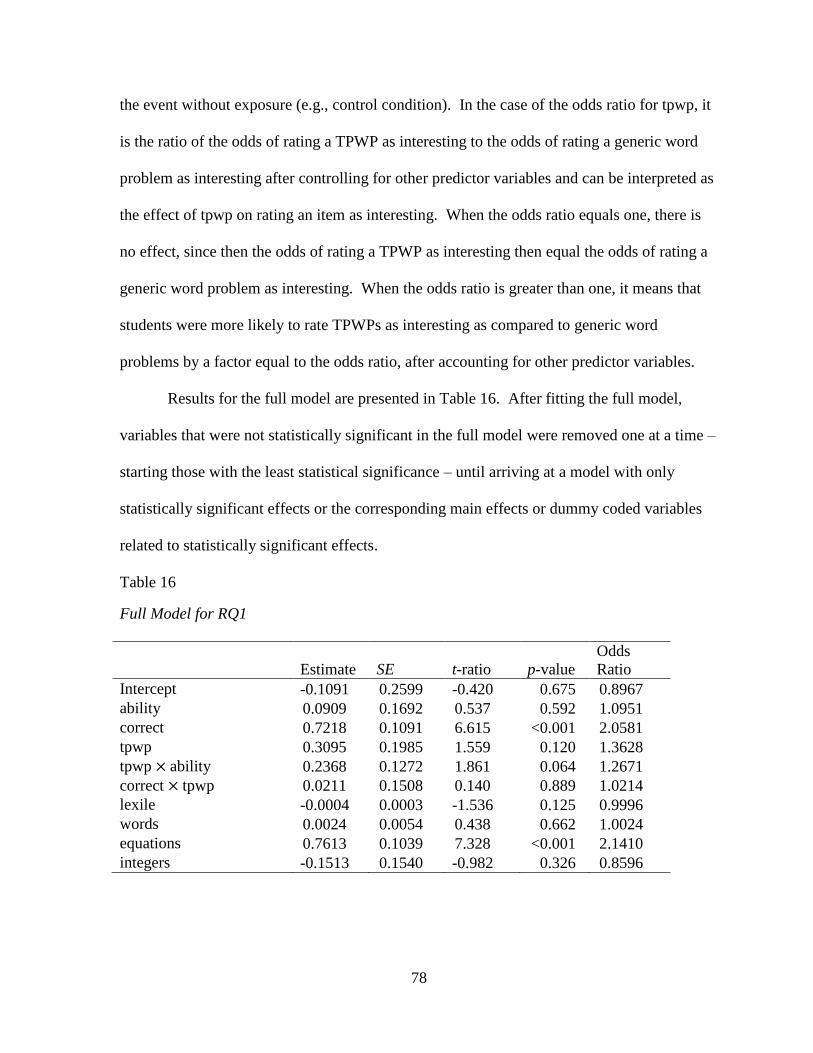
78
the event without exposure (e.g., control condition). In the case of the odds ratio for tpwp, it
is the ratio of the odds of rating a TPWP as interesting to the odds of rating a generic word
problem as interesting after controlling for other predictor variables and can be interpreted as
the effect of tpwp on rating an item as interesting. When the odds ratio equals one, there is
no effect, since then the odds of rating a TPWP as interesting then equal the odds of rating a
generic word problem as interesting. When the odds ratio is greater than one, it means that
students were more likely to rate TPWPs as interesting as compared to generic word
problems by a factor equal to the odds ratio, after accounting for other predictor variables.
Results for the full model are presented in Table 16. After fitting the full model,
variables that were not statistically significant in the full model were removed one at a time –
starting those with the least statistical significance – until arriving at a model with only
statistically significant effects or the corresponding main effects or dummy coded variables
related to statistically significant effects.
Table 16
Full Model for RQ1
Estimate SE t-ratio p-value
Odds
Ratio
Intercept -0.1091 0.2599 -0.420 0.675 0.8967
ability 0.0909 0.1692 0.537 0.592 1.0951
correct 0.7218 0.1091 6.615 <0.001 2.0581
tpwp 0.3095 0.1985 1.559 0.120 1.3628
tpwp×ability 0.2368 0.1272 1.861 0.064 1.2671
correct×tpwp 0.0211 0.1508 0.140 0.889 1.0214
lexile -0.0004 0.0003 -1.536 0.125 0.9996
words 0.0024 0.0054 0.438 0.662 1.0024
equations 0.7613 0.1039 7.328 <0.001 2.1410
integers -0.1513 0.1540 -0.982 0.326 0.8596
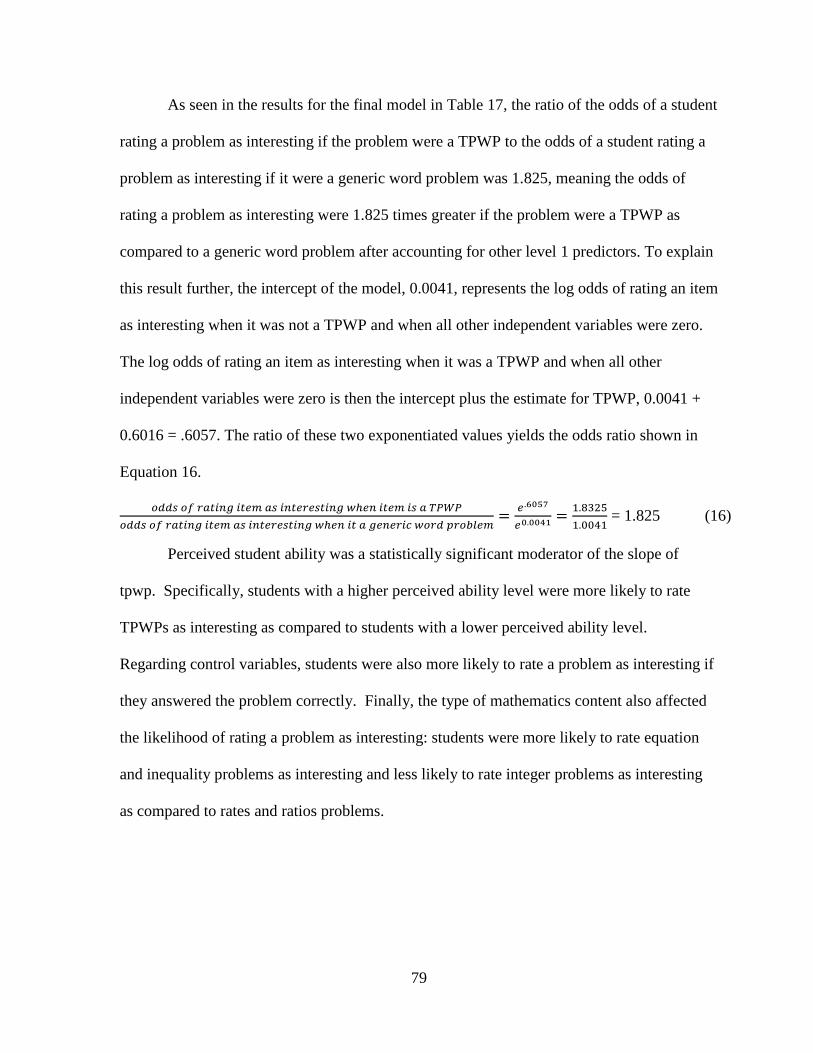
79
As seen in the results for the final model in Table 17, the ratio of the odds of a student
rating a problem as interesting if the problem were a TPWP to the odds of a student rating a
problem as interesting if it were a generic word problem was 1.825, meaning the odds of
rating a problem as interesting were 1.825 times greater if the problem were a TPWP as
compared to a generic word problem after accounting for other level 1 predictors. To explain
this result further, the intercept of the model, 0.0041, represents the log odds of rating an item
as interesting when it was not a TPWP and when all other independent variables were zero.
The log odds of rating an item as interesting when it was a TPWP and when all other
independent variables were zero is then the intercept plus the estimate for TPWP, 0.0041 +
0.6016 = .6057. The ratio of these two exponentiated values yields the odds ratio shown in
Equation 16.
𝑜𝑑𝑑𝑠𝑜𝑓𝑟𝑎𝑡𝑖𝑛𝑔𝑖𝑡𝑒𝑚𝑎𝑠𝑖𝑛𝑡𝑒𝑟𝑒𝑠𝑡𝑖𝑛𝑔𝑤ℎ𝑒𝑛𝑖𝑡𝑒𝑚𝑖𝑠𝑎𝑇𝑃𝑊𝑃
𝑜𝑑𝑑𝑠𝑜𝑓𝑟𝑎𝑡𝑖𝑛𝑔𝑖𝑡𝑒𝑚𝑎𝑠𝑖𝑛𝑡𝑒𝑟𝑒𝑠𝑡𝑖𝑛𝑔𝑤ℎ𝑒𝑛𝑖𝑡𝑎𝑔𝑒𝑛𝑒𝑟𝑖𝑐𝑤𝑜𝑟𝑑𝑝𝑟𝑜𝑏𝑙𝑒𝑚=
𝑒 .6057
𝑒0.0041=
1.8325
1.0041 = 1.825 (16)
Perceived student ability was a statistically significant moderator of the slope of
tpwp. Specifically, students with a higher perceived ability level were more likely to rate
TPWPs as interesting as compared to students with a lower perceived ability level.
Regarding control variables, students were also more likely to rate a problem as interesting if
they answered the problem correctly. Finally, the type of mathematics content also affected
the likelihood of rating a problem as interesting: students were more likely to rate equation
and inequality problems as interesting and less likely to rate integer problems as interesting
as compared to rates and ratios problems.
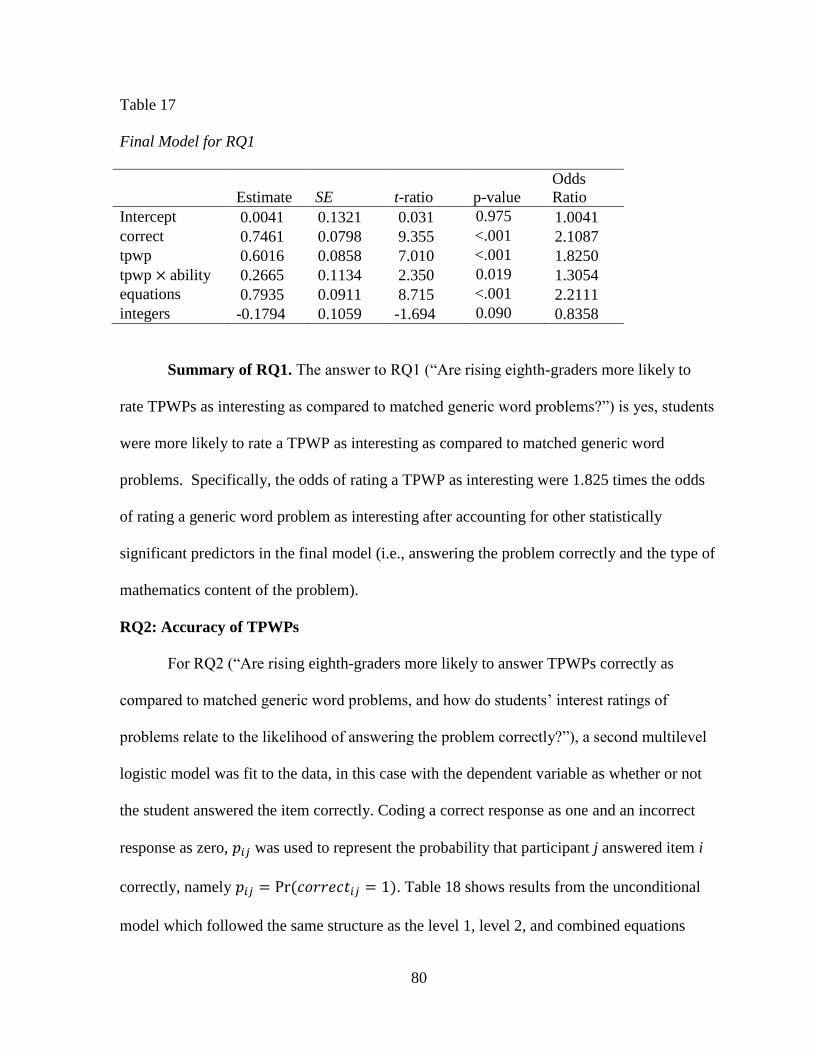
80
Table 17
Final Model for RQ1
Estimate SE t-ratio p-value
Odds
Ratio
Intercept 0.0041 0.1321 0.031 0.975 1.0041
correct 0.7461 0.0798 9.355 <.001 2.1087
tpwp 0.6016 0.0858 7.010 <.001 1.8250
tpwp×ability 0.2665 0.1134 2.350 0.019 1.3054
equations 0.7935 0.0911 8.715 <.001 2.2111
integers -0.1794 0.1059 -1.694 0.090 0.8358
Summary of RQ1. The answer to RQ1 (“Are rising eighth-graders more likely to
rate TPWPs as interesting as compared to matched generic word problems?”) is yes, students
were more likely to rate a TPWP as interesting as compared to matched generic word
problems. Specifically, the odds of rating a TPWP as interesting were 1.825 times the odds
of rating a generic word problem as interesting after accounting for other statistically
significant predictors in the final model (i.e., answering the problem correctly and the type of
mathematics content of the problem).
RQ2: Accuracy of TPWPs
For RQ2 (“Are rising eighth-graders more likely to answer TPWPs correctly as
compared to matched generic word problems, and how do students’ interest ratings of
problems relate to the likelihood of answering the problem correctly?”), a second multilevel
logistic model was fit to the data, in this case with the dependent variable as whether or not
the student answered the item correctly. Coding a correct response as one and an incorrect
response as zero, 𝑝𝑖𝑗 was used to represent the probability that participant j answered item i
correctly, namely 𝑝𝑖𝑗 = Pr(𝑐𝑜𝑟𝑟𝑒𝑐𝑡𝑖𝑗 = 1). Table 18 shows results from the unconditional
model which followed the same structure as the level 1, level 2, and combined equations
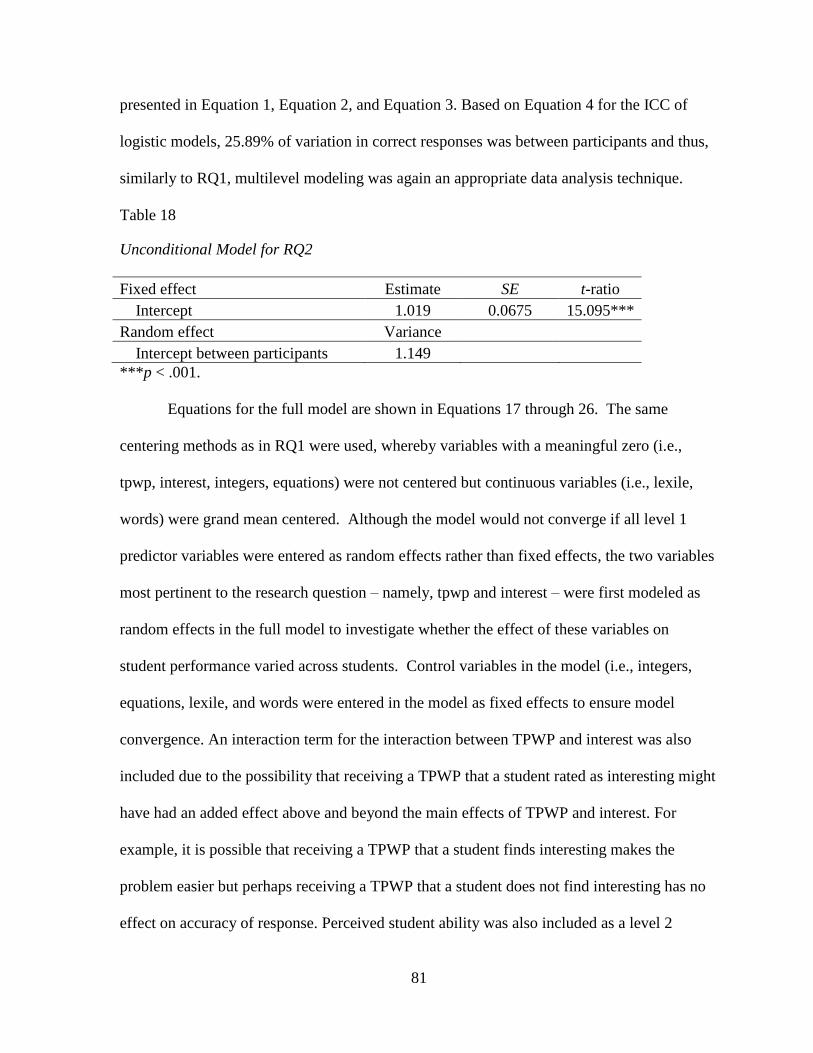
81
presented in Equation 1, Equation 2, and Equation 3. Based on Equation 4 for the ICC of
logistic models, 25.89% of variation in correct responses was between participants and thus,
similarly to RQ1, multilevel modeling was again an appropriate data analysis technique.
Table 18
Unconditional Model for RQ2
Fixed effect Estimate SE t-ratio
Intercept 1.019 0.0675 15.095***
Random effect Variance
Intercept between participants 1.149
***p < .001.
Equations for the full model are shown in Equations 17 through 26. The same
centering methods as in RQ1 were used, whereby variables with a meaningful zero (i.e.,
tpwp, interest, integers, equations) were not centered but continuous variables (i.e., lexile,
words) were grand mean centered. Although the model would not converge if all level 1
predictor variables were entered as random effects rather than fixed effects, the two variables
most pertinent to the research question – namely, tpwp and interest – were first modeled as
random effects in the full model to investigate whether the effect of these variables on
student performance varied across students. Control variables in the model (i.e., integers,
equations, lexile, and words were entered in the model as fixed effects to ensure model
convergence. An interaction term for the interaction between TPWP and interest was also
included due to the possibility that receiving a TPWP that a student rated as interesting might
have had an added effect above and beyond the main effects of TPWP and interest. For
example, it is possible that receiving a TPWP that a student finds interesting makes the
problem easier but perhaps receiving a TPWP that a student does not find interesting has no
effect on accuracy of response. Perceived student ability was also included as a level 2
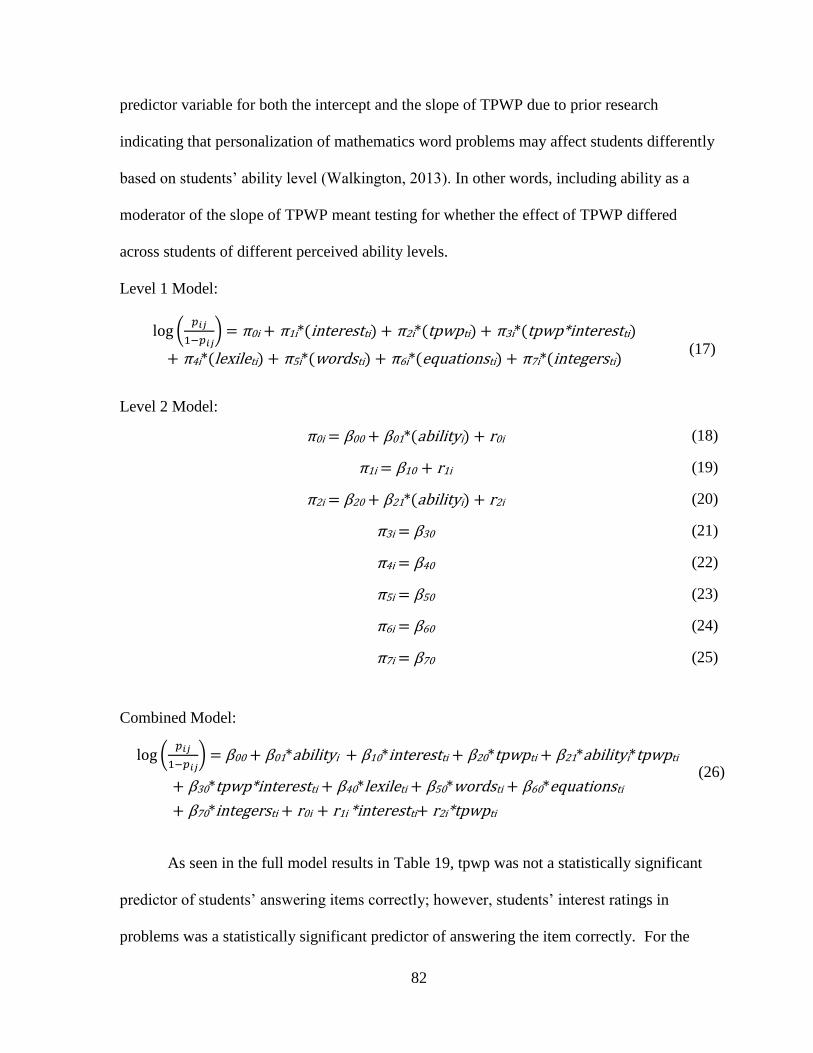
82
predictor variable for both the intercept and the slope of TPWP due to prior research
indicating that personalization of mathematics word problems may affect students differently
based on students’ ability level (Walkington, 2013). In other words, including ability as a
moderator of the slope of TPWP meant testing for whether the effect of TPWP differed
across students of different perceived ability levels.
Level 1 Model:
log (𝑝𝑖𝑗
1−𝑝𝑖𝑗) = π0i + π1i*(interestti) + π2i*(tpwpti) + π3i*(tpwp*interestti)
+ π4i*(lexileti) + π5i*(wordsti) + π6i*(equationsti) + π7i*(integersti)
(17)
Level 2 Model:
π0i = β00 + β01*(abilityi) + r0i (18)
π1i = β10 + r1i (19)
π2i = β20 + β21*(abilityi) + r2i (20)
π3i = β30 (21)
π4i = β40 (22)
π5i = β50 (23)
π6i = β60 (24)
π7i = β70 (25)
Combined Model:
log (𝑝𝑖𝑗
1−𝑝𝑖𝑗) = β00 + β01*abilityi + β10*interestti + β20*tpwpti + β21*abilityi*tpwpti
+ β30*tpwp*interestti + β40*lexileti + β50*wordsti + β60*equationsti
+ β70*integersti + r0i + r1i *interestti+ r2i*tpwpti
(26)
As seen in the full model results in Table 19, tpwp was not a statistically significant
predictor of students’ answering items correctly; however, students’ interest ratings in
problems was a statistically significant predictor of answering the item correctly. For the
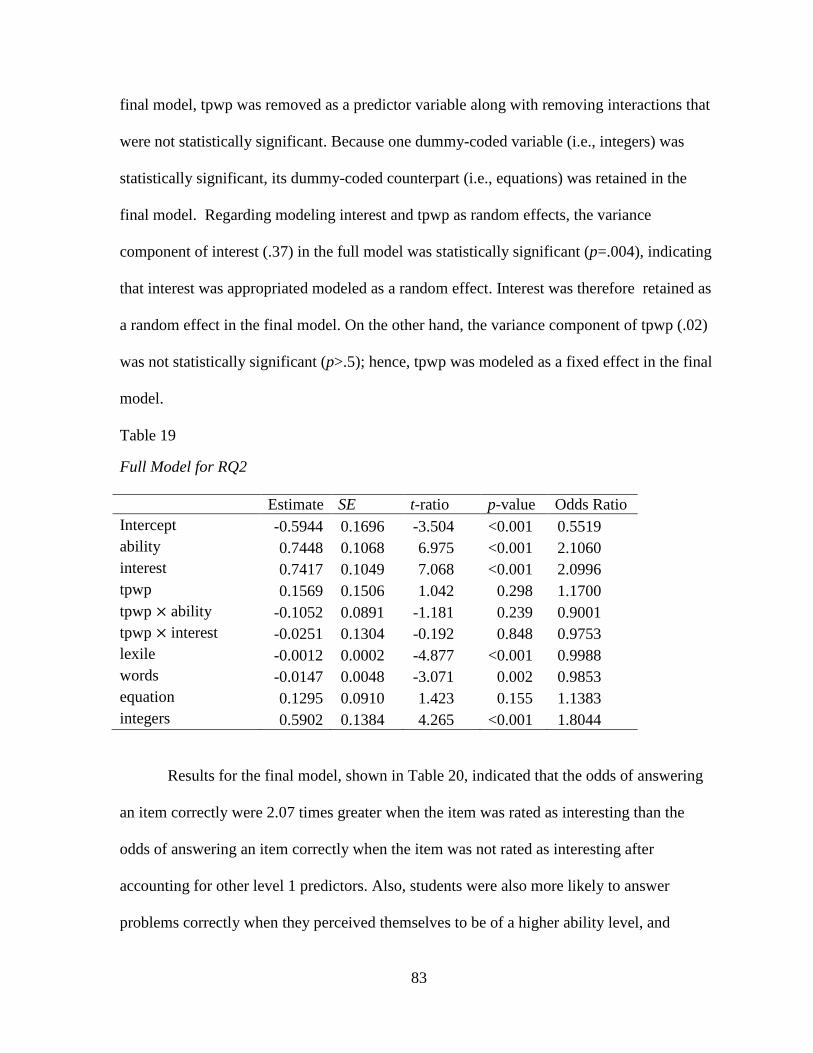
83
final model, tpwp was removed as a predictor variable along with removing interactions that
were not statistically significant. Because one dummy-coded variable (i.e., integers) was
statistically significant, its dummy-coded counterpart (i.e., equations) was retained in the
final model. Regarding modeling interest and tpwp as random effects, the variance
component of interest (.37) in the full model was statistically significant (p=.004), indicating
that interest was appropriated modeled as a random effect. Interest was therefore retained as
a random effect in the final model. On the other hand, the variance component of tpwp (.02)
was not statistically significant (p>.5); hence, tpwp was modeled as a fixed effect in the final
model.
Table 19
Full Model for RQ2
Estimate SE t-ratio p-value Odds Ratio
Intercept -0.5944 0.1696 -3.504 <0.001 0.5519
ability 0.7448 0.1068 6.975 <0.001 2.1060
interest 0.7417 0.1049 7.068 <0.001 2.0996
tpwp 0.1569 0.1506 1.042 0.298 1.1700
tpwp × ability -0.1052 0.0891 -1.181 0.239 0.9001
tpwp × interest -0.0251 0.1304 -0.192 0.848 0.9753
lexile -0.0012 0.0002 -4.877 <0.001 0.9988
words -0.0147 0.0048 -3.071 0.002 0.9853
equation 0.1295 0.0910 1.423 0.155 1.1383
integers 0.5902 0.1384 4.265 <0.001 1.8044
Results for the final model, shown in Table 20, indicated that the odds of answering
an item correctly were 2.07 times greater when the item was rated as interesting than the
odds of answering an item correctly when the item was not rated as interesting after
accounting for other level 1 predictors. Also, students were also more likely to answer
problems correctly when they perceived themselves to be of a higher ability level, and
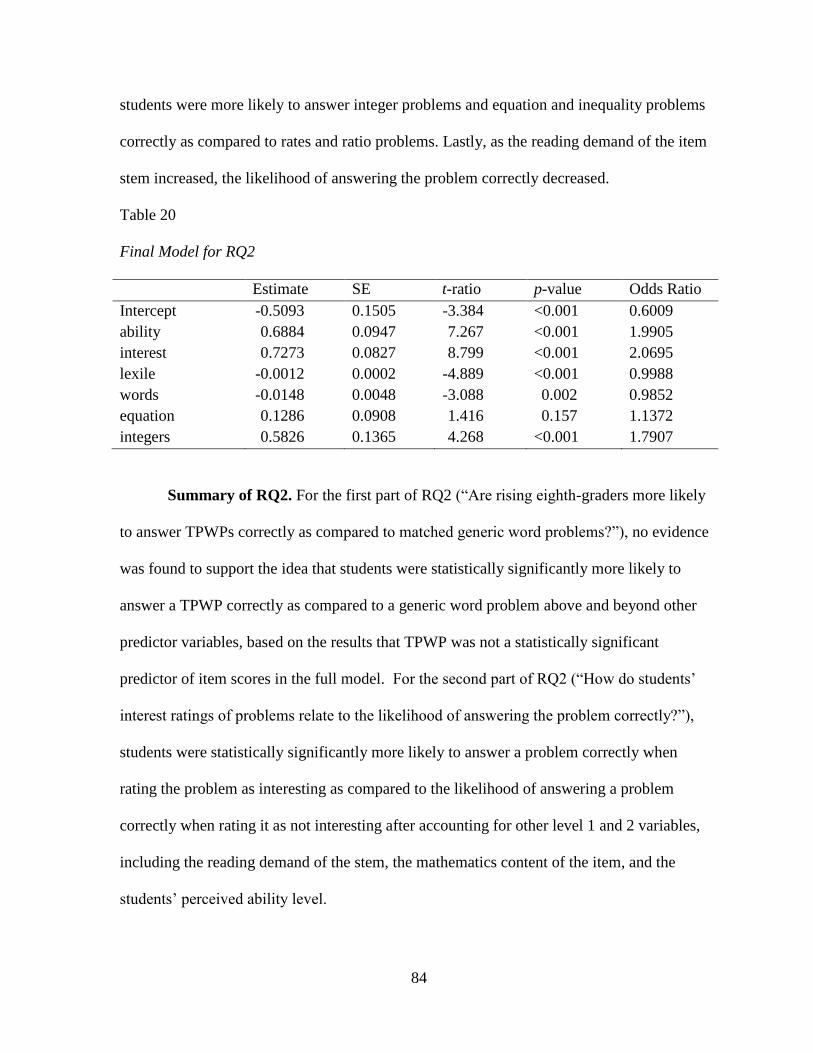
84
students were more likely to answer integer problems and equation and inequality problems
correctly as compared to rates and ratio problems. Lastly, as the reading demand of the item
stem increased, the likelihood of answering the problem correctly decreased.
Table 20
Final Model for RQ2
Estimate SE t-ratio p-value Odds Ratio
Intercept -0.5093 0.1505 -3.384 <0.001 0.6009
ability 0.6884 0.0947 7.267 <0.001 1.9905
interest 0.7273 0.0827 8.799 <0.001 2.0695
lexile -0.0012 0.0002 -4.889 <0.001 0.9988
words -0.0148 0.0048 -3.088 0.002 0.9852
equation 0.1286 0.0908 1.416 0.157 1.1372
integers 0.5826 0.1365 4.268 <0.001 1.7907
Summary of RQ2. For the first part of RQ2 (“Are rising eighth-graders more likely
to answer TPWPs correctly as compared to matched generic word problems?”), no evidence
was found to support the idea that students were statistically significantly more likely to
answer a TPWP correctly as compared to a generic word problem above and beyond other
predictor variables, based on the results that TPWP was not a statistically significant
predictor of item scores in the full model. For the second part of RQ2 (“How do students’
interest ratings of problems relate to the likelihood of answering the problem correctly?”),
students were statistically significantly more likely to answer a problem correctly when
rating the problem as interesting as compared to the likelihood of answering a problem
correctly when rating it as not interesting after accounting for other level 1 and 2 variables,
including the reading demand of the stem, the mathematics content of the item, and the
students’ perceived ability level.

85
RQ3: Response Time to TPWPs
For RQ3 (“Do rising eighth-graders spend more or less time solving a TPWP as
compared to a matched generic problem, and how does amount of time solving each type of
problem relate to mathematical accuracy?”), the dependent variable, response time, is a
continuous variable and thus multilevel linear modeling was used as opposed to the logistic
multilevel modeling used in RQ1 and RQ2. Response time often has a skewed distribution,
as was the case here, and consequently a natural log transformation of response time was
used in order to produce a dependent variable with a normal distribution. Sometimes an
inverse transformation is used on a response time dependent variable (i.e., 1/response time)
in order to create an easily interpretable dependent variable known as response speed that
still produces a more normal distribution (Hox, 2002). However, in these data, the inverse
transformation resulted in a highly skewed distribution and therefore was not used. Figure 12
and Figure 13 show the distribution of response time before and after the transformation,
respectively.
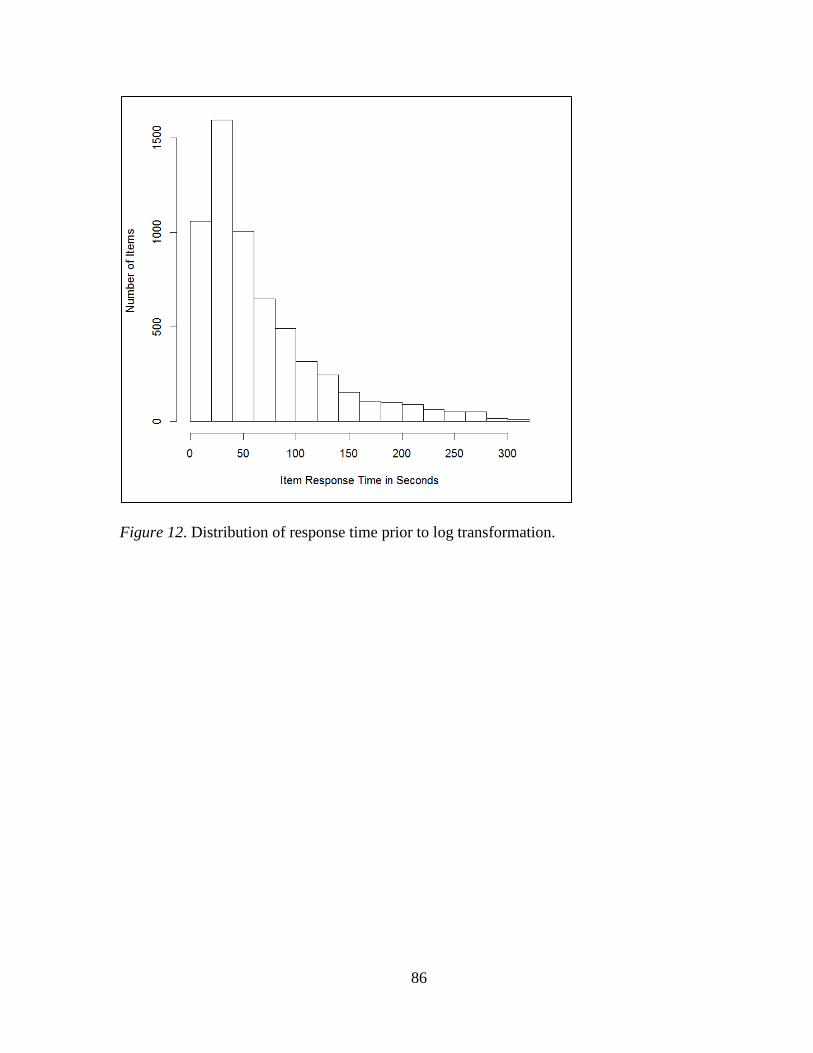
86
Figure 12. Distribution of response time prior to log transformation.
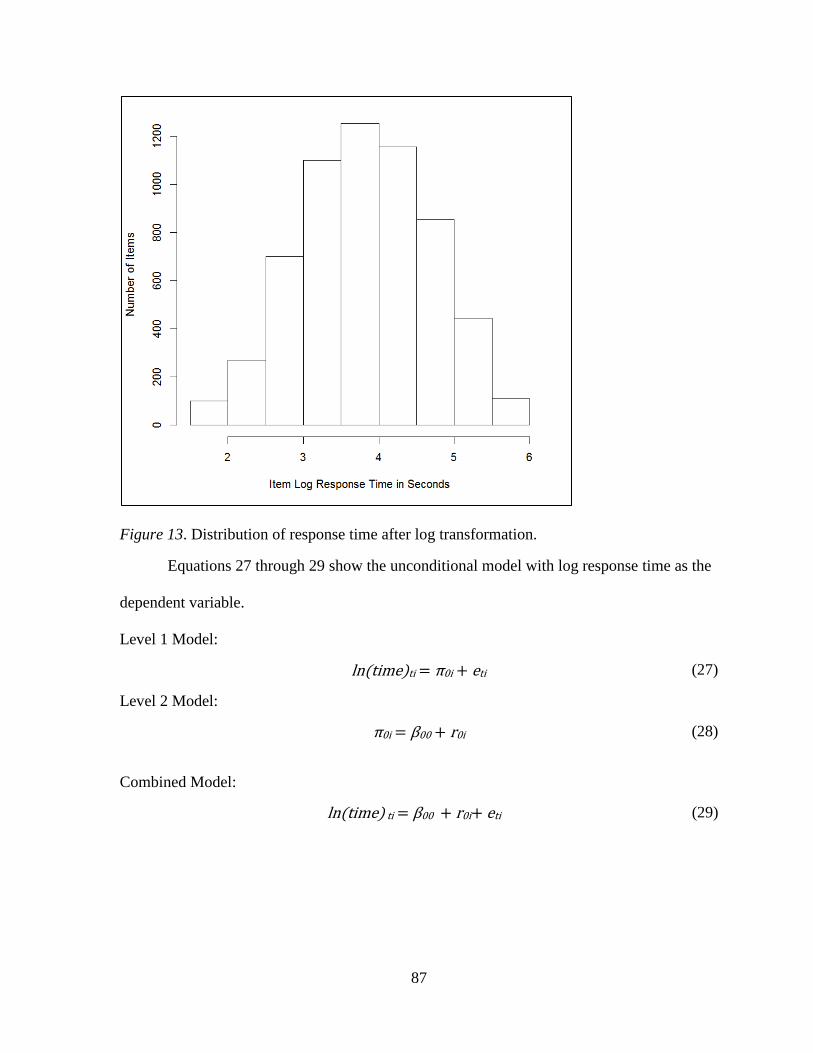
87
Figure 13. Distribution of response time after log transformation.
Equations 27 through 29 show the unconditional model with log response time as the
dependent variable.
Level 1 Model:
ln(time)ti = π0i + eti (27)
Level 2 Model:
π0i = β00 + r0i
(28)
Combined Model:
ln(time) ti = β00 + r0i+ eti
(29)
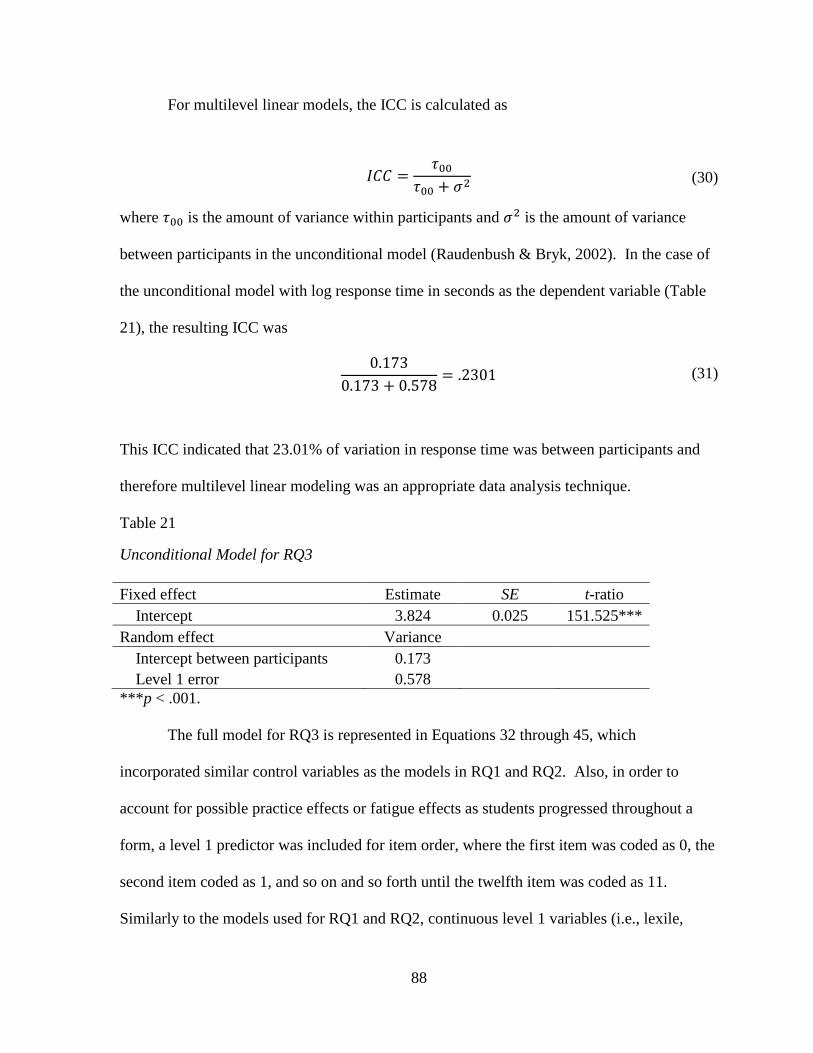
88
For multilevel linear models, the ICC is calculated as
𝐼𝐶𝐶 =𝜏00
𝜏00 + 𝜎2 (30)
where 𝜏00 is the amount of variance within participants and 𝜎2 is the amount of variance
between participants in the unconditional model (Raudenbush & Bryk, 2002). In the case of
the unconditional model with log response time in seconds as the dependent variable (Table
21), the resulting ICC was
0.173
0.173 + 0.578= .2301 (31)
This ICC indicated that 23.01% of variation in response time was between participants and
therefore multilevel linear modeling was an appropriate data analysis technique.
Table 21
Unconditional Model for RQ3
Fixed effect Estimate SE t-ratio
Intercept 3.824 0.025 151.525***
Random effect Variance
Intercept between participants 0.173
Level 1 error 0.578
***p < .001.
The full model for RQ3 is represented in Equations 32 through 45, which
incorporated similar control variables as the models in RQ1 and RQ2. Also, in order to
account for possible practice effects or fatigue effects as students progressed throughout a
form, a level 1 predictor was included for item order, where the first item was coded as 0, the
second item coded as 1, and so on and so forth until the twelfth item was coded as 11.
Similarly to the models used for RQ1 and RQ2, continuous level 1 variables (i.e., lexile,
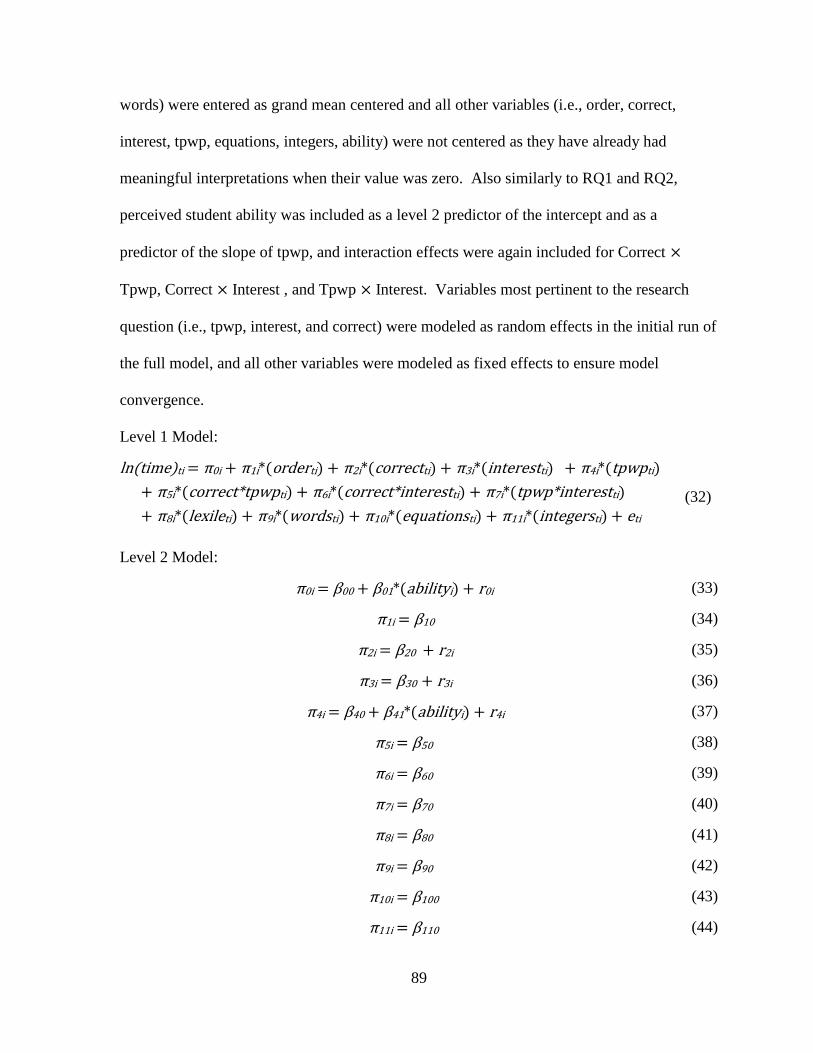
89
words) were entered as grand mean centered and all other variables (i.e., order, correct,
interest, tpwp, equations, integers, ability) were not centered as they have already had
meaningful interpretations when their value was zero. Also similarly to RQ1 and RQ2,
perceived student ability was included as a level 2 predictor of the intercept and as a
predictor of the slope of tpwp, and interaction effects were again included for Correct ×
Tpwp, Correct × Interest , and Tpwp × Interest. Variables most pertinent to the research
question (i.e., tpwp, interest, and correct) were modeled as random effects in the initial run of
the full model, and all other variables were modeled as fixed effects to ensure model
convergence.
Level 1 Model:
ln(time)ti = π0i + π1i*(orderti) + π2i*(correctti) + π3i*(interestti) + π4i*(tpwpti)
+ π5i*(correct*tpwpti) + π6i*(correct*interestti) + π7i*(tpwp*interestti)
+ π8i*(lexileti) + π9i*(wordsti) + π10i*(equationsti) + π11i*(integersti) + eti (32)
Level 2 Model:
π0i = β00 + β01*(abilityi) + r0i (33)
π1i = β10 (34)
π2i = β20 + r2i (35)
π3i = β30 + r3i (36)
π4i = β40 + β41*(abilityi) + r4i (37)
π5i = β50 (38)
π6i = β60 (39)
π7i = β70 (40)
π8i = β80 (41)
π9i = β90 (42)
π10i = β100 (43)
π11i = β110 (44)
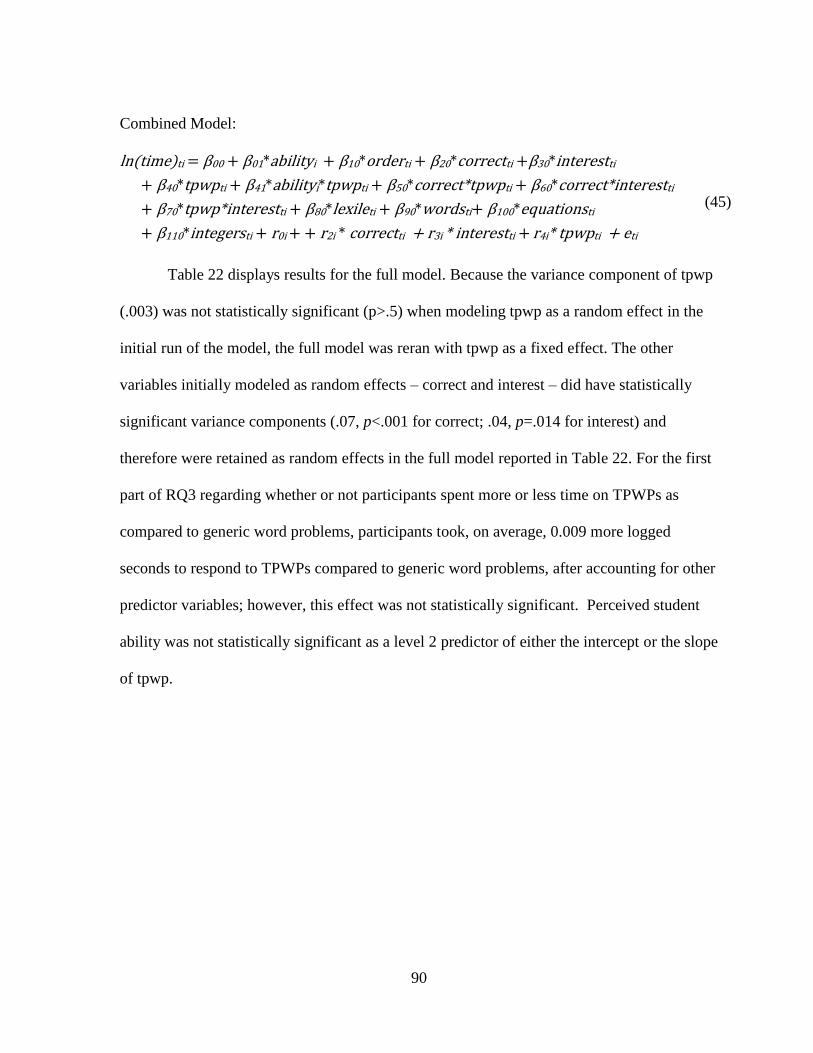
90
Combined Model:
ln(time)ti = β00 + β01*abilityi + β10*orderti + β20*correctti +β30*interestti
+ β40*tpwpti + β41*abilityi*tpwpti + β50*correct*tpwpti + β60*correct*interestti
+ β70*tpwp*interestti + β80*lexileti + β90*wordsti+ β100*equationsti
+ β110*integersti + r0i + + r2i * correctti + r3i * interestti + r4i* tpwpti + eti
(45)
Table 22 displays results for the full model. Because the variance component of tpwp
(.003) was not statistically significant (p>.5) when modeling tpwp as a random effect in the
initial run of the model, the full model was reran with tpwp as a fixed effect. The other
variables initially modeled as random effects – correct and interest – did have statistically
significant variance components (.07, p<.001 for correct; .04, p=.014 for interest) and
therefore were retained as random effects in the full model reported in Table 22. For the first
part of RQ3 regarding whether or not participants spent more or less time on TPWPs as
compared to generic word problems, participants took, on average, 0.009 more logged
seconds to respond to TPWPs compared to generic word problems, after accounting for other
predictor variables; however, this effect was not statistically significant. Perceived student
ability was not statistically significant as a level 2 predictor of either the intercept or the slope
of tpwp.
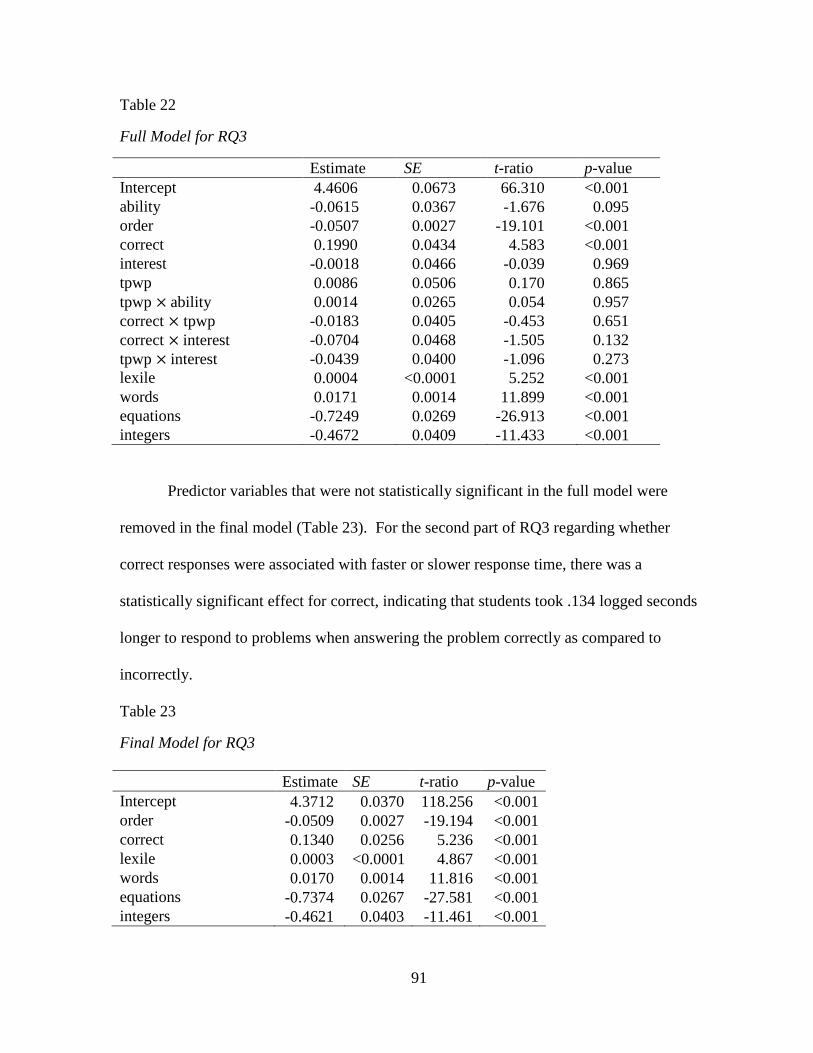
91
Table 22
Full Model for RQ3
Estimate SE t-ratio p-value
Intercept 4.4606 0.0673 66.310 <0.001
ability -0.0615 0.0367 -1.676 0.095
order -0.0507 0.0027 -19.101 <0.001
correct 0.1990 0.0434 4.583 <0.001
interest -0.0018 0.0466 -0.039 0.969
tpwp 0.0086 0.0506 0.170 0.865
tpwp ×ability 0.0014 0.0265 0.054 0.957
correct × tpwp -0.0183 0.0405 -0.453 0.651
correct ×interest -0.0704 0.0468 -1.505 0.132
tpwp ×interest -0.0439 0.0400 -1.096 0.273
lexile 0.0004 <0.0001 5.252 <0.001
words 0.0171 0.0014 11.899 <0.001
equations -0.7249 0.0269 -26.913 <0.001
integers -0.4672 0.0409 -11.433 <0.001
Predictor variables that were not statistically significant in the full model were
removed in the final model (Table 23). For the second part of RQ3 regarding whether
correct responses were associated with faster or slower response time, there was a
statistically significant effect for correct, indicating that students took .134 logged seconds
longer to respond to problems when answering the problem correctly as compared to
incorrectly.
Table 23
Final Model for RQ3
Estimate SE t-ratio p-value
Intercept 4.3712 0.0370 118.256 <0.001
order -0.0509 0.0027 -19.194 <0.001
correct 0.1340 0.0256 5.236 <0.001
lexile 0.0003 <0.0001 4.867 <0.001
words 0.0170 0.0014 11.816 <0.001
equations -0.7374 0.0267 -27.581 <0.001
integers -0.4621 0.0403 -11.461 <0.001
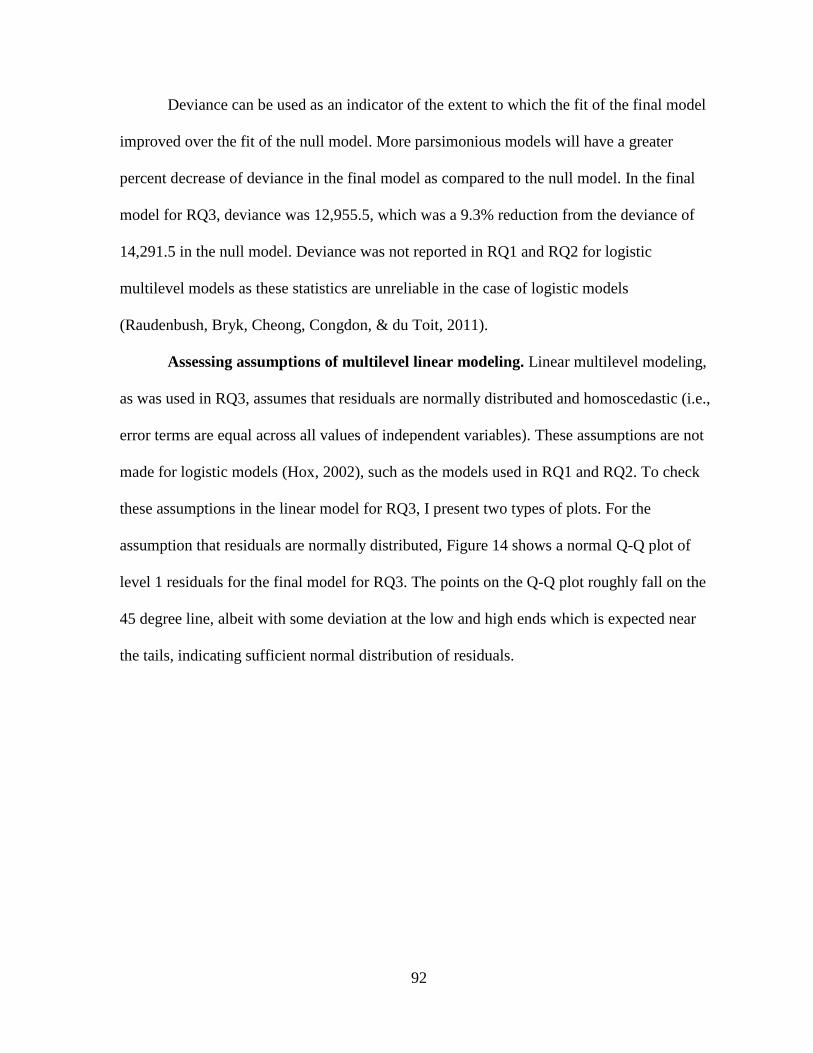
92
Deviance can be used as an indicator of the extent to which the fit of the final model
improved over the fit of the null model. More parsimonious models will have a greater
percent decrease of deviance in the final model as compared to the null model. In the final
model for RQ3, deviance was 12,955.5, which was a 9.3% reduction from the deviance of
14,291.5 in the null model. Deviance was not reported in RQ1 and RQ2 for logistic
multilevel models as these statistics are unreliable in the case of logistic models
(Raudenbush, Bryk, Cheong, Congdon, & du Toit, 2011).
Assessing assumptions of multilevel linear modeling. Linear multilevel modeling,
as was used in RQ3, assumes that residuals are normally distributed and homoscedastic (i.e.,
error terms are equal across all values of independent variables). These assumptions are not
made for logistic models (Hox, 2002), such as the models used in RQ1 and RQ2. To check
these assumptions in the linear model for RQ3, I present two types of plots. For the
assumption that residuals are normally distributed, Figure 14 shows a normal Q-Q plot of
level 1 residuals for the final model for RQ3. The points on the Q-Q plot roughly fall on the
45 degree line, albeit with some deviation at the low and high ends which is expected near
the tails, indicating sufficient normal distribution of residuals.
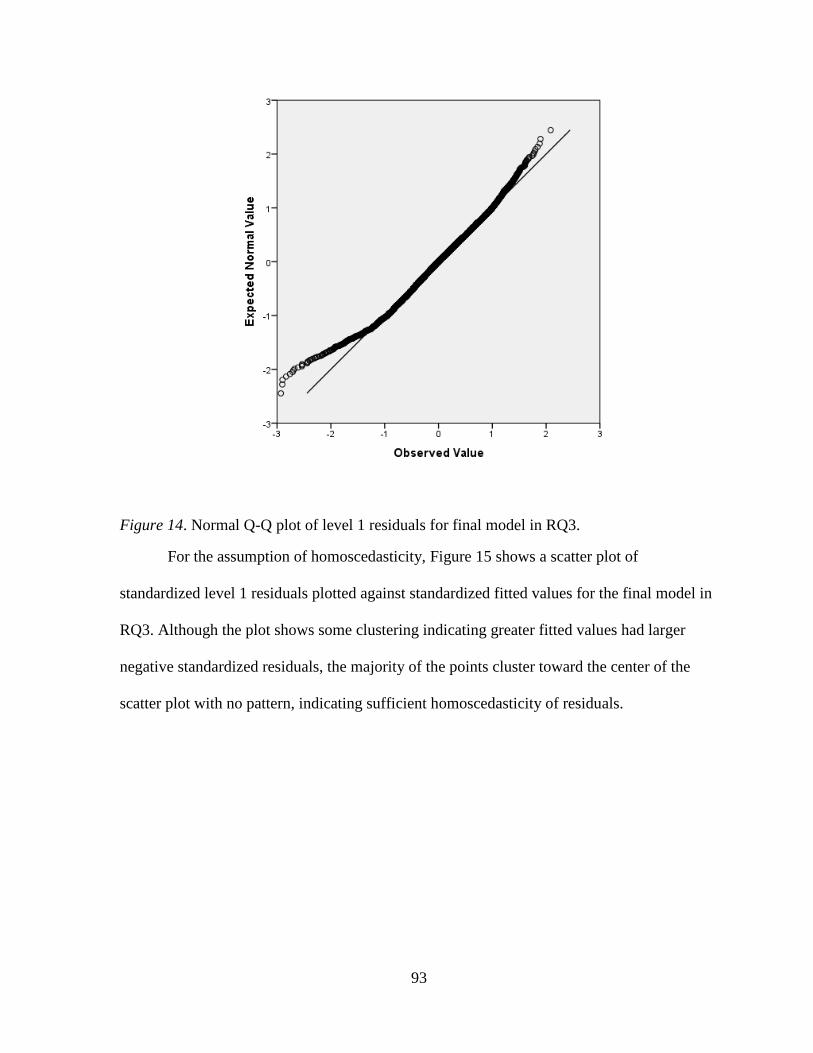
93
Figure 14. Normal Q-Q plot of level 1 residuals for final model in RQ3.
For the assumption of homoscedasticity, Figure 15 shows a scatter plot of
standardized level 1 residuals plotted against standardized fitted values for the final model in
RQ3. Although the plot shows some clustering indicating greater fitted values had larger
negative standardized residuals, the majority of the points cluster toward the center of the
scatter plot with no pattern, indicating sufficient homoscedasticity of residuals.
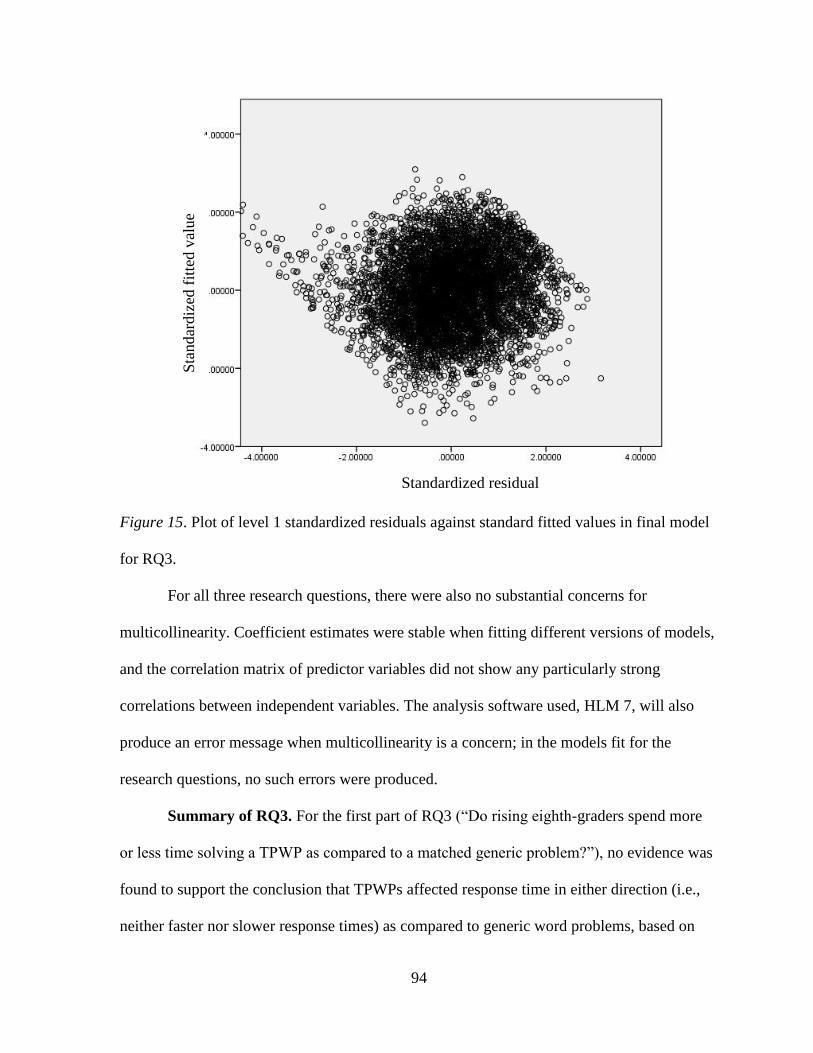
94
Figure 15. Plot of level 1 standardized residuals against standard fitted values in final model
for RQ3.
For all three research questions, there were also no substantial concerns for
multicollinearity. Coefficient estimates were stable when fitting different versions of models,
and the correlation matrix of predictor variables did not show any particularly strong
correlations between independent variables. The analysis software used, HLM 7, will also
produce an error message when multicollinearity is a concern; in the models fit for the
research questions, no such errors were produced.
Summary of RQ3. For the first part of RQ3 (“Do rising eighth-graders spend more
or less time solving a TPWP as compared to a matched generic problem?”), no evidence was
found to support the conclusion that TPWPs affected response time in either direction (i.e.,
neither faster nor slower response times) as compared to generic word problems, based on
Standardized residual
Sta
ndar
diz
ed f
itte
d v
alue
95
the results that tpwp was not a statistically significant predictor of logged response time in
the full model. For the second part of RQ3 (“How does amount of time solving each type of
problem relate to mathematical accuracy?”), students spent more time solving problems
when answering problems correctly as compared to incorrectly.
Power Analysis
In statistical analysis, power refers to the probability of correctly rejecting the null
hypothesis when the alternative hypothesis is true and depends on both type I error rate (i.e.,
error due to rejecting a true null hypothesis; denoted by α) and type II error rate (i.e., error
due to failing to reject a false null hypothesis; denoted by β) (Cohen, 1988). Power is
calculated as 1- β. In two-level multilevel modeling, power depends on the number of units
at each level (i.e., number of items and number of participants) and the level at which key
explanatory variables appear (Raudenbush & Bryk, 2002).
There are two common approaches for power analysis. In one approach, termed by
Spybrook and colleagues (2011) as the power determination approach, a power analysis may
be conducted during research design planning to determine the necessary sample size needed
to detect a particular effect size with a particular amount of power. In other words, the
researcher specifies the effect size he/she anticipates finding based on theory and then
calculates the number of participants required to detect that effect with a specified power.
(e.g., 0.8, 0.9, etc.). This type of power analysis is useful when researchers have the
capability of varying sample size as needed based on data collection resources.
In other cases, when researchers have a set number of participants available and do
not have the option to feasibly modify sample size, a power analysis can be conducted to
calculate the effect size that would be detected with a specified power and static number of
96
participants. Referred to by Spybrook and colleagues (2011) as the effect size approach and
referred to by Moerbeek and Teerenstra (2016) as a sensitivity analysis, this type of power
analysis seeks to calculate the minimum detectable effect size, defined as the smallest true
effect found to be statistically significant with a predetermined sample size (Bloom, 1995).
Because participants were students voluntarily participating in a summer program and
hence sample size was not able to be manipulated, I present a sensitivity power analysis.
Snijders (2005) presented a formula that relates the ratio of a coefficient estimate, 𝛾, to the
standard error of that estimate to power, estimated as:
𝛾
𝑆𝐸(𝛾)≈ 𝑧
1−(𝛼2)+ 𝑧1−𝛽
(46)
for a two-tailed test at a significance level of 𝛼 where 𝑆𝐸(𝛾) is the standard error of the
coefficient estimate and 𝑧1−(
𝛼
2) and 𝑧1−𝛽 are critical points of the Z-distribution for specified
values of type I and type II errors, α and β. Setting α equal to .05 and finding the critical
point of 𝑧1−.05/2 = 1.96 results in:
𝛾
𝑆𝐸(𝛾)≈ 1.96 + 𝑧1−𝛽
(47)
One can then use the standard error of the variable of concern in the full model as an
estimate of the population error. The power analyses here concerns the variable tpwp in all
three research questions. In RQ1, the standard error of tpwp was 0.0858. Equation 47 then
becomes:
𝛾
. 0858≈ 1.96 + 𝑧1−𝛽
(48)
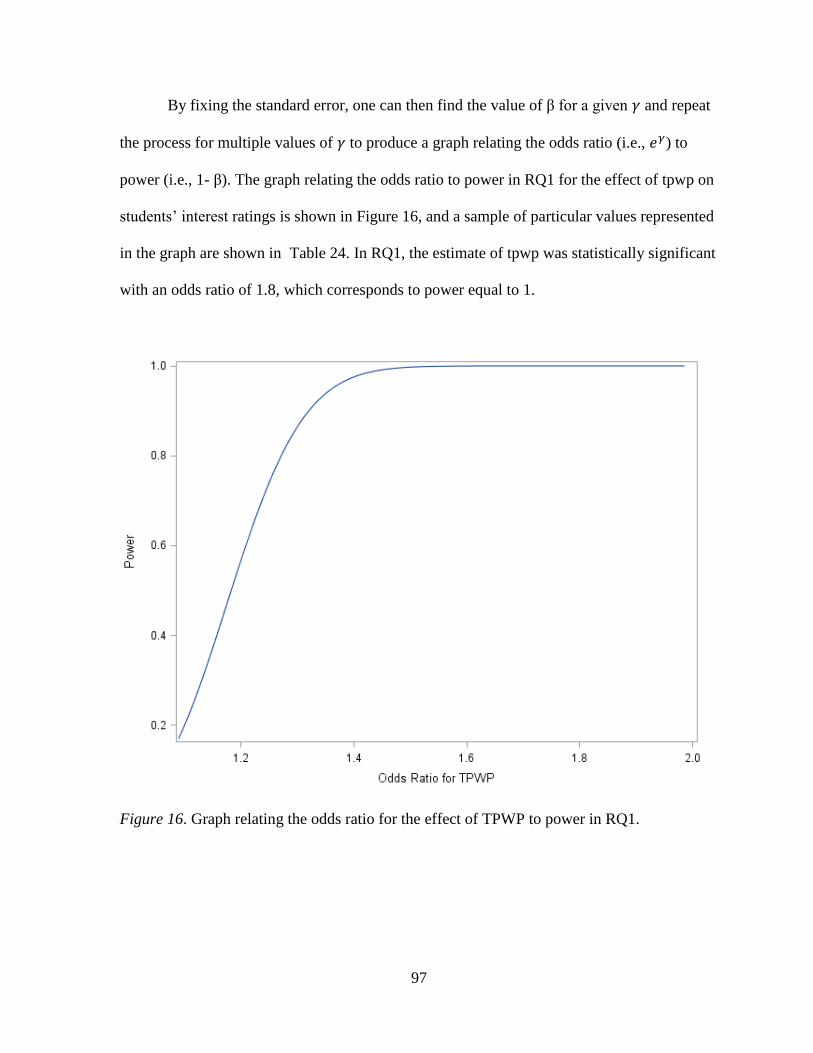
97
By fixing the standard error, one can then find the value of β for a given 𝛾 and repeat
the process for multiple values of 𝛾 to produce a graph relating the odds ratio (i.e., 𝑒𝛾) to
power (i.e., 1- β). The graph relating the odds ratio to power in RQ1 for the effect of tpwp on
students’ interest ratings is shown in Figure 16, and a sample of particular values represented
in the graph are shown in Table 24. In RQ1, the estimate of tpwp was statistically significant
with an odds ratio of 1.8, which corresponds to power equal to 1.
Figure 16. Graph relating the odds ratio for the effect of TPWP to power in RQ1.
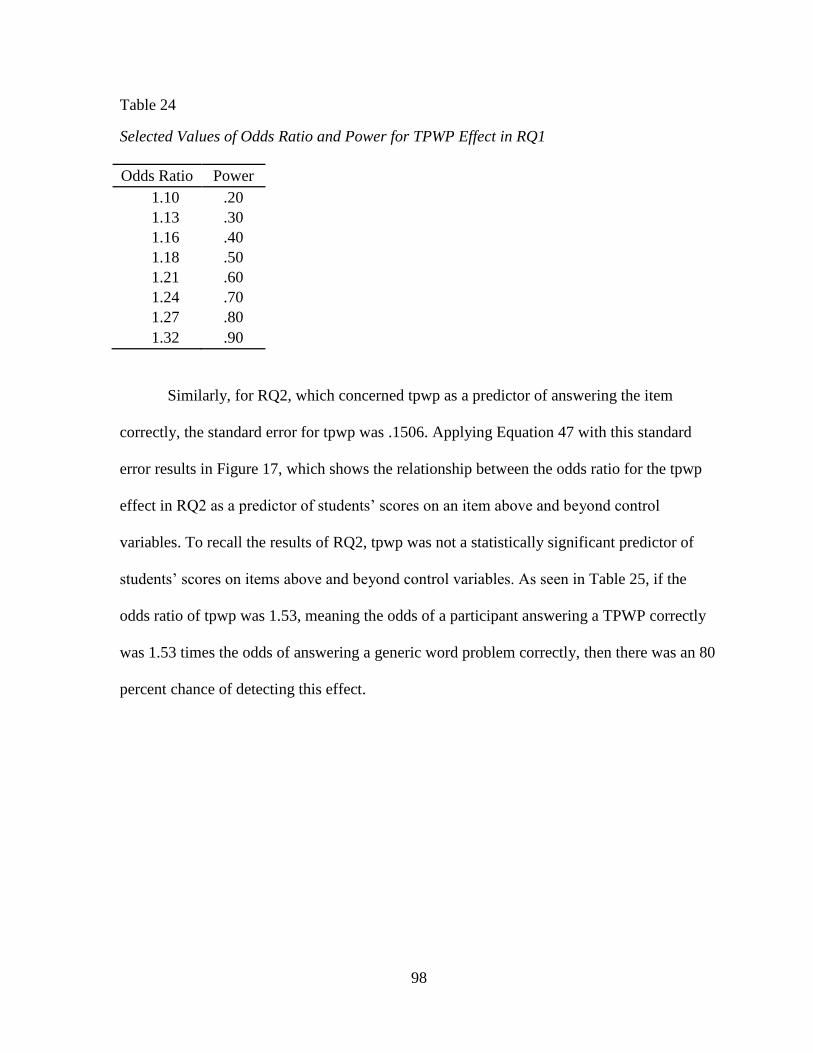
98
Table 24
Selected Values of Odds Ratio and Power for TPWP Effect in RQ1
Odds Ratio Power
1.10 .20
1.13 .30
1.16 .40
1.18 .50
1.21 .60
1.24 .70
1.27 .80
1.32 .90
Similarly, for RQ2, which concerned tpwp as a predictor of answering the item
correctly, the standard error for tpwp was .1506. Applying Equation 47 with this standard
error results in Figure 17, which shows the relationship between the odds ratio for the tpwp
effect in RQ2 as a predictor of students’ scores on an item above and beyond control
variables. To recall the results of RQ2, tpwp was not a statistically significant predictor of
students’ scores on items above and beyond control variables. As seen in Table 25, if the
odds ratio of tpwp was 1.53, meaning the odds of a participant answering a TPWP correctly
was 1.53 times the odds of answering a generic word problem correctly, then there was an 80
percent chance of detecting this effect.
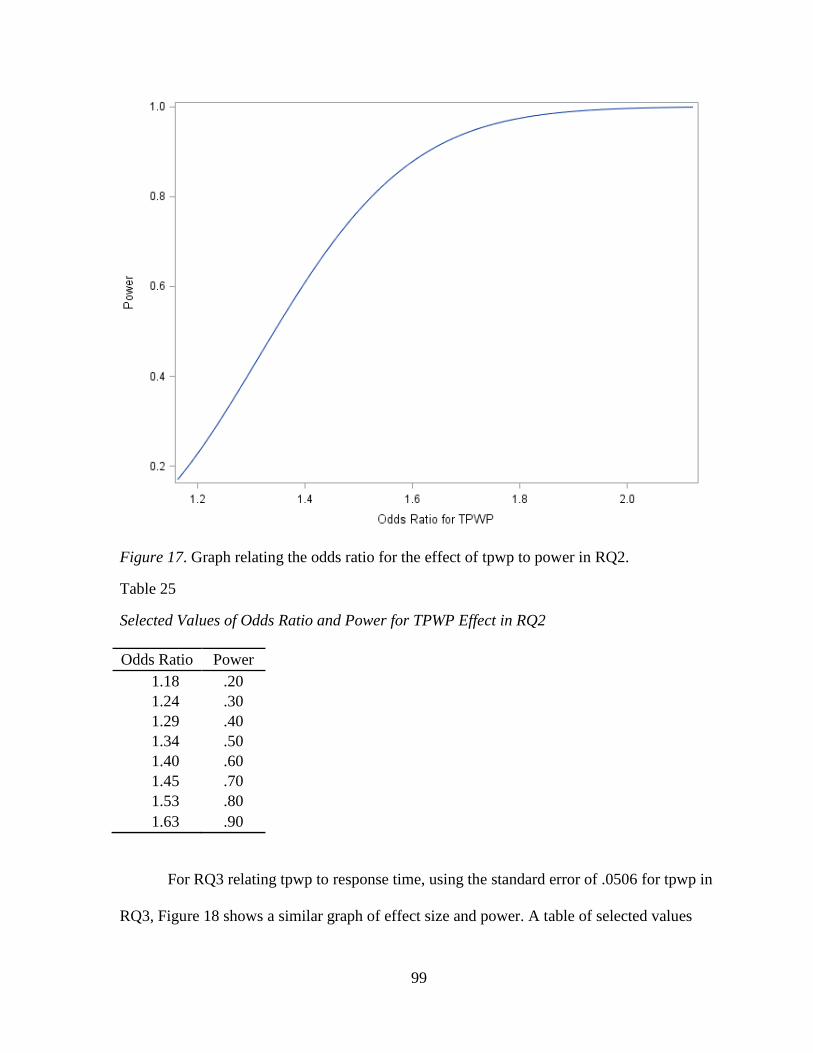
99
Figure 17. Graph relating the odds ratio for the effect of tpwp to power in RQ2.
Table 25
Selected Values of Odds Ratio and Power for TPWP Effect in RQ2
Odds Ratio Power
1.18 .20
1.24 .30
1.29 .40
1.34 .50
1.40 .60
1.45 .70
1.53 .80
1.63 .90
For RQ3 relating tpwp to response time, using the standard error of .0506 for tpwp in
RQ3, Figure 18 shows a similar graph of effect size and power. A table of selected values
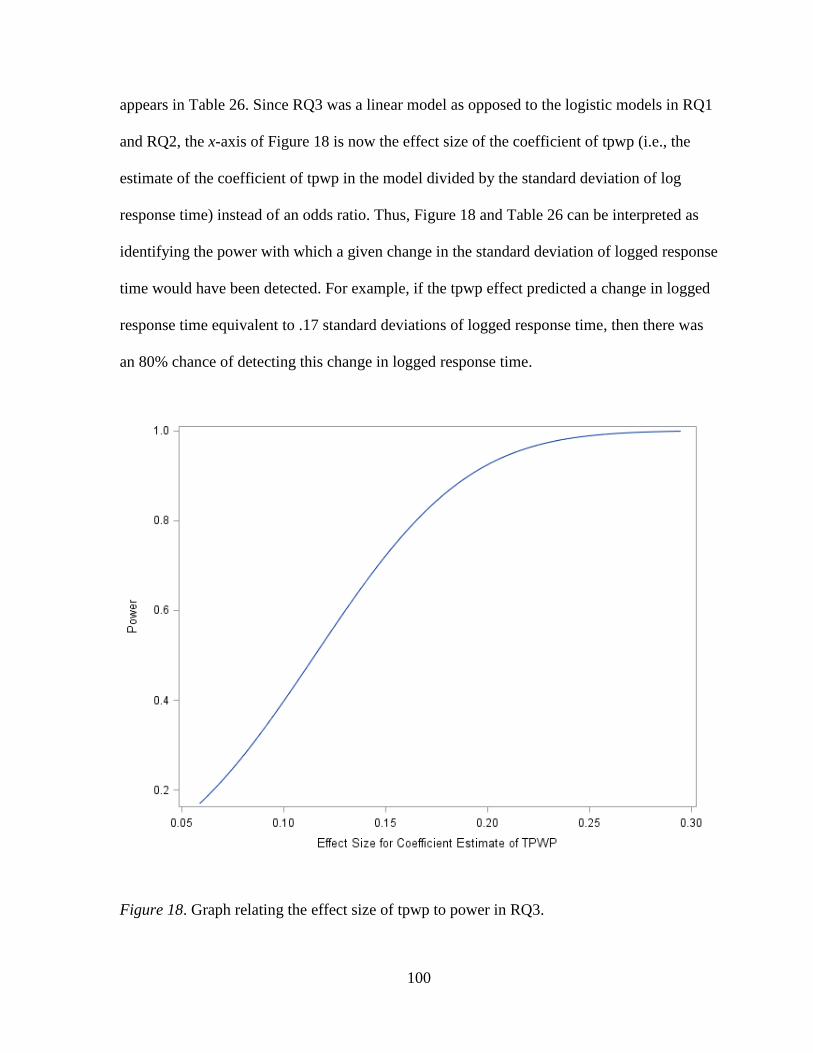
100
appears in Table 26. Since RQ3 was a linear model as opposed to the logistic models in RQ1
and RQ2, the x-axis of Figure 18 is now the effect size of the coefficient of tpwp (i.e., the
estimate of the coefficient of tpwp in the model divided by the standard deviation of log
response time) instead of an odds ratio. Thus, Figure 18 and Table 26 can be interpreted as
identifying the power with which a given change in the standard deviation of logged response
time would have been detected. For example, if the tpwp effect predicted a change in logged
response time equivalent to .17 standard deviations of logged response time, then there was
an 80% chance of detecting this change in logged response time.
Figure 18. Graph relating the effect size of tpwp to power in RQ3.
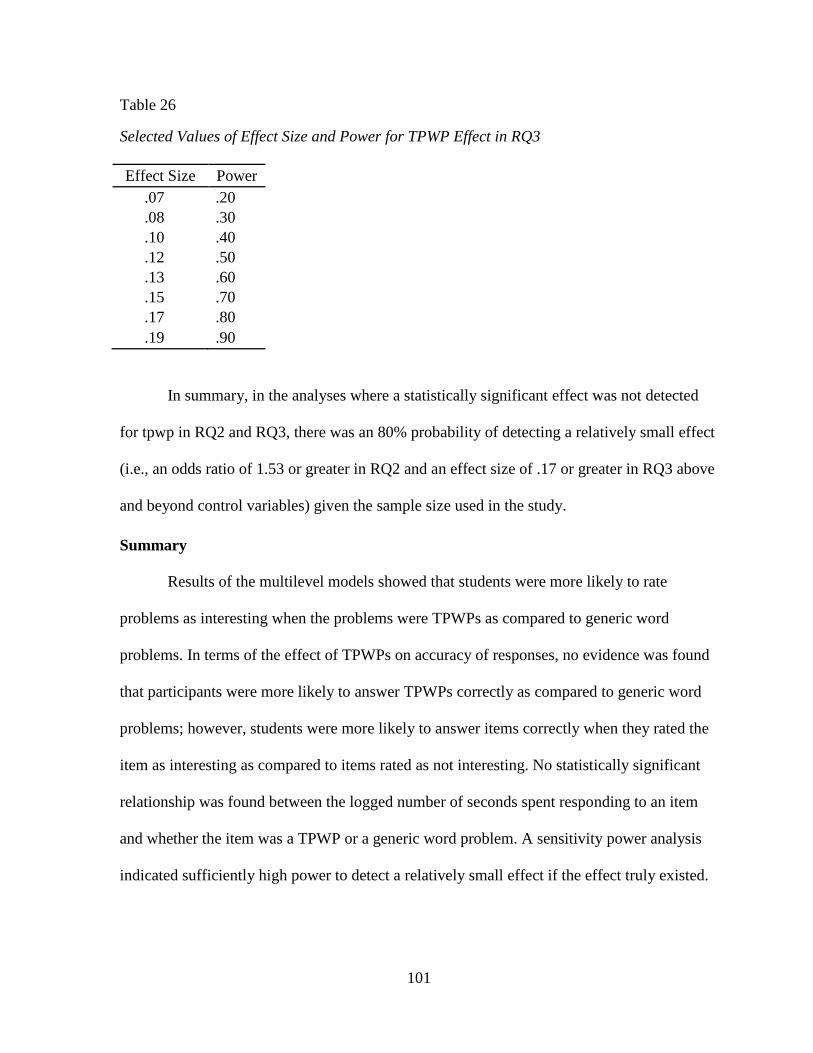
101
Table 26
Selected Values of Effect Size and Power for TPWP Effect in RQ3
Effect Size Power
.07 .20
.08 .30
.10 .40
.12 .50
.13 .60
.15 .70
.17 .80
.19 .90
In summary, in the analyses where a statistically significant effect was not detected
for tpwp in RQ2 and RQ3, there was an 80% probability of detecting a relatively small effect
(i.e., an odds ratio of 1.53 or greater in RQ2 and an effect size of .17 or greater in RQ3 above
and beyond control variables) given the sample size used in the study.
Summary
Results of the multilevel models showed that students were more likely to rate
problems as interesting when the problems were TPWPs as compared to generic word
problems. In terms of the effect of TPWPs on accuracy of responses, no evidence was found
that participants were more likely to answer TPWPs correctly as compared to generic word
problems; however, students were more likely to answer items correctly when they rated the
item as interesting as compared to items rated as not interesting. No statistically significant
relationship was found between the logged number of seconds spent responding to an item
and whether the item was a TPWP or a generic word problem. A sensitivity power analysis
indicated sufficiently high power to detect a relatively small effect if the effect truly existed.
102
Chapter 5: Discussion
This chapter begins with a discussion of the significance and implications of the
results presented in Chapter 4. I then discuss challenges related to using TPWPs as an
instructional strategy, using computer technology to create TPWPs, and conducting research
with TPWPs. The chapter concludes with consideration of the limitations of the present
study and proposed directions for future research.
Significance and Implications of Results
Discussion of RQ1. RQ1 (“Are rising eighth-graders more likely to rate TPWPs as
interesting as compared to matched generic word problems?”) was posed to investigate
whether TPWPs triggered students’ interests. Prior research has largely assumed that
personalization – either in the case of IPWPs or TPWPs – triggers students’ interests without
collecting data to determine if students find personalized word problems interesting (Bates &
Wiest, 2004; Walkington, 2013). Results from RQ1 provided evidence that the use of
TPWPs was indeed related to greater likelihood of rating an item as interesting as compared
to matched generic word problems, thus supporting the hypothesis that TPWPs triggered
students’ interest in the problem. This result supports the idea that TPWPs are one means of
helping students reach Phase I, triggered situational interest, of Hidi and Renninger’s (2006)
four-phase model of interest development. Once reaching Phase I, students may then move
further along the four-stages of interest development until eventually students have a well-
developed individual interest in mathematics. Thus, TPWPs may serve as a catalyst for
stimulating students’ future interest in mathematics. This result is similar to Cordova and
103
Lepper’s (1996) findings that students were more interested in playing a mathematics game
after school when the game had incidentally-personalized elements as compared to a version
of the game with no personalization.
Results from RQ1 also indicated that students were more likely to rate problems as
interesting when students answered problems correctly. In fact, prior research using large-
scale longitudinal data bases has indicated that current achievement in mathematics predicted
future interest in mathematics, but current interest did not predict future achievement (Ganley
& Lubienski, 2016). Similar to this prior research, correct student responses may have led to
feelings of interest, perhaps because of a feeling associated with being interested in tasks that
one can do well. Although students were not provided with feedback about whether their
responses were correct or incorrect until the end of the instrument after interest ratings were
collected, students’ perceptions of their mathematical ability may have been accurate enough
whereby students could have accurately predicted whether they were answering items
correctly or not. These predictions may have made students more likely to rate items as
interesting when feeling like they responded correctly.
In addition to the item being a TPWP and students answering correctly, another
variable that was a statistically significant predictor of students’ interest ratings was whether
or not the item came from the third data collection session in which the problems addressed
equations and inequalities. There are two possible explanations for this result. First, the
equation and inequality word problems generally had longer stems due to the need to explain
a real-life situation modeled by an equation or inequality; therefore, the items had more
interest-specific language than the items in the other two data collection sessions. Thus, it is
possible that a certain extent of personalization must be required before triggering students’
104
situational interest corresponding to Phase I of the four-phase mode of interest development
(Hidi & Renninger, 2006). In other words, perhaps topic-personalization of only a few
words in the stem – as was the case for most of the word problems about ratios and integers
in the first two data collection sessions – was not sufficient to trigger situational interest.
However, several sentences corresponding to a topic-personalized scenario, as was required
for the equation and inequality word problems, may have been enough to trigger situational
interest.
Second, as another possible explanation of why the equations variable was a
statistically significant predictor of students’ interest ratings, it is possible that students
completing the final form of data collection (i.e., the equation and inequalities word
problems) generally had greater interest in mathematics because they persisted throughout all
three sessions of voluntary data collection over a four-week period. Hence, students in the
third session could have been more likely to rate items as interesting due to those students
having greater general interest in mathematics as opposed to finding equations more
interesting than rates or integers. In other words, there was a confound between the type of
mathematics content and the data collection session because each data collection session
focused on a single content area.
Discussion of RQ2. Whereas RQ1 investigated the relationship between TPWPs and
interest ratings, RQ2 (“Are rising eighth-graders more likely to answer TPWPs correctly as
compared to matched generic word problems?” and ”How do students’ interest ratings of
problems relate to the likelihood of answering the problem correctly?”) focused on TPWPs
and interest ratings as predictors of correct word problem responses. Results provided no
evidence that students were more likely to answer an item correctly when the item was a
105
TPWP as compared to a generic word problem after accounting for other control variables
including interest ratings. However, students were statistically significantly more likely to
answer correctly if students rated the item as interesting. This finding implies that although
personalization predicted interest – and interest predicted accuracy of responses –
personalization did not predict accuracy of responses above and beyond the effect of interest.
The finding also suggests that, regardless of whether items were personalized or not,
triggering interest may indeed result in cognitive benefits leading to greater likelihood of an
accurate response, as was hypothesized based on the literature presented in Chapter 2 about
outcomes associated with triggering situational interest such as reduced cognitive load
(McDaniel, Waddil, Finstad, & Bourg, 2000; Park, 2015), heightened attention (Hidi &
Ainley, 2008; Walkington, 2015), or stronger feelings of caring about a task (Ainley, Hidi, &
Berndorff , 2002). The fact that students performed better on items when rating the items as
interesting implies that some of the aforementioned cognitive processes linked to triggering
situational interest may have been occurring in the present study and could account for
improved student performance on problems rated as interesting. Additional analysis could
use path analysis to explore the possibility of interest as a mediator between personalization
and accurate responses.
Discussion of RQ3. RQ3 (“Do rising eighth-graders spend more or less time solving
a TPWP as compared to a matched generic problem?” and ”How does amount of time
solving each type of problem relate to mathematical accuracy?”) was posed with a non-
directional hypothesis about how TPWPs might affect response time. Competing theories
suggested that either students might spend more time on TPWPs as compared to matched
generic word problems due to increased effort or perseverance or that students might spend
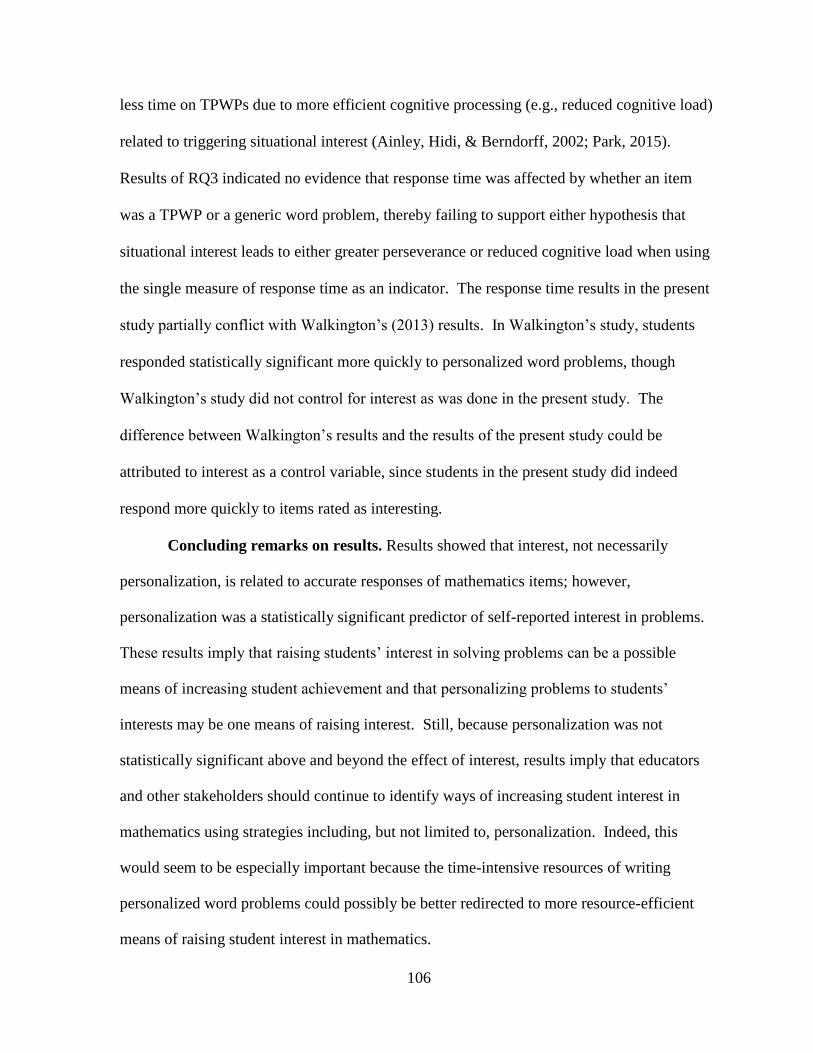
106
less time on TPWPs due to more efficient cognitive processing (e.g., reduced cognitive load)
related to triggering situational interest (Ainley, Hidi, & Berndorff, 2002; Park, 2015).
Results of RQ3 indicated no evidence that response time was affected by whether an item
was a TPWP or a generic word problem, thereby failing to support either hypothesis that
situational interest leads to either greater perseverance or reduced cognitive load when using
the single measure of response time as an indicator. The response time results in the present
study partially conflict with Walkington’s (2013) results. In Walkington’s study, students
responded statistically significant more quickly to personalized word problems, though
Walkington’s study did not control for interest as was done in the present study. The
difference between Walkington’s results and the results of the present study could be
attributed to interest as a control variable, since students in the present study did indeed
respond more quickly to items rated as interesting.
Concluding remarks on results. Results showed that interest, not necessarily
personalization, is related to accurate responses of mathematics items; however,
personalization was a statistically significant predictor of self-reported interest in problems.
These results imply that raising students’ interest in solving problems can be a possible
means of increasing student achievement and that personalizing problems to students’
interests may be one means of raising interest. Still, because personalization was not
statistically significant above and beyond the effect of interest, results imply that educators
and other stakeholders should continue to identify ways of increasing student interest in
mathematics using strategies including, but not limited to, personalization. Indeed, this
would seem to be especially important because the time-intensive resources of writing
personalized word problems could possibly be better redirected to more resource-efficient
means of raising student interest in mathematics.
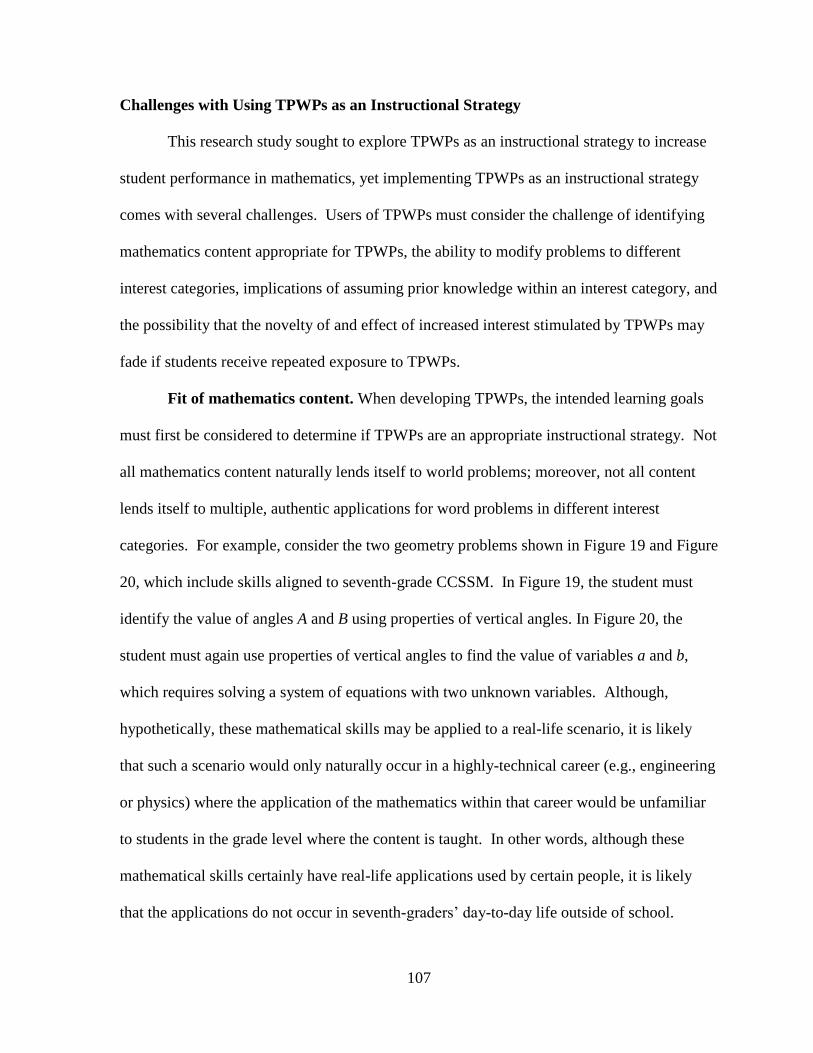
107
Challenges with Using TPWPs as an Instructional Strategy
This research study sought to explore TPWPs as an instructional strategy to increase
student performance in mathematics, yet implementing TPWPs as an instructional strategy
comes with several challenges. Users of TPWPs must consider the challenge of identifying
mathematics content appropriate for TPWPs, the ability to modify problems to different
interest categories, implications of assuming prior knowledge within an interest category, and
the possibility that the novelty of and effect of increased interest stimulated by TPWPs may
fade if students receive repeated exposure to TPWPs.
Fit of mathematics content. When developing TPWPs, the intended learning goals
must first be considered to determine if TPWPs are an appropriate instructional strategy. Not
all mathematics content naturally lends itself to world problems; moreover, not all content
lends itself to multiple, authentic applications for word problems in different interest
categories. For example, consider the two geometry problems shown in Figure 19 and Figure
20, which include skills aligned to seventh-grade CCSSM. In Figure 19, the student must
identify the value of angles A and B using properties of vertical angles. In Figure 20, the
student must again use properties of vertical angles to find the value of variables a and b,
which requires solving a system of equations with two unknown variables. Although,
hypothetically, these mathematical skills may be applied to a real-life scenario, it is likely
that such a scenario would only naturally occur in a highly-technical career (e.g., engineering
or physics) where the application of the mathematics within that career would be unfamiliar
to students in the grade level where the content is taught. In other words, although these
mathematical skills certainly have real-life applications used by certain people, it is likely
that the applications do not occur in seventh-graders’ day-to-day life outside of school.
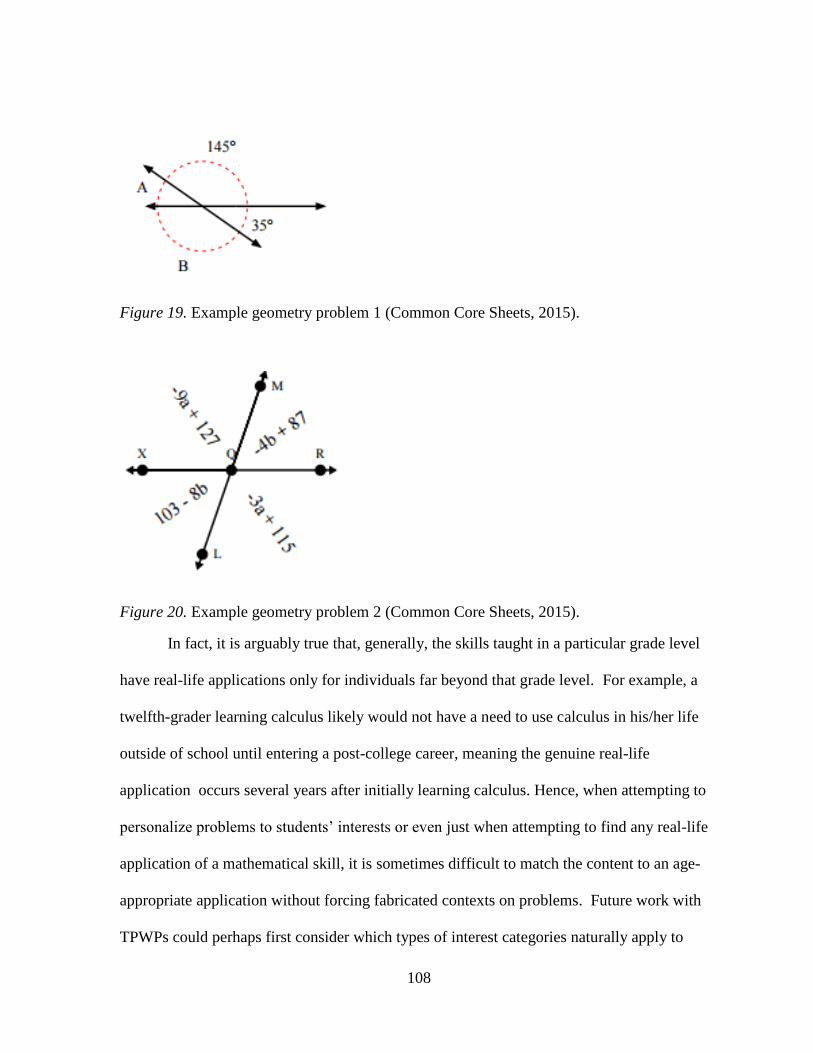
108
Figure 19. Example geometry problem 1 (Common Core Sheets, 2015).
Figure 20. Example geometry problem 2 (Common Core Sheets, 2015).
In fact, it is arguably true that, generally, the skills taught in a particular grade level
have real-life applications only for individuals far beyond that grade level. For example, a
twelfth-grader learning calculus likely would not have a need to use calculus in his/her life
outside of school until entering a post-college career, meaning the genuine real-life
application occurs several years after initially learning calculus. Hence, when attempting to
personalize problems to students’ interests or even just when attempting to find any real-life
application of a mathematical skill, it is sometimes difficult to match the content to an age-
appropriate application without forcing fabricated contexts on problems. Future work with
TPWPs could perhaps first consider which types of interest categories naturally apply to
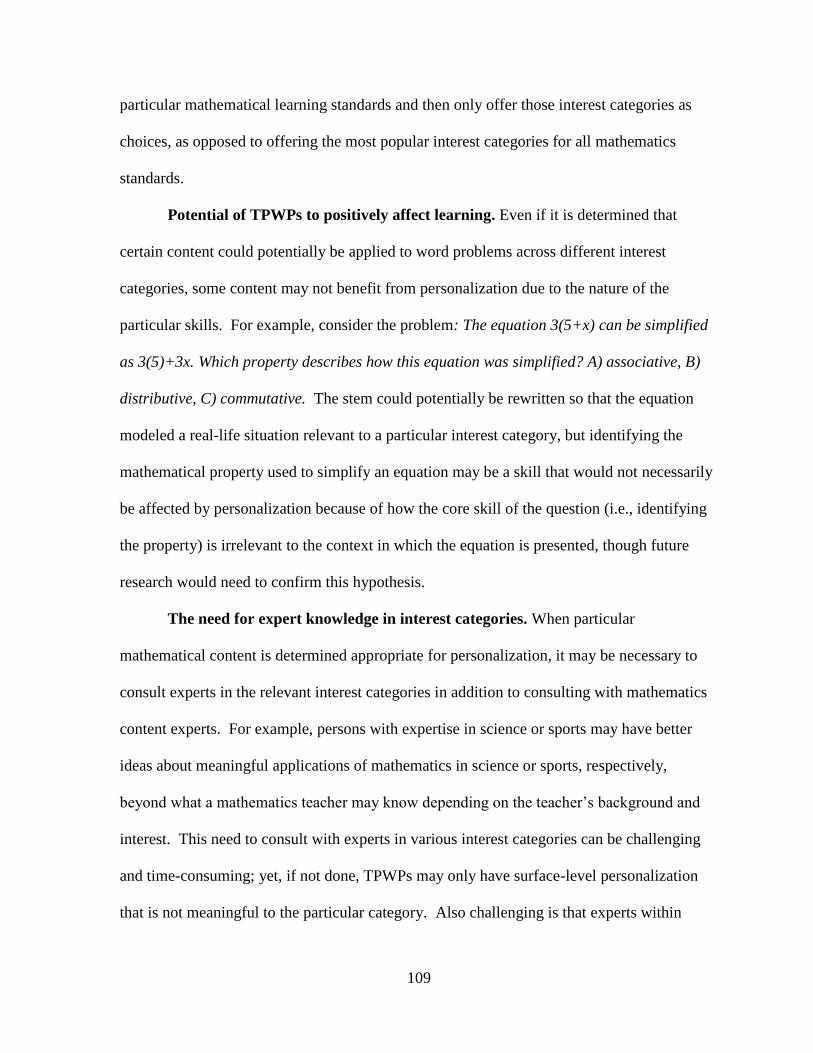
109
particular mathematical learning standards and then only offer those interest categories as
choices, as opposed to offering the most popular interest categories for all mathematics
standards.
Potential of TPWPs to positively affect learning. Even if it is determined that
certain content could potentially be applied to word problems across different interest
categories, some content may not benefit from personalization due to the nature of the
particular skills. For example, consider the problem: The equation 3(5+x) can be simplified
as 3(5)+3x. Which property describes how this equation was simplified? A) associative, B)
distributive, C) commutative. The stem could potentially be rewritten so that the equation
modeled a real-life situation relevant to a particular interest category, but identifying the
mathematical property used to simplify an equation may be a skill that would not necessarily
be affected by personalization because of how the core skill of the question (i.e., identifying
the property) is irrelevant to the context in which the equation is presented, though future
research would need to confirm this hypothesis.
The need for expert knowledge in interest categories. When particular
mathematical content is determined appropriate for personalization, it may be necessary to
consult experts in the relevant interest categories in addition to consulting with mathematics
content experts. For example, persons with expertise in science or sports may have better
ideas about meaningful applications of mathematics in science or sports, respectively,
beyond what a mathematics teacher may know depending on the teacher’s background and
interest. This need to consult with experts in various interest categories can be challenging
and time-consuming; yet, if not done, TPWPs may only have surface-level personalization
that is not meaningful to the particular category. Also challenging is that experts within
110
interest categories may not be familiar with the mathematical skills and prior knowledge
students have in particular grade levels, thus making it difficult for experts to suggest
meaningful mathematical applications that are grade-level appropriate. Inevitably, experts
from various interest categories and mathematics content experts need to collaborate in order
to create meaningful TPWPs.
When to assume interest-specific prior knowledge. Yet another challenge with
using TPWPs is the question of when it should or not be assumed that the student has
particular prior knowledge in the interest category. In typical instructional materials, either
no prior context knowledge is assumed (although prior mathematical knowledge may be
assumed) or the necessary background information is provided for the student. For example,
if a student selects sports as the interest category, should it be assumed that the student
knows what it means to gain or lose yards in football? If no prior knowledge is assumed,
then word problems would become lengthy by providing all of the necessary background
knowledge. Yet, if some prior knowledge was assumed, it is possible that TPWPs would be
more difficult for students if that assumption was false because then students would not have
sufficient prior context knowledge permitting correct interpretation of the TPWP.
Possible novelty effect. As is often the case with new pedagogical strategies, there is
the possibility that the ability for TPWPs to trigger situational interest may have a novelty
effect whereby students initially find TPWPs interesting and then that effect wears off after
repeated exposure to TPWPs. Although future research would need to explore whether such
an effect exists, teachers could potentially reduce the effect of novelty by minimizing the
frequency with which students were exposed to TPWPs. Using a variety of instructional
strategies to trigger situational interest, including TPWPs and other techniques, could help
111
maintain the novelty—and, hence, effectiveness—of those strategies as compared to
repeatedly using the same strategy for triggering situational interest.
Challenges with Using Technology to Create TPWPs
Although TPWPs can be created without the use of computer technology (for
example, a teacher could write individual TPWPs based on the teacher’s knowledge of the
students and community), TPWPs in this study were created with the aid of computer
technology which relied on programmatically substituting students’ names and friends’
names into templates of items based on the responses students provided. Computer-
generating TPWPs – whether for research or practice – presents challenges related to
students’ entering inaccurate interest questionnaire responses, modifying the context of the
problem in a meaningful way, and considering gender pronouns.
Inaccurate interest survey responses. Allowing students to enter responses that then
populate templates for TPWPs can be problematic in several ways. First, students may not
read or follow directions, resulting in students entering different responses than intended by
the directions. For example, based on a visual inspection of name responses provided in this
study, it appeared that a handful of students may have entered a first and last name instead of
their name and a friend’s name. Also, in some cases, students only entered an initial instead
of a full name or did not use proper capitalization on names (e.g., entering names in all
lowercase or all uppercase letters). Additionally, some students entered inappropriate terms
or symbols into text boxes for their names and friends’ names. In a few additional cases,
students entered the same name for themselves as the name entered for the friend’s name,
which would result in a nonsensical word problem instead of one intended to compare two
people. In these cases, the resulting TPWPs would likely be more difficult than a generic
112
word problem because of nonsensical content in the stem of the TPWP resulting from
programmatically substituting incorrect or non-meaningful names.
It is possible that some of these issues could be avoided by providing automatic error
messages after students entered responses, such as “Please use a different name for yourself
and your friend” or “Please do not use any numbers in your name”, and capitalization issues
could be automatically fixed by changing the text so that the first letter was capitalized and
all other letters were lowercase. Some other issues, however, would likely not be easily
identifiable by a computer, such as when a student entered his/her last name instead of a
friend’s name. Also, as students learn that their responses are populating word problems,
some students may be tempted to provide inappropriate responses due to the potential humor
found in seeing inappropriate mathematical word problems. This type of behavior could be
reduced with some teacher or parent oversight, but the amount of time for an adult to check
student responses may not be feasible.
Modifying context of problem. Another challenge related to using computers to
generate TPWPs relates to modifying the context of the problem. In this study, problems
were manually written for each interest category, which had the limitation of only broadly
personalizing problems to students’ interests. It is possible that future work could mine data
from other student activities to collect more detailed information on interests and then use
natural language generation methods to populate models of problems. For example, in the
case of educational technology programs, if students were asked to rate their interest in
problems, as they were in this study, the educational technology could adapt future
curriculum for individual students based on accumulating interest data and learning, so to
speak, what the student findings interesting.

113
Use of gender pronouns. In this study, pronouns for gender (e.g., he/she, his/her)
were not manipulated, as students were not asked to indicate their gender. Problems instead
avoided use of any gender pronouns. This led to some awkward phrasing of item stems
because the student’s name was repeated instead of using a he/she pronoun. A more
advanced TPWP generator could ask the student to report his/her gender on the interest
survey, which could include the option to report preference for use of gender-neutral pronoun
(e.g., they, them), and substitute pronouns appropriately.
Challenges with Conducting Research on TPWPs
In addition to challenges with using TPWPs as an instructional strategy, several
challenges exist related to conducting research on TPWPs due to the need to have matched
sets of generic word problems and TPWPs. In order to create matched pairs of TPWPs and
generic word problems for research purposes, careful attention must be paid to several
features of the item (e.g., text complexity of stem, characteristics of numbers used,
mathematical content, etc.) as was done in this study. To understand the level of challenge
demanded by this task, consider an item that required that a student solve the equation
2x+8=20 with a distractor x=14, where that distractor is based on the student mistake of
adding 20 and 8 before dividing by 2 (i.e., solving 2x=28). Now, when considering writing a
matched equation to 2x+8=20 that has similar numbers, the equation 3x+6=14 might be a
possibility. Both equations are two-step equations with positive numbers; the coefficient and
the constant are single-digit numbers; and the number on the right side of the equation is a
two-digit number. Yet, if the same distractor rationale whereby the student added the
constant terms together before dividing by the coefficient was applied to the second equation,
the resulting equation would be 3x=20 and hence x=6.67. Now, due to applying the same
114
distractor rationale, the attempt at the matched equation has a decimal in the answer choices
which likely makes the two items function differently for students or possibly no longer
match the appropriate grade-level standard.
The aforementioned example is merely one illustrative sample of the challenge of
creating matched problems, and that example only considered the challenge of matching
numbers without regard to the word problem context. For TPWPs, the numbers must also be
applicable to all of the interest categories in a realistic way. For example, consider the real-
life TPWPs presented in Table 27 that utilize factual data and focus on the mathematical skill
of calculating a unit rate. These problems have the benefit of including facts relevant to the
interest categories that may result in a genuine student desire to solve the problem, for
example if a student genuinely wanted to know how many points per game Michael Jordan
scored during his career, as in the case in the sports example. These problems show how it is
possible to achieve somewhat similar numbers across different interest categories and within
the same mathematical skill, yet there are still differences between numbers. To mention one
difference, the science and animals problems involve dividing a four-digit number by a two-
digit number, but the sports and history problems have a three-digit divisor. Subtle
differences in numbers can affect item difficulty (Simpson et al., 2015), however previous
research has shown that differences in number types affect item difficulty less as students
become higher ability (e.g., the difference between dividing a three-digit or four-digit
number might be significant for a fourth-grader but may not matter for a seventh-grader;
Kosh, Simpson, & Bickel, 2015). The questions then becomes “to what extent should
numbers be matched?” and “what criteria would constitute numbers as sufficiently
matched?”. Matching for all possible characteristics of numbers is arguably impossible
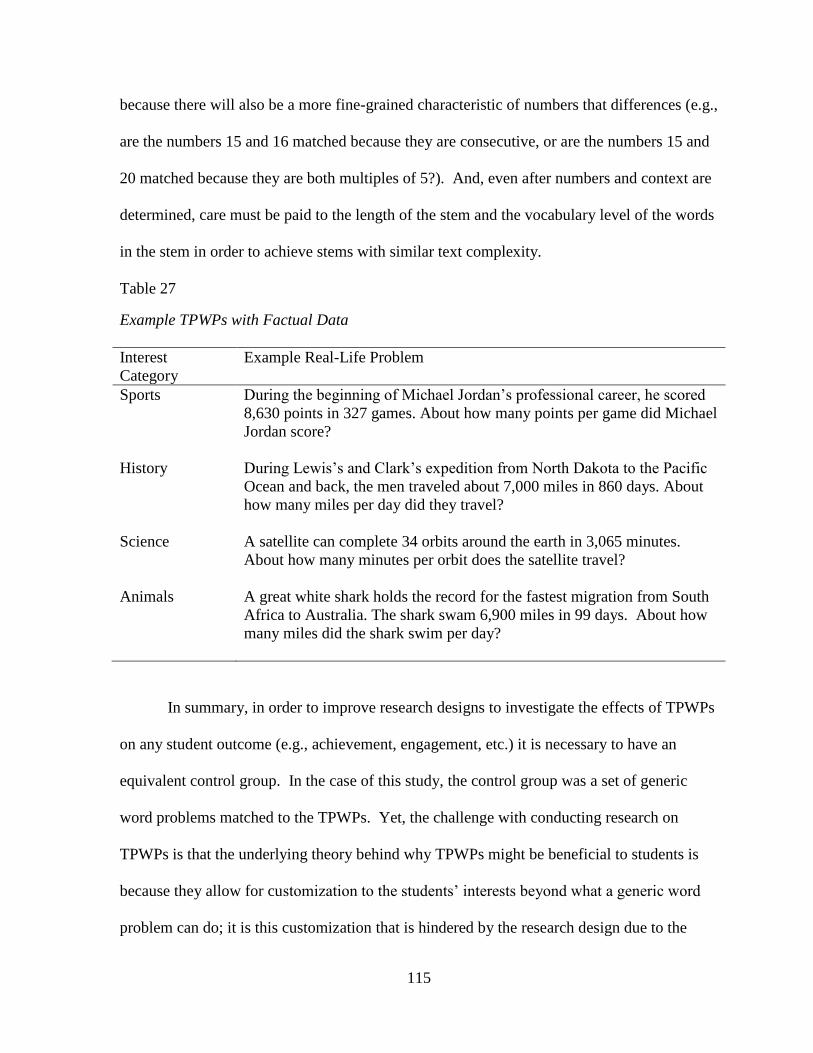
115
because there will also be a more fine-grained characteristic of numbers that differences (e.g.,
are the numbers 15 and 16 matched because they are consecutive, or are the numbers 15 and
20 matched because they are both multiples of 5?). And, even after numbers and context are
determined, care must be paid to the length of the stem and the vocabulary level of the words
in the stem in order to achieve stems with similar text complexity.
Table 27
Example TPWPs with Factual Data
Interest
Category
Example Real-Life Problem
Sports During the beginning of Michael Jordan’s professional career, he scored
8,630 points in 327 games. About how many points per game did Michael
Jordan score?
History During Lewis’s and Clark’s expedition from North Dakota to the Pacific
Ocean and back, the men traveled about 7,000 miles in 860 days. About
how many miles per day did they travel?
Science A satellite can complete 34 orbits around the earth in 3,065 minutes.
About how many minutes per orbit does the satellite travel?
Animals A great white shark holds the record for the fastest migration from South
Africa to Australia. The shark swam 6,900 miles in 99 days. About how
many miles did the shark swim per day?
In summary, in order to improve research designs to investigate the effects of TPWPs
on any student outcome (e.g., achievement, engagement, etc.) it is necessary to have an
equivalent control group. In the case of this study, the control group was a set of generic
word problems matched to the TPWPs. Yet, the challenge with conducting research on
TPWPs is that the underlying theory behind why TPWPs might be beneficial to students is
because they allow for customization to the students’ interests beyond what a generic word
problem can do; it is this customization that is hindered by the research design due to the
116
need to create pairs of equivalent items. When attending to so many details of the problems
in order to create equivalent pairs, there may be little room left for variation according to the
interest category.
Limitations of the Present Research Design
Besides the overarching challenges of conducting research on TPWPs, there were
also specific limitations associated with this study.
Data collected after instruction occurred. As a first limitation, data for this study
were collected the summer following the grade level in which the mathematical skills of the
items were taught, assuming that students’ curriculum during seventh-grade was aligned to
the seventh-grade CCSSM. It is possible that student performance benefits of TPWPs would
only occur during introduction to new material because, perhaps, students have already
solidified their ideas and processes for mathematical skills by the time instruction ends.
Limitations of the interest categories. A second limitation of this study relates to
how the interest categories where developed, where responses to the question “What do you
want to read about?” were coded to identify themes in students’ interests. Results from this
method indicated a wide range of sub-interests within an interest category (e.g., ice skating,
motocross, and football were all coded as sports), thus possibly indicating that the level of
granularity in the interest categories was not fine-grained enough to sufficiently match to
students’ interests. For example, a student may select “sports” as the interest category
because he or she enjoys tennis. But, if all of the sports-targeted problems were about
soccer, baseball, football, and basketball, then the student would not have received a context
targeted to his or her main interest. Similarly, a student may not have been interested in any
of the available categories. Also, relying on responses to the question “What do you want to
117
read about today?” could yield different responses for students’ interests in reading as
compared to topics students might want to see in mathematics problems. Finally, the interest
category that was identified in inductive coding but removed from the study, history, was
also the category with the greatest frequency of coded responses, thus perhaps removing a
large percentage of students’ first-choice topic interests.
Limitations of the participant sample. Another limitation relates to the sample
obtained for the study. Students voluntarily participated in the SMC, and participation rates
tended to decrease as the program progressed throughout the six-weeks of the SMC. Thus,
the students that completed all three sessions of data collection – and hence were more
strongly represented in data analysis – for this study were possibly more intrinsically
motivated and potentially higher-achieving students as compared to the general population of
middle school students. Additionally, in order to access the SMC, students had to have
internet access and access to computers over the summer, which could have resulted in a
sample of participants that excluded students of lower socioeconomic status who may not
have had access to such resources. Furthermore, the study only included one grade level of
students, and students’ grade level was self-reported. It is possible that some students
enrolled in the SMC as a rising eighth-grader were actually enrolled in a different grade in
school.
Possible Hawthorne effect. The Hawthorne effect (Cook, 1962) is when study
participants may modify their behavior when they know they are in a treatment group for a
research study. In this study, due to Institutional Review Board requirements, students were
informed they were participating in a research study. Also, due to the need to explain to
parents and students why data were being collected about students’ interests, students’
118
names, and students’ friends’ names, students were told that they would receive word
problems customized to their interests. Due to this transparency, it is possible that students
guessed the purpose or hypothesis of the research study and were more likely to rate TPWPs
as interesting because students perceived that was the behavior that aligned to the research
hypothesis.
Future Research
Directions for future research could include both modifying the existing study to
reduce the aforementioned limitations as well as posing additional research questions.
Modifications to research design in this study. The limitations of this study could
be addressed with future research in at least five ways. For one, a study could be situated in
the context of students learning new material as opposed to reviewing material the summer
after the school year in which it was taught. Second, relatedly, a study could use a between-
subjects design that randomly assigned students to a personalized condition or a control
condition, where the personalized condition focused on instruction of new material with
personalization. Third, a student interest inventory in mathematics could be used as a level-2
predictor to control for students’ overall interest in mathematics, which would help clarify
results about how personalization, interest, and performance relate to each other. Fourth, the
level-2 variable used in the present study, perceived student ability, could also be replaced
with a more reliable measure with valid inferences of study ability, as opposed to the
minimally-informative measure in this study that merely asked whether the child generally
found math at grade level easy, about average, or difficult. Fifth, a study could separate the
effects of incidental personalization and topic personalization in order to avoid confounding
the two types of personalization by offering four types of problems to students: 1) generic
119
word problems, 2) word problems personalized only with incidental features, 3) word
problems personalized only to interest category, and 4) word problems personalized both to
interest categories and with incidental personalization as well. This type of design would
allow estimates of main effects for incidental and topic personalization as well as the
interaction (i.e., combination) of both incidental and topic personalization.
Exploring the possible mechanism of action. The mechanism of action, presented in
Chapter 1, theorized that students might perform better when receiving TPWPs as compared
to generic word problems because TPWPs would trigger situational interest and hence
capitalize upon the heightened attention, increased affect, and reduced extrinsic cognitive
load associated with situational interest (Ainley, Hidi, & Berndorff, 2002; Hidi & Renninger,
2006; Hidi & Ainley, 2008; McDaniel, Waddil, Finstad, & Bourg; 2000; Yen, Chen, Lai, &
Chuang, 2015; Park, 2015). Although TPWPs predicted a greater likelihood of rating a
problem as interesting and hence provided evidence that TPWPs triggered situational
interest, no statistically significant effect was found for the effect of TPWPs on student
performance beyond the effect of interest. Future research could collect data on these
outcomes of situational interest (e.g., heightened attention, increased affect, and reduced
extrinsic cognitive load) in both the case of TPWPs and other means of triggering situational
interest in order to further understanding about when situational interest may or may not lead
to improved student performance or learning outcomes. Such research would help educators
better understand how to trigger students’ situational interest in ways that would effectively
and efficiently improve student learning.
Effects of TPWP on variables besides student performance. I focused on the effect of
TPWPs on student performance, including accuracy and speed of answering word problems.
120
It is possible that TPWPs may positively affect other variables, such as students’ overall
interest in mathematics, student engagement in mathematics activities, or students’
perceptions about the relevance of mathematics to their personal lives. In fact, although not
formally explored in this study as a research question, data cleaning revealed that many
students completed the data collection instrument more than once by completing the
instrument for a particular interest category and then completing it again for a different
interest category, possibly indicating an engagement effect. No formal conclusions can be
drawn from this, however, because no comparison data were included in this study about
how many students may or may not have also repeated other activities in the SMC.
Future research could investigate effects of TPWPs on variables beyond student
performance, for example by randomly assigning students to either receive TPWPs or
generic word problems and then providing an instrument after administering the problem to
measure students’ perceptions about mathematics (e.g., an instrument that asked students to
agree or disagree to statements such as “I believe I will need to use math in my career” or
“The skills I learn in math class are important”). Relatedly, if researchers were trying to
increase students’ feelings of mathematics as a beneficial field of study, problems could be
personalized according to students’ career goals (A. Stenner, personal communication,
September 21, 2015). For example, if a student indicated wanting to be a doctor, that student
would receive word problems reflecting the type of mathematics doctors do in their everyday
jobs. Another example, related to collecting data on student engagement, is to assign
participants to receive either all TPWPs or all generic word problems and see if students
receiving TPWPs complete more problems than students receiving generic word problems,
thus indicating how many problems students voluntarily completed in a low-stakes
121
environment. Variables such as these (e.g., perceptions about mathematics, engagement)
may have a future effect on achievement or on the likelihood of students pursuing advanced
mathematics training or entering careers with a mathematical focus.
Potential applications of TPWPs in student assessment. Although TPWPs were posed
as a potential instructional strategy in the context of this study, TPWPs may also have
applications in assessment of student learning. The use of TPWPs on assessment could
potentially increase student motivation for completing test items; future research could use
response time data to identify if students are possibly less likely to rapidly guess on TPWPs
as compared to generic problems. As a first step, however, the psychometric properties of
matched items in different interest categories should be compared to ensure that items across
different interest categories function similarly psychometrically. For example, a student
receiving a set of TPWPs about sports and a different student receiving a set of TPWPs about
animals would need to receive comparably difficult items in order to produce fair, parallel
tests. Future research would need to investigate these psychometric properties, likely
beginning with the use of TPWPs on low-stakes tests.
Summary
The purpose of this study was to investigate student performance on TPWPs in
middle school mathematics by 1) determining how TPWPs related to students’ ratings of
problems as interesting or not, 2) determining how TPWPs and interest ratings related to
correct response to word problems, and 3) exploring how TPWPs affected the amount of
time students spent solving problems. Using a sample of 343 rising eighth-graders
completing approximately 6,000 items, results indicated that TPWPs triggered students
interests as compared to matched generic problems and that students were more likely to
122
answer problems correctly when students rated the problem as interesting. No evidence was
found that students were more likely to answer TPWPs correctly after accounting for other
control variables, including interest ratings; however, students were more likely to answer
word problems correctly when students found the problems interesting. No evidence was
found for an effect of TPWPs on response time. Results suggest the strong role of student
interest in particular word problems as a predictor of student performance on those same
problems.
In this final chapter, I discussed challenges of developing TPWPs and conducting
research with TPWPs, such as the difficulty of modifying word problems to match a wide
range of students’ interests and developing matched generic word problems with a sufficient
level of comparability to TPWPs. I also delineated limitations of the research, including the
fact that data collection occurred after instruction of mathematics concepts as opposed to
during learning new material, the broad nature of the interest categories, a rather
homogenous sample with respect to ability and motivation, and a possible Hawthorne effect.
Future research should consider additional predictor variables (e.g., a more detailed ability
measure or an overall interest measure) and possibly consider how TPWPs affect other
outcome variables besides accuracy and response time, such as student engagement or
students’ perceptions of mathematics as an important topic of study.
Despite the limitations of the present study and the challenges with producing
TPWPs, the results of this research support the possible role that educators can have on
students’ mathematics learning when they incorporate strategies to heighten student interest
and engagement in mathematics. Results indicated that student performance – as measured
by mathematical accuracy – was predicted by students’ interest in the mathematics content.
123
Thus, when educators, parents, or curriculum developers incorporate strategies to raise
student interest in content, students may demonstrate greater academic performance. It is
possible that this result extends to content areas beyond mathematics, and stakeholders
should investigate means of increasing student interest and engagement beyond the strategy
that was investigated in the present study (i.e., TPWPs), particularly because of the resource-
intensive nature of writing word problems for multiple interest categories and the limited
amount of personalization that can be achieved with using a computer-based template
approach to TPWP generation. For example, educators could incorporate a variety of
informal learning activities, real-life applications, classroom games, innovative and exciting
new technology, and other means to trigger students’ situational interest and eventually lead
students toward a well-developed interest in mathematics.
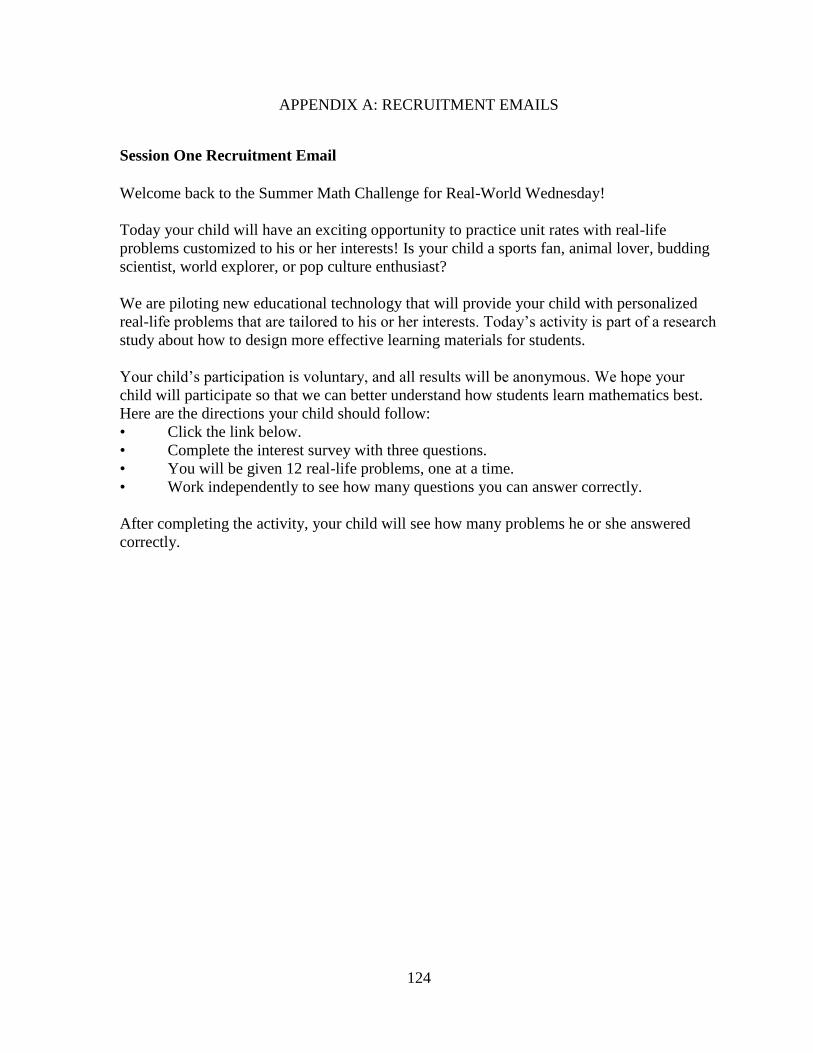
124
APPENDIX A: RECRUITMENT EMAILS
Session One Recruitment Email
Welcome back to the Summer Math Challenge for Real-World Wednesday!
Today your child will have an exciting opportunity to practice unit rates with real-life
problems customized to his or her interests! Is your child a sports fan, animal lover, budding
scientist, world explorer, or pop culture enthusiast?
We are piloting new educational technology that will provide your child with personalized
real-life problems that are tailored to his or her interests. Today’s activity is part of a research
study about how to design more effective learning materials for students.
Your child’s participation is voluntary, and all results will be anonymous. We hope your
child will participate so that we can better understand how students learn mathematics best.
Here are the directions your child should follow:
• Click the link below.
• Complete the interest survey with three questions.
• You will be given 12 real-life problems, one at a time.
• Work independently to see how many questions you can answer correctly.
After completing the activity, your child will see how many problems he or she answered
correctly.

125
Session Two Recruitment Email
Welcome back to the Summer Math Challenge for Real-World Wednesday!
Today your child will have an exciting opportunity to practice integer operations with real-
life problems customized to his or her interests! Is your child a sports fan, animal lover,
budding scientist, world explorer, or pop culture enthusiast?
We are piloting new educational technology that will provide your child with personalized
real-life problems that are tailored to his or her interests. Today’s activity is the second part
of a research study about how to design more effective learning materials for students.
Your child’s participation is voluntary, and all results will be anonymous. We hope your
child will participate so that we can better understand how students learn mathematics best.
Here are the directions your child should follow:
• Click the link below.
• Complete the interest survey with three questions.
• You will be given 12 real-life problems, one at a time.
• Work independently without a calculator to see how many questions you can answer
correctly.
After completing the activity, your child will see how many problems he or she answered
correctly.

126
Session Three Recruitment Email
Welcome back to the Summer Math Challenge for Real-World Wednesday!
Today your child will have an exciting opportunity to practice equations and inequalities
with real-life problems customized to his or her interests! Is your child a sports fan, animal
lover, budding scientist, world explorer, or pop culture enthusiast?
We are piloting new educational technology that will provide your child with personalized
real-life problems that are tailored to his or her interests. Today’s activity is part of a research
study about how to design more effective learning materials for students.
Your child’s participation is voluntary, and all results will be anonymous. We hope your
child will participate so that we can better understand how students learn mathematics best.
Here are the directions your child should follow:
• Click the link below.
• Complete the interest survey with three questions.
• You will be given 12 real-life problems, one at a time.
• Work independently to see how many questions you can answer correctly.
After completing the activity, your child will see how many problems he or she answered
correctly.
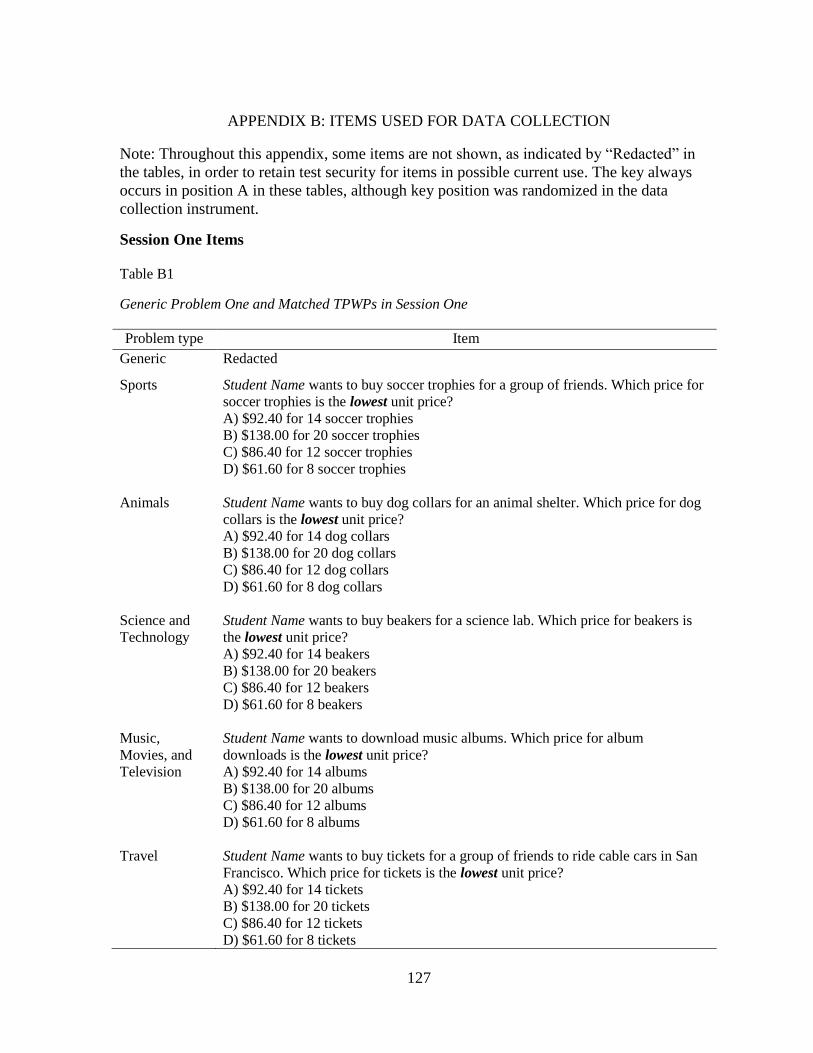
127
APPENDIX B: ITEMS USED FOR DATA COLLECTION
Note: Throughout this appendix, some items are not shown, as indicated by “Redacted” in
the tables, in order to retain test security for items in possible current use. The key always
occurs in position A in these tables, although key position was randomized in the data
collection instrument.
Session One Items
Table B1
Generic Problem One and Matched TPWPs in Session One
Problem type Item
Generic Redacted
Sports Student Name wants to buy soccer trophies for a group of friends. Which price for
soccer trophies is the lowest unit price?
A) $92.40 for 14 soccer trophies
B) $138.00 for 20 soccer trophies
C) $86.40 for 12 soccer trophies
D) $61.60 for 8 soccer trophies
Animals Student Name wants to buy dog collars for an animal shelter. Which price for dog
collars is the lowest unit price?
A) $92.40 for 14 dog collars
B) $138.00 for 20 dog collars
C) $86.40 for 12 dog collars
D) $61.60 for 8 dog collars
Science and
Technology
Student Name wants to buy beakers for a science lab. Which price for beakers is
the lowest unit price?
A) $92.40 for 14 beakers
B) $138.00 for 20 beakers
C) $86.40 for 12 beakers
D) $61.60 for 8 beakers
Music,
Movies, and
Television
Student Name wants to download music albums. Which price for album
downloads is the lowest unit price?
A) $92.40 for 14 albums
B) $138.00 for 20 albums
C) $86.40 for 12 albums
D) $61.60 for 8 albums
Travel Student Name wants to buy tickets for a group of friends to ride cable cars in San
Francisco. Which price for tickets is the lowest unit price?
A) $92.40 for 14 tickets
B) $138.00 for 20 tickets
C) $86.40 for 12 tickets
D) $61.60 for 8 tickets
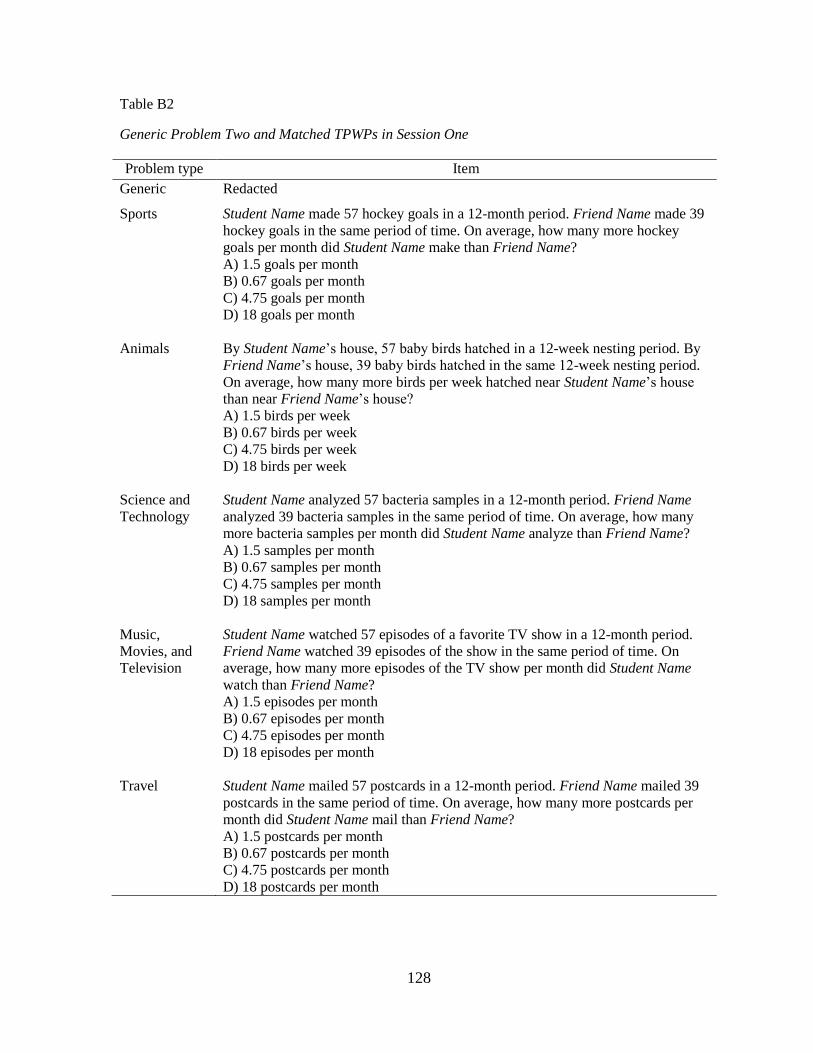
128
Table B2
Generic Problem Two and Matched TPWPs in Session One
Problem type Item
Generic Redacted
Sports Student Name made 57 hockey goals in a 12-month period. Friend Name made 39
hockey goals in the same period of time. On average, how many more hockey
goals per month did Student Name make than Friend Name?
A) 1.5 goals per month
B) 0.67 goals per month
C) 4.75 goals per month
D) 18 goals per month
Animals By Student Name’s house, 57 baby birds hatched in a 12-week nesting period. By
Friend Name’s house, 39 baby birds hatched in the same 12-week nesting period.
On average, how many more birds per week hatched near Student Name’s house
than near Friend Name’s house?
A) 1.5 birds per week
B) 0.67 birds per week
C) 4.75 birds per week
D) 18 birds per week
Science and
Technology
Student Name analyzed 57 bacteria samples in a 12-month period. Friend Name
analyzed 39 bacteria samples in the same period of time. On average, how many
more bacteria samples per month did Student Name analyze than Friend Name?
A) 1.5 samples per month
B) 0.67 samples per month
C) 4.75 samples per month
D) 18 samples per month
Music,
Movies, and
Television
Student Name watched 57 episodes of a favorite TV show in a 12-month period.
Friend Name watched 39 episodes of the show in the same period of time. On
average, how many more episodes of the TV show per month did Student Name
watch than Friend Name?
A) 1.5 episodes per month
B) 0.67 episodes per month
C) 4.75 episodes per month
D) 18 episodes per month
Travel Student Name mailed 57 postcards in a 12-month period. Friend Name mailed 39
postcards in the same period of time. On average, how many more postcards per
month did Student Name mail than Friend Name?
A) 1.5 postcards per month
B) 0.67 postcards per month
C) 4.75 postcards per month
D) 18 postcards per month
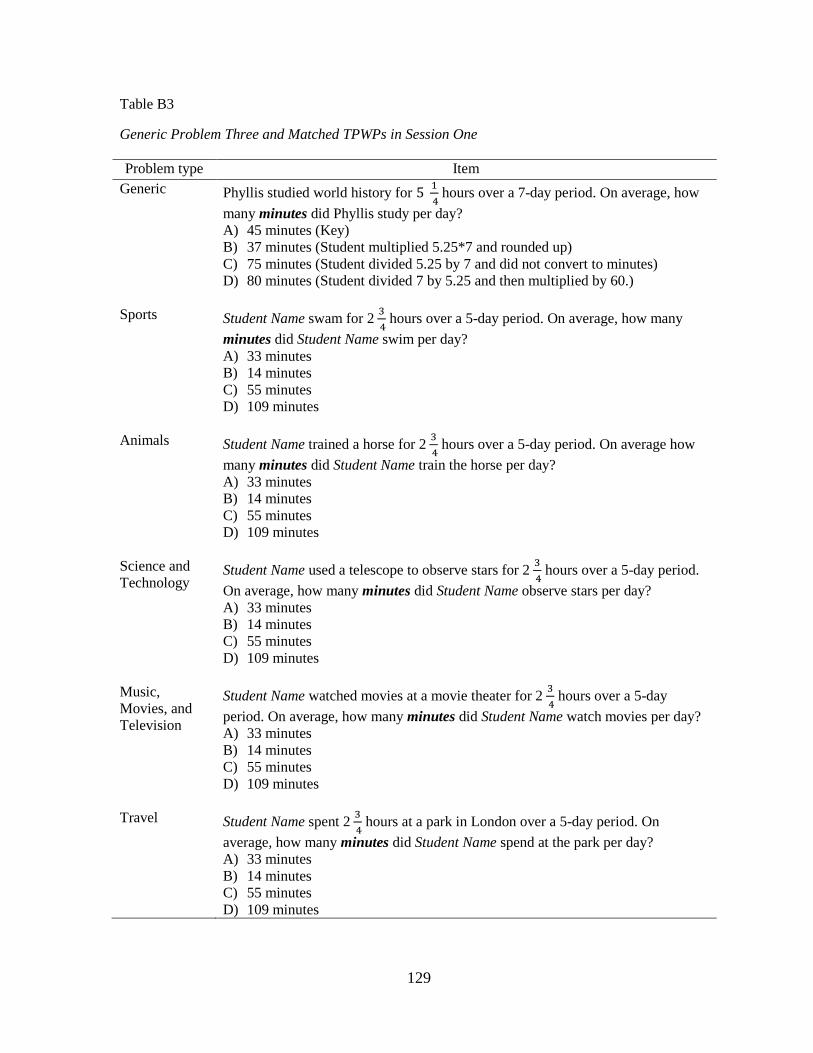
129
Table B3
Generic Problem Three and Matched TPWPs in Session One
Problem type Item
Generic Phyllis studied world history for 51
4 hours over a 7-day period. On average, how
many minutes did Phyllis study per day?
A) 45 minutes (Key)
B) 37 minutes (Student multiplied 5.25*7 and rounded up)
C) 75 minutes (Student divided 5.25 by 7 and did not convert to minutes)
D) 80 minutes (Student divided 7 by 5.25 and then multiplied by 60.)
Sports Student Name swam for 23
4 hours over a 5-day period. On average, how many
minutes did Student Name swim per day?
A) 33 minutes
B) 14 minutes
C) 55 minutes
D) 109 minutes
Animals Student Name trained a horse for 23
4 hours over a 5-day period. On average how
many minutes did Student Name train the horse per day?
A) 33 minutes
B) 14 minutes
C) 55 minutes
D) 109 minutes
Science and
Technology Student Name used a telescope to observe stars for 2
3
4 hours over a 5-day period.
On average, how many minutes did Student Name observe stars per day?
A) 33 minutes
B) 14 minutes
C) 55 minutes
D) 109 minutes
Music,
Movies, and
Television
Student Name watched movies at a movie theater for 23
4 hours over a 5-day
period. On average, how many minutes did Student Name watch movies per day?
A) 33 minutes
B) 14 minutes
C) 55 minutes
D) 109 minutes
Travel Student Name spent 23
4 hours at a park in London over a 5-day period. On
average, how many minutes did Student Name spend at the park per day?
A) 33 minutes
B) 14 minutes
C) 55 minutes
D) 109 minutes
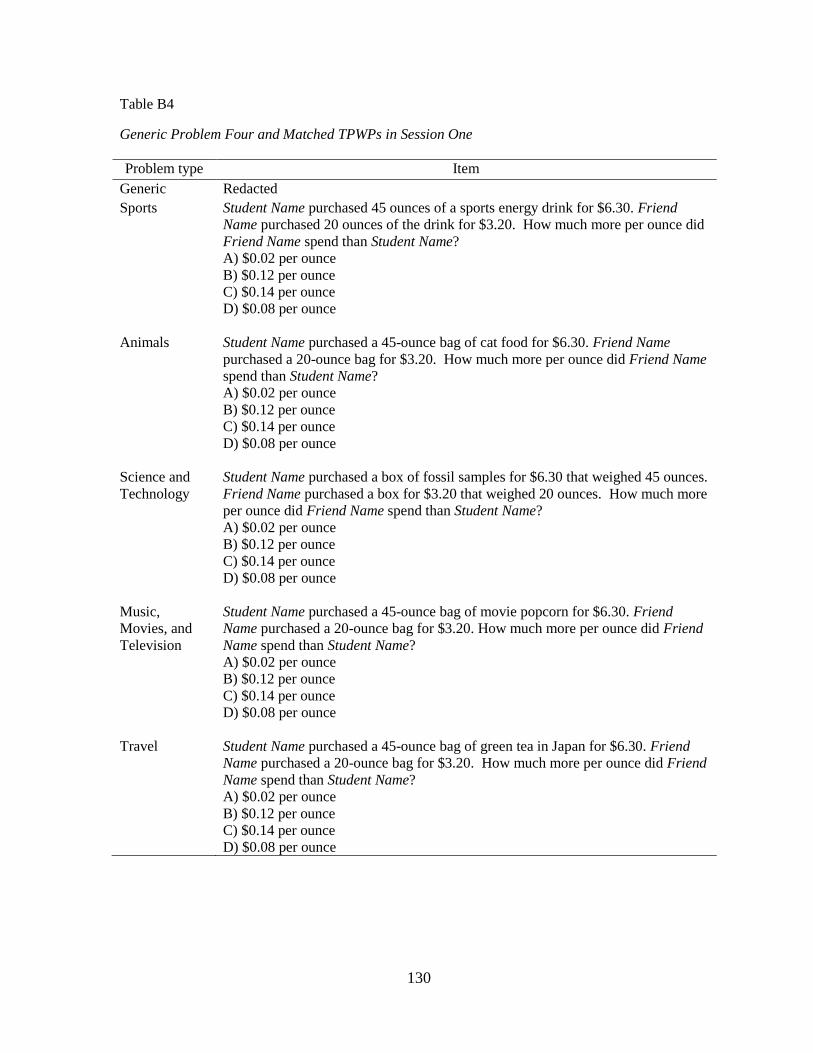
130
Table B4
Generic Problem Four and Matched TPWPs in Session One
Problem type Item
Generic Redacted
Sports Student Name purchased 45 ounces of a sports energy drink for $6.30. Friend
Name purchased 20 ounces of the drink for $3.20. How much more per ounce did
Friend Name spend than Student Name?
A) $0.02 per ounce
B) $0.12 per ounce
C) $0.14 per ounce
D) $0.08 per ounce
Animals Student Name purchased a 45-ounce bag of cat food for $6.30. Friend Name
purchased a 20-ounce bag for $3.20. How much more per ounce did Friend Name
spend than Student Name?
A) $0.02 per ounce
B) $0.12 per ounce
C) $0.14 per ounce
D) $0.08 per ounce
Science and
Technology
Student Name purchased a box of fossil samples for $6.30 that weighed 45 ounces.
Friend Name purchased a box for $3.20 that weighed 20 ounces. How much more
per ounce did Friend Name spend than Student Name?
A) $0.02 per ounce
B) $0.12 per ounce
C) $0.14 per ounce
D) $0.08 per ounce
Music,
Movies, and
Television
Student Name purchased a 45-ounce bag of movie popcorn for $6.30. Friend
Name purchased a 20-ounce bag for $3.20. How much more per ounce did Friend
Name spend than Student Name?
A) $0.02 per ounce
B) $0.12 per ounce
C) $0.14 per ounce
D) $0.08 per ounce
Travel Student Name purchased a 45-ounce bag of green tea in Japan for $6.30. Friend
Name purchased a 20-ounce bag for $3.20. How much more per ounce did Friend
Name spend than Student Name?
A) $0.02 per ounce
B) $0.12 per ounce
C) $0.14 per ounce
D) $0.08 per ounce
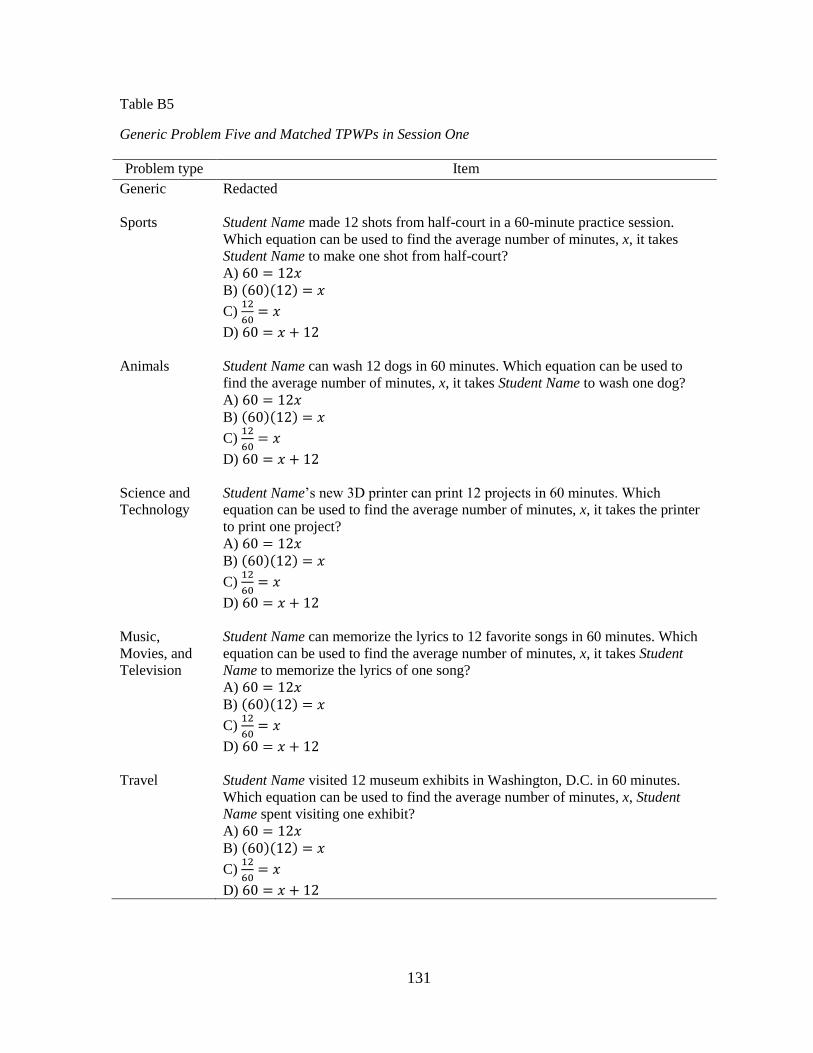
131
Table B5
Generic Problem Five and Matched TPWPs in Session One
Problem type Item
Generic Redacted
Sports Student Name made 12 shots from half-court in a 60-minute practice session.
Which equation can be used to find the average number of minutes, x, it takes
Student Name to make one shot from half-court?
A) 60 = 12𝑥
B) (60)(12) = 𝑥
C) 12
60= 𝑥
D) 60 = 𝑥 + 12
Animals Student Name can wash 12 dogs in 60 minutes. Which equation can be used to
find the average number of minutes, x, it takes Student Name to wash one dog?
A) 60 = 12𝑥
B) (60)(12) = 𝑥
C) 12
60= 𝑥
D) 60 = 𝑥 + 12
Science and
Technology
Student Name’s new 3D printer can print 12 projects in 60 minutes. Which
equation can be used to find the average number of minutes, x, it takes the printer
to print one project?
A) 60 = 12𝑥
B) (60)(12) = 𝑥
C) 12
60= 𝑥
D) 60 = 𝑥 + 12
Music,
Movies, and
Television
Student Name can memorize the lyrics to 12 favorite songs in 60 minutes. Which
equation can be used to find the average number of minutes, x, it takes Student
Name to memorize the lyrics of one song?
A) 60 = 12𝑥
B) (60)(12) = 𝑥
C) 12
60= 𝑥
D) 60 = 𝑥 + 12
Travel Student Name visited 12 museum exhibits in Washington, D.C. in 60 minutes.
Which equation can be used to find the average number of minutes, x, Student
Name spent visiting one exhibit?
A) 60 = 12𝑥
B) (60)(12) = 𝑥
C) 12
60= 𝑥
D) 60 = 𝑥 + 12
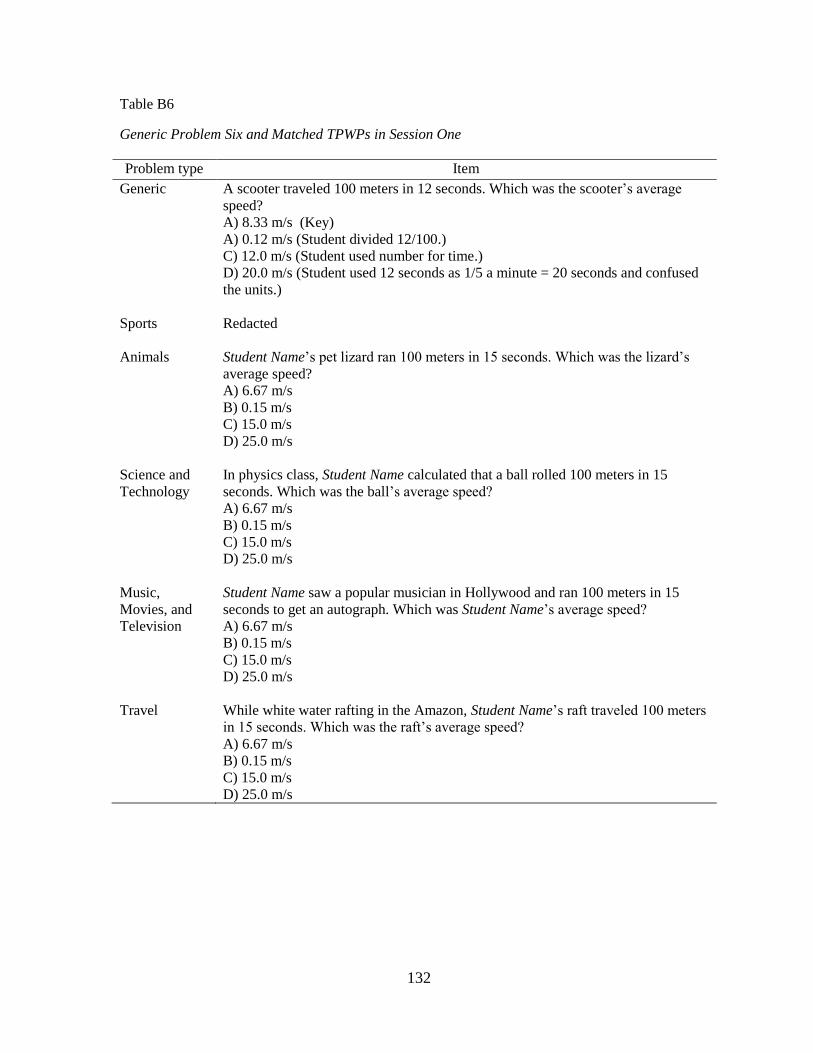
132
Table B6
Generic Problem Six and Matched TPWPs in Session One
Problem type Item
Generic A scooter traveled 100 meters in 12 seconds. Which was the scooter’s average
speed?
A) 8.33 m/s (Key)
A) 0.12 m/s (Student divided 12/100.)
C) 12.0 m/s (Student used number for time.)
D) 20.0 m/s (Student used 12 seconds as 1/5 a minute = 20 seconds and confused
the units.)
Sports Redacted
Animals Student Name’s pet lizard ran 100 meters in 15 seconds. Which was the lizard’s
average speed?
A) 6.67 m/s
B) 0.15 m/s
C) 15.0 m/s
D) 25.0 m/s
Science and
Technology
In physics class, Student Name calculated that a ball rolled 100 meters in 15
seconds. Which was the ball’s average speed?
A) 6.67 m/s
B) 0.15 m/s
C) 15.0 m/s
D) 25.0 m/s
Music,
Movies, and
Television
Student Name saw a popular musician in Hollywood and ran 100 meters in 15
seconds to get an autograph. Which was Student Name’s average speed?
A) 6.67 m/s
B) 0.15 m/s
C) 15.0 m/s
D) 25.0 m/s
Travel While white water rafting in the Amazon, Student Name’s raft traveled 100 meters
in 15 seconds. Which was the raft’s average speed?
A) 6.67 m/s
B) 0.15 m/s
C) 15.0 m/s
D) 25.0 m/s
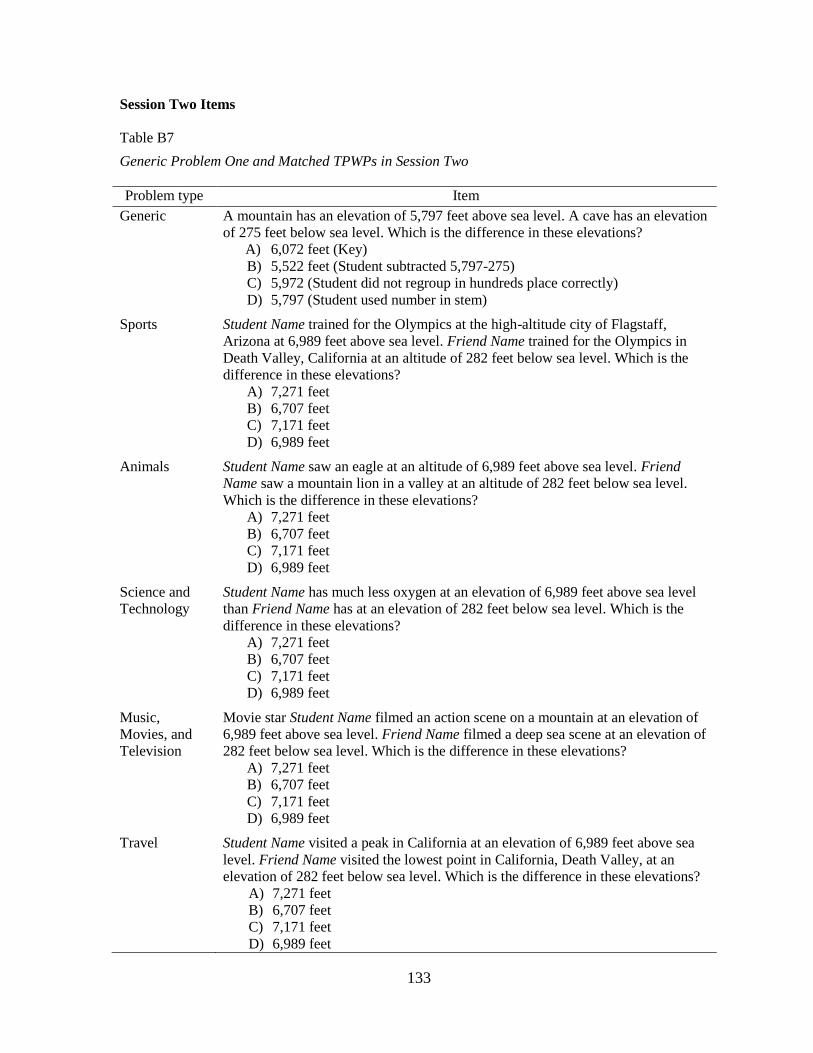
133
Session Two Items
Table B7
Generic Problem One and Matched TPWPs in Session Two
Problem type Item
Generic A mountain has an elevation of 5,797 feet above sea level. A cave has an elevation
of 275 feet below sea level. Which is the difference in these elevations?
A) 6,072 feet (Key)
B) 5,522 feet (Student subtracted 5,797-275)
C) 5,972 (Student did not regroup in hundreds place correctly)
D) 5,797 (Student used number in stem)
Sports Student Name trained for the Olympics at the high-altitude city of Flagstaff,
Arizona at 6,989 feet above sea level. Friend Name trained for the Olympics in
Death Valley, California at an altitude of 282 feet below sea level. Which is the
difference in these elevations?
A) 7,271 feet
B) 6,707 feet
C) 7,171 feet
D) 6,989 feet
Animals Student Name saw an eagle at an altitude of 6,989 feet above sea level. Friend
Name saw a mountain lion in a valley at an altitude of 282 feet below sea level.
Which is the difference in these elevations?
A) 7,271 feet
B) 6,707 feet
C) 7,171 feet
D) 6,989 feet
Science and
Technology
Student Name has much less oxygen at an elevation of 6,989 feet above sea level
than Friend Name has at an elevation of 282 feet below sea level. Which is the
difference in these elevations?
A) 7,271 feet
B) 6,707 feet
C) 7,171 feet
D) 6,989 feet
Music,
Movies, and
Television
Movie star Student Name filmed an action scene on a mountain at an elevation of
6,989 feet above sea level. Friend Name filmed a deep sea scene at an elevation of
282 feet below sea level. Which is the difference in these elevations?
A) 7,271 feet
B) 6,707 feet
C) 7,171 feet
D) 6,989 feet
Travel Student Name visited a peak in California at an elevation of 6,989 feet above sea
level. Friend Name visited the lowest point in California, Death Valley, at an
elevation of 282 feet below sea level. Which is the difference in these elevations?
A) 7,271 feet
B) 6,707 feet
C) 7,171 feet
D) 6,989 feet
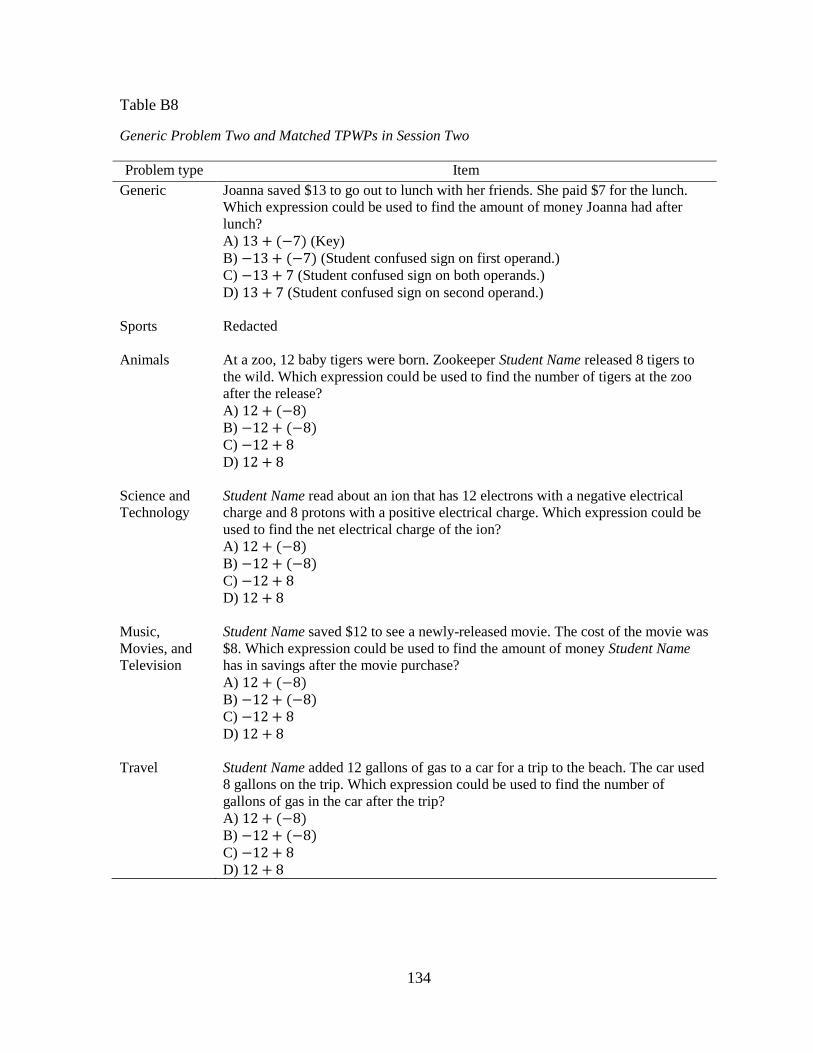
134
Table B8
Generic Problem Two and Matched TPWPs in Session Two
Problem type Item
Generic Joanna saved $13 to go out to lunch with her friends. She paid $7 for the lunch.
Which expression could be used to find the amount of money Joanna had after
lunch?
A) 13 + (−7) (Key)
B) −13 + (−7) (Student confused sign on first operand.)
C) −13 + 7 (Student confused sign on both operands.)
D) 13 + 7 (Student confused sign on second operand.)
Sports Redacted
Animals At a zoo, 12 baby tigers were born. Zookeeper Student Name released 8 tigers to
the wild. Which expression could be used to find the number of tigers at the zoo
after the release?
A) 12 + (−8) B) −12 + (−8) C) −12 + 8
D) 12 + 8
Science and
Technology
Student Name read about an ion that has 12 electrons with a negative electrical
charge and 8 protons with a positive electrical charge. Which expression could be
used to find the net electrical charge of the ion?
A) 12 + (−8) B) −12 + (−8) C) −12 + 8
D) 12 + 8
Music,
Movies, and
Television
Student Name saved $12 to see a newly-released movie. The cost of the movie was
$8. Which expression could be used to find the amount of money Student Name
has in savings after the movie purchase?
A) 12 + (−8) B) −12 + (−8) C) −12 + 8
D) 12 + 8
Travel Student Name added 12 gallons of gas to a car for a trip to the beach. The car used
8 gallons on the trip. Which expression could be used to find the number of
gallons of gas in the car after the trip?
A) 12 + (−8) B) −12 + (−8) C) −12 + 8
D) 12 + 8
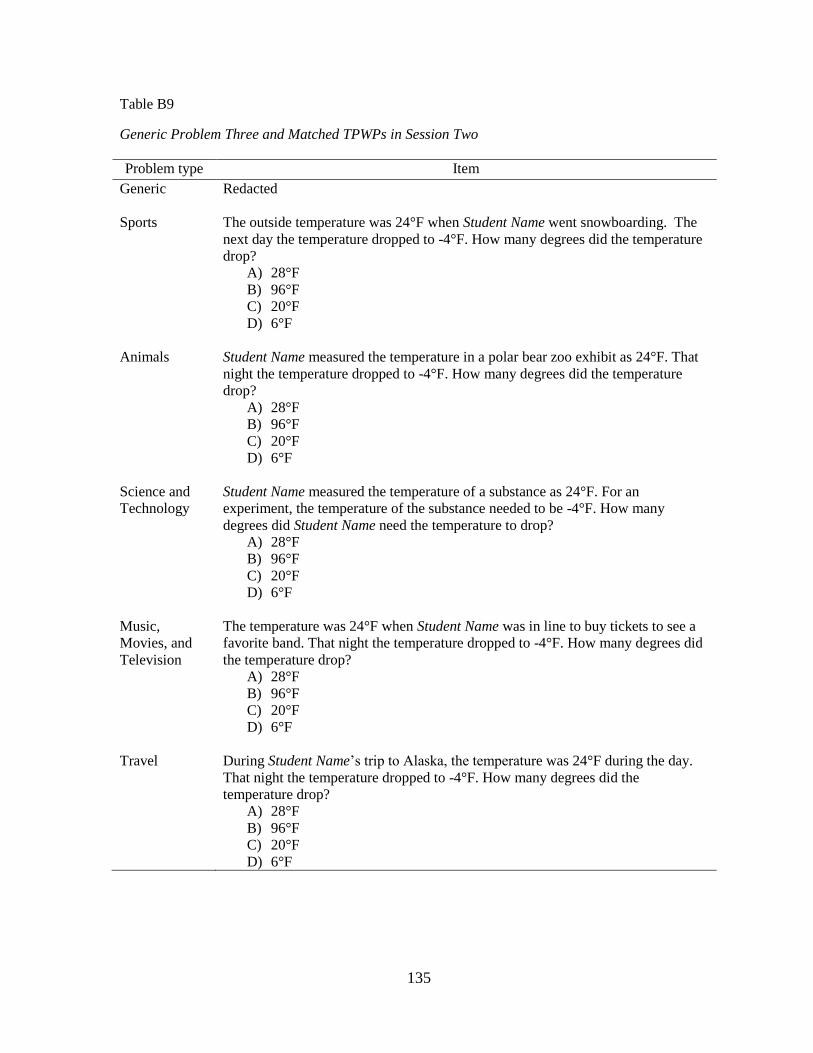
135
Table B9
Generic Problem Three and Matched TPWPs in Session Two
Problem type Item
Generic Redacted
Sports The outside temperature was 24°F when Student Name went snowboarding. The
next day the temperature dropped to -4°F. How many degrees did the temperature
drop?
A) 28°F
B) 96°F
C) 20°F
D) 6°F
Animals Student Name measured the temperature in a polar bear zoo exhibit as 24°F. That
night the temperature dropped to -4°F. How many degrees did the temperature
drop?
A) 28°F
B) 96°F
C) 20°F
D) 6°F
Science and
Technology
Student Name measured the temperature of a substance as 24°F. For an
experiment, the temperature of the substance needed to be -4°F. How many
degrees did Student Name need the temperature to drop?
A) 28°F
B) 96°F
C) 20°F
D) 6°F
Music,
Movies, and
Television
The temperature was 24°F when Student Name was in line to buy tickets to see a
favorite band. That night the temperature dropped to -4°F. How many degrees did
the temperature drop?
A) 28°F
B) 96°F
C) 20°F
D) 6°F
Travel During Student Name’s trip to Alaska, the temperature was 24°F during the day.
That night the temperature dropped to -4°F. How many degrees did the
temperature drop?
A) 28°F
B) 96°F
C) 20°F
D) 6°F
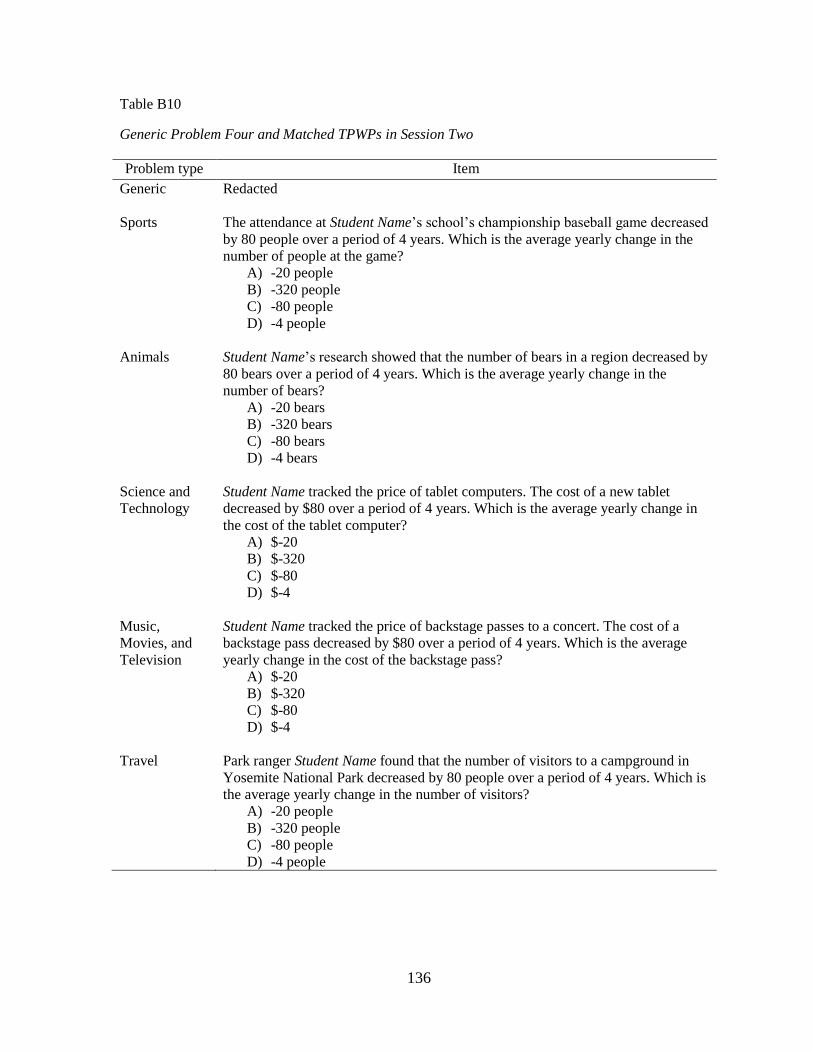
136
Table B10
Generic Problem Four and Matched TPWPs in Session Two
Problem type Item
Generic Redacted
Sports The attendance at Student Name’s school’s championship baseball game decreased
by 80 people over a period of 4 years. Which is the average yearly change in the
number of people at the game?
A) -20 people
B) -320 people
C) -80 people
D) -4 people
Animals Student Name’s research showed that the number of bears in a region decreased by
80 bears over a period of 4 years. Which is the average yearly change in the
number of bears?
A) -20 bears
B) -320 bears
C) -80 bears
D) -4 bears
Science and
Technology
Student Name tracked the price of tablet computers. The cost of a new tablet
decreased by $80 over a period of 4 years. Which is the average yearly change in
the cost of the tablet computer?
A) $-20
B) $-320
C) $-80
D) $-4
Music,
Movies, and
Television
Student Name tracked the price of backstage passes to a concert. The cost of a
backstage pass decreased by $80 over a period of 4 years. Which is the average
yearly change in the cost of the backstage pass?
A) $-20
B) $-320
C) $-80
D) $-4
Travel Park ranger Student Name found that the number of visitors to a campground in
Yosemite National Park decreased by 80 people over a period of 4 years. Which is
the average yearly change in the number of visitors?
A) -20 people
B) -320 people
C) -80 people
D) -4 people
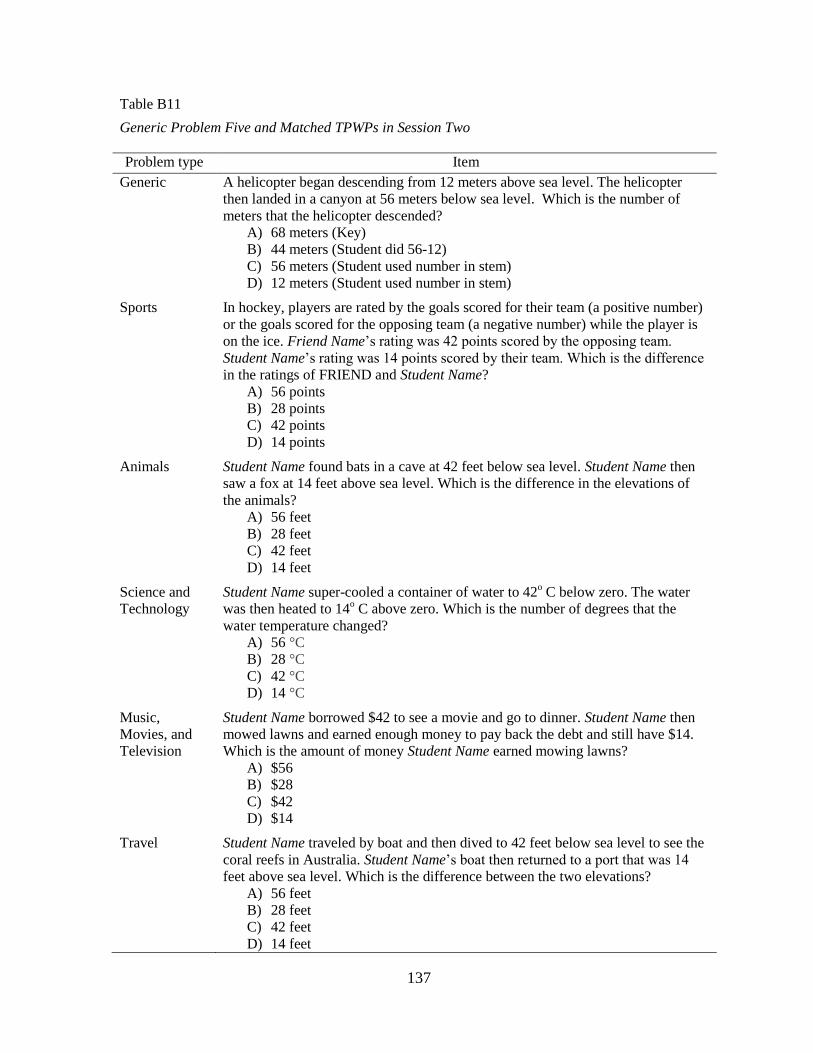
137
Table B11
Generic Problem Five and Matched TPWPs in Session Two
Problem type Item
Generic A helicopter began descending from 12 meters above sea level. The helicopter
then landed in a canyon at 56 meters below sea level. Which is the number of
meters that the helicopter descended?
A) 68 meters (Key)
B) 44 meters (Student did 56-12)
C) 56 meters (Student used number in stem)
D) 12 meters (Student used number in stem)
Sports In hockey, players are rated by the goals scored for their team (a positive number)
or the goals scored for the opposing team (a negative number) while the player is
on the ice. Friend Name’s rating was 42 points scored by the opposing team.
Student Name’s rating was 14 points scored by their team. Which is the difference
in the ratings of FRIEND and Student Name?
A) 56 points
B) 28 points
C) 42 points
D) 14 points
Animals Student Name found bats in a cave at 42 feet below sea level. Student Name then
saw a fox at 14 feet above sea level. Which is the difference in the elevations of
the animals?
A) 56 feet
B) 28 feet
C) 42 feet
D) 14 feet
Science and
Technology
Student Name super-cooled a container of water to 42o C below zero. The water
was then heated to 14o C above zero. Which is the number of degrees that the
water temperature changed?
A) 56 °C
B) 28 °C
C) 42 °C
D) 14 °C
Music,
Movies, and
Television
Student Name borrowed $42 to see a movie and go to dinner. Student Name then
mowed lawns and earned enough money to pay back the debt and still have $14.
Which is the amount of money Student Name earned mowing lawns?
A) $56
B) $28
C) $42
D) $14
Travel Student Name traveled by boat and then dived to 42 feet below sea level to see the
coral reefs in Australia. Student Name’s boat then returned to a port that was 14
feet above sea level. Which is the difference between the two elevations?
A) 56 feet
B) 28 feet
C) 42 feet
D) 14 feet
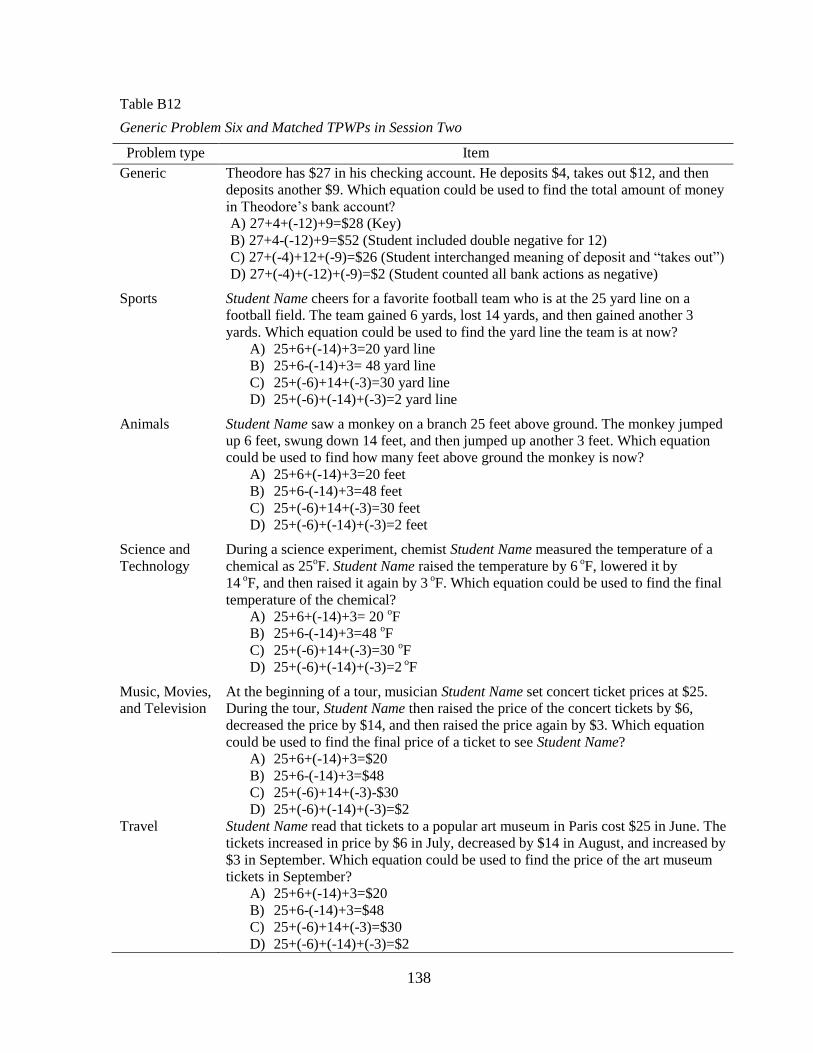
138
Table B12
Generic Problem Six and Matched TPWPs in Session Two
Problem type Item
Generic Theodore has $27 in his checking account. He deposits $4, takes out $12, and then
deposits another $9. Which equation could be used to find the total amount of money
in Theodore’s bank account?
A) 27+4+(-12)+9=$28 (Key)
B) 27+4-(-12)+9=$52 (Student included double negative for 12)
C) 27+(-4)+12+(-9)=$26 (Student interchanged meaning of deposit and “takes out”)
D) 27+(-4)+(-12)+(-9)=$2 (Student counted all bank actions as negative)
Sports Student Name cheers for a favorite football team who is at the 25 yard line on a
football field. The team gained 6 yards, lost 14 yards, and then gained another 3
yards. Which equation could be used to find the yard line the team is at now?
A) 25+6+(-14)+3=20 yard line
B) 25+6-(-14)+3= 48 yard line
C) 25+(-6)+14+(-3)=30 yard line
D) 25+(-6)+(-14)+(-3)=2 yard line
Animals Student Name saw a monkey on a branch 25 feet above ground. The monkey jumped
up 6 feet, swung down 14 feet, and then jumped up another 3 feet. Which equation
could be used to find how many feet above ground the monkey is now?
A) 25+6+(-14)+3=20 feet
B) 25+6-(-14)+3=48 feet
C) 25+(-6)+14+(-3)=30 feet
D) 25+(-6)+(-14)+(-3)=2 feet
Science and
Technology
During a science experiment, chemist Student Name measured the temperature of a
chemical as 25oF. Student Name raised the temperature by 6
oF, lowered it by
14 oF, and then raised it again by 3
oF. Which equation could be used to find the final
temperature of the chemical?
A) 25+6+(-14)+3= 20 oF
B) 25+6-(-14)+3=48 oF
C) 25+(-6)+14+(-3)=30 oF
D) 25+(-6)+(-14)+(-3)=2 oF
Music, Movies,
and Television
At the beginning of a tour, musician Student Name set concert ticket prices at $25.
During the tour, Student Name then raised the price of the concert tickets by $6,
decreased the price by $14, and then raised the price again by $3. Which equation
could be used to find the final price of a ticket to see Student Name?
A) 25+6+(-14)+3=$20
B) 25+6-(-14)+3=$48
C) 25+(-6)+14+(-3)-$30
D) 25+(-6)+(-14)+(-3)=$2
Travel Student Name read that tickets to a popular art museum in Paris cost $25 in June. The
tickets increased in price by $6 in July, decreased by $14 in August, and increased by
$3 in September. Which equation could be used to find the price of the art museum
tickets in September?
A) 25+6+(-14)+3=$20
B) 25+6-(-14)+3=$48
C) 25+(-6)+14+(-3)=$30
D) 25+(-6)+(-14)+(-3)=$2
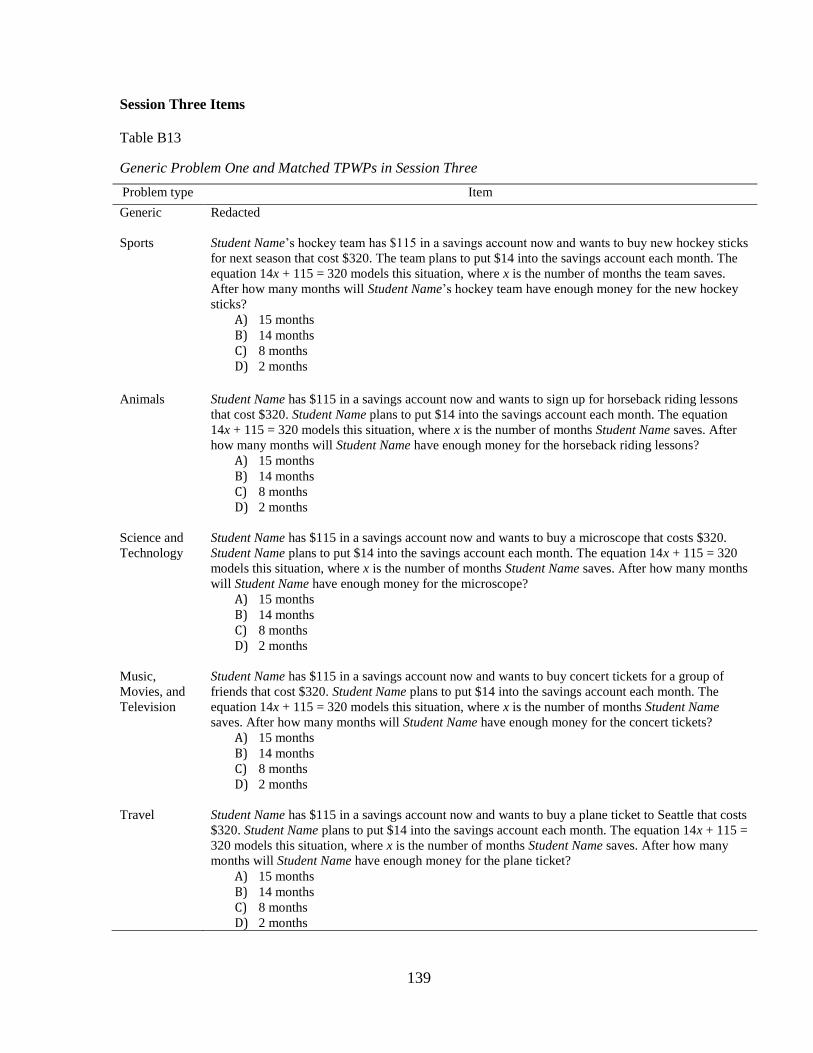
139
Session Three Items
Table B13
Generic Problem One and Matched TPWPs in Session Three
Problem type Item
Generic Redacted
Sports Student Name’s hockey team has $115 in a savings account now and wants to buy new hockey sticks
for next season that cost $320. The team plans to put $14 into the savings account each month. The
equation 14x + 115 = 320 models this situation, where x is the number of months the team saves.
After how many months will Student Name’s hockey team have enough money for the new hockey
sticks?
A) 15 months
B) 14 months
C) 8 months
D) 2 months
Animals Student Name has $115 in a savings account now and wants to sign up for horseback riding lessons
that cost $320. Student Name plans to put $14 into the savings account each month. The equation
14x + 115 = 320 models this situation, where x is the number of months Student Name saves. After
how many months will Student Name have enough money for the horseback riding lessons?
A) 15 months
B) 14 months
C) 8 months
D) 2 months
Science and
Technology
Student Name has $115 in a savings account now and wants to buy a microscope that costs $320.
Student Name plans to put $14 into the savings account each month. The equation 14x + 115 = 320
models this situation, where x is the number of months Student Name saves. After how many months
will Student Name have enough money for the microscope?
A) 15 months
B) 14 months
C) 8 months
D) 2 months
Music,
Movies, and
Television
Student Name has $115 in a savings account now and wants to buy concert tickets for a group of
friends that cost $320. Student Name plans to put $14 into the savings account each month. The
equation 14x + 115 = 320 models this situation, where x is the number of months Student Name
saves. After how many months will Student Name have enough money for the concert tickets?
A) 15 months
B) 14 months
C) 8 months
D) 2 months
Travel Student Name has $115 in a savings account now and wants to buy a plane ticket to Seattle that costs
$320. Student Name plans to put $14 into the savings account each month. The equation 14x + 115 =
320 models this situation, where x is the number of months Student Name saves. After how many
months will Student Name have enough money for the plane ticket?
A) 15 months
B) 14 months
C) 8 months
D) 2 months
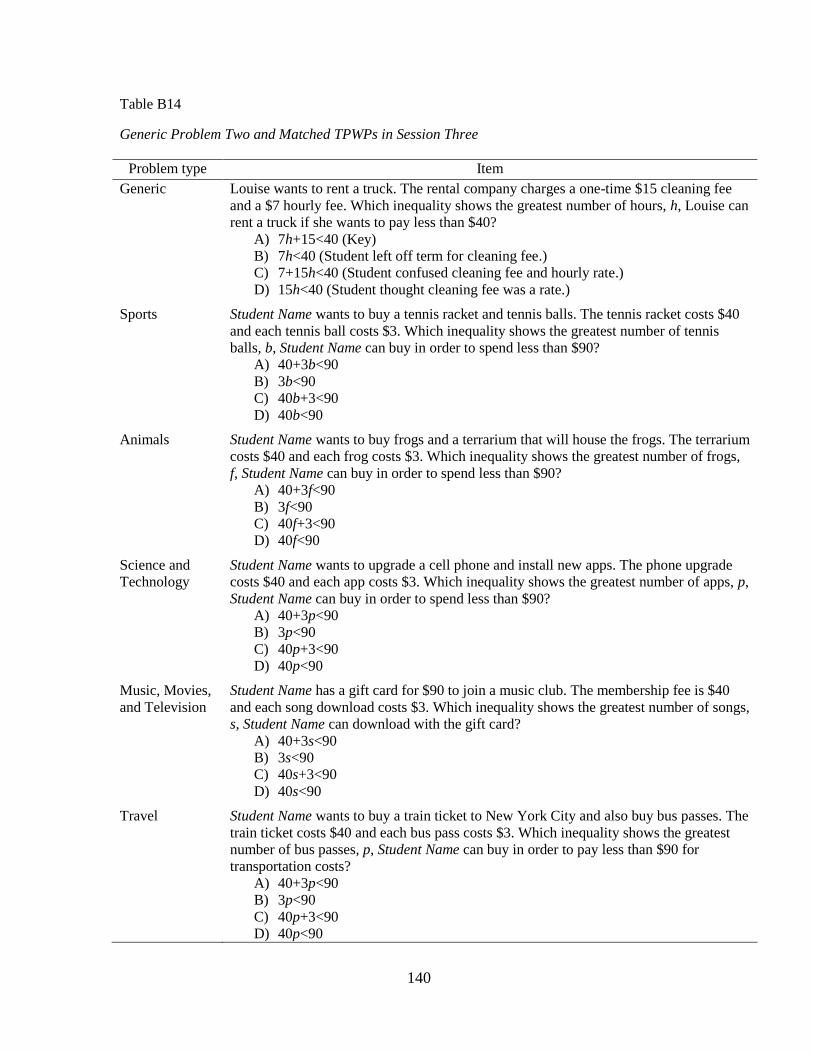
140
Table B14
Generic Problem Two and Matched TPWPs in Session Three
Problem type Item
Generic Louise wants to rent a truck. The rental company charges a one-time $15 cleaning fee
and a $7 hourly fee. Which inequality shows the greatest number of hours, h, Louise can
rent a truck if she wants to pay less than $40?
A) 7h+15<40 (Key)
B) 7h<40 (Student left off term for cleaning fee.)
C) 7+15h<40 (Student confused cleaning fee and hourly rate.)
D) 15h<40 (Student thought cleaning fee was a rate.)
Sports Student Name wants to buy a tennis racket and tennis balls. The tennis racket costs $40
and each tennis ball costs $3. Which inequality shows the greatest number of tennis
balls, b, Student Name can buy in order to spend less than $90?
A) 40+3b<90
B) 3b<90
C) 40b+3<90
D) 40b<90
Animals Student Name wants to buy frogs and a terrarium that will house the frogs. The terrarium
costs $40 and each frog costs $3. Which inequality shows the greatest number of frogs,
f, Student Name can buy in order to spend less than $90?
A) 40+3f<90
B) 3f<90
C) 40f+3<90
D) 40f<90
Science and
Technology
Student Name wants to upgrade a cell phone and install new apps. The phone upgrade
costs $40 and each app costs $3. Which inequality shows the greatest number of apps, p,
Student Name can buy in order to spend less than $90?
A) 40+3p<90
B) 3p<90
C) 40p+3<90
D) 40p<90
Music, Movies,
and Television
Student Name has a gift card for $90 to join a music club. The membership fee is $40
and each song download costs $3. Which inequality shows the greatest number of songs,
s, Student Name can download with the gift card?
A) 40+3s<90
B) 3s<90
C) 40s+3<90
D) 40s<90
Travel Student Name wants to buy a train ticket to New York City and also buy bus passes. The
train ticket costs $40 and each bus pass costs $3. Which inequality shows the greatest
number of bus passes, p, Student Name can buy in order to pay less than $90 for
transportation costs?
A) 40+3p<90
B) 3p<90
C) 40p+3<90
D) 40p<90
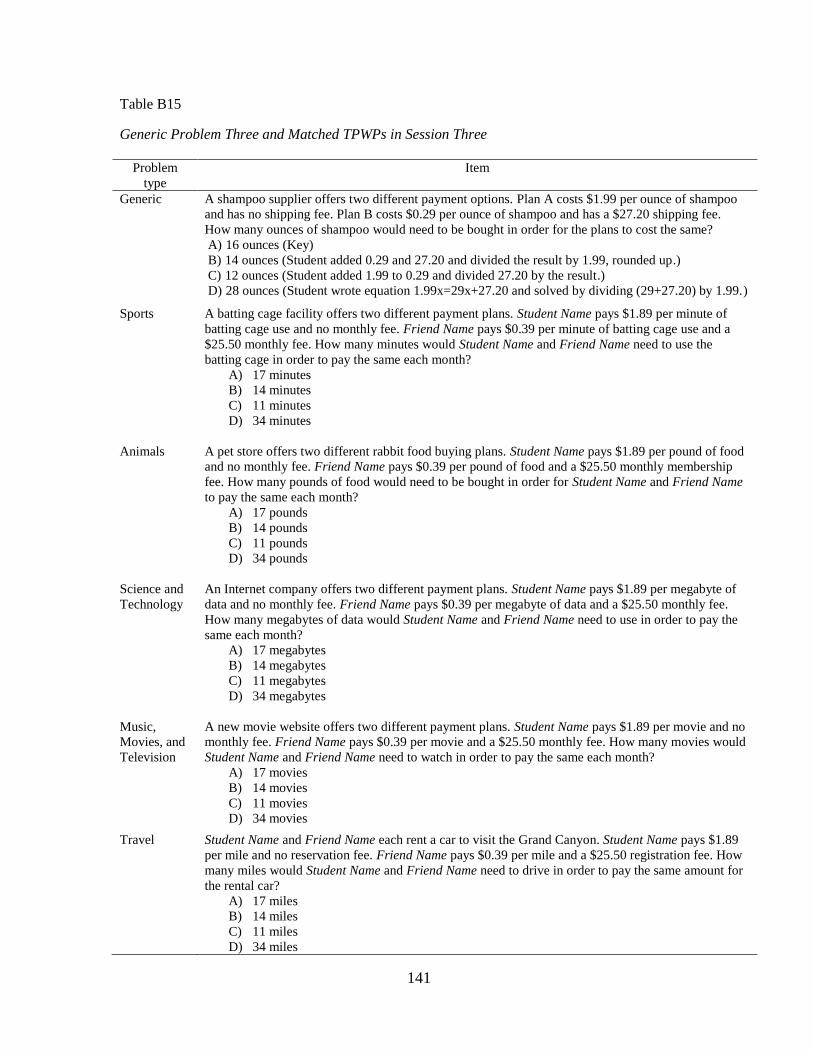
141
Table B15
Generic Problem Three and Matched TPWPs in Session Three
Problem
type
Item
Generic A shampoo supplier offers two different payment options. Plan A costs $1.99 per ounce of shampoo
and has no shipping fee. Plan B costs $0.29 per ounce of shampoo and has a $27.20 shipping fee.
How many ounces of shampoo would need to be bought in order for the plans to cost the same?
A) 16 ounces (Key)
B) 14 ounces (Student added 0.29 and 27.20 and divided the result by 1.99, rounded up.)
C) 12 ounces (Student added 1.99 to 0.29 and divided 27.20 by the result.)
D) 28 ounces (Student wrote equation 1.99x=29x+27.20 and solved by dividing (29+27.20) by 1.99.)
Sports A batting cage facility offers two different payment plans. Student Name pays $1.89 per minute of
batting cage use and no monthly fee. Friend Name pays $0.39 per minute of batting cage use and a
$25.50 monthly fee. How many minutes would Student Name and Friend Name need to use the
batting cage in order to pay the same each month?
A) 17 minutes
B) 14 minutes
C) 11 minutes
D) 34 minutes
Animals A pet store offers two different rabbit food buying plans. Student Name pays $1.89 per pound of food
and no monthly fee. Friend Name pays $0.39 per pound of food and a $25.50 monthly membership
fee. How many pounds of food would need to be bought in order for Student Name and Friend Name
to pay the same each month?
A) 17 pounds
B) 14 pounds
C) 11 pounds
D) 34 pounds
Science and
Technology
An Internet company offers two different payment plans. Student Name pays $1.89 per megabyte of
data and no monthly fee. Friend Name pays $0.39 per megabyte of data and a $25.50 monthly fee.
How many megabytes of data would Student Name and Friend Name need to use in order to pay the
same each month?
A) 17 megabytes
B) 14 megabytes
C) 11 megabytes
D) 34 megabytes
Music,
Movies, and
Television
A new movie website offers two different payment plans. Student Name pays $1.89 per movie and no
monthly fee. Friend Name pays $0.39 per movie and a $25.50 monthly fee. How many movies would
Student Name and Friend Name need to watch in order to pay the same each month?
A) 17 movies
B) 14 movies
C) 11 movies
D) 34 movies
Travel Student Name and Friend Name each rent a car to visit the Grand Canyon. Student Name pays $1.89
per mile and no reservation fee. Friend Name pays $0.39 per mile and a $25.50 registration fee. How
many miles would Student Name and Friend Name need to drive in order to pay the same amount for
the rental car?
A) 17 miles
B) 14 miles
C) 11 miles
D) 34 miles
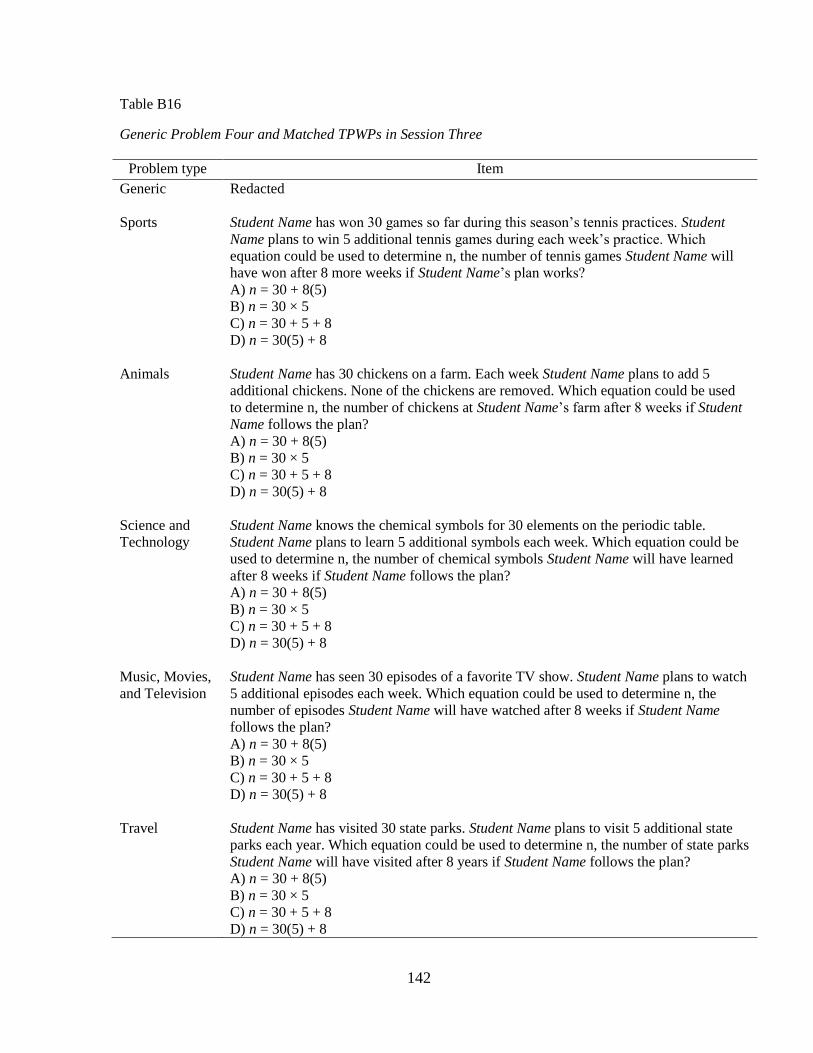
142
Table B16
Generic Problem Four and Matched TPWPs in Session Three
Problem type Item
Generic Redacted
Sports Student Name has won 30 games so far during this season’s tennis practices. Student
Name plans to win 5 additional tennis games during each week’s practice. Which
equation could be used to determine n, the number of tennis games Student Name will
have won after 8 more weeks if Student Name’s plan works?
A) n = 30 + 8(5)
B) n = 30 × 5
C) n = 30 + 5 + 8
D) n = 30(5) + 8
Animals Student Name has 30 chickens on a farm. Each week Student Name plans to add 5
additional chickens. None of the chickens are removed. Which equation could be used
to determine n, the number of chickens at Student Name’s farm after 8 weeks if Student
Name follows the plan?
A) n = 30 + 8(5)
B) n = 30 × 5
C) n = 30 + 5 + 8
D) n = 30(5) + 8
Science and
Technology
Student Name knows the chemical symbols for 30 elements on the periodic table.
Student Name plans to learn 5 additional symbols each week. Which equation could be
used to determine n, the number of chemical symbols Student Name will have learned
after 8 weeks if Student Name follows the plan?
A) n = 30 + 8(5)
B) n = 30 × 5
C) n = 30 + 5 + 8
D) n = 30(5) + 8
Music, Movies,
and Television
Student Name has seen 30 episodes of a favorite TV show. Student Name plans to watch
5 additional episodes each week. Which equation could be used to determine n, the
number of episodes Student Name will have watched after 8 weeks if Student Name
follows the plan?
A) n = 30 + 8(5)
B) n = 30 × 5
C) n = 30 + 5 + 8
D) n = 30(5) + 8
Travel Student Name has visited 30 state parks. Student Name plans to visit 5 additional state
parks each year. Which equation could be used to determine n, the number of state parks
Student Name will have visited after 8 years if Student Name follows the plan?
A) n = 30 + 8(5)
B) n = 30 × 5
C) n = 30 + 5 + 8
D) n = 30(5) + 8
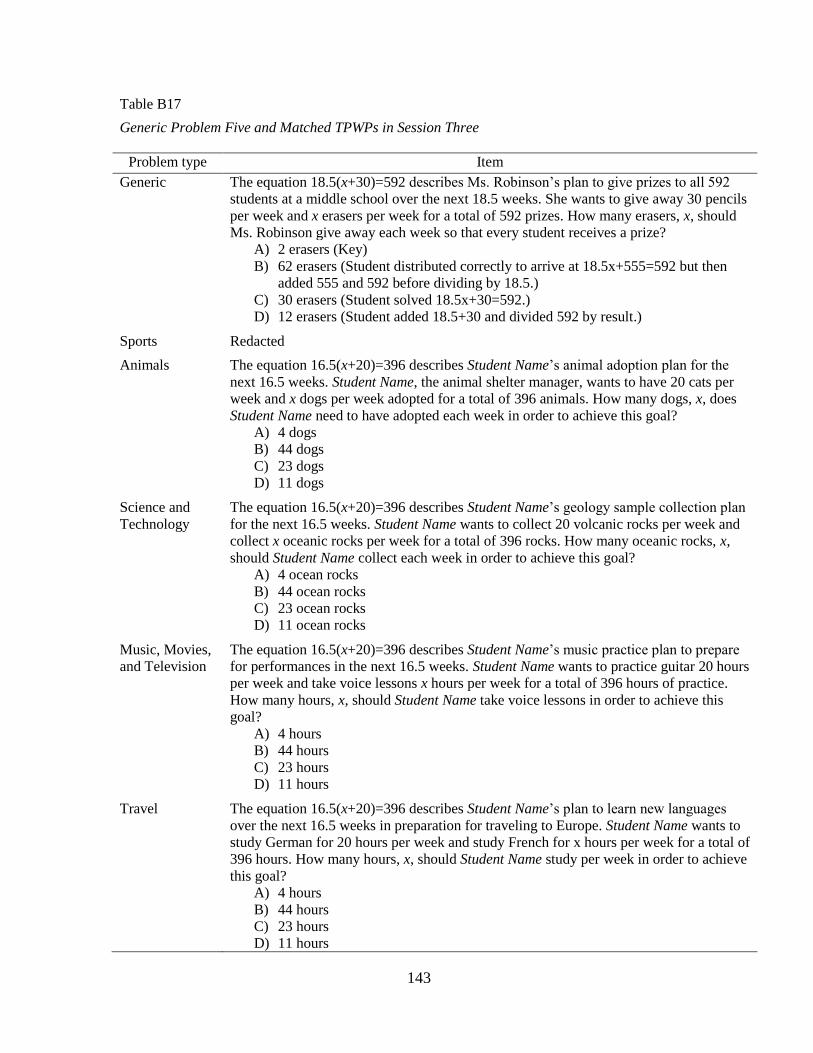
143
Table B17
Generic Problem Five and Matched TPWPs in Session Three
Problem type Item
Generic The equation 18.5(x+30)=592 describes Ms. Robinson’s plan to give prizes to all 592
students at a middle school over the next 18.5 weeks. She wants to give away 30 pencils
per week and x erasers per week for a total of 592 prizes. How many erasers, x, should
Ms. Robinson give away each week so that every student receives a prize?
A) 2 erasers (Key)
B) 62 erasers (Student distributed correctly to arrive at 18.5x+555=592 but then
added 555 and 592 before dividing by 18.5.)
C) 30 erasers (Student solved 18.5x+30=592.)
D) 12 erasers (Student added 18.5+30 and divided 592 by result.)
Sports Redacted
Animals The equation 16.5(x+20)=396 describes Student Name’s animal adoption plan for the
next 16.5 weeks. Student Name, the animal shelter manager, wants to have 20 cats per
week and x dogs per week adopted for a total of 396 animals. How many dogs, x, does
Student Name need to have adopted each week in order to achieve this goal?
A) 4 dogs
B) 44 dogs
C) 23 dogs
D) 11 dogs
Science and
Technology
The equation 16.5(x+20)=396 describes Student Name’s geology sample collection plan
for the next 16.5 weeks. Student Name wants to collect 20 volcanic rocks per week and
collect x oceanic rocks per week for a total of 396 rocks. How many oceanic rocks, x,
should Student Name collect each week in order to achieve this goal?
A) 4 ocean rocks
B) 44 ocean rocks
C) 23 ocean rocks
D) 11 ocean rocks
Music, Movies,
and Television
The equation 16.5(x+20)=396 describes Student Name’s music practice plan to prepare
for performances in the next 16.5 weeks. Student Name wants to practice guitar 20 hours
per week and take voice lessons x hours per week for a total of 396 hours of practice.
How many hours, x, should Student Name take voice lessons in order to achieve this
goal?
A) 4 hours
B) 44 hours
C) 23 hours
D) 11 hours
Travel The equation 16.5(x+20)=396 describes Student Name’s plan to learn new languages
over the next 16.5 weeks in preparation for traveling to Europe. Student Name wants to
study German for 20 hours per week and study French for x hours per week for a total of
396 hours. How many hours, x, should Student Name study per week in order to achieve
this goal?
A) 4 hours
B) 44 hours
C) 23 hours
D) 11 hours
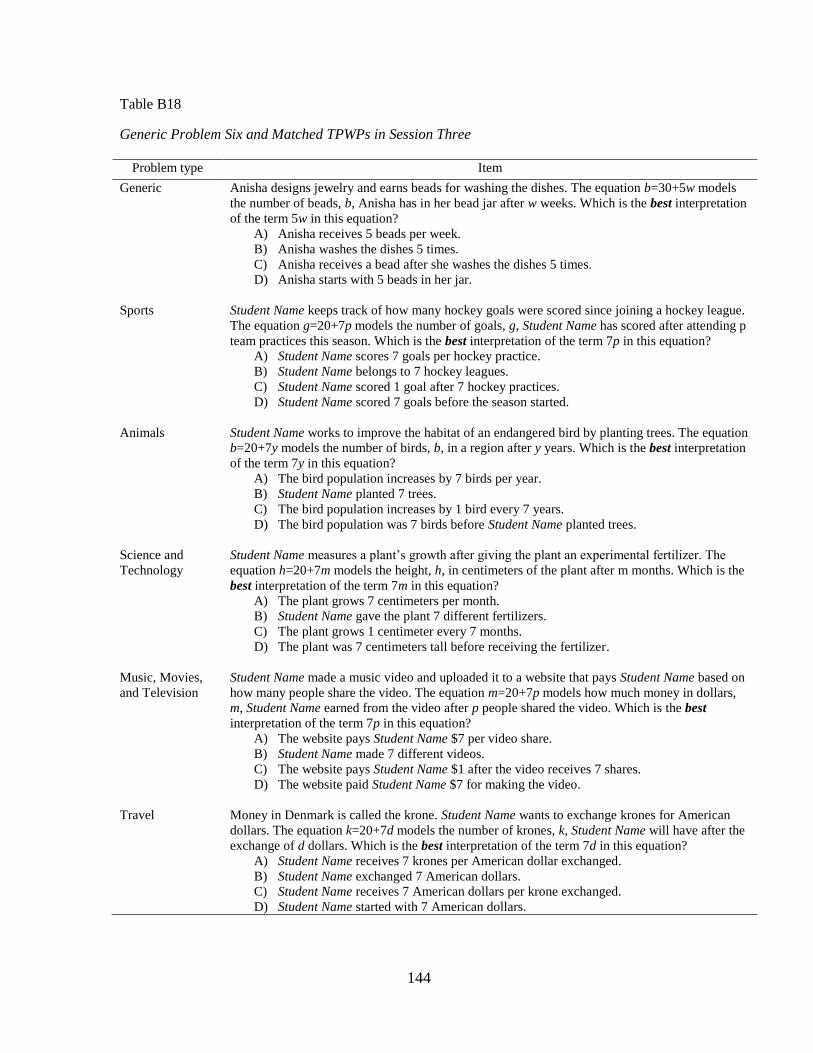
144
Table B18
Generic Problem Six and Matched TPWPs in Session Three
Problem type Item
Generic Anisha designs jewelry and earns beads for washing the dishes. The equation b=30+5w models
the number of beads, b, Anisha has in her bead jar after w weeks. Which is the best interpretation
of the term 5w in this equation?
A) Anisha receives 5 beads per week.
B) Anisha washes the dishes 5 times.
C) Anisha receives a bead after she washes the dishes 5 times.
D) Anisha starts with 5 beads in her jar.
Sports Student Name keeps track of how many hockey goals were scored since joining a hockey league.
The equation g=20+7p models the number of goals, g, Student Name has scored after attending p
team practices this season. Which is the best interpretation of the term 7p in this equation?
A) Student Name scores 7 goals per hockey practice.
B) Student Name belongs to 7 hockey leagues.
C) Student Name scored 1 goal after 7 hockey practices.
D) Student Name scored 7 goals before the season started.
Animals Student Name works to improve the habitat of an endangered bird by planting trees. The equation
b=20+7y models the number of birds, b, in a region after y years. Which is the best interpretation
of the term 7y in this equation?
A) The bird population increases by 7 birds per year.
B) Student Name planted 7 trees.
C) The bird population increases by 1 bird every 7 years.
D) The bird population was 7 birds before Student Name planted trees.
Science and
Technology
Student Name measures a plant’s growth after giving the plant an experimental fertilizer. The
equation h=20+7m models the height, h, in centimeters of the plant after m months. Which is the
best interpretation of the term 7m in this equation?
A) The plant grows 7 centimeters per month.
B) Student Name gave the plant 7 different fertilizers.
C) The plant grows 1 centimeter every 7 months.
D) The plant was 7 centimeters tall before receiving the fertilizer.
Music, Movies,
and Television
Student Name made a music video and uploaded it to a website that pays Student Name based on
how many people share the video. The equation m=20+7p models how much money in dollars,
m, Student Name earned from the video after p people shared the video. Which is the best
interpretation of the term 7p in this equation?
A) The website pays Student Name $7 per video share.
B) Student Name made 7 different videos.
C) The website pays Student Name $1 after the video receives 7 shares.
D) The website paid Student Name $7 for making the video.
Travel Money in Denmark is called the krone. Student Name wants to exchange krones for American
dollars. The equation k=20+7d models the number of krones, k, Student Name will have after the
exchange of d dollars. Which is the best interpretation of the term 7d in this equation?
A) Student Name receives 7 krones per American dollar exchanged.
B) Student Name exchanged 7 American dollars.
C) Student Name receives 7 American dollars per krone exchanged.
D) Student Name started with 7 American dollars.
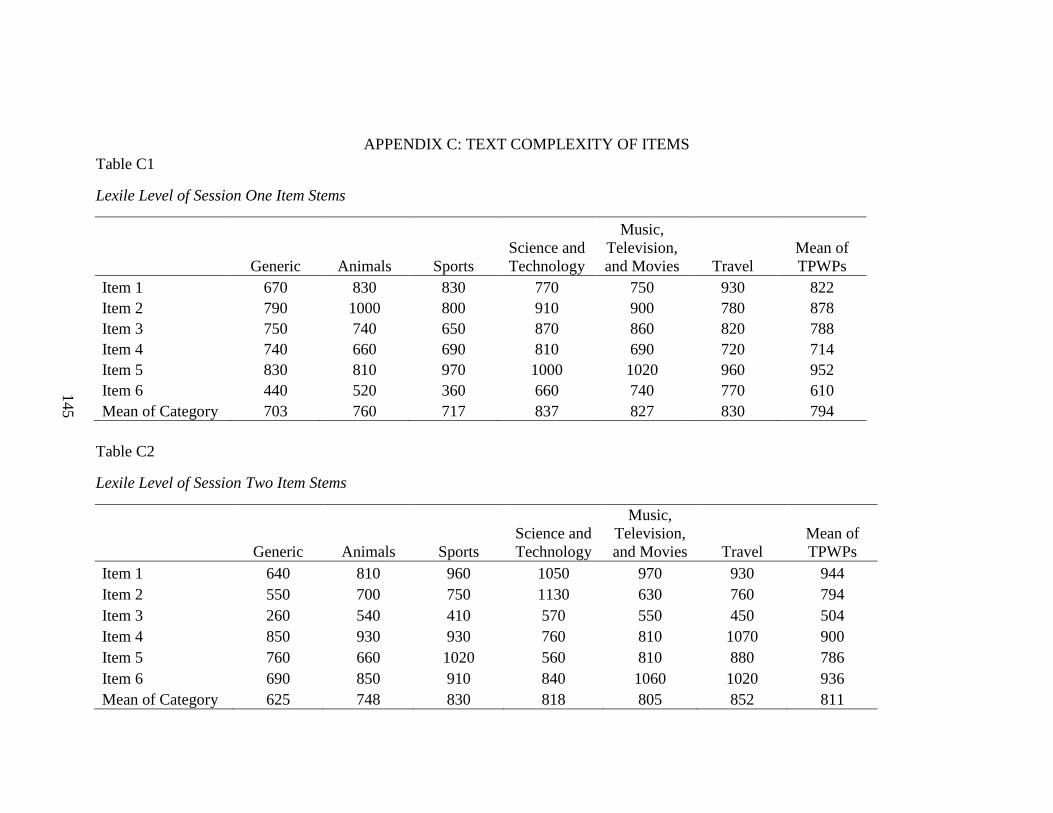
145
APPENDIX C: TEXT COMPLEXITY OF ITEMS
Table C1
Lexile Level of Session One Item Stems
Generic Animals Sports
Science and
Technology
Music,
Television,
and Movies Travel
Mean of
TPWPs
Item 1 670 830 830 770 750 930 822
Item 2 790 1000 800 910 900 780 878
Item 3 750 740 650 870 860 820 788
Item 4 740 660 690 810 690 720 714
Item 5 830 810 970 1000 1020 960 952
Item 6 440 520 360 660 740 770 610
Mean of Category 703 760 717 837 827 830 794
Table C2
Lexile Level of Session Two Item Stems
Generic Animals Sports
Science and
Technology
Music,
Television,
and Movies Travel
Mean of
TPWPs
Item 1 640 810 960 1050 970 930 944
Item 2 550 700 750 1130 630 760 794
Item 3 260 540 410 570 550 450 504
Item 4 850 930 930 760 810 1070 900
Item 5 760 660 1020 560 810 880 786
Item 6 690 850 910 840 1060 1020 936
Mean of Category 625 748 830 818 805 852 811
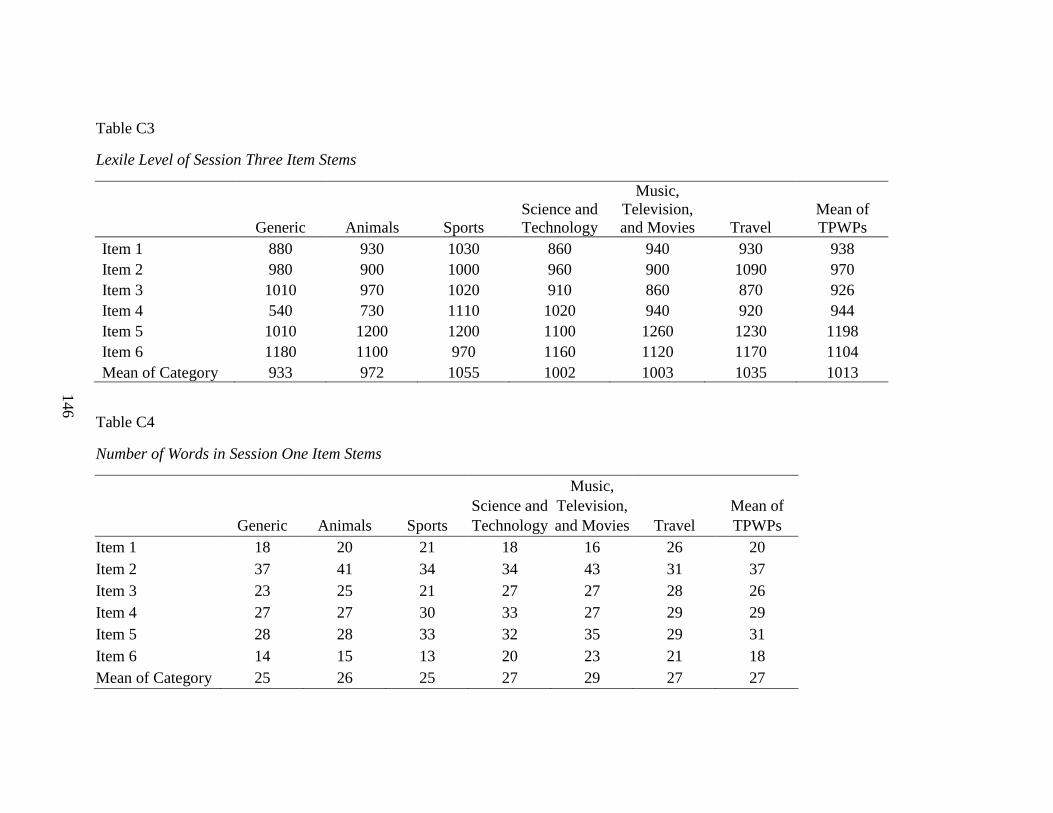
146
Table C3
Lexile Level of Session Three Item Stems
Generic Animals Sports
Science and
Technology
Music,
Television,
and Movies Travel
Mean of
TPWPs
Item 1 880 930 1030 860 940 930 938
Item 2 980 900 1000 960 900 1090 970
Item 3 1010 970 1020 910 860 870 926
Item 4 540 730 1110 1020 940 920 944
Item 5 1010 1200 1200 1100 1260 1230 1198
Item 6 1180 1100 970 1160 1120 1170 1104
Mean of Category 933 972 1055 1002 1003 1035 1013
Table C4
Number of Words in Session One Item Stems
Generic Animals Sports
Science and
Technology
Music,
Television,
and Movies Travel
Mean of
TPWPs
Item 1 18 20 21 18 16 26 20
Item 2 37 41 34 34 43 31 37
Item 3 23 25 21 27 27 28 26
Item 4 27 27 30 33 27 29 29
Item 5 28 28 33 32 35 29 31
Item 6 14 15 13 20 23 21 18
Mean of Category 25 26 25 27 29 27 27
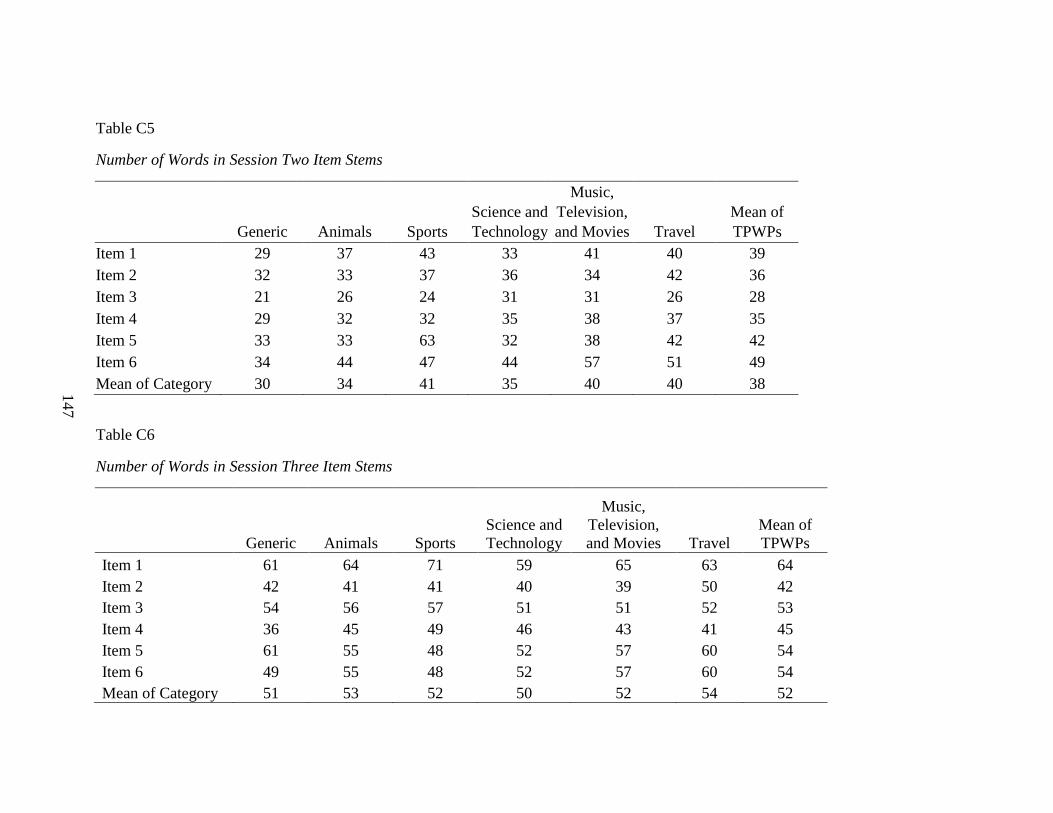
147
Table C5
Number of Words in Session Two Item Stems
Generic Animals Sports
Science and
Technology
Music,
Television,
and Movies Travel
Mean of
TPWPs
Item 1 29 37 43 33 41 40 39
Item 2 32 33 37 36 34 42 36
Item 3 21 26 24 31 31 26 28
Item 4 29 32 32 35 38 37 35
Item 5 33 33 63 32 38 42 42
Item 6 34 44 47 44 57 51 49
Mean of Category 30 34 41 35 40 40 38
Table C6
Number of Words in Session Three Item Stems
Generic Animals Sports
Science and
Technology
Music,
Television,
and Movies Travel
Mean of
TPWPs
Item 1 61 64 71 59 65 63 64
Item 2 42 41 41 40 39 50 42
Item 3 54 56 57 51 51 52 53
Item 4 36 45 49 46 43 41 45
Item 5 61 55 48 52 57 60 54
Item 6 49 55 48 52 57 60 54
Mean of Category 51 53 52 50 52 54 52
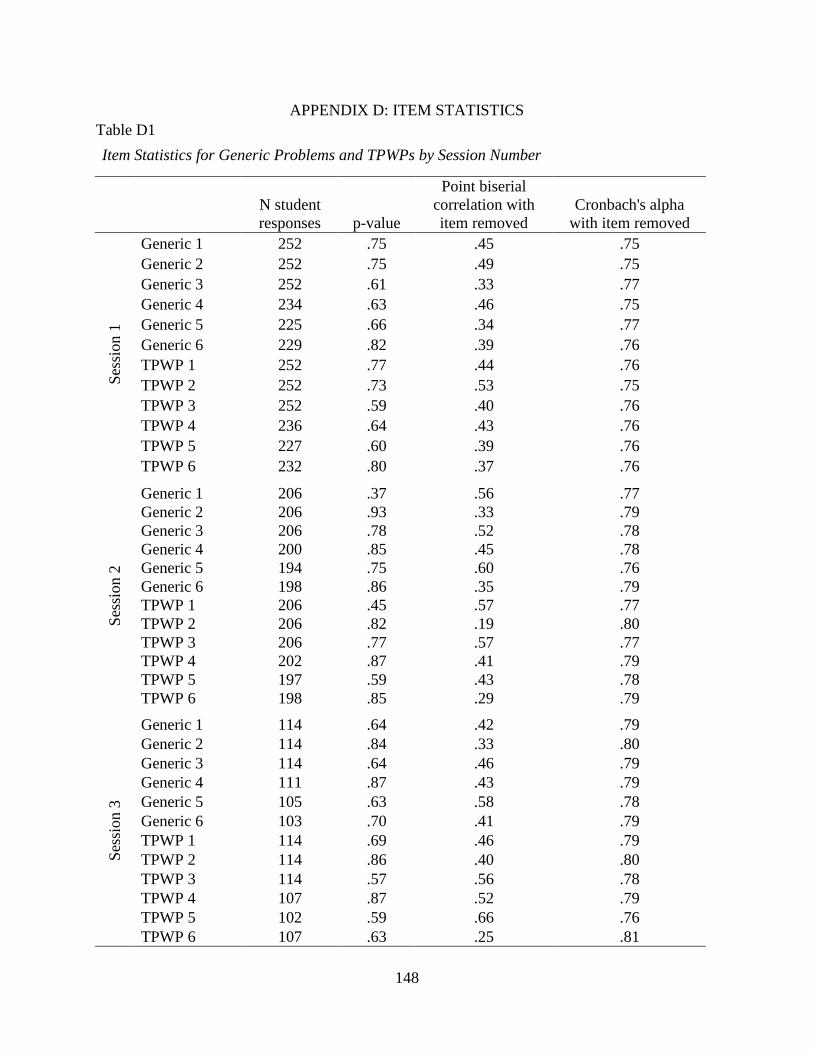
148
APPENDIX D: ITEM STATISTICS
Table D1
Item Statistics for Generic Problems and TPWPs by Session Number
N student
responses p-value
Point biserial
correlation with
item removed
Cronbach's alpha
with item removed
Ses
sion 1
Generic 1 252 .75 .45 .75
Generic 2 252 .75 .49 .75
Generic 3 252 .61 .33 .77
Generic 4 234 .63 .46 .75
Generic 5 225 .66 .34 .77
Generic 6 229 .82 .39 .76
TPWP 1 252 .77 .44 .76
TPWP 2 252 .73 .53 .75
TPWP 3 252 .59 .40 .76
TPWP 4 236 .64 .43 .76
TPWP 5 227 .60 .39 .76
TPWP 6 232 .80 .37 .76
Ses
sion 2
Generic 1 206 .37 .56 .77
Generic 2 206 .93 .33 .79
Generic 3 206 .78 .52 .78
Generic 4 200 .85 .45 .78
Generic 5 194 .75 .60 .76
Generic 6 198 .86 .35 .79
TPWP 1 206 .45 .57 .77
TPWP 2 206 .82 .19 .80
TPWP 3 206 .77 .57 .77
TPWP 4 202 .87 .41 .79
TPWP 5 197 .59 .43 .78
TPWP 6 198 .85 .29 .79
Ses
sion 3
Generic 1 114 .64 .42 .79
Generic 2 114 .84 .33 .80
Generic 3 114 .64 .46 .79
Generic 4 111 .87 .43 .79
Generic 5 105 .63 .58 .78
Generic 6 103 .70 .41 .79
TPWP 1 114 .69 .46 .79
TPWP 2 114 .86 .40 .80
TPWP 3 114 .57 .56 .78
TPWP 4 107 .87 .52 .79
TPWP 5 102 .59 .66 .76
TPWP 6 107 .63 .25 .81
149
REFERENCES
Ainley, M., Hidi, S., & Berndorff, D. (2002). Interest, learning, and the psychological processes
that mediate their relationship. Journal of Educational Psychology, 94(3), 545-561.
Anand, P. D., & Ross, S. M. (1987). Using computer-assisted instruction to personalize
arithmetic materials for elementary school students. Journal of Educational Psychology,
79(1), 72-78.
Anderson, R. C. (1982). Allocation of attention during reading (Report No. 232). Washington,
DC: National Institute of Education.
Bassok, M., Chase, V., & Martin, S. A. (1998). Adding apples and oranges: Alignment of
semantic and formal knowledge. Cognitive Psychology, 35(2), 99-134.
Bates, E., & Wiest, L. (2004). Impact of personalization of mathematical word problems on
student performance. The Mathematics Educator, 14(2), 17-26.
Bloom, H. S. (1995). Minimum detectable effects: A simple way to report the statistical power of
experimental design. Evaluation Review, 19(5), 547-556.
Boston, M. D., & Smith, M. S. (2009). Transforming secondary mathematics teaching:
Increasing the cognitive demands of instructional tasks used in teachers’ classrooms.
Journal for Research in Mathematics Education, 40(2), 119-156.
Brown, M., Brown, P., & Bibby, T. (2008). “I would rather die”: Reasons given by 16-year-olds
for not continuing their study of mathematics. Research in Mathematics Education,
10(1), 3-18.
Cakir, O., & Simsek, N. (2010). A comparative analysis of the effects of computer and paper-
based personalization on student achievement. Computers & Education, 55(4), 1524-
1531.
Clement, J. (1982). Algebra word problem solutions: Thought processes underlying a common
misconception. Journal for Research in Mathematics Education, 13(1), 16-30.
Cohen, J. (1988). Statistical power analysis for the behavioral sciences. Hillsdale, NJ: Lawrence
Erlbaum.
Common Core Sheets (2015). Find missing angles. Retrieved from
http://www.commoncoresheets.com
Cook, D. L. (1962). The hawthorne effect in educational research. Phi Delta Kappa
International, 44(3), 116-122.
Cordova, D. I., & Lepper, M. R. (1996). Intrinsic motivation and the process of learning:
Beneficial effects of contextualization, personalization, and choice. Journal of
Educational Psychology, 88(4), 715-730.
150
Daniel, R. C., & Embretson, S. E. (2010). Designing cognitive complexity in mathematical
problem-solving items. Applied Psychology Measurement, 34(5), 348-364.
Davis-Dorsey, J., Ross, S. M., & Morrison, G. R. (1991). The role of rewording and context
personalization in the solving of mathematical word problems. Journal of Educational
Psychology, 83(1), 61-68.
Deane, P., & Sheehan, K. (2003). Automatic item generation via frame semantics: Natural
language generation of math word problems. Princeton, NJ: Educational Testing Service.
Debue, N., & van de Leemput, C. (2014). What does germane load mean? An empirical
contribution to the cognitive load theory. Frontiers in Psychology, 5(1099), 1-12.
DeLeeuw, K. E., & Mayer, R. E. (2008). A comparison of three measures of cognitive load:
Evidence for separable measures of intrinsic, extraneous, and germane load. Journal of
Educational Psychology, 100(1), 223-234
Dewey, J. (1913). Interest and effort in education. Cambridge, MA: Houghton Mifflin.
Enright, M. K., Morley, M., & Sheehan, K. M. (2002). Items by design: The impact of
systematic feature variation on item statistical characteristics. Applied Measurement in
Education, 15(1), 49-74.
Flowerday, T., Schraw, G., & Stevens, J. (2004). The role of choice and interest in reader
engagement. The Journal of Experimental Education, 72(2), 93-114.
Ganley, C. M., & Lubienski, S. T. (2016). Mathematics confidence, interest, and performance:
Examining gender patterns and reciprocal relations. Learning and Individual Differences,
47, 182-193.
Gaspard, H., Dicke, A. L., Flunger, B., Brisson, B. M., Häfner, I., Nagengast, B., & Trautwein,
U. (2015). Fostering adolescents’ value beliefs for mathematics with a relevance
intervention in the classroom. Developmental Psychology, 51(9), 1226-1240.
Guthrie, J. T., & Humenick, N. M. (2004). Motivating students to read: Evidence for classroom
practices that increase reading motivation and achievement. In P. McCardle & V.
Chhabra (Eds.), The voice of evidence in reading research (pp. 329-354). Baltimore, MD:
Brookes.
Guo, G., & Zhao, H. (2000). Multilevel modeling for binary data. Annual Review of Sociology,
26, 441-462.
Hidi, S. (2006). Interest: A unique motivational variable. Educational Research Review 1(2), 69-
82.
Hidi, S., & Ainley, M. (2008). Interest and self-regulation: Relationships between two variables
that influence learning. In D. Schunk & B. Zimmerman (Eds.), Motivation and self-
regulated learning (pp. 77-109). New York, NY: Lawrence Erlbaum.
Hidi, S., & Renninger, K. (2006). The four-phase model of interest development. Educational
Psychologist, 41, 111–127.
151
Hidi, S., Renninger, K. A., & Krapp, A. (2004). Interest, a motivational variable that combines
affective and cognitive functioning. In D. Dai & R. Sternberg (Eds.), Motivation,
emotion, and cognition: Integrative perspectives on intellectual functioning and
development (pp. 89-115). Mahwah, NJ: Lawrence Erlbaum.
Hoffer, T. B., Venkataraman, L., Hedberg, E. C., & Shagle, S. (2007). Final report on the
national survey of algebra teachers for the national math panel. Chicago, IL: National
Opinion Research Center.
Høgheim, S., & Reber, R. (2015). Supporting interest of middle school students in mathematics
through context personalization and example choice. Contemporary Educational
Psychology, 42, 17-25.
Hox, J. (2002). Multilevel analysis: Techniques and applications. Mahwah, NJ: Lawrence
Erlbaum.
Kahneman, D. (2011). Thinking, fast and slow. New York, NY: Farrar, Straus and Giroux.
Katz, I., & Assor, A. (2007). When choice motivates and when it does not. Educational
Psychology Review, 19(4), 429-442.
Koedinger, K. R., Alibali, M. W., & Nathan, M. J. (2008). Trade‐offs between grounded and
abstract representations: Evidence from algebra problem solving. Cognitive Science,
32(2), 366-397.
Koedinger, K. R., & Nathan, M. J. (2004). The real story behind story problems: Effects of
representations on quantitative reasoning. Journal of the Learning Sciences, 13(2), 129-
164.
Kong, X. J., Wise, S. L., & Bhola, D. S. (2007). Setting the response time threshold parameter to
differentiate solution behavior from rapid guessing behavior. Educational and
Psychology Measurement, 67(4), 609-619.
Kosh, A. E., Simpson, M. A., Bickel, L. (2016, July). The impact of student individual
differences when using automatic item generation to pre-calibrate items. Poster presented
at the International Test Commission Conference, Vancouver, BC.
Ku, H. Y., Harter, C. A., Liu, P. L., Thompson, L., & Cheng, Y. C. (2007). The effects of
individually personalized computer-based instructional program on solving mathematics
problems. Computers in Human Behavior, 23(3), 1195-1210.
Ku, H. Y., & Sullivan, H. J. (2002). Student performance and attitudes using personalized
mathematics instruction. Educational Technology Research and Development, 50(1), 21-
34.
Lauman, D. J. (2000). Student home computer use: A review of the literature. Journal of
Research on Computing in Education, 33(2), 196-203.
152
Martin, S. A., & Bassok, M. (2005). Effects of semantic cues on mathematical modeling:
Evidence from word-problem solving and equation construction tasks. Memory &
Cognition, 33(3), 471-478.
MetaMetrics, Inc. (2011). The quantile framework® for mathematics: Technical guide. Durham,
NC: Author.
MetaMetrics, Inc. (2016). Lexile measures and grade levels. Retrieved from
https://lexile.com/about-lexile/grade-equivalent/
McDaniel, M. A., Waddil, P. J., Finstad, K., & Bourg, T. (2000). The effects of text-based
interest on attention and recall. Journal of Educational Psychology, 92(3), 492-502.
McLoyd, V. C. (1979). The effects of extrinsic rewards of differential value on high and low
intrinsic interest. Child Development, 50(4), 1010-1019.
Moerbeek, M., & Teerenstra, S. (2016). Power analysis of trials with multilevel data. Boca
Raton, FL: CRC Press.
Nathan, M. J., & Koedinger, K. R. (2000). Teachers' and researchers' beliefs of early algebra
development. Journal for Research in Mathematics Education, 31(2), 168-190.
Nathan, M. J., Long, S. D., & Alibali, M. W. (2002). Symbol precedence in mathematics
textbooks: A corpus analysis. Discourse Processes, 33, 1-21.
National Council of Teachers of Mathematics. (2000). Principles and standards for school
mathematics. Reston, VA: National Council of Teachers of Mathematics.
National Governors Association for Best Practices & Council of Chief State School Officers
(2010). Common core state standards for mathematics. Washington, DC: Author.
O’Rourke, E., Andersen, E., Gulwani, S., & Popovic, Z. (2015). A framework for automatically
generating interactive instructional scaffolding. In B. Begole & J. Kim (Eds.),
Proceedings of the 33rd
Annual ACM Conference on Human Factors in Computing
Systems (pp. 1545-1554). New York, NY: Association for Computing Machinery.
Park, S. (2015). The effects of social cue principles on cognitive load, situational interest,
motivation, and achievement in pedagogical agent multimedia learning. Educational
Technology & Society, 18(4), 211-259.
Raudenbush, S. W., & Bryk, A. S. (2002). Hierarchical linear models: Applications and data
analysis methods. Thousand Oaks, CA: Sage.
Raudenbush, S., Bryk, A., Cheong, Y. F., Congdon, R., & du Toit, M. (2011). HLM 7:
Hierarchical linear and nonlinear modeling. Lincolnwood, IL: Scientific Software
International.
Renninger, K. A., & Hidi, S. (2002). Student interest and achievement: Developmental issues
raised by a case study. In A. Wigfield & J. Eccles (Eds.), Development of achievement
and motivation (pp. 173-195). San Diego, CA: Academic.
153
Reynolds, P. L., & Symons, S. (2001). Motivational variables and children's text search. Journal
of Educational Psychology, 93(1), 14.
Schiefele, U., Krapp, A., & Winteler, A. (1992). Interest as predictor of academic achievement:
A meta-analysis of research. In K. Renninger, S. Hidi, & A. Krapp (Eds.), The role of
interest in learning and development (pp.183–212). Hillsdale, NJ: Erlbaum.
Schraw, G., & Lehman, S. (2001). Situational interest: A review of the literature and directions
for future research. Educational Psychology Review, 13(1), 23-52.
Setzer, J. C., Wise, S. L., van de Heuvel, J. R., & Ling, G. (2013). An investigation of examinee
test-taking effort on a large-scale assessment. Applied Measurement in Education, 26(1),
34-49.
Simpson, M. A., Kosh, A. E., Bickel, L., Elmore, J., Sanford-Moore, E., Koons, H., Enoch-
Marx, M. (2015, April). The effects of varying grain size on the exchangeability of item
isomorphs. Paper presented at the 2015 National Council on Measurement in Education
Conference, Chicago, IL.
Snijders, T. A. (2005). Power and sample size in multilevel linear models. In B. Everitt & D.
Howell (Eds.), Encyclopedia of statistics in behavioral science (pp.1570-1573). New
York, NY: Wiley.
Spybrook, J., Bloom, H., Congdon, R., Hill, C., Martinez, A., & Raudenbush, S. (2011). Optimal
design plus empirical evidence: Documentation for the “Optimal Design” software.
Stein, M. K., Grover, B. W., & Henningsen, M. (1996). Building student capacity for
mathematical thinking and reasoning: An analysis of mathematical tasks used in reform
classrooms. American Educational Research Journal, 33(2), 455-488.
Sweller, J., van Merrienboer, J. G., & Paas, F. G. (1998). Cognitive architecture and instructional
design. Educational Psychology Review, 10(3), 251-296.
Verschaffel, L., Greer, B., & De Corte, E. (2000). Making sense of word problems. Lisse, The
Netherlands: Swets and Zeitlinger.
Walkington, C. (2013). Using learning technologies to personalize instruction to student
interests: The impact of relevant contexts on performance and learning outcomes. Journal
of Educational Psychology, 105(4), 932-945.
Walkington, C., & Bernacki, M. (2015). Students authoring personalized “algebra stories”:
Problem-posing in the context of out-of-school interests. The Journal of Mathematics
Behavior, 40, 171-191.
Walkington, C., Clinton, V., Ritter, S. N., & Nathan, M. J. (2015). How readability and topic
incidence relate to performance on mathematics story problems in computer-based
curricula. Journal of Educational Psychology, 107(4), 1051-1074.
154
Walkington, C., Petrosino, A., & Sherman, M. (2013). Supporting algebraic reasoning through
personalized story scenarios: How situational understanding mediates performance and
strategies. Mathematical Thinking and Learning, 15(2), 89-120.
Webb, N. L. (1997). Criteria for alignment of expectations and assessments in mathematics and
science education [Research Monograph No. 8]. Washington, DC: Council of Chief State
School Officers.
Wise, S. L., & DeMars, C. E. (2005). Low examinee effort in low-stakes assessment: Problems
and potential solutions. Educational Assessment, 10(1), 1-17.
Wise, S. L., & Kong, X. (2005). Response time effort: A new measure of examinee motivation in
computer-based tests. Applied Measurement in Education, 18(2), 163-183.
Wise, S. L., Pastor, D. A., & Kong, X. J. (2009). Correlates of rapid guessing behavior in low-
stakes testing: Implications for test development and measurement practice. Applied
Measurement in Education, 22(2), 185-205.
Yen, C. H., Chen, I. C., Lai, S. C., & Chuang, Y. R. (2015). An analytics-based approach to
managing cognitive load by using log data of learning management systems and
footprints of social media. Educational Technology & Society, 18 (4), 141–158.
Related Documents