Behavioral/Systems/Cognitive The Effects of Visual Stimulation and Selective Visual Attention on Rhythmic Neuronal Synchronization in Macaque Area V4 Pascal Fries, 1,2 * Thilo Womelsdorf, 1 * Robert Oostenveld, 1 and Robert Desimone 3,4 1 F. C. Donders Centre for Cognitive Neuroimaging, Radboud University Nijmegen, 6525 EN Nijmegen, The Netherlands, 2 Department of Biophysics, Radboud University Nijmegen, 6525 EZ Nijmegen, The Netherlands, 3 Laboratory of Neuropsychology, National Institute of Mental Health, National Institutes of Health, Bethesda, Maryland 20892, and 4 McGovern Institute for Brain Research, Massachusetts Institute of Technology, Cambridge, Massachusetts 02139 Selective attention lends relevant sensory input priority access to higher-level brain areas and ultimately to behavior. Recent studies have suggested that those neurons in visual areas that are activated by an attended stimulus engage in enhanced gamma-band (30 –70 Hz) synchronization compared with neurons activated by a distracter. Such precise synchronization could enhance the postsynaptic impact of cells carrying behaviorally relevant information. Previous studies have used the local field potential (LFP) power spectrum or spike- LFP coherence (SFC) to indirectly estimate spike synchronization. Here, we directly demonstrate zero-phase gamma-band coherence among spike trains of V4 neurons. This synchronization was particularly evident during visual stimulation and enhanced by selective attention, thus confirming the pattern inferred from LFP power and SFC. We therefore investigated the time course of LFP gamma-band power and found rapid dynamics consistent with interactions of top-down spatial and feature attention with bottom-up saliency. In addition to the modulation of synchronization during visual stimulation, selective attention significantly changed the prestimulus pattern of synchronization. Attention inside the receptive field of the recorded neuronal population enhanced gamma-band synchroni- zation and strongly reduced -band (9 –11 Hz) synchronization in the prestimulus period. These results lend further support for a functional role of rhythmic neuronal synchronization in attentional stimulus selection. Key words: synchronization; oscillation; coherence; gamma; ; attention Introduction Our remarkable capacity to recognize objects critically relies on response characteristics of neurons at later stages of visual cortex, particularly within the inferotemporal (IT) cortex. IT neurons respond selectively to complex objects composed of simpler vi- sual features and may gain some of this selectivity during learning (Erickson and Desimone, 1999; Baker et al., 2002; Sigala and Logothetis, 2002). One aspect underlying such complex repre- sentations in IT cortex is that receptive fields (RFs) span much of the central visual field. During natural vision, such a RF will typically contain multiple competing objects. However, when at- tention is directed to one of those objects, the respective neuronal response is biased toward the response that would be obtained if only the attended stimulus were presented (Moran and Desi- mone, 1985; Chelazzi et al., 1993; Desimone and Duncan, 1995; Sheinberg and Logothetis, 2001). Such a dynamic bias of re- sponses in IT cortex will partly be attributable to a selective mod- ulation of the neuronal input from earlier visual areas such as area V4, containing neurons with smaller RFs and thus coding for only a fraction of the visual space compared with IT neurons (Reynolds et al., 1999). Thus, attention likely enhances (reduces) the postsynaptic impact of those neuronal groups in area V4 processing attended (nonattended) stimuli or stimulus features. Previous studies have shown that attention accomplishes such a dynamic routing of sensory information in cortex not only by enhancing the spiking rate of input neurons, but also by enhanc- ing precise synchronization of neuronal groups activated by the attended stimulus (Fries et al., 2001; Bichot et al., 2005; Taylor et al., 2005; Womelsdorf et al., 2006). Enhanced synchronization of the spiking output of selective neuronal groups could enhance their impact on postsynaptic target cells (Salinas and Sejnowski, 2001; Azouz and Gray, 2003) and could establish a robust com- munication structure among activated neuronal groups by im- posing a selective pattern of synchronization across cortical areas (Fries, 2005; Womelsdorf et al., 2007). However, previous reports of enhancements of synchronization with selective visual atten- tion estimated synchronization of spike output from a visual area Received Oct. 2, 2007; revised Feb. 12, 2008; accepted March 30, 2008. This work was supported by Human Frontier Science Program Organization Grant RGP0070/2003 (P.F.), The Volkswagen Foundation Grant I/79876 (P.F.), the European Science Foundation European Young Investigator Award Program (P.F.), The Netherlands Organization for Scientific Research Grants 452-03-344 (P.F.) and 016-071-079 (T.W.), the National Institute of Mental Health Intramural Research Program (R.D.), and National Institutes of Health Grant R01-EY017292 (R.D.). We thank J. H. Reynolds, A. E. Rorie, A. F. Rossi, and R. C. Saunders for help during the experiments and P. Mitra for helpful comments. *P.F. and T.W. contributed equally to this work. Correspondence should be addressed to Dr. Pascal Fries , F. C. Donders Centre for Cognitive Neuroimaging, Kapittelweg 29, 6525 EN Nijmegen, The Netherlands. E-mail: [email protected]. DOI:10.1523/JNEUROSCI.4499-07.2008 Copyright © 2008 Society for Neuroscience 0270-6474/08/284823-13$15.00/0 The Journal of Neuroscience, April 30, 2008 • 28(18):4823– 4835 • 4823

Welcome message from author
This document is posted to help you gain knowledge. Please leave a comment to let me know what you think about it! Share it to your friends and learn new things together.
Transcript
Behavioral/Systems/Cognitive
The Effects of Visual Stimulation and Selective VisualAttention on Rhythmic Neuronal Synchronization inMacaque Area V4
Pascal Fries,1,2* Thilo Womelsdorf,1* Robert Oostenveld,1 and Robert Desimone3,4
1F. C. Donders Centre for Cognitive Neuroimaging, Radboud University Nijmegen, 6525 EN Nijmegen, The Netherlands, 2Department of Biophysics,Radboud University Nijmegen, 6525 EZ Nijmegen, The Netherlands, 3Laboratory of Neuropsychology, National Institute of Mental Health, NationalInstitutes of Health, Bethesda, Maryland 20892, and 4McGovern Institute for Brain Research, Massachusetts Institute of Technology, Cambridge,Massachusetts 02139
Selective attention lends relevant sensory input priority access to higher-level brain areas and ultimately to behavior. Recent studies havesuggested that those neurons in visual areas that are activated by an attended stimulus engage in enhanced gamma-band (30 –70 Hz)synchronization compared with neurons activated by a distracter. Such precise synchronization could enhance the postsynaptic impactof cells carrying behaviorally relevant information. Previous studies have used the local field potential (LFP) power spectrum or spike-LFP coherence (SFC) to indirectly estimate spike synchronization. Here, we directly demonstrate zero-phase gamma-band coherenceamong spike trains of V4 neurons. This synchronization was particularly evident during visual stimulation and enhanced by selectiveattention, thus confirming the pattern inferred from LFP power and SFC. We therefore investigated the time course of LFP gamma-bandpower and found rapid dynamics consistent with interactions of top-down spatial and feature attention with bottom-up saliency. Inaddition to the modulation of synchronization during visual stimulation, selective attention significantly changed the prestimuluspattern of synchronization. Attention inside the receptive field of the recorded neuronal population enhanced gamma-band synchroni-zation and strongly reduced �-band (9 –11 Hz) synchronization in the prestimulus period. These results lend further support for afunctional role of rhythmic neuronal synchronization in attentional stimulus selection.
Key words: synchronization; oscillation; coherence; gamma; �; attention
IntroductionOur remarkable capacity to recognize objects critically relies onresponse characteristics of neurons at later stages of visual cortex,particularly within the inferotemporal (IT) cortex. IT neuronsrespond selectively to complex objects composed of simpler vi-sual features and may gain some of this selectivity during learning(Erickson and Desimone, 1999; Baker et al., 2002; Sigala andLogothetis, 2002). One aspect underlying such complex repre-sentations in IT cortex is that receptive fields (RFs) span much ofthe central visual field. During natural vision, such a RF willtypically contain multiple competing objects. However, when at-tention is directed to one of those objects, the respective neuronalresponse is biased toward the response that would be obtained if
only the attended stimulus were presented (Moran and Desi-mone, 1985; Chelazzi et al., 1993; Desimone and Duncan, 1995;Sheinberg and Logothetis, 2001). Such a dynamic bias of re-sponses in IT cortex will partly be attributable to a selective mod-ulation of the neuronal input from earlier visual areas such as areaV4, containing neurons with smaller RFs and thus coding foronly a fraction of the visual space compared with IT neurons(Reynolds et al., 1999). Thus, attention likely enhances (reduces)the postsynaptic impact of those neuronal groups in area V4processing attended (nonattended) stimuli or stimulus features.
Previous studies have shown that attention accomplishes sucha dynamic routing of sensory information in cortex not only byenhancing the spiking rate of input neurons, but also by enhanc-ing precise synchronization of neuronal groups activated by theattended stimulus (Fries et al., 2001; Bichot et al., 2005; Taylor etal., 2005; Womelsdorf et al., 2006). Enhanced synchronization ofthe spiking output of selective neuronal groups could enhancetheir impact on postsynaptic target cells (Salinas and Sejnowski,2001; Azouz and Gray, 2003) and could establish a robust com-munication structure among activated neuronal groups by im-posing a selective pattern of synchronization across cortical areas(Fries, 2005; Womelsdorf et al., 2007). However, previous reportsof enhancements of synchronization with selective visual atten-tion estimated synchronization of spike output from a visual area
Received Oct. 2, 2007; revised Feb. 12, 2008; accepted March 30, 2008.This work was supported by Human Frontier Science Program Organization Grant RGP0070/2003 (P.F.), The
Volkswagen Foundation Grant I/79876 (P.F.), the European Science Foundation European Young Investigator AwardProgram (P.F.), The Netherlands Organization for Scientific Research Grants 452-03-344 (P.F.) and 016-071-079(T.W.), the National Institute of Mental Health Intramural Research Program (R.D.), and National Institutes of HealthGrant R01-EY017292 (R.D.). We thank J. H. Reynolds, A. E. Rorie, A. F. Rossi, and R. C. Saunders for help during theexperiments and P. Mitra for helpful comments.
*P.F. and T.W. contributed equally to this work.Correspondence should be addressed to Dr. Pascal Fries , F. C. Donders Centre for Cognitive Neuroimaging,
Kapittelweg 29, 6525 EN Nijmegen, The Netherlands. E-mail: [email protected]:10.1523/JNEUROSCI.4499-07.2008
Copyright © 2008 Society for Neuroscience 0270-6474/08/284823-13$15.00/0
The Journal of Neuroscience, April 30, 2008 • 28(18):4823– 4835 • 4823
only indirectly by measuring local field potential (LFP) oscilla-tory activity (Taylor et al., 2005), or coherence between neuronalspiking activity with the LFP (Fries et al., 2001; Bichot et al., 2005;Womelsdorf et al., 2006).
Here, we investigate the rhythmic synchronization amongspike trains and extend previous findings in several critical re-spects. We report that the spiking output of neurons in area V4synchronizes in the gamma-frequency band at near-zero time lagduring visual stimulation and show that this spike-to-spike syn-chronization is enhanced with selective attention. Furthermore,we illustrate that synchronization and spiking rates are dynami-cally modulated by bottom-up saliency in addition to top-downattention during the course of the task. Although some previousanalyses of the recordings reported in the present study have beenpublished (Fries et al., 2001; Womelsdorf et al., 2006, 2007), ournew analysis is focused on unexplored aspects of the data andthereby reveals substantial new results.
Materials and MethodsExperimental procedure. Experiments were performed in two hemi-spheres of two male rhesus monkeys (Macaca mulatta) and followedguidelines of the National Institutes of Health with approval by the Na-tional Institute of Mental Health Intramural Animal Care and Use Com-mittee. The prelunate gyrus was first localized using magnetic resonanceimage (MRI) scans. Recording chambers were then implanted over theprelunate gyrus under surgical anesthesia. Before recording throughsmall trepanations of the skull within the recording chamber, four toeight tungsten microelectrodes (impedances of 1–2 M�) were advancedseparately at a very slow rate (1.5 �m/s) to minimize deformation of thecortical surface by the electrode (“dimpling”). Electrode tips were sepa-rated by 650 or 900 �m. Data amplification, filtering, and acquisitionwere done with a Multichannel Acquisition Processor (Plexon, Dallas,TX). The signal from each electrode was passed through a headstage withunit gain and an output impedance of 240 � and then split to separatelyextract the spike and the LFP components. For spike recordings, thesignals were filtered with a passband of 100 – 8000 Hz, further amplified,and digitized with 40 kHz. A threshold was set interactively, and spikewaveforms were stored for a time window from 150 �s before to 700 �safter threshold crossing. The threshold clearly separated spikes fromnoise but was chosen to include multiunit activity (MUA). Off-line, weperformed a principal component analysis of the waveforms and plottedthe first against the second principal component. Those waveforms thatcorresponded to artifacts were excluded. For multiunit analyses, all otherwaveforms were accepted, and the times of threshold crossing were keptand downsampled to 1 kHz. For LFP recordings, the signals were filteredwith a passband of 0.7–170 Hz, further amplified, and digitized at 1 kHz.
The powerline artifact was removed from the LFP using the followingprocedure: all signals had been recorded continuously for the entire du-ration of the recording session. For each time epoch of interest (and eachrecording channel), we first took a 10 s epoch out of the continuoussignal with the epoch of interest in the middle. We then calculated thediscrete Fourier transform (DFT) of the 10 s epoch at 60, 120, and 180 Hzwithout any tapering. Because the powerline artifact is of a perfectlyconstant frequency, the 10 s epoch contains integer cycles of the artifactfrequencies and nearly all the artifact energy is contained in those DFTs.We then constructed 60, 120, and 180 Hz sine waves with the amplitudesand phases as estimated by the respective DFTs and subtracted those sinewaves from the 10 s epoch. The epoch of interest was then cut out of thecleaned 10 s epoch. Power spectra of the cleaned 10 s epochs demon-strated that all artifact energy was eliminated, leaving a notch of a binwidth of 0.1 Hz (� 1/10 s). The actual spectral analysis used the multi-taper method, with a spectral smoothing beyond �1 Hz (see below), sothat the notch became invisible.
At the start of the recordings, each electrode was lowered separatelyuntil it recorded visually driven activity. Once this had been achieved forall electrodes, we fine tuned the electrode positions to optimize thesignal-to-noise ratio of the multiple spike recordings. Because the pene-
tration was halted as soon as clear visually driven activity was obtained,most of the recordings were presumably done from the superficial layersof the cortex. To confirm the recording position without killing the ani-mal, we obtained a structural MRI with one electrode in place, confirm-ing the placement in the appropriate portion of the prelunate gyrus. RFposition and neuronal stimulus selectivity were as expected for the targetpart of area V4.
Visual stimulation and experimental paradigm. Stimuli were presentedon a 17 inch cathode ray tube monitor 0.57 m from the monkey’s eyesthat had a resolution of 800 � 600 pixels and a screen refresh rate of 120Hz noninterlaced. Stimulus generation and behavioral control were ac-complished with the CORTEX software package (www.cortex.salk.edu).
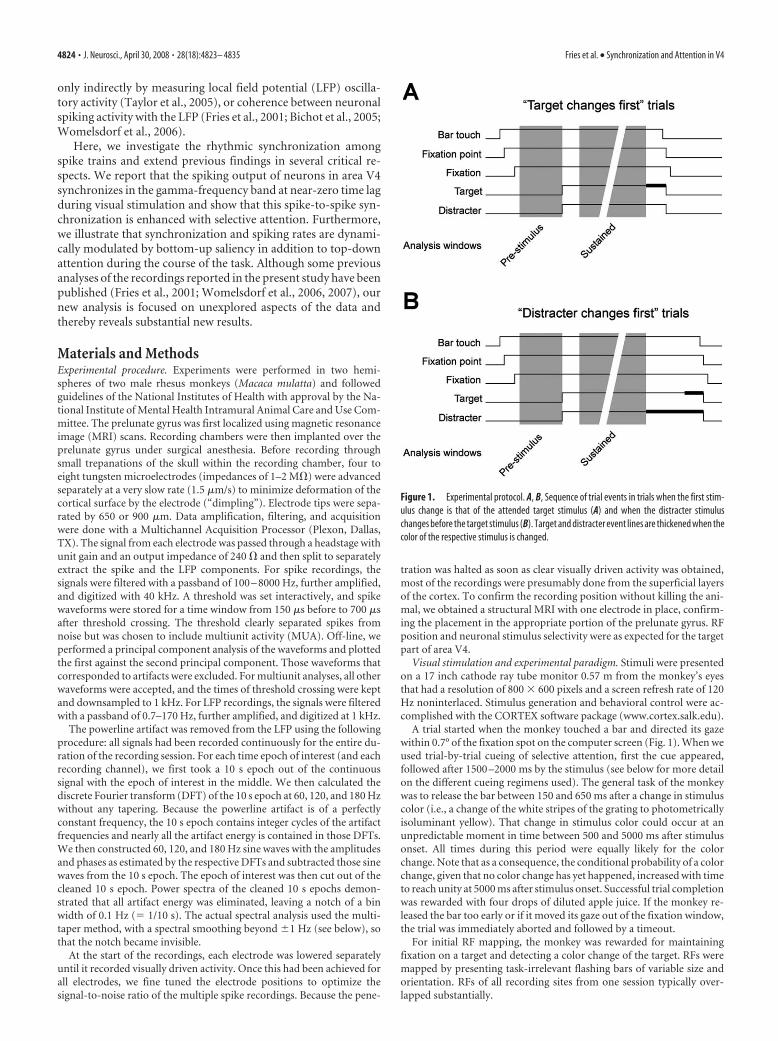
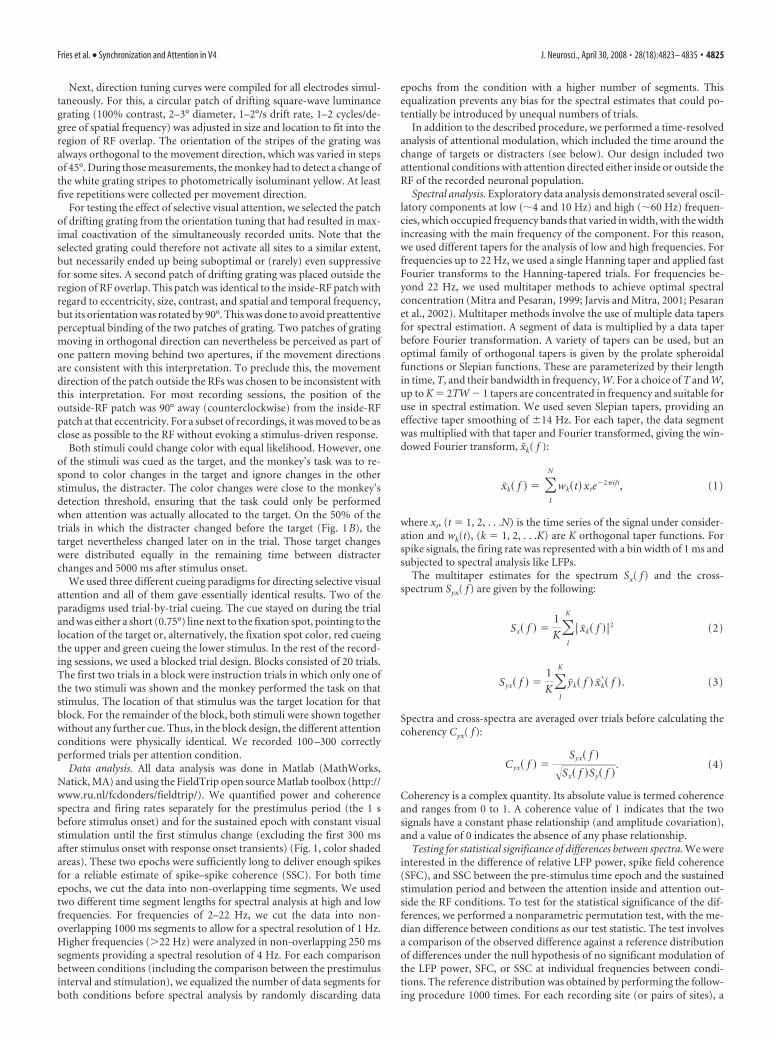
A trial started when the monkey touched a bar and directed its gazewithin 0.7° of the fixation spot on the computer screen (Fig. 1). When weused trial-by-trial cueing of selective attention, first the cue appeared,followed after 1500 –2000 ms by the stimulus (see below for more detailon the different cueing regimens used). The general task of the monkeywas to release the bar between 150 and 650 ms after a change in stimuluscolor (i.e., a change of the white stripes of the grating to photometricallyisoluminant yellow). That change in stimulus color could occur at anunpredictable moment in time between 500 and 5000 ms after stimulusonset. All times during this period were equally likely for the colorchange. Note that as a consequence, the conditional probability of a colorchange, given that no color change has yet happened, increased with timeto reach unity at 5000 ms after stimulus onset. Successful trial completionwas rewarded with four drops of diluted apple juice. If the monkey re-leased the bar too early or if it moved its gaze out of the fixation window,the trial was immediately aborted and followed by a timeout.
For initial RF mapping, the monkey was rewarded for maintainingfixation on a target and detecting a color change of the target. RFs weremapped by presenting task-irrelevant flashing bars of variable size andorientation. RFs of all recording sites from one session typically over-lapped substantially.
Figure 1. Experimental protocol. A, B, Sequence of trial events in trials when the first stim-ulus change is that of the attended target stimulus (A) and when the distracter stimuluschanges before the target stimulus (B). Target and distracter event lines are thickened when thecolor of the respective stimulus is changed.
4824 • J. Neurosci., April 30, 2008 • 28(18):4823– 4835 Fries et al. • Synchronization and Attention in V4
Next, direction tuning curves were compiled for all electrodes simul-taneously. For this, a circular patch of drifting square-wave luminancegrating (100% contrast, 2–3° diameter, 1–2°/s drift rate, 1–2 cycles/de-gree of spatial frequency) was adjusted in size and location to fit into theregion of RF overlap. The orientation of the stripes of the grating wasalways orthogonal to the movement direction, which was varied in stepsof 45°. During those measurements, the monkey had to detect a change ofthe white grating stripes to photometrically isoluminant yellow. At leastfive repetitions were collected per movement direction.
For testing the effect of selective visual attention, we selected the patchof drifting grating from the orientation tuning that had resulted in max-imal coactivation of the simultaneously recorded units. Note that theselected grating could therefore not activate all sites to a similar extent,but necessarily ended up being suboptimal or (rarely) even suppressivefor some sites. A second patch of drifting grating was placed outside theregion of RF overlap. This patch was identical to the inside-RF patch withregard to eccentricity, size, contrast, and spatial and temporal frequency,but its orientation was rotated by 90°. This was done to avoid preattentiveperceptual binding of the two patches of grating. Two patches of gratingmoving in orthogonal direction can nevertheless be perceived as part ofone pattern moving behind two apertures, if the movement directionsare consistent with this interpretation. To preclude this, the movementdirection of the patch outside the RFs was chosen to be inconsistent withthis interpretation. For most recording sessions, the position of theoutside-RF patch was 90° away (counterclockwise) from the inside-RFpatch at that eccentricity. For a subset of recordings, it was moved to be asclose as possible to the RF without evoking a stimulus-driven response.
Both stimuli could change color with equal likelihood. However, oneof the stimuli was cued as the target, and the monkey’s task was to re-spond to color changes in the target and ignore changes in the otherstimulus, the distracter. The color changes were close to the monkey’sdetection threshold, ensuring that the task could only be performedwhen attention was actually allocated to the target. On the 50% of thetrials in which the distracter changed before the target (Fig. 1 B), thetarget nevertheless changed later on in the trial. Those target changeswere distributed equally in the remaining time between distracterchanges and 5000 ms after stimulus onset.
We used three different cueing paradigms for directing selective visualattention and all of them gave essentially identical results. Two of theparadigms used trial-by-trial cueing. The cue stayed on during the trialand was either a short (0.75°) line next to the fixation spot, pointing to thelocation of the target or, alternatively, the fixation spot color, red cueingthe upper and green cueing the lower stimulus. In the rest of the record-ing sessions, we used a blocked trial design. Blocks consisted of 20 trials.The first two trials in a block were instruction trials in which only one ofthe two stimuli was shown and the monkey performed the task on thatstimulus. The location of that stimulus was the target location for thatblock. For the remainder of the block, both stimuli were shown togetherwithout any further cue. Thus, in the block design, the different attentionconditions were physically identical. We recorded 100 –300 correctlyperformed trials per attention condition.
Data analysis. All data analysis was done in Matlab (MathWorks,Natick, MA) and using the FieldTrip open source Matlab toolbox (http://www.ru.nl/fcdonders/fieldtrip/). We quantified power and coherencespectra and firing rates separately for the prestimulus period (the 1 sbefore stimulus onset) and for the sustained epoch with constant visualstimulation until the first stimulus change (excluding the first 300 msafter stimulus onset with response onset transients) (Fig. 1, color shadedareas). These two epochs were sufficiently long to deliver enough spikesfor a reliable estimate of spike–spike coherence (SSC). For both timeepochs, we cut the data into non-overlapping time segments. We usedtwo different time segment lengths for spectral analysis at high and lowfrequencies. For frequencies of 2–22 Hz, we cut the data into non-overlapping 1000 ms segments to allow for a spectral resolution of 1 Hz.Higher frequencies (�22 Hz) were analyzed in non-overlapping 250 mssegments providing a spectral resolution of 4 Hz. For each comparisonbetween conditions (including the comparison between the prestimulusinterval and stimulation), we equalized the number of data segments forboth conditions before spectral analysis by randomly discarding data
epochs from the condition with a higher number of segments. Thisequalization prevents any bias for the spectral estimates that could po-tentially be introduced by unequal numbers of trials.
In addition to the described procedure, we performed a time-resolvedanalysis of attentional modulation, which included the time around thechange of targets or distracters (see below). Our design included twoattentional conditions with attention directed either inside or outside theRF of the recorded neuronal population.
Spectral analysis. Exploratory data analysis demonstrated several oscil-latory components at low (�4 and 10 Hz) and high (�60 Hz) frequen-cies, which occupied frequency bands that varied in width, with the widthincreasing with the main frequency of the component. For this reason,we used different tapers for the analysis of low and high frequencies. Forfrequencies up to 22 Hz, we used a single Hanning taper and applied fastFourier transforms to the Hanning-tapered trials. For frequencies be-yond 22 Hz, we used multitaper methods to achieve optimal spectralconcentration (Mitra and Pesaran, 1999; Jarvis and Mitra, 2001; Pesaranet al., 2002). Multitaper methods involve the use of multiple data tapersfor spectral estimation. A segment of data is multiplied by a data taperbefore Fourier transformation. A variety of tapers can be used, but anoptimal family of orthogonal tapers is given by the prolate spheroidalfunctions or Slepian functions. These are parameterized by their lengthin time, T, and their bandwidth in frequency, W. For a choice of T and W,up to K � 2TW � 1 tapers are concentrated in frequency and suitable foruse in spectral estimation. We used seven Slepian tapers, providing aneffective taper smoothing of �14 Hz. For each taper, the data segmentwas multiplied with that taper and Fourier transformed, giving the win-dowed Fourier transform, xk( f ):
xk� f � �I
N
wk�t xte�2�ift, (1)
where xt, (t � 1, 2, . . .N) is the time series of the signal under consider-ation and wk(t), (k � 1, 2, . . .K) are K orthogonal taper functions. Forspike signals, the firing rate was represented with a bin width of 1 ms andsubjected to spectral analysis like LFPs.
The multitaper estimates for the spectrum Sx( f ) and the cross-spectrum Syx( f ) are given by the following:
Sx� f �1
K�I
K
| xk� f |2 (2)
Syx� f �1
K�I
K
yk� f xk*� f . (3)
Spectra and cross-spectra are averaged over trials before calculating thecoherency Cyx( f ):
Cyx� f �Syx� f
�Sx� f Sy� f . (4)
Coherency is a complex quantity. Its absolute value is termed coherenceand ranges from 0 to 1. A coherence value of 1 indicates that the twosignals have a constant phase relationship (and amplitude covariation),and a value of 0 indicates the absence of any phase relationship.
Testing for statistical significance of differences between spectra. We wereinterested in the difference of relative LFP power, spike field coherence(SFC), and SSC between the pre-stimulus time epoch and the sustainedstimulation period and between the attention inside and attention out-side the RF conditions. To test for the statistical significance of the dif-ferences, we performed a nonparametric permutation test, with the me-dian difference between conditions as our test statistic. The test involvesa comparison of the observed difference against a reference distributionof differences under the null hypothesis of no significant modulation ofthe LFP power, SFC, or SSC at individual frequencies between condi-tions. The reference distribution was obtained by performing the follow-ing procedure 1000 times. For each recording site (or pairs of sites), a
Fries et al. • Synchronization and Attention in V4 J. Neurosci., April 30, 2008 • 28(18):4823– 4835 • 4825
random decision was made to which condition the data from eithercondition was assigned. We then calculated the test statistic at each fre-quency for these randomly assigned conditions and stored only the min-imal and maximal difference across frequencies. From the resulting dis-tribution of 1000 minimal and maximal differences, we determined the2.5th and the 97.5th percentile. The empirically observed, nonrandom-ized difference at a particular frequency was considered statistically sig-nificant ( p 0.05), when it was larger than the 97.5th or smaller than the2.5th percentile of the reference distribution. This procedure corre-sponds to a two-sided test with a global false positive rate of 5% andcorrection for the multiple comparisons across frequencies.
Time-dependent analysis of gamma-band synchronization and firingrate. To analyze the temporal evolution of attentional modulation, wecalculated LFP power in the gamma-frequency band and firing rate witha sliding-window analysis around the time of stimulus onset and aroundthe time of the color change of the target and distracter. LFP power at 60Hz was estimated for windows of �125 ms that were slid over the data in20 ms steps. Spectral estimation relied on multitapering as describedabove and used a smoothing bandwidth of �18 Hz. LFP gamma-bandpower was normalized per recording site through dividing by the powerin the baseline period, averaged over both attention conditions. To easecomparison with LFP power, we quantified firing rates within the sametime windows (�125 ms slid across the data in 20 ms steps) and normal-ized them per recording site through dividing by the baseline firing rate,averaged over both attention conditions. The statistical testing of thepower and firing rate time courses used the same nonparametric ran-domization approach as for the spectra (see above), except that (1) thetest statistic was the t value from a t test between conditions and acrossrecording sites and (2) the corresponding multiple-comparison correc-tion was across time.
Microsaccade detection. Microsaccades (MSs) were detected accordingto the following procedure. Horizontal and vertical eye position record-ings were low-pass filtered (40 Hz), to remove high-frequency noise.The filtered position signals were differentiated in time to obtain velocitysignals. Horizontal and vertical eye velocities were then combined to giveoverall eye velocity, regardless of movement direction. If this velocityexceeded 3 SDs of its mean, this was considered a saccade. Saccades thatstayed within the predefined fixation window of 0.7° around the fixationpoint were considered MSs.
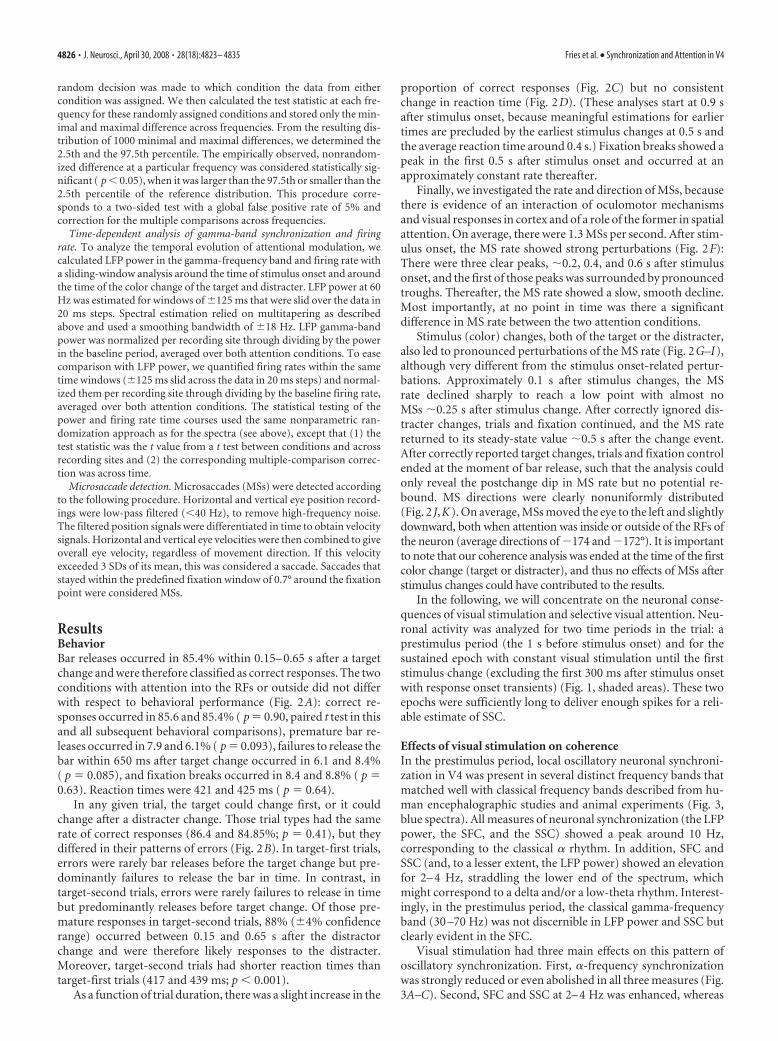
ResultsBehaviorBar releases occurred in 85.4% within 0.15– 0.65 s after a targetchange and were therefore classified as correct responses. The twoconditions with attention into the RFs or outside did not differwith respect to behavioral performance (Fig. 2A): correct re-sponses occurred in 85.6 and 85.4% ( p � 0.90, paired t test in thisand all subsequent behavioral comparisons), premature bar re-leases occurred in 7.9 and 6.1% ( p � 0.093), failures to release thebar within 650 ms after target change occurred in 6.1 and 8.4%( p � 0.085), and fixation breaks occurred in 8.4 and 8.8% ( p �0.63). Reaction times were 421 and 425 ms ( p � 0.64).
In any given trial, the target could change first, or it couldchange after a distracter change. Those trial types had the samerate of correct responses (86.4 and 84.85%; p � 0.41), but theydiffered in their patterns of errors (Fig. 2B). In target-first trials,errors were rarely bar releases before the target change but pre-dominantly failures to release the bar in time. In contrast, intarget-second trials, errors were rarely failures to release in timebut predominantly releases before target change. Of those pre-mature responses in target-second trials, 88% (�4% confidencerange) occurred between 0.15 and 0.65 s after the distractorchange and were therefore likely responses to the distracter.Moreover, target-second trials had shorter reaction times thantarget-first trials (417 and 439 ms; p 0.001).
As a function of trial duration, there was a slight increase in the
proportion of correct responses (Fig. 2C) but no consistentchange in reaction time (Fig. 2D). (These analyses start at 0.9 safter stimulus onset, because meaningful estimations for earliertimes are precluded by the earliest stimulus changes at 0.5 s andthe average reaction time around 0.4 s.) Fixation breaks showed apeak in the first 0.5 s after stimulus onset and occurred at anapproximately constant rate thereafter.
Finally, we investigated the rate and direction of MSs, becausethere is evidence of an interaction of oculomotor mechanismsand visual responses in cortex and of a role of the former in spatialattention. On average, there were 1.3 MSs per second. After stim-ulus onset, the MS rate showed strong perturbations (Fig. 2F):There were three clear peaks, �0.2, 0.4, and 0.6 s after stimulusonset, and the first of those peaks was surrounded by pronouncedtroughs. Thereafter, the MS rate showed a slow, smooth decline.Most importantly, at no point in time was there a significantdifference in MS rate between the two attention conditions.
Stimulus (color) changes, both of the target or the distracter,also led to pronounced perturbations of the MS rate (Fig. 2G–I),although very different from the stimulus onset-related pertur-bations. Approximately 0.1 s after stimulus changes, the MSrate declined sharply to reach a low point with almost noMSs �0.25 s after stimulus change. After correctly ignored dis-tracter changes, trials and fixation continued, and the MS ratereturned to its steady-state value �0.5 s after the change event.After correctly reported target changes, trials and fixation controlended at the moment of bar release, such that the analysis couldonly reveal the postchange dip in MS rate but no potential re-bound. MS directions were clearly nonuniformly distributed(Fig. 2 J,K). On average, MSs moved the eye to the left and slightlydownward, both when attention was inside or outside of the RFs ofthe neuron (average directions of �174 and �172°). It is importantto note that our coherence analysis was ended at the time of the firstcolor change (target or distracter), and thus no effects of MSs afterstimulus changes could have contributed to the results.
In the following, we will concentrate on the neuronal conse-quences of visual stimulation and selective visual attention. Neu-ronal activity was analyzed for two time periods in the trial: aprestimulus period (the 1 s before stimulus onset) and for thesustained epoch with constant visual stimulation until the firststimulus change (excluding the first 300 ms after stimulus onsetwith response onset transients) (Fig. 1, shaded areas). These twoepochs were sufficiently long to deliver enough spikes for a reli-able estimate of SSC.
Effects of visual stimulation on coherenceIn the prestimulus period, local oscillatory neuronal synchroni-zation in V4 was present in several distinct frequency bands thatmatched well with classical frequency bands described from hu-man encephalographic studies and animal experiments (Fig. 3,blue spectra). All measures of neuronal synchronization (the LFPpower, the SFC, and the SSC) showed a peak around 10 Hz,corresponding to the classical � rhythm. In addition, SFC andSSC (and, to a lesser extent, the LFP power) showed an elevationfor 2– 4 Hz, straddling the lower end of the spectrum, whichmight correspond to a delta and/or a low-theta rhythm. Interest-ingly, in the prestimulus period, the classical gamma-frequencyband (30 –70 Hz) was not discernible in LFP power and SSC butclearly evident in the SFC.
Visual stimulation had three main effects on this pattern ofoscillatory synchronization. First, �-frequency synchronizationwas strongly reduced or even abolished in all three measures (Fig.3A–C). Second, SFC and SSC at 2– 4 Hz was enhanced, whereas
4826 • J. Neurosci., April 30, 2008 • 28(18):4823– 4835 Fries et al. • Synchronization and Attention in V4
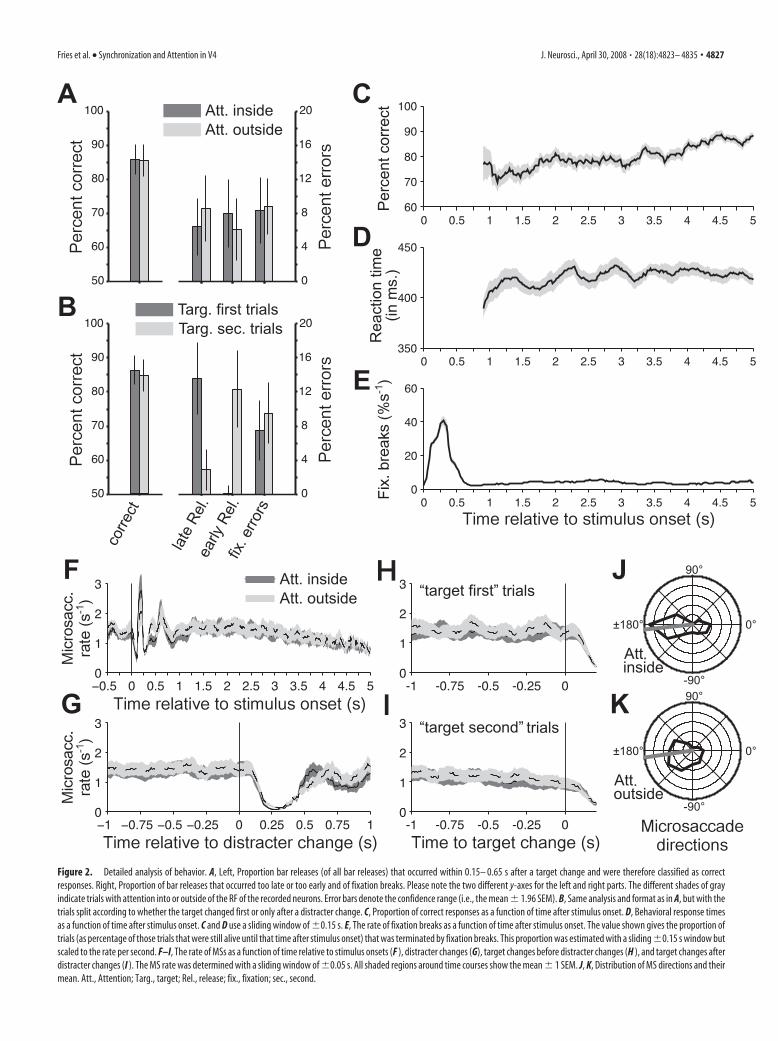
Figure 2. Detailed analysis of behavior. A, Left, Proportion bar releases (of all bar releases) that occurred within 0.15– 0.65 s after a target change and were therefore classified as correctresponses. Right, Proportion of bar releases that occurred too late or too early and of fixation breaks. Please note the two different y-axes for the left and right parts. The different shades of grayindicate trials with attention into or outside of the RF of the recorded neurons. Error bars denote the confidence range (i.e., the mean � 1.96 SEM). B, Same analysis and format as in A, but with thetrials split according to whether the target changed first or only after a distracter change. C, Proportion of correct responses as a function of time after stimulus onset. D, Behavioral response timesas a function of time after stimulus onset. C and D use a sliding window of �0.15 s. E, The rate of fixation breaks as a function of time after stimulus onset. The value shown gives the proportion oftrials (as percentage of those trials that were still alive until that time after stimulus onset) that was terminated by fixation breaks. This proportion was estimated with a sliding �0.15 s window butscaled to the rate per second. F–I, The rate of MSs as a function of time relative to stimulus onsets (F ), distracter changes (G), target changes before distracter changes (H ), and target changes afterdistracter changes (I ). The MS rate was determined with a sliding window of �0.05 s. All shaded regions around time courses show the mean � 1 SEM. J, K, Distribution of MS directions and theirmean. Att., Attention; Targ., target; Rel., release; fix., fixation; sec., second.
Fries et al. • Synchronization and Attention in V4 J. Neurosci., April 30, 2008 • 28(18):4823– 4835 • 4827
LFP power in this band was reduced.Third, gamma-frequency synchronizationwas strongly enhanced as evidenced by allmeasures.
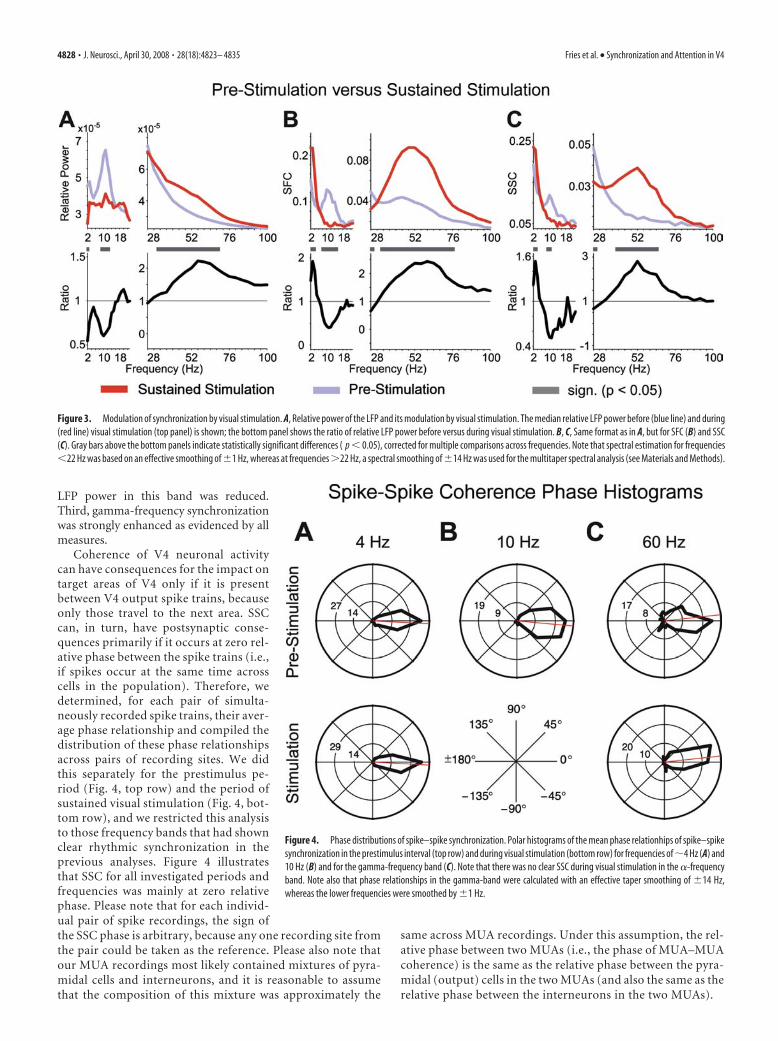
Coherence of V4 neuronal activitycan have consequences for the impact ontarget areas of V4 only if it is presentbetween V4 output spike trains, becauseonly those travel to the next area. SSCcan, in turn, have postsynaptic conse-quences primarily if it occurs at zero rel-ative phase between the spike trains (i.e.,if spikes occur at the same time acrosscells in the population). Therefore, wedetermined, for each pair of simulta-neously recorded spike trains, their aver-age phase relationship and compiled thedistribution of these phase relationshipsacross pairs of recording sites. We didthis separately for the prestimulus pe-riod (Fig. 4, top row) and the period ofsustained visual stimulation (Fig. 4, bot-tom row), and we restricted this analysisto those frequency bands that had shownclear rhythmic synchronization in theprevious analyses. Figure 4 illustratesthat SSC for all investigated periods andfrequencies was mainly at zero relativephase. Please note that for each individ-ual pair of spike recordings, the sign ofthe SSC phase is arbitrary, because any one recording site fromthe pair could be taken as the reference. Please also note thatour MUA recordings most likely contained mixtures of pyra-midal cells and interneurons, and it is reasonable to assumethat the composition of this mixture was approximately the
same across MUA recordings. Under this assumption, the rel-ative phase between two MUAs (i.e., the phase of MUA–MUAcoherence) is the same as the relative phase between the pyra-midal (output) cells in the two MUAs (and also the same as therelative phase between the interneurons in the two MUAs).
Figure 3. Modulation of synchronization by visual stimulation. A, Relative power of the LFP and its modulation by visual stimulation. The median relative LFP power before (blue line) and during(red line) visual stimulation (top panel) is shown; the bottom panel shows the ratio of relative LFP power before versus during visual stimulation. B, C, Same format as in A, but for SFC (B) and SSC(C). Gray bars above the bottom panels indicate statistically significant differences ( p 0.05), corrected for multiple comparisons across frequencies. Note that spectral estimation for frequencies22 Hz was based on an effective smoothing of �1 Hz, whereas at frequencies �22 Hz, a spectral smoothing of �14 Hz was used for the multitaper spectral analysis (see Materials and Methods).
Figure 4. Phase distributions of spike–spike synchronization. Polar histograms of the mean phase relationhips of spike–spikesynchronization in the prestimulus interval (top row) and during visual stimulation (bottom row) for frequencies of �4 Hz (A) and10 Hz (B) and for the gamma-frequency band (C). Note that there was no clear SSC during visual stimulation in the �-frequencyband. Note also that phase relationships in the gamma-band were calculated with an effective taper smoothing of �14 Hz,whereas the lower frequencies were smoothed by �1 Hz.
4828 • J. Neurosci., April 30, 2008 • 28(18):4823– 4835 Fries et al. • Synchronization and Attention in V4
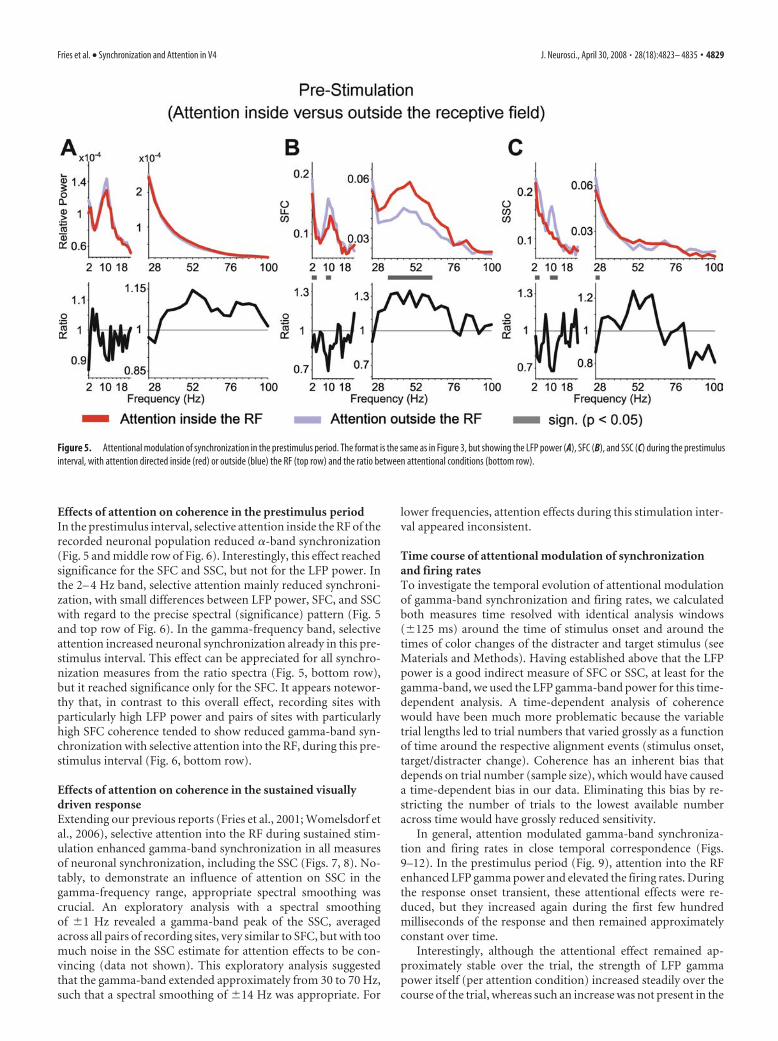
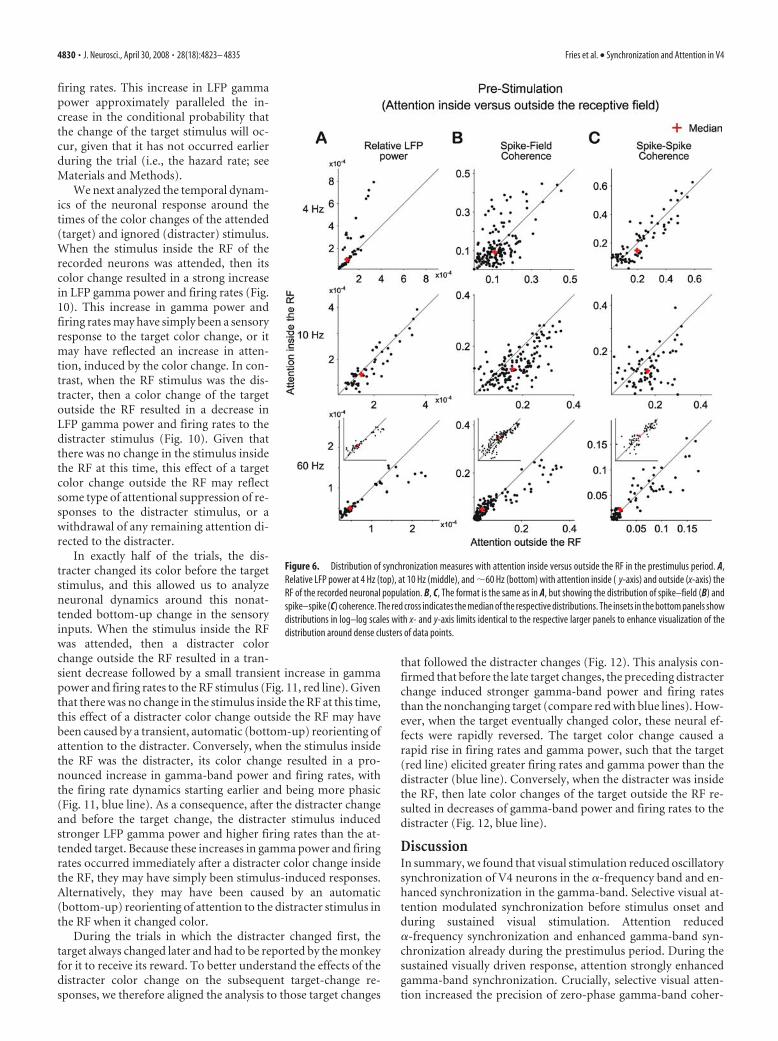
Effects of attention on coherence in the prestimulus periodIn the prestimulus interval, selective attention inside the RF of therecorded neuronal population reduced �-band synchronization(Fig. 5 and middle row of Fig. 6). Interestingly, this effect reachedsignificance for the SFC and SSC, but not for the LFP power. Inthe 2– 4 Hz band, selective attention mainly reduced synchroni-zation, with small differences between LFP power, SFC, and SSCwith regard to the precise spectral (significance) pattern (Fig. 5and top row of Fig. 6). In the gamma-frequency band, selectiveattention increased neuronal synchronization already in this pre-stimulus interval. This effect can be appreciated for all synchro-nization measures from the ratio spectra (Fig. 5, bottom row),but it reached significance only for the SFC. It appears notewor-thy that, in contrast to this overall effect, recording sites withparticularly high LFP power and pairs of sites with particularlyhigh SFC coherence tended to show reduced gamma-band syn-chronization with selective attention into the RF, during this pre-stimulus interval (Fig. 6, bottom row).
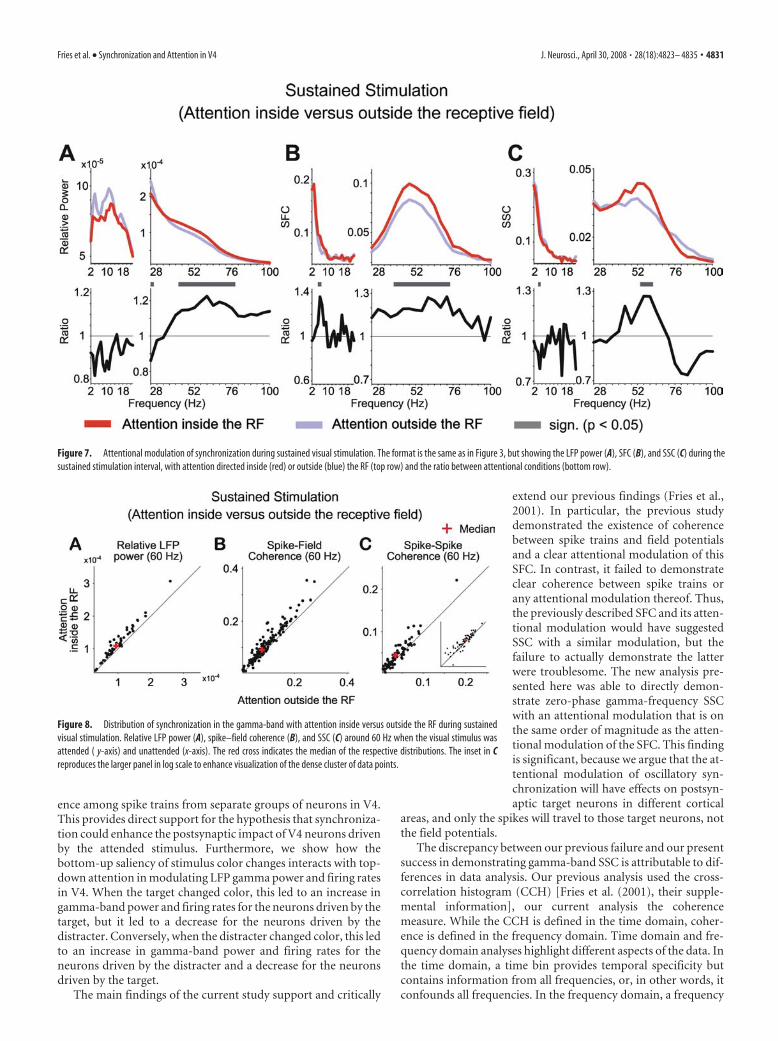
Effects of attention on coherence in the sustained visuallydriven responseExtending our previous reports (Fries et al., 2001; Womelsdorf etal., 2006), selective attention into the RF during sustained stim-ulation enhanced gamma-band synchronization in all measuresof neuronal synchronization, including the SSC (Figs. 7, 8). No-tably, to demonstrate an influence of attention on SSC in thegamma-frequency range, appropriate spectral smoothing wascrucial. An exploratory analysis with a spectral smoothingof �1 Hz revealed a gamma-band peak of the SSC, averagedacross all pairs of recording sites, very similar to SFC, but with toomuch noise in the SSC estimate for attention effects to be con-vincing (data not shown). This exploratory analysis suggestedthat the gamma-band extended approximately from 30 to 70 Hz,such that a spectral smoothing of �14 Hz was appropriate. For
lower frequencies, attention effects during this stimulation inter-val appeared inconsistent.
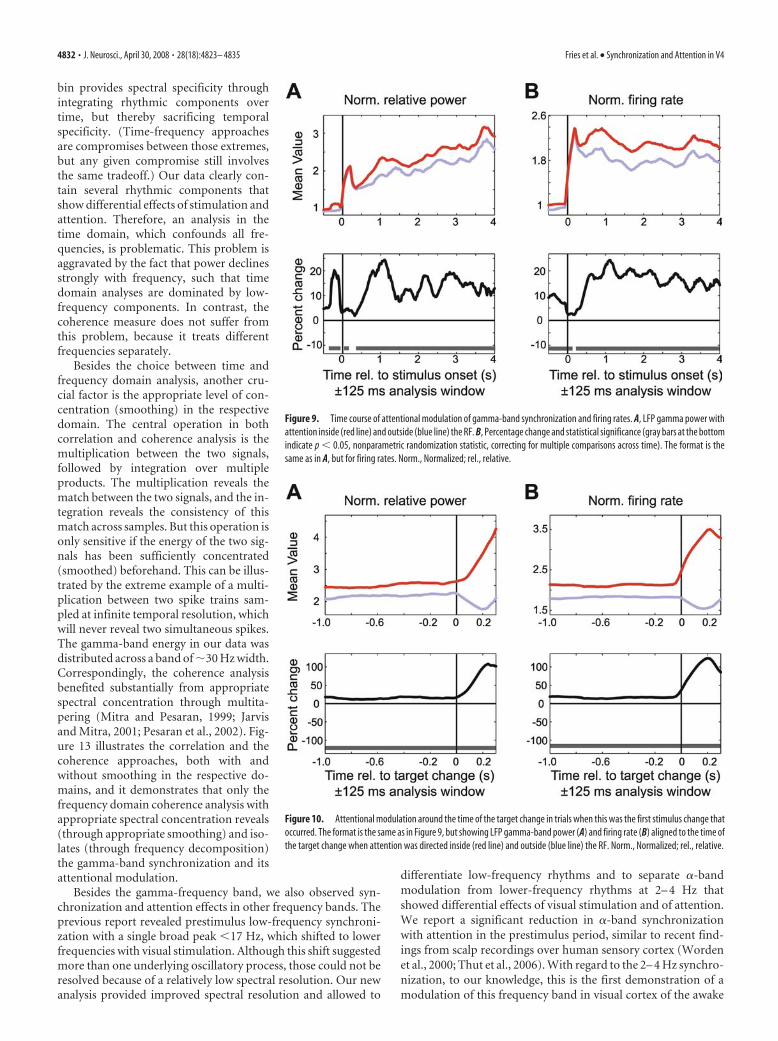
Time course of attentional modulation of synchronizationand firing ratesTo investigate the temporal evolution of attentional modulationof gamma-band synchronization and firing rates, we calculatedboth measures time resolved with identical analysis windows(�125 ms) around the time of stimulus onset and around thetimes of color changes of the distracter and target stimulus (seeMaterials and Methods). Having established above that the LFPpower is a good indirect measure of SFC or SSC, at least for thegamma-band, we used the LFP gamma-band power for this time-dependent analysis. A time-dependent analysis of coherencewould have been much more problematic because the variabletrial lengths led to trial numbers that varied grossly as a functionof time around the respective alignment events (stimulus onset,target/distracter change). Coherence has an inherent bias thatdepends on trial number (sample size), which would have causeda time-dependent bias in our data. Eliminating this bias by re-stricting the number of trials to the lowest available numberacross time would have grossly reduced sensitivity.
In general, attention modulated gamma-band synchroniza-tion and firing rates in close temporal correspondence (Figs.9–12). In the prestimulus period (Fig. 9), attention into the RFenhanced LFP gamma power and elevated the firing rates. Duringthe response onset transient, these attentional effects were re-duced, but they increased again during the first few hundredmilliseconds of the response and then remained approximatelyconstant over time.
Interestingly, although the attentional effect remained ap-proximately stable over the trial, the strength of LFP gammapower itself (per attention condition) increased steadily over thecourse of the trial, whereas such an increase was not present in the
Figure 5. Attentional modulation of synchronization in the prestimulus period. The format is the same as in Figure 3, but showing the LFP power (A), SFC (B), and SSC (C) during the prestimulusinterval, with attention directed inside (red) or outside (blue) the RF (top row) and the ratio between attentional conditions (bottom row).
Fries et al. • Synchronization and Attention in V4 J. Neurosci., April 30, 2008 • 28(18):4823– 4835 • 4829
firing rates. This increase in LFP gammapower approximately paralleled the in-crease in the conditional probability thatthe change of the target stimulus will oc-cur, given that it has not occurred earlierduring the trial (i.e., the hazard rate; seeMaterials and Methods).
We next analyzed the temporal dynam-ics of the neuronal response around thetimes of the color changes of the attended(target) and ignored (distracter) stimulus.When the stimulus inside the RF of therecorded neurons was attended, then itscolor change resulted in a strong increasein LFP gamma power and firing rates (Fig.10). This increase in gamma power andfiring rates may have simply been a sensoryresponse to the target color change, or itmay have reflected an increase in atten-tion, induced by the color change. In con-trast, when the RF stimulus was the dis-tracter, then a color change of the targetoutside the RF resulted in a decrease inLFP gamma power and firing rates to thedistracter stimulus (Fig. 10). Given thatthere was no change in the stimulus insidethe RF at this time, this effect of a targetcolor change outside the RF may reflectsome type of attentional suppression of re-sponses to the distracter stimulus, or awithdrawal of any remaining attention di-rected to the distracter.
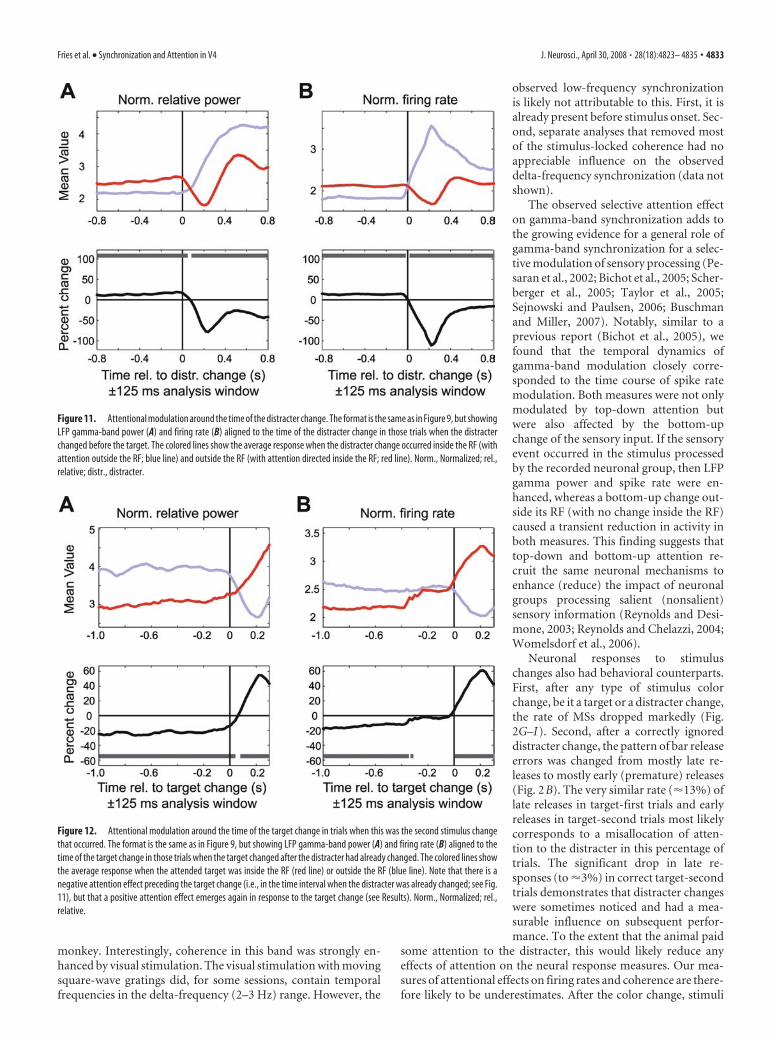
In exactly half of the trials, the dis-tracter changed its color before the targetstimulus, and this allowed us to analyzeneuronal dynamics around this nonat-tended bottom-up change in the sensoryinputs. When the stimulus inside the RFwas attended, then a distracter colorchange outside the RF resulted in a tran-sient decrease followed by a small transient increase in gammapower and firing rates to the RF stimulus (Fig. 11, red line). Giventhat there was no change in the stimulus inside the RF at this time,this effect of a distracter color change outside the RF may havebeen caused by a transient, automatic (bottom-up) reorienting ofattention to the distracter. Conversely, when the stimulus insidethe RF was the distracter, its color change resulted in a pro-nounced increase in gamma-band power and firing rates, withthe firing rate dynamics starting earlier and being more phasic(Fig. 11, blue line). As a consequence, after the distracter changeand before the target change, the distracter stimulus inducedstronger LFP gamma power and higher firing rates than the at-tended target. Because these increases in gamma power and firingrates occurred immediately after a distracter color change insidethe RF, they may have simply been stimulus-induced responses.Alternatively, they may have been caused by an automatic(bottom-up) reorienting of attention to the distracter stimulus inthe RF when it changed color.
During the trials in which the distracter changed first, thetarget always changed later and had to be reported by the monkeyfor it to receive its reward. To better understand the effects of thedistracter color change on the subsequent target-change re-sponses, we therefore aligned the analysis to those target changes
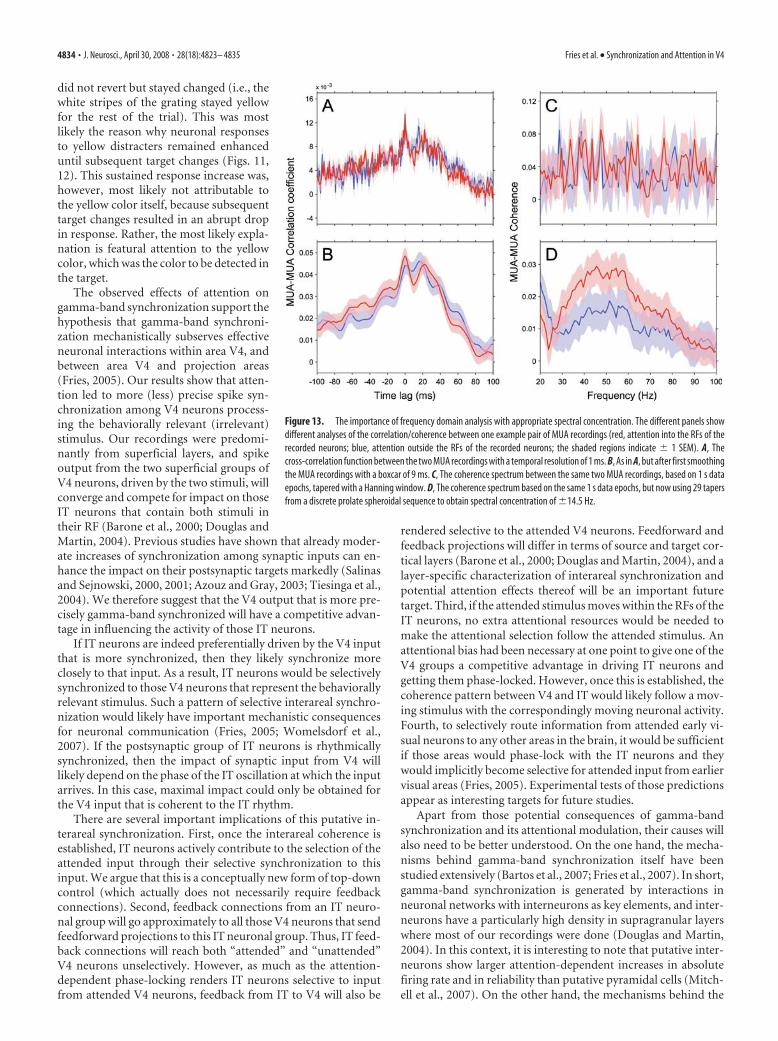
that followed the distracter changes (Fig. 12). This analysis con-firmed that before the late target changes, the preceding distracterchange induced stronger gamma-band power and firing ratesthan the nonchanging target (compare red with blue lines). How-ever, when the target eventually changed color, these neural ef-fects were rapidly reversed. The target color change caused arapid rise in firing rates and gamma power, such that the target(red line) elicited greater firing rates and gamma power than thedistracter (blue line). Conversely, when the distracter was insidethe RF, then late color changes of the target outside the RF re-sulted in decreases of gamma-band power and firing rates to thedistracter (Fig. 12, blue line).
DiscussionIn summary, we found that visual stimulation reduced oscillatorysynchronization of V4 neurons in the �-frequency band and en-hanced synchronization in the gamma-band. Selective visual at-tention modulated synchronization before stimulus onset andduring sustained visual stimulation. Attention reduced�-frequency synchronization and enhanced gamma-band syn-chronization already during the prestimulus period. During thesustained visually driven response, attention strongly enhancedgamma-band synchronization. Crucially, selective visual atten-tion increased the precision of zero-phase gamma-band coher-
Figure 6. Distribution of synchronization measures with attention inside versus outside the RF in the prestimulus period. A,Relative LFP power at 4 Hz (top), at 10 Hz (middle), and �60 Hz (bottom) with attention inside ( y-axis) and outside (x-axis) theRF of the recorded neuronal population. B, C, The format is the same as in A, but showing the distribution of spike–field (B) andspike–spike (C) coherence. The red cross indicates the median of the respective distributions. The insets in the bottom panels showdistributions in log–log scales with x- and y-axis limits identical to the respective larger panels to enhance visualization of thedistribution around dense clusters of data points.
4830 • J. Neurosci., April 30, 2008 • 28(18):4823– 4835 Fries et al. • Synchronization and Attention in V4
ence among spike trains from separate groups of neurons in V4.This provides direct support for the hypothesis that synchroniza-tion could enhance the postsynaptic impact of V4 neurons drivenby the attended stimulus. Furthermore, we show how thebottom-up saliency of stimulus color changes interacts with top-down attention in modulating LFP gamma power and firing ratesin V4. When the target changed color, this led to an increase ingamma-band power and firing rates for the neurons driven by thetarget, but it led to a decrease for the neurons driven by thedistracter. Conversely, when the distracter changed color, this ledto an increase in gamma-band power and firing rates for theneurons driven by the distracter and a decrease for the neuronsdriven by the target.
The main findings of the current study support and critically
extend our previous findings (Fries et al.,2001). In particular, the previous studydemonstrated the existence of coherencebetween spike trains and field potentialsand a clear attentional modulation of thisSFC. In contrast, it failed to demonstrateclear coherence between spike trains orany attentional modulation thereof. Thus,the previously described SFC and its atten-tional modulation would have suggestedSSC with a similar modulation, but thefailure to actually demonstrate the latterwere troublesome. The new analysis pre-sented here was able to directly demon-strate zero-phase gamma-frequency SSCwith an attentional modulation that is onthe same order of magnitude as the atten-tional modulation of the SFC. This findingis significant, because we argue that the at-tentional modulation of oscillatory syn-chronization will have effects on postsyn-aptic target neurons in different cortical
areas, and only the spikes will travel to those target neurons, notthe field potentials.
The discrepancy between our previous failure and our presentsuccess in demonstrating gamma-band SSC is attributable to dif-ferences in data analysis. Our previous analysis used the cross-correlation histogram (CCH) [Fries et al. (2001), their supple-mental information], our current analysis the coherencemeasure. While the CCH is defined in the time domain, coher-ence is defined in the frequency domain. Time domain and fre-quency domain analyses highlight different aspects of the data. Inthe time domain, a time bin provides temporal specificity butcontains information from all frequencies, or, in other words, itconfounds all frequencies. In the frequency domain, a frequency
Figure 7. Attentional modulation of synchronization during sustained visual stimulation. The format is the same as in Figure 3, but showing the LFP power (A), SFC (B), and SSC (C) during thesustained stimulation interval, with attention directed inside (red) or outside (blue) the RF (top row) and the ratio between attentional conditions (bottom row).
Figure 8. Distribution of synchronization in the gamma-band with attention inside versus outside the RF during sustainedvisual stimulation. Relative LFP power (A), spike–field coherence (B), and SSC (C) around 60 Hz when the visual stimulus wasattended ( y-axis) and unattended (x-axis). The red cross indicates the median of the respective distributions. The inset in Creproduces the larger panel in log scale to enhance visualization of the dense cluster of data points.
Fries et al. • Synchronization and Attention in V4 J. Neurosci., April 30, 2008 • 28(18):4823– 4835 • 4831
bin provides spectral specificity throughintegrating rhythmic components overtime, but thereby sacrificing temporalspecificity. (Time-frequency approachesare compromises between those extremes,but any given compromise still involvesthe same tradeoff.) Our data clearly con-tain several rhythmic components thatshow differential effects of stimulation andattention. Therefore, an analysis in thetime domain, which confounds all fre-quencies, is problematic. This problem isaggravated by the fact that power declinesstrongly with frequency, such that timedomain analyses are dominated by low-frequency components. In contrast, thecoherence measure does not suffer fromthis problem, because it treats differentfrequencies separately.
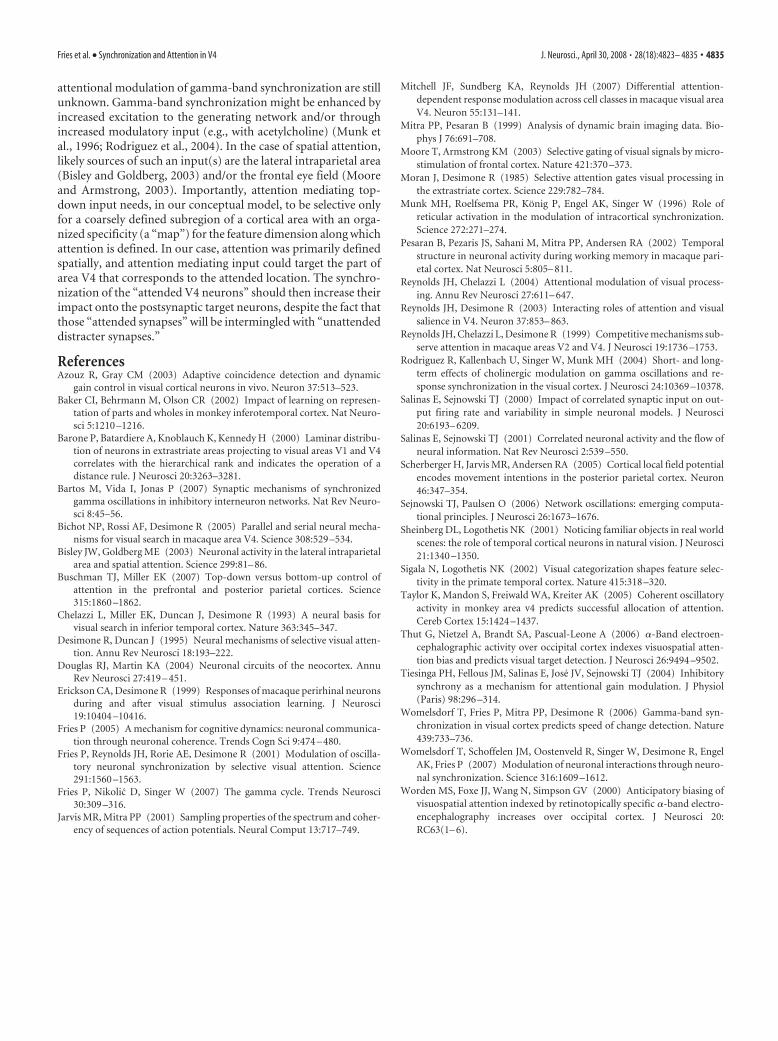
Besides the choice between time andfrequency domain analysis, another cru-cial factor is the appropriate level of con-centration (smoothing) in the respectivedomain. The central operation in bothcorrelation and coherence analysis is themultiplication between the two signals,followed by integration over multipleproducts. The multiplication reveals thematch between the two signals, and the in-tegration reveals the consistency of thismatch across samples. But this operation isonly sensitive if the energy of the two sig-nals has been sufficiently concentrated(smoothed) beforehand. This can be illus-trated by the extreme example of a multi-plication between two spike trains sam-pled at infinite temporal resolution, whichwill never reveal two simultaneous spikes.The gamma-band energy in our data wasdistributed across a band of �30 Hz width.Correspondingly, the coherence analysisbenefited substantially from appropriatespectral concentration through multita-pering (Mitra and Pesaran, 1999; Jarvisand Mitra, 2001; Pesaran et al., 2002). Fig-ure 13 illustrates the correlation and thecoherence approaches, both with andwithout smoothing in the respective do-mains, and it demonstrates that only thefrequency domain coherence analysis withappropriate spectral concentration reveals(through appropriate smoothing) and iso-lates (through frequency decomposition)the gamma-band synchronization and itsattentional modulation.
Besides the gamma-frequency band, we also observed syn-chronization and attention effects in other frequency bands. Theprevious report revealed prestimulus low-frequency synchroni-zation with a single broad peak 17 Hz, which shifted to lowerfrequencies with visual stimulation. Although this shift suggestedmore than one underlying oscillatory process, those could not beresolved because of a relatively low spectral resolution. Our newanalysis provided improved spectral resolution and allowed to
differentiate low-frequency rhythms and to separate �-bandmodulation from lower-frequency rhythms at 2– 4 Hz thatshowed differential effects of visual stimulation and of attention.We report a significant reduction in �-band synchronizationwith attention in the prestimulus period, similar to recent find-ings from scalp recordings over human sensory cortex (Wordenet al., 2000; Thut et al., 2006). With regard to the 2– 4 Hz synchro-nization, to our knowledge, this is the first demonstration of amodulation of this frequency band in visual cortex of the awake
Figure 9. Time course of attentional modulation of gamma-band synchronization and firing rates. A, LFP gamma power withattention inside (red line) and outside (blue line) the RF. B, Percentage change and statistical significance (gray bars at the bottomindicate p 0.05, nonparametric randomization statistic, correcting for multiple comparisons across time). The format is thesame as in A, but for firing rates. Norm., Normalized; rel., relative.
Figure 10. Attentional modulation around the time of the target change in trials when this was the first stimulus change thatoccurred. The format is the same as in Figure 9, but showing LFP gamma-band power (A) and firing rate (B) aligned to the time ofthe target change when attention was directed inside (red line) and outside (blue line) the RF. Norm., Normalized; rel., relative.
4832 • J. Neurosci., April 30, 2008 • 28(18):4823– 4835 Fries et al. • Synchronization and Attention in V4
monkey. Interestingly, coherence in this band was strongly en-hanced by visual stimulation. The visual stimulation with movingsquare-wave gratings did, for some sessions, contain temporalfrequencies in the delta-frequency (2–3 Hz) range. However, the
observed low-frequency synchronizationis likely not attributable to this. First, it isalready present before stimulus onset. Sec-ond, separate analyses that removed mostof the stimulus-locked coherence had noappreciable influence on the observeddelta-frequency synchronization (data notshown).
The observed selective attention effecton gamma-band synchronization adds tothe growing evidence for a general role ofgamma-band synchronization for a selec-tive modulation of sensory processing (Pe-saran et al., 2002; Bichot et al., 2005; Scher-berger et al., 2005; Taylor et al., 2005;Sejnowski and Paulsen, 2006; Buschmanand Miller, 2007). Notably, similar to aprevious report (Bichot et al., 2005), wefound that the temporal dynamics ofgamma-band modulation closely corre-sponded to the time course of spike ratemodulation. Both measures were not onlymodulated by top-down attention butwere also affected by the bottom-upchange of the sensory input. If the sensoryevent occurred in the stimulus processedby the recorded neuronal group, then LFPgamma power and spike rate were en-hanced, whereas a bottom-up change out-side its RF (with no change inside the RF)caused a transient reduction in activity inboth measures. This finding suggests thattop-down and bottom-up attention re-cruit the same neuronal mechanisms toenhance (reduce) the impact of neuronalgroups processing salient (nonsalient)sensory information (Reynolds and Desi-mone, 2003; Reynolds and Chelazzi, 2004;Womelsdorf et al., 2006).
Neuronal responses to stimuluschanges also had behavioral counterparts.First, after any type of stimulus colorchange, be it a target or a distracter change,the rate of MSs dropped markedly (Fig.2G–I). Second, after a correctly ignoreddistracter change, the pattern of bar releaseerrors was changed from mostly late re-leases to mostly early (premature) releases(Fig. 2B). The very similar rate (�13%) oflate releases in target-first trials and earlyreleases in target-second trials most likelycorresponds to a misallocation of atten-tion to the distracter in this percentage oftrials. The significant drop in late re-sponses (to �3%) in correct target-secondtrials demonstrates that distracter changeswere sometimes noticed and had a mea-surable influence on subsequent perfor-mance. To the extent that the animal paid
some attention to the distracter, this would likely reduce anyeffects of attention on the neural response measures. Our mea-sures of attentional effects on firing rates and coherence are there-fore likely to be underestimates. After the color change, stimuli
Figure 11. Attentional modulation around the time of the distracter change. The format is the same as in Figure 9, but showingLFP gamma-band power (A) and firing rate (B) aligned to the time of the distracter change in those trials when the distracterchanged before the target. The colored lines show the average response when the distracter change occurred inside the RF (withattention outside the RF; blue line) and outside the RF (with attention directed inside the RF; red line). Norm., Normalized; rel.,relative; distr., distracter.
Figure 12. Attentional modulation around the time of the target change in trials when this was the second stimulus changethat occurred. The format is the same as in Figure 9, but showing LFP gamma-band power (A) and firing rate (B) aligned to thetime of the target change in those trials when the target changed after the distracter had already changed. The colored lines showthe average response when the attended target was inside the RF (red line) or outside the RF (blue line). Note that there is anegative attention effect preceding the target change (i.e., in the time interval when the distracter was already changed; see Fig.11), but that a positive attention effect emerges again in response to the target change (see Results). Norm., Normalized; rel.,relative.
Fries et al. • Synchronization and Attention in V4 J. Neurosci., April 30, 2008 • 28(18):4823– 4835 • 4833
did not revert but stayed changed (i.e., thewhite stripes of the grating stayed yellowfor the rest of the trial). This was mostlikely the reason why neuronal responsesto yellow distracters remained enhanceduntil subsequent target changes (Figs. 11,12). This sustained response increase was,however, most likely not attributable tothe yellow color itself, because subsequenttarget changes resulted in an abrupt dropin response. Rather, the most likely expla-nation is featural attention to the yellowcolor, which was the color to be detected inthe target.
The observed effects of attention ongamma-band synchronization support thehypothesis that gamma-band synchroni-zation mechanistically subserves effectiveneuronal interactions within area V4, andbetween area V4 and projection areas(Fries, 2005). Our results show that atten-tion led to more (less) precise spike syn-chronization among V4 neurons process-ing the behaviorally relevant (irrelevant)stimulus. Our recordings were predomi-nantly from superficial layers, and spikeoutput from the two superficial groups ofV4 neurons, driven by the two stimuli, willconverge and compete for impact on thoseIT neurons that contain both stimuli intheir RF (Barone et al., 2000; Douglas andMartin, 2004). Previous studies have shown that already moder-ate increases of synchronization among synaptic inputs can en-hance the impact on their postsynaptic targets markedly (Salinasand Sejnowski, 2000, 2001; Azouz and Gray, 2003; Tiesinga et al.,2004). We therefore suggest that the V4 output that is more pre-cisely gamma-band synchronized will have a competitive advan-tage in influencing the activity of those IT neurons.
If IT neurons are indeed preferentially driven by the V4 inputthat is more synchronized, then they likely synchronize moreclosely to that input. As a result, IT neurons would be selectivelysynchronized to those V4 neurons that represent the behaviorallyrelevant stimulus. Such a pattern of selective interareal synchro-nization would likely have important mechanistic consequencesfor neuronal communication (Fries, 2005; Womelsdorf et al.,2007). If the postsynaptic group of IT neurons is rhythmicallysynchronized, then the impact of synaptic input from V4 willlikely depend on the phase of the IT oscillation at which the inputarrives. In this case, maximal impact could only be obtained forthe V4 input that is coherent to the IT rhythm.
There are several important implications of this putative in-terareal synchronization. First, once the interareal coherence isestablished, IT neurons actively contribute to the selection of theattended input through their selective synchronization to thisinput. We argue that this is a conceptually new form of top-downcontrol (which actually does not necessarily require feedbackconnections). Second, feedback connections from an IT neuro-nal group will go approximately to all those V4 neurons that sendfeedforward projections to this IT neuronal group. Thus, IT feed-back connections will reach both “attended” and “unattended”V4 neurons unselectively. However, as much as the attention-dependent phase-locking renders IT neurons selective to inputfrom attended V4 neurons, feedback from IT to V4 will also be
rendered selective to the attended V4 neurons. Feedforward andfeedback projections will differ in terms of source and target cor-tical layers (Barone et al., 2000; Douglas and Martin, 2004), and alayer-specific characterization of interareal synchronization andpotential attention effects thereof will be an important futuretarget. Third, if the attended stimulus moves within the RFs of theIT neurons, no extra attentional resources would be needed tomake the attentional selection follow the attended stimulus. Anattentional bias had been necessary at one point to give one of theV4 groups a competitive advantage in driving IT neurons andgetting them phase-locked. However, once this is established, thecoherence pattern between V4 and IT would likely follow a mov-ing stimulus with the correspondingly moving neuronal activity.Fourth, to selectively route information from attended early vi-sual neurons to any other areas in the brain, it would be sufficientif those areas would phase-lock with the IT neurons and theywould implicitly become selective for attended input from earliervisual areas (Fries, 2005). Experimental tests of those predictionsappear as interesting targets for future studies.
Apart from those potential consequences of gamma-bandsynchronization and its attentional modulation, their causes willalso need to be better understood. On the one hand, the mecha-nisms behind gamma-band synchronization itself have beenstudied extensively (Bartos et al., 2007; Fries et al., 2007). In short,gamma-band synchronization is generated by interactions inneuronal networks with interneurons as key elements, and inter-neurons have a particularly high density in supragranular layerswhere most of our recordings were done (Douglas and Martin,2004). In this context, it is interesting to note that putative inter-neurons show larger attention-dependent increases in absolutefiring rate and in reliability than putative pyramidal cells (Mitch-ell et al., 2007). On the other hand, the mechanisms behind the
Figure 13. The importance of frequency domain analysis with appropriate spectral concentration. The different panels showdifferent analyses of the correlation/coherence between one example pair of MUA recordings (red, attention into the RFs of therecorded neurons; blue, attention outside the RFs of the recorded neurons; the shaded regions indicate � 1 SEM). A, Thecross-correlation function between the two MUA recordings with a temporal resolution of 1 ms. B, As in A, but after first smoothingthe MUA recordings with a boxcar of 9 ms. C, The coherence spectrum between the same two MUA recordings, based on 1 s dataepochs, tapered with a Hanning window. D, The coherence spectrum based on the same 1 s data epochs, but now using 29 tapersfrom a discrete prolate spheroidal sequence to obtain spectral concentration of �14.5 Hz.
4834 • J. Neurosci., April 30, 2008 • 28(18):4823– 4835 Fries et al. • Synchronization and Attention in V4
attentional modulation of gamma-band synchronization are stillunknown. Gamma-band synchronization might be enhanced byincreased excitation to the generating network and/or throughincreased modulatory input (e.g., with acetylcholine) (Munk etal., 1996; Rodriguez et al., 2004). In the case of spatial attention,likely sources of such an input(s) are the lateral intraparietal area(Bisley and Goldberg, 2003) and/or the frontal eye field (Mooreand Armstrong, 2003). Importantly, attention mediating top-down input needs, in our conceptual model, to be selective onlyfor a coarsely defined subregion of a cortical area with an orga-nized specificity (a “map”) for the feature dimension along whichattention is defined. In our case, attention was primarily definedspatially, and attention mediating input could target the part ofarea V4 that corresponds to the attended location. The synchro-nization of the “attended V4 neurons” should then increase theirimpact onto the postsynaptic target neurons, despite the fact thatthose “attended synapses” will be intermingled with “unattendeddistracter synapses.”
ReferencesAzouz R, Gray CM (2003) Adaptive coincidence detection and dynamic
gain control in visual cortical neurons in vivo. Neuron 37:513–523.Baker CI, Behrmann M, Olson CR (2002) Impact of learning on represen-
tation of parts and wholes in monkey inferotemporal cortex. Nat Neuro-sci 5:1210 –1216.
Barone P, Batardiere A, Knoblauch K, Kennedy H (2000) Laminar distribu-tion of neurons in extrastriate areas projecting to visual areas V1 and V4correlates with the hierarchical rank and indicates the operation of adistance rule. J Neurosci 20:3263–3281.
Bartos M, Vida I, Jonas P (2007) Synaptic mechanisms of synchronizedgamma oscillations in inhibitory interneuron networks. Nat Rev Neuro-sci 8:45–56.
Bichot NP, Rossi AF, Desimone R (2005) Parallel and serial neural mecha-nisms for visual search in macaque area V4. Science 308:529 –534.
Bisley JW, Goldberg ME (2003) Neuronal activity in the lateral intraparietalarea and spatial attention. Science 299:81– 86.
Buschman TJ, Miller EK (2007) Top-down versus bottom-up control ofattention in the prefrontal and posterior parietal cortices. Science315:1860 –1862.
Chelazzi L, Miller EK, Duncan J, Desimone R (1993) A neural basis forvisual search in inferior temporal cortex. Nature 363:345–347.
Desimone R, Duncan J (1995) Neural mechanisms of selective visual atten-tion. Annu Rev Neurosci 18:193–222.
Douglas RJ, Martin KA (2004) Neuronal circuits of the neocortex. AnnuRev Neurosci 27:419 – 451.
Erickson CA, Desimone R (1999) Responses of macaque perirhinal neuronsduring and after visual stimulus association learning. J Neurosci19:10404 –10416.
Fries P (2005) A mechanism for cognitive dynamics: neuronal communica-tion through neuronal coherence. Trends Cogn Sci 9:474 – 480.
Fries P, Reynolds JH, Rorie AE, Desimone R (2001) Modulation of oscilla-tory neuronal synchronization by selective visual attention. Science291:1560 –1563.
Fries P, Nikolic D, Singer W (2007) The gamma cycle. Trends Neurosci30:309 –316.
Jarvis MR, Mitra PP (2001) Sampling properties of the spectrum and coher-ency of sequences of action potentials. Neural Comput 13:717–749.
Mitchell JF, Sundberg KA, Reynolds JH (2007) Differential attention-dependent response modulation across cell classes in macaque visual areaV4. Neuron 55:131–141.
Mitra PP, Pesaran B (1999) Analysis of dynamic brain imaging data. Bio-phys J 76:691–708.
Moore T, Armstrong KM (2003) Selective gating of visual signals by micro-stimulation of frontal cortex. Nature 421:370 –373.
Moran J, Desimone R (1985) Selective attention gates visual processing inthe extrastriate cortex. Science 229:782–784.
Munk MH, Roelfsema PR, Konig P, Engel AK, Singer W (1996) Role ofreticular activation in the modulation of intracortical synchronization.Science 272:271–274.
Pesaran B, Pezaris JS, Sahani M, Mitra PP, Andersen RA (2002) Temporalstructure in neuronal activity during working memory in macaque pari-etal cortex. Nat Neurosci 5:805– 811.
Reynolds JH, Chelazzi L (2004) Attentional modulation of visual process-ing. Annu Rev Neurosci 27:611– 647.
Reynolds JH, Desimone R (2003) Interacting roles of attention and visualsalience in V4. Neuron 37:853– 863.
Reynolds JH, Chelazzi L, Desimone R (1999) Competitive mechanisms sub-serve attention in macaque areas V2 and V4. J Neurosci 19:1736 –1753.
Rodriguez R, Kallenbach U, Singer W, Munk MH (2004) Short- and long-term effects of cholinergic modulation on gamma oscillations and re-sponse synchronization in the visual cortex. J Neurosci 24:10369 –10378.
Salinas E, Sejnowski TJ (2000) Impact of correlated synaptic input on out-put firing rate and variability in simple neuronal models. J Neurosci20:6193– 6209.
Salinas E, Sejnowski TJ (2001) Correlated neuronal activity and the flow ofneural information. Nat Rev Neurosci 2:539 –550.
Scherberger H, Jarvis MR, Andersen RA (2005) Cortical local field potentialencodes movement intentions in the posterior parietal cortex. Neuron46:347–354.
Sejnowski TJ, Paulsen O (2006) Network oscillations: emerging computa-tional principles. J Neurosci 26:1673–1676.
Sheinberg DL, Logothetis NK (2001) Noticing familiar objects in real worldscenes: the role of temporal cortical neurons in natural vision. J Neurosci21:1340 –1350.
Sigala N, Logothetis NK (2002) Visual categorization shapes feature selec-tivity in the primate temporal cortex. Nature 415:318 –320.
Taylor K, Mandon S, Freiwald WA, Kreiter AK (2005) Coherent oscillatoryactivity in monkey area v4 predicts successful allocation of attention.Cereb Cortex 15:1424 –1437.
Thut G, Nietzel A, Brandt SA, Pascual-Leone A (2006) �-Band electroen-cephalographic activity over occipital cortex indexes visuospatial atten-tion bias and predicts visual target detection. J Neurosci 26:9494 –9502.
Tiesinga PH, Fellous JM, Salinas E, Jose JV, Sejnowski TJ (2004) Inhibitorysynchrony as a mechanism for attentional gain modulation. J Physiol(Paris) 98:296 –314.
Womelsdorf T, Fries P, Mitra PP, Desimone R (2006) Gamma-band syn-chronization in visual cortex predicts speed of change detection. Nature439:733–736.
Womelsdorf T, Schoffelen JM, Oostenveld R, Singer W, Desimone R, EngelAK, Fries P (2007) Modulation of neuronal interactions through neuro-nal synchronization. Science 316:1609 –1612.
Worden MS, Foxe JJ, Wang N, Simpson GV (2000) Anticipatory biasing ofvisuospatial attention indexed by retinotopically specific �-band electro-encephalography increases over occipital cortex. J Neurosci 20:RC63(1– 6).
Fries et al. • Synchronization and Attention in V4 J. Neurosci., April 30, 2008 • 28(18):4823– 4835 • 4835
Related Documents