The Effects of the Micro-Market Structure for Kansas Grain Elevators on Spatial Grain Price Differentials eetas by Daniel M. O’Brien Suggested citation format: Suggested citation format: O’Brien, D. M. 2009. “The Effects of the Micro-Market Structure for Kansas Grain Elevators on Spatial Grain Price Differentials.” Proceedings of the NCCC-134 Conference on Applied Commodity Price Analysis, Forecasting, and Market Risk Management. St. Louis, MO. [http://www.farmdoc.uiuc.edu/nccc134].

Welcome message from author
This document is posted to help you gain knowledge. Please leave a comment to let me know what you think about it! Share it to your friends and learn new things together.
Transcript
The Effects of the Micro-Market Structure for Kansas Grain Elevators on Spatial Grain Price
Differentials e e t a s
by
Daniel M. O’Brien
Suggested citation format:Suggested citation format:
O’Brien, D. M. 2009. “The Effects of the Micro-Market Structure for Kansas Grain Elevators on Spatial Grain Price Differentials.” Proceedings of the NCCC-134 Conference on Applied Commodity Price Analysis, Forecasting, and Market Risk Management. St. Louis, MO. [http://www.farmdoc.uiuc.edu/nccc134].
1
The Effects of the Micro-Market Structure for Kansas Grain Elevators
on Spatial Grain Price Differentials
Daniel M. O’Brien*
Paper presented at the NCCC-134 Conference on Applied Commodity
Price Analysis, Forecasting, and Market Risk Management
St. Louis, Missouri April 20-21, 2009
Copyright 2009 by Daniel M. O’Brien. All rights reserved. Readers may make verbatim copies of this document for non-commercial purposes by any means, provided that this copyright notice
appears on all such pages
__________________________ * Daniel M. O’Brien is an Extension Agricultural Economist at the Northwest Research Extension Center in Colby, Kansas, and Associate Professor with appointment in the Department of Agricultural Economics at Kansas State University. Any opinions, findings, conclusions and recommendations expressed in this publication are those of the author and do not necessarily reflect the view of Kansas State University.
2
The Effects of the Micro-Market Structure for Kansas Grain Elevators
on Spatial Grain Price Differentials
Corn and wheat cash prices in Kansas are affected by a number of local supply-demand, market
structure, transportation access and other factors. Kansas corn prices in 2008 were affected by
form of business organization, local feedgrain production and livestock feed usage, elevator
storage capacity, access to railroad grain handling facilities, and to a limited degree by the
number of competitors in local markets. Geographic proximity to grain ethanol plants did not
have a positive impact on local corn prices, although a number of mitigating factors may exist.
Kansas wheat prices in 2008 were affected by local wheat production, elevator storage capacity,
the number of competitors in local markets, and by location relative to flour mills. Evidence of
operating cost and efficiency differences among grain elevators indicate the presence of market
power in local Kansas grain markets.
Keywords: grain markets, market structure, grain ethanol, wheat flour, monopsonistic
competition.
Introduction
In recent years the competitive structure of the Kansas grain market has been affected by factors such as livestock feed and wheat mill demand, consolidation of agribusinesses, development of the bioenergy industry, and changing railroad grain handling infrastructure. These changes have often affected the competitive positions of local Kansas grain elevators in local and regional grain markets. The geographic location and intensity of demand for feedgrains from the Kansas livestock feeding industry and for hard red winter wheat by wheat mills have been major factors in the development of the Kansas grain elevator industry and in the competitive structure of Kansas grain markets in recent history. An efficiency-driven trend toward increased grain elevator consolidation and intra-firm coordination has resulted in the formation of multi-site, large scale regional grain handling and processing cooperatives and joint ventures involving both cooperatives and/or independents. The development of unit and shuttle train grain handling facilities in Kansas has been largely motivated by competitive forces, i.e., the desire of grain elevators to enhance their competitive positions by attaining available economies of size and scale in both farm input marketing and grain export-oriented rail car handling facilities. Development of grain-based ethanol plants in Kansas in the last decade has also affected regional feedgrain supply-demand balances and the directional transportation flow of feedgrains throughout the state. In this study, these and other market factors are hypothesized to have had an impact on the competitive market structure of the Kansas grain industry in general, and upon competitive local feedgrain and wheat price differentials for grain elevators across the state. This study is patterned after research on how local corn price differentials are impacted by Illinois grain elevator market structure (Davis and Hill, 1974; Wenzel, Hill and Garcia, 2000). This study also accounts for the impact of grain-ethanol plant development on local feedgrain prices (following from McNew and Griffith, 2005) and of proximity to wheat mills on wheat prices. Whereas Davis and Hill, and Wenzel, Hill and Garcia relied upon direct surveys of grain
3
elevator managers for data, this study will make use of publicly available – non-proprietary information. Although the depth of information regarding any one grain elevator is less with this non-survey approach, the breadth of the data across a larger number of firms is greater, providing more observations and greater degrees of freedom in the associated statistical analysis. This study also contributes to the general body of research on factors affecting local and regional grain basis levels (Brorsen, et al., 1985) (Manfredo and Sanders, 2006). The objective of this study is to measure the impact of structural factors in the Kansas grain elevator industry upon local cash corn and wheat price differentials. A number of broader systemic, structural factors are hypothesized to impact Kansas feedgrain and wheat markets and cash price differentials in this study, including the organizational-form of grain elevators, local and regional grain supply-demand conditions, elevator grain storage and handling capacity, geographic proximity of non-affiliated competitive elevators, and access to shuttle or unit train grain handling facilities. Feedgrain price differentials may also be affected by geographic proximity to beef feedlots and/or grain-ethanol plants, whereas wheat price differentials may be affected by proximity to wheat processors and/or export-oriented grain terminals. After a description of the data and methods use in this study, the results of model estimation will be presented, followed by a summary and conclusions. Data and Methods
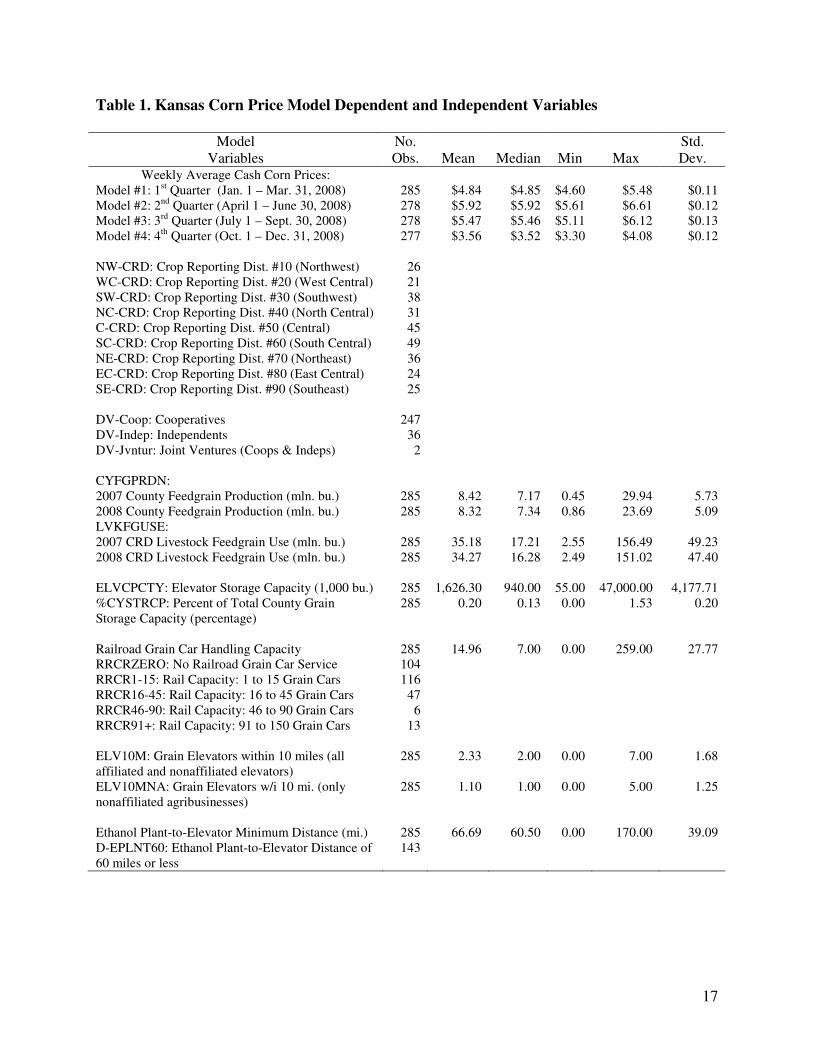
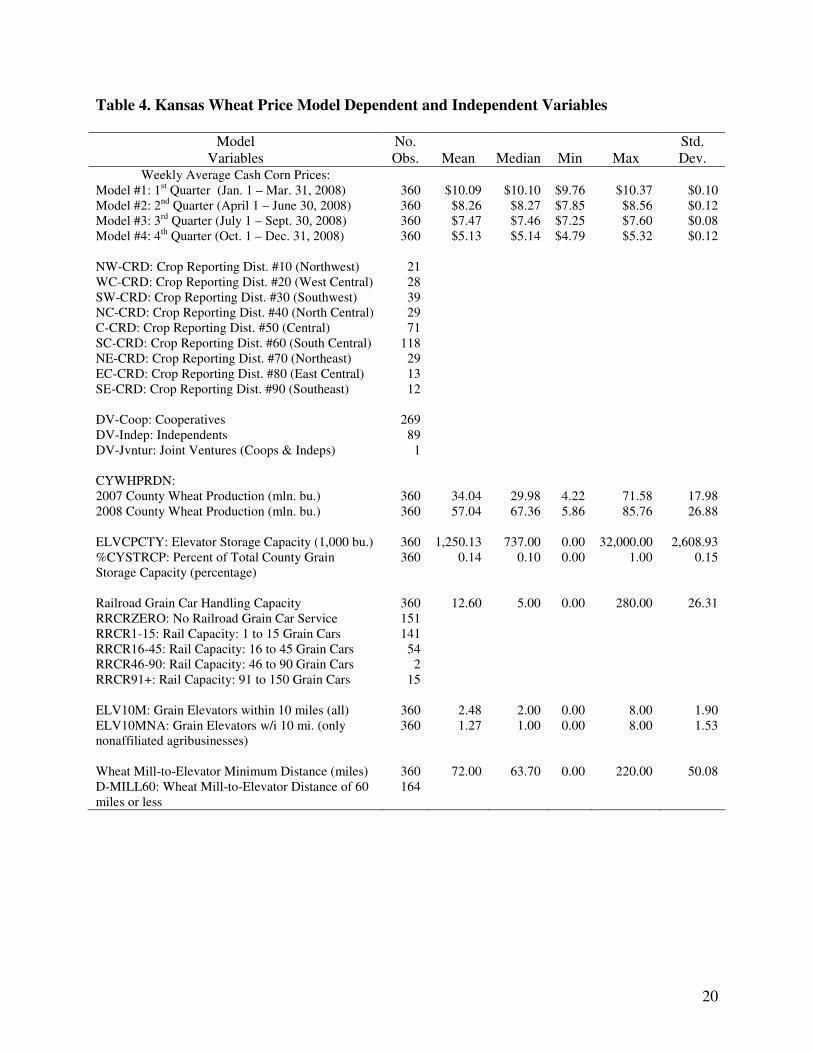
This study focuses upon local supply-demand and market structure factors that may have influenced Kansas corn and wheat cash prices in calendar year 2008. Wednesday weekly cash corn and wheat price data for calendar year 2008 for individual Kansas grain elevators are used from the K-State www.AgManager.info website database. The corn and wheat cash price data are divided into four quarterly groupings throughout the calendar year for both corn and wheat, with separate price models estimated for each quarter of the year for both commodities. Current information for approximately 700 Kansas grain elevators on organizational types, grain elevator capacity, railroad access and railcar handling capacity, and other firm characteristics was gathered from the Kansas Grain and Feed Association, the websites for the Union Pacific and Burlington Northern Santa Fe Railroads, and other publicly available sources. Of the approximately 700 grain elevators in Kansas, adequate numbers of weekly corn and wheat price observations were available for 285 and 360 locations, respectively (Tables 1 and 4) from the K-State www.AgManager.info grain price database. A limited number of missing cash price observations for different grain elevators were estimated using average differentials from state-wide prices. These cash grain prices represent publicly reported bids for each elevator, and may not reflect other individualized grain pricing arrangements that may be available to local grain marketer / sellers. For Kansas corn and wheat markets, average prices were estimated for the 1st Quarter (January – March), 2nd Quarter (April – June), 3rd Quarter (July – September) and 4th Quarter (October – December) of 2008. Quarterly Corn Prices: For the Kansas grain elevators included in this study, cash corn prices averaged $4.82, $5.92, $5.46, and $3.57 per bushel during the 1st through 4th quarters of 2008,
4
respectively (Table 1). During January through March (i.e., the “winter” quarter of the year) the focus of the Kansas corn market is on either continuing to store the previous year’s crop or on selling it to either grain elevators or other end users, such as livestock feeders or grain ethanol plants. Corn acreage and planting conditions as well as U.S. supply-demand projections for the coming crop year typically dominate the attention of the Kansas and U.S. corn markets during April through June (i.e., the “planting” period). Weather and associated U.S. crop development prospects typically become the central focus of the corn market during July through September (i.e., the period of “crop development”). The final size of the U.S. corn crop and the subsequent ramifications for the relative scarcity corn supplies in the new marketing year garners the attention of the corn market during October through December (i.e., “Fall harvest”). Corn market supply – demand and structural characteristics for the most recent harvested crop are most likely to be reflected in cash corn prices during January – March (1st Quarter) and October – December (4th Quarter) periods of the year. During the 2nd and 3rd quarters the attention of the market also takes into account new crop feedgrain prospects to a greater degree, lessening the direct impact of grain industry structure characteristics and existing grain supply-demand conditions upon cash prices. This approach is consistent with that used by Davis and Hill, 1974; and Wenzel, Hill and Garcia, 2000. Quarterly Wheat Prices: For the Kansas grain elevators included in this study, cash wheat prices averaged $10.09, $8.26, $7.47, and $5.13 per bushel during the 1st through 4th quarters of 2008, respectively (Table 4). During January through March (i.e., the “winter” quarter of the year), the focus of the Kansas wheat market tends to be on either continuing to store the previous year’s crop or on selling it to either grain elevators or wheat millers, with lesser attention given to physical condition of wheat acreage and future production prospects for the upcoming Kansas and U.S. wheat crop. Weather and associated U.S. wheat crop development prospects usually become the central focus of the Kansas wheat market during April through June (i.e., the period of “crop development”). Prospects for the final size of the Kansas and U.S. wheat crop becomes the focus of attention for the wheat market during July through September (i.e., “Summer harvest”). During October through December, storage and sales of the year’s wheat crop as well as seeding conditions, acreage and wheat supply-demand projections for the wheat marketing year have the attention of the Kansas and U.S. wheat market. Wheat market supply – demand and structural characteristics for the most recently harvested crop are most likely to be represented in wheat prices during the July – September and October – December quarters of the year, with new crop prospects for U.S. wheat receiving increasingly strong consideration during the January – March and April – June periods. Crop Reporting Districts: In this study corn and wheat price models are estimated both with (Tables 2 and 5) and without (Tables 3 and 6) crop reporting district (CRD) dummy variables. Crop reporting district variables capture regional grain price affects that may occur apart from other independent explanatory variables that are included in these grain price models. For the corn price models, the southwest CRD (i.e., CRD #30) was used at the base region to which other CRD corn price effects are compared. The southwest CRD of Kansas tends to be the region of price leadership for corn in the state due to the concentrated presence of the cattle feeding industry – making it an in-state and intra-state regional demand center for feedgrains. For the wheat price models, the south central CRD (i.e., CRD #60) was used as the base region to which other CRD wheat price effects were compared. The concentrated presence of the wheat
5
milling industry in that region and to a lesser degree in central and east central Kansas make these regions defacto price leaders for wheat markets in the state. Business Organization Type: Statewide, there are an estimated 486 cooperative grain elevators in Kansas, 204 independently owned grain elevators, and 6 joint ventures (jointly owned by a combination of cooperatives, independents or some combination of the two). The offering of patronage dividends by cooperative grain elevators may cause their grain price bids to be lower than those offered by non-patronage paying independents. Such a price difference would reflect the extra cost to the cooperative of building equity reserves over time in anticipation of eventually repaying cooperative members with patronage dividends. In this study, of the 285 grain elevators considered in the corn price models, there were 247 cooperatives, 36 independents, and 2 joint ventures. Of the 360 grain elevators considered in the wheat price models, there were 269 cooperatives, 89 independents, and 1 joint venture. The data indicate that cooperatives are generally better represented in this study than either independent or joint venture grain elevators. County Feedgrain and Wheat Production: County corn and wheat production are included in this study to determine the affect of differing levels of county level grain supplies on cash prices. Average county feedgrain production for the counties with elevators included in this study was 8,420,000 bushels in 2007 and 8,320,000 bushels in 2008 (Table 1). Average county wheat production for the counties with elevators included in this study was 34,04,000 in 2007 and 57,040,000 bushels in 2008 (Table 4). The county feedgrain and wheat production data used in these quarterly models represents the most recently harvested crop that is physically available and positioned to influence cash grain market prices. For 2008 corn price models, 2007 county level feedgrain (corn plus grain sorghum) production levels are used for the 1st, 2nd and 3rd Quarter models, while 2008 county level feedgrain production is used for the 4th Quarter models. For 2008 wheat price models, 2007 county level wheat production levels are used for the 1st, and 2nd Quarter models, while 2008 county level wheat production is used for the 3rd and 4th Quarter models. Grain sorghum is a direct substitute for corn in most livestock feeding rations and grain ethanol production processes, and since local cash corn prices expected to be affected by the supply of grain sorghum and vice verse. Therefore, total county feedgrain production is used as an explanatory variable in corn price models rather than county corn production alone. The effect of county level grain production would likely represent the impact of differing local grain supply levels upon cash corn or wheat prices. Although not formally presented in this paper, alternative variables have been developed to represent the quantity of county feedgrain or wheat supplies in comparison to the range of county production levels for the same grain enterprises during the 2005-2008 period. The model results for these alternative representations of county corn and wheat production will be discussed in the results section below. Livestock Feedgrain Use by CRD: The use of feedgrains for livestock feeding can be estimated through the use of USDA annual fed cattle and swine marketing estimates in combination with corn and grain sorghum ration recommendations in K-State Research and Extension livestock
6
budgets. The USDA provides crop reporting district-level fed cattle and swine marketing information rather than the county level data. Average CRD feedgrain use in livestock feeding for the counties with elevators included in this study was 35,180,000 bushels in 2007 and 34,270,000 bushels in 2008 (Table 1). To avoid multi-colliniarity problems in model estimation, CRD-level livestock feedgrain use information is represented as an explanatory variable in models that do not use CRD-level dummy variables (Table 3 for corn, and Table 6 for wheat). Elevator Grain Storage Capacity: The total storage capacity of individual grain elevators may be positively correlated with the strength of their competitive positions in local grain markets. Statewide, the average total grain storage capacity for Kansas grain elevators is 1,304,000 bushels, with a median total capacity of 721,000 bushels, and a maximum of 47,000,000 bushels. The average capacity of the 285 grain elevators included in the corn price study is 1,626,300 bushels, with a median capacity of 940,000 bushels and a maximum of 47,000,000 bushels (Table 1). The average total storage capacity of the 360 grain elevators included in the wheat price study is 1,250,130 bushels, with a median capacity of 737,000 bushels and a maximum of 32,000,000 bushels (Table 4). An independent variable that may be used to further delineate the relative competitive position of grain elevators in local grain markets may be the percentage of total county grain storage capacity possessed by an individual grain elevator. The average percent of total county storage capacity of the 285 grain elevators included in the corn price study is 20%, with a median of 13% and a maximum of 153% (Table 1). The average percent of total county storage capacity of the 360 grain elevators included in the wheat price study is 14%, with a median of 10% and a maximum of 100% (Table 4). Percentages of near 100% or more are indicative of grain elevators that are regional grain terminals, which in most cases handle and/or store at least some appreciable amount of grain that has originated from outside of the county they are located in. Railroad Car Handling Capacity: Direct access to unit or shuttle train railcar handling facilities is likely to provide grain elevators with lower cost, more competitive grain transportation opportunities than elevators without such access. Unit or shuttle train access may make these elevators into “demand centers” in a de-facto manner in their local regions due to their ability to transport grain more directly and efficiently to export markets via their lower cost rail shipment facilities. Typically, “unit trains” are defined as containing approximately 50 railcars, while “shuttle trains” handle 100+ railcars. Statewide, 288 (41%) of 698 grain elevators in Kansas have no effective rail car service. All incoming and outgoing grain from this elevators is transported by truck. Of the grain elevators that do have rail service, 276 (39% of the total number of grain elevators in Kansas) have capacity to handle 1 to 15 railcars, 100 (14% of the Kansas total) can handle 16 to 45 railcars, 15 (2%) can handle 46 to 90 railcars, and 25 (4% of Kansas grain elevators) can handle 91 to 150 railcars. In this study, grain elevators are categorized more broadly, including those that can handle 1 to 45 and 46 to 150 railcars. In the corn price study, there are 163 grain elevators with 1-45 railcar handling capacity, and 19 elevators with 46-150 railcar handling capacity (leaving 104 with no railcar capacity) (Table 1). In the wheat price study, there are 195 grain elevators with 1-45 railcar handling capacity, and 17 elevators with 46-150 railcar handling capacity (leaving 151 with no railcar capacity) (Table 4).
7
Concentration of Local Grain Elevators: The number of competitive grain elevators within close distance to one another may be an indicator of the competitiveness of local grain markets. Grain elevators that are affiliated with one another in terms of business organization (i.e., co-affiliates in a multi-site cooperative, multi-site independent or co-owned joint venture) are less likely to engage in price competition against one another that those that are not formally affiliated.. Economic theory supports the idea that the larger the number of firms in a market, the more competitive that market will be in terms of prices and/or services provided. In the Kansas grain market, the larger the number of nonaffiliated competitive grain elevators in a local market the more likely it is that to competitive forces will cause prices to be higher in comparison to grain markets that have fewer competitors and less price competition. For the elevators included in the corn price study, there are an average of 2.33 other grain elevators located within 10 miles distance. However, when accounting for firm affiliations, there are an average of 1.10 nonaffiliated elevators within a 10 mile radius of these same Kansas elevators (Table 1). For the elevators included in the wheat price study, there are an average of 2.48 grain elevators located within 10 miles distance. The number of local competitors in these wheat markets declined to 1.27 elevators located within 10 miles when only nonaffiliated elevators were considered (Table 4). Proximity to Grain Ethanol Plants: McNew and Griffith (2005) indicated that the presence of grain ethanol plants tended to cause higher cash grain prices at grain elevators located within the geographic vicinity of the ethanol plants. In this study, the impact on Kansas cash corn prices of grain elevator proximity to grain ethanol plants will be analyzed. The average distance of Kansas grain elevators in the corn price study to grain ethanol plants is 66.7 miles, with a median distance of 60.5 miles, and a maximum distance of 170 miles. Of the 285 elevators in the corn price study, 143 (50%) were located within 60 miles of an ethanol plant. Proximity to Wheat Millers: In an effort to apply the findings of McNew and Griffith (2005) to the Kansas wheat market, the impact on cash wheat prices of proximity of a grain elevator to a wheat mill will be analyzed. The average distance of Kansas grain elevators in the wheat price study to wheat mills is 72.0 miles, with a median distance of 63.7 miles, and a maximum distance of 220 miles. Of the 360 elevators in the wheat price study, 164 (46%) were located within 60 miles of a wheat processing mill. Corn and Wheat Price Models In this analysis two groups of quarterly corn price models and two groups of quarterly wheat price models are estimated. One group of corn price models include crop reporting districts among their explanatory variables (Table 2) and the other does not (Table 3). Similarly, one group of wheat price models include crop reporting districts among their explanatory variables (Table 5) and the other does not (Table 6). Corn Price Models:
8
The first set of four quarterly corn price models for 2008 include the following explanatory variables (Table 2). a) Intercept representing southwest Kansas and other unidentified explanatory factors. b) Eight (8) of 9 state crop reporting districts with southwest Kansas as the basis for comparison,
i.e., NW-CRD, WC-CRD, NC-CRD, C-CRD, SC-CRD, NE-CRD, EC-CRD and SE-CRD. c) DV-INDEP – Dummy variable indicating whether the elevator is organized as an independent
agribusiness firm as opposed to a cooperative or joint venture. d) CYFGPRDN – County level feedgrain production for 2007 (for 1st, 2nd and 3rd Quarters) and
2008 (for 4th Quarter) e) %CYSTRCP – Grain elevator total grain storage capacity as a percentage of total county grain
storage capacity. f) RRCR1-45 – Dummy variable indicating whether an elevator has railcar grain handling
capacity of from 1 to 45 railcars. g) RRCR46-150 – Dummy variable indicating whether an elevator has railcar grain handling
capacity of from 46 to 150 railcars. h) ELV10MNA – Number of nonaffiliated grain elevators located within 10 miles distance. i) DV-EPLNT60 – Dummy variable indicating whether an elevator is located within 60 miles of
a grain ethanol plant.
The second set of four quarterly corn price models for 2008 include estimated CRD-level livestock feedgrain use (LVKFGUSE) as a substitute for crop reporting district variables (Table 3). All other model variables are the same in the two models. Wheat Price Models: The first set of four quarterly wheat price models for 2008 include the following explanatory variables (Table 5). a) Intercept representing south central Kansas and other unidentified explanatory factors. b) Eight (8) of 9 state crop reporting districts with south central Kansas as the basis of
comparison within the model intercept, i.e., NW-CRD, WC-CRD, SW-CRD, NC-CRD, C-CRD, NE-CRD, EC-CRD and SE-CRD.
c) DV-INDEP – Dummy variable indicating whether the elevator is organized as an independent agribusiness firm as opposed to a cooperative or joint venture.
d) CYFGPRDN – County level wheat production for 2007 (for 1st and 2nd Quarters) and 2008 (for 3rd and 4th Quarters)
e) %CYSTRCP – Grain elevator total grain storage capacity as a percentage of total county grain storage capacity.
f) RRCR1-45 – Dummy variable indicating whether an elevator has railcar grain handling capacity of from 1 to 45 railcars.
g) RRCR46-150 – Dummy variable indicating whether an elevator has railcar grain handling capacity of from 46 to 150 railcars.
h) ELV10MNA – Number of nonaffiliated grain elevators located within 10 miles distance. i) DV-MILL60 – Dummy variable indicating whether an elevator is located within 60 miles of a
wheat mill.
9
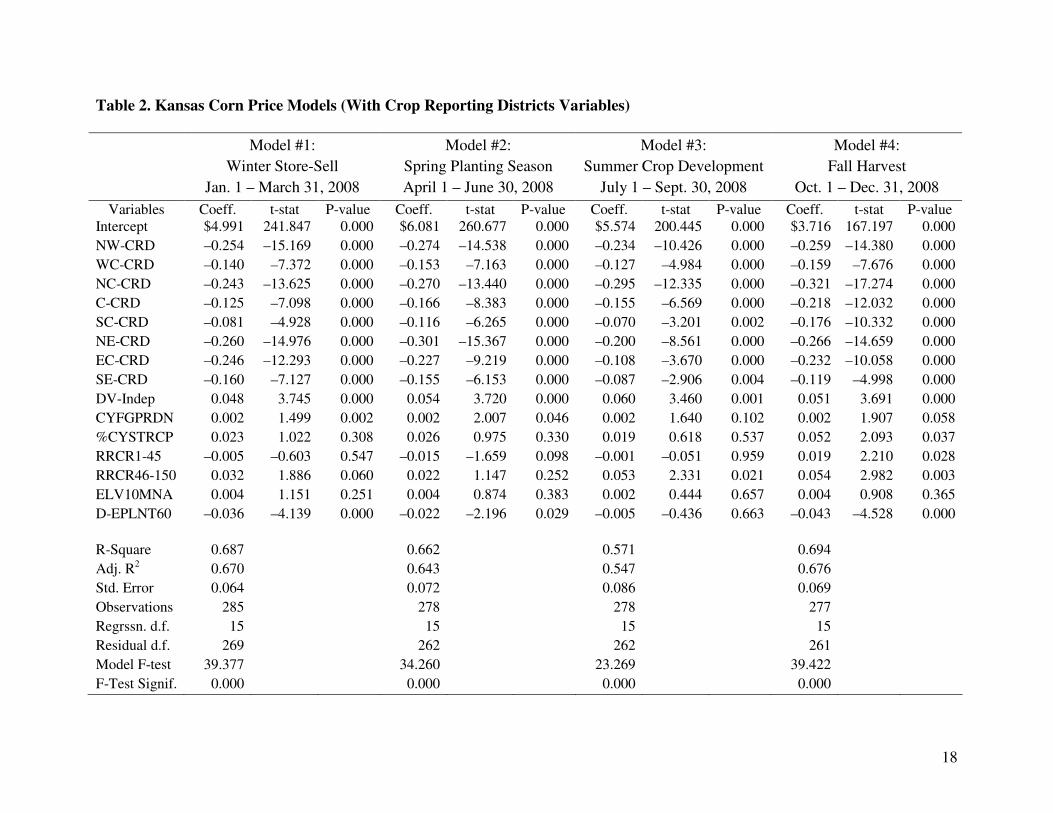
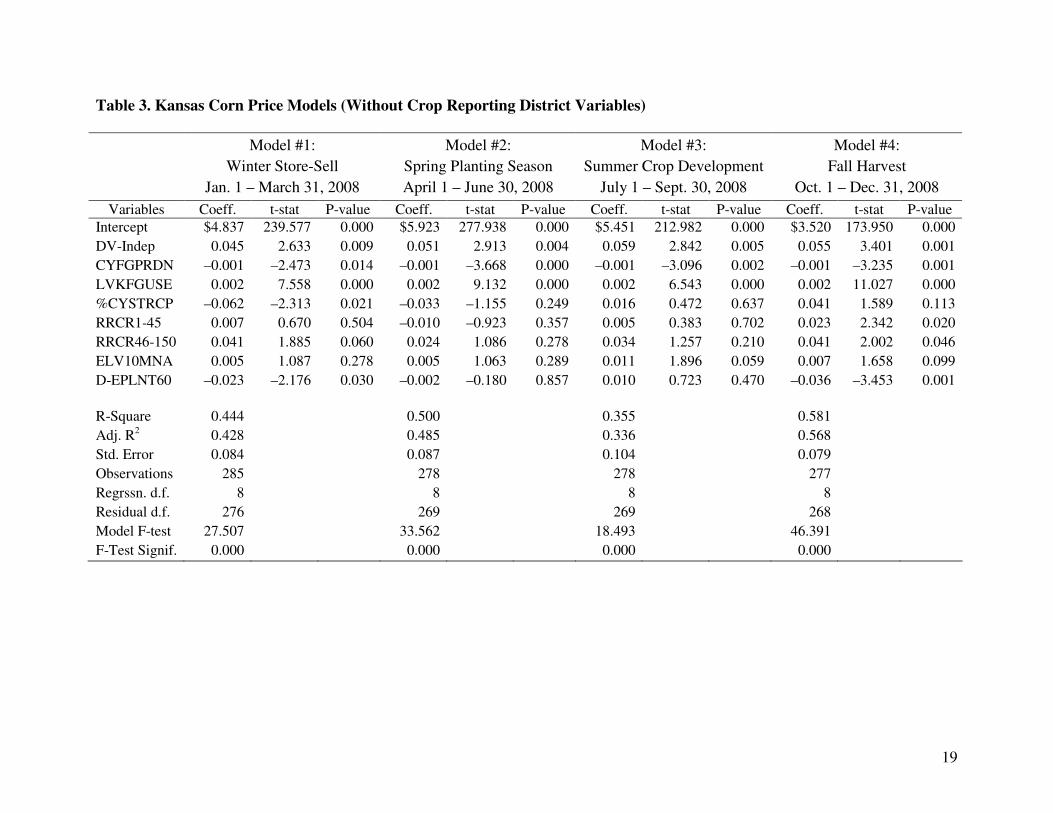
The second set of four quarterly wheat price models for 2008 does not use crop reporting districts as an explanatory variable (Table 6). All other explanatory variables are identical between the two sets of wheat models. Model Estimation Results Results for the quarterly Kansas corn price models are presented in Tables 2 and 3. Discussion of results will focus on the models for the 1st Quarter (January – March) and 4th Quarter (October – December) of calendar year 2008. As discussed above, during these two time periods corn prices are most likely to represent feedgrain market supply-demand and industry structural factors for the feedgrain crops that have most recently been harvested. Uncertainty about new crop prospects will have an increasing influence upon feedgrain prices beginning in the second (April – June) and third (July – September) quarters, causing the focus of the corn market to shift away from existing old crop supply-demand conditions and structural factors. Corn 1st Quarter Model (with CRDs): The 2008 1st Quarter model (January – March) with CRD explanatory variables included has 285 observations, 269 residual degrees of freedom, an R-square value of 0.687, an adjusted R-square of 0.670, and a model F-Test value of 39.377 (significant at the 0.000 level) (Table 2). During the 1st Quarter, each of the Kansas crop reporting districts represented had significantly lower regional corn prices than the southwest CRD, ranging from a minimum price differential of –$0.08 per bushel in south central Kansas (SC-CRD) to –$0.26 per bushel in the northeast region (NE-CRD) of the state. Independent grain elevators (DV-INDEP) had significantly higher prices (+$0.048 per bushel) than cooperatives and/or joint ventures. County feedgrain production in 2007 (CYFGPRDN) had a significant positive effect (+$0.002 per million bushels) on local cash corn prices. The presence of unit and shuttle train grain handling capabilities (RRCR46-150) had a significant positive impact ($0.032 per bushel) upon cash corn prices. Location within 60 miles of a grain ethanol plant (D-EPLNT60) had a significant negative affect (–$0.036 per bushel) upon local cash corn prices. Other factors such as percent of county grain storage capacity (%CYSTRCP), railcar capacity of from 1 to 45 railcars (RRCR1-45), and the number of nonaffiliated grain elevator / potential competitors (ELV10MNA) did not significantly impact 1st Quarter cash corn prices. Corn 1st Quarter Model (Without CRDs): The 2008 1st Quarter model (January – March) without CRD explanatory variables had 285 observations, 276 residual degrees of freedom, an R-square value of 0.444, an adjusted R-square of 0.428, and a model F-Test value of 27.507 (significant at the 0.000 level) (Table 3). During the 1st Quarter, independent grain elevators (DV-INDEP) had significantly higher prices (+$0.045 per bushel) than cooperatives and/or joint ventures (Table 3). County feedgrain production in 2008 (CYFGPRDN) had a significant negative effect (–$0.001 per million bushels) on local cash corn prices. Livestock use of feedgrains by CRD (LVKFGUSE) had a significant positive impact on corn prices (+$0.002 per million bushels). The relative size of grain storage facilities compared to the sum total of county-wide grain storage capacity (%CYSTRCP) had a significant negative impact (–$0.062 or –$0.0062 per bushel per 10% increase in elevator percentage of total county grain storage capacity). The presence of unit and shuttle train grain handling capabilities had a significant positive impact ($0.041 per bushel) upon cash corn prices (RRCR46-150). Location within 60 miles of a grain
10
ethanol plant (D-EPLNT60) had a significant negative affect (–$0.023 per bushel) upon local cash grain prices. Other factors such as railcar capacity of from 1 to 45 railcars (RRCR1-45), and the number of nonaffiliated grain elevators / potential competitors (ELV10MNA) did not significantly impact 1st Quarter cash corn prices in Kansas. Corn 4th Quarter Model (with CRDs): The 2008 4th Quarter model (October - December) had 277 observations, 261 residual degrees of freedom, an R-square value of 0.694, an adjusted R-square of 0.676, and a model F-Test value of 39.422 (significant at the 0.000 level) (Table 2). During the 4th Quarter each of the Kansas crop reporting districts represented had significantly lower regional prices than the southwest CRD, ranging from a minimum price differential of –$0.119 per bushel in southeast (SE-CRD) Kansas to –$0.321 per bushel in the north central (NC-CRD) region of the state. Independent grain elevators (DV-INDEP) had significantly higher prices (+$0.051 per bushel) than cooperatives and/or joint ventures. County feedgrain production in 2008 (CYFGPRDN) had a significant positive effect (+$0.002 per million bushels) on local cash corn prices. The relative size of grain storage facilities compared to the sum total of county-wide grain storage capacity (%CYSTRCP) had a significant positive impact (+$0.052 or +$0.0052 per bushel per 10% increase in elevator percentage of total county grain storage capacity. The presence of both grain railcar handling capacity capabilities of 1 to 45 cars (RRCR1-45), and of the capability of handle unit and/or shuttle train (RRCR46-150) had significant positive impacts on corn prices ($0.019 and $0.054 per bushel, respectively). Location within 60 miles of a grain ethanol plant (D-EPLNT60) had a significant negative affect (–$0.036 per bushel) upon local cash corn prices. The only explanatory variable that had no significant effect upon 4th Quarter cash corn prices was the number of nonaffiliated grain elevator / potential competitors within 10 miles (ELV10MNA). Corn 4th Quarter Model (Without CRDs): The 2008 4th Quarter #4 (October-December) without CRD explanatory variables had 277 observations, 268 residual degrees of freedom, an R-square value of 0.581, an adjusted R-square of 0.568, and a model F-Test value of 46.391 (significant at the 0.000 level) (Table 3). During the 4th Quarter independent grain elevators (DV-INDEP) had significantly higher prices (+$0.055 per bushel) than cooperatives and/or joint ventures. County feedgrain production in 2008 (CYFGPRDN) had a significant negative effect (–$0.001 per million bushels) on local cash corn prices. Livestock use of feedgrains by CRD (LVKFGUSE) had a significant positive impact on cash corn prices (+$0.002 per million bushels). The presence of railcar grain handling capacity capabilities of 1 to 45 cars (RRCR1-45), and of the capability of handle unit and/or shuttle trains (RRCR46-150) had significant positive impacts on corn prices ($0.023 and $0.041 per bushel, respectively). The number of nonaffiliated grain elevator / potential competitors (ELV10MNA) did have significant positive cash corn price impacts (+$0.007 per nonaffiliated grain elevator within 10 miles). Location within 60 miles of a grain ethanol plant (D-EPLNT60) had a significant negative affect (–$0.036 per bushel) upon local cash grain prices. The impact of the relative size of grain storage facilities compared to the sum total of county-wide grain storage capacity (%CYSTRCP) was positive but not quite statistically significant at the 10% confidence level. Results for the quarterly Kansas wheat cash price models are presented in Tables 5 and 6. Discussion of results will focus on the models for the 3rd Quarter (July - September) and 4th Quarter (October – December) of calendar year 2008. As discussed above, during these two
11
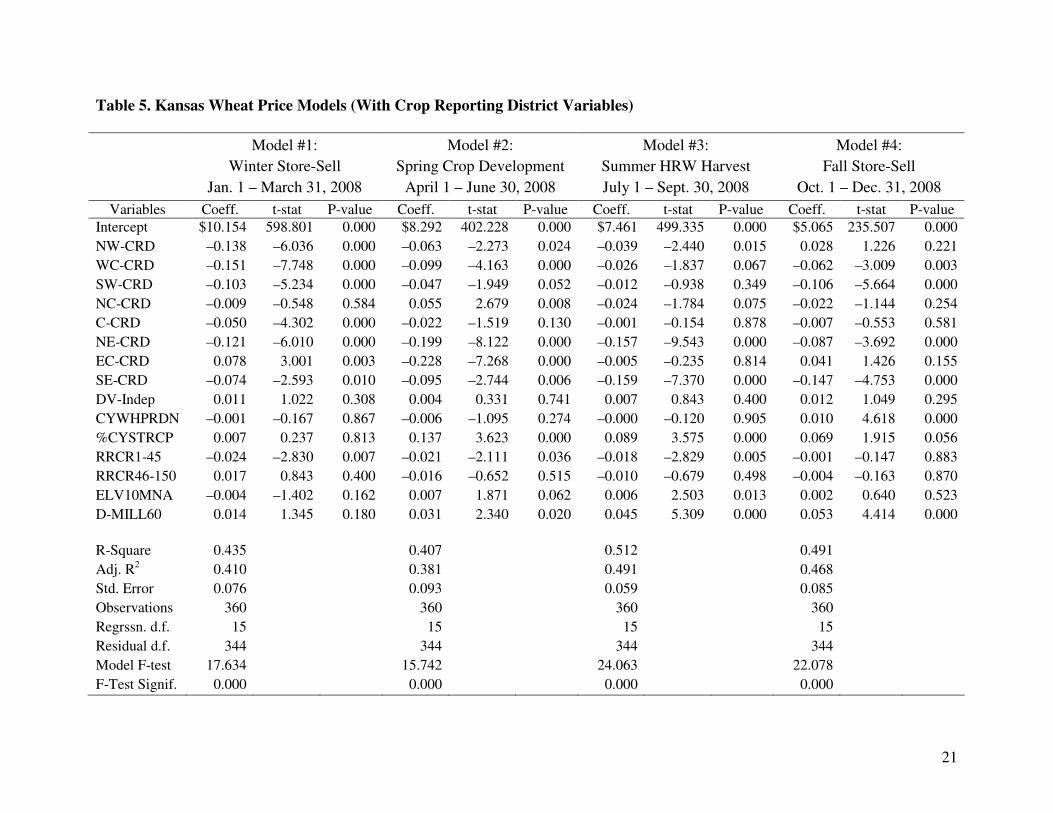
time periods Kansas wheat cash prices are most likely to represent wheat market supply-demand and industry structural factors for the wheat crops that have most recently been harvested. Uncertainty about new crop prospects will have an increasing influence upon wheat prices beginning in the 1st (January - March) and 2nd (April - June) quarters, causing the focus of the Kansas wheat market to shift away from existing old crop supply-demand conditions and structural factors. Wheat 3rd Quarter Model (with CRDs): The 2008 Quarter #3 model (July-September) with CRD explanatory variables had 360 observations, 344 residual degrees of freedom, an R-square value of 0.512, an adjusted R-square of 0.491, and a model F-Test value of 24.063 (significant at the 0.000 level) (Table 5). During the 3rd Quarter, the northwest, west central, north central, northeast and southeast crop reporting districts each had significantly lower prices than south central Kansas, ranging from a minimum price differential of –$0.02 per bushel in north central Kansas (NC-CRD) to –$0.16 per bushel in the southeast region (SE-CRD) of the state. Wheat prices in southwest, central, and east central Kansas CRDs were not significantly different from those in the south central region. The relative size of grain storage facilities compared to the sum total of county-wide grain storage capacity (%CYSTRCP) had a significant positive impact (+$0.089 or +$0.0089 per bushel per 10% increase in elevator percentage of total county grain storage capacity). The presence of railcar grain handling capacity capabilities of 1 to 45 cars (RRCR1-45) had significant negative impacts on wheat prices (–$0.018 per bushel). The number of nonaffiliated grain elevator / potential competitors (ELV10MNA) had significant positive impacts (+$0.006 per nonaffiliated grain elevator within 10 miles) upon 3rd Quarter grain prices. Location within 60 miles of a wheat mill (D-MILL60) had a significant positive
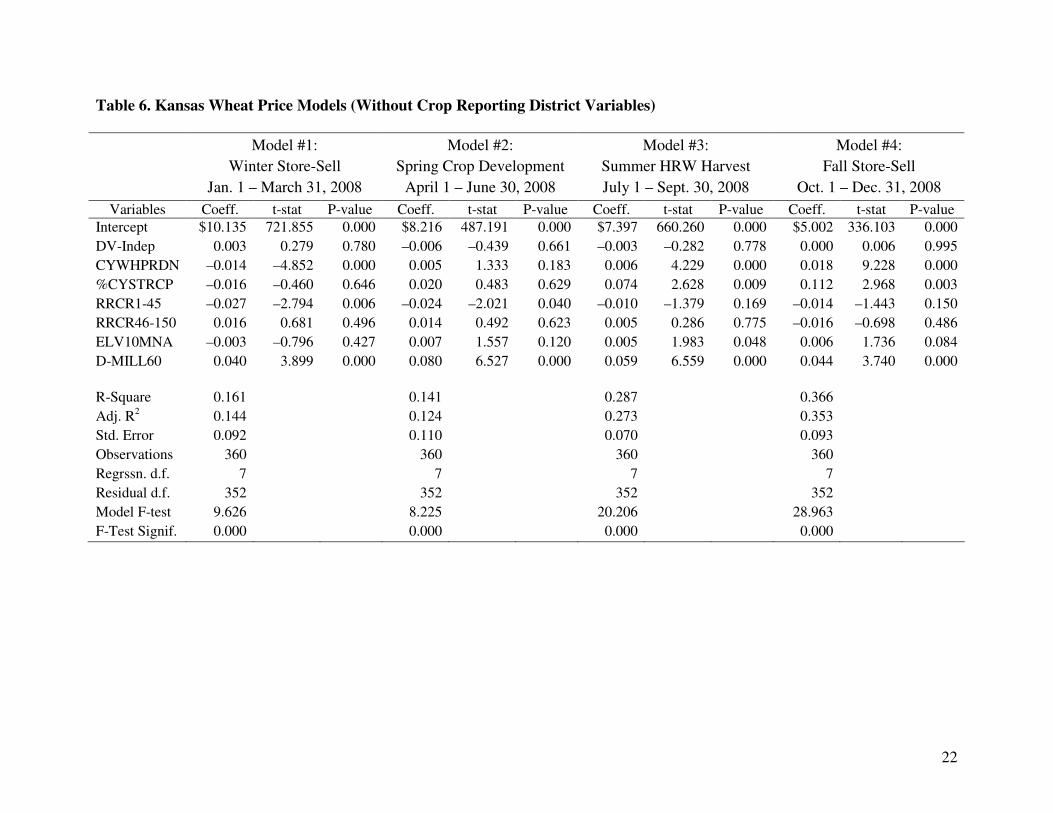
affect (+$0.045 per bushel) upon local wheat prices. Other factors such as the presence of independent grain elevators (DV-INDEP), 2008 county wheat production (CYWHPRDN), and railcar capacity of 46 to 150 railcars (RRCR46-150) to handle unit and shuttle trains did not have a significant impact on Kansas wheat prices in the 3rd Quarter of 2008. Wheat 3rd Quarter Model (Without CRDs): The 2008 3rd Quarter #3 model (July-September) without CRD explanatory variables had 360 observations, 352 residual degrees of freedom, an R-square value of 0.287, an adjusted R-square of 0.273, and a model F-Test value of 20.206 (significant at the 0.000 level) (Table 6). During the 3rd Quarter county crop production in 2008
(CYWHPRDN) had a significant positive effect (+$0.006 per million bushels) on cash wheat prices. The relative size of grain storage facilities compared to the sum total of county-wide
grain storage capacity (%CYSTRCP) had a significant positive impact (+$0.074 or +$0.0074 per bushel per 10% increase in elevator percentage of total grain storage capacity). The number of nonaffiliated grain elevator / potential competitors (ELV10MNA) had a significant positive impact (+$0.005 per nonaffiliated grain elevator within 10 miles) upon 3rd Quarter cash wheat prices. Location within 60 miles of a wheat mill (D-MILL60) had a significant positive affect
(+$0.059 per bushel) upon local wheat prices. Other factors such as the presence of independent grain elevators (DV-INDEP) and railcar capacity of from 1 to 45 railcars (RRCR1-45) and from 46-90 railcars (RRCR46-150) did not have significant impacts upon 3rd Quarter cash wheat prices in Kansas. Wheat 4th Quarter Model (with CRDs): The 2008 4th Quarter model (October - December) with CRD explanatory variables had 360 observations, 344 residual degrees of freedom, an R-square
12
value of 0.491, an adjusted R-square of 0.468, and a model F-Test value of 22.078 (significant at the 0.000 level) (Table 6). During the 4th Quarter, wheat prices in the west central, southwest, northeast, and southeast regions were significantly less than wheat prices in south central Kansas, ranging from a minimum price differential of –$0.06 per bushel in west central Kansas (WC-CRD) to –$0.15 per bushel in the southeast region (SE-CRD) of the state. Wheat prices in the northwest, north central, central, and east central CRDs were not significantly different from those in south central Kansas. County wheat production in 2008 (CYWHPRDN) had a significant positive effect (+$0.001 per million bushels) on local cash corn prices. The relative size of grain storage facilities compared to the sum total of county-wide grain storage capacity
(%CYSTRCP) had a significant positive impact (+$0.069 or +$0.0069 per bushel per 10% increase in elevator percentage of total county grain storage capacity). Location within 60 miles
of a wheat mill (D-MILL60) had a significant positive affect (+$0.053 per bushel) upon local wheat prices. Other factors such as the presence of independent grain elevators (DV-INDEP), 2008 county wheat production (CYWHPRDN), railcar capacity of 1 to 45 and 46 to 150 railcars (RRCR1-46 and RRCR46-150, respectively) and the number of nonaffiliated nonaffiliated grain elevator / potential competitors (ELV10MNA) did not have significant impacts on 4th Quarter cash wheat prices in Kansas. Wheat 4th Quarter Model (Without CRDs): The 2008 4th Quarter #4 model (October-December) without CRD explanatory variables had 360 observations, 352 residual degrees of freedom, an R-square value of 0.366, an adjusted R-square of 0.353, and a model F-Test value of 28.963 (significant at the 0.000 level) (Table 6). During the 4th Quarter, county crop production in 2008
(CYWHPRDN) had a significant positive effect (+$0.018 per million bushels) on cash wheat prices. The relative size of grain storage facilities compared to the sum total of county-wide
grain storage capacity (%CYSTRCP) had a significant positive impact (+$0.112 or +$0.0112 per bushel per 10% increase in elevator percentage of total grain storage capacity). The number of nonaffiliated grain elevator / potential competitors (ELV10MNA) had a significant positive impact (+$0.006 per nonaffiliated grain elevator within 10 miles) upon 3rd Quarter wheat cash prices. Location within 60 miles of a wheat mill (D-MILL60) had a significant positive affect
(+$0.044 per bushel) upon local wheat prices. Other factors such as the presence of independent grain elevators (DV-INDEP) and railcar capacity of from 1 to 45 railcars (RRCR1-45) and from 46-90 railcars (RRCR46-150) did not significantly impact 4th Quarter wheat cash prices in Kansas. Discussion of Corn and Wheat Model Results
Corn cash price models for the 1st and 4th Quarters of 2008 had the greatest explanatory ability of those models including CRDs as explanatory variables, followed closely by the 2nd Quarter and further behind by the 3rd Quarter models (Table 2). Removal of the CRDs and substituting CRD-level feedgrain use by livestock into the models resulted in a net reduction in explanatory capability of all the quarterly corn models (Table 3). Among the non-CRD corn price models, the 4th Quarter corn price model had the most explanatory ability. Wheat cash price models for the 3rd and 4th Quarters of 2008 had the greatest explanatory power both with and without CRD variables included. The inclusion of CRD variables markedly improved the explanatory power of the wheat models, although the wheat models overall explained less of the variation in wheat cash prices than did the corn models for corn cash prices.
13
The finding that proximity to an ethanol plant did not tend to increase but rather decrease cash corn prices in a number of Quarterly corn models models is counter intuitive and is inconsistent with some previous studies. There are a number of possible explanations for this outcome. It is possible that Kansas feedgrain producers over responded to supportive corn and grain sorghum prices in regions near ethanol plants during the 2005-2008 period. This combined with falling ethanol plant profitability and the resulting declining demand from ethanol plants for feedgrains may have lead to lower prices in 2008. Other potential explanations also exist. Future work in this area will attempt to focus upon a priori (before) and ex post (after) effects of ethanol plant establishment on local feedgrain prices. Conversely, in 7 of 8 wheat price models estimated proximity to wheat mills had a positive impact on wheat prices. That independent grain elevators paid higher prices for corn than cooperatives was consistent with expected given the patronage repayment mechanisms employed by cooperatives. However, there was no indication in wheat price models that independent or cooperatively owned grain elevators bid more or less for wheat than the other. This counter intuitive finding for wheat bids and the inconsistency between the findings for corn and wheat markets is a topic for further study. In the corn models where crop reporting districts were included as explanatory variables, there tended to be a positive effect on corn prices from increasing amounts of county feedgrain production. Conversely, in corn models without crop reporting district designations, the price impact of higher levels of county feedgrain production was negative. For wheat, the 4th Quarter Wheat model with CRDs and the 3rd and 4th Quarter Wheat models without CRDs all indicated a positive impact on wheat prices from larger amounts of county wheat production. One wheat model (1st Quarter Wheat, no CRD variables) indicated a negative impact from greater wheat production. The predominant positive price impact on corn and wheat prices from the CRD-based models is counter intuitive, but consistent with findings of earlier studies (Davis and Hill, 1974; Wenzel, Hill and Garcia, 2000). It may be that there is a form of simultaneity that has occurred in the development of feedgrain demand centers (livestock feeding, grain ethanol plants, etc.) and wheat demand centers (wheat mills, export wheat terminals, etc.) at or near the areas of greater corn and wheat production in Kansas. That an expected negative effect on price from increasing local county feedgrain and/or wheat production occurs in models without crop reporting district variables identifies the need to more carefully examine the consequences of using crop reporting district variables in these models. Livestock use of feedgrains by CRD had a positive affect on corn prices in all four 2008 quarterly corn price models, a result consistent with a priori expectations of feedgrain supply – demand impacts. In these corn models there was on instance where an increasing proportion of total grain storage capacity being controlled by a particular elevator resulted in a higher cash corn price (4th Quarter, Model with CRDs), and another instance where it had a negative effect on corn prices (1st Quarter with No CRD). In the wheat models, the positive impact on wheat prices from grain elevators having greater proportions a counties total grain storage capacity was more pronounced, occurring in the 2nd, 3rd and 4th Quarter Wheat Models with CRD variables and the 3rd and 4th
14
Quarter Wheat models without CRD variables. Results for corn are inconsistent, but are very consistent for wheat. To the degree that larger grain elevators can move grain more efficiently and attain economies of size and scale, and as a result bid more aggressively for grain, then these findings would be indicative of some degree of market power in local grain markets. Grain elevator access to railcar grain handling services at the 1 to 45 railcar category and at the larger 46 to 150 railcar category had varying effects on corn and wheat market prices. There is supportive evidence among a number of models that corn prices are positively affected by the ability of grain elevators to handle 46 to 150 railcars (i.e., to handle unit and shuttle train grain handling facilities). Results for 2008 corn price models in the 1st, 3rd and 4th Quarters with CRD variables and for the 1st and 4th Quarters without CRD variables all showed positive price effects from unit and shuttle train grain handling capabilities. Corn prices were also positively affected by the ability of grain elevators to handle 1 to 45 railcars to ship grain for 4th Quarter models both with and without CRD variables, but were negatively affected in the 2nd Quarter corn model with CRD variables. These results for corn price models generally support the idea that grain elevators with access to railcar transportation have competitive cost advantages over grain elevators with no railcar access, and can therefore offer higher corn price bids. Results differed markedly for the impact of railcar handling on wheat prices, as there were no wheat cash price models in which access to railcar services from 45 to 150 railcar unit and/or shuttle trains had a positive impact on wheat prices. In fact, for five wheat models (1st, 2nd and 3rd Quarter models with CRD variable, and 1st and 2nd Quarter models without CRD variables) the railcar grain handling capacity of 1 to 45 railcars had a significant negative impact on wheat prices. The results of these wheat models appear to indicate that in 2008 instate processing of wheat at Kansas mills positively affected wheat prices while export markets which are typically accessed through railcar shipments via unit and shuttle trains. The intensity of local competition faced by grain elevators is represented by the number of nonaffiliated grain elevators located within 10 miles in these models. Increased numbers of local competitors had a positive impact on corn prices only in the 4th Quarter model with no CRD variables. However, for wheat prices there were a number of time periods and models in which increased numbers of local grain elevator competitors had a positive impact on wheat prices, i.e., 2nd and 3rd Quarter models with CRD variables, and 3rd and 4th Quarter models without CRD variables. The wheat market analysis provides more evidence of the positive impact of local grain elevator competition than the corn market analysis in this study for 2008. Summary and Conclusions
Earlier studies (Davis and Hill, 1974; Wenzel, Hill and Garcia, 2000) identified the competitive structure of Illinois grain markets as that of “monopsonistic competition with seasonally induced market power”. Do these results for Kansas corn and wheat markets support the same finding? Model explanatory variables which reflect scale and type of firm may signal differences in operating costs and efficiency among grain elevators. To the degree that these are important in determination of corn and wheat prices, they may reflect the presence of market power in these local grain markets. Positive price effects in wheat markets from increasing numbers of competitors provide support for the idea that varying degrees of competition exist in grain
15
markets. More analysis is needed to determine with confidence whether monopsonistic competition characterizes Kansas corn and wheat markets. If grain markets operate efficiently, then prices should differ between locations by no more than cost of transportation, among time periods by no more than the cost of storage, and among product forms by only as much as the cost of product transformation (Davis and Hill, 1974). This study explores grain market factors affecting grain price differences across all three of these areas (location, time and form). For corn markets these findings support the idea that transportation forms (i.e., railroad service) impact locational price differences, but not for wheat markets. And to the degree that differences in price determination factors vary by time period for corn and wheat in Kansas, this study also supports the idea that prices and the process that determine them may vary across time periods, although grain storage costs are not explicitly accounted for tin this analysis. Product transformation issues are also addressed in this analysis. That local wheat market prices are strongly affected by wheat mill location and that corn market prices are strongly affected by the location of intensive livestock feeding enterprises supports the importance of product transformation issues in these markets. However, the negative impact of ethanol plant proximity on corn prices runs counter to expectations of positive product transformation impacts. Future work in this area will involve broadening the time horizon over which this analysis is conducted and a reexamination of the explanatory variables used in the corn and wheat price models. Current plans are to perform this analysis for the 2006 through 2009 period, allowing for a type of cross section time series approach to determining the impact of particular explanatory factors on Kansas corn and wheat prices. This will also allow for analysis of the effect of grain ethanol plants on local grain market prices on a before and after basis, due to the establishment of a number of these plants in Kansas during the 2007-2008 period. Because ethanol plants were generally more profitable during the 2006-2007 period than during 2008 and 2009 (to date), including both profitable and unprofitable periods for ethanol in the analysis may give a more accurate picture of the impact of ethanol plants upon local corn prices. This can also be said for the price impact other hypothesized explanatory factors in the study, including railcar grain handling capacity, location of wheat mills, and local feedgrain and wheat supply-demand conditions.
16
References
Brorsen, B.W., J.P. Chavas, W.R. Grant, and A.W. Ngenge. “Spatial and Temporal Relationships among Selected U.S. Grain Markets.” North Central Journal of Agricultural
Economics 7(1)(1985):1-10. Davis, L. and L.D. Hill. “Spatial Price Differentials for Corn and Among Illinois Country Elevators.” American Journal of Agricultural Economics 56(1974):135-144. Djundaidi, H., K.B. Young, E.J. Wailes, L. Hoffman, and N. Childs. “Spatial Pricing Efficiency: The Case of U.S. Long Grain Rice.” Selected Paper Presented at the 2001 AAEA Annual Meeting. Fackler, P.L. and H. Tastan. “Estimating the Degree of Market Integration.” American Journal of
Agricultural Economics 90(1)(2008):69-85. Hunnicutt, L., D. Bailey, and M. Crook. “Measuring Market Power with Variables Other than Price.” Selected Paper Presented at the 2002 AAEA Annual Meeting. Manfredo, M.R., and D.R. Sanders. “Is Local Basis Really Local?” Selected Paper Presented at the 2006 NCCC-134 Conference. McNew, K., and D. Griffith. “Measuring the Impact of Ethanol Plants on Local Grain Prices.” Review of Agricultural Economics 27(2)(2005):164-180. Wenzel, B.P, L.D. Hill and P. Garcia. “The Effects of Micro-Market Structure on Illinois Elevator Spatial Corn Price Differentials.” Selected Paper Presented at the 2000 NCR-134 Conference. Whitacre, R.C., and A. D. Spaulding. “Grain Marketing Tools: A Survey of Illinois Grain Elevators.” Selected Paper Presented at the 2007 AAEA Annual Meeting. Yahshilokov, Y. and S. Brosig. “Spatial Price Transmission in Kazakh Wheat Markets.” Poster Paper Presented at the 2006 International Agricultural Economics Conference.
17
Table 1. Kansas Corn Price Model Dependent and Independent Variables
Model
Variables No. Obs.
Mean
Median
Min
Max
Std. Dev.
Weekly Average Cash Corn Prices: Model #1: 1st Quarter (Jan. 1 – Mar. 31, 2008) 285 $4.84 $4.85 $4.60 $5.48 $0.11 Model #2: 2nd Quarter (April 1 – June 30, 2008) 278 $5.92 $5.92 $5.61 $6.61 $0.12 Model #3: 3rd Quarter (July 1 – Sept. 30, 2008) 278 $5.47 $5.46 $5.11 $6.12 $0.13 Model #4: 4th Quarter (Oct. 1 – Dec. 31, 2008) 277 $3.56 $3.52 $3.30 $4.08 $0.12 NW-CRD: Crop Reporting Dist. #10 (Northwest) 26 WC-CRD: Crop Reporting Dist. #20 (West Central) 21 SW-CRD: Crop Reporting Dist. #30 (Southwest) 38 NC-CRD: Crop Reporting Dist. #40 (North Central) 31 C-CRD: Crop Reporting Dist. #50 (Central) 45 SC-CRD: Crop Reporting Dist. #60 (South Central) 49 NE-CRD: Crop Reporting Dist. #70 (Northeast) 36 EC-CRD: Crop Reporting Dist. #80 (East Central) 24 SE-CRD: Crop Reporting Dist. #90 (Southeast) 25 DV-Coop: Cooperatives 247 DV-Indep: Independents 36 DV-Jvntur: Joint Ventures (Coops & Indeps) 2 CYFGPRDN: 2007 County Feedgrain Production (mln. bu.) 2008 County Feedgrain Production (mln. bu.)
285 285
8.42 8.32
7.17 7.34
0.45 0.86
29.94 23.69
5.73 5.09
LVKFGUSE: 2007 CRD Livestock Feedgrain Use (mln. bu.) 2008 CRD Livestock Feedgrain Use (mln. bu.)
285 285
35.18 34.27
17.21 16.28
2.55 2.49
156.49 151.02
49.23 47.40
ELVCPCTY: Elevator Storage Capacity (1,000 bu.) 285 1,626.30 940.00 55.00 47,000.00 4,177.71 %CYSTRCP: Percent of Total County Grain Storage Capacity (percentage)
285 0.20 0.13 0.00 1.53 0.20
Railroad Grain Car Handling Capacity 285 14.96 7.00 0.00 259.00 27.77 RRCRZERO: No Railroad Grain Car Service 104 RRCR1-15: Rail Capacity: 1 to 15 Grain Cars 116 RRCR16-45: Rail Capacity: 16 to 45 Grain Cars 47 RRCR46-90: Rail Capacity: 46 to 90 Grain Cars 6 RRCR91+: Rail Capacity: 91 to 150 Grain Cars 13 ELV10M: Grain Elevators within 10 miles (all affiliated and nonaffiliated elevators)
285 2.33 2.00 0.00 7.00 1.68
ELV10MNA: Grain Elevators w/i 10 mi. (only nonaffiliated agribusinesses)
285 1.10 1.00 0.00 5.00 1.25
Ethanol Plant-to-Elevator Minimum Distance (mi.) 285 66.69 60.50 0.00 170.00 39.09 D-EPLNT60: Ethanol Plant-to-Elevator Distance of 60 miles or less
143
18
Table 2. Kansas Corn Price Models (With Crop Reporting Districts Variables)
Model #1:
Winter Store-Sell
Jan. 1 – March 31, 2008
Model #2:
Spring Planting Season
April 1 – June 30, 2008
Model #3:
Summer Crop Development
July 1 – Sept. 30, 2008
Model #4:
Fall Harvest
Oct. 1 – Dec. 31, 2008
Variables Coeff. t-stat P-value Coeff. t-stat P-value Coeff. t-stat P-value Coeff. t-stat P-value Intercept $4.991 241.847 0.000 $6.081 260.677 0.000 $5.574 200.445 0.000 $3.716 167.197 0.000
NW-CRD –0.254 –15.169 0.000 –0.274 –14.538 0.000 –0.234 –10.426 0.000 –0.259 –14.380 0.000
WC-CRD –0.140 –7.372 0.000 –0.153 –7.163 0.000 –0.127 –4.984 0.000 –0.159 –7.676 0.000
NC-CRD –0.243 –13.625 0.000 –0.270 –13.440 0.000 –0.295 –12.335 0.000 –0.321 –17.274 0.000
C-CRD –0.125 –7.098 0.000 –0.166 –8.383 0.000 –0.155 –6.569 0.000 –0.218 –12.032 0.000
SC-CRD –0.081 –4.928 0.000 –0.116 –6.265 0.000 –0.070 –3.201 0.002 –0.176 –10.332 0.000
NE-CRD –0.260 –14.976 0.000 –0.301 –15.367 0.000 –0.200 –8.561 0.000 –0.266 –14.659 0.000
EC-CRD –0.246 –12.293 0.000 –0.227 –9.219 0.000 –0.108 –3.670 0.000 –0.232 –10.058 0.000
SE-CRD –0.160 –7.127 0.000 –0.155 –6.153 0.000 –0.087 –2.906 0.004 –0.119 –4.998 0.000
DV-Indep 0.048 3.745 0.000 0.054 3.720 0.000 0.060 3.460 0.001 0.051 3.691 0.000
CYFGPRDN 0.002 1.499 0.002 0.002 2.007 0.046 0.002 1.640 0.102 0.002 1.907 0.058
%CYSTRCP 0.023 1.022 0.308 0.026 0.975 0.330 0.019 0.618 0.537 0.052 2.093 0.037
RRCR1-45 –0.005 –0.603 0.547 –0.015 –1.659 0.098 –0.001 –0.051 0.959 0.019 2.210 0.028
RRCR46-150 0.032 1.886 0.060 0.022 1.147 0.252 0.053 2.331 0.021 0.054 2.982 0.003
ELV10MNA 0.004 1.151 0.251 0.004 0.874 0.383 0.002 0.444 0.657 0.004 0.908 0.365
D-EPLNT60 –0.036 –4.139 0.000 –0.022 –2.196 0.029 –0.005 –0.436 0.663 –0.043 –4.528 0.000
R-Square 0.687 0.662 0.571 0.694
Adj. R2 0.670 0.643 0.547 0.676
Std. Error 0.064 0.072 0.086 0.069
Observations 285 278 278 277
Regrssn. d.f. 15 15 15 15
Residual d.f. 269 262 262 261
Model F-test 39.377 34.260 23.269 39.422
F-Test Signif. 0.000 0.000 0.000 0.000
19
Table 3. Kansas Corn Price Models (Without Crop Reporting District Variables)
Model #1:
Winter Store-Sell
Jan. 1 – March 31, 2008
Model #2:
Spring Planting Season
April 1 – June 30, 2008
Model #3:
Summer Crop Development
July 1 – Sept. 30, 2008
Model #4:
Fall Harvest
Oct. 1 – Dec. 31, 2008
Variables Coeff. t-stat P-value Coeff. t-stat P-value Coeff. t-stat P-value Coeff. t-stat P-value
Intercept $4.837 239.577 0.000 $5.923 277.938 0.000 $5.451 212.982 0.000 $3.520 173.950 0.000
DV-Indep 0.045 2.633 0.009 0.051 2.913 0.004 0.059 2.842 0.005 0.055 3.401 0.001
CYFGPRDN –0.001 –2.473 0.014 –0.001 –3.668 0.000 –0.001 –3.096 0.002 –0.001 –3.235 0.001
LVKFGUSE 0.002 7.558 0.000 0.002 9.132 0.000 0.002 6.543 0.000 0.002 11.027 0.000
%CYSTRCP –0.062 –2.313 0.021 –0.033 –1.155 0.249 0.016 0.472 0.637 0.041 1.589 0.113
RRCR1-45 0.007 0.670 0.504 –0.010 –0.923 0.357 0.005 0.383 0.702 0.023 2.342 0.020
RRCR46-150 0.041 1.885 0.060 0.024 1.086 0.278 0.034 1.257 0.210 0.041 2.002 0.046
ELV10MNA 0.005 1.087 0.278 0.005 1.063 0.289 0.011 1.896 0.059 0.007 1.658 0.099
D-EPLNT60 –0.023 –2.176 0.030 –0.002 –0.180 0.857 0.010 0.723 0.470 –0.036 –3.453 0.001
R-Square 0.444 0.500 0.355 0.581
Adj. R2 0.428 0.485 0.336 0.568
Std. Error 0.084 0.087 0.104 0.079
Observations 285 278 278 277
Regrssn. d.f. 8 8 8 8
Residual d.f. 276 269 269 268
Model F-test 27.507 33.562 18.493 46.391
F-Test Signif. 0.000 0.000 0.000 0.000
20
Table 4. Kansas Wheat Price Model Dependent and Independent Variables
Model
Variables No. Obs.
Mean
Median
Min
Max
Std. Dev.
Weekly Average Cash Corn Prices: Model #1: 1st Quarter (Jan. 1 – Mar. 31, 2008) 360 $10.09 $10.10 $9.76 $10.37 $0.10 Model #2: 2nd Quarter (April 1 – June 30, 2008) 360 $8.26 $8.27 $7.85 $8.56 $0.12 Model #3: 3rd Quarter (July 1 – Sept. 30, 2008) 360 $7.47 $7.46 $7.25 $7.60 $0.08 Model #4: 4th Quarter (Oct. 1 – Dec. 31, 2008) 360 $5.13 $5.14 $4.79 $5.32 $0.12 NW-CRD: Crop Reporting Dist. #10 (Northwest) 21 WC-CRD: Crop Reporting Dist. #20 (West Central) 28 SW-CRD: Crop Reporting Dist. #30 (Southwest) 39 NC-CRD: Crop Reporting Dist. #40 (North Central) 29 C-CRD: Crop Reporting Dist. #50 (Central) 71 SC-CRD: Crop Reporting Dist. #60 (South Central) 118 NE-CRD: Crop Reporting Dist. #70 (Northeast) 29 EC-CRD: Crop Reporting Dist. #80 (East Central) 13 SE-CRD: Crop Reporting Dist. #90 (Southeast) 12 DV-Coop: Cooperatives 269 DV-Indep: Independents 89 DV-Jvntur: Joint Ventures (Coops & Indeps) 1 CYWHPRDN: 2007 County Wheat Production (mln. bu.) 2008 County Wheat Production (mln. bu.)
360 360
34.04 57.04
29.98 67.36
4.22 5.86
71.58 85.76
17.98 26.88
ELVCPCTY: Elevator Storage Capacity (1,000 bu.) 360 1,250.13 737.00 0.00 32,000.00 2,608.93 %CYSTRCP: Percent of Total County Grain Storage Capacity (percentage)
360 0.14 0.10 0.00 1.00 0.15
Railroad Grain Car Handling Capacity 360 12.60 5.00 0.00 280.00 26.31 RRCRZERO: No Railroad Grain Car Service 151 RRCR1-15: Rail Capacity: 1 to 15 Grain Cars 141 RRCR16-45: Rail Capacity: 16 to 45 Grain Cars 54 RRCR46-90: Rail Capacity: 46 to 90 Grain Cars 2 RRCR91+: Rail Capacity: 91 to 150 Grain Cars 15 ELV10M: Grain Elevators within 10 miles (all) 360 2.48 2.00 0.00 8.00 1.90 ELV10MNA: Grain Elevators w/i 10 mi. (only nonaffiliated agribusinesses)
360 1.27 1.00 0.00 8.00 1.53
Wheat Mill-to-Elevator Minimum Distance (miles) 360 72.00 63.70 0.00 220.00 50.08 D-MILL60: Wheat Mill-to-Elevator Distance of 60 miles or less
164
21
Table 5. Kansas Wheat Price Models (With Crop Reporting District Variables)
Model #1:
Winter Store-Sell
Jan. 1 – March 31, 2008
Model #2:
Spring Crop Development
April 1 – June 30, 2008
Model #3:
Summer HRW Harvest
July 1 – Sept. 30, 2008
Model #4:
Fall Store-Sell
Oct. 1 – Dec. 31, 2008
Variables Coeff. t-stat P-value Coeff. t-stat P-value Coeff. t-stat P-value Coeff. t-stat P-value
Intercept $10.154 598.801 0.000 $8.292 402.228 0.000 $7.461 499.335 0.000 $5.065 235.507 0.000
NW-CRD –0.138 –6.036 0.000 –0.063 –2.273 0.024 –0.039 –2.440 0.015 0.028 1.226 0.221
WC-CRD –0.151 –7.748 0.000 –0.099 –4.163 0.000 –0.026 –1.837 0.067 –0.062 –3.009 0.003
SW-CRD –0.103 –5.234 0.000 –0.047 –1.949 0.052 –0.012 –0.938 0.349 –0.106 –5.664 0.000
NC-CRD –0.009 –0.548 0.584 0.055 2.679 0.008 –0.024 –1.784 0.075 –0.022 –1.144 0.254
C-CRD –0.050 –4.302 0.000 –0.022 –1.519 0.130 –0.001 –0.154 0.878 –0.007 –0.553 0.581
NE-CRD –0.121 –6.010 0.000 –0.199 –8.122 0.000 –0.157 –9.543 0.000 –0.087 –3.692 0.000
EC-CRD 0.078 3.001 0.003 –0.228 –7.268 0.000 –0.005 –0.235 0.814 0.041 1.426 0.155
SE-CRD –0.074 –2.593 0.010 –0.095 –2.744 0.006 –0.159 –7.370 0.000 –0.147 –4.753 0.000
DV-Indep 0.011 1.022 0.308 0.004 0.331 0.741 0.007 0.843 0.400 0.012 1.049 0.295
CYWHPRDN –0.001 –0.167 0.867 –0.006 –1.095 0.274 –0.000 –0.120 0.905 0.010 4.618 0.000
%CYSTRCP 0.007 0.237 0.813 0.137 3.623 0.000 0.089 3.575 0.000 0.069 1.915 0.056
RRCR1-45 –0.024 –2.830 0.007 –0.021 –2.111 0.036 –0.018 –2.829 0.005 –0.001 –0.147 0.883
RRCR46-150 0.017 0.843 0.400 –0.016 –0.652 0.515 –0.010 –0.679 0.498 –0.004 –0.163 0.870
ELV10MNA –0.004 –1.402 0.162 0.007 1.871 0.062 0.006 2.503 0.013 0.002 0.640 0.523
D-MILL60 0.014 1.345 0.180 0.031 2.340 0.020 0.045 5.309 0.000 0.053 4.414 0.000
R-Square 0.435 0.407 0.512 0.491
Adj. R2 0.410 0.381 0.491 0.468
Std. Error 0.076 0.093 0.059 0.085
Observations 360 360 360 360
Regrssn. d.f. 15 15 15 15
Residual d.f. 344 344 344 344
Model F-test 17.634 15.742 24.063 22.078
F-Test Signif. 0.000 0.000 0.000 0.000
22
Table 6. Kansas Wheat Price Models (Without Crop Reporting District Variables)
Model #1:
Winter Store-Sell
Jan. 1 – March 31, 2008
Model #2:
Spring Crop Development
April 1 – June 30, 2008
Model #3:
Summer HRW Harvest
July 1 – Sept. 30, 2008
Model #4:
Fall Store-Sell
Oct. 1 – Dec. 31, 2008
Variables Coeff. t-stat P-value Coeff. t-stat P-value Coeff. t-stat P-value Coeff. t-stat P-value
Intercept $10.135 721.855 0.000 $8.216 487.191 0.000 $7.397 660.260 0.000 $5.002 336.103 0.000
DV-Indep 0.003 0.279 0.780 –0.006 –0.439 0.661 –0.003 –0.282 0.778 0.000 0.006 0.995
CYWHPRDN –0.014 –4.852 0.000 0.005 1.333 0.183 0.006 4.229 0.000 0.018 9.228 0.000
%CYSTRCP –0.016 –0.460 0.646 0.020 0.483 0.629 0.074 2.628 0.009 0.112 2.968 0.003
RRCR1-45 –0.027 –2.794 0.006 –0.024 –2.021 0.040 –0.010 –1.379 0.169 –0.014 –1.443 0.150
RRCR46-150 0.016 0.681 0.496 0.014 0.492 0.623 0.005 0.286 0.775 –0.016 –0.698 0.486
ELV10MNA –0.003 –0.796 0.427 0.007 1.557 0.120 0.005 1.983 0.048 0.006 1.736 0.084
D-MILL60 0.040 3.899 0.000 0.080 6.527 0.000 0.059 6.559 0.000 0.044 3.740 0.000
R-Square 0.161 0.141 0.287 0.366
Adj. R2 0.144 0.124 0.273 0.353
Std. Error 0.092 0.110 0.070 0.093
Observations 360 360 360 360
Regrssn. d.f. 7 7 7 7
Residual d.f. 352 352 352 352
Model F-test 9.626 8.225 20.206 28.963
F-Test Signif. 0.000 0.000 0.000 0.000
Related Documents