South Dakota State University South Dakota State University Open PRAIRIE: Open Public Research Access Institutional Open PRAIRIE: Open Public Research Access Institutional Repository and Information Exchange Repository and Information Exchange Electronic Theses and Dissertations 2017 The Effects of the Dodd-Frank Act on Community Banks The Effects of the Dodd-Frank Act on Community Banks Hoanh Le South Dakota State University Follow this and additional works at: https://openprairie.sdstate.edu/etd Part of the Economics Commons Recommended Citation Recommended Citation Le, Hoanh, "The Effects of the Dodd-Frank Act on Community Banks" (2017). Electronic Theses and Dissertations. 1709. https://openprairie.sdstate.edu/etd/1709 This Thesis - Open Access is brought to you for free and open access by Open PRAIRIE: Open Public Research Access Institutional Repository and Information Exchange. It has been accepted for inclusion in Electronic Theses and Dissertations by an authorized administrator of Open PRAIRIE: Open Public Research Access Institutional Repository and Information Exchange. For more information, please contact [email protected].

Welcome message from author
This document is posted to help you gain knowledge. Please leave a comment to let me know what you think about it! Share it to your friends and learn new things together.
Transcript
South Dakota State University South Dakota State University
Open PRAIRIE: Open Public Research Access Institutional Open PRAIRIE: Open Public Research Access Institutional
Repository and Information Exchange Repository and Information Exchange
Electronic Theses and Dissertations
2017
The Effects of the Dodd-Frank Act on Community Banks The Effects of the Dodd-Frank Act on Community Banks
Hoanh Le South Dakota State University
Follow this and additional works at: https://openprairie.sdstate.edu/etd
Part of the Economics Commons
Recommended Citation Recommended Citation Le, Hoanh, "The Effects of the Dodd-Frank Act on Community Banks" (2017). Electronic Theses and Dissertations. 1709. https://openprairie.sdstate.edu/etd/1709
This Thesis - Open Access is brought to you for free and open access by Open PRAIRIE: Open Public Research Access Institutional Repository and Information Exchange. It has been accepted for inclusion in Electronic Theses and Dissertations by an authorized administrator of Open PRAIRIE: Open Public Research Access Institutional Repository and Information Exchange. For more information, please contact [email protected].

THE EFFECTS OF THE DODD-FRANK ACT ON COMMUNITY BANKS
BY HOANH LE
A thesis submitted in partial fulfillment of the requirements for the
Master of Science
Major in Economics
South Dakota State University
2017


iii
ACKNOWLEDGEMENTS
I want to thank my family for always supporting me and encouraging me to study and finish my thesis. I want to thank Dr. Santos for helping me in so many ways while I am doing my thesis.
iv
CONTENTS
Chapter 1: INTRODUCTION........................................................................................ 1
Chapter 2: AN OVERVIEW OF COMMUNITY BANKING ...................................... 3
Chapter 3: LITERATURE REVIEW............................................................................. 9
3.1. Studies on banking regulations and regulatory burdens ................................... 10
3.2. The economies of scale in banking industry ..................................................... 15
3.3. The effects of the Dodd-Frank Act on community banks................................. 17
Chapter 4: DATA AND METHODOLOGY ............................................................... 21
4.1. Conceptual Framework ..................................................................................... 21
4.2. Data ................................................................................................................ 31
4.3. Regression Model and Variables ..................................................................... 32
Chapter 5: EMPIRICAL RESULTS ............................................................................ 38
5.1. Descriptive Statistics ......................................................................................... 38
5.2. Empirical results ............................................................................................... 46
Chapter 6: CONCLUSION .......................................................................................... 55
References .................................................................................................................... 57
Appendices .................................................................................................................. 61
v
ABSTRACT
THE EFFECTS OF THE DODD-FRANK ACT ON COMMUNITY BANKS
HOANH LE
2017
In this paper, I study the effects on community banks of seven final rules
associated with the Dodd-Frank Act. I use quarterly data on US bank holding
companies from 1991 through 2016 to test working hypotheses that several bank-
performance measures—including pretax returns on assets, loans per employee,
changes in the number of employees, and salaries to assets—responded to the passage
of these seven final rules in ways that reflected regulatory burdens that these rules
imposed on banks. I find that these seven final rules affected banks differently
according to their scale. Taken together, my results imply that these seven final rules
mostly burdened community banks with $10 billion or less in total assets; put
differently, these rules imposed relatively little regulatory burden on large banks with
greater than $10 billion in total assets.
1
Chapter 1: INTRODUCTION
The banking industry plays an important role in the US financial system and the
US economy, more generally. Annually, banks supply about $10 trillion of credit in
the United States; thus, banks are an important source of external funding for US
businesses. Not surprisingly, perhaps, the US government heavily regulates the
banking industry to ensure it works efficiently and does not fail.
Financial regulation seeks to prevent banks from taking excessive risks and to
protect consumers from losses. Banking regulations include safety and soundness
regulation and consumer protection regulation. The purpose of safety and soundness
regulation is to stabilize the banking system and avoid failure while ensuring banks
are profitable. On the other hand, the purpose of consumer protection regulation is to
protect depositors from losing their savings if a banking panic occurs. Since the Great
Depression (1929-1933), a great deal of financial legislation has been passed;
examples include the Glass-Steagall Act of 1933, the Securities Acts of 1933, the
Securities Exchange Act of 1934, the Competitive Equality in Banking Act (CEBA)
of 1987, and the Providing Appropriate Tools Required to Intercept and Obstruct
Terrorism Act of 2001 (PATRIOT). The latest example is the Dodd-Frank Wall Street
Reform and Consumer Protection Act of 2010 (Dodd-Frank Act). All of legislations,
which include the Dodd-Frank Act, added up to more than 22,000 pages of
regulations.
The Dodd-Frank Act was passed in July 2010 by policymakers who sought to
prevent a banking crisis like the one that occurred in 2008. There are many reasons to
expect that the significant changes in financial regulations associated with the Dodd-

2
Frank Act have increased costs for banks, especially community banks, which do not
benefit from economies of scale.
This expectation has led some financial-system observers to conclude that
regulations for small banks and large banks should differ. To be sure, the authors of
the Dodd-Frank Act intended to target the largest financial institutions; thus, much of
the Dodd-Frank Act is not intended to apply to community banks—generally
speaking, those with total assets of less than $10 billion. Although community banks
are exempted from many of the Act’s rules, there remains much debate over the
regulatory burden the Act imposes—indirectly or otherwise—on community banks.
In this thesis, I study the effects of regulations on community banks and test the
central hypothesis that, compared to large banks, community banks are more
constrained and, thus, burdened by regulations, specifically those associated with the
Dodd-Frank Act. Based on my review and analysis of the literature, I determine that
seven Dodd-Frank rules—mortgage and non-mortgage related—should have the
largest impact on community banks. I measure the impact of these seven final rules on
measures of bank performance—namely, loans per employee, pretax returns on
assets, percentage change in number of employees, and salaries to assets—across 5
groups of banks, which I define based on asset size. My dataset includes more than
135,000 bank-quarter observations for the period from 1991 Q1 to 2016 Q4. I
obtained these data from the Federal Reserve’s Consolidated Financial Statements for
Holding Companies (FR-Y9C) reports.
Taken together, my results imply that the effects of mortgage and non-mortgage
related rules on bank performance vary according to bank size. Specifically, these
seven final rules mostly affect community banks with $10 billion or less in total
3
assets; thus, these rules impose relatively little regulatory burden on large banks with
greater than $10 billion in total assets.
Chapter 2: AN OVERVIEW OF COMMUNITY BANKING
Community banks are known for their traditional banking activities and
regional-market concentrations. Community banks generate revenue from loans they
make to households and business—often, small business in sectors such as
agriculture, real estate, and retail. Typically, a community bank is defined by the
amount of its total assets. Nevertheless, the three largest federal banking regulators
define community banks differently. The Board of Governors of the Federal Reserve
System defines a community bank as an institution with less than $10 billion in total
assets. The Office of the Comptroller of the Currency (OCC) defines a community
bank as an institution with less than $1 billion in total assets and includes some
limited-purpose chartered institutions (2010). Finally, in a 2012 study, the Federal
Deposit Insurance Corporation (FDIC) also defined a community bank as an
institution with less than $1 billion in total assets; though, the FDIC included or
excluded institutions as it deemed appropriate based on special-case features—
including, for example, the extent to which an institution engages in basic banking
activities and the institution’s geographical footprint. Based on the FDIC definition,
94 percent of the 6,914 US financial institutions were community banks as of year-
end 2010 (FDIC, 2012).
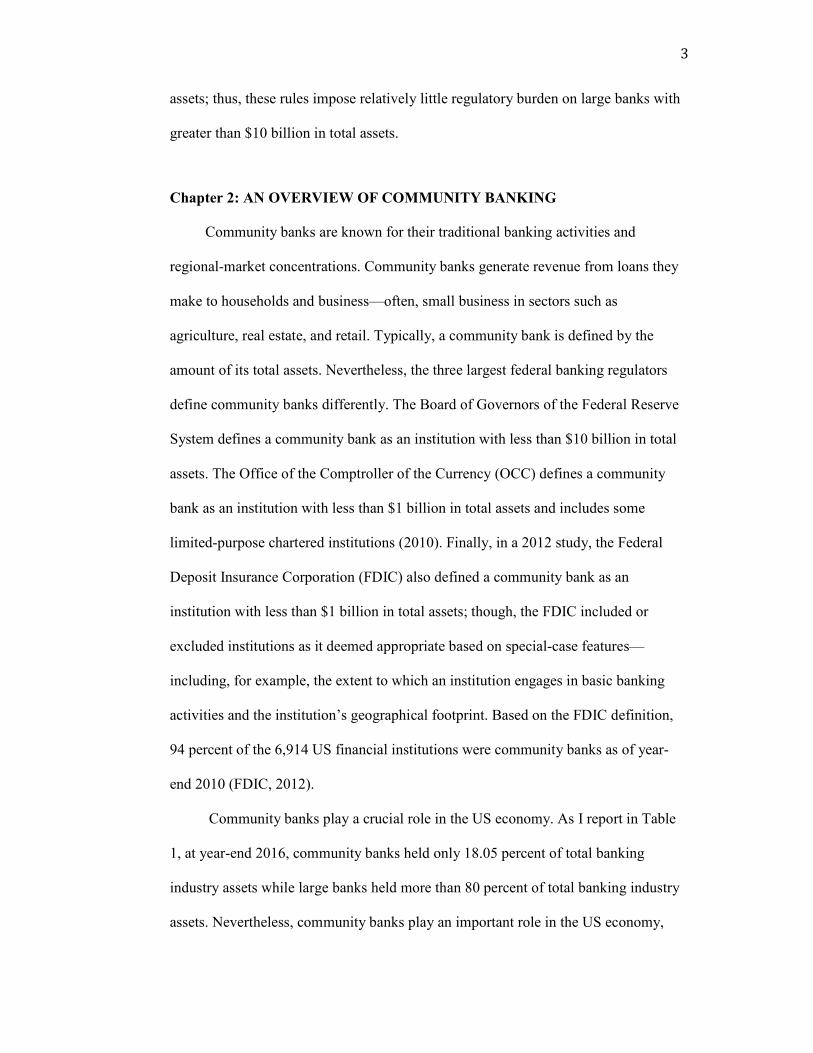
Community banks play a crucial role in the US economy. As I report in Table
1, at year-end 2016, community banks held only 18.05 percent of total banking
industry assets while large banks held more than 80 percent of total banking industry
assets. Nevertheless, community banks play an important role in the US economy,
4
especially in local economies. Community banks provide banking services to millions
of Americans; these banks are a key source of credit for small business loans and rural
communities, more generally.
Table 1: Banking Industry Assets by Asset Size as of December 31, 2016
($billion)
Bank Size
Assets (Billions)
Asset Distribution Across
Bank Size
Less than $100 Million 92 0.55%
$100 Million to $1 Billion 1,174 7.00%
$1 Billion to $10 Billion 1,762 10.50%
$10 Billion to $250 Billion 5,306 31.62%
Greater than $250 Billion 8,447 50.34%
Source: FDIC
As of 2015, community banks provided about 77 percent of loans to the
agricultural industry, 46 percent of loans to the commercial real estate market, and 51
percent of loans to small businesses (Lux & Greene, 2015). Community banks mostly
serve rural communities. According to the FDIC, community banks locate their
offices in local areas four times more than non-community banks do (FDIC, 2012).
As former Federal Reserve chairman Ben Bernanke stated in his speech on March 14,
2012:
Community banks remain a critical component of our financial system and our economy. They help keep their local economies vibrant and growing by taking on and managing the risks of local lending, which larger banks may be unwilling or unable to do. They often respond with greater agility to lending requests than their national competitors because of their detailed knowledge of the needs of their customers and their close ties to the communities they serve.
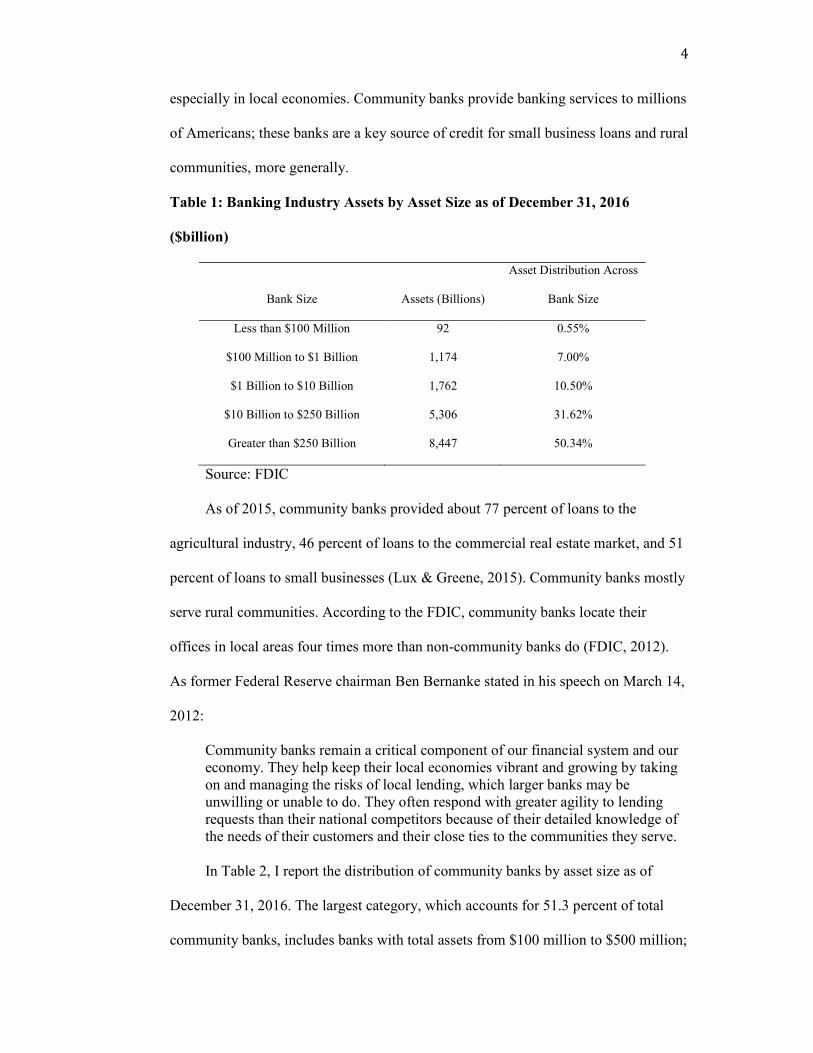
In Table 2, I report the distribution of community banks by asset size as of
December 31, 2016. The largest category, which accounts for 51.3 percent of total
community banks, includes banks with total assets from $100 million to $500 million;
5
the next largest category, which accounts for 26.57 percent of total community banks,
includes banks with total assets less than $100 million. Banks with total assets from
$500 million and $1 billion account for 11.42 percent of community banks; the
remainder includes banks with assets from $1 billion to $10 billion.
Table 2: Community Banks by Asset Size
Size of Community Bank Number of
Community Banks
Percent of Total
Community Banks
Total Assets
(In 000’s)
Percentage of Total
Bank Assets
Less than $100 million
$100 million to $500 million
1,541
2,975
26.57%
51.30%
91,516,049
705,441,247
3.02%
23.30%
$500 million to $1 billion 662 11.42% 468,501,015 15.47%
$1 billion to $10billion
Total
621
5,799
10.71%
100%
1,762,210,918
3,027,699,229
58.21%
100%
Source: FDIC - Statistics on Depository Institutions Report as of December 31, 2016
Community banks distinguish themselves by relying heavily on personal
relationships. Hein, Koch, and Macdonald (2005) define community banks as those
that focus their activities, such as lending and gathering deposits, on local
communities rather than on regional or national markets; thus, community banks are
generally small. Marsh and Norman (2013) characterize the importance of community
banks as follows:
Community banks play a vital role in this nation’s economy, particularly with respect to small businesses and rural communities, and their continued health and vitality is central to the nation’s economic recovery. Community banks provide 48.1 percent of small-business loans issued by US banks, 15.7 percent of residential mortgage lending, 43.8 percent of farmland lending, 42.8 percent of farm lending, and 34.7 percent of commercial real estate loans, and they held 20 percent of all retail deposits at US banks as of 2010.
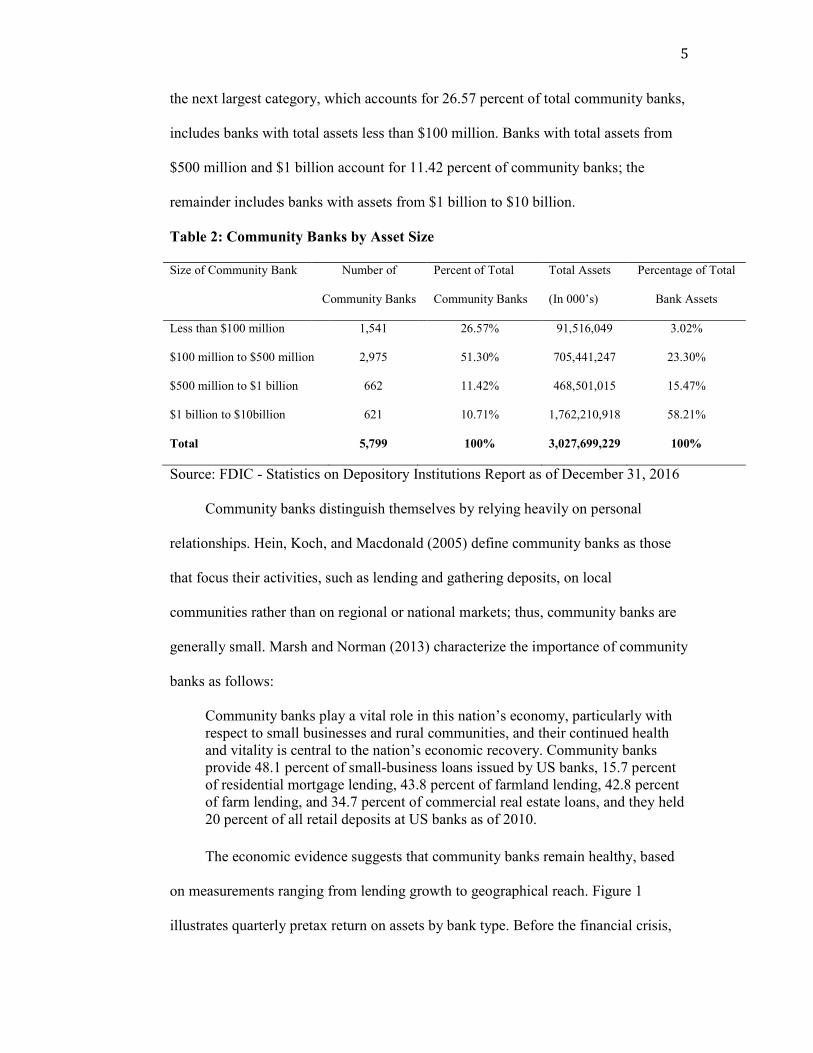
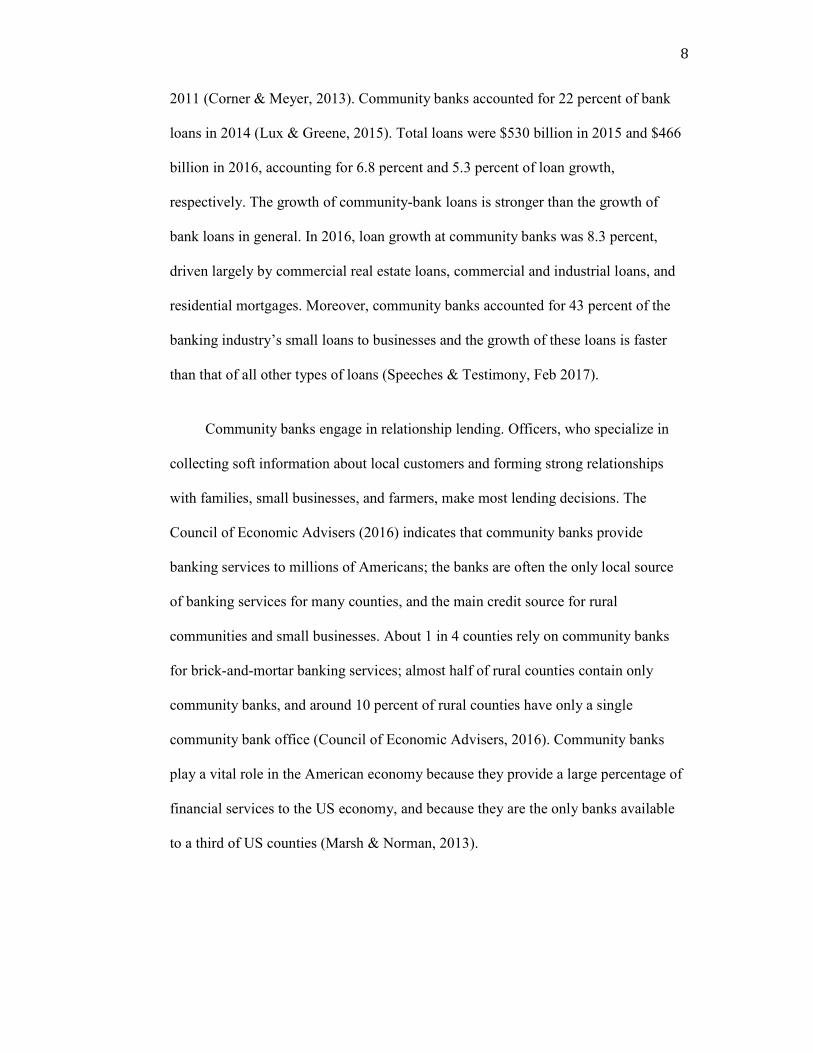
The economic evidence suggests that community banks remain healthy, based
on measurements ranging from lending growth to geographical reach. Figure 1
illustrates quarterly pretax return on assets by bank type. Before the financial crisis,
6
quarterly pretax return on assets of community banks was around 1.4 percent, on
average. During the financial crisis, quarterly pretax return on assets dropped
dramatically. This return improved after the financial crisis, although the rate
remained lower than before the crisis.
Source: FDIC

7
Source: FDIC
Figure 2 illustrates quarterly pretax return on equity by bank type. Over the 12-
year period between 2005 and 2016, community banks generated average quarterly
pretax return on equity of 8.69 percent, compared to 11.35 percent for non-
community banks. For the period from 2005 to 2007, community banks generated
average quarterly pretax return on equity of 13.72 percent, compared to 16.65 percent
for non-community banks. For the period from 2007 to 2010, average quarterly return
on equity deteriorated for both community banks and non-community banks; this
return remained negative from 2009 to 2010. Since then, bank profitability has
recovered; though, average quarterly pretax return on equity for all banks has settled
to a level lower than that before the crisis.
Qualified loans and local deposits are the main ingredients of community-
bank asset transformation and, thus, growth. The total volume of loans held by
community banks peaked in 2008, dropped during the financial crisis, and troughed in
8
2011 (Corner & Meyer, 2013). Community banks accounted for 22 percent of bank
loans in 2014 (Lux & Greene, 2015). Total loans were $530 billion in 2015 and $466
billion in 2016, accounting for 6.8 percent and 5.3 percent of loan growth,
respectively. The growth of community-bank loans is stronger than the growth of
bank loans in general. In 2016, loan growth at community banks was 8.3 percent,
driven largely by commercial real estate loans, commercial and industrial loans, and
residential mortgages. Moreover, community banks accounted for 43 percent of the
banking industry’s small loans to businesses and the growth of these loans is faster
than that of all other types of loans (Speeches & Testimony, Feb 2017).
Community banks engage in relationship lending. Officers, who specialize in
collecting soft information about local customers and forming strong relationships
with families, small businesses, and farmers, make most lending decisions. The
Council of Economic Advisers (2016) indicates that community banks provide
banking services to millions of Americans; the banks are often the only local source
of banking services for many counties, and the main credit source for rural
communities and small businesses. About 1 in 4 counties rely on community banks
for brick-and-mortar banking services; almost half of rural counties contain only
community banks, and around 10 percent of rural counties have only a single
community bank office (Council of Economic Advisers, 2016). Community banks
play a vital role in the American economy because they provide a large percentage of
financial services to the US economy, and because they are the only banks available
to a third of US counties (Marsh & Norman, 2013).

9
Chapter 3: LITERATURE REVIEW
The banking industry is one of the most heavily regulated industries in the
United States (Elliehausen & Lowrey, 2000). After the financial crisis in 2008,
policymakers feared another banking collapse would occur soon, so Congress quickly
passed the Dodd-Frank Wall Street Reform and Consumer Protection Act in 2010
(Dodd-Frank Act). Its framers intended to promote the stability of the financial
system and to protect consumers. However, there is ongoing debate about whether the
additional regulations have resulted in greater regulatory burden for small banks, even
though they were not the source of the financial crisis. Regulations have both benefits
and costs, but the most frequent critique is that “one-size-fits-all” regulations have
negatively affected small banks most severely. Some advocates of this view suggest
that small banks should be exempted from regulations because the costs of regulations
on small banks do not justify the benefits. Moreover, the costs of regulations not only
affect small banks, but also affect consumers, the government, and the overall
economy. For instance, the ability-to-repay rule in the Dodd Frank Act requires the
lender to verify the ability of the borrower to repay the mortgage before the lender
may provide the mortgage. To do that, banks must spend more time considering the
application; they also must spend time and money training their staff to apply more
rigorous lending-decision rules. Thus, this additional regulation may have increased
both the operating and opportunity costs of small banks. Large banks benefit from
economies of scale because they can spread their fixed costs over a large customer
base. Small banks, which do not benefit from economies of scale, are affected more
when regulations increase operating costs. The literature supports the existence of
economies of scale in complying with banking regulations, and the asymmetrically
distributed effects of regulations across the banking industry.
10
This literature review includes three sections: regulations on financial
institutions, economies of scale in the banking industry, and the effects of the Dodd-
Frank Act on community banks.
3.1. Studies on banking regulations and regulatory burdens
Banking regulation can be divided into two categories: safety and soundness
regulation and consumer protection regulation. Safety and soundness regulation is
designed to ensure that banks maintain profitability and avoid failure. Consumer
protection regulation is designed to ensure the rights of consumers, protect consumers
in the financial marketplace, and prevent consumers from unfair, fraudulent business
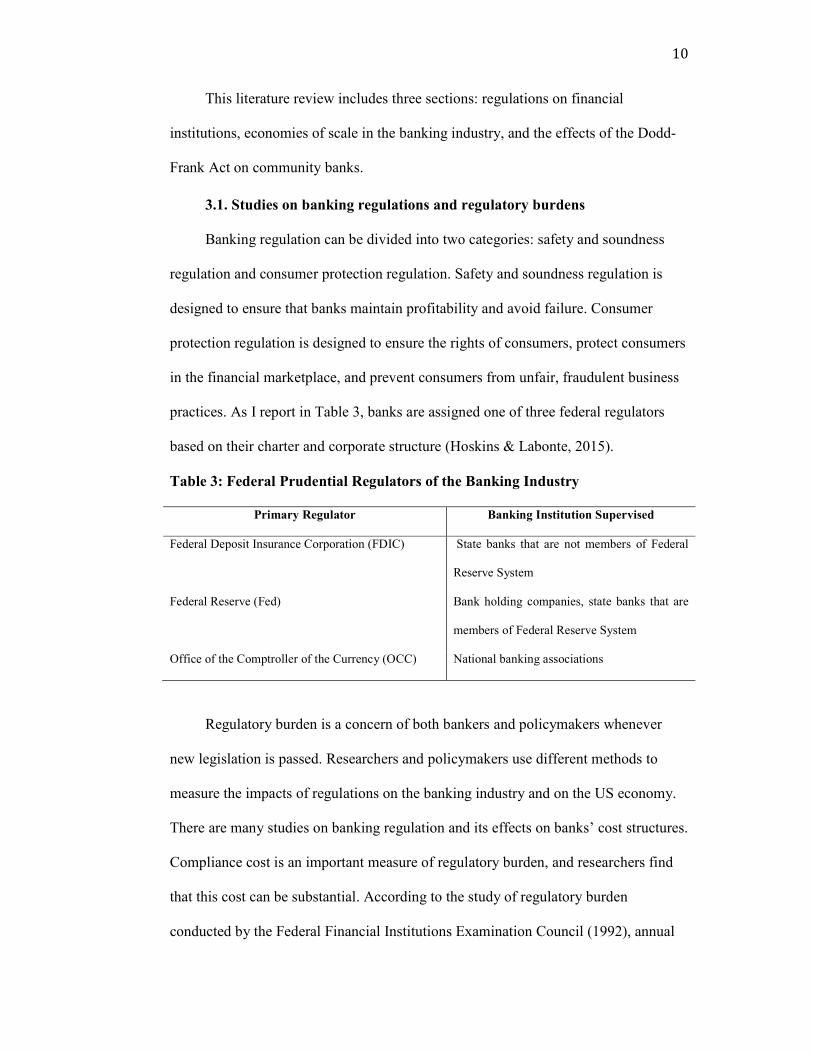
practices. As I report in Table 3, banks are assigned one of three federal regulators
based on their charter and corporate structure (Hoskins & Labonte, 2015).
Table 3: Federal Prudential Regulators of the Banking Industry
Primary Regulator Banking Institution Supervised
Federal Deposit Insurance Corporation (FDIC) State banks that are not members of Federal
Reserve System
Federal Reserve (Fed) Bank holding companies, state banks that are
members of Federal Reserve System
Office of the Comptroller of the Currency (OCC) National banking associations
Regulatory burden is a concern of both bankers and policymakers whenever
new legislation is passed. Researchers and policymakers use different methods to
measure the impacts of regulations on the banking industry and on the US economy.
There are many studies on banking regulation and its effects on banks’ cost structures.
Compliance cost is an important measure of regulatory burden, and researchers find
that this cost can be substantial. According to the study of regulatory burden
conducted by the Federal Financial Institutions Examination Council (1992), annual
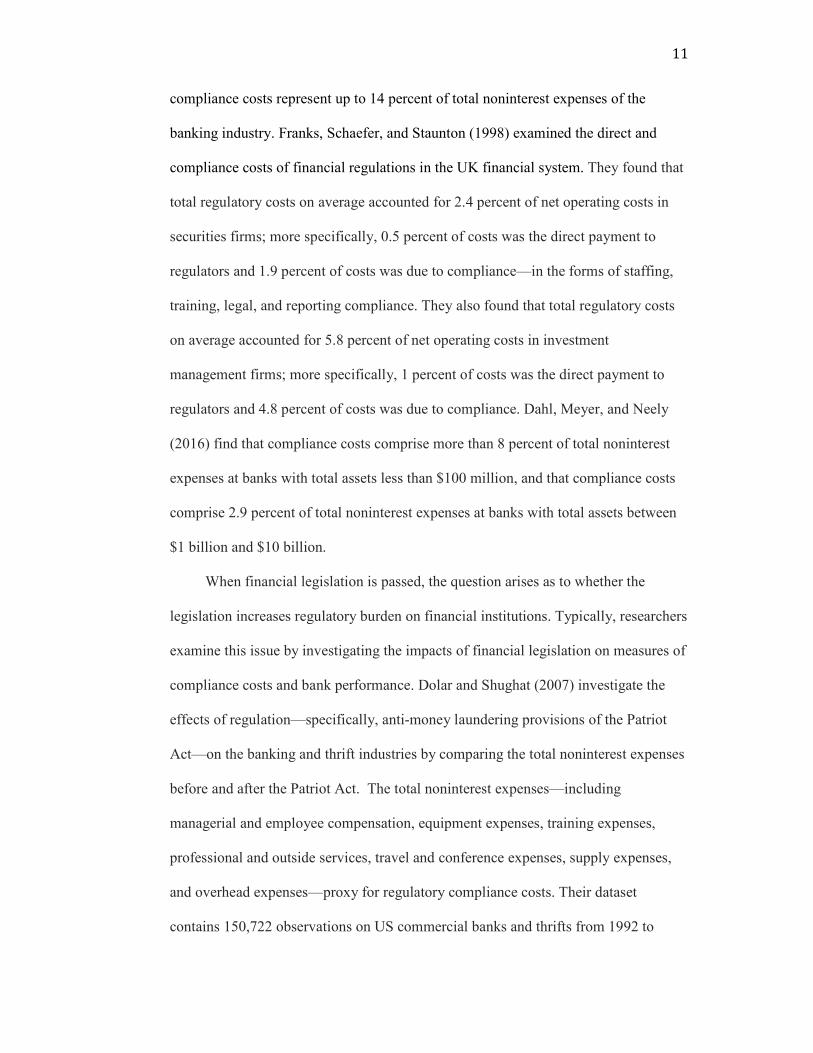
11
compliance costs represent up to 14 percent of total noninterest expenses of the
banking industry. Franks, Schaefer, and Staunton (1998) examined the direct and
compliance costs of financial regulations in the UK financial system. They found that
total regulatory costs on average accounted for 2.4 percent of net operating costs in
securities firms; more specifically, 0.5 percent of costs was the direct payment to
regulators and 1.9 percent of costs was due to compliance—in the forms of staffing,
training, legal, and reporting compliance. They also found that total regulatory costs
on average accounted for 5.8 percent of net operating costs in investment
management firms; more specifically, 1 percent of costs was the direct payment to
regulators and 4.8 percent of costs was due to compliance. Dahl, Meyer, and Neely
(2016) find that compliance costs comprise more than 8 percent of total noninterest
expenses at banks with total assets less than $100 million, and that compliance costs
comprise 2.9 percent of total noninterest expenses at banks with total assets between
$1 billion and $10 billion.
When financial legislation is passed, the question arises as to whether the
legislation increases regulatory burden on financial institutions. Typically, researchers
examine this issue by investigating the impacts of financial legislation on measures of
compliance costs and bank performance. Dolar and Shughat (2007) investigate the
effects of regulation—specifically, anti-money laundering provisions of the Patriot
Act—on the banking and thrift industries by comparing the total noninterest expenses
before and after the Patriot Act. The total noninterest expenses—including
managerial and employee compensation, equipment expenses, training expenses,
professional and outside services, travel and conference expenses, supply expenses,
and overhead expenses—proxy for regulatory compliance costs. Their dataset
contains 150,722 observations on US commercial banks and thrifts from 1992 to
12
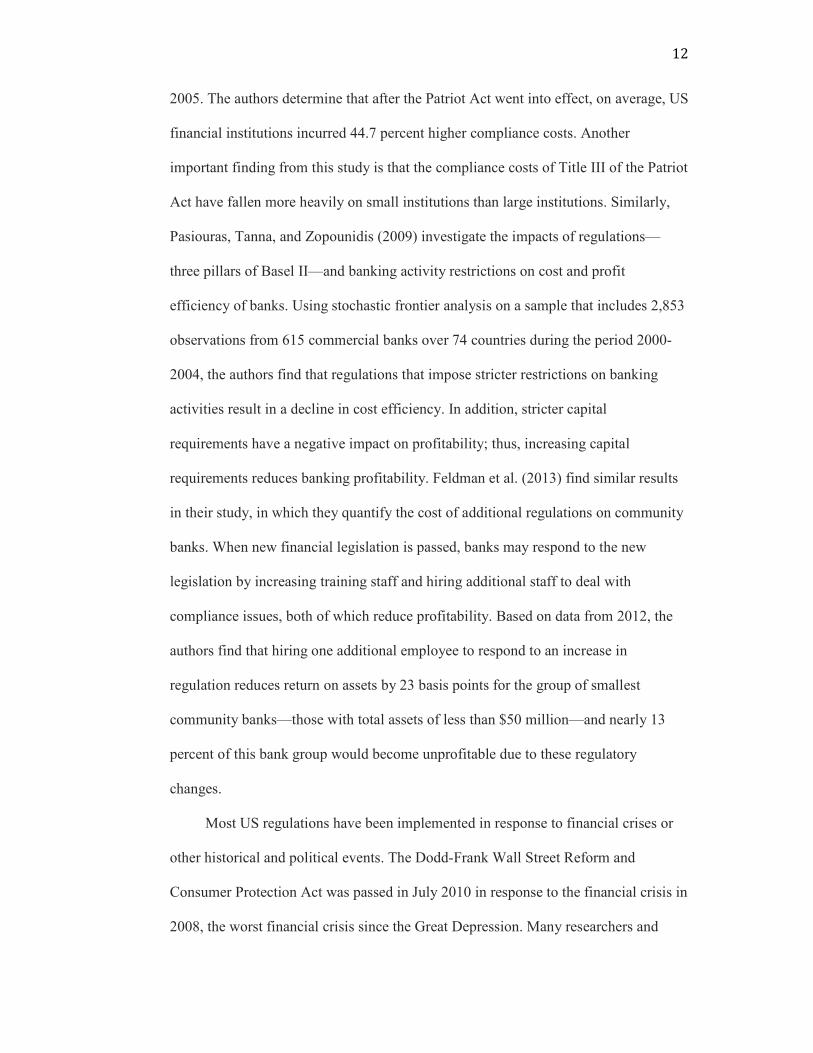
2005. The authors determine that after the Patriot Act went into effect, on average, US
financial institutions incurred 44.7 percent higher compliance costs. Another
important finding from this study is that the compliance costs of Title III of the Patriot
Act have fallen more heavily on small institutions than large institutions. Similarly,
Pasiouras, Tanna, and Zopounidis (2009) investigate the impacts of regulations—
three pillars of Basel II—and banking activity restrictions on cost and profit
efficiency of banks. Using stochastic frontier analysis on a sample that includes 2,853
observations from 615 commercial banks over 74 countries during the period 2000-
2004, the authors find that regulations that impose stricter restrictions on banking
activities result in a decline in cost efficiency. In addition, stricter capital
requirements have a negative impact on profitability; thus, increasing capital
requirements reduces banking profitability. Feldman et al. (2013) find similar results
in their study, in which they quantify the cost of additional regulations on community
banks. When new financial legislation is passed, banks may respond to the new
legislation by increasing training staff and hiring additional staff to deal with
compliance issues, both of which reduce profitability. Based on data from 2012, the
authors find that hiring one additional employee to respond to an increase in
regulation reduces return on assets by 23 basis points for the group of smallest
community banks—those with total assets of less than $50 million—and nearly 13
percent of this bank group would become unprofitable due to these regulatory
changes.
Most US regulations have been implemented in response to financial crises or
other historical and political events. The Dodd-Frank Wall Street Reform and
Consumer Protection Act was passed in July 2010 in response to the financial crisis in
2008, the worst financial crisis since the Great Depression. Many researchers and
13
bankers consider the Dodd-Frank Act the most comprehensive financial regulatory
reform of the twenty-first century. Marsh and Norman (2013) argue that although the
most significant regulations under the Dodd-Frank Act have not gone into effect, the
act already imposes significant compliance costs on community banks. Put
differently, compliance costs place community banks at a further competitive
disadvantage to large banks. Marsh and Norman (2013) also argue that the number of
community banks will continue to shrink because the regulatory burden of the Dodd-
Frank Act will cause additional failures or mergers. Based on a similar research
question, Lux and Greene (2015) analyze the FDIC’s Statistics on Depository
Institutions quarterly dataset to determine the effects of the Dodd-Frank Act on
community banks. The authors find that community banks’ share of assets has fallen
significantly—by over 12 percent—since the second quarter of 2010; the share of
assets of the smallest community banks—those with assets less than $1 billion—has
fallen 19 percent since the second quarter of 2010; and community banks’ market
share of residential and commercial lending fell by 6 percent during the financial
crisis and has fallen at a rate almost double that since 2010.
The Federal Reserve Bank of Kansas City surveyed community banks with
assets less than $1 billion and located in the Tenth District in 2014. According to the
findings of the survey, community banks rate mortgage regulations as the most
expensive and time consuming. These banks expected the number of full-time
employees to increase by 37 percent over the next three years. Nearly 90 percent of
respondents expected an increase in training expenses and technology upgrades over
the next three years.
The Mercatus Center at George Mason University surveyed nearly 200 small
banks—those with total assets less than $10 billion—to study the effects of the Dodd-
14
Frank Act on small banks. The authors conclude “small banks are spending more on
compliance in the wake of Dodd-Frank.” Over 25 percent of small banks expected to
hire additional compliance or legal personnel in the next 12 months. In particular,
37.3 percent of respondents already hired new staff in order to meet the CFPB’s
regulations, especially mortgage rules. 94 percent of respondents in the survey
reported that they would not add any products as a result of Dodd-Frank. Moreover,
some banks reported they discontinued products and services such as residential
mortgages, mortgage servicing, home equity lines of credit, over-draft protections,
and credit cards, as a result of Dodd-Frank. Overall, 82.9 percent of respondents
reported that their compliance costs have increased more than 5 percent since the
passage of the Dodd-Frank Act (Pierce et al., 2014). Hogan and Burns (2016) find a
statistically significant increase in banks’ noninterest expenses, which include
regulatory compliance costs, after the passage of the Dodd-Frank Act.
Cyree (2015) used a quantitative analysis approach to measure the direct
compliance costs of banks around major regulatory changes from 1991 to 2014. The
author analyzed data from the Federal Reserve FR-Y9C reports for bank holding
companies from 1991 Q1 to 2014 Q1. The data included more than 133,000 bank-
quarter observations. The author rejects the hypothesis that major regulatory changes
have no effects on the banking industry; however, the effects of these regulatory
changes vary. Pretax return on assets of community banks fell significantly in relation
to the Ability-to-Repay and Qualified Mortgage Rule, while it rose significantly in
relation to the Patriot Act. Loans-per-employee fell in relation to the Patriot Act. In
contrast, loans-per-employee rose in relation to the passage of the Dodd-Frank Act
and the Ability-to-Repay and Qualified Mortgage Rule, which is inconsistent with the
debate about regulatory burden over the Dodd-Frank Act.
15
On balance, the literature on regulatory burden on community banks finds that
increasing regulations on financial institutions increases compliance costs (because
banks must hire additional staff and spend more time dealing with new rules) and
technological investments, and decreases banking services and profits. Moreover, the
literature finds that regulatory burdens are disproportionally greater for small banks.
3.2. The economies of scale in banking industry
Between 1984 and 2008, the number of commercial banks in the US fell by
more than 50 percent, from 14,482 to 7,086. Despite this fall, the average size of a
commercial bank had increased five-fold in terms of total assets (Wheelock &
Wilson, 2012). Changes in regulation and advances in information technology
encouraged banks to grow large in order to exploit economies of scale (Berger &
Mester, 2003). Large banks exploit economies of scale because of the decline in unit
costs associated with increased bank size. A large bank can spread fixed costs over
more borrowers, which results in a lower cost per customer (Hein, Koch &
Macdonald, 2005). Theory also suggests banks should enjoy economies of scale
because the credit risk of their loans, their portfolio of their financial services, and the
liquidity risk of their deposits will grow more diverse as banks grow larger.
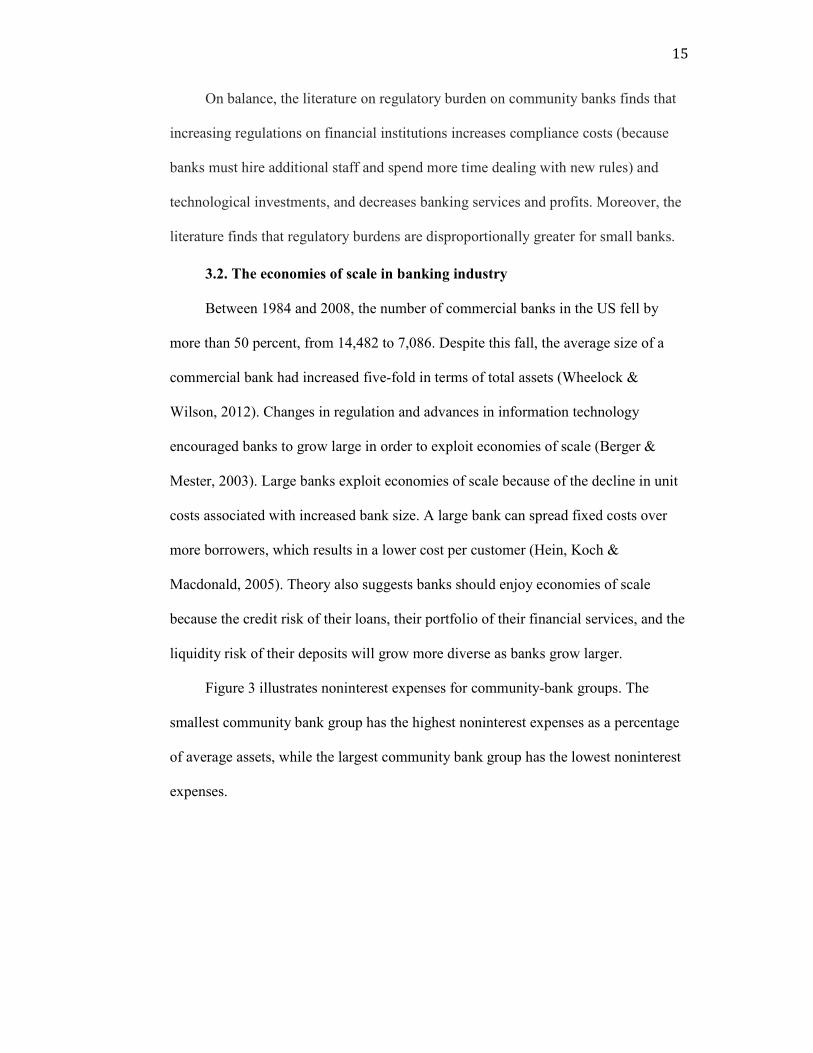
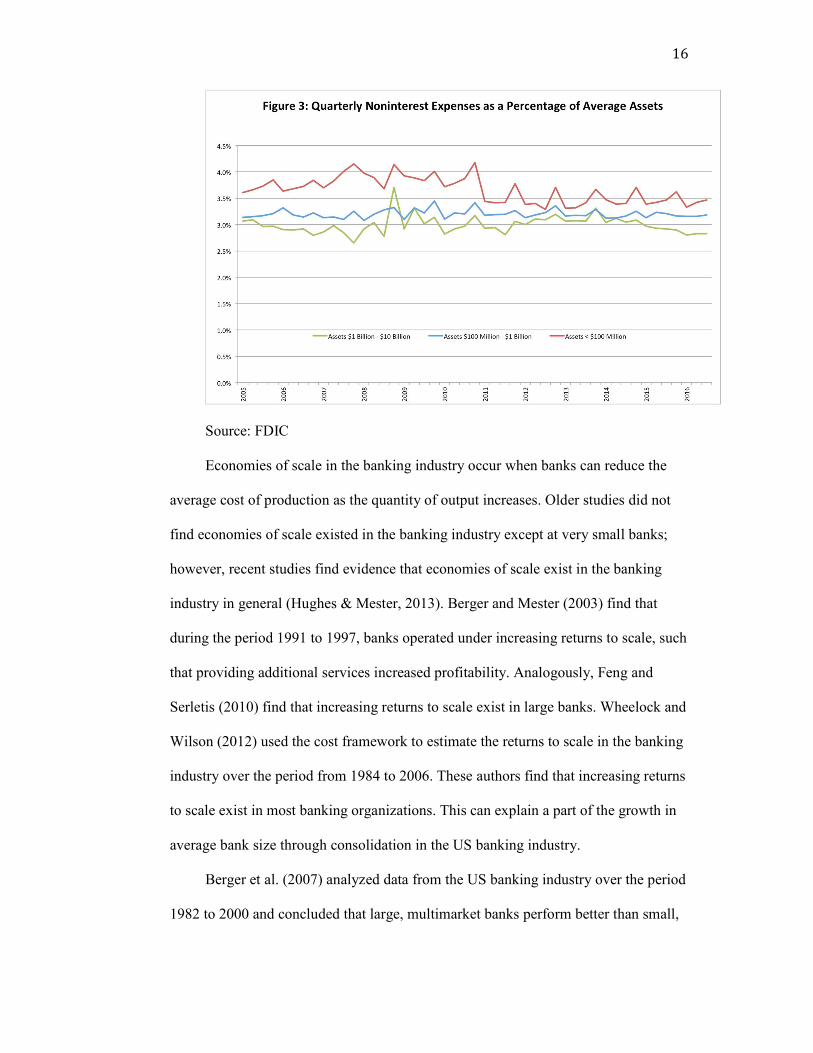
Figure 3 illustrates noninterest expenses for community-bank groups. The
smallest community bank group has the highest noninterest expenses as a percentage
of average assets, while the largest community bank group has the lowest noninterest
expenses.
16
Source: FDIC
Economies of scale in the banking industry occur when banks can reduce the
average cost of production as the quantity of output increases. Older studies did not
find economies of scale existed in the banking industry except at very small banks;
however, recent studies find evidence that economies of scale exist in the banking
industry in general (Hughes & Mester, 2013). Berger and Mester (2003) find that
during the period 1991 to 1997, banks operated under increasing returns to scale, such
that providing additional services increased profitability. Analogously, Feng and
Serletis (2010) find that increasing returns to scale exist in large banks. Wheelock and
Wilson (2012) used the cost framework to estimate the returns to scale in the banking
industry over the period from 1984 to 2006. These authors find that increasing returns
to scale exist in most banking organizations. This can explain a part of the growth in
average bank size through consolidation in the US banking industry.
Berger et al. (2007) analyzed data from the US banking industry over the period
1982 to 2000 and concluded that large, multimarket banks perform better than small,

17
single-market banks. Advances in technology make large, multimarket banks more
competitive relative to small, single-market banks.
Hughes and Mester (2013) analyzed 842 top-tier bank holding companies in the
US in 2007 and found that economies of scale increase with bank size. For instance, a
10 percent increase in output results in an 8.8 percent increase in costs for banks with
total assets less than $800 million; while a 10 percent increase in output results in a
7.5 percent increase in costs for banks with total assets over $100 billion.
3.3. The effects of the Dodd-Frank Act on community banks
The Dodd-Frank Wall Street Reform and Consumer Protection Act (Dodd-
Frank Act) was passed in July 2010 in response to the financial crisis of 2008. The
Dodd-Frank Act is an 849-page bill with 16 titles and more than 250 new rules that
span 11 agencies. The Act addresses many issues that policymakers reason
contributed to the financial crisis in 2008. The Dodd-Frank Act is perhaps the most
comprehensive financial regulatory reform of the twenty-first century. As the full title
of the Dodd-Frank Act reveals, the purpose of this Act is to “promote the financial
stability of the United States by improving accountability and transparency in the
financial system, to end ‘too big to fail’, to protect the American taxpayer by ending
bailouts, to protect consumers from abusive financial services practices, and for other
purposes.” By all accounts, the authors of the bill intended to target the largest
financial institutions, which were mainly responsible for the 2008 financial crisis and
which still pose systemic risks. Indeed, many of the provisions in the Dodd-Frank Act
apply to the largest and most complex financial institutions. The Dodd-Frank Act
creates new government agencies and authorizes agencies to adopt regulations to
implement provisions of the Act. It establishes the Financial Stability Oversight
Council (FSOC) to monitor the US financial system and to identify systemic risks.

18
The FSOC includes 10 voting members and 5 non-voting members and is chaired by
the Secretary of the Treasury. The FSOC collects information as well as monitors the
financial services marketplace to identify potential risks to the US financial system.
Additionally, the bill establishes the Office of Financial Research within the Treasury
Department to support the FSOC by improving the accessibility of financial data and
conducting research related to financial stability (GAO study, 2015). The Dodd-Frank
Act also creates the Consumer Financial Protection Bureau (CFPB) to supervise
banks, and large non-banks such as credit reporting agencies and debt collection
companies. The responsibilities of the CFPB include ensuring consumers are
provided clear information and protected from unfair, deceptive, or abusive practices,
monitoring compliance with federal consumer law, ensuring consumer financial law
is enforced appropriately and financial products and services are delivered
transparently and efficiently (GAO study, 2015). While community banks are not
examined by the CFPB, community banks are subject to the rules written by the
CFPB.
There is strong evidence that community banks did not cause the financial crisis
of 2008 (Marsh & Norman, 2013). Marsh and Norman (2013) reason that community
banks are not responsible for the financial crisis because these banks participated very
little, if at all, in the three main causes of the financial crisis as determined by authors
of the Dodd-Frank Act: namely, subprime lending, securitization, and derivative
trading. From January 2003 to September 2012, community banks held only 0.2
percent of total residential mortgages in default compared with 1.64 percent for all
institutions. Additionally, between 2003 and 2010, community banks participated in
only 0.07 percent of residential mortgage securitization activities and held only 0.003
percent of all credit derivatives held by all banking institutions.

19
The Council of Economic Advisers (2016) found that community banks remain
healthy and their services have grown in the years since the passage of the Dodd-
Frank Act. For example, the annual growth rate of lending by community banks
increased between 3 and 9 percent in 2015. Moreover, there is no evidence that the
Dodd-Frank Act resulted in a decline in access to banking services across counties;
indeed, the average number of branches per community bank has increased (Council
of Economic Adviser Issue Brief, 2016).
The Dodd-Frank Act exempts institutions with $10 billion or less in total assets;
thus, much of the Act is not intended to apply to community banks. Although
community banks are exempted from many of the Act’s rules, there remains much
debate over the regulatory burden the Act imposes—indirectly or otherwise—on
community banks. Regulations can burden community banks by increasing operating
and opportunity costs. Operating costs or compliance costs are the costs banks incur
when complying with regulation, while opportunity costs are the costs banks incur by
giving up business opportunities because of additional regulations. As Hoskins and
Labonte (2015) state in their study, banks face regulatory burdens from new
regulations because banks must train staff how to comply, spend more time reviewing
loan applications, and hire additional compliance officers.
Marty Reinhart, president of a $100 million community bank located in
Wisconsin said the following about the effect that new regulations have had on
residential mortgage lending:
Extra forms with early disclosures and having to register and finger print mortgage loan officers, adds to costs associated with this type of lending. It creates delays, additional cost and confusion on the part of the borrower. A typical mortgage file will have more than 100 pages by the time the loan is closed.

20
In Figure 4, I present the primary drivers of increased compliance costs
according to the 23rd real estate lending survey of the American Bankers Association
(ABA, 2016). Time allocation, technology costs, and loss of efficiency are three
primary factors that drive the increase in compliance costs. Besides those factors,
personnel costs, third-party vendor services, paperwork and complexity of disclosure,
loss of business lines, and increase in time between loan application and final loan
approval also drive the increase in compliance costs.
Source: ABA Real Estate Lending Survey, 2016 Community bank customers have had difficulties obtaining loans after the
passage of the Dodd-Frank Act because of mortgage related rules. According to a
survey of the Independent Community Bankers Association in 2014, 73 percent of
community bank members in the survey mention that regulations suppress mortgage
lending (Community Bank Lending Survey, 2014). The survey of the Mercatus
Center indicates 83 percent of small banks (those with less than $10 billion in assets)
21
report their compliance costs have increased more than 5 percent since the passage of
the Dodd-Frank Act (Peirce et al., 2014).
Chapter 4: DATA AND METHODOLOGY
4.1. Conceptual Framework
The notion that regulatory burden varies across bank size is based on the
principle of economies of scale: the average cost of a product or service falls as
production (and thus bank size) rises. In section 3.2, I document evidence of the
existence of economies of scale in the banking industry. Large banks benefit from
economies of scale because they can spread their fixed costs—including, perhaps
regulatory costs—across a large quantity of production, while small banks cannot do
the same; all else equal, this results in greater regulatory burden for smaller banks.
Regulatory-compliance costs are not matters of public record, because banks do
not separately report the non-interest expenses associated with their compliance
efforts. Nevertheless, if these efforts impose significant cost burdens (notably on
smaller banks), these burdens should be reflected in various financial-statement
measures of bank performance. I focus on four such conventional measures: namely,
loans per employee, salaries to assets, percentage change in number of employees,
and pre-tax returns on assets (Brewer and Russell, 2016; Cyree, 2015; GAO, 2015;
Kupiec and Lee, 2012).
Loans per employee is a measure of output that declines as banks’ regulatory
burden increases. If mortgage lending at small banks were affected by mortgage
related rules associated with the Dodd-Frank Act, these rules would likely increase
cost of originating loans; thus, the mortgage lending would decrease, all else equal
(GAO, 2015).
22
Salaries-to-assets is a measure of cost that increases as banks hire additional
employees or replace employees with higher-priced compliance specialists to deal
with changes in regulations. According to a GAO (2015) study, banks may hire
additional staff to deal with compliance issues. Similarly, Feldman et al. (2013) stated
that when new legislation is passed, banks might respond by hiring additional staff to
manage compliance with regulation. The change in the number of employees before
and after the passage of regulatory events reveals whether regulations increase the
regulatory burden on banks. The number of employees increases if regulations burden
banks.
Finally, to measure the effects of regulations on bank profitability, Brewer and
Russell (2016) use return on assets (ROA) as a dependent variable. However, other
studies suggest using pretax return on assets. According to Kupiec and Lee (2012),
the pretax return on assets is a useful measure with which to compare the profitability
of banks with similar business risk profiles. Additionally, pretax ROA is useful
because many banks are S Corporations and, thus, do not pay federal income taxes;
thus, pretax ROA is unaffected by whether and how banks are taxed (Cyree, 2015).
Pretax ROA decreases if regulations burden banks.
I model across banks and time the pattern of each performance measure as a
function of bank-specific observable variables, unobserved effects, and dummy
variables indicating the announcement or implementation dates associated with seven
Dodd-Frank rules—those I reason apply, intentionally or otherwise, to community
banks. More formally, I estimate a model that takes the general form specified in
Equation 1, where Yi,t is the performance measure for bank i at time t, Xi,t is a vector
of observable variables that vary across banks i, across time t, or some combination of
23
both banks and time, αi is the unobserved heterogeneity across banks, δk is the dummy
variable coefficient associated with rulek, and εi,t is the error term.
Yi ,t
= βXi ,t
+δ1rule
1+δ
2rule
2+ ...+α
i+ ε
i ,t (1)
I am primarily interested in the δ coefficients on the dummy variables rule1,
rule2, and so on. The model includes four dummy variables—namely, ORIGI,
DEBIT, ESCR and RULE—associated with seven final rules. I expect the
corresponding δ coefficients to be statistically significant and negative when Yi,t in
Equation 1 is loans per employee and pretax return on assets; and I expect the
corresponding δ coefficients to be statistically significant and positive when Yi,t is
percentage change in the number of employees and salaries to assets.
Mortgage and non-mortgage related rules associated with the Dodd-Frank Act
Based on a GAO (2015) study, a guide prepared by the American Bankers
Association (ABA; 2012) that identified 12 important issues of the Dodd-Frank Act,
real estate lending surveys from the ABA (2014, 2015, 2016), a survey by Peirce et al.
(2014), and a study of the Congressional Research Service (Hoskins & Labonte,
2015), I reason the following seven Dodd-Frank rules, each of which I briefly
describe, may have the largest impact on community banks.
Mortgage Related Rules
(1) Loan originator compensation requirements under the Truth in Lending
Act (Regulation Z), which was published on September 24th, 2010 and
became effective on April 1st, 2011.
The final rule implements additional requirements and restrictions imposed by
the Dodd-Frank Act concerning loan originator compensation, qualifications
of loan originators—loan originators are qualified when registered or licensed
24
to the extent required by State and Federal Law—and compliance procedures
for depository institutions. In addition, this final rule establishes tests to
determine when loan originators can be compensated.
(2) Escrow requirements for higher-priced mortgage loans (Regulation Z),
which was published on January 22nd, 2013 and became effective on June 1st,
2013.
The final rule requires creditors to establish and maintain an escrow account for
five years (instead of one year) for first-lien higher-priced mortgage loans. The
purpose of this final rule is to ensure that customers set aside funds to pay
property taxes, premiums for homeowners’ insurance, and other mortgage
related insurance required by the creditor. The final rule exempts small creditors
that operate predominately in rural or underserved areas and meet certain
criteria.
(3) Final rule requiring appraisals for higher-priced mortgage loans
(Regulation Z), which was published on February 13th, 2013 and became
effective on January 18th, 2014.
The final rule requires creditors to obtain appraisals meeting certain standards
for mortgages that have an annual percentage rate that exceeds the average
prime offer rate. The borrower must be provided a statement regarding the
purpose of the appraisal and, within 3 business days before the mortgage is
final, a free copy of the appraisal.
25
(4) Mortgage servicing rules under the Real Estate Settlement Procedures Act
(Regulation X) and Truth Lending Act (Regulation Z), which was published on
July 24th, 2013 and became effective on January 10th, 2014.
The final rule implements provisions of the Dodd-Frank Act regarding
mortgage loan servicing, addresses the mortgage servicer’s obligation to correct
errors asserted by borrowers and provide information requested by these
borrowers, provides borrowers with information about loss mitigation options,
establishes policies and procedures for continuing contact between servicer
personnel and borrowers, and protects borrowers connected with force-placed
insurance.
(5) The Ability-to-Repay and Qualified Mortgage Standard under the Truth in
Lending Act (Regulation Z), which was published on January 30th, 2013 and
became effective on January 10th, 2014.
The Ability-to-Repay and Qualified Mortgage Rule require lenders to make a
good faith determination that the borrower has the ability to pay back a loan.
The creditor must consider several underwriting factors such as the borrower’s
current employment status, debt to income ratio, assets, and credit history in
order to determine the borrower’s ability to repay. Creditors are also required to
make qualified mortgage loans, which must meet further underwriting and
pricing standards and comply with the ability to repay. A qualified mortgage
loan requires that a borrower’s debt-to-income ratio does not exceed 43 percent.

26
Effects of mortgage-related rules on community banks
Representatives from the Independent Community Bankers of America
indicated that community banks do not have appropriate technology and staff to
support these mortgage rules that the Dodd-Frank Act imposes. According to the 22nd
annual ABA real estate lending survey (2015), 63 percent of respondents reported that
they did not provide escrow services due to the lack of escrow capabilities and
adequate staff, 17 percent of respondents reported they did not provide escrow
services due to the lack of third-party service providers.
According to Marsh and Norman (2013), a customer of a community bank
will have greater difficulty obtaining a loan because the mortgage related rules
encourage financial product standardization. When products and services become
more standardized, the traditional community bank model becomes less effective.
Officers, who once relied on soft information and strong relationships with consumers
to make lending decisions, now must operate differently; consequently, these
relationship lenders may offer fewer loans.
To comply with new regulatory rules, community banks also must update
technology and hire additional compliance staff, both of which impose a relatively
large regulatory burden on community banks. According to Pierce et al. (2014), banks
have discontinued or plan to discontinue products such as residential mortgages,
mortgage servicing, and home equity lines of credit as a result of the Dodd-Frank Act.
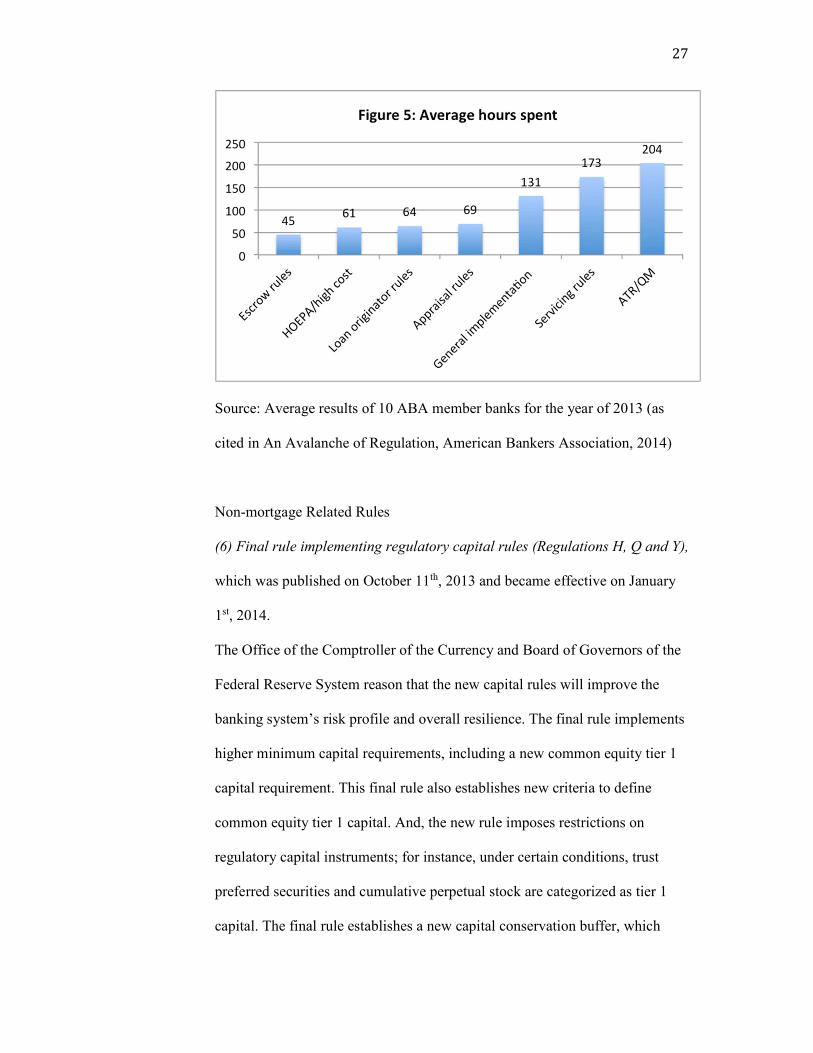
Figure 5 presents average hours banks spent in 2013 on regulatory rules.
Every additional hour that an employee spends dealing with compliance is an hour
that she cannot serve the bank’s local community.
27
Source: Average results of 10 ABA member banks for the year of 2013 (as
cited in An Avalanche of Regulation, American Bankers Association, 2014)
Non-mortgage Related Rules
(6) Final rule implementing regulatory capital rules (Regulations H, Q and Y),
which was published on October 11th, 2013 and became effective on January
1st, 2014.
The Office of the Comptroller of the Currency and Board of Governors of the
Federal Reserve System reason that the new capital rules will improve the
banking system’s risk profile and overall resilience. The final rule implements
higher minimum capital requirements, including a new common equity tier 1
capital requirement. This final rule also establishes new criteria to define
common equity tier 1 capital. And, the new rule imposes restrictions on
regulatory capital instruments; for instance, under certain conditions, trust
preferred securities and cumulative perpetual stock are categorized as tier 1
capital. The final rule establishes a new capital conservation buffer, which
28
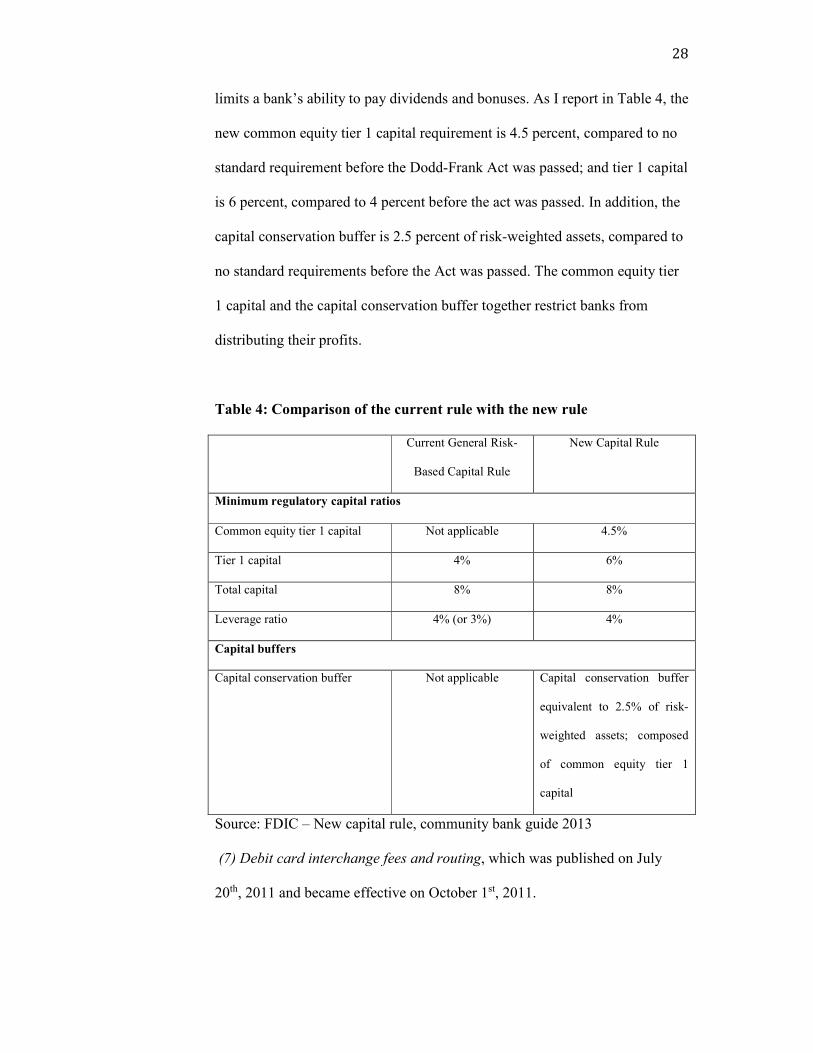
limits a bank’s ability to pay dividends and bonuses. As I report in Table 4, the
new common equity tier 1 capital requirement is 4.5 percent, compared to no
standard requirement before the Dodd-Frank Act was passed; and tier 1 capital
is 6 percent, compared to 4 percent before the act was passed. In addition, the
capital conservation buffer is 2.5 percent of risk-weighted assets, compared to
no standard requirements before the Act was passed. The common equity tier
1 capital and the capital conservation buffer together restrict banks from
distributing their profits.
Table 4: Comparison of the current rule with the new rule
Current General Risk-
Based Capital Rule
New Capital Rule
Minimum regulatory capital ratios
Common equity tier 1 capital Not applicable 4.5%
Tier 1 capital 4% 6%
Total capital 8% 8%
Leverage ratio 4% (or 3%) 4%
Capital buffers
Capital conservation buffer Not applicable Capital conservation buffer
equivalent to 2.5% of risk-
weighted assets; composed
of common equity tier 1
capital
Source: FDIC – New capital rule, community bank guide 2013
(7) Debit card interchange fees and routing, which was published on July
20th, 2011 and became effective on October 1st, 2011.
29
The final rule states that the amount of any interchange transaction fee that
issuers charge related to a debit card transaction must be reasonable and
proportional to the cost issuers incur on that transaction. A debit card issuer
may not charge or receive a transaction fee that exceeds the sum of a 21-cent
base component and 5 basis points of the transaction’s value. This transaction
fee standard does not apply to banks with less than $10 billion in total assets;
however, because community banks must compete with larger issuers,
community banks must accept a lower interchange fee or pass this fee to
customers in other forms of fees, resulting in a decline of debit card revenue.
In addition, the final rule prohibits issuers and payment card networks from
restricting the number of networks through which a debit card transaction can
be processed. This component of the final rule does not exempt community
banks.
Effect of non-mortgage related rules on community banks
Community banks were not required to comply with the new minimum capital
requirements until January 1st, 2015, while the capital conservation buffer and the
criteria to consider common equity tier 1 capital phase in over time. Thus,
community banks have had some time to adapt to the new capital requirements rule.
In any case, community banks must revise call report schedules and train their staff to
comply with the new rule. In the survey of the Mercatus Center, 59.5 percent of
participants report they will increase their tier 1 capital ratio in the next five years,
26.8 percent of participants report their tier 1 capital ratio will remain the same, and
7.4 percent of participants report they will decrease their tier 1 capital ratio (Pierce et
al., 2014). According to the Congressional Research Service, 146 banks with less than
$500 million in total assets faced a capital shortfall of $620 million and lost tax
30
benefits totaling $3.4 million per year (Hoskins & Labonte, 2015). Pasiouras et al.
(2009) found that higher capital requirements negatively affected cost efficiency and
profits of banks.
Although community banks are exempted from the interchange fee standard
rule, they are not exempted from network exclusivity prohibitions. Many parties raise
concerns that prohibitions on network exclusivity will impose costs on small debit
card issuers. Before the final rule goes into effect, some debit card issuers may
provide debit cards that can process electronic debit transactions over two unaffiliated
payment card networks, so these issuers may not incur costs to add additional
unaffiliated payment card networks. However, for other debit card issuers, who do not
have debit cards that can process electronic debit transactions over two unaffiliated
payment card networks, they may incur costs to add additional unaffiliated payment
card networks to comply with network exclusivity prohibitions. According to a survey
of the Board of Governors of the Federal Reserve System (2013), 16 percent of
respondents reported their need to add additional networks to meet the prohibition on
network exclusivity. Costs to add a second network range from $0 to $3.47 per card.
In addition, the debit card interchange fees and routing rule affect exempt-issuers’
interchange fees and revenue. In 2009, interchange fees for all debit card issuers was
43 cents on average. Average interchange fees per debit card transaction for exempt
issuers was 44 cents for the first three quarters of 2011, and fell to 43 cents since the
interchange fee standard went into effect. Thus, although the debit card interchange
fees and routing rule statutorily exempted banks with total assets less than $10 billion,
these banks were affected by this rule nonetheless.

31
4.2. Data
The data I analyze are from the Consolidated Financial Statements for Holding
Companies (FR-Y9C) reports, which I obtain from the Federal Reserve Bank of
Chicago website. The original dataset for bank holding companies from 1991 to 2016
Q4 includes 384,767 observations. I exclude any observations with missing values for
total assets (BHCK2170) because if an observation is missing total assets, then other
variables are also missing. I also exclude banks that have fewer than six quarterly
reports. Finally, I eliminate any observations that include extreme values of the
dependent variables. The final dataset includes more than 135,000 observations for
the period from 1991 to 2016 Q4. This is an unbalanced panel because, over time,
banks might enter or exist because, for example, they are acquired or they fail.
Because the Consolidated Income Statement in FR-Y9C reports is on a calendar year-
to-date basis, I must annually adjust (flow) variables for incomes and expenses in
each quarter. These variables include net interest income, income from fiduciary
activities, income (or loss) before applicable income taxes and discontinued
operations, salaries, and employee benefits. For these variables, I multiply Q1 values
time 4, Q2 values time 2, and Q3 values time 4/3.
Following Cyree (2015), I divide the sample into 5 groups based on each
institution’s asset size: Group-1 banks include the largest banks with total assets
greater than $50 billion, Group-2 banks include larger banks with total assets from
$10 to $50 billion, Group-3 banks include banks with total assets from $5 to $10
billion, Group-4 banks include banks with total assets from $1 to $5 billion, and
Group-5 banks include banks with total assets less than $1 billion.
To begin, I report summary statistics and discuss the results presented in Cyree
(2015), who estimates the regulatory burden on loan-per-employee and other such
32
dependent variables of seven pieces of noteworthy financial regulation; namely, the
Federal Deposit Insurance Improvement Act (FDICIA), the Interstate Branching and
Banking Efficiency Act (IBBEA), the IBBEA Interstate Banking and Branching
Provision went into effect (IBBEA2), the Gramm-Leach-Bliley Act (GLBA), the
Providing Appropriate Tools Required to Intercept and Obstruct Terrorism Act of
2001 (PATRIOT), the Dodd-Frank Act (DFA) (in its entirety), and the Ability-to-
Repay and Qualified Mortgage (ATR). Then, to add to this literature, I estimate the
effects of seven final rules associated with the Dodd-Frank Act.
4.3. Regression Model and Variables
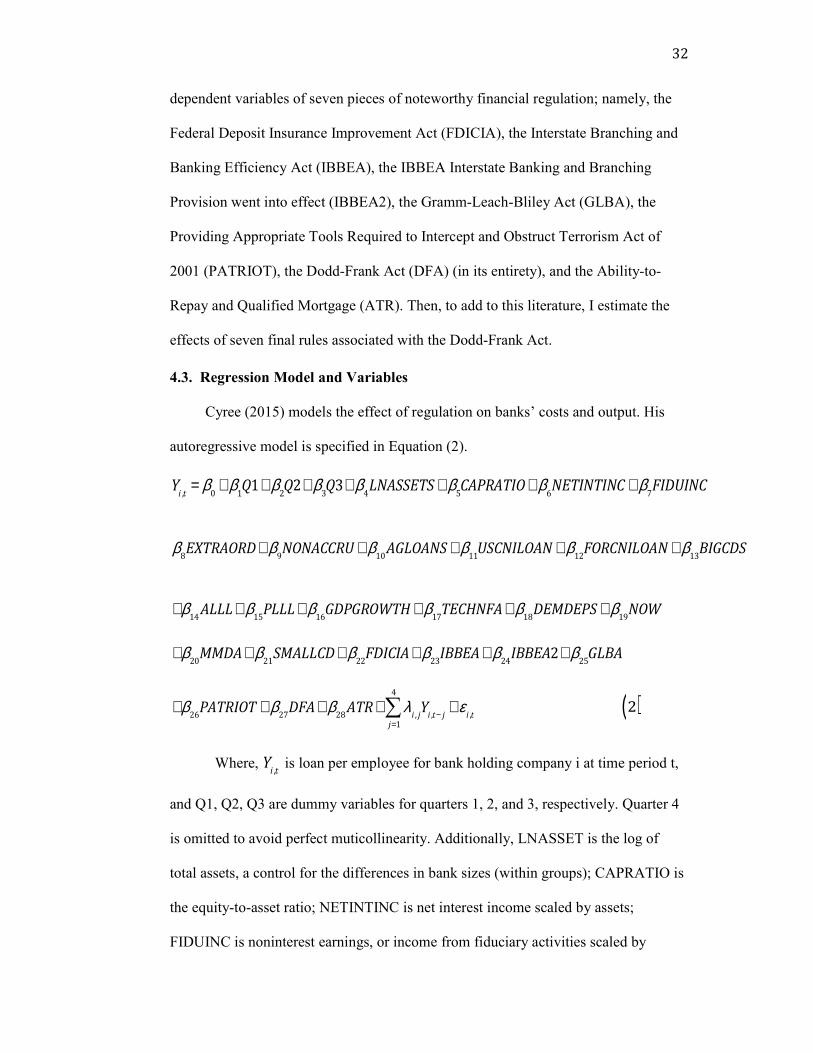
Cyree (2015) models the effect of regulation on banks’ costs and output. His
autoregressive model is specified in Equation (2).
Yi ,t
= β0
+ β1Q1+ β
2Q2+ β
3Q3+ β
4LNASSETS + β
5CAPRATIO+ β
6NETINTINC + β
7FIDUINC
β
8EXTRAORD+ β
9NONACCRU + β
10AGLOANS + β
11USCNILOAN + β
12FORCNILOAN + β
13BIGCDS
+β
14ALLL+ β
15PLLL+ β
16GDPGROWTH + β
17TECHNFA+ β
18DEMDEPS + β
19NOW
+β
20MMDA+ β
21SMALLCD+ β
22FDICIA+ β
23IBBEA+ β
24IBBEA2+ β
25GLBA
+β26PATRIOT + β
27DFA+ β
28ATR+ λ
i , jj=1
4
∑ Yi ,t− j + ε
i ,t
2( )
Where,
Yi ,t
is loan per employee for bank holding company i at time period t,
and Q1, Q2, Q3 are dummy variables for quarters 1, 2, and 3, respectively. Quarter 4
is omitted to avoid perfect muticollinearity. Additionally, LNASSET is the log of
total assets, a control for the differences in bank sizes (within groups); CAPRATIO is
the equity-to-asset ratio; NETINTINC is net interest income scaled by assets;
FIDUINC is noninterest earnings, or income from fiduciary activities scaled by
33
assets; EXTRAORD is extra-ordinary income scaled by assets; NONACCRU is loans
not accruing interest scaled by assets; AGLOANS is loans to finance agricultural
production and other loans to farmers scaled by assets; USCNILOAN is US
commercial and industrial loans scaled by assets; FORCNILOAN is foreign
commercial and industrial loans scaled by assets; BIGCDS is time deposits of
$100,000 or more scaled by assets; ALLL is the allowance for loan and lease losses
scaled by assets; PLLL is the provision for loan and lease losses scaled by assets;
GDPGROWTH is the annualized quarterly growth rate of US gross domestic product;
DEMDEPS is noninterest-bearing balances, including demand, time, and saving
deposits; TECHNFA is expenses of premises and fixed assets scaled by assets; NOW
is interest-bearing deposits, including NOW, ATS, and other transaction accounts,
scaled by assets; MMDA is money market deposit accounts and other saving accounts
scaled by assets; SMALLCD is time deposits of less than $100,000 scaled by assets.
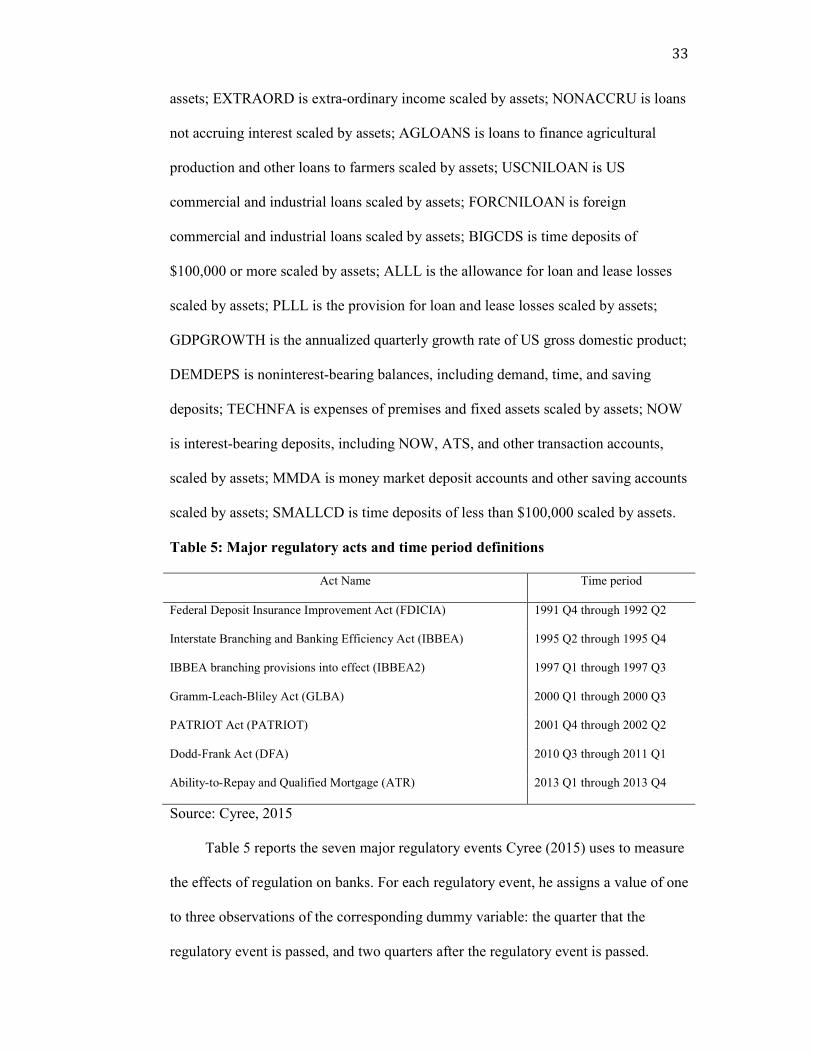
Table 5: Major regulatory acts and time period definitions
Act Name Time period
Federal Deposit Insurance Improvement Act (FDICIA) 1991 Q4 through 1992 Q2
Interstate Branching and Banking Efficiency Act (IBBEA) 1995 Q2 through 1995 Q4
IBBEA branching provisions into effect (IBBEA2) 1997 Q1 through 1997 Q3
Gramm-Leach-Bliley Act (GLBA) 2000 Q1 through 2000 Q3
PATRIOT Act (PATRIOT) 2001 Q4 through 2002 Q2
Dodd-Frank Act (DFA) 2010 Q3 through 2011 Q1
Ability-to-Repay and Qualified Mortgage (ATR) 2013 Q1 through 2013 Q4
Source: Cyree, 2015
Table 5 reports the seven major regulatory events Cyree (2015) uses to measure
the effects of regulation on banks. For each regulatory event, he assigns a value of one
to three observations of the corresponding dummy variable: the quarter that the
regulatory event is passed, and two quarters after the regulatory event is passed.

34
According to Cyree (2015), the independent variable for the Federal Deposit
Insurance Corporation Improvement Act (FDICIA) takes a value of 1 for the time
period 1991 Q4 through 1992 Q2 and 0 otherwise; the variable for the Interstate
Branching and Bank Efficiency Act (IBBEA) takes a value of 1 for the time period
1995 Q2 through 1995 Q4 and 0 otherwise; the variable for the IBBEA2, which
indicates when the branching provision goes into effect, takes a value of 1 for the time
period 1997 Q1 through 1997 Q3 and 0 otherwise; the variable for the Gramm-Leach-
Bliley Act (GLBA) takes a value of 1 for the time period 2000 Q1 through 2000 Q3
and 0 otherwise; the variable for the Providing Appropriate Tools Required to
Intercept and Obstruct Terrorism Act (PATRIOT) takes a value of 1 for the time
period 2001 Q4 through 2002 Q2 and 0 otherwise; the variable for the Dodd-Frank
Wall Street Reform and Consumer Protection Act (DFA) takes a value of 1 for the
time period 2010 Q3 through 2011 Q1 and 0 otherwise; and the variable for the
Ability-to-Repay and Qualified Mortgages (ATR) takes a value of 1 for the time
period 2013 Q1 through 2013 Q4 and 0 otherwise.
Effects of mortgage and non-mortgage related rules on community banks
Similar to Cyree’s model in Equation (2), my model of effects of final rules on
banks’ costs and output is specified in Equation (3), where I replace broad financial
legislation by specific final rules. I omit the variable (EXTRAORD), which captures
merger activity, branch sales, or other (rare) non-reoccurring events1.
Yi ,t
= β0
+ β1Q1+ β
2Q2+ β
3Q3+ β
4LNASSETS + β
5CAPRATIO+ β
6NETINTINC + β
7FIDUINC
+β
8NONACCRU + β
9AGLOANS + β
10USCNILOAN + β
11FORCNILOAN + β
12BIGCDS
1 Cyree uses this variable as a control variable to account for large and unusual events. I omit this
variable due to the lack of data.

35
+β
13ALLL+ β
14PLLL+ β
15GDPGROWTH + β
16TECHNFA+ β
17DEMDEPS + β
18NOW
β19MMDA+ β
20SMALLCD+ β
21ORIGI + β
22ESCR+ β
23RULE + β
24DEBIT + λ
i , jj=1
k
∑ Yi ,t− j + ε
i ,t3( )
Table 6: Final rules and time period definition
Final Rule Implementation
Loan originator compensation requirements (ORIGI)
Debit card interchange fees and routing (DEBIT)
2011 Q2 through 2011 Q4
2011 Q4 through 2012 Q2
Escrow requirements for higher-priced mortgage loans (ESCR) 2013 Q2 through 2013 Q4
Final rule requiring appraisals for higher-priced mortgage
(RULE)
2014 Q1 through 2014 Q3
Mortgage servicing rules (RULE) 2014 Q1 through 2014 Q3
The Ability-to-Repay and Qualified Mortgage Standard (RULE) 2014 Q1 through 2014 Q3
Final rule implementing regulatory capital rules (RULE) 2014 Q1 through 2014 Q3
Table 6 reports seven final rules—mortgage and non-mortgage related
associated with the Dodd-Frank Act—that may have large impact on community
banks. For each rule, I assign a value of one to three observations of the
corresponding dummy variable: the quarter that the rule became effective, and two
quarters immediately afterwards.
The independent variable for loan originator compensation requirements
(ORIGI) takes a value of 1 for the time period from 2011 Q2 through 2011 Q4 and 0
otherwise; the variable for the Escrow requirements for higher-priced mortgage loans
(ESCR) takes a value of 1 for the time period from 2013 Q2 through 2013 Q4 and 0
otherwise; the variable for the group of mortgaged-related rules (RULE) takes a value
of 1 for the time period from 2014 Q1 through 2014 Q3 and 0 otherwise; the variable
36
for debit card interchange fees and routing (DEBIT) takes a value of 1 for the time
period from 2011 Q4 through 2012 Q2 and 0 otherwise.
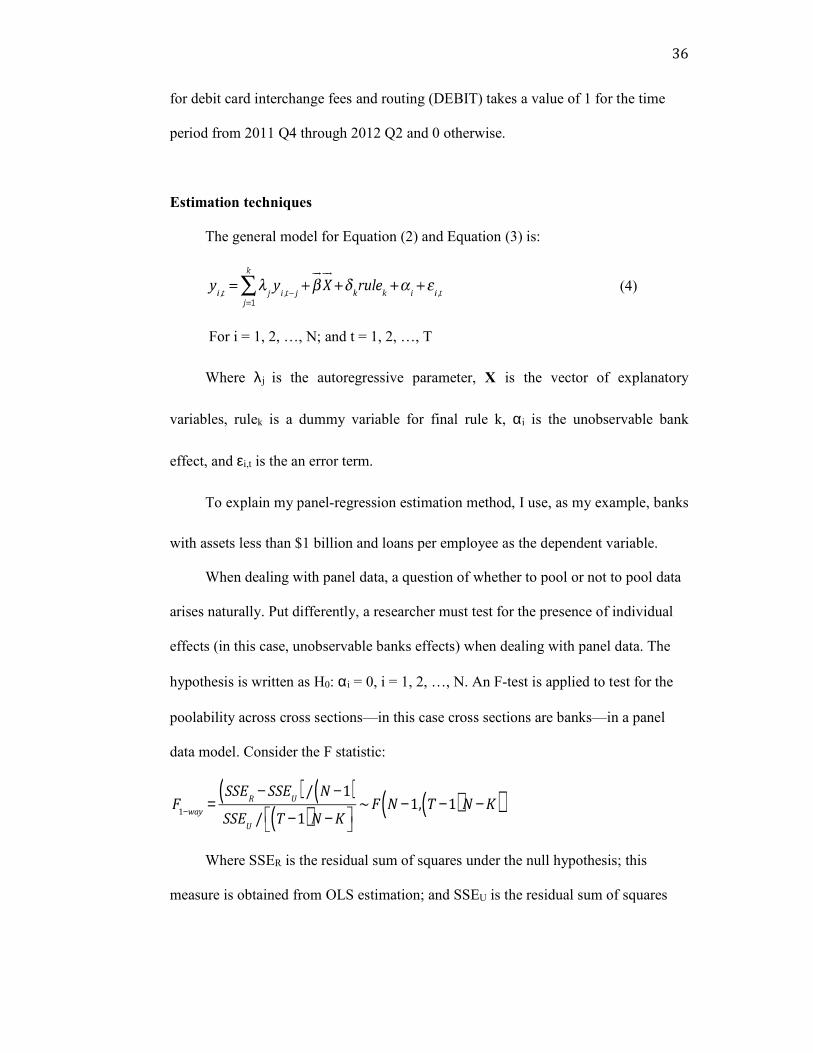
Estimation techniques
The general model for Equation (2) and Equation (3) is:
(4)
For i = 1, 2, …, N; and t = 1, 2, …, T
Where λj is the autoregressive parameter, X is the vector of explanatory
variables, rulek is a dummy variable for final rule k, αi is the unobservable bank
effect, and εi,t is the an error term.
To explain my panel-regression estimation method, I use, as my example, banks
with assets less than $1 billion and loans per employee as the dependent variable.
When dealing with panel data, a question of whether to pool or not to pool data
arises naturally. Put differently, a researcher must test for the presence of individual
effects (in this case, unobservable banks effects) when dealing with panel data. The
hypothesis is written as H0: αi = 0, i = 1, 2, …, N. An F-test is applied to test for the
poolability across cross sections—in this case cross sections are banks—in a panel
data model. Consider the F statistic:
F1−way =
SSER
− SSEU( ) / N −1( )
SSEU
/ T −1( )N −K
~F N −1, T −1( )N −K( )
Where SSER is the residual sum of squares under the null hypothesis; this
measure is obtained from OLS estimation; and SSEU is the residual sum of squares

37
under the alternative hypothesis; this measure is obtained from fixed effects
estimation (Kunst, 2009).
For banks with total assets less than $1 billion, the F-test statistic for poolability
across banks is F-test = 153.75, which corresponds to a p-value < 0.05; thus, in this
case, I reject the null hypothesis at the 5 percent level of significance and I determine
that the fixed effect model is favorable.
Next, I use the Hausman test for a random effects model. The Hausman test
statistic is constructed based on q = βRE - βFE. Where βRE is the coefficient obtained
from random effects estimation; and βFE is coefficient obtained from fixed effects
estimation. Hausman (1978) suggested comparing the βRE and βFE under the null
hypothesis of no correlation; there should be no difference between βRE and βFE if the
random effects model is favorable. Consider the Hausman test statistic: m =
q′[var(q)]-1q, where var(q) = var(βFE) – var(βRE) (Baltagi, 2013, p. 76-77). The
Hausman-test statistic for banks with total assets less than $1 billion is 3110.06,
which corresponds to a p-value < 0.05; thus, in this case, I reject the null hypothesis at
the 5 percent level of significance and I determine that the fixed effects model is
favorable.
Thus far, the F and Hausman tests imply that the fixed effects model is most
favorable. Finally, I use the Durbin-Watson test to test for first-order correlation in a
fixed effects model as Bhargava, Franzini and Narendranathan (1982) instruct;
specifically, I test the null hypothesis H0: λ= 0 against the alternative hypothesis
H1:λ < 1. For large N, there is no need to compute the upper bound and lower
bound. Instead, I compare whether the Durbin-Watson statistic test is less than 2
(Baltagi, 2013, p. 109-110). For banks with less than $1 billion in assets, the DW-test
test statistic is 0.38, which is very far from 2; thus, I reject the null hypothesis and
38
determine that first-order serial correlation is present in the fixed effects model. Thus,
in this case, I estimate a fixed effects model with one autoregressive lag, which I
specified in Equation 5 below.
(5)
I use the GMM two step methodology to estimate equation (5), as Arellano and
Bond (1991) suggest.
I perform these diagnostic tests for the other four groups of banks and for the
other three dependent variables. The Hausman test and F-test for other bank groups
imply that the fixed effects model is most favorable, and the Durbin-Watson test for
first-order correlation in a fixed effect model implies that first-order serial correlation
is present in all these fixed effects models except the one in which the change in
number of employees is the dependent variable. In this case, the Durbin-Watson test
for first-order correlation implies that there is no autocorrelation.
Chapter 5: EMPIRICAL RESULTS
5.1. Descriptive Statistics
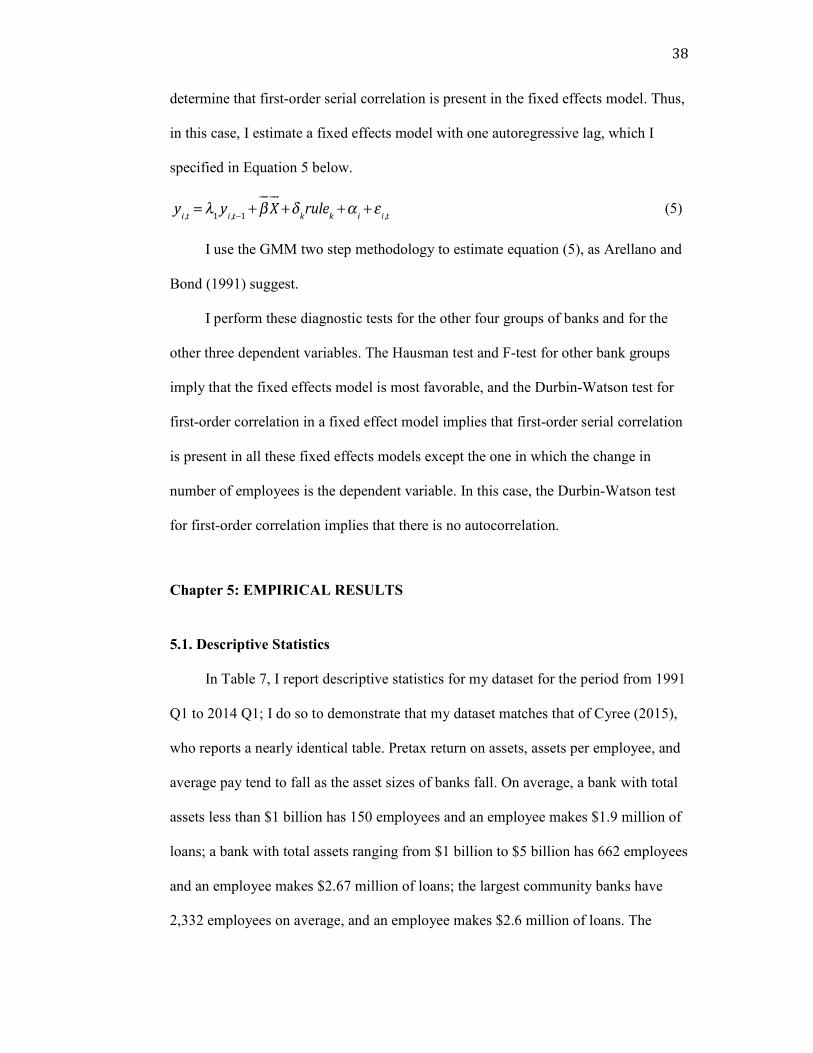
In Table 7, I report descriptive statistics for my dataset for the period from 1991
Q1 to 2014 Q1; I do so to demonstrate that my dataset matches that of Cyree (2015),
who reports a nearly identical table. Pretax return on assets, assets per employee, and
average pay tend to fall as the asset sizes of banks fall. On average, a bank with total
assets less than $1 billion has 150 employees and an employee makes $1.9 million of
loans; a bank with total assets ranging from $1 billion to $5 billion has 662 employees
and an employee makes $2.67 million of loans; the largest community banks have
2,332 employees on average, and an employee makes $2.6 million of loans. The

39
largest banks have 49,926 employees on average; however, an employee only makes
$2.89 million of loans, which indicates that largest banks earn most revenue from
non-traditional banking activities.
As I indicated above, Cyree (2015) measures costs and productivity for the
banking industry around seven major regulatory events from 1991 to 2014 Q1. He
uses pooled OLS regression to estimate the autoregressive model corresponding to
Equation (2). In doing so, he concludes there are varied effects of these seven
regulatory changes on banks. Pretax return on assets increases for all five groups of
banks after the passage of the PATRIOT Act, but pretax return on assets decreases for
Group-4 and Group-5 banks during the rulemaking period of the Dodd-Frank Act
(Ability to Repay and Qualified Mortgage period—ATR) from 2013 Q1 through 2013
Q4. Loans per employee decrease for all five groups of banks after the passage of
FDICIA and PATRIOT Acts; but, loans per employee increase for all five groups of
banks during the rulemaking period of the Dodd-Frank Act and increase for Group-2,
Group-4, and Group-5 banks after the passage of the Dodd-Frank Act. Percentage
change in number of employees decreases for all five groups of banks after the
passage of the Gramm Leach Bliley Act, and decreases for the two smallest
community-bank groups during the rulemaking period of the Dodd-Frank Act.
Salaries to assets for four out of five groups of banks increase during the rulemaking
period of the Dodd-Frank Act (because, according to Cyree (2015), banks replaced
current employees with higher paid and more productive employees). For the sake of
comparison, I return to these results below, where I discuss my findings.
40
Table 7: Means of selected variables
Variable Assets > $50 Billion (N= 2,729)
Assets $10 - $50 Billion (N=5,231)
Assets $5 - $10 Billion (N=4,654)
Assets $1 - $5 Billion (N=25,060)
Assets < $1 Billion (N= 101,043)
SAL2ASST 0.0161 0.0171 0.0174 0.0168 0.0171
PREROA 0.0145 0.0155 0.0155 0.0124 0.0131
ASSTPEREMP 7.0603 4.9861 4.2717 4.1678 2.9670
LOANPEREMPL 2.8916 3.2539 2.6033 2.6728 1.9017
TECHNFA 2.5295 2.9565 2.9024 2.8208 2.8532
NUMEMP 49,926.25 7,072.22 2,332.54 662.24 150.88
TOTASSET 275,662,095 21,915,313.51 7,031,041.84 2,046,377.09 384,749.69
AVGPAY 93.15 60.35 59.10 58.64 46.45
Assets per employee, loans per employee and technical expenses are in millions of dollars; total assets and average pay are in thousand of
dollars.
41
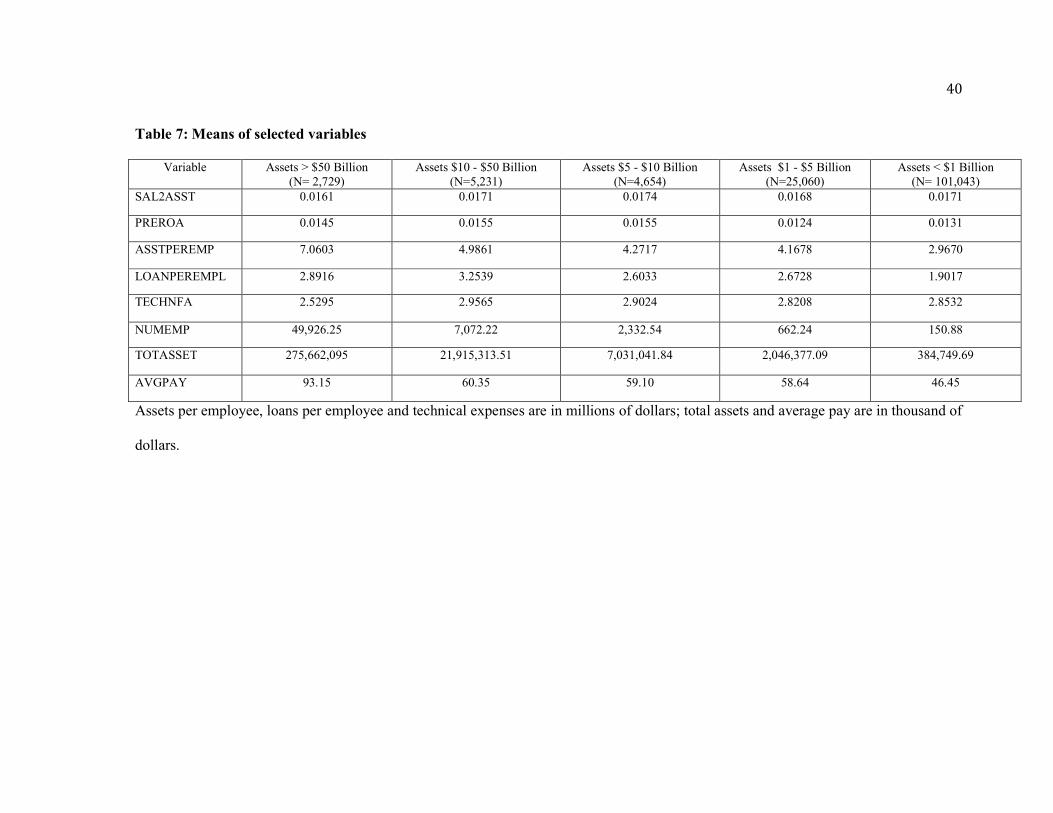
Figures 6 and 7 illustrate the averages of total assets of banks across the five
groups from 1991 to 2016. Over this period, total assets for the smallest community
banks (Group-3 banks) and the largest community banks (Group-5 banks) trended
upward on average. The average of total assets of Group-5 banks was $255.697
million in 1991 and three-times larger in 2016; over the same period, the average of
total assets of Group-3 banks was $6,805 million in 1991 and $7,467 million in 2016.
Meanwhile, the average of total assets of Group-1 banks increased more than 4 times,
from $94,435 million in 1991 to $394,889 million in 2016.

42
Figure 8 illustrates pretax returns on assets across the five groups of banks from
1991 to 2016. Overall, in terms of profitability, large banks have outperformed
community banks. From 1991 to 2007, average pretax return on assets was 1.45
percent for Group-5 banks, 1.57 percent for Group-4 banks, and 1.83 percent for
Group-3 banks. From 2008 to 2010, average pretax return on assets for all bank
groups dropped dramatically and turned negative in 2009. This return improved after
the financial crisis, when average annual growth rates were 0.88 percent for Group-5
banks, 1.07 percent for Group-4 banks, and 1.33 percent for Group-3 banks. Among
these community-bank groups, Group-3 banks—those with total assets between $5
billion to $10 billion—had the highest pretax return on assets. Banks in this group
also performed best during the crisis.

43
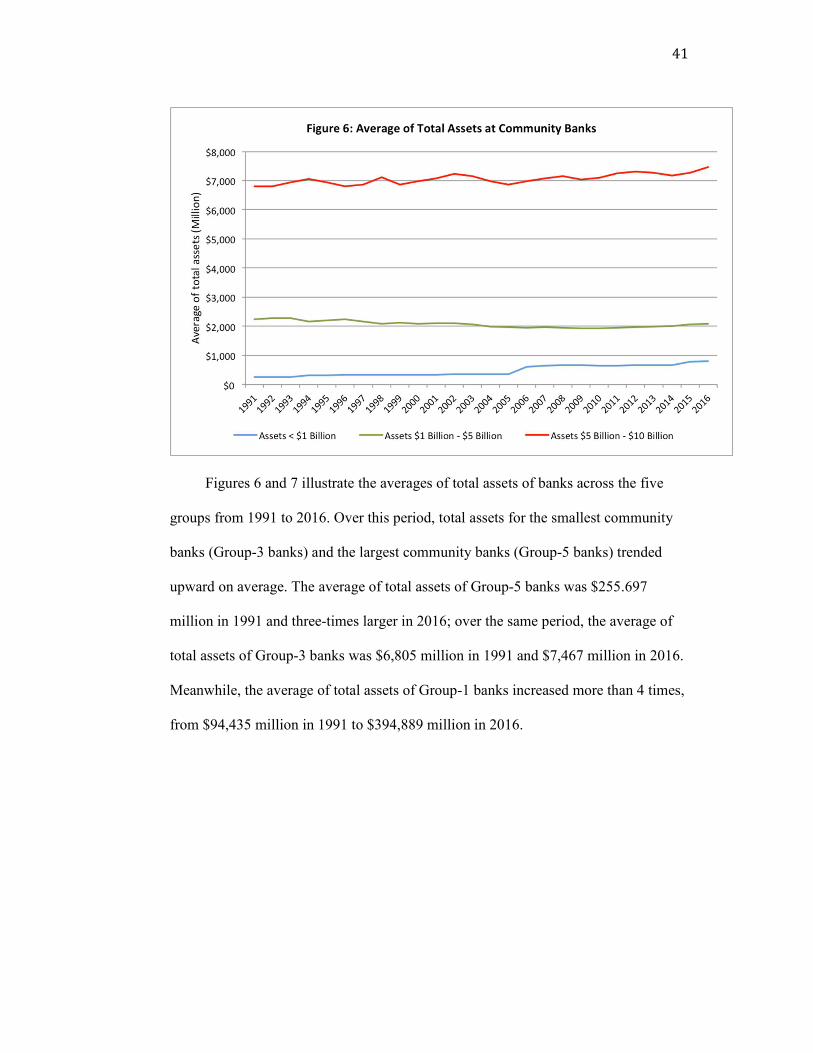
Figures 9 and 10 illustrate the average number of employees of banks across the
five groups from 1991 to 2016. The average of number of employees tended to
decrease for Group-2, Group-3, and Group-4 banks. When mortgage and non-
mortgage related rules went into effect from 2011 to 2014, the average number of
employees tended to increase for Group-3 banks. The average number of employees
for Group-5 banks increased since mid 2013, during and after the mortgage related
rules went into effect. The average number of employees tended to increase for
Group-1 banks, and this group of banks had an increase in average number of
employees in 2010 and 2011, around the time the Dodd-Frank Act was passed.
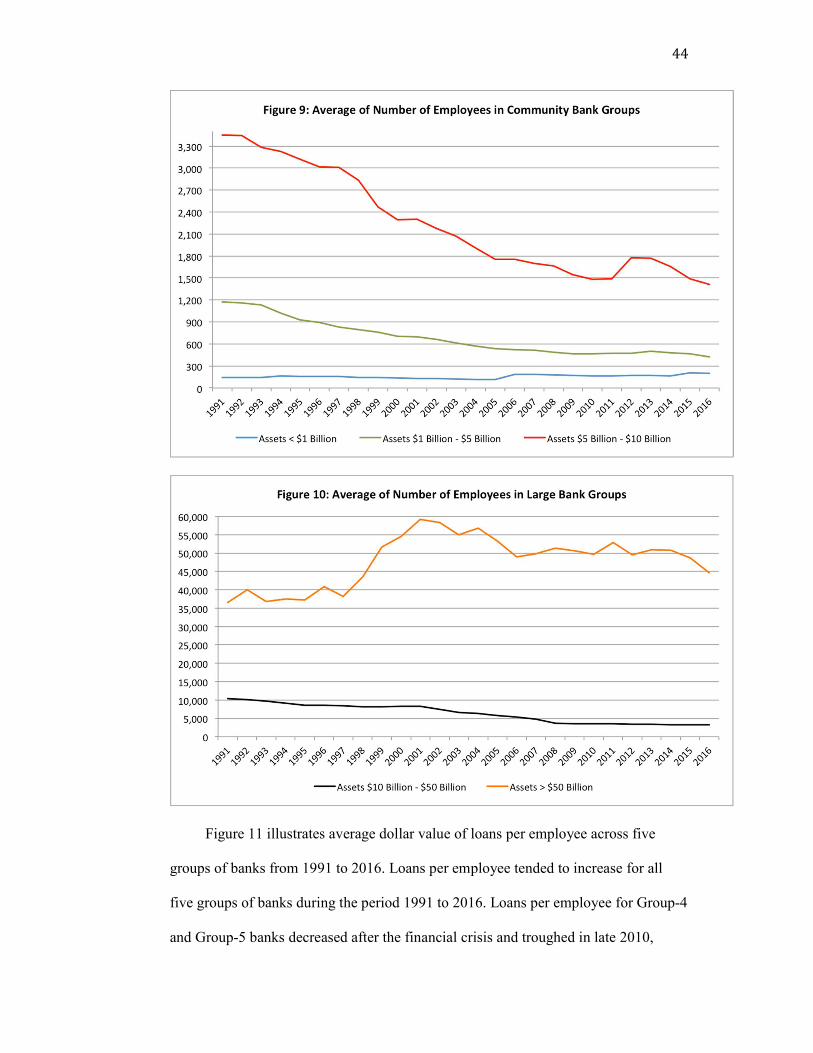
44
Figure 11 illustrates average dollar value of loans per employee across five
groups of banks from 1991 to 2016. Loans per employee tended to increase for all
five groups of banks during the period 1991 to 2016. Loans per employee for Group-4
and Group-5 banks decreased after the financial crisis and troughed in late 2010,

45
around the time the Dodd-Frank Act was passed. Loans per employee for Group-3
banks tended to increase before the crisis, remained steady during crisis and when the
Dodd-Frank Act was passed.
46
Figure 12 illustrates salaries as a percentage of assets across the five groups of
banks. Salaries to assets for the three groups of community banks increased from
2011 to 2013. After 2013, salaries to assets decreased for two groups of banks: those
with total assets ranging from $1 billion to $5 billion and those with total assets
ranging from $5 billion to $10 billion. Salaries to assets in the group of the smallest
banks increased until 2015, and decreased thereafter.
5.2. Empirical results
Effects of mortgage and non-mortgage related rules
Loans per employee
Table 8 reports the effects of mortgage and non-mortgage related rules on loans
per employee across five groups of banks. I am primarily interested in the coefficients
on indicator variables ORIGI, DEBIT, RULE, and ESCR.
The coefficients on indicator variables are statistically significant for Group-4
and Group-5 banks. Specifically, ESCR and RULE are positively related to loans per
employee for Group-5 banks—those with less than $1 billion in assets. Similarly,
ESCR and RULE are positively related to loans per employee for Group-4 banks—
those with $1 billion to $5 billion in assets. The coefficients on indicator variables are
statistically insignificant for other groups of banks.
In summary, I conclude that mortgage and non-mortgage related rules only
affect loans per employee at the smallest community banks.
As the mortgage and non-mortgage related rules impose a greater regulatory
burden on community banks, mortgage lending in community banks is affected. I
expected loans per employee in community banks to decrease during the
implementation of these seven final rules; and these rules should not have large
effects on large banks. My results are consistent with my expectation about the effects
47
of these rules on large banks; however, the results are different from my expectation
about the effects of these rules on community banks. Loans per employee increased
during the passage of RULE from 2014 Q1 to 2014 Q3; this contradicted my
expectation and the findings of a survey conducted by the Independent Community
Bankers of America in 2014 in which 73 percent of community bank members
reported a decline in mortgage lending. However, My results are consistent with those
of Cyree (2015) for Group-4 and Group-5 banks; in these cases, Cyree finds that loans
per employee increased during the period from 2013 Q2 to 2013 Q4.
Pretax return on assets
Table 9 reports the effects of mortgage and non-mortgage related rules on
pretax returns on assets across five groups of banks.
The coefficients on three of four indicator variables are all statistically
significant for Group-5 banks. Specifically, ESCR, and RULE are negatively related
to pretax returns on assets for Group-5 banks—those with less than $1 billion in
assets; meanwhile, DEBIT is positively related to pretax return on assets for this
community-bank group. Somewhat similarly, RULE is negatively related to pretax
return on asset for Group-4 banks—those with $1 billion to $5 billion in assets.
Meanwhile, the coefficients on indicator variables are statistically insignificant for
Group-1, Group-2 and Group-3 banks—those with greater than $5 billion in assets.
In general, I conclude that the mortgage and non-mortgage related rules have a
negative impact on pretax return on assets at the smallest community-banks.
As the mortgage and non-mortgage related rules impose regulatory burden on
community banks, these banks’ profitability is affected. I expected profits at
community banks to fall during the implementation of these final rules; and profits at

48
large banks should not be affected during the implementation of these rules. My
results are consistent with my expectations and findings of other studies, an increase
in regulation will reduce banking profitability; those studies include Pasiousras et al.
(2009), Feldman et al. (2013), Cyree (2015), and Brewer and Russel (2016).
Moreover, the absolute values of coefficients on indicators are greatest for the
smallest community-bank group, which suggest that this group is affected the most
severely. This is consistent with Dolar and Shughart (2007) and Brewer and Russell
(2016), who find disproportionally large regulatory burdens for small banks. Dolar
and Shughart (2007) find compliance costs fall more heavily on small institutions
than large institutions. Brewer and Russell (2016) find that an increase in regulation
will result in a decrease in profitability of financial institutions, especially for banks
with assets of less than $250 million.
Percentage change in number of employees
Table 10 reports the effects of mortgage and non-mortgage related rules on the
percentage change in the number of employees across five groups of banks.
The coefficients on indicator variables are statistically significant for Group-4
and Group-5 banks. Specifically, ESCR and RULE are negatively related to
percentage change in number of employees for Group-5 banks—those with less than
$1 billion in assets. Similarly, ESCR and RULE are negatively related to percentage
change in number of employees for Group-4 banks—those with $1 billion to $5
billion in assets. Somewhat similarly, RULE is negatively related to percentage
change in number of employees for Group-2 banks—those with $10 billion to $50
billion in assets.

49
Meanwhile, RULE is negatively related to percentage change in number of
employees for Group-1 banks—those with greater than $50 billion in assets; on the
other hand, ORIGI is positively related to percentage change in number of employees
for this group of banks.
In summary, I conclude that mortgage and non-mortgage related rules
negatively affect percentage change in number of employees at banks.
As the mortgage and non-mortgage related rules impose regulatory burden on
community banks, I expect these banks to hire additional employee to deal with
compliance; thus, number of employees increases. My results are inconsistent with
my expectation; nevertheless, my results are similar to Cyree (2015) findings. Cyree’s
(2015) finds the decline in percentage change of number of employees for Group-4
and Group-5 banks during the passage of the Dodd-Frank Act and the Ability-to-
Repay and Qualified mortgage rule.
Salaries to assets
Table 11 reports the effects of mortgage and non-mortgage related rules on
salaries to assets across five groups of banks.
ORIGI is negatively related to salaries to assets for Group-5 banks—those with
less than $1 billion in assets; meanwhile, ESCR is positively related to salaries to
assets for this group. Somewhat similarly, RULE is negatively related to salaries to
assets for Group-3 and Group-4 banks—those with $1 billion to $10 billion in assets.
Meanwhile, the coefficients on indicator variables are statistically insignificant for
Group-1 and Group-2 banks—those with greater than $10 billion in assets.
In summary, I conclude that the mortgage and non-mortgage related rules only
affect salaries to assets at community banks, and these effects vary.
50
Salaries to assets can be a proxy for noninterest expenses. As mortgage and
non-mortgage related rules impose regulatory burden on community banks, I expected
salaries to assets at community banks increase during the implementation of these
rules. Moreover, literature shows an increase in noninterest expenses after the passage
of financial legislation; examples include Dolar and Shughart (2007), Pierce et al.
(2014), and Hogan and Burns (2016). I find inconsistent results with my expectation
and with general findings in the literature.
Besides, I also run the regression model with 4 lags of the dependent variable,
which I report in Appendices A, B, C and D as Cyree (2015) did to make the
comparison. Including 4 lags of the dependent variable does not improve the model
(R-square for the autoregressive models does not improve when including 4 lags of
the dependent variables, some of them are lower than the fixed effects models).
Moreover, some lags of the dependent variable are statistically insignificant, which
suggests it is unnecessary to include them in the model.

51
Table 8: Loan per employee is dependent variable, fixed effects model with first-order autocorrelation
Variables
Assets > $50 billion
Coefficient
Assets $10 - $50 billion
Coefficient
Assets $5 - $10 billion
Coefficient
Assets $1 - $5 billion
Coefficient
Assets < $1 billion
Coefficient
Q1 -0.01875 -0.05437 -0.04768 -0.03102 -0.01123(**)
Q2 0.001 -0.03413 -0.03142 -0.02002 -0.00885(**)
Q3 0.00036 -0.01139 -0.00367 0.00548 0.00935(*)
LOANPEREMP_1 0.90511 0.86572 0.83987 0.81123(*) 0.74252(*)
LNASSETS 0.2106 0.18787 0.23641 0.3203(*) 0.33726(*)
CAPRATIO -0.48379 -0.3816 -0.8323 -0.44587 -0.83228
NETINTINC -0.19049 -1.32544 -1.57895 -2.55669 -1.51617
FIDUINC 1.41092 -5.73204 4.25666 -12.2595 -2.96946
NONACCRU -4.96987 -0.63525 1.74628 -0.45719 0.12993
AGLOANS -19.76605 -2.62502 1.18688 1.98055 2.21765(*)
USCNILOAN 0.37073 0.58076 1.12989 1.64747(*) 1.20543(*)
FORCNILOAN -1.47564 2.11957 3.72271 0.34877 1.78826(*)
BIGCDS -0.05745 -0.20411 -0.1551 -0.30233 -0.11799
ALLL 1.08158 -1.32713 -5.35192 1.51494 -0.75777
PLLL -1.51419 -0.29204 -1.17386 -2.15776(**) -1.02821
GDPGROWTH -0.00062 -0.00109 -0.00109 -0.00246(**) -0.00073
DEMDEPS -0.32102 -0.08317 -0.14634 -0.68078 -0.54422(*)
TECHNFA -0.00115 -0.01019 -0.01042 -0.00442 -0.00103
NOW 1.03964 -0.22457 0.10287 -0.42814 -0.34544(*)
MMDA -0.16493 -0.07659 -0.03641 -0.5744(**) -0.41055(*)
SMALLCD 0.48636 -0.09638 -0.33412 -0.42727 -0.2946(*)
ORIGI 0.00036 0.00702 -0.00331 -0.00585 0.00014
ESCR 0.02258 0.03388 0.03923 0.04567(*) 0.03448(*)
RULE 0.05023 0.07212 0.03812 0.07244(*) 0.06262(*)
DEBIT 0.09274 0.01103 0.00179 0.00288 -0.00341
Constant -3.5498 -2.643242 -3.14783 -3.76745(*) -3.5230(*)
No. Obs 1,842 3,452 2,847 18,056 74,296
No. Banks 73 178 199 910 3268
Note: Fixed effect model estimator results (*) significance at the 99% level, (**) significance at the 95% level.
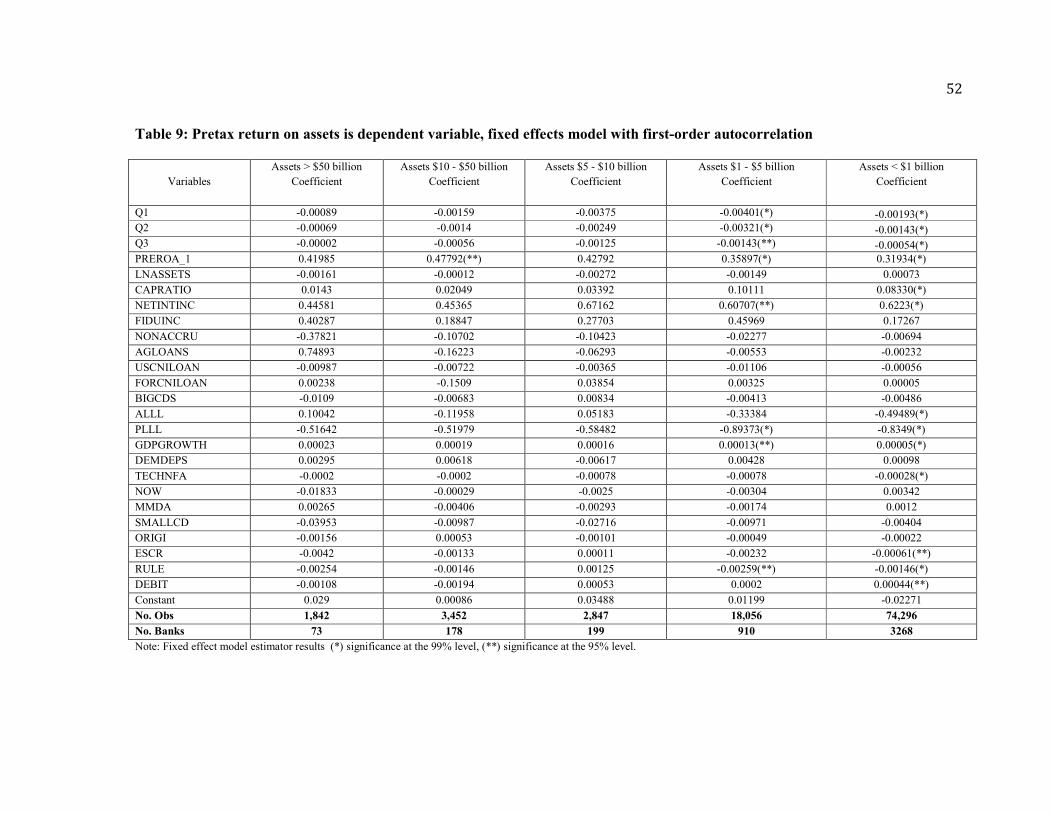
52
Table 9: Pretax return on assets is dependent variable, fixed effects model with first-order autocorrelation
Variables
Assets > $50 billion
Coefficient
Assets $10 - $50 billion
Coefficient
Assets $5 - $10 billion
Coefficient
Assets $1 - $5 billion
Coefficient
Assets < $1 billion
Coefficient
Q1 -0.00089 -0.00159 -0.00375 -0.00401(*) -0.00193(*)
Q2 -0.00069 -0.0014 -0.00249 -0.00321(*) -0.00143(*)
Q3 -0.00002 -0.00056 -0.00125 -0.00143(**) -0.00054(*)
PREROA_1 0.41985 0.47792(**) 0.42792 0.35897(*) 0.31934(*)
LNASSETS -0.00161 -0.00012 -0.00272 -0.00149 0.00073
CAPRATIO 0.0143 0.02049 0.03392 0.10111 0.08330(*)
NETINTINC 0.44581 0.45365 0.67162 0.60707(**) 0.6223(*)
FIDUINC 0.40287 0.18847 0.27703 0.45969 0.17267
NONACCRU -0.37821 -0.10702 -0.10423 -0.02277 -0.00694
AGLOANS 0.74893 -0.16223 -0.06293 -0.00553 -0.00232
USCNILOAN -0.00987 -0.00722 -0.00365 -0.01106 -0.00056
FORCNILOAN 0.00238 -0.1509 0.03854 0.00325 0.00005
BIGCDS -0.0109 -0.00683 0.00834 -0.00413 -0.00486
ALLL 0.10042 -0.11958 0.05183 -0.33384 -0.49489(*)
PLLL -0.51642 -0.51979 -0.58482 -0.89373(*) -0.8349(*)
GDPGROWTH 0.00023 0.00019 0.00016 0.00013(**) 0.00005(*)
DEMDEPS 0.00295 0.00618 -0.00617 0.00428 0.00098
TECHNFA -0.0002 -0.0002 -0.00078 -0.00078 -0.00028(*)
NOW -0.01833 -0.00029 -0.0025 -0.00304 0.00342
MMDA 0.00265 -0.00406 -0.00293 -0.00174 0.0012
SMALLCD -0.03953 -0.00987 -0.02716 -0.00971 -0.00404
ORIGI -0.00156 0.00053 -0.00101 -0.00049 -0.00022
ESCR -0.0042 -0.00133 0.00011 -0.00232 -0.00061(**)
RULE -0.00254 -0.00146 0.00125 -0.00259(**) -0.00146(*)
DEBIT -0.00108 -0.00194 0.00053 0.0002 0.00044(**)
Constant 0.029 0.00086 0.03488 0.01199 -0.02271
No. Obs 1,842 3,452 2,847 18,056 74,296
No. Banks 73 178 199 910 3268
Note: Fixed effect model estimator results (*) significance at the 99% level, (**) significance at the 95% level.

53
Table 10: Change in number of employee is dependent variable, fixed effects model
Variables
Assets > $50 billion
Coefficient
Assets $10 - $50 billion
Coefficient
Assets $5 - $10 billion
Coefficient
Assets $1 - $5 billion
Coefficient
Assets < $1 billion
Coefficient
Q1 -1.91683(*) -1.18129 -2.24(*) -1.43522(*) -1.11428(*)
Q2 -1.45834(*) -0.37656 -0.76413(**) -0.22613 0.16935(**)
Q3 -1.29376(*) -0.96618(*) -1.10228(*) -1.16194(*) -0.98451(*)
LNASSETS -0.465 -0.39394 0.93137 -0.4196(**) -0.64513(*)
CAPRATIO -1.55394 -3.19333 -4.94566 -4.859 -0.1204
NETINTINC -34.81971 -28.93467 -11.71574 -6.27095 -27.43414(*)
FIDUINC -63.27417 -71.29997 70.68511(*) -275.4609(*) -24.64811
NONACCRU -44.42456 -47.31563(*) -40.48074(**) -21.78879(*) -29.75913(*)
AGLOANS 22.79613 9.2893 -20.66502 9.2504 -0.07676(*)
USCNILOAN -7.54375 -6.77189(**) -6.23579 1.12308 3.8272
FORCNILOAN -3.54799 32.03111(*) 4.40645 -3.38 -1.04946
BIGCDS -7.94021 3.45354 0.48138 0.70439 0.92516
ALLL -17.27414 -7.70711 -10.87385 -38.9098(**) -65.51693(*)
PLLL -34.85454 7.86686 -30.38213 -16.49741 12.63119
GDPGROWTH 0.01597 0.07901(**) 0.06036(**) 0.06117(*) 0.03024(*)
DEMDEPS -1.44111 2.92813 -1.14986 3.4886(*) 3.01791(*)
TECHNFA -0.50942(*) -0.25212 -0.46765(*) -0.37027(*) -0.32099
NOW 17.61105(**) 3.96008 3.83511 1.06323 -0.92988
MMDA -0.402 0.91386 -1.87629 -0.07235 -0.38343
SMALLCD 6.80269 5.11324(*) 4.22271 1.04319 1.51212(*)
ORIGI 0.75957(**) -0.0081 0.25661 0.03978 -0.07151
ESCR -0.56204 -0.511 -0.50648 -0.53377(*) -0.44893(*)
RULE -1.11208(*) -1.29796(**) -0.4377 -1.03004(*) -0.82567(*)
DEBIT -0.68595 0.23888 0.18818 0.11586 0.15484
Constant 14.70935(**) 9.29309 -10.2719 9.18953(*) 11.31069(*)
No. Obs 2,079 3,985 3,435 20,685 84,341
No. Banks 81 197 230 993 3452
Note: Fixed effect model estimator results (*) significance at the 99% level, (**) significance at the 95% level.
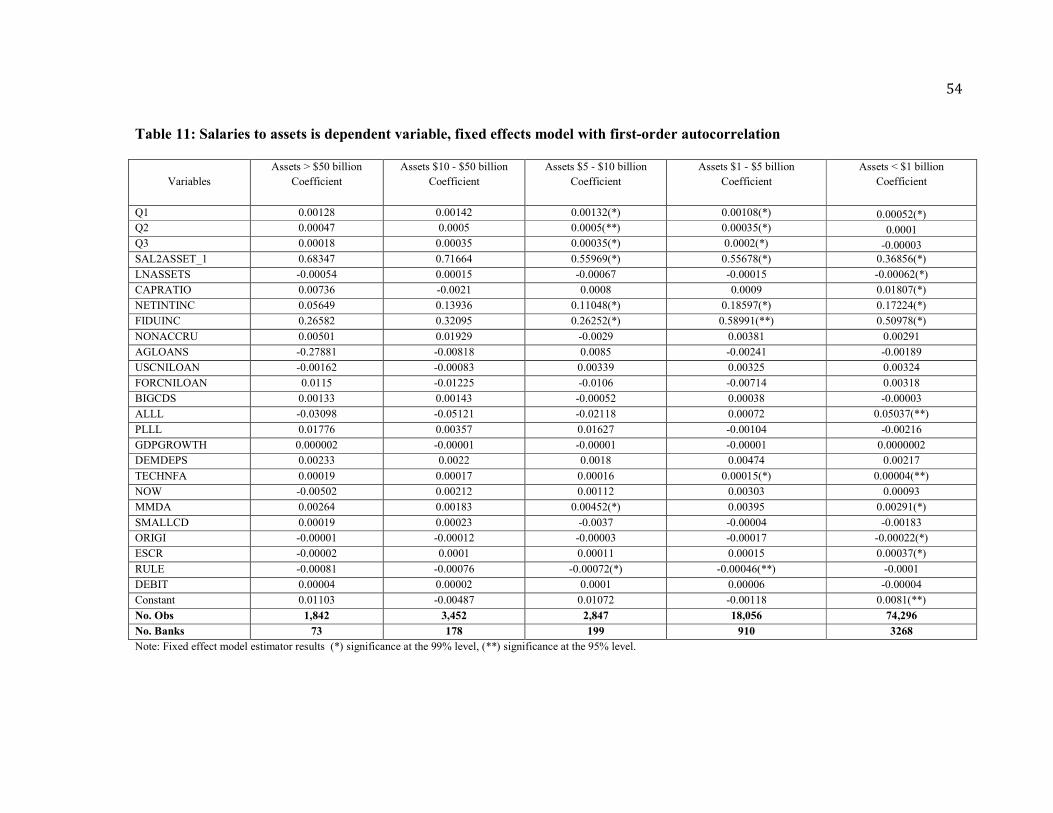
54
Table 11: Salaries to assets is dependent variable, fixed effects model with first-order autocorrelation
Variables
Assets > $50 billion
Coefficient
Assets $10 - $50 billion
Coefficient
Assets $5 - $10 billion
Coefficient
Assets $1 - $5 billion
Coefficient
Assets < $1 billion
Coefficient
Q1 0.00128 0.00142 0.00132(*) 0.00108(*) 0.00052(*)
Q2 0.00047 0.0005 0.0005(**) 0.00035(*) 0.0001
Q3 0.00018 0.00035 0.00035(*) 0.0002(*) -0.00003
SAL2ASSET_1 0.68347 0.71664 0.55969(*) 0.55678(*) 0.36856(*)
LNASSETS -0.00054 0.00015 -0.00067 -0.00015 -0.00062(*)
CAPRATIO 0.00736 -0.0021 0.0008 0.0009 0.01807(*)
NETINTINC 0.05649 0.13936 0.11048(*) 0.18597(*) 0.17224(*)
FIDUINC 0.26582 0.32095 0.26252(*) 0.58991(**) 0.50978(*)
NONACCRU 0.00501 0.01929 -0.0029 0.00381 0.00291
AGLOANS -0.27881 -0.00818 0.0085 -0.00241 -0.00189
USCNILOAN -0.00162 -0.00083 0.00339 0.00325 0.00324
FORCNILOAN 0.0115 -0.01225 -0.0106 -0.00714 0.00318
BIGCDS 0.00133 0.00143 -0.00052 0.00038 -0.00003
ALLL -0.03098 -0.05121 -0.02118 0.00072 0.05037(**)
PLLL 0.01776 0.00357 0.01627 -0.00104 -0.00216
GDPGROWTH 0.000002 -0.00001 -0.00001 -0.00001 0.0000002
DEMDEPS 0.00233 0.0022 0.0018 0.00474 0.00217
TECHNFA 0.00019 0.00017 0.00016 0.00015(*) 0.00004(**)
NOW -0.00502 0.00212 0.00112 0.00303 0.00093
MMDA 0.00264 0.00183 0.00452(*) 0.00395 0.00291(*)
SMALLCD 0.00019 0.00023 -0.0037 -0.00004 -0.00183
ORIGI -0.00001 -0.00012 -0.00003 -0.00017 -0.00022(*)
ESCR -0.00002 0.0001 0.00011 0.00015 0.00037(*)
RULE -0.00081 -0.00076 -0.00072(*) -0.00046(**) -0.0001
DEBIT 0.00004 0.00002 0.0001 0.00006 -0.00004
Constant 0.01103 -0.00487 0.01072 -0.00118 0.0081(**)
No. Obs 1,842 3,452 2,847 18,056 74,296
No. Banks 73 178 199 910 3268
Note: Fixed effect model estimator results (*) significance at the 99% level, (**) significance at the 95% level.

55
Chapter 6: CONCLUSIONS AND RECOMMENDATIONS
Community banks play a crucial role in the US economy; these banks are often
the only local source of banking services for many counties, and the main credit
source for rural communities and small businesses. The literature on community
banking shows evidence that community banks were not the main causes of the
financial crisis in 2008, and the passage of the Dodd-Frank Act was not intended to
apply to community banks. The Dodd-Frank Act exempts institutions with $10 billion
or less in total assets; thus, much of the Act is not intended to apply to community
banks. Although community banks are exempted from many of the Act’s rules, there
remains much debate over the regulatory burden the Act imposes—indirectly or
otherwise—on community banks.
The purpose of this study was to learn the effects of the Dodd-Frank Act on
community banks; more specifically, the effects of seven rules associated with the
Dodd-Frank Act—mortgage and non-mortgage related rules—on community banks.
To do that, I used quarterly bank holding company data from 1991 Q1 to 2016 Q4 to
measure the performance of community banks (in terms of loans per employee, pretax
return on assets, percentage change in number of employees, and salaries to assets)
after the passage of seven final rules and compared these results with the performance
of larger banks during the same period. I modeled each performance measure as a
function of bank-specific observable variables, bank-specific unobserved (fixed-
effect) heterogeneity, and the Dodd-Frank Act rule dummy variables. I estimated my
model across five groups of banks, which I divided based on asset size. I found that
the effects of the Dodd-Frank Act rules on bank performance vary by bank size. My
estimated results showed that these seven final rules affected community banks more

56
severely, but had little or no impact on larger banks, which is consistent with the
existence of economies of scale in the banking industry as economic theory would
suggest. However, these Dodd-Frank Act rules do not impose large economic burdens
on any banks.
In this study, I used three quarters for Dodd-Frank Act rule dummy variables to
estimate the effects of these rules on bank performance; however, three quarters might
not capture all the effects of the Dodd-Frank Act rules on bank performance. Future
studies could estimate the effects of the Dodd-Frank Act rules on bank performance
by using longer implementation periods and alternative econometric-model
specifications.
57
References
22nd Annual ABA Real Estate Survey Report. (May, 2015). Retrieved from
https://www.aba.com/Tools/Function/Mortgage/Documents/2015ABARealEstat
eLendingandTRIDSurvey.pdf
23rd Annual ABA Residential Real Estate Survey Report. (April, 2016). Retrieved
from
https://www.aba.com/Tools/Function/Mortgage/Documents/2016ABARealEstat
eLendingSurveyReport.pdf
2014 ICBA Community Bank Lending Survey. (2015). Retrieved from
https://www.icba.org/docs/default-source/icba/news-documents/press-release/2015/2014icbacommunitybanklendingsurveyexecsummary.pdf?sfvrsn=2
American Bankers Association. (2012). Dodd-Frank and Community Banks: Your
Guide to 12 Critical Issues. Retrieved from http://www.aba.com/aba/documents/DFA/DFGuide.pdf
Baltagi, B. H. (2013). Econometric analysis of panel data. Chichester, West
Sussex: John Wiley & Sons Ltd. Berger, A. N., & Mester, L. J. (2003). Explaining the dramatic changes in
performance of US banks: technological change, deregulation, and dynamic
changes in competition. Journal Of Financial Intermediation, 12(1), 57.
doi:10.1016/S1042-9573(02)00006-2\
Berger, A. N., Dick, A. A., Goldberg, L. G., & White, L. J. (2007). Competition from
Large, Multimarket Firms and the Performance of Small, Single-Market Firms:
Evidence from the Banking Industry. Journal Of Money, Credit & Banking
(Wiley-Blackwell), 39(2/3), 331-368. doi:10.1111/j.0022-2879.2007.00028.x
Bernanke, B. S. (2012, March). Community Banking. Speech presented at
Independent Community Bankers of America National Convention and
Techworld in Nashville, Tennessee. Retrieved from
https://www.federalreserve.gov/newsevents/speech/bernanke20120314a.pdf.
Brewer, B., & Russell, L. (2016). Impact of Dodd-Frank on Small Community
Lenders. Retrieved from
http://ageconsearch.umn.edu/bitstream/235986/2/Dodd%20Frank%20Lender%2
0Paper.pdf
Cyree, K. B. (2015). The Effects Of Regulatory Compliance For Small Banks Around
Crisis-Based Regulation.

58
Corner, G. S., & Meyer, A. P. (2013). Community Bank Lending during the Financial
Crisis. Federal Reserve Bank of St. Louis. Retrieved from
https://www.stlouisfed.org/publications/central-banker/spring-2013/community-
bank-lending-during-the-financial-crisis
Council of Economic Advisers. (2016). The Performance of Community Banks Over
Time.
Dahl, D., Meyer, A., & Neely, M. (2016). Bank Size, Compliance Costs and
Compliance Performance in Community Bank. Retrieved from
https://www.communitybanking.org/~/media/files/communitybanking/2016/sessio
n2_paper2_neely.pdf
Dolar, B., & Shughart, W. F. (2007). The wealth effects of the USA Patriot Act:
evidence from the banking and thrift industries. Journal of Money Laundering
Control, 10(3), 300-317. doi:10.1108/13685200710763470
Elliehausen, G., & Lowrey, B. R. (2000). The Costs of Implementing Regulatory
Changes: The Truth in Savings Act. Journal Of Financial Services Research,
17(2), 165.
Federal Deposit Insurance Corporation (2012). FDIC Community Banking Study.
Federal Deposit Insurance Corporation. (Feb, 2017). Chairman’s Opening Statement
Fourth Quarter 2016 Quarterly Banking Profile. Speeches & Testimony.
https://www.fdic.gov/news/news/speeches/spfeb2817.html
Federal Financial Institutions Examination Council. (1992). Study on Regulatory
Burden. Washington, DC: Federal Financial Institutions Examination Council.
Federal Reserve Bank of Kansas City. (2014). Survey of Community Depository
Insititutions. Retrieved from
https://www.kansascityfed.org/publicat/banking/surveycommbanks/14executivesumm
ary.pdf
Feldman, R. J., Schmidt, J., & Heinecke, K. (2013). Quantifying the Costs of
Additional Regulation on Community Banks. Retrieved from
https://www.minneapolisfed.org/research/economic-policy-papers/quantifying-
the-costs-of-additional-regulation-on-community-banks
Feng, G. (2010). Efficiency, technical change, and returns to scale in large US banks:
Panel data evidence from an output distance function satisfying theoretical
regularity. Journal Of Banking And Finance, (. 1), 127.

59
Franks, J. R., Schaefer, S. M., & Staunton, M. D. (1998). The direct and compliance
costs of financial regulation. Journal of Banking & Finance, 21(11-12), 1547-
1572. doi:10.1016/s0378-4266(97)00045-9
Government Accountability Office (GAO). (2015). Dodd-Frank regulations, impacts
on community banks, credit unions and systemically important institutions:
report to congressional addressees.
Hein, E. S., Koch, W. T., & Macdonald, S. S (2005). On the Uniqueness of
Community Banks. Federal Reserve Bank of Atlanta. Retrieved from
https://www.frbatlanta.org/-/media/documents/filelegacydocs/Heinarticlefinal.pdf
Hogan, T. L., & Burns, S. (August, 2016). The Impact of Dodd-Frank on Banks’
Noninterest Expenses. Available at SSRN: https://ssrn.com/abstract=2832288
or http://dx.doi.org/10.2139/ssrn.2832288
Hoskins, S. M., & Labonte, M. (2015, June 15). An Analysis of the Regulatory
Burden on Small Banks. Retrieved June 18, 2017, from
https://digital.library.unt.edu/ark:/67531/metadc626873/
Hughes, J. P., & Mester, L. J. (2013). Who said large banks don’t experience scale
economies? Evidence from a risk-return-driven cost function. Journal Of
Financial Intermediation, 22559-585. doi:10.1016/j.jfi.2013.06.004
Kunst, M. R. (2009). Econometrics method for panel data —Part II. University of
Vienna.
Kupiec, P., & Lee, Y. (2012). What Factors Explain Differences in Return on Assets
Among Community Banks? Retrieved from
https://www.fdic.gov/regulations/resources/cbi/report/cbi-roa.pdf
Lux, M., & Greene, R. (2015). The State and Fate of Community Banking. Harvard
University, M-RCBG Associate Working Paper Series No. 37, February 2015.
Marsh, T. D., & Norman, J. W. (2013). The Impact of Dodd-Frank on Community
Banks. American Enterprise Institute.
Pasiouras, F., Tanna, S., & Zopounidis, C. (2009). The impact of banking regulations
on banks cost and profit efficiency: Cross-country evidence. International
Review of Financial Analysis, 18(5), 294-302. doi:10.1016/j.irfa.2009.07.003
Pierce, H., Robinson, I., & Stratmann, T. (2014). How are Small banks Faring Under
Dodd-Frank. Arlington, VA: Mercatus Center, George Mason University.

60
Wheelock, D. C., & Wilson, P. W. (2012). Do Large Banks Have Lower Costs? New
Estimates of Returns to Scale for U.S. Banks. Journal Of Money, Credit &
Banking (Wiley-Blackwell), 44(1), 171-199. doi:10.1111/j.1538-
4616.2011.00472.x

61
Appendices
Appendix A: Random effect model and autoregressive model for loan per employee
Table 12: Loan per employee is dependent variable, random effect model
Variables
Assets > $50 billion
Coefficient
Assets $10 - $50 billion
Coefficient
Assets $5 - $10 billion
Coefficient
Assets $1 - $5 billion
Coefficient
Assets < $1 billion
Coefficient
Intercept -2.8811(*) -18.6166(*) -23.9034(*) -13.6272(*) -7.6417(*)
Q1 -0.3306(*) -0.5043*) -0.2823(*) -0.3566(*) -0.2552(*)
Q2 -0.2014(*) -0.3303(*) -0.188(*) -0.2279(*) -0.1786(*)
Q3 -0.0882(**) -0.1595(*) -0.0661(*) -0.1114(*) -0.0857(*)
LNASSETS 0.2989(*) 1.286(*) 1.6297(*) 1.1466(*) 0.7868(*)
CAPRATIO 6.1871(*) -0.4647 -3.5145(*) 1.7518(*) 0.909(*)
NETINTINC -24.3023(*) -4.0689(**) 3.6167(**) -5.1609(*) 1.261(*)
FIDUINC -20.0119(*) -25.9565(*) -9.0514(*) 7.7907(*) -12.0598(*)
NONACCRU 1.7102 -2.5628 7.1443(*) -0.6467 2.2667(*)
AGLOANS -20.0211(**) -0.7458 -3.2462 1.7637(*) 1.719(*)
USCNILOAN 3.1655(*) 2.2759(*) 6.0156(*) 2.9108(*) 0.9526(*)
FORCNILOAN -1.2605 0.8069 19.9526(*) 4.98(*) 0.7131(*)
BIGCDS 3.4286(*) 0.17 -0.1479 0.4083(*) 1.4289(*)
ALLL -14.9954(*) 22.1301(*) -6.3832 9.0728(*) 7.2629(*)
PLLL 30.1985(*) -0.9907 -0.7848 3.5571 1.9775(*)
GDPGROWTH -0.0085 -0.029(*) -0.0357(*) -0.0314(*) -0.01215(*)
DEMDEPS 2.3729(*) 1.5234(*) 2.3962(*) 0.0075 -0.9727(*)
TECHNFA -153.417(*) -138.71(*) -81.826(*) -107.894(*) -71.7865(*)
NOW 1.0483 0.2526 1.459(*) 0.2232(**) -0.4286(*)
MMDA 2.5097(*) 1.2716(*) 1.192(*) 0.0788 -0.059(*)
SMALLCD -3.0546(*) -0.7644(*) 1.754(*) 0.1586(**) -0.3122(*)
ORIGI -0.0758 -0.0671 -0.0954(**) -0.1085(*) -0.0109
ESCR -0.0502 -0.1781(*) -0.0467 -0.1851(*) 0.0516(*)
RULE 0.0913 0.0788 -0.0457 -0.0215 0.2068(*)
DEBIT -0.0153 -0.0404 -0.0534 -0.1463(*) 0.0164
Observations N = 2,994 N = 5,555 N = 4,885 N = 27,615 N= 96,297
R-Square R2 = 0.37 R2 = 0.45 R2 = 0.39 R2 = 0.41 R2 = 0.54
Note: Random effect model results (*) significance at the 99% level, (**) significance at the 95% level.
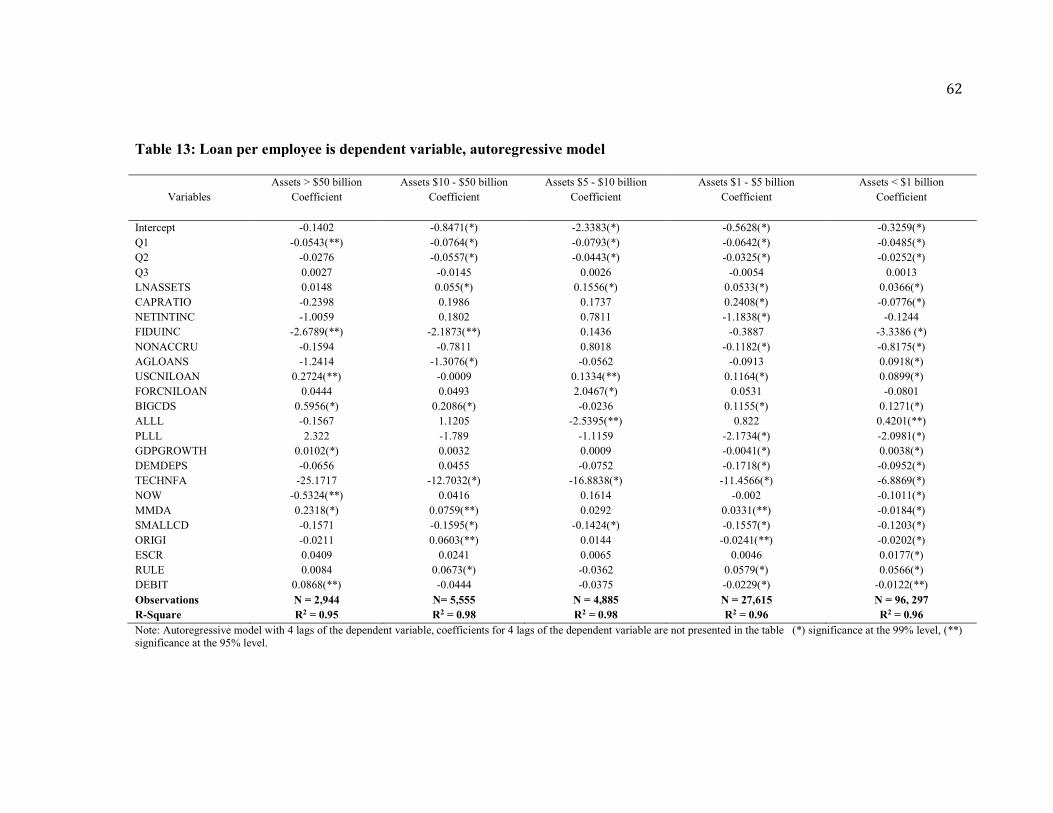
62
Table 13: Loan per employee is dependent variable, autoregressive model
Variables
Assets > $50 billion
Coefficient
Assets $10 - $50 billion
Coefficient
Assets $5 - $10 billion
Coefficient
Assets $1 - $5 billion
Coefficient
Assets < $1 billion
Coefficient
Intercept -0.1402 -0.8471(*) -2.3383(*) -0.5628(*) -0.3259(*)
Q1 -0.0543(**) -0.0764(*) -0.0793(*) -0.0642(*) -0.0485(*)
Q2 -0.0276 -0.0557(*) -0.0443(*) -0.0325(*) -0.0252(*)
Q3 0.0027 -0.0145 0.0026 -0.0054 0.0013
LNASSETS 0.0148 0.055(*) 0.1556(*) 0.0533(*) 0.0366(*)
CAPRATIO -0.2398 0.1986 0.1737 0.2408(*) -0.0776(*)
NETINTINC -1.0059 0.1802 0.7811 -1.1838(*) -0.1244
FIDUINC -2.6789(**) -2.1873(**) 0.1436 -0.3887 -3.3386 (*)
NONACCRU -0.1594 -0.7811 0.8018 -0.1182(*) -0.8175(*)
AGLOANS -1.2414 -1.3076(*) -0.0562 -0.0913 0.0918(*)
USCNILOAN 0.2724(**) -0.0009 0.1334(**) 0.1164(*) 0.0899(*)
FORCNILOAN 0.0444 0.0493 2.0467(*) 0.0531 -0.0801
BIGCDS 0.5956(*) 0.2086(*) -0.0236 0.1155(*) 0.1271(*)
ALLL -0.1567 1.1205 -2.5395(**) 0.822 0.4201(**)
PLLL 2.322 -1.789 -1.1159 -2.1734(*) -2.0981(*)
GDPGROWTH 0.0102(*) 0.0032 0.0009 -0.0041(*) 0.0038(*)
DEMDEPS -0.0656 0.0455 -0.0752 -0.1718(*) -0.0952(*)
TECHNFA -25.1717 -12.7032(*) -16.8838(*) -11.4566(*) -6.8869(*)
NOW -0.5324(**) 0.0416 0.1614 -0.002 -0.1011(*)
MMDA 0.2318(*) 0.0759(**) 0.0292 0.0331(**) -0.0184(*)
SMALLCD -0.1571 -0.1595(*) -0.1424(*) -0.1557(*) -0.1203(*)
ORIGI -0.0211 0.0603(**) 0.0144 -0.0241(**) -0.0202(*)
ESCR 0.0409 0.0241 0.0065 0.0046 0.0177(*)
RULE 0.0084 0.0673(*) -0.0362 0.0579(*) 0.0566(*)
DEBIT 0.0868(**) -0.0444 -0.0375 -0.0229(*) -0.0122(**)
Observations N = 2,944 N= 5,555 N = 4,885 N = 27,615 N = 96, 297
R-Square R2 = 0.95 R2 = 0.98 R2 = 0.98 R2 = 0.96 R2 = 0.96
Note: Autoregressive model with 4 lags of the dependent variable, coefficients for 4 lags of the dependent variable are not presented in the table (*) significance at the 99% level, (**) significance at the 95% level.
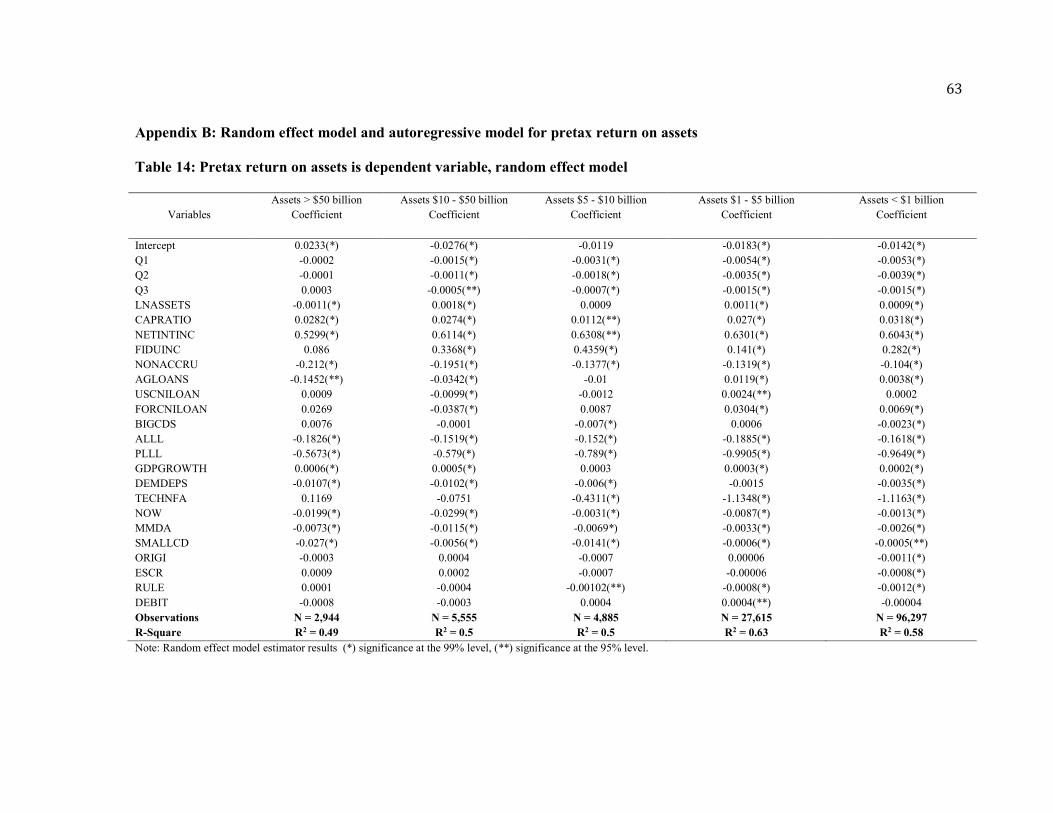
63
Appendix B: Random effect model and autoregressive model for pretax return on assets
Table 14: Pretax return on assets is dependent variable, random effect model
Variables
Assets > $50 billion
Coefficient
Assets $10 - $50 billion
Coefficient
Assets $5 - $10 billion
Coefficient
Assets $1 - $5 billion
Coefficient
Assets < $1 billion
Coefficient
Intercept 0.0233(*) -0.0276(*) -0.0119 -0.0183(*) -0.0142(*)
Q1 -0.0002 -0.0015(*) -0.0031(*) -0.0054(*) -0.0053(*)
Q2 -0.0001 -0.0011(*) -0.0018(*) -0.0035(*) -0.0039(*)
Q3 0.0003 -0.0005(**) -0.0007(*) -0.0015(*) -0.0015(*)
LNASSETS -0.0011(*) 0.0018(*) 0.0009 0.0011(*) 0.0009(*)
CAPRATIO 0.0282(*) 0.0274(*) 0.0112(**) 0.027(*) 0.0318(*)
NETINTINC 0.5299(*) 0.6114(*) 0.6308(**) 0.6301(*) 0.6043(*)
FIDUINC 0.086 0.3368(*) 0.4359(*) 0.141(*) 0.282(*)
NONACCRU -0.212(*) -0.1951(*) -0.1377(*) -0.1319(*) -0.104(*)
AGLOANS -0.1452(**) -0.0342(*) -0.01 0.0119(*) 0.0038(*)
USCNILOAN 0.0009 -0.0099(*) -0.0012 0.0024(**) 0.0002
FORCNILOAN 0.0269 -0.0387(*) 0.0087 0.0304(*) 0.0069(*)
BIGCDS 0.0076 -0.0001 -0.007(*) 0.0006 -0.0023(*)
ALLL -0.1826(*) -0.1519(*) -0.152(*) -0.1885(*) -0.1618(*)
PLLL -0.5673(*) -0.579(*) -0.789(*) -0.9905(*) -0.9649(*)
GDPGROWTH 0.0006(*) 0.0005(*) 0.0003 0.0003(*) 0.0002(*)
DEMDEPS -0.0107(*) -0.0102(*) -0.006(*) -0.0015 -0.0035(*)
TECHNFA 0.1169 -0.0751 -0.4311(*) -1.1348(*) -1.1163(*)
NOW -0.0199(*) -0.0299(*) -0.0031(*) -0.0087(*) -0.0013(*)
MMDA -0.0073(*) -0.0115(*) -0.0069*) -0.0033(*) -0.0026(*)
SMALLCD -0.027(*) -0.0056(*) -0.0141(*) -0.0006(*) -0.0005(**)
ORIGI -0.0003 0.0004 -0.0007 0.00006 -0.0011(*)
ESCR 0.0009 0.0002 -0.0007 -0.00006 -0.0008(*)
RULE 0.0001 -0.0004 -0.00102(**) -0.0008(*) -0.0012(*)
DEBIT -0.0008 -0.0003 0.0004 0.0004(**) -0.00004
Observations N = 2,944 N = 5,555 N = 4,885 N = 27,615 N = 96,297
R-Square R2 = 0.49 R2 = 0.5 R2 = 0.5 R2 = 0.63 R2 = 0.58
Note: Random effect model estimator results (*) significance at the 99% level, (**) significance at the 95% level.

64
Table 15: Pretax return on assets is dependent variable, autoregressive model
Variables
Assets > $50 billion
Coefficient
Assets $10 - $50 billion
Coefficient
Assets $5 - $10 billion
Coefficient
Assets $1 - $5 billion
Coefficient
Assets < $1 billion
Coefficient
Intercept -0.0054 -0.0052(**) -0.0001 -0.0075(*) -0.0052(*)
Q1 0.0027 0.001(*) -0.0004 -0.0028(*) -0.0031(*)
Q2 0.0012 0.0001 -0.0008(*) -0.0023(*) -0.0021(*)
Q3 0.0009(*) 0.0002 0.0001 -0.0009(*) -0.0008(*)
LNASSETS 0.0001 0.0002 -0.0001 0.0005(*) 0.0003(*)
CAPRATIO 0.0287(*) 0.0206(*) 0.0176(*) 0.0042(*) 0.0125(*)
NETINTINC 0.211(*) 0.1437(*) 0.2327(*) 0.3113(*) 0.283(*)
FIDUINC 0.1062(*) 0.0855(*) 0.0941(*) 0.1246(*) 0.1154(*)
NONACCRU -0.0872(*) -0.051(*) -0.0404(*) -0.0412(*) -0.0369(*)
AGLOANS -0.0422 -0.0101(**) -0.0029 0.0074(*) 0.0011(*)
USCNILOAN 0.0045(*) -0.0023(*) -0.0029(*) -0.0028(*) -0.0002
FORCNILOAN -0.0066 0.0012 0.0031 0.0074(*) 0.0027(**)
BIGCDS -0.0093 0.0022(**) 0.0002 0.0012(*) 0.0006(*)
ALLL 0.0844(*) 0.0125 0.0299 0.0245(*) 0.0369(*)
PLLL -0.3694(*) -0.285(*) -0.4975(*) -0.7111(*) -0.6635(*)
GDPGROWTH 0.0003(*) 0.0003(*) 0.0002(*) 0.0002(*) 0.0001(*)
DEMDEPS -0.0103(*) -0.0009 -0.0022 -0.001(**) -0.0006(*)
TECHNFA 0.5813(*) 0.1637(*) -0.1587(*) -0.7769(*) -0.8415(*)
NOW 0.0061 -0.0056(*) -0.0058(*) -0.0046(*) 0.0003
MMDA -00052(*) -0.0014(*) -0.0031(*) -0.0015 -0.0005(*)
SMALLCD -0.0062(*) -0.0014 -0.0027(*) -0.0017(*) 0.0003(*)
ORIGI -0.0014(*) -0.00003 0.00004 -0.00004 -0.0007(*)
ESCR 0.0004 0.0003 -0.0005 -0.0004(*) -0.0009(*)
RULE -0.0002 -0.0008(**) -0.0006 -0.0009(*) -0.001(*)
DEBIT -0.0004 -0.0005 0.0007 0.0002 0.0004(*)
Observations N = 2, 944 N = 5,555 N = 4,885 N = 27,615 N =96,297
R-Square R2 = 0.8 R2 = 0.78 R2 = 0.78 R2 = 0.79 R2 = 0.78
Note: Autoregressive model with 4 lags of the dependent variable, coefficients for 4 lags of the dependent variable are not presented in the table (*) significance at the 99% level, (**) significance at the 95% level.
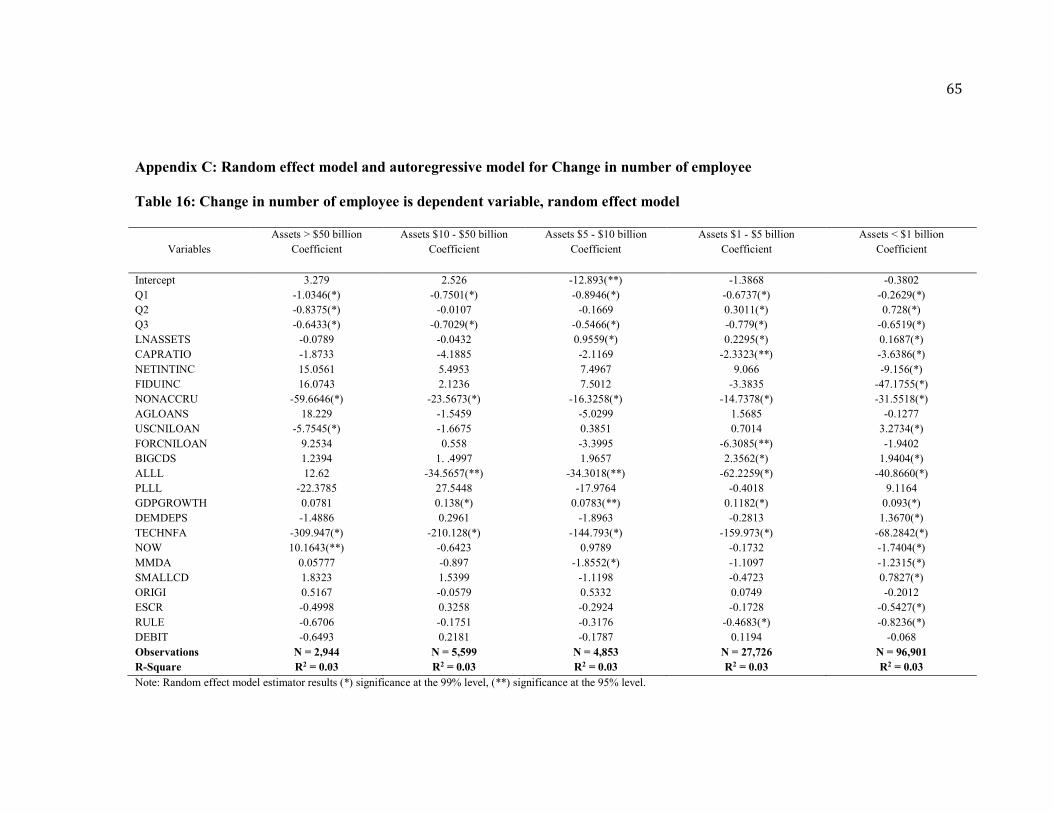
65
Appendix C: Random effect model and autoregressive model for Change in number of employee
Table 16: Change in number of employee is dependent variable, random effect model
Variables
Assets > $50 billion
Coefficient
Assets $10 - $50 billion
Coefficient
Assets $5 - $10 billion
Coefficient
Assets $1 - $5 billion
Coefficient
Assets < $1 billion
Coefficient
Intercept 3.279 2.526 -12.893(**) -1.3868 -0.3802
Q1 -1.0346(*) -0.7501(*) -0.8946(*) -0.6737(*) -0.2629(*)
Q2 -0.8375(*) -0.0107 -0.1669 0.3011(*) 0.728(*)
Q3 -0.6433(*) -0.7029(*) -0.5466(*) -0.779(*) -0.6519(*)
LNASSETS -0.0789 -0.0432 0.9559(*) 0.2295(*) 0.1687(*)
CAPRATIO -1.8733 -4.1885 -2.1169 -2.3323(**) -3.6386(*)
NETINTINC 15.0561 5.4953 7.4967 9.066 -9.156(*)
FIDUINC 16.0743 2.1236 7.5012 -3.3835 -47.1755(*)
NONACCRU -59.6646(*) -23.5673(*) -16.3258(*) -14.7378(*) -31.5518(*)
AGLOANS 18.229 -1.5459 -5.0299 1.5685 -0.1277
USCNILOAN -5.7545(*) -1.6675 0.3851 0.7014 3.2734(*)
FORCNILOAN 9.2534 0.558 -3.3995 -6.3085(**) -1.9402
BIGCDS 1.2394 1. .4997 1.9657 2.3562(*) 1.9404(*)
ALLL 12.62 -34.5657(**) -34.3018(**) -62.2259(*) -40.8660(*)
PLLL -22.3785 27.5448 -17.9764 -0.4018 9.1164
GDPGROWTH 0.0781 0.138(*) 0.0783(**) 0.1182(*) 0.093(*)
DEMDEPS -1.4886 0.2961 -1.8963 -0.2813 1.3670(*)
TECHNFA -309.947(*) -210.128(*) -144.793(*) -159.973(*) -68.2842(*)
NOW 10.1643(**) -0.6423 0.9789 -0.1732 -1.7404(*)
MMDA 0.05777 -0.897 -1.8552(*) -1.1097 -1.2315(*)
SMALLCD 1.8323 1.5399 -1.1198 -0.4723 0.7827(*)
ORIGI 0.5167 -0.0579 0.5332 0.0749 -0.2012
ESCR -0.4998 0.3258 -0.2924 -0.1728 -0.5427(*)
RULE -0.6706 -0.1751 -0.3176 -0.4683(*) -0.8236(*)
DEBIT -0.6493 0.2181 -0.1787 0.1194 -0.068
Observations N = 2,944 N = 5,599 N = 4,853 N = 27,726 N = 96,901
R-Square R2 = 0.03 R2 = 0.03 R2 = 0.03 R2 = 0.03 R2 = 0.03
Note: Random effect model estimator results (*) significance at the 99% level, (**) significance at the 95% level.

66
Table 17: Change in number of employee is dependent variable, autoregressive model
Variables
Assets > $50 billion
Coefficient
Assets $10 - $50 billion
Coefficient
Assets $5 - $10 billion
Coefficient
Assets $1 - $5 billion
Coefficient
Assets < $1 billion
Coefficient
Intercept 0.7111 -0.5975 -6.7796 -2.731(*) -1.107(**)
Q1 -0.7203(**) -0.5679(*) -0.6116(*) -0.4209(*) -0.1514(*)
Q2 -0.6238(**) 0.0739 0.304 0.4296(*) -0.7767(*)
Q3 -0.5398(**) -0.667(*) -0.4612(*) -0.6631(*) -0.491(*)
LNASSETS 0.0135 0.0979 0.5099 0.2762(*) 0.1865(*)
CAPRATIO -0.8943 -3.1881 -1.7315 -2.5288(*) -4.5631(*)
NETINTINC 22.2499(**) 11.4002 6.1687 4.3277 -4.2255
FIDUINC 18.7777 10.4601 -7.6369 -3.1813 -36.9311(*)
NONACCRU -41.8299(*) -15.6617(*) -13.4869 -11.7802(*) -28.8634
AGLOANS 13.0803 -0.7124 -2.2608 0.6398 0.2441
USCNILOAN -4.5225(*) -0.6746 0.2074 0.3456 2.2171(*)
FORCNILOAN 7.6928(**) -1.7173 -3.1571 -3.5811(**) -2.9095(**)
BIGCDS 1.3781 1.2564 1.4196 2.0992(**) 2.1061(*)
ALLL -7.4713 -30.9109(**) -17.7997 -45.6488(*) -21.7108(*)
PLLL -19.6462 29.1064(**) -20.5434 -1.8351 7.531
GDPGROWTH 0.081 0.1159(*) 0.0567 0.0968(*) 0.0886(*)
DEMDEPS -1.0204 -0.6074 -1.3046 -0.3834 0.5192
TECHNFA -198.516(**) -155.696(*) -50.7352 -86.6458(*) -52.3786(*)
NOW 5.6645 -1.0519 -0.1798 0.4771 -1.6073(*)
MMDA -0.7651 -0.5177 -1.0683(**) -0.4529 -0.949(*)
SMALLCD 1.4508 0.6065 -0.8628 -0.6138 0.2207
ORIGI 0.3485 -0.0853 0.5731 0.0613 -0.2059
ESCR -0.4804 0.3872 -0.2329 -0.1989 -0.5312(*)
RULE -0.6531 -0.1206 -0.1506 -0.3735(*) -0.7585(*)
DEBIT -0.6726 0.2817 -0.2039 0.1474 0.0048
Observations N = 2,944 N = 5,599 N = 4,853 N = 27,726 N = 96,901
R-Square R2 = 0.04 R2 = 0.06 R2 = 0.06 R2 = 0.06 R2 = 0.05
Note: Autoregressive model with 4 lags of the dependent variable, coefficients for 4 lags of the dependent variable are not presented in the table (*) significance at the 99% level, (**) significance at the 95% level.
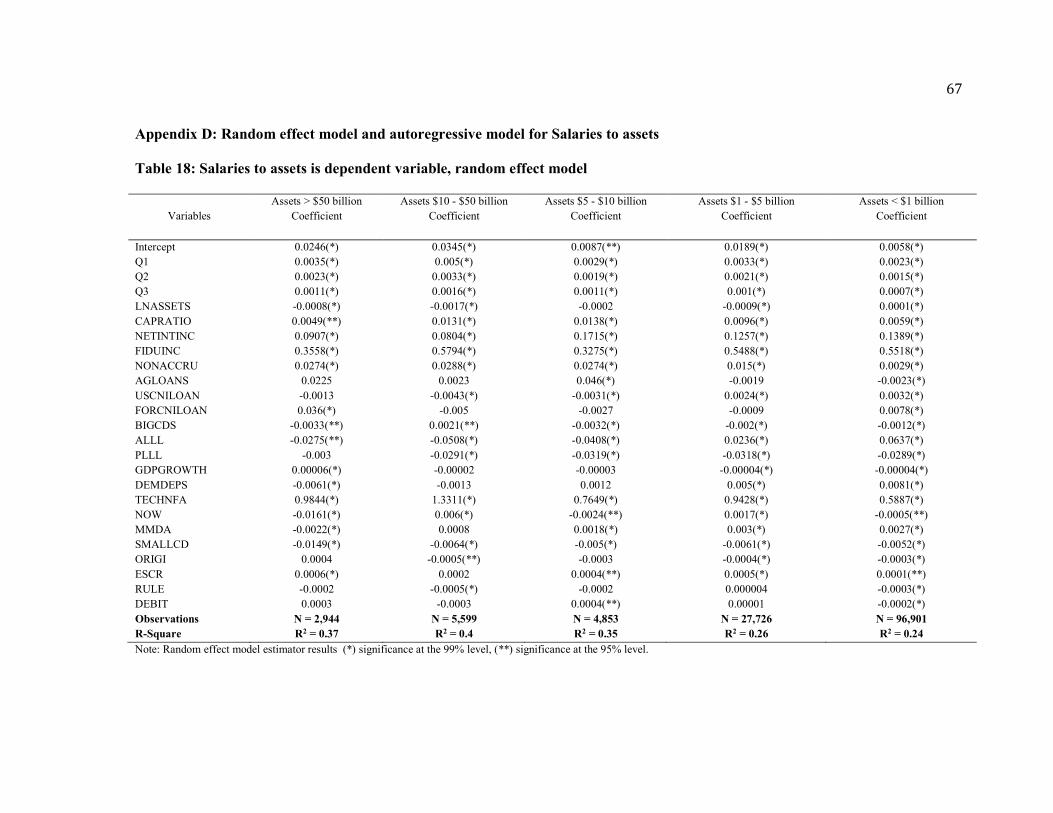
67
Appendix D: Random effect model and autoregressive model for Salaries to assets
Table 18: Salaries to assets is dependent variable, random effect model
Variables
Assets > $50 billion
Coefficient
Assets $10 - $50 billion
Coefficient
Assets $5 - $10 billion
Coefficient
Assets $1 - $5 billion
Coefficient
Assets < $1 billion
Coefficient
Intercept 0.0246(*) 0.0345(*) 0.0087(**) 0.0189(*) 0.0058(*)
Q1 0.0035(*) 0.005(*) 0.0029(*) 0.0033(*) 0.0023(*)
Q2 0.0023(*) 0.0033(*) 0.0019(*) 0.0021(*) 0.0015(*)
Q3 0.0011(*) 0.0016(*) 0.0011(*) 0.001(*) 0.0007(*)
LNASSETS -0.0008(*) -0.0017(*) -0.0002 -0.0009(*) 0.0001(*)
CAPRATIO 0.0049(**) 0.0131(*) 0.0138(*) 0.0096(*) 0.0059(*)
NETINTINC 0.0907(*) 0.0804(*) 0.1715(*) 0.1257(*) 0.1389(*)
FIDUINC 0.3558(*) 0.5794(*) 0.3275(*) 0.5488(*) 0.5518(*)
NONACCRU 0.0274(*) 0.0288(*) 0.0274(*) 0.015(*) 0.0029(*)
AGLOANS 0.0225 0.0023 0.046(*) -0.0019 -0.0023(*)
USCNILOAN -0.0013 -0.0043(*) -0.0031(*) 0.0024(*) 0.0032(*)
FORCNILOAN 0.036(*) -0.005 -0.0027 -0.0009 0.0078(*)
BIGCDS -0.0033(**) 0.0021(**) -0.0032(*) -0.002(*) -0.0012(*)
ALLL -0.0275(**) -0.0508(*) -0.0408(*) 0.0236(*) 0.0637(*)
PLLL -0.003 -0.0291(*) -0.0319(*) -0.0318(*) -0.0289(*)
GDPGROWTH 0.00006(*) -0.00002 -0.00003 -0.00004(*) -0.00004(*)
DEMDEPS -0.0061(*) -0.0013 0.0012 0.005(*) 0.0081(*)
TECHNFA 0.9844(*) 1.3311(*) 0.7649(*) 0.9428(*) 0.5887(*)
NOW -0.0161(*) 0.006(*) -0.0024(**) 0.0017(*) -0.0005(**)
MMDA -0.0022(*) 0.0008 0.0018(*) 0.003(*) 0.0027(*)
SMALLCD -0.0149(*) -0.0064(*) -0.005(*) -0.0061(*) -0.0052(*)
ORIGI 0.0004 -0.0005(**) -0.0003 -0.0004(*) -0.0003(*)
ESCR 0.0006(*) 0.0002 0.0004(**) 0.0005(*) 0.0001(**)
RULE -0.0002 -0.0005(*) -0.0002 0.000004 -0.0003(*)
DEBIT 0.0003 -0.0003 0.0004(**) 0.00001 -0.0002(*)
Observations N = 2,944 N = 5,599 N = 4,853 N = 27,726 N = 96,901
R-Square R2 = 0.37 R2 = 0.4 R2 = 0.35 R2 = 0.26 R2 = 0.24
Note: Random effect model estimator results (*) significance at the 99% level, (**) significance at the 95% level.
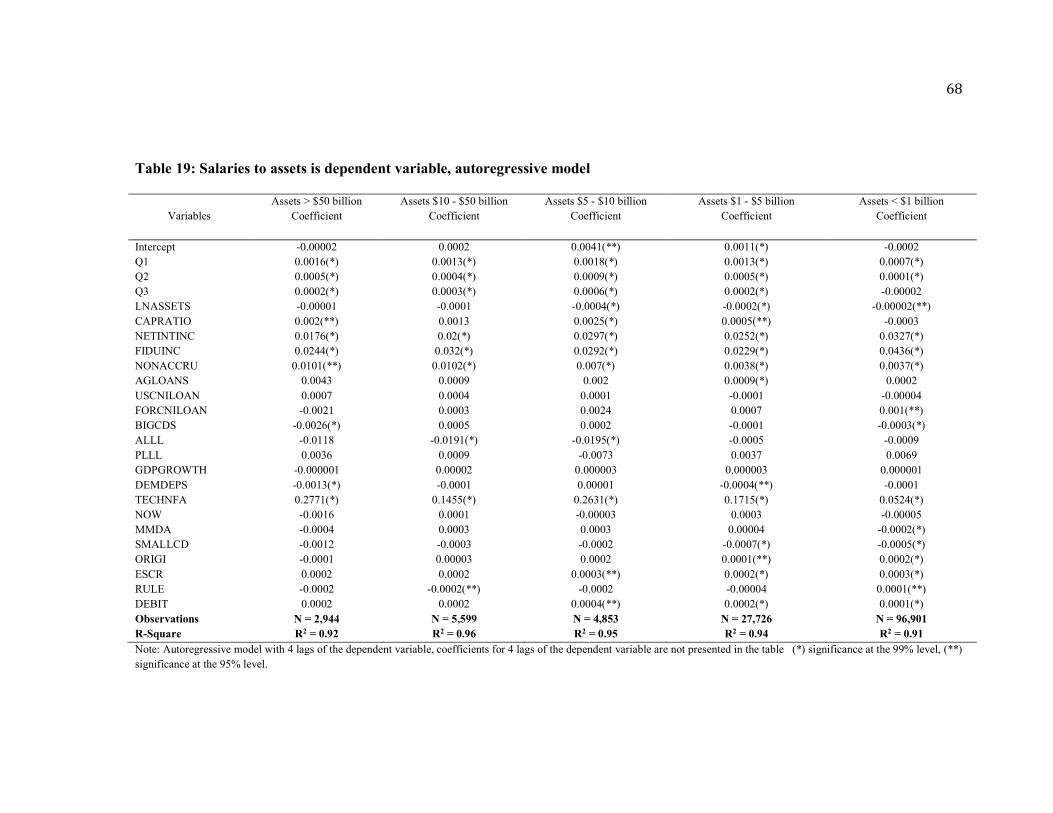
68
Table 19: Salaries to assets is dependent variable, autoregressive model
Variables
Assets > $50 billion
Coefficient
Assets $10 - $50 billion
Coefficient
Assets $5 - $10 billion
Coefficient
Assets $1 - $5 billion
Coefficient
Assets < $1 billion
Coefficient
Intercept -0.00002 0.0002 0.0041(**) 0.0011(*) -0.0002
Q1 0.0016(*) 0.0013(*) 0.0018(*) 0.0013(*) 0.0007(*)
Q2 0.0005(*) 0.0004(*) 0.0009(*) 0.0005(*) 0.0001(*)
Q3 0.0002(*) 0.0003(*) 0.0006(*) 0.0002(*) -0.00002
LNASSETS -0.00001 -0.0001 -0.0004(*) -0.0002(*) -0.00002(**)
CAPRATIO 0.002(**) 0.0013 0.0025(*) 0.0005(**) -0.0003
NETINTINC 0.0176(*) 0.02(*) 0.0297(*) 0.0252(*) 0.0327(*)
FIDUINC 0.0244(*) 0.032(*) 0.0292(*) 0.0229(*) 0.0436(*)
NONACCRU 0.0101(**) 0.0102(*) 0.007(*) 0.0038(*) 0.0037(*)
AGLOANS 0.0043 0.0009 0.002 0.0009(*) 0.0002
USCNILOAN 0.0007 0.0004 0.0001 -0.0001 -0.00004
FORCNILOAN -0.0021 0.0003 0.0024 0.0007 0.001(**)
BIGCDS -0.0026(*) 0.0005 0.0002 -0.0001 -0.0003(*)
ALLL -0.0118 -0.0191(*) -0.0195(*) -0.0005 -0.0009
PLLL 0.0036 0.0009 -0.0073 0.0037 0.0069
GDPGROWTH -0.000001 0.00002 0.000003 0.000003 0.000001
DEMDEPS -0.0013(*) -0.0001 0.00001 -0.0004(**) -0.0001
TECHNFA 0.2771(*) 0.1455(*) 0.2631(*) 0.1715(*) 0.0524(*)
NOW -0.0016 0.0001 -0.00003 0.0003 -0.00005
MMDA -0.0004 0.0003 0.0003 0.00004 -0.0002(*)
SMALLCD -0.0012 -0.0003 -0.0002 -0.0007(*) -0.0005(*)
ORIGI -0.0001 0.00003 0.0002 0.0001(**) 0.0002(*)
ESCR 0.0002 0.0002 0.0003(**) 0.0002(*) 0.0003(*)
RULE -0.0002 -0.0002(**) -0.0002 -0.00004 0.0001(**)
DEBIT 0.0002 0.0002 0.0004(**) 0.0002(*) 0.0001(*)
Observations N = 2,944 N = 5,599 N = 4,853 N = 27,726 N = 96,901
R-Square R2 = 0.92 R2 = 0.96 R2 = 0.95 R2 = 0.94 R2 = 0.91
Note: Autoregressive model with 4 lags of the dependent variable, coefficients for 4 lags of the dependent variable are not presented in the table (*) significance at the 99% level, (**)
significance at the 95% level.
Related Documents