1.ABSTRACT A simple “power law” velocity profile is used to study the effects of pipe roughness and Reynolds Number (Re) on ultrasonic meter performance. Considered here are two measure- ment methods. The first utilize a single bounce path through the pipe center, and is common to multipath as well as single path meters. The second employs four parallel chordal paths, (e.g. Daniel SeniorSonic). The single path centerline measurement requires typical corrections from 4% to 8% for changes in velocity profile due to variations in pipe roughness and Re. A correction for Re can be calculated from additional information on fluid density and viscosity, but changes of roughness with time cannot be measured, and hence cannot be corrected. It will be shown that the four path meter does an excellent job of integrating the velocity profile to give the correct flow rate over a wide range of both Re and roughness. A mathematically generated profile similar to that from a single bend is used to study the effects of asymmetry on the performance of both measurements. The centerline measure- ment varies over about 1.5%, depending on the path orientation relative to the asymmetry. Unfortunately applying a typical Re correction then creates a bias error of about 4%. In con- trast, the four path meter accurately integrates the velocity profile to give an answer within 0.2% of the flow irrespective of orientation. Furthermore the four-path meter is capable of recognizing the changes in operating conditions. 117 THE EFFECTS OF REYNOLDS NUMBER,WALL ROUGHNESS,AND PROFILE ASYMMETRY ON SINGLE- AND MULTI- PATH ULTRASONIC METERS Klaus J. Zanker, Daniel Industries 117

Welcome message from author
This document is posted to help you gain knowledge. Please leave a comment to let me know what you think about it! Share it to your friends and learn new things together.
Transcript
1.ABSTRACT
A simple “power law” velocity profile is used to study the effects of pipe roughness andReynolds Number (Re) on ultrasonic meter performance. Considered here are two measure-ment methods. The first utilize a single bounce path through the pipe center, and is commonto multipath as well as single path meters. The second employs four parallel chordal paths,(e.g. Daniel SeniorSonic).
The single path centerline measurement requires typical corrections from 4% to 8% forchanges in velocity profile due to variations in pipe roughness and Re. A correction for Recan be calculated from additional information on fluid density and viscosity, but changes ofroughness with time cannot be measured, and hence cannot be corrected. It will be shownthat the four path meter does an excellent job of integrating the velocity profile to give thecorrect flow rate over a wide range of both Re and roughness.
A mathematically generated profile similar to that from a single bend is used to study the effects of asymmetry on the performance of both measurements. The centerline measure-ment varies over about 1.5%, depending on the path orientation relative to the asymmetry.Unfortunately applying a typical Re correction then creates a bias error of about 4%. In con-trast, the four path meter accurately integrates the velocity profile to give an answer within0.2% of the flow irrespective of orientation. Furthermore the four-path meter is capable ofrecognizing the changes in operating conditions.
117
THE EFFECTS OF REYNOLDS NUMBER,WALLROUGHNESS,AND PROFILE ASYMMETRY ONSINGLE- AND MULTI- PATH ULTRASONIC METERS
Klaus J. Zanker, Daniel Industries
117

2. EFFECTS OF REYNOLDS NUMBER AND WALL ROUGHNESSON SINGLE PATH CENTER LINE ULTRASONIC METERS
Power Law Velocity ProfileThe velocity profile in pipe flow is quite complex, but a simple power law is a good appro-ximation everywhere except at the pipe center, where the velocity gradient (dv/dy)R exhibitsa discontinuity. This is not too serious because there is no flow through the exact center ofthe pipe, since the area is zero.
The power law profile is defined by
whereVmax = the velocity at the meter axis y = the distance from the meter walln = the ‘power’v = the velocity at yR = the meter radius
By integrating over the pipe area, one obtains the average flow velocity Vavg from
whereQ = the volumetric flow rater = the radial location of v (r = R – y)
After integration this yields
By integrating along the pipe diameter, one obtains the average center chord velocity Vchdfrom
which after integration yields
A correction factor CF can then be defined as the factor used to bring the center chordal velocity to the true average velocity.
118

It is plotted in Figure 1 as a function of the power law exponent.
Wall Roughness, Reynolds Number, and the Power Law ProfileTo be able to use this correction factor one needs to find a way of expressing n in real worldterms of Re and Wall Roughness WR. Fortunately, Prandtl and Nikuradse [Ref.1] sorted thisout in the 1930’s when considering the friction loss in pipe flow. The friction factor (f) de-pends upon Re and the relative Wall Roughness WR/d (to the pipe diameter d), but can alsobe related to the velocity profile through the shear stress at the pipe wall. The friction loss isproportional to the wall shear stress, which in turn is proportional to the velocity gradient atthe pipe wall.
The relationship is given by:
This simplifies for the two special cases. For hydraulically smooth pipe flow with WR = 0,This is shown in Figure 2
119

Figure 2. Relation of n to Reynolds number in smooth pipe flow.
Then for fully turbulent rough pipe flow, as Re V→∞
This is shown in Figure 3.
Figure 3. Relation of n to wall roughness in fully turbulent flow.
Practical ImplicationsThis work shows that a meter using a single path through the center of the pipe will overes-timate the flow by between 4% and 9% if no correction factor is applied. The overestimateis due to the high velocity in the center of the pipe affecting the line integral disproportiona-te to the small area represented.
It is quite straightforward to calculate the Reynolds Number (Re) from:
120

Measuring the pressure and temperature allow reasonable estimates of the density r and viscosity m. Then the correction factor CF can be calculated from this live value of Re.If the relative Wall Roughness WR/d is known it is easy to calculate a correction factor.Although WR/d might be known for a new pipe, there is no measure of how it changes withtime. Hence it is not possible to make a real-time profile correction for WR/d.The effects of changing roughness are shown in Figure 4.
Figure 4. Variation of CF with pipe roughness and diameter.
Thus it is quite easy to produce 0.5 to 1% error with time as the pipe roughness changes, without any means of correction.
3. EFFECTS OF REYNOLDS NUMBER AND PIPE ROUGHNESSON A FOUR-PATH ULTRASONIC METER
The Four-Path Ultrasonic Meter GeometryAn arrangement of four chordal paths proposed by British Gas is that shown in Figure 5.
Figure 5. Ultrasonic multipath geometry proposed by British Gas.
121
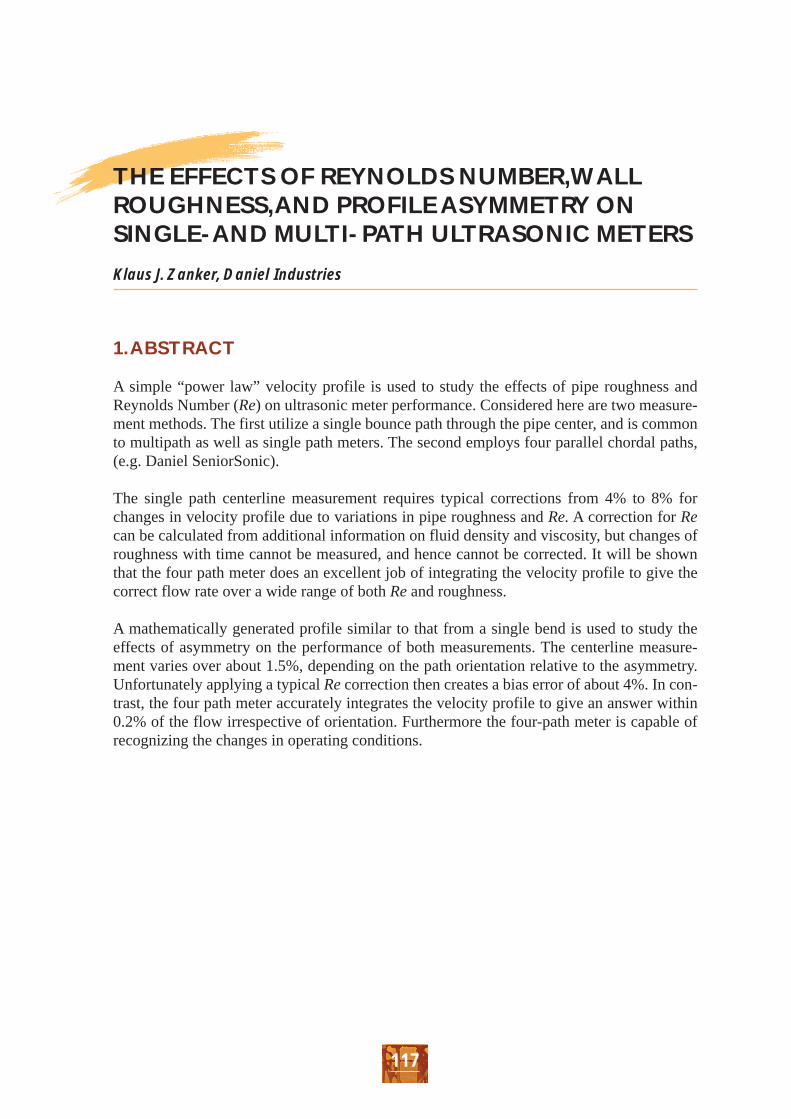
A Gauss-Jacobi numerical integration [Ref.2] gives the average flow velocity Vavg over thearea of the pipe from the weighted sum of the line averages along the chords Vi
where the weighting factors, Wi, are determined for the specific chord locations. Note that
It is significant that integration of a uniform velocity profile, using this method would givethe correct answer. Another interpretation of the weighting factors Wi is the proportion ofpipe area associated with each chord to obtain the flow, the sum of which must be 1 unity.
The average chord velocity Vi is obtained as shown in Figure 6.
Figure 6. Evaluation of chordal integration.
This is integrated numerically by dividing the integration path s into 10 or more parts. Careis required with the segment next to the wall because of the very steep velocity gradient.
Chordal IntegrationNumerical integration of the chord velocities for the four-path configuration has been per-formed for a range of n in the power law distribution. A typical example for n = 7 and n = 12is shown in Figure 7.
Note, these represent the same average flow with Vavg = 1, hence if the velocity increases inthe center of the pipe it must decrease near the wall to maintain continuity. In this examplethe velocity on the centerline increases from 1.04 to 1.07, which is the error made by a meter using a single path through the centerline. However, with the four-path meter whenthe velocity on Chord-B increases, that on Chord-A decreases. The decrease on Chord-A isgreater than the increase on Chord-B, but this is compensated for by the weighting factors togive virtually the same flow.
122

Figure 7. Velocity profile with four-path meter for two values of n.
The numerical integration process is shown in the table below:
Furthermore there is information to show that the velocity profile has changed, by the ratioVBC / VAD, due to either Reynolds No or pipe roughness.
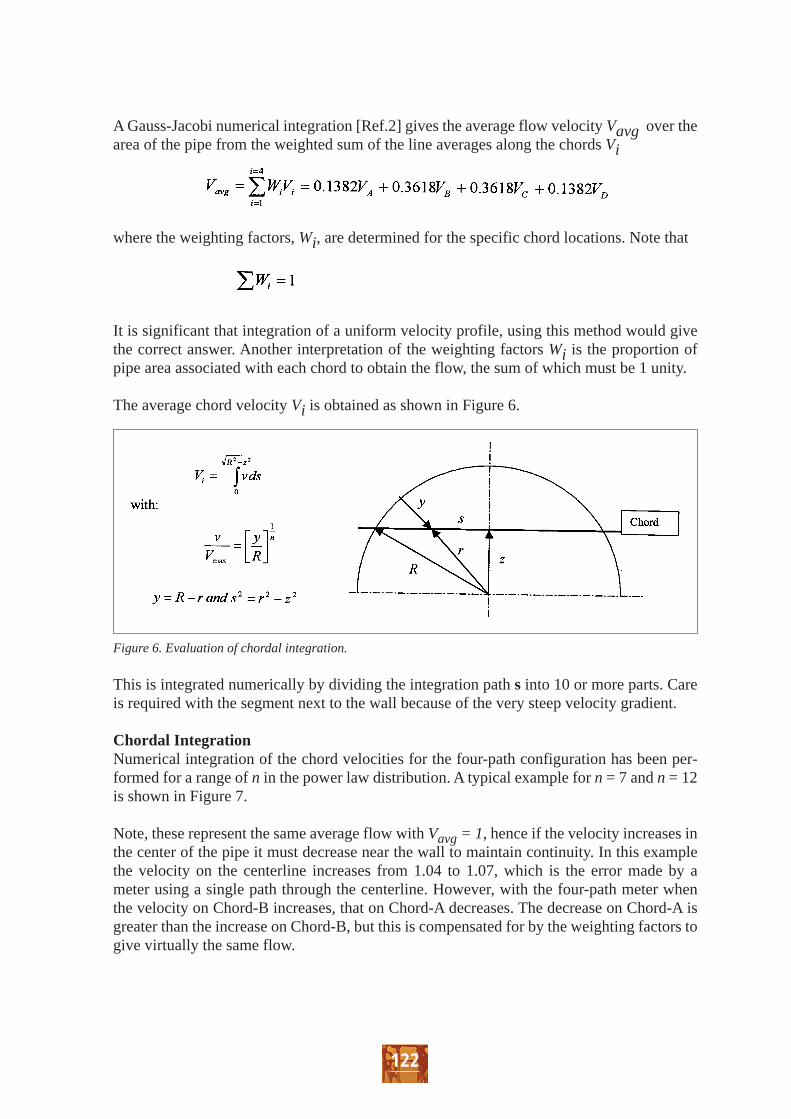
This process is repeated for values of n from 4 to 14, and the four-path meter (SeniorSonic)is compared to the single path through the centerline (JuniorSonic) with the result shown inFigure 8.
The four-path meter does an excellent job of integrating a power law profile, with a maxi-mum error of 0.06% at n = 4, and from n = 5 to 14 the error is reduced to 0.03%. Thus themeter should be immune to normal changes in Reynolds Number and pipe roughness, whe-reas the meter which depends on a single path through the center shows a 7% variation overthe complete range.
123
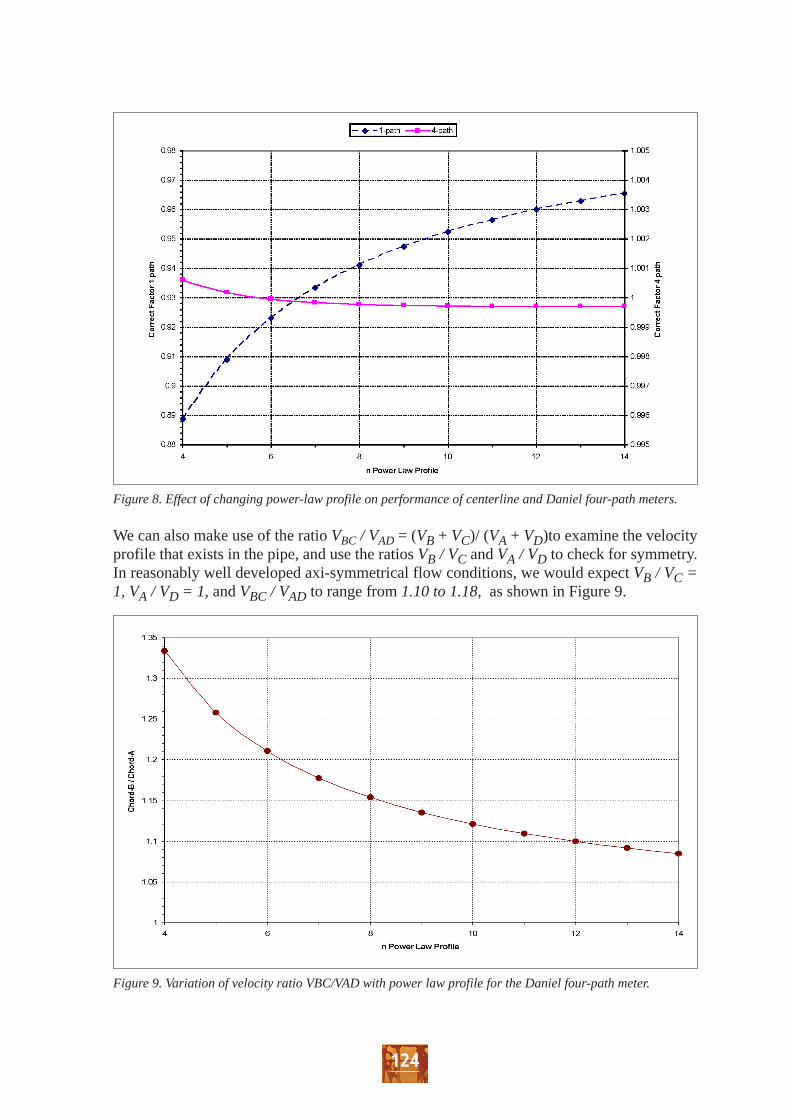
Figure 8. Effect of changing power-law profile on performance of centerline and Daniel four-path meters.
We can also make use of the ratio VBC / VAD = (VB + VC)/ (VA + VD)to examine the velocityprofile that exists in the pipe, and use the ratios VB / VC and VA / VD to check for symmetry.In reasonably well developed axi-symmetrical flow conditions, we would expect VB / VC =1, VA / VD = 1, and VBC / VAD to range from 1.10 to 1.18, as shown in Figure 9.
Figure 9. Variation of velocity ratio VBC/VAD with power law profile for the Daniel four-path meter.
124
4.THE EFFECT OF FLOW PROFILE ASYMMETRY ON SINGLEAND MULTI PATH ULTRASONIC METERS
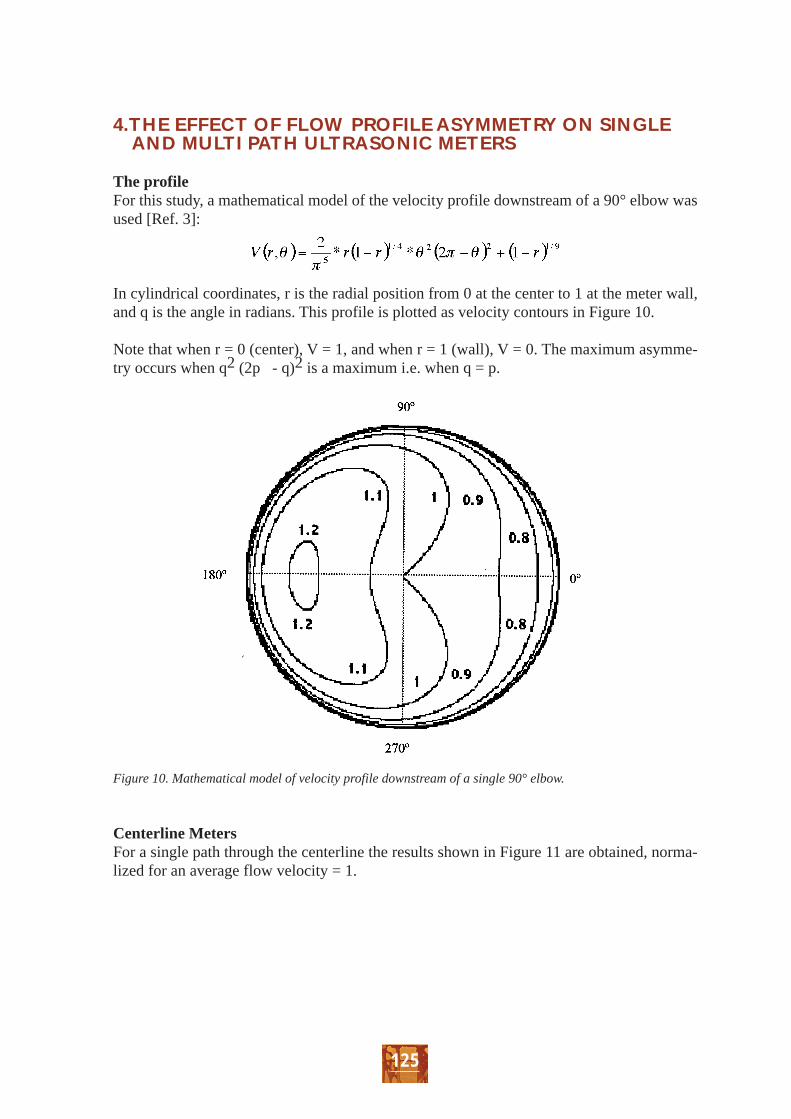
The profileFor this study, a mathematical model of the velocity profile downstream of a 90° elbow wasused [Ref. 3]:
In cylindrical coordinates, r is the radial position from 0 at the center to 1 at the meter wall,and q is the angle in radians. This profile is plotted as velocity contours in Figure 10.
Note that when r = 0 (center), V = 1, and when r = 1 (wall), V = 0. The maximum asymme-try occurs when q2 (2p - q)2 is a maximum i.e. when q = p.
Figure 10. Mathematical model of velocity profile downstream of a single 90° elbow.
Centerline MetersFor a single path through the centerline the results shown in Figure 11 are obtained, norma-lized for an average flow velocity = 1.
125

Figure 11. Velocities measured along centerline chords at various angles.
To give an idea of the asymmetry, the velocity which would be measured along a radius (halfa chord) is shown by the broken line and second y-axis. The minimum velocity at 0° is 0.9and the maximum at 180o is 1.125 i.e. a 25% variation.
The variation of velocity with the angular position (θ) of the diameter is much less: 1.012 at0 o and 1.026 at 90° or 1.4% and the actual value of the velocity is quite close the averageflow velocity of 1. However, since it is normal practice to make a Reynolds number correc-tion (CF) for a single path through the centerline as shown in Figure 1, with n = 9 the powerlaw velocity profile CF = 0.947. Thus the meter output would vary from 0.958 to 0.972, or a3 – 4% error.
If two diameters are used at right angles to one another, made up from 0° and 90°, 30° and120°, etc., the output is virtually constant at 1.02 making the two path meter independent ofangular position. Once again the Reynolds number correction will turn this +2% error into a–3% error and is not good in disturbed flows.
126

Four-path SeniorSonicIntegrating along the chords of the four-path meter, located at +/- 0.309 R and +/- 0.809 Rgives the results shown in Figure 12.
Figure 12. Chord measurements from four-path USM downstream from a bend.
The profile is not axi-symmetric, so the four-paths reflect the asymmetry in all cases exceptat the 90o position, where the paths and profile are symmetric about the 0o position. This isa mathematical profile which would never perfectly exist in practice, but which can be usedto simplify integration.
The ratios of chord velocities can again be used as a measure of asymmetry as shown inFigure 13. In fully developed flow the velocities of the outer chords are 0.89 and the innerchords are 1.042, so VA / VD = VB / VC = 1 and VB / VA = VC / VD = 1.042 / 0.89 = 1.171
When the profile looks symmetrical at 90o, VBC / VAD = 1.075 which is 10% off normal(1.171) and suggests that the profile is too flat.
The outer and inner chord velocities are shown in Figure 14, together with the results of theintegration for the average flow velocity. The four-path integration technique does a verygood job on this asymmetric profile, and is 0.2% high virtually independent of the angularorientation of the chords (shown on second Y axis).
The mean chord data gives VAD = 0.94 and VBC = 1.03, which again appears more flat thanthe normal fully developed flow.
127

Figure 13. Velocity ratios from four-path ultrasonic meter downstream of a bend.
Figure 14. Inner and outer chord velocity contributions to the average flow velocity for the four-path ultraso-
nic meter downstream of a bend.
128
5. CONCLUSIONS
For centerline measurements in fully developed flow, corrections of 4 – 8% are necessary tocorrect for Reynolds number and roughness variations. Re variation can be corrected dyna-mically from knowledge of r and m, but variations in roughness can cause uncompensatederrors of as much as 1%.
In asymmetric flow, variations of 1.5% can occur due to the orientation of the centerlinechord relative to the asymmetry. An error of +1.5% will then become – 4% when the normalRe correction is applied. One can thus conclude that Reynolds number correction is inappropriate in disturbed flow, but only applies strictly to fully developed flow.
A flow conditioner might help improve the disturbed profile, but at the expense of additio-nal pressure loss, cost, blockage and potential fouling. Furthermore, bi-directional flowwould require two flow conditioners with separate forward and reverse calibrations.
Turning now to a four-path meter of the Daniel Senior Sonic type, in fully developed flow,corrections of only 0.06% account for all Re and roughness effects. In the asymmetric flowdownstream of a single elbow, the integration error has been shown to be only 0.2%, irres-pective of orientation. This is at least an order of magnitude less than the errors from a sing-le path centerline meter.
Fixed upstream pipe-work would normally be expected to produce a fixed velocity profile,however with “T” pieces or headers the velocity profile can change with the proportion offlow in the respective branches. The four-path meter would detect and measure such chang-es through the velocity profile, while the integration technique would still give the correctflow rate. In fact four velocity measures of the profile are a very useful diagnostic tool provided by the meter.
The better accuracy and superior diagnostic ability of the four-path meter justify the claim that itis suitable for fiscal measurement, while the single path centerline meter is clearly not suitable.
A final interesting observation from the flow asymmetry work is that the velocity profileseen by the four chords is not unique for different orientations in the same flow. Hence itwould be extremely difficult to devise a better integration technique (e.g. using variableweighing factors) that makes use of this velocity profile information. In fact it is obviouslyunnecessary, as the Gauss-Jacobi integration method works remarkably well.
REFERENCES
1. “Boundary Layer Theory” by H. Schlichting, McGraw-Hill Book Co. 1960
2. ISO/TR 12765:1997(E), Measurement of Fluid Flow in Closed Conduits – MethodsUsing Transit Time Ultrasonic Flowmeters.
3. Franc, S., Heilmann, C. and Siekmann, H. E. “Point Velocity Method for Flow RateMeasurement in Asymmetric Pipe Flow” Flow Meas. Instrum. Vol. 7 No. 314 1996
129
Related Documents