HAL Id: hal-00295697 https://hal.archives-ouvertes.fr/hal-00295697 Submitted on 22 Jul 2005 HAL is a multi-disciplinary open access archive for the deposit and dissemination of sci- entific research documents, whether they are pub- lished or not. The documents may come from teaching and research institutions in France or abroad, or from public or private research centers. L’archive ouverte pluridisciplinaire HAL, est destinée au dépôt et à la diffusion de documents scientifiques de niveau recherche, publiés ou non, émanant des établissements d’enseignement et de recherche français ou étrangers, des laboratoires publics ou privés. The effects of lightning-produced NOx and its vertical distribution on atmospheric chemistry: sensitivity simulations with MATCH-MPIC L. J. Labrador, R. von Kuhlmann, M. G. Lawrence To cite this version: L. J. Labrador, R. von Kuhlmann, M. G. Lawrence. The effects of lightning-produced NOx and its ver- tical distribution on atmospheric chemistry: sensitivity simulations with MATCH-MPIC. Atmospheric Chemistry and Physics, European Geosciences Union, 2005, 5 (7), pp.1815-1834. hal-00295697

Welcome message from author
This document is posted to help you gain knowledge. Please leave a comment to let me know what you think about it! Share it to your friends and learn new things together.
Transcript

HAL Id: hal-00295697https://hal.archives-ouvertes.fr/hal-00295697
Submitted on 22 Jul 2005
HAL is a multi-disciplinary open accessarchive for the deposit and dissemination of sci-entific research documents, whether they are pub-lished or not. The documents may come fromteaching and research institutions in France orabroad, or from public or private research centers.
L’archive ouverte pluridisciplinaire HAL, estdestinée au dépôt et à la diffusion de documentsscientifiques de niveau recherche, publiés ou non,émanant des établissements d’enseignement et derecherche français ou étrangers, des laboratoirespublics ou privés.
The effects of lightning-produced NOx and its verticaldistribution on atmospheric chemistry: sensitivity
simulations with MATCH-MPICL. J. Labrador, R. von Kuhlmann, M. G. Lawrence
To cite this version:L. J. Labrador, R. von Kuhlmann, M. G. Lawrence. The effects of lightning-produced NOx and its ver-tical distribution on atmospheric chemistry: sensitivity simulations with MATCH-MPIC. AtmosphericChemistry and Physics, European Geosciences Union, 2005, 5 (7), pp.1815-1834. �hal-00295697�

Atmos. Chem. Phys., 5, 1815–1834, 2005www.atmos-chem-phys.org/acp/5/1815/SRef-ID: 1680-7324/acp/2005-5-1815European Geosciences Union
AtmosphericChemistry
and Physics
The effects of lightning-produced NOx and its vertical distributionon atmospheric chemistry: sensitivity simulations withMATCH-MPIC
L. J. Labrador, R. von Kuhlmann, and M. G. Lawrence
Max-Planck Institute for Chemistry, Department of Airchemistry/NWG, J. J. Becherweg 27, 55128 Mainz, Germany
Received: 6 July 2004 – Published in Atmos. Chem. Phys. Discuss.: 6 October 2004Revised: 3 June 2005 – Accepted: 7 June 2005 – Published: 22 July 2005
Abstract. The impact of different assumptions concern-ing the source magnitude as well as the vertical placementof lightning-produced nitrogen oxides is studied using theglobal chemistry transport model MATCH-MPIC. The re-sponses of NOx, O3, OH, HNO3 and peroxyacetyl-nitrate(PAN) are investigated. A marked sensitivity to both param-eters is found. NOx burdens globally can be enhanced byup to 100% depending on the vertical placement and sourcemagnitude strength. In all cases, the largest enhancementsoccur in the tropical upper troposphere, where lifetimes ofmost trace gases are longer and where they thus become moresusceptible to long-range transport by large-scale circulationpatterns. Comparison with observations indicate that 0 and20 Tg(N)/yr production rates of NOx from lightning are toolow and too high, respectively. However, no single interme-diate production rate or vertical distribution can be singledout as best fitting the observations, due to the large scatter inthe datasets. This underscores the need for further measure-ment campaigns in key regions, such as the tropical conti-nents.
1 Introduction
Nitrogen oxides (NOx=NO+NO2) play an important role intropospheric chemistry. They are catalytic precursors ofozone (O3) and also have a strong influence on the hy-droxyl radical (OH) concentration. Lightning-produced ni-trogen oxides constitute an important part of the total NOxbudget, and lightning is one of the sources with the largestuncertainties, with estimates ranging from 1–20 Tg(N)/yr(Lawrence et al., 1995; Price et al., 1997a). Under cer-tain conditions, lightning can compete with anthropogenicsources of NOx and even be the domintaing source (Zhang
Correspondence to:L. Labrador([email protected])
et al., 2003a). Produced mostly in and around active thunder-storms, lightning-produced NOx (ltNOx hereafter) is read-ily carried by convective updrafts to the upper troposphere(UT), where its lifetime is considerably longer than in thelower troposphere (LT). The link between lightning and ni-trogen oxides was probably first recognized in 1827 by J. vonLiebig (von Liebig, 1827), although it was not until the 1970sthat further studies were conducted to determine its role inthe photochemistry of the LT, primarily in controlling ozoneconcentrations. LtNOx is also closely linked with OH radi-cal production and hence has the potential to affect the atmo-sphere’s oxidizing efficiency (Labrador et al., 2004). In or-der to determine an accurate budget for tropospheric ozone,it is crucial to determine an accurate budget for LtNOx. Thelarge uncertainty in LtNOx production estimates is reflectedin Table1. From early estimates of the production range ex-ceeding 100 Tg(N)/yr, only in the last decade do we see theestimates in different studies settling within the 1–20 Tg(N)range. While recent studies (e.g.,Huntrieser et al.(2002);Wang et al.(1998)) point towards the lower end of that pro-duction range, there is not yet enough solid evidence to dis-card the upper end thereof. The reasons for this large un-certainty are many-fold; among them, on the one hand, therelatively poorly understood aspects of the lightning phe-nomenon itself, including the charge separation process, theamount of energy deposited per flash, the partitioning amongcloud-to-ground, intracloud and intercloud flashes and, onthe other hand, those aspects related to the production ofNOx, such as the amount of NO molecules produced perflash or per unit energy. While a number of laboratory stud-ies have been carried out to determine these parameters, is-sues such as the similarity of simulated sparks to real flashesand the scalability of laboratory measurements to the char-acteristic dimensions of the atmosphere may be a sourceof error. The global distribution of lightning and the totalglobal flash rate continue to be a source of uncertainty, al-though this has been improved substantially by the recent
© 2005 Author(s). This work is licensed under a Creative Commons License.

1816 L. Labrador et al.: Effects of lightning-NOx on tropospheric chemistry
Table 1. Global estimates of lightning-produced NOx (values prior to 1995 adopted fromLawrence et al., 1995).
Reference Molec.(NO)/unit energy Molec.(NO)/flash Number of flashes LtNOx production rate(type of estimate) (×1016 molec./J) (×1025 molec./flash) (flashes/sec) (Tg(N)/yr)
Tuck (1976)a - 1.1 500 4Chameides et al.(1977)a 3–7 6–14 400 18–41Noxon(1976)c - 10 500 37Chameides(1979)a 8–17 16–34 400 47–100Dawson(1980)a - 0.8 500 3Hill et al. (1980)a - 1.2 100 0.9Levine et al.(1981)b 5±2 0.5 500 1.8±0.7Kowalczyk and Bauer(1982)a - 10 50 5.7Peyrous and Lapyere(1982)b 1.6 3.2 400 9.4Drapcho et al.(1983)c - 40 100 30Chameides et al.(1987)d - - - 7Franzblau and Popp(1989)c - 300 100 220Sisterson and Liaw(1990)a - 8.2 200 12Liaw et al.(1990)e - - - 81Lawrence et al.(1995)e - 2.3(1–7) 100(70–150) 2(1–8)Kumar et al.(1995)c - 0.5 100 2Ridley et al.(1996)c - - 100 2–5Levy et al.(1996)a - - - 2–6Price et al.(1997a)c 10 - 70–100 12.2(5–20)Price et al.(1997b)a 10 - - 13.2(5–25)Wang et al.(1998)b - 3.1 30–100 2.5–8.3Nesbitt et al.(2000)c - 0.87–6.2 57 0.9Navarro-Gonzales et al.(2001)b 15±5 - - -Huntrieser et al.(2002)c - 2.7× 10²¹ molec/m flash - 3Christian et al.(2003)c - - 44±5 -Fehr et al.(2004)c - 21 - -Ridley et al.(2004)c - 0.3–6.1 - 1.1–19.6
a Theoretical estimateb Laboratory-based estimatec Field observations-based estimated Thunderstorm extrapolation-based estimatee Review-based estimate
advent of dedicated space-borne observation platforms suchas the Optical Transient Detector (OTD) and Lightning Imag-ing Sensor (LIS) (Christian et al., 2003). Airborne observa-tion campaigns provide critically-needed data to help evalu-ate model results. As will be discussed later, there is a defi-nite need for further measurements of NOx enhancements instorm areas, particularly in the tropics.
3D global chemistry transport models (CTMs) also con-stitute useful and powerful tools to study the production ofLtNOx and its potential effects on atmospheric chemistry. Inthis paper, we study the sensitivity of tropospheric chemistryto various assumptions concerning the vertical placement andsource magnitude of LtNOx using a 3-D CTM. Given the un-certainties mentioned above, it is currently difficult to arriveat definitive conclusions on the effects of these two parame-ters on the overall contribution of lightning NOx. In light ofthis, our main objective with this study is to add to our knowl-edge about lightning-produced NOx and its effects with thehelp of a modeling tool.
This study is broken down as follows; in Sect. 2 a briefdescription of our model, as well as our approach to model-ing the vertical distribution of LtNOx, is laid out. In Sect. 3,the results of model runs with 3 different assumptions con-cerning the vertical placement of LtNOx and 5 different totalsource magnitudes are considered. In Sect. 4 the sensitivityof a number of tropospheric trace gases to different LtNOxsource magnitudes is discussed. In Sect. 5 the results of ourdifferent runs are compared with a set of observations forNOx. Section 6 gives our conclusions.
2 Approach to modeling LtNOx
The model used for this study is the Model of Atmo-spheric Transport and Chemistry, Max-Planck Institute forChemistry version, or MATCH-MPIC, an off-line chem-istry and transport model based on the NCAR CCM (Com-munity Climate Model) that consists of two main parts, a
Atmos. Chem. Phys., 5, 1815–1834, 2005 www.atmos-chem-phys.org/acp/5/1815/

L. Labrador et al.: Effects of lightning-NOx on tropospheric chemistry 1817
(b)
(a)
Fig. 1. Averaged flash activity from a)MATCH-MPIC for 1997 and from b)OTD/LIS for 1995–2003 in flashes/km2/day.
meteorology module and a chemistry module. The chemistrymodule comprises a suite of 140 gas phase reactions plus oneheterogeneous reaction, including the major known sourcesand sinks of ozone and its associated chemistry as describedin detail invon Kuhlmann et al.(2003a). MATCH-MPIC isan off-line model, and therefore needs basic meteorologicaldata as input (temperature, zonal and meridional winds, sur-face pressure, latent and sensible heat fluxes) to calculate theremaining meteorological parameters, namely vertical windvelocity, convective mass fluxes, cloud fraction and precipi-tation and vertical turbulence. Two schemes are used to pa-rameterize moist convection; the penetrative deep convectionscheme byZhang and McFarlane(1995), plus the convectiveadjustment scheme byHack(1994). The runs for this studywere done with input data from the NCEP/NCAR reanaly-sis at a reduced horizontal resolution of T21 (approximately5.6◦
×5.6◦) and an unchanged vertical resolution which com-prises 28 levels, from the surface to 0.2 hPa, in sigma coor-dinates. The runs were carried out for the year 1997 with aspin-up time of four months. A timestep of 30 min was used.Further details on MATCH-MPIC are invon Kuhlmann et al.(2003a), Lawrence et al.(1999, 2003a), Rasch et al.(1997)and references therein.
2.1 Lightning parameterization
The parameterization for the horizontal distribution of light-ning used in MATCH-MPIC is based onPrice and Rind(1992)(PR92 hereafter). PR92 developed a simple lightningparameterization based on cloud top height as a predictor oflightning activity. It has been shown that efficient chargebuildup and separation processes are strongly dependent onupdraft velocity. Cloud top height has in turn been shownto correlate positively with updraft velocity. This, plus thepossibility to readily determine cloud top height from directsatellite measurements, was the basis for choosing it as a firstsuitable predictor of lightning activity. The parameterizedrelationship between cloud top height and flash frequencyis: F=3.44×10⁵ H4.9 for continental convective clouds, andF=6.4×10⁴ H1.73 for marine clouds, where F is the flash fre-quency (in flashes/min/8◦×10◦ box) and H is the modeledcloud top height (in km). Figure1 shows the averaged globallightning distribution using PR92 in MATCH-MPIC for theyear 1997 and as observed by the OTD and LIS for the theperiod from mid 1997 to early 2003. The observed lightningdistribution was made using a composite dataset that makesit possible to combine the larger spatial coverage of the OTDand the longer timespan and better detection efficiency of theLIS. The model captures the main features and the general
www.atmos-chem-phys.org/acp/5/1815/ Atmos. Chem. Phys., 5, 1815–1834, 2005

1818 L. Labrador et al.: Effects of lightning-NOx on tropospheric chemistry
-16LtNOx (kg/m s x10 )
c
d e
-3
f
LtNOx (pptv/day)
Pres
sure
(hP
a)
a b
Fig. 2. Monthly mean LtNOx emissions, from model output, in pptv/day(a–c)and 10−16kg/m3s (d–f), for the three vertical distributions inthis study: PICK (solid line), ANVIL (dashed line) and EVEN (dotted line), at selected locations representative of the PICK distribution’sthree cases: (a) and (d) midlatitude continental (35◦ N, 90◦ W for June 97); (b) and (e) tropical continental (8◦ N, 65◦ W for July 1997) and(c) and (f) tropical marine (12◦ N, 63◦ W for July 1997).
Table 2. MATCH-MPIC runs done for this study.
Run LtNOx production Vertical distribution(Tg(N)/yr)
NoLtNOx 0 N/Aa
EVEN2 2 Density-weighteda
EVEN5 5 Density-weighteda
EVEN10 10 Density-weighteda
PICK2 2 Pickering et al. (1998)PICK5 5 Pickering et al. (1998)PICK10 10 Pickering et al. (1998)PICK20 20 Pickering et al. (1998)ANVIL2 2 Five uppermost layers of cloudANVIL5 5 Five uppermost layers of cloud
a Constant mixing ratio in the vertical
pattern of the observed flash distribution well. The flashactivity over the southeastern United States is well repro-duced, as is the overall pattern over India and southeasternAsia. However, an overestimation of the flash activity is ap-parent over the tropics, particularly over northern and centralSouth America, Central America, southeastern Asia, easternIndia, eastern Borneo, Papua-New Guinea and northern Aus-tralia. On the other hand, flash activity is underestimatedmostly over the extratropics, particularly over the Westernand South Western United States, the Mediterranean basin,parts of central Europe and the Caucasus range, the MiddleEast, Central and South-Central Asia, north-eastern Chinaand southern Australia. Most of the activity over Indone-sia is underestimated, except for easternmost Borneo. Thestrong signal over the Congo basin is well reproduced exceptfor some underestimation at the center of the feature. Coastal
lightning is mostly underestimated by the model as is marinelightning, particularly over the North and South Atlantic andthe northwestern Pacific. While these discrepancies mightbe a result of the lightning parameterization itself, other fac-tors, such as the convection parameterization used and themodel’s failure to reproduce off-shore transport of lightning-active convective clouds, may also play a role. In the last fewyears, other lightning parameterizations have been proposed,particularly focusing on using convective mass fluxes (e.g.,Allen and Pickering(2002)); the use of these in MATCH-MPIC is being examined in a parallel study.
2.2 Vertical distribution of LtNOx in MATCH-MPIC
In previous versions of MATCH-MPIC, LtNOx was input asa uniform volume mixing ratio throughout the vertical con-vective column. This was chosen based on three assump-tions; first, intracloud flashes are much more frequent thancloud to ground flashes (Price and Rind, 1994). Second,cloud to ground discharges are much more energetic than in-tracloud discharges (Turman, 1978; Kowalczyk and Bauer,1982) and third, NOx production by lightning apparently ex-hibits a strong dependence on the ambient air density, beingless for lower densities (Goldenbaum and Dickerson, 1993).The first two can be regarded as canceling each other out toan extent. The third assumption then results in an approxi-mately even mixing ratio (i.e., density-weighted) distributionof the emissions in the vertical. The first and third assump-tions can also be regarded as canceling each other out, even inthe event that intra cloud discharges might be as effective inproducing NOx as cloud to ground discharges, as suggestedby Gallardo and Cooray(1996); Cooray (1997); DeCariaet al.(2000) andFehr et al.(2004). While these assumption
Atmos. Chem. Phys., 5, 1815–1834, 2005 www.atmos-chem-phys.org/acp/5/1815/

L. Labrador et al.: Effects of lightning-NOx on tropospheric chemistry 1819
are hard to prove or disprove, there is recent evidence thatthe vertical distribution of LtNOx in deep-convective cloudsis likely to be quite different from an even mixing ratio inthe vertical.Pickering et al.(1998) (subsequently P98) useda cloud-resolving model to develop a set of profiles to typifythe vertical distribution of LtNOx after a convective storm foruse in specifying the effective lightning NOx source in globaland regional chemistry models. Profiles were computed forthree different regimes: tropical continental, tropical marineand mid-latitude continental. We have implemented all threeprofiles from P98 in MATCH-MPIC and, since a midlati-tude marine profile was not developed in P98, we adoptedthe midlatitude continental profile for all midlatitude areas,marine areas included. The profiles were scaled (stretched orsqueezed in the vertical) to fit the depth of convection in eachmodel column.
A recent study byZhang et al.(2003b) has shown that sim-ulations of different storms can lead to qualitatively similarbut quantitatively different profiles from P98. Thus, morework is needed to determine the most appropriate assump-tions for use in global models. Here we examine the basicsensitivity of the simulated tropospheric chemistry to variousassumed profiles of LtNOx, which provides an indication ofthe degree of importance of refining the knowledge and pa-rameterizations of its vertical placement.
2.3 Sensitivity studies
In order to assess the impact of LtNOx and its vertical place-ment on tropospheric chemistry, a set of sensitivity runs wascarried out where a number of different assumptions con-cerning the source strength and the vertical distribution ofthe lightning NOx source were implemented, as summarizedin Table2.
First, a run in which the lightning NOx source was turnedoff (NoLtNOx run) was carried out. Although a zero LtNOxproduction rate is not realistic, this run serves as aGedanken-experimentagainst which to compare other runs, in order tobe able to assess the net impact of the lightning NOx sourceon the model’s NOx distribution and budget.
Second, a series of runs with various LtNOx source mag-nitudes was done with 3 vertical distributions: 1) a density-weighted distribution as in previous versions of MATCH-MPIC, from cloud top to ground (or cloud bottom over theoceans), which we will refer to as the EVEN distribution; 2)the distribution according to the vertical profiles developedby Pickering et al.(1998), hereafter referred to as the PICKdistribution; 3) a distribution in which all of the LtNOx is de-posited in the five top-most layers of the convective column,intended to represent the upper limit of upward transport ofLtNOx by convective updrafts which we will call the ANVILdistribution.
The mean vertical LtNOx profiles based on these threeassumptions are plotted in Fig.2 for a run with a sourcestrength of 2 Tg(N) of NOx from lightning, and the percent-
Table 3. Vertical distribution, in percentage of total LtNOx, of thedifferent vertical profiles at different pressure levels.
EVEN PICK ANVIL
Midlat. continental1000–800 36.4 36.9 0.1800–500 41.7 2.2 0.2500–300 18.2 54.3 85.2300–100 3.7 6.6 14.5
Trop. continental1000–800 35.9 21.3 0.02800–500 41.1 19 12.9500–300 18 45.1 66300–100 5 14.6 21.1
Trop. marine1000–800 38.1 20.7 0.3800–500 43.7 33.7 46.1500–300 17.1 43.5 50.1300–100 1.1 2.1 3.5
age of total NOx deposited by each distribution at specificpressure levels is shown in Table3. The EVEN distributionsimulates an even-mixing ratio profile in the vertical, whichmeans decreasing fluxes with altitude. In the three differentprofiles, the EVEN distribution exhibits remarkably similarfluxes over the same pressure intervals, in a behavior con-sistent with a prescribed constant mixing ratio. The largestinflux of LtNOx into the UT from this distribution occurs inthe tropical continental case, due to convection reaching thehighest altitudes in the tropics. The PICK distribution sim-ulates the largest fluxes in the 1000–800 and 500–300 hParegions. This is consistent with both the prescription of 20%of the total LtNOx mass deposited in the lowest levels forthe midlatitude continental case and with strong convectionpresent in the midlatitudes, respectively. Conversely, this dis-tribution shows the lowest fluxes in the 800–500 hPa layer. Inthe tropical continental case, the PICK distribution simulatesalmost similar fluxes in both the 1000–800 and 800–500 hParanges and the largest fluxes in the 500–300 hPa layer. Thetropical continental case simulates, in fact, the largest fluxesin this pressure range of all three cases, due to the depth ofconvection in the tropics as well as the higher tropopausethere. In the tropical marine case, where downdrafts are notthat strong, the PICK distribution shows the lowest fluxes inthe 1000–800 hPa layer, lower even that in the 800–500 hPalayer. The tropical marine case simulates the lowest fluxes ofall three distributions in both the 500–300 and 300–100 hPalayers. Though the tropopause is high in the tropics, convec-tion over oceanic regions is not as strong as over the conti-nents, resulting in decreased fluxes. The ANVIL distributionsimulates the largest fluxes in the 500–300 hPa layer in all3 cases, consistent with the LtNOx being placed in the five
www.atmos-chem-phys.org/acp/5/1815/ Atmos. Chem. Phys., 5, 1815–1834, 2005

1820 L. Labrador et al.: Effects of lightning-NOx on tropospheric chemistry
(a)
(b)
Fig. 3. Ratio of(a) annual zonal means and of the(b) horizontal distributions at 300 hPa of NOx for the PICK5 and NoLtNOx runs.
uppermost model levels of the convective column. Almostno fluxes are simulated in the lowermost layer in this distri-bution. In the 300–100 hPa layer, the simulated fluxes in theANVIL distribution are twice as large as the PICK fluxes inthe midlatitude continental case, 60% larger in the tropicalcontinental case and 75% larger in the tropical marine case.The amount of NOx deposited at the higher levels is a criticalparameter in model simulations. According toRidley et al.(2004) the correct injection of NOx in the UT is far more im-portant than in the middle troposphere, since its lifetime atlower altitudes is shorter.
Different LtNOx source magnitudes, spanning the cur-rently accepted range of uncertainties in the source, wereused for these distributions. A series of runs with LtNOx pro-duction rates of 2, 5, and 10 Tg(N)/yr using the EVEN dis-tribution (hereafter EVEN2, EVEN5 and EVEN10, respec-tively) were carried out. Similarly, runs with LtNOx produc-tion rates of 2, 5, 10 and 20 Tg(N)/yr using the PICK distri-bution (hereafter PICK2, PICK5, PICK10 and PICK 20, re-spectively) and LtNOx production rates of 2 and 5 Tg(N)/yrusing the ANVIL distribution (ANVIL2 and ANVIL5, re-spectively) were also made. This results are then comparedto the NoLtNOx run. This information is summarized in Ta-ble4. The largest source (20 Tg(N)/yr), which we consider to
be relatively unlikely, was only examined for the “best” ver-tical distribution (i.e, PICK20). In this study, we will analyzethe effects of these different vertical distributions and sourcemagnitudes on NOx, O3, OH, HNO3 and peroxyacetyl nitrate(PAN, hereafter). We will focus our discussion on the PICK5run, since it best reflects the currently accepted estimate forLtNOx and the most physically-based vertical distribution inthe literature.
3 Significance of LtNOx for tropospheric NOx concen-trations
In this section, we will analyze the significance of the sourceof NOx from lightning on total NOx concentrations. To thatend, we will compare the results of the PICK5 run (i.e.,our reference run) against the NoLtNOx run. Fig. 3a andb depict the ratio of the annual zonal means of the PICK5vs NoLtNOx runs, and the ratio of the horizontal NOx dis-tributions at 300 hPa, respectively. Most of the enhance-ment due to LtNOx takes place in the tropical mid and up-per troposphere, mainly between 40◦ north and south lati-tude and between 800 and 200 hPa. A 20% enhancementin the zonal mean mid- and upper troposphere is evident at700 hPa, peaking at approximately 300 hPa over the equator,
Atmos. Chem. Phys., 5, 1815–1834, 2005 www.atmos-chem-phys.org/acp/5/1815/

L. Labrador et al.: Effects of lightning-NOx on tropospheric chemistry 1821
(a)
(b)
Fig. 4. Ratio of the horizontal distributions at 1000 hPa of(a)NOx and(b)OH for the PICK5 and NoLtNOx runs.
where a factor of 3.4 more NOx is present compared to theNoLtNOx run. The largest enhancements in the tropical UTare consistent with lightning activity being prevalent over thetropics and continental regions (Christian et al., 2003), espe-cially over equatorial South America, central Africa, and In-donesia. However, based on the preliminary evaluation dis-cussed above, comparisons with OTD data indicate that theenhancements in NOx might be biased high due to a tendencyof the lightning parameterization to overestimate flash activ-ity in the tropics. We see that, despite the fact that the PICK5vertical distribution of LtNOx prescribes around 20% of thetotal LtNOx to be released in the first 2 km above the conti-nental landmasses, the enhancement there is relatively small.This is mainly due to the fact that, at surface levels, LtNOxmust compete against other surface sources, such as soils,biomass burning and urban and industrial fossil fuel burningemissions.
Interestingly, the addition of LtNOx causes surface totalNOx mixing ratios to decrease by∼5%, particularly overthe extratropical LT (Fig.4a). Stockwell et al.(1999) foundthe same result, particularly over Europe and North Amer-ica, and attributed it to increases in OH due to the generalincrease in O3 when lightning is included in their model sim-ulations. There are two mechanisms to account for the com-puted NOx losses, namely the reaction of OH with NO2 to
form HNO3 and the conversion of N2O5 into HNO3 via hy-drolysis on aerosols. Figure4b shows the annual mean sur-face ratio of OH for the PICK5 and the NoLtNOx runs. Ageneral decrease of∼2% in surface OH is simulated overmost midlatitude and some tropical landmasses when LtNOxis included in our simulations, mainly between 50◦ north and40◦ south, rendering the first mechanism unsuitable to ex-plain the loss (NO2 levels do increase slightly but not enoughto compensate for the decrease in OH). The explanation ofStockwell et al.(1999) can be used to interpret our resultsoutside of that latitude range where, in our simulations, sur-face OH increases when adding LtNOx. However, whereverthere is a decrease in surface OH, the negative NOx feedbackcan only be explained by an increase in the NOx loss rate viathe second loss reaction. This mechanism depends partly onO3 levels, which control the formation of NO3 and thereforeN2O5. We compute an increase in surface O3 concentrationof ∼3% for the midlatitude continental areas (not shown),largely due to downward convective mixing of O3 producedby LtNOx aloft (Lawrence et al., 2003b). This enhances theloss of NOy via hydrolysis of N2O5, and ultimately leads tothe computed reduction in NOx levels.
www.atmos-chem-phys.org/acp/5/1815/ Atmos. Chem. Phys., 5, 1815–1834, 2005

1822 L. Labrador et al.: Effects of lightning-NOx on tropospheric chemistry
(a)
(b)
Fig. 5. Ratios of the annual zonal means of the(a) EVEN5 and(b) ANVIL5 runs to the NoLtNOx run for total NOx.
4 Effects of the different assumptions of vertical place-ment of ltNOx on the vertical distribution of differenttrace gases
What is the impact of the different assumed vertical distribu-tions of LtNOx on atmospheric chemistry? In order to answerthis question, we compare the effects of the three main verti-cal distributions tested in this study for the 5 Tg(N)/yr source,i.e. EVEN5, PICK5, and ANVIL5, against the NoLtNOx run.We consider NOx as well as O3, OH, HNO3 and PAN. Com-mon to all three distributions is that the largest enhancementin all of these species occurs in the tropical UT, between ap-proximately 500 and 300 hPa, with the main differences be-ing in the magnitude and the vertical extent of the enhance-ment.
The EVEN5 distribution results in a gradual enhancementin NOx with altitude (Fig.5a), consistent with a density-weighted distribution, reaching a maximum of a factor of 2higher than the NoLtNOx run between approximately 300and 400 hPa above the equator. This is quite different thanthe PICK5 and ANVIL5 runs (Figs.3a and5b, respectively),which simulate very similar enhancements to each other, al-though the ANVIL5 run, more weighted toward the UT, sim-ulates a reduction below 900 hPa at all latitudes and no evi-dent enhancement below 800 hPa. The maximum enhance-ment in these two runs is about a factor of 3 higher than the
mixing ratio of the NoLtNOx run at 300–400 hPa and rep-resents a 100% larger enhancement than computed for theEVEN5 distribution. Considering that all three runs weredone with the same 5 Tg(N)/yr LtNOx production rate, this isa significant result, since accounting for the lofting by con-vective updrafts in the PICK5 and ANVIL5 runs results intwice the enhancement of NOx in the UT compared to theEVEN distribution. In all three runs, decreases in total NOxare computed at the surface in the extratropics and even inthe tropics in the ANVIL5 run. As discussed before, thisis mainly due to downward transport of ozone produced byenhanced NOx in the UT, reducing the near-surface NOx life-time
Much like with NOx, a gradual vertical enhancement ofO3 is simulated in the EVEN5 run (Fig.6a), with the largestenhancements occurring at the tropical latitudes (in contrastto the reduction in surface NOx at high latitudes). Surfaceenhancements range from 12% within the tropics to∼4%at high latitudes. The peak enhancement is approximately30% between 200 and 700 hPa in the tropics. Again, thePICK5 and ANVIL5 runs (Figs.6b and c, respectively) sim-ulate very similar profiles except at the surface, where thePICK5 run results in an enhancement of up to 15% close tothe equator and∼10% in the tropical regions, compared toa maximum zonal mean near-surface enhancement of 10%in the ANVIL5 run for most of the tropics. The largest
Atmos. Chem. Phys., 5, 1815–1834, 2005 www.atmos-chem-phys.org/acp/5/1815/

L. Labrador et al.: Effects of lightning-NOx on tropospheric chemistry 1823
(c)
(a)
(b)
Fig. 6. Ratios of the annual zonal means of the(a) EVEN5, (b) PICK5 and(c) ANVIL5 runs to the NoLtNOx run for O3.
enhancements in both runs are simulated between 200 and400 hPa over the tropics with 45% more O3 compared to theNoLtNOx run. The general differences in tropospheric O3as a result of the different vertical placements emphasize therole of NOx in controlling the O3 budget, and underscores theneed not only to determine an accurate estimate of the LtNOxsource magnitude, but also to correctly assess its post-stormvertical distribution.
There is a significant impact on OH by LtNOx. In theEVEN5 run (Fig.7a), enhancements of up to 60% with re-spect to the NoLtNOx run are simulated in the tropical UT,mainly in the altitude band between 300 and 100 hPa. Againthe PICK5 and ANVIL5 runs (Figs.7b and c, respectively)show very similar profiles for OH, with enhancements of ap-
proximately 100% between 100 and 200 hPa. All three runsalso simulate enhancements of about 10% near surface levelsin the tropics. The enhancements in the cold and dry tropi-cal UT are because there production of OH via O(1D)+H2Ois slow, while secondary sources, such as enhancements inHOx recycling efficiency due to increased NOx, take on amore important role. Despite the strong temperature depen-dence of the oxidation reactions of long-lived trace gasessuch as methane and methylchloroform, this result has an im-portant effect on the oxidizing efficiency of the troposphere,and increases in the source magnitude of LtNOx can lead to asubstantial reduction in the computed lifetimes of these tracegases (Labrador et al., 2004).
www.atmos-chem-phys.org/acp/5/1815/ Atmos. Chem. Phys., 5, 1815–1834, 2005

1824 L. Labrador et al.: Effects of lightning-NOx on tropospheric chemistry
(a)
(c)
(b)
Fig. 7. Ratios of the annual zonal means of the(a) EVEN5, (b) PICK5 and(c) ANVIL5 runs to the NoLtNOx run for OH.
There is a very sensitive response of nitric acid, one ofthe main reservoirs through which reactive nitrogen is lost(via dry and wet deposition), to LtNOx. All three distribu-tions simulate enhancements greater than a factor of 2 withrespect to the NoLtNOx run, as can be seen in Figs.8a, b andc. The particularly sensitive response is due to the fact that,on adding LtNOx, not only NO2, a direct precursor of nitricacid, but also another precursor, OH, is enhanced. From allthree distributions, it can be observed that, compared to mostother trace gases discussed, the maximum enhancements innitric acid occur at a somewhat lower altitude i.e., between400 and 500 hPa. Two main reasons could account for thisfact: first, while the largest relative increase in OH by addingLtNOx occurs in the UT, the largest absolute enhancement
occurs at a lower altitude (Labrador et al., 2004), coincid-ing with the maximum enhancement in nitric acid. Further-more, in the UT, there is a buffering effect of PAN, whichis enhanced at the expense of nitric acid. The PICK5 andANVIL5 runs (Figs.8b and c, respectively) are very simi-lar, although the enhancement in the UT at higher latitudesis greater in the ANVIL5 run and the PICK5 run simulateslarger enhancements than the ANVIL5 run in the lowermostlevels.
The importance of the NOx reservoir species peroxyacetylnitrate (PAN) lies in its high stability at low temperatures.Once produced, it can be transported long distances and,through thermal degradation, it can introduce NOx into re-mote regions, where background levels are generally low. As
Atmos. Chem. Phys., 5, 1815–1834, 2005 www.atmos-chem-phys.org/acp/5/1815/

L. Labrador et al.: Effects of lightning-NOx on tropospheric chemistry 1825
(a)
(c)
(b)
Fig. 8. Ratios of the annual zonal means of the(a) EVEN5, (b) PICK5 and(c) ANVIL5 runs to the NoLtNOx run for HNO3.
shown in Figure 9a, the burden of PAN is doubled in the trop-ical UT by assuming the PICK5 lightning NOx vertical dis-tribution. The EVEN5 run (Fig.9a) simulates increases ofover 50% from 500 hPa up to the tropopause level over thetropics, where values peak at a factor of 1.6 larger than theNoLtNOx run. The PICK5 and ANVIL5 runs (Figs.9b andc, respectively) show again a very similar pattern. Maximumenhancements are of the order of 100% between∼300 and200 hPa in both distributions, with enhancements decreasingrapidly outside of the tropical latitudes. All three distribu-tions simulate enhancements in PAN in the UT, as a result ofincreases in total NOx in the same region. The ANVIL5 runsimulates no notable enhancement at the surface, whereas thePICK5 run shows a 10% enhancement, consistent with the
placement of NOx by the PICK98 profiles in the lowermosttroposphere.
5 Sensitivity of tropospheric trace gas burdens to theincrease in the source of NOx from lightning
In this section, we analyze the responses of NOx, as wellas O3, OH, HNO3 and PAN to increases in the source mag-nitude of LtNOx. We calculated the burdens of these tracegases for the whole globe (90◦ north to 90◦ south), the trop-ics (between 25◦ north and south), and the extratropics (90◦
to 25◦ north and 25◦ south to 90◦ south), for the EVEN2, 5and 10 and PICK2, 5, 10 and 20 runs . Since the PICK and
www.atmos-chem-phys.org/acp/5/1815/ Atmos. Chem. Phys., 5, 1815–1834, 2005

1826 L. Labrador et al.: Effects of lightning-NOx on tropospheric chemistry
(a)
(c)
(b)
Fig. 9. Ratios of the annual zonal means of the(a) EVEN5, (b) PICK5 and(c) ANVIL5 runs to the NoLtNOx run for PAN.
ANVIL runs produce mostly similar results, we will limit ourcomparison to the EVEN and PICK set of runs.
Figures10a–e show the burdens for the EVEN and PICKruns as a function of the LtNOx source magnitude. A con-sistent tendency was for the PICK runs to result in higherburdens for all trace gases than the EVEN runs, due to theirlifetimes generally being longer in the UT, where most of theNOx in the PICK runs is released.
Globally, adding LtNOx produces a tendency towards sat-uration, already seen from 2 Tg(N)/yr–5 Tg(N)/yr and whichbecomes very clear in the 20 Tg(N)/yr production rate. Theresponse of the EVEN set of runs is similar to the PICKruns, although the magnitude of the absolute increase in to-tal NOx is not as marked as that of the PICK runs. Inter-
estingly, the difference in the total NOx burden for equiva-lent production rates between the PICK and EVEN runs in-creases with increasing LtNOx: relative to the NO LtNOxrun, the PICK2 run simulates a total NOx burden 2.5% largerthan the EVEN2 run. For the 5 and 10 Tg(N)/yr produc-tion rates, these differences are 4.3 and 5.3%, respectively.This is a consequence of the weighting of the PICK distribu-tion towards the higher altitudes, as opposed to the density-weighted EVEN distribution.
The tropical regions simulate a more sensitive response,due in large part to the fact that most of the lightning activityin the model is concentrated there (Fig.1) and because theother competing sources (especially fossil-fuel burning) tendto be smaller in the tropics than in the extratropics. Though
Atmos. Chem. Phys., 5, 1815–1834, 2005 www.atmos-chem-phys.org/acp/5/1815/

L. Labrador et al.: Effects of lightning-NOx on tropospheric chemistry 1827
NOx
0
0.05
0.1
0.15
0.2
0.25
0 5 10 15 20LtNOx(Tg(N)/yr)
NO
x(T
g)
OH
0
0.05
0.1
0.15
0.2
0.25
0.3
0 5 10 15 20LtNOx(Tg(N)/yr)
OH
(m
olec
/cm
3 )
c
HNO3
0
0.05
0.1
0.15
0.2
0.25
0.3
0.35
0.4
0 5 10 15 20
LtNOX(Tg(N)/yr)
HN
O3(
Tg)
(d)
PAN
0
0.1
0.2
0.3
0.4
0.5
0.6
0.7
0 5 10 15 20
LtNOx(Tg(N)/yr)
PA
N(T
g)
EVEN whole globe
EVEN tropics
EVEN extratropics
PICK whole globe PICK
PICK tropics
PICK extratropics
(e
a
O3
0
100
200
300
400
500
600
0 5 10 15 20LtNOx(Tg(N)/yr)
O3(
Tg)
(b)
NOx
0
0.05
0.1
0.15
0.2
0.25
0 5 10 15 20LtNOx(Tg(N)/yr)
NO
x(T
g)OH
0
0.05
0.1
0.15
0.2
0.25
0.3
0 5 10 15 20LtNOx(Tg(N)/yr)
OH
(m
olec
/cm
3 )
(c)
HNO3
0
0.05
0.1
0.15
0.2
0.25
0.3
0.35
0.4
0 5 10 15 20
LtNOX(Tg(N)/yr)
HN
O3(
Tg)
(d)
PAN
0
0.1
0.2
0.3
0.4
0.5
0.6
0.7
0 5 10 15 20
LtNOx(Tg(N)/yr)
PA
N(T
g)
EVEN whole globe
EVEN tropics
EVEN extratropics
PICK whole globe PICK
PICK tropics
PICK extratropics
(e)
(a)
Fig. 10.Burdens of(a) NOx, (b) O3, (c) OH, (d) HNO3 and(e)PAN, for the PICK and EVEN series of runs for the tropics and extratropics.
Table 4. Burdens of the NoLtNOx runs (in Tg for NOx and O3 and×106 molec for OH) and relative increases (in percent) of the burdensof the different trace gases for the whole globe and tropics (T) for the different runs with respect to the LtNOx runs.
Trace Burden in Relative increase vs. NoLtNOx run
gas NoLtNOx run P2 P5 P10 P20 E2 E5 E10
NOx 0.14 9.1 19.5 31.9 51.2 6.4 14.4 24.9NOx(T) 0.05 16.6 36.4 60.6 98.2 11.9 27.3 47.8O3 377.1 6.8 14.1 21.8 30.7 4.9 10.6 17.6O3 (T) 138.5 9.9 20.8 32.3 45.6 7.1 15.7 26.2OH 0.17 13.2 27.8 43.1 61.3 9.6 21.1 35.1OH (T) 0.09 16.4 34.8 54.8 78.4 11.9 26.5 44.6HNO3 0.15 14.2 35.6 69.6 135.2 11.6 29.1 59.8HNO3 (T) 0.07 21.4 54.7 109.6 217 17.6 44.7 90.7PAN 0.37 14.2 28.9 43.2 57.4 9.7 21.3 34.9PAN (T) 0.13 8.1 51.7 24.8 33.2 5.5 12.0 19.8
the same non-linear response as in the whole globe is alsopresent, increases in total NOx in the tropics are larger. Thedifferences in burden growth with respect to the NoLtNOxrun between the PICK and EVEN runs are also larger thanin the whole globe: 4%, 6.7% and 7.9% for the 2, 5 and10 Tg(N)/yr production rates, respectively.
As with NOx, O3 shows a non-linear response to increasesin LtNOx, tending towards saturation at the highest end ofthe range in both sets of runs. The PICK runs simulate largerenhancements throughout the entire production range, par-ticularly in the tropical regions (Fig.10b and Table4). Glob-
ally, the PICK20 run simulates increases of up to 30% withrespect to the NoLtNOx run, while in the tropics O3 is en-hanced by 45% for the same run. These enhancements areall the more important considering that they take place inthe UT, where longer lifetimes and the Hadley circulationcan transport this ozone to higher latitudes and because O3 ismore efficient as a greenhouse gas at higher altitudes. Thisincrease of O3 at higher altitudes is responsible for the re-duction of surface NOx levels simulated at high latitudes inFig. 4a.
www.atmos-chem-phys.org/acp/5/1815/ Atmos. Chem. Phys., 5, 1815–1834, 2005

1828 L. Labrador et al.: Effects of lightning-NOx on tropospheric chemistry
Table 5. Regional annual mean airmass-weighted OH concentrations (×106 molec/cm3) and relative increases vs. NoLtNOx (in parenthesis)for the different LtNOx vertical distributions.
REGION NoLtNOx EVEN5 PICK5
Below 750 hPa 90◦ S–30◦ S 0.54 0.58 (+7.4%) 0.59 (+9.3%)Below 750 hPa 30◦ S–0◦ 1.25 1.45 (+16%) 1.43 (+14.4%)Below 750 hPa 0◦–30◦ N 1.44 1.59 (+10.4%) 1.56 (+8.3%)Below 750 hPa 30◦ N–90◦ N 0.82 0.85 (+3.7%) 0.85 (+3.7%)750–500 hPa 90◦ S–30◦ S 0.48 0.55 (+14.6%) 0.56 (+17%)750–500 hPa 30◦ S–0◦ 1.21 1.53 (+26.4%) 1.56 (+28.9%)750–500 hPa 0◦–30◦ N 1.44 1.71 (+18.8%) 1.72 (+19.4%)750–500 hPa 30◦ N–90◦ N 0.72 0.77 (+6.9%) 0.77 (+6.9%)500–250 hPa 90◦ S–30◦ S 0.34 0.40 (+17.6%) 0.42 (+23.5%)500–250 hPa 30◦ S–0◦ 0.67 0.93 (+38.8%) 1.07 (+59.7%)500–250 hPa 0◦–30◦ N 0.87 1.13 (+29.9%) 1.27 (+46%)500–250 hPa 30◦ N–90◦ N 0.52 0.57 (+9.6%) 0.58 (+11.5%)
Fig. 11. Campaign regions (within boxes), superimposed on the ratio of the annual horizontal distribution of NOx from the PICK5 andNoLtNOx runs.
Figure 10c shows that the relative change in global en-hancement of the OH burden is greater than that of O3 andis close to that of NOx. Table 5 shows the regional an-nual mass-weighted OH mean concentrations, as suggestedby Lawrence et al.(2001), for the different vertical distri-butions with a 5 Tg(N)/yr LtNOx production rate, as well asthe relative increases of the two vertical distributions versusthe NoLtNOx run. The largest OH increases in all three dis-tributions are in the southern hemisphere, despite the light-ning activity being dominant over the northern hemisphere(Christian et al., 2003). For instance, in the EVEN5 distri-bution, the enhancements in the 90◦ S–30◦ S domains at allaltitudes are about a factor of two larger than those in theequivalent domains in the northern hemisphere, whereas inthe 30◦ S–0◦ domains, they are about 50% larger than in the0◦–30◦ N domains. In the PICK distribution the enhance-
ments in the 90◦ S–30◦ S regions below 750 hPa are a factorof three larger, and in the 750–500 hPa and 500–250 hPa do-mains approximately a factor of two larger than the equiva-lent northern hemisphere domains. In the 30◦ S–0◦ domains,the enhancements are about 50% larger than in the 0◦–30◦ Ndomains. This marked sensitivity of the southern hemisphereto LtNOx is a result of lower total NOx emissions from othersources, which makes OH more sensitive to increases in NOxthere. The PICK distribution simulates larger relative in-creases vs. the NoLtNOx run in the uppermost domains thanthe EVEN distribution, particularly in the tropics, consistentwith the larger amounts of LtNOx deposited in the upper lev-els by the PICK distribution.
Nitric acid (HNO3) (Fig. 10d) shows a marked sensitiv-ity to increases in LtNOx which is different from the othergases. There is more than a doubling in its burden between
Atmos. Chem. Phys., 5, 1815–1834, 2005 www.atmos-chem-phys.org/acp/5/1815/

L. Labrador et al.: Effects of lightning-NOx on tropospheric chemistry 1829
Fig. 12. NOx profiles for different campaign regions (whisker boxes) and for the NoLtNOx (dash-dotted line), EVEN5(dashed line),PICK5(solid line) and PICK20 (dotted line) runs. The boxes and whiskers contain the central and side 40% of the observations. On theright-hand side are the number of observations at each altitude. Inside the whisker boxes, the median and mean values are represented by anasterisk and vertical line, respectively.
the 2 and 5 Tg(N)/yr runs in both the PICK and EVEN dis-tributions over the whole globe as well as in the tropics. Forhigher production rates, the approximately linear responsecontinues without abatement until the top of the productionrange for both sets of runs, with enhancements of over 100%and 200% over the whole globe and tropics, respectively, inthe PICK20 run. This sensitivity increases with the magni-tude of the source of NOx from lightning (Table4) and isdue to the increase in its two main precursors, NO2 and OH.From Fig.10d, it is readily apparent that the burdens for thetropical and extratropical regions are very approximately thesame; this is in part accounted for by the fact that the OHradical is more abundant in the tropics (see Table5), whileNO2 is more abundant in the extratropics.
Figure 10e shows that the burden of PAN can be dou-bled versus the NoLtNOx run in the tropical UT by assuming
the PICK vertical distribution. For every 5 Tg(N)/yr of NOxfrom lightning, PAN is enhanced by almost 52% betweenthe NoLtNOx and PICK5 runs, or about 14% more than NOx(Table4). Then, for every additional 5 Tg(N)/yr, PAN is en-hanced by 17% between the PICK10 and 20 runs, or abouthalf the increase in NOx for the same range; thus, the ten-dency towards saturation is much stronger for PAN than forother trace gases. The strong response at the lower end of theLtNOx production range in the tropics can be accounted forby the very strong emissions of isoprene in MATCH-MPICruns in the tropics (von Kuhlmann et al., 2004). The forma-tion of PAN depends, among other factors, on the availabilityof the peroxyacetyl radical, the dominant producer of whichin our runs in the tropical regions is isoprene. As LtNOx isfurther increased, however, one moves into a hydrocarbon-limited PAN formation regime. While NOx is increased
www.atmos-chem-phys.org/acp/5/1815/ Atmos. Chem. Phys., 5, 1815–1834, 2005

1830 L. Labrador et al.: Effects of lightning-NOx on tropospheric chemistry
Table 6. Set of campaign regions, campaigns names and coordinates used in this study to compare against model output.
Region Region name campaign Date Coordinates, deg.
1 Africa-South TRACE-A 21 Sept.–26 Oct. 1992 25 S–5 S, 15–352 Atlantic-S TRACE-A 21 Sept.–26 Oct. 1992 20 S–0, 340–3503 Natal CITE-3 22 Aug.–29 Sept. 1989 15 S–5 N, 325–3354 E-Brazil TRACE-A 21 Sept.–26 Oct. 1992 15 S–5 S, 310–3205 E-Brazil Coast TRACE-A 21 Sept.–26 Oct. 1992 35 S–25 S, 310–3206 Ontario ABLE3-B 6 July–15 Aug. 1990 45 N–60 N, 270–2807 California CITE-2 11 Aug.–5 Sept. 1986 35 N–45 N, 235–2508 Pacific-Tropics-W PEM-West-A 16 Sept.–21 Oct. 1991 5 S–15 N, 155–1659 Philippine-sea PEM-West-A 16 Sept.–21 Oct. 1991 5 N–20 N, 135–15010 Japan-Coast-E PEM-West-A 16 Sept.–21 Oct. 1991 15 N–40 N, 135–150
through LtNOx, isoprene emissions, and other PAN precur-sors are kept constant in our runs, leading to the rapid satu-ration signal.
6 Comparisons with observations
In this section we compare the model output from the sensi-tivity runs with a subset of the composites of airborne fieldcampaign observations compiled byEmmons et al.(2000).Table6 and Fig.11show the selected set of observation cam-paign regions for comparison with our model results. Sixregions were selected for their location within the tropics,which are representative of both maritime (Regions 2, 8 and9 in Fig.11), continental (Regions 1 and 4) as well as coastalareas (Region 3). Regions 2 and 3 are of particular impor-tance since they are located downwind of NOx sources suchas LtNOx and biomass burning from the African continent.Four regions were selected in the extratropics, of which twoin coastal areas (Regions 5 and 10), and two in continentalareas (Region 6 and 7). It bears keeping in mind that theyears of the campaigns generally do not coincide with theyear of our simulation; this introduces a further element ofuncertainty which may need to be assessed in the future inthe light of interannual variability of lightning. Figure12shows the vertical profiles of NOx for the measurements ofeach campaign region plotted (box-whiskers plots) as well asthose of the model output for the NoLtNOx, EVEN5, PICK5and PICK20 runs for the selected regions.
In all but one case, the PICK20 run overestimates the ob-served NOx profiles, particularly over the tropical sites. Inthe case of Regions 3 and 4, the modeled concentrations canbe up to a factor of 3 higher than those of the observationsat the higher altitudes. While the trend is not as strong overthe tropical marine sites (Regions 8 and 9), it is still evident.Over the midlatitudes, where measurements were available(Region 10), the same tendency is again observed, with thePICK20 modeled concentrations about 50% higher than theobserved ones. Although more observations are needed, our
results give a strong indication that the 20 Tg(N)/yr produc-tion of NOx from lightning is too high a source magnitude.
Other than in the PICK20 run, it is difficult to discern anyparticular trend of over or underestimation of the model re-sults, even when dividing the comparison between tropicsand extratropics. Over the tropical continental landmasses,there is generally good agreement between modeled resultsand observations in the first 4 km for all 4 areas (Regions 1,3, 4 and 5) considered. However, there is also little differencebetween the different model profiles up to that height, whichunderscores the fact that the largest differences in NOx mix-ing ratios are found in the UT (see Fig.3a). The runs startto exhibit larger differences among themselves above about4 km. In Region 4, the PICK20 run shows a clear tendency tooverestimate above∼3 km as do, to a much lesser extent, thetwo runs with 5 Tg(N)/yr production rate. In South Africa(Region 1), the model results tend to underestimate NOx inthe LT, probably as result of underestimated biomass-burningemissions in the model, but there is a slightly better agree-ment in the free and upper troposphere. The overall lowmixing ratios in the UT for both measurements and modelresults indicate low lightning activity over the campaign re-gion at that time. Even then, the PICK20 run clearly over-estimates NOx in the UT. NOx measurement above Natal,Brazil (Region 3) were only made for the first 5 km and, upto that height, the PICK5 run shows the best agreement withthe observations. Over the two maritime regions in the trop-ical Pacific Ocean (Regions 8 and 9), all 4 runs plotted tendto clearly overestimate NOx mixing ratios in the first 4–6 km,probably as a result of excessive downward transport of NOx-rich air into the lower reaches of the marine troposphere onthe part of the model. Above that, there is a better agreementbetween the runs and the measurements, with the exceptionof the PICK20 run clearly being on the higher end (when notoutside) of the measured values. However, since in the UTthe range of measured values is wide and includes the valuesfor most of the model runs, is it not possible to single out anyrun as having the best agreement. Region 2, in the tropical
Atmos. Chem. Phys., 5, 1815–1834, 2005 www.atmos-chem-phys.org/acp/5/1815/
L. Labrador et al.: Effects of lightning-NOx on tropospheric chemistry 1831
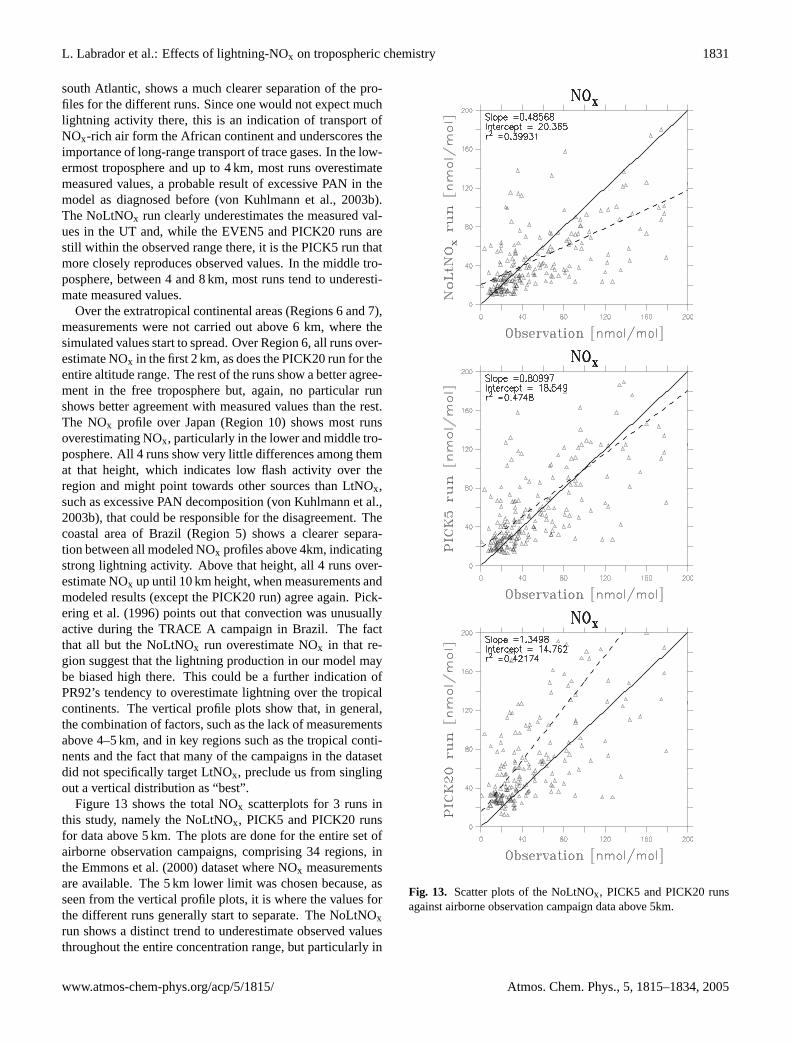
south Atlantic, shows a much clearer separation of the pro-files for the different runs. Since one would not expect muchlightning activity there, this is an indication of transport ofNOx-rich air form the African continent and underscores theimportance of long-range transport of trace gases. In the low-ermost troposphere and up to 4 km, most runs overestimatemeasured values, a probable result of excessive PAN in themodel as diagnosed before (von Kuhlmann et al., 2003b).The NoLtNOx run clearly underestimates the measured val-ues in the UT and, while the EVEN5 and PICK20 runs arestill within the observed range there, it is the PICK5 run thatmore closely reproduces observed values. In the middle tro-posphere, between 4 and 8 km, most runs tend to underesti-mate measured values.
Over the extratropical continental areas (Regions 6 and 7),measurements were not carried out above 6 km, where thesimulated values start to spread. Over Region 6, all runs over-estimate NOx in the first 2 km, as does the PICK20 run for theentire altitude range. The rest of the runs show a better agree-ment in the free troposphere but, again, no particular runshows better agreement with measured values than the rest.The NOx profile over Japan (Region 10) shows most runsoverestimating NOx, particularly in the lower and middle tro-posphere. All 4 runs show very little differences among themat that height, which indicates low flash activity over theregion and might point towards other sources than LtNOx,such as excessive PAN decomposition (von Kuhlmann et al.,2003b), that could be responsible for the disagreement. Thecoastal area of Brazil (Region 5) shows a clearer separa-tion between all modeled NOx profiles above 4km, indicatingstrong lightning activity. Above that height, all 4 runs over-estimate NOx up until 10 km height, when measurements andmodeled results (except the PICK20 run) agree again.Pick-ering et al.(1996) points out that convection was unusuallyactive during the TRACE A campaign in Brazil. The factthat all but the NoLtNOx run overestimate NOx in that re-gion suggest that the lightning production in our model maybe biased high there. This could be a further indication ofPR92’s tendency to overestimate lightning over the tropicalcontinents. The vertical profile plots show that, in general,the combination of factors, such as the lack of measurementsabove 4–5 km, and in key regions such as the tropical conti-nents and the fact that many of the campaigns in the datasetdid not specifically target LtNOx, preclude us from singlingout a vertical distribution as “best”.
Figure13 shows the total NOx scatterplots for 3 runs inthis study, namely the NoLtNOx, PICK5 and PICK20 runsfor data above 5 km. The plots are done for the entire set ofairborne observation campaigns, comprising 34 regions, intheEmmons et al.(2000) dataset where NOx measurementsare available. The 5 km lower limit was chosen because, asseen from the vertical profile plots, it is where the values forthe different runs generally start to separate. The NoLtNOxrun shows a distinct trend to underestimate observed valuesthroughout the entire concentration range, but particularly in
Lorenzo Labrador: Effects of lightning-NO � on tropospheric chemistry 17
Fig. 13. Scatter plots of the NoLtNO � , PICK5 and PICK20 runs against airborne observation campaign data above 5km.
observations data throughout the entire range, particularly atthe upper end, confirming the tendency already seen in thevertical profile plots.
The effects of the vertical distribution and source mag-nitude of LtNO � have been addressed before in a numberof modeling studies. Tie et al. (2001) and Stockwell et al.(1999) point out that including lightning-NO � emissions intheir models produces better agreement with observations.
In another study, Tie et al. (2002) conclude, based on ver-tical profile plots, that simulations with a production of 7Tg(N)/yr of NO � from lightning uniformly distributed inclouds, and 3.5 Tg(N)/yr in the upper regions of clouds pro-duce the best agreement with observations. The differencesbetween our modeled results and the latter study are notable.While there may be many factors to account for this, includ-ing the use of different models, we believe that the use of
www.atmos-chem-phys.org/0000/0001/ Atmos. Chem. Phys., 0000, 0001–20, 2005
Fig. 13. Scatter plots of the NoLtNOx, PICK5 and PICK20 runsagainst airborne observation campaign data above 5km.
www.atmos-chem-phys.org/acp/5/1815/ Atmos. Chem. Phys., 5, 1815–1834, 2005

1832 L. Labrador et al.: Effects of lightning-NOx on tropospheric chemistry
the upper range. The PICK5 run shows the best fit of all runs,both burden- and distribution wise, although the EVEN5 run(not pictured) resulted in a very similar correlation coeffi-cient (r2=0.4655) and a lower slope (0.65866). It is inter-esting to notice that, in spite of the EVEN5 and PICK5 runshaving markedly different NOx vertical distributions, the dif-ference in the scatter plots is small. We believe this to bedue to the lack of observation at key locations where thelargest differences could be expected. On the other hand,the PICK20 run shows a clear tendency to overestimate theobservations data throughout the entire range, particularly atthe upper end, confirming the tendency already seen in thevertical profile plots.
The effects of the vertical distribution and source mag-nitude of LtNOx have been addressed before in a numberof modeling studies.Tie et al. (2001) andStockwell et al.(1999) point out that including lightning-NOx emissions intheir models produces better agreement with observations.In another study,Tie et al.(2002) conclude, based on verticalprofile plots, that simulations with a production of 7 Tg(N)/yrof NOx from lightning uniformly distributed in clouds, and3.5 Tg(N)/yr in the upper regions of clouds produce the bestagreement with observations. The differences between ourmodeled results and the latter study are notable. While theremay be many factors to account for this, including the use ofdifferent models, we believe that the use of theHack(1994)convection scheme inTie et al.(2002) is fundamental in ac-counting for these differences since it is unable to simulatedeep convective mixing well. From our results, it is appar-ent that it is not possible, based on vertical profiles alone,to arrive at a solid conclusion as to which production rate orvertical distribution yields the best agreement with observa-tions, and while the scatter plots afford an extra measure ofobjectivity to our analysis, we can only state with a certaindegree of confidence that in our simulations the NoLtNOxand PICK20 runs underestimate and overestimate, respec-tively, the observations enough not to be considered as re-alistic assumptions. We believe that the combination of thelow availability of observational data, particularly in criticalareas, such as the continental tropics, the large scatter in theavailable observations and the many uncertainties in mod-eling lightning NOx and other NOx sources calls for exer-cising caution when coming to conclusions about its sourcemagnitude based on simple comparisons with observations.More observations campaigns, such as TROCCINOX (http://www.pa.op.dlr.de/troccinox), specifically aimed at reduc-ing the uncertainties in the source of NOx from lightning andin key regions, such as the tropical continents, are thereforeneeded.
7 Conclusions
We have investigated the effects of different assumptionsconcerning the source magnitude and vertical placement
of lightning-produced NOx on total NOx as well as on O3,OH, HNO3 and PAN using the chemical transport modelMATCH-MPIC. Our results show these trace gases to bevery sensitive to both parameters. Global increases in NOxin the tropics compared to a run with no NOx from lightningare simulated assuming a 5 Tg(N)/yr LtNOx productionrate and a vertical distribution according toPickering et al.(1998). Since these enhancements occur primarily in thetropical upper troposphere, the produced NOx, along withall other trace gases resulting from its chemistry, have thepotential to be transported over long distances to pristineareas, greatly enhancing concentrations in those places.However, under the present circumstances, we believe thatthe uncertainties in our knowledge of the production ofNOx from lightning, such as 1) the horizontal distributionof lightning, which we address in a separate study, 2) theenergy produced by each type of discharge and number ofNO molecules per unit energy, along with 3) the low numberof observation campaigns available, make it extremely dif-ficult to determine a “best” vertical distribution and sourcemagnitude. We can say, however, that our results pointtowards a 0 Tg(N)/yr source of NOx from lightning as beingtoo low and 20 Tg(N)/yr as being too high. This underscoresthe need for further measurement campaigns, particularlyin the tropical continental regions, where lightning activityis prevalent. On the other hand, there is a definite needfor improved lightning parameterizations for use in 3Dglobal chemistry transport models, although substantialimprovements in these parameterizations may have to waituntil more detailed data are available from next generationconvection parameterizations (K. A. Pickering, personalcommunication, 2004).
Edited by: J. Brandt
References
Allen, D. and Pickering, K.: Evaluation of lightning flash rate pa-rameterizations for use in a global chemical transport model, J.Geophys. Res., 107, 4711, doi:10.1029/2002JD002066, 2002.
Chameides, W., Stedman, D., Dickerson, R., Rusch, D., and Ci-cerone, R.: NOx production in lightning, J. Atmos. Sci., 34, 143–149, 1977.
Chameides, W. L.: Production of CO, H2, and other trace gases byatmospheric lightning, Transactions, Amer. Geophys. Un., 59,1150–1150, 1979.
Chameides, W. L., Davis, D. D., Bradshaw, J., Rodgers, M., Sand-holm, S., and Bai, D. B.: An estimate of the NOx production-ratein electrified clouds based on NO observation from the GTEsCITE-1 fall 1983 field operation, J. Geophys. Res., 92, 2153–2156, 1987.
Christian, H. J., Blakeslee, R. J., Boccippio, D. J., Boeck, W. L.,Buechler, D. E., Driscoll, K. T., Goodman, S. J., Hall, J. M.,Koshak, W. J., Mach, D. M., and Stewart, M. F.: Global fre-quency and distribution of lightning as observed from space
Atmos. Chem. Phys., 5, 1815–1834, 2005 www.atmos-chem-phys.org/acp/5/1815/

L. Labrador et al.: Effects of lightning-NOx on tropospheric chemistry 1833
by the optical transient detector, J. Geophys. Res., 108, 4005,doi:10.1029/2002JD002347, 2003.
Cooray, V.: Energy disipation in lightning flashes, J. Geophys. Res.,102, 21 401–21 410, 1997.
Dawson, G. A.: Nitrogen-fixation by lightning, J. Atmos. Sci., 37,174–178, 1980.
DeCaria, A. J., Pickering, K. E., Stenchikov, G. L., Scala J. R., Stith,J. L., Dye, J. E., and Laroche, B. A. R. P.: A cloud-scale modelstudy of lightning-generated NOx in an individual thunderstormduring STERAO-A, J. Geophys. Res., 105, 11 601–11 616, 2000.
Drapcho, D. L., Sisterson, D., and Kumar, R.: Nitrogen fixation bylightning activity in a thunderstorm, J. Geophys. Res., 19, 729–734, 1983.
Emmons, L. K., Hauglustaine, D. A., Muller, J.-F., Carroll, M. A.,Brasseur, G. P., Brunner, D., Staehelin, J., Thouret, V., andMarenco, A.: Data composites of airborne observations of tropo-spheric ozone and its precursors, J. Geophys. Res., 105, 20 497–20 538, 2000.
Fehr, T., Holler, H., and Huntrieser, H.: Model study on pro-duction and transport of lightning-produced NOx in a EU-LINOX supercell storm, J. Geophys. Res., 109, D09 102,doi:10.1029/2003JD003935, 2004.
Franzblau, E. and Popp, C. J.: Nitrogen oxides produced from light-ning, J. Geophys. Res., 94, 11 089–11 104, 1989.
Gallardo, L. and Cooray, V.: Could cloud-to-cloud discharges beas effective as cloud-to-ground discharges in producing NOx?,Tellus, 48B, 641–651, 1996.
Goldenbaum, G. C. and Dickerson, R. R.: Nitric-oxide productionby lightning discharges, J. Geophys. Res., 98, 18 333–18 338,1993.
Hack, J. J.: Parameterization of moist convection in the NationalCenter for Atmospheric Research community climate model(CCM2), J. Geophys. Res., 99, 5551–5568, 1994.
Hill, R. D., Rinker, R. G., and Wilson, H. D.: Atmospheric nitrogen-fixation by lightning, J. Atmos. Sci., 37, 179–192, 1980.
Huntrieser, H., Feigl, C., Schlager, H., Schroder, F., Gerbig, C.,van Velthoven, P., Flatøy, F., Thery, C., Petzold, A., Holler,H., and Schumann, U.: Airborne measurements of NOx, tracerspecies, and small particles during the European LightningNitrogen Oxides Experiment, J. Geophys. Res., 107, 4113,doi:10.1029/2000JD000209, 2002.
Kowalczyk, M. and Bauer, E.: Lightning as a source of NOx inthe troposphere, Technical Memorandum ORNL/TM-2001/268,Federal Aviation Administration, Oak Ridge, Tenn., 1982.
Kumar, P. P., Manohar, G. K., and Kandalgaonkar, S. S.: Globaldistribution of nitric-oxide produced by lightning and its seasonalvariation, J. Geophys. Res., 100, 11 203–11 208, 1995.
Labrador, L., von Kuhlmann, R., and Lawrence, M. G.: Strong sen-sitivity of the global mean OH concentration and the troposphericoxidizing efficiency to the source of NOx from lightning, Geo-phys. Res. Lett., 31, L06 102, doi:10.1029/20 003GL019 229,2004.
Lawrence, M. G., Chameides, W. L., Kasibhatla, P. S., Levy II, H.,and Moxim, W.: Lightning and atmospheric chemistry: The rateof atmospheric NO production, Vol. I, pp. 189–202, CRC Press,Inc., 1995.
Lawrence, M. G., Crutzen, P. J., Rasch, P. J., Eaton, B. E., andMahowald, N. M.: A model for studies of tropospheric photo-chemistry: Description, global distributions, and evaluation, J.
Geophys. Res., 104, 26 245–26 277, 1999.Lawrence, M. G., Jockel, P., and von Kuhlmann, R.: What does the
global mean OH concentration tell us?, Atmos. Chem. Phys., 1,37–49, 2001,SRef-ID: 1680-7324/acp/2001-1-37.
Lawrence, M. G., Rasch, P. J., von Kuhlmann, R., Williams, J., Fis-cher, H., de Reus, M., Lelieveld, J., Crutzen, P. J., Schultz, M.,Stier, P., Huntrieser, H., Heland, J., Stohl, A., Forster, C., Elbern,H., Jakobs, H., and Dickerson, R. R.: Global chemical weatherforecasts for field campaign planning: predictions and observa-tions of large-scale features during MINOS, CONTRACE, andINDOEX, Atmos. Chem. Phys., 3, 267–289, 2003a,SRef-ID: 1680-7324/acp/2003-3-267.
Lawrence, M. G., von Kuhlmann, R., and Salzmann, M.: The bal-ance of effects of deep convective mixing on tropospheric ozone,Geophys. Res. Lett., 30, 1940, doi:10.1029/2003GL017644,2003b.
Levine, J. S., Rogowski, R. S., Gregory, G. L., Howell, W. E., andFishman, J.: Simultaneous measurements of NOx, NO and O3production in a laboratory discharge: Atmospheric implications,Geophys. Res. Lett., 8, 357–360, 1981.
Levy, H., Moxim, W. J., and Kasibhatla, P. S.: A global three-dimensional time-dependent lightning source of troposphericNOx, J. Geophys. Res., 101, 22 911–22 922, 1996.
Liaw, Y. P., Sisterson, D. L., and Miller, N. L.: Comparison of field,laboratory, and theoretical estimates of global nitrogen-fixationby lightning, J. Geophys. Res., 22, 22 489–22 494, 1990.
Navarro-Gonzales, R., Villagran-Muniz, M., Molina, L., andMolina, M.: The physical mechanism of nitric oxide formation insimulated lightning, Geophys. Res. Lett., 28, 3867–3870, 2001.
Nesbitt, S. W., Zhang, R., and Orville, R. E.: Seasonal and globalNOx production by lightning estimated from the Optical Tran-sient Detector (OTD), Tellus, 52B, 1206–1215, 2000.
Noxon, J. F.: Atmospheric nitrogen-fixation by lightning, Geophys.Res. Lett., 3, 463–465, 1976.
Peyrous, R. and Lapyere, R. M.: Gaseous products created by elec-trical discharges in the atmosphere and condensation nuclei re-sulting from gaseous-phase reactions, Atmos. Environ., 6, 959–968, 1982.
Pickering, K. E., Thompson, A. M., Wang, Y., Tao, W.-K., McNa-mara, E. P., Kichhoff, V. W. J. J., Heikes, B. G., SAchse, G. W.,Bradshaw, J. D., Gregory, G. L., and Blake, D. R.: Convec-tive transport of biomass burning emissions over Brazil duringTRACE A, J. Geophys. Res., 101, 23 993–24 012, 1996.
Pickering, K. E., Wang, Y., Tao, W. K., Price, C., and Muller, J.-F.:Vertical distributions of lightning NOx for use in regional andglobal chemical transport models, J. Geophys. Res., 103, 31 203–31 216, 1998.
Price, C. and Rind, D.: A simple lightning parameterization forcalculating global lightning distributions, J. Geophys. Res., 97,9919–9933, 1992.
Price, C. and Rind, D.: Modeling global lightning distributions in ageneral circulation model, Mon. Weather Rev., 122, 1930–1939,1994.
Price, C., Penner, J., and Prather, M.: NOx from lightning: 1. Globaldistribution based on lightning physics, J. Geophys. Res., 102,5929–5941, 1997a.
Price, C., Penner, J., and Prather, M.: NOx from lightning: 2. Con-straints from the global atmospheric electric circuit, J. Geophys.
www.atmos-chem-phys.org/acp/5/1815/ Atmos. Chem. Phys., 5, 1815–1834, 2005

1834 L. Labrador et al.: Effects of lightning-NOx on tropospheric chemistry
Res., 102, 5942–5951, 1997b.Rasch, P. J., Mahowald, N. M., and Eaton, B. E.: Representations of
transport, convection and the hydrologic cycle in chemical trans-port models: Implications for the modeling of short lived andsoluble species, J. Geophys. Res., 102, 28 127–28 138, 1997.
Ridley, B., Ott, L., Pickering, K., Emmons, L., Montzka, D.,Weinheimer, A., Knapp, D., Grahek, F., Li, L., Heymsfeld,G., McGill, M., Kucera, P., Mahoney, M. J., Baumgardner, D.,Schultz, M., and Brasseur, G.: Florida thunderstorms: A faucetof reactive nitrogen to the upper troposphere, J. Geophys. Res.,109, doi:10.1029/2004JD004769, 2004.
Ridley, B. A., Dye, J. E., Walega, J. G., Zheng, J., Grahek, F. E.,and Rison, W.: On the production of active nitrogen by thunder-storms over New Mexico, J. Geophys. Res., 101, 20 985–21 005,1996.
Sisterson, D. L. and Liaw, Y. P.: An evaluation of lightning andcorona discharge on thuderstorm air and precipitation chemistry,J. Atmos. Chem., 10, 83–96, 1990.
Stockwell, D. Z., Giannakopoulos, C., Plantevin, P. H., Carver,G. D., Chipperfield, M. P., Law, K. S., Pyle, J. A., Shallcross,D. E., and Wang, K.-Y.: Modelling NOx from lightning and itsimpact on global chemical fields, Atmos. Environ., 33, 4477–4493, 1999.
Tie, X., Brasseur, G., Emmons, L., Horowitz, L., and Kinnison,D.: Effects of aerosols on tropospheric oxidants: A global modelstudy, J. Geophys. Res., 106, 22 931–22 964, 2001.
Tie, X., Zhang, R., Brasseur, G., and Lei, W.: Global NOx produc-tion by lightning, J. Atmos. Chem., 43, 61–74, 2002.
Tuck, A. F.: Production of nitrogen-oxides by lightning discharges,Q. J. R. Meteorol. Soc., 102, 749–755, 1976.
Turman, B. N.: Analysis of lightning data from DMSP satellite, J.Geophys. Res., 83, 5019–5024, 1978.
von Kuhlmann, R., Lawrence, M. G., Crutzen, P. J., and Rasch,P. J.: A model for studies of tropospheric ozone and nonmethanehydrocarbons: Model description and ozone results, J. Geophys.Res., 108, 4294, doi:10.1029/2002JD002893, 2003a.
von Kuhlmann, R., Lawrence, M. G., Crutzen, P. J., and Rasch, P. J.:A model for studies of tropospheric ozone and non-methane hy-drocarbons: Model evaluation of ozone related species, J. Geo-phys. Res., 108, 4729, doi:10.1019/2002JD003348, 2003b.
von Kuhlmann, R., Lawrence, M. G., Poschl, U., and Crutzen, P. J.:Sensitivities in global scale modeling of isoprene, Atmos. Chem.Phys., 4, 1–17, 2004,SRef-ID: 1680-7324/acp/2004-4-1.
von Liebig, J.: Extrait d’une note sur la nitrification, Ann. Chem.Phys., 35, 329–333, 1827.
Wang, Y., DeSilva, A. W., Goldenbaum, G. C., and Dickerson,R. R.: Nitric oxide production by simulated lightning: Depen-dence on current, energy, and pressure, J. Geophys. Res., 103,19 149–19 159, 1998.
Zhang, G. J. and McFarlane, N. A.: Sensitivity of climate simula-tions to the parameterization of cumulus convection in the cana-dian climate centre general circulation model, Atmos. Ocean, 33,407–446, 1995.
Zhang, R., Tie, X., and Bond, D. W.: Impacts of anthropogenic andnatural NOx sources over the U.S. on tropospheric chemistry,Proc. Nat. Acad. of Sci., 100, 1505–1509, 2003a.
Zhang, X. J., Helsdon Jr., J. H., and Farley, R. D.: Nu-merical modeling of lightning-produced NOx using and ex-plicit lightning scheme: 1. Three-dimensional simulationand expanded chemistry, J. Geophys. Res., 108, 4580,doi:10.10.1029/2002JD003225, 2003b.
Atmos. Chem. Phys., 5, 1815–1834, 2005 www.atmos-chem-phys.org/acp/5/1815/
Related Documents


![NOx Removal Using a Non-thermal Surface Plasma Discharge ... › content › files › pdf › IJPEST_Vol6_No1_13_pp074-080.… · NOx NOx i 100 (3) where [NOx]i and [NOx] are the](https://static.cupdf.com/doc/110x72/5f1e3ef72e75905a25738ef6/nox-removal-using-a-non-thermal-surface-plasma-discharge-a-content-a-files.jpg)


