The Effects of Insider Trading Regulation on Trade Timing, Litigation Risk, and Profitability Alan D. Jagolinzer Stanford University Graduate School of Business 518 Memorial Way Stanford, CA 94305 [email protected] Darren T. Roulstone ∗ University of Chicago Graduate School of Business 5807 South Woodlawn Avenue Chicago, IL 60637 [email protected] October 2007 Please do not distribute or quote without permission ∗ Corresponding author. We thank Sam Peltzman and workshop participants at the BYU Accounting Research Symposium, the University of British Columbia, the University of Illinois, and the University of Wisconsin for helpful comments and suggestions, and Itzhak Ben-David for excellent research assistance. Data on analyst forecasts has been provided by I/B/E/S/ International and data on shareholder lawsuits was graciously provided by Woodruff-Sawyer & Co. We gratefully acknowledge the financial support of the University of Chicago Graduate School of Business and the Stanford University Graduate School of Business; the second author also thanks the Centel Foundation/Robert P. Reuss Faculty Research Fund. 1

Welcome message from author
This document is posted to help you gain knowledge. Please leave a comment to let me know what you think about it! Share it to your friends and learn new things together.
Transcript
The Effects of Insider Trading Regulation on Trade Timing, Litigation Risk, and Profitability
Alan D. Jagolinzer Stanford University
Graduate School of Business 518 Memorial Way Stanford, CA 94305
Darren T. Roulstone∗ University of Chicago
Graduate School of Business 5807 South Woodlawn Avenue
Chicago, IL 60637 [email protected]
October 2007
Please do not distribute or quote without permission
∗ Corresponding author. We thank Sam Peltzman and workshop participants at the BYU Accounting Research Symposium, the University of British Columbia, the University of Illinois, and the University of Wisconsin for helpful comments and suggestions, and Itzhak Ben-David for excellent research assistance. Data on analyst forecasts has been provided by I/B/E/S/ International and data on shareholder lawsuits was graciously provided by Woodruff-Sawyer & Co. We gratefully acknowledge the financial support of the University of Chicago Graduate School of Business and the Stanford University Graduate School of Business; the second author also thanks the Centel Foundation/Robert P. Reuss Faculty Research Fund.
1

Abstract
Prior research indicates that insiders avoid trading ahead of major disclosure events such as
quarterly earnings announcements and that this avoidance is associated with firm policies
restricting the timing of insider trades (Bettis, Coles and Lemmon, 2000; Roulstone, 2003).
Garfinkel (1997) provides evidence that this behavior increased in response to the Insider
Trading and Securities Fraud Enforcement Act of 1988 (ITSFEA). Using a 24-year sample of
insider trades we show that insiders are, over time, increasingly trading after earnings
announcements especially since passage of ITSFEA. This finding is robust to controls for
insider incentives to trade around earnings announcements. We investigate the economic effects
of these changes by documenting a relation between litigation risk (measured by the expected
probability of 10b-5 litigation) and insider trade timing. Specifically, litigation risk is decreasing
in the extent to which insiders trade following earnings announcements rather than before
earnings announcements. Finally, while insiders are increasingly trading during times of lower
litigation risk, we fail to find a general decrease in insider-trading profitability over our sample
period, suggesting that regulation (economy-wide and firm-specific) has not limited the ability of
insiders to exploit private information. However, when we examine firms that respond to the
passage of ITSFEA by moving trading after earnings announcements we find evidence that
abnormal returns to insider trading are lower in the post-ITSFEA period for these firms.
2

1. Introduction
This study examines how firms and insiders respond to changes in insider trade-related
litigation risk by analyzing the effects of changes in insider trade regulation on firm-level
litigation risk and on insiders’ trade distribution before and after earnings announcements. Prior
literature documents that insiders modify trade patterns when faced with increased litigation
risk.1 However, there is little evidence of the net effect of insider trade regulation on total firm-
level litigation risk when considering the changes in trading patterns documented in prior
research. This study utilizes a simultaneous equations approach to directly examine both (1) the
association between increased insider trade regulation and changes in observed insider trade
patterns and (2) the association between changes in observed insider trade patterns and total firm
litigation risk. By examining these two associations we develop a better sense of the true impact
of insider trade regulation on firms’ risk environment.
There is still uncertainty regarding the degree to which insider trade regulation has an effect
on insider trade behavior. For example, Seyhun (1992) finds that insiders reduce “timely” trade
before major firm events such as earnings and takeover announcements; however, he does not
find a decrease in abnormal insider trade profits or volume associated with passage of two
regulatory Acts that materially increase penalties for illegal trade.2
We find evidence that increased insider trade regulation is associated with shifts in insider
trade activity from periods that precede earnings announcements to periods that follow earnings
announcements. This is consistent with prior evidence that insiders appear to avoid trade before
1 For example, insiders appear to avoid trade before forthcoming news events (Givoly and Palmon, 1985), takeover announcements (Seyhun, 1992), management forecasts of earnings (Penman, 1985; Noe, 1999), and earnings announcements (Park, Jang, and Loeb, 1995; Garfinkel, 1997). 2 Seyhun (1992) defines a “timely” trade as one that profitably predicts the earnings news. In other words, sales prior to negative news and purchases prior to positive news would be considered “timely”.
3

pending news events because of heightened litigation risk surrounding these events.3 Our
evidence documents a steady shift in the distribution of trade surrounding earnings
announcements including a marked shift in this distribution associated with the passage of the
Insider Trading and Securities Fraud Enforcement Act of 1988.4 We find some evidence that
shifts in trade distribution are predictably associated with cross-sectional variation in our proxy
for firm litigation risk. Specifically, we find that the average proportion of insiders’ trades that
execute after earnings announcements (relative to before earnings announcements) increases in
firms with higher litigation risk, although this result is sensitive to how we measure insider-
trading patterns.
We also find evidence that new regulation that increases insider trading penalties does not
unambiguously increase overall firm litigation risk, because of the regulation’s endogenous
effect on insider trading patterns. Specifically, we find that, ceteris paribus, the passage of new
insider trade regulation is associated with an increase in firm-level litigation risk. We also find,
however, that new regulation is associated with insider trades shifting away from higher-risk
windows that precede earnings announcement. This shift in insider trade patterns, ceteris
paribus, is associated with a decrease in firm-level litigation risk.
We also analyze whether insiders’ trade profits are affected by changes in litigation risk
through time. Prior research shows that insiders avoid profitable trade opportunities before
notable events such as bankruptcy (Seyhun and Bradley, 1997) and management earnings
forecasts (Noe, 1999); however, insiders still appear to earn abnormal profits from trade over
longer horizons (Noe, 1999), and still appear to predict longer-term performance-related events
3 This is also consistent with increasing imposition of firm-imposed trade restrictions or “blackout windows” immediately before earnings announcements. 4 Congress passed the Insider Trading and Securities Fraud Enforcement Act (ITSFEA) of 1988, which, among other things, increases criminal penalties from five to ten years and increases criminal fines from $100,000 to $1,000,000 for illegal trade activity.
4

(Ke et al., 2003). We examine whether the profitability of insiders’ trades over 1-6-month
horizons shift through time, reflecting a predictable response to changes in the litigation risk
environment. We find that, post-ITSFEA, both insider purchases and sales increase their
reliance on past price changes, i.e., insider buys occur after greater price declines and insider
sales occur after greater price rises. This is consistent with insiders adopting “passive” trading
strategies (Penman, 1982) that are less likely to raise regulatory attention than active trading
strategies. We also find evidence of an increase in active trading for insider purchases and sales:
three-month returns following insider purchases (sales) increase (decrease) post-ITSFEA.5
When we break the sample into firms that appear to respond (or fail to respond) to ITSFEA by
moving insider-trading after earnings announcements we find evidence that ITSFEA is
associated with a relative decrease in active trading by insiders. Specifically, firms that move
trading after earnings announcements show no increase in abnormal profits to insider trading in
the post-ITSFEA period, while firms that do not move trading after earnings announcements
show an increase in such profits.
Collectively, this study provides evidence regarding the net effect of insider trade regulation
on insiders’ trade patterns and firms’ overall litigation risk. By explicitly modeling the
endogenous relation between litigation risk and insider trade patterns, it enhances our
understanding, relative to prior research, of how insiders respond to changes in regulation that
governs their trade activity. The study also updates prior research (e.g., Seyhun, 1992) on the
effect of economy-wide regulation on insiders’ ability to trade and profit from private
information. Specifically, we show that private, firm-level actions appear to be necessary for
regulation to have an effect on insider-trading behavior.
5 Note that insiders implicitly profit from lower returns subsequent to sales since they were able to sell before the price drop.
5

The paper proceeds as follows. Section 2 outlines prior research regarding the relationship
between insider trade regulation and insider trade patterns and also delineates a brief history of
the development of insider trade regulation within the U.S. Section 3 outlines our hypotheses.
Section 4 discusses the data selection procedures for the analyses. Section 5 presents the
empirical analyses and results. Finally, Section 6 summarizes the findings, discusses the study’s
limitations, and presents suggestions for future analysis.
2. Background
Prior studies that examine the association between insider trade patterns and insiders’
regulatory-imposed trade risk typically fall into one of three categories: (1) examining whether
insiders trade in anticipation of price-relevant firm events such as management forecasts
(Penman, 1982; Noe, 1999), firm-specific news releases (Givoly and Palmon, 1985), takeover
announcements (Seyhun, 1992), and bankruptcy (Gosnell et al., 1992; Seyhun and Bradley,
1997); (2) examining whether there are cross-sectional differences in insiders’ trade across
economies with different levels of regulatory risk (e.g., Beny, 2005; Wisniewski and Bohl,
2005); and (3) examining whether shifts in regulation affect insiders’ trade patterns and profits
(e.g., Seyhun, 1992; Garfinkel, 1997). Although there is some conflicting evidence, generally,
studies show that regulatory risk lowers the incidence of insiders’ trades preceding price-relevant
firm events, however, regulatory risk does not appear to reduce insiders’ overall trade volume or
profits.
This study most closely resembles Seyhun (1992) and Garfinkel (1997) who assess the
impact of specific trade enforcement acts on insiders’ trade patterns, and Lee et al., (2007) who
examine the effect of firm-level restrictions on insider-trading profits. Specifically, Seyhun
6

(1992) examines whether there are shifts in insider trading patterns and profits associated with
the enactment of the Insider Trading Sanctions Act (ITSA) of 1984 and the Insider Trading and
Securities Fraud Enforcement Act (ITSFEA) of 1988 which both increase penalties for illegal
insider trade. Congress passed ITSA in 1984 to strengthen enforcement of insider trading laws
in response to increasing frequency of and profitability from illegal insider trade (Bainbridge,
1985). ITSA increased civil penalties by 300% and increased criminal penalties by 1,000%
relative to existing penalties. ITSFEA, among other things, increased criminal penalties to a
maximum of $1 million and increased the maximum jail sentence to 10 years. Seyhun (1992)
documents that there is no discernable decrease in insider trade volume or insider trade
profitability associated with the passage of these laws. However, both Seyhun (1992) and
Garfinkel (1997) examine the association between regulatory enforcement and insiders’ trade
volume before earnings releases and find evidence of decreased “timely” trade in anticipation of
earnings news.
Recent research finds that firms often restrict insiders to trading in the time period following
a quarterly earnings announcement. One impetus for the adoption of trading-window restrictions
on insider trading was the passage of ITSFEA. In addition to the increased penalties mentioned
above, this law amended the Securities Exchange Act of 1934 to impose civil penalties on
“controlling person[s]” who “failed to establish, maintain, or enforce any policy or procedure”
intended to limit violations of insider trading laws. Thus, firms could now be punished for
insider-trading violations by their executives. This Act gave firms an incentive to adopt policies
restricting insiders; trading-window restrictions are a common form for such policies. Bettis,
Coles and Lemmon (2000; hereafter, BCL) and Jeng (1999) survey companies to document these
restrictions and provide evidence that these restrictions arose in the early 1990’s. These
7

restrictions have the effect of reducing the ability of insiders to profit from private information
(BCL; Roulstone, 2003) and affect the incorporation of information into market prices (Jeng,
1999).
Another factor affecting the timing of insider trades is the introduction of SEC Rule 10b5-1
in October 2000 (Jagolinzer, 2007). These plans allow insiders to set up program trades that,
when executed faithfully, afford insiders an affirmative defense against trade-related legal
liability. Thus, insiders using 10b5-1 plans face less risk from trading ahead of disclosure events
relative to insiders not using these plans.
In a related study, Lee et al. (2007) examine whether firm-level restrictions on the timing of
insider trades reduce the profits to insider trading. Using the empirical proxy for restrictions
developed in Roulstone (2003), Lee et al. (2007) observe that firm-level restrictions are rising
over time but that returns to insider trading have not decreased as a result of these restrictions.
This study differs from Lee et al. (2007) by focusing on effects from economy-wide regulatory
changes including changes in firm-level litigation risk and insiders’ trade profitability.
3. Hypothesis development
This study focuses on determining the degree to which litigation risk affects insider trade
patterns and the degree to which insiders’ trade patterns affect litigation risk. Prior research has
generally focused only on the former question, thereby leaving open the question of how the
endogenous nature of insider trade regulation impacts firms.
Because insider trade regulation generally increases insiders’ trade-related litigation costs,
prior research hypothesizes that insiders’ profits and timely trade volume are negatively
associated with increased regulation or enforcement. We present similar hypotheses regarding
insiders’ trades surrounding earnings announcements because these announcements are the most
8

common source of price-relevant news for most firms. Also, as previously noted, there is survey
evidence (e.g., BCL; Jeng, 1999) suggesting firms often limit their insiders’ ability to trade
before earnings announcements. Specifically, we hypothesize that:
H1A: Insiders trade more volume after earnings announcements relative to volume before earnings announcements. H1B: The proportion of insiders’ trade volume after earnings announcements relative to before earnings announcements is positively associated with the passage of regulatory acts that increase illegal insider trade-related penalties.
Firms at risk of shareholder lawsuits are especially sensitive to revelations of insiders trading
on price-relevant information. Johnson et al. (2006) show that abnormal insider selling
correlates with the initiation and outcomes of shareholder lawsuits. Similarly, Griffin and
Grundfest (2002) show that firms sued by shareholders exhibit higher insider selling than control
firms. It is possible that firms that face higher litigation risk will enforce more stringent
restrictions on insiders’ trade activity before material news events like earnings announcements.
It is also possible that insiders at firms that face higher litigation risk infer higher trade-related
litigation costs associated with trades executed before material news events like earnings
announcements. In either case, we hypothesize that:
H2A: The proportion of insiders’ trade volume after earnings announcements relative to before earnings announcements is positively associated with a firm’s expected level of litigation risk.
Since insider trade activity is a key component of firm level litigation risk (Johnson et al.,
2006), presumably less timely trade should be associated with lower overall firm-level litigation
risk. If firms restrict insiders’ trades or if insiders simply choose to trade less before material
news events like earnings announcements, this should, in turn, reduce the likelihood that the firm
will face litigation costs. Specifically, we hypothesize that:
9

H2B: Firm-level litigation risk is negatively associated with the proportion of insiders’ trade volume after earnings announcements relative to before earnings announcements.
Our final hypothesis investigates the economic effects of insider-trading legislation. Similar
to Seyhun (1992), we investigate whether insider profits have declined after increases in
regulation. Seyhun (1992) does not find evidence of a reduction in insiders’ trade profitability
associated with the increased penalties from either ITSA or ITSFEA. We explore this further by
examining the association between the passage of ITSA and ITSFEA and insiders’ strategies
used to obtain trade profits. We examine whether insiders’ trade profits are derived from active
vs. passive strategies and whether changes in insider profits over time are related to firms’ and
insiders’ responses to the passage of ITSFEA.
Active strategies (Penman, 1982) are strategies where the insider trades prior to the release of
information that moves prices. In contrast, passive strategies involve the insider waiting to trade
until after the disclosure of price-relevant information. Presumably, if insiders respond to
increased regulatory risk, they will shift their profitable trade strategies from active to passive.
Further, active trading strategies should be reduced for firms and insiders that respond to
ITSFEA by moving insider trading after earnings announcements. Specifically, we hypothesize
that:
H3A: Active (passive) profits from insiders’ trades are negatively (positively) associated with the passage of regulatory acts that increase illegal insider trade-related penalties. H3B: Active profits from insiders’ trades are negatively associated with the response of firms and insiders to the passage of regulatory acts that increase illegal insider trade-related penalties. 4. Data
Data for this study comes from the Compustat, CRSP, I/B/E/S, CDA/Spectrum, National
Archives, and Thomson Financial Insider Trading Data Feed databases. From Compustat, we
10
collect data on firms’ quarterly earnings announcement dates and earnings surprises. From
CRSP we collect data on trading volume, stock returns around earnings announcements and
market value. From I/B/E/S we collect data on analyst following and forecasts. From
CDA/Spectrum we collect data on institutional holdings. From the National Archives and
Thomson Financial we collect all trades made by top executives and directors of the sample
firms.6 We merge the trading data with the earnings announcement dates to measure the
distribution of insider trades around earnings announcements. To minimize the influence of
firms with short time-series of data we require firms to have at least 28 quarterly observations
between 1980 and 2003 (27 is the upper limit of the first quartile in the distribution of number of
quarterly observations). Data regarding shareholder litigation is provided by Woodruff-Sawyer
& Co.7
Table 1 provides descriptive statistics on the main variables used in the study. The median
firm in the study is small with limited analyst following and institutional ownership. Slightly
over two percent of quarterly observations overlap with a shareholder litigation damage period.
Insider trading is distributed such that slightly over half of all shares traded by insiders are traded
in the one-month period following an earnings announcement. This number is higher for sales
than for purchases, (especially for the median firm) consistent with insiders being more
concerned with the appearance of impropriety while selling shares than while purchasing shares.
Table 2 reports the distribution of insider trades around earnings announcements for each
year of the sample period. The first column of Table 2 reports the percentage of all shares traded
by insiders that are traded in the one month period following an earnings announcement. We
6 We use the National Archives for insider-trading data from 1980 to 1985; we use Thomson Financial for data from 1986-2003. 7 Woodruff Sawyer & Co. is a San Francisco-based insurance broker that deals Directors and Officers’ Liability insurance.
11

call this variable TradePostEarns.8 For all insider trades the percentage falling in the post-
announcement window rises from 37.8% in 1980 to 61.0% in 2003. Columns 2 and 3 of Table 2
present results for insider sales (TradePostEarnsSales) and insider buys (TradePostEarnsBuys). For
insider sales (buys) the change is from 38.5% (34.8%) to 62.0% (58.4%). Thus, over our sample
period, the distribution of insider trade around earnings announcements has gone from an evenly
distributed pattern (i.e., roughly 33% of trades occurring in the month after an earnings
announcement) to one in which insider trades are strongly concentrated in the period following
an earnings announcement. The next section examines this change in more detail by controlling
for the effects of firm factors and litigation risk on insider-trade timing.
5. Empirical Estimation
5.1 Insider Trade-Timing
We evaluate the relation between the timing of insider trades, earnings news and trends in
insider-trading restrictions with the following multivariate estimation (firm and time subscripts
have been omitted):
TradesPostEarns = α0 + α1 Trend + α2 PostITSA + α3 PostITSFEA + α4 Post10b5-1 + α5 TrendPreITSA + α6 TrendPostITSA + α7 TrendPostITSFEA + α8 TrendPost10b5-1 + α9 EarnsReaction + α10 EarnsSurprise + α11 LN(MVE) + α12 LN(AnalystFoll) + α13 InstOwn + α14 PriorReturn + α15 SubseqReturn + ∑
=+
J
jja
115
FixedEffj + ε (1)
8 For example, if 100 shares are traded in the two months before the announcement and 50 shares are traded in the month after the announcement, TradePostEarns will equal 0.333 (50/150).
12
TrendTimePeriod is an iterative count variable that increases by one for each year during the
specified time period;9 PostITSA is a dichotomous variable equal to one if the firm-quarter falls
within the years 1984 and 1990 (i.e., after the passage of ITSA and before ITSFEA) and is zero
otherwise; PostITSFEA is a dichotomous variable equal to one if the firm-quarter falls within the
years 1990 and 2000 (i.e., after the passage of ITSFEA and before the introduction of 10b5-1
trading plans in 2001) and is zero otherwise; Post10b5-1 is a dichotomous variable equal to one
if the firm-quarter falls after the year 2000 and is zero otherwise; EarnsSurprise is the firm-
quarter’s unexpected earnings, defined as the firm-quarter’s seasonal difference in quarterly
earnings, scaled by the firm’s standard deviation of seasonally-differenced earnings;
EarnsReaction is the cumulative, market-adjusted return at the announcement; MVE is the
market value of equity; AnalystFoll is the average number of analysts following the firm during
the year; InstOwn is the percentage of the firm’s outstanding shares owned by institutions scaled
by shares outstanding; and PriorReturn (SubseqReturn) is the market-adjusted return over the
two months prior to (one month following) the earnings announcement.
We control for the potential association between TradePostEarns and firm size since the size
of the firm is associated with the amount of information available regarding an earnings
announcement and with the market’s reaction to these announcements. For large firms, the news
in the earnings announcement has been preempted more than for small firms (Atiase, 1985),
suggesting that insiders at large firms have fewer profitable trading opportunities than insiders at
small firms.10 In addition, larger firms face greater political costs (Watts and Zimmerman, 1986)
and greater litigation risk (Rogers and Stocken, 2005) and thus, are more likely to regulate their
executives’ wealth-appropriating actions than are small firms. We proxy for firm size (MVE)
9 For example, TrendPostITSFEA = 1, 2, 3, and 4 for the first, second, third, and fourth years of the period defined by the PostITSFEA variable, respectively. 10 Seyhun (1998) documents that insider trades are more profitable at small firms than at large firms.
13

with the market value of equity defined as shares outstanding multiplied by price at the
beginning of each data-quarter.
We control for the potential association between TradePostEarns and the number of analysts
that follow the firm because analyst following is associated with the market’s response to
earnings news (Lobo and Mahmoud, 1989) and the quality of the firm’s information
environment. Firms with more analysts have more complete information environments and more
efficient prices, leading to fewer opportunities for insiders to exploit private information.
Analyst coverage also enhances a firm’s visibility and attracts investor scrutiny. We proxy for
analyst following (Analyst) with the number of analysts issuing a one-quarter ahead earnings
forecast in the month prior to the earnings announcement as reported on the I/B/E/S summary
tape. Where I/B/E/S reports no analyst forecasts, we code Analyst as zero.
We control for the potential association between TradePostEarns and the level of
institutional ownership as institutional ownership is associated with the information content of
earnings (El-Gazzar, 1998). Further, the level of institutional ownership is often used to proxy
for corporate governance since institutional owners have resources, incentives and leverage to
monitor corporations. We measure institutional ownership (InstOwn) as the number of shares
owned by institutions, scaled by shares outstanding.
Finally we control for the potential association between TradePostEarns and firm
performance prior to the announcement (PriorReturn) since there is evidence that insiders sell
after prices have risen and buy after prices have fallen (Rozeff and Zaman, 1998).
We measure the effect of regulatory changes and general trends in legal enforcement with
our three indicator and four trend variables. The intercept measures the average value of the
14

dependent variable during the pre-ITSA period (i.e., 1980-1984). The four trend variables
control for general trends during these four periods.
Because an insider’s actions depend on the sign of the news release, we estimate equation (1)
with purchases and sales evaluated separately (i.e., utilizing TradePostEarnsBuys and
TradePostEarnsSells as our dependent variables). Separately examining purchases and sales also
recognizes that insider sells often reflect diversification needs rather than a desire to trade on
information.
One issue with using TradePostEarnsBuys and TradePostEarnsSells as dependent variables is
that they are constrained to lie between zero and 100 inclusive. To address this issue, we
transform these variables into standard normal z-scores using the Invnorm function in STATA.
Inferences using these transformed dependent variables are identical to those reported with the
exception that statistical significance is slightly higher than in the tables [results not tabulated].
We have also estimated equation (1) using a Tobit specification with upper and lower-censoring;
results with Tobit estimation are similar to those presented.
The specification in equation (1) assumes that TradePostEarns has three components: a firm-
specific component representing corporate governance and institutional factors affecting the
firm’s policies on insider trading (modeled by including firm fixed effects); a time-varying
component that reflects changes in the costs and benefits over time of restricting insiders and
changes in the litigation risk from trading on private information; and a quarterly-specific
component that reflects the effect of earnings announcement news on insider incentives to trade
before or after the earnings announcement. For the last component, the EarnsSurprise variable
indicates whether the timing of purchases and sales is affected by the sign and magnitude of the
earnings news. For example, a positive coefficient on EarnsSurprise in the TradePostEarnsSells
15

regression would indicate that insiders concentrate sales in the month following the release of
good news. This would reflect a passive trading strategy that exploits the information being
released. Similarly, the EarnsReaction variable investigates whether insiders time their trades to
take advantage of price movements at the announcement that are unrelated to earnings. We also
estimate the regressions separately for cases where EarnsReaction is positive or negative. This
allows us to test whether insiders are moving trades after earnings announcements even if the
price change at the announcement gives them no reason to. For example, when EarnsReaction is
negative, insiders should sell ahead of and buy subsequent to the announcement, thus reducing
TradePostEarnsSells and increasing TradePostEarnsBuys.
Table 3 contains the results for estimation of equation (1). The table reports OLS
coefficients with t-statistics (in parentheses) based on standard errors robust to heteroscedasticity
and correlation within industry clusters. Panel A reports estimation of the distribution of insider
sales around earnings announcements, while Panel B reports estimation of the distribution of
insider purchases around earnings announcements. Supportive of Hypothesis 1A, Panel A shows
that in the pre-ITSA period, insider sales are slightly more likely after an earnings announcement
as opposed to before an earnings announcement. Supportive of Hypothesis 1B, Panel A reports
positive and significant coefficients on PostITSA and PostITSFEA in all three specifications:
regardless of the news in the announcement, insider sales are more likely to be made in the one
month following an earnings announcement in the post-ITSA and post-ITSFEA period relative to
the pre-ITSA period. The coefficient on PostITSFEA in column 1 indicates that following the
passage of ITSFEA, the proportion of trades occurring after earnings announcement is higher by
11% relative to the pre-ITSA mean of 41%. As expected, the announcement return
(EarnsReaction) has a strongly positive coefficient: insiders delay sales after good news, an
16

example of a passive insider-trading strategy. The earnings surprise also has a positive
coefficient although it is only significant for good news surprises. Firms with high institutional
ownership are also associated with high trading in the post-announcement period, possibly the
result of corporate governance pressure by institutional ownership. Column 2 of Table 3
indicates that even when the announcement releases negative news, insiders move sales after the
announcement in the post-ITSFEA period. Thus, the effect of ITSFEA is not proxying for a
change in announcement news over time.11
Panel B of Table 3 reports similar results for insider purchases. Contrary to Hypothesis 1A,
in the pre-ITSA period, insider purchases are actually slightly less likely to occur after an
earnings announcement relative to before the announcement. This is probably due to purchases
being less likely than sales to attract regulatory and shareholder scrutiny. However, the
coefficients on PostITSA and PostITSFEA are significantly positive across almost all
specifications, supporting Hypothesis 1B: following increases in insider-trading regulation,
insider purchases are more likely to occur after an earnings announcement.12 As expected,
negative announcement returns lead to purchasing occurring in the post-announcement period;
however, the effect of earnings surprises is never statistically significant. As with insider sales,
institutional ownership is positively associated with post-announcement trading. Finally, even
when the announcement return is positive insiders move purchases after the announcement in the
post-ITSFEA period (Column 3).
Given that insiders are increasingly trading after earnings announcements, a related question
is whether insiders are reducing their volume of trading over time. Such a reduction in trading
11 We have also estimated separate regressions based on the sign of the earnings surprise; results are similar to those reported with insider sales increasingly occurring after earnings announcements regardless of the sign of the earnings surprise. 12 The coefficient on PostITSA is not significant for earnings announcements with positive price reactions.
17

would be expected if restrictions on the timing of trades reduce insiders’ opportunities to trade
profitably. In unreported analyses, we regress insider trading turnover (shares traded by insiders,
scaled by shares outstanding) on the same variables as those included in equation (1). We
perform separate regressions for 1) shares purchased in the two months prior to an earnings
announcement; 2) shares sold in the two months prior to an earnings announcement; 3) shares
purchased in the one month following an earnings announcement; and 4) shares sold in the one
month following an earnings announcement. In all cases we find that insider trading volume is
higher following the passage of ITSA and ITSFEA than before ITSA. We also find that insider
purchases continue to increase after 10b5-1 plans are introduced in 2000; however, insider sales
volume decreases after the introduction of 10b5-1 plans. Overall, these results indicate that
insiders are not reducing the volume of their trading (both purchases and sales) even as their
discretion in timing is apparently being reduced.
The regression results in Table 3 indicate that insider trades are increasingly being moved
after major information disclosures. The next section investigates whether these shifts in insider-
trading volume are associated with changes in the litigation risk faced by the firm.
5.2 Litigation Risk and Trade-Timing
Hypotheses 2 and 3 predict that the use of insider-trading window restrictions is
endogenously associated with firm-level litigation risk. We test this prediction by estimating the
following simultaneous system of equations:
TradePostEarns = β0 + β1 LitRisk + β2 LN(MVE) + β3 LN(AnalystFoll) + β4 InstOwn + β5 PriorReturn + β6 SubseqReturn + β7 PostITSFEA + β8 Post10b5-1 + β9 EarnsReaction + φ (2)
18

LitRisk = δ0 + δ1 ΤradesPostEarns + δ2 MinReturn + δ3 StdDevRet + δ4 Turnover + δ5 Ln(MVE) + δ6 BuyHoldRet + δ7 Beta + δ8 BioTechIndDum + δ9 CompHWIndDum + δ10 ElectrIndDum + δ11 RetailIndDum + δ12 CompSWIndDum + δ13 PostITSFEA + δ14 Post10b5-1 + ω (3)
Equation (2) is a condensed version of equation (1) while equation (3) is taken from the
litigation-risk estimation in Rogers and Stocken (2005). TradePostEarns is as defined
previously13; LitRisk is a dichotomous variable equal to one if the firm-quarter observation falls
within a litigation damage period specified within a securities class action lawsuit filed against
the firm, and is equal to zero otherwise.14 MinReturn is the minimum daily return over the firm-
quarter; StdDevRet is the standard deviation of daily returns over the firm-quarter; Turnover is
share turnover (shares traded during the quarter, scaled by shares outstanding); BuyHoldRet is
the buy-and-hold return over the quarter; Beta is the firm’s beta over the firm-quarter estimated
using daily returns and the value-weighted market index; BioTechIndDum CompHWIndDum,
ElectrIndDum, RetailIndDum, and CompSWIndDum are dichotomous variables equal to one if
the firm is in the bio-technology, computer hardware, electrical, retail, and computer software
industries, respectively and is equal to zero otherwise; and PostITSFEA and Post10b5-1 are as
defined previously. Note that due to the need for data on shareholder litigation, we estimate this
13 Note that TradePostEarns is measured using all insider trades (both purchases and sales). 14 We obtain litigation damage period data from a proprietary securities class action dataset graciously provided by Woodruff-Sawyer & Co.
19

model over the years 1987-2003. Thus, we are not able to investigate the effects on litigation
risk of the passage of ITSA in 1984.15
Table 4 reports results regarding the potentially endogenous association between trade-timing
and litigation risk. Column 1 presents two-stage least squares (2SLS) estimation of the
determinants of TradePostEarns. We correct t-statistics for potential correlation within industry
clusters and for heteroscedasticity. The coefficient on predicted litigation risk (LitRisk) is
positive but not statistically or economically significant. Therefore it does not support the notion
that insiders avoid more relative trade before earnings announcements in response to increased
levels of overall firm litigation risk Consistent with the evidence in Table 1, TradePostEarns is
positively associated with firm size, analyst following, institutional ownership, and the passage
of ITSFEA. We also find evidence that the relative proportion of trade before earnings
announcements increases after the adoption of SEC Rule 10b5-1. Specifically, we find that the
estimated coefficient for Post10b5-1 in the TradePostEarns regression is negative (−0.023) and
is statistically significant (t = −2.97), which is consistent with firms allowing insiders’ Rule
10b5-1 trades to execute within otherwise-restricted trade windows before earnings (Jagolinzer,
2007).16
Column 2 of Table 4 reports the determinants of litigation risk as a function of factors
documented in Rogers and Stocken (2005) and the distribution of insiders’ trade activity
surrounding earnings announcements (TradePostEarns). The estimation utilizes IVPROBIT, a
STATA procedure for probit estimation with an endogenous independent variable (in this case, 15 Including a dummy variable for firm-quarters after the passage of the Private Securities Litigation Reform Act of 1995 has no effect on the estimation of equation (3); the coefficient on this dummy variable is not significantly different from zero. 16 The coefficient on Post10b5-1 is positive in Table 3 Panel A which focused on insider sales. The dependent variable in Table 4 is the timing measure based on both purchases and sales. In addition, the time period for Table 3 is 1980-2003, while in Table 4, the time period is 1987-2003. If TradePostEarns increased during 1980-1987, we would expect the coefficient on Post10b5-1 in Table 4 to be more negative than its coefficient in Table 3.
20

TradePostEarns). We correct t-statistics for potential correlation within industry clusters and
for heteroscedasticity. The main result is that, consistent with Hypothesis 2B, the coefficient on
TradePostEarns is negative and significant. This suggests that firms’ overall litigation risk is
decreasing in the degree to which insiders trade after, relative to before, earnings
announcements. To get some sense of economic magnitude, a one-standard deviation increase in
TradePostEarns results in a 0.95 standard deviation decrease in the probability of litigation,
assuming correct model specification. Consistent with Rogers and Stocken (2005), litigation risk
is increasing in firm size and share turnover and decreasing in quarterly stock return, the
minimum daily return during the quarter, and the standard deviation of daily stock returns during
the quarter. We also find that the passage of ITSFEA is associated with an increase in litigation
risk: the coefficient on PostITSFEA is positive and significant.
The estimation in Table 4 uses a measure of trade-timing (TradePostEarns) that is re-
calculated every quarter. This introduces noise in the estimation process as firm policies on
insider trading are probably more evident when trades are examined over a longer period.
Columns 3 and 4 of Table 4 reproduce the estimation with a new measure of insider trade-
timing: (TradePostEarnsAVG). TradePostEarnsAVG is the average value of TradePostEarns over
the current quarter and the prior three quarters. We estimate the TradePostEarnsAVG regression
without EarnsReaction since we would not expect the current quarter price reaction to be
associated with the average value of TradePostEarns over a one year time period.
Results for TradePostEarnsAVG are similar to the results for TradePostEarns with one notable
exception: in column 3, the coefficient on LitRisk (0.426) is statistically positive (t-stat = 2.33).
This provides evidence that a firm’s overall litigation risk is associated with the distribution of
insiders’ trades around earnings and also provides some evidence of the endogenous relationship
21

between regulation, firm-level litigation risk and insiders’ trade patterns. In the fourth column of
Table 4 we see that, just as for TradePostEarns, TradePostEarnsAVG is negatively associated
with litigation risk; however, the economic magnitude of the relation is lower: a one-standard
deviation increase in the average percentage of trading occurring after an earnings announcement
disclosure is associated with a 0.31 standard deviations decrease in litigation risk.
Overall, the results in Tables 3 and 4 suggest that the passage of ITSFEA had two offsetting
effects on litigation risk. First, insiders moved more trading volume to periods after earnings
announcements following ITSFEA’s passage. Second, unconditional litigation risk increased
following the passage of ITSFEA. However, trading after earnings announcement disclosures is
also associated with lower litigation risk. Thus, the effect of ITSFEA on litigation risk depends
on the interaction between an overall increase in litigation and insiders’ trading pattern responses
to the passage of ITSFEA.17
5.3 Insider-Trading Profitability
Our final set of results concern changes in the profitability of insider trading over time. If
changes in regulation and litigation risk have prompted insiders to trade during times of low
litigation risk (or prompted firms to better monitor insiders’ trade activity), we would expect to
see reductions in the ability of insiders to exploit their private information. We test this
proposition by examining changes (post-ITSA and post-ITSFEA) in abnormal returns to insider-
trading events.
17 We have also investigated the direct effect of lawsuits on insider trade timing by creating an indicator variable which, for a given firm-quarter, equals one if any of the prior 8 firm-quarters was part of a lawsuit damages period (zero otherwise). We include this variable in estimation of equation (1). For both insider sales and insider purchases, the coefficient on this variable is positive and marginally significant (two-tailed p-value of 0.05 and 0.09 for purchases and sales respectively) indicating that insiders move trading after earnings announcements in the wake of a lawsuit.
22

We measure changes in profitability by regressing firms’ monthly excess returns on risk factors
and indicator variables that capture mean profit shifts across insider-trading events. For each
firm-month observation, we create an excess return by subtracting the risk free rate from the
firm-month return. These excess returns are regressed on the Fama-French (1993) factors and
the Carhart (1997) momentum factor and on indicator variables for whether the firm-month is in
proximity to an insider-trading event.18 For example, we include an indicator variable for
whether the firm-month is within 3 months prior to an insiders’ trade month; the coefficient on
this indicator variable gives the average abnormal return (i.e., excess return controlling for the
Fama-French and momentum factors) in the three month period prior to the insider-trading event.
We include indicator variables (MonthDumi) in the regression equation below) for five time
periods around insider-trading events: months -6 to 4 before the event-month, months -3 to -1
before the event-month, the event month, months +1 to +3 following the event-month, and
months +4 to +6 following the event-month. We use indicator variables (PeriodDumj in the
regression equation below) to estimate the regression separately for time periods before and after
the passage of ITSA in 1984 and ITSFEA in 1988 and test for changes across the regressions by
fully interacting the variables. This enables us to test whether abnormal returns around insider-
trading events changed after the passage of ITSA and ITSFEA. To avoid the confounding effect
of 10b5-1 plans, we limit the data to years 1980-2000. Because we pool together the firms’
individual time-series of monthly data we control for cross-sectional correlation by clustering the
standard errors of the coefficient estimates by calendar month. The regression model is the
following:
18 The factors are available through WRDS and from Ken French’s website: http://mba.tuck.dartmouth.edu/pages/faculty/ken.french/data_library.html
23

Rit - Rft = γ0 + γ1 (RMkt - Rf) + γ2 SMB +
γ3 HML + γ4 UMD +
γ5 MonthDumi + γ6 PeriodDumj +
ψ (4)
Rit is the raw monthly return for firm i in month t; Rft is the monthly risk-free rate; RMkt is the
value-weighted, monthly, market return; SMB is the difference in monthly return between a
portfolio of small stocks and a portfolio of large stocks; HML is the difference in monthly returns
between a portfolio of value (high book-to-market) stocks and a portfolio of glamour (low book-
to-market) stocks; UMD is difference in monthly returns between a portfolio of winner (high past
returns) stocks and a portfolio of loser (low past returns) stocks; MonthDumi is a set of five
indicator variables specifying whether the firm-month occurs in months -6 to -4, -3 to -1, month
zero, month +1 to +3, or month +4 to +6, relative to the insider purchase or sale; and PeriodDumj
is a set of two indicator variables indicating whether the firm-month is between the passage of
ITSA and ITSFEA (1985-1988) or after the passage of ITSFEA (post-1988). The intercept
captures firm-months before the passage of ITSA that are not in the seven month window around
an insider purchase or sale. The full regression includes the interactions between PeriodDum
and the risk factors and the interactions between PeriodDum and MonthDum.19
Table 5 contains the regression output.20 Panel A of Table 5 focuses on all firms with
required data, while panels B and C focus on subsets of the data partitioned on observed trade
pattern changes associated with the passage of ITSA and ITSFEA. In each table, the first 19 Results in Tables 5 and 6 are not affected by: 1) using only the Fama-French factors (i.e., omitting the momentum factor) or only the market factor. We have also included a factor based on idiosyncratic risk to control for changes in volatility over time. Reported results are similar to results with this factor included in equation (4). 20 Note that we are regressing individual firm-month returns on risk factors and allowing indicator variables to tell us the mean returns to firm-months with characteristics of interest (e.g., firm-months that follow a month with insider purchases). Traditional event studies usually form portfolios of firm-months with a characteristic of interest and regress the portfolio-month return on risk factors. Relative to the latter regression setup, the R-squared for our regression will be low as firm-month returns display greater variation than portfolio-month returns.
24

column presents results for trades that occur in the pre-ITSA period (prior to 1984); the second
column presents the incremental change for trades that occur between ITSA and ITSFEA (1985-
1988); and the third column presents the incremental change for trades that occur after ITSFEA
and before the introduction of 10b5-1 plans (1989-2000). For example, column one of Table 5
panel A shows that in the pre-ITSA period, in the three months ahead of an insider sale, firms
experience a positive return of 1.45% (the coefficient on Months – 3 to - 1 plus the overall
intercept); i.e., insiders are contrarian sellers who sell shares after price increases. The second
and third columns show that, for sales, this contrarian behavior is slightly decreased after the
passage of ITSA, but becomes stronger after the passage of ITSFEA (the sum of the post-ITSA
dummy and the coefficient on Months – 3 to - 1 in the post-ITSA period is a marginally
significant -0.44%, while the sum of the post-ITSFEA dummy and Months – 3 to - 1 in the post-
ITSFEA period is a significant 0.62%). Thus, the passage of ITSFEA appears to be associated
with a greater use of passive trading strategies when insiders are selling.
Examining returns after insider sales shows that insiders earn negative returns to their sales,
i.e., they are active traders. For example, for sales in the pre-ITSA period, returns in the three
months after the trade earn a cumulative abnormal return of -0.52% (p-value <0.001). This
negative return increases after the passage of ITSFEA: the cumulative three-month return
following insider sales is 0.86% lower after ITSFEA than before (p-value<0.001).
The right side of Table 5 panel A shows regression results for insider purchases. As with
insider sales, insider purchasers are contrarians. For example, in the pre-ITSA period, the
cumulative return in the three months prior to a purchase transaction is roughly -1.54% (p-
value<0.001). After ITSFEA, the cumulative return over these months is 0.61% lower than
before the passage of ITSA (p-value=0.013). Active trading also exists: there are positive returns
25

in the months following insider purchases in the pre-ITSA period; however the increase in these
returns post-ITSFEA is only marginally significant (the p-value on the sum of the post-ITSFEA
dummy and Months – 3 to - 1 in the post-ITSFEA period equals 0.052).
Overall, the results in panel A of Table 5 suggest that insiders are contrarians who earn
returns to their trades (purchases precede positive returns and sales precede negative returns)
and, contrary to Hypothesis 3A, that this behavior has not decreased after the passage of
ITSFEA. However, our proxy for the effects of ITSFEA is simply an indicator variable for the
passage of time. Thus, it incorporates any effects of ITSFEA along with other firm, and
economy-wide factors that changes in the post-ITSFEA period relative to the pre-ITSA period.
In order to isolate the effects of ITSFEA, we examine a subset of firms where insiders appear to
have reacted to regulation by altering the distribution of their trading around earnings
announcements.
For Panels B and C of Table 5, we isolate firms and insiders that respond to ITSFEA by
taking all firms with data in the pre-ITSA period (1980-1984) and calculating their average value
of TradePostEarns in the first year they appear in the sample. We then quintile rank (within
years) firms based on initial values of TradePostEarns. We similarly rank firms in the post-
ITSFEA period by calculating their average value of TradePostEarns in the final year they
appear in the sample (or in 2000 if they appear in the sample after 2000). Our sample of firms
that respond to the passage of ITSFEA consists of firms that first appear in the sample in the
bottom quintile of firms ranked on TradePostEarns and last appear in the sample in the top
quintile of firms ranked on TradePostEarns. In other words, these are firms that in the pre-ITSA
period tend to have trades occurring ahead of earnings announcements but in the post-ITSFEA
period tend to have trades appearing after earnings announcements. For comparison purposes, we
26

also examine firms that begin in the bottom quintile and end in the bottom quintile; these firms
appear to have room for insiders to respond to ITSFEA but where insiders choose not to do so.21
Panel B of Table 5 reports results of estimating equation (4) for the “low-responders”, while
panel C reports results of estimating equation (4) for the “responders”. Panel B reports that low-
responders are firms whose insiders are contrarians and earn abnormal returns to their insider
sales (but do not appear to earn returns to purchases). In the post-ITSFEA period, these firms
earn greater returns to insider sales (returns in the three months period following a sale are
1.23% lower post-ITSFEA; p-value=0.019) and also earn significant abnormal returns following
purchases (returns in the three month period following a purchase are 1.11% higher post-
ITSFEA; p-value=0.035). Thus, these firms show no decrease in abnormal returns earned by
insiders after their trades and, in fact, show an increase in such returns.
Turning to the responding firms in Panel C we see a different pattern. Insiders at these firms
are also strong contrarians and they earn abnormal returns to both purchases and sales.
However, in the post-ITSFEA period, there is no evidence of an increase in returns to insider-
trading activity (none of the sums of the post-ITSFEA dummy and the post-ITSFEA month
dummies are significantly different from zero for both sales and purchases). Thus, consistent
with Hypothesis 3B, for firms and insiders that responded to ITSFEA by moving trading after
earnings announcements the change in abnormal returns relative to firms and insiders that did not
move trading after earnings announcements is negative, suggesting that ITSFEA had an effect on
the ability of insiders to earn abnormal returns.22
21 Firms in the lowest (highest) quintile of TradePostEarns in their first year have an average value of TradePostEarns of 9.0% (99%). In their final year in the sample, firms in the lowest (highest) quintile of TradePostEarns have an average value of TradePostEarns of 2.0% (88%). 22 Note that by requiring data in the pre-ITSA and post-ITSFEA time periods, our sample for Table 5 is skewed towards larger firms that survive for several years. However, panels A and B of Table 5 show that this sample is able to detect significant changes in insider-trading profitability across time. Thus, our results in panel C do not appear to reflect a lack of powering our tests.
27

6. Conclusion
This study examines how insider trades are affected by increases in insider-trading
regulation. We find that insider-trading legislation is positively associated with the tendency of
insiders to trade after, relative to before, earnings announcements. This is consistent with firms
and insiders adopting self-imposed limits on trading during times of high information asymmetry
when the penalties for trading on private information increase. Examining the simultaneous
relation between litigation risk and insider timing, we find some evidence of a positive
association between increased litigation risk and insiders’ trade volume after, relative to before,
earnings announcements, consistent with insiders seeking to avoid litigation risk or with firms
increasing restrictions on insiders’ trade. Our results also suggest that increased trade after,
relative to before, earnings announcements, is negatively associated with firms’ overall litigation
risk (as measured by the incidence of shareholder lawsuits).
Regarding insiders’ trade strategies, the evidence suggests that insiders’ passive profits
(earned when insiders delay trades until after the revelation of price-relevant information such as
selling after good news) are positively associated with the passage of the Insider Trading and
Securities Fraud Enforcement Act of 1988. The documented increase in passive trading seems a
rational response to the regulation since passive strategies are much less likely to trigger insider-
trading violations. Evidence also suggests, however, that insiders’ active profits (earned when
insiders trade prior to the revelation of price-relevant information such as selling before bad
news) are positively associated with the passage of ITSFEA. However, examining subsets of
firms defined by whether they respond to ITSFEA by moving trading after earnings
announcements, we provide some evidence that responding firms have lower increases in
28
abnormal profits to insider trading than non-responding firms. Thus, ITSFEA appears to have
some effects on the ability of insiders to exploit their private information.
Our results provide evidence regarding the economic impact of insider-trading regulation,
specifically documenting that regulation appears endogenously associated with insider-trading
patterns and with overall litigation risk. Our results also confirm that there does not appear to be
evidence of overall insider trading profit declines for trades that execute after increased trade
regulation enactment; rather the key factor affecting trading profits is the firm’s apparent
response to the legislation in moving trading after earnings announcements. Thus, in this case,
private enforcement of public regulation appears necessary for the regulation to affect firms and
insiders.
Future research could explore the sources of insiders’ abnormal returns and whether these
returns are associated with regulatory action. Given the incentives to trade after earnings
announcements, insiders should take advantage of the implications of past earnings
announcements for future earnings announcements. For example, insiders may increase sales
after the release of earnings that contain positive accruals which are likely to reverse in the
future. In addition, it would be interesting to delineate what factors lead to the observed
distribution of trade around earnings that is outlined in this study. Specifically, are insiders
trading after earnings announcements because of their own personal aversion to increased
litigation risk, or does this pattern appear because firms respond to increased litigation and
regulatory risk by imposing greater restrictions on when insiders may trade? Finally, the joint
effects of 10b5-1 plans and Reg. FD (which potentially affected information asymmetry between
insiders and market participants) are a promising area for future study.
29

References
Atiase, R. K., 1985, “Predisclosure Information, Firm Capitalization, and Security Price Behavior Around Earnings Announcements”, 23 Journal of Accounting Research, 21-36 Beny, L. 2005, “Do Insider Trading Laws Matter? Some Preliminary Comparative Evidence”, 7 American Law and Economics Review, 144 Bettis, J. C., J. L. Coles, and M. L. Lemmon, 2000, “Corporate Policies Restricting Trading by Insiders”, 57 Journal of Financial Economics, 191-220 Carhart, M. 1997, “On Persistence in Mutual Fund Performance”, 52 Journal of Finance, 57-82 El-Gazzar, S. M., 1998, “Predisclosure Information and Institutional Ownership: A Cross-Sectional Examination of Market Revaluations During Earnings Announcement Periods”, 73 The Accounting Review, 119-129 Fama, F. and K. French, 1993, “Common Risk Factors in the Returns on Stocks and Bonds”, 33 Journal of Financial Economics, 3-56 Garfinkel, J., 1997, “New Evidence on the Effects of Federal Regulations on Insider Trading: The Insider Trading and Securities Fraud Enforcement Act (ITSFEA)”, 3 Journal of Corporate Finance, 89-111 Givoly, D. and D. Palmon, 1985, “Insider Trading and the Exploitation of Inside Information: Some Empirical Evidence”, 58 Journal of Business 69 Gosnell, T., A. J. Keown, and J. M. Pinkerton, 1992, “Bankruptcy and Insider Trading: Differences Between Exchange-Listed and OTC Firms”, 47 Journal of Finance 349 Griffin, P and J. Grundfest, 2002, “When Does Insider Selling Support a ‘Strong Inference’ of Fraud?” (Stanford Law and Economics Olin Working Paper) Jagolinzer, A. D., 2007, “Do Insiders Trade Strategically within SEC Rule 10b5-1?” (Working paper, Stanford University) Jeng, L. A., 1999, “Corporate Insiders and the Window of Opportunity” (Working paper, Boston University) Johnson, M., K. Nelson, and A. Pritchard, 2006, “Do the Merits Matter More? Class Actions under the Private Securities Litigation Reform Act.” 23 Journal of Law, Economics, and Organization, 627-652
30

31
Ke, B., S. J. Huddart, and K. R. Petroni, 2003, “What Insiders Know About Future Earnings and How They Use it: Evidence from Insider Trades”, 35 Journal of Accounting and Economics 315-346 Lee, I., Y. Li, and J. M. Sequeira, 2007, “Do Insiders Make Abnormal Profits from Their Insider Trading Even When Firms Adopt a Rule to Restrict Their Trading?” (Working Paper, National University of Singapore) Lobo G. and A. Mahmoud, 1989, “Relationship between Differential Amounts of Prior Information and Security Return Variability”, 27 Journal of Accounting Research, 116-134 Noe, C. F., 1999, “Voluntary Disclosures and Insider Transactions”, 27 Journal of Accounting and Economics 305-326 Park, S., H. J. Jang, and M. P. Loeb, 1995, “Insider Trading Activity Surrounding Annual Earnings Announcements”, 22 Journal of Business Finance and Accounting Penman, S. H., 1982, “Insider Trading and the Dissemination of Firms’ Forecast Information”, 55 Journal of Business Penman, S. H., 1985, “A Comparison of the Information Content of Insider Trading and Management Earnings Forecasts”, 20 Journal of Financial and Quantitative Analysis Rogers, J. and P. Stocken, 2005, “Credibility of Management Forecasts” 80 Accounting Review, 1,233-1,260 Roulstone, D. T., 2003, “The Relation Between Insider-Trading Restrictions and Executive Compensation”, 41 Journal of Accounting Research 525-552 Rozeff, M. and M. Zaman, 1998, “Overreaction and Insider Trading: Evidence from Growth and Value Portfolios”, 53 Journal of Finance, 701-716 Seyhun, H. N., 1992, “The Effectiveness of the Insider-Trading Sanctions”, 35 Journal of Law and Economics, 149 Seyhun, H. N. and M. H Bradley, 1997, “Corporate Bankruptcy and Insider Trading”, 70 Journal of Business, 189 Seyhun, H. N., 1998, Investment Intelligence from Insider Trading. MIT Press: Boston Watts, R. and J. Zimmerman, 1986, Positive Accounting Theory Wisniewski, T. P. and M. T. Bohl, 2005, “The Information Content of Registered Insider Trading Under Lax Law Enforcement”, 25 International Review of Law and Economics 169

Appendix A. Variable Definitions
Variable Definition
TradePostEarns the number of shares traded by a firm’s insiders during the one-month period following a quarterly earnings announcement scaled by the total number of shares traded by the firm’s insiders during the two-month period that precedes the earnings announcement and the one-month period that follows the announcement
TrendTimePeriod Iterative count variable that increases by one for each year during the specified time period
PostITSA Dichotomous variable equal to one if firm-quarter is between 1984 and 1990; zero otherwise
PostITSFEA Dichotomous variable equal to one if firm-quarter is between 1990 and 2000; zero otherwise
Post10b5-1 Dichotomous variable equal to one if firm-quarter is after 2000; zero otherwise
MVE Market value of equity (shares outstanding multiplied by price 10 days before earnings announcement)
AnalystFoll Number of analysts issuing a earnings forecast in month prior to earnings announcement
InstOwn Percentage of shares outstanding owned by institutional investors
PriorReturn Cumulative, market-adjusted return over the two month period preceding a quarterly earnings announcement
SubseqReturn Cumulative, market-adjusted return over the one month period subsequent to a quarterly earnings announcement
EarnsReaction Three-day, cumulative, market-adjusted return centered on the release day of a quarterly earnings announcement
EarnsSurprise Quarterly earnings analyst forecast error (when available) or seasonal change in quarterly earnings (when analyst forecast error is not available) scaled by price 10 days before earnings announcement
LitRisk A dichotomous variable equal to one if the firm-quarter observation falls within a litigation damage period specified within a securities class action lawsuit filed against the firm, and equal to zero otherwise
MinReturn The minimum daily return over the firm-quarter
StdDevReturn The standard deviation of daily returns over the firm-quarter
Turnover The share turnover over the firm-quarter (shares traded during the quarter, scaled by shares outstanding)
BuyHoldRet The buy-and-hold return over the quarter
Beta Coefficient on market return in a firm-specific market model regression of quarterly daily returns
CompHWIndDum, ElectrIndDum, RetailIndDum, and CompSWIndDum
Dichotomous variables equal to one if the firm is in the bio-technology, computer hardware, electrical, retail, and computer software industries, respectively and is equal to zero otherwise
Rf Risk-free rate
RMkt Monthly Portfolio Return
SMB Return on small firms minus return on big firms
HML Return on value firms minus return on growth firms
UMD Return on winners minus return on losers
32

Table 1. Descriptive statistics
Variable Mean Std. Dev. Q1 Median Q3 TradePostEarns 0.504 0.446 0.000 0.502 1.000 TradePostEarnsSales 0.513 0.450 0.000 0.545 1.000 TradePostEarnsBuys 0.481 0.466 0.000 0.400 1.000 LitRisk 0.021 0.144 0.000 0.000 0.000 MVE ($billion) 1.137 7.672 0.024 0.092 0.415 AnalystFoll 1.399 3.349 0.000 0.000 1.000 InstOwn 0.147 0.230 0.000 0.000 0.240 PriorReturn 0.005 0.245 -0.109 −0.012 0.088 SubseqReturn 0.000 0.176 -0.079 −0.010 0.062 EarnsReaction 0.002 0.079 -0.034 −0.001 0.034 EarnsSurprise -0.002 0.123 −0.009 0.001 0.009 MinReturn -0.099 0.076 −0.125 −0.077 -0.048 StdDevRet 0.037 0.029 0.019 0.030 0.046 Turnover 0.204 0.190 0.071 0.142 0.270 BuyHoldRet 0.043 0.811 −0.143 0.000 0.145 Beta 1.100 2.325 0.332 0.938 1.731
See the Appendix for variable definitions.
Table 2. Distribution of insiders’ trades around earnings announcements
Year TradePostEarns TradePostEarnsSales TradePostEarnsBuys 1980 37.8% 38.5% 34.8% 1981 39.4% 39.6% 39.3% 1982 41.6% 43.5% 36.7% 1983 40.0% 39.5% 39.9% 1984 42.5% 44.0% 39.6% 1985 42.9% 44.9% 38.2% 1986 44.1% 44.5% 41.7% 1987 41.6% 39.2% 43.7% 1988 42.7% 44.3% 40.2% 1989 46.0% 46.9% 43.6% 1990 46.6% 46.3% 46.6% 1991 49.7% 51.7% 44.5% 1992 51.0% 53.0% 46.0% 1993 49.8% 49.2% 51.0% 1994 52.7% 53.0% 51.7% 1995 53.1% 55.5% 49.3% 1996 54.0% 55.0% 51.1% 1997 55.0% 54.7% 53.5% 1998 55.4% 57.9% 50.9% 1999 55.2% 56.7% 53.1% 2000 53.8% 54.8% 51.4% 2001 53.9% 57.8% 45.9% 2002 55.9% 55.8% 55.6% 2003 61.0% 62.0% 58.4% The sample is drawn from all firms on Compustat with at least 27 quarters of observations between 1980 and 2003 and necessary return data from CRSP. Percentages in Table 2 refer to the percentage of shares traded by insiders that are traded in the one-month period following an earnings announcement.
33

Table 3. Factors associated with distributional shifts in insiders’ trades around earnings announcements
Panel A. Sales TradePostEarnsSales = Pooled EarnsReaction < 0 EarnsReaction > 0 Intercept
0.402 (13.09)
0.439 (12.21)
0.416 (8.68)
PostITSA
0.061 (3.56)
0.034 (1.74)
0.082 (3.82)
PostITSFEA
0.117 (6.60)
0.081 (3.93)
0.147 (6.38)
Post10b5-1
0.128 (7.01)
0.112 (4.30)
0.154 (6.40)
TrendPreITSA
0.010 (2.61)
0.005 (1.00)
0.013 (2.71)
TrendPostITSA
-0.004 (2.48)
−0.002 (−0.96)
-0.005 (2.67)
TrendPostITSFEA
0.005 (5.12)
0.007 (5.46)
0.004 (5.37)
TrendPost10b5-1
0.022 (4.11)
0.018 (2.12)
0.024 (3.62)
LN(MVE)
−0.002 (−1.28)
−0.003 (−1.20)
−0.004 (−0.94)
LN(AnalystFoll)
0.003 (1.28)
0.006 (2.21)
−0.000 (−0.13)
InstOwn
0.031 (3.22)
0.004 (0.31)
0.010 (0.68)
PriorReturn
0.161 (13.36)
0.164 (15.64)
0.170 (7.80)
SubseqReturn
0.292 (28.51)
0.286 (17.64)
0.304 (20.01)
EarnsReaction
0.511 (22.97)
0.651 (12.77)
0.381 (8.11)
EarnsSurprise 0.047 (2.02)
−0.031 (−0.96)
0.119 (3.52)
n 106,584 51,255 55,329
Adj. R2 0.162 0.207 0.211
PostITSA=PostITSFEA p-value=0.00 p-value=0.00 p-value=0.00
PostITSFEA=Post10b5-1 p-value=0.41 p-value=0.17 p-value=0.69
34

35
Table 3. Factors associated with distributional shifts in insiders’ trades around earnings announcements
Panel B. Buys TradePostEarnsBuys = Pooled EarnsReaction < 0 EarnsReaction > 0 Intercept
0.254 (7.56)
0.093 (2.20)
0.373 (6.11)
PostITSA
0.044 (2.64)
0.060 (2.08)
0.022 (1.13)
PostITSFEA
0.103 (5.68)
0.118 (3.70)
0.075 (3.62)
Post10b5-1
0.040 (1.50)
0.001 (0.02)
0.051 (1.70)
TrendPreITSA
0.003 (0.79)
0.009 (1.35)
−0.005 (−0.89)
TrendPostITSA
−0.002 (−1.51)
-0.003 (−1.42)
-0.001 (−0.36)
TrendPostITSFEA
0.004 (3.47)
0.002 (1.25)
0.007 (3.94)
TrendPost10b5-1
0.063 (9.55)
0.079 (10.11)
0.057 (7.41)
LN(MVE)
0.009 (3.43)
0.021 (6.13)
-0.000 (0.01)
LN(AnalystFoll)
−0.005 (−1.77)
−0.008 (−2.08)
−0.004 (−1.21)
InstOwn
0.054 (4.24)
0.060 (3.18)
0.045 (2.67)
PriorReturn
−0.190 (−14.82)
−0.215 (−14.33)
−0.171 (−11.32)
SubseqReturn
−0.125 (−8.38)
−0.149 (−5.71)
−0.109 (−6.48)
EarnsReaction
−0.464 (−21.52)
−0.880 (−13.35)
−0.267 (−5.84)
EarnsSurprise −0.022 (−1.32)
−0.010 (−0.41)
−0.035 (−1.58)
n 79,861 40,588 39,273
Adj. R2 0.152 0.221 0.218
PostITSA=PostITSFEA p-value=0.00 p-value=0.00 p-value=0.00
PostITSFEA=Post10b5-1 p-value=0.00 p-value=0.00 p-value=0.24
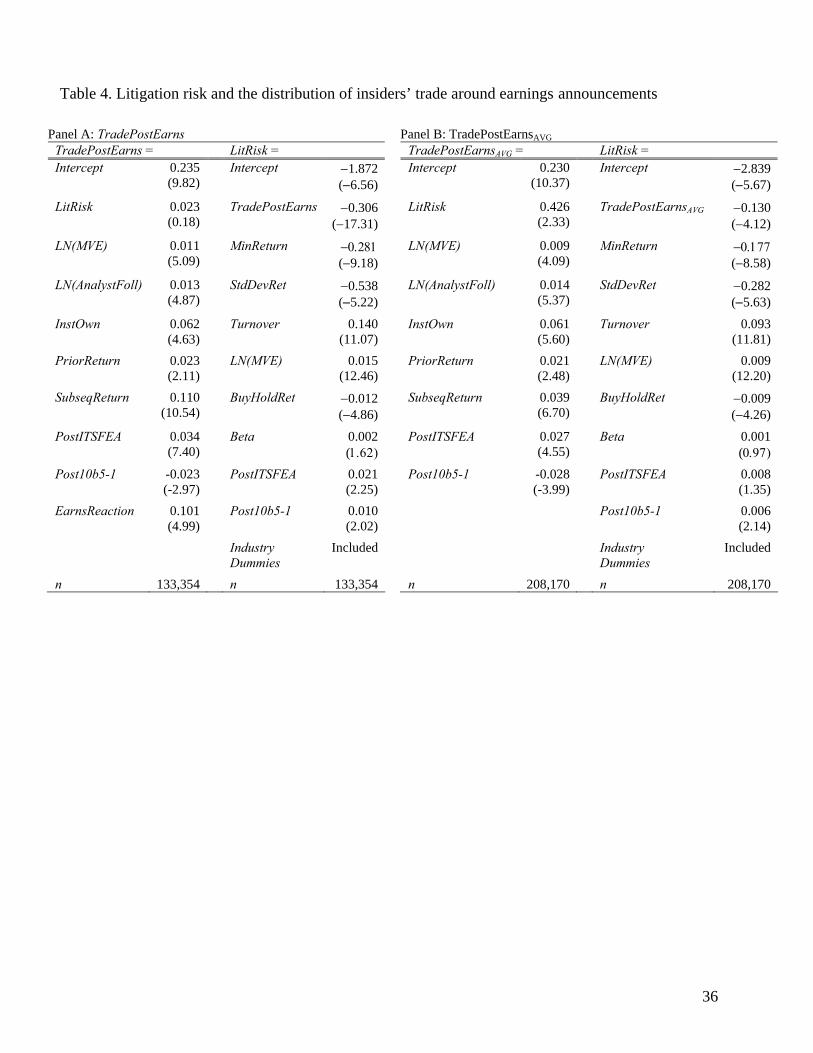
Table 4. Litigation risk and the distribution of insiders’ trade around earnings announcements
Panel A: TradePostEarns Panel B: TradePostEarnsAVG TradePostEarns = LitRisk = TradePostEarnsAVG = LitRisk = Intercept 0.235
(9.82) Intercept −1.872
(−6.56) Intercept 0.230
(10.37)
Intercept −2.839 (−5.67)
LitRisk 0.023 (0.18)
TradePostEarns −0.306 (−17.31)
LitRisk 0.426 (2.33)
TradePostEarnsAVG −0.130 (−4.12)
LN(MVE) 0.011 (5.09)
MinReturn −0.281 (−9.18)
LN(MVE) 0.009 (4.09)
MinReturn −0.177 (−8.58)
LN(AnalystFoll) 0.013 (4.87)
StdDevRet −0.538 (−5.22)
LN(AnalystFoll) 0.014 (5.37)
StdDevRet −0.282 (−5.63)
InstOwn 0.062 (4.63)
Turnover 0.140 (11.07)
InstOwn 0.061 (5.60)
Turnover 0.093 (11.81)
PriorReturn 0.023 (2.11)
LN(MVE) 0.015 (12.46)
PriorReturn 0.021 (2.48)
LN(MVE) 0.009 (12.20)
SubseqReturn 0.110 (10.54)
BuyHoldRet −0.012 (−4.86)
SubseqReturn 0.039 (6.70)
BuyHoldRet −0.009 (−4.26)
PostITSFEA 0.034 (7.40)
Beta 0.002 (1.62)
PostITSFEA 0.027 (4.55)
Beta 0.001 (0.97)
Post10b5-1 -0.023 (-2.97)
PostITSFEA 0.021 (2.25)
Post10b5-1 -0.028 (-3.99)
PostITSFEA 0.008 (1.35)
EarnsReaction 0.101 (4.99)
Post10b5-1 0.010 (2.02)
Post10b5-1 0.006 (2.14)
Industry Dummies
Included Industry Dummies
Included
n 133,354 n 133,354 n 208,170 n 208,170
36

Table 5. Shifts in insiders’ trade profitability in response to regulatory changes Panel A. Pooled
Sales Buys Pre-ITSA Δ Post-
ITSA Δ Post-
ITSFEA Pre-ITSA Δ Post-
ITSA Δ Post-
ITSFEA Intercept 0.0042
(3.57) −0.0050
(−2.61) -0.0027
(−1.34)
Months – 6 to − 4
0.0020 (1.63)
0.0036 (2.24)
0.0044 (2.76)
−0.0024 (−1.90)
−0.0003 (−0.02)
−0.0006 (−0.41)
Months – 3 to − 1
0.0103 (7.74)
0.0006 (0.34)
0.0089 (5.26)
−0.0130 (−9.93)
0.0050 (3.26)
−0.0034 (−1.87)
Month 0 0.0126 (8.33)
0.0004 (0.19)
0.0074 (3.91)
−0.0077 (−4.27)
0.0066 (2.99)
−0.0010 (−0.42)
Months + 1 to + 3 −0.0094 (−8.59)
−0.0001 (−0.07)
−0.0059 (−3.98)
0.0083 (7.02)
0.0003 (0.19)
0.0041 (2.57)
Months + 4 to + 6 −0.0052 (−3.65)
0.0004 (0.24)
−0.0012 (−0.69)
0.0020 (1.51)
−0.0012 (−0.66)
0.0002 (0.10)
Adjusted R2 15.02% Panel B. Low distributional shifts in insiders’ trades around earnings announcements
Sales Buys Pre-ITSA Δ Post-
ITSA Δ Post-
ITSFEA Pre-ITSA Δ Post-
ITSA Δ Post-
ITSFEA Intercept 0.0033
(1.77) −0.0030
(−0.95) −0.0026
(−0.79)
Months – 6 to − 4
0.0016 (0.48)
0.0041 (0.92)
0.0055 (1.20)
−0.0003 (−0.11)
0.0005 (0.12)
−0.0022 (−0.54)
Months – 3 to − 1
0.0161 (4.04)
−0.0059 (−1.14)
0.0082 (1.56)
−0.0084 (−2.01)
−0.0084 (−1.69)
−0.0084 (−1.67)
Month 0 0.0057 (1.16)
0.0110 (1.81)
0.0101 (1.58)
−0.0029 (−0.58)
0.0054 (0.74)
−0.0015 (−0.23)
Months + 1 to + 3 −0.0055 (−1.60)
−0.0066 (−1.50)
−0.0097 (−2.17)
0.0013 (0.36)
0.0048 (1.10)
0.0137 (2.99)
Months + 4 to + 6 −0.0074 (−2.42)
0.0038 (0.92)
−0.0027 (−0.65)
0.0032 (0.79)
0.0032 (0.69)
−0.0052 (−1.12)
Adjusted R2 11.30%
37

38
Table 5. Shifts in insiders’ trade profitability in response to regulatory changes Panel C. High distributional shifts in insiders’ trades around earnings announcements Sales Buys Pre-ITSA Δ Post-
ITSA Δ Post-
ITSFEA Pre-ITSA Δ Post-
ITSA Δ Post-
ITSFEA Intercept 0.0034
(1.26) −0.0080
(−2.06) −0.0039
(−0.95)
Months – 6 to − 4
0.0006 (0.13)
0.0079 (1.37)
0.0067 (1.28)
−0.0024 (−0.60)
−0.0005 (−0.09)
−0.0021 (−0.41)
Months – 3 to − 1
0.0127 (3.73)
−0.0018 (−0.37)
0.0039 (0.82)
−0.0149 (−3.89)
0.0104 (2.05)
−0.0031 (−0.65)
Month 0 0.0184 (3.39)
−0.0069 (−1.02)
−0.0005 (−0.07)
−0.0024 (−0.45)
0.0032 (0.42)
−0.0016 (−0.19)
Months + 1 to + 3 −0.0129 (−3.40)
0.0104 (1.97)
−0.0004 (−0.07)
0.0154 (3.27)
−0.0095 (−1.65)
−0.0020 (−0.35)
Months + 4 to + 6 −0.0076 (−2.27)
0.0006 (0.13)
0.0055 (1.26)
−0.0008 (−0.21)
0.0037 (0.74)
0.0016 (0.33)
Adjusted R2 11.97% Coefficients on the Fama-French and Carhart factors and their interactions with the period dummies are omitted for brevity. Robust t-statistics are clustered at the calendar-month level.
Related Documents