Veterinary Surgery 24:337-346, 1995 The Effects of Implant Orientation, Canal Fill, and Implant Fit on Femoral Strain Patterns and Implant Stability During Catastrophic Testing of a Canine Cementless Femoral Prosthesis ROBERT T. PERNELL, DVM, MS, Diplomate ACVS, JAMES L. MILTON, DVM, MS, Diplomate ACVS, ROBERT S. GROSS, PhD, RONALD D. MONTGOMERY, DVM, MS, Diplomate ACVS, JAMES G.W. WENZEL, DVM, PhD, Diplomate ACT, CARL G. SAVORY, MD, FACS, and HAROLD M. ABERMAN, DVM, MSE Cementless femoral stems were placed into 12 normal greyhound femora. The implanted femora were divided into three groups by stem orientation and implant size and loaded in axial compres- sion at a rate of 25 newtons (N) per second until failure. Rosette strain gauges were used to measure femoral principal strains at 500 N, 1,000 N, 1,500 N, and at maximum load. During maximum load, varus orientation of the femoral stem had significantly higher tensile hoop strains in the proximomedial cortex, whereas neutral orientation had higher tensile hoop strains along the cranial cortex. Femoral fractures occurred in these areas of peak tensile strain. There was no difference in maximum load between groups, therefore varus orientation did not predispose to fracture. Maximizing canal fill and implant fit increased implant stability. QCopyright I995 by The American Colkge of Veterinary Surgeons EMENTLESS TOTAL HIP arthroplasty (THA) C systems depend on biological fixation for long- term survival. Initial stability of the component is a major requirement for tissue ingrowth. Subsidence of the implant within the medullary canal and mi- cromotion between the implant and femur indicate poor implant stability. Cementless stems will subside until the interface compression equals the axial force. The amount of subsidence is influenced by the fric- tion and distribution of the implant-bone interface. When only proximal fit is obtained, the weak me- taphyseal bone will allow subsidence until distal fit at the isthmus occurs (wedge effect).2 The current trend in placement of a cementless prosthesis is to obtain stability by maximizing canal Engh et a1 reported a 93% incidence of bony ingrowth in THA that achieved 100% fit, but only 69% in those less than In addition, patients with complete fit had a lower incidence of pain and limp. Insertion of femoral stems that maximize end- osteal contact increases the likelihood of intraoper- From the Departments of Small Animal Surgery and Medicine, Aerospace Engineering, Large Animal Surgery and Medicine, Auburn University, AL; Hughston Orthopedic Clinic. Columbus, GA; and Research and Development, Howmedica, Inc, Ruther- ford, NJ. This project was funded by the Department of Small Animal Surgery and Medicine. Auburn University; Implants were donated by Howmedica, Inc, Rutherford, NJ. Address reprint requests to Robert T. Pernell, DVM, Coastal Carolina Veterinary Surgery, PA, 186 1 Remount Road, N Charles- ton, SC 29406. @Copyright 1995 by The American College of Veterinary Surgeons 0 16 1-349919512404-0006$3.00/0 337

Welcome message from author
This document is posted to help you gain knowledge. Please leave a comment to let me know what you think about it! Share it to your friends and learn new things together.
Transcript

Veterinary Surgery 24:337-346, 1995
The Effects of Implant Orientation, Canal Fill, and Implant Fit on Femoral Strain Patterns and Implant Stability During Catastrophic Testing of a Canine Cementless
Femoral Prosthesis
ROBERT T. PERNELL, DVM, MS, Diplomate ACVS, JAMES L. MILTON, DVM, MS, Diplomate ACVS, ROBERT S. GROSS, PhD, RONALD D. MONTGOMERY, DVM, MS, Diplomate ACVS,
JAMES G.W. WENZEL, DVM, PhD, Diplomate ACT, CARL G. SAVORY, MD, FACS, and HAROLD M. ABERMAN, DVM, MSE
Cementless femoral stems were placed into 12 normal greyhound femora. The implanted femora were divided into three groups by stem orientation and implant size and loaded in axial compres- sion at a rate of 25 newtons (N) per second until failure. Rosette strain gauges were used to measure femoral principal strains at 500 N, 1,000 N, 1,500 N, and at maximum load. During maximum load, varus orientation of the femoral stem had significantly higher tensile hoop strains in the proximomedial cortex, whereas neutral orientation had higher tensile hoop strains along the cranial cortex. Femoral fractures occurred in these areas of peak tensile strain. There was no difference in maximum load between groups, therefore varus orientation did not predispose to fracture. Maximizing canal fill and implant fit increased implant stability. QCopyright I995 by The American Colkge of Veterinary Surgeons
EMENTLESS TOTAL HIP arthroplasty (THA) C systems depend on biological fixation for long- term survival. Initial stability of the component is a major requirement for tissue ingrowth. Subsidence of the implant within the medullary canal and mi- cromotion between the implant and femur indicate poor implant stability. Cementless stems will subside until the interface compression equals the axial force. The amount of subsidence is influenced by the fric- tion and distribution of the implant-bone interface. When only proximal fit is obtained, the weak me-
taphyseal bone will allow subsidence until distal fit at the isthmus occurs (wedge effect).2
The current trend in placement of a cementless prosthesis is to obtain stability by maximizing canal
Engh et a1 reported a 93% incidence of bony ingrowth in THA that achieved 100% fit, but only 69% in those less than In addition, patients with complete fit had a lower incidence of pain and limp.
Insertion of femoral stems that maximize end- osteal contact increases the likelihood of intraoper-
From the Departments of Small Animal Surgery and Medicine, Aerospace Engineering, Large Animal Surgery and Medicine, Auburn University, AL; Hughston Orthopedic Clinic. Columbus, GA; and Research and Development, Howmedica, Inc, Ruther- ford, NJ.
This project was funded by the Department of Small Animal Surgery and Medicine. Auburn University; Implants were donated by Howmedica, Inc, Rutherford, NJ.
Address reprint requests to Robert T. Pernell, DVM, Coastal Carolina Veterinary Surgery, PA, 186 1 Remount Road, N Charles- ton, SC 29406.
@Copyright 1995 by The American College of Veterinary Surgeons 0 16 1-349919512404-0006$3.00/0
337

338 CATASTROPHIC FEMORAL STRAIN PATTERNS
ative femoral fracture^.^ The incidence of intra- operative femoral fractures for cementless stems is reported to be 2.6% to 28%.'34.6-9 Walker et a1'"S1' illustrated that forceful impaction of a large stem increased tensile hoop strains in the proximal femur 125% of normal, and concluded the increased tensile hoop strains may be responsible for fractures during surgery or in the early postoperative period. Jasty et all2 agreed that press fitting of femoral stems by un- derreaming the isthmus or using oversized implants can produce residual tensile hoop strains large enough to create femoral fractures. Manley et all3 reported an association between subsidence and in- creased tensile hoop strains during axial loading of cemented THA.
Our hypotheses, based on clinical observations, are that large implants placed in neutral orientation are more stable, produce an even distribution of strain and are less likely to cause femoral fractures; and that undersized implants placed in varus posi- tion are more stable than undersized implants in neutral position, but concentrate strain at points of contact and are more likely to cause fractures. This study was performed to evaluate: the association of fracture location and peak tensile strains resulting from alterations in femoral stem orientation, implant fit and canal fill, and the influence of implant fit, canal fill, and orientation on implant stability.
MATERIALS AND METHODS
This study was approved by the Auburn University In- stitutional Animal Care and Use Committee whose guidelines conform to the Animal Welfare Act.
Twelve normal femora with an average length of 24.1 cm (kO.8 cm) were obtained from three male and three female greyhounds. The dogs' ages varied from 2 to 7 years (mean 3 k 2 years) and body weight (BW) varied from 28.6 to 30.5 kg (mean 29.4 k 0.9 kg).
The dogs' hips and femora were radiographed to elim- inate femora with preexisting abnormalities. The dogs were euthanatized and femora extirpated on the day of testing. Implant size was determined by superimposing implant templates over craniocaudal and mediolateral radiographs of extirpated femora. The femora were ran- domly and equally allocated to three treatment groups, with no group containing femora from the same dog. In group one, femoral stems were placed in a neutral position with maximal fill, ie, placement of the largest implant possible without removing cortical bone during broaching (large neutral group). In group two, femoral stems were
placed in a neutral position with the implant used being one size smaller than maximal fill (small neutral group). In group three, similar undersized femoral stems were placed in a varus position (varus group). The method to determine implant orientation has been previously de- scribed.I4 The femoral stems were manufactured from cobalt-chromium alloy (PCA Canine Total Hip System, Howmedica Inc, Rutherford, NJ) and were porous coated along the proximal one-third of their length.
The femora remained at room temperature and wrapped in saline-soaked towels before testing. The fem- ora were potted with polymethylmethacrylate (Technovit, Jorgensen Laboratories, Loveland, CO) in 10" of adduc- tion and 10" of flexi~n. '~. '~- ' ' Three prewired, stacked rosette strain gauges (FRA-2-3L- 1 1, Texas Measurements, College Station, TX) were placed along the proximal me- taphysis and two along the proximal diaphysis (Fig 1) and oriented so that the vertical element was parallel to the long axis of the bone. The rosettes were labeled according to location. Capital letters (M,C,L) refer to the medial, cranial and lateral cortices, respectively. Numbers 1 and 2 were used to designate proximal and distal, respectively.
Site preparation for strain gauge placement was per- formed according to the manufacturer's specifications and has been previously de~cribed.'~ The strain gauges were attached to the femora with methylcyanoacrylate (M- Bond, Measurements Group, Raleigh, NC). The lead wires were connected to a strain indicator and data acquisition system (System 4000, Measurements Group). The potted femora were secured to the ram of a servohydraulic ma- terial testing machine (Model 132 1, Instron Corp, Canton, MA). A 1-cm diameter aluminum rod attached to the load cell contacted the femoral head.
All implanted femora were dynamically tested in axial compression to failure at a loading rate of 25 Newtons per second (N/s). This loading rate was obtained by con- figuring the servohydraulic test controller to run a load control test program rather than a displacement control program. The controller continuously varied the rate of crosshead displacement to obtain a constant loading rate of 25 N/s. Load control allowed direct digital acquisition of maximum load together with strain measurements. Strain measurements were automatically recorded at 3- second intervals or 75 N increments. Load displacement data were recorded from the digital control panel by a VHS camera and manually transferred to a X-Y graph.
Parameters evaluated from the load-displacement data included maximum load, maximum displacement, slope of the initial linear component (A), slope of the graph following yield point (B), load required to produce 2 mm and 4 mm of displacement, yield load, yield displacement, yield energy, and energy at failure (Fig 2). Maximum load was the greatest load observed during the testing interval. Displacement refers to total displacement of the crosshead

PERNELL ET AL 339
I -
ll -
111 -
to subsidence or interface stiffness and slope B referred to the stiffness during subsidence. The yield load was the amount of load required to break interface friction and initiate subsidence. The yield energy was the area under the curve and represented the amount of energy (Nm) absorbed by the bone-implant composite at yield. The energy at failure was the amount of energy absorbed by the femur before failure as measured by the area under the curve at maximum displacement." The area under the curve was calculated using a digitizing tablet (Nu- monics 2200, Jandel Scientific, Corte Madera, CA). Slopes A and B of the load displacement curve were calculated using linear regression.
Measurements of implant alignment were performed manually using a goniometer. Mediolateral alignment was determined from craniocaudal radiographs and was pos- itive in the varus direction and negative in the valgus di- rection. Craniocaudal alignment was measured from the mediolateral radiograph and was positive when the prox- imal end of the stem was angled cranially and was negative when the proximal end of the stem was angled c a ~ d a l l y . ' ~
A digitizing tablet and software (Sigma Scan version 3.90, Jandel Scientific, Corte Madera, CA) were used to determine the level of cut, level of seating, length of the femur, and the percentages of canal fill and implant fit from radiographs taken before loading. Canal fill was de- fined as the amount of the proximal femoral canal oc- cupied by the implant. Mediolateral canal fill was mea- sured linearly at three levels from the craniocaudal radiographs (Fig l ) . l 4 . I 9 Level I was at the lateral flare or elbow of the implant, level Ill was 5 mm proximal to the tip of the stem, and level I1 was halfway between levels I and 111. Linear craniocaudal canal fill was measured only at level 111. Two-dimensional (2-D) measurements of canal fill were performed from both craniocaudal and medio-
Fig 1. Placement of rosette strain gauges along the proximal portion of the femur. Rosette MI was placed below the osteotomy on the medial cortex. Rosette C1 was placed on the cranial cortex and centered over the medial cortex of the femoral diaphysis. Rosette L l was positioned laterally at the level of the implant elbow. Rosettes L2 and M2 were placed at the tip of the stem laterally and medially, respectively. The insert shows the ori- entation of the three strain gauges within each rosette. The letters I to 111 along the lateral cortex represent the three levels of linear canal fill measurement.
and includes subsidence of the implant relative to the bone, femoral bending, and axial compression ofthe bone. Maximum displacement was the displacement recorded at failure. Failure was defined as the inability of the femur to withstand load and occurred with a fissure fracture. Failure occurred when the load decreased by 10% or greater. Slope A was assumed to represent the resistance
lateral radiographs. l4 The medial boundary was the medial endosteal cortex from the osteotomy to the stem tip. The
AXIAL C O M P R E S S I O N ( N ) FA1 LU R E I
MAXIMU H LOAD 2000
0 1 2 3 4 5 - YIELD ENERGY D ISPLACEMENT ( m m )
,I".DfO .IS.,
Fig 2. displacement curve.
Graphic illustration of variables analyzed from the load

340 CATASTROPHIC FEMORAL STRAIN PATTERNS
Table I . Strain Data at 500 N
Rosette MI Rosette M2 Rosette CI Rosette LI Rosette L2 Group (we) (re) (re) h e ) (re)
Large Neutral Maximum El 268.3 k 298. I 228.3 f 84.6 B 309.2 t 208.2 A 338.6 i 229.8 A 191.3 i 234.6 B Minimum E2 -106.1 k 163.3 -469.2 f 119.4 -514.7 t 230.4 b 81.1 f 229.3 -35.5 k 258.1 b Angle El (deg) 37.3 -c 44.7 80.5 f 33.6 -43.7 f 42.2 88.9 f 47.9 59.4 f 45.6
Maximum El 530.0 -t 269.9 219.0 f 92.4 B 274.2 f 183.7 A 334.0 k 75.4 A 139.9 f 28.3 B
Angle E l (deg) -79.3 i 15.8 -82.0 f 3.1 7 I .4 t 38.8 -70.6 k 30.7 46.9 i 38.6
Maximum El 1,030.4 k 696.5 372.1 f 22.2 A 43.9 t 61.6 B 141.1 i 33.7 B 978.5 f 417.1 A Minimum €2 -4 I .4 t 189.2 -453.9 f 162.0 -771.7 t 183.9 b 116.5 f 142.1 601.6 k 396.2 a Angle El (deg) 84.6 + 24.7 -84.0 t 2.2 -18.8f 14.6 64.1 k 6.8 -38.7 f 47.4
Small Neutral
Minimum €2 40.1 f 61.8 -374.7 i 108.6 -61.2 f 65.4 a 90.1 f 91.9 -3 1.4 i 87.0 b
Varus
Mean principal strains (microstrain, pe) and mean angle (degrees) with standard deviation. The maximum principal strains and minimum principal strains were individually compared between groups at each rosette. Values with different letter designations were significant at P 5 .05. Capital letters were used to indicate significant differences in maximurn principal strains and lower case in minimum principal strains.
distal margin was a line between the medial and lateral cortices, at the level of the stem tip. The lateral boundary was the endosteal surface of the lateral cortex from the stem tip to the cortex just opposite the elbow of the stem. The proximal boundary was a diagonal line from the end- osteal cortex opposite the elbow and medial aspect of the osteotomy. Craniocaudal 2-D canal fill was measured from the osteotomy, the stem tip and the endosteal sur- faces cranially and caudally.
Implant fit was defined as the percentage of linear con- tact between the implant and endosteal surface of the cor- tex. A distance of 1 mm or less was defined as having contact. The craniocaudal radiograph was used to measure the medial, lateral, and total mediolateral fit. The medio- lateral radiograph was used to measure the cranial, caudal, and total craniocaudal fit.14
Statistical Analysis
Statistical analysis was performed on a personal com- puter using a commercial statistical software package (SAS Institute, Inc, Cary, NC). Rank transformation (values of one extreme ranked first, the other extreme ranked 12th, etc, with equal values [ties] given the average of the ranks) was performed on the implantation variables (eg, level of cut, level of seating, alignment, canal fill, implant fit), strain data (at 500 N, 1,000 N, 1,500 N and maximum load) and load displacement variables. Contrasts between treatment groups were tested using analysis of variance (ANOVA) of the ranks2' When significance was dem- onstrated with ANOVA, differences between groups were compared using the Ryan-Einot-Gabriel-Welsch multiple F test (REGWF). A Pearson correlation analysis was per- formed between the strain data at maximum load and
the implantation and load displacement variables. A P value I .05 was considered significant.
The ANOVA model used for the strain data partitioned variance between block, dog within block, leg (left versus right), and group. A block contained two dogs whose op- posite femora were in the same two groups. Because paired canine femora are symmetrical in regard to geometric and mechanical proper tie^,^'-^^ variance caused by leg was eliminated from the model when not significant.
RESULTS
Strain Data
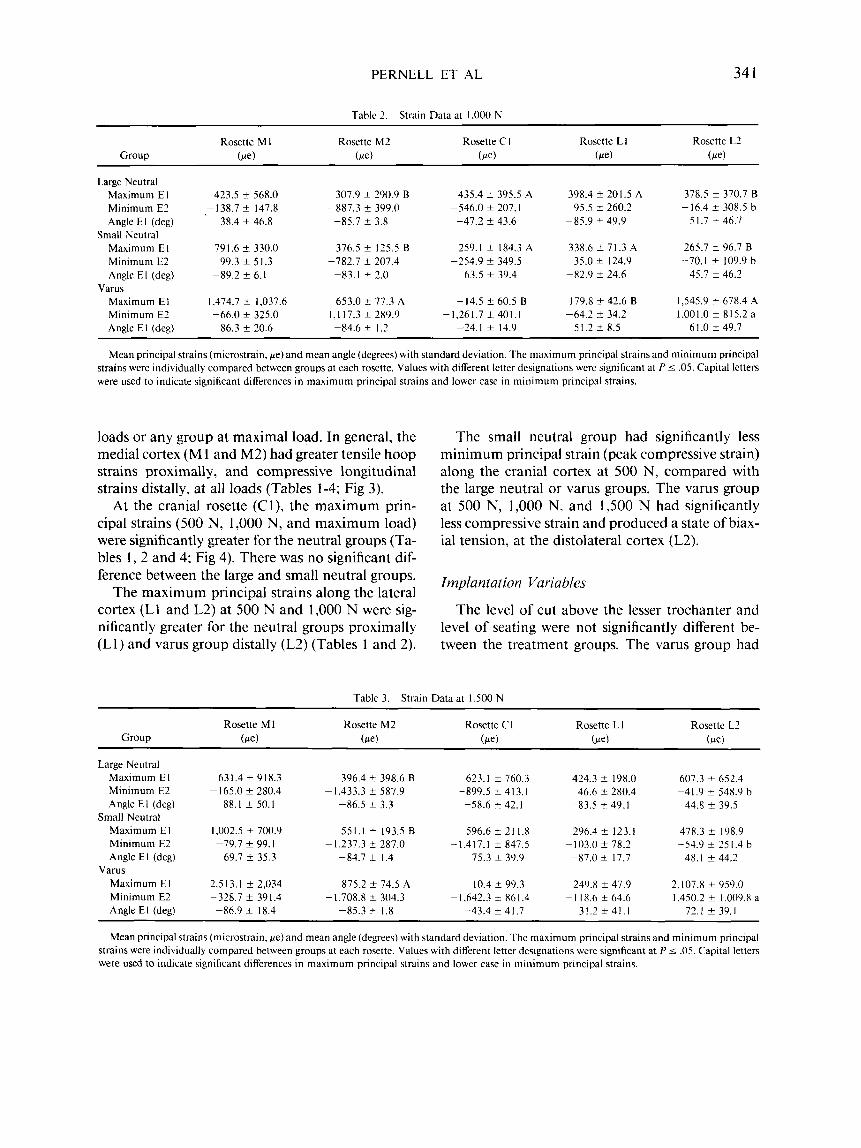
Mean principal strains (+ 1 SD) for the implanted femora under axial compression of 500, 1,000, and 1,500 Newtons are presented in Tables 1, 2, and 3, respectively. The mean principal strains observed during maximum load are listed in Table 4 and il- lustrated in Figs 3-5. In general, the magnitude of the principal strains increased with load with the exception of the minimum principal strains along the lateral cortex (L1 and L2).
At the proximomedial cortex (M l), the maximum principal strains were higher for the varus group, but were only statistically significant at maximum load. The maximum principal strains for all groups during maximum load were oriented circumferentially (Fig 3).
At the distomedial cortex (M2), the maximum principal strains were significantly greater for the varus group at 500, 1,000, and 1,500 N. There were no differences between either neutral group at these
PERNELL ET AL 34 1
Tablc 2. Strain Data at 1.000 N ~ ~~
Rosette L1 Rosette L2 Rosette M I Rosette M2 Rosette C I Group (fie) (fie) b e ) (fie) (fie)
Large Neutral Maximum E I 423.5 f 568.0 307.9 f 290.9 B 435.4 f 395.5 A 398.4 f 201.5 A 378.5 f 370.7 B Minimum E2 -138.7 f 147.8 -887.3 f 399.0 -546.0 f 207.1 95.5 * 260.2 -16.4 f 308.5 b Angle E l (deg) 38.4 f 46.8 -85.7 f 3.8 -47.2 k 43.6 -85.9 f 49.9 5 I .7 f 46.7
Maximum E I 791.6 f 330.0 376.5 f 125.5 B 259.1 f 184.3 A Minimum E2 99.3 f 51.3 -782.7 f 207.4 -254.9 f 349.5 35.0 f 124.9 --70.1 f 109.9 b Angle El (deg) -89.2 ? 6.1 -83.1 f 2.0 63.5 f 39.4 -82.9 f 24.6 45.7 f 46.2
Maximum El 1.474.7 f 1,037.6 653.0 k 77.3 A -14.5 f 60.5 B 179.8 f 42.6 B 1,545.9 2 678.4 A Minimum E2 -66.0 f 325.0 - 1 , l 17.3 f 289.9 -1,261.7 f 401.1 -64.2 f 34.2 1.001.0 f 815.2 a Angle El (deg) 86.3 f 20.6 -84.6 f 1.2 -24.1 f 14.9
Small Neutral 265.7 f 96.7 B 338.6 f 7 I .3 A
Varus
6 1 .0 f 49.7 5 I .2 f 8.5
Mean principal strains (microstrain. fie) and mean angle (degrees) with standard deviation. The maximum principal strains and minimum principal strains were individually compared between groups at each rosette. Values with different letter designations were significant at PI .05. Capital letters were used to indicate significant differences in maximum principal strains and lower case in minimum principal strains.
loads or any group at maximal load. In general, the medial cortex (M 1 and M2) had greater tensile hoop strains proximally, and compressive longitudinal strains distally, at all loads (Tables 1-4; Fig 3).
At the cranial rosette (Cl), the maximum prin- cipal strains (500 N, 1,000 N, and maximum load) were significantly greater for the neutral groups (Ta- bles 1, 2 and 4; Fig 4). There was no significant dif- ference between the large and small neutral groups.
The maximum principal strains along the lateral cortex (L I and L2) at 500 N and 1,000 N were sig- nificantly greater for the neutral groups proximally (Ll) and varus group distally (L2) (Tables 1 and 2).
The small neutral group had significantly less minimum principal strain (peak compressive strain) along the cranial cortex at 500 N, compared with the large neutral or varus groups. The varus group at 500 N, 1,000 N, and 1,500 N had significantly less compressive strain and produced a state of biax- ial tension, at the distolateral cortex (L2).
Implantation Variables
The level of cut above the lesser trochanter and level of seating were not significantly different be- tween the treatment groups. The varus group had
Table 3. Strain Data at 1,500 N
Rosette 1-2 Rosette M 1 Rosette M2 Rosette C 1 Rosette L 1 Group (fie) b e ) (fie) (fie)
Large Neutral Maximum El Minimum E2 Angle El (deg)
Maximum E I Minimum E2 Angle E l (deg)
Maximum El Minimum E2 Angle El (deg)
Small Neutral
Varus
631.4 f 918.3 -165.0 f 280.4
-88.1 f 50. I
1.002.5 f 700.9 -79.7 k 99. I
69.7 f 35.3
2,513.1 f 2,034 -328.7 f 391.4
-86.9 f 18.4
396.4 f 398.6 B -1,433.3 f 587.9
-86.5 f 3.3
551.1 f 193.5 B -1,237.3 f 287.0
-84.7 f 1.4
875.2 f 74.5 A -1,708.8 t 304.3
-85.3 f 1.8
623.1 k 760.3 -899.5 f 413.1
-58.6 f 42.1
596.6 f 2 I 1.8 -1,417.1 k 847.5
75.3 f 39.9
10.4 f 99.3 -1.642.3 k 861.4
-43.4 f 41.7
424.3 f 198.0 46.6 f 280.4
-83.5 f 49.1
296.4 f 123.1 - 103.0 f 78.2 -87.0 f 17.7
249.8 f 47.9 - 1 18.6 f 64.6
31.2 f 4 1 . 1
607.3 f 652.4 -41.9 f 548.9 b
44.8 f 39.5
478.3 f 198.9 -54.9 ? 25 I .4 b
48.1 f 44.2
2.107.8 f 959.0 1,450.2 f 1,009.8 a
72.1 t 39.1
Mean principal strains (microstrain. fie) and mean angle (degrees) with standard deviation. The maximum principal strains and minimum principal strains were individually compared between groups at each rosette. Values with different letter designations were significant at P 5 .05. Capital letters were used to indicate significant differences in maximum principal strains and lower case in minimum principal strains.

342 CATASTROPHIC FEMORAL STRAIN PATTERNS
Table 4. Strain Data at Maximum Load
Rosette M I Rosette M2 Rosette C I Rosette LI Rosette L2 Group b e ) ( w ) b e ) b e ) b e )
Large Neutral Maximum E I 1,245.9 f 1,181.5 B* 844.2 f 1,224.9 1,416.7 f 1,244.2 A 394.9 k 26 I .7 I ,2 13.0 k 966.1
-2,062.6 f 565.0 -3 16.0 f 294.5 178.0 f 853.7 Minimum E2 -751.2 f 987.2 -2,4 14.4 k 23 1.4 Angle El (deg) 90.0 f 52.5 -84.7 f 3.3 -72.8 f 8.7 87.4 f 42.3 25.9 f 23.1
Maximum El 1,133.8 * 1,133.8 B* 745.8 k 153.2 1,876.2 f 1.276.7 A 36 1 .O f 228.6 612.0 f 153.0 -3,884.8 f 1,473.7 -206.0 f 147.1 -83.9 f 440.6 Minimum E2 -392.7 f 262.6 -1,714.5 f 613.9
Angle El (deg) -77.4 f 35.6 -84.6 f 1.1 -75.4 f 18.1 -81.1 f 17.0 49.4 k 40.6
481.5 f 834.9 B 248.9 f 82.0 1,502.7 k 376.4 Maximum El Minimum E2 - 1,628.8 f 2.240.7 -2,438.4 f 786.8 -2.400.5 f 1,077.4 -141.6 f 89.3 818.5 f 482.3 Angle El (deg) 85.4 i 28.8 -86.0 f 2.6 -72.1 f 39.1 1.6 k 39.6 47.7 k 18.1
Small Neutral
Varus I, 169.4 f 30 I .8 4,169.7 f 3,101.0 A*
Mean principal strains (microstrain, pe) and mean angle (degrees) with standard deviation. The maximum principal strains and minimum principal strains were individually compared between groups at each rosette. Values with different letter designations were significant at P i .05. Capital letters were used to indicate significant differences in maximum principal strains and lower case in minimum principal strains.
* P = .04, REGWF did not detect significant differences between groups.
significantly greater mediolateral alignment (4.0 k 1.4") than the large (0.50 -t 2.1") and small (0.75 f 1.0") neutral groups. There were no significant dif- ferences in craniocaudal alignment between groups.
Mediolateral canal fill at level I was significantly less for the varus group (Table 5) . The large and small neutral groups were not significantly different. Mediolateral and craniocaudal canal fill at level I11 was significantly greater for the large neutral group. There was no significant difference between the small neutral or varus groups. Craniocaudal2-D canal fill
was significantly different between all three groups. The large neutral group had the greatest percentage of canal fill, followed by the varus group, and then the small neutral group. There were no significant differences between groups at level I1 or 2-D medio- lateral canal fill.
The large neutral and vams groups had signifi- cantly greater lateral implant fit compared with the small neutral group (Table 6). The large neutral group had significantly greater cranial and total
SMALL NEUTRAL
Fig 3. Graphic illustration of the strain distribution of the me- dial cortex at maximum load. Compressive strains are illustrated by converging arrows and tensile strains by diverging arrows. The maximum principal strain for the varus group (*) was sig- nificantly greater than the large and small neutral groups.
Fig 4. Graphic illustration of the strain distribution of the cra- nial cortex at maximum load. Compressive strains are illustrated by converging arrows and tensile strains by diverging arrows. The maximum principal strain for the large and small neutral groups were significantly greater than the varus group (*).

PERNELL ET AL 343
LARGE NEUTRAL
t h u BAR = 200 MICROSTRAIN
SMALL NEUTRAL
I
Fig 5. Graphic illustration of the strain distribution of the lat- eral cortex at maximum load. Compressive strains are illustrated by converging arrows and tensile strains by diverging arrows.
craniocaudal fit compared with the small neutral or varus groups.
To evaluate the influence of implantation vari- ables on the distribution of strain during maximum load, a correlation analysis was performed. Increased mediolateral alignment (varus orientation) was as- sociated with increased tensile strain at the proxi- momedial cortex (r = 0.60, P = .04) and decreased compression at the distolateral cortex (r = 0.71, P = .Ol ) . Compressive strains at rosette Cl increased with greater craniocaudal alignment (r = -0.58, P = .05), lower craniocaudal 2-D fill ( r = 0.63, P =
.03) and lower lateral fit (r = 0.7 1, P = .O 1 ).
Load Displacement Data
The 10 variables measured from the load dis- placement curve are defined in Fig 2 and presented in Tables 7 and 8. Load displacement data (except maximum load and maximum displacement) from the first three femora were eliminated because of technical errors. Because of the small group size and high probability of committing a type I1 statistical error, load displacement conclusions were generally based on correlation analysis and not ANOVA. Maximum displacement was the only variable that showed a significant difference between groups. The varus group had significantly greater displacement than either of the neutral groups, which were not significantly different. A correlation analysis between
Table 5. Mean Percentage of Canal Fill
Large Neutral Small Neutral Varus Grouo Grouo Group
Mediolateral Level I (%)
Mediolateral Level I 1 (90)
Mediolateral Level 111 (e)
Mediolateral
Craniocaudal 2-D (%)
Level 111 (a')
69.8 k 5.9 A
75.1 f 6.9 (65.3-81.5)
84.3 k 4.8 A (80.3-91.3)
77.2 f 4.8
86.5 f 3.9 A
(61 .l-73.9)
(70.3-80.8)
(82.7-9 I .9)
66.1 k 1.0 A
70.1 & 2.9 (66.1-73.0) 74.1 k 4.1 B (69.5-78.8) 71.6 f 2.4
71.5 k 8.0 B
(65.3-67.5)
(68.7-73.7)
(64.0-78.6)
59.3 -+ 3.2 B (55.2-63.0) 66.9 -+ 6.3
72.9 1 6 . 4 B
70.2 2 4.1
73.0 f 3.4 B
(58.6-73.6)
(63.9-78.2)
(64.4-73.3)
(68.6-76.0) 82. I f 4.3 A 65.2 k 2.4 C 70.4 ? 5.2 B Craniocaudal
2-D (70) (78.1-86.9) (62.0-67.8) (65.9-75.6)
Mean percentage of canal fill and standard deviation. The numbers in parentheses are the range. Within each level. when the letters beside the standard deviation differ. the differences is significant at P I .05.
the load displacement data and implantation vari- ables showed several significant associations. Lower maximum displacement was associated with in- creased mediolateral canal fill at level 111 (r = -0.60, P = .05), cranial fit (r = -0.64, P = .03), and total craniocaudal fit (r = -0.43, P = .04). Femora with higher levels of cut were associated with higher max- imum loads (r = 0.80, P = .002). Increased stiffness during subsidence (slope B) was associated with greater craniocaudal fill at level 111 (r = 0.64, P = .05), craniocaudal2-D fill (r = 0.73, P = .02), cranial fit (r = 0.88, P = .0007), and total craniocaudal fit (r = 0.90, P = -0004). Increased load required to
Table 6. Mean Percentage of Implant Fit
Large Small Neutral Group Neutral Group Varus Group
Medial Fit (%) Lateral Fit (B) Total M-L Fit (%') Cranial Fit (Yo)
Caudal Fit (W ) Total CRCD Fit
19.4 f 22.9
43.1 k 23.1 A (0.0-44.7)
(2 3.3-7 3.5) 29.5 f 17.8
(10.0-50.3) 86.0 f 12.0 A
32.7 k 18.7
59.0 f 11.8 A (50.1-75.9)
(68.8-94.5)
( I 5.8-57.9)
14.1 f 28.2 (0.0-56.4)
9.2 f 11.7 B (0.0-24.4)
12.0 k 14.0
26.2 ? 18.6 B (3.5-48.2)
13.6 +_ 11.6 (2.2-27.4)
19.9 ? 7.0 B (12.3-26.8)
(0.0-31.9)
31.1 ? 14.3 (I 7.7-48.6)
30.0 k 6.8 A (24.0-38.0)
30.6 ? 8.6 (20.5-38.2)
29.4 f 20.1 B (2.3-39.4)
20.4 f 16.8 (7.5-44.4)
24.9 f 15.7 B (10.7-46.9)
Mean percentage of implant fit and standard deviation. The numbers in parentheses are the range. Within each level, when the letters beside the standard deviation differ, the difference is significant at P I .05.

344 CATASTROPHIC FEMORAL STRAIN PATTERNS
Table 7. Load Displacement Data
Large Neutral Group Small Neutral Group Varus Group (N = 4) (N = 2) (N = 3)
Interface Stiffness (A) (N/m)
Stiffness during Subsidence (B) (N/m)
Yield load (N)
Yield Displacement (mm)
Yield energy (Nm)
1,390.4 & 204.6
32 1 .O f 92.9
889.3 t 245.8
0.66 f 0.2
0.32 t 0. I7
( I , 185- 1,672)
(2 17.5-405.7)
(662.6- 1,2 19.0)
(0.41-0.90)
(0.14-0.54)
1,280.9 ? 347.3
178.5 ? 39.7*
7 18.6 ? 470.2
0.63 5 0.53
0.29 f 0.34
( I ,035.3-1,526.5)
( 148.4-223.5)
(386.1-1,05 1.0)
(0.25-1.00)
(0.05-0.53)
1,325.1 t 133.7
131.0 f 109.3
1,021.6 t 405.2
0.78 f 0.25
0.41 f 0.23
(1,18 1.0-1,445.0)
(55.0-256.3)
(559.9-1,3 18.0)
(0.50-0.96)
(0.15-0.57) ~ ~~
Variables are listed as the mean and standard deviation. The numbers in parentheses are the range. * N = 3
displace the femoral stem 4 mm was associated with greater cranial fit (r = 0.72, P = .02) and total cra- niocaudal fit (r = 0.78, P = .007). The ability of the femur to absorb energy before failure was associated with increased level of cut (r = 0.69, P = .03) and craniocaudal alignment (r = 0.66, P = .04).
Fracture Location
The location of fractures varied among treatment groups. The four femora with the large implant placed in a neutral position fractured along the cra- nial cortex at the lateral half of the horizontal oste- otomy site. All four femora of the small neutral group fractured along the cranial cortex at the medial half of the horizontal osteotomy site. The femora of the varus group had the most variation in fracture location. Two femora fractured at the osteotomy on the proximomedial cortex. The other two femora initially developed fissure fractures that originated distal to the osteotomy. The fissure in femur no. 9 originated on the medial cortex approximately 2 cm below the osteotomy and extended distally for 2 cm. The fissure in femur no. 12 began on the lateral cor- tex at the level of rosette L2 and extended distally for 3 cm. These femora (9 and 12) withstood addi- tional loading but eventually developed other com- plete fractures along the cranial cortex. The force required to initiate catastrophic failure (maximum load) was greatest for the large neutral group (2,766.5 k 1,103.2 N). When compared with the small neutral (2,047.3 -t 574.9 N) or varus (2,044.3 k 576.2 N) groups, the difference, however, was not significantly different (P = .33).
DISCUSSION Tensile strength is the most important mechanical
property of bone, as bones usually fail in tension rather than compression.'8 Neutral orientation (large and small implant groups) more evenly distributed tensile strain at all loads. In the varus group, prox- imomedial and distolateral concentrations of tensile strain coincided with points of focal implant fit. There was a direct relationship between varus ori- entation and tensile strain at the proximomedial cortex (r = 0.60, P = .04). The location of the highest peak tensile strains coincided with the origination of fractures. All eight femora in the neutral groups fractured along the cranial cortex. In contrast, 3 of 4 femora in the varus group fractured or developed a fissure along the medial cortex. The fourth femur initially fissured along the distolateral aspect of the femur at an area of elevated tensile strain (L2).
The strain data varied considerably at all loads (Tables 1-4). Possible explanations for the large vari- ation include small sample size, reversals in direction of principal strain magnitude, and data that was not normally distributed. Because the assumption of normal distribution could not be made, rank trans- formation of the data was performed.
Femora with large implants in neutral position required the greatest load to initiate failure but this difference was not significant (P = -33). Although higher tensile strains were measured from the varus group, we could not conclude that varus orientation predisposed to failure, because there was not a sig- nificant difference in maximum load.
The average load to failure for all implanted ca- nine femora was 2,286.0 -t 799.1 N, which is equiv-

PERNELL ET AL 345
Table 8. Load Displacement Data
Large Neutral Group (N = 4)
Small Neutral Group (N = 3 )
Varus Group (N = 3 )
Load Q 2mm (N)
Load Q 4mm ( N )
Max Load (N)
Maximum Displacement (mm)
Energy Failure (Nm)
1,487.3 +_ 215.4
2,129.5 f 377.2
2,766.5 f 1.103.2
(1,297.8-1,791.1)
( 1.732.9-2.576.9)
(1,952-4.396) 6.0 -+ 2.3 B
(4.3-9.3)
(6.3-26.0) 11.8 f 9.5
941.3 -+ 374.4
1,298.3 f 453.6
2.047.3 f 514.9 ( 1.649-2,899)* 8.6 f 0.7 B
(641.9-1,361.1)
(938.8-1.808.0)
(7.7-9.2) I I .9 4.08
(9.3- 16.6)
1,430.4 f 645.4
1,692.4 * 815.2
2,044.3 f 576.1
11.7 k 0.5 A ( I 1.3-12.3) 19.6 f 7.0 (13.2-27.1)
(740.2-7,018.9)
(903.6-2.531.61
( 1.623-2.854)*
Variables are listed as the mean and standard deviation. The numbers in parentheses are the range. When the letters beside the standard deviation
* N = 4 . differ, the difference is significant at P I .05.
alent to 23 1.9 kg or 790% BW. It seems unlikely that postoperative femoral fractures will develop if ex- ercise is limited, but the load to failure may be lower when torsional forces are applied to the femur.24
Cementless implants must be stable for tissue in- growth.' Implant stability is influenced by the fric- tion and distribution of the implant-bone interface.2 The yield point of the load displacement curve (Fig 2) represents the loss of interface stability and be- ginning of subsidence leading to failure. The mean yield load for all femora was 895.4 f 324.3 N which is equivalent to 90.9 kg or about 300% BW. Two to 4 months after THA, dogs generate forces equal to 50% to 80% BW on their hip joints during walking." One femur in the small neutral group had a yield load equivalent to 137% BW. Dogs with undersized implants placed in neutral position may generate enough force to cause subsidence if they are allowed excessive postoperative activity. Further investiga- tion into the forces generated in the canine prosthetic hip joint during various activities needs to be per- formed.
Based on correlation analysis, greater canal fill and implant fit were associated with increased implant stability. The large neutral group had greater stiffness during subsidence (slope B) compared to the small neutral or varus groups (P = .07). With increased canal fill and implant fit the stiffness during subsi- dence was increased. The most significant variable was total craniocaudal fit (r = 0.90, P = .0004). The results of the present study agree with other studies that correlated increased canal fill and implant fit with greater ~tability.'~~~~.'~.'~~'~
The varus group had significantly greater maxi- mum displacement than either neutral group. With load, the varus implant shifted laterally while sub- siding distally. The significant difference in displace- ment was attributed to the greater lateral displace- ment of the varus group.
There was a direct relationship between load, dis- placement and tensile hoop strain along the medial and cranial cortices indicating that, as an implant is loaded and subsidence occurs, tensile strains in- crease. These findings are in agreement with Manley et all3 who reported an association between subsi- dence and increased tensile hoop strains during loading of cemented THA.
In the clinical setting, canal fill, and implant fit should be maximized to decrease subsidence and promote tissue ingrowth. Maximal fill can only occur with neutral orientation that produces an even dis- tribution of tensile strain. If maximal fit and fill is not possible because of limitations in implant size, placement of an undersized stem in varus position will increase proximomedial and distolateral fit and provide interface stability equal to the large neutral group. Varus orientation will significantly increase tensile hoop strains, but the results of the present study indicate that this will not lead to failure at lower loads.
CONCLUSIONS
Varus orientation of the femoral stem generated higher tensile and compressive strains in the proxi- momedial cortex region during maximal loads. Im-

346 CATASTROPHIC FEMORAL STRAIN PATTERNS
plants placed in neutral orientation had higher tensile hoop strains along the cranial cortex during maximal loads. Location of femoral fractures directly coin- cided with peak tensile strains. There was not a significant difference in maximum load between groups, therefore varus orientation did not predis- pose to fracture. Maximizing canal fill and implant fit increased implant stability.
REFERENCES
I . Andrew TA, Flanagan JP, Gerundini M, et al: The isoelastic, noncemented total hip arthroplasty: Preliminary experi- ence with 400 cases. Clin Orthop 206: 127- 138, 1986
2. Huiskes R: The various stress patterns ofpress-fit, ingrown, and cemented femoral stems. Clin Orthop 26 1 :27-38, I990
3. Rashmir-Raven AM, DeYoung DJ, Abrams CF, et al: Sub- sidence of an uncemented canine femoral stem. Vet Surg
4. Stuchin SA: Femoral shaft fracture in porous and press-fit total hip arthroplasty. Orthop Rev 19: 153-1 59, 1990
5. Engh CA, Bobyn JD, Glassman AH: Porous-coated hip re- placement: The factors governing bone ingrowth, stress shielding, and clinical results. J Bone Joint Surg 69-B:45- 55, 1987
6. Fitzgerald RH, Brindley GW, Kavanagh BF: The unce- mented total hip arthroplasty: Intraoperative femoral fractures. Clin Orthop 235:61-66, 1988
7. Mont MA, Maar DC, Krackow KA, et al: Hoop-stress frac- tures of the proximal femur during hip arthroplasty: man- agement and results in 19 cases. J Bone Joint Surg 74-B:
8. Mallory TH. Kraus TJ, Vaughn BK: Intraoperative femoral fractures associated with cementless total hip arthroplasty. Orthopedics 12:23 1-239, 1989
9. Schwartz JT, Mayer JG, Engh CA: Femoral fracture during non-cemented total hip arthroplasty. J Bone Joint Surg
10. Walker PS, Schneeweis D, Murphy S, et al: Strains and micromotions of press-fit femoral stem prostheses. J Bio- mech 20:693-702, 1987
1 1 . Walker PS, Robertson DD: Design and fabrication of ce- mentless hip stems. Clin Orthop 23525-34, 1988
12. Jasty M, Harrigan TP, Henshaw R: Residual strains pro- duced in the proximal femur during rasping and during insertion of uncemented metal femoral components.
21:327-331, 1992
257-260, 1992
71-A:1135-1142, 1989
Trans Orthopedic Research Society 33rd annual meeting, San Francisco, January 19-22, 1987, p 399
13. Manley MT, Stern LS, Kotzar G, et al: Femoral component loosening in hip arthroplasty: Cadaver study of subsidence and hoop strain. Acta Orthop Scand 58:485-490, 1987
14. Pernell RT, Milton JL, Gross RS, et al: Femoral strain dis- tribution and subsidence after physiologic loading of a cementless canine femoral prosthesis: The effects of im- plant orientation, canal fill and implant fit. Vet Surg 23: 503-5 18, 1994
15. Diegel PD, Daniels AU, Dunn HK: Initial effect of collarless stem stiffness on femoral bone strain. J Arthroplasty 4:
16. McBeath AA, Schopler SA, Narechania RG: Circumferential and axial strain in the proximal femur: Effect of prosthesis and position. Clin Orthop 150:301-305, 1980
17. Bergmann G, Siraky J, Rohlmann A: A comparison of hip joint forces in sheep, dog and man. J Biomech 17:907- 921, 1984
18. Currey JD: The mechanical properties ofbone. Clin Orthop
19. DeYoung DJ, Schiller RA: Radiographic criteria for eval- uation of uncemented total hip replacement in dogs. Vet Surg 21%-98. 1992
20. Conover WJ, Iman RL: Rank transformations as a bridge between parametric and nonparametric statistics. Am Statistician 35:124-133, 1981
2 1. Tonino AJ, Davidson CL, Klopper PJ. et al: Protection from stress in bone and its effects: Experiments with stainless steel and plastic plates in dogs. J Bone Joint Surg 58-B: 107-1 13, 1976
22. Sumner DR, Turner TM, Galante JO: Symmetry of the canine femur: implications for experimental sample size requirements. J Orthop Res 6:758-765, 1988
23. Crowninshield RD, Pedersen DR, Brand RA: A measure- ment of proximal femur strain with total hip arthroplasty. J Biomech Eng 102:230-233, 1980
24. Mcpherron MA, Egger EL, Gomez MA: Effect of cemented total hip replacement on torsional characteristics of the canine femur. Proceedings of the 19th annual VOS Con- ference. Keystone, CO 1992, p 5
25. Whiteside LA: The effect of stem fit on bone hypertrophy and pain relief in cementless total hip arthroplasty. Clin Orthop 247:138-147, 1989
26. Phillips TW, Messieh SS, McDonald P D Femoral stem fix- ation in hip replacement: A biomechanical comparison of cementless and cemented prostheses. J Bone Joint Surg
173-178, 1989
73~210-231, 1970
72-B:431-434, 1990
Related Documents


![A cementless, proximally fixed anatomic femoral stem ...bone interfaces inhibited bone ingrowth when the micro-motion exceeded 150 mm [10,11]. We hypothesized that a cementless, anatomic](https://static.cupdf.com/doc/110x72/5e63476c137d81362d557525/a-cementless-proximally-fixed-anatomic-femoral-stem-bone-interfaces-inhibited.jpg)

