The effects of iCVD film thickness and conformality on the permeability and wetting of MD membranes The MIT Faculty has made this article openly available. Please share how this access benefits you. Your story matters. Citation Servi, Amelia T.; Guillen-Burrieza, Elena; Warsinger, David M.; Livernois, William; Notarangelo, Katie; Kharraz, Jehad; Lienhard V, John H.; Arafat, Hassan A. and Gleason, Karen K. “The Effects of iCVD Film Thickness and Conformality on the Permeability and Wetting of MD Membranes.” Journal of Membrane Science 523 (February 2017): 470–479. © The Authors As Published http://dx.doi.org/10.1016/j.memsci.2016.10.008 Publisher Elsevier Version Author's final manuscript Citable link http://hdl.handle.net/1721.1/108260 Terms of Use Creative Commons Attribution-Noncommercial-Share Alike Detailed Terms http://creativecommons.org/licenses/by-nc-sa/4.0/

Welcome message from author
This document is posted to help you gain knowledge. Please leave a comment to let me know what you think about it! Share it to your friends and learn new things together.
Transcript

The effects of iCVD film thickness and conformalityon the permeability and wetting of MD membranes
The MIT Faculty has made this article openly available. Please share how this access benefits you. Your story matters.
Citation Servi, Amelia T.; Guillen-Burrieza, Elena; Warsinger, David M.;Livernois, William; Notarangelo, Katie; Kharraz, Jehad; LienhardV, John H.; Arafat, Hassan A. and Gleason, Karen K. “The Effectsof iCVD Film Thickness and Conformality on the Permeability andWetting of MD Membranes.” Journal of Membrane Science 523(February 2017): 470–479. © The Authors
As Published http://dx.doi.org/10.1016/j.memsci.2016.10.008
Publisher Elsevier
Version Author's final manuscript
Citable link http://hdl.handle.net/1721.1/108260
Terms of Use Creative Commons Attribution-Noncommercial-Share Alike
Detailed Terms http://creativecommons.org/licenses/by-nc-sa/4.0/
1
The effects of iCVD film thickness and conformality on the permeability and
wetting of MD membranes
Amelia T. Servia, Elena Guillen-Burriezab,1, David M. Warsingera, William Livernoisc, Katie
Notarangeloc, Jehad Kharrazb, John H. Lienhard Va, Hassan A. Arafatb, Karen K. Gleasonc,2
aDepartment of Mechanical Engineering, Massachusetts Institute of Technology, 77
Massachusetts Avenue, Cambridge, Massachusetts, 02139, United States
bInstitute Center for Water and Environment (iWater), Masdar Institute of Science and
Technology, Abu Dhabi, UAE
cDepartment of Chemical Engineering, Massachusetts Institute of Technology
1 Present Address: The Cyprus Institute, 20 Konstantinou Kavafi, 2121 Aglantzia, Nicosia, Cyprus
2 Corresponding author. E-mail address: [email protected].
Citation: A. T. Servi, E. Guillen-Burrieza, D. M. Warsinger, W. Livernois, K. Notarangelo, J.
Kharraz, H. A. Arafat, and K. K. Gleason, “The effects of iCVD film thickness and
conformality on the permeability and wetting of MD membranes.” Journal of Membrane
Science, vol 523, pp.470-479. 2017
2
Abstract
Membranes possessing high permeability to water vapor and high liquid entry pressure (LEP) are
necessary for efficient membrane distillation (MD) desalination. A common technique to prepare
specialized MD membranes consists of coating a hydrophilic or hydrophobic base membrane
with a low surface-energy material. This increases its liquid entry pressure, making the
membrane suitable for MD. However, in addition to increasing LEP, the surface-coating may
also decrease permeability of the membrane by reducing its average pore size. In this study, we
quantify the effects of initiated chemical vapor deposition (iCVD) polymer coatings on
membrane permeability and LEP. We consider whether the iCVD films should have minimized
thickness or maximized non-conformality, in order to maximize the permeability achieved for a
given value of LEP. We determined theoretically that permeability of a single pore is maximized
with a highly non-conformal iCVD coating. However, the overall permeability of a membrane
consisting of many pores is maximized when iCVD film thickness is minimized. We applied the
findings experimentally, preparing an iCVD-treated track-etched polycarbonate (PCTE)
membrane and testing it in a permeate gap membrane distillation (PCMD) system. This study
focuses on membranes with clearly defined, cylindrical pores. However, we believe that the
principles we discuss will extend to membranes with more complex pore architectures. Overall,
this work indicates that the focus of surface-coating development should be on minimizing film
thickness, not on increasing their non-conformality.
Keywords: Membrane distillation (MD), Desalination, Track-etched polycarbonate (PCTE)
membranes, Dusty gas model, Initiated chemical vapor deposition (iCVD).

3
Variables
a Ratio of uncoated/coated pore radii measured at top surface of membrane, a = ro/rt
Ad Coefficient of molecular diffusion (kg/m-s-Pa)
Ak Coefficient of Knudsen diffusion (kg/m2-s-Pa)
c Pore concentration on the membrane surface (pores/m2)
c200 Pore concentration of Sterlitech’s 200 nm (radius) PCTE membrane
de Collision diameter of water molecules (m)
D Diffusion coefficient of water in air (m2/s)
K Permeability of membrane with pores of constant radius (kg/m2-s-Pa)
kb Boltzmann constant (J/K)
KiCVD Permeability of membrane treated with an iCVD polymer coating (kg/m2-s-Pa)
KiCVD,lin Permeability of membrane with iCVD coating approximated linearly (kg/m2-s-Pa)
K(x) Permeability of membrane at distance, x, from its surface (kg/m2-s-Pa)
Kn Knudsen number ( )
L Pore length = membrane thickness multiplied by tortuosity for straight pores (m)
ΔP Liquid entry pressure (Pa)
P Total pressure within the pores during membrane distillation (Pa)
pa Partial pressure of air within the pores during membrane distillation (Pa)
R Universal gas constant (J/K-mol)
r Pore radius, constant value (m)
rt Pore radius at the membrane’s top surface (m)
rb Pore radius at the membrane’s bottom surface (m)
ro Pore radius prior to iCVD treatment (m)
4
r(x) Pore radius within the membrane (m)
SL Step coverage of the iCVD coating, can be written as �� = ����������
S(x) Step coverage of the iCVD coating within the membrane, written as �� = ����()�����
T Temperature (K)
x Distance from the top surface of the membrane (m)
γ Surface tension of the liquid (N/m)
Γ Sticking coefficient
θ Contact angle between the membrane and the liquid (°)
λ Mean free path (m)
1. Introduction
Membrane distillation (MD) is a thermal separation process used for desalination [1–5]. In direct
contact and permeate gap membrane distillation (DCMD and PGMD), a hydrophobic membrane
acts as a barrier separating the heated feed stream from the cooled distillate stream [6]. The
temperature difference across the membrane creates a difference in the partial pressure between
the water vapor on either side. This causes a net diffusion of water vapor through the membrane
from the feed to the distillate. Salt and other contaminants in the feed stream are left behind.
The hydrophobic membrane in the MD system has two roles. It must be impermeable to liquid
water, but permeable to water vapor. A high liquid entry pressure (LEP) ensures that liquid water
does not enter the membrane. High permeability to water vapor is necessary to maintain efficient
production of desalinated water [7–10]. Currently, MD systems primarily use hydrophobic
membranes developed for micro- and ultra- filtration [5]. However, experimental, higher
5
performance MD membranes are often prepared. Many of these membranes consist of a
hydrophilic or hydrophobic base membrane coated with a low surface-energy chemistry to
increase liquid entry pressure [11–16]. This versatile method increases the options for base
membranes and surface chemistries, making it possible to produce higher performance
membranes. However, while the hydrophobic surface treatment increases LEP, if it has thickness
that is a significant fraction of pore radius, it will also change the membrane’s permeability to
water vapor. The current study explores how the thickness and conformality of the hydrophobic
coating affects the relationship between LEP and permeability. We also discuss how to maximize
permeability for a given value of LEP.
2. Theoretical background
2.1. Models for LEP and permeability of an ideal membrane
MD membranes consist of a collection of pores. According to the Young-Laplace model [17],
membranes consisting of cylindrical pores have LEP given by
∆ = ������ (�)��
(Eq. 1)
where γ is the liquid’s surface tension, θ is the contact angle between the liquid and the
membrane, and rt is the pore radius at the surface of the membrane. For these ideal membranes,
the only geometric quantity determining LEP is the pore radius at the membrane surface.
Increasing this value decreases liquid entry pressure.
In contrast, permeability of a membrane to water vapor is affected by multiple aspects of the
membrane architecture. For an ideal membrane consisting of straight, cylindrical pores, these
factors include pore radius, pore concentration, and membrane thickness. MD membranes
6
typically have pore sizes ranging from 100 to 450 nm [5]. At this size range, the mean free path
of water vapor, λ, is comparable to the pore radius (Appendix A). This means that the Knudsen
numbers, Kn = λ/2r, is within the transition regime (0.2 < Kn < 1.0) in which both continuum and
discrete effects are important. Although it has been met with some criticism [18], the
permeability (often referred to as the membrane coefficient) for MD membranes is often
described using the dusty gas model [19]. In the dusty gas model, the total resistance to diffusion
is the sum of the resistances to molecular and Knudsen diffusion. This captures the effects of
both the intramolecular and the wall collisions expected to occur at these Kn values.
The dusty gas model assumes that Knudsen and molecular diffusion are present in series within
the pores [2]. The physical basis for the mechanisms being in series is still under debate [18]. A
condensed version of the dusty gas model for a membrane consisting of cylindrical pores of
radius, r, length, L and concentration, c (pores/m2) is given by
� = ����������
���
� (Eq. 2)
where K is permeability and Ak is a constant of the system. Ak is defined as
�� = ���
!"# $ %"#
� !&
'/� (Eq. 3)
where R is the universal gas constant (J/mol-K), T is temperature (K), and Mw is the molecular
weight of water (g/mol). Ad is also a constant of the system. It is defined as
�) = � !"#
*+,-
(Eq. 4)
where P is the total pressure inside the pores (Pa), D is the water diffusion coefficient with air
(m2/s) and pa is the air pressure within the pores (Pa) [19]. According to Eq. (2), as r approaches
zero (Kn >>1), K approaches pure Knudsen diffusion. As r becomes very large (Kn<<1), K
7
approaches pure molecular diffusion. At intermediate values of Kn, both sources of resistance are
significant, and permeability is lower than it would be for pure Knudsen or pure molecular
diffusion. As seen in Eq. (2), permeability is highly sensitive to pore radius, increasing
substantially with increased values of r.
As seen from Eq. (1) and Eq. (2), liquid entry pressure and permeability do not necessarily scale
with each other. To produce more efficient MD membranes, it is desired to increase permeability
without decreasing LEP beyond the limit needed to prevent liquid water entry. One way to do
this is to modify the attributes of the membrane that affect permeability but do not affect LEP.
These include membrane thickness, pore concentration and pore size below the surface of the
membrane. In this study, we focus on pore size, determining how iCVD coatings affect the
relationship between pore size at and below the surface of the membrane. We use knowledge of
the pore profiles to predict how the iCVD coating will affect the relationship between
permeability and LEP of the membrane.
2.2. Overview of iCVD film thickness and conformality
iCVD has been used previously to prepare hydrophobic membranes for MD and other
applications [12, 16, 20–22]. A defining characteristic of iCVD coatings is the ability to make
them ultra-thin (~10 nm) and the ability to tune their conformality. iCVD films are grown from
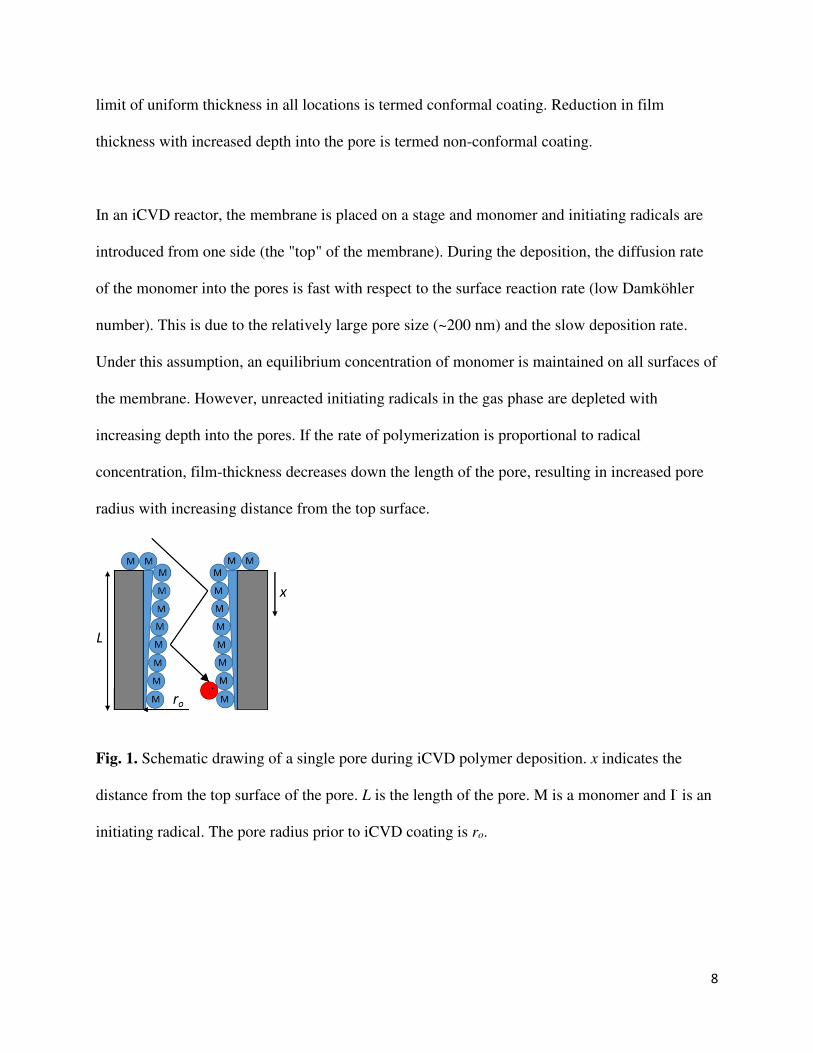
vapor-phase monomer and initiating radicals. The monomer and initiating radicals enter the
pores from the “top” surface of the membrane, polymerizing on the internal walls [23–25] (Fig.
1). Multiple factors influence the thickness of the iCVD film along the lengths of the pores. The
8
limit of uniform thickness in all locations is termed conformal coating. Reduction in film
thickness with increased depth into the pore is termed non-conformal coating.
In an iCVD reactor, the membrane is placed on a stage and monomer and initiating radicals are
introduced from one side (the "top" of the membrane). During the deposition, the diffusion rate
of the monomer into the pores is fast with respect to the surface reaction rate (low Damköhler
number). This is due to the relatively large pore size (~200 nm) and the slow deposition rate.
Under this assumption, an equilibrium concentration of monomer is maintained on all surfaces of
the membrane. However, unreacted initiating radicals in the gas phase are depleted with
increasing depth into the pores. If the rate of polymerization is proportional to radical
concentration, film-thickness decreases down the length of the pore, resulting in increased pore
radius with increasing distance from the top surface.
Fig. 1. Schematic drawing of a single pore during iCVD polymer deposition. x indicates the
distance from the top surface of the pore. L is the length of the pore. M is a monomer and I∙ is an
initiating radical. The pore radius prior to iCVD coating is ro.
9
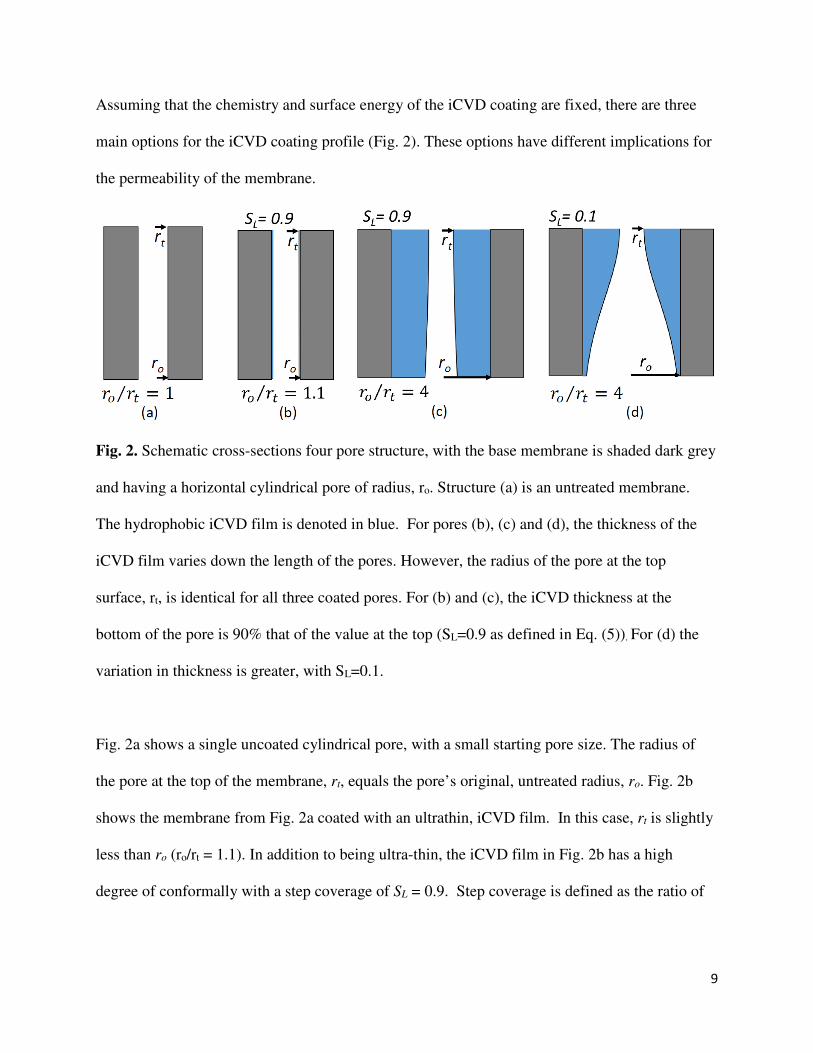
Assuming that the chemistry and surface energy of the iCVD coating are fixed, there are three
main options for the iCVD coating profile (Fig. 2). These options have different implications for
the permeability of the membrane.
Fig. 2. Schematic cross-sections four pore structure, with the base membrane is shaded dark grey
and having a horizontal cylindrical pore of radius, ro. Structure (a) is an untreated membrane.
The hydrophobic iCVD film is denoted in blue. For pores (b), (c) and (d), the thickness of the
iCVD film varies down the length of the pores. However, the radius of the pore at the top
surface, rt, is identical for all three coated pores. For (b) and (c), the iCVD thickness at the
bottom of the pore is 90% that of the value at the top (SL=0.9 as defined in Eq. (5)). For (d) the
variation in thickness is greater, with SL=0.1.
Fig. 2a shows a single uncoated cylindrical pore, with a small starting pore size. The radius of
the pore at the top of the membrane, rt, equals the pore’s original, untreated radius, ro. Fig. 2b
shows the membrane from Fig. 2a coated with an ultrathin, iCVD film. In this case, rt is slightly
less than ro (ro/rt = 1.1). In addition to being ultra-thin, the iCVD film in Fig. 2b has a high
degree of conformally with a step coverage of SL = 0.9. Step coverage is defined as the ratio of
10
coating thickness at the bottom and top of a pore. Smaller values of SL indicate coatings that are
less conformal.
Fig. 2c shows a different way of achieving the same rt using iCVD. We hypothesis that having
identical values of rt will result in identical values of LEP. In Fig. 2c, the starting pore radius, ro,
is larger and the iCVD coating is thicker than in Fig. 2b. The coated pore has ro/rt = 4. The step
coverage is again highly conformal with SL = 0.9. A third coating option expected to have the
same LEP is illustrated in Fig. 2d. This pore has the same starting pore radius as Fig. 2c, and the
same ratio of ro/rt =4. However, the conformality of the film is significantly lower, with SL =
0.1. While we anticipate the pores in Fig 2b – d will have the same LEP, differences in their
permeability to water vapor are expected. In this study, we quantify how they differ.
2.3. Quantifying iCVD film thickness and conformality
In order to quantify the effects of non-conformality on the permeability of membranes, it is
necessary to characterize the profile of the iCVD coating at all points within the membrane. This
profile can be calculated based on the principles of the polymerization.
iCVD films are grown from vapor-phase monomer and initiating radicals that enter the pores
from the “top” surface of the membrane (Fig. 1). As initiating radicals react with the monomer,
they are depleted, reducing the rate of polymerization with increasing distance from the surface.
The rate of depletion of initiated radicals with distance from the surface of the pore depends on a
quantity called the sticking coefficient [24]. The sticking coefficient is controlled during iCVD
deposition by the fractional saturation of the monomer in the deposition chamber. Low sticking

11
coefficients produce films that are nearly conformal (constant film thickness). Higher sticking
coefficients cause steeper depletion and greater asymmetry of the film, producing pores
increasingly similar to Fig. 2d.
The step coverage of iCVD polymer films has been studied previously [24]. Step coverage, SL,
can be written as
�� = ����������
(Eq. 5)
where ro is the unmodified pore radius. rt and rb are the top and bottom pore radii after iCVD
treatment. Analytical modeling [24] has determined that
ln(��) = − �12 $ �
���&
� (Eq. 6)
where Γ is the sticking coefficient of the initiator and L is the length of the pore. This model
assumes that the monomer and initiating radicals are in the Knudsen diffusion regime within the
pore and so collide primarily with the pore walls. This is a reasonable assumption given the low
pressure in the iCVD deposition chamber (< 1 Torr). Increasing the sticking coefficient or
increasing the aspect ratio of the pores lowers the step coverage, producing less conformal
coatings.
Eq. (5) can be generalized to describe the step coefficient at any distance x from the top surface
of the membrane. SL is replaced by S(x) which is defined as
�(3) = ����()�����
(Eq. 7)
where r(x) is the pore radius at distance x from the top of the pore. Using the same analytical
model as for Eq. (6), S(x) is modeled as

12
ln(�(3)) = − �42 $ 5
�67&
�= $
�&�
ln(��). (Eq. 8)
As x approaches L, S(x) approaches SL. Combining Eq. (7) and Eq. (8) and solving for r(x)
produces an equation for r(x):
8(3) = 89 − ��$:
;&<
(89 − 8=). (Eq. 9)
While the pore profile in Eq. (9) is implied in [24], this is the first time it has been calculated
explicitly. Fig. 2d illustrates the predicted shape of a non-conformal iCVD coating profile.
Knowledge of the pore profile makes it possible to calculate the effect of the iCVD film on
permeability.
3. Materials and methods
3.1. Membrane preparation
In addition to building new theory, in this study we also prepared a membrane similar to the one
in Fig. 2b, and tested it in a permeate gap membrane distillation (PGMD) system. We used
polyvinylpyrrolidone (PVP) treated, hydrophilic, track-etched polycarbonate membranes
(Sterlitech, PCT0214220) as the base membrane. We chose this membrane because its pore
structure resembles an ideal membrane with straight cylindrical pores (Fig. 3). Pore size
(diameter) was 400 nm. Total membrane thickness was 24 µm. Pore density was 1.5×10¹²
pores/m2.
13
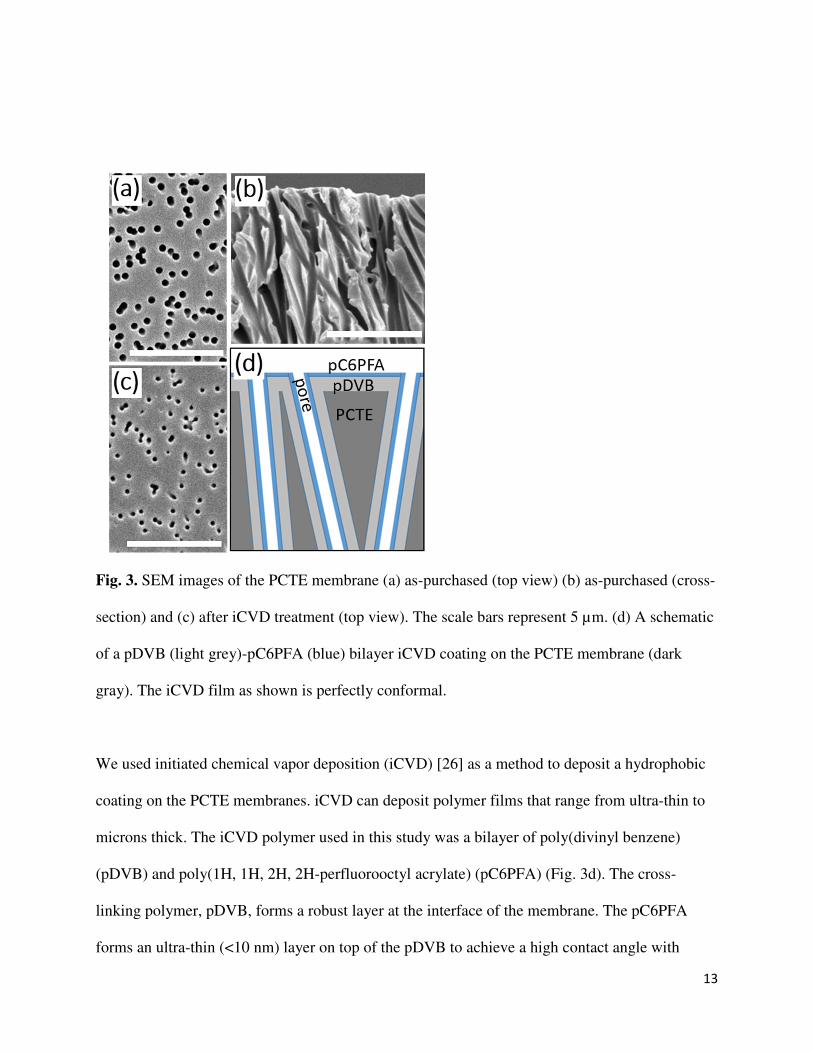
Fig. 3. SEM images of the PCTE membrane (a) as-purchased (top view) (b) as-purchased (cross-
section) and (c) after iCVD treatment (top view). The scale bars represent 5 µm. (d) A schematic
of a pDVB (light grey)-pC6PFA (blue) bilayer iCVD coating on the PCTE membrane (dark
gray). The iCVD film as shown is perfectly conformal.
We used initiated chemical vapor deposition (iCVD) [26] as a method to deposit a hydrophobic
coating on the PCTE membranes. iCVD can deposit polymer films that range from ultra-thin to
microns thick. The iCVD polymer used in this study was a bilayer of poly(divinyl benzene)
(pDVB) and poly(1H, 1H, 2H, 2H-perfluorooctyl acrylate) (pC6PFA) (Fig. 3d). The cross-
linking polymer, pDVB, forms a robust layer at the interface of the membrane. The pC6PFA
forms an ultra-thin (<10 nm) layer on top of the pDVB to achieve a high contact angle with
14
water (110 - 135 º). Without the pDVB base layer, pC6PFA has significant side-chain
rearrangement, reducing its contact angle hysteresis and making it less suitable use for MD [27,
28]. pDVB-pC6PFA bilayers have been studied as an environmentally friendly alternative to
poly(1H, 1H, 2H, 2H-perfluorodecyl acrylate) (pPFDA). However, they have not been applied
previously to MD membranes [27, 28].
Both iCVD layers were deposited in a custom-built reaction chamber. The chamber is cylindrical
(height = 38 mm, diameter = 246 mm). It contains an array of 14 resistively heated parallel
filaments (80% Ni, 20% Cr). Membranes were taped to a cooled stage (recirculating
chiller/heater, NESLAB). The total pressure inside the chamber was maintained at a constant
value using a mechanical pump (45 CFM pumping speed, Alcatel).
To produce the pDVB layer, tert-butyl peroxide (TBPO, Sigma-Aldrich, 97%) initiator and DVB
(Sigma-Aldrich, 80%) monomer were introduced into the chamber. The TBPO was at room-
temperature and was introduced at a rate of 1.0 sccm. The DVB was heated to 60 °C and
introduced at a rate of 0.5 sccm. The stage was maintained at 30 °C, and the total pressure in the
vacuum chamber was 800 mTorr. This resulted in a fractional saturation of the DVB monomer of
0.3. Deposition time of the pDVB layer was 189 minutes.
The pC6PFA layer was deposited directly on top of the pDVB film using the iCVD closed-batch
configuration described previously [29]. The closed-batch configuration makes it easier to
control film thickness for monomers that polymerize rapidly such as C6PFA. C6PFA monomer
(Sigma-Aldrich, 97%,) and TBPO (Sigma-Aldrich, 97%) were used. The chamber was initially
15
evacuated. The TBPO initiator was fed into the evacuated chamber at room temperature until the
total pressure reached 110 mTorr. The C6PFA monomer was heated to 80 °C and fed into the
chamber until the total pressure in the chamber was 190 mTorr. The stage was maintained at 25
°C. After filling the chamber with initiator and monomer, all valves were closed and the system
was let rest for 2 minutes to allow mixing. The filament array was then turned on for 15 minutes,
allowing the film to form. Next, the filaments were turned off and the chamber was evacuated.
When the system had cooled, the chamber was refilled with initiator and monomer and the
deposition process was repeated for a total of nine times. Depositing multiple rounds of C6PFA
increased the pC6PFA layer thickness, reducing the possibility of defects due to thinness of the
coating.
3.2. SEM imaging and pore size analysis
The pore radii at the top and bottom surfaces of the membrane was determined using image
analysis of 445 µm2, 5 nm/pixel resolution SEM images of the top and bottom surfaces of the
membrane. This made it possible to characterize the step coverage of the pores in a way that bulk
characterization would be unable to do. SEM images were collected using a JEOL 6010a SEM
microscope with an acceleration voltage of 5 keV. All SEM samples were sputtered with gold to
improve conductivity during imaging. The thickness of this gold layer was taken into account
when calculating pore size. SEM images were read into MATLAB and converted to black and
white using a threshold determined using Otsu’s method. Pores were identified and their areas
were measured using MATLAB’s regionprops command. Pores with areas smaller than 500
pixels were discarded. The remaining pores were placed in a histogram with bin-size of 5 nm.
The average (mode) pore size was determined by identifying the bin with the most pores and
16
calculating a radius assuming a circular pore-shape. Similar analysis using curve-fitting instead
of mode value to determine average pore size, has been used by other researchers [30].
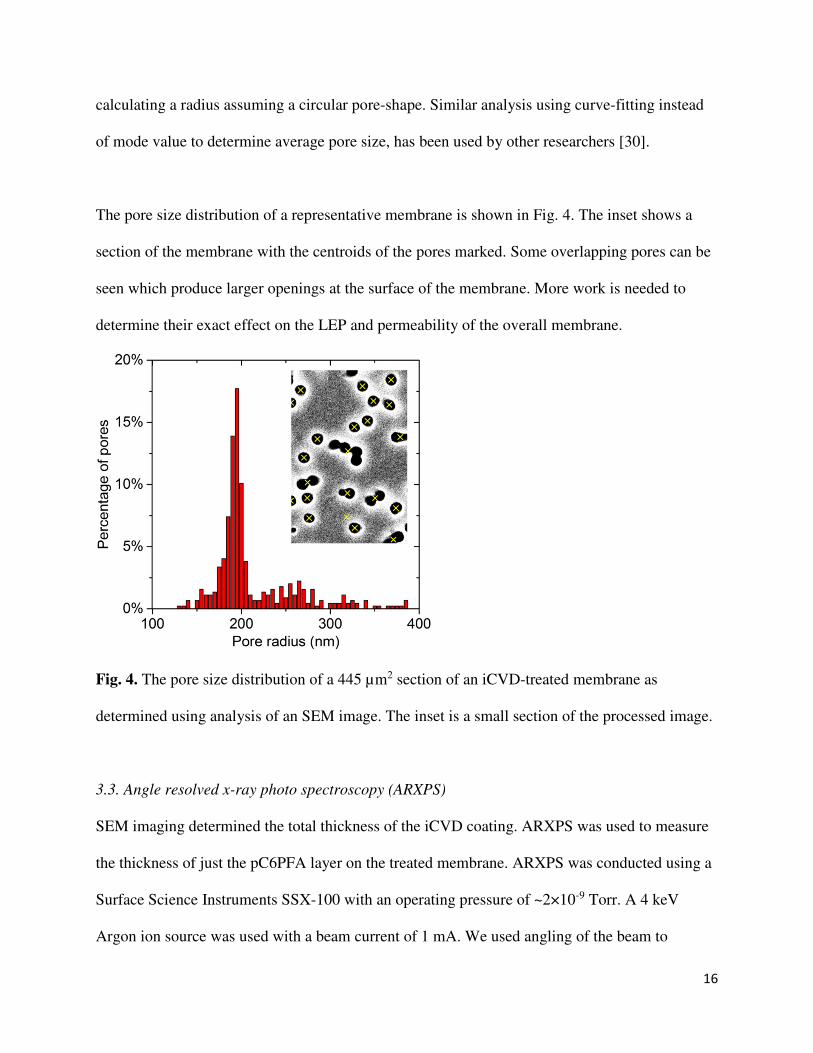
The pore size distribution of a representative membrane is shown in Fig. 4. The inset shows a
section of the membrane with the centroids of the pores marked. Some overlapping pores can be
seen which produce larger openings at the surface of the membrane. More work is needed to
determine their exact effect on the LEP and permeability of the overall membrane.
Fig. 4. The pore size distribution of a 445 µm2 section of an iCVD-treated membrane as
determined using analysis of an SEM image. The inset is a small section of the processed image.
3.3. Angle resolved x-ray photo spectroscopy (ARXPS)
SEM imaging determined the total thickness of the iCVD coating. ARXPS was used to measure
the thickness of just the pC6PFA layer on the treated membrane. ARXPS was conducted using a
Surface Science Instruments SSX-100 with an operating pressure of ~2×10⁻⁹ Torr. A 4 keV
Argon ion source was used with a beam current of 1 mA. We used angling of the beam to
17
measure the ratio of the FS1 and CS1 signals at a range of depths from the top and bottom surfaces
of the membrane (where top is the direction from which the iCVD coating was deposited). Based
on the inelastic mean free path of 2.4 nm, the depth of penetration of the x-ray beam was
calculated to be 7.2, 6.2, 4.6 and 2.5 nm at incidence angles of 0, 30, 50 and 70 °, respectively.
Measurements taken at each angle indicated the strength of the fluorine signal to each of these
depths. FS1/CS1 for pure pC6PFA is 1.3 based on calculation from its chemical structure. Values
below this indicate that the coating is incomplete when measured to that depth.
3.4. Contact angle, liquid entry pressure, and permeate gap membrane distillation (PGMD)
Advancing contact angles were measured using a goniometer equipped with an automatic
dispenser (model 590, Ramé-Hart). DropImage software was used to acquire images for
measurement. A 3 µL drop of room-temperature DI water was first placed onto the membrane
surface. Water was then added to this drop in increments of 2 µL, and the angle between the
advancing drop and the membrane surface was measured 100 ms after each addition.
Liquid entry pressure (LEP) was measured using a custom system similar to ones used
previously [12, 16, 31, 32]. A pristine sample of the membrane was held in a 13 mm syringe
membrane holder (GE healthcare biosciences). The membrane was exposed to the saline solution
(35 g/L, NaCl) on one surface and deionized (DI) water on the other. A syringe pump (PHD
22/2000, Harvard apparatus) incrementally increased the pressure of the saline solution against
the membrane. After each increase, the pressure was held constant for 12 seconds. A USB
pressure transducer (PX409, Omega) monitored the pressure difference across the membrane.
LEP is defined as the pressure at which liquid first passes through the membrane. The deionized
18
water reservoir was monitored using an electrical conductivity meter (Oakton Con6 Probe). LEP
was detected by an increase in the electrical conductivity of the reservoir corresponding to a rate
of 0.3 µL/s of saline entering the reservoir. This was the smallest rate that we could measure with
our system. For all LEP testing, the active area of the membrane was 0.64 cm2. Three samples
from each membrane were tested for LEP.
Permeate gap membrane distillation (PGMD) was conducted using a custom-built lab-scale
system. The active area of the membrane was rectangular with a surface area of 21 cm2. The feed
solution contained DI water and NaCl at a concentration of 35 g/L. Feed and distillate flowed
past the membrane at a rate of 680 L/hr. Distillate temperature was maintained at 20 °C. Feed
temperature was 40 – 60 °C. Experiment duration was 18 hours. When calculating the membrane
distillation coefficient, temperature polarization was taken into account using previous
simulations. This modelling included a simultaneous equation solver with discretized cells for
heat and mass transfer balancing, solved with the finite difference method. It accounted for
convection, conduction, evaporation, temperature polarization, etc [33]. Analysis was done and
validated through comparisons to well-characterized membranes, with trials for numerous
temperatures.
4. Results and discussion
4.1. Theoretical findings
4.1.1. Permeability of asymmetric membranes
The dusty gas model assumes pores that are cylindrical with unvarying pore radius within the
membrane. In this study, we extend the dusty gas model to describe membranes with pores
19
whose radii vary lengthwise along the pore. This new model is described below with further
derivation in Appendix B.
Due to the iCVD coating, the membranes considered in this study have pores that are
asymmetric, with the pore radius varying with distance from the surface of the membrane. We
have not seen analysis of the permeability of such pores in the literature so we derive new
equations. If the pores have radii that vary with distance, x, from the membrane surface, the
dusty gas permeability becomes
�>?@+ = �A B
C(:)D;E
(Eq. 10)
where K is a function of x and is defined in Eq. (2). This approach assumes that changes in r with
respect to x occur over length scales much larger than r. It also assumes that the mean free path
of the gas is small compared to the rate of variation of r with respect to x.
A closed-form solution for KiCVD is not available when r(x) is defined by Eq. (9). However, a
closed-form solution would be useful to build intuition about the system. One such solution can
be obtained if we approximate r(x) as varying linearly in x. In a linear approximation, r(x) is
described by
8(3) = 8= + ��(G�')� 3 (Eq. 11)
where a is a measure of asymmetry defined as the ratio of the radius at the bottom of the pore
(rb) and the radius at the top of the pore (rt) so that a = rb/rt. The pore radius is always larger at
the bottom of the pore so a is always greater than one. With this definition of r(x), the dusty gas
permeability of a membrane with asymmetric pores, KiCVD,lin, is given by
20
�>?@+,I>J = �G<������(G�')��G����
����
� . (Eq. 12)
Eq. (12) can be rewritten as
�>?@+,I>J = K ������
(-LB)<- �����
����
� , (Eq. 13)
revealing that KiCVD,lin ≈ aK.
4.1.2. Effect of iCVD films on membrane permeability
To theoretically compare the effects of different iCVD films on membrane permeability, we
must compare membranes with the same value of rt and LEP. We consider the ratio, R, between
the permeability of coated and uncoated pores with top pore radius, rt.
As was observed in Eq. (13), if both membranes have the same value of rt,
M = NOPQR,SOTN ≈ K. (Eq. 14)
Since, unlike SL, a is not an experimentally controllable parameter, we use Eq. (5) to rewrite a in
terms of SL:
K = ����
− $����
− 1& ��. (Eq. 15)
Eq. (14) thus becomes
M ≈ ����
− $����
− 1& ��. (Eq. 16)
Eq. (16) shows that as SL approaches zero, R approaches ro/rt. As SL approaches 1, R approaches
1. This implies that increasing ro/rt (i.e. increasing the iCVD film thickness) increases the
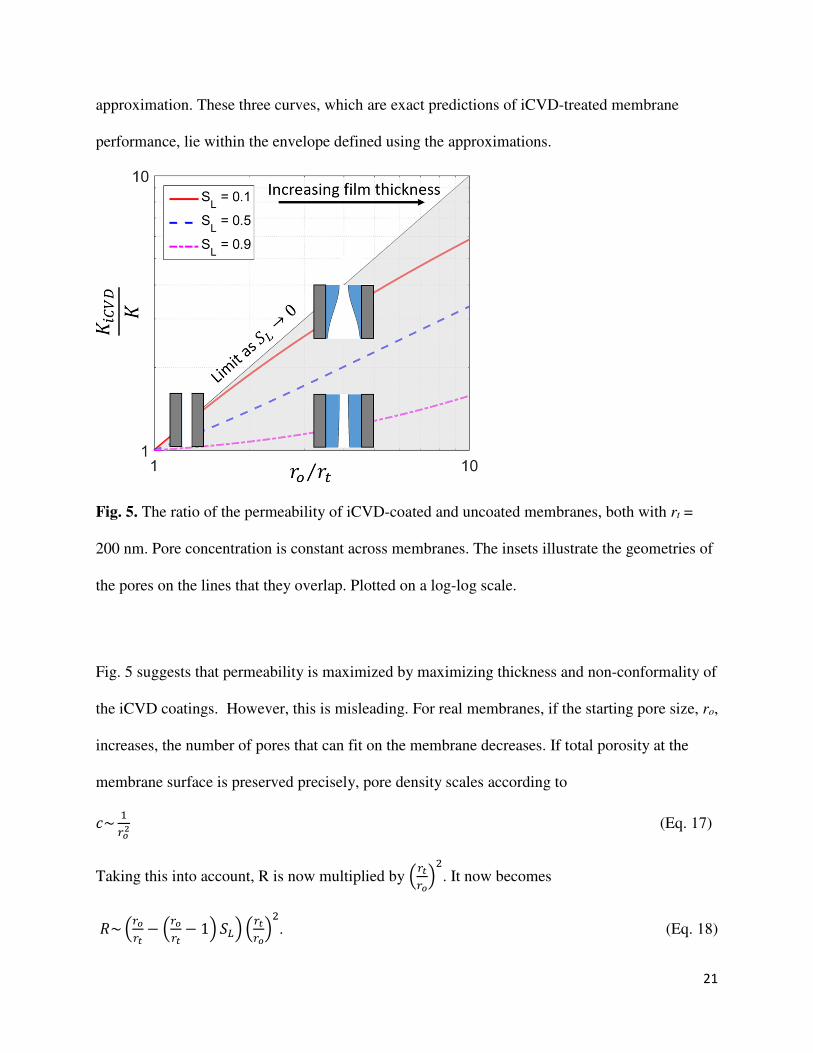
permeability possible at a given value of rt and LEP. This result is plotted in Fig. 5. The shaded
area in Fig. 5 is the area between Eq. (16) evaluated for SL = 0 and SL = 1. The three additional
curves show R evaluated using the exact equation for pore radius rather than the linear
21
approximation. These three curves, which are exact predictions of iCVD-treated membrane
performance, lie within the envelope defined using the approximations.
Fig. 5. The ratio of the permeability of iCVD-coated and uncoated membranes, both with rt =
200 nm. Pore concentration is constant across membranes. The insets illustrate the geometries of
the pores on the lines that they overlap. Plotted on a log-log scale.
Fig. 5 suggests that permeability is maximized by maximizing thickness and non-conformality of
the iCVD coatings. However, this is misleading. For real membranes, if the starting pore size, ro,
increases, the number of pores that can fit on the membrane decreases. If total porosity at the
membrane surface is preserved precisely, pore density scales according to
W~ '��<
(Eq. 17)
Taking this into account, R is now multiplied by $����
&�. It now becomes
M~ $����
− $����
− 1& ��& $����&�. (Eq. 18)
22
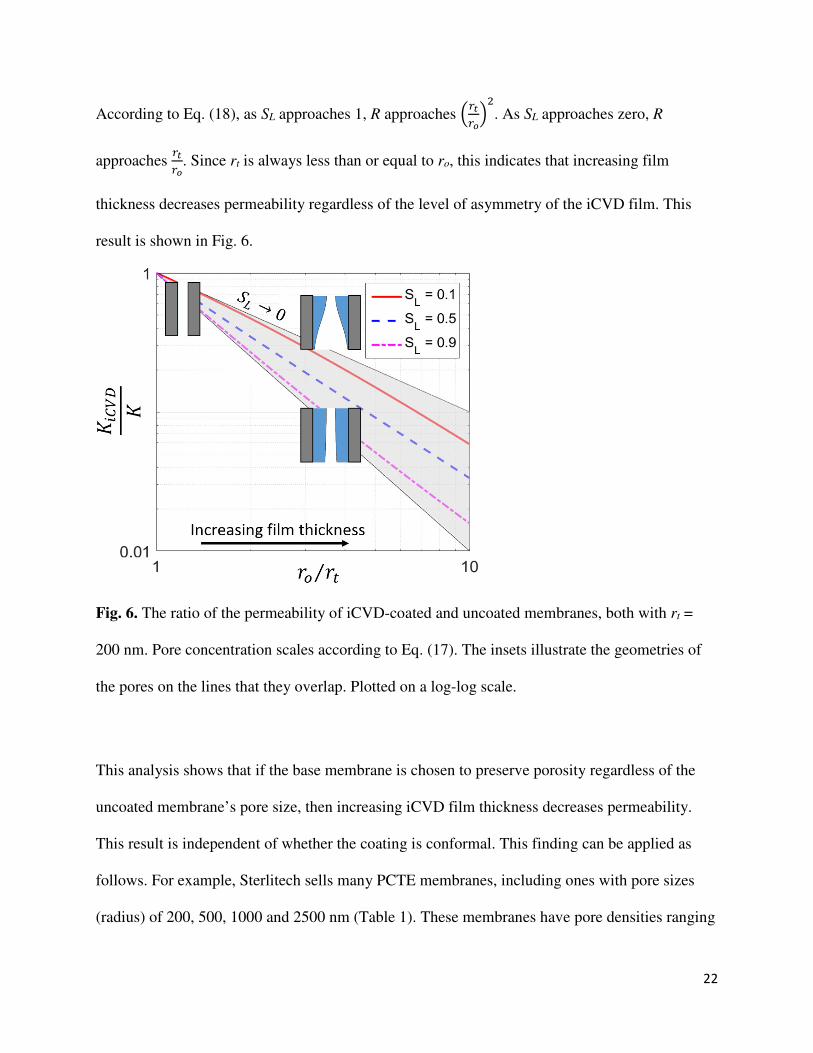
According to Eq. (18), as SL approaches 1, R approaches $����
&�. As SL approaches zero, R
approaches ����
. Since rt is always less than or equal to ro, this indicates that increasing film
thickness decreases permeability regardless of the level of asymmetry of the iCVD film. This
result is shown in Fig. 6.
Fig. 6. The ratio of the permeability of iCVD-coated and uncoated membranes, both with rt =
200 nm. Pore concentration scales according to Eq. (17). The insets illustrate the geometries of
the pores on the lines that they overlap. Plotted on a log-log scale.
This analysis shows that if the base membrane is chosen to preserve porosity regardless of the
uncoated membrane’s pore size, then increasing iCVD film thickness decreases permeability.
This result is independent of whether the coating is conformal. This finding can be applied as
follows. For example, Sterlitech sells many PCTE membranes, including ones with pore sizes
(radius) of 200, 500, 1000 and 2500 nm (Table 1). These membranes have pore densities ranging

23
from 1.5×10¹² pores/m2 for the 200 nm membrane, to 4×10⁹ pores/m2 for the 2500 nm
membrane. If a value of rt = 200 nm is needed to have adequate LEP for MD, we can compare
the permeabilities of the three larger membranes after iCVD coating to rt = 200 to the
permeability of the 200 nm membrane without any coating. The results are shown in Table 1.
What we find is that the 500, 1000 and 2500 nm membranes are predicted to have 33.25%,
6.65% and 3.375% the permeability of the uncoated 200 nm membrane after coating. This is
assuming that limiting case of SL = 0. This result illustrates that increasing the starting pore size
and then narrowing the top of the pore using iCVD, ultimately causes a reduction in membrane
permeability. In order to maximize permeability, a membrane with a pore size as close as
possible to the desired value of rt should be chosen and the iCVD film thickness should be
minimized.
Table 1. Predicted permeability of three membranes from the Sterlitech catalog after iCVD
treatment. Permeability is expressed relative to the permeability of an uncoated membrane from
the same catalog with ro = 200 nm and pore concentration, c200 = 1.5×10¹² pores/m2. We assume
the coated pore size at the surface of the membrane is rt = 200 nm. The rightmost column is
calculated by multiplying Eq. (16) by c/c200 to account for differences in pore concentration
between the different membranes. We assume that step coverage of the iCVD coating is SL = 0.
This is the limit of non-conformality.
ro c ro/rt c/c200 R = KiCVD,lin/K200
500 2×10¹¹ 2.5 0.133 0.3325
1000 2×10¹⁰ 5 0.0133 0.0665
2500 4×10⁹ 12.5 0.0027 0.03375
24
One exception to this finding is if a membrane can be produced that has large internal pore radii,
where each large pore has many small openings at the membrane surface. This structure has the
benefits of non-conformality/asymmetry without the accompanying reduction in pore density.
Membranes such as this have been produced using phase inversion [13]. They could also
potentially be prepared using free-standing, iCVD polymer films [34]. This type of membrane
could have permeability that increases with ro/rt according to Eq. (14). However, more work is
needed to make this a viable option.
4.2. Experimental findings
4.2.1. Membrane characterization
With the insights about base membrane pore size and iCVD film thickness, we set out to prepare
a membrane suitable for MD. For the base membrane, we chose a 200 nm radius PCTE
membrane from Sterlitech. We deposited a pDVB-pC6PFA iCVD bilayer on the membrane,
trying to minimize the thickness of the bilayer while maintaining the desired surface energy.
Image analysis determined that the pDVB-pC6PFA bilayer was 20 nm thick at the top surface of
the membrane and 5 nm thick at the bottom surface of the membrane (both measurements +/- 10
nm). This corresponds to step coverage, SL = 0.25. Angle resolved XPS (ARXPS) was used to
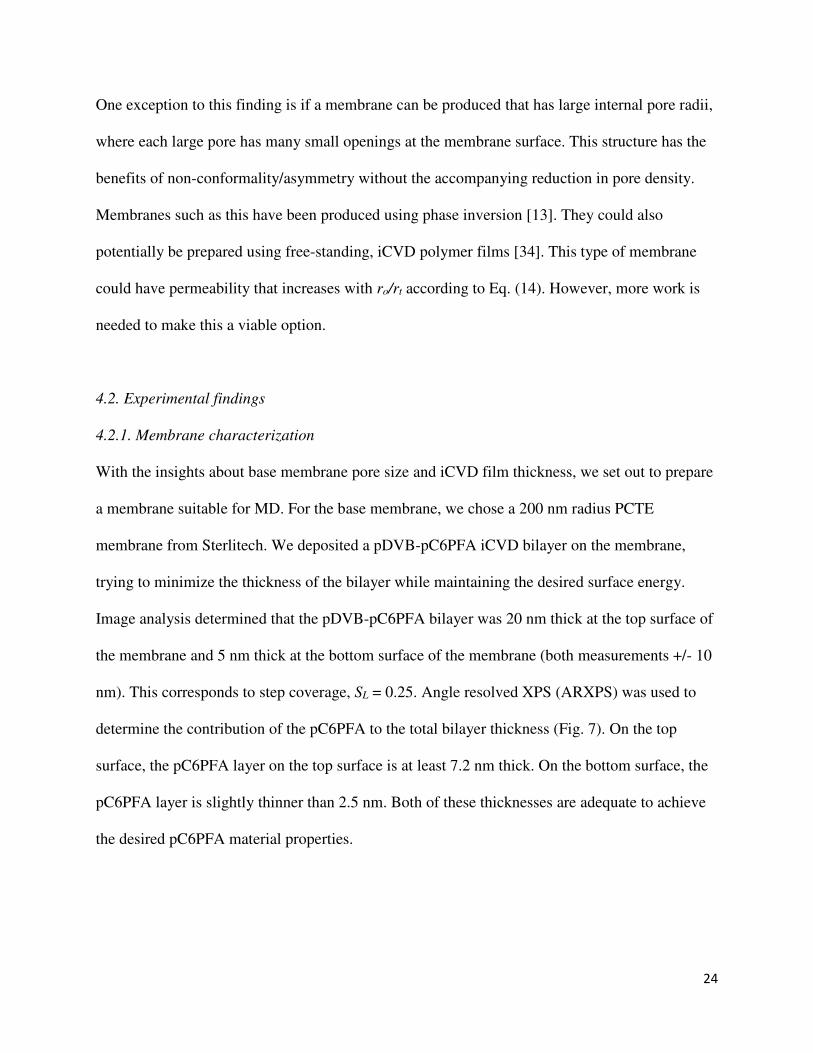
determine the contribution of the pC6PFA to the total bilayer thickness (Fig. 7). On the top
surface, the pC6PFA layer on the top surface is at least 7.2 nm thick. On the bottom surface, the
pC6PFA layer is slightly thinner than 2.5 nm. Both of these thicknesses are adequate to achieve
the desired pC6PFA material properties.
25
Fig. 7. The ratio of the FS1 and CS1 ARXPS signals at four sampling depths from the top and
bottom surfaces of the membrane. The inset shows a schematic of the area near the membrane’s
top surface. The thickness of the pC6PFA film is indicated. The layer below the pC6PFA is the
pDVB.
4.2.2. Membrane performance
We first verified that the pDVB-pC6PFA bilayer increased LEP enough to prevent wetting
during MD testing. This was especially important because bilayer polymer films of this
composition have never before been applied to MD membranes. We measured the apparent
advancing contact angle (ACA) and LEP of a PCTE membrane as-purchased, after application of
pDVB and after applications of the pDVB-pC6PFA bilayer (Table 2). Measurements showed
that the bilayer-treated membrane has a water LEP of 276 kPa (LEP measurements were ± 21
kPa) This value is suitable for MD. The membrane treated with the pDVB layer only does not
have an LEP high enough for successful MD performance. This indicates that the bilayer is
necessary to prepare a membrane suitable for MD.
26
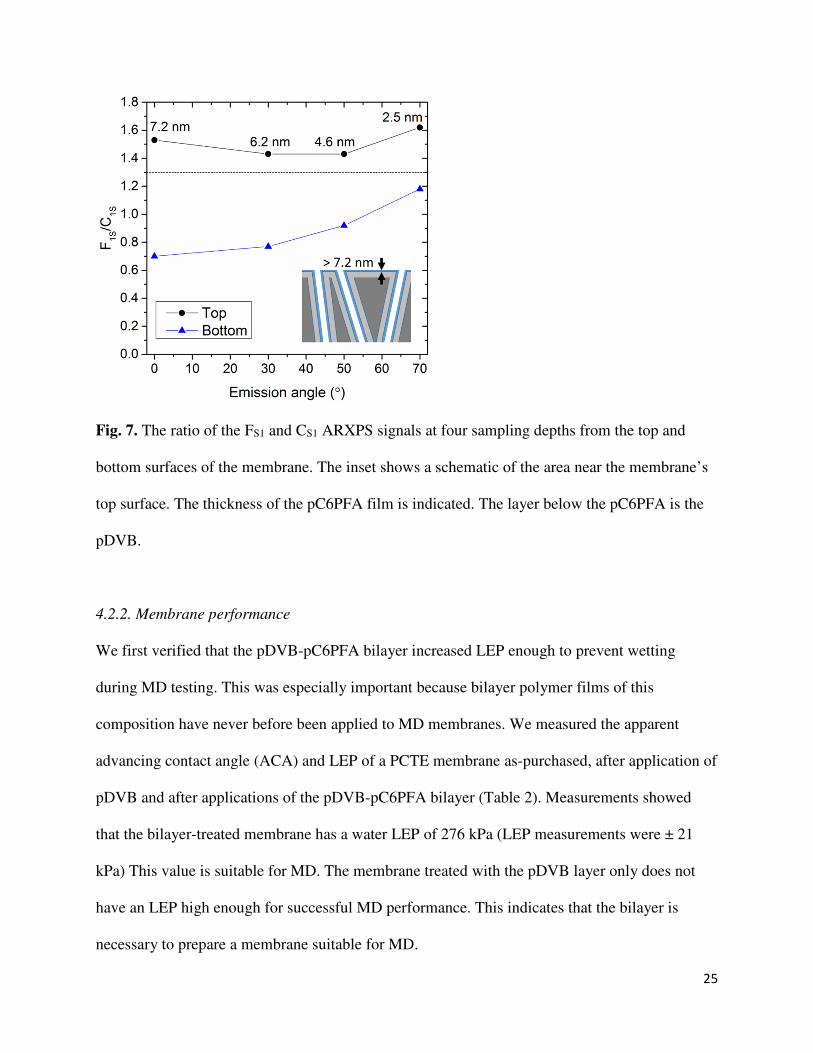
Table 2. Advancing contact angle (ACA) and liquid entry pressure (LEP) of PCTE membranes
as-purchased, after application of pDVB and after application of the full pDVB-pC6PFA bilayer.
Membrane rt (nm) ACA (°) LEP (kPa)
(measured)
LEP (kPa)
(Y-L)
As-purchased PCTE 200 91 0 13
pDVB 193 103 53 168
pDVB-pC6PFA bilayer (Membrane M0) 180 124 276 447
We compared the measured LEP values to the values calculated from the Young-Laplace model
(Eq. (1)). We assumed surface tension, γ = 0.072 N/m. We found that for the three membranes in
Table 2, the measured LEP value was less than the predicted value. This may be an effect of the
“double-pores” at the surface seen in Fig. 3 and Fig. 4. Over-predicting LEP for PCTE
membranes has been shown previously as well [35].
We tested the bilayer-treated membrane in a permeate gap membrane distillation (PGMD)
system using NaCl solution at a concentration of 35 g/L. This test showed that the iCVD-treated
PCTE membrane had 99.98% salt rejection. This indicates that the membrane did not wet in the
MD system. This is the first demonstration of a pDVB-pC6PFA bilayer successfully being used
to prepare a hydrophobic membrane with adequately high LEP for MD. The measured
permeability (membrane distillation coefficient) of the membrane was 1.36×10⁻⁶ ± 3.4 ×10⁻⁷
kg/m2-Pa-s (Fig. 8). This value is slightly lower than the values for other membranes currently
27
used for MD [5]. This is largely explained by the significantly lower porosity (~10% versus
>70%) of the PCTE membranes compared to other MD membranes.
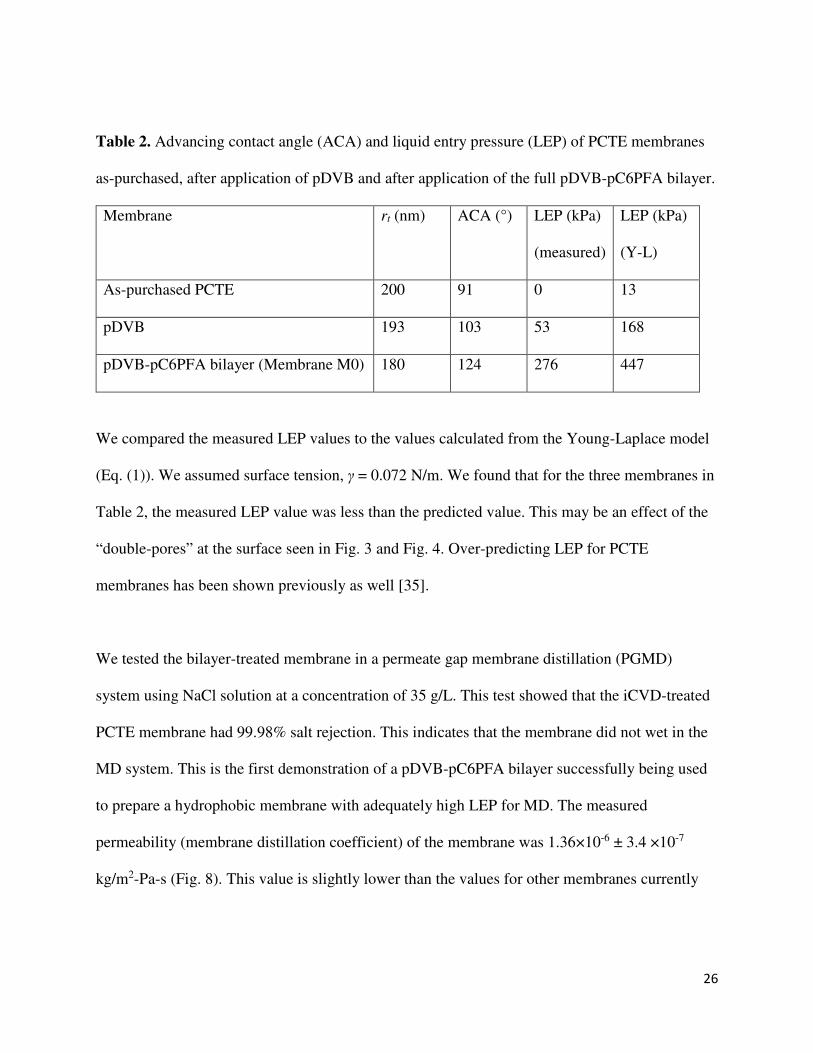
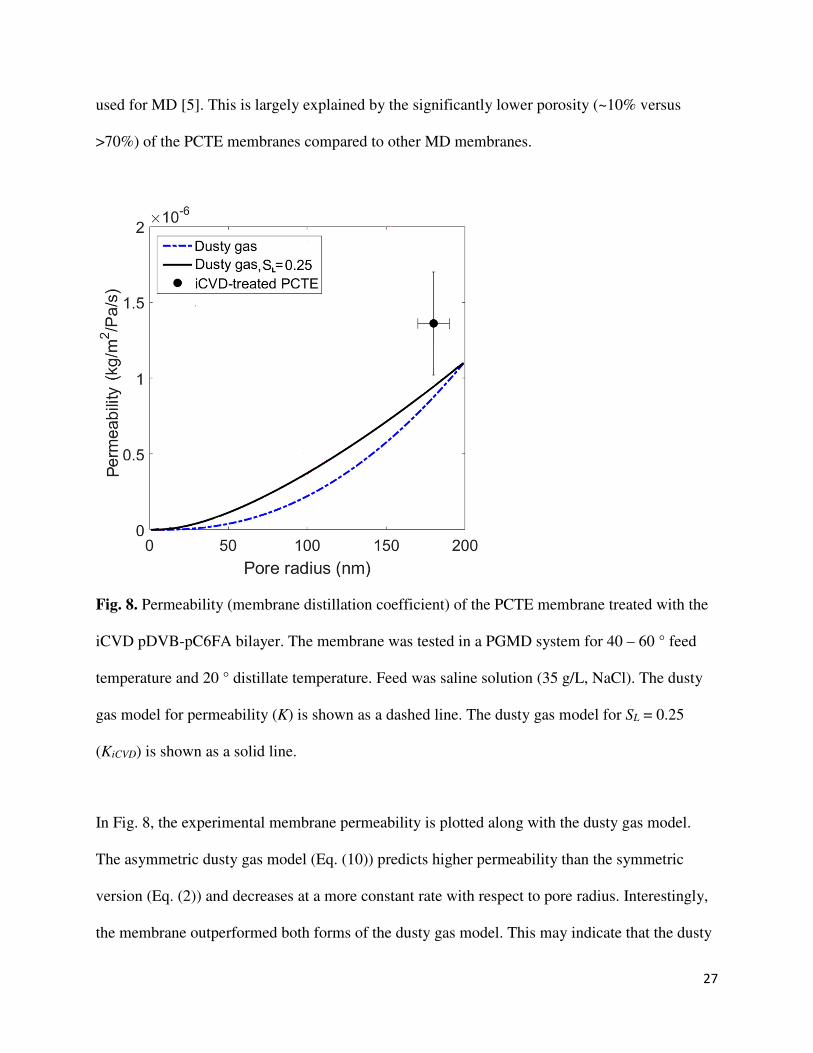
Fig. 8. Permeability (membrane distillation coefficient) of the PCTE membrane treated with the
iCVD pDVB-pC6FA bilayer. The membrane was tested in a PGMD system for 40 – 60 ° feed
temperature and 20 ° distillate temperature. Feed was saline solution (35 g/L, NaCl). The dusty
gas model for permeability (K) is shown as a dashed line. The dusty gas model for SL = 0.25
(KiCVD) is shown as a solid line.
In Fig. 8, the experimental membrane permeability is plotted along with the dusty gas model.
The asymmetric dusty gas model (Eq. (10)) predicts higher permeability than the symmetric
version (Eq. (2)) and decreases at a more constant rate with respect to pore radius. Interestingly,
the membrane outperformed both forms of the dusty gas model. This may indicate that the dusty

28
gas model is not the correct model. However, it is also consistent with the lower than expected
LEP, indicating that there may be unaccounted for factors that increase the effective pore size of
the membrane such as “double-pores”. The parameter values used for these models are based on
measurements of the system and can be found in Appendix C.
This experimental work shows that an iCVD coating can effectively raise the LEP of a PCTE
membrane to a level where it can be used for MD. It also shows the limitations of trying to
control and predict LEP and permeability of iCVD-coated PCTE membranes. Further
experimental study could apply the pDVB-pC6PFA bilayer to membranes with more complex
pore structures while still following the principle of minimizing film thickness according to the
theoretical findings.
5. Conclusions
In this study, we analyzed the effects of iCVD surface-modification on the permeability and LEP
of MD membranes. We developed new models for the iCVD coating profile and for the dusty
gas permeability of asymmetric membranes. We found that non-conformality of the iCVD film
cannot be used to improve membrane permeability at constant LEP and that the key to
maximizing permeability is to choose a base membrane that allows iCVD film thickness to be
minimized.
In addition to determining the theoretical effects of iCVD coatings on membrane performance,
we also demonstrated how the theory relates to an experimental membrane. We prepared a
track-etched polycarbonate (PCTE) membrane treated with an iCVD pDVB-pC6PFA bilayer.
29
We determined that the bilayer successfully increased the LEP of the membrane to a level
adequate to distill water in a PGMD system. We sized the base membrane to minimize the iCVD
film thickness in order to maximize permeability. However, we found that we were limited
experimentally in how thin we could make the iCVD layer while maintaining the desired
material properties. We also found that the membrane had lower LEP and higher permeability
than we calculated. This may because overlapping pores increase the effective pore size of the
membrane.
For future studies, we suggest the further exploration of free-standing iCVD films that may be
used to produce membranes whose pores have multiple small openings. Further theoretical and
experimental work is also needed to determine if these findings extend to membranes with more
complex pore structures.
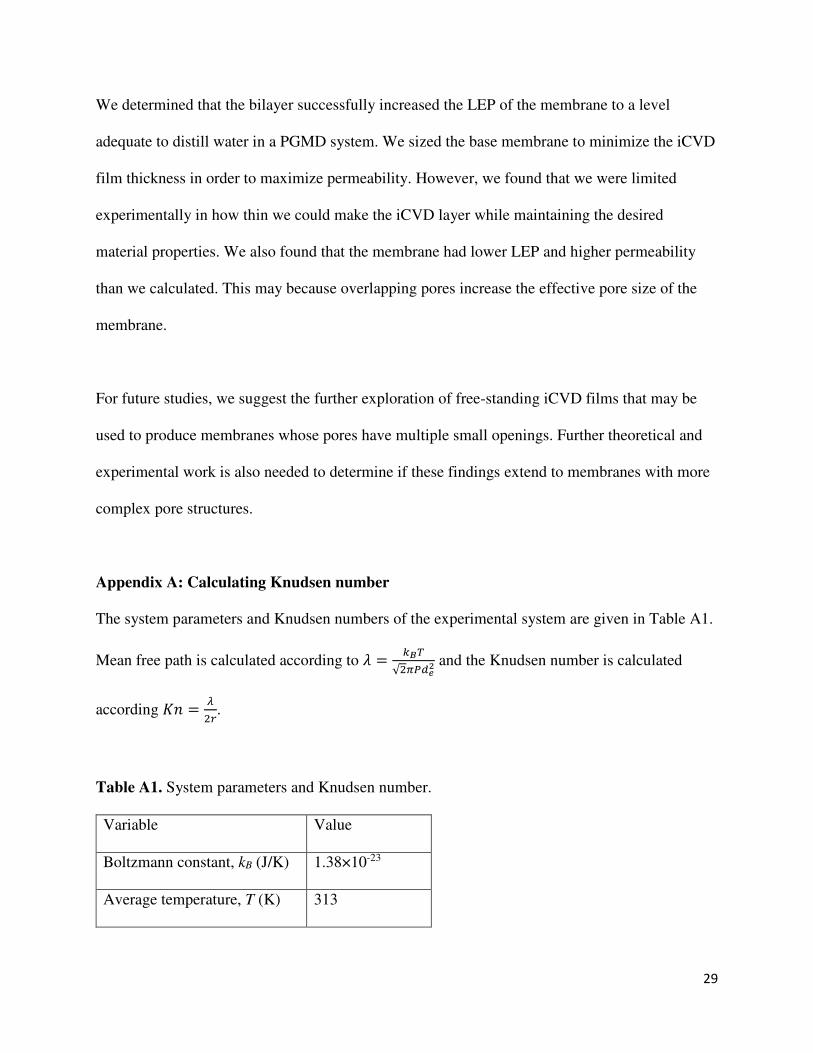
Appendix A: Calculating Knudsen number
The system parameters and Knudsen numbers of the experimental system are given in Table A1.
Mean free path is calculated according to Y = �Z#√��*)\<
and the Knudsen number is calculated
according �] = ^��.
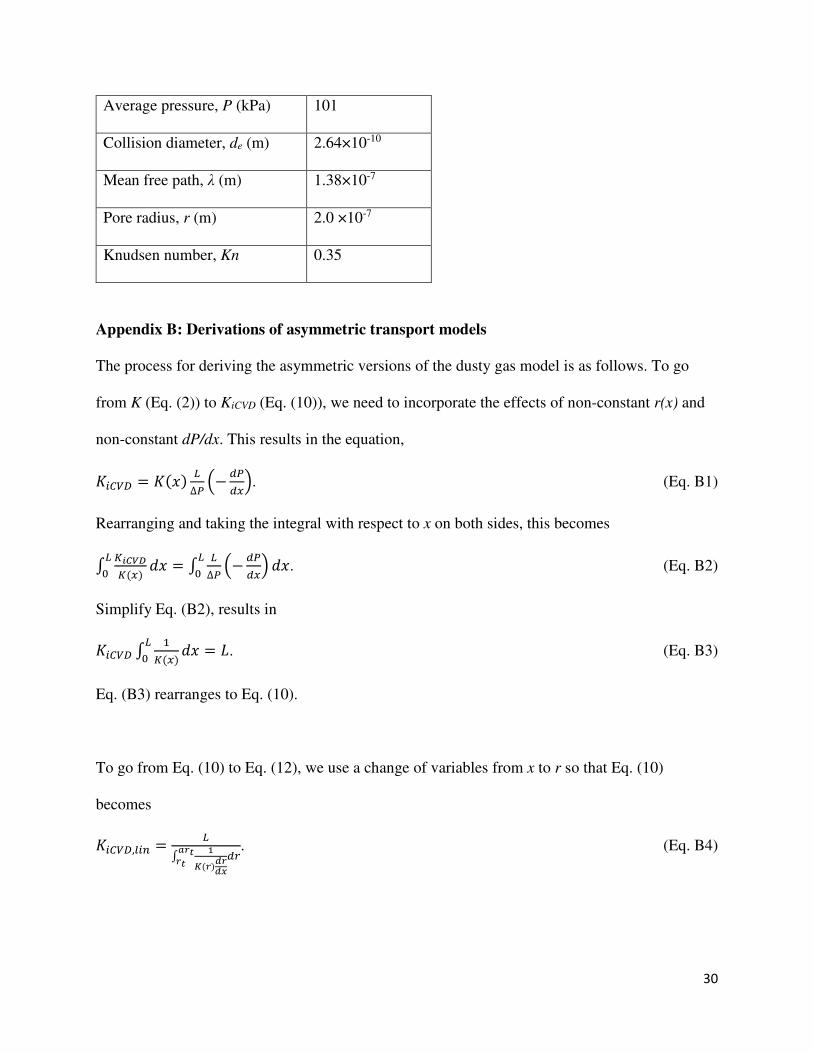
Table A1. System parameters and Knudsen number.
Variable Value
Boltzmann constant, kB (J/K) 1.38×10⁻²³
Average temperature, T (K) 313
30
Average pressure, P (kPa) 101
Collision diameter, de (m) 2.64×10⁻¹⁰
Mean free path, λ (m) 1.38×10⁻⁷
Pore radius, r (m) 2.0 ×10⁻⁷
Knudsen number, Kn 0.35
Appendix B: Derivations of asymmetric transport models
The process for deriving the asymmetric versions of the dusty gas model is as follows. To go
from K (Eq. (2)) to KiCVD (Eq. (10)), we need to incorporate the effects of non-constant r(x) and
non-constant dP/dx. This results in the equation,
�>?@+ = �(3) �∆* $− )*
)&. (Eq. B1)
Rearranging and taking the integral with respect to x on both sides, this becomes
A NOPQRN()
�_ `3 = A �
∆* $− )*)&�
_ `3. (Eq. B2)
Simplify Eq. (B2), results in
�>?@+ A 'N()
�_ `3 = a. (Eq. B3)
Eq. (B3) rearranges to Eq. (10).
To go from Eq. (10) to Eq. (12), we use a change of variables from x to r so that Eq. (10)
becomes
�>?@+,I>J = �A B
C(b)�b�:
-b�b� )�. (Eq. B4)
31
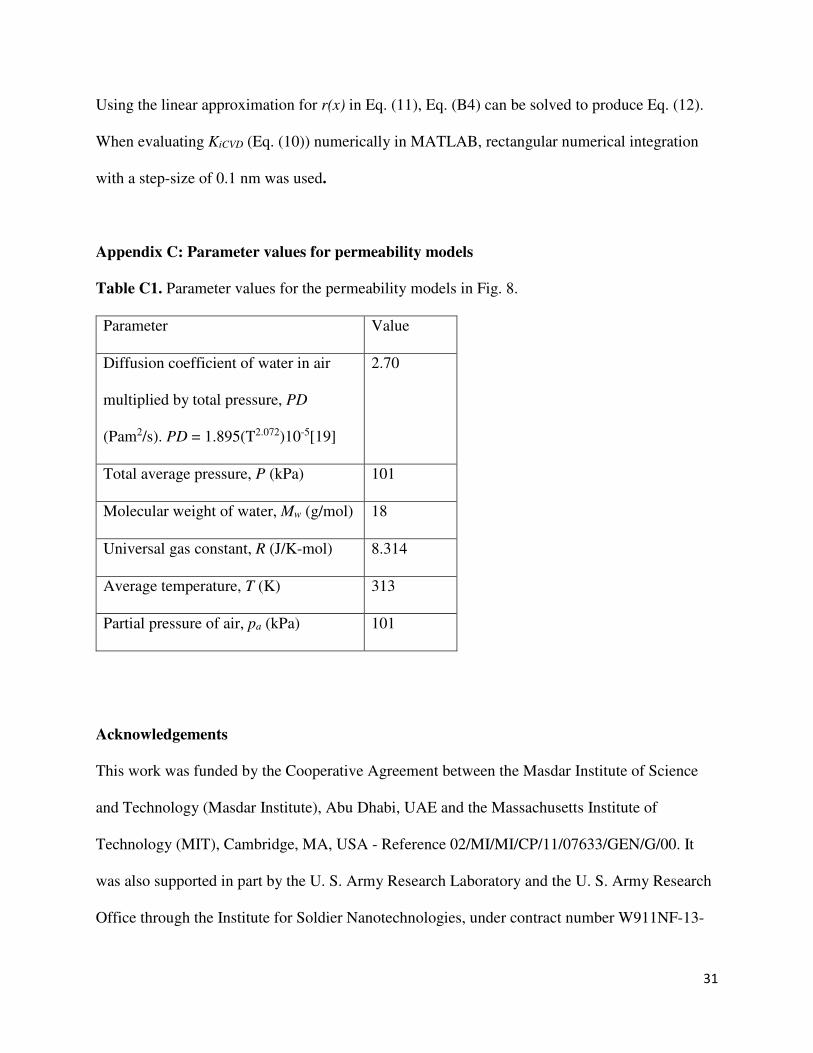
Using the linear approximation for r(x) in Eq. (11), Eq. (B4) can be solved to produce Eq. (12).
When evaluating KiCVD (Eq. (10)) numerically in MATLAB, rectangular numerical integration
with a step-size of 0.1 nm was used.
Appendix C: Parameter values for permeability models
Table C1. Parameter values for the permeability models in Fig. 8.
Parameter Value
Diffusion coefficient of water in air
multiplied by total pressure, PD
(Pam2/s). PD = 1.895(T2.072)10-5[19]
2.70
Total average pressure, P (kPa) 101
Molecular weight of water, Mw (g/mol) 18
Universal gas constant, R (J/K-mol) 8.314
Average temperature, T (K) 313
Partial pressure of air, pa (kPa) 101
Acknowledgements
This work was funded by the Cooperative Agreement between the Masdar Institute of Science
and Technology (Masdar Institute), Abu Dhabi, UAE and the Massachusetts Institute of
Technology (MIT), Cambridge, MA, USA - Reference 02/MI/MI/CP/11/07633/GEN/G/00. It
was also supported in part by the U. S. Army Research Laboratory and the U. S. Army Research
Office through the Institute for Soldier Nanotechnologies, under contract number W911NF-13-

32
D-0001. This work made use of the Cornell Center for Materials Research Shared Facilities
which are supported through the NSF MRSEC program (DMR-1120296).
References
[1] A.M. Alklaibi, N. Lior, Membrane-distillation desalination: Status and potential,
Desalination. 171 (2005) 111–131.
[2] K.W. Lawson, D.R. Lloyd, Review: Membrane distillation, J. Membr. Sci. 124 (1997) 1–
25.
[3] H. Susanto, Towards practical implementations of membrane distillation, Chem. Eng.
Process. Process Intensif. 50 (2011) 139–150.
[4] P. Wang, T.-S. Chung, Recent advances in membrane distillation processes: Membrane
development, configuration design and application exploring, J. Membr. Sci. 474 (2015)
39–56.
[5] A. Alkhudhiri, N. Darwish, N. Hilal, Membrane distillation: A comprehensive review,
Desalination. 287 (2012) 2–18.
[6] J. Swaminathan, H.W. Chung, D.M. Warsinger, F.A. AlMarzooqi, H.A. Arafat, J.H.
Lienhard V, Energy efficiency of permeate gap and novel conductive gap membrane
distillation, J. Membr. Sci. 502 (2016) 171–178.
[7] M.I. Ali, E.K. Summers, H.A. Arafat, J.H. Lienhard V, Effects of membrane properties on
water production cost in small scale membrane distillation systems, Desalination. 306
(2012) 60–71.
[8] J. Phattaranawik, R. Jiraratananon, A.G. Fane, Effect of pore size distribution and air flux
on mass transport in direct contact membrane distillation, J. Membr. Sci. 215 (2003) 75–85.
[9] M.S. El-Bourawi, Z. Ding, R. Ma, M. Khayet, A framework for better understanding
membrane distillation separation process, J. Membr. Sci. 285 (2006) 4–29.
[10] E.K. Summers, H.A. Arafat, J.H. Lienhard V, Energy efficiency comparison of single-stage
membrane distillation (MD) desalination cycles in different configurations, Desalination.
290 (2012) 54–66.
[11] M. Essalhi, M. Khayet, Surface segregation of fluorinated modifying macromolecule for
hydrophobic/hydrophilic membrane preparation and application in air gap and direct
contact membrane distillation, J. Membr. Sci. 417–418 (2012) 163–173.
[12] A.T. Servi, J. Kharraz, D. Klee, K. Notarangelo, B. Eyob, E. Guillen-Burrieza, A. Liu, H.A.
Arafat, K.K. Gleason, A systematic study of the impact of hydrophobicity on the wetting of
MD membranes, J. Membr. Sci. 520 (2016) 850–859.
[13] M. Qtaishat, M. Khayet, T. Matsuura, Novel porous composite hydrophobic/hydrophilic
polysulfone membranes for desalination by direct contact membrane distillation, J. Membr.
Sci. 341 (2009) 139–148.
[14] Y. Zhang, R. Wang, S. Yi, L. Setiawan, X. Hu, A.G. Fane, Novel chemical surface
modification to enhance hydrophobicity of polyamide-imide (PAI) hollow fiber
membranes, J. Membr. Sci. 380 (2011) 241–250.
33
[15] Y. Liao, R. Wang, A.G. Fane, Engineering superhydrophobic surface on poly(vinylidene
fluoride) nanofiber membranes for direct contact membrane distillation, J. Membr. Sci. 440
(2013) 77–87.
[16] F. Guo, A. Servi, A. Liu, K.K. Gleason, G.C. Rutledge, Desalination by Membrane
Distillation using Electrospun Polyamide Fiber Membranes with Surface Fluorination by
Chemical Vapor Deposition, ACS Appl. Mater. Interfaces. 7 (2015) 8225–8232.
[17] A.C.M. Franken, J.A.M. Nolten, M.H.V. Mulder, D. Bargeman, C.A. Smolders, Wetting
criteria for the applicability of membrane distillation, J. Membr. Sci. 33 (1987) 315–328.
[18] J.B. Young, B. Todd, Modelling of multi-component gas flows in capillaries and porous
solids, Int. J. Heat Mass Transf. 48 (2005) 5338–5353.
[19] M. Khayet, A. Velázquez, J.I. Mengual, Modelling mass transport through a porous
partition: Effect of pore size distribution, J. Non-Equilib. Thermodyn. 29 (2004).
[20] D.M. Warsinger, A. Servi, S. Van Belleghem, J. Gonzalez, J. Swaminathan, J. Kharraz,
H.W. Chung, H.A. Arafat, K.K. Gleason, J.H. Lienhard V, Combining air recharging and
membrane superhydrophobicity for fouling prevention in membrane distillation, J. Membr.
Sci. 505 (2016) 241–252.
[21] M. Ma, Y. Mao, M. Gupta, K.K. Gleason, G.C. Rutledge, Superhydrophobic Fabrics
Produced by Electrospinning and Chemical Vapor Deposition, Macromolecules. 38 (2005)
9742–9748.
[22] M. Ma, M. Gupta, Z. Li, L. Zhai, K.K. Gleason, R.E. Cohen, M.F. Rubner, G.C. Rutledge,
Decorated Electrospun Fibers Exhibiting Superhydrophobicity, Adv. Mater. 19 (2007) 255–
259.
[23] M. Gupta, V. Kapur, N.M. Pinkerton, K.K. Gleason, Initiated Chemical Vapor Deposition
(iCVD) of Conformal Polymeric Nanocoatings for the Surface Modification of High-
Aspect-Ratio Pores, Chem. Mater. 20 (2008) 1646–1651.
[24] S.H. Baxamusa, K.K. Gleason, Thin Polymer Films with High Step Coverage in
Microtrenches by Initiated CVD, Chem. Vap. Depos. 14 (2008) 313–318.
[25] A. Asatekin, K.K. Gleason, Polymeric nanopore membranes for hydrophobicity-based
separations by conformal initiated chemical vapor deposition, Nanoletters. 11 (2011) 677–
686.
[26] A.M. Coclite, R.M. Howden, D.C. Borrelli, C.D. Petruczok, R. Yang, J.L. Yagüe, A. Ugur,
N. Chen, S. Lee, W.J. Jo, A. Liu, X. Wang, K.K. Gleason, 25th Anniversary Article: CVD
Polymers: A New Paradigm for Surface Modification and Device Fabrication, Adv. Mater.
25 (2013) 5392–5423.
[27] A. Liu, E. Goktekin, K.K. Gleason, Cross-linking and ultrathin grafted gradation of
fluorinated polymers synthesized via initiated chemical vapor deposition to prevent surface
reconstruction, Langmuir. 30 (2014) 14189–14194.
[28] K. Honda, M. Morita, H. Otsuka, A. Takahara, Molecular aggregation structure and surface
properties of poly(fluoroalkyl acrylate) thin films, Macromolecules. 38 (2005) 5699–5705.
[29] C.D. Petruczok, N. Chen, K.K. Gleason, Closed Batch Initiated Chemical Vapor Deposition
of Ultrathin, Functional, and Conformal Polymer Films, Langmuir. 30 (2014) 4830–4837.
[30] J.I. Calvo, A. Hernández, G. Caruana, L. Martınez, Pore size distributions in microporous
membranes. I. Surface Study of Track-etched filters by image analysis, Journal Colloid
Interface Sci. 175 (1995) 138–250.
34
[31] M.C. García-Payo, M.A. Izquierdo, C. Fernandez-Pineda, Wetting study of hydrophobic
membranes via liquid entry pressure measurements with aqueous alcohol solutions, J.
Colloid Interface Sci. 230 (2000) 420–431.
[32] K. He, H.J. Hwang, I.S. Moon, Air gap membrane distillation on the different types of
membrane, Korean J. Chem. Eng. 28 (2011) 770–777.
[33] D.M. Warsinger, J. Swaminathan, L.A. Maswadeh, J.H. Lienhard V, Superhydrophobic
condenser surfaces for air gap membrane distillation, J. Membr. Sci. 492 (2015) 578–587.
[34] R.J. Frank-Finney, P.D. Haller, M. Gupta, Ultrathin Free-Standing Polymer Films
Deposited onto Patterned Ionic Liquids and Silicone Oil, Macromolecules. 45 (2012) 165–
170.
[35] E. Guillen-Burrieza, A. Servi, B.S. Lalia, H.A. Arafat, Membrane structure and surface
morphology impact on the wetting of MD membranes, J. Membr. Sci. 483 (2015) 94–103.
Related Documents