The effects of hybridization on growth allometry and craniofacial form in Sulawesi macaques Michael A. Schillaci a, * , Jeffery W. Froehlich b , Jatna Supriatna c , Lisa Jones-Engel d a Department of Social Sciences, University of Toronto at Scarborough, 1265 Military Trail, Toronto, Ontario, M1C 1A4, Canada b Department of Anthropology, University of New Mexico, Albuquerque, NM, 87131, USA c Center for Biodiversity and Conservation Studies, Fakultas Matematika dan Ilmu Pengethuan Alam, University of Indonesia, Depok, Java, Indonesia d Box 357330, Washington National Primate Research Center, University of Washington, Seattle, WA, 98195, USA Received 21 February 2004; accepted 25 April 2005 Abstract The present research investigates the effects of hybridization between Macaca maurus and M. tonkeana on adult male form and patterns of growth allometry. Comparisons of adult hybrid mean phenotypic values with the adult averages of the parental species indicate a condition of heterosis for cranial vault length and crownerump length. Negative heterosis is indicated for body mass. Regression parameters describing growth allometry are generated for four craniofacial measurement variables and one body measurement using both least squares and reduced major axis regression. Comparisons of hybrid and parental regression slopes and intercepts using analysis of covariance and t-tests suggest that there is a hybrid pattern of growth allometry characterized by an increase in regression slope values coupled with lower intercept values compared to those of the parental species and the parental averages for most regression parameters. Multivariate analyses of the adult and ontogenetic morphometric data indicate significant differences across species taxa in form and shape during development and adulthood. Our finding of significant differences between hybrids and their parental taxa in growth allometry and craniofacial form and shape during development challenges the assumption often made regarding the reproductive and taxonomic significance of observed * Corresponding author. Tel.: C1 416 2877328; fax: C1 416 2877283. E-mail addresses: [email protected] (M.A. Schillaci), [email protected] (J.W. Froehlich), [email protected] (J. Supriatna), [email protected] (L. Jones-Engel). 0047-2484/$ - see front matter Ó 2005 Elsevier Ltd. All rights reserved. doi:10.1016/j.jhevol.2005.04.010 Journal of Human Evolution 49 (2005) 335e369

Welcome message from author
This document is posted to help you gain knowledge. Please leave a comment to let me know what you think about it! Share it to your friends and learn new things together.
Transcript
Journal of Human Evolution 49 (2005) 335e369
The effects of hybridization on growth allometry andcraniofacial form in Sulawesi macaques
Michael A. Schillaci a,*, Jeffery W. Froehlich b, Jatna Supriatna c,Lisa Jones-Engel d
a Department of Social Sciences, University of Toronto at Scarborough, 1265 Military Trail, Toronto, Ontario,
M1C 1A4, Canadab Department of Anthropology, University of New Mexico, Albuquerque, NM, 87131, USA
c Center for Biodiversity and Conservation Studies, Fakultas Matematika dan Ilmu Pengethuan Alam, University of Indonesia,
Depok, Java, Indonesiad Box 357330, Washington National Primate Research Center, University of Washington, Seattle, WA, 98195, USA
Received 21 February 2004; accepted 25 April 2005
Abstract
The present research investigates the effects of hybridization between Macaca maurus and M. tonkeana on adultmale form and patterns of growth allometry. Comparisons of adult hybrid mean phenotypic values with the adult
averages of the parental species indicate a condition of heterosis for cranial vault length and crownerump length.Negative heterosis is indicated for body mass. Regression parameters describing growth allometry are generated forfour craniofacial measurement variables and one body measurement using both least squares and reduced major axis
regression. Comparisons of hybrid and parental regression slopes and intercepts using analysis of covariance and t-testssuggest that there is a hybrid pattern of growth allometry characterized by an increase in regression slope valuescoupled with lower intercept values compared to those of the parental species and the parental averages for mostregression parameters. Multivariate analyses of the adult and ontogenetic morphometric data indicate significant
differences across species taxa in form and shape during development and adulthood. Our finding of significantdifferences between hybrids and their parental taxa in growth allometry and craniofacial form and shape duringdevelopment challenges the assumption often made regarding the reproductive and taxonomic significance of observed
* Corresponding author. Tel.: C1 416 2877328; fax: C1 416 2877283.
E-mail addresses: [email protected] (M.A. Schillaci), [email protected] (J.W. Froehlich), [email protected] (J. Supriatna),
[email protected] (L. Jones-Engel).
0047-2484/$ - see front matter � 2005 Elsevier Ltd. All rights reserved.
doi:10.1016/j.jhevol.2005.04.010
336 M.A. Schillaci et al. / Journal of Human Evolution 49 (2005) 335e369
ontogenetic divergence between Neandertals and modern humans. We propose that anthropological primatology, withits goal of developing nonhuman primate models for investigating human evolution, can provide a biologically relevant
means by which to empirically estimate the taxonomic significance of morphological and ontogenetic divergenceobserved in the hominid fossil record.� 2005 Elsevier Ltd. All rights reserved.
Keywords: Ontogeny; Heterosis; Hybrids; Growth and development; Neandertals; Human evolution; Anthropological primatology;
Species recognition
Introduction
Although macaque hybridization on the Indo-nesian island of Sulawesi has been the focus ofconsiderable research for over fifteen years, therehas not been any research on the effects of thishybridization on growth and development. More-over, with the exception of human primates, therehas been virtually nothing published on hybrid-ization and growth by primatologists or biologicalanthropologists. Here, we present findings fromour study on the effects of hybridization betweenMacaca maurus1 and M. tonkeana on patterns ofbivariate growth allometry. The potential conse-quences of the observed pattern differences ingrowth allometry on adult form are examinedusing formal comparisons of adult measurements,as well as multivariate vectors describing overallbody size and shape. Specifically, we address thefollowing research questions:
1) Does hybridization between these congenerscause heterosis resulting in increased adultcranial and somatic dimensions?
2) If heterosis in adult hybrid size exists, is itassociated with increased regression slopesreflecting a stronger magnitude of allometricgrowth2 in our cross-sectional ontogeneticsample?
1 Here, we use the species name Macaca maurus in place of
M. maura (Cuvier: 1823) in accordance with convention
allowing the use of separate gender in latin for genus and
species names in macaque taxonomic nomenclature, e.g.,
Macaca sylvanus and M. silenus.2 It is important to note that an increased magnitude of
allometric growth does not neccesarily correspond with in-
creased growth rates (see Gould, 2000).
3) If pattern differences in growth allometryamong the taxonomic groupings are observed,are these pattern differences associated withdifferences in adult form (i.e., sizeC shape)?
Increasingly, comparative studies of ontogeny arebecoming a well-accepted means to investigatetaxonomy and reproductive isolation in the hom-inid fossil record. Given the dearth of literature ongrowth among hybridizing primate species, ourstudy on macaque hybrid growth has relevance notonly to the field of primatology, but also to thestudy of hominid evolution. In particular, webelieve that our findings have implications forinterpreting the evolutionary and taxonomic sig-nificance of the well-described ontogenetic diver-gence between Neandertals and modern humans.
Research on Neandertal growth and taxonomy
A number of recent studies have comparedNeandertal and modern human craniofacial andpostcranial growth (e.g., Minugh-Purvis, 1988;Krovitz, 2000; Williams, 2000; Ponce de Leonand Zollikofer, 2001; Minugh-Purvis, 2002; Wil-liams et al., 2002a; Coqueugniot and Minugh-Purvis, 2003; Krovitz, 2003; Williams et al., 2003;Ramirez Rozzi and Bermudez de Castro, 2004;Zollikofer and Ponce de Leon, 2004). Despitedifferences in analytical techniques, most of thesestudies have described a significantly divergentpattern of growth and development for theNeandertals when compared to modern humans(but see Minugh-Purvis, 2002; see also Ackermannand Krovitz, 2002). For example, the study byPonce de Leon and Zollikofer (2001), whichemployed computerized fossil reconstruction and
337M.A. Schillaci et al. / Journal of Human Evolution 49 (2005) 335e369
geometric morphometrics, concluded that differ-ences between Neandertals and modern humans incraniofacial form likely arose early in develop-ment, possibly during prenatal development. Thedivergent Neandertal pattern of craniofacialgrowth seems to be a product of early differencesin the relative timing and rates of growth inspecific areas of the face (for a related discussion,see Ackermann and Krovitz, 2002; Krovitz, 2003).The authors suggested that early ontogeneticdivergence coupled with an evolutionary stasis ofthe divergent Neandertal ontogeny support thenotion that Neandertals are distinct from modernhumans at the species level.
Similarly, in a study of Neandertal craniofacialgrowth allometry using a number of differentstatistical techniques, including regression, Euclid-ian distance analysis, and principal componentsanalysis, Williams (2000) found that most of thedifferences between Neandertals and humans aregenerated early in ontogeny, and Neandertalsexhibit stronger growth allometry and fastergrowth. These findings are supported by sub-sequent work by Williams et al. (2002a), whoexamined craniofacial ontogeny in modern hu-mans and Neandertals relative to the ontogeny ofcommon chimpanzees and bonobos. Similar toWilliams’ (2000) previous study, this subsequentwork showed that Neandertals grew faster andachieved larger adult size relative to modernhumans. Neandertals also exhibited strongergrowth allometries, with apparent differences inpatterns of allomeric shape change. The results ofWilliams et al. (2002a) also showed that, for themost part, Neandertal and modern human infantsare separated by substantial distances in shapespace that increased very little during growth intoadulthood, indicating an early divergence in shapebetween these two taxa. Roughly the samecondition was described for distances betweenPan troglodytes and P. paniscus in shape space(Williams et al., 2002a).
The study by Williams et al. (2002a) isparticularly interesting, and somewhat unique, inthat the observed pattern differences in growthbetween Neandertals and modern humans werecompared to pattern differences observed inbonobos and chimpanzees. These comparisons
provide a biologically relevant scale by which toassess the taxonomic and heterochronic signifi-cance of pattern differences in growth. Based ontheir comparison of shape change differencesbetween taxon groupings, the authors (Williamset al., 2002a: 425) argued: ‘‘[I]n general, Neander-thals differ from modern humans in craniofacialproportions as much, or more, than pygmychimpanzees differ from common chimpanzees.’’Implicit, perhaps, in this statement is that theobserved divergence in Neandertal growth istaxonomically significant. It is important to pointout that the authors of this informative study werenot concerned explicitly with taxonomy, but ratherwith characterizing heterochronic process in mod-ern human and Neandertal growth.
Recently, Williams and Krovitz (2004) exam-ined the position of the mental foramen duringdevelopment in Neandertals and modern humans.Similar to previous studies, Williams and Krovitz(2004) found increased Neandertal growth ratesfor a number of mandibular dimensions whencompared to modern humans. Results from theirprincipal components analysis indicated strongdifferences in shape between these congenersthroughout development, especially during earlydevelopment. In addition, the authors pointed outthat Neandertals exhibited greater mandibularshape change during ontogeny than do modernhumans. Interestingly, shape differences betweenNeandertals and modern humans decreased withage. Nevertheless, substantial differences in ante-rior mandibular shape do exist between Neander-tal and modern human adults, a finding consistentwith previous research describing multivariateshape differences between these taxa in themandibular ramus (Rak et al., 2002).
Research by Minugh-Purvis (e.g., Minugh-Pur-vis, 1988, 1998, 2002; Minugh-Purvis et al., 2000)has also figured prominently in the literature onNeandertal craniofacial growth and development.In a comprehensive study of Neandertal, earlymodern human, and recent human craniofacialgrowth using a variety of metric variables, Minugh-Purvis (1988) found Neandertal growth rates to besomewhat similar to those of early modern humans,and that this early modern human pattern ofcraniofacial growth was intermediate between that
338 M.A. Schillaci et al. / Journal of Human Evolution 49 (2005) 335e369
of Neandertals and recent human populations. Ina subsequent study, Minugh-Purvis (2002) foundsimilar growth patterning in minimum frontalbreadth between earlyUpper Paleolithic Europeansand recent modern human samples. This patterndiffered from that of Neandertals, who showedfaster growth and earlier maturation for breadth ofthe anterior cranial vault (Minugh-Purvis, 2002).Minugh-Purvis (2002) also found pattern similarityduring early childhood between early UpperPaleolithic humans from Europe and Neandertals,an interesting finding given earlier work byPonce deLeon and Zollikofer (2001) who, in contrast, foundsubstantial differences in growth patterns betweenNeandertals and early modern humans from theLevant (i.e., Skhul 1, Qafzeh 11, and Qafzeh 9).Similarities in growth patterning, rather thanabsolute size, were observed by Minugh-Purvis(2002) for the midvault and possibly the posteriorcranial vault between the Neandertals and UpperPaleolithic Europeans. Based on the observedgrowth patterns, Minugh-Purvis (2002) argued thatthere is an apparent alteration of growth at theNeandertaleearly Upper Paleolithic Europeanmodern human interface, with a trend toward anextended growth period in modern humans. Al-though this trend eventually differentiates recentmodern humans from Neandertals in terms ofobserved patterns in craniofacial growth, the earlyUpper Paleolithic Europeans seem to be somewhatintermediate. Minugh-Purvis (2002: 496) inter-preted the intermediate pattern of early UpperPaleolithic European growth as demonstrating‘‘that [Pleistocene human] neurocranial ontogenyfollowed a mosaic of heterochronic change de-scribing an evolutionary continuum.’’
Most recently, Ramirez Rozzi and Bermudez deCastro (2004) demonstrated convincingly thatNeandertals are characterizedby avery short periodof dental development relative to a sample ofUpperPaleolithiceMesolithic humans and to their pre-sumed ancestor Homo heidelbergensis. The authorsof this study pointed out that dental development isan excellent indicator of somatic development, andsuggested that Neandertals also developed somat-ically, and presumably skeletally, much faster thanmodern humans (see alsoDean et al., 1986). The fastdevelopment of the Neandertals was considered by
the authors to be an autapamorphy, representingstrong evidence in favor of a specific distinctionbetween Neandertals and modern humans.
The Sulawesi macaques
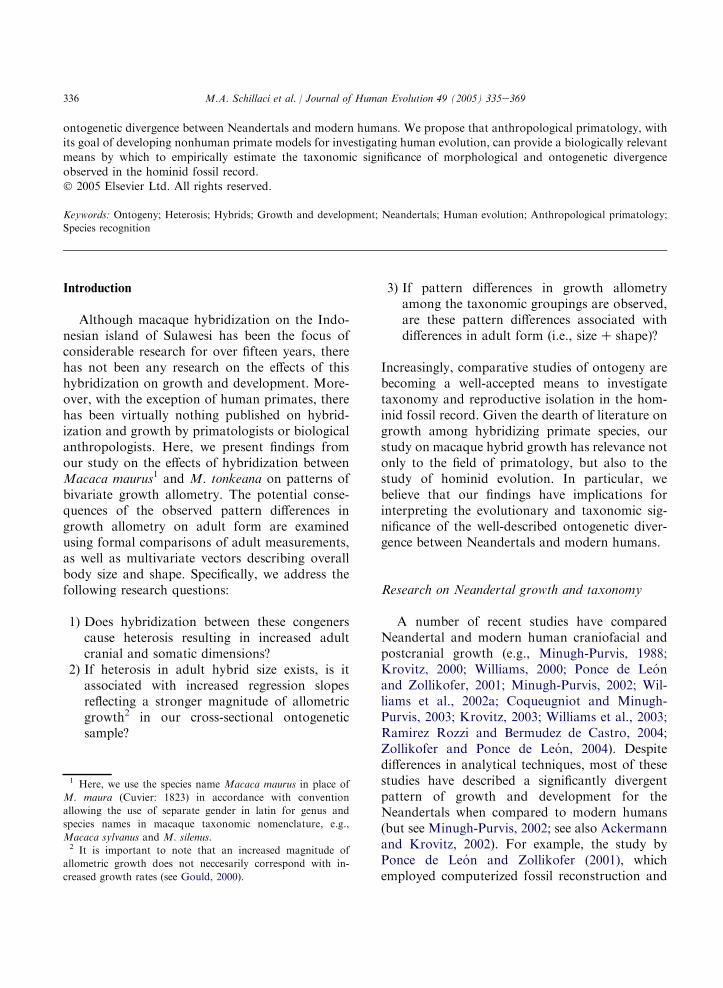
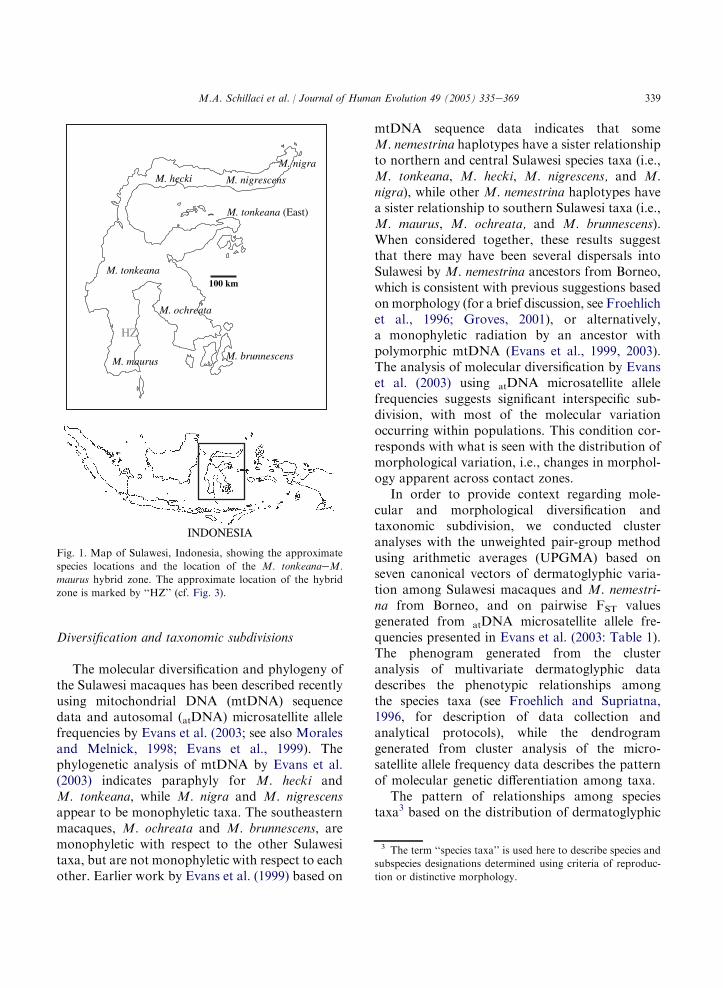
Sulawesi is home to a remarkable diversity ofmacaques, representing roughly 40% of the speciesdiversity within Macaca, despite occupying lessthan 2% of the geographic range of the genus(Albrecht, 1978). Sulawesi was colonized by one ortwo overseas dispersals of a M. nemestrina-likeancestor from Borneo sometime during the Pleis-tocene. Subsequent geographical radiations cou-pled with intermittent vicariance stemming fromsea level changes are likely responsible for much ofthe well-described taxonomic and morphologicaldiversity among the island’s macaque taxa (seeFooden, 1969; Albrecht, 1978; Froehlich, 2003).Fooden (1969) designated seven macaque species onSulawesi: Macaca maurus, M. tonkeana, M. hecki,M. nigrescens, M. nigra, M. ochreata, and M.brunnescens (Fig. 1). Subsequent research has bothsupported Fooden’s species designations (Al-brecht, 1978; Fujita and Watanabe, 1995) andquestioned them (Groves, 1980; Supriatna, 1991;Froehlich and Supriatna, 1996). Much of thedebate surrounding Sulawesi macaque taxonomystems from the discovery of marginal sympatryand hybridization among most of the Sulawesispecies taxa, raising questions regarding thevalidity of species-level distinctions for those taxawith known hybrids.
Despite significant differences in character traitslikely important in maintaining specific materecognition systems (SMRS; Paterson, 1985), suchas pelage patterning, size and shape of the glutealfields, female sexual swelling (Stallmann andFroehlich, 2000; Froehlich, 2003; see also descrip-tions in Groves, 2001), body size, and various facialmeasurements (Albrecht, 1978), hybridization oc-curs at five of the six species boundaries on theisland (Groves, 1980; Ciani et al., 1989; Supriatna,1991; Watanabe and Matsumura, 1991; Watanabeet al., 1991a; Watanabe et al., 1991b; Froehlich andSupriatna, 1996; Bynum et al., 1997; Froehlichet al., 1999; Evans et al., 2001; Bynum, 2002).
339M.A. Schillaci et al. / Journal of Human Evolution 49 (2005) 335e369
Diversification and taxonomic subdivisions
The molecular diversification and phylogeny ofthe Sulawesi macaques has been described recentlyusing mitochondrial DNA (mtDNA) sequencedata and autosomal (atDNA) microsatellite allelefrequencies by Evans et al. (2003; see also Moralesand Melnick, 1998; Evans et al., 1999). Thephylogenetic analysis of mtDNA by Evans et al.(2003) indicates paraphyly for M. hecki andM. tonkeana, while M. nigra and M. nigrescensappear to be monophyletic taxa. The southeasternmacaques, M. ochreata and M. brunnescens, aremonophyletic with respect to the other Sulawesitaxa, but are not monophyletic with respect to eachother. Earlier work by Evans et al. (1999) based on
M. nigra
M. tonkeana
M. nigrescensM. hecki
M. maurus
M. ochreata
100 km
M. brunnescens
HZ
M. tonkeana (East)
INDONESIA
Fig. 1. Map of Sulawesi, Indonesia, showing the approximate
species locations and the location of the M. tonkeanaeM.
maurus hybrid zone. The approximate location of the hybrid
zone is marked by ‘‘HZ’’ (cf. Fig. 3).
mtDNA sequence data indicates that someM. nemestrina haplotypes have a sister relationshipto northern and central Sulawesi species taxa (i.e.,M. tonkeana, M. hecki, M. nigrescens, and M.nigra), while other M. nemestrina haplotypes havea sister relationship to southern Sulawesi taxa (i.e.,M. maurus, M. ochreata, and M. brunnescens).When considered together, these results suggestthat there may have been several dispersals intoSulawesi by M. nemestrina ancestors from Borneo,which is consistent with previous suggestions basedon morphology (for a brief discussion, see Froehlichet al., 1996; Groves, 2001), or alternatively,a monophyletic radiation by an ancestor withpolymorphic mtDNA (Evans et al., 1999, 2003).The analysis of molecular diversification by Evanset al. (2003) using atDNA microsatellite allelefrequencies suggests significant interspecific sub-division, with most of the molecular variationoccurring within populations. This condition cor-responds with what is seen with the distribution ofmorphological variation, i.e., changes in morphol-ogy apparent across contact zones.
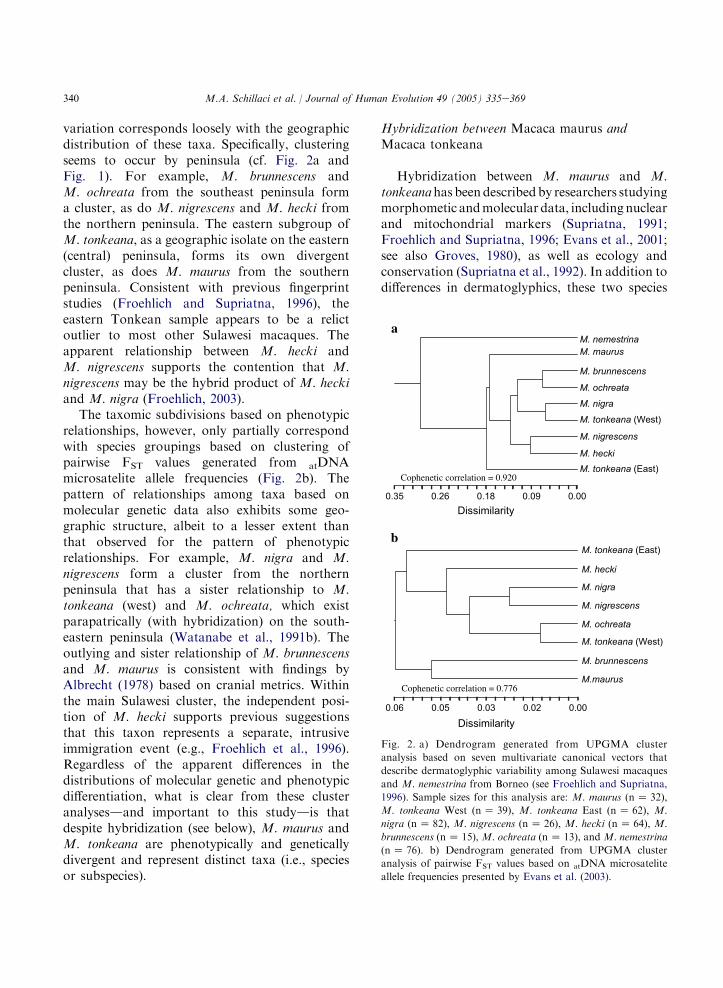
In order to provide context regarding mole-cular and morphological diversification andtaxonomic subdivision, we conducted clusteranalyses with the unweighted pair-group methodusing arithmetic averages (UPGMA) based onseven canonical vectors of dermatoglyphic varia-tion among Sulawesi macaques and M. nemestri-na from Borneo, and on pairwise FST valuesgenerated from atDNA microsatellite allele fre-quencies presented in Evans et al. (2003: Table 1).The phenogram generated from the clusteranalysis of multivariate dermatoglyphic datadescribes the phenotypic relationships amongthe species taxa (see Froehlich and Supriatna,1996, for description of data collection andanalytical protocols), while the dendrogramgenerated from cluster analysis of the micro-satellite allele frequency data describes the patternof molecular genetic differentiation among taxa.
The pattern of relationships among speciestaxa3 based on the distribution of dermatoglyphic
3 The term ‘‘species taxa’’ is used here to describe species and
subspecies designations determined using criteria of reproduc-
tion or distinctive morphology.
340 M.A. Schillaci et al. / Journal of Human Evolution 49 (2005) 335e369
variation corresponds loosely with the geographicdistribution of these taxa. Specifically, clusteringseems to occur by peninsula (cf. Fig. 2a andFig. 1). For example, M. brunnescens andM. ochreata from the southeast peninsula forma cluster, as do M. nigrescens and M. hecki fromthe northern peninsula. The eastern subgroup ofM. tonkeana, as a geographic isolate on the eastern(central) peninsula, forms its own divergentcluster, as does M. maurus from the southernpeninsula. Consistent with previous fingerprintstudies (Froehlich and Supriatna, 1996), theeastern Tonkean sample appears to be a relictoutlier to most other Sulawesi macaques. Theapparent relationship between M. hecki andM. nigrescens supports the contention that M.nigrescens may be the hybrid product of M. heckiand M. nigra (Froehlich, 2003).
The taxomic subdivisions based on phenotypicrelationships, however, only partially correspondwith species groupings based on clustering ofpairwise FST values generated from atDNAmicrosatelite allele frequencies (Fig. 2b). Thepattern of relationships among taxa based onmolecular genetic data also exhibits some geo-graphic structure, albeit to a lesser extent thanthat observed for the pattern of phenotypicrelationships. For example, M. nigra and M.nigrescens form a cluster from the northernpeninsula that has a sister relationship to M.tonkeana (west) and M. ochreata, which existparapatrically (with hybridization) on the south-eastern peninsula (Watanabe et al., 1991b). Theoutlying and sister relationship of M. brunnescensand M. maurus is consistent with findings byAlbrecht (1978) based on cranial metrics. Withinthe main Sulawesi cluster, the independent posi-tion of M. hecki supports previous suggestionsthat this taxon represents a separate, intrusiveimmigration event (e.g., Froehlich et al., 1996).Regardless of the apparent differences in thedistributions of molecular genetic and phenotypicdifferentiation, what is clear from these clusteranalysesdand important to this studydis thatdespite hybridization (see below), M. maurus andM. tonkeana are phenotypically and geneticallydivergent and represent distinct taxa (i.e., speciesor subspecies).
Hybridization between Macaca maurus andMacaca tonkeana
Hybridization between M. maurus and M.tonkeanahas beendescribedby researchers studyingmorphometic andmolecular data, includingnuclearand mitochondrial markers (Supriatna, 1991;Froehlich and Supriatna, 1996; Evans et al., 2001;see also Groves, 1980), as well as ecology andconservation (Supriatna et al., 1992). In addition todifferences in dermatoglyphics, these two species
0.35 0.26 0.18 0.09 0.00Dissimilarity
M. tonkeana (East)M. hecki
M. nigrescens
M. tonkeana (West)
M. nigra
M. ochreata
M. brunnescens
M. maurus
M. nemestrina
Cophenetic correlation = 0.920
a
0.06 0.05 0.03 0.02 0.00
Dissimilarity
M.maurus
M. brunnescens
M. tonkeana (West)
M. ochreata
M. nigrescens
M. nigra
M. hecki
M. tonkeana (East)
Cophenetic correlation = 0.776
b
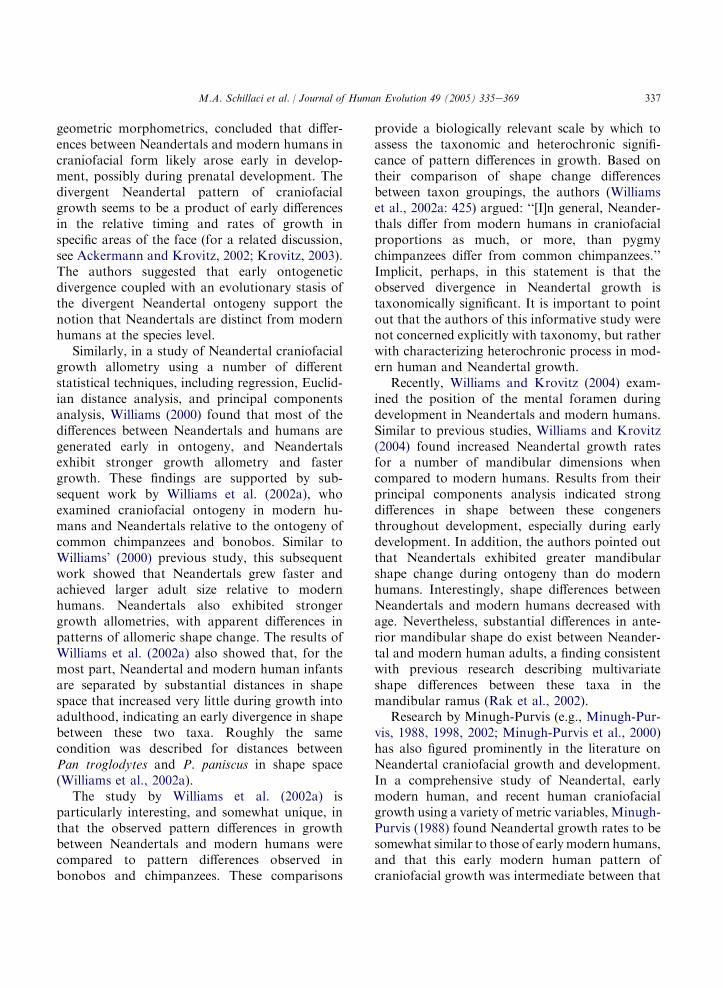
Fig. 2. a) Dendrogram generated from UPGMA cluster
analysis based on seven multivariate canonical vectors that
describe dermatoglyphic variability among Sulawesi macaques
and M. nemestrina from Borneo (see Froehlich and Supriatna,
1996). Sample sizes for this analysis are: M. maurus (nZ 32),
M. tonkeana West (nZ 39), M. tonkeana East (n Z 62), M.
nigra (nZ 82), M. nigrescens (nZ 26), M. hecki (nZ 64), M.
brunnescens (nZ 15), M. ochreata (nZ 13), and M. nemestrina
(nZ 76). b) Dendrogram generated from UPGMA cluster
analysis of pairwise FST values based on atDNA microsatelite
allele frequencies presented by Evans et al. (2003).
341M.A. Schillaci et al. / Journal of Human Evolution 49 (2005) 335e369
taxa differ in body size, cranial and postcranialmetrics, pelage coloration, and female sexualswellings. The larger of the two taxa, Macacatonkeana, exhibits black body pelage with whitecoloring on the dorsal portion of the hind limbs andon portions of the ventrum. In contrast, Macacamaurus pelage is uniformly dark-chocolate brown.
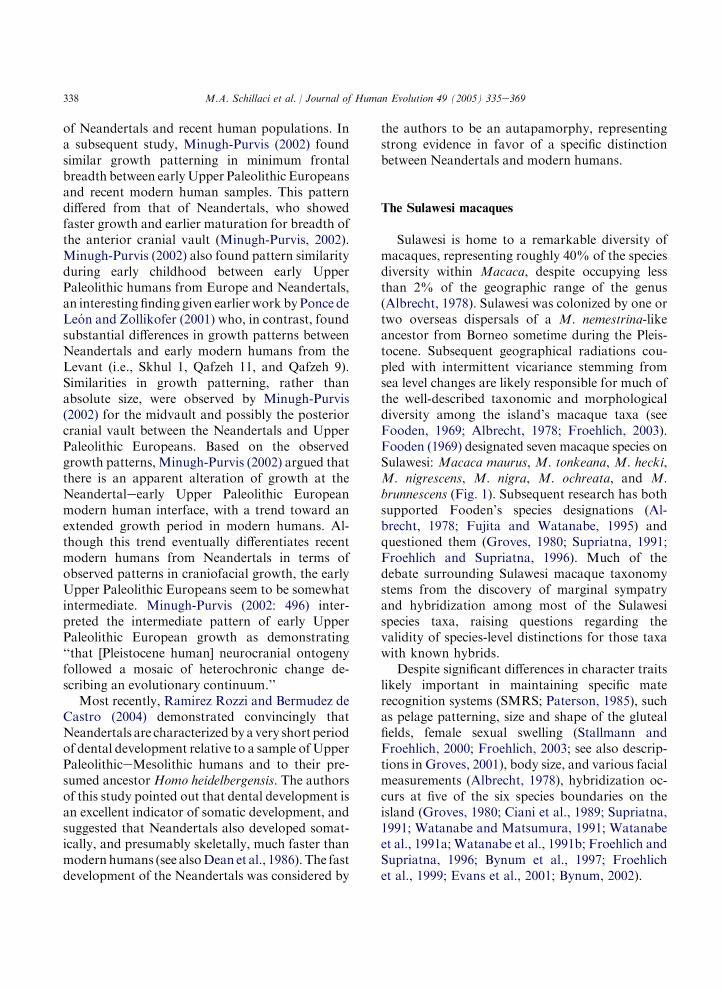
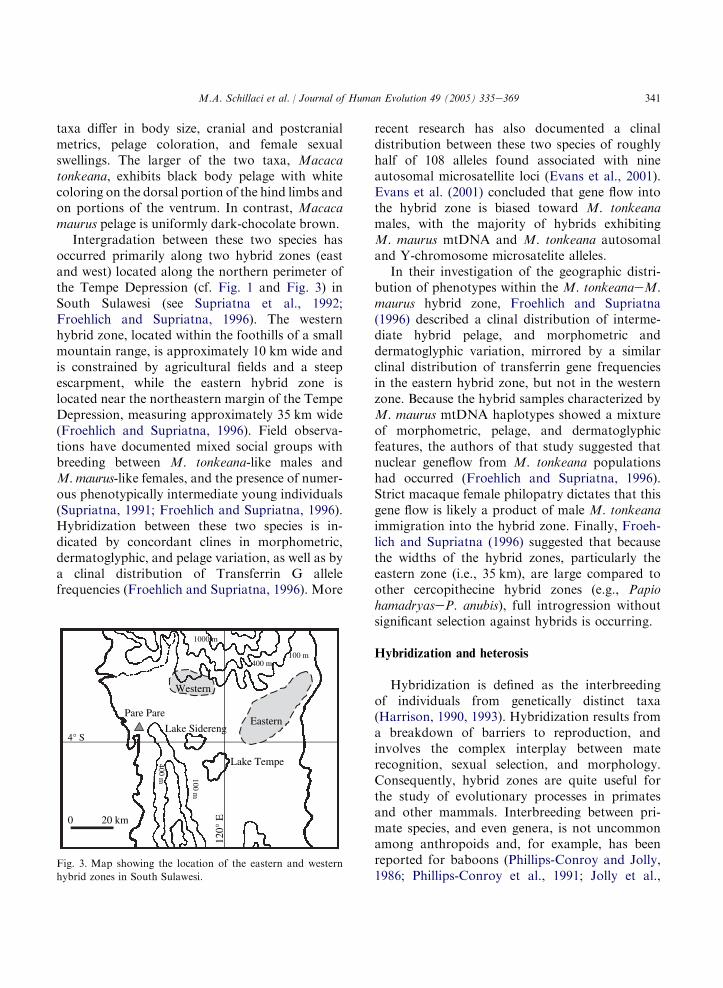
Intergradation between these two species hasoccurred primarily along two hybrid zones (eastand west) located along the northern perimeter ofthe Tempe Depression (cf. Fig. 1 and Fig. 3) inSouth Sulawesi (see Supriatna et al., 1992;Froehlich and Supriatna, 1996). The westernhybrid zone, located within the foothills of a smallmountain range, is approximately 10 km wide andis constrained by agricultural fields and a steepescarpment, while the eastern hybrid zone islocated near the northeastern margin of the TempeDepression, measuring approximately 35 km wide(Froehlich and Supriatna, 1996). Field observa-tions have documented mixed social groups withbreeding between M. tonkeana-like males andM.maurus-like females, and the presence of numer-ous phenotypically intermediate young individuals(Supriatna, 1991; Froehlich and Supriatna, 1996).Hybridization between these two species is in-dicated by concordant clines in morphometric,dermatoglyphic, and pelage variation, as well as bya clinal distribution of Transferrin G allelefrequencies (Froehlich and Supriatna, 1996). More
Eastern
Western
400 m 100 m
1000 m
100 m 400 m
4° S
120°
E
0 20 km
Pare Pare
Lake Sidereng
Lake Tempe
Fig. 3. Map showing the location of the eastern and western
hybrid zones in South Sulawesi.
recent research has also documented a clinaldistribution between these two species of roughlyhalf of 108 alleles found associated with nineautosomal microsatellite loci (Evans et al., 2001).Evans et al. (2001) concluded that gene flow intothe hybrid zone is biased toward M. tonkeanamales, with the majority of hybrids exhibitingM. maurus mtDNA and M. tonkeana autosomaland Y-chromosome microsatelite alleles.
In their investigation of the geographic distri-bution of phenotypes within the M. tonkeanaeM.maurus hybrid zone, Froehlich and Supriatna(1996) described a clinal distribution of interme-diate hybrid pelage, and morphometric anddermatoglyphic variation, mirrored by a similarclinal distribution of transferrin gene frequenciesin the eastern hybrid zone, but not in the westernzone. Because the hybrid samples characterized byM. maurus mtDNA haplotypes showed a mixtureof morphometric, pelage, and dermatoglyphicfeatures, the authors of that study suggested thatnuclear geneflow from M. tonkeana populationshad occurred (Froehlich and Supriatna, 1996).Strict macaque female philopatry dictates that thisgene flow is likely a product of male M. tonkeanaimmigration into the hybrid zone. Finally, Froeh-lich and Supriatna (1996) suggested that becausethe widths of the hybrid zones, particularly theeastern zone (i.e., 35 km), are large compared toother cercopithecine hybrid zones (e.g., PapiohamadryaseP. anubis), full introgression withoutsignificant selection against hybrids is occurring.
Hybridization and heterosis
Hybridization is defined as the interbreedingof individuals from genetically distinct taxa(Harrison, 1990, 1993). Hybridization results froma breakdown of barriers to reproduction, andinvolves the complex interplay between materecognition, sexual selection, and morphology.Consequently, hybrid zones are quite useful forthe study of evolutionary processes in primatesand other mammals. Interbreeding between pri-mate species, and even genera, is not uncommonamong anthropoids and, for example, has beenreported for baboons (Phillips-Conroy and Jolly,1986; Phillips-Conroy et al., 1991; Jolly et al.,
342 M.A. Schillaci et al. / Journal of Human Evolution 49 (2005) 335e369
1997), gibbons (Brockelman and Srikosamatara,1984; Marshall and Sugardjito, 1986), and mac-aques (e.g., Fooden, 1964, 1969; Bernstein, 1966,1968; Supriatna, 1991; Bynum et al., 1997; Jolly,2001).
The concept of heterosis, and its importance asa biological principle, was first recognized inresearch on hybrid corn in the early 1900s.Heterosis, sometimes referred to as hybrid vigor(see Paul, 1992, for discussion) is considereda common consequence of hybridization and isachieved when the hybrid phenotype exceeds themidpoint, i.e., midparental average, of the parentaltaxa (see summaries in Falconer and Mackay,1996; Kohn et al., 2001). For metric traits, heterosisis defined as a condition of increased heterozygos-ity resulting in F1 hybrid measurement valuesgreater than the average of the two parental species(Falconer and Mackay, 1996). As such, hybridsexhibiting heterosis typically have larger body size,as well as increased size in other phenotypiccharacteristics, than the average of the twoparental species. This consequence of hybridizationhas made controlled crossbreeding an importanttool in agriculture and animal husbandry.
Hybrid deviation from the parental mean isa product of differences in gene frequencies betweenthe parental populations, as well as differences ininteractions within and between various loci (Kohnet al., 2001: 42). Dominance (d) also plays anessential role in heterosis, and loci without domi-nance cannot contribute to heterosis. Falconer andMackay (1996) pointed out that the degree ofheterosis at any given locus for the F1 hybridgeneration (HF1) is the arithmetic product of thesquare of the difference in gene frequency (y)between the parental taxa and the level of hybriddominance (d) at that gene (i.e., the frequency ofhybrid heterozygotes). Assuming that separate locicontribute to the effects of heterosis in an additivemanner, the joint effects of these separate loci can beexplained by the sumof their separate contributions(i.e., HF1Z
Pdy2; Falconer and Mackay, 1996:
256). It follows, therefore, that, assuming thesummed level of dominance is greater than one,the greater the difference in gene frequencies, thegreater the effects of heterosis (Falconer andMackay, 1996). It is important to note that the
degree of heterosis in the F2 hybrids is roughly 50%of that seen the F1 hybrids under a condition ofrandom mating.
Negative heterosis, or dysgenesis, is indicatedwhen the hybrid phenotypic mean is less than themean of the parental taxa. Dysgenesis can resultfrom hybridization between two taxa with differ-ent environmental adaptation and coadapted genecomplexes (Falconer and Mackay, 1996; Kohnet al., 2001). The breakdown of these complexesmay result in smaller hybrid phenotypes relative tothe midparental average. When parental taxashare similar physical environments, as may bethe case for parapatric or sympatric taxa, largedifferences in coadaped gene complexes causingsignificant dysgenesis would not be expected.
The effects of hybridization and heterosis innonhuman primates have not been well studied.Most of the published research centers on hybrid-ization among callitrichids. Cheverud et al. (1993)described hybridization among subspecies ofSaguinus fuscicollis that resulted in heterosis incraniofacial form. Heterosis was found for mostindividual cranial dimensions in the subspecieshybrids. The statistical significance of heterosisvaried by hybrid grouping. Cheverud et al. (1993)also found substantial heterosis in overall size andsize-related shape as described by the first principalcomponent scores. In their subsequent study ofSaguinus fuscicollis subspecies hybridization,Kohn et al. (2001) found heterosis in postcranialmorphology, with hybrids exhibiting greater di-mensions than the midparental average. In a studyof regional crossbreeding between captive rhesusmacaques, Smith and Scott (1989) describedgreater average age-adjusted values for weightand body length in the crossbred macaquescompared to the regional groups of noncrossbredanimals. With the notable exception of Smith andScott (1989), we were unable to find any reports ofthe effects of hybridization and heterosis onnonhuman primate growth and development inour review of the literature.
Although the effects of heterosis on growth anddevelopment in nonhuman primates have not beenwell studied, there is a body of literature on growthand heterosis in other animals and plantsdparticularly in commercial crops and livestock.
343M.A. Schillaci et al. / Journal of Human Evolution 49 (2005) 335e369
Crossbreeeding, or hybridization, and its effectson body weight during development and ongrowth and maturation have been studied in pigs(Muller et al., 2000; Cassady et al., 2002), Pacificoysters (Bayne et al., 1999), sea urchins (Rahmanet al., 2000), chickens (Williams et al., 2002b), quail(Hyankova et al., 2002), cattle (Gregory et al., 1992;Demeke et al., 2003), sheep (Gama et al., 1991), andhumans (e.g., Hulse, 1961; Little et al., 1986;Khongsdier and Mukherjee, 2003a, b). The strongmajority of these studies suggest that crossbreedingor hybridization is often associated with growthheterosis characterized primarily by faster hybridvelocities, or rates of growth (but see Demeke et al.,2003). A variety of other effects have also beendescribed in the literature. For example,Gama et al.(1991) described increased mortality associatedwith heterosis during development in sheep. Heter-osis in body weight is present early in developmentfor hybrid beef cows (Gregory et al., 1992) and pigs(Cassady et al., 2002). Larger litter sizes areassociated with heterosis in hybrid pigs, as isincreased nipple number, increased body weight atpuberty, and increased weaning weight (Cassadyet al., 2002). Based on the literature cited above, wemight expect to see increased regression slope valuesreflecting a greater magnitude of allometric growthfor our sample of hybrid macaques from Sulawesi.
Growth allometry
Allometry has been defined as the study of therelationship between size and shape (Gould, 1966),or as a change in shape correlated with an increaseor decrease in size (Gould, 1977). Classical studiesof bivariate growth allometry have relied on theslope and intercept of the linear regression linedescribing the linear relationship between bodysize and some aspect of anatomy as a measure ofsize-related shape change during development.Size-related shape changes from ancestor to de-scendant taxa can result from one or more primarypattern differences in growth allometry: 1) dissoci-ation of ancestor and descendant allometries due todifferences in regression slope values, 2) dissocia-tion of ancestor and descendant allometries due todifferences in regression intercept values, and 3)
ontogenetic scaling due to truncation or extensionof the descendant slope along a common trajectory(for a review, see Gould, 1977; Shea, 1983; Leighet al., 2003). Dissociations due to slope differencesare necessarily assessed in relation to isometry.
When pattern differences between ancestor anddescendent allometries are interpreted using amodelof heterochronyddefined by Gould (1977: 2) as‘‘changes in the relative time of the appearanceand rate of development’’dthese dissociationsrepresent forms of ontogenetic process [but seeGodfrey and Sutherland (1995a, b, 1996); also seeGodfrey (1999) for a concise historical review].Dissociation from ancestral allometric trajectories,either by way of increased descendant slope(acceleration) or intercept values (predisplace-ment), or through continued growth along theancestral trajectory (hypermorphosis), will resultin peramorphosis, which is the development ofa new descendant adult shape (Alberch et al., 1979;for clarification on terminology, see also Rice,1997; Gould, 2000). Higher intercept values for thedescendant trajectories imply increased prenatal orearly growth in the descendant taxon, while lowerintercept values imply decreased early descendantgrowth (Shea, 1985). Similarly, dissociation fromancestral allometric trajectories by way of de-creased descendant slope (neoteny) or interceptvalues (postdisplacement), or by truncated growthalong the ancestral trajectory (hypomorphosis),will result in the development of a juvenilizeddescendant adult shape relative to the ancestraladult shape, termed paedomorphosis (Alberchet al., 1979).
Both hypermorphosis and hypomorphosis, orontogenetic scaling, require size changes in thedescendant taxon. In the case of hypermorphosis,the increased size can result in a new adult shape;hypomorphosis does not result in a new de-scendent adult shape but does result in a newsizeeshape association. As such, hypermorphosismight reflect selection on size, with any relatedshape changes being byproducts of selection onsize (see Leigh et al., 2003). Because hybridizationcan increase adult size through heterosis, a resultindependent of size selection in the hybrids, it isreasonable to assume that heterosis might bereflected in the growth allometry of hybrids.
344 M.A. Schillaci et al. / Journal of Human Evolution 49 (2005) 335e369
Of particular interest to the present study,Leigh et al. (2003) suggested that size-dependentshape variation, as described by growth allometry,is likely an important mechanism in producingmorphological diversity among living papionins(subfamily Cercopithecinae), including macaques(also seeMouri, 1996). The heterochronic processesdescribed above can produce significant changes inadult morphology through small changes in growthallometry (see Alberch et al., 1979). Although Leighet al. (2003) did not address the subject ofhybridization, based on their suggestion, it seemspossible that some of the morphological diversityobserved among the Sulawesi macaquesmay be duein part to hybridization if interbreeding betweenspecies taxa affects patterns of growth allometry inhybrids. Based on what is known of the effects ofhybridization on growth in other mammals, wewould expect increased slope values and, perhaps,increased intercept values for hybrid regressionsdescribing ontogenetic allometries. Relative toisometry, this pattern of allometry might reflectacceleration or predisplacement resulting in per-amorphic adult hybrid form.
Allometric growth in papionins
Heterochrony and allometric growth of thecraniofacial skeleton in macaques has been wellstudied (e.g., Cochard, 1985; Sirianni and Swindler,1985; King and Schneiderman, 1993; Mouri, 1996;Collard and O’Higgins, 2001; O’Higgins andCollard, 2002; Zumpano, 2002; Leigh et al., 2003).Much of the research on heterochrony and growthallometry has focused on the relationship betweenontogeny and sexual dimorphism, or has describedsex differences in allometric growth. Recently,Leigh et al. (2003) and Collard and O’Higgins(2001) have examined the developmental basis ofshape variation in papionins and how developmen-tal changes may be reflected in papionin phylogeny.
The dominant finding of this body of researchsuggests that there is a disproportionate lengthen-ing of the face in relation to increases in body size,a result of strong positive allometry (Cochard,1985; Leigh et al., 2003). This condition appears tobe symplesiomorphic among papionin genera (seediscussions in Collard and O’Higgins, 2001; Leigh
et al., 2003), as does the observed negativeallometry of cranial vault size relative to facialsize (Cochard, 1985; Leigh et al., 2003). Whileanterior growth of the face exhibits positiveallometry in relation to body weight, growth infacial breadth exhibits negative allometry. Leighet al. (2003) demonstrated that differences amongpapionin genera in craniofacial form are primarilya product of size-related shape changes, with thelarger and peramorphic genera (i.e., Mandrillusand Papio) surpassing the size and shape ranges ofsmaller, less derived genera (i.e., Macaca andCercocebus) (see also Collard and O’Higgins,2001). Most of the size-related shape change inpapionins is attributable to hypermorphosis (on-togenetic scaling) and acceleration. The researchby Leigh et al. (2003) and Collard and O’Higgins(2001) suggests cogently that change in patterns ofgrowth allometry can produce significant taxo-nomically relavent craniofacial variation in closelyrelated primate taxa.
Materials and methods
Data collection
Morphometric data were collected from a sam-ple of 78 wild and pet macaques (M. maurus andM. tonkeana) from South and Central Sulawesi(see Froehlich and Supriatna, 1996) (Appendix A).Only males were included in this analysis due tosmall female sample sizes. The large majority ofthe sample (88.5%) comprises wild macaquestrapped and anesthetized for data collectionusing ketamine (Supriatna, 1991). The remainingportion of the sample comprises pets anesthetizedfor data collection with Telazol� (Schillaci et al.,2001). This cross-sectional sample included bothmature and immature individuals (Table 1).Hybrids were trapped from within the hybrid zoneand were not sampled based on a predeterminedphenotype (see Supriatna, 1991; Froehlich andSupriatna, 1996). Because our hybrid sample mayinclude some F2 hybrids and backcrosses, theeffects of heterosis on adult traits and hybridgrowth allometry could have been reduced. Thiswould limit our ability to identify a statistically
345M.A. Schillaci et al. / Journal of Human Evolution 49 (2005) 335e369
significant hybrid pattern of growth, and perhapsreduce our ability to correlate adult heterosis withhybrid growth patterns.
Dental ages were assigned in the field based onobserved patterns of dental eruption for 51 of the78 animals used in the study (65.4%). Dental ageswere used to place monkeys into one of four agecategories: Juvenile 1, Juvenile 2, Subadult, andAdult (see footnote in Appendix A). Based on the51 monkeys with assigned dental ages, linearregression, with body mass and crownerumplength (CRL) as predictor variables, was used toestimate age category for those animals that didnot have dental ages assigned in the field (agecategoryZ 0.312C 0.237(mass)C 0.0217(CRL);r2Z 0.783).
Body weight was measured using a spring scale,and four external measurements of the head andface were taken using standard sliding andspreading calipers (see Table 2). Crownerumplength was measured from the base of the tail tocranial apex using a flexible metal tape measure.The head and face measurement variables used forthis study quantify horizontal and anteroposteriorgrowth, and have been shown to be useful fordistinguishing among the Sulawesi species taxa(e.g., Albrecht, 1978; Froehlich et al., 1999;Froehlich, 2003).
Analysis of the adult data
Descriptive statistics for body mass, crownerump length, and the four craniofacial variableswere calculated for the adult hybrid and parentalspecies samples. Formal comparisons across allthree adult samples for each variable were
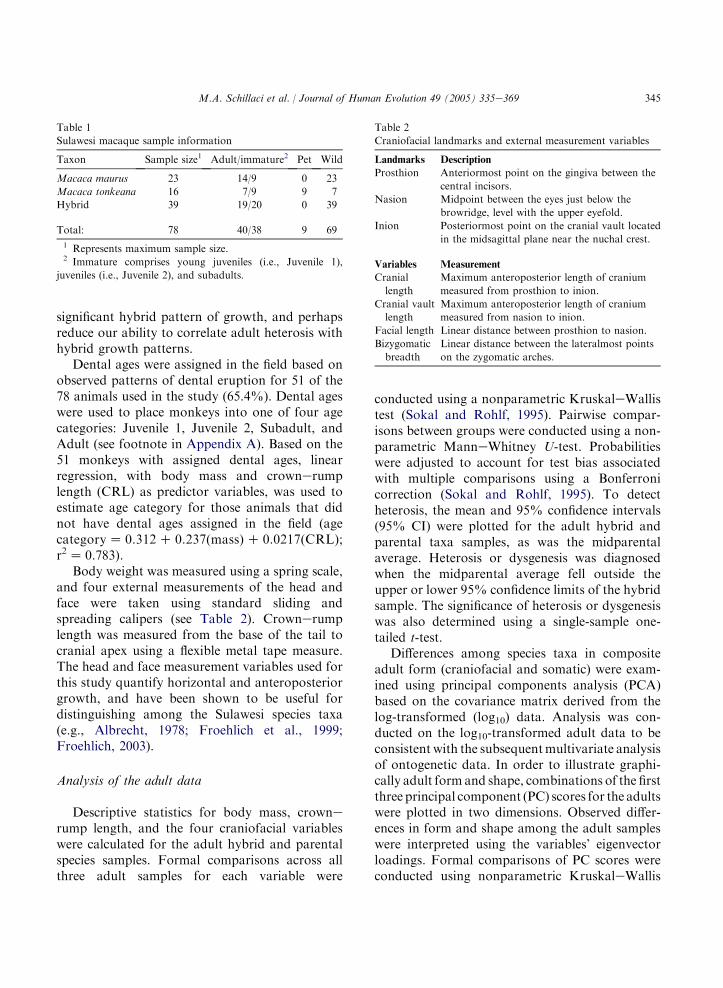
Table 1
Sulawesi macaque sample information
Taxon Sample size1 Adult/immature2 Pet Wild
Macaca maurus 23 14/9 0 23
Macaca tonkeana 16 7/9 9 7
Hybrid 39 19/20 0 39
Total: 78 40/38 9 69
1 Represents maximum sample size.2 Immature comprises young juveniles (i.e., Juvenile 1),
juveniles (i.e., Juvenile 2), and subadults.
conducted using a nonparametric KruskaleWallistest (Sokal and Rohlf, 1995). Pairwise compar-isons between groups were conducted using a non-parametric ManneWhitney U-test. Probabilitieswere adjusted to account for test bias associatedwith multiple comparisons using a Bonferronicorrection (Sokal and Rohlf, 1995). To detectheterosis, the mean and 95% confidence intervals(95% CI) were plotted for the adult hybrid andparental taxa samples, as was the midparentalaverage. Heterosis or dysgenesis was diagnosedwhen the midparental average fell outside theupper or lower 95% confidence limits of the hybridsample. The significance of heterosis or dysgenesiswas also determined using a single-sample one-tailed t-test.
Differences among species taxa in compositeadult form (craniofacial and somatic) were exam-ined using principal components analysis (PCA)based on the covariance matrix derived from thelog-transformed (log10) data. Analysis was con-ducted on the log10-transformed adult data to beconsistent with the subsequentmultivariate analysisof ontogenetic data. In order to illustrate graphi-cally adult form and shape, combinations of the firstthree principal component (PC) scores for the adultswere plotted in two dimensions. Observed differ-ences in form and shape among the adult sampleswere interpreted using the variables’ eigenvectorloadings. Formal comparisons of PC scores wereconducted using nonparametric KruskaleWallis
Table 2
Craniofacial landmarks and external measurement variables
Landmarks Description
Prosthion Anteriormost point on the gingiva between the
central incisors.
Nasion Midpoint between the eyes just below the
browridge, level with the upper eyefold.
Inion Posteriormost point on the cranial vault located
in the midsagittal plane near the nuchal crest.
Variables Measurement
Cranial
length
Maximum anteroposterior length of cranium
measured from prosthion to inion.
Cranial vault
length
Maximum anteroposterior length of cranium
measured from nasion to inion.
Facial length Linear distance between prosthion to nasion.
Bizygomatic
breadth
Linear distance between the lateralmost points
on the zygomatic arches.
346 M.A. Schillaci et al. / Journal of Human Evolution 49 (2005) 335e369
and ManneWhitney U-tests. Probabilities wereadjusted using a Bonferroni correction. Diagnosisof heterosis/dysgenesis in size and size-related shapewas based on the results from a one-sample t-testcomparing hybrid and midparental averages forfirst PC scores.
In addition to the PCA, canonical discriminantanalyses of the log10-transformed adult data werealso conducted. Canonical discriminant functionsare linear combinations of the variables thatminimize within-group variation while maximizingbetween-group variation (see Manly, 1995). Thismultivariate technique is a powerful tool foridentifying morphological characteristics usefulfor distinguishing among a priori groupings. Forthe present study, canonical variate scores wereplotted in two dimensions and interpreted visually.A multivariate analysis of variance (MANOVA)of the same data was conducted to determine thestatistical significance of differences across groupsfor all variables simultaneously. These multivari-ate analyses were conducted to address ourresearch question regarding the uniqueness of theadult hybrid form.
Analysis of the ontogenetic data
The four craniofacial variables and body length(CRL) were each regressed against the log10-transformed values of the cube root of bodyweight using least squares (LS) and reduced majoraxis (RMA) regression. All variables were log10-transformed prior to regression analyses. Theslope of the RMA regression line was calculatedby dividing the least squares slope by the Pearsoncorrelation coefficient (r), while the intercept of theRMA regression line was calculated as: Yi� kXi,where Yi is the mean value of the dependentvariable for group i, Xi is the mean value of theindependent variable (in this study the log10-transformed values of body weight) for group i,and k is the slope of the RMA regression line(Sokal and Rohlf, 1995).
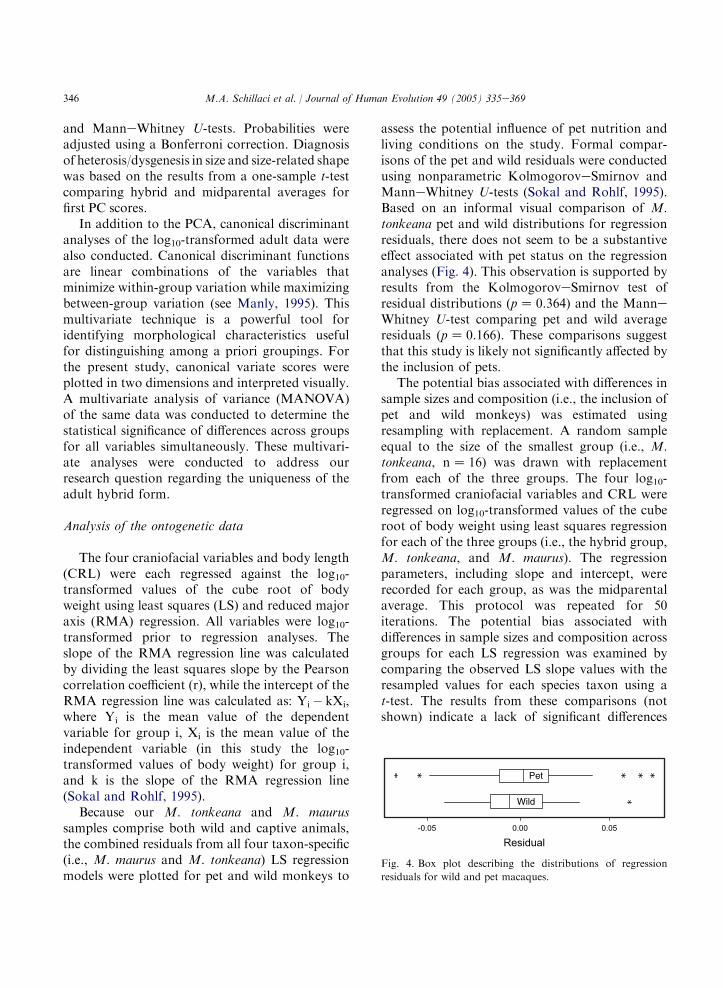
Because our M. tonkeana and M. maurussamples comprise both wild and captive animals,the combined residuals from all four taxon-specific(i.e., M. maurus and M. tonkeana) LS regressionmodels were plotted for pet and wild monkeys to
assess the potential influence of pet nutrition andliving conditions on the study. Formal compar-isons of the pet and wild residuals were conductedusing nonparametric KolmogoroveSmirnov andManneWhitney U-tests (Sokal and Rohlf, 1995).Based on an informal visual comparison of M.tonkeana pet and wild distributions for regressionresiduals, there does not seem to be a substantiveeffect associated with pet status on the regressionanalyses (Fig. 4). This observation is supported byresults from the KolmogoroveSmirnov test ofresidual distributions (pZ 0.364) and the ManneWhitney U-test comparing pet and wild averageresiduals (pZ 0.166). These comparisons suggestthat this study is likely not significantly affected bythe inclusion of pets.
The potential bias associated with differences insample sizes and composition (i.e., the inclusion ofpet and wild monkeys) was estimated usingresampling with replacement. A random sampleequal to the size of the smallest group (i.e., M.tonkeana, nZ 16) was drawn with replacementfrom each of the three groups. The four log10-transformed craniofacial variables and CRL wereregressed on log10-transformed values of the cuberoot of body weight using least squares regressionfor each of the three groups (i.e., the hybrid group,M. tonkeana, and M. maurus). The regressionparameters, including slope and intercept, wererecorded for each group, as was the midparentalaverage. This protocol was repeated for 50iterations. The potential bias associated withdifferences in sample sizes and composition acrossgroups for each LS regression was examined bycomparing the observed LS slope values with theresampled values for each species taxon using at-test. The results from these comparisons (notshown) indicate a lack of significant differences
Pet
Wild
0.050.00-0.05
Residual
Fig. 4. Box plot describing the distributions of regression
residuals for wild and pet macaques.
347M.A. Schillaci et al. / Journal of Human Evolution 49 (2005) 335e369
between the observed and resampled regressionparameters, suggesting that there is not a sub-stantial bias associated with small and unevensample sizes.
Comparisons of LS regression slope and in-tercept values between parental taxa and theircommon hybrid were conducted using a general-ized analysis of covariance (ANCOVA) modelallowing unequal slopes and intercepts acrossgroups. This generalized ANCOVA model isequivalent to fitting a multiple regression modelto the combined data, and then determining ifcertain defined regression effects are zero. Fora model comprising three groups, two indicatorvariables must be defined to uniquely identify eachobservation by taxon grouping: let I1Z 1 for M.maurus and I1Z 0 otherwise; similarly, let I2Z 1for M. tonkeana and I2Z 0 otherwise (i.e., M.maurus: I1Z 1, I2Z 0; M. tonkeana: I1Z 0,I2Z 1; hybrid group: I1Z 0, I2Z 0). Two in-teraction, or product, variables (P4 and P5) arethen defined using the indicators I1 and I2, and thepredictor variable (i.e., log10-transformed value ofthe cube root of mass), such that P4Z I1* massand P5Z I2* mass. Therefore, when the taxongrouping is the hybrid group, I1Z I2ZP4ZP5Z 0,and when the taxon grouping is M. maurus,I2Z P5Z 0, I1Z 1, and P4Zmass. The general-ized ANCOVA model comparing slopes andintercepts across the parental species and thehybrid group for CRL growth relative to bodymass can then be expressed as:
CRLZb0Cb1I1Cb2I2Cb3MassCb4P4
Cb5P5Ce ½1�
Where b0 and b3 are the intercept and slope of thehybrid group (reference group), b1 is the differencein intercept values between the hybrid group andM. maurus, b2 is the difference in intercept valuesbetween the hybrid group and M. tonkeana, b4 isthe difference in slope values between the hybridgroup and M. maurus, and b5 is the difference inslope values between the hybrid group and M.tonkeana. Differences across all three groups inslope values were tested using an F-test. TheANCOVA and F-test comparisons were con-ducted with the REG and GLM procedures in
SAS (SAS Institute Inc., 1990). In addition,differences between the hybrid group and themean of the two parental species for LS and RMAregression parameters for each variable weretested using a modified t-test described in Equa-tion 2:
tZ�bh � bp
�=
ffiffiffiffiffiffiffiffiffiffiffiffiffiffiffiffiffiffiffiffiffiffiffiffiffiffiffiffiffiffiffiffiffiffiffiffiffiffiffiffiffiffiffiffiffiffiSE2
bhC1
4
�SE2
b1CSE2b2
�r½2�
where bh is the hybrid regression parameters (i.e.,slope or intercept), bp is the mean of the twoparental species parameters b1 and b2, and SE1
and SE2 are the standard errors of the regressionparameters for the two parental species. Thedegrees of freedom used for this test were equalto the sum of the error degrees of freedom fromthe regression models for the two parental speciesand the hybrid. Probabilities were adjusted usinga Bonferroni correction to compensate for testbias associated with multiple comparisons (Sokaland Rohlf, 1995).
Ontogenetic allometry was also investigated byPCA using the covariance matrix of log10-trans-formed variables. This multivariate generalizationof allometry was described by Jolicoeur (1963),and has been used successfully to investigategrowth allometry in nonhuman primates (e.g.,Shea, 1982; Mouri, 1996). When size is included ina PCA using the covariance matrix of log-trans-formed data from an ontogenetic sample, the firstPC (PC1), or the growth allometry vector,represents a measure of allometry across allvariables (see Shea, 1985).
Principal components analysis was conductedon the entire data set comprising all threetaxonomic groupings. Principal component scoreswere plotted in two dimensions, and the distribu-tion of scores interpreted visually. Formal com-parisons of component scores were conductedusing nonparametric KruskaleWallis and ManneWhitney U-tests with Bonferroni corrected prob-abilities. In addition, similar to the analysis ofadult variation, canonical discriminant analysisand MANOVA of the PC scores were used todetermine if allometric and non-allometric shapevectors are useful for distinguishing amongtaxonomic groupings.
348 M.A. Schillaci et al. / Journal of Human Evolution 49 (2005) 335e369
Research questions
Each of our three research questions wereaddressed by way of formal and informal compar-isons of adult size and form, and comparisons ofregression parameters representing allometric tra-jectories. Our first research question, whether ornot hybridization between M. maurus and M.tonkeana has caused heterosis resulting in in-creased adult cranial and somatic dimensions,was addressed by comparing the adult midparentalaverage for each variable with the correspondingadult hybrid mean. If hybridization has resulted inheterosis, we would expect the hybrid means to besignificantly larger than the midparental average.Midparental averages falling significantly belowthe hybrid mean, using a one-tailed single-samplet-test, indicated heterosis in the hybrid group fora given trait.
The second research question, whether or notobserved heterosis in adult size is associated withincreased regression slope and intercept values,reflecting an increased magnitude of allometricgrowth, was addressed by comparing hybrid LSregression parameters with the midparental aver-age using the t-tests. This second question isequivalent to a null hypothesis predicting no dif-ference between the hybrid regression parametersand the average parameters of the two parentalspecies (i.e., H0: bhZ bp, or HA: bhs bp,).
The third research questiondwhether or notobserved pattern differences in growth allometryamong the taxon groupings are associated withdifferences in adult formdwas assessed throughformal comparisons of adult PC scores, andthrough canonical variate analysis andMANOVA.Significant differences between the hybrid groupand the parental taxa in PC1 indicate increasedhybrid size and differences in size-related shape(i.e., static adult allometry), a finding consistentwith heterosis. Significant differences between thehybrid group and the parental taxa in subsequentPC scores indicate significant shape differences. Ifthe adult hybrid form was nonintermediate, weexpected significant differences in PC scores, as wellas significant MANOVA results. The canonicalvariate analyis was expected to define significantdiscriminant functions useful for distinguishing
among groups in addition to visually separating thehybrid group from the parental species in multi-variate space.
Results
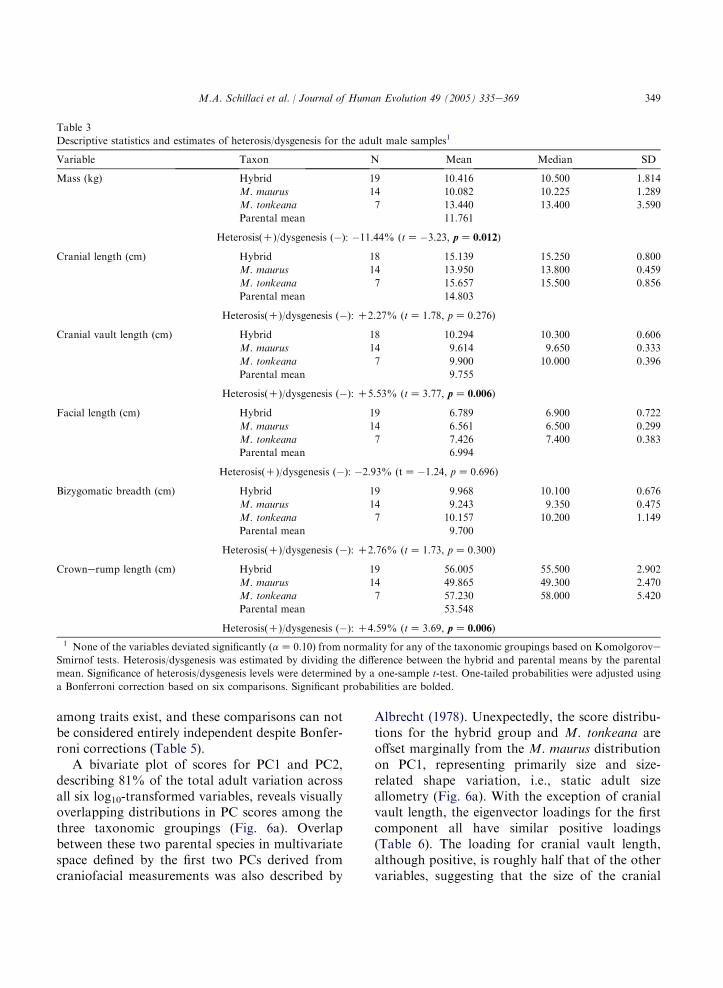
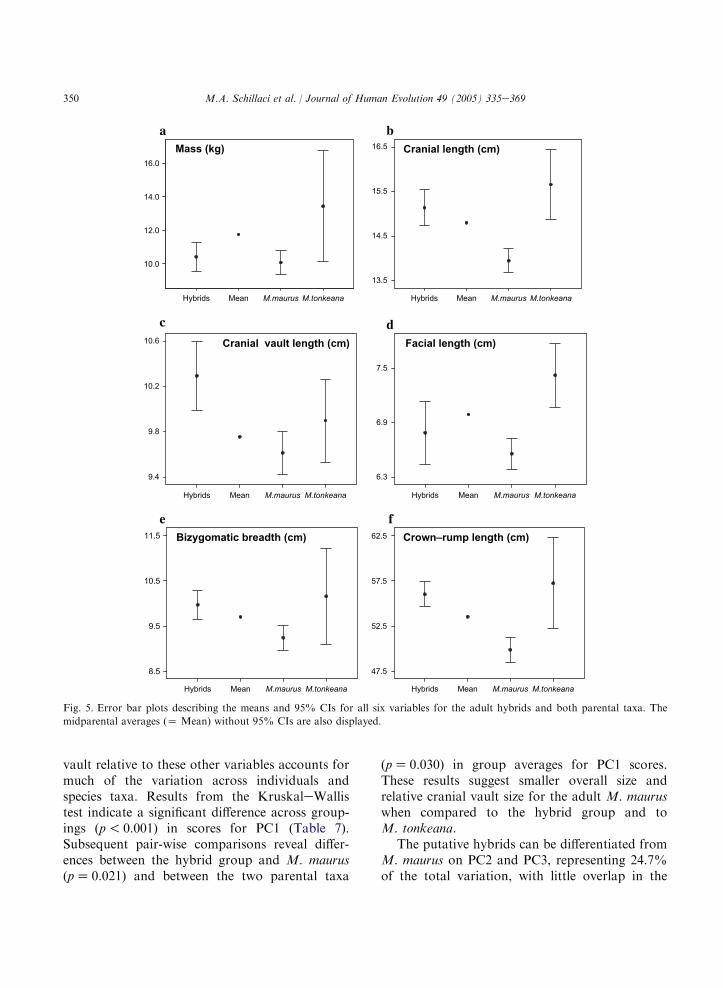
The summary statistics for the raw variablesfrom the adults are presented in Table 3. Adultmeans and 95% CIs for body mass, crownerumplength, and the four craniofacial variables arepresented graphically in Fig. 5. Visual compar-isons of the midparental averages (i.e., the mean oftwo parental taxa, M. maurus and M. tonkeana)with the hybrid means for cranial length, cranialvault length, bizygomatic breadth, and crownerump length indicates that only two of thesecomparisons, cranial vault length and crownerump length, reach statistical significance. Com-parisons of bizygomatic breadth and cranial lengthapproach significance but fall just within the 95%CI for the hybrid means. Interestingly, dysgenesisis indicated for hybrid body mass. These results,based on a visual comparison of the midparentalaverages with the hybrid confidence intervals, arein agreement with the results from the single-sample t-tests (Table 3).
Formal comparisons across taxonomic group-ings using a KruskaleWallis test reveal significantdifferences among taxa for all variables except bodymass (Table 4). Subsequent pair-wise ManneWhitney comparisons indicate significant differ-ences between the hybrid group and M. maurus forcranial length, cranial vault length, and crownerump length, as well as significant differencesbetween the two interbreeding parental taxa, M.maurus and M. tonkeana, for cranial length andfacial length, a finding consistent with resultspresented by Fooden (1969), who described greatertotal cranial and rostral length for M. tonkeanacompared to M. maurus. There are not anysignificant differences between M. tonkeana andthe hybrid group in the present study. The resultsfrom these formal univariate comparisons of adultvariation indicate that statistically significant differ-ences in phenotypic traits can exist among naturallyinterbreeding primate species taxa. It is importantto note, however, that significant correlations
349M.A. Schillaci et al. / Journal of Human Evolution 49 (2005) 335e369
Table 3
Descriptive statistics and estimates of heterosis/dysgenesis for the adult male samples1
Variable Taxon N Mean Median SD
Mass (kg) Hybrid 19 10.416 10.500 1.814
M. maurus 14 10.082 10.225 1.289
M. tonkeana 7 13.440 13.400 3.590
Parental mean 11.761
Heterosis(C)/dysgenesis (�): �11.44% (tZ�3.23, pZ 0.012)
Cranial length (cm) Hybrid 18 15.139 15.250 0.800
M. maurus 14 13.950 13.800 0.459
M. tonkeana 7 15.657 15.500 0.856
Parental mean 14.803
Heterosis(C)/dysgenesis (�): C2.27% (tZ 1.78, pZ 0.276)
Cranial vault length (cm) Hybrid 18 10.294 10.300 0.606
M. maurus 14 9.614 9.650 0.333
M. tonkeana 7 9.900 10.000 0.396
Parental mean 9.755
Heterosis(C)/dysgenesis (�): C5.53% (tZ 3.77, pZ 0.006)
Facial length (cm) Hybrid 19 6.789 6.900 0.722
M. maurus 14 6.561 6.500 0.299
M. tonkeana 7 7.426 7.400 0.383
Parental mean 6.994
Heterosis(C)/dysgenesis (�): �2.93% (tZ�1.24, pZ 0.696)
Bizygomatic breadth (cm) Hybrid 19 9.968 10.100 0.676
M. maurus 14 9.243 9.350 0.475
M. tonkeana 7 10.157 10.200 1.149
Parental mean 9.700
Heterosis(C)/dysgenesis (�): C2.76% (tZ 1.73, pZ 0.300)
Crownerump length (cm) Hybrid 19 56.005 55.500 2.902
M. maurus 14 49.865 49.300 2.470
M. tonkeana 7 57.230 58.000 5.420
Parental mean 53.548
Heterosis(C)/dysgenesis (�): C4.59% (tZ 3.69, pZ 0.006)
1 None of the variables deviated significantly (aZ 0.10) from normality for any of the taxonomic groupings based on KomolgoroveSmirnof tests. Heterosis/dysgenesis was estimated by dividing the difference between the hybrid and parental means by the parental
mean. Significance of heterosis/dysgenesis levels were determined by a one-sample t-test. One-tailed probabilities were adjusted using
a Bonferroni correction based on six comparisons. Significant probabilities are bolded.
among traits exist, and these comparisons can notbe considered entirely independent despite Bonfer-roni corrections (Table 5).
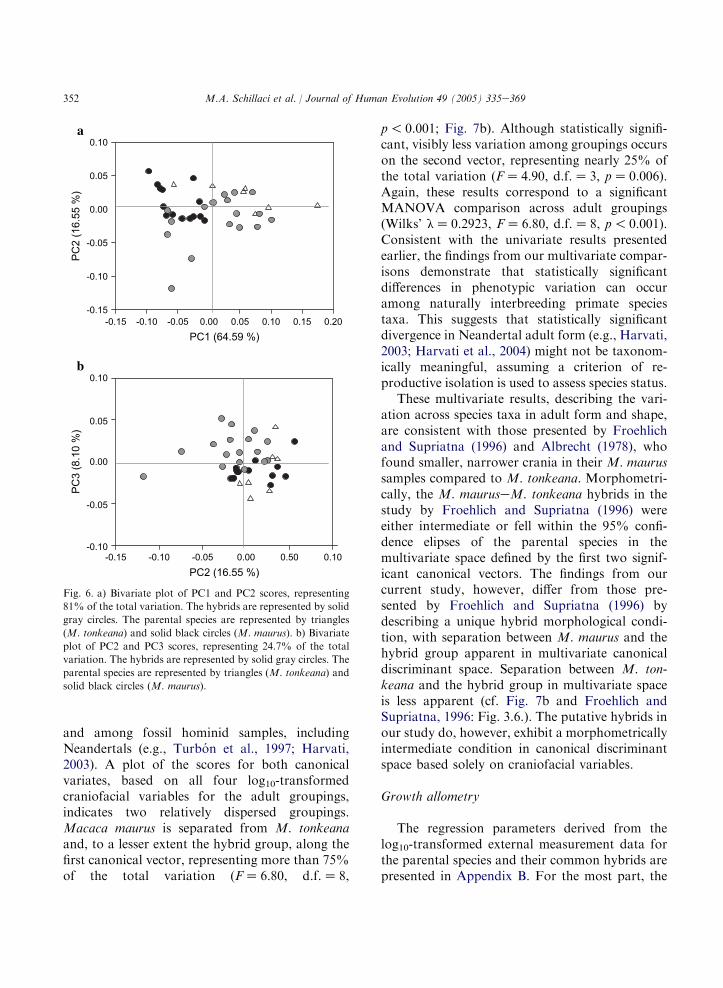
A bivariate plot of scores for PC1 and PC2,describing 81% of the total adult variation acrossall six log10-transformed variables, reveals visuallyoverlapping distributions in PC scores among thethree taxonomic groupings (Fig. 6a). Overlapbetween these two parental species in multivariatespace defined by the first two PCs derived fromcraniofacial measurements was also described by
Albrecht (1978). Unexpectedly, the score distribu-tions for the hybrid group and M. tonkeana areoffset marginally from the M. maurus distributionon PC1, representing primarily size and size-related shape variation, i.e., static adult sizeallometry (Fig. 6a). With the exception of cranialvault length, the eigenvector loadings for the firstcomponent all have similar positive loadings(Table 6). The loading for cranial vault length,although positive, is roughly half that of the othervariables, suggesting that the size of the cranial
350 M.A. Schillaci et al. / Journal of Human Evolution 49 (2005) 335e369
13.5
14.5
15.5
16.5Cranial length (cm)
b
10.0
12.0
14.0
16.0
Mass (kg)
Hybrids Mean M.maurus
a
d
9.4
9.8
10.2
10.6Cranial vault length (cm)
c
e
8.5
9.5
10.5
11.5 Bizygomatic breadth (cm)
47.5
52.5
62.5 Crown–rump length (cm)
57.5
f
M.tonkeana
Hybrids Mean M.maurus M.tonkeana
Hybrids Mean M.maurus M.tonkeana Hybrids Mean M.maurus M.tonkeana
6.3
6.9
7.5
Facial length (cm)
Hybrids Mean M.maurus M.tonkeana
Hybrids Mean M.maurus M.tonkeana
Fig. 5. Error bar plots describing the means and 95% CIs for all six variables for the adult hybrids and both parental taxa. The
midparental averages (Z Mean) without 95% CIs are also displayed.
vault relative to these other variables accounts formuch of the variation across individuals andspecies taxa. Results from the KruskaleWallistest indicate a significant difference across group-ings (p! 0.001) in scores for PC1 (Table 7).Subsequent pair-wise comparisons reveal differ-ences between the hybrid group and M. maurus(pZ 0.021) and between the two parental taxa
(pZ 0.030) in group averages for PC1 scores.These results suggest smaller overall size andrelative cranial vault size for the adult M. mauruswhen compared to the hybrid group and toM. tonkeana.
The putative hybrids can be differentiated fromM. maurus on PC2 and PC3, representing 24.7%of the total variation, with little overlap in the
351M.A. Schillaci et al. / Journal of Human Evolution 49 (2005) 335e369
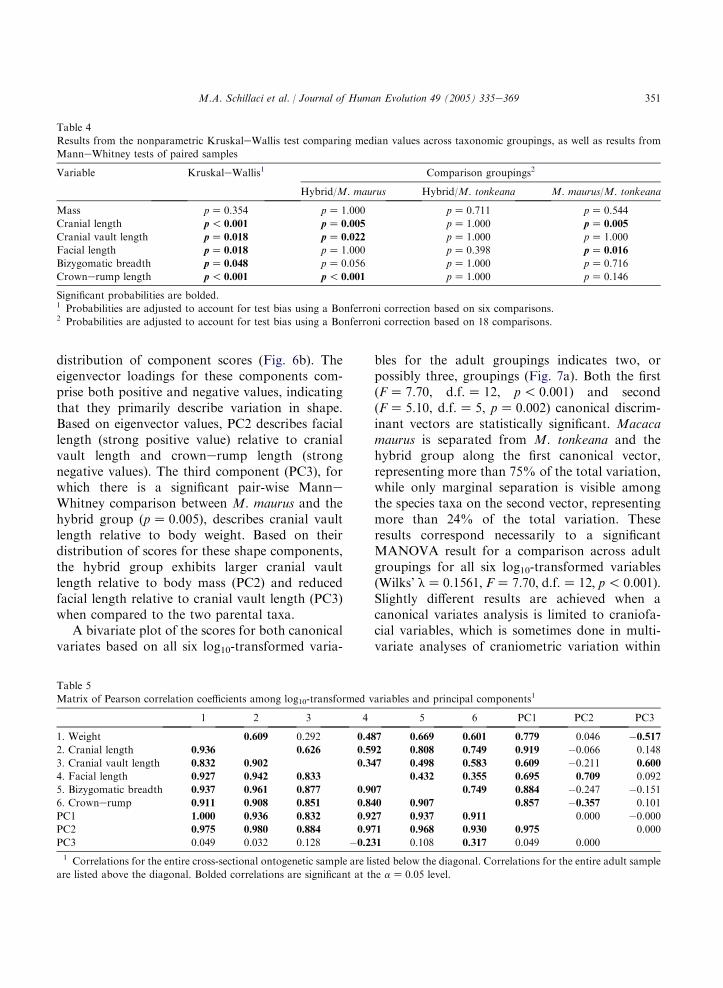
Table 4
Results from the nonparametric KruskaleWallis test comparing median values across taxonomic groupings, as well as results from
ManneWhitney tests of paired samples
Variable KruskaleWallis1 Comparison groupings2
Hybrid/M. maurus Hybrid/M. tonkeana M. maurus/M. tonkeana
Mass pZ 0.354 pZ 1.000 pZ 0.711 pZ 0.544
Cranial length p! 0.001 pZ 0.005 pZ 1.000 pZ 0.005
Cranial vault length pZ 0.018 pZ 0.022 pZ 1.000 pZ 1.000
Facial length pZ 0.018 pZ 1.000 pZ 0.398 pZ 0.016
Bizygomatic breadth pZ 0.048 pZ 0.056 pZ 1.000 pZ 0.716
Crownerump length p! 0.001 p! 0.001 pZ 1.000 pZ 0.146
Significant probabilities are bolded.1 Probabilities are adjusted to account for test bias using a Bonferroni correction based on six comparisons.2 Probabilities are adjusted to account for test bias using a Bonferroni correction based on 18 comparisons.
distribution of component scores (Fig. 6b). Theeigenvector loadings for these components com-prise both positive and negative values, indicatingthat they primarily describe variation in shape.Based on eigenvector values, PC2 describes faciallength (strong positive value) relative to cranialvault length and crownerump length (strongnegative values). The third component (PC3), forwhich there is a significant pair-wise ManneWhitney comparison between M. maurus and thehybrid group (pZ 0.005), describes cranial vaultlength relative to body weight. Based on theirdistribution of scores for these shape components,the hybrid group exhibits larger cranial vaultlength relative to body mass (PC2) and reducedfacial length relative to cranial vault length (PC3)when compared to the two parental taxa.
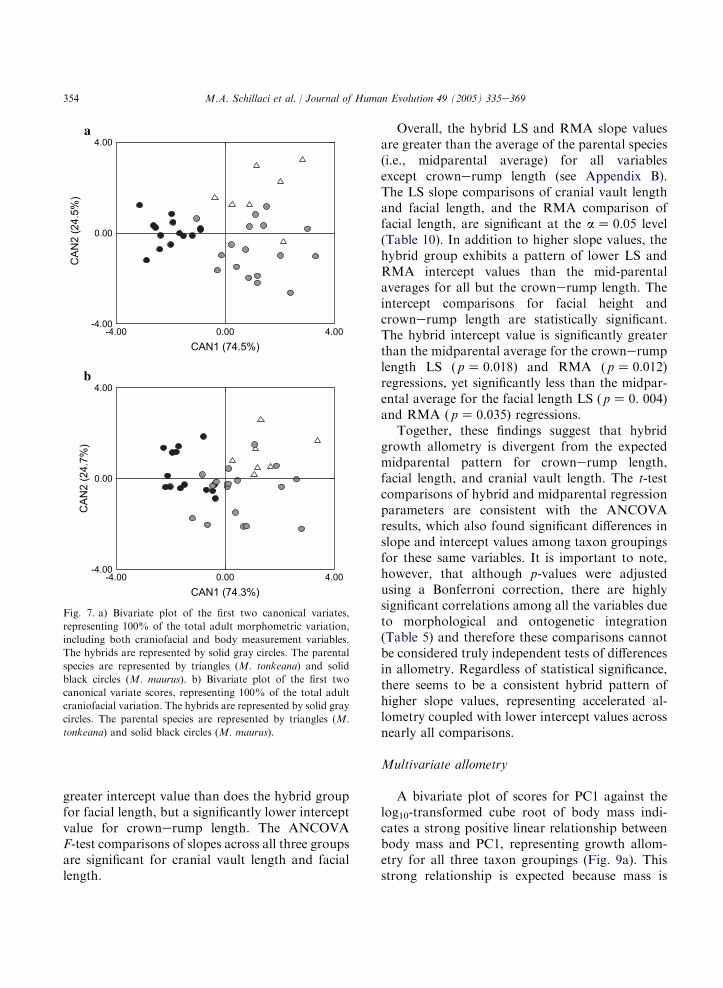
A bivariate plot of the scores for both canonicalvariates based on all six log10-transformed varia-
bles for the adult groupings indicates two, orpossibly three, groupings (Fig. 7a). Both the first(FZ 7.70, d.f.Z 12, p! 0.001) and second(FZ 5.10, d.f.Z 5, pZ 0.002) canonical discrim-inant vectors are statistically significant. Macacamaurus is separated from M. tonkeana and thehybrid group along the first canonical vector,representing more than 75% of the total variation,while only marginal separation is visible amongthe species taxa on the second vector, representingmore than 24% of the total variation. Theseresults correspond necessarily to a significantMANOVA result for a comparison across adultgroupings for all six log10-transformed variables(Wilks’ lZ 0.1561, FZ 7.70, d.f.Z 12, p! 0.001).Slightly different results are achieved when acanonical variates analysis is limited to craniofa-cial variables, which is sometimes done in multi-variate analyses of craniometric variation within
Table 5
Matrix of Pearson correlation coefficients among log10-transformed variables and principal components1
1 2 3 4 5 6 PC1 PC2 PC3
1. Weight 0.609 0.292 0.487 0.669 0.601 0.779 0.046 �0.517
2. Cranial length 0.936 0.626 0.592 0.808 0.749 0.919 �0.066 0.148
3. Cranial vault length 0.832 0.902 0.347 0.498 0.583 0.609 �0.211 0.600
4. Facial length 0.927 0.942 0.833 0.432 0.355 0.695 0.709 0.092
5. Bizygomatic breadth 0.937 0.961 0.877 0.907 0.749 0.884 �0.247 �0.151
6. Crownerump 0.911 0.908 0.851 0.840 0.907 0.857 �0.357 0.101
PC1 1.000 0.936 0.832 0.927 0.937 0.911 0.000 �0.000
PC2 0.975 0.980 0.884 0.971 0.968 0.930 0.975 0.000
PC3 0.049 0.032 0.128 �0.231 0.108 0.317 0.049 0.000
1 Correlations for the entire cross-sectional ontogenetic sample are listed below the diagonal. Correlations for the entire adult sample
are listed above the diagonal. Bolded correlations are significant at the aZ 0.05 level.
352 M.A. Schillaci et al. / Journal of Human Evolution 49 (2005) 335e369
and among fossil hominid samples, includingNeandertals (e.g., Turbon et al., 1997; Harvati,2003). A plot of the scores for both canonicalvariates, based on all four log10-transformedcraniofacial variables for the adult groupings,indicates two relatively dispersed groupings.Macaca maurus is separated from M. tonkeanaand, to a lesser extent the hybrid group, along thefirst canonical vector, representing more than 75%of the total variation (FZ 6.80, d.f.Z 8,
a
-0.15
-0.10
-0.05
0.00
0.05
0.10
-0.15 -0.10 -0.05 0.00 0.05 0.10 0.15 0.20PC1 (64.59 %)
PC2
(16.
55 %
)
-0.10
-0.05
0.00
0.05
0.10
-0.15 -0.10 -0.05 0.00 0.50 0.10PC2 (16.55 %)
PC3
(8.1
0 %
)
b
Fig. 6. a) Bivariate plot of PC1 and PC2 scores, representing
81% of the total variation. The hybrids are represented by solid
gray circles. The parental species are represented by triangles
(M. tonkeana) and solid black circles (M. maurus). b) Bivariate
plot of PC2 and PC3 scores, representing 24.7% of the total
variation. The hybrids are represented by solid gray circles. The
parental species are represented by triangles (M. tonkeana) and
solid black circles (M. maurus).
p! 0.001; Fig. 7b). Although statistically signifi-cant, visibly less variation among groupings occurson the second vector, representing nearly 25% ofthe total variation (FZ 4.90, d.f.Z 3, pZ 0.006).Again, these results correspond to a significantMANOVA comparison across adult groupings(Wilks’ lZ 0.2923, FZ 6.80, d.f.Z 8, p! 0.001).Consistent with the univariate results presentedearlier, the findings from our multivariate compar-isons demonstrate that statistically significantdifferences in phenotypic variation can occuramong naturally interbreeding primate speciestaxa. This suggests that statistically significantdivergence in Neandertal adult form (e.g., Harvati,2003; Harvati et al., 2004) might not be taxonom-ically meaningful, assuming a criterion of re-productive isolation is used to assess species status.
These multivariate results, describing the vari-ation across species taxa in adult form and shape,are consistent with those presented by Froehlichand Supriatna (1996) and Albrecht (1978), whofound smaller, narrower crania in their M. maurussamples compared to M. tonkeana. Morphometri-cally, the M. mauruseM. tonkeana hybrids in thestudy by Froehlich and Supriatna (1996) wereeither intermediate or fell within the 95% confi-dence elipses of the parental species in themultivariate space defined by the first two signif-icant canonical vectors. The findings from ourcurrent study, however, differ from those pre-sented by Froehlich and Supriatna (1996) bydescribing a unique hybrid morphological condi-tion, with separation between M. maurus and thehybrid group apparent in multivariate canonicaldiscriminant space. Separation between M. ton-keana and the hybrid group in multivariate spaceis less apparent (cf. Fig. 7b and Froehlich andSupriatna, 1996: Fig. 3.6.). The putative hybrids inour study do, however, exhibit a morphometricallyintermediate condition in canonical discriminantspace based solely on craniofacial variables.
Growth allometry
The regression parameters derived from thelog10-transformed external measurement data forthe parental species and their common hybrids arepresented in Appendix B. For the most part, the
353M.A. Schillaci et al. / Journal of Human Evolution 49 (2005) 335e369
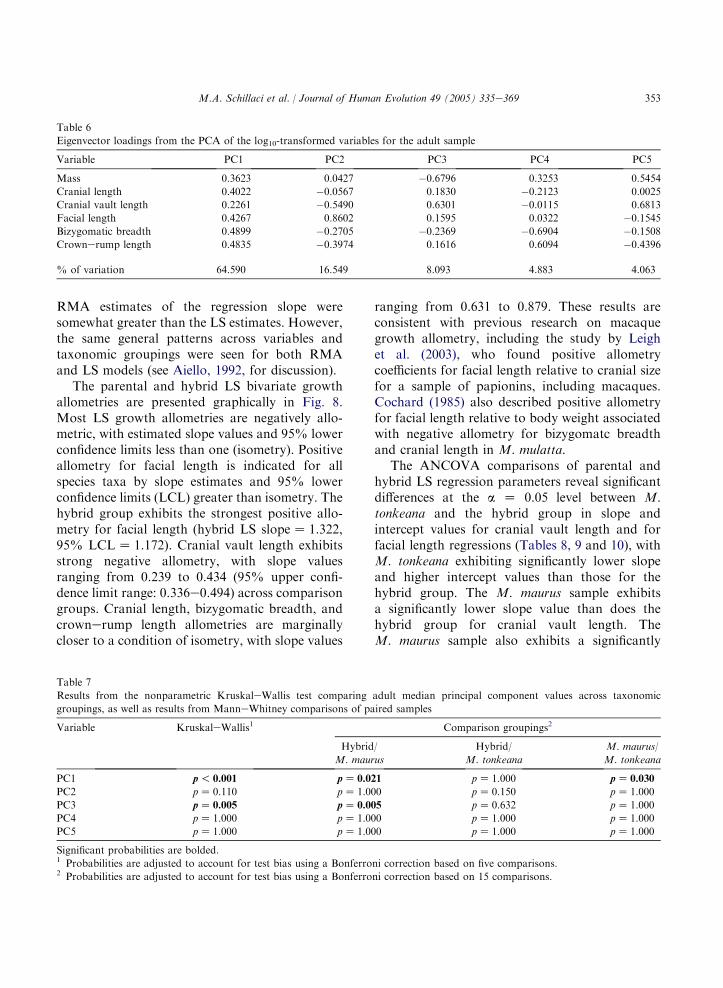
Table 6
Eigenvector loadings from the PCA of the log10-transformed variables for the adult sample
Variable PC1 PC2 PC3 PC4 PC5
Mass 0.3623 0.0427 �0.6796 0.3253 0.5454
Cranial length 0.4022 �0.0567 0.1830 �0.2123 0.0025
Cranial vault length 0.2261 �0.5490 0.6301 �0.0115 0.6813
Facial length 0.4267 0.8602 0.1595 0.0322 �0.1545
Bizygomatic breadth 0.4899 �0.2705 �0.2369 �0.6904 �0.1508
Crownerump length 0.4835 �0.3974 0.1616 0.6094 �0.4396
% of variation 64.590 16.549 8.093 4.883 4.063
RMA estimates of the regression slope weresomewhat greater than the LS estimates. However,the same general patterns across variables andtaxonomic groupings were seen for both RMAand LS models (see Aiello, 1992, for discussion).
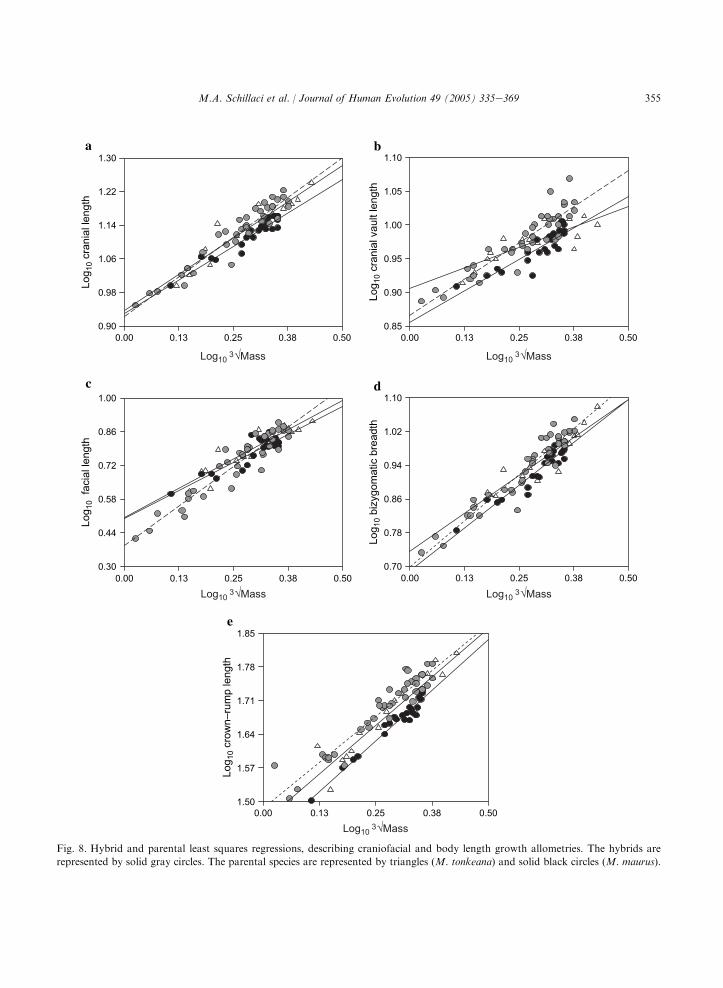
The parental and hybrid LS bivariate growthallometries are presented graphically in Fig. 8.Most LS growth allometries are negatively allo-metric, with estimated slope values and 95% lowerconfidence limits less than one (isometry). Positiveallometry for facial length is indicated for allspecies taxa by slope estimates and 95% lowerconfidence limits (LCL) greater than isometry. Thehybrid group exhibits the strongest positive allo-metry for facial length (hybrid LS slopeZ 1.322,95% LCLZ 1.172). Cranial vault length exhibitsstrong negative allometry, with slope valuesranging from 0.239 to 0.434 (95% upper confi-dence limit range: 0.336e0.494) across comparisongroups. Cranial length, bizygomatic breadth, andcrownerump length allometries are marginallycloser to a condition of isometry, with slope values
ranging from 0.631 to 0.879. These results areconsistent with previous research on macaquegrowth allometry, including the study by Leighet al. (2003), who found positive allometrycoefficients for facial length relative to cranial sizefor a sample of papionins, including macaques.Cochard (1985) also described positive allometryfor facial length relative to body weight associatedwith negative allometry for bizygomatc breadthand cranial length in M. mulatta.
The ANCOVA comparisons of parental andhybrid LS regression parameters reveal significantdifferences at the a Z 0.05 level between M.tonkeana and the hybrid group in slope andintercept values for cranial vault length and forfacial length regressions (Tables 8, 9 and 10), withM. tonkeana exhibiting significantly lower slopeand higher intercept values than those for thehybrid group. The M. maurus sample exhibitsa significantly lower slope value than does thehybrid group for cranial vault length. TheM. maurus sample also exhibits a significantly
Table 7
Results from the nonparametric KruskaleWallis test comparing adult median principal component values across taxonomic
groupings, as well as results from ManneWhitney comparisons of paired samples
Variable KruskaleWallis1 Comparison groupings2
Hybrid/
M. maurus
Hybrid/
M. tonkeana
M. maurus/
M. tonkeana
PC1 p! 0.001 pZ 0.021 pZ 1.000 pZ 0.030
PC2 pZ 0.110 pZ 1.000 pZ 0.150 pZ 1.000
PC3 pZ 0.005 pZ 0.005 pZ 0.632 pZ 1.000
PC4 pZ 1.000 pZ 1.000 pZ 1.000 pZ 1.000
PC5 pZ 1.000 pZ 1.000 pZ 1.000 pZ 1.000
Significant probabilities are bolded.1 Probabilities are adjusted to account for test bias using a Bonferroni correction based on five comparisons.2 Probabilities are adjusted to account for test bias using a Bonferroni correction based on 15 comparisons.
354 M.A. Schillaci et al. / Journal of Human Evolution 49 (2005) 335e369
greater intercept value than does the hybrid groupfor facial length, but a significantly lower interceptvalue for crownerump length. The ANCOVAF-test comparisons of slopes across all three groupsare significant for cranial vault length and faciallength.
a
-4.00
0.00
4.00
-4.00
0.00
4.00
-4.00 0.00 4.00CAN1 (74.5%)
-4.00 0.00 4.00CAN1 (74.3%)
CAN
2 (2
4.5%
)
b
CAN
2 (2
4.7%
)
Fig. 7. a) Bivariate plot of the first two canonical variates,
representing 100% of the total adult morphometric variation,
including both craniofacial and body measurement variables.
The hybrids are represented by solid gray circles. The parental
species are represented by triangles (M. tonkeana) and solid
black circles (M. maurus). b) Bivariate plot of the first two
canonical variate scores, representing 100% of the total adult
craniofacial variation. The hybrids are represented by solid gray
circles. The parental species are represented by triangles (M.
tonkeana) and solid black circles (M. maurus).
Overall, the hybrid LS and RMA slope valuesare greater than the average of the parental species(i.e., midparental average) for all variablesexcept crownerump length (see Appendix B).The LS slope comparisons of cranial vault lengthand facial length, and the RMA comparison offacial length, are significant at the aZ 0.05 level(Table 10). In addition to higher slope values, thehybrid group exhibits a pattern of lower LS andRMA intercept values than the mid-parentalaverages for all but the crownerump length. Theintercept comparisons for facial height andcrownerump length are statistically significant.The hybrid intercept value is significantly greaterthan the midparental average for the crownerumplength LS ( pZ 0.018) and RMA ( pZ 0.012)regressions, yet significantly less than the midpar-ental average for the facial length LS ( pZ 0. 004)and RMA ( pZ 0.035) regressions.
Together, these findings suggest that hybridgrowth allometry is divergent from the expectedmidparental pattern for crownerump length,facial length, and cranial vault length. The t-testcomparisons of hybrid and midparental regressionparameters are consistent with the ANCOVAresults, which also found significant differences inslope and intercept values among taxon groupingsfor these same variables. It is important to note,however, that although p-values were adjustedusing a Bonferroni correction, there are highlysignificant correlations among all the variables dueto morphological and ontogenetic integration(Table 5) and therefore these comparisons cannotbe considered truly independent tests of differencesin allometry. Regardless of statistical significance,there seems to be a consistent hybrid pattern ofhigher slope values, representing accelerated al-lometry coupled with lower intercept values acrossnearly all comparisons.
Multivariate allometry
A bivariate plot of scores for PC1 against thelog10-transformed cube root of body mass indi-cates a strong positive linear relationship betweenbody mass and PC1, representing growth allom-etry for all three taxon groupings (Fig. 9a). Thisstrong relationship is expected because mass is
355M.A. Schillaci et al. / Journal of Human Evolution 49 (2005) 335e369
a
0.70
0.78
0.86
0.94
1.02
1.10
0.00 0.13 0.25 0.38 0.50
Log 1
0 bi
zygo
mat
ic b
read
thd
0.85
0.90
0.95
1.00
1.05
1.10
0.00 0.13 0.25 0.38 0.50
Log 1
0 cr
ania
l vau
lt le
ngth
b
0.90
0.98
1.06
1.14
1.22
1.30
0.00 0.13 0.25 0.38 0.50
Log 1
0 cr
ania
l len
gth
0.30
0.44
0.58
0.72
0.86
1.00
0.00 0.13 0.25 0.38 0.50
Log 1
0 fa
cial
leng
th
c
1.50
1.57
1.64
1.71
1.78
1.85
0.00 0.13 0.25 0.38 0.50
Log 1
0 cr
own–
rum
p le
ngth
e
Fig. 8. Hybrid and parental least squares regressions, describing craniofacial and body length growth allometries. The hybrids are
represented by solid gray circles. The parental species are represented by triangles (M. tonkeana) and solid black circles (M. maurus).
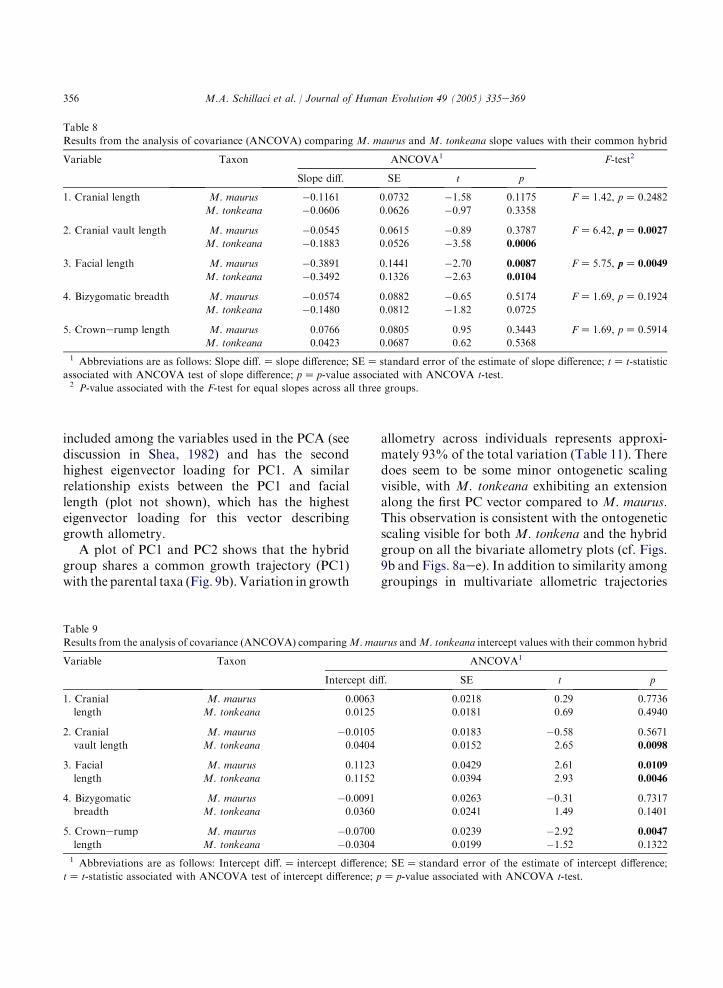
356 M.A. Schillaci et al. / Journal of Human Evolution 49 (2005) 335e369
Table 8
Results from the analysis of covariance (ANCOVA) comparing M. maurus and M. tonkeana slope values with their common hybrid
Variable Taxon ANCOVA1 F-test2
Slope diff. SE t p
1. Cranial length M. maurus �0.1161 0.0732 �1.58 0.1175 FZ 1.42, pZ 0.2482
M. tonkeana �0.0606 0.0626 �0.97 0.3358
2. Cranial vault length M. maurus �0.0545 0.0615 �0.89 0.3787 FZ 6.42, pZ 0.0027
M. tonkeana �0.1883 0.0526 �3.58 0.0006
3. Facial length M. maurus �0.3891 0.1441 �2.70 0.0087 FZ 5.75, pZ 0.0049
M. tonkeana �0.3492 0.1326 �2.63 0.0104
4. Bizygomatic breadth M. maurus �0.0574 0.0882 �0.65 0.5174 FZ 1.69, pZ 0.1924
M. tonkeana �0.1480 0.0812 �1.82 0.0725
5. Crownerump length M. maurus 0.0766 0.0805 0.95 0.3443 FZ 1.69, pZ 0.5914
M. tonkeana 0.0423 0.0687 0.62 0.5368
1 Abbreviations are as follows: Slope diff.Z slope difference; SEZ standard error of the estimate of slope difference; tZ t-statistic
associated with ANCOVA test of slope difference; pZ p-value associated with ANCOVA t-test.2 P-value associated with the F-test for equal slopes across all three groups.
included among the variables used in the PCA (seediscussion in Shea, 1982) and has the secondhighest eigenvector loading for PC1. A similarrelationship exists between the PC1 and faciallength (plot not shown), which has the highesteigenvector loading for this vector describinggrowth allometry.
A plot of PC1 and PC2 shows that the hybridgroup shares a common growth trajectory (PC1)with the parental taxa (Fig. 9b). Variation in growth
allometry across individuals represents approxi-mately 93% of the total variation (Table 11). Theredoes seem to be some minor ontogenetic scalingvisible, with M. tonkeana exhibiting an extensionalong the first PC vector compared to M. maurus.This observation is consistent with the ontogeneticscaling visible for both M. tonkena and the hybridgroup on all the bivariate allometry plots (cf. Figs.9b and Figs. 8aee). In addition to similarity amonggroupings in multivariate allometric trajectories
Table 9
Results from the analysis of covariance (ANCOVA) comparingM. maurus andM. tonkeana intercept values with their common hybrid
Variable Taxon ANCOVA1
Intercept diff. SE t p
1. Cranial
length
M. maurus 0.0063 0.0218 0.29 0.7736
M. tonkeana 0.0125 0.0181 0.69 0.4940
2. Cranial
vault length
M. maurus �0.0105 0.0183 �0.58 0.5671
M. tonkeana 0.0404 0.0152 2.65 0.0098
3. Facial
length
M. maurus 0.1123 0.0429 2.61 0.0109
M. tonkeana 0.1152 0.0394 2.93 0.0046
4. Bizygomatic
breadth
M. maurus �0.0091 0.0263 �0.31 0.7317
M. tonkeana 0.0360 0.0241 1.49 0.1401
5. Crownerump
length
M. maurus �0.0700 0.0239 �2.92 0.0047
M. tonkeana �0.0304 0.0199 �1.52 0.1322
1 Abbreviations are as follows: Intercept diff.Z intercept difference; SEZ standard error of the estimate of intercept difference;
tZ t-statistic associated with ANCOVA test of intercept difference; pZ p-value associated with ANCOVA t-test.
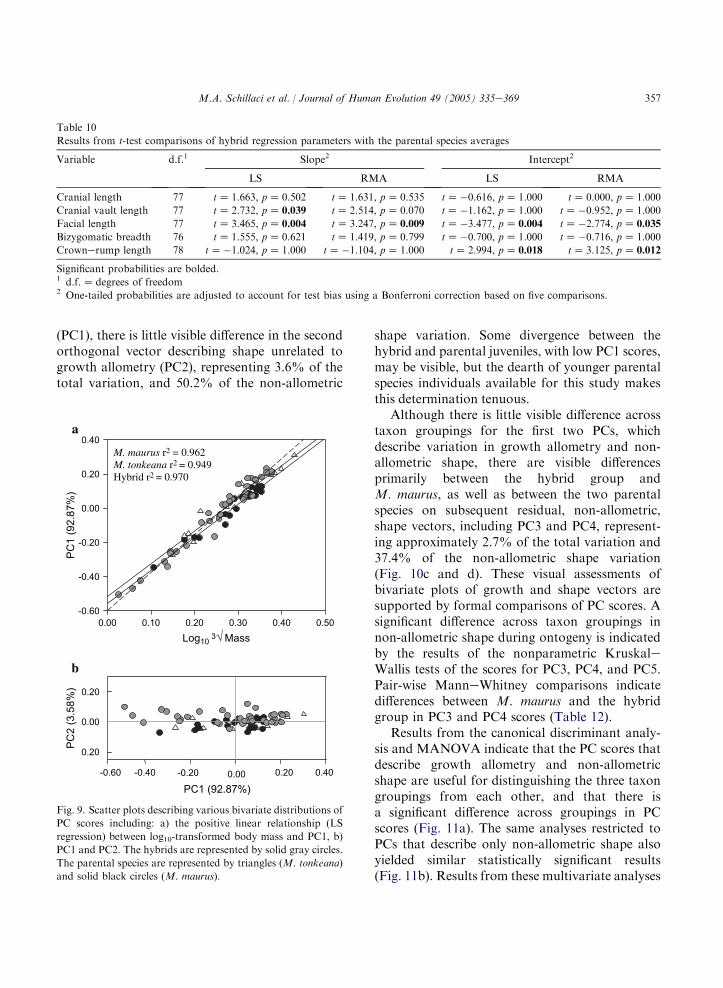
357M.A. Schillaci et al. / Journal of Human Evolution 49 (2005) 335e369
Table 10
Results from t-test comparisons of hybrid regression parameters with the parental species averages
Variable d.f.1 Slope2 Intercept2
LS RMA LS RMA
Cranial length 77 tZ 1.663, pZ 0.502 tZ 1.631, pZ 0.535 tZ�0.616, pZ 1.000 tZ 0.000, pZ 1.000
Cranial vault length 77 tZ 2.732, pZ 0.039 tZ 2.514, pZ 0.070 tZ�1.162, pZ 1.000 tZ�0.952, pZ 1.000
Facial length 77 tZ 3.465, pZ 0.004 tZ 3.247, pZ 0.009 tZ�3.477, pZ 0.004 tZ�2.774, pZ 0.035
Bizygomatic breadth 76 tZ 1.555, pZ 0.621 tZ 1.419, pZ 0.799 tZ�0.700, pZ 1.000 tZ�0.716, pZ 1.000
Crownerump length 78 tZ�1.024, pZ 1.000 tZ�1.104, pZ 1.000 tZ 2.994, pZ 0.018 tZ 3.125, pZ 0.012
Significant probabilities are bolded.1 d.f.Z degrees of freedom2 One-tailed probabilities are adjusted to account for test bias using a Bonferroni correction based on five comparisons.
(PC1), there is little visible difference in the secondorthogonal vector describing shape unrelated togrowth allometry (PC2), representing 3.6% of thetotal variation, and 50.2% of the non-allometric
-0.60
-0.40
-0.20
0.00
0.20
0.40
0.00 0.10 0.20 0.30 0.40 0.50Log10 3 Mass
PC1
(92.
87%
)
M. maurus r2 = 0.962 M. tonkeana r2 = 0.949 Hybrid r2 = 0.970
a
b
0.00
0.20
-0.60 -0.40 0.00 0.20
PC1 (92.87%)
PC2
(3.5
8%)
0.20
-0.20 0.40
Fig. 9. Scatter plots describing various bivariate distributions of
PC scores including: a) the positive linear relationship (LS
regression) between log10-transformed body mass and PC1, b)
PC1 and PC2. The hybrids are represented by solid gray circles.
The parental species are represented by triangles (M. tonkeana)
and solid black circles (M. maurus).
shape variation. Some divergence between thehybrid and parental juveniles, with low PC1 scores,may be visible, but the dearth of younger parentalspecies individuals available for this study makesthis determination tenuous.
Although there is little visible difference acrosstaxon groupings for the first two PCs, whichdescribe variation in growth allometry and non-allometric shape, there are visible differencesprimarily between the hybrid group andM. maurus, as well as between the two parentalspecies on subsequent residual, non-allometric,shape vectors, including PC3 and PC4, represent-ing approximately 2.7% of the total variation and37.4% of the non-allometric shape variation(Fig. 10c and d). These visual assessments ofbivariate plots of growth and shape vectors aresupported by formal comparisons of PC scores. Asignificant difference across taxon groupings innon-allometric shape during ontogeny is indicatedby the results of the nonparametric KruskaleWallis tests of the scores for PC3, PC4, and PC5.Pair-wise ManneWhitney comparisons indicatedifferences between M. maurus and the hybridgroup in PC3 and PC4 scores (Table 12).
Results from the canonical discriminant analy-sis and MANOVA indicate that the PC scores thatdescribe growth allometry and non-allometricshape are useful for distinguishing the three taxongroupings from each other, and that there isa significant difference across groupings in PCscores (Fig. 11a). The same analyses restricted toPCs that describe only non-allometric shape alsoyielded similar statistically significant results(Fig. 11b). Results from these multivariate analyses
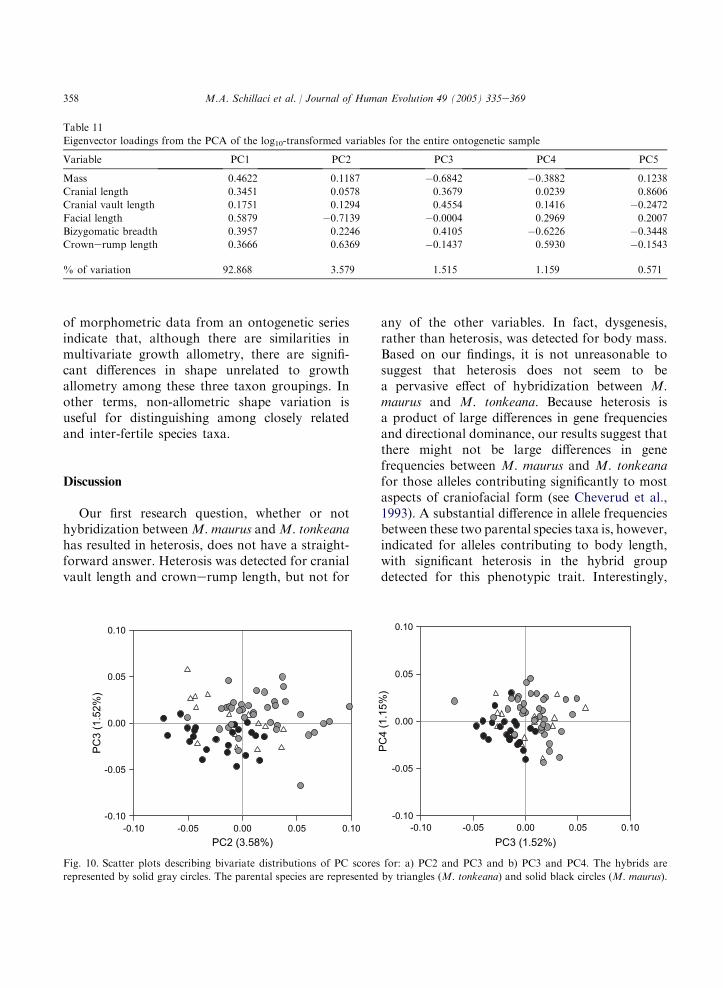
358 M.A. Schillaci et al. / Journal of Human Evolution 49 (2005) 335e369
Table 11
Eigenvector loadings from the PCA of the log10-transformed variables for the entire ontogenetic sample
Variable PC1 PC2 PC3 PC4 PC5
Mass 0.4622 0.1187 �0.6842 �0.3882 0.1238
Cranial length 0.3451 0.0578 0.3679 0.0239 0.8606
Cranial vault length 0.1751 0.1294 0.4554 0.1416 �0.2472
Facial length 0.5879 �0.7139 �0.0004 0.2969 0.2007
Bizygomatic breadth 0.3957 0.2246 0.4105 �0.6226 �0.3448
Crownerump length 0.3666 0.6369 �0.1437 0.5930 �0.1543
% of variation 92.868 3.579 1.515 1.159 0.571
of morphometric data from an ontogenetic seriesindicate that, although there are similarities inmultivariate growth allometry, there are signifi-cant differences in shape unrelated to growthallometry among these three taxon groupings. Inother terms, non-allometric shape variation isuseful for distinguishing among closely relatedand inter-fertile species taxa.
Discussion
Our first research question, whether or nothybridization betweenM. maurus andM. tonkeanahas resulted in heterosis, does not have a straight-forward answer. Heterosis was detected for cranialvault length and crownerump length, but not for
any of the other variables. In fact, dysgenesis,rather than heterosis, was detected for body mass.Based on our findings, it is not unreasonable tosuggest that heterosis does not seem to bea pervasive effect of hybridization between M.maurus and M. tonkeana. Because heterosis isa product of large differences in gene frequenciesand directional dominance, our results suggest thatthere might not be large differences in genefrequencies between M. maurus and M. tonkeanafor those alleles contributing significantly to mostaspects of craniofacial form (see Cheverud et al.,1993). A substantial difference in allele frequenciesbetween these two parental species taxa is, however,indicated for alleles contributing to body length,with significant heterosis in the hybrid groupdetected for this phenotypic trait. Interestingly,
-0.10
-0.05
0.00
0.05
0.10
-0.10
-0.05
0.00
0.05
0.10
-0.05-0.10 0.00 0.05 0.10
PC3
(1.5
2%)
-0.10 -0.05 0.00 0.05 0.10
PC4
(1.1
5%)
PC3 (1.52%)PC2 (3.58%)
Fig. 10. Scatter plots describing bivariate distributions of PC scores for: a) PC2 and PC3 and b) PC3 and PC4. The hybrids are
represented by solid gray circles. The parental species are represented by triangles (M. tonkeana) and solid black circles (M. maurus).
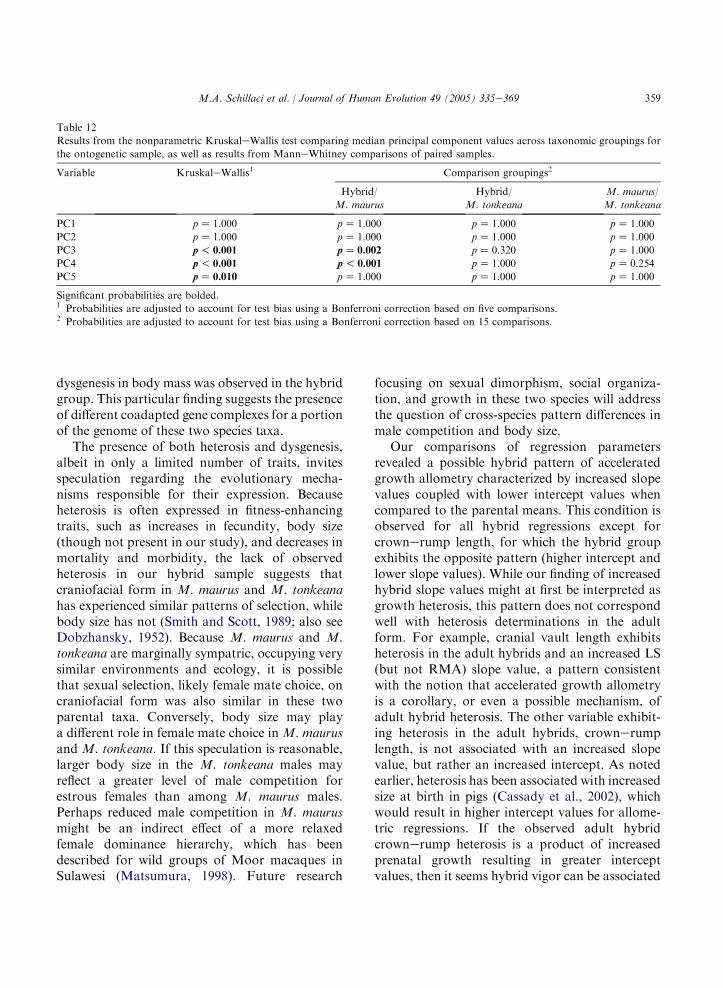
359M.A. Schillaci et al. / Journal of Human Evolution 49 (2005) 335e369
Table 12
Results from the nonparametric KruskaleWallis test comparing median principal component values across taxonomic groupings for
the ontogenetic sample, as well as results from ManneWhitney comparisons of paired samples.
Variable KruskaleWallis1 Comparison groupings2
Hybrid/
M. maurus
Hybrid/
M. tonkeana
M. maurus/
M. tonkeana
PC1 pZ 1.000 pZ 1.000 pZ 1.000 pZ 1.000
PC2 pZ 1.000 pZ 1.000 pZ 1.000 pZ 1.000
PC3 p! 0.001 pZ 0.002 pZ 0.320 pZ 1.000
PC4 p! 0.001 p! 0.001 pZ 1.000 pZ 0.254
PC5 pZ 0.010 pZ 1.000 pZ 1.000 pZ 1.000
Significant probabilities are bolded.1 Probabilities are adjusted to account for test bias using a Bonferroni correction based on five comparisons.2 Probabilities are adjusted to account for test bias using a Bonferroni correction based on 15 comparisons.
dysgenesis in body mass was observed in the hybridgroup. This particular finding suggests the presenceof different coadapted gene complexes for a portionof the genome of these two species taxa.
The presence of both heterosis and dysgenesis,albeit in only a limited number of traits, invitesspeculation regarding the evolutionary mecha-nisms responsible for their expression. Becauseheterosis is often expressed in fitness-enhancingtraits, such as increases in fecundity, body size(though not present in our study), and decreases inmortality and morbidity, the lack of observedheterosis in our hybrid sample suggests thatcraniofacial form in M. maurus and M. tonkeanahas experienced similar patterns of selection, whilebody size has not (Smith and Scott, 1989; also seeDobzhansky, 1952). Because M. maurus and M.tonkeana are marginally sympatric, occupying verysimilar environments and ecology, it is possiblethat sexual selection, likely female mate choice, oncraniofacial form was also similar in these twoparental taxa. Conversely, body size may playa different role in female mate choice in M. maurusand M. tonkeana. If this speculation is reasonable,larger body size in the M. tonkeana males mayreflect a greater level of male competition forestrous females than among M. maurus males.Perhaps reduced male competition in M. maurusmight be an indirect effect of a more relaxedfemale dominance hierarchy, which has beendescribed for wild groups of Moor macaques inSulawesi (Matsumura, 1998). Future research
focusing on sexual dimorphism, social organiza-tion, and growth in these two species will addressthe question of cross-species pattern differences inmale competition and body size.
Our comparisons of regression parametersrevealed a possible hybrid pattern of acceleratedgrowth allometry characterized by increased slopevalues coupled with lower intercept values whencompared to the parental means. This condition isobserved for all hybrid regressions except forcrownerump length, for which the hybrid groupexhibits the opposite pattern (higher intercept andlower slope values). While our finding of increasedhybrid slope values might at first be interpreted asgrowth heterosis, this pattern does not correspondwell with heterosis determinations in the adultform. For example, cranial vault length exhibitsheterosis in the adult hybrids and an increased LS(but not RMA) slope value, a pattern consistentwith the notion that accelerated growth allometryis a corollary, or even a possible mechanism, ofadult hybrid heterosis. The other variable exhibit-ing heterosis in the adult hybrids, crownerumplength, is not associated with an increased slopevalue, but rather an increased intercept. As notedearlier, heterosis has been associated with increasedsize at birth in pigs (Cassady et al., 2002), whichwould result in higher intercept values for allome-tric regressions. If the observed adult hybridcrownerump heterosis is a product of increasedprenatal growth resulting in greater interceptvalues, then it seems hybrid vigor can be associated
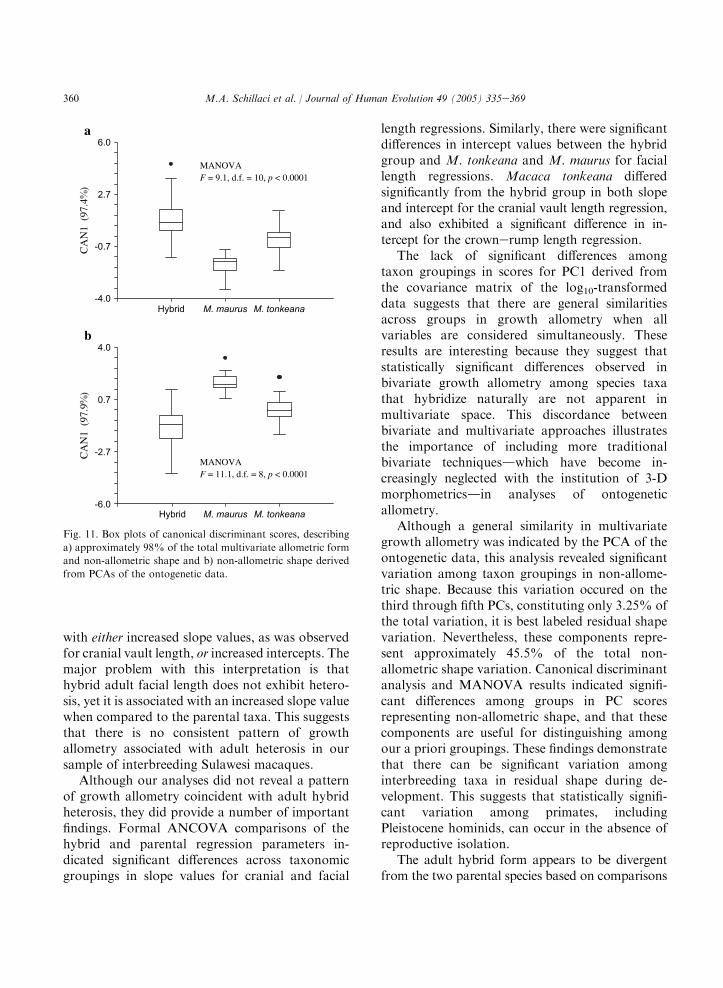
360 M.A. Schillaci et al. / Journal of Human Evolution 49 (2005) 335e369
with either increased slope values, as was observedfor cranial vault length, or increased intercepts. Themajor problem with this interpretation is thathybrid adult facial length does not exhibit hetero-sis, yet it is associated with an increased slope valuewhen compared to the parental taxa. This suggeststhat there is no consistent pattern of growthallometry associated with adult heterosis in oursample of interbreeding Sulawesi macaques.
Although our analyses did not reveal a patternof growth allometry coincident with adult hybridheterosis, they did provide a number of importantfindings. Formal ANCOVA comparisons of thehybrid and parental regression parameters in-dicated significant differences across taxonomicgroupings in slope values for cranial and facial
-4.0
-0.7
2.7
6.0
MANOVA F = 9.1, d.f. = 10, p < 0.0001
Hybrid M. maurus M. tonkeana
-6.0
-2.7
0.7
4.0
MANOVA F = 11.1, d.f. = 8, p < 0.0001
M. maurus M. tonkeanaHybrid
b
a
CA
N1
(97
.4
)C
AN
1 (
97.9
)
Fig. 11. Box plots of canonical discriminant scores, describing
a) approximately 98% of the total multivariate allometric form
and non-allometric shape and b) non-allometric shape derived
from PCAs of the ontogenetic data.
length regressions. Similarly, there were significantdifferences in intercept values between the hybridgroup and M. tonkeana and M. maurus for faciallength regressions. Macaca tonkeana differedsignificantly from the hybrid group in both slopeand intercept for the cranial vault length regression,and also exhibited a significant difference in in-tercept for the crownerump length regression.
The lack of significant differences amongtaxon groupings in scores for PC1 derived fromthe covariance matrix of the log10-transformeddata suggests that there are general similaritiesacross groups in growth allometry when allvariables are considered simultaneously. Theseresults are interesting because they suggest thatstatistically significant differences observed inbivariate growth allometry among species taxathat hybridize naturally are not apparent inmultivariate space. This discordance betweenbivariate and multivariate approaches illustratesthe importance of including more traditionalbivariate techniquesdwhich have become in-creasingly neglected with the institution of 3-Dmorphometricsdin analyses of ontogeneticallometry.
Although a general similarity in multivariategrowth allometry was indicated by the PCA of theontogenetic data, this analysis revealed significantvariation among taxon groupings in non-allome-tric shape. Because this variation occured on thethird through fifth PCs, constituting only 3.25% ofthe total variation, it is best labeled residual shapevariation. Nevertheless, these components repre-sent approximately 45.5% of the total non-allometric shape variation. Canonical discriminantanalysis and MANOVA results indicated signifi-cant differences among groups in PC scoresrepresenting non-allometric shape, and that thesecomponents are useful for distinguishing amongour a priori groupings. These findings demonstratethat there can be significant variation amonginterbreeding taxa in residual shape during de-velopment. This suggests that statistically signifi-cant variation among primates, includingPleistocene hominids, can occur in the absence ofreproductive isolation.
The adult hybrid form appears to be divergentfrom the two parental species based on comparisons
361M.A. Schillaci et al. / Journal of Human Evolution 49 (2005) 335e369
of PC scores. There are significant differencesbetween M. maurus and M. tonkeana, and betweenM. maurus and the hybrid group, in PC1 scores,chiefly representing size and size-related shapevariation. There is also a significant differencebetween M. maurus and the hybrid group in PC3scores, representing shape. The results from thecanonical discriminant analysis also indicate signif-icant differences across taxon groupings in adultform, including craniofacial form, despite inter-breeding among species taxa.
The divergence of adult hybrid form is some-what unexpected given the fact that most of thehybrid growth allometries are not significantlydifferent from the parental conditions. It seems,therefore, that among these species taxa ofSulawesi macaques, significant differences in adultshape are associated with only small differences ingrowth allometry. Our finding is consistent withAlberch et al.’s (1979: 315) claim that ‘‘[M]anyelements of morphological evolution can beinterpreted asminor reshuffling within a fundamen-tal developmental program during phylogenesis’’(emphasis added). This same conclusion wasechoed recently by Lieberman et al. (2004: 298),who suggested that the origin of modern humancraniofacial form likely occurred through a fewontogenetically early shifts in craniofacial devel-opment, rather than large scale evolutionaryevents comprising many independent changes.
Limitations to the research
The results of this study of the effects ofhybridization on patterns of growth allometryare subject to several important limitations.Perhaps the most significant among these limita-tions are the small sample sizes. Small samplesmay have resulted in low power for the ANCOVAand t-test comparisons. Another potential problemassociated with the population samples used hereis the composition of the M. tonkeana sample,which comprises both pet and wild individuals.Differences between pets and wild monkeys innutrition and living conditions may have affectedpet growth at some level (see Leigh, 1994; Turneret al., 1997). Based on our comparison of re-
gression residuals, however, there does not seem tobe a significant effect associated with pet status.
In addition to the limitations associated withthe nature of the population samples included inthe analysis, this study is also potentially limitedby how we represented craniofacial shape, withonly a few linear facial diameters included (seeGodfrey and Sutherland, 1995a, b, for a critique ofthe use of logarithmically transformed size-traitspace to interpret ancestoredescendant patterns inthe ontogenesis of shape). Although three-dimen-sional geometric morphometric techniques arebecoming the gold standard in analyses ofcraniofacial morphology and ontogeny (e.g.,Richtsmeier et al., 1993; Collard and O’Higgins,2001; Ponce de Leon and Zollikofer, 2001;O’Higgins and Collard, 2002; Singleton, 2002;Leigh et al., 2003; Berge and Penin, 2004; Frostet al., 2003; Harvati, 2003; Harvati et al., 2004),this approach is not practical with live subjects inthe field. The three craniofacial variables includedhere do allow a gross, albeit limited, evaluation ofanteroposterior and horizontal craniofacial de-velopment relative to body weight.
Some of the discordance observed betweenheterosis in adult traits and heterosis in growthrates may be a by-product of our potentiallyconservative method of formally diagnosing hy-brid vigor. Our use of a Bonferrroni correction fortest bias associated with multiple comparisonsresulted in nonsignificant findings for heterosis intwo traits (i.e., cranial length and bizygomaticbreadth) that would have been diagnosed as beingheterotic without such a correction. A comparisonof the Bonferroni-corrected results comparinghybrid regression parameters with the midparentalaverages presented in Table 10 with the resultspresented in Table 3 describing adult heterosissuggests this does not seem to have been the case.With or without a Bonferroni correction, discor-dance between adult trait heterosis and acceleratedgrowth allometry is apparent.
Finally, as discussed earlier, because our hybridsample likely included some F2 hybrids andbackcrosses, the effects of heterosis in adult traitsand in hybrid growth allometry could have beenreduced. This would limit our ability to identifya statistically significant hybrid pattern of growth,
362 M.A. Schillaci et al. / Journal of Human Evolution 49 (2005) 335e369
and perhaps reduce our ability to correlate adultheterosis with hybrid growth patterns. The possi-bility of nonhybrids being included within thepresumed hybrid sample would also contribute tothis problem. Nevertheless, regardless of statisticalsignificance, it seems clear from our results thatthere is an identifiable pattern of hybrid growthcharacterized by higher regression slopes andlower intercept values.
Anthropological primatology andmorphology-based systematics
The taxonomic status of the Neandertals, andthe question of interbreeding between Neandertalsand modern humans in Europe, has receivedconsiderable attention in the literature (for recentreviews, see Stringer, 2002; Holliday, 2003). Therecent discovery of a possible modern humaneNeandertal hybrid from Portugal has contributedvery compelling evidence to an already heateddebate (Duarte et al., 1999; but see Tattersall andSchwartz, 1999). The brief review of the recentliterature presented earlier in this paper onNeandertal craniofacial growth and developmentillustrates that there is a growing body ofpublished research demonstrating a significantdifference between Neandertals and modern hu-mans in patterns of ontogeny. This ontogeneticdivergence is typically, though not always (seeMinugh-Purvis, 2002), inferred (e.g., Ponce deLeon and Zollikofer, 2001) or implied (e.g.,Williams et al., 2002a) to be taxonomicallysignificant at the species level, thus lending supportto the assertion that Neandertals were distinctfrom modern humans at the species level. What ismissing from the literature, however, is a discussionof how the taxonomic significance of ontogeneticdivergence is determined. There is no biologicallymeaningful method for inferring taxonomic dis-tinction from statistical significance, although thisis done in conjunction with assertions of speciesstatus for Neandertals. Species status for Nean-dertals holds particular significance because itimplies reproductive isolation from Upper Paleo-lithic modern humans in Europe, thus precludingNeandertals from contributing genetically to the
ancestry of recent human populations in Europe.To be precise, the question of interest andcontroversy among anthropologists is not: WereNeandertals a population of Homo that wasdiagnosably distinct from modern humans, main-taing its identity over time and space with its ownevolutionary fate and tendencies (see Wiley andMayden, 2000)? Instead, the question of interest is:Did Neandertals make a genetic contribution toany surviving modern human lineages? Given thisfact, the following question should be addressed:How much ontogenetic divergence is taxonomi-cally relevant at the species level, i.e., indicative ofreproductive isolation?
While the present study does not directlyaddress the question of Neandertal taxonomy orgenetic isolation, it does demonstrate that signif-icant differences in patterns of growth allometrycan occur between naturally hybridizing primatespecies taxa (see Jolly, 2003). These differences ingrowth allometry coincide with significant differ-ences in form and non-allometric shape duringdevelopment, as described by PCA. The results ofthe present research suggest that statisticallysignificant differences in growth and in developingform and shape may not correspond to repro-ductive isolation.4 Although recognition ofa unique and statistically significant divergentNeandertal pattern of growth suggests Neander-tals may represent a diagnosably distinct clusterof organisms [i.e., a phylogenetic species asdefined by the phylogenetic species concept(PSC) of Cracraft (1983)], it does not inform usabout the process of reproduction. In his discus-sion of taxonomy and species identification,Groves (2004) asserted that species status underthe PSC does not depend on the ability orpropensity to interbreed with other presumedtaxa. Neandertals, for example, can be diagnosedreliably as a separate species (Homo neanderthal-ensis) from modern humans (Homo sapiens) underthe PSC and still contribute genetically to theancestry of living humans (see also relevant
4 Although not always stated, the literature on Neandertal
growth seems to most often rely on the biological species
concept when making assertions regarding species status for
Neandertals based on observed ontogenetic divergence.
363M.A. Schillaci et al. / Journal of Human Evolution 49 (2005) 335e369
discussions in Eldredge and Cracraft, 1980; Jolly,1993; Masters, 1993). So, while the potential forhybridization may not represent sufficientgrounds to lump Neandertals and modern hu-mans into the same species under the PSC, it doessuggest that limited genetic contribution byNeandertals to some modern human lineages inEurope might have been possible (but see theargument by Lieberman, 2003).
Inferences about reproductive isolation that arebased on morphological or ontogenetic divergenceobserved in the fossil record should emanateempirically from observations of ontogenetic di-vergence and reproduction among extant pri-mates. In their review of morphology-basedsystematics, Sarmiento et al. (2002: 55) arguedconvincingly that ‘‘[b]ecause many of the varia-bles bearing on systematics are rarely known (e.g.,complete phenotype, geographic distribution,population variation, behavior, ecology, develop-ment, and genotype) living taxa must form thebackbone of systematic studies’’ (emphasisadded). This assertion holds true regardless ofthe method of study, whether phenetic orcladistic. Citing work by Simpson (1961) andMayr (1963, 1982), Sarmiento et al. (2002:55) alsoasserted that the taxonomic classification offossils always depends on analogies made toextant taxa, and that the magnitude of morpho-logical differences and/or types of morphologicalcharacters that are chosen to diagnose fossil taxamust always be guided by differences that di-agnose living taxa (see also discussions inAlbrecht and Miller, 1993; Shea et al., 1993;Jolly, 2001; Schillaci and Froehlich, 2001). Thisalso applies to taxonomic classifications based onontogenetic divergence. Hybridization with in-trogression between phenotypically and/or eco-logically distinct species taxa offers a uniqueopportunity to address this issue (see discussionby Holliday, 2003). For example, taxonomicdistinctions at the species level for Neandertalsshould correspond with a level of ontogeneticdivergence greater than that observed for extanthybridizing, or interbreeding, primate taxa (con-tra Tattersall, 2003). Differences between Nean-dertals and modern humans in enamel extensionrates (Ramirez Rozzi and Bermudez de Castro,
2004; but see Dean et al., 2001: Figure 1), forinstance, should be greater than that observedbetween hybridizing taxa such as Papio hama-dryas and Theropithicus gelada (see Jolly et al.,1997). Similarly, differences observed betweenNeandertals and modern humans in craniofacialshape early in development (Ponce de Leon andZollikofer, 2001) should be greater than thoseobserved between interbreeding species taxa, suchas M. tonkeana and M. maurus.
Through investigation of inter- and intraspecificvariation in morphology and ontogeny, and howthis variation maps onto reproductive isolationamong extant primates, anthropological primatol-ogy provides a biologically relevant model bywhich to assess the taxonomic significance ofmorphological and ontogenetic divergence ob-served in the fossil record (but see Ackermann,2003, 2005). The comparative approach of anthro-pological primatology also has the added potentialof providing general principles regarding, forexample, the relationship between morphologicaldivergence and reproductive isolation in primatesthat cannot be determined through study ofa single species, such as Homo sapiens, or a smallgroup of species such as humans and African apes(Martin, 2002: 3). Additional research on thenature of primate reproduction in hybrid zones,hybrid morphology, and the introgression ofalleles into parental populations is needed beforespecies recognition, or inferences of reproductiveisolation in the hominid fossil record, can be madereliably.
Conclusions
Although subject to certain limitations, theresults of this study of the effects of hybridizationon growth allometry between two Sulawesi ma-caque taxa suggest that there is a hybrid pattern ofgrowth allometry. Heterosis is not indicated formost adult morphological characteristics includedin the study, and when observed, it does notcorrespond well with heterosis in growth. Theobserved pattern of hybrid growth is characterizedby higher regression slope values and lowerintercepts for most variables. These findings
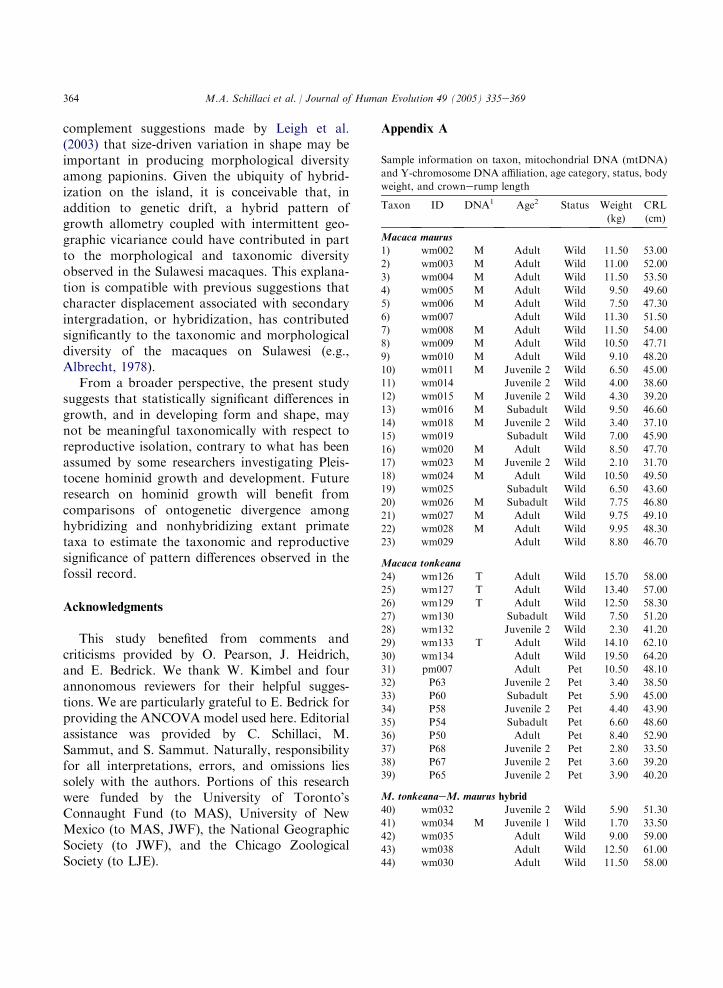
364 M.A. Schillaci et al. / Journal of Human Evolution 49 (2005) 335e369
complement suggestions made by Leigh et al.(2003) that size-driven variation in shape may beimportant in producing morphological diversityamong papionins. Given the ubiquity of hybrid-ization on the island, it is conceivable that, inaddition to genetic drift, a hybrid pattern ofgrowth allometry coupled with intermittent geo-graphic vicariance could have contributed in partto the morphological and taxonomic diversityobserved in the Sulawesi macaques. This explana-tion is compatible with previous suggestions thatcharacter displacement associated with secondaryintergradation, or hybridization, has contributedsignificantly to the taxonomic and morphologicaldiversity of the macaques on Sulawesi (e.g.,Albrecht, 1978).
From a broader perspective, the present studysuggests that statistically significant differences ingrowth, and in developing form and shape, maynot be meaningful taxonomically with respect toreproductive isolation, contrary to what has beenassumed by some researchers investigating Pleis-tocene hominid growth and development. Futureresearch on hominid growth will benefit fromcomparisons of ontogenetic divergence amonghybridizing and nonhybridizing extant primatetaxa to estimate the taxonomic and reproductivesignificance of pattern differences observed in thefossil record.
Acknowledgments
This study benefited from comments andcriticisms provided by O. Pearson, J. Heidrich,and E. Bedrick. We thank W. Kimbel and fourannonomous reviewers for their helpful sugges-tions. We are particularly grateful to E. Bedrick forproviding the ANCOVA model used here. Editorialassistance was provided by C. Schillaci, M.Sammut, and S. Sammut. Naturally, responsibilityfor all interpretations, errors, and omissions liessolely with the authors. Portions of this researchwere funded by the University of Toronto’sConnaught Fund (to MAS), University of NewMexico (to MAS, JWF), the National GeographicSociety (to JWF), and the Chicago ZoologicalSociety (to LJE).
Appendix A
Sample information on taxon, mitochondrial DNA (mtDNA)
and Y-chromosome DNA affiliation, age category, status, body
weight, and crownerump length
Taxon ID DNA1 Age2 Status Weight
(kg)
CRL
(cm)
Macaca maurus
1) wm002 M Adult Wild 11.50 53.00
2) wm003 M Adult Wild 11.00 52.00
3) wm004 M Adult Wild 11.50 53.50
4) wm005 M Adult Wild 9.50 49.60
5) wm006 M Adult Wild 7.50 47.30
6) wm007 Adult Wild 11.30 51.50
7) wm008 M Adult Wild 11.50 54.00
8) wm009 M Adult Wild 10.50 47.71
9) wm010 M Adult Wild 9.10 48.20
10) wm011 M Juvenile 2 Wild 6.50 45.00
11) wm014 Juvenile 2 Wild 4.00 38.60
12) wm015 M Juvenile 2 Wild 4.30 39.20
13) wm016 M Subadult Wild 9.50 46.60
14) wm018 M Juvenile 2 Wild 3.40 37.10
15) wm019 Subadult Wild 7.00 45.90
16) wm020 M Adult Wild 8.50 47.70
17) wm023 M Juvenile 2 Wild 2.10 31.70
18) wm024 M Adult Wild 10.50 49.50
19) wm025 Subadult Wild 6.50 43.60
20) wm026 M Subadult Wild 7.75 46.80
21) wm027 M Adult Wild 9.75 49.10
22) wm028 M Adult Wild 9.95 48.30
23) wm029 Adult Wild 8.80 46.70
Macaca tonkeana
24) wm126 T Adult Wild 15.70 58.00
25) wm127 T Adult Wild 13.40 57.00
26) wm129 T Adult Wild 12.50 58.30
27) wm130 Subadult Wild 7.50 51.20
28) wm132 Juvenile 2 Wild 2.30 41.20
29) wm133 T Adult Wild 14.10 62.10
30) wm134 Adult Wild 19.50 64.20
31) pm007 Adult Pet 10.50 48.10
32) P63 Juvenile 2 Pet 3.40 38.50
33) P60 Subadult Pet 5.90 45.00
34) P58 Juvenile 2 Pet 4.40 43.90
35) P54 Subadult Pet 6.60 48.60
36) P50 Adult Pet 8.40 52.90
37) P68 Juvenile 2 Pet 2.80 33.50
38) P67 Juvenile 2 Pet 3.60 39.20
39) P65 Juvenile 2 Pet 3.90 40.20
M. tonkeanaeM. maurus hybrid
40) wm032 Juvenile 2 Wild 5.90 51.30
41) wm034 M Juvenile 1 Wild 1.70 33.50
42) wm035 Adult Wild 9.00 59.00
43) wm038 Adult Wild 12.50 61.00
44) wm030 Adult Wild 11.50 58.00
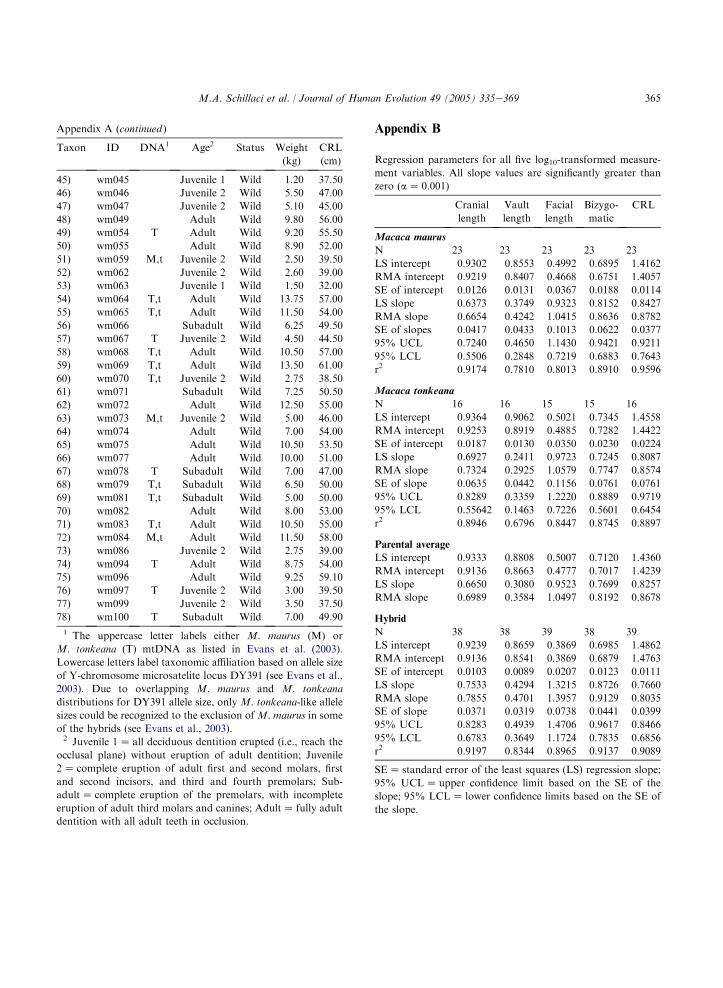
365M.A. Schillaci et al. / Journal of Human Evolution 49 (2005) 335e369
Appendix A (continued )
Taxon ID DNA1 Age2 Status Weight
(kg)
CRL
(cm)
45) wm045 Juvenile 1 Wild 1.20 37.50
46) wm046 Juvenile 2 Wild 5.50 47.00
47) wm047 Juvenile 2 Wild 5.10 45.00
48) wm049 Adult Wild 9.80 56.00
49) wm054 T Adult Wild 9.20 55.50
50) wm055 Adult Wild 8.90 52.00
51) wm059 M,t Juvenile 2 Wild 2.50 39.50
52) wm062 Juvenile 2 Wild 2.60 39.00
53) wm063 Juvenile 1 Wild 1.50 32.00
54) wm064 T,t Adult Wild 13.75 57.00
55) wm065 T,t Adult Wild 11.50 54.00
56) wm066 Subadult Wild 6.25 49.50
57) wm067 T Juvenile 2 Wild 4.50 44.50
58) wm068 T,t Adult Wild 10.50 57.00
59) wm069 T,t Adult Wild 13.50 61.00
60) wm070 T,t Juvenile 2 Wild 2.75 38.50
61) wm071 Subadult Wild 7.25 50.50
62) wm072 Adult Wild 12.50 55.00
63) wm073 M,t Juvenile 2 Wild 5.00 46.00
64) wm074 Adult Wild 7.00 54.00
65) wm075 Adult Wild 10.50 53.50
66) wm077 Adult Wild 10.00 51.00
67) wm078 T Subadult Wild 7.00 47.00
68) wm079 T,t Subadult Wild 6.50 50.00
69) wm081 T,t Subadult Wild 5.00 50.00
70) wm082 Adult Wild 8.00 53.00
71) wm083 T,t Adult Wild 10.50 55.00
72) wm084 M,t Adult Wild 11.50 58.00
73) wm086 Juvenile 2 Wild 2.75 39.00
74) wm094 T Adult Wild 8.75 54.00
75) wm096 Adult Wild 9.25 59.10
76) wm097 T Juvenile 2 Wild 3.00 39.50
77) wm099 Juvenile 2 Wild 3.50 37.50
78) wm100 T Subadult Wild 7.00 49.90
1 The uppercase letter labels either M. maurus (M) or
M. tonkeana (T) mtDNA as listed in Evans et al. (2003).
Lowercase letters label taxonomic affiliation based on allele size
of Y-chromosome microsatelite locus DY391 (see Evans et al.,
2003). Due to overlapping M. maurus and M. tonkeana
distributions for DY391 allele size, only M. tonkeana-like allele
sizes could be recognized to the exclusion of M. maurus in some
of the hybrids (see Evans et al., 2003).2 Juvenile 1Z all deciduous dentition erupted (i.e., reach the
occlusal plane) without eruption of adult dentition; Juvenile
2Z complete eruption of adult first and second molars, first
and second incisors, and third and fourth premolars; Sub-
adultZ complete eruption of the premolars, with incomplete
eruption of adult third molars and canines; AdultZ fully adult
dentition with all adult teeth in occlusion.
Appendix B
Regression parameters for all five log10-transformed measure-
ment variables. All slope values are significantly greater than
zero (aZ 0.001)
Cranial
length
Vault
length
Facial
length
Bizygo-
matic
CRL
Macaca maurus
N 23 23 23 23 23
LS intercept 0.9302 0.8553 0.4992 0.6895 1.4162
RMA intercept 0.9219 0.8407 0.4668 0.6751 1.4057
SE of intercept 0.0126 0.0131 0.0367 0.0188 0.0114
LS slope 0.6373 0.3749 0.9323 0.8152 0.8427
RMA slope 0.6654 0.4242 1.0415 0.8636 0.8782
SE of slopes 0.0417 0.0433 0.1013 0.0622 0.0377
95% UCL 0.7240 0.4650 1.1430 0.9421 0.9211
95% LCL 0.5506 0.2848 0.7219 0.6883 0.7643
r2 0.9174 0.7810 0.8013 0.8910 0.9596
Macaca tonkeana
N 16 16 15 15 16
LS intercept 0.9364 0.9062 0.5021 0.7345 1.4558
RMA intercept 0.9253 0.8919 0.4885 0.7282 1.4422
SE of intercept 0.0187 0.0130 0.0350 0.0230 0.0224
LS slope 0.6927 0.2411 0.9723 0.7245 0.8087
RMA slope 0.7324 0.2925 1.0579 0.7747 0.8574
SE of slope 0.0635 0.0442 0.1156 0.0761 0.0761
95% UCL 0.8289 0.3359 1.2220 0.8889 0.9719
95% LCL 0.55642 0.1463 0.7226 0.5601 0.6454
r2 0.8946 0.6796 0.8447 0.8745 0.8897
Parental average
LS intercept 0.9333 0.8808 0.5007 0.7120 1.4360
RMA intercept 0.9136 0.8663 0.4777 0.7017 1.4239
LS slope 0.6650 0.3080 0.9523 0.7699 0.8257
RMA slope 0.6989 0.3584 1.0497 0.8192 0.8678
Hybrid
N 38 38 39 38 39
LS intercept 0.9239 0.8659 0.3869 0.6985 1.4862
RMA intercept 0.9136 0.8541 0.3869 0.6879 1.4763
SE of intercept 0.0103 0.0089 0.0207 0.0123 0.0111
LS slope 0.7533 0.4294 1.3215 0.8726 0.7660
RMA slope 0.7855 0.4701 1.3957 0.9129 0.8035
SE of slope 0.0371 0.0319 0.0738 0.0441 0.0399
95% UCL 0.8283 0.4939 1.4706 0.9617 0.8466
95% LCL 0.6783 0.3649 1.1724 0.7835 0.6856
r2 0.9197 0.8344 0.8965 0.9137 0.9089
SEZ standard error of the least squares (LS) regression slope;
95% UCLZ upper confidence limit based on the SE of the
slope; 95% LCLZ lower confidence limits based on the SE of
the slope.
366 M.A. Schillaci et al. / Journal of Human Evolution 49 (2005) 335e369
References
Ackermann, R.R., 2005 Variation in Neandertals: a response to
Harvati (2003). J. Hum. Evol. 48, 643e646.
Ackermann, R.R., 2003. Using extant morphological variation
to understand fossil relationships: a cautionary tale. S. Afr.
J. Sci. 99, 255e258.
Ackermann, R.R., Krovitz, G.E., 2002. Common patterns of
facial ontogeny in the hominid lineage. Anat. Rec. (New
Anat.) 269, 142e147.
Aiello, L.C., 1992. Allometry and the analysis of size and shape
in human evolution. J. Hum. Evol. 22, 127e147.
Alberch, P., Gould, S.J., Oster, J.F., Wake, D.B., 1979. Size
and shape in ontogeny and phylogeny. Paleobiology 5,
296e317.
Albrecht, G.H., 1978. The Craniofacial Morphology of the
Sulawesi Macaques: Multivariate Approaches to Biological
Problems. In: Contrib. Primatol., Vol. 13. Karger, Basel.
Albrecht, G.H., Miller, J.M.A., 1993. Geographic variation in
primates: a review with implications for interpreting fossils.
In: Kimbel, W.H., Martin, L.B. (Eds.), Species, Species
Concepts, and Primate Evolution. Plenum Press, New
York, pp. 123e161.
Bayne, B.L., Hedgecock, D., McGoldrick, D., Rees, R., 1999.
Feeding behaviour and metabolic efficiency contribute to
growth heterosis in Pacific oysters [Crassostrea gigas
(Thunberg)]. J. Exp. Mar. Biol. Ecol. 233, 115e130.
Berge, C., Penin, X., 2004. Ontogenetic allometry, hetero-
chrony, and interspecific differences in the skull of African
apes, using tridimensional Procrustes analysis. Am. J. Phys.
Anthropol. 124, 124e138.
Bernstein, I.S., 1966. Naturally occurring primate hybrids.
Science 154, 1559e1560.
Bernstein, I.S., 1968. Social status of two hybrids in a wild
troop of Macaca irus. Folia Primatol. 8, 121e131.Brockelman, W.Y., Srikosamatara, S., 1984. Maintenance of
social structure in gibbons. In: Preuschof, H., Chivers, D.J.,
Brockelman, W.Y., Creel, N. (Eds.), The Lesser Ape.
Edinburgh University Press, Edinburgh, pp. 298e323.Bynum, N., 2002. Morphological variation within a macaque
hybrid zone. Am. J. Phys. Anthropol. 118, 45e49.
Bynum, E.L., Bynum, D.Z., Supriatna, J., 1997. Confirmation
of the hybrid zone between wild populations of Macaca
tonkeana and Macaca hecki in Central Sulawesi, Indonesia.
Am. J. Primatol. 43, 181e209.
Cassady, J.P., Young, L.D., Leymaster, K.A., 2002. Heterosis
and recombination effects on pig growth and carcass traits.
J. Anim. Sci. 80, 2286e2302.
Cheverud, J.M., Jacobs, S.C., Moor, A.J., 1993. Genetic
differences among subspecies of the saddle-back tamarin
(Saguinas fuscicollis): evidence from hybrids. Am. J.
Primatol. 21, 1e15.
Ciani, A.C., Stanyon, R., Scheffrahn, W., Sampurno, B., 1989.
Evidence of gene flow between Sulawesi macaques. Am. J.
Primatol. 17, 257e270.
Cochard, L.R., 1985. Ontogenetic allometry of the skull and
dentition of the rhesus monkey (Macaca mulatta). In:
Jungers, W.L. (Ed.), Size and Scaling in Primate Biology.
Plenum Press, New York, pp. 231e255.
Collard, M., O’Higgins, P., 2001. Ontogeny and homoplasy in
the papionin monkey face. Evol. Dev. 3, 322e331.
Coqueugniot, N., Minugh-Purvis, N., 2003. Ontogenetic pat-
terning and phylogenetic significance of mental foramen
number and position in the evolution of upper Pleistocene
Homo sapiens. In: Thompson, J., Krovitz, J., Nelson, A.
(Eds.), Patterns of Growth and Development in the Genus
Homo. CambridgeUniversity Press, Cambridge, pp. 295e319.
Cracraft, J., 1983. Species concepts and speciation analysis.
Curr. Ornithol. 1, 159e187.
Dean, M.C., Stringer, C.B., Bromage, T.G., 1986. Age at death
for the Neanderthal child from Devil’s Tower, Gibralter and
the implications for studies of general growth and de-
velopment in Neanderthals. Am. J. Phys. Anthropol. 70,
301e309.
Dean, C., Leakey, M., Reid, D., Schrenk, F., Schwartz, G.T.,
Stringer, C., Walker, A., 2001. Growth processes in teeth
distinguish modern humans from Homo erectus and earlier
hominins. Nature 414, 628e631.
Demeke, S., Nesser, F.W.C., Schoeman, S.J., 2003. Early
growth performance of Bos taurus!Bos indicus cattle
crosses in Ethiopia: evaluation of different crossbreed
models. J. Anim. Breed. Genet. 120, 39e50.Dobzhansky, T., 1952. Nature and origin of heterosis. In:
Grower, J.W. (Ed.), Heterosis. Iowa State College Press,
Ames, pp. 218e223.
Duarte, C., Mauricio, J., Pettitt, P.B., Souto, P., Trinkaus, E.,
van der Plicht, H., Zilhao, J., 1999. The early Upper
Paleolithic human skeleton from Abrigo do Lagar Velho
(Portugal) and modern human emergence in Iberia. Proc.
Natl. Acad. Sci. USA 96, 7604e7609.Eldredge, N., Cracraft, J., 1980. Phylogenetic Patterns and the
Evolutionary Process: Method and Theory in Comparative
Biology. Columbia University Press, New York.
Evans, B.J., Morales, J.C., Supriatna, J., Melnick, D.J., 1999.
Origin of the Sulawesi macaques (Cercopithecidae: Macaca)
as suggested by mitochondrial DNA phylogeny. Biol. J.
Linn. Soc. 66, 539e560.Evans, B.J., Supriatna, J., Andayani, N., Melnick, D.J., 2003.
Diversification of Sulawesi macaque monkeys: decoupled
evolution of mitochondrial and autosomal DNA. Evolution
57, 1931e1946.
Evans, B.J., Supriatna, J., Melnick, D.J., 2001. Hybridization
and population genetics of two macaque species in Sulawesi,
Indonesia. Evolution 55, 1683e1702.
Falconer, D.S., Mackay, T.F.C., 1996. Introduction to
Quantitative Genetics, fourth ed. Longman Group, Eng-
land.
Fooden, J., 1964. Rhesus and crab-eating macaques: intergra-
dation in Thailand. Science 143, 363e365.
Fooden, J., 1969. Taxonomy and Evolution of the Monkeys of
Celebes (Primates: Cercopithecidae). In: Bibliotheca Prima-
tologica, Vol. 10. Karger, Basel.
Froehlich, J.W., 2003. Testing some theoretical expectations of
sexual selection versus the recognition species concept in the
367M.A. Schillaci et al. / Journal of Human Evolution 49 (2005) 335e369
speciose macaques of Sulawesi, Indonesia. In: Jones, C.B.
(Ed.), Sexual Selection and Reproductive Competition in
Primates: New Perspectives and Directions. Special Topics
in Primatology, Vol. 3. The American Society of Primatol-
ogists, Oklahoma, pp. 539e591.
Froehlich, J.W., Supriatna, J., 1996. Secondary intergradation
between Macaca maurus and M. tonkeana. In: Fa, J.E.,
Lindburg, D.G. (Eds.), Evolution and Ecology of Macaque
Societies. CambridgeUniversity Press, Cambridge, pp. 43e70.
Froehlich, J.W., Supriatna, J., Muskita, Y., 1996. Biodiversity
and the conservation biology of Macaca nigra: an anthro-
pological view. Trop. Biodivers. 3, 85e102.
Froehlich, J.W., Supriatna, J., Hart, V., Akbar, S., Babo, R.,
1999. The Balan of Balantak: a possible new species of
macaque in Central Sulawesi. Trop. Biodivers. 4, 167e184.
Frost, S.R., Marcus, L.F., Bookstein, F.L., Reddy, D.P.,
Delson, E., 2003. Cranial allometry, phylogeography, and
systematics of large-bodied papionins (Primates: Cercopi-
thecinae) inferred from geometric morphometric analysis of
landmark data. Anat. Rec. 275A, 1048e1072.
Fujita, K., Watanabe, K., 1995. Visual preference for closely
related species by Sulawesi macaques. Am. J. Primatol. 37,
253e261.
Gama, L.T., Dickerson, G.E., Young, L.D., Leymaster, K.A.,
1991. Effects of breed, heterosis, age of dam, litter size,
and birth weight on lamb mortality. J. Anim. Sci. 69,
2727e2743.
Godfrey, L.R., 1999. What is heterochrony? Evol. Anthropol.
7, 186e188.Godfrey, L.R., Sutherland, M.R., 1995a. Flawed inference: why
size-based tests of heterochronic process do not work.
J. Theor. Biol. 172, 43e61.
Godfrey, L.R., Sutherland, M.R., 1995b. What’s growth got to
do with it? Process and product in the evolution of
ontogeny. J. Hum. Evol. 29, 405e431.
Godfrey, L.R., Sutherland, M.R., 1996. Paradox of peramor-
phic paedomorphosis: heterochrony and human evolution.
Am. J. Phys. Anthropol. 99, 17e42.
Gould, S.J., 1966. Allometry and size in ontogeny and
phylogeny. Biol. Rev. 41, 587e680.Gould, S.J., 1977. Ontogeny and Phylogeny. Harvard Univer-
sity Press, Cambridge.
Gould, S.J., 2000. Of coiled oysters and big brains: how to
rescue the terminology of heterochrony, now gone astray.
Evol. Dev. 2, 241e248.
Gregory, K.E., Cundiff, L.V., Koch, R.M., 1992. Breed effects
and heterosis in advanced generations of composite pop-
ulations on actual weight, adjusted weight, hip height, and
condition score of beef cows. J. Anim. Sci. 70, 1742e1754.
Groves, C.P., 1980. Speciation in Macaca: the view from
Sulawesi. In: Lindburg, D. (Ed.), The Macaques: Studies in
Ecology, Behavior and Evolution. Van Nostrand, New
York, pp. 84e124.
Groves, C.P., 2001. Primate Taxonomy. Smithsonian Institu-
tion Press, Washington.
Groves, C.P., 2004. The what, why and how of primate
taxonomy. Int. J. Primatol. 25, 1105e1126.
Harrison, R.G., 1990. Hybrid zones: windows in the evolution-
ary process. Oxf. Surv. Evol. Biol. 7, 69e128.
Harrison, R.G., 1993. Hybrids and hybrid zones: historical
perspective. In: Harrison, R.G. (Ed.), Hybrid Zones and the
Evolutionary Process. Oxford University Press, New York,
pp. 3e12.
Harvati, K., 2003. The Neanderthal taxonomic position:
models of intra- and inter-specific craniofacial variation.
J. Hum. Evol. 44, 107e132.
Harvati, K., Frost, S.R., McNulty, K.P., 2004. Neanderthal
taxonomy reconsidered: implications of 3D primate models
of intra- and inter-specific differences. Proc. Natl. Acad. Sci.
USA 101, 1147e1152.
Holliday, T.W., 2003. Species concepts, reticulation, and
human evolution. Curr. Anthropol. 44, 653e673.
Hulse, F.S., 1961. Exogamy and heterosis. Yearb. Phys.
Anthropol. 9, 240e257.
Hyankova, L., Dedkova, L., Knızetova, H., Hort, J., 2002.
Heterosis in body weight related to growth performance of
parental lines of Japanese quail and to heterosis in lay.
Br. Poult. Sci. 43, 508e517.
Jolicoeur, P., 1963. The multivariate generalization of the
allometry equation. Biometrics 19, 497e499.
Jolly, C.J., 1993. Species, subspecies, and baboon systematics.
In: Kimbel, W.H., Martin, L.B. (Eds.), Species, Species
Concepts, and Primate Evolution. Plenum Press, New
York, pp. 67e107.
Jolly, C.J., 2001. A proper study for mankind: analogies from
papionin monkeys and their implications for human
evolution. Yearb. Phys. Anthropol. 44, 177e204.
Jolly, C.J., 2003. Comment on: Species concepts, reticulation,
and human evolution. By T.W. Holliday. Curr. Anthropol.
44, 662e663.Jolly, C.J., Woolley-Barker, T., Beyene, S., Disotell, T.R.,
Phillips-Conroy, J.E., 1997. Intergeneric hybrid baboons.
Int. J. Primatol. 18, 597e625.Khongsdier, R., Mukherjee, N., 2003a. Growth and nutritional
status of Khasi boys in northeast India relating to
exogamous marriages and socioeconomic classes. Am. J.
Phys. Anthropol. 122, 162e170.Khongsdier, R., Mukherjee, N., 2003b. Effects of heterosis on
growth in height and its segments: a cross-sectional study of
the Khasi girls in Northeast India. Ann. Hum. Biol. 30,
605e621.King, A.H., Schneiderman, E.D., 1993. Differential growth
among components of the palate in rhesus monkeys
(Macaca mulatta). Cleft Palate Craniofac. J. 30, 302e308.
Kohn, L.A., Langton, L.B., Cheverud, J.M., 2001. Subspecific
genetic differences in the saddle-back tamarin (Saguinus
fuscicollis) postcranial skeleton. Am. J. Primatol. 54, 41e56.
Krovitz, G.E., 2000. Three-dimensional comparisons of cra-
niofacial morphology and growth patterns in Neanderthals
and modern humans. Ph.D. Dissertation, Johns Hopkins
University, Baltimore, Maryland.
Krovitz, G.E., 2003. Shape and growth differences between
Neanderthals and modern humans: grounds for species-
level distinction? In: Thompson, J., Krovitz, J., Nelson, A.
368 M.A. Schillaci et al. / Journal of Human Evolution 49 (2005) 335e369
(Eds.), Patterns of Growth and Development in the Genus
Homo Cambridge University Press, Cambridge, pp. 320e
342.
Leigh, S.R., 1994. Relations between captive and noncaptive
weights in anthropoid primates. Zoo Biol. 13, 21e43.
Leigh, S.R., Shah, N.F., Buchanan, L.S., 2003. Ontogeny and
phylogeny in papionin primates. J. Hum. Evol. 45, 285e316.Lieberman, D.E., 2003. Comment on: Species concepts, re-
ticulation, and human evolution. By T.W. Holliday. Curr.
Anthropol. 44, 664e665.
Lieberman, D.E., Krovitz, G.E., McBratney-Owen, B., 2004.
Testing hypotheses about tinkering in the fossil record: the
case of the human skull. J. Exp. Zool. (Mol. Dev. Evol.)
302B, 284e301.
Little, B.B., Molina, R.M., Buschang, P.H., 1986. Increased
heterozygosity and child growth in an isolated subsistence
agricultural community in the valley of Oaxaca, Mexico.
Am. J. Phys. Anthropol. 77, 85e90.Manly, B.F.J., 1995. Multivariate Statistical Methods: A
Primer, second ed. Chapman and Hall, London.
Marshall, J., Sugardjito, J., 1986. Gibbon systematics. In:
Erwin, J., Swindler, D.R. (Eds.), Comparative Primate
Biology, Vol. I: Systematics, Evolution, and Anatomy. Alan
Liss, New York, pp. 137e185.
Martin, R.D., 2002. Primatology as an essential basis for
biological anthropology. Evol. Anthropol. 1 (Suppl.), 3e6.
Masters, J.C., 1993. Primates and paradigms: problems with the
identification of genetic species. In: Kimbel, W.H.,
Martin, L.B. (Eds.), Species, Species Concepts, and Primate
Evolution. Plenum Press, New York, pp. 43e64.
Matsumura, S., 1998.Relaxeddominance relations among female
moor macaques (Macaca maura) in their natural habitat,
south Sulawesi, Indonesia. Folia Primatol. 69, 346e356.Mayr, E., 1963. Populations, Species, and Evolution. Harvard
University Press, Cambridge.
Mayr, E., 1982. The Growth of Evolutionary Thought.
Harvard University Press, Cambridge.
Minugh-Purvis, N., 1988. Patterns of craniofacial growth and
development in upper Pleistocene hominids. Ph.D. Disser-
tation, University of Pennsylvania.
Minugh-Purvis, N., 1998. The search for the earliest modern
Europeans: a comparison of the Krapina 1 and es-Skhul 1
juveniles. In: Akazawa, T., Aoki, K., Bar-Yosef, O. (Eds.),
Neanderthals and Modern Humans in West Asia. Plenum,
New York, pp. 339e352.
Minugh-Purvis, N., 2002. Heterochronic change in the neuro-
cranium and the emergence of modern humans. In: Minugh-
Purvis, N., McNamara, K.J. (Eds.), Human Evolution
Through Developmental Change. The Johns Hopkins
University Press, Baltimore, pp. 479e498.
Minugh-Purvis, N., Radov�cic, J., Smith, F.H., 2000. Krapina 1:
a juvenile Neanderthal from the early late Pleistocene of
Croatia. Am. J. Phys. Anthropol. 111, 393e424.
Morales, J.C., Melnick, D.J., 1998. Phylogenetic relationships
of the macaques (Cercopithecidae: Macaca), as revealed by
high resolution restriction site mapping of mitochondrial
ribosomal genes. J. Hum. Evol. 34, 1e23.
Mouri, T., 1996. Multivariate cranial ontogenetic allometries in
crab-eating, rhesus and Japanese macaques. Anthropol. Sci.
104, 281e303.
Muller, E., Moser, G., Bartenschlager, H., Geldermann, H.,
2000. Trait values of growth, carcass and meat quality in
wild boar, Meishan and Pietrain pigs as well as their
crossbred generations. J. Anim. Breed. Genet. 117, 189e202.
O’Higgins, P., Collard, M., 2002. Sexual dimorphism and facial
growth in papionin monkeys. J. Zool. 257, 255e272.
Paterson, H.E.H., 1985. The recognition concept of species. In:
Vrba, E.S. (Ed.), Species and Speciation. Transvaal
Museum Monograph No. 4. Transvaal Museum, Pretoria,
pp. 21e29.Paul, D., 1992. Heterochrony. In: Keller, E.F., Lloyd, E.A.
(Eds.), Keywords in Evolutionary Biology. Harvard Uni-
versity Press, Cambridge, pp. 166e169.
Phillips-Conroy, J.E., Jolly, C.J., 1986. Changes in the structure
of the baboon hybrid zone in the Awash national park,
Ethiopia. Am. J. Phys. Anthropol. 71, 337e350.
Phillips-Conroy, J.E., Jolly, C.J., Brett, F., 1991. Character-
istics of hamadryas-like male baboons living in anubis
baboon troops in the Awash hybrid zone, Ethiopia. Am. J.
Phys. Anthropol. 86, 853e868.
Ponce de Leon, M.S., Zollikofer, C.P.E., 2001. Neanderthal
cranial ontogeny and its implications for late hominid
diversity. Nature 412, 534e538.
Rahman, M.A., Uehara, T., Aslan, L.M., 2000. Comparative
viability and growth of hybrids between two sympatric
species of sea urchins (genus Echinometra) in Okinawa.
Aquaculture 183, 45e56.
Rak, Y., Ginzburg, A., Geffen, E., 2002. Does Homo
neanderthalensis play a role in modern human ancestry?
The mandibular evidence. Am. J. Phys. Anthropol. 119,
199e204.
Ramirez Rozzi, F.W., Bermudez de Castro, J.M., 2004.
Surprisingly rapid growth in Neanderthals. Nature 428,
936e939.
Rice, S.H., 1997. The analysis of ontogenetic trajectories: when
a change in size or shape is not heterochrony. Proc. Natl.
Acad. Sci. USA 94, 907e912.
Richtsmeier, J.T., Cheverud, J.M., Danahey, S.E.,
Corner, B.D., Lele, S., 1993. Sexual dimorphism of
ontogeny in the crab-eating macaque (Macaca fascicularis).
J. Hum. Evol. 25, 1e30.
Sarmiento, E.E., Stiner, E., Mowbray, K., 2002. Morphology-
based systematics (MBS) and problems with fossil hominoid
and hominid systematics. Anat. Rec. (New Anat) 269, 50e66.SAS Institute Inc., 1990. SAS/STAT User’s Guide. Version 6,
fourth ed. Vol. 1 and 2. Cary, North Carolina.
Schillaci, M.A., Froehlich, J.W., 2001. Nonhuman primate
hybridization and the taxonomic status of Neanderthals.
Am. J. Phys. Anthropol. 115, 157e166.
Schillaci, M.A., Jones-Engel, L., Heidrich, J.E., Miller, G.P.,
Froehlich, J.W., 2001. Field methodology for lateral cranial
radiography of nonhuman primates. Am. J. Phys. Anthro-
pol. 116, 278e284.
369M.A. Schillaci et al. / Journal of Human Evolution 49 (2005) 335e369
Shea, B.T., 1982. Growth and size allometry in the African
Pongidae: cranial and postcranial analyses. Ph.D. Disserta-
tion, Duke University.
Shea, B.T., 1983. Allometry and heterochrony in the African
apes. Am. J. Phys. Anthropol. 62, 275e289.
Shea, B.T., 1985. Ontogenetic allometry and scaling: a discus-
sion based on growth and form of the skull in African Apes.
In: Jungers, W.L. (Ed.), Size and Scaling in Primate
Biology. Plenum Press, New York, pp. 175e206.
Shea, B.T., Leigh, S.R., Groves, C.P., 1993. Multivariate
craniometric variation in chimpanzees: implications for species
identification in paleoanthropology. In: Kimbel, W.H.,
Martin, L.B. (Eds.), Species, Species Concepts, and Primate
Evolution. Plenum Press, New York, pp. 265e295.Simpson, G.G., 1961. Principals of Animal Taxonomy.
Columbia University Press, New York.
Singleton, M., 2002. Patterns of cranial shape variation in the
Papionini (Primates: Cercopithecinae). J. Hum Evol. 42,
547e578.
Sirianni, J.E., Swindler, D.R., 1985. Growth and Development
of the Pigtailed Macaque. CRC Press, Boca Raton.
Smith, D.G., Scott, L.M., 1989. Heterosis associated with
regional crossbreeding between captive groups of rhesus
macaques. Am. J. Primatol. 19, 255e260.
Sokal, R.R., Rohlf, F.J., 1995. Biometry, third ed. W.H.
Freeman and Company, New York.
Stallmann, R.R., Froehlich, J.W., 2000. Primate sexual
swellings as coevolved signal systems. Primates 41, 1e16.
Stringer, C.B., 2002. Modern human origins: progress and
prospects. Phil. Trans. R. Soc. Lond. B 357, 563e579.
Supriatna, J., 1991. Hybridization between Macaca maurus and
Macaca tonkeana: a test of species status using behavioral
and morphogenetic analysis. Ph.D. Dissertation, University
of New Mexico.
Supriatna, J., Froehlich, J.W., Erwin, J.M., Southwick, C.H.,
1992. Population habitat and conservation status ofMacaca
maurus, Macaca tonkeana and their putative hybrid. Trop.
Biodivers. 1, 31e48.
Tattersall, I., 2003. Comment on: Species concepts, reticulation,
and human evolution. By T.W. Holliday. Curr. Anthropol.
44, 662e663.
Tattersall, I., Schwartz, J.H., 1999. Hominids and hybrids: the
place of Neanderthals in human evolution. Proc. Natl.
Acad. Sci. USA 96, 7117e7119.Turner, T.R., Anapol, F., Jolly, C.P., 1997. Growth, de-
velopment, and sexual dimorphism in vervet monkeys
(Cercopithecus aethiops) at four sites in Kenya. Am. J.
Phys. Anthropol. 103, 19e35.Turbon, D., Perez-Perez, A., Stringer, C.B., 1997. A multivar-
iate analysis of Pleistocene hominids: testing hypotheses
about European origins. J. Hum. Evol. 32, 449e468.
Watanabe, K., Matsumura, S., 1991. The borderlands and
possible hybrids between three species of macaques, M.
nigra, M. nigrescens, and M. hecki, in the northern
peninsula of Sulawesi. Primates 32, 365e369.
Watanabe, K., Lapasere, H., Tantu, R., 1991a. External
characteristics and associated developmental changes in
two species of Sulawesi macaques, Macaca tonkeana and
Macaca hecki, with special reference to hybrids and the
borderlands between species. Primates 32, 61e76.
Watanabe, K., Matsumura, S., Watanabe, T., Hamada, Y.,
1991b. Distribution and possible intergradation between
Macaca tonkeana and Macaca ochreata at the borderland of
the species in Sulawesi. Primates 32, 369e385.
Wiley, E.O., Mayden, R.L., 2000. The evolutionary species
concept. In: Wheeler, Q.D., Meier, R. (Eds.), Species
Concepts and Phylogenetic Theory: A Debate. Columbia
University Press, New York, pp. 70e89.
Williams, F.L., 2000. Heterochrony and the human fossil
record: comparing Neanderthal and modern human cranio-
facial ontogeny. In: Stringer, C.B., Barton, R.N.E.,
Finlayson, J.C. (Eds.), Neanderthals on the Edge: 150th
Anniversary Conference of the Forbes Quarry Discovery.
Oxbow Books, Oxford, pp. 257e267.
Williams, F.L., Krovitz, G.E., 2004. Ontogenetic migration of
the mental foramen in Neandertals and modern humans.
J. Hum. Evol. 47, 199e219.
Williams, F.L., Godfrey, L.R., Sutherland, M.R., 2002a.
Heterochrony and the evolution of Neanderthal and
modern human craniofacial form. In: Minugh-Pervis, N.,
McNamara, K.J. (Eds.), Human Evolution Through De-
velopmental Change. The Johns Hopkins University Press,
Baltimore, pp. 405e441.
Williams, S.M., Price, S.E., Siegel, P.B., 2002b. Heterosis of
growth and reproductive traits in fowl. Poultry Science 81,
1109e1112.
Williams, F.L., Godfrey, L.R., Sutherland, M.R., 2003. Di-
agnosing heterochronic perturbations in the craniofacial
evolution of Homo (Neanderthals and modern humans) and
Pan (P. troglodytes and P. paniscus). In: Thompson, J.,
Krovitz, J., Nelson, A. (Eds.), Patterns of Growth and
Development in the Genus Homo. Cambridge University
Press, Cambridge, pp. 320e342.
Zollikofer, C.P.E., Ponce de Leon, M.S., 2004. Kinematics of
cranial ontogeny: heterotopy, heterochrony, and geometric
morphometric analysis of growth models. J. Exp. Zool.
(Mol. Dev. Evol.) 302B, 322e340.
Zumpano, M.P., 2002. Size and shape changes during late fetal
growth (137e157 gestational days) in the pigtailed macaque
(Macaca nemestrina) craniofacial complex: an application
using three-dimensional coordinate data and finite element
scaling analysis. Anat. Rec. 267, 307e320.
Related Documents