The Effects of Green The Effects of Green Energy Policies on Energy Policies on Innovation Innovation By Ryan Prescott By Ryan Prescott

The Effects of Green Energy Policies on Innovation By Ryan Prescott.
Dec 25, 2015
Welcome message from author
This document is posted to help you gain knowledge. Please leave a comment to let me know what you think about it! Share it to your friends and learn new things together.
Transcript

The Effects of Green Energy The Effects of Green Energy Policies on InnovationPolicies on Innovation
By Ryan PrescottBy Ryan Prescott
Renewable EnergyRenewable Energy
Six Sources of Renewable EnergySix Sources of Renewable Energy
• Hydro PowerHydro Power• Wind PowerWind Power• GeothermalGeothermal• Oceanic PowerOceanic Power
◦ WaveWave◦ TidalTidal
• BiomassBiomass• SolarSolar
◦ PhotovoltaicPhotovoltaic◦ Solar ConcentrationSolar Concentration

Wind PowerWind Power
• 1980’s major advances in aerodynamics, 1980’s major advances in aerodynamics, structural design and resource structural design and resource assessment.assessment.
• By 2007, installed global wind generating By 2007, installed global wind generating capacity had increased to 94,124 MW from capacity had increased to 94,124 MW from 10 MW in 1980(Earth Policy Institute, 10 MW in 1980(Earth Policy Institute, 2008). 2008).

GeothermalGeothermal
• Geothermal energy comes from the harnessing of super heated Geothermal energy comes from the harnessing of super heated underground aquifers or reservoirs.underground aquifers or reservoirs.
• The number of countries utilizing geothermal energy has The number of countries utilizing geothermal energy has increased from 10 in 1975 to 24 in 2004 (IEA/OECD, 2006).increased from 10 in 1975 to 24 in 2004 (IEA/OECD, 2006).
• From 1984 to 2004 capital cost for geothermal power decreased From 1984 to 2004 capital cost for geothermal power decreased 50% (IEA/OECD, 2006).50% (IEA/OECD, 2006).

WaveWave
• There have been several different approaches used to There have been several different approaches used to capture wave energy.capture wave energy.
◦ An oscillating water column which consists of a partially An oscillating water column which consists of a partially submerged structure where air is trapped above the submerged structure where air is trapped above the water free surface. water free surface.
◦ Palemis, a floating cylindrical snake like device.Palemis, a floating cylindrical snake like device.
TidalTidal
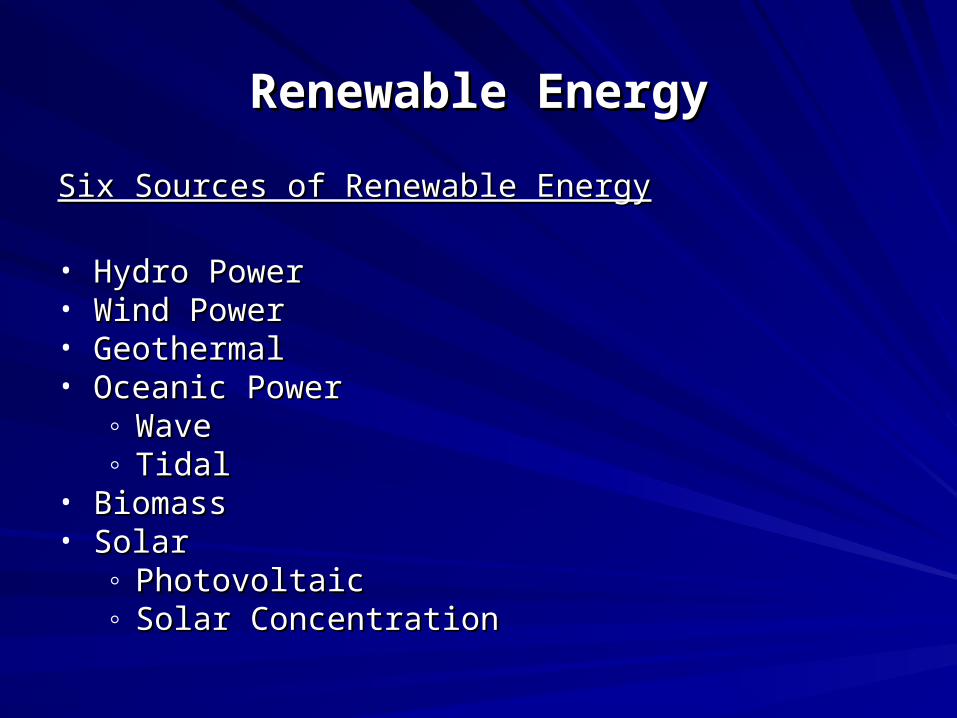
• The most basic tidal power is a The most basic tidal power is a turbine in the water, whereby turbine in the water, whereby the tide rotates the turbine the tide rotates the turbine producing power.producing power.
• Barrage tidal power is where a Barrage tidal power is where a barrage or dam is placed barrage or dam is placed across an estuary. across an estuary.
• Currently there is no clear Currently there is no clear winner in oceanic technology.winner in oceanic technology.
• 260 MW of tidal barrages 260 MW of tidal barrages worldwide (International worldwide (International Energy Agency, 2006).Energy Agency, 2006).
BiomassBiomass
• Anaerobic digestionAnaerobic digestion
◦ Involves the breaking down of biodegradable material Involves the breaking down of biodegradable material using microorganisms in the absence of oxygen to using microorganisms in the absence of oxygen to produce methane and carbon dioxide rich biogas.produce methane and carbon dioxide rich biogas.
• CombustionCombustion
◦ Biomass such as wood or wood pellets co-fired with coal Biomass such as wood or wood pellets co-fired with coal or used in large combustion plants. or used in large combustion plants.
There are several ways to produce bioenergy.

Biomass ContinuedBiomass Continued• PrylosisPrylosis
◦ Biomass is converted to liquid (bio-oil), gaseous and Biomass is converted to liquid (bio-oil), gaseous and solid (charcoal) through the super heating of the solid (charcoal) through the super heating of the biomass in the absence of oxygen.biomass in the absence of oxygen.
• FermentationFermentation
◦ The converting of sugars from such sources as corn, The converting of sugars from such sources as corn, sugarcane or sugar beet into ethanol and another sugarcane or sugar beet into ethanol and another byproduct such as methane using microorganisms. byproduct such as methane using microorganisms.
• Biomass supplies over 50% of the renewable energy Biomass supplies over 50% of the renewable energy supply of the world (International Energy Agency, 2006).supply of the world (International Energy Agency, 2006).

PhotovoltaicPhotovoltaic• Photovoltaics involves the use of sunlight to split Photovoltaics involves the use of sunlight to split
positive and negative charge carriers which produce positive and negative charge carriers which produce an electrical voltage. an electrical voltage.
• The worldwide use of PV has increased The worldwide use of PV has increased substantially with installed capacity increasing from substantially with installed capacity increasing from 110 MW in 1992 to 1809 MW in 2003 (International 110 MW in 1992 to 1809 MW in 2003 (International Energy Agency, 2006).Energy Agency, 2006).
• Capital costs have fallen substantially from the 70’s Capital costs have fallen substantially from the 70’s when it cost several hundred dollars per watt to less when it cost several hundred dollars per watt to less than 6 dollars per watt (Anderson, 1998).than 6 dollars per watt (Anderson, 1998).
Solar ConcentrationSolar Concentration• Solar concentration involves the concentration of the sun’s rays Solar concentration involves the concentration of the sun’s rays
to produce either a super-heated liquid or gas.to produce either a super-heated liquid or gas.
• Several different designs have been proposed such as parabolic Several different designs have been proposed such as parabolic troughs and tower plants.troughs and tower plants.
• OECD countries produced 548 GWh of electricity in 2003 OECD countries produced 548 GWh of electricity in 2003 (International Energy Agency, 2006).(International Energy Agency, 2006).
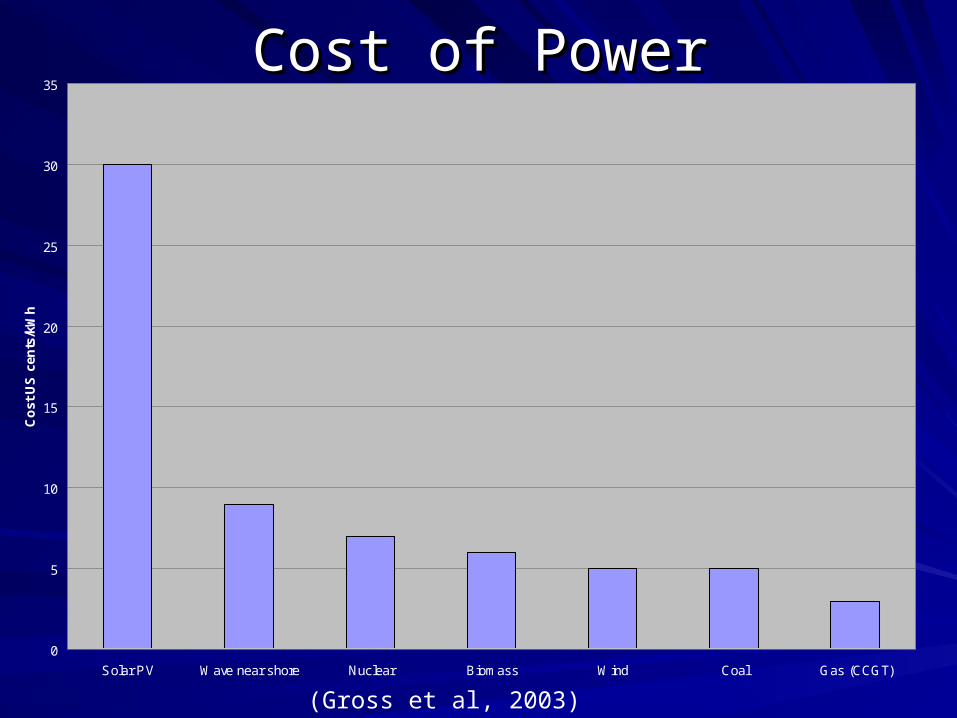
Cost of PowerCost of Power
0
5
10
15
20
25
30
35
Solar PV Wave near shore Nuclear Biomass Wind Coal Gas (CCGT)
Co
st U
S c
ents
/kW
h
(Gross et al, 2003)
Types of Policies for Encouraging Types of Policies for Encouraging Growth and Innovation in Green Growth and Innovation in Green
EnergyEnergy
• Price guarantees or feed-in-tariffsPrice guarantees or feed-in-tariffs• Pollution PermitsPollution Permits• ObligationsObligations• Investment IncentivesInvestment Incentives• Research SubsidiesResearch Subsidies

Why Encourage Research and Why Encourage Research and Innovation in Green Energy Innovation in Green Energy
Technologies?Technologies?
• Spillovers associated with researchSpillovers associated with research• Decreasing of the pollution externality Decreasing of the pollution externality
caused by traditional energy sources such caused by traditional energy sources such as:as:◦ CoalCoal◦ OilOil◦ Natural GasNatural Gas

Literature ReviewLiterature Review
Literature Related to Innovation in Green Energy Literature Related to Innovation in Green Energy
• Spillovers resulting from R&DSpillovers resulting from R&D◦ There are many estimates of the social returns to R&DThere are many estimates of the social returns to R&D
◦ Grilches (1992) reviews empirical evidence showing that private Grilches (1992) reviews empirical evidence showing that private rates of return on R&D have been significantly less than social rates of return on R&D have been significantly less than social rates of return.rates of return.
◦ Simple measurement of improvement, such as increased crop Simple measurement of improvement, such as increased crop yield.yield.
◦ Regression based estimations using patent citations, looking at Regression based estimations using patent citations, looking at how patents in one sector are cited by patents in another sector. how patents in one sector are cited by patents in another sector.

Literature Review ContinuedLiterature Review Continued• Induced innovationInduced innovation
◦ Induced innovation as a result of energy price changes has been Induced innovation as a result of energy price changes has been looked at by several authors.looked at by several authors.
◦ Popp (2002) uses US patent and trademark office data to look at Popp (2002) uses US patent and trademark office data to look at the effect of energy prices on energy efficiency innovations.the effect of energy prices on energy efficiency innovations.
◦ Innovation as a result of government policy choices has been looked Innovation as a result of government policy choices has been looked at by several others.at by several others.
◦ Popp (2006) used patent data on patents filed by the US, Germany Popp (2006) used patent data on patents filed by the US, Germany and Japan in their home countries to look at innovation spillovers. and Japan in their home countries to look at innovation spillovers.
◦ Johnston et al (2008) looked at the effect of policy changes within Johnston et al (2008) looked at the effect of policy changes within most industrialized nations on innovation using country patent most industrialized nations on innovation using country patent counts.counts.

Problem StatementProblem Statement• Inefficient investment in Green Energy R&D.Inefficient investment in Green Energy R&D.
• Mechanism to increase innovation complicated by market structure.Mechanism to increase innovation complicated by market structure.
◦ Markets not perfectly competitive.Markets not perfectly competitive.
• Must account for different stages of competition.Must account for different stages of competition.
◦ Renewable energy firms compete amongst other renewable Renewable energy firms compete amongst other renewable energy firms to innovate new products.energy firms to innovate new products.
◦ Renewable energy firms compete against traditional energy Renewable energy firms compete against traditional energy firms to supply energy to the market. firms to supply energy to the market.
◦ Firms from different countries face different incentives to Firms from different countries face different incentives to innovate.innovate.
Research ObjectivesResearch Objectives
• Develop theoretical model.Develop theoretical model.• From the model develop testable From the model develop testable
hypothesis.hypothesis.• Collect data and test hypothesis Collect data and test hypothesis
empirically.empirically.

Structure of 2 Stage GameStructure of 2 Stage Game
Stage 2Stage 2
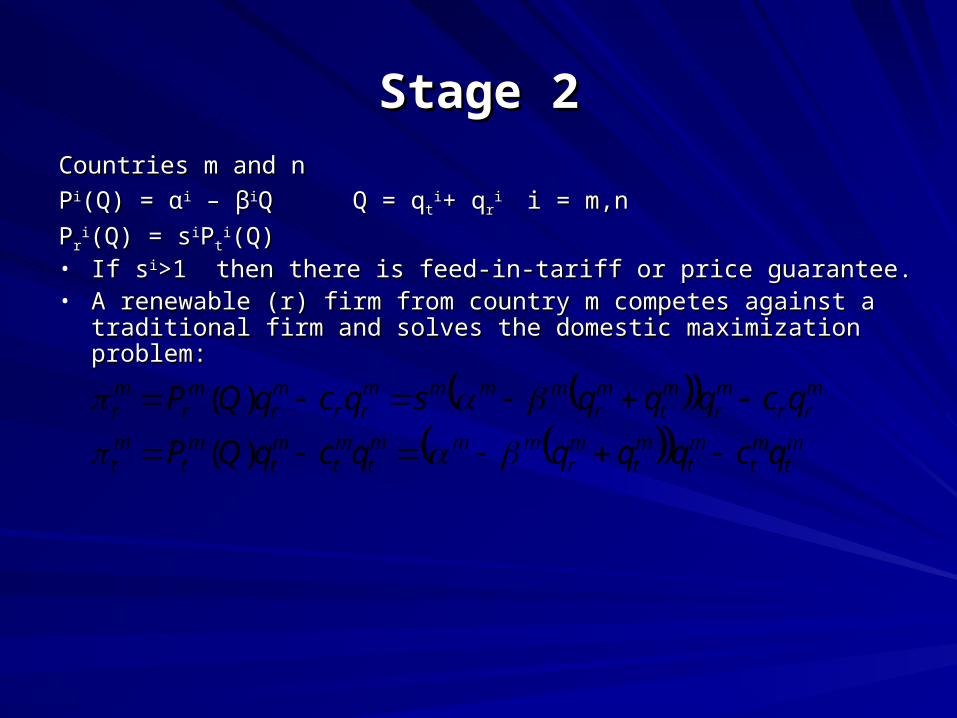
Countries m and nCountries m and n
PPii(Q) = α(Q) = αii – β – βiiQQ Q = qQ = qttii+ q+ qrr
ii i = m,ni = m,n
PPrrii(Q) = s(Q) = siiPPtt
ii(Q)(Q)• If sIf sii>1 then there is feed-in-tariff or price guarantee.>1 then there is feed-in-tariff or price guarantee.• A renewable (r) firm from country m competes against a traditional A renewable (r) firm from country m competes against a traditional
firm and solves the domestic maximization problem:firm and solves the domestic maximization problem:
mt
mt
mt
mt
mr
mmmt
mt
mt
mt
mt
mrr
mr
mt
mr
mmmmrr
mr
mr
mr
qcqqqqcqQP
qcqqqsqcqQP
)(
)(

Stage 2 ContinuedStage 2 Continued
• A renewable (r) firm from country m competes against a traditional firm and A renewable (r) firm from country m competes against a traditional firm and solves the international maximization problem:solves the international maximization problem:
• δδ measures the openness of an economy to an international firm. measures the openness of an economy to an international firm.
• ααnn = = ααmm = = αα, , ββnn = = ββmm = = ββ and c and cttnn = c = ctt
mm = c = ctt
mr
nrmr
nt
nt
nt
nt
nr
nnnt
nt
nt
nt
nt
nrnr
nr
nt
nr
nnnnrr
nr
nr
nr
qcqqqqcqQP
qcqqqsqcqQP
)(
)()(

Stage 1Stage 1
• Firm i’s probability of discovering the new Firm i’s probability of discovering the new technology Ptechnology P (x(xii) and satisfies:) and satisfies:
0 ≤ P0 ≤ P (x(xii) ≤ 1) ≤ 1 i=m,ni=m,n
P′(xP′(xii) > 1/k) > 1/k
P′′P′′ (x(xii) = 0) = 0
• If two firms discover at the same time then the If two firms discover at the same time then the winner is determined by a coin flip. winner is determined by a coin flip.
Pr(firm i is the winner) = Pr(firm i is the winner) =
Pr(firm i discovers)Pr(firm j doesn’t discover) Pr(firm i discovers)Pr(firm j doesn’t discover) + 0.5 Pr(firm i discovers)Pr(firm j discovers)+ 0.5 Pr(firm i discovers)Pr(firm j discovers)

Stage 2 ContinuedStage 2 Continued
• Both firms have the same quadratic R&D cost function:Both firms have the same quadratic R&D cost function:
where 0 ≤ φ ≤ 1where 0 ≤ φ ≤ 1
φ = 1 φ = 1 no subsidy no subsidy
• ππmm* is the profit that the renewable winner from country m * is the profit that the renewable winner from country m
will receive with the patent.will receive with the patent.
• ππmm* is exogenous and determined from stage 2.* is exogenous and determined from stage 2.
22 ix
2)(2
1*)]()(5.0))(1)(([)(
mxm
mnxP
mxP
nxP
mxP
mprofitE

Theoretical ResultsTheoretical Results• Result 1: Increase in feed-in-tariffs or price guarantees Result 1: Increase in feed-in-tariffs or price guarantees
increases the research of both domestic and increases the research of both domestic and international firms equally provided it is an open international firms equally provided it is an open economy (economy (δδ=0) and research subsidies are equal =0) and research subsidies are equal
• ((φφmm= = φφnn).).
• Result 2: If economies aren’t completely open an Result 2: If economies aren’t completely open an increase in feed-in-tariffs or price guarantees increases increase in feed-in-tariffs or price guarantees increases the research of both domestic and international firms; the research of both domestic and international firms; however domestic firms research increases more. however domestic firms research increases more.
0**
0**
n
n
n
m
m
n
m
m
ds
dx
ds
dx
ds
dx
ds
dx
0**
0*
,*
m
n
m
m
m
n
m
m
ds
dx
ds
dx
ds
dx
ds
dx

Theoretical Results ContinuedTheoretical Results Continued
• Result 3: An increase in research subsidy φResult 3: An increase in research subsidy φii will will
increase the equilibrium level of research of the increase the equilibrium level of research of the domestic firm and decrease the international firm’s domestic firm and decrease the international firm’s research.research.
0*
0*
m
n
m
m
d
dx
d
dx

EmpiricalEmpirical
• The basic specification will be as follows, The basic specification will be as follows, where t is time from 1987 to 2007 and i is where t is time from 1987 to 2007 and i is country: country:
tititi
ti
tjjtiti
tittiti
priceoilGDPC
GDPPPS
SWSpat
,,5,4
,32,10,
,2,1,
lnln
lnln

PatentsPatents• The European Patent Office maintains a searchable patent The European Patent Office maintains a searchable patent
database.database.◦ European, worldwide and US patentsEuropean, worldwide and US patents◦ 1978 to present1978 to present◦ Searchable based on:Searchable based on:
◦ keyword(s) in title or abstractkeyword(s) in title or abstract◦ application number application number ◦ publication number publication number ◦ priority number priority number ◦ inventorinventor◦ applicantapplicant◦ European classification (ECLA)European classification (ECLA)◦ International Patent Classification (IPC)International Patent Classification (IPC)
• Relevant patents can be determined using International Patent Relevant patents can be determined using International Patent Classification (IPC) codes (World International Patent Organization, Classification (IPC) codes (World International Patent Organization, 2008)2008)

Patents ContinuedPatents Continued
WindWind ClassClass Sub-Sub-ClassesClasses
Wind motors with rotation axis substantially in Wind motors with rotation axis substantially in wind direction wind direction F03DF03D 1/001/00
Wind motors with rotation axis substantially at Wind motors with rotation axis substantially at right angle to wind directionright angle to wind direction F03DF03D 3/003/00
Controlling wind motorsControlling wind motors F03DF03D 7/007/00
Adaptations of wind motors for special use; Adaptations of wind motors for special use; Combinations of wind motors with apparatus Combinations of wind motors with apparatus driven therebydriven thereby
F03DF03D 9/009/00
Details, component parts, or accessories not Details, component parts, or accessories not provided for in, or of interest apart from, the provided for in, or of interest apart from, the other groups of this subclass ie Transmission other groups of this subclass ie Transmission of power, e.g. using hollow exhausting blades of power, e.g. using hollow exhausting blades or mounting structuresor mounting structures
F03DF03D 11/0011/00
IPC codes for Wind

Wind Power PatentsWind Power Patents
0
10
20
30
40
50
60
70
80
1978
1979
1980
1981
1982
1983
1984
1985
1986
1987
1988
1989
1990
1991
1992
1993
1994
1995
1996
1997
1998
1999
2000
2001
2002
2003
2004
2005
2006
2007
Priority Date
Pat
ents
Germany
Denmark
Japan
US
Great Britain
Explanatory VariablesExplanatory Variables
• Policy variables will be determined using the Policy variables will be determined using the International Energy Agency Global Renewable International Energy Agency Global Renewable Energy Policies and Measures Database Energy Policies and Measures Database (OECD/IEA, 2008b). (OECD/IEA, 2008b).
◦ The database allows the searching of policies The database allows the searching of policies based on type of policy, country and policy based on type of policy, country and policy target.target.
◦ Available from 1974 up to July 2008.Available from 1974 up to July 2008.
• Oil price can be found using IEA database.Oil price can be found using IEA database.
Related Documents