The Effects of Grazing The Effects of Grazing Management on Water Management on Water Quality Quality Kirk Schwarte Kirk Schwarte Iowa State University Iowa State University [email protected] [email protected]

The Effects of Grazing Management on Water Quality Kirk Schwarte Iowa State University [email protected].
Dec 27, 2015
Welcome message from author
This document is posted to help you gain knowledge. Please leave a comment to let me know what you think about it! Share it to your friends and learn new things together.
Transcript
The Effects of Grazing The Effects of Grazing Management on Water QualityManagement on Water Quality
Kirk Schwarte Kirk Schwarte
Iowa State UniversityIowa State [email protected]@iastate.edu
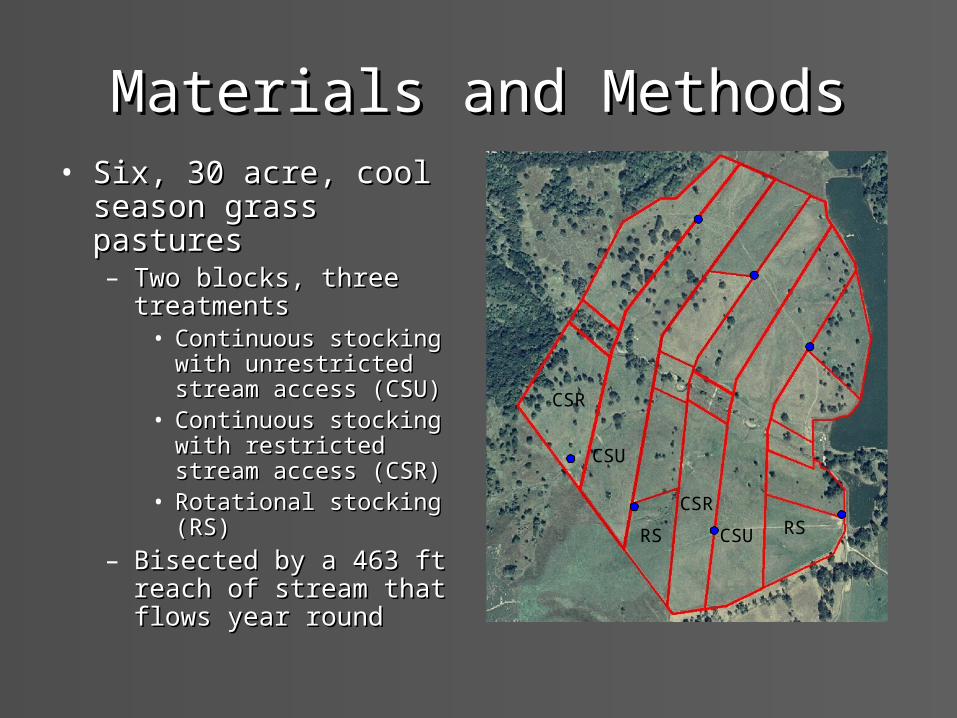
Materials and MethodsMaterials and Methods• Six, 30 acre, cool season Six, 30 acre, cool season
grass pasturesgrass pastures– Two blocks, three Two blocks, three
treatmentstreatments• Continuous stocking with Continuous stocking with
unrestricted stream unrestricted stream access (CSU)access (CSU)
• Continuous stocking with Continuous stocking with restricted stream access restricted stream access (CSR)(CSR)
• Rotational stocking (RS)Rotational stocking (RS)
– Bisected by a 463 ft reach Bisected by a 463 ft reach of stream that flows year of stream that flows year roundround
CSR
CSU
RS RSCSU
CSR

Effects of Poorly Managed GrazingEffects of Poorly Managed Grazing
• Cattle congregate near water Cattle congregate near water sourcessources– Disturb banksDisturb banks
• Shear force from hooves break down bank Shear force from hooves break down bank structurestructure
– Increases surface runoffIncreases surface runoff• Increases soil bulk densityIncreases soil bulk density• Promotes sediment, phosphorus, and pathogen Promotes sediment, phosphorus, and pathogen
loadingloading
– Decrease streamside vegetationDecrease streamside vegetation• Decreases stream shadeDecreases stream shade• Increases stream width to depth ratioIncreases stream width to depth ratio• Decreases ‘erosion resistance’ by plantsDecreases ‘erosion resistance’ by plants

Non-Point Source PollutionNon-Point Source Pollution
Sediment Sediment
Water Clarity Water Clarity Water Quality Water Quality
Die / DecomposeDie / Decompose
Aquatic Plants Aquatic Plants Algae Algae
Nitrogen Nitrogen Phosphorus Phosphorus
Hypoxia / Hypoxia / Eutrophication Eutrophication
Aquatic Aquatic Life Life
Oxygen Oxygen
BacteriaBacteriaPathogens Pathogens
Runoff Runoff
Impaired Impaired WatersWaters
Impaired WatersImpaired Waters
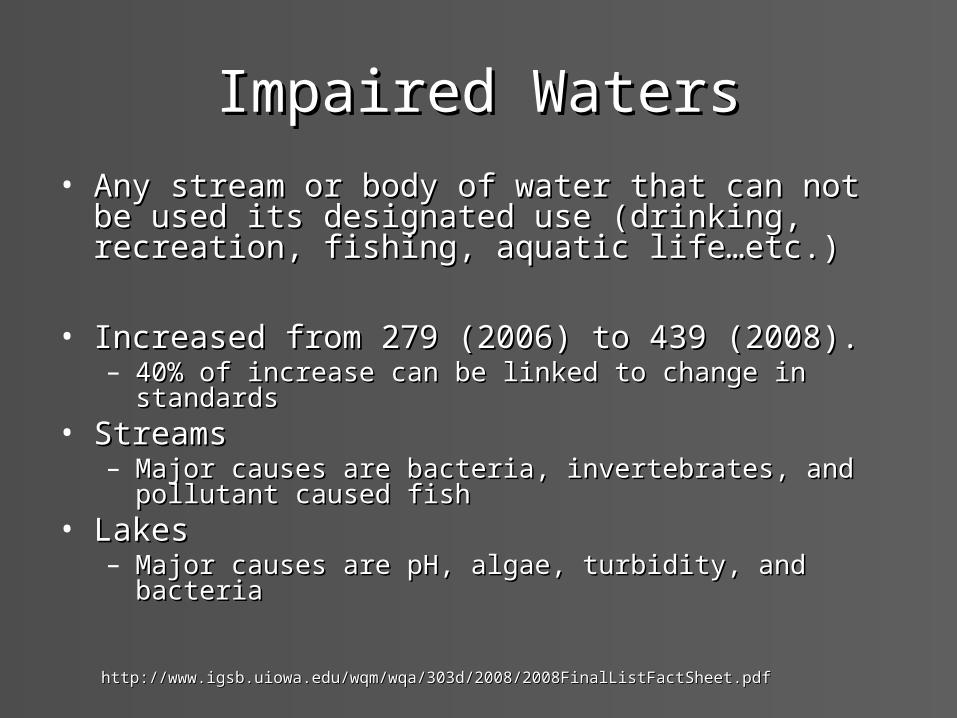
• Any stream or body of water that can not be used its Any stream or body of water that can not be used its designated use (drinking, recreation, fishing, aquatic designated use (drinking, recreation, fishing, aquatic life…etc.)life…etc.)
• Increased from 279 (2006) to 439 (2008). Increased from 279 (2006) to 439 (2008). – 40% of increase can be linked to change in standards40% of increase can be linked to change in standards
• StreamsStreams– Major causes are bacteria, invertebrates, and pollutant caused Major causes are bacteria, invertebrates, and pollutant caused
fishfish• LakesLakes
– Major causes are pH, algae, turbidity, and bacteriaMajor causes are pH, algae, turbidity, and bacteria
http://www.igsb.uiowa.edu/wqm/wqa/303d/2008/2008FinalListFactSheet.pdfhttp://www.igsb.uiowa.edu/wqm/wqa/303d/2008/2008FinalListFactSheet.pdf
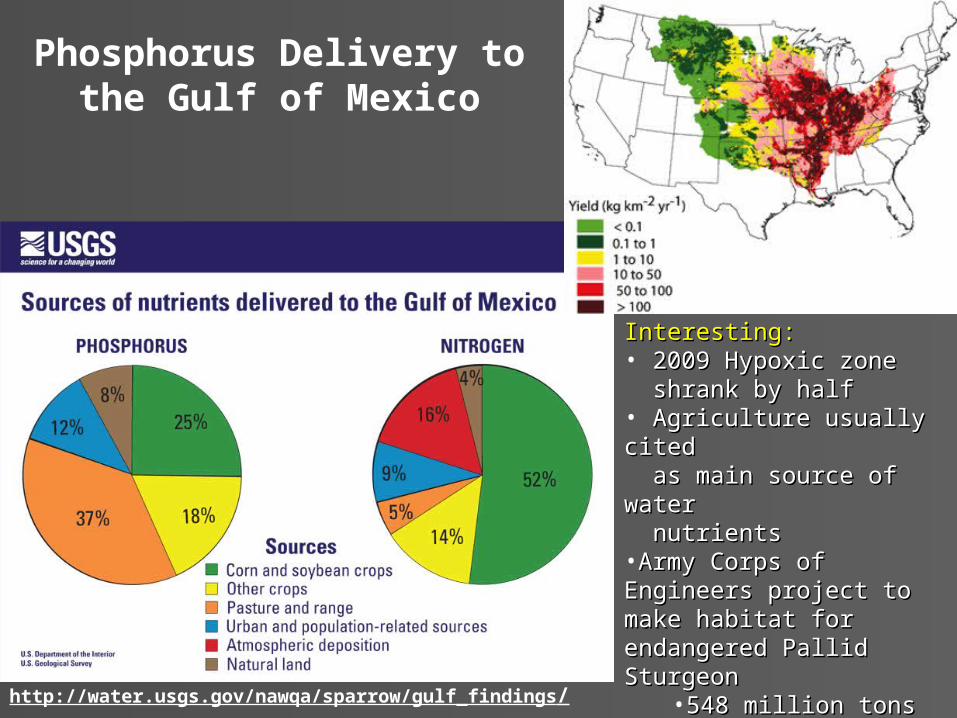
http://water.usgs.gov/nawqa/sparrow/gulf_findings/
Phosphorus Delivery to the Gulf of Mexico
Interesting: Interesting: • 2009 Hypoxic zone2009 Hypoxic zone shrank by halfshrank by half• Agriculture usually citedAgriculture usually cited as main source of water as main source of water nutrientsnutrients•Army Corps of Engineers Army Corps of Engineers project to make habitat for project to make habitat for endangered Pallid Sturgeonendangered Pallid Sturgeon
•548 million tons of soil548 million tons of soil•358,403 lbs of P358,403 lbs of P•40-60,000 acres in 5ft of 40-60,000 acres in 5ft of slurry slurry
(Feedstuffs, (Feedstuffs, 2010)2010)

Surface RunoffSurface RunoffPercent Runoff
0
0.1
0.2
0.3
0.4
0.5
0.6
0.7
0.8
CSU Vegetative CSU Bare CSR Vegetative RS Vegetative RS Bare
Treatment
%%Slopes ranged from Slopes ranged from 3.43.4°° to 33 to 33°°, with the , with the average of 13average of 13°°
Sward Height
0
2
4
6
8
10
12
CSU Vegetative CSU Bare CSR Vegetative RS Vegetative RS Bare
Treatment
cmcm

Sediment/Phosphorus Surface RunoffSediment/Phosphorus Surface Runoff
Lbs/acreLbs/acre
Phosphorus
0
2
4
6
8
10
12
14
CSU Vegetative CSU Bare CSR Vegetative RS Vegetative RS Bare
Treatment
Lbs/acreLbs/acre
Sediment
0
500
1000
1500
2000
2500
3000
CSU Veg CSU Bare CSR Veg RS Veg RS Bare
Treatment
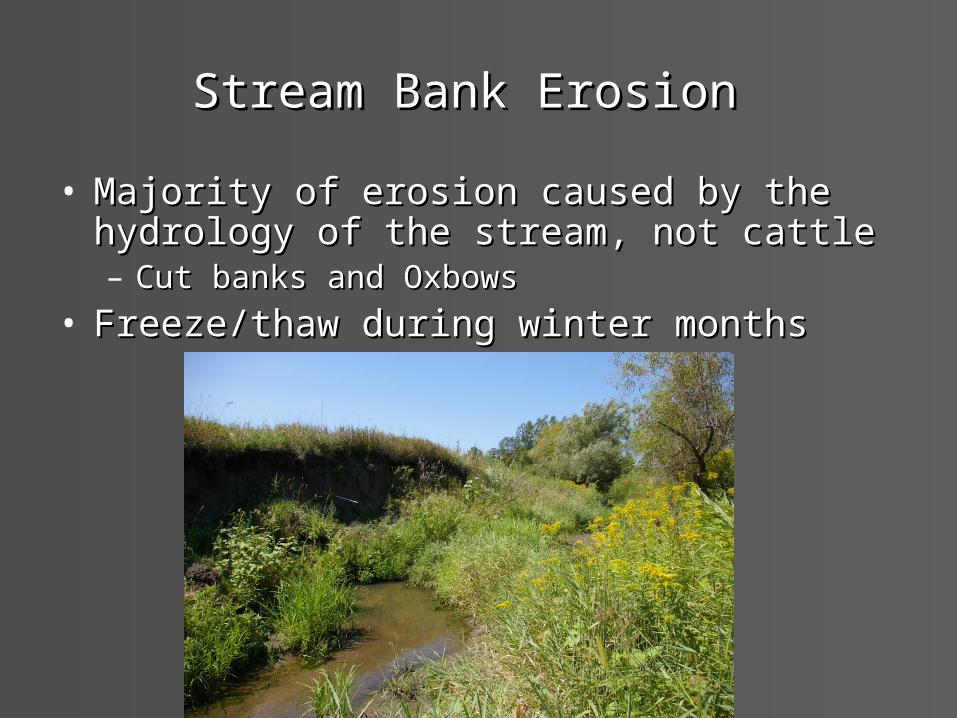
Stream Bank Erosion Stream Bank Erosion
• Majority of erosion caused by the hydrology of Majority of erosion caused by the hydrology of the stream, not cattlethe stream, not cattle– Cut banks and OxbowsCut banks and Oxbows
• Freeze/thaw during winter monthsFreeze/thaw during winter months
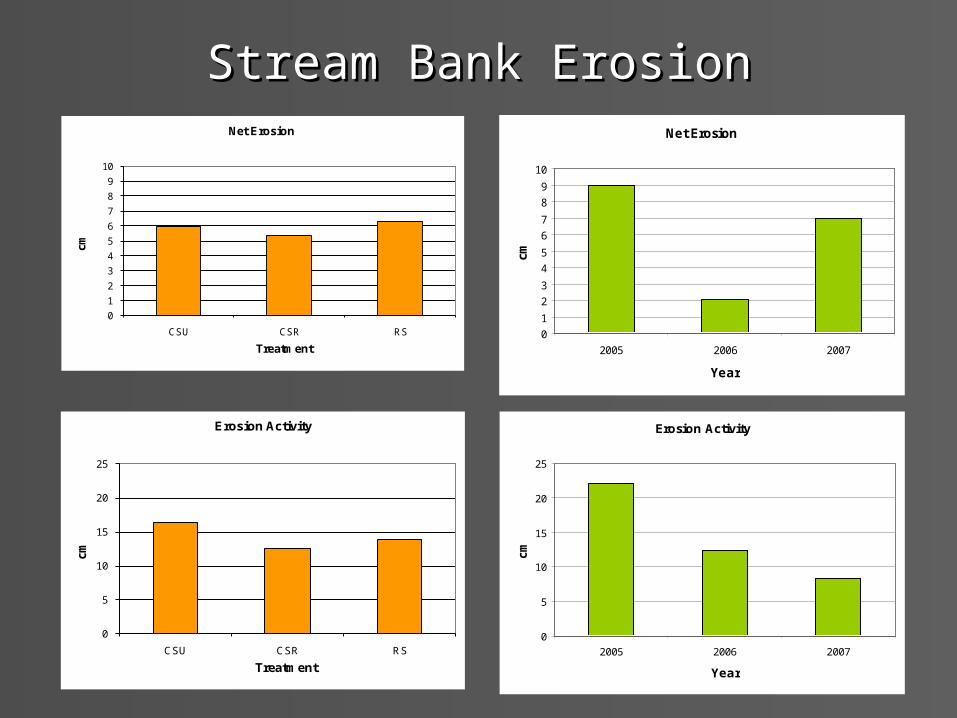
Stream Bank ErosionStream Bank Erosion
0
1
2
3
4
5
6
7
8
9
10
CSU CSR RS
cm
Treatment
Net Erosion Net Erosion
0
1
2
3
4
5
6
7
8
9
10
2005 2006 2007
Year
cm
0
5
10
15
20
25
CSU CSR RS
cm
Treatment
Erosion Activity Erosion Activity
0
5
10
15
20
25
2005 2006 2007
Year
cm
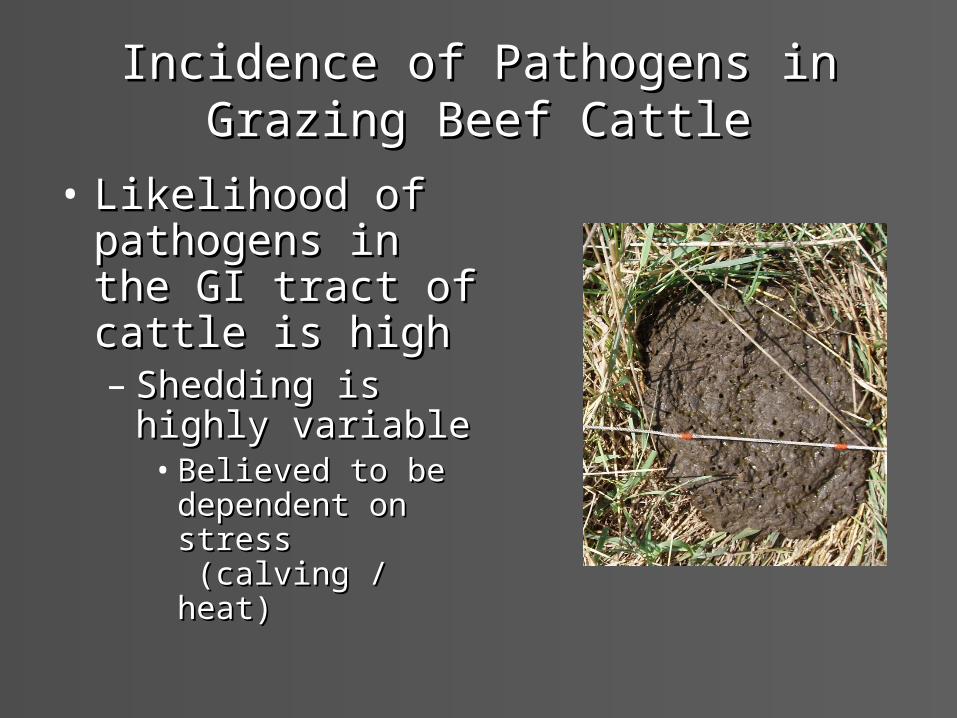
Incidence of Pathogens in Grazing Incidence of Pathogens in Grazing Beef CattleBeef Cattle
• Likelihood of Likelihood of pathogens in the GI pathogens in the GI tract of cattle is hightract of cattle is high– Shedding is highly Shedding is highly
variablevariable• Believed to be Believed to be
dependent on stress dependent on stress (calving / heat) (calving / heat)

PathogensPathogens
• E.coli 0157-H7E.coli 0157-H7
June August September
20072007 0%0% 0%0% 15.6%15.6%
20082008 0%0% 0%0% 0%0%
20092009 0%0% 0%0% 0%0%
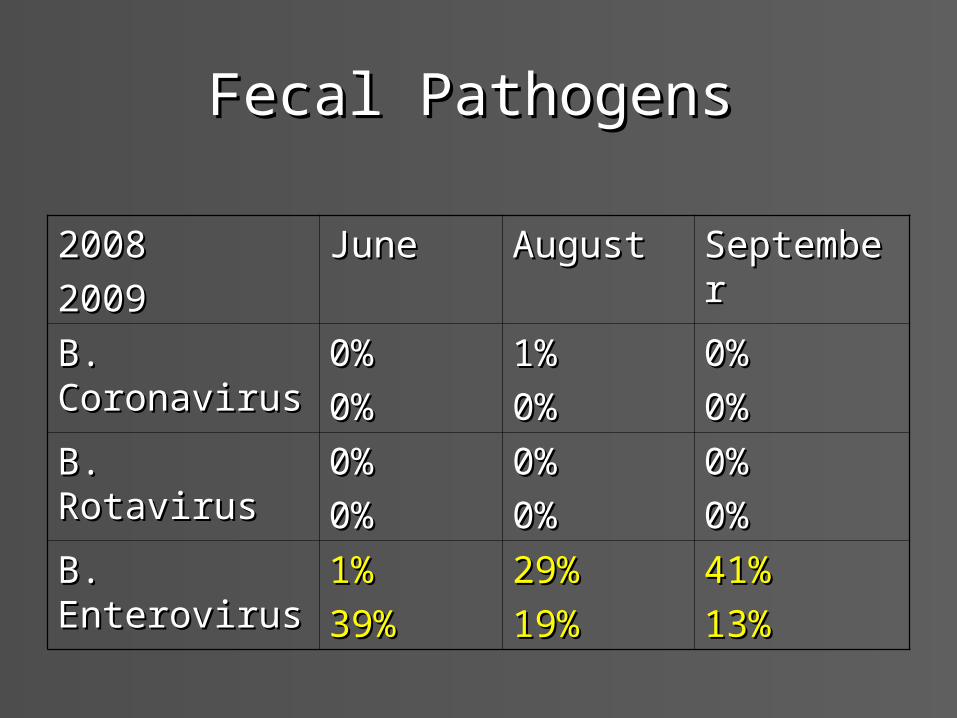
Fecal PathogensFecal Pathogens
20082008
20092009
JuneJune AugustAugust SeptemberSeptember
B. CoronavirusB. Coronavirus 0%0%
0%0%
1%1%
0%0%
0%0%
0%0%
B. RotavirusB. Rotavirus 0%0%
0%0%
0%0%
0%0%
0%0%
0%0%
B. EnterovirusB. Enterovirus 1%1%
39%39%
29%29%
19%19%
41%41%
13%13%

Runoff PathogensRunoff Pathogens
20082008
20092009
AprilApril JuneJune AugustAugust OctoberOctober
E.Coli 0157:H7E.Coli 0157:H7
00
00
00
00
00
00
00
B. CoronavirusB. Coronavirus
00
00
00
00
00
00
00
B. RotavirusB. Rotavirus
00
00
00
00
00
00
00
B. EnterovirusB. Enterovirus
11
11
00
00
00
22
00

Mean Concentrations of Fecal Coliforms in Mean Concentrations of Fecal Coliforms in Upstream and Downstream Samples from Upstream and Downstream Samples from Pastures in the Lake Rathbun WatershedPastures in the Lake Rathbun Watershed
0
500
1000
1500
2000
2500
Mar
chApr
ilM
ayJu
ne July
AugSep
tO
ctNov
Fec
al c
oli
form
s, C
FU
/100
ml Upstream
Downstream
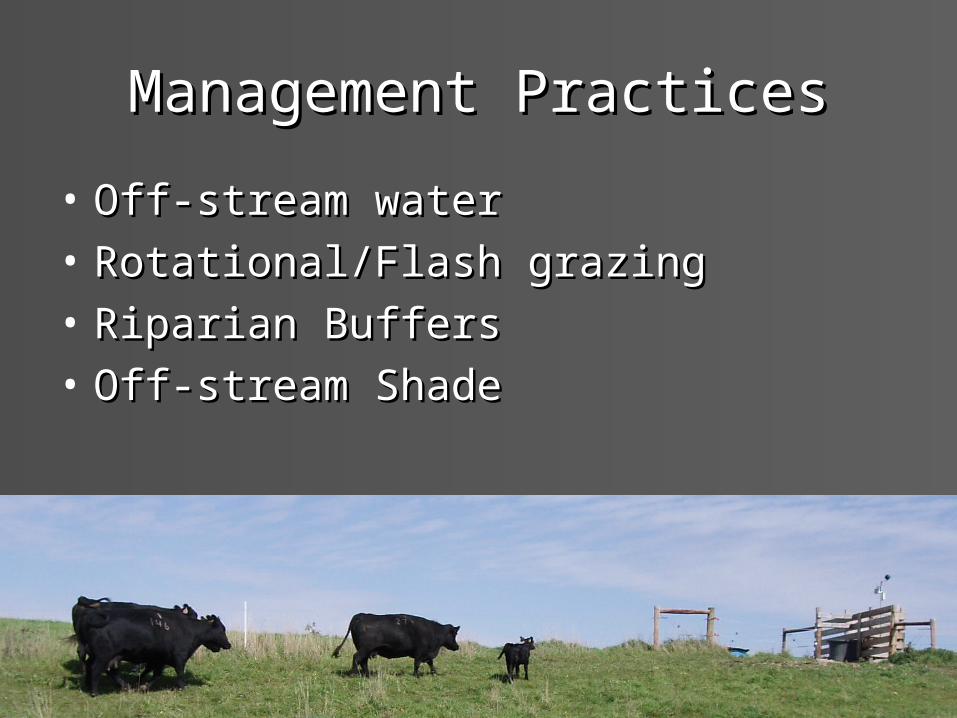
Management PracticesManagement Practices
• Off-stream waterOff-stream water
• Rotational/Flash grazingRotational/Flash grazing
• Riparian BuffersRiparian Buffers
• Off-stream ShadeOff-stream Shade
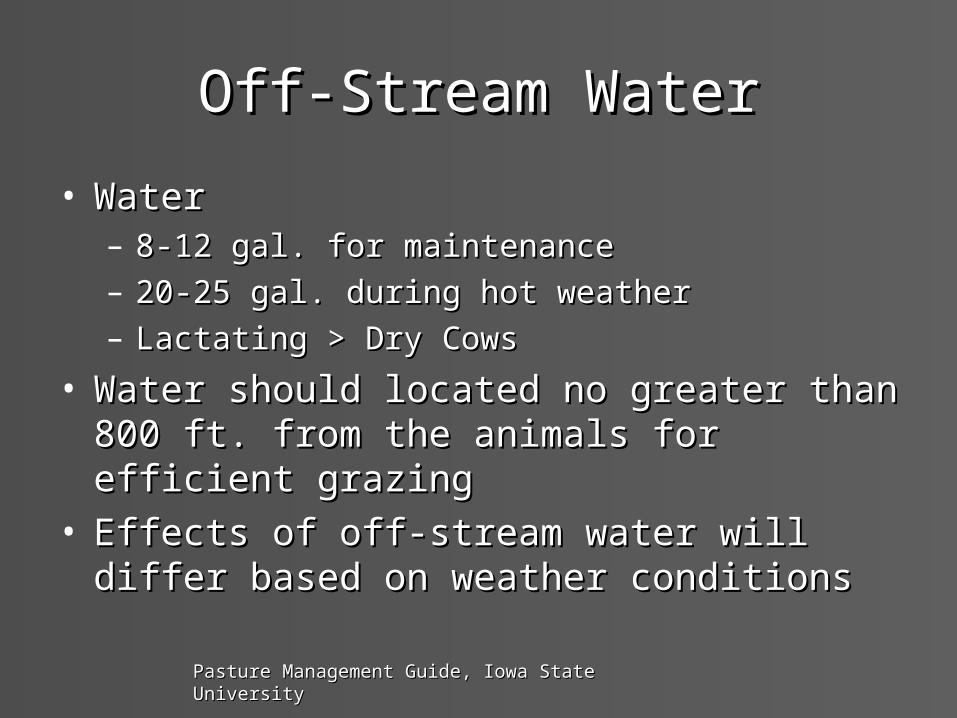
Off-Stream WaterOff-Stream Water
• WaterWater– 8-12 gal. for maintenance 8-12 gal. for maintenance – 20-25 gal. during hot weather 20-25 gal. during hot weather – Lactating > Dry CowsLactating > Dry Cows
• Water should located no greater than 800 ft. Water should located no greater than 800 ft. from the animals for efficient grazingfrom the animals for efficient grazing
• Effects of off-stream water will differ based on Effects of off-stream water will differ based on weather conditionsweather conditions
Pasture Management Guide, Iowa State UniversityPasture Management Guide, Iowa State University

Proportion of time spent within Proportion of time spent within 110 ft zone110 ft zone when when comparing the availability of an comparing the availability of an alternative wateralternative water
SourceSource
0.0
2.0
4.0
6.0
8.0
10.0
12.0
14.0
16.0
Time within Zone, %
May June July August September
Month
CSU Open
CSU Closed
CSR Open
CSR Closed

Riparian BuffersRiparian Buffers
• Complete Complete exclusion from exclusion from riparian areasriparian areas
• Requires off-site Requires off-site water or stream water or stream crossingcrossing
• Eligible for Eligible for government government payments?payments?
Tr eat ment CSR CSU
Est i mat ed Pr obabi l i t y
0. 000. 010. 020. 030. 040. 050. 060. 070. 080. 090. 100. 110. 120. 130. 140. 150. 160. 170. 180. 190. 200. 210. 220. 230. 240. 250. 260. 270. 280. 290. 300. 31
Temper at ur e
0 10 20 30 40
, Cel s i us
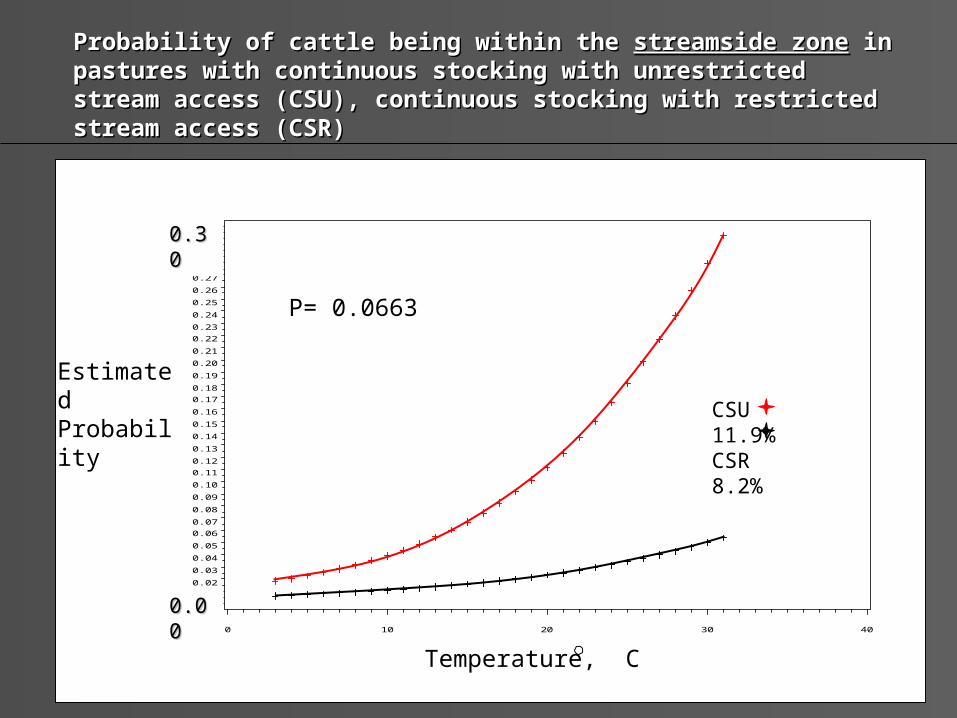
CSU 11.9%CSR 8.2%
Probability of cattle being within the Probability of cattle being within the streamside zonestreamside zone in pastures with in pastures with continuous stocking with unrestricted stream access (CSU), continuous stocking with unrestricted stream access (CSU), continuous stocking with restricted stream access (CSR)continuous stocking with restricted stream access (CSR)
Temperature, C
Estimated Probability
P= 0.0663
0.300.30
0.000.00
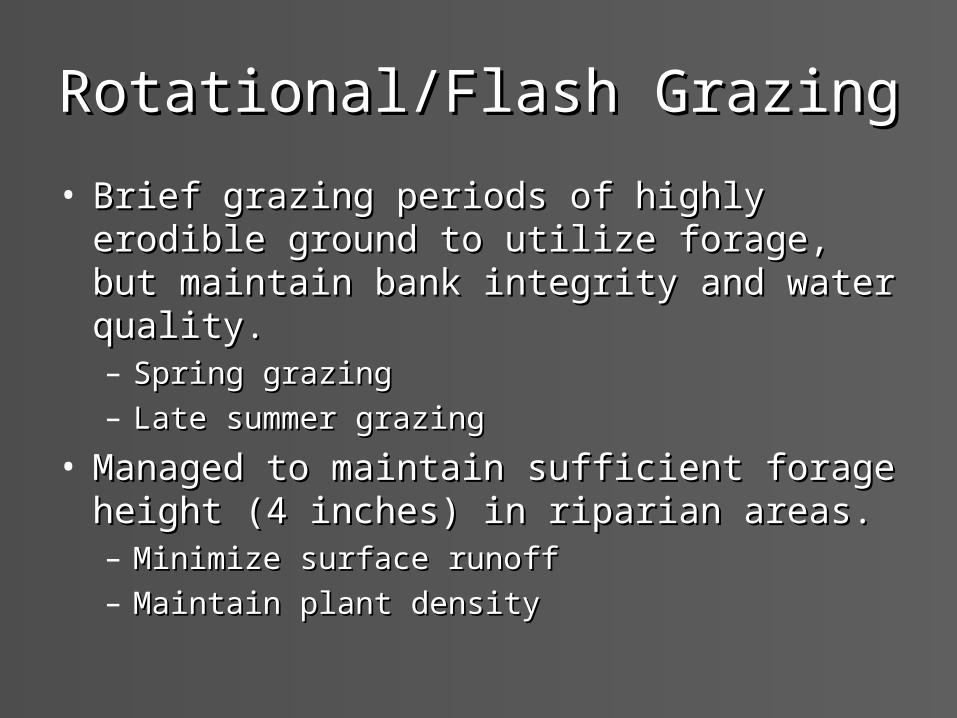
Rotational/Flash GrazingRotational/Flash Grazing
• Brief grazing periods of highly erodible ground to Brief grazing periods of highly erodible ground to utilize forage, but maintain bank integrity and utilize forage, but maintain bank integrity and water quality. water quality. – Spring grazing Spring grazing – Late summer grazingLate summer grazing
• Managed to maintain sufficient forage height (4 Managed to maintain sufficient forage height (4 inches) in riparian areas. inches) in riparian areas. – Minimize surface runoffMinimize surface runoff– Maintain plant densityMaintain plant density
0
2
4
6
8
10
12
14
Time within Zone, %
May June July August September
Month
CSU
CSR
RS
RS RiparianPaddock
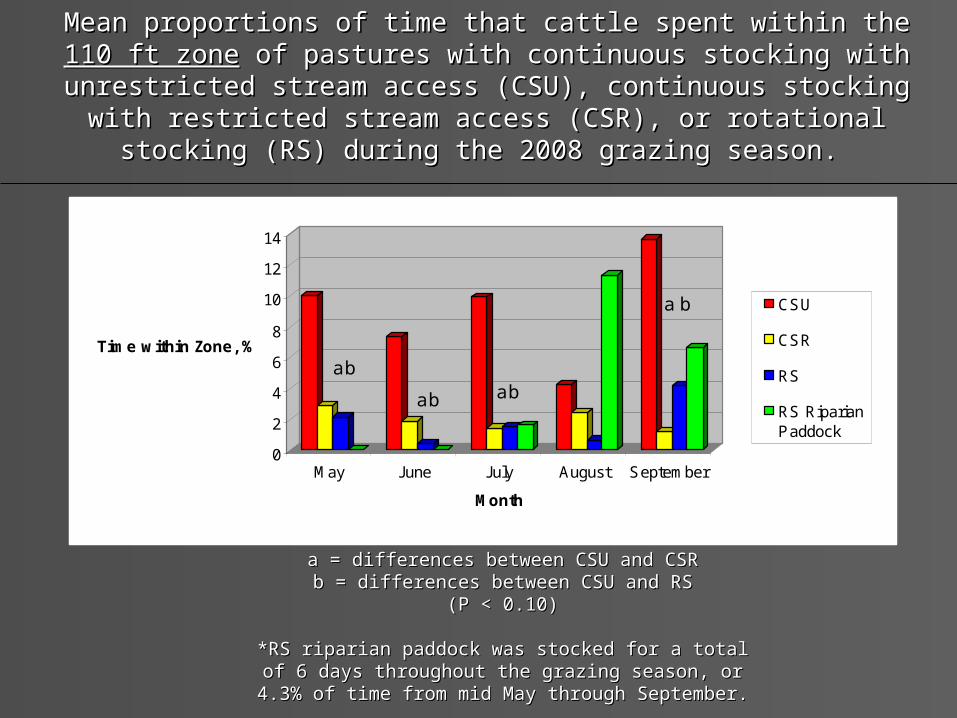
Mean proportions of time that cattle spent within the Mean proportions of time that cattle spent within the 110 ft zone110 ft zone of of pastures with continuous stocking with unrestricted stream access (CSU), pastures with continuous stocking with unrestricted stream access (CSU),
continuous stocking with restricted stream access (CSR), or rotational continuous stocking with restricted stream access (CSR), or rotational stocking (RS) during the 2008 grazing season. stocking (RS) during the 2008 grazing season.
a
a
a ab
bb
b
a = differences between CSU and CSRa = differences between CSU and CSRb = differences between CSU and RSb = differences between CSU and RS
(P < 0.10)(P < 0.10)
*RS riparian paddock was stocked for a total of 6 *RS riparian paddock was stocked for a total of 6 days throughout the grazing season, or 4.3% of time days throughout the grazing season, or 4.3% of time
from mid May through September.from mid May through September.

Off-stream ShadeOff-stream Shade
• Cattle seek shade during the hot summer Cattle seek shade during the hot summer daysdays– Allows for a place for cattle to congregate and Allows for a place for cattle to congregate and
rest away from water sourcesrest away from water sources– May ease pressure on grasses near the May ease pressure on grasses near the
stream from high foot trafficstream from high foot traffic

Stream Bank ForageStream Bank Forage
Bank Sward Ht
0
5
10
15
20
May June July August September October
Month
Cm
CSU
CSR
RS
Bank Bare Cover
0102030405060
May June July August September October
Month
%
CSU
CSR
RS
Pasture Size and ShapePasture Size and Shape
• Many pastures were developed on highly Many pastures were developed on highly erodible land near streamserodible land near streams
• If the pasture has a large percentage of If the pasture has a large percentage of the pasture in a riparian area, cattle don’t the pasture in a riparian area, cattle don’t have anywhere else to gohave anywhere else to go
• Even at cool temperatures, cattle will be Even at cool temperatures, cattle will be found near the water sourcefound near the water source
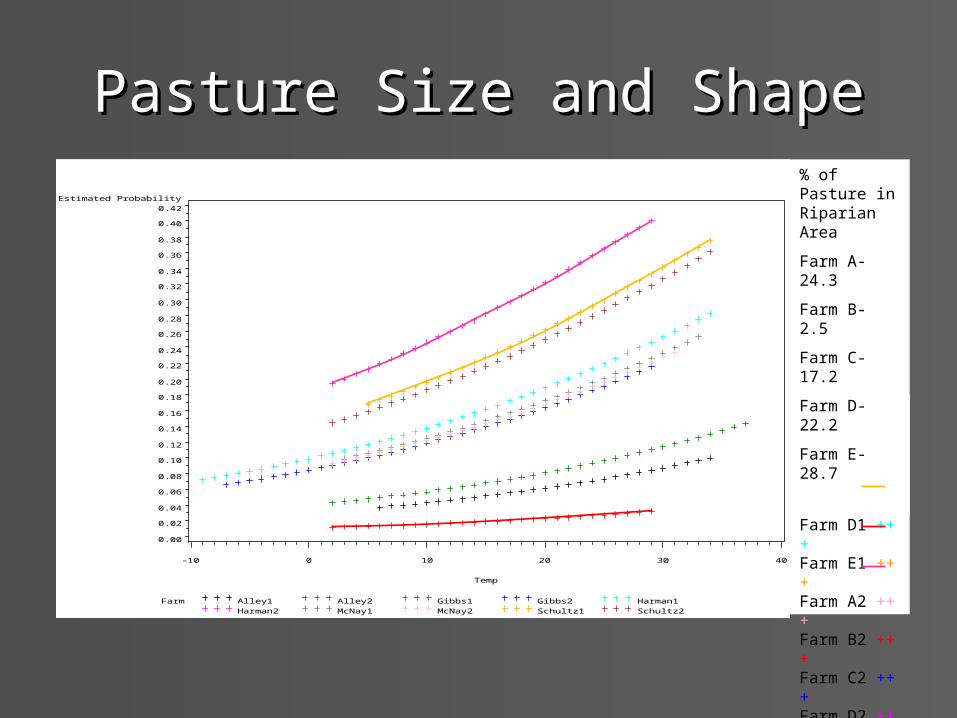
Pasture Size and ShapePasture Size and Shape
Far m Al l ey1 Al l ey2 Gi bbs1 Gi bbs2 Har man1Har man2 McNay1 McNay2 Schul t z1 Schul t z2
Es t i mat ed Pr obabi l i t y
0. 00
0. 02
0. 04
0. 06
0. 08
0. 10
0. 12
0. 14
0. 16
0. 18
0. 20
0. 22
0. 24
0. 26
0. 28
0. 30
0. 32
0. 34
0. 36
0. 38
0. 40
0. 42
Temp
- 10 0 10 20 30 40
Farm A1 +++Farm B1 +++Farm C1 +++Farm D1 +++Farm E1 +++Farm A2 +++Farm B2 +++Farm C2 +++Farm D2 +++Farm E2 +++
% of Pasture in Riparian Area
Farm A- 24.3
Farm B- 2.5
Farm C-17.2
Farm D-22.2
Farm E- 28.7

•Treatments to control NPS of pasture streams seem likely to be most effective on small or narrow pastures.

Environmental Quality Incentives Environmental Quality Incentives Program (EQIP)Program (EQIP)
• Provides support to landowners to implement Provides support to landowners to implement programs that will benefit the conservation of our programs that will benefit the conservation of our nature resourcesnature resources
• Provides assistance in building fences, wells Provides assistance in building fences, wells and water sources, stream crossings, grass and water sources, stream crossings, grass seeding, and more…seeding, and more…
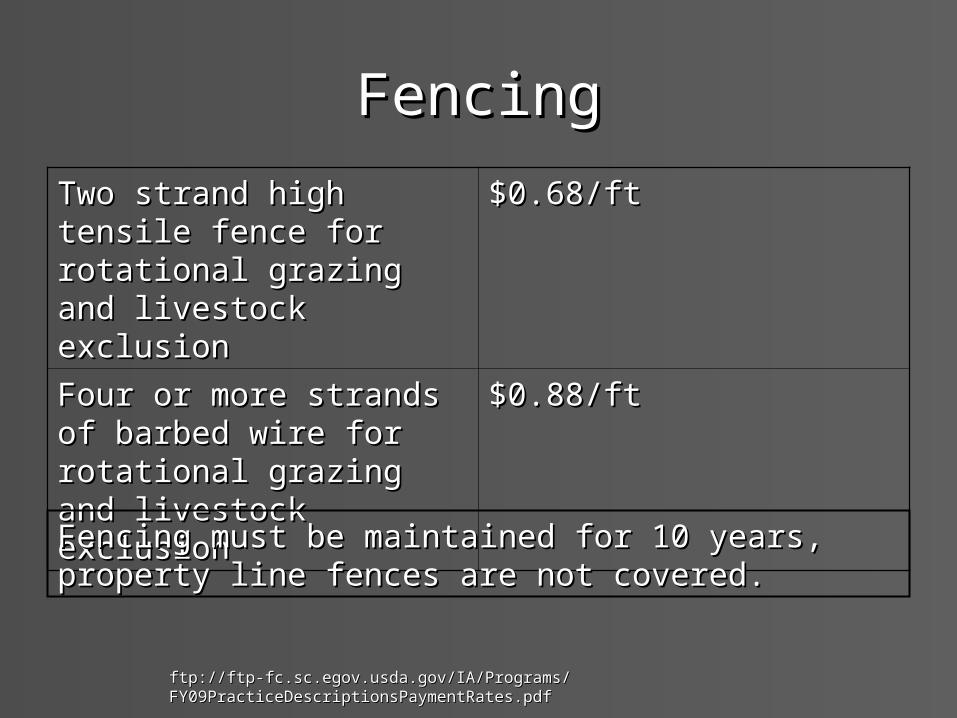
FencingFencing
ftp://ftp-fc.sc.egov.usda.gov/IA/Programs/FY09PracticeDescriptionsPaymentRates.pdfftp://ftp-fc.sc.egov.usda.gov/IA/Programs/FY09PracticeDescriptionsPaymentRates.pdf
Two strand high tensile Two strand high tensile fence for rotational grazing fence for rotational grazing and livestock exclusionand livestock exclusion
$0.68/ft$0.68/ft
Four or more strands of Four or more strands of barbed wire for rotational barbed wire for rotational grazing and livestock grazing and livestock exclusionexclusion
$0.88/ft$0.88/ft
Fencing must be maintained for 10 years, property line Fencing must be maintained for 10 years, property line fences are not covered. fences are not covered.
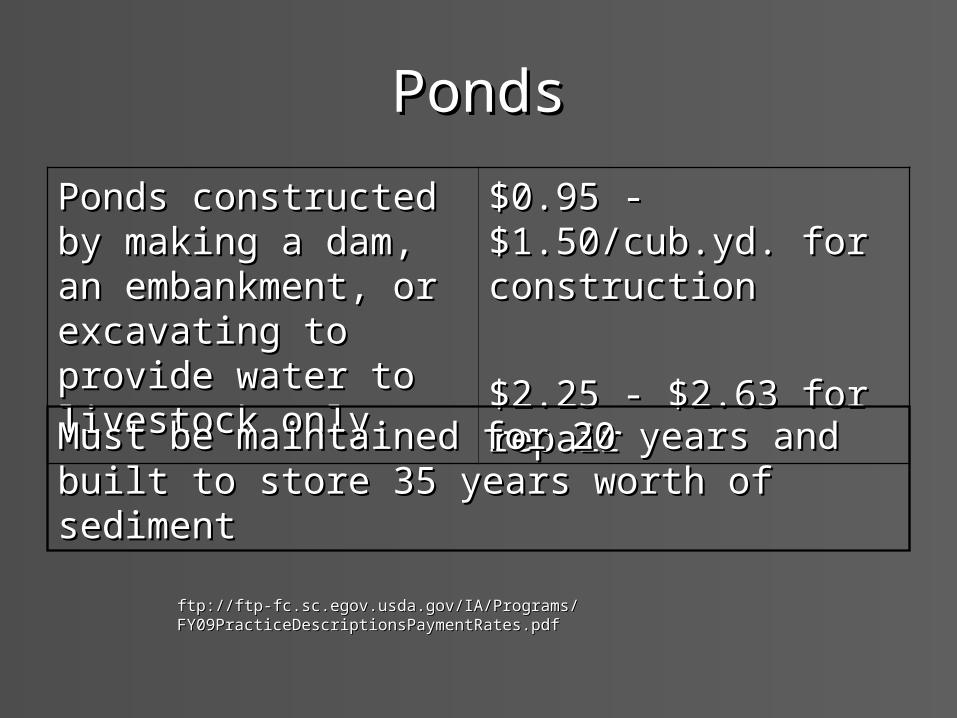
PondsPonds
Ponds constructed by Ponds constructed by making a dam, an making a dam, an embankment, or embankment, or excavating to provide excavating to provide water to livestock only. water to livestock only.
$0.95 - $1.50/cub.yd. for $0.95 - $1.50/cub.yd. for constructionconstruction
$2.25 - $2.63 for repair$2.25 - $2.63 for repair
Must be maintained for 20 years and built to store Must be maintained for 20 years and built to store 35 years worth of sediment35 years worth of sediment
ftp://ftp-fc.sc.egov.usda.gov/IA/Programs/FY09PracticeDescriptionsPaymentRates.pdfftp://ftp-fc.sc.egov.usda.gov/IA/Programs/FY09PracticeDescriptionsPaymentRates.pdf

Prescribed GrazingPrescribed Grazing
To improve and maintain To improve and maintain desired species, plant desired species, plant vigor, and plant quality vigor, and plant quality to maintain a healthy to maintain a healthy herd, quality surface and herd, quality surface and subsurface water, subsurface water, reduce soil erosion, and reduce soil erosion, and improve soil conditionsimprove soil conditions
$40 - $80/acre$40 - $80/acre
A one time payment with A one time payment with a maximum of $50,000. a maximum of $50,000.
Other grazing practices must be followed and documented Other grazing practices must be followed and documented before a payment is received. before a payment is received.
ftp://ftp-fc.sc.egov.usda.gov/IA/Programs/FY09PracticeDescriptionsPaymentRates.pdfftp://ftp-fc.sc.egov.usda.gov/IA/Programs/FY09PracticeDescriptionsPaymentRates.pdf

Stream CrossingsStream Crossings
For the construction of a For the construction of a culvert/bridge type culvert/bridge type stream crossing for stream crossing for livestock and small livestock and small equipmentequipment
Typically a 50’ length x Typically a 50’ length x 24” diam. tube 24” diam. tube
Rock- $22.25/cub.yd.Rock- $22.25/cub.yd.
Tube and Installation-Tube and Installation-
$1,500 each$1,500 each
Maintained for 10 years and landowner must get all Maintained for 10 years and landowner must get all construction permitsconstruction permits
ftp://ftp-fc.sc.egov.usda.gov/IA/Programs/FY09PracticeDescriptionsPaymentRates.pdfftp://ftp-fc.sc.egov.usda.gov/IA/Programs/FY09PracticeDescriptionsPaymentRates.pdf

Well and Water TankWell and Water Tank
To drill a hole to form an To drill a hole to form an aquifer aquifer
-Non-potable water-Non-potable water
-6” or less diameter pipe-6” or less diameter pipe
- 20 years- 20 years
$13.00/ft$13.00/ft
A tank or water trough to A tank or water trough to provide water for provide water for animalsanimals
-Can also cover the -Can also cover the pumppump
Varies… $0.38/gal Varies… $0.38/gal
ftp://ftp-fc.sc.egov.usda.gov/IA/Programs/FY09PracticeDescriptionsPaymentRates.pdfftp://ftp-fc.sc.egov.usda.gov/IA/Programs/FY09PracticeDescriptionsPaymentRates.pdf

IMPLICATIONS
• Stream bank erosion seems primarily related to stream hydrology.
• Coliform and pathogen loading of pasture streams comes from numerous sources including wildlife and humans.
• Improper grazing management may increase:– Bare ground near pasture streams– Manure concentration near pasture streams– Sediment and nutrient loading of precipitation runoff
• Risks of grazing on pasture streams may be controlled by:– Stabilized crossings with riparian buffers– Rotational grazing– Off-stream water
• Greatest risk of NPS pollution from grazing occurs in small and/or narrow pastures.

Questions?Questions?
This material is based upon work supported by the Cooperative State Research, Education, and Extension Service, U.S. Department of Agriculture, under Award No. 2006-51130-03700. Any opinions, findings, conclusions, or recommendations expressed in this publication are those of the authors and do not necessarily reflect the view of the U.S. Department of Agriculture.
Related Documents