THE EFFECTS OF FREQUENCY OF TESTING ON COLLEGE STUDENTS IN A PRINCIPLES OF MARKETING COURSE by D. William Deck, Jr. Dissertation submitted to the faculty of the Virginia Polytechnic Institute and State University in partial fulfillment of the requirements for the degree of DOCTOR OF PHILOSOPHY in Vocational and Technical Education APPROVED: _________________________________ William T. Price, Jr., Chair _________________________ _________________________ Susan. B. Asselin James. R. Brown _________________________ _________________________ William. G. Camp Samuel. D. Morgan December, 1998 Blacksburg, Virginia Key Words: Assessment, Cognitive Learning, Spacing Effect, Student Achievement, Testing Frequency

Welcome message from author
This document is posted to help you gain knowledge. Please leave a comment to let me know what you think about it! Share it to your friends and learn new things together.
Transcript
THE EFFECTS OF FREQUENCY OF TESTING ON COLLEGE STUDENTS IN
A PRINCIPLES OF MARKETING COURSE
by
D. William Deck, Jr.
Dissertation submitted to the faculty of the
Virginia Polytechnic Institute and State University
in partial fulfillment of the requirements for the degree of
DOCTOR OF PHILOSOPHY
in
Vocational and Technical Education
APPROVED:
_________________________________William T. Price, Jr., Chair
_________________________ _________________________Susan. B. Asselin James. R. Brown
_________________________ _________________________William. G. Camp Samuel. D. Morgan
December, 1998Blacksburg, Virginia
Key Words: Assessment, Cognitive Learning, Spacing Effect, StudentAchievement, Testing Frequency
ii
THE EFFECTS OF FREQUENCY OF TESTING ON COLLEGE STUDENTS IN
A PRINCIPLES OF MARKETING COURSE
by
D. William Deck, Jr.
Committee Chair: William T. Price, Jr.
(ABSTRACT)
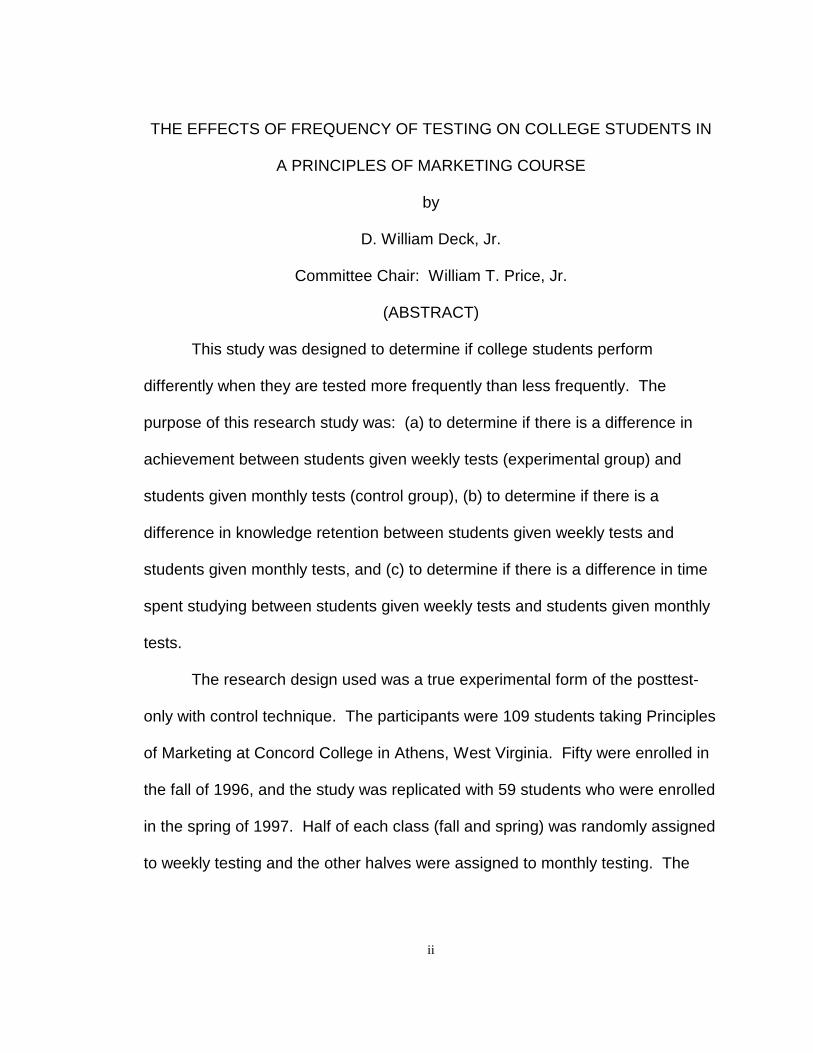
This study was designed to determine if college students perform
differently when they are tested more frequently than less frequently. The
purpose of this research study was: (a) to determine if there is a difference in
achievement between students given weekly tests (experimental group) and
students given monthly tests (control group), (b) to determine if there is a
difference in knowledge retention between students given weekly tests and
students given monthly tests, and (c) to determine if there is a difference in time
spent studying between students given weekly tests and students given monthly
tests.
The research design used was a true experimental form of the posttest-
only with control technique. The participants were 109 students taking Principles
of Marketing at Concord College in Athens, West Virginia. Fifty were enrolled in
the fall of 1996, and the study was replicated with 59 students who were enrolled
in the spring of 1997. Half of each class (fall and spring) was randomly assigned
to weekly testing and the other halves were assigned to monthly testing. The
iii
weekly and monthly groups were taught simultaneously by the researcher both
semesters.
To test for differences in achievement between the weekly group and the
monthly group, the mean test scores were compared at 80-question intervals.
To test for differences in knowledge retention between the weekly group and the
monthly group, the mean final exam scores were compared. To test for
differences in hours spent studying between the weekly group and the monthly
group, the means from the self-reported study hours surveys were compared at
80-question intervals.
Based on the results of analysis of covariance, the research showed a
significant difference in achievement between the weekly and the monthly
groups in favor of the weekly group (p = .007). However, the difference between
the weekly and monthly group final exam scores was not significant (p = .553),
and the difference between the weekly and monthly groups’ self-reported study
hours was also not significant (p = .231).
iv
ACKNOWLEDGMENTS
The author would like to offer sincere thanks to those individuals who
made the completion of the Doctor of Philosophy degree possible. Thank you to
Dr. Bill Price, committee chair, for your help and guidance along the way. Thank
you to the other members of the Doctoral committee, Dr. Susan Asselin, Dr. Jim
Brown, Dr. Bill Camp, and Dr. Sam Morgan for your time, assistance, and
support.
Thanks also to special friends John Pack, Dr. M. Islam, and Pat Darken
for your expertise, inspiration, and time you gave to help complete this research
project.
Thanks to my lovely wife, Margie. Your help was tremendous and greatly
appreciated. You are a good wife.
Finally, thanks to God for making this possible.
v
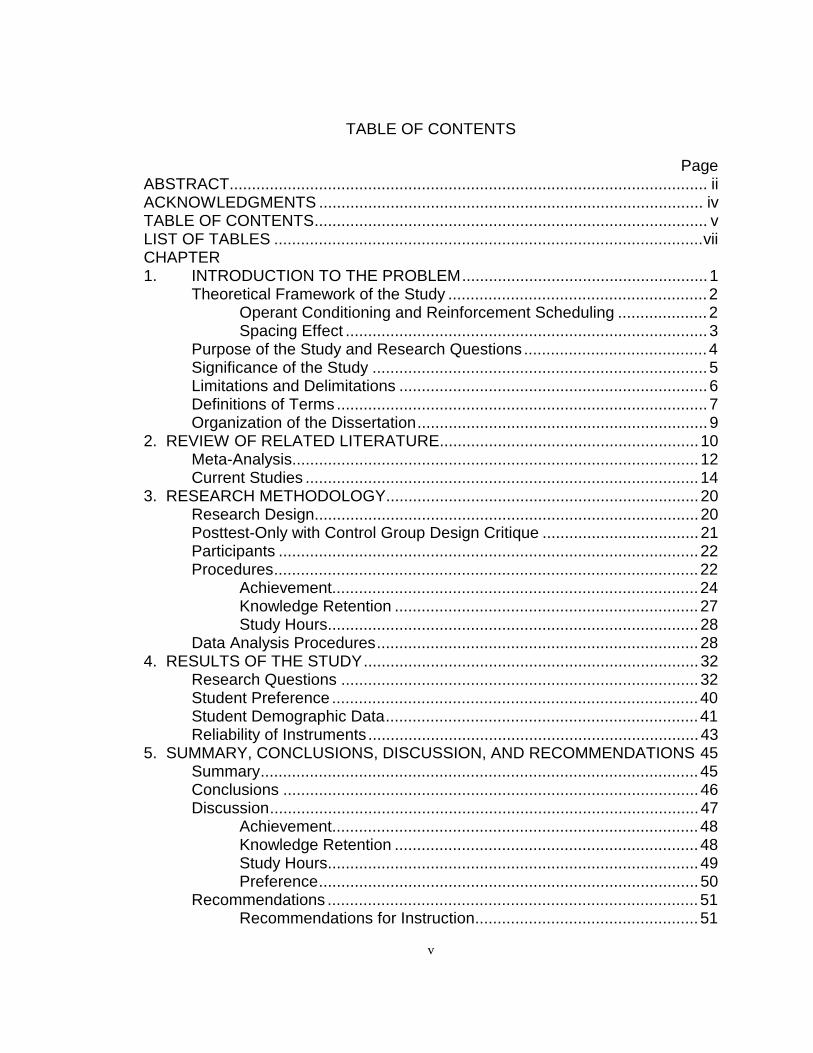
TABLE OF CONTENTS
PageABSTRACT........................................................................................................... iiACKNOWLEDGMENTS ...................................................................................... ivTABLE OF CONTENTS........................................................................................ vLIST OF TABLES ................................................................................................viiCHAPTER1. INTRODUCTION TO THE PROBLEM.......................................................1
Theoretical Framework of the Study ..........................................................2Operant Conditioning and Reinforcement Scheduling ....................2Spacing Effect .................................................................................3
Purpose of the Study and Research Questions .........................................4Significance of the Study ...........................................................................5Limitations and Delimitations .....................................................................6Definitions of Terms ...................................................................................7Organization of the Dissertation.................................................................9
2. REVIEW OF RELATED LITERATURE..........................................................10Meta-Analysis...........................................................................................12Current Studies ........................................................................................14
3. RESEARCH METHODOLOGY......................................................................20Research Design......................................................................................20Posttest-Only with Control Group Design Critique ...................................21Participants ..............................................................................................22Procedures...............................................................................................22
Achievement..................................................................................24Knowledge Retention ....................................................................27Study Hours...................................................................................28
Data Analysis Procedures........................................................................284. RESULTS OF THE STUDY...........................................................................32
Research Questions ................................................................................32Student Preference ..................................................................................40Student Demographic Data......................................................................41Reliability of Instruments..........................................................................43
5. SUMMARY, CONCLUSIONS, DISCUSSION, AND RECOMMENDATIONS 45Summary..................................................................................................45Conclusions .............................................................................................46Discussion................................................................................................47
Achievement..................................................................................48Knowledge Retention ....................................................................48Study Hours...................................................................................49Preference.....................................................................................50
Recommendations ...................................................................................51Recommendations for Instruction..................................................51
vi
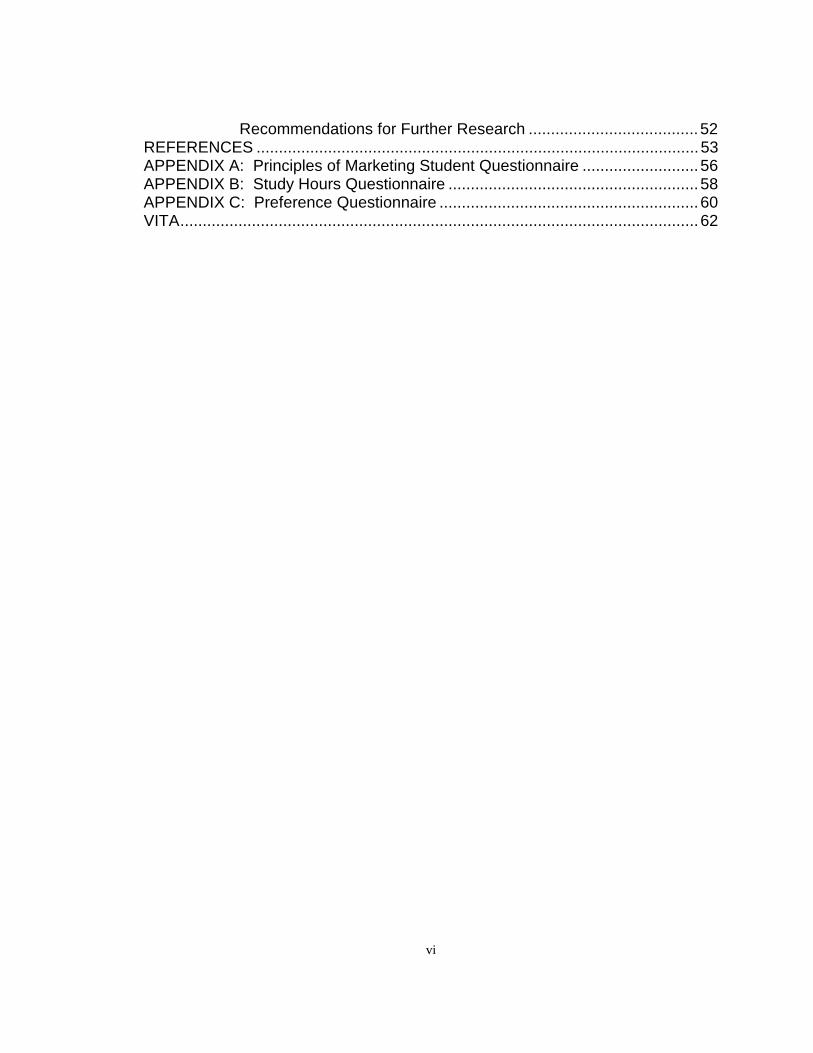
Recommendations for Further Research ......................................52REFERENCES ...................................................................................................53APPENDIX A: Principles of Marketing Student Questionnaire ..........................56APPENDIX B: Study Hours Questionnaire ........................................................58APPENDIX C: Preference Questionnaire ..........................................................60VITA....................................................................................................................62
vii
LIST OF TABLES
PageTable 1 Comparison of Test Means Between the Weekly Group and
the Monthly Group ..............................................................................33
Table 2 Summary Table for Multivariate Analysis of Covariance--Comparison of Test Means Between the Weekly Group andthe Monthly Group using GPA as the Covariate .................................34
Table 3 Comparison of each Semester Test Means Between theWeekly Group and the Monthly Group ................................................35
Table 4 Comparison of the Final Exam Means Between the Weekly Groupand the Monthly Group ........................................................................36
Table 5 Summary Table for Analysis of Covariance--Comparison ofthe Final Exam Means Between the Weekly Group and theMonthly Group using GPA as the Covariate ........................................36
Table 6 Comparison of each Semester Final Exam Means Between theWeekly Group and the Monthly Group ................................................37
Table 7 Comparison of Hours Studied Means Between the WeeklyGroup and the Monthly Group .............................................................38
Table 8 Summary Table for Multivariate Analysis of Covariance--Comparison of Hours Studied Means Between the WeeklyGroup and the Monthly Group using GPA as the Covariate ................39
Table 9 Comparison of each Semester Hours Studied Means Betweenthe Weekly Group and the Monthly Group ..........................................40
Table 10 Crosstabulation of Testing Frequency by Testing Preference .............41
Table 11 Student Demographic Data .................................................................42
Table 12 Reliability Estimates (Cronbach’s Alpha) of Weekly Tests,Monthly Tests, and the Final Exam .....................................................43
1
CHAPTER 1
INTRODUCTION TO THE PROBLEM
What is the optimal number of tests to give per course of instruction in
college? Contrary to popular belief, research has shown that the majority of
students prefer more frequent testing (e.g., Bangert-Drowns, Kulik, & Kulik,
1986; Grover, Becker, & Davis, 1989; Kika, McLaughlin, & Dixon, 1992; McDaris,
1984; Selakovich, 1962). Is it easier to study for shorter tests? Will students
learn more if they are tested more frequently?
Students may benefit from instructors who divide the course material into
smaller, more manageable segments. Also, students who wait until the last
minute to study may end up studying more if there are more “last minutes.” But,
can testing be more than simply for evaluation? Can more frequent testing be
an effective use of class time and play an additional role in the teaching and
learning process? If frequent tests encourage students to study more and, as a
result, learn more, then perhaps it would be valuable to test more.
Many good reasons exist to expect frequent testing to benefit both
teaching and learning. Researchers have offered myriad expected benefits such
as extrinsic motivation, a greater ability to determine areas of strengths and
weaknesses, a clearer course structure, increased processing of information,
and a reduction in stress by a reduction in perceived risk (Bangert-Drowns et al.
1986). Frequent testing has been studied for decades; nevertheless, the studies
have not returned conclusive results. In fact, many have produced conflicting
2
results (Bangert-Drowns et al.). Thus, it remains unclear whether the expected
benefits of frequent testing are real.
Theoretical Framework of the Study
This section examines the concepts of operant conditioning and
reinforcement scheduling as well as the spacing effect.
Operant Conditioning and Reinforcement Scheduling
Operant Conditioning was made famous by Skinner (Bourne & Ekstrand,
1973). Good and Brophy (1990), authors of Educational Psychology: A
Realistic Approach, argued that operant conditioning and reinforcement
scheduling support the belief that students wait until the “last minute” to study.
Under operant conditioning, the subject (the student) is reinforced (the test) for
the proper behavior or response (studying). However, different schedules of
reinforcement have different effects on response rates:
When they [the subjects] know that a fixed time interval must elapse
before the next reinforcement opportunity, they will simply wait (or do
something else) while the time elapses and then begin producing the
target response around the time that the next reinforcement is due. (p.
163)
Subjects wait until they receive a discriminant stimulus to begin the
desired behavior. This concept can be applied to students. For example, when
students know that one month must pass before the next test, they will wait to
3
begin studying around the time of the next test. Good and Brophy (1990)
applied this to variable versus fixed test scheduling:
Variable interval...schedules produce steadier and more persistent rates
of response, because learners know that their effects will pay off
eventually even though they cannot predict when. For example, you may
have noticed that you tend to “keep up” by maintaining a steady study
schedule in courses in which unannounced quizzes are expected (variable
schedule) but to concentrate your studying in days before exams in
courses in which a fixed exam schedule is followed. (p. 164)
Although Good and Brophy are comparing variable (unpredictable interval) to
fixed (constant interval) testing schedules, weekly testing is similar to variable
testing in that it forces the student to “keep up” and thus increase achievement.
Instead of students knowing that they may have an unannounced quiz on
Tuesday, students know that they will have a quiz on Tuesday. The effect is the
same.
In summary, based on the theory of operant conditioning, students will
study more often if given more frequent tests. But, will more frequent study
sessions increase achievement? The spacing effect theory addresses this
question.
Spacing Effect
Forcing the students to maintain a steady study schedule by testing
frequently has benefits supported by the spacing effect. Dempster and Farris
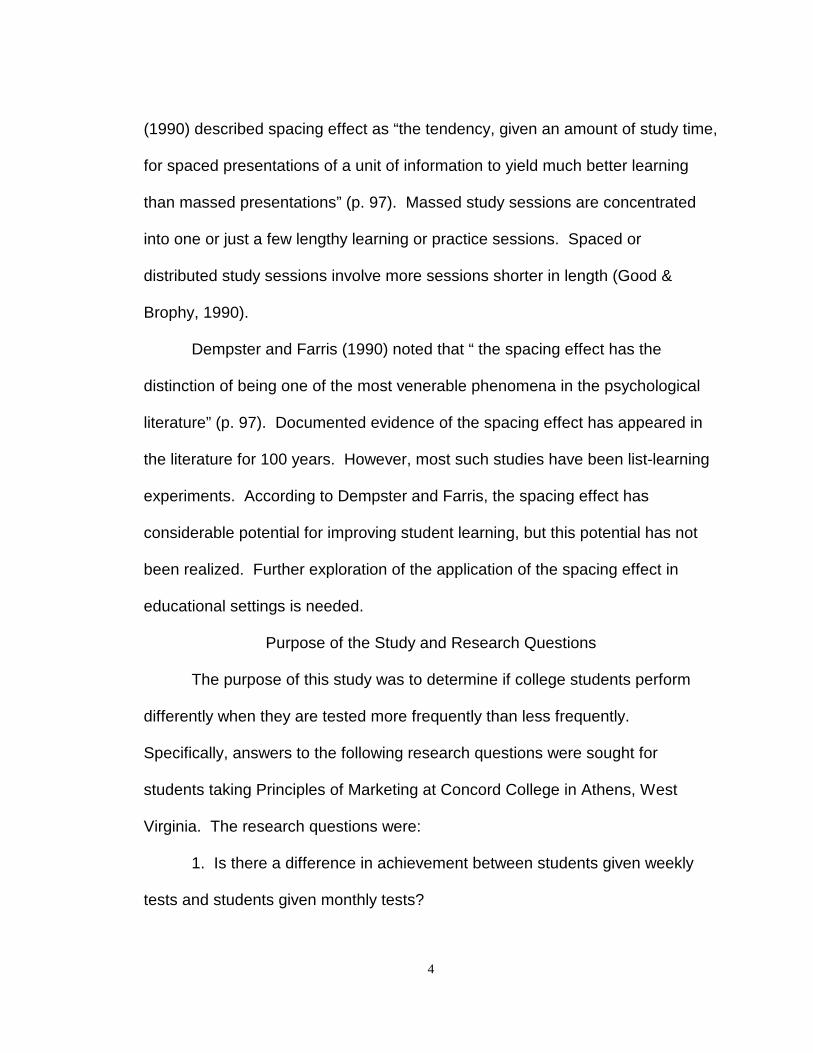
4
(1990) described spacing effect as “the tendency, given an amount of study time,
for spaced presentations of a unit of information to yield much better learning
than massed presentations” (p. 97). Massed study sessions are concentrated
into one or just a few lengthy learning or practice sessions. Spaced or
distributed study sessions involve more sessions shorter in length (Good &
Brophy, 1990).
Dempster and Farris (1990) noted that “ the spacing effect has the
distinction of being one of the most venerable phenomena in the psychological
literature” (p. 97). Documented evidence of the spacing effect has appeared in
the literature for 100 years. However, most such studies have been list-learning
experiments. According to Dempster and Farris, the spacing effect has
considerable potential for improving student learning, but this potential has not
been realized. Further exploration of the application of the spacing effect in
educational settings is needed.
Purpose of the Study and Research Questions
The purpose of this study was to determine if college students perform
differently when they are tested more frequently than less frequently.
Specifically, answers to the following research questions were sought for
students taking Principles of Marketing at Concord College in Athens, West
Virginia. The research questions were:
1. Is there a difference in achievement between students given weekly
tests and students given monthly tests?
5
2. Is there a difference in knowledge retention between students given
weekly tests and students given monthly tests?
3. Is there a difference in time spent studying between students given
weekly tests and students given monthly tests?
Significance of the Study
Considerable research has been conducted searching for ways to
improve the performance of college students--including frequency of testing
research. However, the effectiveness of frequent testing is still in question. This
research problem has occurred not because of the nature of frequent testing but
because much of the previous research contain flaws in methodology (Khalaf
and Hanna, 1992; Rievman, 1973; Yamin, 1988). Examples of these flaws will
be detailed in Chapter 2.
Many instructors believe that determining the number of tests to give in a
course is a minor decision, a decision often based on chapter breakdown and
vacation schedules. If more frequent testing does improve student performance
in achievement and knowledge retention, then this is an opportunity that must be
taken, and best of all, at little or no instructor expense. More frequent grading
does not necessarily result in additional grading. The same total number of
questions can be used.
Extensive search on frequency of testing found no previous studies of
frequency of testing for a marketing class.
6
Limitations and Delimitations
This section examines the limitations and delimitations of the study.
Limitations
1. The students were aware that they were participating in an experiment.
This may have sensitized them to the treatment. In other words, knowing they
were participating in an experiment, the students may have studied differently
(more or less) than they would have under normal classroom testing. However,
both groups should have been affected equally.
2. Some students may have objected to the group into which they were
placed. This negative attitude may have been reflected in lower test scores or
mortality (the loss of subjects).
3. The sample size was 109 students due to classroom constraints and
student enrollment. Ideally, the sample size should have been determined by
the study’s requirements based on sample size theory.
4. Although the students were randomly assigned to groups, they were
not randomly selected to attend the course. They registered for the class
themselves without prior knowledge of the experiment. This could have
negatively influenced the external validity of the experiment.
5. Study hours were self-reported. There may have been a difference
between the actual study time and the reported time. Plus, some students may
have inflated their reported hours in an attempt to impress the instructor.
7
Delimitations
1. By design, the participants in this study were limited to those students
enrolled in the 16 week-long Principles of Marketing course sections offered at
Concord College during the 1996 fall semester and the 1997 spring semester.
The students were primarily sophomore and junior business majors.
2. The study did not attempt to include students in courses other than
Principles of Marketing.
Definitions of Terms
The following terms are defined as they apply to this study:
Achievement
Achievement was measured by the mean grade earned on the tests by a
student. This did not include the final exam grade. The final exam grade was
used to measure knowledge retention.
Final Exam
The final exam refers to the last exam that was given to both groups
simultaneously. The exam covered material from the entire course, therefore it
was a good test of knowledge retention.
Frequent Testing
Students tested 12 times during the semester (excluding the final exam)
were considered to be frequently tested. This was one test per week. This was
applicable to the experimental group (weekly group) only.
8
Knowledge Retention
Knowledge retention was measured by the grade earned on the
comprehensive final exam which was given at the end of the semester to both
groups simultaneously during the regularly scheduled final exam time. This did
not include any other test score.
Monthly Tests
The monthly tests refer to the tests given to the control group once each
month for three months. Each test contained 80 questions.
Nonfrequent Testing
Students tested 3 times during the semester (excluding the final exam)
were considered to be nonfrequently tested. This was one test per month. This
was applicable to the control group (monthly group) only.
Principles of Marketing
The course description of Principles of Marketing in the Concord College
Catalog 1995 is as follows:
A survey of the fundamental features of contemporary marketing systems
and the planning required to make available satisfying goods and services
at a profit. A study of the complex and dynamic activities of marketing
functions, explaining the roles of marketing in society and the institutions
that compose the marketing system. Focuses on the marketing mix:
product development and differentiation, distribution channels, pricing,
and promotion. (p. 57)
9
Study Hours
Study hours refers to the number of hours a student studied for a given
test or the final exam. This was collected through a survey instrument included
with each test and the final exam.
Weekly Tests
The weekly tests refer to the tests given to the experimental group once
each week for 12 weeks. Each test contained 20 questions.
Organization of the Dissertation
This dissertation is divided into five chapters. Chapter 1 provides an
introduction to the problem which includes: theoretical framework of the study,
purpose of the study and research questions, significance of the study,
limitations and delimitations, and definition of terms. Chapter 2 consists of a
review of related literature. Chapter 3 outlines the research methodology.
Chapter 4 provides the results of the study for each research question. Chapter
5 presents the summary, conclusions, discussion, and recommendations. The
reference list, appendices, and vita follow Chapter 5.
10
CHAPTER 2
REVIEW OF RELATED LITERATURE
Researchers have offered several possible explanations for why frequent
testing should benefit teaching and learning. The first is that more frequent
testing provides extrinsic motivation. Students work harder throughout the
course because they want to get good grades on the tests (e.g., Curo, 1963;
Dustin, 1971; Khalaf, 1989; Standlee & Popham, 1960). Second, frequent
testing offers the student feedback or knowledge of their results giving them the
opportunity to see their areas of strengths and weakness and giving the student
more time to work toward eliminating the areas of weakness (e.g., Bangert-
Drowns et al., 1986; McDaris, 1984; Standlee & Popham). The third possible
explanation is what Standlee and Popham called “enforced activity” of the
subject matter (p. 322). The process of taking a test forces the student to
process the information at a deeper level than they may otherwise. Fourth,
Selakovich (1962) found that frequent testing leads to improved class discussion.
And lastly, Dustin proposed that frequent testing may reduce stress since each
test represents a smaller portion of the total grade.
A substantial body of research has been conducted on the effects of
frequent testing on students. One of the earliest studies was done by Turney
(1931) and is a good example of the typical frequency of testing study. A
description of Turney’s work will depict how most such studies have been
conducted. Turney studied the effects of frequent, short, objective quizzes upon
11
the achievement of college junior and seniors taking educational psychology. He
wanted to see if students would perform better when given frequent opportunity
to determine their relative grades or standing in the class and whether this
information motivated the students to study harder. He was interested in
determining the effects of feedback on motivation.
A modified version of the final exam was used as a pretest. The class
section that scored the lowest on the pretest was determined to be the
experimental group, the other as the control. The experimental group scored a
mean of 85.2 and the control group scored 108.1. Both groups were given the
same midterm and final exam; however, the experimental group was given an
additional quiz each week while the control group was given only one additional
quiz during the course. Both classes were taught by the same instructor. The
lectures, readings, and laboratory work were identical. The experimental group
contained 40 students while the control group had 28 students.
Turney did not use the tests to measure achievement. Only the final
exam scores were used. The gains in knowledge were represented by the
difference between the score on the final exam and the score on the pretest. On
the final exam the experimental group scored 212.5, for a gain of 127.3. The
control group scored almost the same, 212.4, for a gain of 104.7. Turney
deduced that the 12 short quizzes led to the experimental group gaining 21.6%
[(127.3 - 104.7)/104.7] more than the control group. Thus, he concluded that
frequent testing increases learning.
12
During Turney’s last class meeting, a questionnaire was distributed to
determine how the experimental group felt about receiving frequent quizzes.
Almost the entire experimental group believed they studied harder, thought that
they learned the material more thoroughly, and liked knowing where they stood
at all times in relation to the rest of the class. The experimental group was
strongly in favor of the short, frequent quizzes.
Several issues can be raised about Turney’s study. One, the final exam
was used as a pretest that could have sensitized the students to the final exam,
thus influencing the results. Two, both groups differed widely in their initial
knowledge of the subject. Three, because the experimental group had additional
grades, their final exam was worth fewer points than the control group’s final
exam. Four, the two groups were not given an equal number of test questions
for the semester, so this is not just a study of frequency of testing, but is also a
study of the quantity of testing. Each of these four issues adds a confounding
variable to the study that makes extracting the true effects of frequent testing
difficult.
Meta-Analysis
Many studies have been conducted since Turney’s work. Bangert-Drowns
et al. (1986) conducted a thorough meta-analytic review on what they considered
to be the most sound research on frequent testing. In conducting this meta-
analysis, Bangert-Drowns et al. used 16 variables to identify the most
13
methodologically sound studies including testing procedures, experimental
design, classroom setting, and publication histories.
For effects on achievement, Bangert-Drowns et al. (1986) found only
seven studies. Their analysis found positive results from frequent testing.
Students generally performed better on short tests on smaller units of instruction
than on long tests covering larger units of instruction. In the typical study, the
experimental group outperformed the control group by .49 standard deviations.
For effects on knowledge retention, Bangert-Drowns et al. (1986) found
32 studies that met their standards. Of the 32 studies, 26 showed results
favoring frequent testing. Six showed that frequent testing had a negative effect.
However, in their final analysis they were unable to conclude with significantly
positive results.
When frequently tested students were compared to other, less frequently
tested students, they only showed minimal, nonsignificant superiority on a
summative achievement measure, about one tenth of a standard
deviation. The correlation between the number of tests given to the
frequently tested students and effect size was actually negative, r = -.06,
though not significantly so. (p. 24)
For student preference, Bangert-Drowns et al. (1986) found five studies
that measured student preference. Students in the frequent testing condition
had attitudes that were more positive by .46 standard deviations. That is,
14
students had a more favorable opinion of their instruction when they were tested
frequently.
Even though these were the leading studies to date, closer examination
reveals some evidence of extraneous variables that could have confounded the
results leading to inconclusive results of frequent testing. Most of the studies
included in the meta-analysis were quasi-experimental designs and not true
experimental designs because the students were not randomly assigned to
groups (e.g., Laidlaw, 1963; Lindenberg, 1984; Noll, 1939). The disadvantages
of a quasi-experimental design over a true experimental design are discussed in
Chapter 3.
Current Studies
Bangert-Drowns et at. completed their meta-analysis in 1986. Since then,
other studies have been conducted that warrant attention. In 1989, Grover,
Becker, and Davis conducted a quasi-experimental study on 28 students in one
section of Introductory Psychology at Emporia State University. The students
were not randomly assigned to groups; they were allowed to chose their testing
frequency. Exactly half of the students chose frequent testing; the other half
chose the less frequent option. This study removed an extraneous variable
found in previous studies. Both groups were taught at the same time in the
same room by the same instructor to ensure that both groups received the exact
same instruction. Previous studies have either used two different classes or
divided one class into two separate sections after assignment. The results of
15
Grover et al. showed that a significant difference was not found on the tests.
Consistent with previous studies, no significant difference was found on the
comprehensive final exam. Concerning preference, 75% of the students said
they would pick frequent testing next time. All 14 of the frequently tested
students said that if they had it to do all over again, they would select the same
option. Seven of the 14 infrequently tested students, however, said they would
select the frequent option.
There are three potential problems with this design. One, a minimum of
two-thirds of the test questions were the same between the two groups. This
made it possible for the frequent group to share test information with the
infrequent group. Two, the frequently tested students took the first three of every
four tests at one of two prescheduled times outside of class. This made test
information sharing possible within the frequent group as well. Three, although
the authors stated that there was no difference in gender distribution or ACT
scores, the groups were not randomly assigned so other differences between the
groups could have existed. Each of these problems could have confounded the
results.
In 1989, Dineen, Taylor, and Stephens investigated the effect of
extremely frequent testing on high school mathematics students. The subjects
were 184 ninth through twelfth graders, and were tested on either daily or weekly
intervals. There were three classes of Introduction to Algebra 1, two classes
each of Introduction to Algebra 2, Algebra 1, Algebra 2, and Pre-Calculus and
16
Trigonometry. Although the students were not randomly assigned, the control
and experimental groups were randomly determined. The daily groups
consistently outscored the weekly group, but the differences were not significant.
The differences in the groups were greater with the less difficult courses,
indicating that frequent testing may be more effective with weaker students.
Knowledge retention and testing frequency preference were not measured.
There is one major problem with the methodology of Dineen et al. (1989)
that may have confounded the results. The frequent group had their lowest five
grades dropped, the infrequent group did not have any grades dropped. Are the
differences in the groups a result of different testing frequencies or a result of
different grading techniques? This cannot be measured when two variables are
manipulated simultaneously.
Beaulieu and Frost (1989) conducted a study of 137 college students
enrolled in three sections of a junior-level management course. One section
received three tests during the semester, the second section received seven
tests, and the third section received thirteen tests. The section with thirteen
tests scored the highest with 82.50%, the seven-test section scored 82.37%, and
the three-test section scored 81.59%. Although there appeared to be a slight
relationship between test frequency and achievement, the differences were not
significant. However, the three-test section scored eight percent better on the
final than the other two sections. The students in the seven and thirteen test
conditions overwhelmingly preferred frequent testing.
17
There are several problems with the Beaulieu and Frost (1989)
methodology. One, the students were not randomly assigned to groups. In fact,
there was no evidence that any steps were taken to ensure that the three groups
were equal prior to the experiment. Two, the students were told that the final
exam grade would be used only if it helps the student. The effect that this had
on student final exam studying cannot be measured. Three, each section was
asked to answer virtually the same test questions, but at different points in time,
of course. This creates a situation where students from one section that has
taken a particular test to share test item information with students from another
who have yet to take the test. This will be at the disadvantage to the more
frequently tested students since they receive the tests first.
In 1992, Kika et al. conducted a study of 51 secondary algebra students
for eight months. This study controlled for many of the methodological problems
previously discussed. The students were randomly assigned to one of two
Algebra 11 classes. The two classes were taught by the same instructor, the
only difference in the classes was the frequency of tests--weekly versus
biweekly. Both classes were given the Grade 10/11 British Columbia
Mathematics Achievement test as a pretest. An ABAB time series experimental
design was used. Group 1 received weekly tests for the first two months while
Group 2 received biweekly tests. During the second two month period, the
frequency was reversed--Group 2 received weekly tests while Group 1 received
biweekly. This procedure of reversing every two months continued for two more
18
periods. Kika et al. found that the class mean scores were significantly higher
during the weekly testing periods than during the biweekly period. The mean
increase in class means was found to be 5.5% for Group 1 and 8% for Group 2.
Knowledge retention was not measured. At the end of the study, both groups
were given a questionnaire on their preference of testing frequencies. Eighty-
eight percent of the students preferred the weekly testing.
Although the Kika et al. (1992) study is one of the best designed
frequency of testing studies to date, there is still a possible source of internal
invalidity. Instructor effects cannot be controlled with this design. Although the
same instructor was used for both groups the design makes it possible for the
effectiveness of the instruction to vary from group to group. Frequent testing
gives the instructor frequent feedback that may have affected the instructor’s
teaching. Furthermore, wanting the frequent group to excel for the study to be a
success may have subconsciously affected the instructor’s teaching.
Khalaf and Hanna (1992) also tested the effects of testing frequency on
high school students. Khalaf and Hanna tested for retention twice, once at the
end of the semester, and once three months later with a different, but parallel
test. Random cluster sampling was used to select over 2000 10th-grade biology
students in the all-male high schools in Saudi Arabia’s four largest school
districts. Students were not randomly assigned; instead, whole schools were
randomly assigned to groups. A total of 12 schools, 24 teachers, and 93 classes
were used in this study. The infrequent classes were tested monthly, while the
19
frequent groups were tested twice a month. Each teacher made up his or her
own quizzes. The final exams revealed significant differences between the two
groups. The frequent group performed .30 standard deviations better than the
control group. Neither achievement nor testing frequency preference were
measured.
In 1986, Beaulieu and Zar argued that the state of literature regarding
frequently administered summative tests was clouded with ambiguity. Today,
the issue remains unclear. Many examples of extraneous variables such as the
main testing effect, selection bias, and lecture variation have been discussed in
this chapter. A study was needed that controlled these variables to achieve
conclusive results.
20
CHAPTER 3
RESEARCH METHODOLOGY
The content of this chapter describes the research design and a critique
of the design. The chapter further examines the participants used in the study,
methodological procedures, and data analysis procedures.
Research Design
In the present study, a true experimental design was utilized. According
to Gay (1987), author of Educational Research--Competencies for Analysis and
Application, “The experimental method is the only method of research that can
truly test hypotheses concerning cause-and-effect relationships. It represents
the most valid approach to the solution to educational problems, both practical
and theoretical” (p. 298).
True experimental designs have one characteristic in common that neither
quasi-experimental nor pre-experimental have--random assignment of subjects
to groups. In addition to random assignment, it would have been ideal to also
have had random selection, but this was not possible since the students
themselves determined which classes they took. However, according to Gay
(1987), “To qualify as a true design, at least random assignment must be
involved” (p. 322). Therefore, the advantages of a true experimental design do
apply to the present study. The specific form of true experiment that was used in
the present study was a form of the posttest-only with control group design.
21
Using this design, subjects are randomly assigned to groups, exposed to the
independent variable, and then posttested.
Posttest-Only with Control Group Design Critique
A review of true experimental design methodology follows with a
discussion of the strengths and the limitations of the design of the present study.
Strengths
Three types of experimental designs exist: pre-experimental designs,
quasi-experimental designs, and true experimental designs. Pre-experimental
designs are the weakest. According to Gay (1992), pre-experimental designs do
not control threats to validity well and “should be avoided.... In fact, the results of
a study based on such a design are so questionable, they are essentially
worthless for all purposes except, perhaps, a preliminary investigation of a
problem” (p. 318).
Quasi-experimental designs offer more control over extraneous variables
than pre-experimental designs, but similar to pre-experimental designs, the
subjects are not randomly assigned. Almost all previous frequency of testing
studies have used quasi-experimental designs because the researcher had to
agree to use existing classes. However, Gay (1992) stated that “If you have a
choice between a true experimental design and a quasi-experimental design,
select the true design” (p. 318). The advantage of true experimental designs is
that, because of random assignment, nearly all sources of internal and external
invalidity are controlled; this is not so with quasi-experimental designs. As
22
Christensen (1977), author of Experimental Psychology has stated,
“randomization is the most important and basic of all the control methods. It
provides a control not only for known sources of variation but also for unknown
sources of variation” (p. 124).
Limitations
The posttest-only control group design uses a combination of random
assignment and the presence of a control group. This combination controls for
all sources of internal and external invalidity except mortality. A pretest is
required to control for mortality. If subjects are lost during the experiment and
pretest scores are available, it is possible to determine whether mortality
occurred in a random fashion. A satisfactory alternative to a pretest is to use
other measures as a substitution such as grade point averages (GPA).
Participants
The participants in this study were students enrolled in two Principles of
Marketing courses taught at Concord College. The first course was taught
during the 1996 fall semester with 50 students enrolled (28 male and 22 female).
The study was replicated with the second course taught during the 1997 spring
semester with 59 students enrolled (30 male and 29 female). The students were
primarily sophomore and junior business majors.
Procedures
Of the 50 students enrolled in the fall class, 25 were randomly assigned to
the weekly (experimental) group and 25 were randomly assigned to the monthly
23
(control) group. The class met from 9:30 a.m. to 10:45 a.m. on Tuesdays and
Thursdays for 16 weeks. Of the 59 students enrolled in the spring class, 30 were
randomly assigned to the weekly group and 29 were randomly assigned to the
monthly group. The class met from 7:00 p.m. to 9:30 p.m. on Wednesdays for
16 weeks.
The researcher was the instructor for both courses. Both weekly and
monthly groups attended class together, thus lectures were given to both groups
simultaneously during each semester. This ensured that both groups of subjects
received the same instruction.
During the first week of each semester, a questionnaire was given to the
students to determine the following: (a) gender, (b) age, (c) full or part-time
student, (d) number of hours employed per week, (e) number of earned credit
hours, (f) grade point average, and (g) marital status (see appendix A for the
complete questionnaire). The number of earned credit hours and grade point
average data were also taken from the registrar to ensure accuracy. The
demographic data were collected to check that the groups were indeed
equivalent and to also help answer any future research questions that may be
proposed.
The textbook used for the course was Schoell and Guiltinan’s (1995)
Marketing. Both groups in each class read and were tested on the same 18
chapters from the text. The chapters varied in length from 26 to 38 pages.
24
The students were told that they were participating in an experiment to
determine if different testing frequencies had an effect on grades. The students
were not told which group was expected to have superior performance.
However, the students were told that if there was a difference in group
performance, the group with the lower mean would be raised to equal the other
group’s mean. This was done to ensure that none of the students thought they
were being treated unfairly, especially if they were not selected to be in the group
they preferred.
Achievement
The weekly group was given a 20-question test each week (every other
class meeting in the fall semester course and every class meeting in the spring
semester course) during the last 15 to 20 minutes of class on the material that
was covered the previous week. Depending on the topic, this was always one or
two chapters of material. The monthly group was dismissed from class during
this time each week except for every fourth week when both weekly and monthly
groups were tested.
While the weekly group was tested each week on one or two chapters, the
monthly group was tested after every six chapters. This was one test per month
for the monthly group. When it was time for the monthly group to be tested, both
groups were tested simultaneously. In the fall semester course, this was done at
the beginning of class. In the spring semester course, this was done during the
last hour of the class. The weekly group received their 20-question test on the
25
previous week’s material, while the control group was given their 80-question test
on the previous month’s material. Each student was dismissed after they
finished their test.
As mentioned in Chapter 2, a major problem with most previous studies
was that it was possible for one group to receive superior instruction over the
other group (teaching effects). Using these designs, it is not even possible to
measure the magnitude of the teaching effect and subtract it from the treatment
effect. In the present study both groups were taught in the same class
simultaneously. This made it impossible for teaching effects to occur.
Controlling for this problem created another, however.
Since the weekly group received 3 out of 4 tests prior to the monthly
group, exchange of information about the tests was possible. The fourth, eighth,
and twelfth test for the weekly group (20 questions) was given at the same time
the tests for the monthly group was given (80 questions). Since these tests were
given to both groups simultaneously no exchange of information was possible,
so the 20 questions given to the weekly group were the same as questions 61 to
80 given to the monthly group. The other 60 questions, however, had to be
different for each group due to the possibility of information exchange. For each
weekly group’s tests 1 through 3, 5 through 7, and 9 through 11, forty different
questions were developed. Twenty were randomly selected for the weekly
group, and the remaining 20 were used for the monthly group. Since each test
question was randomly selected, it can be assumed that the tests were
26
equivalent. For the entire semester, out of 240 questions given to each group,
80 were the same and 160 were different.
The test instruments used during the fall semester were also used during
the spring semester. However, the groups were reversed. The test instruments
used to grade the weekly group in the fall semester course were used to test the
monthly group in the spring semester course, and the test instruments used to
grade the monthly group in the fall semester course were used to test the weekly
group in the spring semester course. This ensured that the test instruments
were not the cause of the difference between the weekly and monthly mean test
grades.
The tests were developed from the Schoell and Guiltinan (1995) testbank.
To maximize the potential for test reliability, Cronbach’s coefficient alpha and
item analysis were used to select test questions from a Principles of Marketing
course taught by the researcher in the spring of 1996. These tests had not been
returned to the students and each test question was originally taken from the
textbook’s testbank. If a sufficient number of acceptable questions (a positive
item-total correlation) were not available, additional questions were taken from
the same testbank. Care was also taken to ensure that the material tested
provided a representative sample of the material covered in the chapters and in
the lectures.
27
The reliability of each test used in the experiment was determined by
calculating its Cronbach’s coefficient alpha. The results of these reliability
estimates are presented in Chapter 4.
Test grades were posted on the researcher’s office door identified by
Social Security numbers within two or three days of each testing day. The tests
were not returned to the students and the answers were not discussed in class.
Students were told to see the instructor after class or in his office if they desired
to look over their tests or to discuss test questions and answers. However, very
few students took advantage of this offer. The students were told that if they
missed a test they would not be allowed to make it up without an excused
absence as defined by the Concord College Catalog 1995.
Knowledge Retention
The purpose of the final exam was to see if one of the groups retained
more of the course material than the other. A 72-question comprehensive final
exam was given to both groups simultaneously during the scheduled final exam
time. Since both groups took the exam together, the same exam was used. The
final exam questions were taken from the tests. One half of the questions were
randomly selected from the weekly group’s tests, and the other half were
randomly selected from the monthly group’s tests. However, if two similar
questions were selected, one was randomly dropped and another was randomly
selected as a replacement. The same final exam was used for both semesters.
28
The reliability of the final exam was determined by calculating its
Cronbach’s coefficient alpha. The results of these reliability estimates are
presented in Chapter 4.
Study Hours
To measure the mean hours the students spent studying per test, a brief
questionnaire was given to each student with each test asking them to write the
total number of hours spent studying for that particular test (see appendix B for
the questionnaire). The students were told that the answer to the question
should be honest and would in no way affect their grade or the instructor’s
opinion of them.
Sixty percent of the final course grade was based on the total points
earned on the tests, and 20% was based on the final exam. The remaining 20%
was determined by a group project.
The group project was not related to the study and should not have added
a confounding variable to the results. Each group was required to prepare and
present a complete marketing strategy for a product or service. The students
worked in groups of three to five. They were allowed to pick their group
members, but all of the members of a group had to be from the same testing
frequency.
Data Analysis Procedures
Specific statistical analyses related to each research question were as
follows. To test for a difference in retention between students given weekly tests
29
(experimental group) and students given monthly tests (control group), analysis
of covariance was used. To test for differences in achievement and study time
between students given weekly tests and students given monthly tests,
multivariate analysis of covariance was used. It was possible to simply run a t
test for each variable; however, according to Huck, Cormier, and Bounds (1974),
authors of Reading Statistics and Research, it is inappropriate to use a separate
univariate analysis for each of several dependent variables in one study. When
the dependent variables are correlated, as they are in this study, the probability
of a Type I error will be higher than the level of significance desired. Huck et al.
stated that in these conditions “instead of using a separate univariate analysis for
each dependent variable, a researcher should use multivariate analysis” (p. 178).
Grade point average was used as the covariate to control for mortality
effects for all three research questions. As mentioned earlier, the posttest-only
control group design uses a combination of random assignment and the
presence of a control group. This combination controls for all sources of internal
and external invalidity except mortality (loss of subjects). Students were allowed
to drop the course and thus drop out of the experiment if they desired, and some
did. In the fall semester 10 from the original 50 students dropped the course--4
from the weekly group and 6 from the monthly group. In the spring semester 8
from the original 59 students dropped the course--2 from the weekly group and 6
from the monthly group. More dropped from the monthly group than the weekly
group. Therefore, mortality did not occur in a random fashion, and the randomly
30
assigned groups could no longer be assumed to be equivalent in ability. A
covariate was needed to equalize the groups. Research has found that the best
predictor for a future grade point average is a past grade point average. For
example, Wolfe and Johnson (1995) studied many variables including Scholastic
Aptitude Test (SAT), average grade earned in high school, and 32 personality
variables. They found that a student’s high school grade average is the best
predictor of college performance. Concord College transcripts were acquired for
each student from the registrar to calculate grade point averages. Grade point
averages were calculated from all of the courses each student had taken at
Concord College including the semester of the study, excluding the grade that
they received in Principles of Marketing.
To test for differences in achievement, the mean percentage of correct
answers from the 240 test questions for all students in the weekly group was
compared to those of the monthly group. This was calculated at 80-question
intervals, because the monthly students received 80-question tests. These three
observations were compared to see if changes in achievement occurred
throughout the semester. To test for differences in knowledge retention, the final
exam was used. The final exam mean of the weekly group was compared to the
mean of the monthly group. To test for differences in study time, the student
self-reported study hours responses were used. These means were also
compared at 80-question intervals to see if changes in study habits occurred
throughout the semester.

31
SPSS Graduate Pack Advanced Version 6.1.4 (1996), a statistical
software package, was used for all data analysis.
32
CHAPTER 4
RESULTS OF THE STUDY
This chapter presents the results of the methodological procedures
described in Chapter 3. To test for differences in achievement and study time
between students given weekly tests (experimental group) and students given
monthly tests (control group), multivariate analysis of covariance was used. To
test for a difference in retention between students given weekly tests and
students given monthly tests, analysis of covariance was used. Student
cumulative grade point average at Concord College was the covariate used to
control for mortality effects for all three research questions. SPSS Graduate
Pack Advanced Version 6.1.4 (1996), a statistical software package, was used
for all data analysis.
Research Questions
Answers to three research questions were sought to determine if students
perform differently when they are tested more frequently than less frequently.
1. Is there a difference in achievement between students given weekly
tests and students given monthly tests?
To test for differences in achievement, the mean percentage of correct
answers from the 240 test questions for all students in the weekly group were
compared to those of the monthly group. The weekly group received weekly
tests containing 20 questions, while the monthly group received monthly tests
containing 80 questions. The overall means were calculated and compared
33
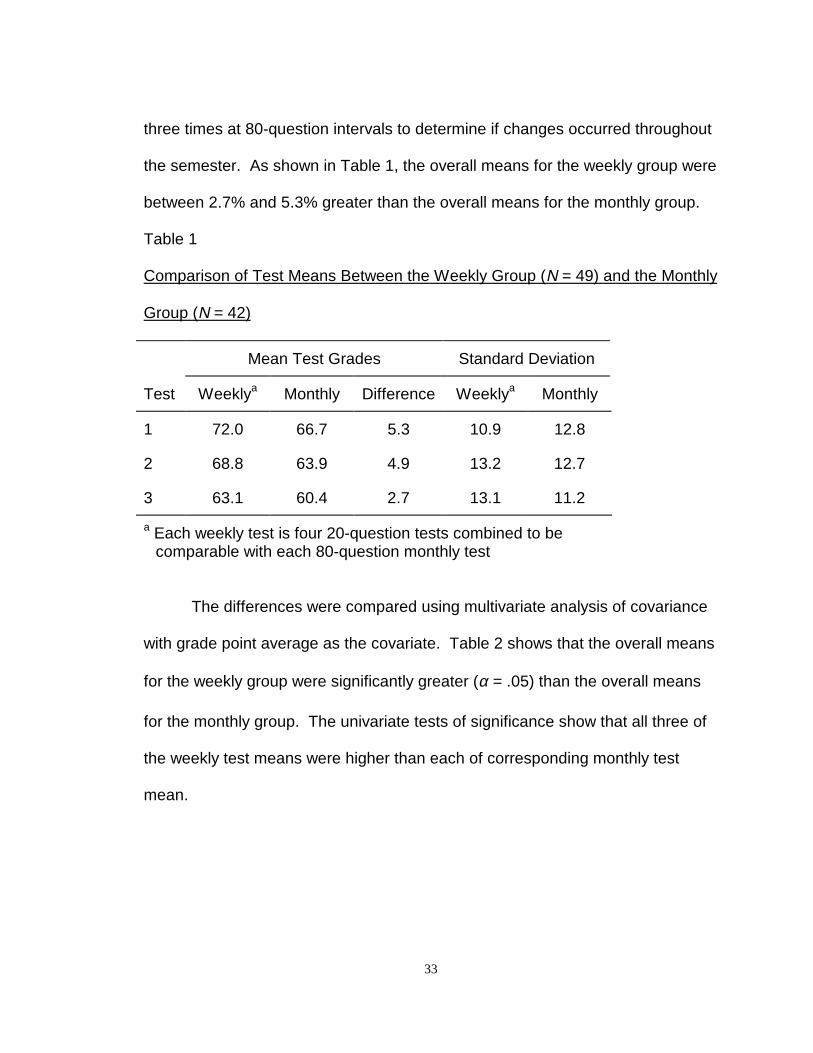
three times at 80-question intervals to determine if changes occurred throughout
the semester. As shown in Table 1, the overall means for the weekly group were
between 2.7% and 5.3% greater than the overall means for the monthly group.
Table 1
Comparison of Test Means Between the Weekly Group (N = 49) and the Monthly
Group (N = 42)
Mean Test Grades Standard Deviation
Test Weeklya Monthly Difference Weeklya Monthly
1 72.0 66.7 5.3 10.9 12.8
2 68.8 63.9 4.9 13.2 12.7
3 63.1 60.4 2.7 13.1 11.2
a Each weekly test is four 20-question tests combined to be comparable with each 80-question monthly test
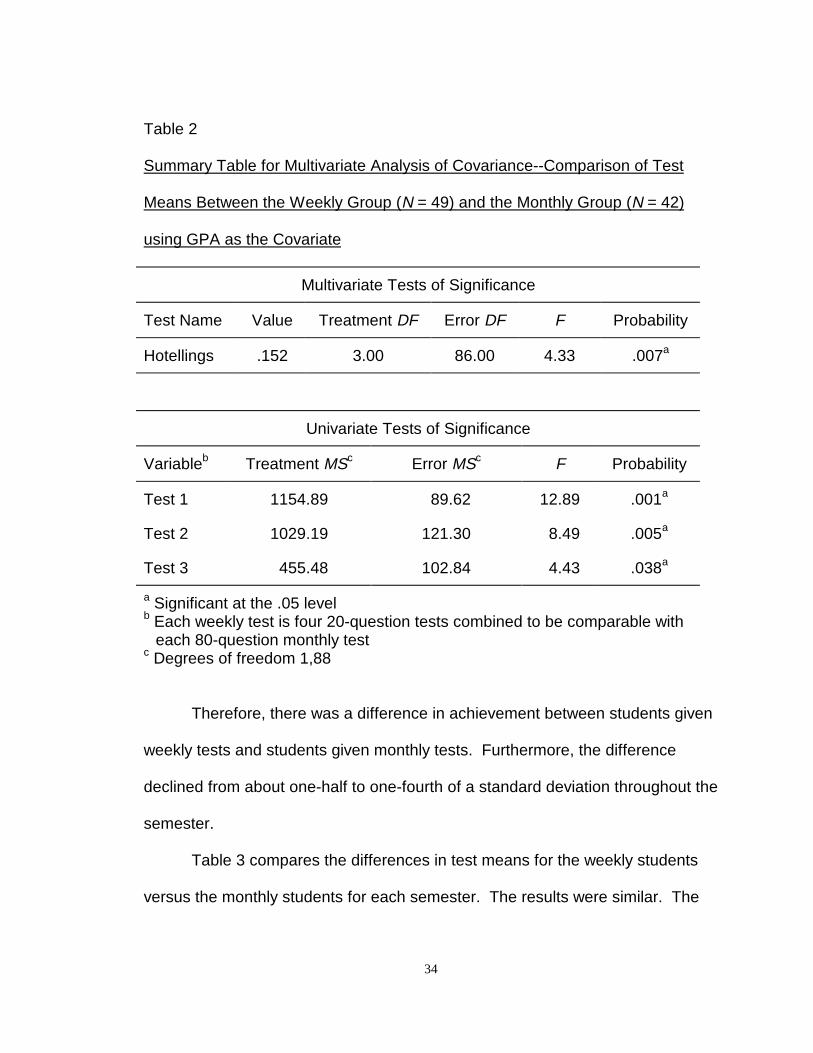
The differences were compared using multivariate analysis of covariance
with grade point average as the covariate. Table 2 shows that the overall means
for the weekly group were significantly greater (α = .05) than the overall means
for the monthly group. The univariate tests of significance show that all three of
the weekly test means were higher than each of corresponding monthly test
mean.
34
Table 2
Summary Table for Multivariate Analysis of Covariance--Comparison of Test
Means Between the Weekly Group (N = 49) and the Monthly Group (N = 42)
using GPA as the Covariate
Multivariate Tests of Significance
Test Name Value Treatment DF Error DF F Probability
Hotellings .152 3.00 86.00 4.33 .007a
Univariate Tests of Significance
Variableb Treatment MSc Error MSc F Probability
Test 1 1154.89 89.62 12.89 .001a
Test 2 1029.19 121.30 8.49 .005a
Test 3 455.48 102.84 4.43 .038a
a Significant at the .05 levelb Each weekly test is four 20-question tests combined to be comparable with
each 80-question monthly testc Degrees of freedom 1,88
Therefore, there was a difference in achievement between students given
weekly tests and students given monthly tests. Furthermore, the difference
declined from about one-half to one-fourth of a standard deviation throughout the
semester.
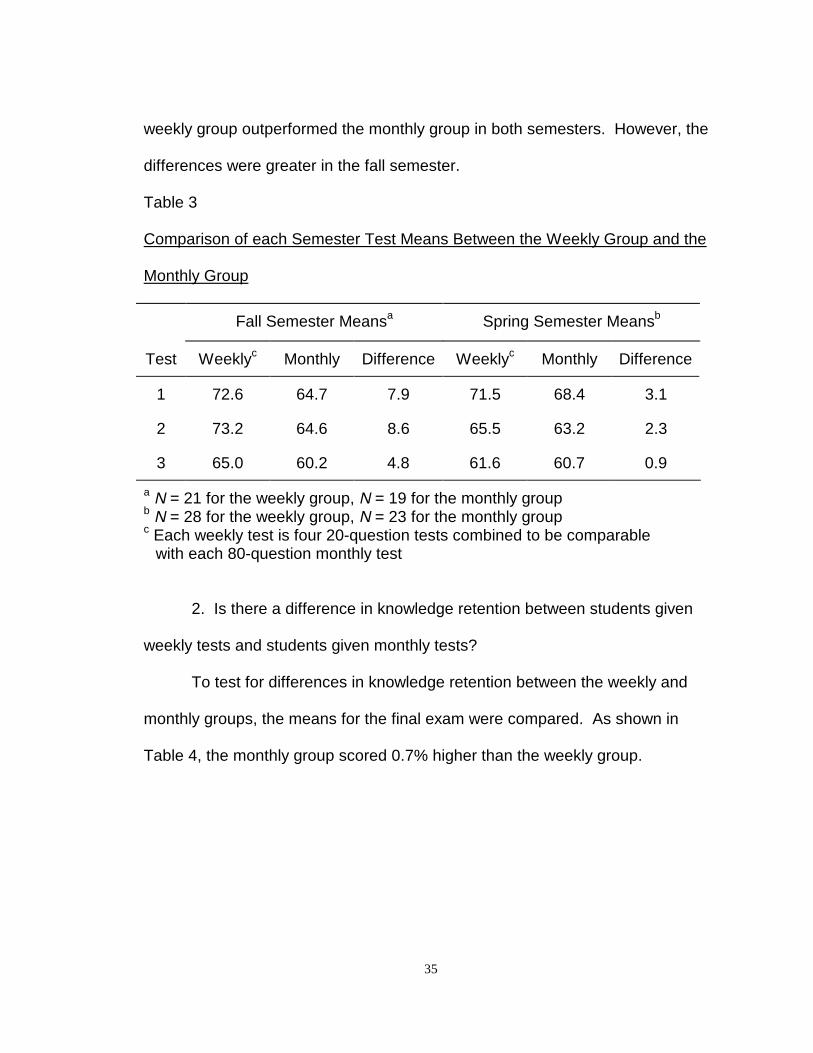
Table 3 compares the differences in test means for the weekly students
versus the monthly students for each semester. The results were similar. The
35
weekly group outperformed the monthly group in both semesters. However, the
differences were greater in the fall semester.
Table 3
Comparison of each Semester Test Means Between the Weekly Group and the
Monthly Group
Fall Semester Meansa Spring Semester Meansb
Test Weeklyc Monthly Difference Weeklyc Monthly Difference
1 72.6 64.7 7.9 71.5 68.4 3.1
2 73.2 64.6 8.6 65.5 63.2 2.3
3 65.0 60.2 4.8 61.6 60.7 0.9
a N = 21 for the weekly group, N = 19 for the monthly groupb N = 28 for the weekly group, N = 23 for the monthly groupc Each weekly test is four 20-question tests combined to be comparable
with each 80-question monthly test
2. Is there a difference in knowledge retention between students given
weekly tests and students given monthly tests?
To test for differences in knowledge retention between the weekly and
monthly groups, the means for the final exam were compared. As shown in
Table 4, the monthly group scored 0.7% higher than the weekly group.
36
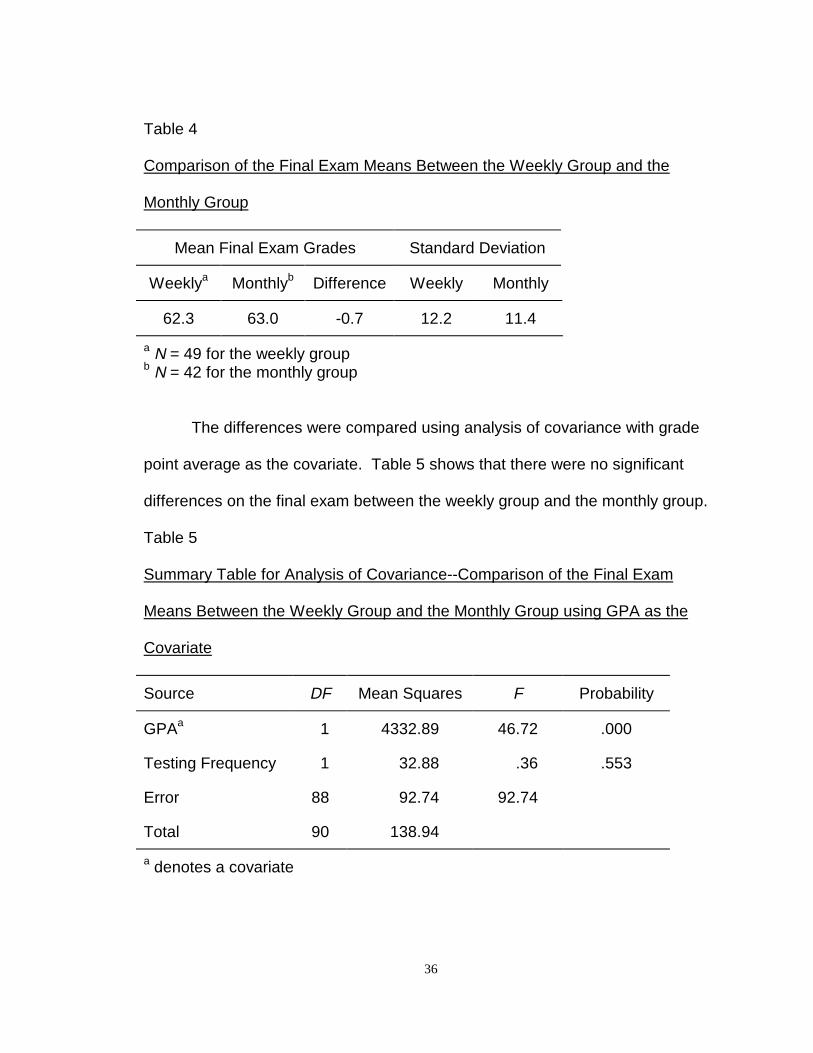
Table 4
Comparison of the Final Exam Means Between the Weekly Group and the
Monthly Group
Mean Final Exam Grades Standard Deviation
Weeklya Monthlyb Difference Weekly Monthly
62.3 63.0 -0.7 12.2 11.4
a N = 49 for the weekly groupb N = 42 for the monthly group
The differences were compared using analysis of covariance with grade
point average as the covariate. Table 5 shows that there were no significant
differences on the final exam between the weekly group and the monthly group.
Table 5
Summary Table for Analysis of Covariance--Comparison of the Final Exam
Means Between the Weekly Group and the Monthly Group using GPA as the
Covariate
Source DF Mean Squares F Probability
GPAa 1 4332.89 46.72 .000
Testing Frequency 1 32.88 .36 .553
Error 88 92.74 92.74
Total 90 138.94
a denotes a covariate
37
Therefore, there is no difference in knowledge retention between students
given weekly tests and students given monthly tests.
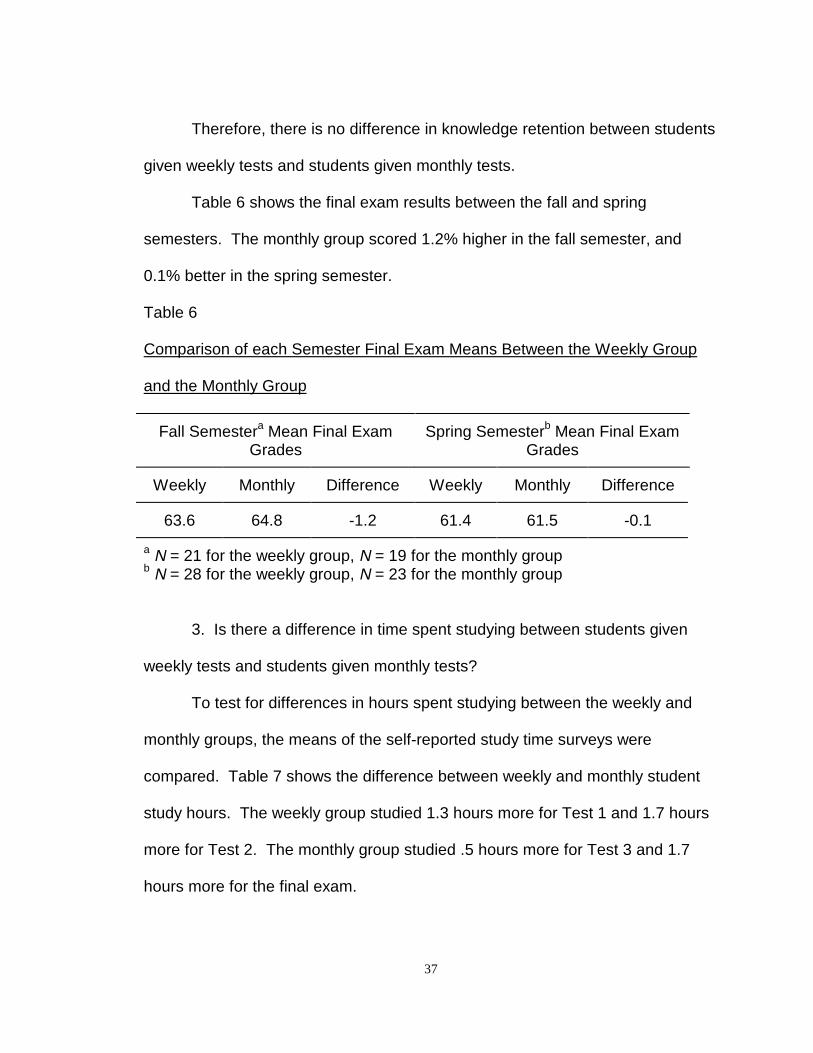
Table 6 shows the final exam results between the fall and spring
semesters. The monthly group scored 1.2% higher in the fall semester, and
0.1% better in the spring semester.
Table 6
Comparison of each Semester Final Exam Means Between the Weekly Group
and the Monthly Group
Fall Semestera Mean Final ExamGrades
Spring Semesterb Mean Final ExamGrades
Weekly Monthly Difference Weekly Monthly Difference
63.6 64.8 -1.2 61.4 61.5 -0.1
a N = 21 for the weekly group, N = 19 for the monthly groupb N = 28 for the weekly group, N = 23 for the monthly group
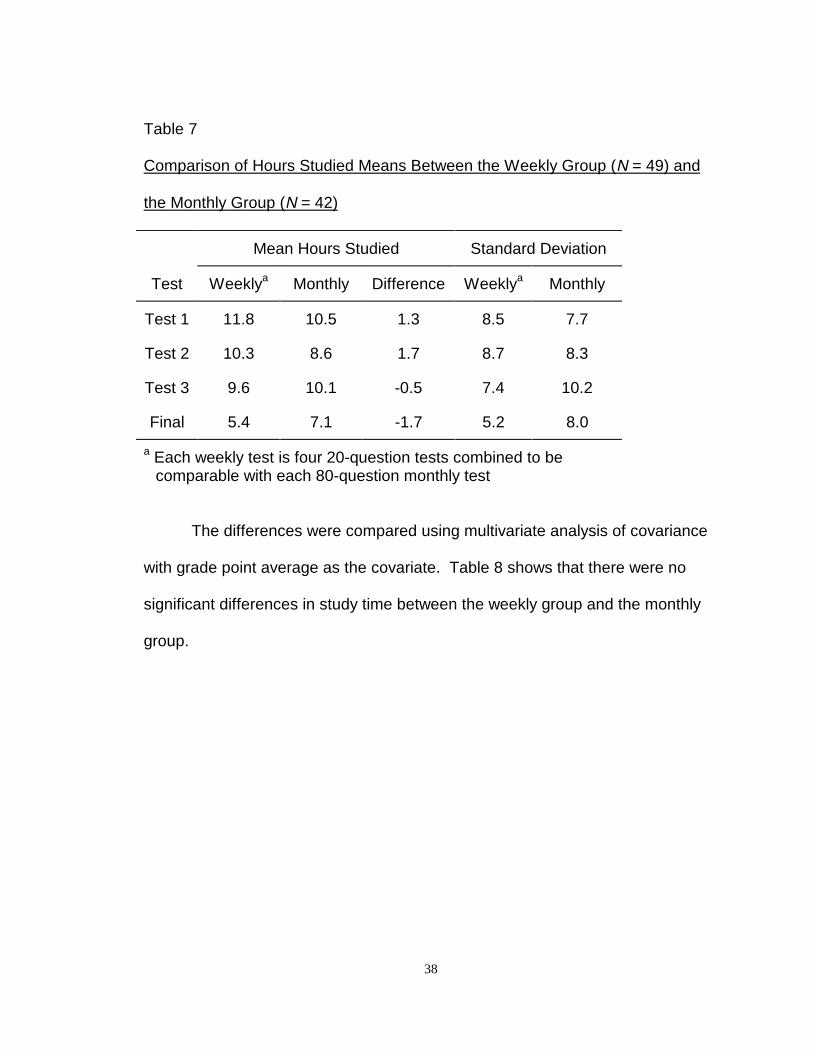
3. Is there a difference in time spent studying between students given
weekly tests and students given monthly tests?
To test for differences in hours spent studying between the weekly and
monthly groups, the means of the self-reported study time surveys were
compared. Table 7 shows the difference between weekly and monthly student
study hours. The weekly group studied 1.3 hours more for Test 1 and 1.7 hours
more for Test 2. The monthly group studied .5 hours more for Test 3 and 1.7
hours more for the final exam.
38
Table 7
Comparison of Hours Studied Means Between the Weekly Group (N = 49) and
the Monthly Group (N = 42)
Mean Hours Studied Standard Deviation
Test Weeklya Monthly Difference Weeklya Monthly
Test 1 11.8 10.5 1.3 8.5 7.7
Test 2 10.3 8.6 1.7 8.7 8.3
Test 3 9.6 10.1 -0.5 7.4 10.2
Final 5.4 7.1 -1.7 5.2 8.0
a Each weekly test is four 20-question tests combined to be comparable with each 80-question monthly test
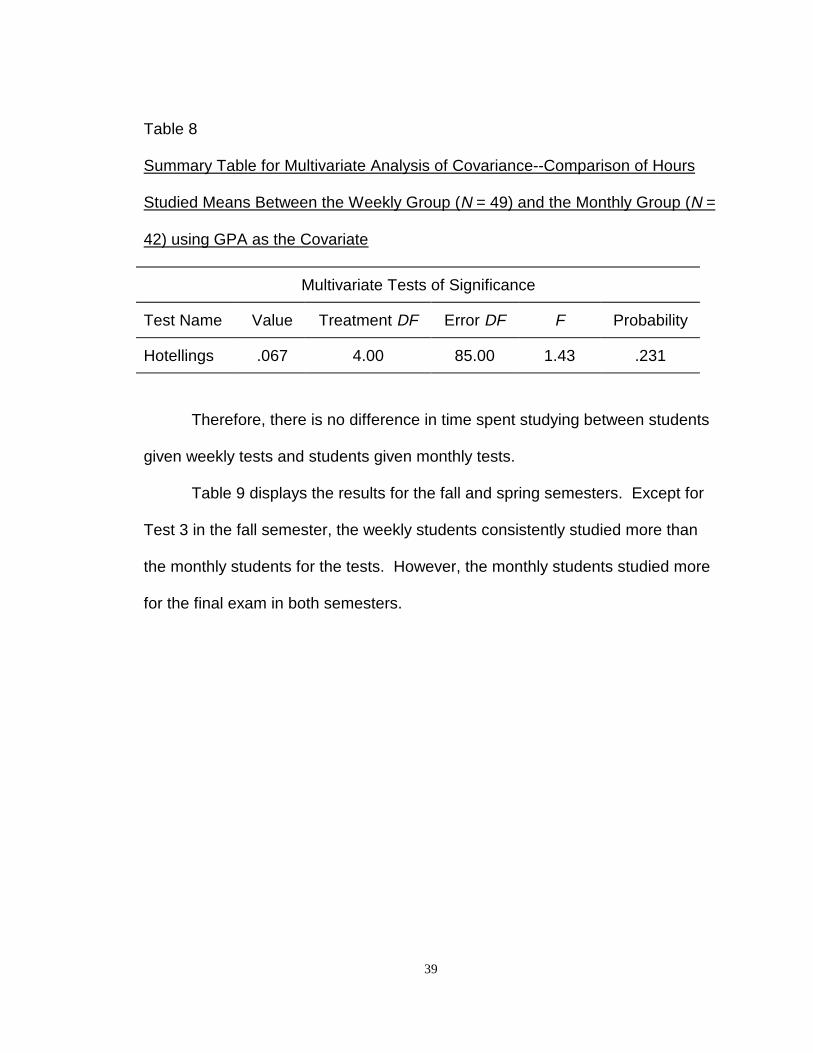
The differences were compared using multivariate analysis of covariance
with grade point average as the covariate. Table 8 shows that there were no
significant differences in study time between the weekly group and the monthly
group.
39
Table 8
Summary Table for Multivariate Analysis of Covariance--Comparison of Hours
Studied Means Between the Weekly Group (N = 49) and the Monthly Group (N =
42) using GPA as the Covariate
Multivariate Tests of Significance
Test Name Value Treatment DF Error DF F Probability
Hotellings .067 4.00 85.00 1.43 .231
Therefore, there is no difference in time spent studying between students
given weekly tests and students given monthly tests.
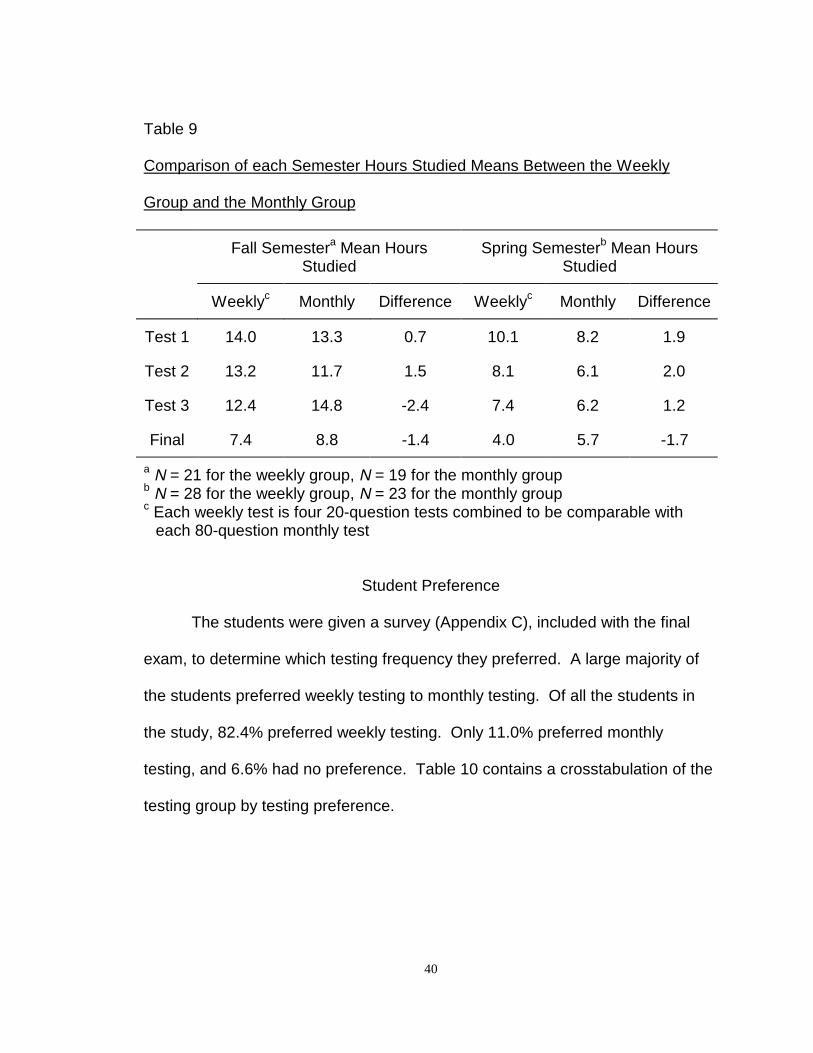
Table 9 displays the results for the fall and spring semesters. Except for
Test 3 in the fall semester, the weekly students consistently studied more than
the monthly students for the tests. However, the monthly students studied more
for the final exam in both semesters.
40
Table 9
Comparison of each Semester Hours Studied Means Between the Weekly
Group and the Monthly Group
Fall Semestera Mean HoursStudied
Spring Semesterb Mean HoursStudied
Weeklyc Monthly Difference Weeklyc Monthly Difference
Test 1 14.0 13.3 0.7 10.1 8.2 1.9
Test 2 13.2 11.7 1.5 8.1 6.1 2.0
Test 3 12.4 14.8 -2.4 7.4 6.2 1.2
Final 7.4 8.8 -1.4 4.0 5.7 -1.7
a N = 21 for the weekly group, N = 19 for the monthly groupb N = 28 for the weekly group, N = 23 for the monthly groupc Each weekly test is four 20-question tests combined to be comparable with
each 80-question monthly test
Student Preference
The students were given a survey (Appendix C), included with the final
exam, to determine which testing frequency they preferred. A large majority of
the students preferred weekly testing to monthly testing. Of all the students in
the study, 82.4% preferred weekly testing. Only 11.0% preferred monthly
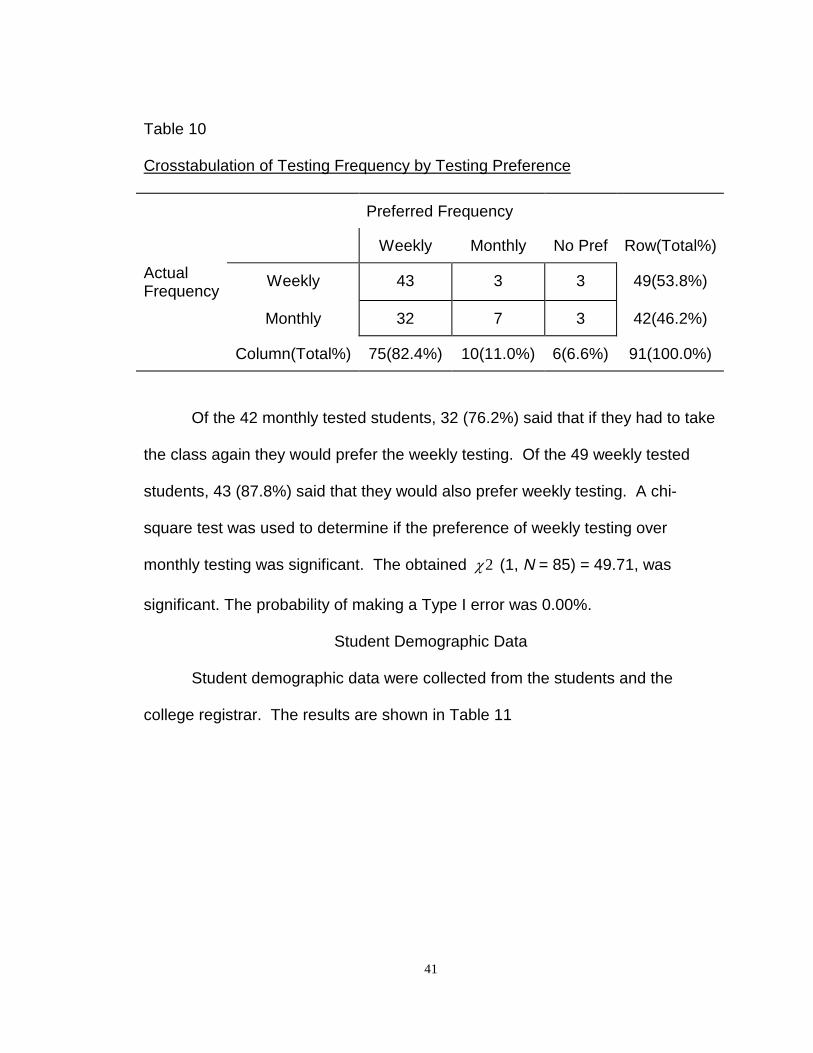
testing, and 6.6% had no preference. Table 10 contains a crosstabulation of the
testing group by testing preference.
41
Table 10
Crosstabulation of Testing Frequency by Testing Preference
Preferred Frequency
Weekly Monthly No Pref Row(Total%)
ActualFrequency
Weekly 43 3 3 49(53.8%)
Monthly 32 7 3 42(46.2%)
Column(Total%) 75(82.4%) 10(11.0%) 6(6.6%) 91(100.0%)
Of the 42 monthly tested students, 32 (76.2%) said that if they had to take
the class again they would prefer the weekly testing. Of the 49 weekly tested
students, 43 (87.8%) said that they would also prefer weekly testing. A chi-
square test was used to determine if the preference of weekly testing over
monthly testing was significant. The obtained �2 (1, N = 85) = 49.71, was
significant. The probability of making a Type I error was 0.00%.
Student Demographic Data
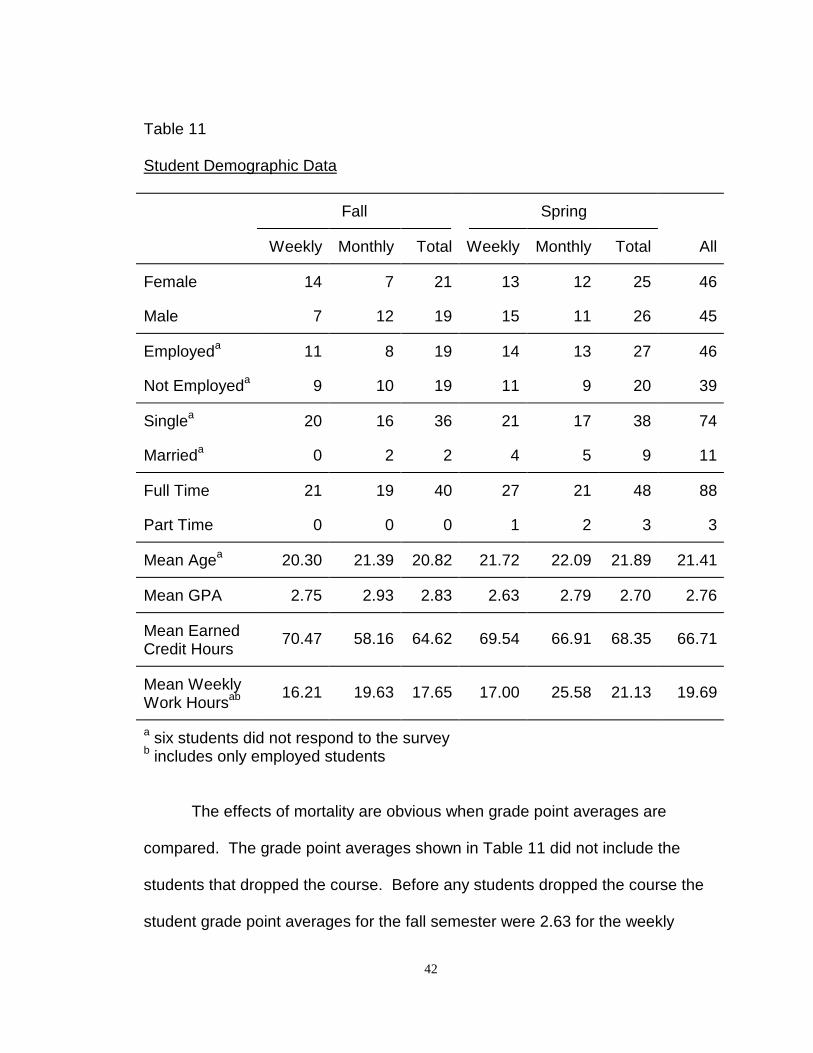
Student demographic data were collected from the students and the
college registrar. The results are shown in Table 11
42
Table 11
Student Demographic Data
Fall Spring
Weekly Monthly Total Weekly Monthly Total All
Female 14 7 21 13 12 25 46
Male 7 12 19 15 11 26 45
Employeda 11 8 19 14 13 27 46
Not Employeda 9 10 19 11 9 20 39
Singlea 20 16 36 21 17 38 74
Marrieda 0 2 2 4 5 9 11
Full Time 21 19 40 27 21 48 88
Part Time 0 0 0 1 2 3 3
Mean Agea 20.30 21.39 20.82 21.72 22.09 21.89 21.41
Mean GPA 2.75 2.93 2.83 2.63 2.79 2.70 2.76
Mean EarnedCredit Hours
70.47 58.16 64.62 69.54 66.91 68.35 66.71
Mean WeeklyWork Hoursab 16.21 19.63 17.65 17.00 25.58 21.13 19.69
a six students did not respond to the surveyb includes only employed students
The effects of mortality are obvious when grade point averages are
compared. The grade point averages shown in Table 11 did not include the
students that dropped the course. Before any students dropped the course the
student grade point averages for the fall semester were 2.63 for the weekly
43
group and 2.71 for the monthly group. The student grade point averages for the
spring semester were 2.61 for the weekly group and 2.69 for the monthly group.
Notice that the groups were much more equivalent before the effects of mortality.
The differences in grade point average between the weekly and monthly groups
at least doubled after the effects of mortality. Also notice that the grade point
averages for each of the four groups increased after the effect of mortality. More
students with lower grade point averages dropped the course than students with
higher grade point averages.
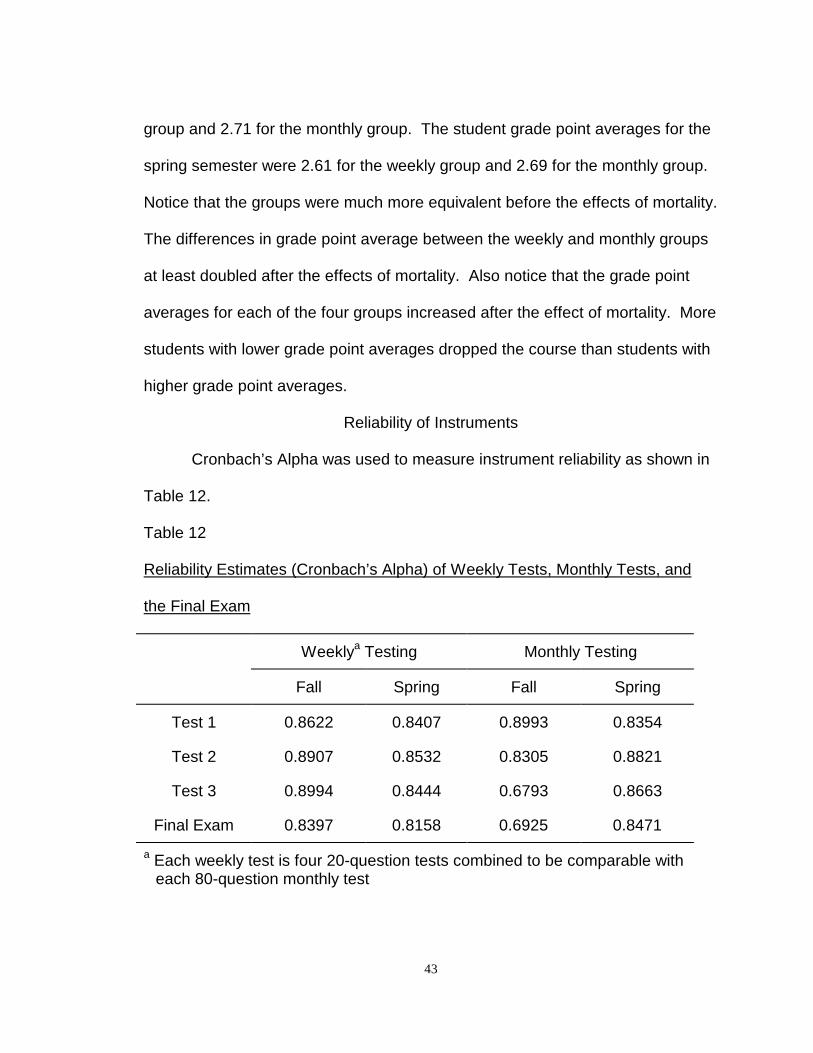
Reliability of Instruments
Cronbach’s Alpha was used to measure instrument reliability as shown in
Table 12.
Table 12
Reliability Estimates (Cronbach’s Alpha) of Weekly Tests, Monthly Tests, and
the Final Exam
Weeklya Testing Monthly Testing
Fall Spring Fall Spring
Test 1 0.8622 0.8407 0.8993 0.8354
Test 2 0.8907 0.8532 0.8305 0.8821
Test 3 0.8994 0.8444 0.6793 0.8663
Final Exam 0.8397 0.8158 0.6925 0.8471
a Each weekly test is four 20-question tests combined to be comparable witheach 80-question monthly test
44
Any alpha measurement over .70 was considered to be acceptable. Note
from Table 11 that all but two alpha measurements (the fall semester monthly
Test 3 and the fall semester monthly final exam) are well above the minimum.
Concerning the fall semester monthly final exam with a measurement of 0.6925,
recall that all four final exams were identical, so the same instrument that
measured 0.6925, also measured 0.8397, 0.8158, and 0.8471 from other
students. Also, the fall semester monthly Test 3 measured 0.6793 , but was also
the same test used for the spring semester weekly Test 3 and measured 0.8444.
Therefore, all instruments were considered reliable.
45
CHAPTER 5
SUMMARY, CONCLUSIONS, DISCUSSION, AND RECOMMENDATIONS
This chapter provides a summary of the study, conclusions, discussion,
and recommendations for instruction and further research concerning whether
college students perform differently when they are tested more frequently than
less frequently.
Summary
The purpose of this research study concerning frequency of testing was:
(a) to determine if there is a difference in achievement between students given
weekly tests (experimental group) and students given monthly tests (control
group), (b) to determine if there is a difference in knowledge retention between
students given weekly tests and students given monthly tests, and (c) to
determine if there is a difference in time spent studying between students given
weekly tests and students given monthly tests.
To test for differences in achievement between the weekly group and the
monthly group, the mean test scores were compared at 80-question intervals.
To test for differences in knowledge retention between the weekly group and the
monthly group, the mean final exam scores were compared. To test for
differences in hours spent studying between the weekly group and the monthly
group, the means from the self-reported study hours surveys were compared at
80-question intervals. The surveys were given with each test and the final exam.
46
The research design used was a true experimental form of the posttest-
only with control technique. The participants were 109 students taking Principles
of Marketing at Concord College in Athens, West Virginia. Fifty were enrolled in
the fall of 1996, and the study was replicated with 59 students who were enrolled
in the spring of 1997. Half of each class (fall and spring) was randomly assigned
to weekly testing and the other halves were assigned to monthly testing. The
weekly and monthly groups were taught simultaneously by the researcher both
semesters.
Conclusions
The present research corrected for all methodological flaws discussed in
Chapter 2, therefore, the results are very defensible. This research showed a
significant difference in achievement between the weekly and the monthly
groups in favor of the weekly group, as measured by the mean grade earned on
each test. Therefore, it can be concluded that there is a difference in
achievement between students given weekly tests and students given monthly
tests.
The difference between the weekly and monthly group final exam scores
was not significant. Therefore, it cannot be concluded that there is a difference
in knowledge retention between students given weekly tests and students given
monthly tests.
The difference between the weekly and monthly groups’ self-reported
study hours was not significant. Therefore, it cannot be concluded that there is a
47
difference in time spent studying between students given weekly tests and
students given monthly tests.
Discussion
This study was based on the theories of operant conditioning and
reinforcement scheduling, and the spacing effect. Good and Brophy (1990),
authors of Educational Psychology: A Realistic Approach, argued that operant
conditioning and reinforcement scheduling support the belief that students wait
until the “last minute” to study. Under operant conditioning, the subject (the
student) is reinforced (the test) for the proper behavior or response (studying).
Subjects wait until they receive a discriminant stimulus to begin the desired
behavior. For example, when students know that one month must pass before
the next test, they will begin studying around the time of the next test. Based on
operant conditioning and reinforcement scheduling, there are two reasons
students should learn more if given more frequent tests. One, students taking
weekly test should study more often than students receiving monthly tests. Two,
the weekly tested students will have less material to study during these “last
minutes.”
Forcing the students to maintain a steady study schedule by testing
frequently has additional benefits supported by the spacing effect. Dempster
and Farris (1990) described spacing effect as “the tendency, given an amount of
study time, for spaced presentations of a unit of information to yield much better
learning than massed presentations” (p. 97). Massed presentations are
48
concentrated into one or just a few lengthy learning or practice sessions.
Spaced or distributed presentations involve more sessions shorter in length
(Good & Brophy, 1990). Therefore, based on the spacing effect, the more
frequently tested students should learn more, simply because frequent studying
is more effective than infrequent studying.
Achievement
Concerning the performance on the tests, operant conditioning and
reinforcement scheduling and the spacing effect theories held true in this study.
Compared to the monthly students, the weekly students scored 5.3% higher on
Test 1, 4.9% higher on Test 2, and 2.7% higher on Test 3. These results are
consistent with the meta-analysis completed by Bangert-Drowns et al. (1986),
and the findings of Kika et al. (1992). Also, notice that the differences in the
means declined over time. This may be because as the material becomes more
complex, the effect of frequent testing is reduced. This supports the findings of
Dineen et al. (1989) where the differences in the groups were greater with the
less difficult courses. A second possible explanation for the decline in the
differences in the means is student fatigue. Several students complained that
weekly testing was exhausting and that they were unable to maintain the same
intensity level in their study habits for the entire semester.
Knowledge Retention
Do the frequently tested students remember more of the material than the
infrequently tested students? In this study, there was no significant difference in
49
the weekly and monthly final exam means. These results are consistent with the
meta-analysis completed by Bangert-Drowns et al. (1986), and the findings of
Grover et al. (1989).
Although frequent testing had an effect on achievement, the effects were
not lasting. The reason may be explained by the number of hours spent studying
for the final exam. Fulkerson and Martin (1981) reported similar findings and
believed that cramming for the final exam made up for the differences in the
groups.
Study Hours
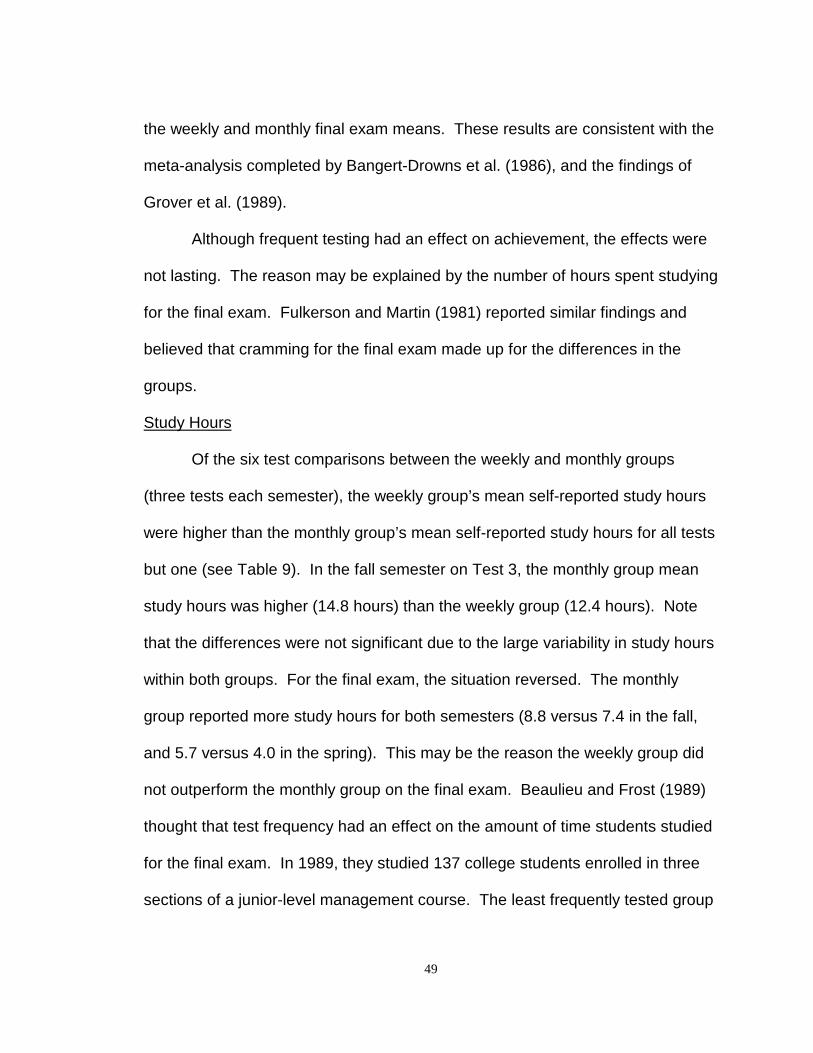
Of the six test comparisons between the weekly and monthly groups
(three tests each semester), the weekly group’s mean self-reported study hours
were higher than the monthly group’s mean self-reported study hours for all tests
but one (see Table 9). In the fall semester on Test 3, the monthly group mean
study hours was higher (14.8 hours) than the weekly group (12.4 hours). Note
that the differences were not significant due to the large variability in study hours
within both groups. For the final exam, the situation reversed. The monthly
group reported more study hours for both semesters (8.8 versus 7.4 in the fall,
and 5.7 versus 4.0 in the spring). This may be the reason the weekly group did
not outperform the monthly group on the final exam. Beaulieu and Frost (1989)
thought that test frequency had an effect on the amount of time students studied
for the final exam. In 1989, they studied 137 college students enrolled in three
sections of a junior-level management course. The least frequently tested group
50
scored eight percent better on the final than the other two more frequently tested
groups. Although study hour data was not collected, Beaulieu and Frost
speculated that the more frequently tested groups may have been conditioned
during the semester to study less for their shorter tests and this same amount of
effort (study time) was used for the final exam. It appears that Beaulieu and
Frost are correct, however, since the difference in study hours was not
significantly different, this evidence is not conclusive.
The data from Table 9 provide more evidence that some weekly students
may be experiencing fatigue, perhaps even after just several weeks of weekly
testing. The amount of time both weekly groups spent studying declined
throughout the semester. This did not happen in either monthly group.
Preference
The final results showed that 82.4% of the students preferred frequent
testing, while only 6.6% preferred monthly testing. All previous studies that have
measured student preference to testing frequency reached the same
conclusions (e.g., Turney, 1931; Bangert-Drowns et al., 1986; Grover et al.,
1989; Beaulieu and Frost ,1989; Kika et al., 1992). Of the studies that reported
their numbers, the results are very similar. Grover et al. reported that 75%
preferred frequent testing, and Kika et al. reported that 88% preferred frequent
testing.
51
Recommendations
The findings and conclusions of this study indicate that the use of frequent
testing does not encourage students to study more hours per course, does not
affect how students will perform on the final exam, but it does help students earn
higher grades during the semester. Furthermore, almost all students prefer
frequent testing to nonfrequent testing.
Recommendations for Instruction
The findings and conclusions of this study are used to support the
following recommendations for instruction and further research.
1. Frequent testing is recommended. There are several reasons for this
recommendation. Students overwhelmingly prefer frequent testing. The positive
impact on student preference towards frequent testing may be because there is
a positive effect on achievement. Furthermore, frequent testing can promote a
positive attitude toward the class, the material, and perhaps a more positive
attitude about the instructor as well. Improved student evaluations may be a side
benefit for instructors who choose to use an increased testing frequency.
2. Give the first test early in the semester. The benefits of frequent
testing seem to decline throughout the semester (refer to Table 1). Perhaps the
main benefit to frequent testing is that it gets the student involved in the material
earlier in the semester. Even a short quiz given early in the semester may help
the students become more involved in the course.
52
Recommendations for Further Research
The findings and conclusions of this study are used to support the
following recommendations for further research.
1. The final exam should be re-administered to the students at some
point in time after the course to determine if there is a longer-term difference in
knowledge retention between students given weekly tests and students given
monthly tests.
2. Replication should take place using different courses to determine if
the type of course has an effect on the results.
3. Replication of this study should be conducted using different course
meeting schedules to determine if frequent testing has a different effect on
students in a course that meets several days per week versus a course that
meets only once per week.
4. Studies should be conducted to compare the effects of frequent testing
with various demographic variables such as age, gender, grade point average,
employment, and marital status.
5. Studies should be conducted to determine if there are additional
benefits to frequent testing. Because of the positive effect that frequent testing
has on students’ grades and therefore, potentially students’ attitudes, frequent
testing may have many benefits. Some benefits to consider: an increase in
student retention rates, a change in student attitudes, a reduction in stress, or an
improvement in students’ teacher evaluations.
53
REFERENCES
Bangert-Drowns, R. L., Kulik, J. A., & Kulik, C. C. (1986). Effects of frequentclassroom testing (Report No. TM-860-524). San Francisco, CA: Paperpresented at the Annual Meeting of the American Educational ResearchAssociation. (ERIC Document Reproduction Service No. ED 274 672)
Beaulieu, R. P., & Frost, B. E. (1989). Impact of examination frequency onAchievement and Effect. Journal of Instructional Psychology, 16, 145-150.
Beaulieu, R. P., & Zar, M. C. (1986). The effects of examination frequency onstudent performance. Journal of Instructional Psychology, 13, 81-89.
Bourne, L. E., & Ekstrand, B. R. (1979). Psychology: Its principles andmeanings (3rd ed.). New York: Holt, Rinehart, and Winston.
Christensen, L. B. (1977). Experimental Methodology. Boston: Allyn andBacon.
Concord College Catalog 1995. Athens, West Virginia.
Curo, D. M. (1963). An investigation of the influence of daily pre-class testingon achievement in high school American history classes. DissertationAbstracts International, 24, 5236.
Dempster, F. N., & Farris, R. (1990). The spacing effect: Research andpractice. Journal of Research and Development in Education, 23(2), 97-101.
Dineen, P., Taylor, J., & Stephens, L. (1989). The effect of testing frequencyupon the achievement of students in high school mathematics courses.School Science Mathematics, 89(3), 197-200.
Dustin, D. S. (1971). Some effects of exam frequency. The PsychologicalRecord, 21, 409-414.
Fulkerson, F. F., & Martin, G. (1981). Effects of exam frequency on studentperformance, evaluations of instructor, and test anxiety. Teaching ofPsychology, 8(2), 90-93.
Gay, L. R. (1992). Educational Research: Competencies for Analysis andApplication (4th ed.). New York: Macmillan.
54
Good, T. L., & Brophy, J. E. (1990). Educational Psychology: A RealisticApproach (4th ed.). New York: Longman.
Grover, C. A., Becker, A. H., & Davis, S. F. (1989). Chapters and units:Frequent versus infrequent testing revisited. Teaching of Psychology,16(4), 192-194.
Huck, S. W., Cormier, W. H., & Bounds, W. G., Jr. (1974). Reading Statisticsand Research. New York: Harper Collins.
Khalaf, A. S. S. (1989). The effects of classroom testing frequency on studentachievement in tenth grade biology in Saudi Arabia. Unpublished doctoraldissertation, Kansas State University, Manhattan.
Khalaf, A. S. S., & Hanna, G. S. (1992). The impact of classroom testingfrequency on high school student’s achievement. ContemporaryEducational Psychology, 17, 71-77.
Kika, F. M., McLaughlin, T. F., & Dixon, J. (1992). Effects of frequent testing ofsecondary algebra students. Journal of Educational Research, 85(3),159-162.
Laidlaw, W. J. (1963). The effects of frequent tests on achievement, retentionand transfer, and tests. Dissertation Abstracts International, 24, 5197.
Lindenberg, T. S. (1984). The effect of test frequency on achievement in thefirst principles of accounting course. Unpublished doctoral dissertation,Northern Illinois University, Dekalb.
McDaris, M. A. (1984). Test frequency revisited--A pilot study (Report No. TM-860-006). Honolulu, HI: Paper presented at the Annual Meeting of theInternational Communication Association. (ERIC Document ReproductionService No. ED 265 175)
Noll, V. H. (1939). The effect of written tests upon achievement in college: Anexperiment and summary of evidence. Journal of Educational Research,32(5), 345-358.
Rievman, S. P. (1973). Optimal frequency of testing as a function of ability leveland reinforcement history. Unpublished doctoral dissertation, FloridaAtlantic University.
Schoell, W. F., & Guiltinan, J. P. (1995). Marketing (6th ed.). Englewood Cliffs,NJ: Prentice Hall.
55
Selakovich, D. (1962). An experiment attempting to determine the effectivenessof frequent testing as an aid to learning in beginning college courses inAmerican government. The Journal of Educational Research, 55(4), 178-180.
SPSS Graduate Pack Advanced Version, V6.1.4, [Computer Software]. (1996).Chicago, IL: SPSS Incorporated, 444 North Michigan Avenue.
Standlee, L. S., & Popham, W. J. (1960). Quizzes’ contribution to learning.Journal of Educational Psychology, 51(6), 322-325.
Turney, A. H. (1931). The effect of frequent short objective tests upon theachievement of college students in educational psychology. School andSociety, 33(858), 760-762.
Wolfe, R. N., & Johnson, S. D. (1995). Personality as a predictor of collegeperformance. Educational and Psychological Measurement, 55(2), 177-185.
Yamin, S. B. (1988). Frequency of testing and its effects on achievement inchemistry, test anxiety and attitudes toward science at UniversityTechnology of Maylasia. Unpublished doctoral dissertation, UniversityTechnology of Malaysia.
56
APPENDIX A:PRINCIPLES OF MARKETING STUDENT QUESTIONNAIRE
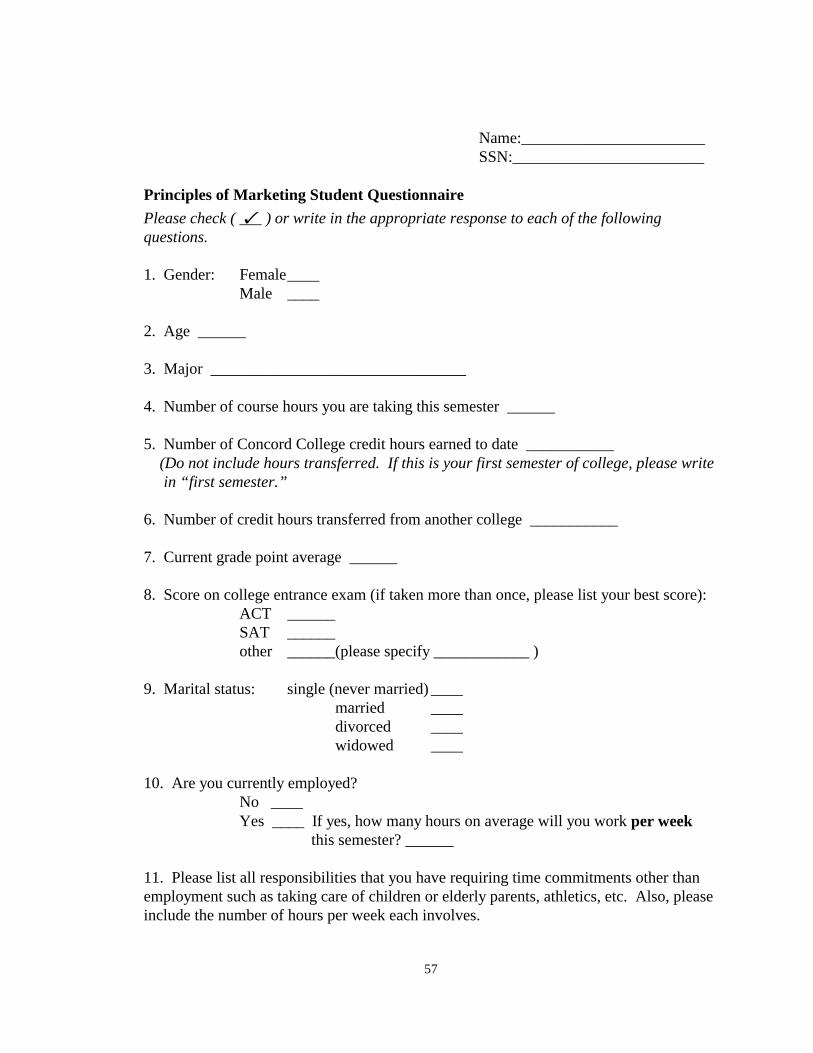
57
Name:_______________________SSN:________________________
Principles of Marketing Student Questionnaire
Please check ( � ) or write in the appropriate response to each of the followingquestions.
1. Gender: Female____Male ____
2. Age ______
3. Major ________________________________
4. Number of course hours you are taking this semester ______
5. Number of Concord College credit hours earned to date ___________ (Do not include hours transferred. If this is your first semester of college, please write in “first semester.”
6. Number of credit hours transferred from another college ___________
7. Current grade point average ______
8. Score on college entrance exam (if taken more than once, please list your best score):ACT ______SAT ______other ______(please specify ____________ )
9. Marital status: single (never married) ____married ____divorced ____widowed ____
10. Are you currently employed?No ____Yes ____ If yes, how many hours on average will you work per week
this semester? ______
11. Please list all responsibilities that you have requiring time commitments other thanemployment such as taking care of children or elderly parents, athletics, etc. Also, pleaseinclude the number of hours per week each involves.
58
APPENDIX B:STUDY HOURS QUESTIONNAIRE
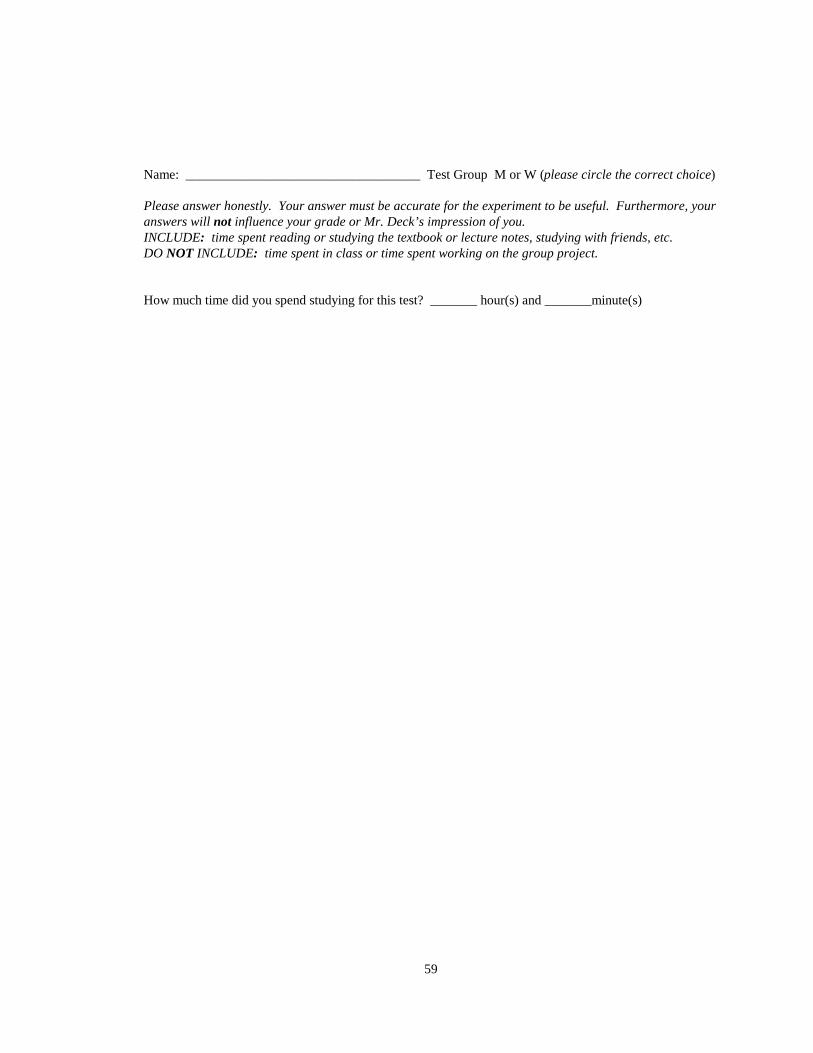
59
Name: ___________________________________ Test Group M or W (please circle the correct choice)
Please answer honestly. Your answer must be accurate for the experiment to be useful. Furthermore, youranswers will not influence your grade or Mr. Deck’s impression of you.INCLUDE: time spent reading or studying the textbook or lecture notes, studying with friends, etc.DO NOT INCLUDE: time spent in class or time spent working on the group project.
How much time did you spend studying for this test? _______ hour(s) and _______minute(s)
60
APPENDIX C:PREFERENCE QUESTIONNAIRE
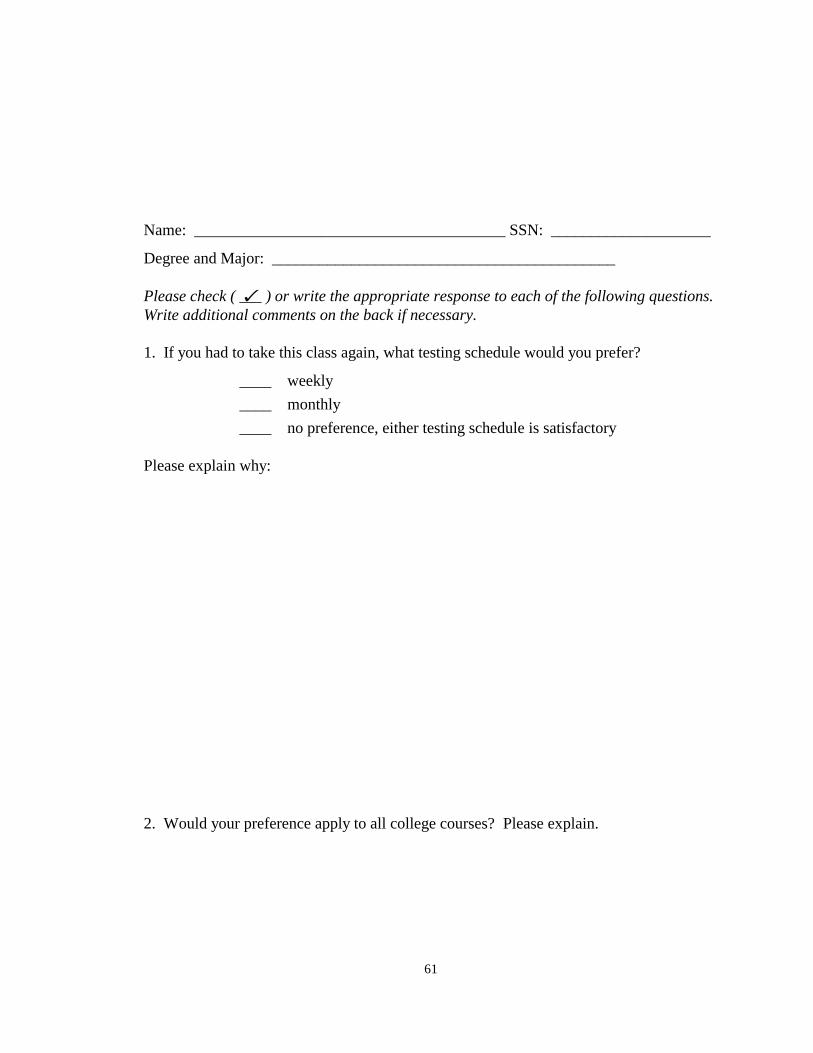
61
Name: _______________________________________ SSN: ____________________
Degree and Major: ___________________________________________
Please check ( � ) or write the appropriate response to each of the following questions.Write additional comments on the back if necessary.
1. If you had to take this class again, what testing schedule would you prefer?
____ weekly
____ monthly
____ no preference, either testing schedule is satisfactory
Please explain why:
2. Would your preference apply to all college courses? Please explain.
62
D. William Deck, Jr. (Bill)Assistant Professor of Business
Division of Business and EconomicsConcord College
Athens, West Virginia 24712
EducationPh.D., Virginia Polytechnic Institute and State University, Blacksburg, VA,
Concentration: Marketing Education, December 1998. DissertationTopic: The Effects of Frequency of Testing on College Students in aPrinciples of Marketing Course. Committee Chair: Dr. William T. Price,Jr.
Masters in Business Administration, Virginia Polytechnic Institute and StateUniversity, Blacksburg, VA, March 1986
Bachelor of Science in Business, Virginia Polytechnic Institute and StateUniversity, Blacksburg, VA, Major: Finance, July 1983
Academic ExperienceAssistant Professor of Business, Division of Business and Economics, Concord
College, Athens, West Virginia, 1987-present.
Courses taught: Principles of Marketing, Marketing Research, RetailManagement, Marketing Management, Sales and Sales Management,Advertising and Sales Promotion, Quantitative Methods, Calculus forBusiness Applications, and Investments.
Committee memberships: Personnel Committee, Professional ActivitiesCommittee, Curriculum Review Committee, Institutional HearingCommittee, and Faculty Senate.
Sponsor: Marketing Club - American Marketing Association Concord CollegeChapter.
Professional ExperiencePlanner, Burlington Industries - Menswear Division, Clarksville, Virginia.
April 1986 to August 1987. Responsible for scheduling and orderingdacron tow, scheduling blended top, forecasting and inventory control,MRP maintenance, and updating and publishing reports.
63
Loan Officer Trainee, Bank of Shawsville, Shawsville, Virginia.July 1983 to September 1984. Initiated, pursued, and ensured promptcollection of all delinquent loans. Acted as plaintiff for the bank in legalmatters pertaining to collections.
Computer ExperienceDOS and Windows based computers and software: Microsoft Office including
Word, Excel, PowerPoint; LOTUS 123; and SPSS.
Related Documents