The Effects of Elevated CO 2 Concentration on Soybean Gene Expression. An Analysis of Growing and Mature Leaves 1[W][OA] Elizabeth A. Ainsworth*, Alistair Rogers, Lila O. Vodkin, Achim Walter, and Ulrich Schurr United States Department of Agriculture/Agricultural Research Service Photosynthesis Research Unit (E.A.A.), Department of Plant Biology (E.A.A.), and Department of Crop Sciences (A.R., L.O.V.), University of Illinois at Urbana-Champaign, Urbana, Illinois 61801; Department of Environmental Sciences, Brookhaven National Laboratory, Upton, New York 11973–5000 (A.R.); and ICG-III, Juelich Research Center, D–52425 Juelich, Germany (E.A.A., A.W., U.S.) Improvements in carbon assimilation and water-use efficiency lead to increases in maximum leaf area index at elevated carbon dioxide concentration ([CO 2 ]); however, the molecular drivers for this increase are unknown. We investigated the molecular basis for changes in leaf development at elevated [CO 2 ] using soybeans (Glycine max) grown under fully open air conditions at the Soybean Free Air CO 2 Enrichment (SoyFACE) facility. The transcriptome responses of rapidly growing and fully expanded leaves to elevated [CO 2 ] were investigated using cDNA microarrays. We identified 1,146 transcripts that showed a significant change in expression in growing versus fully expanded leaves. Transcripts for ribosomal proteins, cell cycle, and cell wall loosening, necessary for cytoplasmic growth and cell proliferation, were highly expressed in growing leaves. We further identified 139 transcripts with a significant [CO 2 ] by development interaction. Clustering of these transcripts showed that transcripts involved in cell growth and cell proliferation were more highly expressed in growing leaves that developed at elevated [CO 2 ] compared to growing leaves that developed at ambient [CO 2 ]. The 327 [CO 2 ]-responsive genes largely suggest that elevated [CO 2 ] stimulates the respiratory breakdown of carbohydrates, which provides increased energy and biochemical precursors for leaf expansion and growth at elevated [CO 2 ]. While increased photosynthesis and carbohydrate production at elevated [CO 2 ] are well documented, this research demonstrates that at the transcript and metabolite level, respiratory breakdown of starch is also increased at elevated [CO 2 ]. By 2050, soybean (Glycine max) will grow in an atmosphere with a 50% higher carbon dioxide con- centration ([CO 2 ]) (Prentice et al., 2001). As the world’s most widely grown seed legume, the physiological responses of soybean to elevated CO 2 have been well characterized. Elevated [CO 2 ] increases carbon (C) up- take, foliar carbohydrate content, plant growth, and yield, while decreasing stomatal conductance (for re- view, see Ainsworth et al., 2002). A Free Air CO 2 Enrichment (FACE) experiment was established in one of the world’s most productive soybean-growing areas, Central Illinois, in 2001. This facility allows investigation of the response of field-grown soybean to an atmosphere predicted for 2050 without alteration of the microclimate (Long et al., 2004). Across the grow- ing season, daily integrals of leaf photosynthetic CO 2 uptake increased by approximately 25%, even as mid- day stomatal conductance decreased by approxi- mately 20% (Rogers et al., 2004; Bernacchi et al., 2006). Improvements in C assimilation and water-use effi- ciency spurred increases in maximum leaf area index (LAI) and aboveground biomass in elevated [CO 2 ] (Morgan et al., 2005; Dermody et al., 2006). The com- bination of increased photosynthesis and increased LAI provided the inputs for significant increases in soybean seed yield (Ort et al., 2006). Increased leaf growth, leading to larger individual leaf size, is one component of increased LAI measured at elevated [CO 2 ] in field experiments (Taylor et al., 2003; Tricker et al., 2004; Dermody et al., 2006). At the molecular level, the basis for changes in LAI at ele- vated [CO 2 ] is largely unknown. Both cell production rates and cell expansion have been shown to be sensitive to elevated [CO 2 ] (Taylor et al., 1994, 2003). Transcript analysis of growing poplar (Populus spp.) leaves exposed to elevated [CO 2 ] showed that genes involved in cell wall loosening and synthesis were 1 This work was supported by the Illinois Council for Food and Agricultural Research, by the Archer Daniels Midland Company, and by the U.S. Department of Agriculture/Agricultural Research Service. E.A.A. was supported by an Alexander von Humboldt postdoctoral research fellowship. A.R. was supported by the U.S. Department of Energy Office of Science contract no. DE–AC02– 98CH10886 to Brookhaven National Laboratory. * Corresponding author; e-mail [email protected]; fax 217–244– 4419. The author responsible for distribution of materials integral to the findings presented in this article in accordance with the policy described in the Instructions for Authors (www.plantphysiol.org) is: Elizabeth A. Ainsworth ([email protected]). [W] The online version of this article contains Web-only data. [OA] Open Access articles can be viewed online without a sub- scription. www.plantphysiol.org/cgi/doi/10.1104/pp.106.086256 Plant Physiology, September 2006, Vol. 142, pp. 135–147, www.plantphysiol.org Ó 2006 American Society of Plant Biologists 135 www.plantphysiol.org on August 23, 2016 - Published by www.plantphysiol.org Downloaded from Copyright © 2006 American Society of Plant Biologists. All rights reserved.

Welcome message from author
This document is posted to help you gain knowledge. Please leave a comment to let me know what you think about it! Share it to your friends and learn new things together.
Transcript
The Effects of Elevated CO2 Concentration on SoybeanGene Expression. An Analysis of Growingand Mature Leaves1[W][OA]
Elizabeth A. Ainsworth*, Alistair Rogers, Lila O. Vodkin, Achim Walter, and Ulrich Schurr
United States Department of Agriculture/Agricultural Research Service Photosynthesis Research Unit(E.A.A.), Department of Plant Biology (E.A.A.), and Department of Crop Sciences (A.R., L.O.V.), Universityof Illinois at Urbana-Champaign, Urbana, Illinois 61801; Department of Environmental Sciences,Brookhaven National Laboratory, Upton, New York 11973–5000 (A.R.); and ICG-III, JuelichResearch Center, D–52425 Juelich, Germany (E.A.A., A.W., U.S.)
Improvements in carbon assimilation and water-use efficiency lead to increases in maximum leaf area index at elevated carbondioxide concentration ([CO2]); however, the molecular drivers for this increase are unknown. We investigated the molecularbasis for changes in leaf development at elevated [CO2] using soybeans (Glycine max) grown under fully open air conditions atthe Soybean Free Air CO2 Enrichment (SoyFACE) facility. The transcriptome responses of rapidly growing and fully expandedleaves to elevated [CO2] were investigated using cDNA microarrays. We identified 1,146 transcripts that showed a significantchange in expression in growing versus fully expanded leaves. Transcripts for ribosomal proteins, cell cycle, and cell wallloosening, necessary for cytoplasmic growth and cell proliferation, were highly expressed in growing leaves. We furtheridentified 139 transcripts with a significant [CO2] by development interaction. Clustering of these transcripts showed thattranscripts involved in cell growth and cell proliferation were more highly expressed in growing leaves that developed atelevated [CO2] compared to growing leaves that developed at ambient [CO2]. The 327 [CO2]-responsive genes largely suggestthat elevated [CO2] stimulates the respiratory breakdown of carbohydrates, which provides increased energy and biochemicalprecursors for leaf expansion and growth at elevated [CO2]. While increased photosynthesis and carbohydrate production atelevated [CO2] are well documented, this research demonstrates that at the transcript and metabolite level, respiratorybreakdown of starch is also increased at elevated [CO2].
By 2050, soybean (Glycine max) will grow in anatmosphere with a 50% higher carbon dioxide con-centration ([CO2]) (Prentice et al., 2001). As the world’smost widely grown seed legume, the physiologicalresponses of soybean to elevated CO2 have been wellcharacterized. Elevated [CO2] increases carbon (C) up-take, foliar carbohydrate content, plant growth, andyield, while decreasing stomatal conductance (for re-view, see Ainsworth et al., 2002). A Free Air CO2Enrichment (FACE) experiment was established in
one of the world’s most productive soybean-growingareas, Central Illinois, in 2001. This facility allowsinvestigation of the response of field-grown soybean toan atmosphere predicted for 2050 without alteration ofthe microclimate (Long et al., 2004). Across the grow-ing season, daily integrals of leaf photosynthetic CO2uptake increased by approximately 25%, even as mid-day stomatal conductance decreased by approxi-mately 20% (Rogers et al., 2004; Bernacchi et al., 2006).Improvements in C assimilation and water-use effi-ciency spurred increases in maximum leaf area index(LAI) and aboveground biomass in elevated [CO2](Morgan et al., 2005; Dermody et al., 2006). The com-bination of increased photosynthesis and increasedLAI provided the inputs for significant increases insoybean seed yield (Ort et al., 2006).
Increased leaf growth, leading to larger individualleaf size, is one component of increased LAI measuredat elevated [CO2] in field experiments (Taylor et al.,2003; Tricker et al., 2004; Dermody et al., 2006). At themolecular level, the basis for changes in LAI at ele-vated [CO2] is largely unknown. Both cell productionrates and cell expansion have been shown to besensitive to elevated [CO2] (Taylor et al., 1994, 2003).Transcript analysis of growing poplar (Populus spp.)leaves exposed to elevated [CO2] showed that genesinvolved in cell wall loosening and synthesis were
1 This work was supported by the Illinois Council for Food andAgricultural Research, by the Archer Daniels Midland Company,and by the U.S. Department of Agriculture/Agricultural ResearchService. E.A.A. was supported by an Alexander von Humboldtpostdoctoral research fellowship. A.R. was supported by the U.S.Department of Energy Office of Science contract no. DE–AC02–98CH10886 to Brookhaven National Laboratory.
* Corresponding author; e-mail [email protected]; fax 217–244–4419.
The author responsible for distribution of materials integral to thefindings presented in this article in accordance with the policydescribed in the Instructions for Authors (www.plantphysiol.org) is:Elizabeth A. Ainsworth ([email protected]).
[W] The online version of this article contains Web-only data.[OA] Open Access articles can be viewed online without a sub-
scription.www.plantphysiol.org/cgi/doi/10.1104/pp.106.086256
Plant Physiology, September 2006, Vol. 142, pp. 135–147, www.plantphysiol.org � 2006 American Society of Plant Biologists 135 www.plantphysiol.org on August 23, 2016 - Published by www.plantphysiol.orgDownloaded from
Copyright © 2006 American Society of Plant Biologists. All rights reserved.
up-regulated (Taylor et al., 2005; Druart et al., 2006).Therefore, at least in poplar, elevated [CO2] appears tostimulate or prolong expansion in leaves (Ferris et al.,2001; Taylor et al., 2003; Druart et al., 2006).
Leaf growth is a spatially and temporally dynamicprocess (for review, see Schurr et al., 2006). To under-stand the mechanisms controlling leaf growth in di-cots, experiments must account for the spatial and dielvariations in growth (Trainotti et al., 2004; Matsubaraet al., 2005). Growing leaves do not expand at all timesthroughout the diel cycle, nor do they necessarilyexpand homogeneously. Tobacco (Nicotiana tabacum)leaves show a base-to-tip gradient in developmentalstage of the tissue, and differential expression of genesin apical and basal tissues (Trainotti et al., 2004). Whilethe functional maturation of dicot leaves has beendescribed to progress with a base-to-tip gradient(Avery, 1933; Turgeon, 1989), recent experiments usingdigital image sequence processing revealed that somedicot species lack a base-to-tip gradient in relativeexpansion rates (Ainsworth et al., 2005; Matsubaraet al., 2005). Prolonged cytoplasmic growth as opposedto vacuolated growth dominated leaf expansion inPopulus deltoides, a species that lacks a base-to-tipgradient in leaf growth (Matsubara et al., 2005). Soy-bean also lacks a pronounced base-to-tip gradient inleaf growth rates (Ainsworth et al., 2005). Yet, soybeanhas a clear diel pattern of leaf expansion, with maxi-mum rates occurring at night (Bunce, 1977; Ainsworthet al., 2005). How elevated [CO2] alters the dynamics ofleaf expansion in soybean has not been examined todate. However, there is evidence in poplar species thataltered carbohydrate status may change the fine-scaletemporal and spatial patterns of growth in response to
elevated [CO2] (Walter et al., 2005), and experiments withtransgenic plants clearly show a link between leaf C me-tabolism and leaf development (Raines and Paul, 2006).
The first objective of this research was to investigatemolecular changes in growing and fully expandedsoybean leaves developed at elevated [CO2] underfully open-air conditions. Research has shown that theresponse of soybean to elevated [CO2] in the field isless than predicted from chamber studies (Long et al.,2006). One approach for maximizing future produc-tion of soybean is to increase LAI and, therefore, thepotential for C uptake. Thus, the other objectives of ourstudy were to identify transcripts that control leafgrowth and elongation, and to investigate how ele-vated [CO2] alters the expression of those transcripts.This research provides an overview of the soybeantranscriptome response to elevated [CO2] in both fullyexpanded and growing leaves.
RESULTS AND DISCUSSION
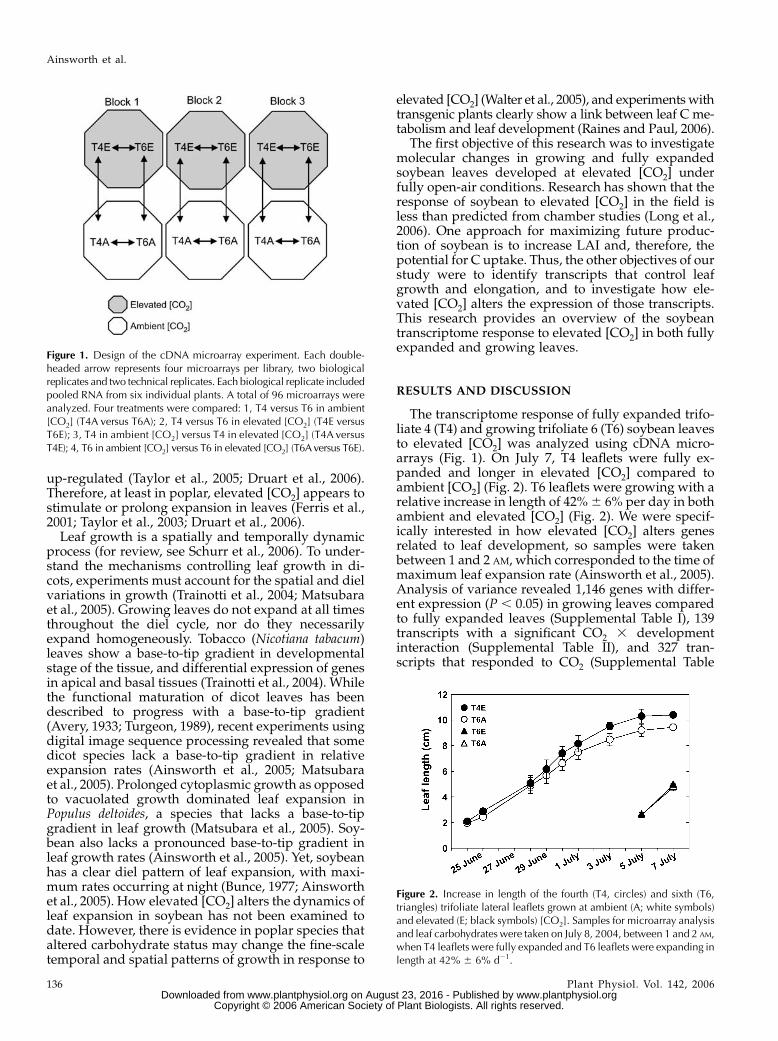
The transcriptome response of fully expanded trifo-liate 4 (T4) and growing trifoliate 6 (T6) soybean leavesto elevated [CO2] was analyzed using cDNA micro-arrays (Fig. 1). On July 7, T4 leaflets were fully ex-panded and longer in elevated [CO2] compared toambient [CO2] (Fig. 2). T6 leaflets were growing with arelative increase in length of 42% 6 6% per day in bothambient and elevated [CO2] (Fig. 2). We were specif-ically interested in how elevated [CO2] alters genesrelated to leaf development, so samples were takenbetween 1 and 2 AM, which corresponded to the time ofmaximum leaf expansion rate (Ainsworth et al., 2005).Analysis of variance revealed 1,146 genes with differ-ent expression (P , 0.05) in growing leaves comparedto fully expanded leaves (Supplemental Table I), 139transcripts with a significant CO2 3 developmentinteraction (Supplemental Table II), and 327 tran-scripts that responded to CO2 (Supplemental Table
Figure 1. Design of the cDNA microarray experiment. Each double-headed arrow represents four microarrays per library, two biologicalreplicates and two technical replicates. Each biological replicate includedpooled RNA from six individual plants. A total of 96 microarrays wereanalyzed. Four treatments were compared: 1, T4 versus T6 in ambient[CO2] (T4A versus T6A); 2, T4 versus T6 in elevated [CO2] (T4E versusT6E); 3, T4 in ambient [CO2] versus T4 in elevated [CO2] (T4A versusT4E); 4, T6 in ambient [CO2] versus T6 in elevated [CO2] (T6Aversus T6E).
Figure 2. Increase in length of the fourth (T4, circles) and sixth (T6,triangles) trifoliate lateral leaflets grown at ambient (A; white symbols)and elevated (E; black symbols) [CO2]. Samples for microarray analysisand leaf carbohydrates were taken on July 8, 2004, between 1 and 2 AM,when T4 leaflets were fully expanded and T6 leaflets were expanding inlength at 42% 6 6% d21.
Ainsworth et al.
136 Plant Physiol. Vol. 142, 2006 www.plantphysiol.org on August 23, 2016 - Published by www.plantphysiol.orgDownloaded from
Copyright © 2006 American Society of Plant Biologists. All rights reserved.
III). The changes in transcript abundance were upto 3.5-fold in developmentally regulated transcripts(Table I) and up to 2-fold in transcripts regulated by[CO2] (Table II). This result is similar to results fromtwo other FACE experiments where only small changesin transcript expression were detected at elevated [CO2](Gupta et al., 2005; Taylor et al., 2005). This likely re-flects the chronic nature of FACE treatment. In theFACE experiment, we analyzed transcript profiles ofplants acclimated to an environmental change (a higher[CO2]) rather than observing the response of geneexpression to an acute change, e.g. an herbivore attack.
Genes Associated with Leaf Development
Expression of 1,146 genes was significantly differentin growing versus fully expanded leaves, irrespectiveof growth [CO2] (for a complete list of transcripts,
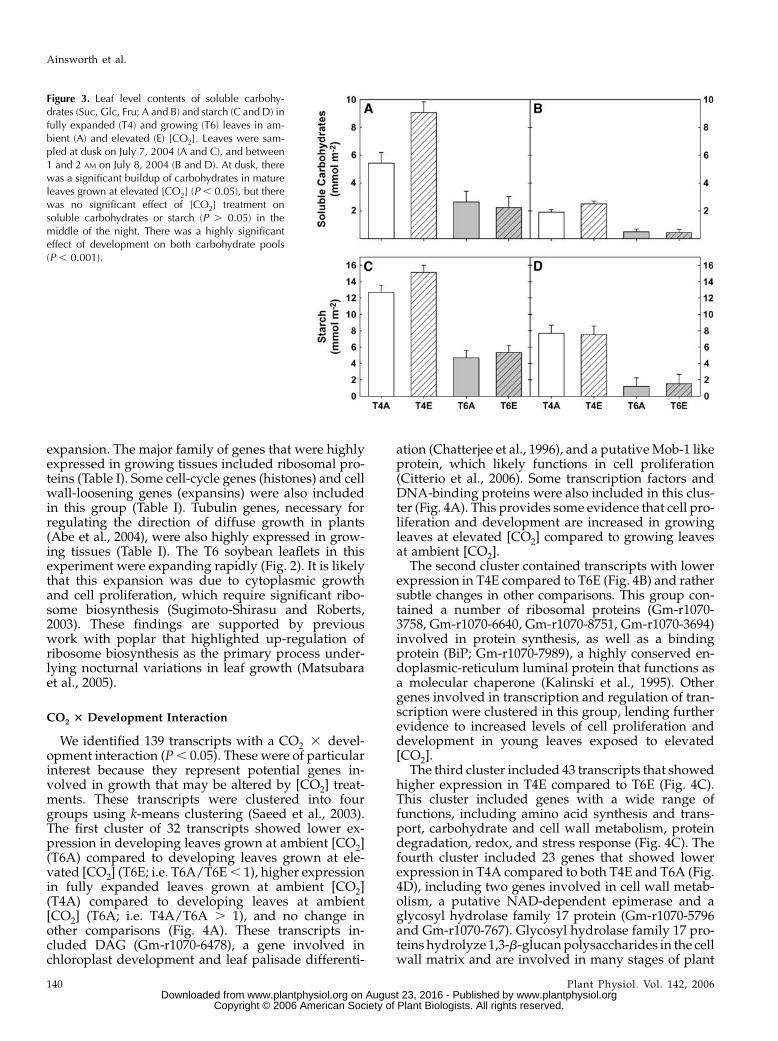
see Supplemental Table I). A total of 178 transcripts,encoding genes for a wide variety of functions,showed 1.5 times lower gene expression in growingleaves compared to fully expanded leaves. This groupincluded genes involved in secondary metabolism,transport, stress and metal handling, and major andminor carbohydrate metabolism. Notably, starch phos-phorylase (Gm-r1088-8633), a glucan-metabolizing en-zyme (Smith et al., 2005), was expressed at lower levelsin growing leaves compared to fully expanded leaves(T6/T4 5 0.595). This correlated with measuredamounts of leaf carbohydrates (Fig. 3), where fullyexpanded, mature leaves had between 4 to 5 times theamount of starch as developing leaves (Fig. 3, C and D)and, therefore, more substrate for degradation.
A total of 132 transcripts showed at least 1.5 timeshigher expression in growing leaves and, therefore,represent our best estimates of control points of leaf
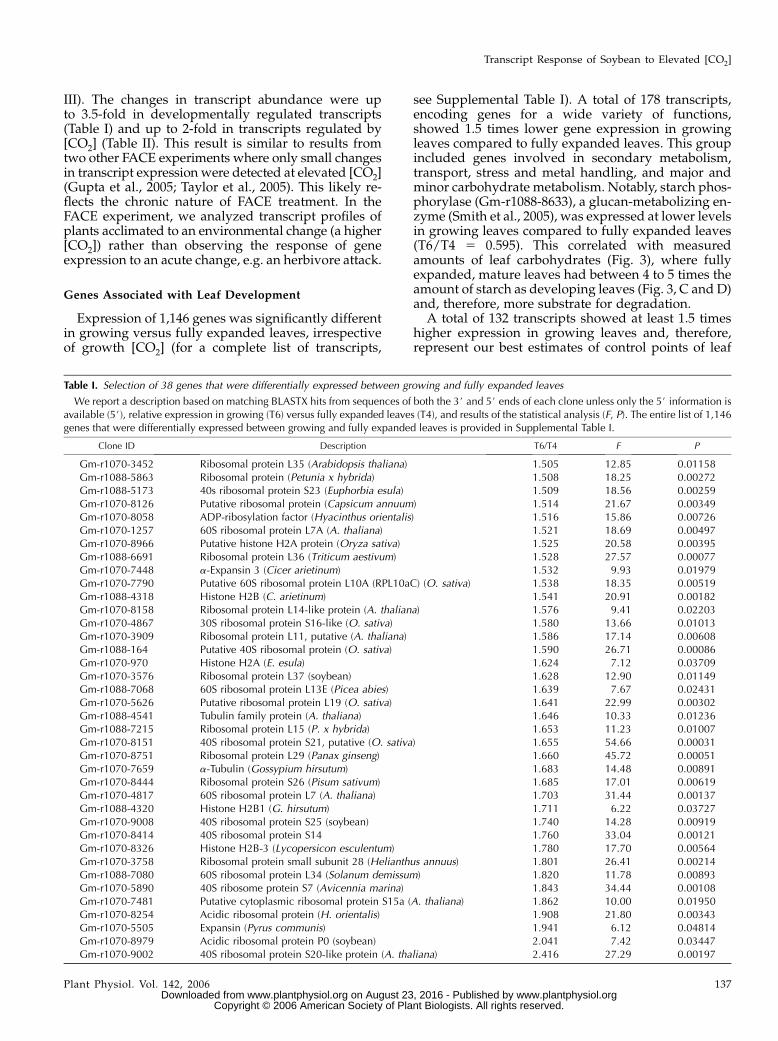
Table I. Selection of 38 genes that were differentially expressed between growing and fully expanded leaves
We report a description based on matching BLASTX hits from sequences of both the 3# and 5# ends of each clone unless only the 5# information isavailable (5#), relative expression in growing (T6) versus fully expanded leaves (T4), and results of the statistical analysis (F, P). The entire list of 1,146genes that were differentially expressed between growing and fully expanded leaves is provided in Supplemental Table I.
Clone ID Description T6/T4 F P
Gm-r1070-3452 Ribosomal protein L35 (Arabidopsis thaliana) 1.505 12.85 0.01158Gm-r1088-5863 Ribosomal protein (Petunia x hybrida) 1.508 18.25 0.00272Gm-r1088-5173 40s ribosomal protein S23 (Euphorbia esula) 1.509 18.56 0.00259Gm-r1070-8126 Putative ribosomal protein (Capsicum annuum) 1.514 21.67 0.00349Gm-r1070-8058 ADP-ribosylation factor (Hyacinthus orientalis) 1.516 15.86 0.00726Gm-r1070-1257 60S ribosomal protein L7A (A. thaliana) 1.521 18.69 0.00497Gm-r1070-8966 Putative histone H2A protein (Oryza sativa) 1.525 20.58 0.00395Gm-r1088-6691 Ribosomal protein L36 (Triticum aestivum) 1.528 27.57 0.00077Gm-r1070-7448 a-Expansin 3 (Cicer arietinum) 1.532 9.93 0.01979Gm-r1070-7790 Putative 60S ribosomal protein L10A (RPL10aC) (O. sativa) 1.538 18.35 0.00519Gm-r1088-4318 Histone H2B (C. arietinum) 1.541 20.91 0.00182Gm-r1070-8158 Ribosomal protein L14-like protein (A. thaliana) 1.576 9.41 0.02203Gm-r1070-4867 30S ribosomal protein S16-like (O. sativa) 1.580 13.66 0.01013Gm-r1070-3909 Ribosomal protein L11, putative (A. thaliana) 1.586 17.14 0.00608Gm-r1088-164 Putative 40S ribosomal protein (O. sativa) 1.590 26.71 0.00086Gm-r1070-970 Histone H2A (E. esula) 1.624 7.12 0.03709Gm-r1070-3576 Ribosomal protein L37 (soybean) 1.628 12.90 0.01149Gm-r1088-7068 60S ribosomal protein L13E (Picea abies) 1.639 7.67 0.02431Gm-r1070-5626 Putative ribosomal protein L19 (O. sativa) 1.641 22.99 0.00302Gm-r1088-4541 Tubulin family protein (A. thaliana) 1.646 10.33 0.01236Gm-r1088-7215 Ribosomal protein L15 (P. x hybrida) 1.653 11.23 0.01007Gm-r1070-8151 40S ribosomal protein S21, putative (O. sativa) 1.655 54.66 0.00031Gm-r1070-8751 Ribosomal protein L29 (Panax ginseng) 1.660 45.72 0.00051Gm-r1070-7659 a-Tubulin (Gossypium hirsutum) 1.683 14.48 0.00891Gm-r1070-8444 Ribosomal protein S26 (Pisum sativum) 1.685 17.01 0.00619Gm-r1070-4817 60S ribosomal protein L7 (A. thaliana) 1.703 31.44 0.00137Gm-r1088-4320 Histone H2B1 (G. hirsutum) 1.711 6.22 0.03727Gm-r1070-9008 40S ribosomal protein S25 (soybean) 1.740 14.28 0.00919Gm-r1070-8414 40S ribosomal protein S14 1.760 33.04 0.00121Gm-r1070-8326 Histone H2B-3 (Lycopersicon esculentum) 1.780 17.70 0.00564Gm-r1070-3758 Ribosomal protein small subunit 28 (Helianthus annuus) 1.801 26.41 0.00214Gm-r1088-7080 60S ribosomal protein L34 (Solanum demissum) 1.820 11.78 0.00893Gm-r1070-5890 40S ribosome protein S7 (Avicennia marina) 1.843 34.44 0.00108Gm-r1070-7481 Putative cytoplasmic ribosomal protein S15a (A. thaliana) 1.862 10.00 0.01950Gm-r1070-8254 Acidic ribosomal protein (H. orientalis) 1.908 21.80 0.00343Gm-r1070-5505 Expansin (Pyrus communis) 1.941 6.12 0.04814Gm-r1070-8979 Acidic ribosomal protein P0 (soybean) 2.041 7.42 0.03447Gm-r1070-9002 40S ribosomal protein S20-like protein (A. thaliana) 2.416 27.29 0.00197
Transcript Response of Soybean to Elevated [CO2]
Plant Physiol. Vol. 142, 2006 137 www.plantphysiol.org on August 23, 2016 - Published by www.plantphysiol.orgDownloaded from
Copyright © 2006 American Society of Plant Biologists. All rights reserved.
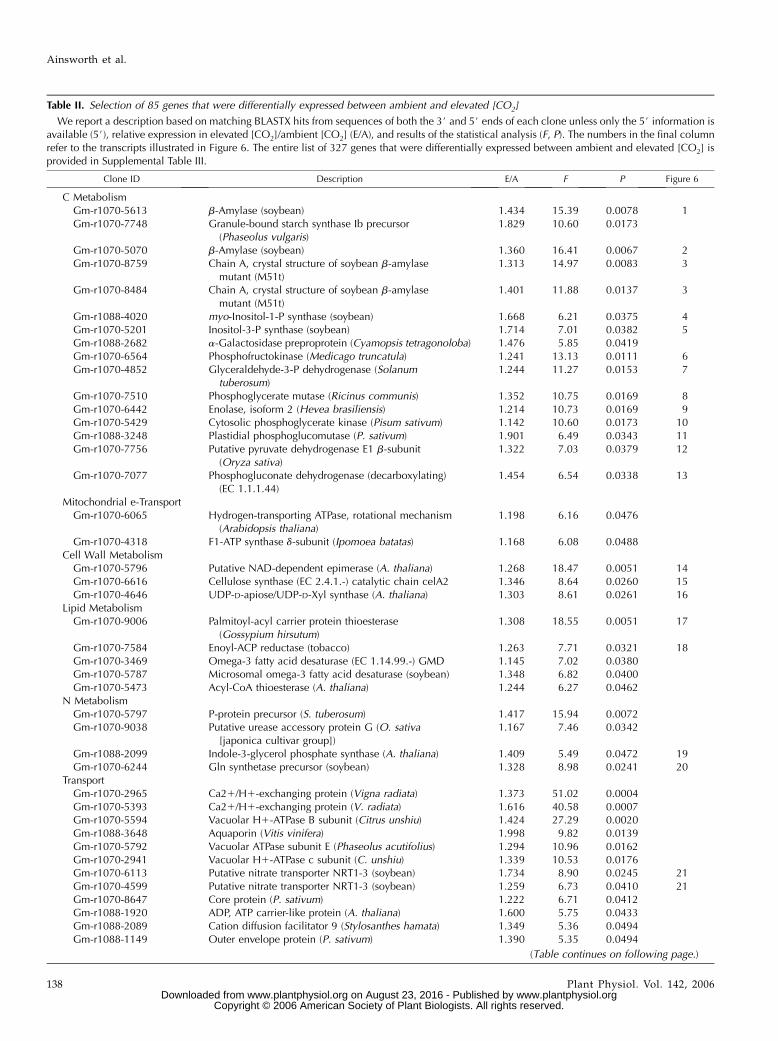
Table II. Selection of 85 genes that were differentially expressed between ambient and elevated [CO2]
We report a description based on matching BLASTX hits from sequences of both the 3# and 5# ends of each clone unless only the 5# information isavailable (5#), relative expression in elevated [CO2]/ambient [CO2] (E/A), and results of the statistical analysis (F, P). The numbers in the final columnrefer to the transcripts illustrated in Figure 6. The entire list of 327 genes that were differentially expressed between ambient and elevated [CO2] isprovided in Supplemental Table III.
Clone ID Description E/A F P Figure 6
C MetabolismGm-r1070-5613 b-Amylase (soybean) 1.434 15.39 0.0078 1Gm-r1070-7748 Granule-bound starch synthase Ib precursor
(Phaseolus vulgaris)1.829 10.60 0.0173
Gm-r1070-5070 b-Amylase (soybean) 1.360 16.41 0.0067 2Gm-r1070-8759 Chain A, crystal structure of soybean b-amylase
mutant (M51t)1.313 14.97 0.0083 3
Gm-r1070-8484 Chain A, crystal structure of soybean b-amylasemutant (M51t)
1.401 11.88 0.0137 3
Gm-r1088-4020 myo-Inositol-1-P synthase (soybean) 1.668 6.21 0.0375 4Gm-r1070-5201 Inositol-3-P synthase (soybean) 1.714 7.01 0.0382 5Gm-r1088-2682 a-Galactosidase preproprotein (Cyamopsis tetragonoloba) 1.476 5.85 0.0419Gm-r1070-6564 Phosphofructokinase (Medicago truncatula) 1.241 13.13 0.0111 6Gm-r1070-4852 Glyceraldehyde-3-P dehydrogenase (Solanum
tuberosum)1.244 11.27 0.0153 7
Gm-r1070-7510 Phosphoglycerate mutase (Ricinus communis) 1.352 10.75 0.0169 8Gm-r1070-6442 Enolase, isoform 2 (Hevea brasiliensis) 1.214 10.73 0.0169 9Gm-r1070-5429 Cytosolic phosphoglycerate kinase (Pisum sativum) 1.142 10.60 0.0173 10Gm-r1088-3248 Plastidial phosphoglucomutase (P. sativum) 1.901 6.49 0.0343 11Gm-r1070-7756 Putative pyruvate dehydrogenase E1 b-subunit
(Oryza sativa)1.322 7.03 0.0379 12
Gm-r1070-7077 Phosphogluconate dehydrogenase (decarboxylating)(EC 1.1.1.44)
1.454 6.54 0.0338 13
Mitochondrial e-TransportGm-r1070-6065 Hydrogen-transporting ATPase, rotational mechanism
(Arabidopsis thaliana)1.198 6.16 0.0476
Gm-r1070-4318 F1-ATP synthase d-subunit (Ipomoea batatas) 1.168 6.08 0.0488Cell Wall MetabolismGm-r1070-5796 Putative NAD-dependent epimerase (A. thaliana) 1.268 18.47 0.0051 14Gm-r1070-6616 Cellulose synthase (EC 2.4.1.-) catalytic chain celA2 1.346 8.64 0.0260 15Gm-r1070-4646 UDP-D-apiose/UDP-D-Xyl synthase (A. thaliana) 1.303 8.61 0.0261 16
Lipid MetabolismGm-r1070-9006 Palmitoyl-acyl carrier protein thioesterase
(Gossypium hirsutum)1.308 18.55 0.0051 17
Gm-r1070-7584 Enoyl-ACP reductase (tobacco) 1.263 7.71 0.0321 18Gm-r1070-3469 Omega-3 fatty acid desaturase (EC 1.14.99.-) GMD 1.145 7.02 0.0380Gm-r1070-5787 Microsomal omega-3 fatty acid desaturase (soybean) 1.348 6.82 0.0400Gm-r1070-5473 Acyl-CoA thioesterase (A. thaliana) 1.244 6.27 0.0462
N MetabolismGm-r1070-5797 P-protein precursor (S. tuberosum) 1.417 15.94 0.0072Gm-r1070-9038 Putative urease accessory protein G (O. sativa
[japonica cultivar group])1.167 7.46 0.0342
Gm-r1088-2099 Indole-3-glycerol phosphate synthase (A. thaliana) 1.409 5.49 0.0472 19Gm-r1070-6244 Gln synthetase precursor (soybean) 1.328 8.98 0.0241 20
TransportGm-r1070-2965 Ca21/H1-exchanging protein (Vigna radiata) 1.373 51.02 0.0004Gm-r1070-5393 Ca21/H1-exchanging protein (V. radiata) 1.616 40.58 0.0007Gm-r1070-5594 Vacuolar H1-ATPase B subunit (Citrus unshiu) 1.424 27.29 0.0020Gm-r1088-3648 Aquaporin (Vitis vinifera) 1.998 9.82 0.0139Gm-r1070-5792 Vacuolar ATPase subunit E (Phaseolus acutifolius) 1.294 10.96 0.0162Gm-r1070-2941 Vacuolar H1-ATPase c subunit (C. unshiu) 1.339 10.53 0.0176Gm-r1070-6113 Putative nitrate transporter NRT1-3 (soybean) 1.734 8.90 0.0245 21Gm-r1070-4599 Putative nitrate transporter NRT1-3 (soybean) 1.259 6.73 0.0410 21Gm-r1070-8647 Core protein (P. sativum) 1.222 6.71 0.0412Gm-r1088-1920 ADP, ATP carrier-like protein (A. thaliana) 1.600 5.75 0.0433Gm-r1088-2089 Cation diffusion facilitator 9 (Stylosanthes hamata) 1.349 5.36 0.0494Gm-r1088-1149 Outer envelope protein (P. sativum) 1.390 5.35 0.0494
(Table continues on following page.)
Ainsworth et al.
138 Plant Physiol. Vol. 142, 2006 www.plantphysiol.org on August 23, 2016 - Published by www.plantphysiol.orgDownloaded from
Copyright © 2006 American Society of Plant Biologists. All rights reserved.
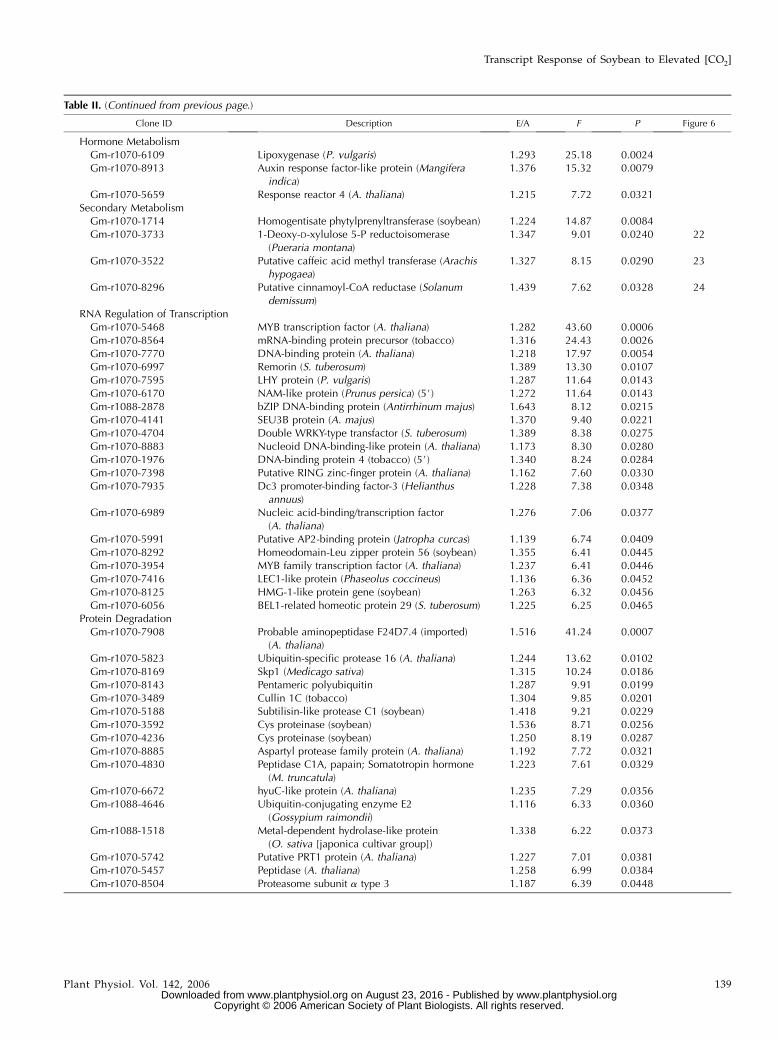
Table II. (Continued from previous page.)
Clone ID Description E/A F P Figure 6
Hormone MetabolismGm-r1070-6109 Lipoxygenase (P. vulgaris) 1.293 25.18 0.0024Gm-r1070-8913 Auxin response factor-like protein (Mangifera
indica)1.376 15.32 0.0079
Gm-r1070-5659 Response reactor 4 (A. thaliana) 1.215 7.72 0.0321Secondary Metabolism
Gm-r1070-1714 Homogentisate phytylprenyltransferase (soybean) 1.224 14.87 0.0084Gm-r1070-3733 1-Deoxy-D-xylulose 5-P reductoisomerase
(Pueraria montana)1.347 9.01 0.0240 22
Gm-r1070-3522 Putative caffeic acid methyl transferase (Arachishypogaea)
1.327 8.15 0.0290 23
Gm-r1070-8296 Putative cinnamoyl-CoA reductase (Solanumdemissum)
1.439 7.62 0.0328 24
RNA Regulation of TranscriptionGm-r1070-5468 MYB transcription factor (A. thaliana) 1.282 43.60 0.0006Gm-r1070-8564 mRNA-binding protein precursor (tobacco) 1.316 24.43 0.0026Gm-r1070-7770 DNA-binding protein (A. thaliana) 1.218 17.97 0.0054Gm-r1070-6997 Remorin (S. tuberosum) 1.389 13.30 0.0107Gm-r1070-7595 LHY protein (P. vulgaris) 1.287 11.64 0.0143Gm-r1070-6170 NAM-like protein (Prunus persica) (5#) 1.272 11.64 0.0143Gm-r1088-2878 bZIP DNA-binding protein (Antirrhinum majus) 1.643 8.12 0.0215Gm-r1070-4141 SEU3B protein (A. majus) 1.370 9.40 0.0221Gm-r1070-4704 Double WRKY-type transfactor (S. tuberosum) 1.389 8.38 0.0275Gm-r1070-8883 Nucleoid DNA-binding-like protein (A. thaliana) 1.173 8.30 0.0280Gm-r1070-1976 DNA-binding protein 4 (tobacco) (5#) 1.340 8.24 0.0284Gm-r1070-7398 Putative RING zinc-finger protein (A. thaliana) 1.162 7.60 0.0330Gm-r1070-7935 Dc3 promoter-binding factor-3 (Helianthus
annuus)1.228 7.38 0.0348
Gm-r1070-6989 Nucleic acid-binding/transcription factor(A. thaliana)
1.276 7.06 0.0377
Gm-r1070-5991 Putative AP2-binding protein (Jatropha curcas) 1.139 6.74 0.0409Gm-r1070-8292 Homeodomain-Leu zipper protein 56 (soybean) 1.355 6.41 0.0445Gm-r1070-3954 MYB family transcription factor (A. thaliana) 1.237 6.41 0.0446Gm-r1070-7416 LEC1-like protein (Phaseolus coccineus) 1.136 6.36 0.0452Gm-r1070-8125 HMG-1-like protein gene (soybean) 1.263 6.32 0.0456Gm-r1070-6056 BEL1-related homeotic protein 29 (S. tuberosum) 1.225 6.25 0.0465
Protein DegradationGm-r1070-7908 Probable aminopeptidase F24D7.4 (imported)
(A. thaliana)1.516 41.24 0.0007
Gm-r1070-5823 Ubiquitin-specific protease 16 (A. thaliana) 1.244 13.62 0.0102Gm-r1070-8169 Skp1 (Medicago sativa) 1.315 10.24 0.0186Gm-r1070-8143 Pentameric polyubiquitin 1.287 9.91 0.0199Gm-r1070-3489 Cullin 1C (tobacco) 1.304 9.85 0.0201Gm-r1070-5188 Subtilisin-like protease C1 (soybean) 1.418 9.21 0.0229Gm-r1070-3592 Cys proteinase (soybean) 1.536 8.71 0.0256Gm-r1070-4236 Cys proteinase (soybean) 1.250 8.19 0.0287Gm-r1070-8885 Aspartyl protease family protein (A. thaliana) 1.192 7.72 0.0321Gm-r1070-4830 Peptidase C1A, papain; Somatotropin hormone
(M. truncatula)1.223 7.61 0.0329
Gm-r1070-6672 hyuC-like protein (A. thaliana) 1.235 7.29 0.0356Gm-r1088-4646 Ubiquitin-conjugating enzyme E2
(Gossypium raimondii)1.116 6.33 0.0360
Gm-r1088-1518 Metal-dependent hydrolase-like protein(O. sativa [japonica cultivar group])
1.338 6.22 0.0373
Gm-r1070-5742 Putative PRT1 protein (A. thaliana) 1.227 7.01 0.0381Gm-r1070-5457 Peptidase (A. thaliana) 1.258 6.99 0.0384Gm-r1070-8504 Proteasome subunit a type 3 1.187 6.39 0.0448
Transcript Response of Soybean to Elevated [CO2]
Plant Physiol. Vol. 142, 2006 139 www.plantphysiol.org on August 23, 2016 - Published by www.plantphysiol.orgDownloaded from
Copyright © 2006 American Society of Plant Biologists. All rights reserved.
expansion. The major family of genes that were highlyexpressed in growing tissues included ribosomal pro-teins (Table I). Some cell-cycle genes (histones) and cellwall-loosening genes (expansins) were also includedin this group (Table I). Tubulin genes, necessary forregulating the direction of diffuse growth in plants(Abe et al., 2004), were also highly expressed in grow-ing tissues (Table I). The T6 soybean leaflets in thisexperiment were expanding rapidly (Fig. 2). It is likelythat this expansion was due to cytoplasmic growthand cell proliferation, which require significant ribo-some biosynthesis (Sugimoto-Shirasu and Roberts,2003). These findings are supported by previouswork with poplar that highlighted up-regulation ofribosome biosynthesis as the primary process under-lying nocturnal variations in leaf growth (Matsubaraet al., 2005).
CO2 3 Development Interaction
We identified 139 transcripts with a CO2 3 devel-opment interaction (P, 0.05). These were of particularinterest because they represent potential genes in-volved in growth that may be altered by [CO2] treat-ments. These transcripts were clustered into fourgroups using k-means clustering (Saeed et al., 2003).The first cluster of 32 transcripts showed lower ex-pression in developing leaves grown at ambient [CO2](T6A) compared to developing leaves grown at ele-vated [CO2] (T6E; i.e. T6A/T6E , 1), higher expressionin fully expanded leaves grown at ambient [CO2](T4A) compared to developing leaves at ambient[CO2] (T6A; i.e. T4A/T6A . 1), and no change inother comparisons (Fig. 4A). These transcripts in-cluded DAG (Gm-r1070-6478), a gene involved inchloroplast development and leaf palisade differenti-
ation (Chatterjee et al., 1996), and a putative Mob-1 likeprotein, which likely functions in cell proliferation(Citterio et al., 2006). Some transcription factors andDNA-binding proteins were also included in this clus-ter (Fig. 4A). This provides some evidence that cell pro-liferation and development are increased in growingleaves at elevated [CO2] compared to growing leavesat ambient [CO2].
The second cluster contained transcripts with lowerexpression in T4E compared to T6E (Fig. 4B) and rathersubtle changes in other comparisons. This group con-tained a number of ribosomal proteins (Gm-r1070-3758, Gm-r1070-6640, Gm-r1070-8751, Gm-r1070-3694)involved in protein synthesis, as well as a bindingprotein (BiP; Gm-r1070-7989), a highly conserved en-doplasmic-reticulum luminal protein that functions asa molecular chaperone (Kalinski et al., 1995). Othergenes involved in transcription and regulation of tran-scription were clustered in this group, lending furtherevidence to increased levels of cell proliferation anddevelopment in young leaves exposed to elevated[CO2].
The third cluster included 43 transcripts that showedhigher expression in T4E compared to T6E (Fig. 4C).This cluster included genes with a wide range offunctions, including amino acid synthesis and trans-port, carbohydrate and cell wall metabolism, proteindegradation, redox, and stress response (Fig. 4C). Thefourth cluster included 23 genes that showed lowerexpression in T4A compared to both T4E and T6A (Fig.4D), including two genes involved in cell wall metab-olism, a putative NAD-dependent epimerase and aglycosyl hydrolase family 17 protein (Gm-r1070-5796and Gm-r1070-767). Glycosyl hydrolase family 17 pro-teins hydrolyze 1,3-b-glucan polysaccharides in the cellwall matrix and are involved in many stages of plant
Figure 3. Leaf level contents of soluble carbohy-drates (Suc, Glc, Fru; A and B) and starch (C and D) infully expanded (T4) and growing (T6) leaves in am-bient (A) and elevated (E) [CO2]. Leaves were sam-pled at dusk on July 7, 2004 (A and C), and between1 and 2 AM on July 8, 2004 (B and D). At dusk, therewas a significant buildup of carbohydrates in matureleaves grown at elevated [CO2] (P , 0.05), but therewas no significant effect of [CO2] treatment onsoluble carbohydrates or starch (P . 0.05) in themiddle of the night. There was a highly significanteffect of development on both carbohydrate pools(P , 0.001).
Ainsworth et al.
140 Plant Physiol. Vol. 142, 2006 www.plantphysiol.org on August 23, 2016 - Published by www.plantphysiol.orgDownloaded from
Copyright © 2006 American Society of Plant Biologists. All rights reserved.
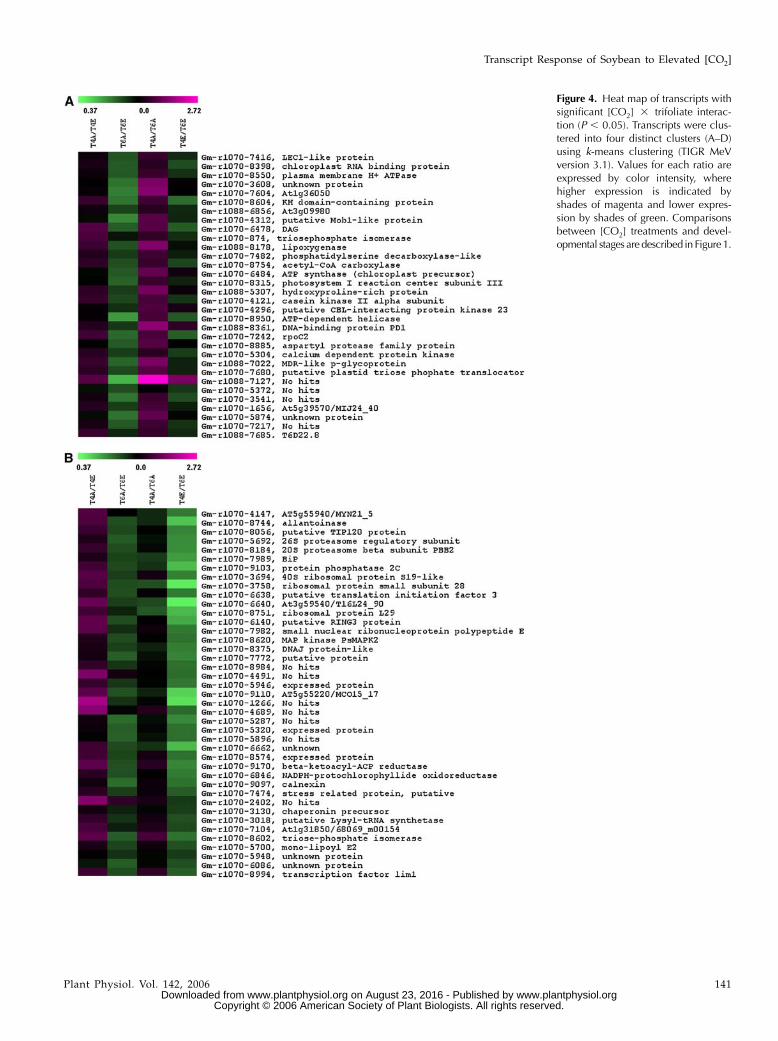
Figure 4. Heat map of transcripts withsignificant [CO2] 3 trifoliate interac-tion (P , 0.05). Transcripts were clus-tered into four distinct clusters (A–D)using k-means clustering (TIGR MeVversion 3.1). Values for each ratio areexpressed by color intensity, wherehigher expression is indicated byshades of magenta and lower expres-sion by shades of green. Comparisonsbetween [CO2] treatments and devel-opmental stages aredescribed in Figure1.
Transcript Response of Soybean to Elevated [CO2]
Plant Physiol. Vol. 142, 2006 141 www.plantphysiol.org on August 23, 2016 - Published by www.plantphysiol.orgDownloaded from
Copyright © 2006 American Society of Plant Biologists. All rights reserved.
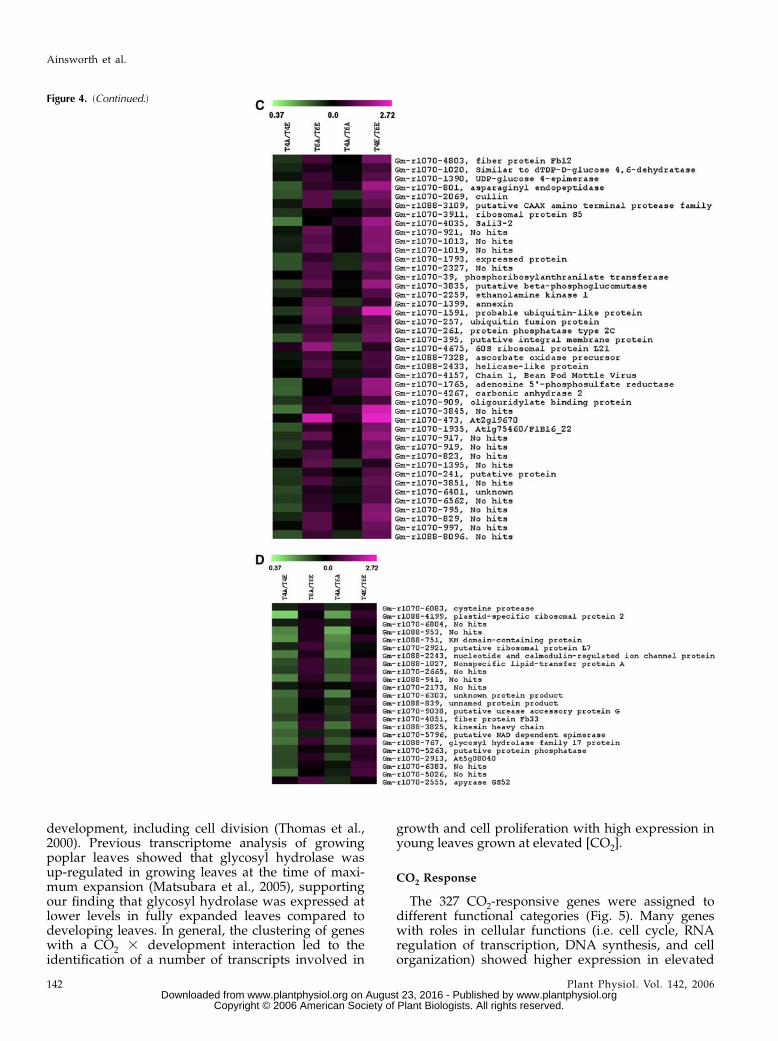
development, including cell division (Thomas et al.,2000). Previous transcriptome analysis of growingpoplar leaves showed that glycosyl hydrolase wasup-regulated in growing leaves at the time of maxi-mum expansion (Matsubara et al., 2005), supportingour finding that glycosyl hydrolase was expressed atlower levels in fully expanded leaves compared todeveloping leaves. In general, the clustering of geneswith a CO2 3 development interaction led to theidentification of a number of transcripts involved in
growth and cell proliferation with high expression inyoung leaves grown at elevated [CO2].
CO2 Response
The 327 CO2-responsive genes were assigned todifferent functional categories (Fig. 5). Many geneswith roles in cellular functions (i.e. cell cycle, RNAregulation of transcription, DNA synthesis, and cellorganization) showed higher expression in elevated
Figure 4. (Continued.)
Ainsworth et al.
142 Plant Physiol. Vol. 142, 2006 www.plantphysiol.org on August 23, 2016 - Published by www.plantphysiol.orgDownloaded from
Copyright © 2006 American Society of Plant Biologists. All rights reserved.
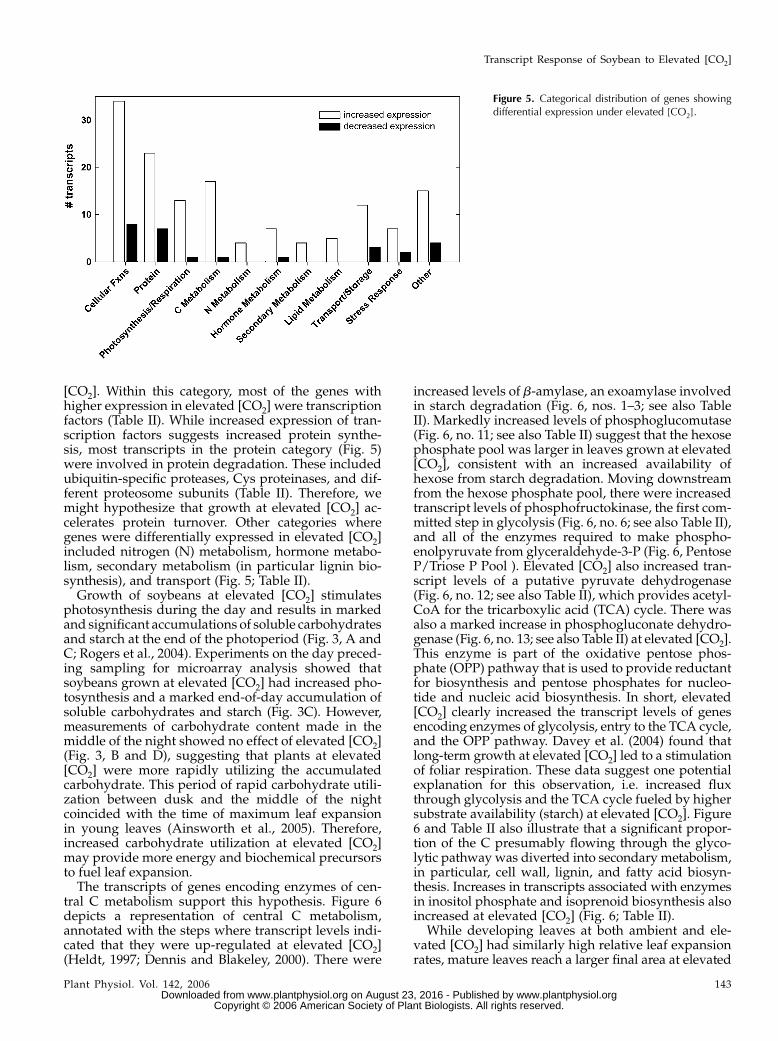
[CO2]. Within this category, most of the genes withhigher expression in elevated [CO2] were transcriptionfactors (Table II). While increased expression of tran-scription factors suggests increased protein synthe-sis, most transcripts in the protein category (Fig. 5)were involved in protein degradation. These includedubiquitin-specific proteases, Cys proteinases, and dif-ferent proteosome subunits (Table II). Therefore, wemight hypothesize that growth at elevated [CO2] ac-celerates protein turnover. Other categories wheregenes were differentially expressed in elevated [CO2]included nitrogen (N) metabolism, hormone metabo-lism, secondary metabolism (in particular lignin bio-synthesis), and transport (Fig. 5; Table II).
Growth of soybeans at elevated [CO2] stimulatesphotosynthesis during the day and results in markedand significant accumulations of soluble carbohydratesand starch at the end of the photoperiod (Fig. 3, A andC; Rogers et al., 2004). Experiments on the day preced-ing sampling for microarray analysis showed thatsoybeans grown at elevated [CO2] had increased pho-tosynthesis and a marked end-of-day accumulation ofsoluble carbohydrates and starch (Fig. 3C). However,measurements of carbohydrate content made in themiddle of the night showed no effect of elevated [CO2](Fig. 3, B and D), suggesting that plants at elevated[CO2] were more rapidly utilizing the accumulatedcarbohydrate. This period of rapid carbohydrate utili-zation between dusk and the middle of the nightcoincided with the time of maximum leaf expansionin young leaves (Ainsworth et al., 2005). Therefore,increased carbohydrate utilization at elevated [CO2]may provide more energy and biochemical precursorsto fuel leaf expansion.
The transcripts of genes encoding enzymes of cen-tral C metabolism support this hypothesis. Figure 6depicts a representation of central C metabolism,annotated with the steps where transcript levels indi-cated that they were up-regulated at elevated [CO2](Heldt, 1997; Dennis and Blakeley, 2000). There were
increased levels of b-amylase, an exoamylase involvedin starch degradation (Fig. 6, nos. 1–3; see also TableII). Markedly increased levels of phosphoglucomutase(Fig. 6, no. 11; see also Table II) suggest that the hexosephosphate pool was larger in leaves grown at elevated[CO2], consistent with an increased availability ofhexose from starch degradation. Moving downstreamfrom the hexose phosphate pool, there were increasedtranscript levels of phosphofructokinase, the first com-mitted step in glycolysis (Fig. 6, no. 6; see also Table II),and all of the enzymes required to make phospho-enolpyruvate from glyceraldehyde-3-P (Fig. 6, PentoseP/Triose P Pool ). Elevated [CO2] also increased tran-script levels of a putative pyruvate dehydrogenase(Fig. 6, no. 12; see also Table II), which provides acetyl-CoA for the tricarboxylic acid (TCA) cycle. There wasalso a marked increase in phosphogluconate dehydro-genase (Fig. 6, no. 13; see also Table II) at elevated [CO2].This enzyme is part of the oxidative pentose phos-phate (OPP) pathway that is used to provide reductantfor biosynthesis and pentose phosphates for nucleo-tide and nucleic acid biosynthesis. In short, elevated[CO2] clearly increased the transcript levels of genesencoding enzymes of glycolysis, entry to the TCA cycle,and the OPP pathway. Davey et al. (2004) found thatlong-term growth at elevated [CO2] led to a stimulationof foliar respiration. These data suggest one potentialexplanation for this observation, i.e. increased fluxthrough glycolysis and the TCA cycle fueled by highersubstrate availability (starch) at elevated [CO2]. Figure6 and Table II also illustrate that a significant propor-tion of the C presumably flowing through the glyco-lytic pathway was diverted into secondary metabolism,in particular, cell wall, lignin, and fatty acid biosyn-thesis. Increases in transcripts associated with enzymesin inositol phosphate and isoprenoid biosynthesis alsoincreased at elevated [CO2] (Fig. 6; Table II).
While developing leaves at both ambient and ele-vated [CO2] had similarly high relative leaf expansionrates, mature leaves reach a larger final area at elevated
Figure 5. Categorical distribution of genes showingdifferential expression under elevated [CO2].
Transcript Response of Soybean to Elevated [CO2]
Plant Physiol. Vol. 142, 2006 143 www.plantphysiol.org on August 23, 2016 - Published by www.plantphysiol.orgDownloaded from
Copyright © 2006 American Society of Plant Biologists. All rights reserved.
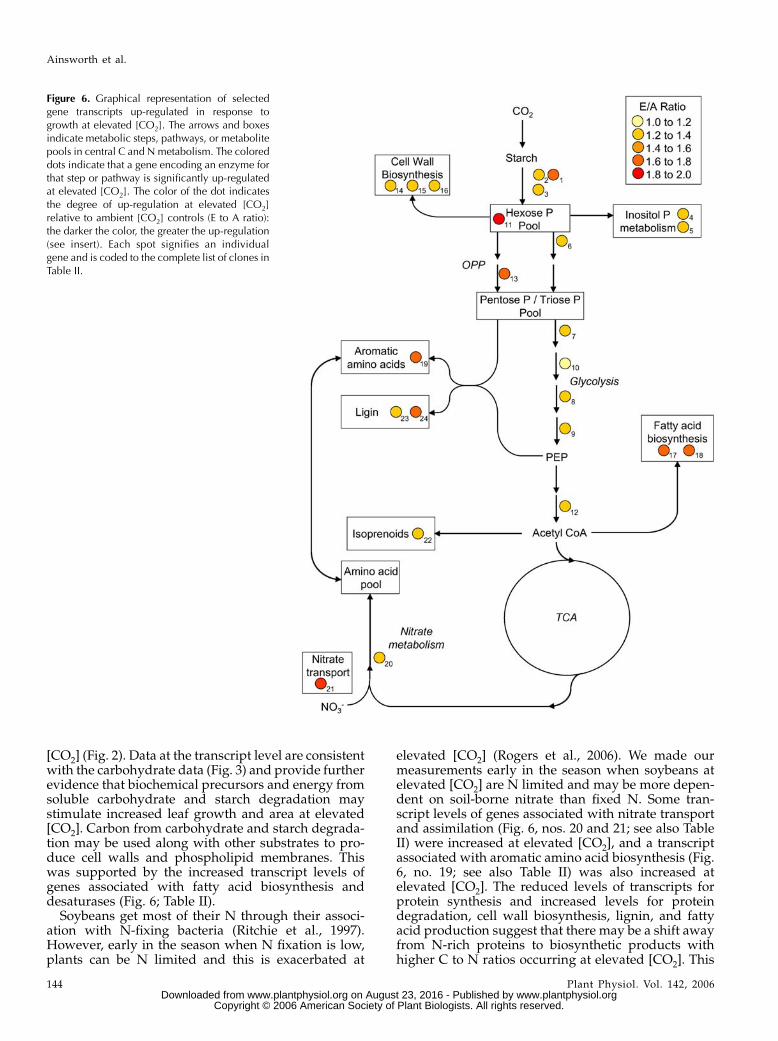
[CO2] (Fig. 2). Data at the transcript level are consistentwith the carbohydrate data (Fig. 3) and provide furtherevidence that biochemical precursors and energy fromsoluble carbohydrate and starch degradation maystimulate increased leaf growth and area at elevated[CO2]. Carbon from carbohydrate and starch degrada-tion may be used along with other substrates to pro-duce cell walls and phospholipid membranes. Thiswas supported by the increased transcript levels ofgenes associated with fatty acid biosynthesis anddesaturases (Fig. 6; Table II).
Soybeans get most of their N through their associ-ation with N-fixing bacteria (Ritchie et al., 1997).However, early in the season when N fixation is low,plants can be N limited and this is exacerbated at
elevated [CO2] (Rogers et al., 2006). We made ourmeasurements early in the season when soybeans atelevated [CO2] are N limited and may be more depen-dent on soil-borne nitrate than fixed N. Some tran-script levels of genes associated with nitrate transportand assimilation (Fig. 6, nos. 20 and 21; see also TableII) were increased at elevated [CO2], and a transcriptassociated with aromatic amino acid biosynthesis (Fig.6, no. 19; see also Table II) was also increased atelevated [CO2]. The reduced levels of transcripts forprotein synthesis and increased levels for proteindegradation, cell wall biosynthesis, lignin, and fattyacid production suggest that there may be a shift awayfrom N-rich proteins to biosynthetic products withhigher C to N ratios occurring at elevated [CO2]. This
Figure 6. Graphical representation of selectedgene transcripts up-regulated in response togrowth at elevated [CO2]. The arrows and boxesindicate metabolic steps, pathways, or metabolitepools in central C and N metabolism. The coloreddots indicate that a gene encoding an enzyme forthat step or pathway is significantly up-regulatedat elevated [CO2]. The color of the dot indicatesthe degree of up-regulation at elevated [CO2]relative to ambient [CO2] controls (E to A ratio):the darker the color, the greater the up-regulation(see insert). Each spot signifies an individualgene and is coded to the complete list of clones inTable II.
Ainsworth et al.
144 Plant Physiol. Vol. 142, 2006 www.plantphysiol.org on August 23, 2016 - Published by www.plantphysiol.orgDownloaded from
Copyright © 2006 American Society of Plant Biologists. All rights reserved.
is supported by the increased levels of the OPP en-zyme phosphogluconate dehydrogenase, indicatingthat, at elevated [CO2], C is being utilized for biosyn-thesis rather than simply increased energy production.
CONCLUSION
In this field study, we investigated the transcriptomeresponse of soybean to elevated [CO2] in growing andfully expanded leaves. We tested the hypothesis thatincreased C assimilation in plants grown at elevated[CO2] altered pools of carbohydrates and transcriptsthat control growth and expansion of young leaves. Itis well established that elevated [CO2] increases pho-tosynthetic C fixation and carbohydrate synthesis (Longet al., 2004); however, this research suggests that at thetranscript level, elevated [CO2] also stimulates therespiratory breakdown of carbohydrates, which likelyprovides increased fuel for leaf expansion and growthat elevated [CO2].
MATERIALS AND METHODS
Experimental Site
Soybeans (Glycine max cv 93B15; Pioneer Hi-Bred) were grown at the
SoyFACE facility, located in Champaign, IL (40�02#N, 88�14#W, 228 m above
sea level). SoyFACE was established on a tile-drained field that has been in
continuous cultivation for more than 100 years. The 32-ha site has organically
rich Flanagan/Drummer series soil. Following standard agronomic practice in
the region, no fertilizer was applied. The crop was planted on May 28, 2004,
and measurements were made on July 8, 2004, when the crop was in the
vegetative growth phase (Ritchie et al., 1997). The experiment consisted of
four blocks, each containing two 20-m-diameter octagonal plots. One plot was
fumigated from sunrise to sunset to an elevated target [CO2] of 550 mmol
mol21, using the FACE design of Miglietta et al. (2001); the other plot provided
a current ambient [CO2] control (375 mmol mol21). In 2004, the actual elevated
[CO2] averaged across the growing season was 550 mmol mol21. One-minute
averages of [CO2] within the plots were within 620% of the 550 mmol mol21
target 93% of the time (T. Mies, personal communication).
Leaf Growth
The length of T4 and T6 lateral leaflets was tracked with a ruler (60.1 cm)
approximately every other day from initiation of T4 until sampling of both
developmental stages on July 7, 2004. Growth of 12 leaflets on six randomly
selected plants per plot was followed. Leaf development in field-grown plants
was similar to leaf development of plants raised in growth chambers, where a
homogeneous distribution of growth along the leaf blade and a distinct
diurnal rhythm of expansion were described for leaflets of a similar devel-
opmental stage (Ainsworth et al., 2005).
Leaf Carbohydrates
Leaf discs from T4 and T6 middle leaflets of three plants within each plot
were sampled for analysis of carbohydrates between 1 and 2 AM on July 8,
2004. Therefore, 12 leaflets per developmental stage and [CO2] treatment were
sampled. Each disc (approximately 1.8 cm2) was removed from a vein-free
area of a middle leaflet, wrapped in foil, and plunged immediately into liquid
N. Samples were lyophilized prior to analysis.
Individual leaf discs were powdered in liquid N. Foliar contents of
carbohydrates were extracted from ground leaf tissue in 80% (v/v), buffered
(2 mM HEPES, pH 7.8) ethanol at 80�C. Four 20-min incubations were needed
to recover the soluble carbohydrates. Glc, Fru, and Suc were determined using
a continuous enzymatic substrate assay (Jones et al., 1977). For starch de-
termination, pellets of the ethanol extraction were solubilized by heating to
95�C in 0.1 M NaOH. The NaOH solution was then acidified to pH 4.9, and
starch content was determined as Glc equivalents (Hendriks et al., 2003). For
the comparison of carbohydrates, a mixed-model ANOVA was performed
with trifoliate and CO2 treatment as fixed effects and block as a random effect
(SAS Institute).
Microarray Analysis
T4 and T6 lateral leaflets from 12 individual soybeans within each plot
were harvested between 1 and 2 AM. Entire leaflets were cut, wrapped in foil,
plunged immediately into liquid N, and then lyophilized (Multi-Dry Lyoph-
ilizer; FTS Systems) and stored at 220�C. Total RNA was extracted from six
pooled freeze-dried leaflets from each plot and developmental stage using a
SDS/phenol chloroform method and lithium chloride precipitation (Wang
and Vodkin, 1994). RNA content was quantified by spectrophotometry, and
the integrity was confirmed using agarose gel electrophoresis (Sambrook et al.,
1989). RNA was further purified using RNeasy columns (Qiagen) according to
the manufacturer’s instructions. Prior to labeling, purified RNA was concen-
trated in a Speed Vac (Savant Instruments). The cDNA synthesis, probe
labeling, hybridization conditions, and slide scanning followed Vodkin et al.
(2004). Microarrays from two reracked libraries, Gm-1070 and Gm-1088, were
probed. The experimental design for the microarray experiment is illustrated
in Figure 1. Three of the four experimental blocks in the FACE experiment
were used. Each double-headed arrow represents four arrays per library, two
biological samples of RNA (from six pooled leaflets), and the dye swaps
(technical replicates). Therefore, a total of 96 separate hybridizations were
made.
Spot intensities were quantified using Imagene 6.1 (Biodiscovery). The
local background was subtracted for each spot, and spots were normalized to
the median intensity of each dye on each slide. The natural log of the
background-corrected median signal was used for all statistical analyses.
Spots flagged by the Imagene image analysis software were removed from
subsequent analyses (Prakash and Petrov, 2004). Reliability of the data was
evaluated with Pearson correlation coefficients and kappa statistics on
pairwise comparisons of arrays. Five slides from library Gm-1070 and three
slides from library Gm-1088 had low-weighted kappa values (,0.50) and
were dropped from the analysis. Gm-1070 contained 9,216 cDNA clones from
various developmental stages of immature cotyledons, flowers, pods, and
seed coats, and Gm-1088 contained 9,216 cDNA clones from cotyledons and
hypocotyls of germinating seedlings and other plant parts subjected to
various pathogens or environmental stress conditions (Vodkin et al., 2004).
Transcripts that had missing data points on more than 20% of the arrays were
also dropped from the analysis. Therefore, 5,314 transcripts from library
Gm-1070 and 5,831 transcripts from library Gm-1088 were included in the
analysis of variance.
Biological and technical replications were averaged for each plot for
statistical analysis. A mixed-model ANOVA was performed, with trifoliate
and CO2 treatment as fixed effects and block as a random effect. The model
was tested for conformation to the assumption of normality of the residuals
using the Shapiro-Wilkes Test. A Bonferroni significance level was used as an
initial criterion for rejecting the null hypothesis of a significant treatment effect
(0.05/5,314 for Gm-1070 and 0.05/5,831 for Gm-1088). No genes were signif-
icant at the Bonferroni level, so we used a second nominal threshold of a ,
0.05 because type I and II errors are inversely related and because Bonferroni
correlation is overly conservative (Kerr and Churchill, 2001; Wayne and
McIntyre, 2002). If no evidence for departure from normality of the residuals
was evident and the P value for the test of differences was #0.05, the gene was
considered significant, following the methods of Li et al. (2004). All analyses
were performed in SAS. Reproducibility of the hybridizations and degree of
variation between technical and biological replicates and experimental blocks
in the field are illustrated in Supplemental Figure 1.
ACKNOWLEDGMENTS
We thank Steve Long and Tim Mies for management and maintenance
of the SoyFACE facility. We thank L. McIntyre for assistance with statistical
analysis of the experiment and insightful comments on an early draft of
the manuscript. We thank R. Knepp, K. Gillespie, A.M. Boone, and S.I.
Jones for technical help with RNA extractions, microarray protocols, and
bioinformatics.
Received July 3, 2006; accepted July 25, 2006; published July 28, 2006.
Transcript Response of Soybean to Elevated [CO2]
Plant Physiol. Vol. 142, 2006 145 www.plantphysiol.org on August 23, 2016 - Published by www.plantphysiol.orgDownloaded from
Copyright © 2006 American Society of Plant Biologists. All rights reserved.
LITERATURE CITED
Abe T, Thitamadee S, Hashimoto T (2004) Microtubule defects and cell
morphogenesis in the lefty1lefty2 tubulin mutant of Arabidopsis thaliana.
Plant Cell Physiol 45: 211–220
Ainsworth EA, Davey PA, Bernacchi CJ, Dermody OC, Heaton EA, Moore
DJ, Morgan PB, Naidu SL, Ra HSY, Zhu XG, et al (2002) A meta-
analysis of elevated [CO2] effects on soybean (Glycine max) physiology,
growth and yield. Glob Change Biol 8: 695–709
Ainsworth EA, Walter A, Schurr U (2005) Glycine max leaflets lack a base-
tip gradient in growth rate. J Plant Res 118: 343–346
Avery GS (1933) Structure and development of the tobacco leaf. Am J Bot
20: 565–592
Bernacchi CJ, Leakey ADB, Heady LE, Morgan PB, Rogers A, Long SP, Ort
DR (2006) Hourly and seasonal variation in photosynthesis and stoma-
tal conductance of soybean grown at future CO2 and ozone concentra-
tions for three years under fully open air conditions. Plant Cell Environ
doi/10.1111/j.1365-3040.2006.01581.x
Bunce JA (1977) Leaf elongation in relation to leaf water potential in
soybean. J Exp Bot 28: 156–161
Chatterjee M, Sparvoli S, Edmunds C, Garosi P, Finlay K, Martin C (1996)
DAG, a gene required for chloroplast differentiation and palisade
development in Antirrhinum majus. EMBO J 15: 4194–4207
Citterio S, Piatti S, Albertini E, Aina R, Varotta S, Barcaccia G (2006)
Alfalfa Mob1-like proteins are involved in cell proliferation and are
localized in the cell division plane during cytokinesis. Exp Cell Res 312:
1050–1064
Davey PA, Hunt S, Hymus GJ, DeLucia EH, Drake BG, Karnosky DF,
Long SP (2004) Respiratory oxygen uptake is not decreased by an
instantaneous elevation of [CO2], but is increased with long-term
growth in the field at elevated CO2. Plant Physiol 134: 520–527
Dennis DT, Blakeley SD (2000) Carbohydrate metabolism. In BB
Buchanan, W Gruissem, RL Jones, eds, Biochemistry and Molecular
Biology of Plants. American Society of Plant Physiologists, Rockville,
MD, pp 631–675
Dermody O, Long SP, Delucia EH (2006) How does elevated CO2 or ozone
affect the leaf-area index of soybean when applied independently? New
Phytol 169: 145–155
Druart N, Rodrıguez-Buey M, Barron-Gafford G, Sjodin A, Bhalerao R,
Hurry V (2006) Molecular targets of elevated [CO2] in leaves and stems
of Populus deltoides: implications for future tree growth and carbon
sequestration. Funct Plant Biol 33: 121–131
Ferris R, Sabatti M, Miglietta F, Mills RF, Taylor G (2001) Leaf area is
stimulated in Populus by free air CO2 enrichment (POPFACE), through
increased cell expansion and production. Plant Cell Environ 24: 305–315
Gupta P, Duplessis S, White H, Karnosky DF, Martin F, Podila GK (2005)
Gene expression patterns of trembling aspen trees following long-term
exposure to interacting elevated CO2 and tropospheric O3. New Phytol
167: 129–142
Heldt HW (1997) Plant Biochemistry and Molecular Biology. Oxford
University Press, New York
Hendriks JHM, Kolbe A, Gibon Y, Stitt M, Geigenberger P (2003) ADP-
glucosepyro-phosphorylase is activated by posttranslational redox-
modification in response to light and to sugars in leaves of Arabidopsis
and other plant species. Plant Physiol 133: 838–849
Kalinski A, Rowley DL, Loer DS, Foley C, Buta G, Herman EM (1995)
Binding-protein expression is similar to temporal, developmental and
stress-induced regulation in terminally differentiated soybean organs.
Planta 195: 611–621
Kerr MK, Churchill GA (2001) Statistical design and the analysis of gene
expression microarray data. Genome Res 77: 123–128
Jones MGK, Outlaw WH, Lowry OH (1977) Enzymic assay of 1027 to 10214
moles of sucrose in plant tissues. Plant Physiol 60: 379–383
Li H, Singh AK, McIntyre LM, Sherman LA (2004) Differential gene
expression in response to hydrogen peroxide and the putative PerR
regulon of Synechocystis sp. strain PCC 6803. J Bacteriol 186: 3331–3345
Long SP, Ainsworth EA, Leakey ADB, Nosberger J, Ort DR (2006) Food
for thought: lower-than-expected crop yield stimulation with rising CO2
concentrations. Science 312: 1918–1921
Long SP, Ainsworth EA, Rogers A, Ort DR (2004) Rising atmospheric
carbon dioxide: plants FACE the future. Annu Rev Plant Biol 55: 591–628
Matsubara S, Hurry V, Druart N, Benedict C, Janzik I, Chavarrıa-Krauser
A, Walter A, Schurr U (2005) Nocturnal changes in leaf growth of
Populus deltoides are controlled by cytoplasmic growth. Planta 223:
1315–1328
Miglietta F, Peressotti A, Vaccari FP, Zaldei A, de Angelis P, Scarascia-
Mugnozza G (2001) Free-air CO2 enrichment (FACE) of a poplar
plantation: the POPFACE fumigation system. New Phytol 150: 465–476
Morgan PB, Bollero GA, Nelson RL, Dohleman FG, Long SP (2005)
Smaller than predicted increase in aboveground net primary production
and yield of field-grown soybean under fully open-air [CO2] elevation.
Glob Change Biol 11: 1856–1865
Ort DR, Ainsworth EA, Aldea M, Allen DJ, Bernacchi CJ, Berenbaum
MR, Bollero GA, Cornic G, Davey PA, Dermody O, et al (2006)
SoyFACE: the effects and interactions of elevated [CO2] and [O3] on
soybean. In J Nosberger, SP Long, RJ Norby, M Stitt, GR Hendrey, H
Blum, eds, Managed Ecosystems and CO2: Case Studies, Processes and
Perspectives. Springer, Berlin, pp 71–85
Prakash PJ, Petrov A (2004) Gene Flagging in ImaGene. Biodiscover Inc.
Technical Bulletin. Biodiscover Inc., El Segundo, CA, pp 1–7
Prentice IC, Farquhar GD, Fasham MJR, Goulden ML, Heimann M,
Jaramillo VJ, Kheshgi HS, LeQuere C, Scholes RJ, Wallace DWR, et al
(2001) The carbon cycle atmospheric carbon dioxide. In JT Houghton, Y
Ding, DJ Griggs, M Noguer, PJ Van der Linder, X Dai, K Maskell, CA
Johnson, eds, Climate Change 2001: The Scientific Basis. Contributions
of Working Group I to the Third Assessment Report of the Intergov-
ernmental Panel on Climate Change. Cambridge University Press, New
York, pp 183–239
Raines CA, Paul MJ (2006) Products of leaf primary carbon metabolism
modulate the developmental programme determining plant morphol-
ogy. J Exp Bot 57: 1857–1862
Ritchie SW, Hanaway JJ, Thompson HE, Benson GO (1997) How a
Soybean Plant Develops. Special Report Number 53. Iowa State Uni-
versity, Ames, IA
Rogers A, Allen DJ, Davey PA, Morgan PB, Ainsworth EA, Bernacchi CJ,
Cornic G, Dermody O, Dohleman FG, Heaton EA, et al (2004) Leaf
photosynthesis and carbohydrate dynamics of soybeans grown
throughout their life-cycle under Free-Air Carbon dioxide Enrichment.
Plant Cell Environ 27: 449–458
Rogers A, Gibon Y, Stitt M, Morgan PB, Bernacchi CJ, Ort DR, Long SP
(2006) Increased carbon availability at elevated carbon dioxide concen-
tration improves N assimilation in a legume. Plant Cell Environ 29:
1651–1658
Saeed AI, Sharov V, White J, Li J, Liang W, Bhagabati N, Braisted J,
Klapa M, Currier TM, Sturn A, et al (2003) TM4: a free, open-source
system for microarray data management analysis. Biotechniques 34:
374–378
Sambrook J, Fritsch EF, Maniatis T (1989) Molecular Cloning: A Labora-
tory Manual, Ed 2. Cold Spring Harbor Laboratory Press, Cold Spring
Harbor, NY
Schurr U, Walter A, Rascher U (2006) Functional dynamics of plant growth
and photosynthesis—from steady-state to dynamics—from homogene-
ity to heterogeneity. Plant Cell Environ 29: 340–352
Smith AM, Zeeman SC, Smith SM (2005) Starch degradation. Annu Rev
Plant Biol 56: 73–98
Sugimoto-Shirasu K, Roberts K (2003) ‘‘Big it up’’: endoreduplication and
cell-size control in plants. Curr Opin Plant Biol 6: 544–553
Taylor G, Ranasinghe S, Bosac C, Gardner SDL, Ferris R (1994) Elevated
CO2 and plant growth: cellular mechanisms and responses of whole
plants. J Exp Bot 45: 1761–1774
Taylor G, Street NR, Tricker PJ, Sjodin A, Graham L, Skogstrom O,
Calfapietra C, Scarascia-Mugnozza G, Jansson S (2005) The transcrip-
tome of Populus in elevated CO2. New Phytol 167: 143–154
Taylor G, Tricker PJ, Zhang FZ, Alston VJ, Miglietta F, Kuzminsky E
(2003) Spatial and temporal effects of free-air CO2 enrichment (POP-
FACE) on leaf growth, cell expansion, and cell production in a closed
canopy of poplar. Plant Physiol 131: 177–185
Thomas BR, Romero GO, Nevins DJ, Rodriguez RL (2000) New perspec-
tives on the endo-beta-glucanases of glycosyl hydrolase Family 17. Int
J Biol Macromol 27: 139–144
Trainotti L, Pavanello A, Casadoro G (2004) Differential expression of
genes in apical and basal tissues of expanding tobacco leaves. Plant Sci
167: 679–686
Tricker PJ, Calfapietra C, Kuzminsky E, Puleggi R, Ferris R, Nathoo M,
Pleasants LJ, Alston V, de Angelis P, Taylor G (2004) Long-term
acclimation of leaf production, development, longevity and quality
Ainsworth et al.
146 Plant Physiol. Vol. 142, 2006 www.plantphysiol.org on August 23, 2016 - Published by www.plantphysiol.orgDownloaded from
Copyright © 2006 American Society of Plant Biologists. All rights reserved.
following 3 yr exposure to free-air CO2 enrichment during canopy
closure in Populus. New Phytol 162: 413–426
Turgeon R (1989) The sink-source transition in leaves. Annu Rev Plant
Physiol Plant Mol Biol 40: 119–138
Vodkin LO, Khanna A, Shealy R, Clough SJ, Gonzalez DO, Philip R,
Zabala G, Thibaud-Nissen F, Sidarous M, Stromvik M, et al (2004)
Microarrays for global expression constructed with a low redundancy
set of 27,500 sequenced cDNAs representing an array of developmental
stages and physiological conditions of the soybean plant. BMC
Genomics 5: 73
Walter A, Christ MM, Barron-Gifford GA, Grieve KA, Murthy R, Rascher
U (2005) The effect of elevated CO2 on diel leaf growth cycle, leaf
carbohydrate content and canopy growth performance of Populus
deltoides. Glob Change Biol 11: 1258–1271
Wang C-S, Vodkin LO (1994) Extraction of RNA from tissues containing
high levels of procyanidins that bind RNA. Plant Mol Biol Rep 12:
132–145
Wayne ML, McIntyre LM (2002) Combining mapping and arraying: an
approach to candidate gene identification. Proc Natl Acad Sci USA 99:
14903–14906
Transcript Response of Soybean to Elevated [CO2]
Plant Physiol. Vol. 142, 2006 147 www.plantphysiol.org on August 23, 2016 - Published by www.plantphysiol.orgDownloaded from
Copyright © 2006 American Society of Plant Biologists. All rights reserved.
Related Documents


