The Effects of Dispositional Academic Self- handicapping on Performance Expectations, Performance Outcomes and Affect. i Jane Direen BA (Hons) Submitted in partial requirement for the degree of Doctor of Psychology (Clinical) at the University of Tasmania, June 2005.

Welcome message from author
This document is posted to help you gain knowledge. Please leave a comment to let me know what you think about it! Share it to your friends and learn new things together.
Transcript
The Effects of Dispositional Academic Self-
handicapping on Performance Expectations,
Performance Outcomes and Affect.
i
Jane Direen
BA (Hons)
Submitted in partial requirement for the degree of Doctor of Psychology
(Clinical) at the University of Tasmania, June 2005.
Statement
I declare that this thesis is my own work and that, to the best of my knowledge and belief,
it does not contain material from published sources without proper acknowledgement, nor
does it contain material which has been accepted for the award of any higher degree or
graduate diploma in any university. The research contained in this thesis has been granted
ethics approval.
This thesis is not to be made available for loan or copying for two years following the
date this statement was signed. Following that time the thesis may be made available for
loan and limited copying in accordance with the Copyright Act, 1968.
Jane Direen, June 2005.
Abstract
There is evidence to suggest that dispositional self-handicappers suffer long-term
negative effects such as poor academic performance and negative affect. However, there
has been little research investigating these effects in situations where real life goals are
salient and where specific academic self-handicapping measurement tools are used. In
addition, research directly investigating dispositional self-handicapper's performance
expectations is limited to laboratory settings. Studies have indicated a need for the
development and validation of academic self-handicapping scales that are more reflective
of self-handicapping in the academic domain. Consequently, further research
investigating the above areas in a field setting using a specific academic self-
handicapping tool is advised. In study 1, participants (N = 240) completed a package of
questionnaires including the Revised Academic Self-Handicapping Scale (RASH) and 140
participants returned to complete the second questionnaire package four weeks later. The
RASH was revised to form a 12-item scale (RASH-I I ). The RASH-II was found to have
two subscales: Procrastination and Achievement Anxiety, and was found to be a
psychometrically sound instrument, which has good reliability and validity. Study 2
examined the relationship between dispositional academic self-handicapping and claimed
handicaps, performance expectations, performance and affect in a naturalistic context
using the RASH-II as a specific academic self-handicapping assessment tool. Participants
(N = 78) completed the RASH-II and were provided the opportunity to claim handicaps,
report performance expectations, and report affect at various times during the semester.
In addition, participants' grades on assignments and examinations were obtained.
Participants who scored high on the RASH-II, claimed more handicaps prior to
iv
assignments and exams and expected to perform more poorly than those who scored low.
This was despite similar performances throughout the year. In addition, these participants
also reported higher levels of negative affect. These fmdings confirm previous research
into the effects of chronic self-handicapping whilst using a new academic self-
handicapping measurement tool and focussing on real life performance situations for
third year University students.
Acknowledgements
I wish to thank Dr. Ted Thompson and Mr Peter Ball for their ongoing support and
guidance. Thank you also to Dr. Frances Martin for her practical advice and support.
Thank you to Dr. Georgina O'Donnell and my many other work colleagues and friends
for their emotional support. My family and husband Dickie deserve a big thank you for
their patience and love and finally thank you to all the students who gave up their time to
participate in these studies.
Table of Contents
Situational Self-handicapping Strategies 1
Dispositional Self-handicapping 3
The Self-Handicapping Scale (SHS) 4
Academic Self-handicapping 6
The Academic Self Handicapping Questionnaire (ASHQ) 6
Performance Expectations 7
Performance 10
Affect 16
Research Designs 20
Summary and Hypotheses S 21
Study 1 21
Study 2 23
Study 1 25
Summary of Hypotheses 26
Method 26
Participants 26
Instruments 27
Procedure 32
Results 32
Factor Analysis 32
Corrected item/item Total Correlations 33
vi
vii
Reliability Analysis 34
Correlates of the Revised Self-Handicapping Scale-II 34
Discussion 35
Factor Structure 36
Relations with Neighbouring Constructs 37
Study 2 40
Summary of Hypotheses 41
Method 42
Participants 42
Instruments 42
Procedure 45
Results 46
Treatment of Data 46
Claimed Handicaps 48
Performance Expectations 49
Performance 53
Affect 57
Discussion 58
Predictive Validity of the RASH-II 59
Performance Expectations 60
Performance 61
Affect 62
General Discussion 63
viii
Limitations of the Study 64
Directions for Further Research 65
Conclusion 66
References 68
List of Appendices 81
Appendix A: Data Analyses
Al: Study 1; ANOVA on Scale Order Variations 82
A2: Study 1; Factor Analysis of the RASH 83
A3: Study 1; Item/item Total Correlations 84
A4: Study 1; Test-retest Reliability Analysis 85
A5: Study 1; Internal Consistency Analysis 86
A6: Study 2; Conversion of Grades Needed to Percentages 87
A7: Study 2; RASH-II Low, Medium and High Groups 88
A8: Study 2; Post hoc Analyses 89
A9: Study 2; Analyses on Achievement Anxiety Subscale for
Performance Measures 93
Appendix B: Experimental Materials
Bl: RASH-H Scale 94
B2: General Performance Expectations Measures 97
B3: Claimed Handicap Scale 98
B4: Positive Motivation Scale 100
B5: Claimed Handicap Instructions 101
B6: Specific Performance Expectation Measures 102
Research has established a pervasive tendency on the part of individuals to attribute
successful outcomes to themselves and unsuccessful outcomes to other factors. This 'self
serving bias' enables an individual to deny personal responsibility for unsuccessful
outcomes, thereby avoiding any negative implications, and assume responsibility for
successful outcomes. In so doing, they assert the link between performance and evaluation.
Berglas and Jones (1978) have suggested that these principles of self-image protection are
also used proactively. They coined the term self-handicapping to represent the
characteristic of actively seeking or creating factors that interfere with performance in
order to provide an external explanation for failure and enhanced responsibility for
success.
Situational Self-handicapping Strategies
Situational self-handicapping strategies occur in situations when certain factors or
characteristics are present such as non-contingent success or high task difficulty. It has
been suggested that self-handicapping occurs in situations where the outcome is uncertain
(Jones & Berglas, 1978; Berglas & Jones, 1978; DeGree & Snyder, 1985; Harris &
Snyder, 1986; Snyder, 1990; Snyder & Smith, 1982) and that self-handicaps are strategies
designed to reduce uncertainty regarding one's abilities (Maracek & Mettee, 1972). In their
initial demonstration of self-handicapping behaviour, Berglas and Jones provided
participants who were allocated to either (a) contingent success or (b) non-contingent
success feedback, the opportunity to self-handicap for an upcoming test by ingesting what
they believed to be a debilitating drug. Participants who had experienced non-contingent
success chose to take the debilitating drug presumably as a means to undermine the
competence implications of any decreases in performance. Further research has replicated
2
these findings utilising both drug ingestion (Kolditz & Arkin, 1982) and alcohol
consumption (Tucker, Vuchinich, & Sobell, 1981). Snyder and colleagues (Frankel &
Snyder, 1978; Snyder, Smoller, Strenta, & Frankel, 1981) suggested that lack of effort
could be utilised as an impediment to performance and afford the self-handicapper the
same benefits as drug ingestion and alcohol consumption. They found that participants
who had been given unsolvable problems followed by music said to facilitate performance,
did in fact reduce effort on the upcoming task. Reductions in effort have also been found in
other studies (Baumeister, Hamilton, & Tice, 1985; Pyszczynski & Greenberg, 1983;
Rhodewalt & Fairfield, 1991).
Arkin and Baumgardner (1985) suggest an organisational scheme to classify
situational self-handicapping behaviour. Alcohol consumption, drug ingestion and
reductions in effort constitute an "acquisition of an impediment to accurate appraisal" (p.
175), where an individual deliberately behaves in a certain manner prior to performance
situations. By contrast, it is suggested that claims of handicaps also occur (such as
claiming test anxiety). These handicaps are also known as self-reported handicaps (Hirt,
Deppe, & Gordon, 1991) and represent handicaps that individuals claim to have prior to a
performance situation.
In an investigation of the performance-related consequences of self-handicapping
and state self-confidence among physical education students, Ryska (2002) utilised an
open-ended response format to measure claimed impediments to performance. Participants
claimed performance impediments such as inadequate physical preparation, other sport
commitments, pre-competitive anxiety, injury/illness, social activities, poor concentration,
inadequate sleep and many more. In an academic context, Feick and Rhodewalt (1997),
3
Rhodewalt and Hill (1995) and Thompson and Richardson (2001) found that individuals
with a disposition for self-handicapping behaviour claimed handicaps such as test anxiety,
financial worries, feeling off colour and headaches as impediments to future performance.
Arkin and Baumgardner suggest that the above classes of internal handicaps can be
contrasted with external handicaps such as the choice of difficult goals, or non-diagnostic
contexts. Internal handicaps represent those handicaps with an internal locus of control
whereas external handicaps are termed as such due to an external locus of control.
Dispositional Self-handicapping
Edward E. Jones and colleagues in the 1970's believed that there are differences
among people in the extent to which they utilise situational self-handicaps (Berglas 8c
Jones, 1978; Jones & Berglas, 1978). Specifically, it was postulated that some individuals
will use any possible claim or behavioural impediment to performance if it is available
across a variety of situations and over a long period of time. These individuals can be
thought of as Wispositional self-handicappers These individuals are thought to have a
tenuous and uncertain sense of esteem (Harris & Snyder, 1986) and thus, their tendencies
towards self-handicapping reflect an uncertainty about how competent they are (Berglas &
Jones). In addition, research has shown a higher level of self-criticism amongst
dispositional self-handicappers (Eronen, Nurmi, & Salmela-Aro, 1998; Rhodewalt & Hill,
1995). When people are faced with a task they feel is a threat to their self-esteem, fear of
failure or fear of evaluation can develop (Deppe & Harackiewicz, 1996; Newman &
Wadas, 1997) and self-handicapping or failure avoidant behaviours are utilised.
In relation to views about the self, Thompson and Muskett (2003) have asserted
that dispositional self-handicappers have an entity view of intelligence, where intelligence
4
or ability is seen as a fixed, immutable, stable trait. Hence poor performance on a task
implies that a person has low ability relative to that task. When people who hold an entity
view of ability encounter a situation in which they are uncertain of their ability to perform
well, they may be more likely to engage in self-handicapping behaviours in order to deflect
explanations of ability for the failure.
In the late 1970s, Jones devised a questionnaire to directly probe individuals about
their self-handicapping behaviours and motivations (Jones & Berglas). Initial work with
this scale produced correlations with low self-esteem (r's .30 to .50). Consequently the
Self-Handicapping Scale (SHS; Jones & Rhodewalt, 1982, cited in Rhodewalt, 1990) was
designed to assess preferences for the use of self-handicapping strategies with as little
overlap with self-esteem as possible.
The Self-Handicapping Scale (SHS)
In its original form, the SHS consisted of 20 items that probed respondents'
tendency to claim handicaps such as lack of effort, illness, procrastination or emotional
upset in situations involving evaluative threat. Items include: "I would do a lot better if!
tried harder," "I tend to put things off to the last minute," and" I suppose! feel 'under the
weather' more often than most people." Participants indicate their agreement with each
statement on a 6-point scale with end-points "Strongly Disagree" and "Strongly Agree." A
25-item version of the scale also exists. Both versions have been used in research and the
basic item content in the 20-item version is contained in the 25-item scale. In addition to
this, various modifications of the response alternatives and changes to the number of
response alternatives (four, five, six and seven) have been reported. Psychometric data is
often reported without differentiation between the two scales. The SHS has been found to
5
be internally consistent (a = .78) and temporally stable (test — retest at one month = .74)
from a mass testing of 685 college undergraduates (M = 67.5, Median = 67; Rhodewalt,
Saltzman, & Wittmer, 1984). More recently, Ross, Canada, and Rausch (2002) reported a
similar internal consistency for the scale (a = .76).
In addition, the scale has continued to show good predictive validity for a variety of
self-handicapping strategies. Strube and Roenunele (1985) demonstrated that high self-
handicappers who had a reason for self-protection (low self-esteem) deliberately chose a
test form that maximised potential pride whilst minimising potential shame. In addition,
Thompson and Richardson (2001) found a trend for high self-handicappers (as measured
by the SHS) to claim more handicaps (such as test anxiety, financial worries and feeling off
colour) than low self-handicappers prior to an intellectually evaluative event. Similarly,
Hirt et al., (1991) found that high self-handicapping men engaged in behavioural self-
handicapping and reported greater stress when it served as a viable excuse for poor
performance than low self-handicappers.
Rhodewalt et al., (1984) revealed that competitive swimmers and professional
golfers who scored high on the SHS did not increase the amount of effort they put into
practicing prior to an important performance situation, whereas the low self-handicappers
did. In addition, McCrea and Hirt (2001) found that high self-handicapping individuals
claimed to prepare less for an exam than low self-handicappers. In support of the above
research, Rhodewalt and Fairfield (1991) found that when a task was difficult (i.e. when
individuals did not expect to succeed), high self-handicappers as measured by the SHS,
indicated they intended to exert less effort on the task than low self-handicappers. These
6
studies support the utility of the SHS in predicting a reduction in effort and practice as a
self-handicapping strategy in high dispositional self-handicappers.
Although the SHS shows good predictive validity and good levels of internal
consistency and temporal stability, factor analytic studies suggest that the psychometric
properties of the scale can be improved (Martin & Brawley, 1999; Prapavessis & Grove,
1998; Rhodewalt, 1990; Strube, 1986). Ten-item and 14-item scales have been developed
with at least as good reliability and validity as the SHS. Researchers continue to utilise all
versions of the scale with much similar results.
Academic Self-handicapping
The SHS was originally designed to measure tendencies towards self-handicapping
across all domains, however it has been validated predominantly in academic contexts.
Although the validation and reliability data for the SHS in academic contexts is good, the
scale items are worded in more general terms and are not necessarily reflective of self-
handicapping in the academic domain (Urdan & Midgley, 2001). In addition, Murray and
Warden (1992) suggest that a questionnaire that is specifically tailored to academic self-
handicapping may have greater potential for the identification of individuals who have a
tendency to use self-handicapping strategies academically.
Academic Self-Handicapping Questionnaire (ASHQ; Warden, 1987, cited in Murray &
Warden, 1992)
Warden (1987, cited in Murray & Warden, 1992) adapted the Academic Self.
Handicapping Questionnaire (ASHQ) from Jones and Rhodewalt's (1982, cited in
Rhodewalt, 1990) SHS. The ASHQ contains 22 items that relate specifically to academic
situations. A pilot study has shown the ASHQ to have adequate internal consistency (a=
7
.76; Murray & Warden). Murray and Warden evaluated the validity of the ASHQ in
predicting self-handicapping behaviours by testing two hypotheses: (1) that self-
handicapping strategies result in a reduction in effort and (2) that self-handicappers are
more critical of their performance than others are about their performance.
Results showed that there was an inverse relationship between self-handicapping
and the amount of studying prior to an exam and that self-handicapping also correlated
negatively with actual performance on the exam. The authors suggest that these results
validate the ASHQ as a measure of academic self-handicapping behaviour. In addition,
people who scored high on the ASHQ tended to have relatively low expectations of
performance and low perceived performance on the exam. Furthermore, their perceived
performance, after receiving feedback, was lower than that of low scorers on the ASHQ
who performed comparably. The authors state that this further supports the use of the
ASHQ as a measure of academic self-handicapping (Murray & Warden, 1992). Warden and
Murray (personal communication, 1999) revised the ASHQ to produce a 24-item scale
known as the Revised Academic Self-Handicapping Scale (RAW. There appears to be no
other research utilising the ASHQ, and no psychometric data at all to support the use of the
RASH in academic contexts.
Performance Expectations
In their original conceptualisation of self-handicapping behaviour, Berglas and
Jones (1978) suggested that self-handicapping occurs when future outcome uncertainty and
uncertain self-images are created. This has been achieved in the literature by manipulating
task importance and prior exposure to non-contingent success (success which is undeserved
on the basis of actual feedback: Higgins & Harris, 1988; Kolditz & Arkin, 1982; Mayerson
8
& Rhodewalt, 1988; Rhodewalt & Davison, 1986; Tucker et al., 1981). Similarly, C. R.
Snyder and colleagues (e.g., Smith, Snyder, & Handelsman, 1982; Snyder, 1990; Snyder &
Smith, 1982) emphasise the role of an uncertain anticipatory set in self-handicapping
behaviour and suggest that this requires tasks to be presented as diagnostic of a valued
attribute such as intelligence (DeGree & Snyder, 1985; Greenberg, 1985; Pyszczynski &
Greenberg, 1983; Rhodewalt et al., 1984; Sheppard & Arkin, 1989; Smith et al.).
Both conceptualisations of self-handicapping behaviour emphasise the role of
"efficacy expectancies" in self-handicapping behaviour. "Efficacy expectancies" refer to a
person's beliefs about whether a behaviour can be performed (Bandura, 1977). On the one
hand, individuals with uncertain self-images doubt their ability to perform efficaciously
and on the other, the manipulation of uncertainty concerning future performance outcomes
challenges individuals' perceived ability to achieve a certain outcome.
Much of the research has focussed on situational self-handicapping and the
manipulation of efficacy expectancies in a laboratory setting usually by manipulating the
difficulty of the task. It appears that only limited research has investigated whether high
dispositional self-handicappers have chronically low efficacy expectancies. It is implicit in
the above conceptualisations of situational self-handicapping behaviour that individuals
who chronically self-handicap are likely to exhibit chronically low efficacy expectancies.
That is, high dispositional self-handicappers might chronically expect poorer performance
on tasks and expect that they are less likely/less able to achieve their goals on tasks than
low dispositional self-handicappers.
Although not a primary focus of either study, Feick and Rhodewalt (1997) and
Rhodewalt and Hill (1995) measured individuals' performance expectations on an
9
upcoming exam. Their primary focus was on participants' attributional, affective, and self-
esteem responses to test grades that were not as high as expected and grades that met or
exceeded expectations. They used a set of questions designed by Rhodewalt and Hill,
which probed students' expectations for their performance on the first examination. These
included asking participants to indicate what grades they expected to receive on the first
exam. They circled one of 13 possible grades (A+, A, A-, .....F) for each item.
Surprisingly, both Feick and Rhodewalt and Rhodewalt and Hill reported that participants'
expected test grades were unrelated to dispositional self-handicapping as measured by the
SHS.
Similarly, McCrea and Hirt (2001) measured performance expectations. Although
not a primary focus of their study, they found that expectations for the second exam, whilst
controlling for the first exam performance, did not differ as a function of dispositional self-
handicapping.
Although these studies suggest that high dispositional self-handicappers do not
expect to perform more poorly than low dispositional self-handicappers, Murray and
Warden (1992) investigated university students' study habits, expectations for performance
and actual performance on a midterm examination and found that dispositional self-
handicapping was negatively correlated with expected scores on the examination. That is,
high dispositional self-handicappers reported lower expectations than low dispositional
self-handicappers. Similarly, Eronen et al., (1998) measured success expectations as part of
an investigation of achievement strategies, academic success and well-being. Participants
who showed a self-handicapping pattern had fewer success expectations than participants
who showed an optimistic or defensively pessimistic pattern of achievement behaviour.
10
In summary, investigations where participants' expectations for success or failure
are manipulated in a laboratory setting result in changes in situational self-handicapping
behaviours. It is implicit in the original conceptualisations of self-handicapping behaviour
that those individuals who have a disposition for engaging in self-handicapping behaviour
are likely to exhibit chronically low performance expectations. However there has been
limited research that has investigated whether high dispositional self-handicappers have
chronically low efficacy expectancies. Feick and Rhodewalt (1997), McCrea and Hirt
(2001) and Rhodewalt and Hill (1995) have shown that dispositional self-handicappers do
not expect to perform more poorly than others. However, Eronen et al., (1998) and Murray
and Warden (1992) suggest that they do expect to perform more poorly than others.
Those studies failing to report a relationship between dispositional self-
handicapping and performance expectations utilised the SHS to identify dispositional self-
handicappers, whereas a scale developed specifically for academic contexts (ASHQ) was
used by Murray and Warden and behavioural patterns known to specifically relate to
academic self-handicapping were used to categorise the self-handicapping group in Eronen
et al.,'s study. It is possible that the differing results are a function of how the researchers
identify dispositional self-handicappers. There is quite obviously a need for further
research into dispositional self-handicapping and performance expectations to clarify this.
Performance
If self-handicapping behaviour involves the creation of impediments to performance
in settings where the potential for feedback that damages self-images is likely (Berglas &
Jones, 1978; Jones & Berglas, 1978), then one would expect poor performance as a result
of creating such impediments. It has been shown that impaired performance typically
11
results from negative evaluation expectancies (Sanna, 1992; Sanna & Pusecker, 1994;
Sanna & Shotland, 1990). If one were to assume that dispositional self-handicappers expect
to perform poorly, then it follows that performance will be impaired. However, some
researchers have found performance benefits as a result of self-handicapping behaviour
(e.g., Sanna & Mark, 1995). Evidence suggests that the relationship between self-
handicapping and performance is complex and depends on whether the handicap is claimed
or acquired, and whether it is internal or external.
Drexler, Ahrens, and Haaga (1995) suggest that acquired handicaps are more likely
to interfere with performance than claimed handicaps. Although one would expect internal,
acquired handicaps such as a reduction in effort, consumption of alcohol or drug ingestion
to interfere with performance, research on these handicaps is limited for ethical reasons.
Contrary to Drexler et al.,'s suggestion, it has typically been shown that the acquisition of
external handicaps, such as choice of difficult goals or listening to debilitating music,
improves performance. It has been suggested that this may be a result of reduced anxiety
and lowered concern about expending effort (Rhodewalt & Fairfield, 1991), or the
alleviation of pressure created by performance concerns, which enables the individual to
have a more adaptive attentional focus (Baumeister & Showers, 1986). This results in
enhanced self-confidence, improved ability, and increased motivation and performance
(Deppe & Harackiewicz, 1996).
In support of the above comments, Sanna and Mark (1995) randomly assigned
University students to one of three conditions, where they (a) did not listen to music, (b)
listened to what was described as debilitating music or (c) listened to what was described
as facilitating music. The authors also manipulated efficacy expectations by varying the
12
difficulty of the preliminary task and manipulated levels of expected evaluation. They
found that when participants were provided with a handicap, greater performance was
found when a negative evaluation was expected. This was especially the case for high
dispositional self-handicappers as measured by the SHS. Similarly, Snyder et al., (1981)
had participants perform tasks that were either (a) solvable with response contingent
feedback, or (b) unsolvable with non-contingent feedback. Participants performed a second
task whilst either (a) listening to debilitating music or (b) not listening to debilitating
music. Participants who experienced unsolvable problems and thus expected to fail the
upcoming task, and who listened to debilitating music did not display any performance
deficits relative to solvable problem participants. This suggests that the distracting
performance setting provided them with an alternative means of self-esteem protection and
thus, freed them to try and do well without concern about the implications of failure.
The conclusion that acquired, external handicaps lead to enhanced effort, and
possibly enhanced performance, is qualified by Rhodewalt and Davison (1986). In their
study, participants performed a cognitive task and received success or failure feedback that
was either response contingent or non-contingent. Participants then chose whether to listen
to distracting music during the administration of a second cognitive test. Participants who
expected to fail in the up-coming task and self-handicapped, performed at a higher level
than all others. Participants exposed to non-contingent success who self-handicapped
performed more poorly than all other groups. Thus, it can be suggested that acquired,
external handicaps facilitate performance following failure but not following non-
contingent success or that which cannot be confidently attributed to one's own efforts or
capacities.
13
It is widely recognised that individuals with no overt psychological dysfunction
may respond to situation specific threats to self-esteem by claiming handicaps or by
behaviourally self-handicapping (Berglas, 1990). This may afford the situation specific
self-handicapper (who is not necessarily a chronic self-handicapper) performance benefits.
These individuals may utilise such strategies on limited occasions, when the right
conditions exist. Thus, we may expect to see the benefits of self-handicapping behaviour in
those studies which focus on situational self-handicapping. Although this may be the case,
it is the chronic self-handicapper who exhibits similar symptoms to the situational self-
handicapper, but on an enduring basis who Berglas believes will experience negative
consequences such as poor performance, negative affect and poor well-being as a result of
long-term self-handicapping.
Research that has been conducted into dispositional self-handicapping and
performance shows that dispositional self-handicappers perform poorly as a result of
chronic self-handicapping behaviours (long -term self-handicapping). In a study by
Rhodewalt and Fairfield (1991), participants scoring in the top and bottom thirds of a
sample distribution of SHS scores were led to believe that they were about to take a test
which was described as either (a) important or (b) unimportant and in which they were led
to anticipate would be (a) difficult or (b) easy. Prior to taking the test, participants reported
how hard they intended to try. The results showed that there were no differences in
performance when participants were led to expect the test to be easy. However, when they
were led to expect it to be difficult (low probability of success), high dispositional self-
handicappers indicated they intended to put forth less effort and performed more poorly
than low self-handicappers.
14
Supporting these results in a naturalistic setting, Beck, Koons, and Milgram (2000)
studied undergraduate psychology students. Prior to taking an exam, participants
completed a package of questionnaires and recorded the time spent studying. High
dispositional self-handicappers claimed that they studied less and performed more poorly
on the exam than low self-handicappers. Similarly, Murray and Warden (1992) found that
University students who were grouped as high dispositional self-handicappers reported that
they studied less and they did not achieve as well on an examination compared to low
dispositional self-handicappers. Eronen et al., (1998); Martin, Marsh, and Debus (2001)
and Zuckerman, Kieffer, and Knee (1998) showed that University students who
chronically self-handicap are least successful in their studies compared with students who
self-handicap less.
In qualification of the above results, McCrea and Hirt (2001) examined self-
handicapping behaviours and test performance among undergraduate university students
over the course of a semester. They found that high dispositional self-handicappers
performed poorly relative to low self-handicappers after claiming poor preparation,
however not after claiming stress. This suggests that future performance is not affected
uniformly by dispositional self-handicapping and depends largely on the types of claims or
behaviours that dispositional self-handicappers use in an attempt to buffer self-esteem.
Midgely, Urdan, and colleagues (1995, 1996, 1998) showed that this pattern of
underachievement is not restricted simply to University contexts. They conducted a series
of survey style studies with school age children. Although their primary focus was not on
self-handicapping and performance alone, their results consistently showed that for fifth
and eighth graders, low achievers report using self-handicapping strategies more than high
15
achievers. In a similar vein, Nurmi, Onatsu, and Haavisto (1995) found that
underachieving high school students reported a pattern of attributions and affect that was
consistent with self-handicapping.
In contrast to the above studies that suggest dispositional self-handicapping
negatively affects performance, Rhodewalt and colleagues (Feick & Rhodewalt, 1997;
Rhodewalt & Hill, 1995) have found no such relationship. Using undergraduate
psychology students' course examinations as performance indicators, the authors obtained
information about dispositional self-handicapping at the beginning of term. Participants
then completed a checklist of claimed handicaps at a point prior to taking the first exam
(during the same class; Feick & Rhodewalt, and two days prior to the exam; Rhodewalt &
Hill). Their results showed that dispositional self-handicapping was not related to actual
grade achieved. In support of these results, Wesley (1994) had undergraduate University
students complete procrastination and self-handicapping questionnaires and obtained
Grade Point Average (GPA) information. Regression analyses showed that self-
handicapping, as measured by the SHS, played no part in the statistical prediction of GPA.
Results suggested that self-handicapping and procrastination overlap in the portion of
variance accounted for in GPA.
In summary, evidence suggests that the relationship between situational self-
handicapping and performance depends on whether the handicap is claimed or acquired,
internal or external. Research has typically shown that the acquisition of external
handicaps, such as choice of difficult goals or listening to debilitating music, improves
performance, at least following failure. Research into dispositional self-handicapping and
performance suggests that dispositional self-handicappers perform poorly as a result of
16
chronic self-handicapping behaviour patterns. However, some research has shown no
relationship at all. It is possible that dispositional self-handicapping, in and of itself, may
not be enough to predict poor performance rather that the types of claims that are made by
dispositional self-handicappers, and whether these are actually a true indication of their
behaviour, provide a clearer indication of future performance.
Affect
Just as one might expect self-esteem benefits from engaging in self-handicapping
behaviour, so too might one expect to obtain affective benefits. Research has supported the
suggestion that short-term affective benefits occur as a result of self-handicapping
behaviour. In a study of level and certainty of self-esteem and self-handicapping, Harris
and Snyder (1986) measured participant anxiety levels following an 'intelligence test'.
They found that uncertain participants derived affective benefits, in the form of reduced
anxiety, from using the self-handicapping strategy of reduced practice. Similarly, Feick
and Rhodewalt (1997) found that although post-performance affect was predicted
predominantly by performance, the number of claimed handicaps also contributed to
increases in affect. The measures of affect used in this study were the positive and negative
affect subscales of the Resultant Self-esteem Scale (McFarland & Ross, 1982, cited in
Rhodewalt & Hill, 1995). This scale was also used in a similar study by Rhodewalt and
Hill where the authors found that affect was not predicted by dispositional self-
handicapping.
The most comprehensive measure of affect appears to be that used in a study by
Drexler et al., (1995) in which the Positive and Negative Affect Scale (PANAS, Watson &
Clarke, 1984) was employed. Drexler et al., measured the pre- and post-spatial relations
17
task affect of University undergraduates. Participants were given the opportunity to choose
what was described as debilitating music whilst performing a task purported to be
indicative of intelligence and future success. Participants who self-handicapped, reported
smaller decreases in positive affect than those who did not. There were no differences for
negative affect. This study also lends support to the suggestion that there are short-term
affective benefits associated with self-handicapping behaviour.
However, according to Covington (1984) the temporary relief afforded by failure-
avoiding tactics such as situational self-handicapping is illusory as their repeated use may
destroy an individual's will to learn. Covington (1992) found that although people who
self-handicap may convince others that their performance did not reflect lack of ability,
they continue to describe themselves in self-deprecatory terms such as "lazy" and
"shiftless". This is especially the case for people who believe they have responsibility for
their own actions as they may experience feelings of guilt later for successful excuses that
enabled them to avoid responsibility (Jung, 1991). Thus, although there appear to be short-
term affective benefits as a result of employing specific self-handicaps, those dispositional
self-handicappers, who use these strategies across situations and time, are likely to develop
negative affective states. Research suggests a link between chronic self-handicapping and
negative affective states is likely.
Aunola, Stattin, and Nurmi (2000a) have shown that maladaptive achievement
strategies used by adolescents (such as self-handicapping) contribute to the development of
depressive symptomatology. Similarly, a lack of 'feeling in control' is a characteristic of
maladaptive achievement strategies (Diener & Dweck, 1978; Dweck, 1986) and has been
shown to be related to depression and anxiety (Petersen, Compas, Brooks-Gunn, Stemmler,
18
Ey, & Grant, 1993). Maladaptive achievement strategies have also been linked with
emotion-focussed coping, which is related to depression and overall low adjustment
(Rijavec & Brdar, 1997).
More specific to self-handicapping, Strube (1986) examined the psychometric
properties of the SHS and found that higher self-handicapping was related to higher levels
of depression. Similarly, Weary and Williams (1990) have shown that self-handicapping is
associated with depression. In addition, drawing from a population of undergraduate
psychology students, Ross et al., (2002) investigated the relationship between self-
handicapping and the Five Factor Model of personality (Costa & McCrea, 1992, cited in
Ross et al.). The Five Factor Model is an empirically-derived model that represents
personality in terms of five factors (Neuroticism, Extraversion, Openness to experience,
Agreeableness and Conscientiousness). Results showed that the Neuroticism factors
predicted self-handicapping, with the lower order factor of depression being the strongest
predictor. These results support other findings suggesting that depressive symptoms are
characteristic of people who repeatedly engage in self-handicapping behaviour (Adams &
Adams, 1991; Eronen et al., 1998; Greaven, Santor, Thompson, & Zuroff, 2000; Nurmi,
1993; Weary & Williams).
The majority of studies have focused primarily on depressive symptomatology.
There is very little research into general affective states of self-handicappers. Two studies
have focused on general affect and self-handicapping. Murray and Warden (1992) found
that affect was predominantly mediated by performance. However, self-handicapping was
also an important mediator with high self-handicappers expressing less positive affect than
low self-handicappers. Additionally, Zuckerman et al., (1998) investigated self-
19
handicapping as a dispositional variable over time. They used the PANAS as a measure of
general affect and found that for both time 1 and time 2, the SHS was negatively related to
positive affect (PANAS PA) and positively related to negative affect (PANAS NA). In
addition, higher SHS scores at time 1 resulted in more negative affect over time. Higher
negative affect and lower positive affect at time 1 resulted in higher SHS scores over time.
Thus the authors suggested that self-handicapping reinforces negative affect but, in turn, is
also reinforced by this construct.
Research has shown that the NA subscale of the PANAS, but not the PA subscale, is
related to self-reported stress and poor coping (Clark & Watson, 1986, cited in Clark &
Watson, 1988; Kanner, Coyne, Schaefer, & Lazarus, 1981; Wills, 1986), health complaints
(Beiser, 1974; Tessler & Mechanic, 1978) and frequency of unpleasant events (Stone,
1981; Warr, Barter, & Brownbridge, 1983). In addition, Tellegen (1985, cited in Watson,
Clark, & Tellegen, 1988) suggests that low PA and high NA are distinguishing features of
depression and anxiety. This is consistent with the above results linking depression with
maladaptive achievement strategies and high NA and self-handicapping.
In summary, research has provided evidence for the short-term affective benefits of
situational self-handicapping, however, Covington (1984, 1992) and Jung (1991) suggest
that the temporary affective relief afforded by failure-avoiding tactics such as situational
self-handicapping, is limited as people who are chronic self-handicappers continue to
describe themselves in self-deprecatory terms. This is supported by research showing a
close link between chronic self-handicapping and depressive symptomatology. The above
research suggests that a link between chronic self-handicapping and negative affect is
likely, however, only limited research has focused on positive and negative affect. The
20
limited research to date suggests that dispositional self-handicapping is related to higher
levels of negative affect and lower levels of positive affect. Only one longitudinal study to
date has used the PANAS as a measurement of general affect. The PANAS scale is useful,
as it has well established links with other constructs and issues that assist in providing a
more detailed account of what 'negative affect' and 'positive affect' actually entail.
Research Designs
Much of the early research into academic self-handicapping behaviour has been
conducted in experimental settings. This allowed controlled investigations of situational
self-handicapping and has provided invaluable insight into the short-term benefits of
situational self-handicapping behaviour. However, long-term self-handicapping can create
pervasive patterns of avoiding esteem or control threatening situations, which can
undermine the individual's self-esteem (Berglas, 1990). It has been shown that chronic
self-handicapping may also lead to other types of problem behaviour such as dropping out
of school, subsequent unemployment and norm breaking behaviours such as substance use
and delinquency (Nurmi, 1993; Nurmi, Salmela-Aro, & Ruotsalainen, 1994).
Consequently, there is a need for researchers to focus on chronic forms of self-
handicapping behaviour.
The appearance of longitudinal and field investigations in the study of dispositional
self-handicapping has only occurred over the last decade. These studies vary in their
approach, however the majority utilise a survey style, in which questionnaires are
completed by a large number of participants at one or two points in time. This style of
research has typically involved correlation and regression analyses to investigate the
relationship between dispositional self-handicapping, achievement and a range of well-
21
being constructs such as depression, affect, self-esteem, and coping style (Aunola et al.,
2000a; Aunola, Stattin, & Nurmi, 2000b; Martin et al., 2001; Martin, Marsh, & Debus,
2002; Midgley et al., 1996; Midgley & Urdan, 1995; Nurmi et al., 1995; Ross et al., 2002;
Urdan et al., 1998; Wesley, 1994). These designs, however, have rarely involved the
investigation of self-handicapping behaviour in response to real life threats which provides
invaluable information on self-handicapping in natural contexts, rather than contrived
situations. Consequently, there is a real need for further investigations utilizing real-life
naturalistic designs.
Summary and Hypotheses
Study 1
More recently, researchers have begun to recognize the importance of investigating
dispositional self-handicapping in real life contexts. However, limited research has utilized
tools specifically designed to assess academic self-handicapping (Urdan & Midgley,
2001). A questionnaire that is specifically tailored to academic self-handicapping may have
greater potential for the identification of individuals who have a tendency to use self-
handicapping strategies academically (Murray & Warden, 1992). The SHS has been used
in the majority of research on dispositional self-handicapping. Although the validation and
reliability data for the SHS in academic contexts is good, the scale items are worded in
more general terms and are not necessarily reflective of self-handicapping in the academic
domain (Urdan & Midgley). Thus, there is a need for specific academic self-handicapping
scales to be developed and used regularly in future research. The RASH is an academic
self-handicapping scale that has been developed (Warden & Murray, personal
22
communication, 1999), however there appears to be no psychometric data at all to support
the use of the RASH in academic contexts.
As academic self-handicapping is a domain specific form of general self-
handicapping, it was hypothesized that the RASH-II would correlate positively with the
Self-Handicapping Scale (Jones & Rhodewalt, 1982, cited in Rhodewalt, 1990). Research
suggests that dispositional self-handicappers have a tenuous and uncertain sense of esteem
and that self-handicapping tendencies reflect an uncertainty about how competent one is.
Thus, it was hypothesized that the RASH-II would correlate positively with the Causal
Uncertainty Scale (Weary & Edwards, 1994) and the Global Self-Esteem Uncertainty
Scale (Marsh, 1990) and negatively with the Confidence in Ability Scale (Henderson et al.,
1992, cited in Hong et al., 1995) and the Academic Self-Esteem Scale (Marsh).
Research suggests that when people are faced with a task that they feel will be a
threat to their self-esteem they usually develop a fear of failure or fear of evaluation.
Therefore, it was hypothesized that the RASH-II would correlate positively with the Fear
of Negative Evaluation Scale (Leary, 1983).
Self-handicappers have been shown to have higher levels of self-criticism than non
self-handicappers. The Attitudes Toward Self Scale (Carver & Ganellen, 1983) measures
individuals' tendencies to be self-punitive. Consequently, it was hypothesized that the
RASH-II would correlate positively with the Attitudes Toward Self Scale and its three
subscales (Overgeneralisation, High Standards and Self-Criticism).
It has been asserted that self-handicapping is related to having a view of ability as a
fixed trait (Thompson & Muskett, 2003). Consequently, these individuals believe that poor
performance on a task implies low ability. Thus, it was hypothesized that the RASH-II
23
would correlate positively with the Implicit View of Ability Scale (Henderson et al., 1992,
cited in Hong et al., 1995).
Self-worth protection and impostor fears are considered to be failure-avoiding
strategies. Both self-worth protection and self-handicapping involves strategies to protect
self-esteem in situations of evaluative threat. Impostor fears involve intense feelings of
intellectual phoniness such that people harbor doubts about their own abilities. It has been
suggested that self-handicappers also have doubts regarding how competent they are. Thus,
it was hypothesized that the RASH-II would correlate positively with the Self-Worth
Protection Scale (Thompson & Dinnel, 2004) and the Clance Impostor Phenomenon Scale
(Clance, 1985). It was hypothesized that the RASH-II would have stronger correlations
with those constructs related to academic contexts (such as the ASE, CIA and WA Scales)
than would the SHS.
Study 2
As the RASH-II is a measure of dispositional self-handicapping in academic
contexts, it was hypothesized that High Self-handicappers (as measured by the RASH-II)
would claim more handicaps on all measures than Low Self-handicappers. This would
provide adequate evidence for the predictive validity of the RASH-II in an academic
context.
It appears that only limited research has focussed primarily on dispositional self-
handicapping and efficacy expectancies. Of these studies, three have shown that
dispositional self-handicappers do not expect to perform more poorly than others whilst
other studies suggest the opposite. Given that one's expectations for success or failure are
ultimately linked with one's performance, it is imperative that there is a clear
24
understanding of chronic self-handicappers' efficacy expectancies. Those studies failing to
report a relationship between dispositional self-handicapping and performance
expectations used the SHS to identify dispositional self-handicappers, whilst other studies
have used questionnaires specifically designed for academic contexts. It is possible that the
differing results are a function of how the researchers identify dispositional self-
handicappers. Thus, it was hypothesized that High Self-handicappers would expect lower
grades for assignments than Low Self-handicappers. With regard to self-handicappers'
failure expectations, it was hypothesized that High Self-handicappers would feel they have
less 'margin for error' than Low Self-handicappers with regard to performing above what
they consider to be a failure.
It was hypothesized that High Self-handicappers would report that they are less
likely to achieve the grades needed to reach their goals than Low Self-handicappers. To
ensure that any difference here was not a function of the actual grades they believe they
needed in order to achieve their goals, a 'grades needed' measure was also taken. There is
no evidence to suggest that self-handicappers would differ in their perception of the grades
they required to reach their goals, consequently no difference was expected between self-
handicapping groups for this measure.
Research into dispositional self-handicapping and performance suggests that
dispositional self-handicappers perform poorly as a result of chronic self-handicapping
behaviour patterns. However, some research has failed to show any relationship at all. It is
possible that dispositional self-handicapping, in and of itself, may not be enough to predict
poor performance and that the types of claims that are made by dispositional self-
handicappers, and whether these are actually a true indication of their behaviour, provide a
25
clearer indication of future performance. The majority of the research supports a link
between chronic self-handicapping and poor performance. Thus, it is hypothesized that
High Self-handicappers would achieve lower grades across all measures than Low Self-
handicappers.
Previous studies have shown that a link between chronic self-handicapping and
negative affect is likely. However, only limited research has focused on positive and
negative affect. The limited research to date suggests that dispositional self-handicapping
is related to higher levels of negative affect and lower levels of positive affect, yet only one
dispositional self-handicapping study has used the PANAS as a measure of general affect.
The PANAS scale is useful as it has well established links with other constructs and issues
that assist in providing a more detailed account of what 'negative affect' and 'positive
affect' actually entail. Thus, it was hypothesized that High Self-handicappers would report
higher levels of negative affect and lower levels of positive affect than Low Self-
handicappers. It has been suggested that chronic self-handicapping may destroy an
individual's will to learn. Consequently, it was hypothesized that High Self-handicappers
would report less Positive Motivation toward their studies than Low Self-handicappers.
STUDY 1
There is a need for specific academic self-handicapping tools to be developed and
used in future research, therefore the aim of Study 1 was to subject the Revised Academic
Self-Handicapping Scale (RASH) to a psychometric evaluation of its items, reliability, and
validity and revise it for use as the dispositional self-handicapping measure in the second
study (Study 2).
26
Summary of Hypotheses
It was hypothesised that the RASH-II would correlate positively with the Self-
Handicapping Scale (Jones & Rhodewalt, 1982, cited in Rhodewalt, 1990), Causal
Uncertainty Scale (Weary & Edwards, 1994), Brief Fear of Negative Evaluation Scale
(Leary, 1983), Self-Worth Protection Scale (Thompson & Dinnel, 2004), Attitudes
Towards Self Scale (Carver & Ganellen, 1983), Overgeneralisation, Self-Criticism and
High Standards subscales of the Attitudes Toward Self Scale, Implicit View of Ability Scale
(Henderson et al., 1992, cited in Hong et al., 1995), the Clance Impostor Phenomenon
Scale (Clance, 1985) and the Global Self-Esteem subscale of the Self-Descriptive
Questionnaire (Marsh, 1990-formatted to assess uncertainty of self-esteem).
It was hypothesised that the RASH-II would correlate negatively with the Academic
Self-Esteem subscale of the Self-Descriptive Questionnaire (Marsh, 1990) and the
Confidence in Ability Scale (Henderson et al., 1992, cited in Hong et al., 1995). It was also
hypothesised that the RASH-II would have stronger correlations with the Academic Self-
Esteem Scale, Confidence In Ability Scale and Implicit Views of Ability Scale than would
the Self-Handicapping Scale.
Method
Participants
Participants were 240 undergraduate psychology students enrolled at the University
of Tasmania, who received course credit for their participation (191 females, 49 males).
The ages of these participants ranged from 17-58 with a median age of 19. Participants
were asked to return in four weeks to complete the package again. Of the original 240
27
participants, one hundred and forty participants returned questionnaire packages for the
second testing (109 females, 31 males) four weeks later.
Instruments
Participants were asked to complete a questionnaire package that contained the
Revised Academic Self-Handicapping Scale (Warden & Murray, personal communication,
1999), the Self-Worth Protection Scale (Thompson & Dinnel, 2004), the Causal
Uncertainty Scale (Weary & Edwards, 1994), the Clance Imposter Phenomenon Scale
(Clance, 1985), the Academic Self-Esteem subscale of the Self-Descriptive Questionnaire
III (Marsh, 1990), the Global Self-Esteem subscale of the Self-Descriptive Questionnaire
III (Marsh - formatted to assess uncertainty of self-esteem), the Attitudes Toward Self Scale
(Carver & Ganellen, 1983), the Self-Handicapping Scale (Jones & Rhodewalt, 1982, cited
in Rhodewalt, 1990), the Brief Fear of Negative Evaluation Scale (Leary, 1983), the
Confidence in Ability Scale (Henderson et al., 1992, cited in Hong et al., 1995), and the
Implicit View of Ability Scale (Henderson et al., cited in Hong et al.). Nine scales were
used to give an adequate indication of both convergent and divergent validity. There were
five different scale orders within the packages to compensate for order effects. Participants
were also asked to provide their age, sex and package completion date on the front cover.
Revised Academic Self-Handicapping Scale (Warden & Murray, Personal
Communication, 1999)
The Revised Academic Self-Handicapping Scale (RASH) is a revision of the 22-item
Academic Self-Handicapping Questionnaire developed by Warden and Murray. The RASH
is a 24-item scale that measures dispositional self-handicapping in academic contexts.
Examples of items from the RASH are: "I usually don't ask questions even when it would
28
help me" and "I find myself easily distractible when I am trying to work." Respondents
rate each item on a 6-point scale (1 = "Strongly Disagree", 2 = "Moderately Disagree", 3 =
"Mildly Disagree", 4 = Mildly Agree", 5 = "Moderately Agree", 6 = "Strongly Agree").
Self-Worth Protection Scale (Thompson & Dinnel, 2004)
The Self-Worth Protection Scale (SWAPS) is a 33-item scale that identifies students who
manifest self-worth protection strategies. An example of an item on this scale is: "I avoid
academic situations in which I can't do as well as I would like." Respondents are asked to
rate each item on a 7-point scale with end-point designations (1 = "Not very true of me"; 7
= "Very true of me"). The SWPS has been shown to have a test-retest reliability of .90 for a
four week interval and an internal consistency (coefficient alpha) of .90.
Confidence in Ability Scale (Henderson et al., 1992, cited in Hong et al., 1995)
The Confidence in Ability Scale (CIA) contains three pairs of items, one indicating high
confidence in ability and the other indicating low confidence in ability. Respondents select
between the option in each pair of items that best describes them (e.g., "I usually think I
am intelligent" vs "I wonder if! am intelligent") and then rate the degree to which the
selected item is true of them on a 3-point scale (1 = "Sort of true", 3 = "Very true").
Scoring is then recoded to a 6-point scale in which a high score indicates a more confident
view of ability. Henderson et al., (cited in Hong et al.) demonstrated high internal
consistency for the CIA Scale (a = .81) and high test-retest reliability for a 1-week period
(r = .83). In addition, Neemann and Harter (1986, cited in Hong et al.) found that the CIA
Scale was highly correlated (r = .77) with the perceived Intellectual Competence subscale
of the Self-perception Profile for College Students and less highly correlated (r = .43) with
the Rosenberg Self-Esteem Scale.
29
Self-Handicapping Scale (Jones & Rhodewalt, 1982, cited in Rhodewalt, 1990)
The Self-Handicapping Scale (SHS) is a 20-item scale that measures respondents'
tendencies to voluntarily adopt or claim a handicap to account for possible poor
performance. An item from this scale is "I sometimes enjoy being mildly ill for a day or
two because it takes off the pressure." Respondents rate each item on a 6-point scale with
end-point designations of 1 = "Strongly Disagree and 6= "Strongly Agree." For the
purpose of the present study, Rhodewalt's 14-item SHS was used.
Glance Impostor Phenomenon Scale (Glance, 1985)
The Glance Impostor Phenomenon Scale (GIPS) is a 20-item measure designed to assess
the degree to which individuals are anxious that others will discover that they are not truly
intelligent and that they will be eventually exposed for the impostors that they believe they
are. Items such as "I can give the impression that I am more competent than I really am"
are rated on a 5-point scale (with end-point designations of 1 = "Not at all true of me" and
5 = "Very true of me"). Chrisman, Pieper, Clance, Holland, and Glickauf-Hughes (1995)
found the CIPS to have a coefficient alpha of .92.
Academic Self-Esteem subscale of the Self-Descriptive Questionnaire III (Marsh, 1990)
The Academic Self-Esteem subscale (ASE) measures individuals' self-esteem in academic
situations using 30 items such as "I learn quickly in most academic subjects." Respondents
are asked to indicate their level of agreement to each item on a 9-point scale (1 = "strongly
disagree; 9 = "strongly agree").
Global Self-Esteem subscale of the Self-Descriptive Questionnaire III (Marsh, 1990)
The Global Self-Esteem subscale (GSE) has 12-items that measure how individuals' feel
about themselves in general. Uncertainty of GSE was assessed by formatting the Marsh
30
items into a dichotomous point format ("like me", "unlike me"), then asking participants to
rate their responses on a five-point scale with end point designations of 1 = "Not at all
certain" and 5 = "Very certain." However, responses were recoded such that a high score
reflected global self-esteem uncertainty (GSEUS-see Thompson, 1993; Thompson,
Davidson, & Barber, 1995). Marsh reports a coefficient alpha of r = .93 for the GSE Scale.
Although psychometric data are not available for the Global Self-Esteem Uncertainty
Scale, Marsh has provided information about the GSE and the ASE. Measures of internal
consistency (Cronbach's alpha) for these two measures of self-esteem have ranged from
.76 to .95 with a mean of .89. Marsh also reported median test-retest reliabilities of .87 for
a 1-month interval and .74 for an 18-month interval.
Attitudes Toward Self Scale (Carver & Ganellen, 1983)
The Attitudes Toward Self Scale (A TS) is an 18-item scale that measures individuals'
tendencies to be self-punitive. Respondents are asked to rate the degree to which each item
is true of themselves on a 6-point scale (1 = "extremely untrue"; 6 = "extremely true").
From a factor analytic perspective, Carver and Ganellen found three component scales of
the ATS: Overgeneralisation, High Standards, and Self-Criticism. An item from each of
the three subscales of the ATS is "my feelings about myself drop if I notice any weakness
or shortcomings at all", "other people think I expect a lot from myself', and "when my
behaviour doesn't live up to standards, I feel I have let myself or someone down"
respectively. Carver and Ganellen report measures of internal consistency of r = .82 for the
tendency to overgeneralise self-judgments, r = .80 for maintenance of high standards, and
r = .65 for the tendency to be self-critical.
31
Brief Fear of Negative Evaluation (Leary, 1983)
The Fear of Negative Evaluation Scale (FNE: Watson & Friend, 1969) is a 30-item scale
that assesses the extent to which people experience apprehension about being negatively
evaluated by other people. An item from the FNE is "I worry about what other people
think of me even when I know it won't make any difference." Respondents are asked to
rate the degree to which each item is characteristic of them on a 5-point scale with
designations "not at all characteristic of me", "slightly characteristic of me", "moderately
characteristic of me", "very characteristic of me" and "extremely characteristic of me".
The brief form of the FNE scale (Leary), used in the present study, has 12 of the original
30 items from the FNE. An inter-item reliability of .90 and test-retest reliability of .75 are
reported for the brief form (Leary).
Causal Uncertainty Scale (Weary & Edwards, 1994)
The Causal Uncertainty Scale (CUS) is a 14-item scale that measures the degree to which
individuals are uncertain of the causes of events in their lives and others' lives. An item
from the GUS is "When things go right, I generally do not know what to do to keep them
that way." Respondents are asked to rate each item on a 6-point scale (1 = "Disagree very
much", 2 = "Disagree pretty much", 3 = "Disagree a little", 4 = "Agree a little", 5 =
"Agree pretty much", 6= "Agree very much"). Edwards, Weary, and Reich (1998)
reported a coefficient alpha of r = .86 and found that the CUS was significantly correlated
with depression (r = .37), perceived lack of control (r = .51), anxiety (r = .41), intolerance
of ambiguity (r = .26), self-esteem (r = -.40), neuroticism (r = .32), decisiveness (r = -.28)
and need for cognition (r = -.42), demonstrating construct validity.
32
Implicit View of Ability Scale (Henderson et al., 1992, cited in Hong etal., 1995)
The Implicit View of Ability Scale (NA) is a 3-item scale in which respondents indicate the
degree to which they believe intelligence is a stable construct. A sample item from this
scale is "Your intelligence is something about you that you can't change very much."
Respondents are asked to rate their agreement with each item on a 6-point scale (1 =
"Disagree very much"; 6 = "Agree very much"). Hong et al., found that the [VA correlated
highly (r = .77) with the Intellectual Competence subscale of the Self-Perception Profile
and was moderately correlated (r = .43) with the Rosenberg Self-Esteem Scale. Hong et al.,
also reported a coefficient alpha of r = .81 and a test-retest reliability of r = .83 for a one-
week delay.
Procedure
Participants were given the questionnaire package to fill out in their own time
within one week. Participants were instructed to read the items carefully and to respond
without thinking excessively about each item. Participants were asked to return four weeks
later to complete the RASH a second time to provide an assessment of re-test reliability.
Results
A one-way ANOVA was performed to compare scores on all scales across the five
different order combinations (see Appendix Al). There were no significant differences
between the five combinations for any of the dependent measures (p> .05). Therefore, data
across all combinations were collapsed for all further analyses.
Factor analysis
In order to assess the degree to which the RASH scale measures a unitary construct,
the data was submitted to an exploratory factor analysis using a principal axis extraction
33
with an oblique rotation (see Appendix A2). A number of methods of extraction were
employed, however the principle axis extraction method was chosen as the results were
more psychologically meaningful. From the scree test, it was determined that two factors
best described the data. These two factors combined accounted for 34.9% of the variance.
The first factor accounted for 26.5% of the variance and seems to focus primarily on a
Procrastination component of self-handicapping. The second factor accounted for 8.4% of
the variance and seems to focus primarily on an Achievement Anxiety component of self-
handicapping. When a factor loading criterion of .30 or higher was used, five items (2, 6,
10, 12, 16) loaded solely on the first factor whereas seven items (3, 7, 8, 18, 19, 22, 24)
loaded solely on the second factor. Twelve items (1, 4, 5, 9, 11, 13, 14, 15, 17, 20, 21, 23)
did not load on either factor at criterion level.
Corrected Item/Item Total Correlations
Correlations between the response to a particular item and the sum of the responses
to all other items were obtained. Items were considered potentially problematic if they did
not exceed .30 (see Appendix A3). Three items (4, 5, 23) failed to achieve this criterion
level.
Based on these item analyses, twelve items (1, 4, 5, 9, 11, 13, 14, 15, 17, 20, 21,
23) were eliminated from further consideration. The decision was taken to pursue the
analyses with a global measure of self-handicapping based on the items which loaded on
the two subscales (as a total score) as this was the primary interest of the investigation. The
formation of a total RASH-II score is defensible since the correlation between the two
subscales was r = .45. The practice of generating a total score from moderately correlated
subscales is common in psychological research (The Self-Worth Protection Scale subscales
34
inter-correlate at .20, .25 and .60, Thompson & Dinmel, 2004; the Contingencies of Self-
Worth Scale subscales inter-correlate at .53, .45, .54, and .42, Crocker, Cooper &
Bouvrette, 2003; the Objectified Body Consciousness Scale subscales inter-correlate at .66
and -.51, McKinley & Hyde, 1996; and the Levels of Self-Criticism Scale subscales inter-
correlate at .45, Thompson & Zuroff, 2004). Thus, for all further analyses, a total score on
the RASH-II scale consisted of the sum of the responses to the remaining 12 items. The
Procrastination subscale of the RASH-II consisted of the sum of the responses to the five
items listed above from Factor One and the Achievement Anxiety subscale of the RASH-II
consisted of the sum of the responses to the seven items listed above from Factor Two.
Reliability Analysis
Participants were asked to complete the RASH-II scale on two separate occasions,
at least four-weeks apart. A test-retest reliability of .79 was established for the
Procrastination subscale, .82 for the Achievement Anxiety subscale, and .83 for the total
RASH-II score (the sum of the two subscales-see Appendix A4). A measure of internal
consistency was computed for the subscales of the RASH-II scale. The internal consistency
using coefficient alpha was .76 for the Procrastination subscale and .79 for the
Achievement Anxiety subscale. For the total RASH-II score, the internal consistency
(coefficient alpha) was .82 (see Appendix A5).
Correlates of the Revised Academic Self-Handicapping Scale -II
Self-handicapping is multifaceted and consequently has close links with a large
variety of constructs. Consequently, zero-order correlations with nine other scales were
used to examine evidence for convergent validity of the RASH-II scale based on previous
predictions. As was expected, the correlation between academic self-handicapping (RASH-
35
II) and general self-handicapping (as measured by the SHS) was positive and strong (r =
.74). Dispositional academic self-handicapping (as measured by the RASH-I1) was
significantly positively correlated with two other failure avoidant strategies: impostor
phenomenon (r = .62) and self-worth protection (r = .58). Dispositional academic self-
handicapping was positively correlated with the Attitudes Towards Self Scale (r = .36). In
relation to the three subscales of the ATS, dispositional academic self-handicapping was
significantly positively correlated with the tendency to overgeneralise self-judgments (r =
.48) and the tendency to be self-critical (r = .35), but was not significantly correlated with
the maintenance of high standards (r = .13).
Dispositional academic self-handicapping also correlated significantly and
positively with causal uncertainty (r = .49), and self-esteem uncertainty (r = .36).
Significant, positive correlations were also found between dispositional academic self-
handicapping and implicit views of ability (r = .19) and fear of negative evaluation (r =
.49). Finally, dispositional academic self-handicapping was significantly and negatively
correlated with confidence in ability (r = -.47) and academic self-esteem (r = -.45).
The correlational results for the general Self-Handicapping Scale showed that the
SHS was significantly and positively correlated with the Implicit View ofAbility Scale (r =
.17) and significantly negatively correlated with the Confidence in Ability Scale (r = -.40)
and Academic Self-Esteem Scale (r = - .33).
Discussion
The results of the present study show preliminary evidence for the reliability and
validity of the RASH-II in the assessment of dispositional self-handicapping tendencies in
academic settings. When twelve items from the RASH were removed (1, 4, 5, 9, 11, 13, 14,
36
15, 17, 20, 21, 23) as a result of the item analyses, the resulting scale was reliable from two
perspectives. First, there was a high degree of internal consistency based on coefficient
alpha. Second, there was consistency in scores over a limited period of time, indicating the
stability of the scale over a one-month period.
Factor Structure
From the results of the factor analysis of the items on the RASH, a two-factor
structure seemed to be the clearest explanation of the data. Upon examining the items that
loaded on the first factor, it was determined that the factor seemed to measure a tendency
to use Procrastination behaviours as a self-handicapping strategy in academic situations.
This result is consistent with Jones and Rhodewalt's (1982, cited in Rhodewalt, 1990)
conceptualisation of self-handicapping involving lack of effort, illness and procrastination
as strategies for protecting the self-concept against judgments of low ability. Ferrari
(1991a, 1991b), Beck et al., (2000) and Ferrari and Tice (2000) also found that high self-
reported procrastination was related to delayed task engagement and less preparation time
prior to an upcoming important task. The results support previous work by Lay, Knish, and
Zanatta (1992), which suggests that behavioural procrastination may be a behavioural self-
handicapping strategy.
The second factor seemed to measure an Achievement Anxiety component of self-
handicapping. The anxiety link with self-handicapping has been established in a number of
studies. For example, test-anxious (Harris, Snyder, Higgins, & Schrag, 1986; Greenberg,
Pyszczynslci, & Paisley, 1985; Smith et al., 1982) and socially anxious (Snyder, Smith,
Augelli, & Ingram, 1985) participants have shown self-handicapping behaviours in
contexts that involved evaluative conditions and expectancies that encouraged this type of
37
behaviour. In addition to the use of anxiety as a self-handicapping strategy, literature
detailing the theoretical underpinnings of self-handicapping behaviour suggests that the
certainty one has to produce a successful outcome in an important evaluative situation is
conducive to self-handicapping behaviour. It follows that if one is uncertain about his or
her ability to produce an outcome in a situation that has high ego-relevance for that
individual, he or she is quite likely to have a high level of negative affect (Weary &
Jacobson, 1997) and achievement anxiety. Thus, the factor analysis has produced factors
within the RASH-II that are theoretically and behaviourally consistent with our knowledge
of the dynamics of self-handicapping.
Relations with Neighbouring Constructs
The results of the correlational analysis suggest that the RASH-II is a construct-
valid instrument.
Uncertain Self-Esteem
According to Jones and Berglas (1978; Berglas & Jones, 1978) and C. R. Snyder
and colleagues (e.g., DeGree & Snyder, 1985; Harris & Snyder, 1986; Snyder, 1990;
Snyder & Smith, 1982) self-handicapping is a set of behaviours or claims to protect one's
self-image in situations where the outcome is uncertain. It has also been suggested that
they are strategies designed to reduce uncertainty regarding one's abilities (Maracek &
Mettee, 1972). In addition to this, it has been proposed that self-handicappers have a
tenuous and uncertain sense of esteem (Harris & Snyder) and that self-handicapping
tendencies reflect an uncertainty concerning how competent one is (Berglas & Jones,
1978). The results of the present study are consistent with these suggestions as both global
self-esteem uncertainty and causal uncertainty were significantly negatively related to
38
academic self-handicapping as predicted. The results also support Newman and Wadas
(1997) who demonstrated a relationship between self-esteem uncertainty and self-
handicapping behaviour.
Low Academic Self-Esteem and Confidence in Ability
An alternate way of conceptualising uncertain self-esteem may be a general lack of
confidence in one's academic ability (Harris & Snyder, 1986). Confidence in ability is
reflected in the academic self-esteem of people. Thus, if people are not confident in their
academic abilities or have low academic self-esteem, they may be more likely to engage in
academic self-handicapping. The present results are consistent with this reasoning.
Individuals who scored higher on the RASH-II tended to score lower on measures of
academic self-esteem and confidence in ability.
Self-Criticism, Overgeneralisation and High Standards
As predicted, the present results showed a positive correlation between the RASH-I1
and the ATS Scale. More specifically, as participants increased their self-critical
assessments and their tendencies to overgeneralise negative self-judgments, they also
increased in their tendencies to report academic self-handicapping behaviours. These
results are consistent with other research that has shown a higher level of self-criticism
amongst self-handicappers (Eronen et al., 1998; Rhodewalt & Hill, 1995), suggesting that
these individuals may have a tendency to protect themselves from their self-criticism by
engaging in self-handicapping behaviour. Contrary to expectation, the relationship between
dispositional self-handicapping and high standards was not significant. These results
provide some support for the relationship between these constructs and dispositional self-
handicapping.
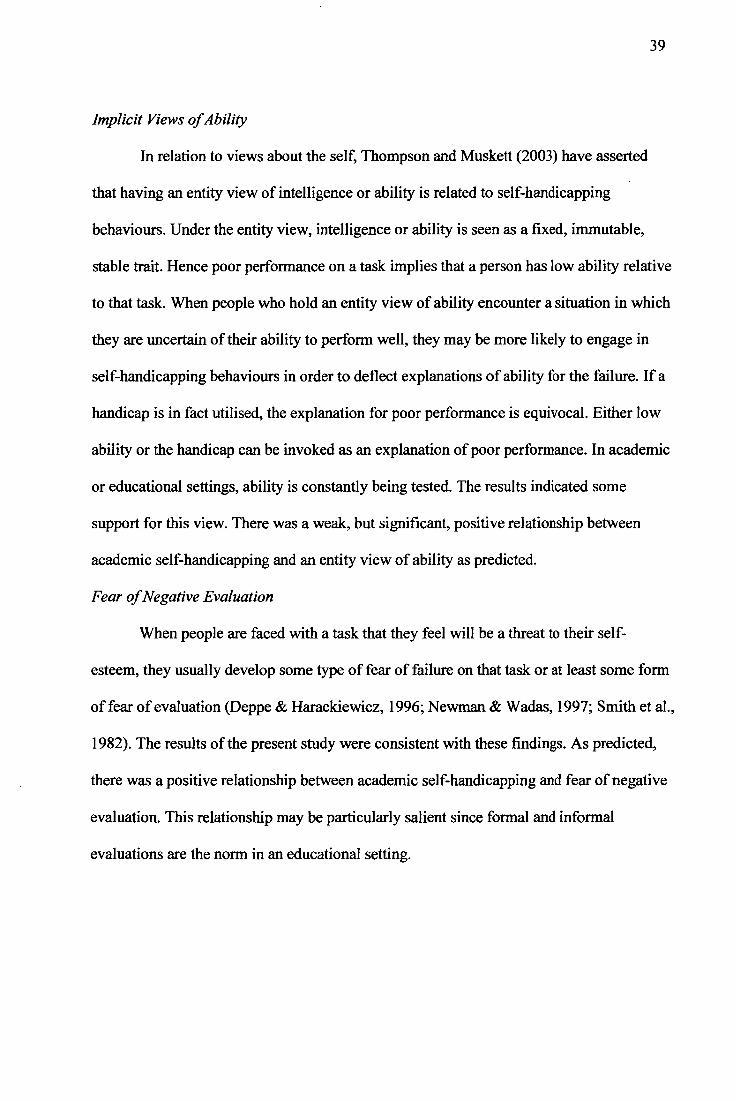
39
Implicit Views of Ability
In relation to views about the self, Thompson and Muskett (2003) have asserted
that having an entity view of intelligence or ability is related to self-handicapping
behaviours. Under the entity view, intelligence or ability is seen as a fixed, immutable,
stable trait. Hence poor performance on a task implies that a person has low ability relative
to that task. When people who hold an entity view of ability encounter a situation in which
they are uncertain of their ability to perform well, they may be more likely to engage in
self-handicapping behaviours in order to deflect explanations of ability for the failure. If a
handicap is in fact utilised, the explanation for poor performance is equivocal. Either low
ability or the handicap can be invoked as an explanation of poor performance. In academic
or educational settings, ability is constantly being tested. The results indicated some
support for this view. There was a weak, but significant, positive relationship between
academic self-handicapping and an entity view of ability as predicted.
Fear of Negative Evaluation
When people are faced with a task that they feel will be a threat to their self-
esteem, they usually develop some type of fear of failure on that task or at least some form
of fear of evaluation (Deppe & Harackiewicz, 1996; Newman & Wads, 1997; Smith et al.,
1982). The results of the present study were consistent with these findings. As predicted,
there was a positive relationship between academic self-handicapping and fear of negative
evaluation. This relationship may be particularly salient since formal and informal
evaluations are the norm in an educational setting.
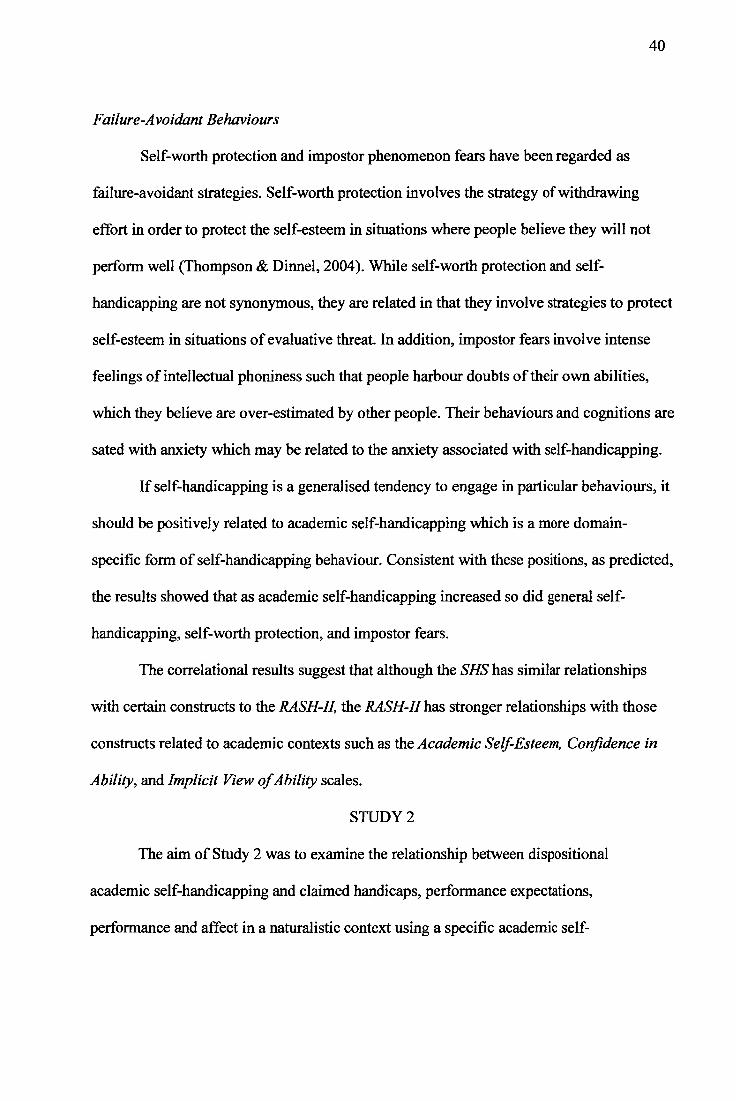
40
Failure -Avoidant Behaviours
Self-worth protection and impostor phenomenon fears have been regarded as
failure-avoidant strategies. Self-worth protection involves the strategy of withdrawing
effort in order to protect the self-esteem in situations where people believe they will not
perform well (Thompson & Dinnel, 2004). While self-worth protection and self-
handicapping are not synonymous, they are related in that they involve strategies to protect
self-esteem in situations of evaluative threat. In addition, impostor fears involve intense
feelings of intellectual phoniness such that people harbour doubts of their own abilities,
which they believe are over-estimated by other people. Their behaviours and cognitions are
sated with anxiety which may be related to the anxiety associated with self-handicapping.
If self-handicapping is a generalised tendency to engage in particular behaviours, it
should be positively related to academic self-handicapping which is a more domain-
specific form of self-handicapping behaviour. Consistent with these positions, as predicted,
the results showed that as academic self-handicapping increased so did general self-
handicapping, self-worth protection, and impostor fears.
The correlational results suggest that although the SHS has similar relationships
with certain constructs to the RASH-II, the RASH-II has stronger relationships with those
constructs related to academic contexts such as the Academic Self-Esteem, Confidence in
Ability, and Implicit View of Ability scales.
STUDY 2
The aim of Study 2 was to examine the relationship between dispositional
academic self-handicapping and claimed handicaps, performance expectations,
performance and affect in a naturalistic context using a specific academic self-

41
handicapping assessment tool. In order to maximise the natural occurrence of self-
handicapping facilitating factors, third year undergraduate psychology students were
recruited and asked to complete questionnaires relating to their studies. Third year
psychology students have either continued on to third year because they would like to do
fourth year honours in psychology, or because psychology is likely to be useful in their
pursuit of other career goals outside of the University. Consequently, there is a high level
of competition, and competition has been suggested to contribute to increases in self-
handicapping behaviour (Garcia, 1995). In addition, grading on a curve, which occurs in
psychology at the University of Tasmania, is also likely to contribute to increases in self-
handicapping behaviour (Garcia) and competition for those students not guaranteed
success could represent an environment in which self-protection is the main objective
(Covington & Omelich, 1984, cited in Martin et al., 2002).
Logically, the importance of psychology assessments is likely to be greater than in
previous years, which has been shown to increase the occurrence of self-handicapping
behaviour (Rhodewalt & Fairfield, 1991). In addition, recruiting students during the last
year of their degrees provides an opportunity to investigate dispositional self-handicapping
at a time when real life career goals are salient. To this end real life performance situations,
which carry real life consequences were used as measurement points over a period of five
months.
Summary of Hypotheses
It was hypothesised that High Self-handicappers would claim more handicaps on
all measures than Low Self-handicappers. This would provide adequate evidence for the
predictive validity of the RASH-II in an academic context.
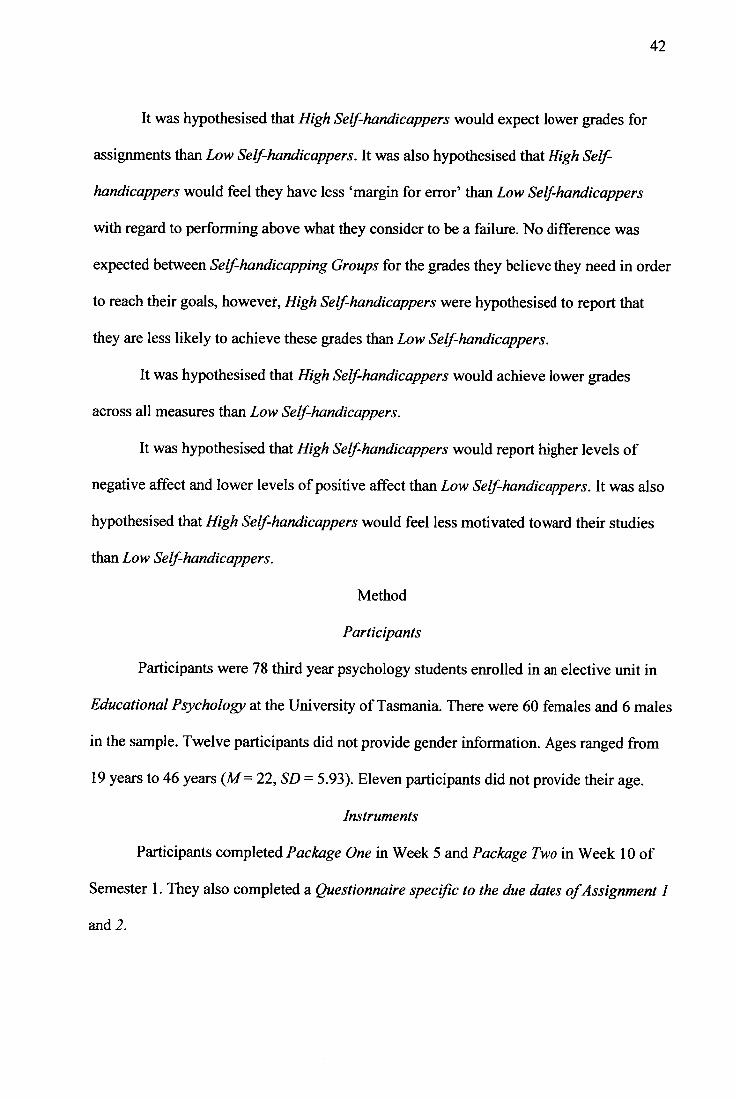
42
It was hypothesised that High Self-handicappers would expect lower grades for
assignments than Low Self-handicappers. It was also hypothesised that High Self-
handicappers would feel they have less 'margin for error' than Low Self-handicappers
with regard to performing above what they consider to be a failure. No difference was
expected between Self-handicapping Groups for the grades they believe they need in order
to reach their goals, however, High Self-handicappers were hypothesised to report that
they are less likely to achieve these grades than Low Self-handicappers.
It was hypothesised that High Self-handicappers would achieve lower grades
across all measures than Low Self-handicappers.
It was hypothesised that High Self-handicappers would report higher levels of
negative affect and lower levels of positive affect than Low Self-handicappers. It was also
hypothesised that High Self-handicappers would feel less motivated toward their studies
than Low Self-handicappers.
Method
Participants
Participants were 78 third year psychology students enrolled in an elective unit in
Educational Psychology at the University of Tasmania. There were 60 females and 6 males
in the sample. Twelve participants did not provide gender information. Ages ranged from
19 years to 46 years (M= 22, SD = 5.93). Eleven participants did not provide their age.
Instruments
Participants completed Package One in Week 5 and Package Two in Week 10 of
Semester 1. They also completed a Questionnaire specific to the due dates of Assignment I
and 2.
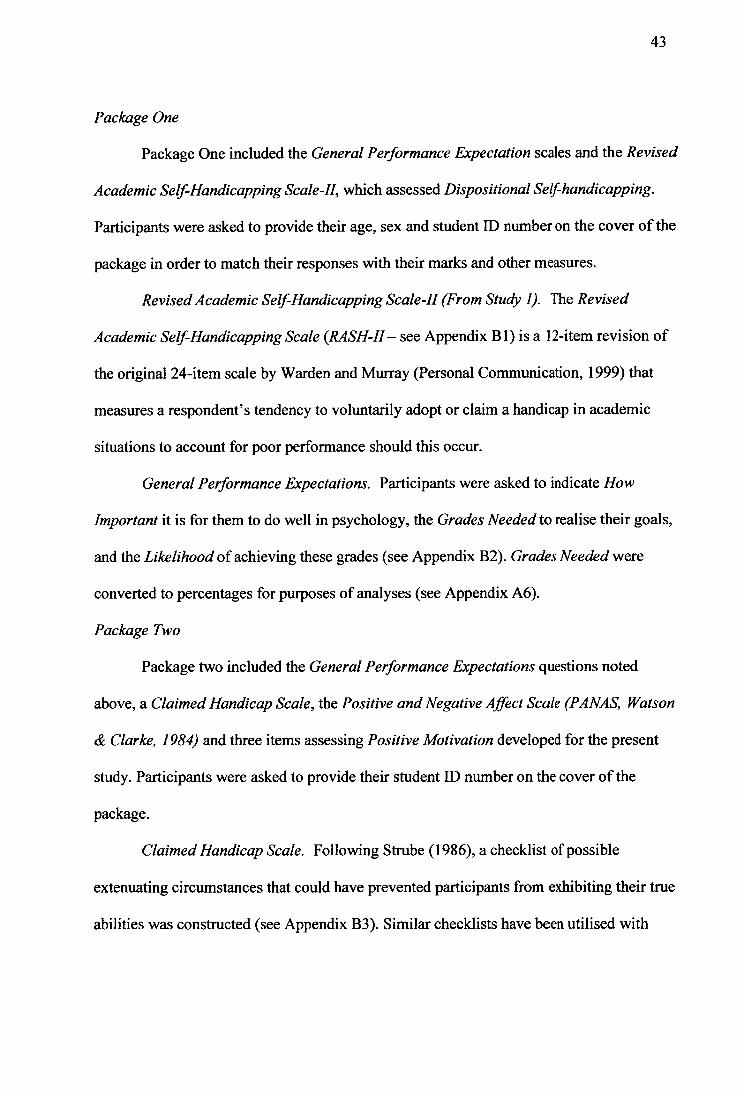
43
Package One
Package One included the General Performance Expectation scales and the Revised
Academic Self-Handicapping Scale-II, which assessed Dispositional Self-handicapping.
Participants were asked to provide their age, sex and student ID number on the cover of the
package in order to match their responses with their marks and other measures.
Revised Academic Self-Handicapping Scale-II (From Study 1). The Revised
Academic Self-Handicapping Scale (RASH-II— see Appendix B1) is a 12-item revision of
the original 24-item scale by Warden and Murray (Personal Communication, 1999) that
measures a respondent's tendency to voluntarily adopt or claim a handicap in academic
situations to account for poor performance should this occur.
General Performance Expectations. Participants were asked to indicate How
Important it is for them to do well in psychology, the Grades Needed to realise their goals,
and the Likelihood of achieving these grades (see Appendix B2). Grades Needed were
converted to percentages for purposes of analyses (see Appendix A6).
Package Two
Package two included the General Performance Expectations questions noted
above, a Claimed Handicap Scale, the Positive and Negative Affect Scale (PANAS, Watson
& Clarke, 1984) and three items assessing Positive Motivation developed for the present
study. Participants were asked to provide their student ID number on the cover of the
package.
Claimed Handicap Scale. Following Strube (1986), a checklist of possible
extenuating circumstances that could have prevented participants from exhibiting their true
abilities was constructed (see Appendix B3). Similar checklists have been utilised with
44
success in other studies (Thompson & Hepburn, 2003; Thompson & Richardson, 2001).
This checklist provided participants with the opportunity to claim handicaps by rating the
degree to which each item was likely to have affected their performance. As the primary
focus of the study was to assess the degree to which individuals claim handicaps as
opposed to which handicaps are claimed, items were summed to produce a final Claimed
Handicap measure. Coefficient alphas for the scale range from .87 to .91 across three
repeated administrations. Instructions for the Claimed Handicap Scale either requested
participants to focus specifically on recently completed assignments (Assignments I & 2),
or their general behaviour (Generic Claimed Handicaps). For the various Claimed
Handicap Scale instructions see Appendix B5.
Positive and Negative Affect Scale (PANAS; Watson & Clark 1984). The PANAS
consists of 10 descriptors for the Positive Affect (PA) scale: attentive, interested, alert,
excited, enthusiastic, inspired, proud, determined, strong and active and 10 descriptors for
the Negative Affect (NA) scale: distressed, upset, hostile, irritable, scared, afraid,
ashamed, guilty, nervous and jittery. The PANAS can be used with a variety of time
instructions. Individuals are asked to rate (on a scale with end-point descriptors of 1 = 'not
at all' to 5 = 'extremely) to what extent they feel or have felt this way right now, today, in
the past few days, during the past week, during the past few weeks, during the past year, or
in general. Alphas range from .86 to .90 for PA and from .84 to .87 for NA (Watson et al.,
1988).
Positive Motivation. Participants were asked to indicate the degree to which they
felt: Motivated, Committed and Interested in their academic studies (see Appendix B4). As
scores for each item were highly inter-correlated, item scores were totaled for a measure of
45
Positive Motivation towards academic studies. The resultant co-efficient alpha suggests
that this is justified (.88).
Questionnaires Specific to Assignment I and 2 Due Dates
Participants were asked to provide their student ID number on the front of the
questionnaire as well as the date they handed the assignment in and the date they
completed the questionnaire. The questionnaire included the Claimed Handicap Scale
discussed above. Participants were asked to respond specifically in relation to the
assignment they just handed in. The questionnaire also included Specc Performance
Expectation measures, where participants were asked to indicate their Expected Grade for
the assignment and the Grade below which they would consider to have failed (see
Appendix B6).
Procedure
In Week 3 of the semester, students enrolled in Educational Psychology at the
University of Tasmania were told of the purpose of the study. They were visited in their
practical class in Week 5 and were given procedural details. Information sheets and
consent forms were handed out. All but one student elected to participate in the study.
Participants were advised that all data would be confidential and that information
would be matched through their student identification numbers. Participants were also
informed that they could withdraw from the study at any time without prejudice.
Participants provided their e-mail addresses (without names) so that correspondence could
be maintained. Participants then completed Package One before leaving the practical class.
The Questionnaires specific to Assignment 1 and 2 due dates were placed on a
table adjacent to where students submitted and collected their assignments. A locked box
46
was provided for completed questionnaires. Participants were sent reminders via e-mail
three days prior to assignment due dates. Reminder notices were also posted where
students submit assignments.
During Week 10 of the semester (half way between due dates for Assignments 1
and 2), participants completed Package Two during practical class and any
concerns/questions regarding the study were discussed. Finally, participant's grades for
Assignments 1 and 2, end of course marks for Educational Psychology and grades for other
psychology courses were obtained from the School of Psychology office with participants'
consent. Contact was maintained via email to encourage continued participation.
Participants were thanked and debriefed upon completion of the study.
Results
Treatment of Data
Exclusion of Data
As it was necessary to limit opportunities for participants to discuss outcomes with
one another and possibly alter their performance expectations, data returns were excluded
from the analyses if questionnaires were dated as completed more than three days after the
due date (N = 2). In addition, data were eliminated if participants rated the Importance of
doing well in psychology (included in the General Performance Expectation measure) as
less than 6 out of 10 (N= 3).
Attrition Rate
As might be expected with a study of this nature, some attrition occurred. Some
participants forgot to complete questionnaires, whilst others missed questions. From the
original 78 participants who completed Package One, 57 participants completed the
47
Questionnaire specific to Assignment I and 2 due dates for Assignment 1. The number was
different again for Assignment 2.
Following Rhodewalt and Fairfield (1991), data were sorted to create three
Dispositional Self-Handicapping groups (Low, Medium and High) based on participant's
scores on the RASH-IL Frequency analyses utilising scores on these items were run to
determine cut off points for three relatively even groups (see Appendix A7). As expected,
the scores for this sample were skewed slightly to the lower end of the scale with a
minimum value of 19 and a maximum value of 64. Participants with scores ranging from
19 to 31 were classified as Low Dispositional Self-handicappers (N = 20), while
participants with scores ranging from 32 to 37 were classified as Medium Dispositional
Self-handicappers (N = 18) and those participants with scores ranging from 38 to 64 were
classified as High Dispositional Self-handicappers (N = 19).
Analysis Strategy
Given the attrition rate in this study, and the need to utilize as much data as
possible, it was necessary for one-way ANOVAs to be performed on each dependent
variable where MANOVAs might otherwise have been used. In each case, unless
otherwise stated, one-way ANOVAs were performed with the Dispositional Self-
Handicapping group (Low, Medium or High) as the independent variable. Where tests of
homogeneity were non-significant, Tukey HSD post-hoc tests were performed. Where tests
of homogeneity were significant, Dunnett's T3 post-hoc tests were performed. In the
majority of cases, the Medium Self-handicapping group means fell in between those of the
High and Low Self-handicapping groups. Consequently, for purposes of simplicity, post-
hoc tests incorporating the Medium Self-handicapping group were reported only if the
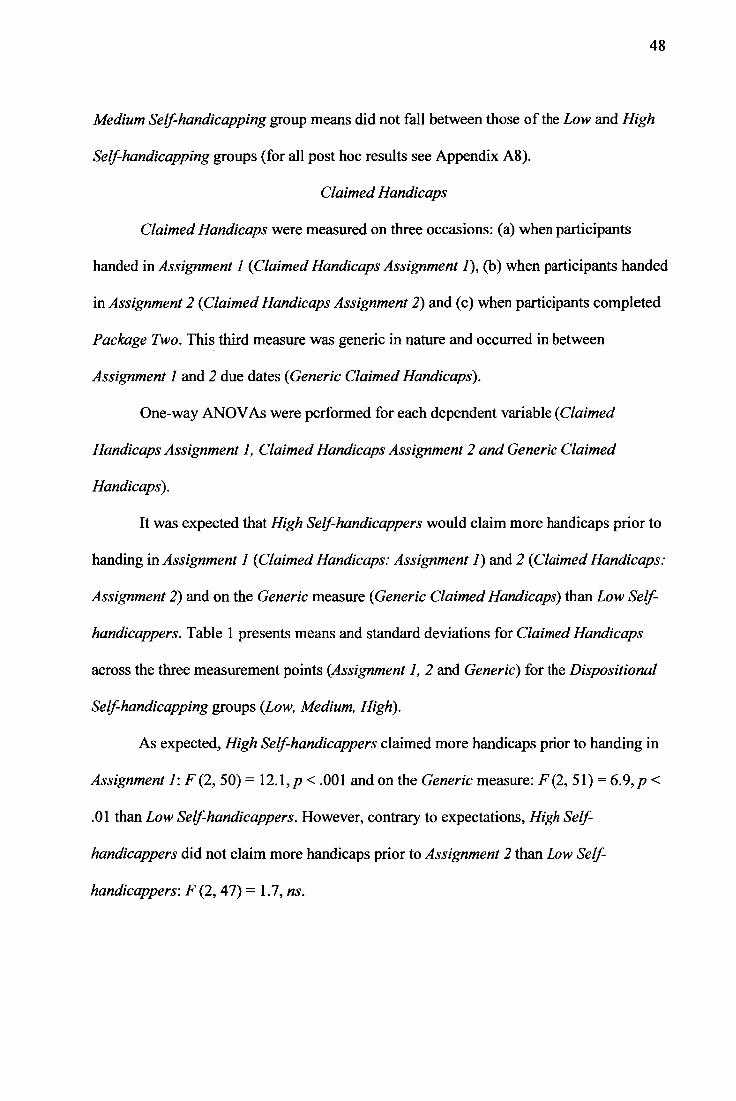
48
Medium Self-handicapping group means did not fall between those of the Low and High
Self-handicapping groups (for all post hoc results see Appendix A8).
Claimed Handicaps
Claimed Handicaps were measured on three occasions: (a) when participants
handed in Assignment I (Claimed Handicaps Assignment /), (b) when participants handed
in Assignment 2 (Claimed Handicaps Assignment 2) and (c) when participants completed
Package Two. This third measure was generic in nature and occurred in between
Assignment 1 and 2 due dates (Generic Claimed Handicaps).
One-way ANOVAs were performed for each dependent variable (Claimed
Handicaps Assignment 1, Claimed Handicaps Assignment 2 and Generic Claimed
Handicaps).
It was expected that High Self-handicappers would claim more handicaps prior to
handing in Assignment I (Claimed Handicaps: Assignment 1) and 2 (Claimed Handicaps:
Assignment 2) and on the Generic measure (Generic Claimed Handicaps) than Low Self-
handicappers. Table 1 presents means and standard deviations for Claimed Handicaps
across the three measurement points (Assignment 1, 2 and Generic) for the Dispositional
Self-handicapping groups (Low, Medium, High).
As expected, High Self-handicappers claimed more handicaps prior to handing in
Assignment 1: F (2, 50) = 12.1, p < .001 and on the Generic measure: F (2, 51) = 6.9, p <
.01 than Low Self-handicappers. However, contrary to expectations, High Self-
handicappers did not claim more handicaps prior to Assignment 2 than Low Self-
handicappers: F (2, 47) = 1.7, ns.
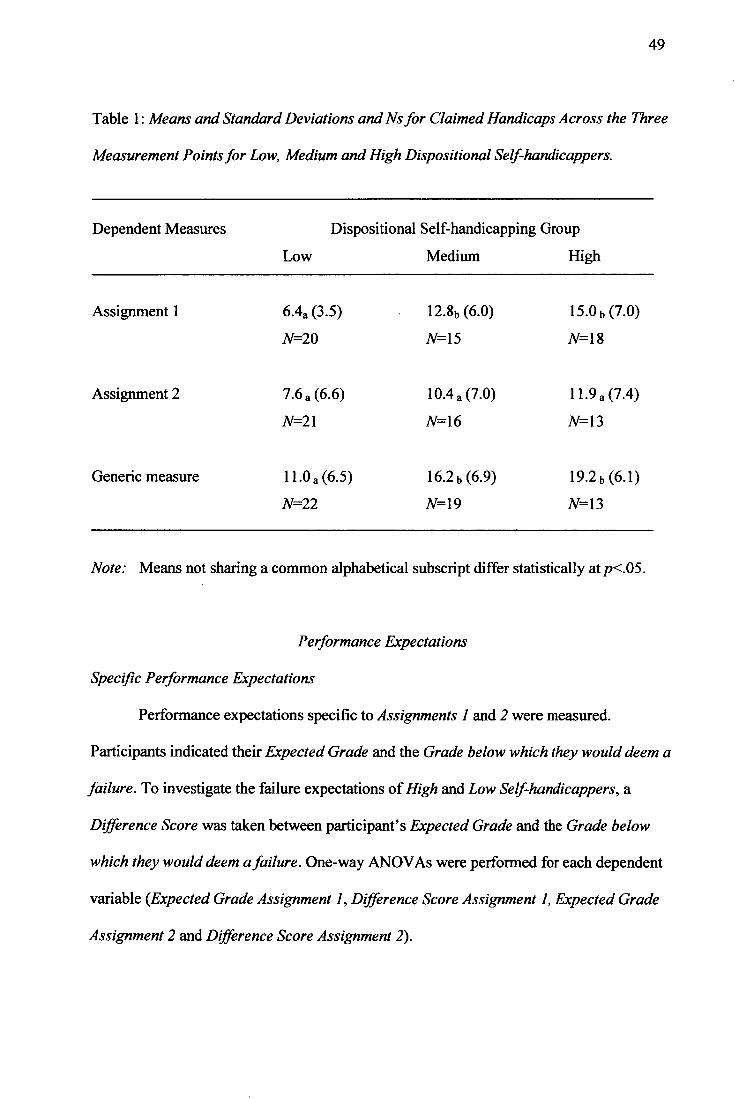
49
Table 1: Means and Standard Deviations and Ns for Claimed Handicaps Across the Three
Measurement Points for Low, Medium and High Dispositional Self-handicappers.
Dependent Measures Dispositional Self-handicapping Group
Low Medium High
Assignment 1 6.4a (3.5) 12•8b (6.0) 15.0 b (7.0)
N=20 N=15 N=18
Assignment 2 7.6 a (6.6) 10.4 a (7.0) 11.9 a (7.4)
N=21 N=16 N=13
Generic measure 11.0 a (6.5) 16.2 b (6.9) 19.2 b (6.1)
N=22 N=19 N=13
Note: Means not sharing a common alphabetical subscript differ statistically at p<.05.
Performance Expectations
Specific Performance Expectations
Performance expectations specific to Assignments 1 and 2 were measured.
Participants indicated their Expected Grade and the Grade below which they would deem a
failure. To investigate the failure expectations of High and Low Self-handicappers, a
Difference Score was taken between participant's Expected Grade and the Grade below
which they would deem a failure. One-way ANOVAs were performed for each dependent
variable (Expected Grade Assignment 1, Difference Score Assignment 1, Expected Grade
Assignment 2 and Difference Score Assignment 2).
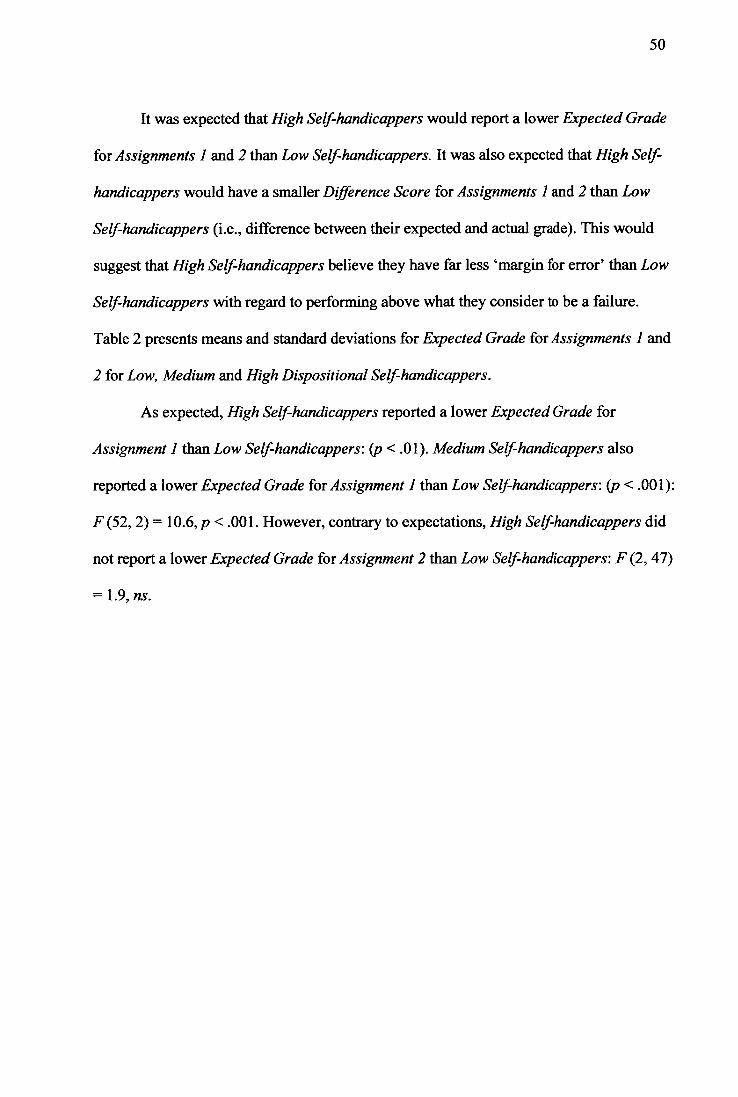
50
It was expected that High Self-handicappers would report a lower Expected Grade
for Assignments 1 and 2 than Low Self-handicappers. It was also expected that High Self-
handicappers would have a smaller Difference Score for Assignments 1 and 2 than Low
Self-handicappers (i.e., difference between their expected and actual grade). This would
suggest that High Self-handicappers believe they have far less 'margin for error' than Low
Self-handicappers with regard to performing above what they consider to be a failure.
Table 2 presents means and standard deviations for Expected Grade for Assignments 1 and
2 for Low, Medium and High Dispositional Self-handicappers.
As expected, High Self-handicappers reported a lower Expected Grade for
Assignment 1 than Low Self-handicappers: (p < .01). Medium Self-handicappers also
reported a lower Expected Grade for Assignment 1 than Low Self-handicappers: (p < .001):
F (52, 2) = 10.6, p < .001. However, contrary to expectations, High Self-handicappers did
not report a lower Expected Grade for Assignment 2 than Low Self-handicappers: F (2, 47)
= 1.9, ns.
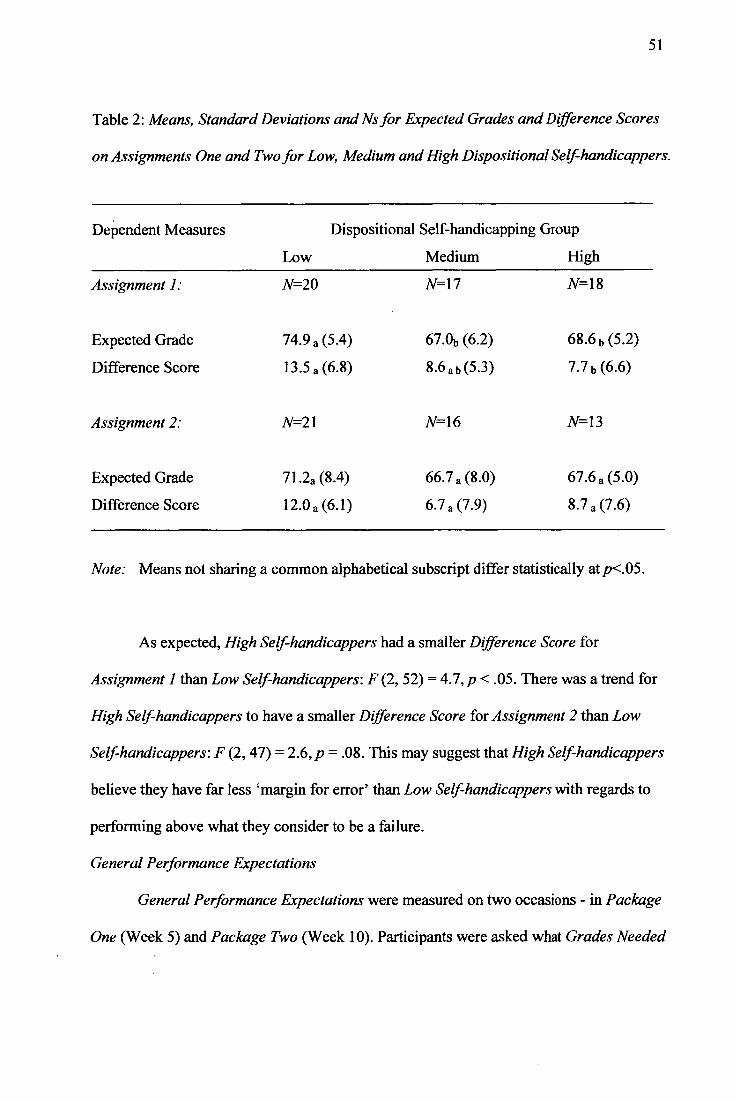
51
Table 2: Means, Standard Deviations and Ns for Expected Grades and Difference Scores
on Assignments One and Two for Low, Medium and High Dispositional Self-handicappers.
Dependent Measures Dispositional Self-handicapping Group
Low Medium High
Assignment I : N=20 N=17 N=18
Expected Grade 74.9 a (5.4) 67.0b (6.2) 68.6 b (5.2)
Difference Score 13.5 a (6.8) 8.6 a b (5.3) 7.7 b (6.6)
Assignment 2: N=21 N=16 N=13
Expected Grade 71.2a (8.4) 66.7 a (8.0) 67.6 a (5.0)
Difference Score 12.0 a (6.1) 6.7 a (7.9) 8.7 a (7.6)
Note: Means not sharing a common alphabetical subscript differ statistically at p<.05.
As expected, High Self-handicappers had a smaller Difference Score for
Assignment 1 than Low Self-handicappers: F (2, 52) = 4.7, p < .05. There was a trend for
High Self-handicappers to have a smaller Difference Score for Assignment 2 than Low
Self-handicappers: F (2,47) = 2.6,p = .08. This may suggest that High Self-handicappers
believe they have far less 'margin for error' than Low Self-handicappers with regards to
performing above what they consider to be a failure.
General Performance Expectations
General Performance Expectations were measured on two occasions - in Package
One (Week 5) and Package Two (Week 10). Participants were asked what Grades Needed
52
to achieve to reach their goals and the Likelihood of achieving these grades. One-way
ANOVAs were performed for each dependent variable: Grades Needed (Week 5), Grades
Needed (Week 10), Likelihood (Week 5) and Likelihood (Week 10).
It was expected that there would be no difference between High and Low Self-
handicappers for the Grade Needed in Weeks 5 and 10. It was also expected that High
Self-handicappers would report less Likelihood of achieving the grades needed in Weeks 5
and 10 than Low Self-handicappers.
As expected, there was no difference between High and Low Self-handicappers for
Grade Needed in Week 5: F (2, 71) = .07, ns or Week 10: F (2, 53) = .46, ns. Also as
expected, High Self-handicappers reported less Likelihood of achieving the grades needed
to realize their goals than Low Self-handicappers in Week 5: F (2, 71) = 9.0, p < .001 and
Week 10: F (2, 53) = 5.1, p < .01. Table 3 presents means and standard deviations for
Grade Needed and Likelihood in Weeks 5 and 10 for Low, Medium and High Dispositional
Self-handicappers.
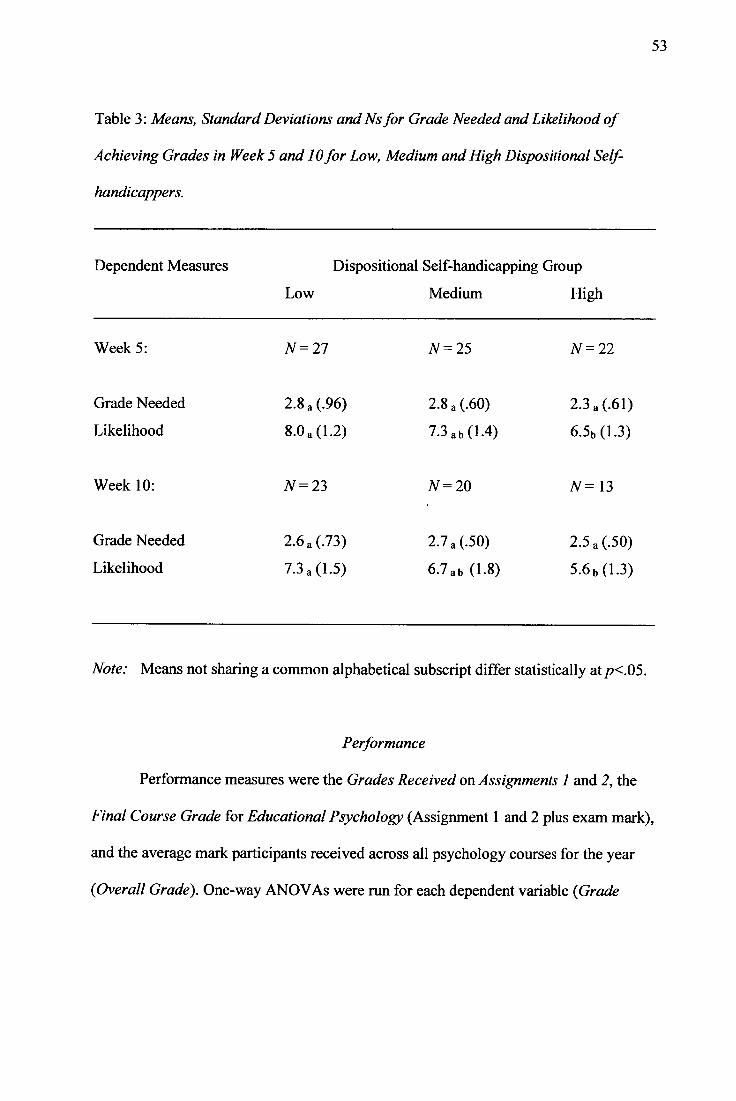
Table 3: Means, Standard Deviations and Ns for Grade Needed and Likelihood of
Achieving Grades in Week 5 and 10 for Low, Medium and High Dispositional Self-
handicappers.
Dependent Measures Dispositional Self-handicapping Group
Low Medium High
Week 5: N = 27 N = 25 N = 22
Grade Needed 2.8 a (.96) 2.8 a (.60) 2.3 a (.61)
Likelihood 8.0 a (1.2) 7.3 a b (1.4) 6.5b (1.3)
Week 10: N = 23 N = 20 N = 13
Grade Needed 2.6 a (.73) 2.7 a (.50) 2.5 a (.50) Likelihood 7.3 a (1.5) 6.7 a b (1.8) 5.6 b (1.3)
Note: Means not sharing a common alphabetical subscript differ statistically at p<.05.
Performance
Performance measures were the Grades Received on Assignments 1 and 2, the
Final Course Grade for Educational Psychology (Assignment 1 and 2 plus exam mark),
and the average mark participants received across all psychology courses for the year
(Overall Grade). One-way ANOVAs were run for each dependent variable (Grade
53
54
Received Assignment 1, Grade Received Assignment 2, Final Course Grade and Overall
Grade).
It was expected that High Self-handicappers would achieve a lower grade on
Assignments 1 and 2, the Final Course Grade and Overall Grade than Low Self-
handicappers.
Table 4 presents means and standard deviations for Grade Received for
Assignments 1 and 2, Final Course Grade and Overall Grade for Low, Medium and High
Self-handicappers. Contrary to expectation, there were no differences between High and
Low Self-handicappers for Grade Received for Assignment 1: F (2, 68) = 1.4, ns,
Assignment 2: F (2, 69) = .96, ns, or Final Course Grade: F (2, 69) = 3.1, ns. Similarly,
High Self-handicappers did not obtain a lower Overall Grade than Low Self-handicappers:
F (2, 70) = 2.2, ns. Medium Self-handicappers obtained higher Final Course Grades than
High Self-handicappers (p < .05) and consistently obtained higher grades than both High
and Low Self-handicappers across all other measures, however, not significantly so.
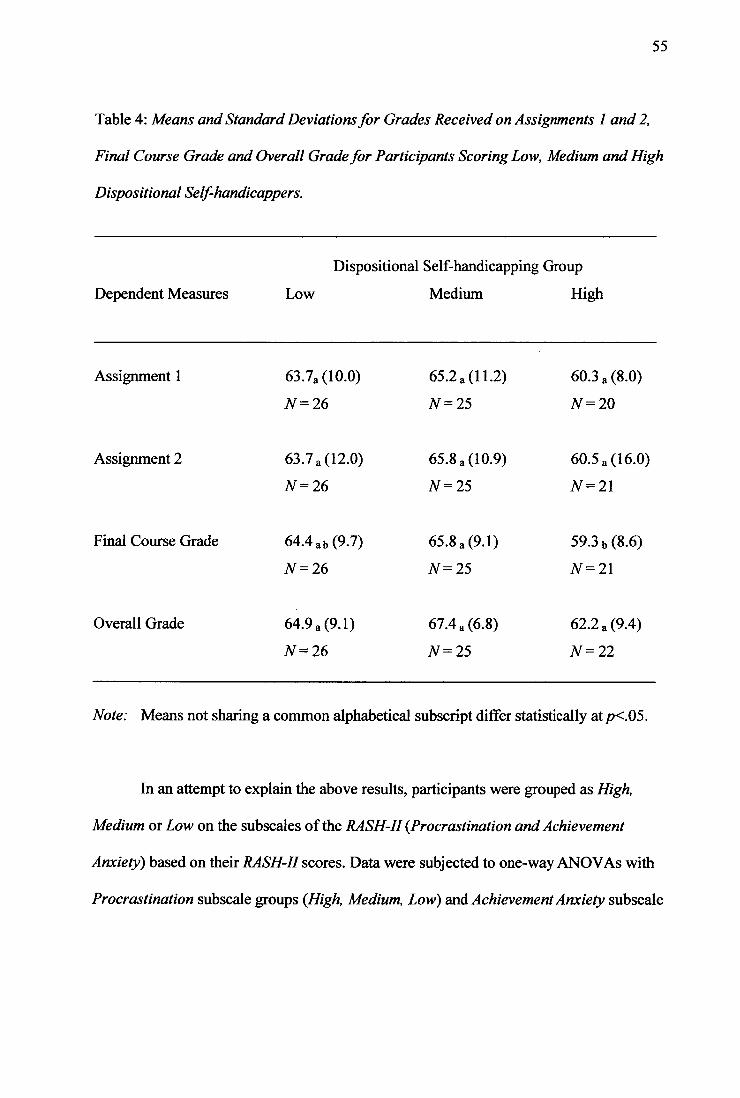
55
Table 4: Means and Standard Deviations for Grades Received on Assignments I and 2,
Final Course Grade and Overall Grade for Participants Scoring Low, Medium and High
Dispositional Self-handicappers.
Dependent Measures
Dispositional Self-handicapping Group
Low Medium High
Assignment 1 63.7a (10.0) 65.2 a (11.2) 60.3 a (8.0)
N = 26 N = 25 N = 20
Assignment 2 63.7 a (12.0) 65.8 a (10.9) 60.5 a (16.0)
N = 26 N = 25 N = 21
Final Course Grade 64.4 a b (9.7) 65.8 a (9.1) 59.3 b (8.6)
N = 26 N = 25 N = 21
Overall Grade 64.9 a (9.1) 67.4 a (6.8) 62.2 a (9.4)
N = 26 N = 25 N = 22
Note: Means not sharing a common alphabetical subscript differ statistically at p<.05.
In an attempt to explain the above results, participants were grouped as High,
Medium or Low on the subscales of the RASH-II (Procrastination and Achievement
Anxiety) based on their RASH-II scores. Data were subjected to one-way ANOVAs with
Procrastination subscale groups (High, Medium, Low) and Achievement Anxiety subscale

56
groups (High, Medium, Low) as independent variables maintaining the same dependent
measures reported above.
Those who scored High on the Procrastination subscale received lower Grades for
Assignment I: F (2, 68) = 4.2,p < .05, Final Course Grade: F (2, 69) = 7.9,p < .001 and
Overall Grade: F (2, 70) = 4.6, p < .05 than those who scored Low on the Procrastination
subscale (see Table 5). There was also a trend for those who scored High on the
Procrastination subscale to receive lower Grades for Assignment 2: F (2, 69) = 2.9, p =
.058. There were no differences between those who scored High or Low on the
Achievement Anxiety subscale on any of the Performance measures (see Appendix A9).
This suggests that the Procrastination component of dispositional self-handicapping that
contributes to poorer performance and that the Achievement Anxiety component on its own
has no impact on performance.
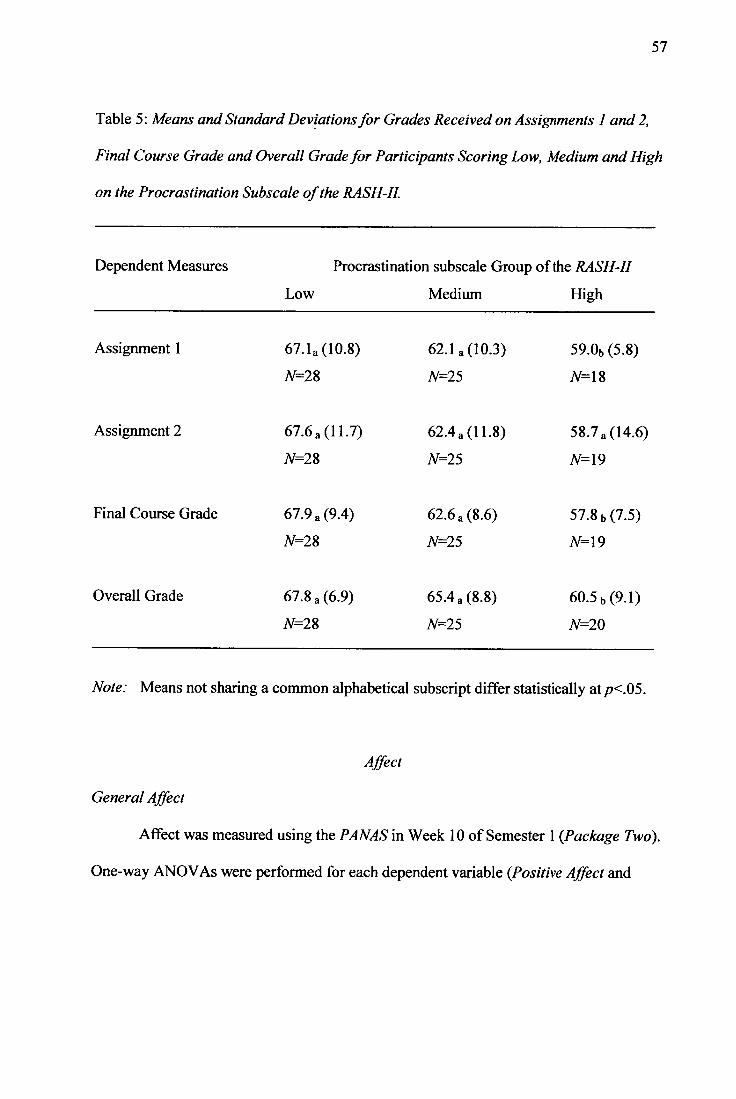
57
Table 5: Means and Standard Deviations for Grades Received on Assignments 1 and 2,
Final Course Grade and Overall Grade for Participants Scoring Low, Medium and High
on the Procrastination Subscale of the RASH-IL
Dependent Measures Procrastination subscale Group of the RASH-II
Low Medium High
Assignment 1 67.1 a (10.8) 62.1 a (10.3) 59•0b (5.8)
N=28 N=25 N=18
Assignment 2 67.6 a (11.7) 62.4 a (11.8) 58.7 a (14.6)
N=28 N=25 N=19
Final Course Grade 67.9 a (9.4) 62.6 a (8.6) 57.8 b (7.5)
N=28 N=25 N=19
Overall Grade 67.8 a (6.9) 65.4 a (8.8) 60.5 b (9.1)
N=28 N=25 N=20
Note: Means not sharing a common alphabetical subscript differ statistically at p<.05.
Affect
General Affect
Affect was measured using the PANAS in Week 10 of Semester 1 (Package Two).
One-way ANOVAs were performed for each dependent variable (Positive Affect and
58
Negative Affect). It was expected that High Self-handicappers would report higher levels of
Negative Affect and lower levels of Positive Affect than Low Self-handicappers.
As expected, High Self-handicappers reported higher levels of Negative Affect than
Low Self-handicappers: High; N= 13, M = 28.7, SD = 7.6; Low: N = 22, M = 17.9, SD =
6.5: F (2, 51) = 10.8,p < .001. Contrary to expectations, High Self-handicappers did not
report lower levels of Positive Affect than Low Self-handicappers: High; N = 13, M = 26.4,
SD= 6.6; Low: N= 22, M= 30.0, SD= 6.7: F (2, 51) = 1.2, ns.
Positive Motivation
Positive Motivation in relation to academic studies was measured in Week 10
(Package Two). A one-way ANOVA was performed. It was expected that High Self-
handicappers would report less Positive Motivation in relation to academic studies than
Low Self-handicappers.
Contrary to expectation, High Self-handicappers (N= 13, M= 8.5, SD = 2.3) did
not report less Positive Motivation in relation to academic studies than Low Self-
handicappers: N= 22, M= 10.3, SD = 3.3: F (2, 51) = 1.5, ns.
Discussion
The present study examined the relationship between dispositional academic self-
handicapping and claimed handicaps, performance expectations, performance and affect in
a naturalistic context. The results show that the RASH-II is a reliable predictor of claimed
handicaps in academic contexts. The results also show that high dispositional academic
self-handicappers, as measured by the RASH-II, believe they are less likely to achieve the
grades they need in order to realise their goals, despite needing the same grades as low
dispositional self-handicappers. The results suggest that they believe they have far less
59
"margin for error" with regard to performing above what they consider to be a failure and
there was some support for high dispositional self-handicappers to expect to perform more
poorly than low dispositional self-handicappers on assignments. Despite these
expectations, there was limited evidence to suggest that high dispositional self-
handicappers performed more poorly than low dispositional self-handicappers. Higher
levels of negative affect were evident for high dispositional self-handicappers, however
there were no differences between self-handicapping groups for positive affect or positive
motivation.
Predictive Validity of the RASH-II
In addition to conducting Study 1 in which the psychometric properties of the
RASH-II were investigated, an aim of Study 2 was to investigate the predictive validity of
the RASH-II in an academic setting. To this end, it was expected that High Self-
handicappers would report more Claimed Handicaps prior to handing in Assignment 1, 2
and on the Generic Claimed Handicaps measure than Low Self-handicappers. These
expectations were supported for Assignment 1 and the Generic Claimed Handicaps
measure, however this was not the case for Assignment 2. Although the pattern of
responses was in the direction expected, it is possible that the decrease in the number of
participants in the High Self-handicapping group from Assignment 1 to Assignment 2
contributed to the lack of a significant difference in Claimed Handicaps between self-
handicapping groups for Assignment 2. These results are consistent with the results of
Murray and Warden's (1992) study that showed the Academic Self-Handicapping
Questionnaire (ASHQ: from which the RASH and consequently, the RASH-II is derived)
60
was predictive of self-handicapping strategies such as reduction in effort. The results show
that the RASH-II has good predictive validity in academic contexts.
Performance Expectations
Despite Low and High Self-handicappers reporting they needed the same grades to
achieve their future goals, High Self-handicappers reported that they were less likely to be
able to achieve these grades than Low Self-handicappers. Similarly, for Assignment 1, they
expected to perform more poorly than Low Self-handicappers. In addition, results indicated
that High Self-handicappers believe they have far less "margin for error" with regard to
performing above what they consider to be a failure than Low Self-handicappers. These
results contradict research by Feick and Rhodewalt (1997), Rhodewalt and Hill (1995) and
McCrea and Hirt (2001) who found no such differences in performance expectations for
High and Low Self-handicappers. However, these researchers used the SHS as their
measurement of dispositional academic self-handicapping, as opposed to a measure
specifically designed for academic contexts. Yet Murray and Warden (1992) used the
ASHQ in their study and found that High Self-handicappers expected to perform more
poorly than Low Self-handicappers on an upcoming exam-results consistent with findings
of the present study.
Thus, it can be concluded that High Self-handicappers carry uncertain self-images
and consequently doubt their ability to achieve a successful outcome. Much research has
focussed on the manipulation of uncertainty concerning future performance and uncertain
self-images. The present research shows that even without such manipulation and in a
naturalistic context, High Self-handicappers carry doubts about their ability and that these
doubts are evidenced across a variety of assessment situations.
61
Performance
Research suggests that dispositional self-handicappers perform poorly as a result of
chronic self-handicapping (Beck et al., 2000; Eronen et al., 1998; Martin et al., 2001;
Midgley et al., 1996; Midgley & Urdan, 1995; Murray & Warden, 1992; Nurmi et al.,
1995; Urdan et al., 1998; Zuckerman et al., 1998). Thus, it was expected that High Self-
handicappers would perform more poorly than Low Self-handicappers for Assignments 1,
2, Final Course Grade and Overall Grade. However, results suggested that High Self-
handicappers performed equally to Low Self-handicappers across all four measures. This
supports research by Feick and Rhodewalt (1997), Rhodewalt and Hill (1995) and Wesley
(1994) who also failed to fmd any differences in performance as a function of dispositional
self-handicapping.
McCrea and Hirt (2001) suggest that performance may be affected by dispositional
self-handicapping only when claiming certain handicaps and not others. They found that
performance was affected after claims of poor test preparation, however not after claims of
stress. It is possible that claims such as poor test preparation are accurate appraisals of
behavioural handicaps employed by dispositional handicappers. By virtue of its inherent
nature, this type of handicap is likely to affect performance. However, stress may be less
likely to directly affect performance. This may explain the fmdings that Medium Self-
handicappers performed better than both Low and High Self-handicappers. It is possible
that the self-handicapping strategies employed by the Medium group differed to those in
the other groups. It would be interesting to investigate the types of handicaps employed by
various groups of dispositional self-handicappers. This would be a new an innovative step
in future self-handicapping research.
62
To investigate further the performance effects of dispositional self-handicapping,
participants were grouped according to their scores on the two subscales of the RASH-II:
Procrastination and Achievement Anxiety. Based on the research previously noted, it was
expected that participants high on the Procrastination subscale would perform more poorly
on all measures than those who scored low. However, no differences were expected
between Achievement Anxiety groups.
Results confirmed that those participants who scored high on the Procrastination
subscale received lower grades across measurements than those who scored low on the
Procrastination subscale. As expected, there were no differences between Achievement
Anxiety groups on any of the performance measures. These results support research by
Wesley (1994) who showed that self-handicapping and procrastination overlap in the
portion of variance accounted for in Grade Point Average and suggest that it is the more
active forms of self-handicapping that dispositional self-handicappers employ over a
period of time that affect performance. Research that differentiates dispositional self-
handicappers according to their preferences for particular handicaps is likely to provide
further insight into the effects of dispositional self-handicapping on performance.
Affect
Research on dispositional self-handicapping has seldom used a comprehensive
measurement of affect such as the Positive and Negative Affect Scale (PANAS: Watson &
Clarke, 1984). Consequently, the PANAS was used in the present study and it was expected
that High Self-handicappers would report lower levels of positive affect and higher levels
of negative affect than Low Self-handicappers. In addition, it was expected that High Self-
handicappers would report lower levels of positive motivation than Low Self-
63
handicappers. The results showed that High Self-handicappers reported higher levels of
Negative Affect, however there were no differences between self-handicapping groups for
Positive Affect or Positive Motivation. These results are consistent with Zuckerman et al.,
(1998) who also used the PANAS. They found that higher levels of dispositional self-
handicapping at one point in time (as measured by the SHS) resulted in lower Negative
Affect over time, however there were no changes in Positive Affect over time.
Negative Affect is a general dimension of subjective distress that includes a variety
of aversive mood states such as anger, contempt, disgust, guilt, fear and nervousness
(Watson et al., 1988). Negative Affect has been shown to correspond with the dominant
personality factors of anxiety/neuroticism, which in turn have also been shown to predict
self-handicapping (Ross et al., 2002) and is related to self-reported distress and poor
coping (Clarke & Watson, 1986, cited in Clark & Watson, 1988; Wills, 1986) and
measures of depression (Watson et al.). Thus, it can be suggested that despite possible
short-term affective gains, dispositional self-handicappers exhibit negative affect over
time, which is suggestive of distress, poor coping and possible depression.
GENERAL DISCUSSION
Study 1 provided preliminary evidence that the Revised Academic Self-
Handicapping Scale-II is a psychometrically sound instrument that has good reliability and
validity, however further studies with a larger sample and utilising confirmatory factor
analytical procedures are recommended. The results also suggest that the RASH-II may be
beneficial in helping to identify whether people tend to self-handicap in academic
situations by engaging in procrastination behaviours and by utilising anxiety-based
performance deficit explanations of their performance. The RASH-H has marginally
64
stronger relationships with other academic constructs than the SHS. Finally, it carries an
additional benefit in being a domain specific measure.
Study 2 examined the relationship between dispositional academic self-
handicapping and claimed handicaps, performance expectations, performance and affect in
a naturalistic context. The results show that the RASH-II is a reliable predictor of claimed
handicaps in academic contexts. The results also show that high dispositional academic
self-handicappers, as measured by the RASH-II, believe that despite needing the same
grades as low dispositional self-handicappers in order to realise their goals, they are less
likely to achieve these grades. The results also suggest that they believe they have far less
"margin for error" with regards to performing above what they consider to be a failure.
There was some support for high dispositional self-handicappers to expect to perform more
poorly than low dispositional self-handicappers on assignments. Although high self-
handicappers expected this to be the case, there was limited evidence to suggest that they
performed more poorly than low dispositional self-handicappers. High dispositional self-
handicappers evidenced higher levels of negative affect, however there were no differences
between self-handicapping groups for positive affect or positive motivation.
Limitations of the Study
The attrition rate in study 2 did not enable repeated measures analyses of data to
obtain information about changes in self-handicapping behaviour over time. In addition,
some analyses were performed with unequal cell numbers as a result of the attrition rate.
To date, the only methods that have been used to measure self-handicapping in
longitudinal contexts are questionnaire-based assessments. These questionnaires have
focussed on providing people with the opportunity to claim handicaps, without assessing
65
whether people actually engage in these behaviours and for what purpose. Midgley and
Urdan (2001) suggest that a combination of methods should be used to assess self-
handicapping strategies such as observations, surveys and interviews. The present study
used a questionnaire-based method of assessing self-handicapping behaviour and might
have benefited from additional self-handicapping measurement strategies. As a limited
number of participants in Study 2 scored at the extreme high end of the RASH-IL the
sample was skewed at the lower end of the self-handicapping spectrum. Thus, the results
reflect high self-handicapping individuals relative only to the specific sample, not relative
to the general population.
Given the design of the study, it is not possible to establish cause and effect. It is
possible, for example, that chronic self-handicapping does not lead to negative affect, but
that individuals who report more negative affect are more likely to self-handicap.
However, research has suggested that self-handicapping is cyclical in nature and that self-
handicapping results in poor adjustment over time and that poor adjustment results in
further self-handicapping (Zuckerman et al., 1998; Eronen et al., 1998; Murray & Warden,
1992).
Directions for Further Research
Study 1 provided preliminary evidence that the RASH-II is a psychometrically
sound instrument for the measurement of academic self-handicapping. Future research
might attempt to provide additional evidence for the continued use of the RASH-IL In
addition, future research might focus on utilising the two subscales of the RASH-II
(Procrastination and Achievement Anxiety). Study 2 showed that high dispositional self-
handicappers claim more handicaps, report that they expect to perform more poorly, and
66
report more negative affect than low self-handicappers when they are faced with real life
assessment situations that are relevant to their real life goals. Research that investigates the
longer-term effects of self-handicapping behaviour whilst still grounded in real life
contexts would shed more light on the contextual and individual factors that affect self-
handicapping. Research that has focussed on the longer-term effects of self-handicapping
has simply used questionnaire based assessments at three or four points in time, without
specific assessments of self-handicapping behaviour as it occurs in response to real life
academic assessment situations. Research that uses a variety of self-handicapping
measurement strategies will be able to provide a clearer interpretation of the effects of self-
handicapping. In addition, a new innovative step in the self-handicapping research would
involve the investigation of the types of handicaps employed by various groups of
dispositional self-handicappers (such as low, medium and high).
Conclusion
Research has suggested that specific academic self-handicapping assessment tools
be used over the more generic tools that are currently available. This study provided
preliminary psychometric support for the use of the RASH-II in the measurement of
academic self-handicapping. However, further studies with a larger sample and utilising
confirmatory factor analysis procedures are required. The detrimental effects of chronic
academic self-handicapping and the performance attitudes of chronic self-handicappers
have also been demonstrated within a context in which real life goals are salient and
competition for high grades is a priority.
In terms of performance expectations, individuals who chronically self-handicap
expect to perform more poorly on upcoming assignments than those who don't and
67
consequently claim more handicaps. However, they do not necessarily perform more
poorly on assignments and exams.
When investigated further, individuals who scored high on the procrastination
component of the self-handicapping scale (RASH-II), suggesting the use of behavioural
self-handicapping strategies, performed more poorly than those who scored low on this
scale. The study supports research highlighting the link between chronic self-handicapping
and negative affect, but not positive affect or motivation. The use of the PANAS also
enabled the suggestion of a link between chronic self-handicapping and poor general well-
being, depressive affect and poor coping. Understanding the attitudes of chronic self-
handicappers and the detrimental effects of chronic self-handicapping has implications for
educating these individuals on the importance of having more adaptive attitudes and using
more adaptive strategies throughout their university studies.
68
References
Adams, M., & Adams, J. (1991). Life events, depression, and perceived problem solving
alternatives in adolescents. Journal of Child Psychology and Psychiatry, 32, 811-
820.
Arkin, R. M., & Baumgardner, A. H. (1985). Self-handicapping. In J. H. Harvey, & G.
Weary, (Eds.)., Attribution: Basic issues and applications (pp. 169-202). New
York: Academic Press.
Aunola, K., Stattin, H., & Nurmi, J. (2000a). Adolescents' achievement strategies,
school adjustment, and externalising and internalising problem behaviors. Journal
of Youth and Adolescence, 29, 289-306.
Aunola, K., Stattin, H., & Nurmi, J. (2000b). Parenting styles and adolescents'
achievement strategies. Journal of Adolescence, 23, 205-222.
Bandura, A. (1977). Self-efficacy: Toward a unifying theory of behavioral change.
Psychological Review, 84, 191-215.
Baumeister, R. F., Hamilton, J. C., & Tice, D. M. (1985). Public versus private expectancy
of success: Confidence booster or performance pressure? Journal of Personality
and Social Psychology, 48, 1447-1457.
Baumeister, R. F., & Showers, C. J. (1986). A review of paradoxical performance effects:
Choking under pressure in sports and mental tests. European Journal of Social
Psychology, 16, 361-383.
69
Beck, B. L., Koons, S. R., & Milgrim, D. L. (2000). Correlates and consequences of
behavioral procrastination: The effects of academic procrastination, self
consciousness, self-esteem and self-handicapping Journal of Social Behavior and
Personality, 15, 3-13.
Beiser, M. (1974). Components and correlates of mental well-being. Journal of Health and
Social Behavior, 15, 320-327.
Berglas, S. (1990). Etiological and diagnostic considerations. In R. L. Higgins, C. R.
Snyder, & S. Berglas, (Eds.)., Self-handicapping: The paradox that isn't (pp. 152-
182). New York: Plenum Press.
Berglas, S., & Jones, E. E. (1978). Drug choice as a self-handicapping strategy in response
to noncontingent success. Journal of Personality and Social Psychology, 36, 405-
417.
Carver, C. S., & Ganellen, R. J. (1983). Depression and components of self-punitiveness:
High standards, self-criticism, and overgeneralization. Journal ofAbnormal
Psychology, 92, 330-337.
Chrisman, S. M., Pieper, W. A., Clance, P. R., Holland, C. L., & Glickauf-Hughes, C.
(1995). Validation of the dance impostor phenomenon scale. Journal of
Personality Assessment, 65, 456-467.
Clance, P. R. (1985). The impostor phenomenon: Overcoming the fear that haunts your
success. Atlanta, GA: Peachtree.
Clark, L. A., & Watson, D. (1988). Mood and the mundane: Relations between daily life
events and self-reported mood. Journal of Personality and Social Psychology, 54,
296-308.
70
Covington M. V. (1984). The self-worth theory of achievement motivation: Findings and
implications. Elementary School Journal, 85, 5-20.
Covington, M. V. (1992). Making the grade: A self-worth perspective on motivation and
school reform. Cambridge, England: Cambridge University Press.
Crocker, J., Cooper, M., & Bouvrette, A. (2003). Contingencies of self-worth in college
students: Theory and measurement. Journal of Personality and Social Psychology,
85, 894-908.
DeGree, C. E., & Snyder, C. R. (1985). Adler's psychology (of use) today: Personal
history of traumatic life events as a self-handicapping strategy. Journal of
Personality and Social Psychology, 48, 1512-1519.
Deppe, R. K., & Harackiewicz, J. M. (1996). Self-handicapping and intrinsic motivation:
Buffering intrinsic motivation from the threat of failure. Journal of Personality and
Social Psychology, 70, 868-876.
Diener, C. I., & Dweck, C. S. (1978). An analysis of learned helplessness: Continuous
changes in performance, strategy, and achievement cognitions following failure.
Journal of Personality and Social Psychology, 36, 451-462.
Drexler, L. P., Ahrens, A. H., & Haaga, D. A. F. (1995). The affective consequences of
self-handicapping. Journal of Social Behavior and Personality, 10, 861-870.
Dweck, C. S. (1986). Motivational processes affecting learning. American Psychologist,
41, 1040-1048.
Edwards, J. A., Weary, G., & Reich, D. A. (1998). Causal uncertainty: Factor structure and
relation to the big five personality factors. Personality and Social Psychology
Bulletin, 24, 451-462.
71
Eronen, S., Nurmi, J., & Salmela-Aro, K. (1998). Optimistic, defensive-pessimistic,
impulsive and self-handicapping strategies in university environments. Learning
and Instruction, 8, 159-177.
Feick, D. L., & Rhodewalt, F. (1997). The double-edged sword of self-handicapping:
Discounting, augmentation and the protection and enhancement of self-esteem.
Motivation and Emotion, 21, 147-163.
Ferrari, J. R. (1991a). Self-handicapping by procrastinators: Protecting self-esteem, social
esteem or both? Journal of Research in Personality, 25, 245-261.
Ferrari, J. R. (1991b). A second look at behavioral self-handicapping among women.
Journal of Behavior and Personality, 6, 195-206.
Ferrari, J. R., & Tice, D. M. (2000). Procrastination as a self-handicap for men and
women: A task-avoidance strategy in a laboratory setting. Journal of Research in
Personality, 34, 73-83.
Frankel, A., & Snyder, M. L. (1978). Poor performance following unsolvable problems:
Learned helplessness or egoism? Journal of Personality and Social Psychology, 36,
1415-1423.
Garcia, T. (1995). The role of motivational strategies in self-regulated learning. New
Directions for Teaching and Learning: Understanding Self-regulated Learning, 63,
29-42.
Greaven, S. H., Santor, D. A., Thompson, R., & Zuroff, D. C. (2000). Adolescent self-
handicapping, depressive affect, and maternal parenting styles. Journal of Youth
and Adolescence, 29, 631-646.
72
Greenberg, J. (1985). Unattainable goal choice as a self-handicapping strategy. Journal of
Applied Social Psychology, 15, 140-152.
Greenberg, J., Pyszczynski, T., & Paisley, C. (1985). Effect of extrinsic incentives on use
of test anxiety as an anticipatory attributional defense: Playing it cool when the
stakes are high. Journal of Personality and Social Psychology, 47, 1136-1145.
Harris, R. N., & Snyder, C. R. (1986). The role of uncertain self-esteem in self-
handicapping. Journal of Personality and Social Psychology, 51, 451-458.
Harris, R. N., Snyder, C. R., Higgins, R. L., & Schrag, J. L. (1986). Enhancing the
prediction of self-handicapping. Journal of Personality and Social Psychology, 51,
1191-1199.
Higgins, R., & Harris, R. (1988). Strategic alcohol use: Drinking to self-handicap. Journal
of Social and Clinical Psychology, 6, 191-202.
Hirt, E. R., Deppe, R. K., & Gordon, L. J. (1991). Self-reported versus behavioral self-
handicapping: Empirical evidence for a theoretical distinction. Journal of
Personality and Social Psychology, 61, 981-991.
Hong, Y., Chiu, C., & Dweck, C. S. (1995). Implicit theories of intelligence:
Reconsidering the role of confidence in achievement motivation. In M. H., Kernis
(Ed.)., Efficacy, Agency and Self-esteem (pp. 197-216). New York: Plenum Press.
Jones, E. E., & Berglas, S. (1978). Control of attributions about the self through self-
handicapping strategies: The appeal of alcohol and the role of underachievement.
Personality and Social Psychology Bulletin, 4, 200-206.
Jung, J. (1991). The relationship of excuses to psychological well-being. Journal of Social
Behavior and Personality, 6, 421-430.
73
Kanner, A. D., Coyne, J. C., Schaefer, C., & Lazarus, R. S. (1981). Comparison of two
modes of stress measurement: Daily hassles and uplifts versus major life events.
Journal of Behavioral Medicine, 4, 1-39.
Kolditz, T. A., & Arkin, R. M. (1982). An impression management interpretation of the
self-handicapping strategy. Journal of Personality and Social Psychology, 43, 492-
502.
Lay, C. H., Knish, S., & Zanatta, R. (1992). Self-handicappers and procrastination: A
comparison of their practice behavior prior to an evaluation. Journal of Research in
Personality, 26, 242-257.
Leary, M. R. (1983). A brief version of the Fear of Negative Evaluation Scale. Personality
and Social Psychology bulletin, 9, 371-375.
Marecek, J., & Mettee, D. R. (1972). Avoidance of continued success as a function of self-
esteem, level of esteem certainty, and responsibility for success. Journal of
Personality and Social Psychology, 22, 98-107.
Marsh, H. W. (1990). Self-Descriptive Questionnaire III Manual. San Antonio, TX: The
Psychological Corporation.
Martin, K.A., & Brawley, L. R. (1999). Is the self-handicapping scale reliable in non-
academic achievement domains? Personality and Individual Differences, 27, 901-
911.
Martin, A. J., Marsh, H. W., & Debus, R. L. (2001). A quadripolar need achievement
representation of self-handicapping and defensive pessimism. American
Educational Research Journal, 38, 583-610.
74
Martin, A. J., Marsh, H. W., & Debus, R. L. (2002). Self-handicapping and defensive
pessimism: A model of self-protection from a longitudinal perspective.
Contemporary Educational Psychology, 28, 1-36.
Mayerson, N. H., & Rhodewalt, F. (1988). Role of self-protective attributions in the
experience of pain. Journal of Clinical Psychology, 6, 203-218.
McCrea, S. M., & Hirt, E. R. (2001). The role of ability judgements in self-handicapping.
Personality and Social Psychology Bulletin, 27, 1378-1389.
McKinley, N., & Hyde, J. (1996). The objectified body consciousness scale: Development
and validation. Psychology of Women Quarterly, 20, 181-215.
Midgley, C., Arunkumar, R., & Urdan, T. C. (1996). "If I don't do well tomorrow, there's
a reason": Predictors of adolescents' use of academic self-handicapping strategies.
Journal of Educational Psychology, 88, 423-434.
Midgley, C., & Urdan, T. (1995). Predictors of middle school students' use of self-
handicapping strategies. Journal of Early Adolescence, 15, 389-411.
Midgley, C., & Urdan, T. (2001). Academic self-handicapping and achievement goals: A
further examination. Contemporary Educational Psychology, 26, 61-75.
Murray, C. B., & Warden, M. R. (1992). Implications of self-handicapping strategies for
academic achievement: A reconceptualization_ The Journal of Social Psychology,
132, 23-37.
Newman, L. S., & Wadas, R. F. (1997). When the stakes are higher: Self-esteem instability
and self-handicapping. Journal of Social Behavior and Personality, 12, 217-233.
Nurmi, J. (1993). Self-handicapping and a failure-trap strategy: A cognitive approach to
problem behaviour and delinquency. Psychiatria Fennica, 24, 75-85.
75
Nurmi, J., Onatsu, T., & Haavisto, T. (1995). Underachievers' cognitive and behavioural
strategies—self-handicapping at school. Contemporary Educational Psychology, 20,
188-200.
Nurmi, J., Salmela-Aro, K., & Ruotsalainen, H. (1994). Cognitive and attributional
strategies among unemployed young adults: A case of the failure-trap strategy.
European Journal of Personality, 8, 135-148.
Petersen, A., Compas, B. E., Brooks-Gunn, J., Stemmler, M., Ey, S., & Grant, K. E.
(1993). Depression in adolescence. American Psychologist, 48, 155-168.
Prapavessis, H., & Grove, J. R. (1998). Self-handicapping and self-esteem. Journal of
Applied Sport Psychology, 10, 175-184.
Pyszczynski, T., & Greenberg, J. (1983). Determinants of reduction in intended effort as
a strategy for coping with anticipated failure. Journal of Research in Personality,
17, 412-422.
Rhodewalt, F. (1990). Self-handicappers. In R. L. Higgins, C. R. Snyder & S. Berglas
(Eds.)., Self-handicapping: The paradox that isn't (pp. 69-106). New York: Plenum
Press.
Rhodewalt, F., & Davison, J. (1986). Self-handicapping and subsequent performance: Role
of outcome valence and attributional certainty. Basic and Applied Social
Psychology, 7, 307-323.
Rhodewalt, F., & Fairfield, M. (1991). Claimed self-handicaps and the self-handicapper:
The relation of reduction in intended effort to performance. Journal of Research in
Personality, 25, 402-417.
76
Rhodewalt, F., & Hill, S. K. (1995). Self-handicapping in the classroom: The effects of
claimed self-handicaps on responses to academic failure. Basic and Applied Social
Psychology, 16, 397-416.
Rhodewalt, F., Saltzman, A. T., & Wittmer, J. (1984). Self-handicapping among
competetive athletes: The role of practice in self-esteem protection. Basic and
Applied Social Psychology, 5, 197-209.
Rijavec, M., & Brdar, I. (1997). Coping with school failure: Development of the school
failure coping scale. European Journal of Education, 12, 37-49.
Ross, S. R., Canada, K. E., & Rausch, M. K. (2002). Self-handicapping and the five factor
model of personality: Mediation between neuroticism and conscientiousness.
Personality and Individual Differences, 32, 1173-1184.
Ryska, T. A. (2002). Effects of situational self-handicapping and state self-confidence on
the physical performance of young participants. The Psychological Record, 52,
461-478.
Sanna, L. J. (1992). Self-efficacy theory: Implications for social facilitation and social
loafing. Journal of Personality and Social Psychology, 62, 774-786.
Sanna, L. J., & Mark, M. M. (1995). Self-handicapping, expected evaluation, and
performance: Accentuating the positive and attenuating the negative.
Organizational Behavior and Human Decision Processes, 64, 84-102.
Sanna, L. J., & Pusecker, P. A. (1994). Self-efficacy, valence of self-evaluation and
performance. Personality and Social Psychology Bulletin, 20, 82-92.
Sanna, L. J., & Shotland, R. L. (1990). Valence of anticipated evaluation and social
facilitation. Journal of Experimental Social Psychology, 26, 82-92.
77
Shepperd, J. A., & Arkin, R. M. (1989). Determinants of self-handicapping: Task
importance and the effects of preexisting handicaps on self-generated handicaps.
Personality and Social Psychology Bulletin, 15, 101-112.
Smith, T. W., Snyder, C. R., & Handelsman, M. M. (1982). On the self-serving function of
an academic wooden leg: Test anxiety as a self-handicapping strategy. Journal of
Personality and Social Psychology, 42, 314-321.
Smith, T. W., Snyder, C. R., & Perkins, S. C. (1983). The self-serving function of
hypochondriacal complaints: Physical symptoms as self-handicapping strategies.
Journal of Personality and Social Psychology, 44, 787-797.
Snyder, C. R. (1990). Self-handicapping processes and sequelae: On the taking of a
psychological dive. In R. L. Higgins, C. R. Snyder, & S. Berglas, (Eds.)., Self-
handicapping: The paradox that isn't (pp. 107-150). New York: Plenum Press.
Snyder, C. R., & Smith, T. W. (1982). Symptoms as self-handicapping strategies: The
virtues of old wine in a new bottle. In G. Weary, & H. L. Mirels, (Eds.).,
Integrations of clinical and social psychology. NY: Oxford University Press.
Snyder, C. R., Smith, T. W., Augelli, R. W., & Ingram, R. E. (1985). On the self-serving
function of social anxiety: Shyness as a self-handicapping strategy. Journal of
Personality and Social Psychology, 48, 970-980.
Snyder, M. L., Smoller, B., Strenta, A., & Frankel, A. (1981). A comparison of egotism,
negativity, and learned helplessness as explanations for poor performance after
unsolvable problems. Journal of Personality and Social Psychology, 40, 24-30.
Stone, A. A. (1981). The association between perceptions of daily experiences and self-
and spouse-rated mood. Journal of Research in Personality, 15, 510-522.
78
Strube, M. J. (1986). An analysis of the self-handicapping scale. Basic and Applied
Social Psychology, 7, 211-224.
Strube, M. J., & Roemmele, L. A. (1985). Self-enhancement, self-assessment and self-
evaluative task choice. Journal of Personality and Social Psychology, 49, 981-993.
Tessler, R., & Mechanic, D. (1978). Psychological distress and perceived health status.
Journal of Health and Social Behavior, 19, 254-262.
Thompson, R., & Zuroff, D. C. (2004). The levels of self-criticism scale: Comparative and
internalized self-criticism. Personality and Individual Differences, 36, 419-430.
Thompson, T. (1993). Characteristics of self-worth protection in achievement behaviour.
British Journal of Educational Psychology, 55, 631-660.
Thompson, T., Davidson, J. A., & Barber, J. G. (1995). Self-worth protection in
achievement motivation: Performance effects and attributional behaviour. Journal
of Educational Psychology, 87, 598-610.
Thompson, T., & Dinnel, D. L. (2004). Construction and initial validation of the Self-
worth Protection Scale. British Journal of Educational Psychology, 73, 89-107.
Thompson, T., & Hepburn, J. (2003). Causal uncertainty, claimed and behavioural self-
handicapping. British Journal of Educational Psychology, 73, 247-266.
Thompson, T., & Muskett, S. (2003). Does priming for mastery goals improve the
performance of students with an entity view of ability? Australian Journal of
Psychology, 55, 64-64.
Thompson, T., & Richardson, A. (2001). Self-handicapping status, claimed self-handicaps
and reduced practice effort following success and failure feedback. British Journal
of Educational Psychology, 71, 151-170.
79
Tucker, J., Vuchinich, R., & Sobell, M. (1981). Alcohol consumption as a self-
handicapping strategy. Journal of Abnormal Psychology, 90, 220-230.
Urdan, T., & Midgley, C. (2001). Academic self-handicapping: What we know, what more
there is to learn. Educational Psychology Review, 13, 115-138.
Urchin,, T., Midgley, C., & Anderman, E. M. (1998). The role of classroom goal structure in
students' use of self-handicapping strategies. American Educational Research
Journal, 35, 101-122.
Warr, P., Barter, J., & Brownbridge, G. (1983). On the independence of positive and
negative affect. Journal of Personality and Social Psychology, 44, 644-651.
Watson, D., & Clark, L. A. (1984). Negative affectivity: The disposition to experience
aversive emotional states. Psychological Bulletin, 96, 465-490.
Watson, D., Clark, L. A., & Tellegen, A. (1988). Development and validation of brief
measures of positive and negative affect: The PANAS scales. Journal of
Personality and Social Psychology, 54, 1063-1070.
Watson, D., & Friend, R. (1969). Measurement of social-evaluative anxiety. Journal of
Consulting and Clinical Psychology, 33, 448-457.
Weary, G., & Edwards, J. A. (1994). Individual differences in causal uncertainty. Journal
of Personality and Social Psychology, 67, 308-318.
Weary, G., & Jacobson, J. A. (1997). Causal uncertainty beliefs and diagnostic information
seeking. Journal of Personality and Social Psychology, 73, 839-848.
Weary, G., & Williams, J. P. (1990). Depressive self-presentation: Beyond self-
handicapping. Journal of Personality and Social Psychology, 58, 892-898.
80
Wesley, J. C. (1994). Effects of ability, higfischool achievement, and procrastinatory
behavior on college performance. Educational and Psychological Measurement,
54, 404-408.
Wills, T. A. (1986). Stress and coping in early adolescence: Relationships to substance
abuse in urban school samples. Health Psychology, 5, 503-529.
Zuckerman, M., Kieffer, S. C., & Knee, C. R. (1998). Consequences of self-handicapping:
Effects on coping, academic performance, and adjustment Journal of Personality
and Social Psychology, 74, 1619-1628.
List of Appendices
Appendix A: Data Analyses
Al: Study 1; ANOVA on Scale Order Variations
A2: Study 1; Factor Analysis of the RASH
A3: Study 1; Item/Item Total Correlations
A4: Study 1; Test-retest Reliability Analysis
A5: Study 1; Internal Consistency Analysis
A6: Study 2; Conversion of Grades Needed to Percentages
A7: Study 2; RASH-II Low, Medium and High Groups
A8: Study 2; Post hoc Analyses
A9: Study 2; Analyses on Achievement Anxiety Subscale for Performance
Measures
Appendix B: Experimental Materials
B1 : RASH-II Scale
B2: General Performance Expectations Measures
B3: Claimed Handicap Scale
B4: Positive Motivation Scale
B5: Claimed Handicap Instructions
B6: Specific Performance Expectation Measures
81
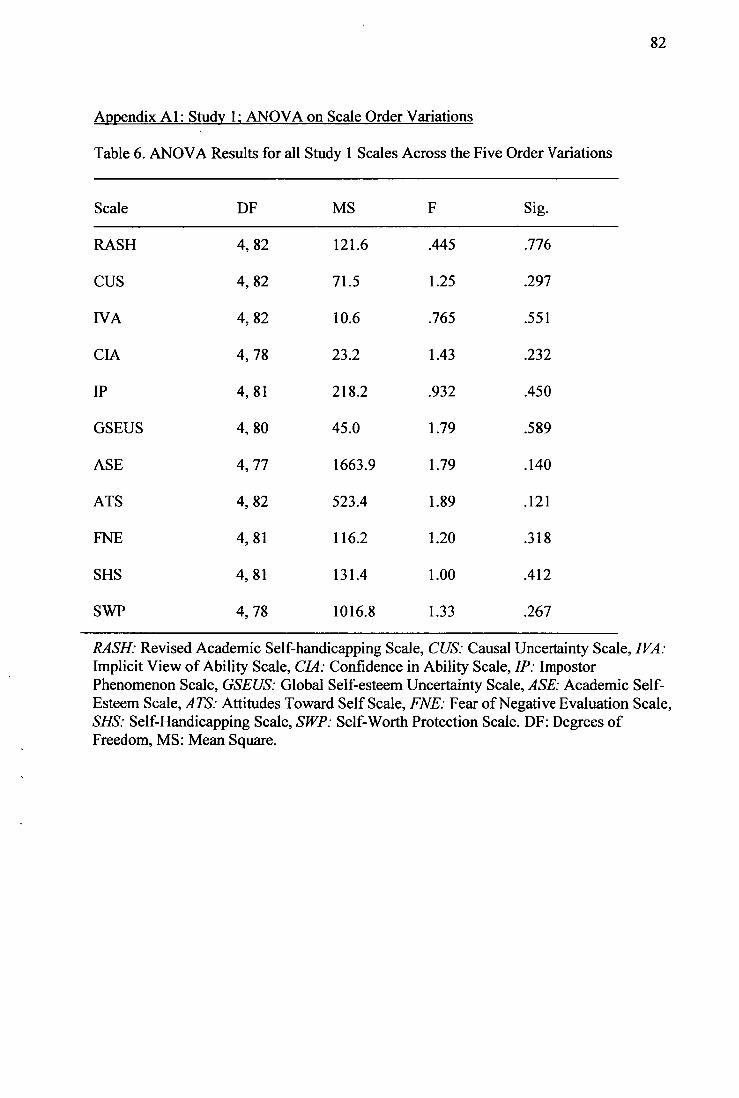
82
Appendix Al: Study 1; ANOVA on Scale Order Variations
Table 6. ANOVA Results for all Study 1 Scales Across the Five Order Variations
Scale DF MS F Sig.
RASH 4,82 121.6 .445 .776
CUS 4, 82 71.5 1.25 .297
WA 4, 82 10.6 .765 .551
CIA 4, 78 23.2 1.43 .232
IP 4, 81 218.2 .932 .450
GSEUS 4, 80 45.0 1.79 .589
ASE 4,77 1663.9 1.79 .140
ATS 4,82 523.4 1.89 .121
FNE 4,81 116.2 1.20 .318
SHS 4,81 131.4 1.00 .412
SWP 4,78 1016.8 1.33 .267
RASH: Revised Academic Self-handicapping Scale, CUS: Causal Uncertainty Scale, IVA: Implicit View of Ability Scale, CIA: Confidence in Ability Scale, IF: Impostor Phenomenon Scale, GSEUS: Global Self-esteem Uncertainty Scale, ASE: Academic Self-Esteem Scale, ATS: Attitudes Toward Self Scale, FNE: Fear of Negative Evaluation Scale, SHS: Self-Handicapping Scale, SWP: Self-Worth Protection Scale. DF: Degrees of Freedom, MS: Mean Square.
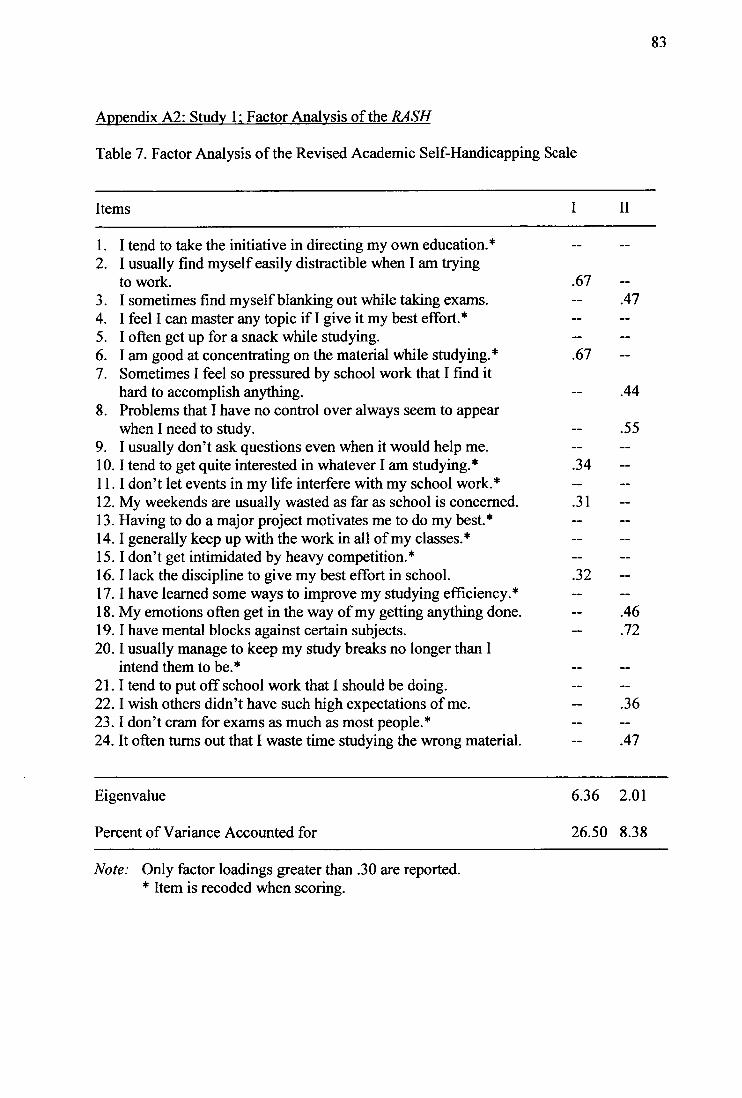
Appendix A2: Study 1; Factor Analysis of the RASH
Table 7. Factor Analysis of the Revised Academic Self-Handicapping Scale
Items I II
83
1. I tend to take the initiative in directing my own education.* 2. I usually find myself easily distractible when I am trying
to work. .67 3. I sometimes find myself blanking out while taking exams. 4. I feel I can master any topic if! give it my best effort.* 5. I often get up for a snack while studying. 6. I am good at concentrating on the material while studying.* .67 7. Sometimes I feel so pressured by school work that I find it
hard to accomplish anything. 8. Problems that I have no control over always seem to appear
when I need to study. 9. I usually don't ask questions even when it would help me. 10. I tend to get quite interested in whatever I am studying.* .34 11. I don't let events in my life interfere with my school work.* 12. My weekends are usually wasted as far as school is concerned. .31 13. Having to do a major project motivates me to do my best.* 14. I generally keep up with the work in all of my classes.* 15. I don't get intimidated by heavy competition.* 16. I lack the discipline to give my best effort in school. .32 17. I have learned some ways to improve my studying efficiency.* 18. My emotions often get in the way of my getting anything done. 19. I have mental blocks against certain subjects. 20. I usually manage to keep my study breaks no longer than I
intend them to be.* 21. I tend to put off school work that I should be doing. 22. I wish others didn't have such high expectations of me. 23. I don't cram for exams as much as most people.* 24. It often turns out that I waste time studying the wrong material.
.47
.44
.55
.46
.72
.36
.47
Eigenvalue 6.36 2.01
Percent of Variance Accounted for 26.50 8.38
Note: Only factor loadings greater than .30 are reported. * Item is recoded when scoring.
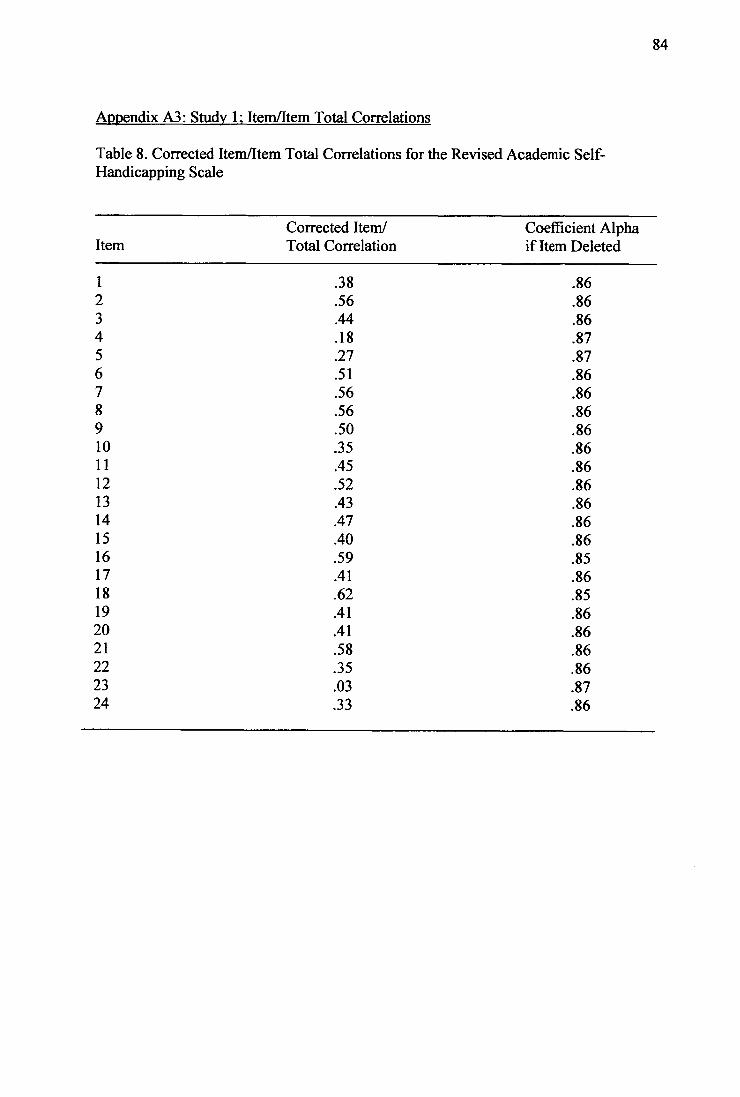
Appendix A3: Study 1; Item/Item Total Correlations
Table 8. Corrected Item/Item Total Correlations for the Revised Academic Self-Handicapping Scale
Item Corrected Item/ Total Correlation
Coefficient Alpha if Item Deleted
1 .38 .86 2 .56 .86 3 .44 .86 4 .18 .87 5 .27 .87 6 .51 .86 7 .56 .86 8 .56 .86 9 .50 .86 10 .35 .86 11 .45 .86 12 .52 .86 13 .43 .86 14 .47 .86 15 .40 .86 16 .59 .85 17 .41 .86 18 .62 .85 19 .41 .86 20 .41 .86 21 .58 .86 22 .35 .86 23 .03 .87 24 .33 .86
84
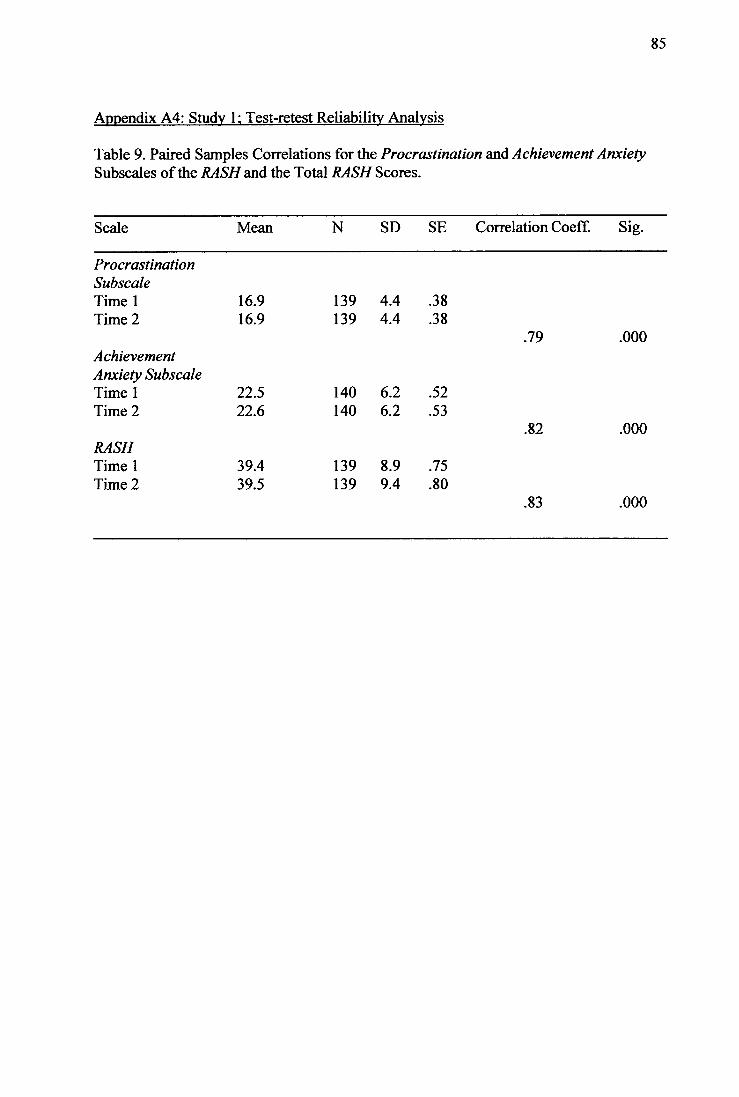
85
Appendix A4: Study 1; Test-retest Reliability Analysis
Table 9. Paired Samples Correlations for the Procrastination and Achievement Anxiety Subscales of the RASH and the Total RASH Scores.
Scale Mean N SD SE Correlation Coeff. Sig.
Procrastination Subscale Time 1 16.9 139 4.4 .38 Time 2 16.9 139 4.4 .38
.79 .000 Achievement Anxiety Subscale Time 1 22.5 140 6.2 .52 Time 2 22.6 140 6.2 .53
.82 .000 RASH Time 1 39.4 139 8.9 .75 Time 2 39.5 139 9.4 .80
.83 .000
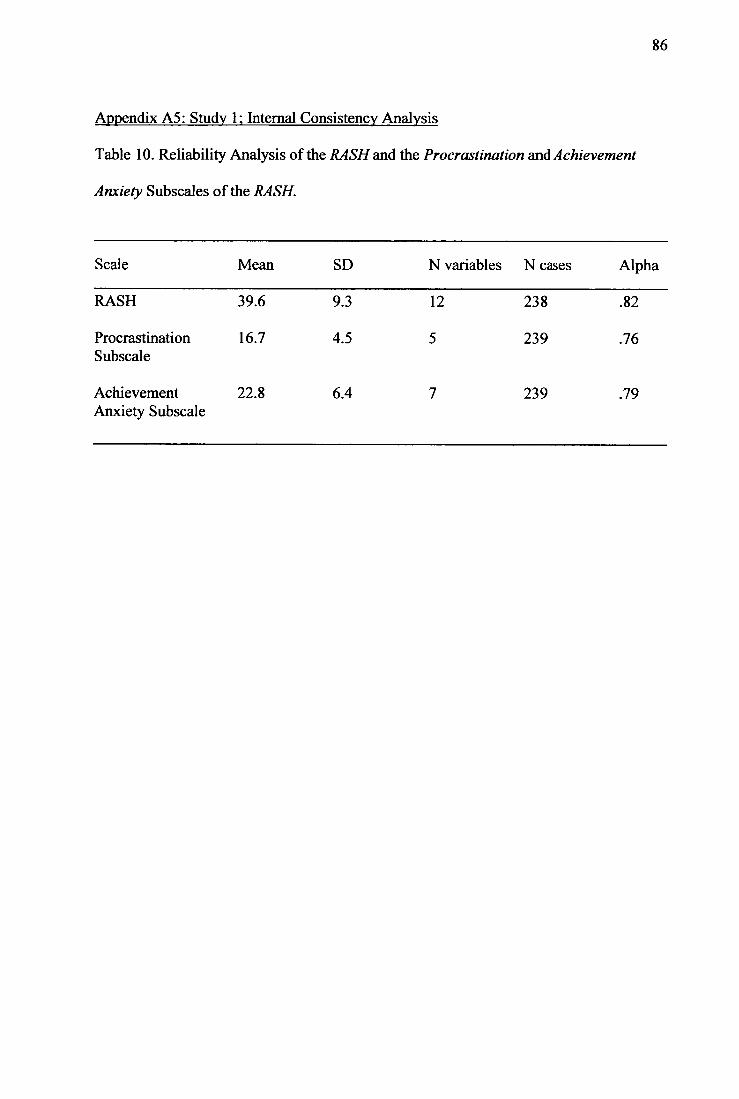
86
Appendix A5: Study 1; Internal Consistency Analysis
Table 10. Reliability Analysis of the RASH and the Procrastination and Achievement
Anxiety Subscales of the RASH.
Scale Mean SD N variables N cases Alpha
RASH 39.6 9.3 12 238 .82
Procrastination 16.7 4.5 5 239 .76 Subscale
Achievement 22.8 6.4 7 239 .79 Anxiety Subscale
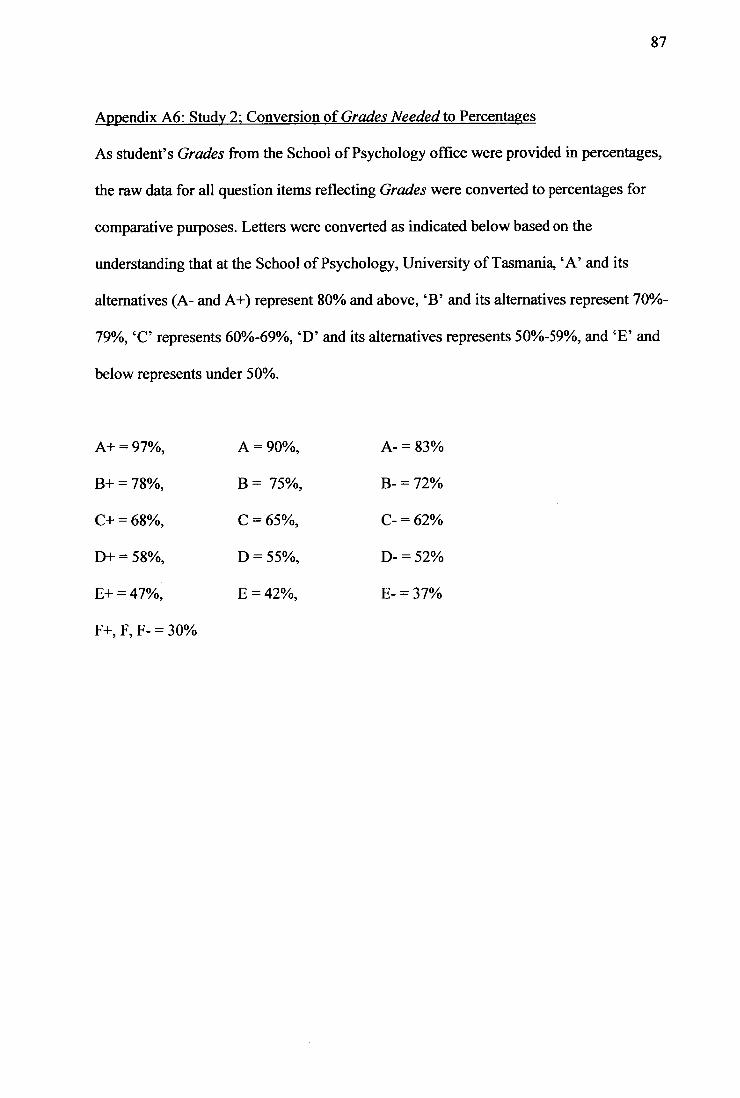
87
Appendix A6: Study 2; Conversion of Grades Needed to Percentages
As student's Grades from the School of Psychology office were provided in percentages,
the raw data for all question items reflecting Grades were converted to percentages for
comparative purposes. Letters were converted as indicated below based on the
understanding that at the School of Psychology, University of Tasmania, 'A' and its
alternatives (A- and A+) represent 80% and above, 'B' and its alternatives represent 70%-
79%, 'C' represents 60%-69%, 'D' and its alternatives represents 50%-59%, and `E' and
below represents under 50%.
A+ = 97%, A = 90%, A- = 83%
B+ = 78%, B = 75%, B- = 72%
C+ = 68%, C =65%, C- = 62%
D+ = 58%, D = 55%, D- = 52%
E+ = 47%, E = 42%, E- = 37%
F+, F, F- = 30%
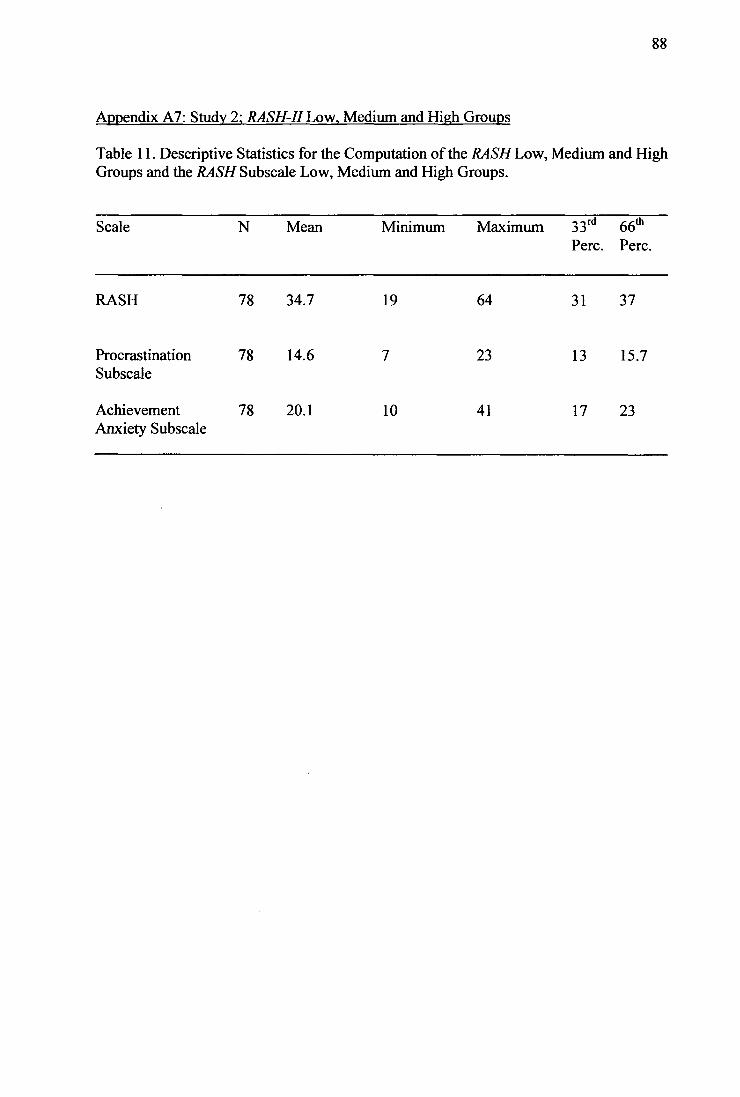
88
Appendix A7: Study 2; RASH-II Low, Medium and High Groups
Table 11. Descriptive Statistics for the Computation of the RASH Low, Medium and High Groups and the RASH Subseale Low, Medium and High Groups.
Scale N Mean Minimum Maximum 33 rd Perc.
66th Perc.
RASH 78 34.7 19 64 31 37
Procrastination 78 14.6 7 23 13 15.7 Subseale
Achievement 78 20.1 10 41 17 23 Anxiety Subscale
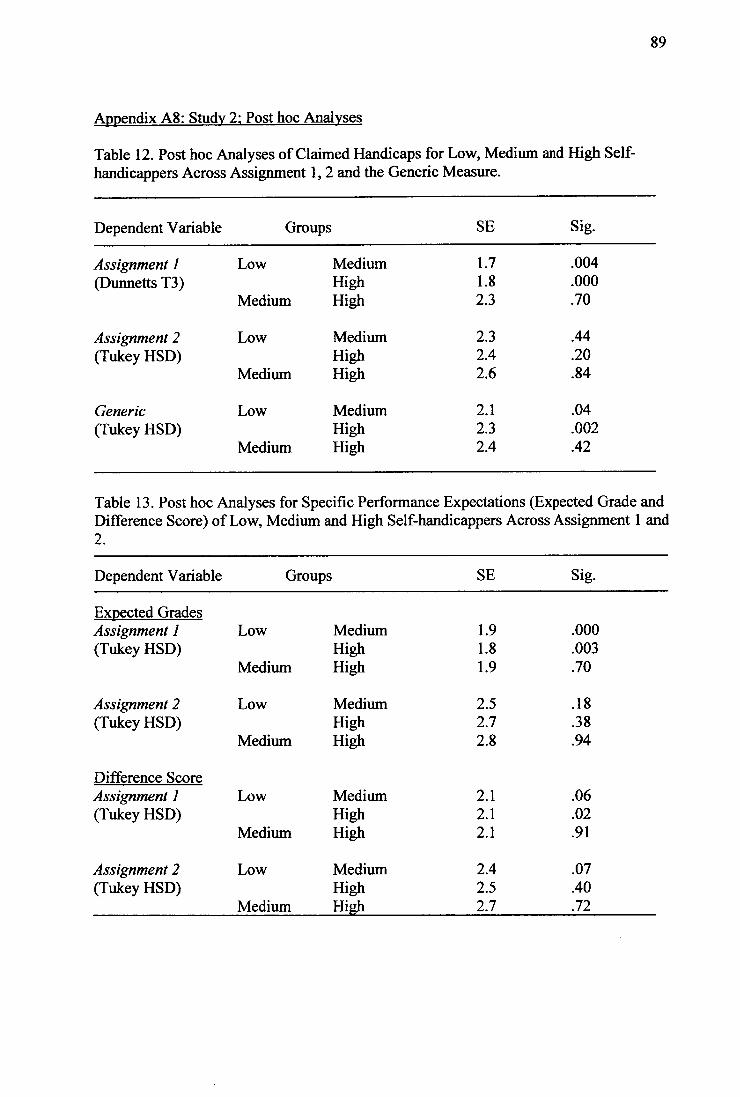
89
Appendix A8: Study 2; Post hoc Analyses
Table 12. Post hoc Analyses of Claimed Handicaps for Low, Medium and High Self-handicappers Across Assignment 1,2 and the Generic Measure.
Dependent Variable Groups SE Sig.
Assignment 1 Low Medium 1.7 .004 (Dunnetts T3) High 1.8 .000
Medium High 2.3 .70
Assignment 2 Low Medium 2.3 .44 (Tulcey HSD) High 2.4 .20
Medium High 2.6 .84
Generic Low Medium 2.1 .04 (Tukey HSD) High 2.3 .002
Medium High 2.4 .42
Table 13. Post hoc Analyses for Specific Performance Expectations (Expected Grade and Difference Score) of Low, Medium and High Self-handicappers Across Assignment 1 and 2.
Dependent Variable Groups SE Sig.
Expected Grades Assignment 1 Low Medium 1.9 .000 (Tukey HSD) High 1.8 .003
Medium High 1.9 .70
Assignment 2 Low Medium 2.5 .18 (Tukey HSD) High 2.7 .38
Medium High 2.8 .94
Difference Score Assignment 1 Low Medium 2.1 .06 (Tulcey HSD) High 2.1 .02
Medium High 2.1 .91
Assignment 2 Low Medium 2.4 .07 (Tukey HSD) High 2.5 .40
Medium High 2.7 .72
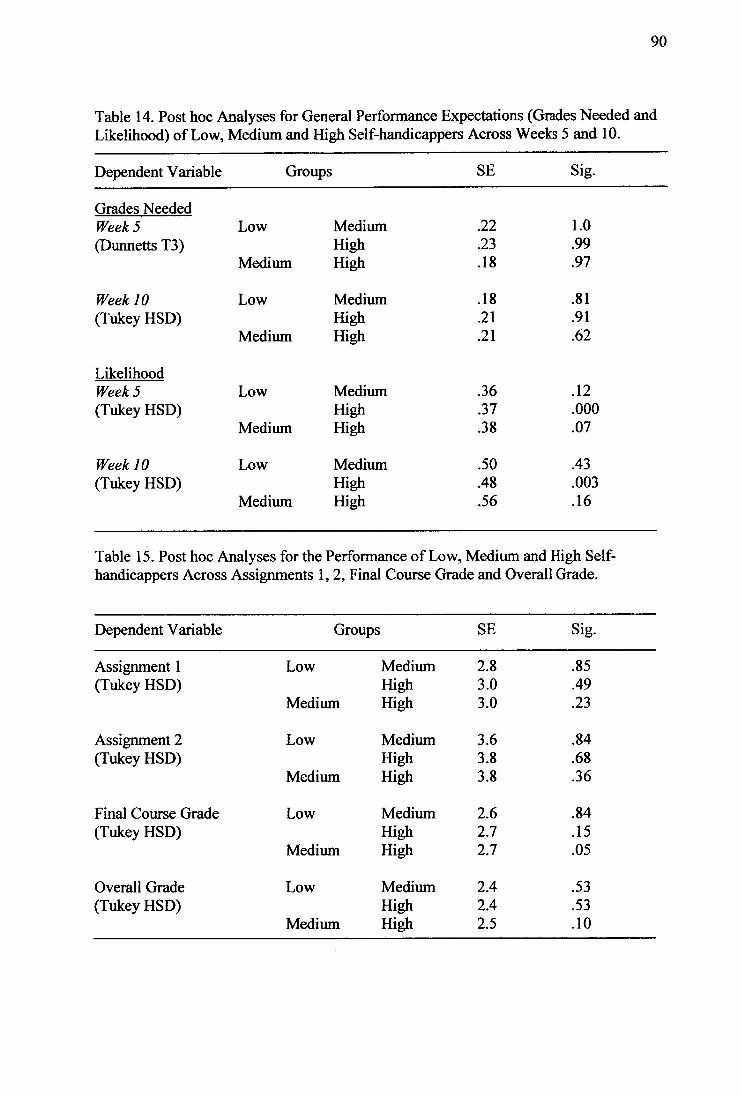
90
Table 14. Post hoc Analyses for General Performance Expectations (Grades Needed and Likelihood) of Low, Medium and High Self-handicappers Across Weeks 5 and 10.
Dependent Variable Groups SE Sig.
Grades Needed Week 5 Low Medium .22 1.0 (Dunnetts T3) High .23 .99
Medium High .18 .97
Week 10 Low Medium .18 .81 (Tukey HSD) High .21 .91
Medium High .21 .62
Likelihood Week 5 Low Medium .36 .12 (Tukey HSD) High .37 .000
Medium High .38 .07
Week 10 Low Medium .50 .43 (Tukey HSD) High .48 .003
Medium High .56 .16
Table 15. Post hoc Analyses for the Performance of Low, Medium and High Self-handicappers Across Assignments 1, 2, Final Course Grade and Overall Grade.
Dependent Variable Groups SE Sig.
Assignment 1 Low Medium 2.8 .85 (Tukey HSD) High 3.0 .49
Medium High 3.0 .23
Assignment 2 Low Medium 3.6 .84 (Tukey HSD) High 3.8 .68
Medium High 3.8 .36
Final Course Grade Low Medium 2.6 .84 (Tukey HSD) High 2.7 .15
Medium High 2.7 .05
Overall Grade Low Medium 2.4 .53 (Tukey HSD) High 2.4 .53
Medium High 2.5 .10
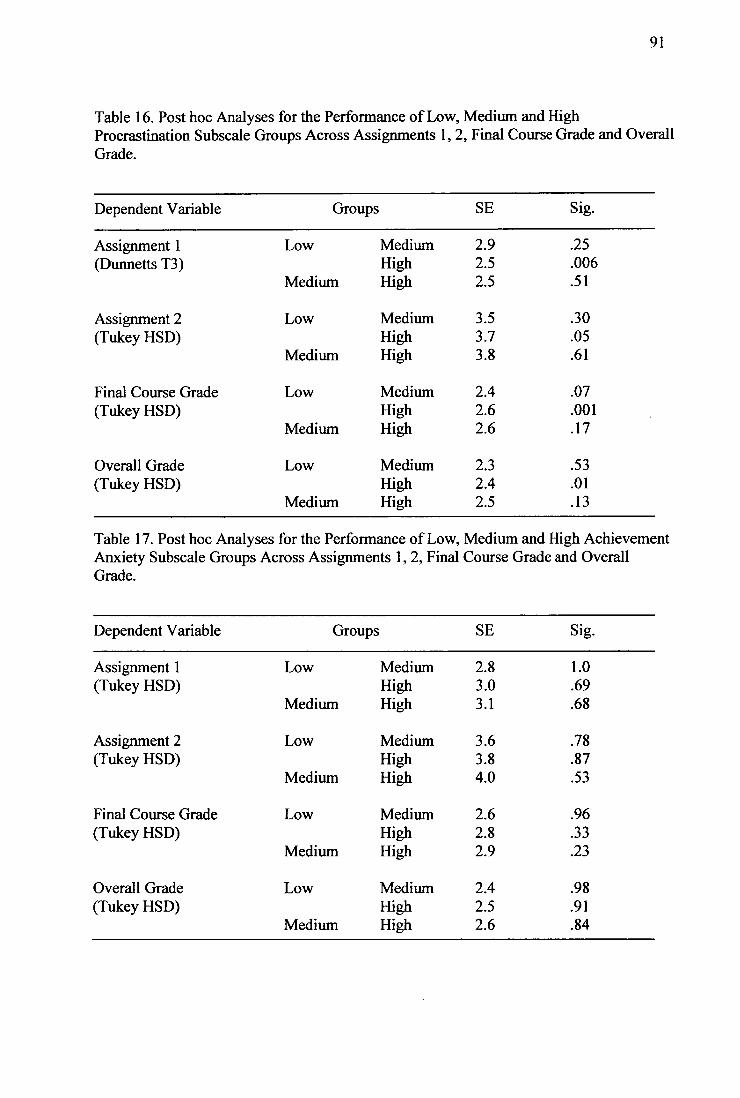
91
Table 16. Post hoc Analyses for the Performance of Low, Medium and High Procrastination Subscale Groups Across Assignments 1, 2, Final Course Grade and Overall Grade.
Dependent Variable Groups SE Sig.
Assignment 1 Low Medium 2.9 .25 (Dunnetts T3) High 2.5 .006
Medium High 2.5 .51
Assignment 2 Low Medium 3.5 .30 (Tukey HSD) High 3.7 .05
Medium High 3.8 .61
Final Course Grade Low Medium 2.4 .07 (Tukey HSD) High 2.6 .001
Medium High 2.6 .17
Overall Grade Low Medium 2.3 .53 (Tukey HSD) High 2.4 .01
Medium High 2.5 .13
Table 17. Post hoc Analyses for the Performance of Low, Medium and High Achievement Anxiety Subsca1e Groups Across Assignments 1, 2, Final Course Grade and Overall Grade.
Dependent Variable Groups SE Sig.
Assignment 1 Low Medium 2.8 1.0 (Tukey HSD) High 3.0 .69
Medium High 3.1 .68
Assignment 2 Low Medium 3.6 .78 (Tukey HSD) High 3.8 .87
Medium High 4.0 .53
Final Course Grade Low Medium 2.6 .96 (Tukey HSD) High 2.8 .33
Medium High 2.9 .23
Overall Grade Low Medium 2.4 .98 (Tukey HSD) High 2.5 .91
Medium High 2.6 .84
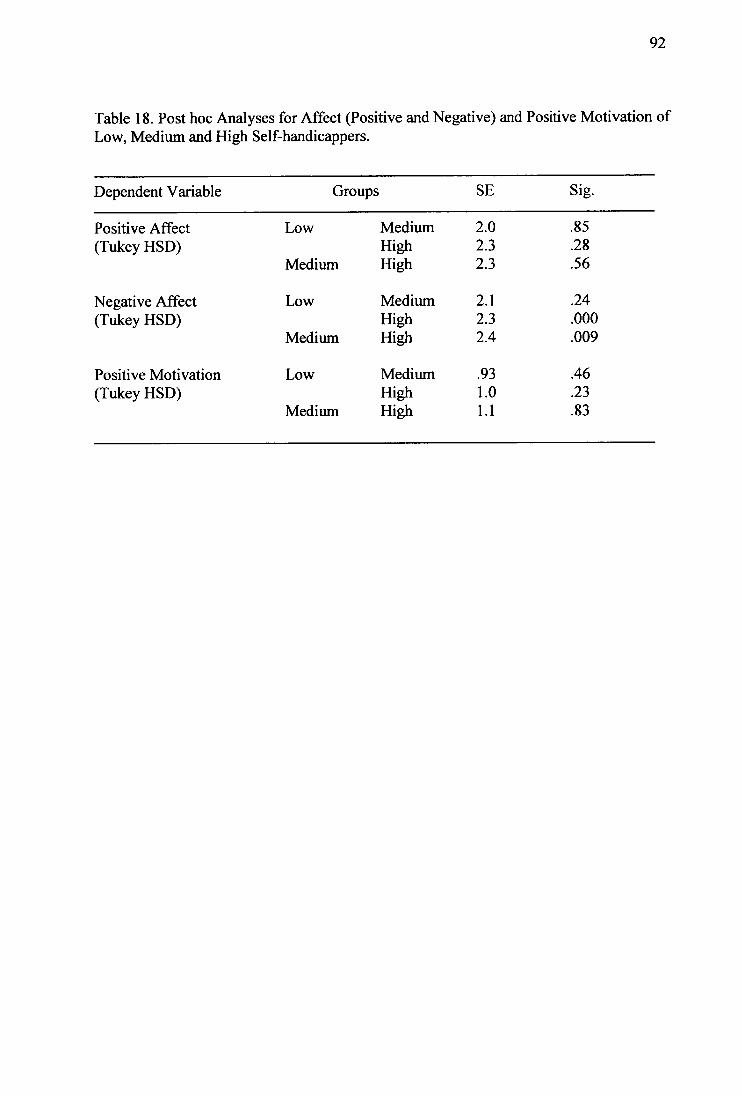
92
Table 18. Post hoc Analyses for Affect (Positive and Negative) and Positive Motivation of Low, Medium and High Self-handicappers.
Dependent Variable Groups SE Sig.
Positive Affect Low Medium 2.0 .85 (Tukey HSD) High 2.3 .28
Medium High 2.3 .56
Negative Affect Low Medium 2.1 .24 (Tukey HSD) High 2.3 .000
Medium High 2.4 .009
Positive Motivation Low Medium .93 .46 (Tukey HSD) High 1.0 .23
Medium High 1.1 .83
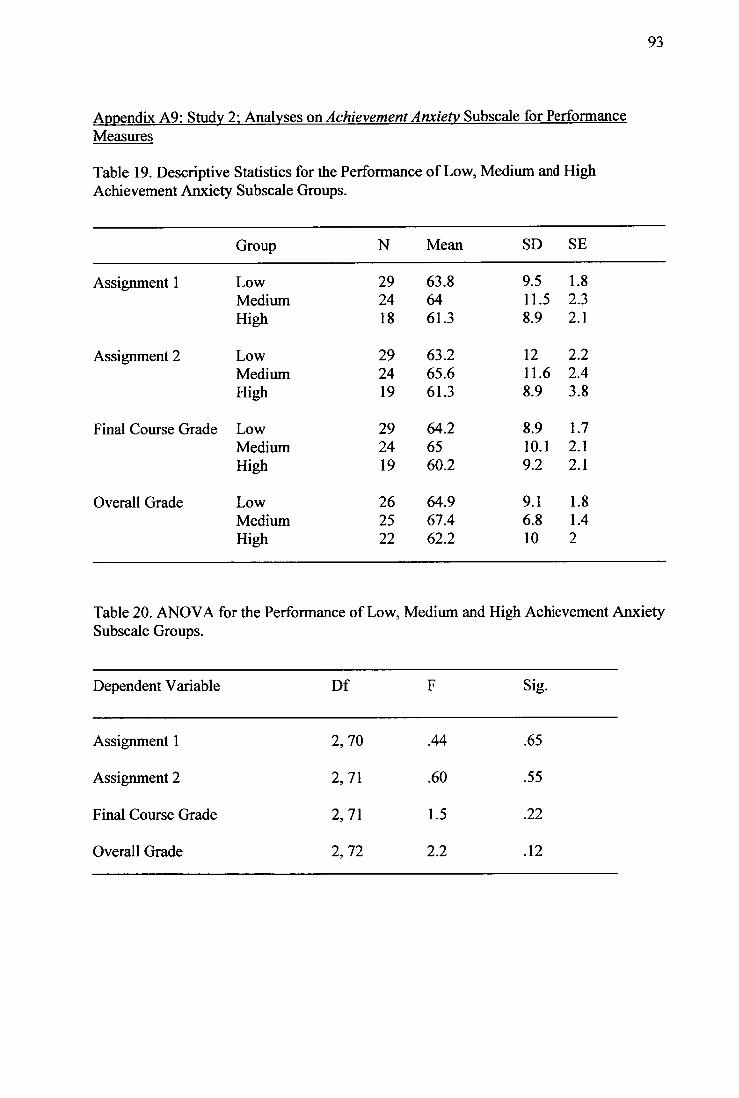
93
Appendix A9: Study 2; Analyses on Achievement Anxiety Subscale for Performance Measures
Table 19. Descriptive Statistics for the Performance of Low, Medium and High Achievement Anxiety Subscale Groups.
Group N Mean SD SE
Assignment 1 Low 29 63.8 9.5 1.8 Medium 24 64 11.5 2.3 High 18 61.3 8.9 2.1
Assignment 2 Low 29 63.2 12 2.2 Medium 24 65.6 11.6 2.4 High 19 61.3 8.9 3.8
Final Course Grade Low 29 64.2 8.9 1.7 Medium 24 65 10.1 2.1 High 19 60.2 9.2 2.1
Overall Grade Low 26 64.9 9.1 1.8 Medium 25 67.4 6.8 1.4 High 22 62.2 10 2
Table 20. ANOVA for the Performance of Low, Medium and High Achievement Anxiety Subscale Groups.
Dependent Variable Df F Sig.
Assignment 1 2, 70 .44 .65
Assignment 2 2, 71 .60 .55
Final Course Grade 2, 71 1.5 .22
Overall Grade 2, 72 2.2 .12
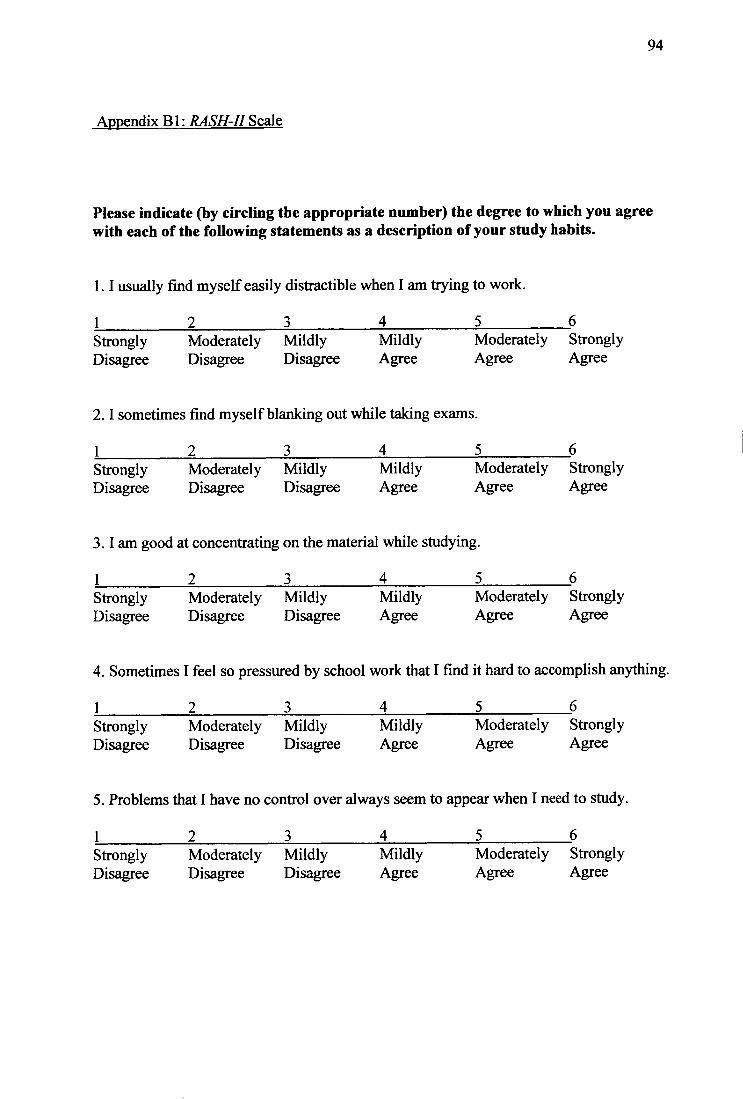
94
Appendix Bl: RASH-H Scale
Please indicate (by circling the appropriate number) the degree to which you agree with each of the following statements as a description of your study habits.
1. I usually find myself easily distractible when I am trying to work.
1 2 3 4 5 6 Strongly Moderately Mildly Mildly Moderately Strongly Disagree Disagree Disagree Agree Agree Agree
2. I sometimes find myself blanking out while taking exams.
1 2 3 4 5 6 Strongly Moderately Mildly Mildly Moderately Strongly Disagree Disagree Disagree Agree Agree Agree
3. I am good at concentrating on the material while studying.
1 2 3 4 5 6 Strongly Moderately Mildly Mildly Moderately Strongly Disagree Disagree Disagree Agree Agree Agree
4. Sometimes I feel so pressured by school work that I find it hard to accomplish anything.
1 2 3 4 5 6 Strongly Moderately Mildly Mildly Moderately Strongly Disagree Disagree Disagree Agree Agree Agree
5. Problems that I have no control over always seem to appear when I need to study.
1 2 3 4 5 6 Strongly Moderately Mildly Mildly Moderately Strongly Disagree Disagree Disagree Agree Agree Agree
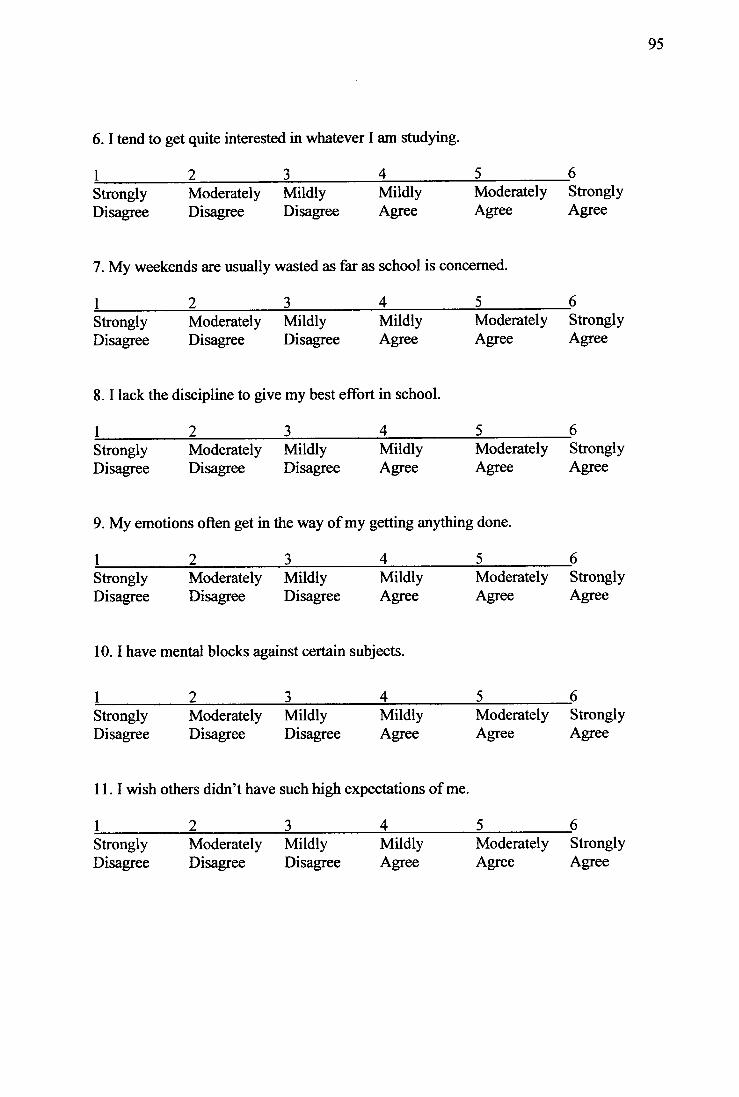
6. I tend to get quite interested in whatever I am studying.
1 2 3 4 5 6 Strongly Moderately Mildly Mildly Moderately Strongly Disagree Disagree Disagree Agree Agree Agree
7. My weekends are usually wasted as far as school is concerned.
1 2 3 4 5 6 Strongly Moderately Mildly Mildly Moderately Strongly Disagree Disagree Disagree Agree Agree Agree
8. I lack the discipline to give my best effort in school.
1 2 3 4 5 6 Strongly Moderately Mildly Mildly Moderately Strongly Disagree Disagree Disagree Agree Agree Agree
9. My emotions often get in the way of my getting anything done.
1 2 3 4 5 6 Strongly Moderately Mildly Mildly Moderately Strongly Disagree Disagree Disagree Agree Agree Agree
10. I have mental blocks against certain subjects.
1 2 3 4 5 6 Strongly Moderately Mildly Mildly Moderately Strongly Disagree Disagree Disagree Agree Agree Agree
11. I wish others didn't have such high expectations of me.
1 2 3 4 5 6 Strongly Moderately Mildly Mildly Moderately Strongly Disagree Disagree Disagree Agree Agree Agree
95
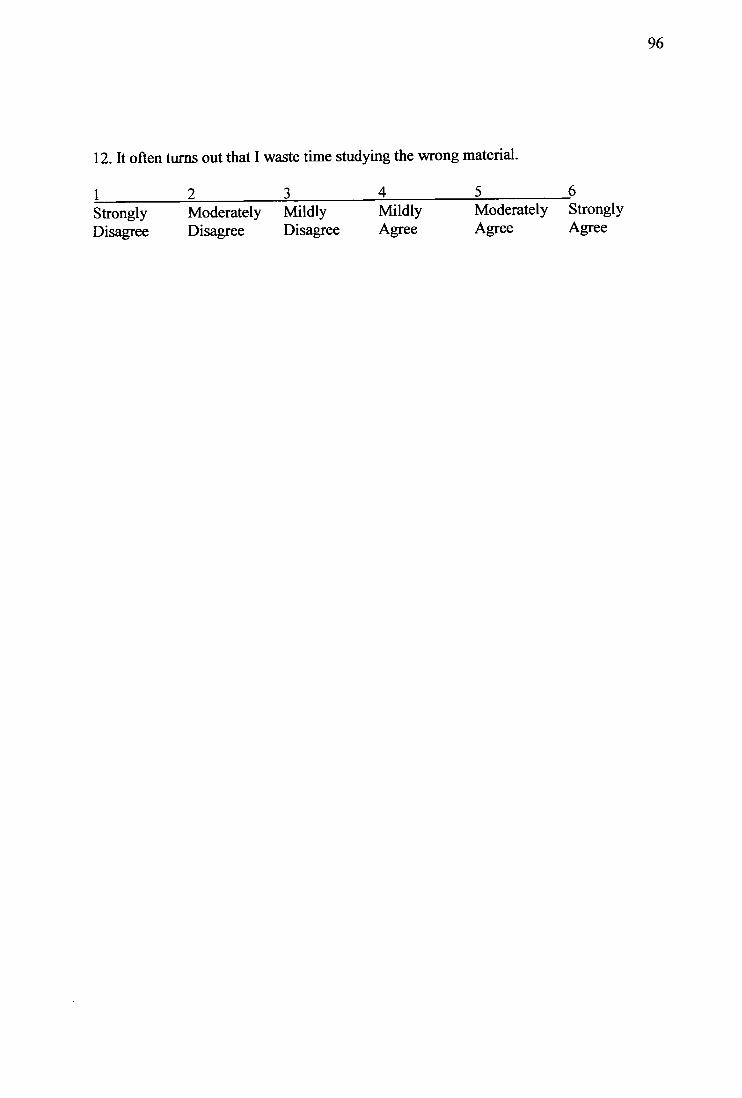
12. It often turns out that I waste time studying the wrong material.
1 2 3 4 5 6 Strongly Moderately Mildly Mildly Moderately Strongly Disagree Disagree Disagree Agree Agree Agree
96
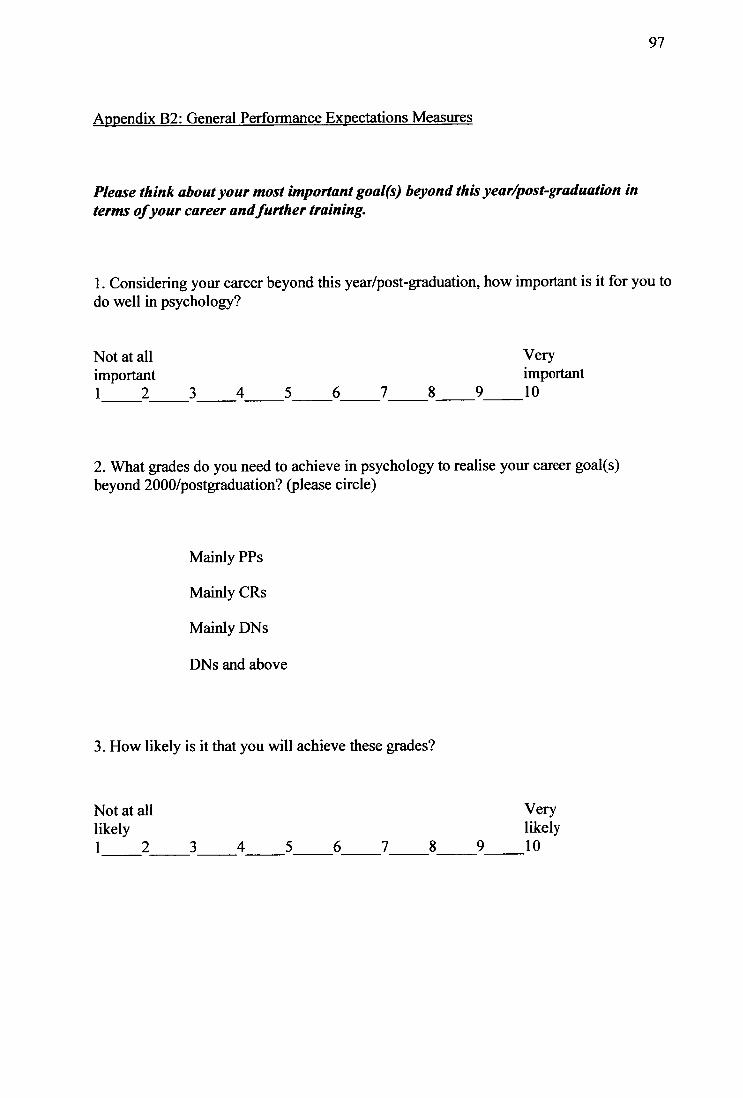
97
Appendix B2: General Performance Expectations Measures
Please think about your most important goal(s) beyond this year/post-graduation in terms of your career and further training.
1. Considering your career beyond this year/post-graduation, how important is it for you to do well in psychology?
Not at all Very important important 1 2 3 4 5 6 7 8 9 10
2. What grades do you need to achieve in psychology to realise your career goal(s) beyond 2000/postgraduation? (please circle)
Mainly PPs
Mainly CRs
Mainly DNs
DNs and above
3. How likely is it that you will achieve these grades?
Not at all Very likely likely 1 2 3 4 5 6 7 8 9 10
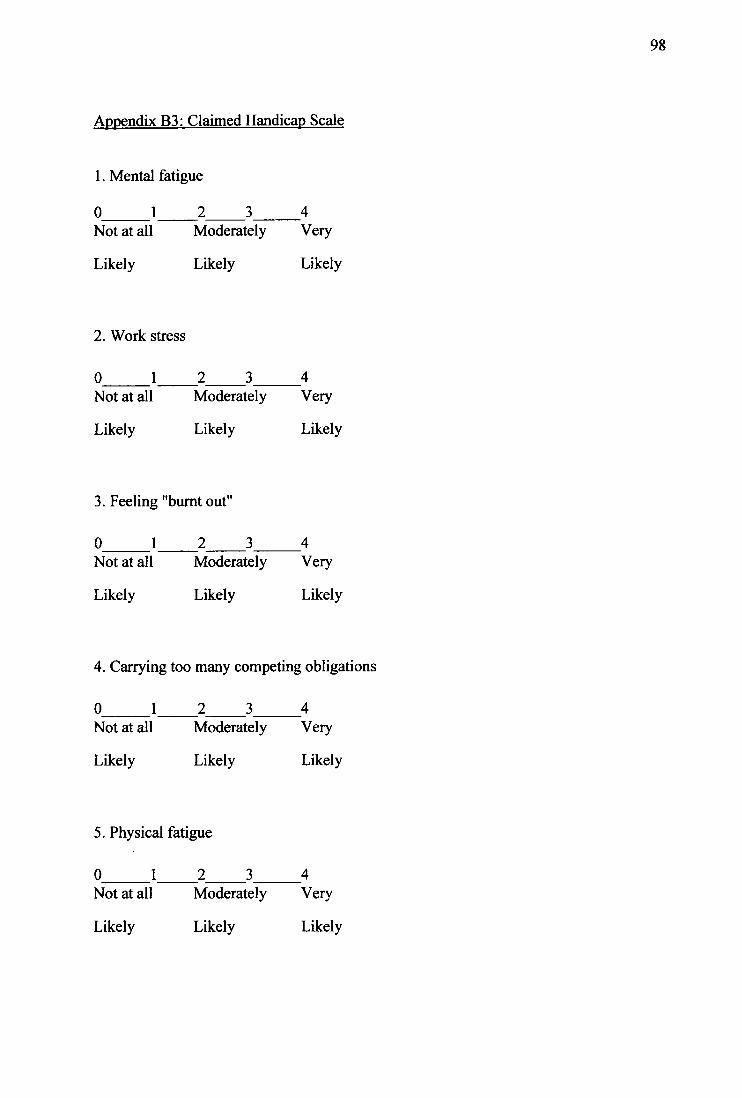
Appendix B3: Claimed Handicap Scale
1. Mental fatigue
0 1 2 3 4 Not at all Moderately Very
Likely Likely Likely
2. Work stress
0 1 2 3 4 Not at all Moderately Very
Likely Likely Likely
3. Feeling "burnt out"
0 1 2 3 4 Not at all Moderately Very
Likely Likely Likely
4. Carrying too many competing obligations
0 1 2 3 4 Not at all Moderately Very
Likely Likely Likely
5. Physical fatigue
0 1 2 3 4 Not at all Moderately Very
98
Likely Likely Likely
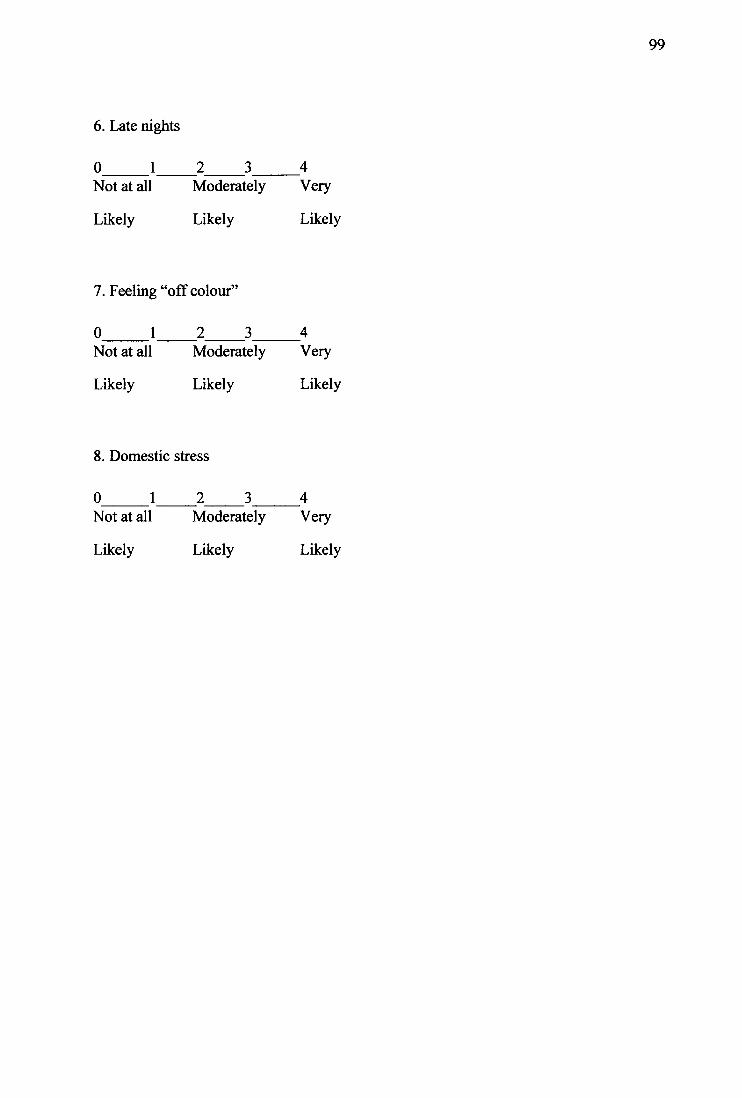
6. Late nights
0 1 2 3 4 Not at all Moderately Very
Likely Likely Likely
7. Feeling "off colour"
0 1 2 3 4 Not at all Moderately Very
Likely Likely Likely
8. Domestic stress
0 1 2 3 4 Not at all Moderately Very
Likely Likely Likely
99
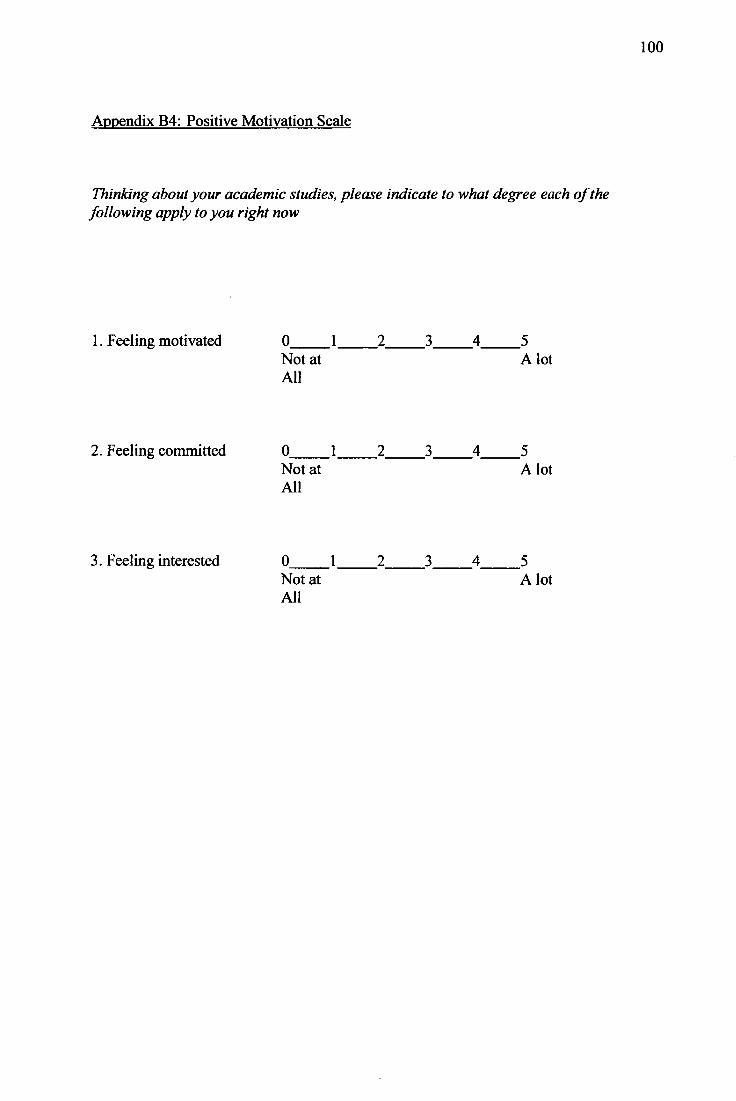
Appendix B4: Positive Motivation Scale
Thinking about your academic studies, please indicate to what degree each of the following apply to you right now
1. Feeling motivated 0 1 2 3 4 5 Not at A lot All
2. Feeling committed 0 1 2 3 4 5 Not at A lot MI
3. Feeling interested 0 1 2 3 4 5 Not at A lot All
100
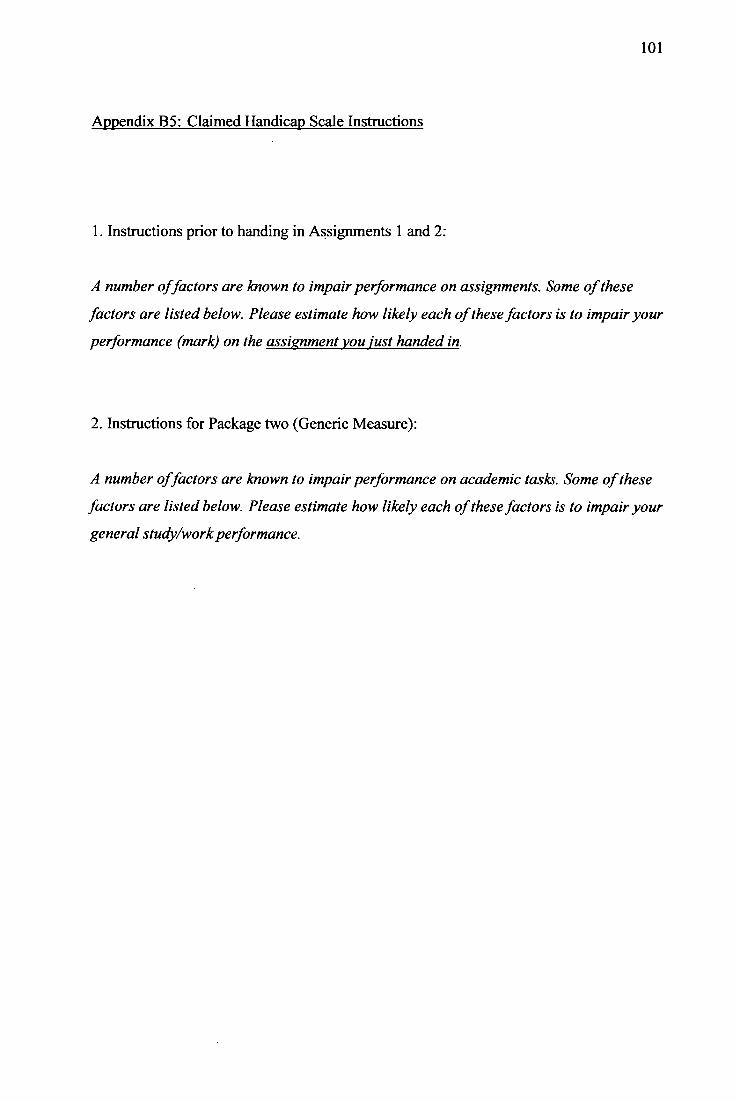
101
Appendix B5: Claimed Handicap Scale Instructions
1. Instructions prior to handing in Assignments 1 and 2:
A number of factors are known to impair performance on assignments. Some of these
factors are listed below. Please estimate how likely each of these factors is to impair your
performance (mark) on the assignment you just handed in.
2. Instructions for Package two (Generic Measure):
A number of factors are known to impair performance on academic tasks. Some of these
factors are listed below. Please estimate how likely each of these factors is to impair your
general study/work performance.
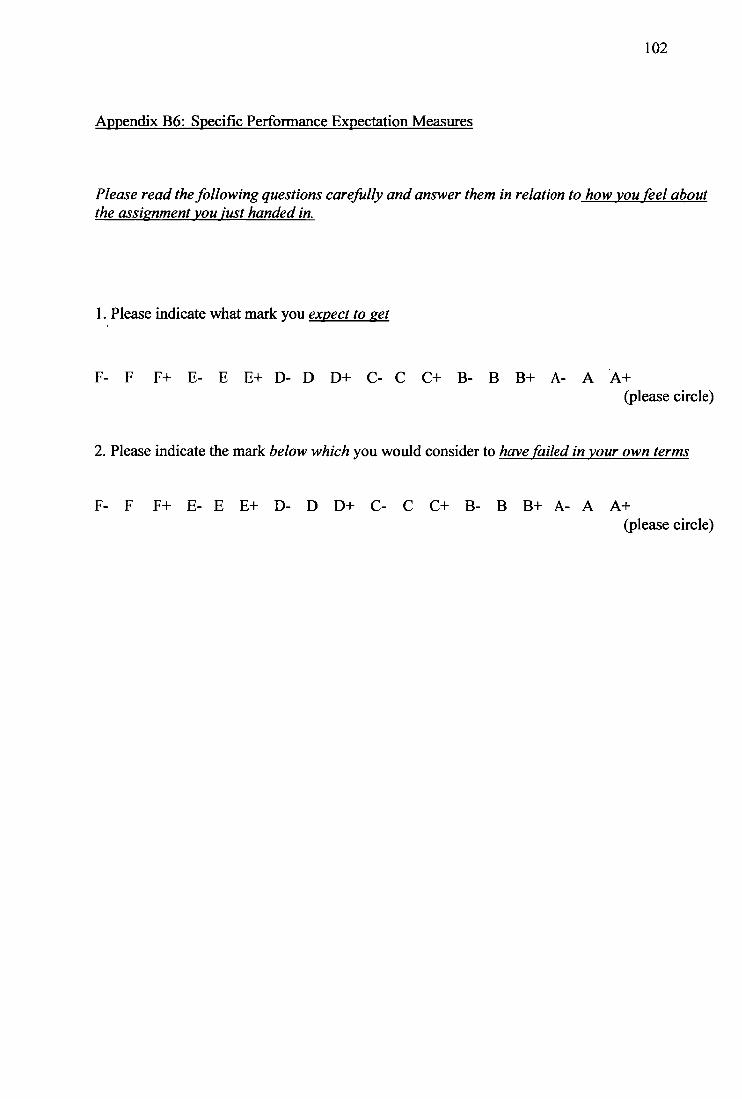
102
Appendix B6: Specific Performance Expectation Measures
Please read the following questions carefully and answer them in relation to how you feel about the assignment you just handed in.
1. Please indicate what mark you expect to get
F- F F+ E- E E+ D- D D+ C- C C+ B- B B+ A- A A+ (please circle)
2. Please indicate the mark below which you would consider to havefailed in your own terms
F- F F+ E- E E+ D- D D+ C- C C+ B- B B+ A- A A+ (please circle)
Related Documents