THE EFFECTIVENESS OF USING MIND MAPPING IN IMPROVING STUDENTS’ READING COMPREHENSION OF NARRATIVE TEXT (A Quasi Experimental Study at The Second Grade of SMA Mathla’ul Huda Parung Panjang-Bogor) By: Sheira Ayu Indrayani 109014000107 THE DEPARTMENT OF ENGLISH EDUCATION FACULTY OF TARBIYAH AND TEACHERS’ TRAINING SYARIF HIDAYATULLAH STATE ISLAMIC UNIVERSITY JAKARTA 2014

Welcome message from author
This document is posted to help you gain knowledge. Please leave a comment to let me know what you think about it! Share it to your friends and learn new things together.
Transcript
THE EFFECTIVENESS OF USING MIND MAPPING IN
IMPROVING STUDENTS’ READING COMPREHENSION OF
NARRATIVE TEXT
(A Quasi Experimental Study at The Second Grade of SMA Mathla’ul Huda
Parung Panjang-Bogor)
By:
Sheira Ayu Indrayani
109014000107
THE DEPARTMENT OF ENGLISH EDUCATION
FACULTY OF TARBIYAH AND TEACHERS’ TRAINING
SYARIF HIDAYATULLAH STATE ISLAMIC UNIVERSITY
JAKARTA
2014
v
ABSTRACT
THE EFFECTIVENESS OF USING MIND MAPPING IN IMPROVING
STUDENTS’ READING COMPREHENSION OF NARRATIVE TEXT A
Quasi Experimental Study at the Second Grade of SMA Mathla’ul Huda Parung
Panjang-Bogor. Skripsi of English Education at Faculty of Tarbiyah and
Teachers’ Training of State Islamic University Syarif Hidayatullah Jakarta, 2014.
The objective of this study is to find the effectiveness of mind mapping in
improving students’ reading comprehension achievement, especially for narrative
text at the second grade students of SMA Mathla’ul Huda Parung Panjang Bogor
academic year 2013/2014. The subjects of this study were 70 students.
Experimental research was used as a method in this study. The study was
carried out in two classes, they are the controlled class and the experimental class.
The data were gathered through tests which were delivered into the pre-test and
the post-test.
The result of the study showed that the mind mapping technique is
effective to use in teaching reading comprehension of narrative text. Gained score
of the experimental class (27.14) is higher than the controlled class (17.71). From
the result of statistic calculation, it is obtained that the value of t-observation (to) is
3.47 and degree of freedom (df) is 68. In the table of significance 5%, the value of
degree of significance is 1.66. Comparing those values, the result is 3.47 > 1.66
which means t-observation (to) score is higher than t-table (tt) score. In other
word, the Alternative Hypothesis (Ha) is accepted and the Null Hypothesis (Ho) is
rejected. Therefore, teaching reading comprehension of narrative text by using
mind mapping technique is effective.
Keywords: Mind Mapping Technique, Reading Comprehension, Narrative Text,
Experimental Study.
SHEIRA AYU INDRAYANI (PBI)
vi
ABSTRAK
THE EFFECTIVENESS OF USING MIND MAPPING IN IMPROVING
STUDENTS’ READING COMPREHENSION OF NARRATIVE TEXT A
Quasi Experimental Study at the Second Grade of SMA Mathla’ul Huda Parung
Panjang-Bogor. Skripsi of English Education at Faculty of Tarbiyah and
Teachers’ Training of State Islamic University Syarif Hidayatullah Jakarta, 2014.
Penelitian ini dilakukan untuk mengetahui keefektifan tehnik mind
mapping dalam meningkatkan prestasi belajar siswa dalam memahami bacaan dari
teks narasi pada siswa kelas 2 SMA Mathla’ulhuda tahun akademik 2013/2014.
Subjek penelitian ini terdiri dari 70 siswa.
Penelitian eksperimen adalah metode yang digunakan di dalam penelitian
ini. Penelitian ini diadakan di dalam dua kelas, yaitu kelas kontrol dan kelas
eksperimen. Data dikumpulkan melalui tes yang diberikan melalui pre-test dan
post-test.
Hasil dari penelitian menunjukkan bahwa tehnik mind mapping efektif
digunakan dalam pengajaran memahami bacaan dari teks narasi. Gained score
yang diperoleh kelas eksperimen (27.14) lebih tinggi daripada kelas control
(17.71). Dari hasil kalkulasi statistik, dapat diperoleh bahwa nilai dari t-observasi
(to) adalah 3.47 dan degree of freedom (df) adalah 1.66. Dalam table signifikan
5%, nilai degree of freedom adalah 1.66. Dengan membandingkan nilai-nilai
tersebut, hasilnya adalah 3.47 > 1.66 yang berarti skor t-observasi (to) lebih besar
dari skor t-tabel (tt). Dengan kata lain, Hipotesis Alternatif (Ha) diterima dan
Hipotesis Null (Ho) ditolak. Oleh karena itu, pengajaran memahami bacaan dari
teks narasi menggunakan tehnik mind mapping efektif.
Kata kunci: Tehnik Mind Mapping, Memahami Bacaan, Teks Narasi, Penelitian
Eksperimental.
SHEIRA AYU INDRAYANI (PBI)
vii
ACKNOWLEDGEMENT
In the name of Allah, the Beneficent and Merciful
Praised be to Allah, Lord of the world, who has given mercy and
blessing to the writer in finishing this skripsi. Peace and salutation be upon to the
prophet Muhammad SAW, his family, his companion, and his adherence.
In this occasion, the writer would like to thank to her beloved family,
Tonny Soelistyo Wahyudi and Suarni as her parents, and her brother Muhammad
Fadel Azhari for their prayers, understanding, support, and motivation.
The writer also would like to address her great honor and attitude to her
advisors, St. Nurul Azkiyah, M.Sc, Ph.D and Yenny Rahmawati, M.Ed for their
guidance and valuable advices during the writer did this skripsi.
The writer’s sincere gratitude also goes to:
1. Drs. Syauki, M.Pd., the Head of English Education Departement.
2. All lecturers of English Education for the useful knowledge and skills
given.
3. Ratu Nurul Ulfah, S.Sos.I.MM., the Headmaster of SMA Mathla’ul Huda
Parung Panjang Bogor for giving permission to the writer to do
observation and research.
4. Ferry Setiawan, S.Pd., and Sita Yulia as the English Teachers at SMA
Mathla’ul Huda Parung Panjang Bogor.
5. All of the teachers and the second year students at SMA Mathla’ul Huda
Parung Panjang Bogor.
6. All of her friends in English Education Department, especially C Class for
academic year 2009 and the members of Bloom Project.
7. All of her friends in PPKT at SMAN 1 Parung Bogor.
8. To any other persons whose are named cannot be mentioned one for their
contribution to the writer during finishing her skripsi.
viii
The writer realizes that her writing is still far from being perfect.
Therefore, she would like to accept some suggestions and criticizes for this skripsi
and it will be so valuable for her.
Jakarta, 12 Mei 2014
The Writer
ix
TABLE OF CONTENT
COVER ..................................................................................................... i
PAGE OF APPROVAL ........................................................................... ii
ENDORSEMENT SHEET ...................................................................... iii
SURAT PERNYATAAN KARYA SENDIRI ......................................... iv
ABSTRACT .............................................................................................. v
ABSTRAK ................................................................................................ vi
ACKNOWLEDGEMENT ....................................................................... vii
TABLE OF CONTENT ............................................................................ ix
LIST OF TABLES .................................................................................... xi
LIST OF PICTURE .................................................................................. xii
LIST OF APPENDICES .......................................................................... xiii
CHAPTER I. INTRODUCTION ....................................................... 1
A. The Background of The Study ................................ 1
B. The Problem of The Study ...................................... 4
C. The Limitation of The Problem .............................. 5
D. The Formulation of The Problem ........................... 5
E. The Objective of The Study .................................... 5
F. The Significance of The Study ............................... 5
CHAPTER II. LITERATURE REVIEW ........................................... 6
A. Reading ................................................................... 6
B. Reading Comprehension ......................................... 7
1. The Definition of Reading Comprehension ..... 7
2. The Factors Influencing Reading
Comprehension ................................................ 9
C. The Purposes of Reading ......................................... 11
D. Narrative Text ......................................................... 12
E. Mind Mapping ......................................................... 14
1. The Concept of Mind Mapping ....................... 14
x
2. The Purposes of Mind Mapping ...................... 18
3. The Procedure of Mind Mapping .................... 18
4. The Advantages and Disadvantages of Mind
Mapping ............................................................ 19
F. Teaching Reading Comprehension of Narrative
Text Through Mind Mapping ................................. 21
G. Previous Studies ...................................................... 22
H. Conceptual Framework ........................................... 24
I. Hypotheses .............................................................. 25
CHAPTER III. RESEARCH METHODOLOGY ............................... 27
A. The Research Design .............................................. 27
B. The Place and Time of The Research ..................... 27
C. The Population and Sample of The Research .......... 28
D. The Data Collection Technique .............................. 28
E. The Content of The Intervention ............................ 29
F. The Data Analysis Technique ................................. 30
G. The Statistical Hypotheses ...................................... 31
CHAPTER IV. RESEARCH FINDING ............................................... 33
A. The Data Description .............................................. 33
1. The Pre-test Scores ........................................... 33
2. The Post-test Scores.......................................... 35
3. The Gained Scores ............................................ 37
B. The Data Analysis ................................................... 38
C. The Data Interpretation ........................................... 46
CHAPTER V. CONCLUSION AND SUGGESTION ....................... 48
A. Conclusion .............................................................. 48
B. Suggestion .............................................................. 48
BIBLIOGRAPHY .................................................................................... 49
APPENDICES .......................................................................................... 52
xi
LIST OF TABLES
Table 4.1 The Students’ Pre-test Scores ..................................................... 33
Table 4.2 The Students’ Post-test Scores .................................................... 35
Table 4.3 The Gained Scores of The Experimental Class and
The Controlled Class .................................................................. 37
Table 4.4 The t-test of Pre-test in The Experimental Class and
The Controlled Class .................................................................. 39
Table 4.5 The t-test of Post-test in The Experimental Class and
The Controlled Class .................................................................. 40
Table 4.6 The t-test of Gained Score in The Experimental Class
and The Controlled Class ........................................................... 41
Table 4.7 The Comparison Scores of Each Student in
The Experimental Class and The Controlled Class .................... 42
xii
LIST OF PICTURE
Picture 2.1 The Sample of Mind Mapping .................................................. 17
xiii
LIST OF APPENDICES
Appendix 1 : ANATEST result
Appendix 2 : The Instrument
Appendix 3 : The Blueprint Test of Pre-Test and Post-Test
Appendix 4 : The Instrument of Pre-Test and Post-Test
Appendix 5 : The Answer Keys
Appendix 6 : Lesson Planning
Appendix 7 : Students’ Exercises Scores
Appendix 8 : Student’s Mind Mapping
Appendix 9 : Surat Keterangan Telah Melakukan Penelitian
Appendix 10 : Surat Pengesahan Proposal Skripsi
Appendix 11 : Surat Bimbingan Skripsi
Appendix 12 : Surat Pergantian Judul Skripsi
1
CHAPTER I
INTRODUCTION
This chapter explains about the background of the study, the problem of
the study, the limitation of the problem, the formulation of the problem, the
purpose of the study, and the significance of the study.
A. The Background of the Study
English as an international language has been used for all over the
world in recent years. Jeremy Harmer states that today English is the world’s most
widely studied foreign language.1 In other words, English has important role in
people’s communication. In Indonesia, English is taught in schools as a foreign
language. This subject is tested in the national exam which shows the importance
of this subject.
In teaching and learning process of English, there are four skills taught:
listening, speaking, reading, and writing. In foreign language learning, reading is a
skill that teachers expect learners to acquire. It argues as the most essential skill
for success in all education context.2 No wonder, the students can learn many
things through reading. In other words, the more they read, the more knowledge
they get; hence, a strong correlation between reading and academic success is
shown.
The act of reading cannot be separated from comprehension. The
students cannot achieve their academic success without comprehending what they
read. In comprehending the text, the students should be monitored by their
teachers, hence the way to teach comprehension should be well understood by the
teachers. Teaching comprehension is an activity through some steps: selecting a
text, explaining the strategy, modelling the strategy, guided support, practicing
1 Jeremy Harmer, Approaches and Methods in Language Teaching-8th Ed, (New
York: Cambridge University Press, 1992), p.1 2 H. Douglas Brown, Language Assessment-Principles and Classroom Practices,
(New York: Longman, 2004), p.185.
2
independently, and reflecting.3
Therefore, it can be concluded that reading
comprehension is a long process.
In addition, having a good comprehension in reading can be facilitated
by many strategies. McNamara whose thinking is adopted by the College Board
underlines growing recognition that the use of reading strategies is essential; high
ability students who use reading strategies are getting successful not only in
comprehending reading, but also in overcoming reading problems and becoming a
better reader and comprehender.4 In summary, the students should have better
strategies for their good comprehension.
Nowadays, the need of reading comprehension requires teachers to
facilitate students through interesting strategies in learning process. Harmer states
that students are better to be impulsed in responding the context and gaining their
feeling about it than only focussing them on the text construction.5 The teachers
usually ask the students to read without giving the solution about how to read with
pleasure and comprehend through interesting strategies. The students are used to
comprehend the text only by reading normally, as what their habits in learning
process. In conclusion, students are stated having no problems in learning reading
comprehension because of their habits -reading normally.
At the senior high school level, the students are expected to master
some types of text like narrative, discussion, and hortatory exposition. Narrative
as one of those types become a common text used in students teaching and
learning process, moreover used in national exam. Narrative is a text that tells a
story to entertain the audience, let the audience think about an issue, teach them a
lesson, or excite their emoticons.6 Based on the theories, it can be assumed that
3NSW Department of Education and Training, Teaching Comprehension Strategies,
2010, p. 7. 4
McNamara, Ozuru, Best, & O’Reilly, “Reading Strategies strand in English
Language Arts College Board Standards for College Success™” as cited by the College Board
College Board Standards, 2006. 5 Jeremy Harmer, The Practice of English Language Teaching-Forth Ed (Oxford:
Pearson Longman, 2007), pp.101. 6
Mark Anderson and Kathy Anderson, Text Types in English 3(Melbourne:
MacMillan Education, 2003), p.6.
3
narrative text can be studied easily, because it lets the students interested to read
the text; as its purpose is to entertain people.
Based on the writer’s observation, there are many students of the
second grade at SMA Mathla’ul Huda Parung Panjang Bogor who have
difficulties in comprehending a narrative text; they could not find the major
elements of the narrative text including setting, character, conflict or problem, the
goal and resolution in the text based on the writer’s observation. Moreover, they
could not get the main idea and supporting details of the text. Consequently, most
of the students think that reading comprehension is a hard activity to do. Panatda
states that students who faced English as a foreign language have low ability in
reading comprehension; they cannot reorganize and connect the new information
from the text with their own knowledge.7
Moreover, most of the students think twice to read comprehendly the
text given. It can be seen when they prefer to answer the question given suddenly,
without read the text deeper. In addition, commonly the students are taught
through conventional method like delivering the material without any interesting
action in teaching and learning process of reading comprehension. Therefore,
students are getting low in their achievements.
In summary, the students face some problems in reading
comprehension activities. First, students have difficulties in getting information
from the text, in this case is narrative text. Then, this situation brings the students
have low achievements in reading activity. In addition, the teaching and learning
process of reading comprehension runs conventionally in class. It makes the
students think twice to do reading activity, moreover reading is a long activity.
Considering that facts, the writer suggests mind mapping as the
technique for teaching reading comprehension. Drawing mind mapping is an
activity which makes the brain easier to accept and remember visually
stimulating, multi-coloured mind maps, rather than monotonous, boring linear
7 Panatda Siriphanich, Using Mind Mapping Technique to Improve Students’ Reading
Comprehension of Thai EFL University Students (The 2nd International Conference on
Humanities and Social Sciences April 10th, 2010 Faculty of Liberal Arts, Prince of Songkla
University).
4
notes.8
Theoritically, it can be concluded that mind mapping is a creative
technique which let the students to get success in remembering ideas or
comprehending written information. Moreover, this technique enables students to
associate story through pattern, keyword, or symbol.
The writer considers that mind mapping can be an alternative technique
for students when doing reading comprehension in achieving their academic
success later. The writer takes a quasi-experimental research design to get the
evidence about whether mind mapping technique can improve students’ reading
comprehension of narrative text. Mind-mapping is supposed to be an interesting
alternative technique that will help the students to organize their ideas about the
text they have read by their own schema, so that they can comprehend the text
easily. This study focuses on students’ mind-mapping in interpreting the text, not
on their creativity.
Finally, based on the explanation above, the writer entitles this study
“The Effectiveness of Using Mind Mapping in Students’ Reading Comprehension
of Narrative Text (Quasi-Experimental Study at the Second Grade of
SMAMathla’ul Huda Parung Panjang Bogor).”
B. The Problem of the Study
Based on the background above, there are some identified problems:
1. Reading comprehension of English text still becomes a hard activity to
do for students, because they still have difficulties in getting
information from text, especially narrative text.
2. Students’ reading comprehension achievements are low.
3. The teaching and learning process of reading comprehension runs
conventionally in class.
8Tony Buzan and Barry Buzan, The Mind Map Book (London: BBC Worldwide
Limitied, 2002), p.82.
5
C. The Limitation of the Problem
This study spesifically deals with teaching and learning process of
reading comprehension in narrative text at the second grade of SMA Mathla’ul
Huda Parung Panjang Bogor. This study intends to measure whether or not mind
mapping technique is effective in improving students’ reading comprehension
achievement of narrative text.
D. The Formulation of the Problem
Based on the background above, the writer formulates the problem
question: “Is mind mapping effective to improve students’ reading comprehension
achievement at the second grade of SMA Mathla’ul Huda Parung Panjang
Bogor?”
E. The Objective of the Study
The study is intended to find the empirical evidence of mind mapping’s
effectiveness in improving students’ reading comprehension, especially for
narrative text.
F. The Significance of the Study
The result of the study is expected to be useful for the writer herself;
hence, it will enrich her knowledge in teaching reading. Besides, it can be the
English teachers reference in stimulating their students to read and comprehend
the various reading materials by using mind mapping in the teaching and learning
of reading comprehension. Finally, the students can be motivated to read more,
hence they can improve their reading comprehension.
6
CHAPTER II
LITERATURE REVIEW
This chapter explains about reading, reading comprehension, purposes
of reading, narrative text, mind mapping, teaching reading comprehension through
mind mapping, previous studies, conceptual framework, and hypotheses.
Specifically, reading comprehension theories deliver into some points: the
definition of reading comprehension and the factor influencing reading
comprehension. While mind mapping theories state into some points: the concept
of mind mapping, the purposes of mind mapping, the procedure of mind mapping,
and the advantages and disadvantages of mind mapping.
A. Reading
Reading is the skill or activity of getting information from books. It is
an important skill for students to learn. Hence, a student who is not engaged in
reading activity, he/she will miss new information. Harmer states that reading is
useful for language acquisition; the more the students read, the better they get at
it. In addition, reading also has positive effect on students‟ vocabulary knowledge,
on their spelling, and on their writing.1 Mc Donough supports by stating reading is
clearly one of the most important.2
In order to know correctly what reading is, there are some definitions of
reading below based on some experts.
Grabe states that reading is the ability to draw meaning from the printed
page and interpret this information appropriately.3
McLaughin as cited by Barbara Hawkins points out that reading is the
most complex and difficult skills than others that the child must acquire in
1Jeremy Harmer, The Practice of English Language Teaching-4thEd., (Oxford:
Pearson Longman, 2007), p.99. 2Jo Mc Donough and Christopher Shaw, Materials and Methods in ELT: A Teacher’s
Guide-2nd, (Malden: Blackwell Publishing, 2003), p.89. 3William Grabe and Fredricka L.Stoller, Teaching and Researching Reading, (Oxford:
Pearson Education, 2002), p.9.
7
school.4 In addition, based on Goodman, reading is a selective process which
involves partial use of available minimal language cues selected from perceptual
input on the basis of the reader‟s expectation. As this partial information is
processed, tentative decisions are made to be confirmed, rejected or refined as
reading progresses.5
In summary, reading is the way to get some ideas and information from
written text through continously process in which the reader can make a decision
to confirm, reject, or refine the ideas itself. In line with Grabe‟s statement before,
the writer do agree that reading is a kind of activity that people need to interpret
the printed page through drawing the meaning of that page. Based on the writer
research, drawing the meaning helps readers to easily understand what they
interpret from the text. Here, the writer interprets „drawing the meaning‟ by
linking these words with drawing the readers interpretation of the text through
mind mapping. For visual readers and especially students, it really helps them to
understand the text well.
B. Reading Comprehension
1. The Definition of Reading Comprehension
Comprehension is the ability to understand completely and be familiar
with a situation, facts, etc. Comprehension is not a single unitary process. It starts
from the moving of words on the page to meaning in the mind, the recognizing of
individual words by using memory and knowledge of letter and sound patterns,
matching the resulting pronunciations to meaning, and finally connects these
words into idea units.6
4Barbara Hawkins, Teaching Children to Read in a Second Language,Teaching
English as A Second or Foreign Language, 2nd Ed. Marianne Celce-Murcia, (Boston: Heinle &
Heinle, 1991), p. 169. 5Goodman, K. (1970). Reading as a psychologistic guessing game. In H. Singer and
R. b. Ruddell . (Eds). Theoretical models and Processes of Reading. Newark, (N.J.: International
reading Association), p.260 as be cited by Parviz Ajideh, Schema Theory-Based Pre-Reading
Tasks: A Neglected Essential in The ESL Reading Class (The Reading Matrix Vol.3. No.1, April
2003), p.1. 6JoAnne Schudt Caldwell, Comprehension Assessment-A Classroom Guide, (New
York: The Guildford Press, 2008), p.5.
8
In line with the statements above, Wiggens and McTighe concludes six
facets of understanding or comprehension. The first is explanation or
understanding of why and how. The second facet is interpretation. The third facet
is application or the ability to use knowledge in new situations and contexts. The
fourth facet is perspective. The fifth facet is empathy for the feelings and views of
others. The sixth facet is self-knowledge.7 Thus, it can be concluded that
comprehension is the ability to get enlightenment on something through several
steps in process.
Snow cited by Kurniawan states reading comprehension as the process
to get a precise understanding of the writer‟s message through simultaneously
extracting and constructing meaning by collaborating reader‟s background
knowledge and interaction and involvement.8 In line with this, Grabe explains that
reading comprehension is the interaction of information between the reader‟s
drawing information from a text and the reader‟s expectations or information
about the text that already has.9
Lems concludes that reading comprehension is not a static competency.
It depends on reader‟s purpose to read and reader‟s basic knowledge with the text
in used. In addition, the role of strategies helps the reading comprehension
achieved.10
Wilhelm cited in Kurniawan‟s writing defines that reading
comprehension is the degree to which the readers understand what the readers
read. It is the ultimate end-goal of reading that if the readers do not read to
understand, the readers will read for nothing; Comprehension requires the reader
to be an active constructor of meaning.11
7Ibid., p. 36-37.
8Ashadi Kurniawan, Improving Students’ Reading Comprehension on Narrative Text
Through Story Mapping Strategy (skripsi, teacher training and education faculty, Tanjungpura
University, Pontianak, 2013), p.4. 9William Grabe and Fredricka L. Stoller, Reading for Academic Purposes: Guidelines
for the ESL/EFL Teacher, Teaching English as A Second or Foreign Language, 3rd Ed. Marianne
Celce-Murcia (Boston: Heinle & Heinle, 2001), p.188. 10Kristin Lems, et.al.,Teaching Reading to English Languager Learners: Insight from
Linguistics, (New York: The Guildford Press, 2010), p.170. 11Ashadi Kurniawan, Op.Cit.
9
Based on those definitions above, reading is an important activity used
in learning process, but it becomes more useful when the readers can comprehend
what they read. Overall, reading comprehension can be concluded as the ability to
understand the meaning or idea in the written text completely and chronically.
Eventhough reading comprehension has long process, what the readers get are
comparable with the process itself.
In line with those theories, the writer concludes that reading
comprehension ability is a must for people to have it. Based on the writer‟s
research, students need to comprehend what they read in order to get academic
success. Of course, reading comprehension is a long activity, but with the
appropriate technique for each student/reader, it is not possible that the long
activity becomes an interesting long activity that makes the students/readers enjoy
and can easily comprehend what they rea.
2. The Factors Influencing Reading Comprehension
It is undeniable that students‟ ability to comprehend the print that they
meet in the class depend on their ability to understand both what a writer says and
what they do not say, except between the lines.12
Comprehension is an active
process which engages the interaction between the reader‟s construct meaning and
the information of the text itself.13
Therefore, comprehending depends on the
ability:
a) to evaluate and make a judgment,
b) to distinguish between what an author offers as facts and the author‟s
opinions about those facts,
c) to recognize the difference between what is fact and what is assumed to be
fact,
d) to compare,
e) to categorize,
f) to grasp the explanation of a process,
12 Dorothy Piercey, Reading Activities in Content Area-2nd Ed (Boston: Allyn and
Bacon, 1982) p. 26. 13Ashadi Kurniawan, Op.Cit.
10
g) to identify an author‟s theme,
h) to know characters,
i) to recognize a main idea and the data that support it,
j) to distiguish between cause and effect.
In doing comprehension, it cannot be denied that there are several
factors which influencing the reader to become good or poor comprehender.
Perfetti as in Jane V. Oakhill‟s writing suggests that comprehension difficulties
arise mainly because certain processes that can potentially become relatively
automatic fail to become so.14
Paris states five foundations of comprehension:15
a) Conceptual knowledge.
In developing the students‟ comprehension, they need to be familiar with the
concept of the text like the plot and the character‟s thought of the story.
b) Language skills.
The mastery of language skills prove the better comprehension of students
later. It means that a student who at least had mastered one skill, he/she can
easily comprehend the text. As example, the students who good in vocabulary
can easily do reading comprehension.
c) Text features.
In line with the conceptual knowledge, the students need to know how the
concepts of genres, the schematic structures of texts, the titles, and many
terms that related to the meaning of texts. It is used to help the students to
construct the meaning from any types of texts.
d) Strategies.
14Jane V. Oakhill and Kate Cain, Assessment of comprehension in reading, The
Psychological Assessment of Reading, John R. Beech and Chris Singleton (London: Routledge,
1997), p. 178. 15Dr. Scott Paris, Developing Comprehension Skills,
http://media.wix.com/ugd/37184e_2c198e440de641efab7a9f78e2be47c3.pdf (Accessed on
February 9th, 2014).
11
It is undeniable that students need a variety of strategies in helping them
learning reading comprehension. The appropriate strategies will make them
easier to comprehend the text, such as summarizing and paraphrasing
important information or asking and aswering questions.
e) Fluent decoding.
Comprehension is difficult when the students only focused on how the words
in a text pronounce correctly. In fact, it is easier when the students learn how
to automatically decoding and recognizing the words quickly and accurately.
In conclusion, the comprehension process is a long activity that has
influencing factors in its process. The plus or the minus of influencing factors
depend on the students‟ decision, whether or not they want to maximize the
information gotten from what they read. When they want to take the benefit from
the reading comprehension, they can improve their reading skill through some
points of views above. If they are not, they will just get the information without
the experience.
C. The Purposes of Reading
When people decide to read, it means that they have a purpose. Even
when they read novel for pleasure, at least they want to get information about the
story. Like Nuttall‟s statement, people read because they wanted to get something
from the writing; whatever it was, people wanted to get the message that the
writer had expressed.16
There are many experts define about the purpose of reading. Generally,
their definition state that reading has two main purposes: reading for pleasure and
reading for getting information. Here are some reasons below.
Rivers and Temperley list the reason for reading as below17
:
1. to obtain information for some purpose or because curious about some topic,
2. to obtain instructions on how to perform some task for work or daily life,
16Christine Nuttall, Teaching Reading Skills in a Foreign Language, (Portsmouth:
Heinemann, 1989), p.3. 17Jo Mc Donough and Christopher Shaw, Op.Cit., p.90.
12
3. to keep in touch with friends by correspondence or to understand bussiness
letters,
4. to know when or where something will take place or what is available,
5. to know what is happening or has happened (as reported in newspapers,
magazines, reports),
6. for enjoyment or excitement.
Grabe on his books concludes the purpose of reading into some point,
they are:18
1. Reading to search for simple information and reading to skim quickly.
2. Reading to learn from texts.
3. Reading to integrate information, write, and critique texts.
4. Reading for general comprehension.
To sum up, when the students have purpose in reading materials, it will
let the students to be more focus on what they want to get. Whatever the purpose,
the students will have new information and will be useful for their needs when the
purpose has decided. Moreover, through the suitable technique in comprehending
their reading materials, the students will be more focus in the learning process and
maximize the information gotten.
D. Narrative Text
There are some kind of texts which are learnt at school by the second
grade students of senior high school and narrative takes a part. Narration is any
written English text in which the writer wants to amuse, entertain people, and to
deal with actual or vicarious experience in different ways.19
Narrative uses
conflicts among the participants, either natural conflict, social conflict or
psychological conflict. In some ways, a narrative text combines all these conflicts.
Thus, commonly narrative text is found in story book.20
18William Grabe and Fredricka L.Stoller, Op.Cit., p.13-15. 19Sanggam Siahaan and Kisno Shinoda, Generic Text Structure (Yogyakarta: Graha
Ilmu, 2008), p.73. 20Anis Apriliawati, Comprehending Text Types (Bekasi: Ganesha Exact, 2009),p.39.
13
In addition, there are steps for constructing a narrative text: orientation,
complication, sequence of events, resolution, and coda (an optional step).
1. Orientation includes who is in the story, when the story is taking place, and
where the action is happening.
2. Complication sets off a chain of events that influences what will happen in
the story.
3. Sequence of events tells how the characters react to the complication.
4. Resolution shows how the characters solve the problem created in the
complication.
5. Coda provides a comment or moral based on what has been learned from the
story (an optional step).21
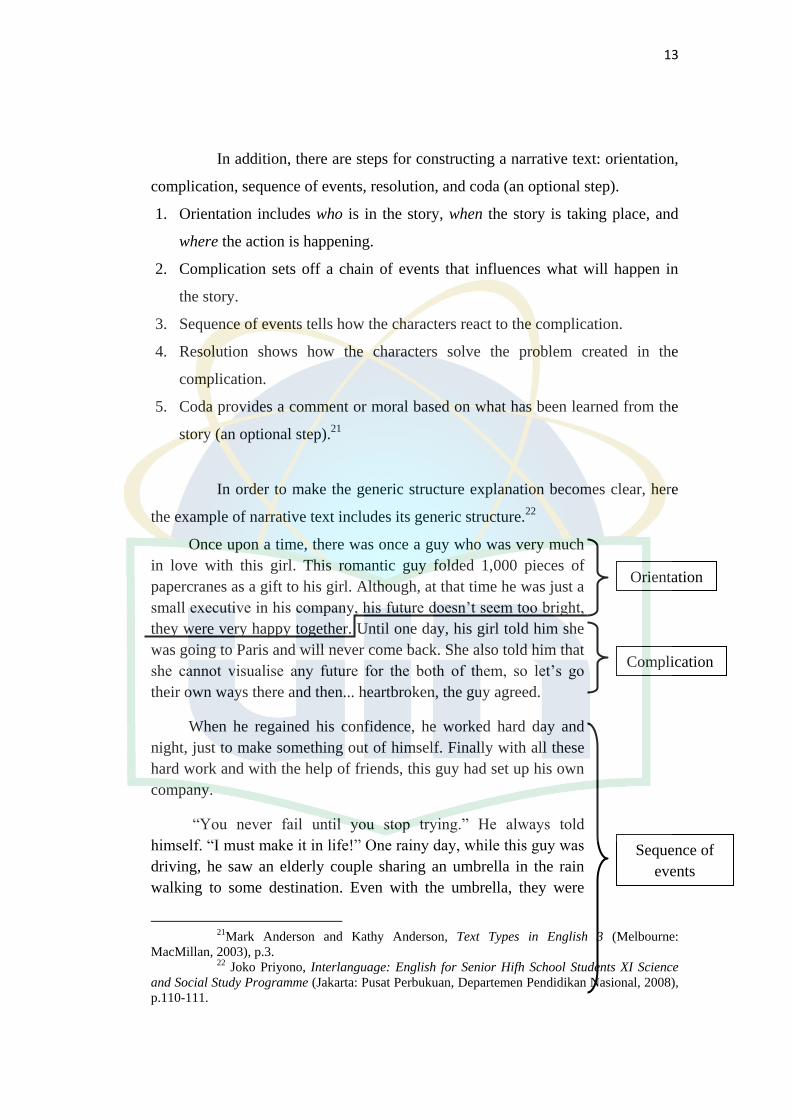
In order to make the generic structure explanation becomes clear, here
the example of narrative text includes its generic structure.22
Once upon a time, there was once a guy who was very much
in love with this girl. This romantic guy folded 1,000 pieces of
papercranes as a gift to his girl. Although, at that time he was just a
small executive in his company, his future doesn‟t seem too bright,
they were very happy together. Until one day, his girl told him she
was going to Paris and will never come back. She also told him that
she cannot visualise any future for the both of them, so let‟s go
their own ways there and then... heartbroken, the guy agreed.
When he regained his confidence, he worked hard day and
night, just to make something out of himself. Finally with all these
hard work and with the help of friends, this guy had set up his own
company.
“You never fail until you stop trying.” He always told
himself. “I must make it in life!” One rainy day, while this guy was
driving, he saw an elderly couple sharing an umbrella in the rain
walking to some destination. Even with the umbrella, they were
21Mark Anderson and Kathy Anderson, Text Types in English 3 (Melbourne:
MacMillan, 2003), p.3. 22 Joko Priyono, Interlanguage: English for Senior Hifh School Students XI Science
and Social Study Programme (Jakarta: Pusat Perbukuan, Departemen Pendidikan Nasional, 2008),
p.110-111.
Orientation
Complication
Sequence of
events
14
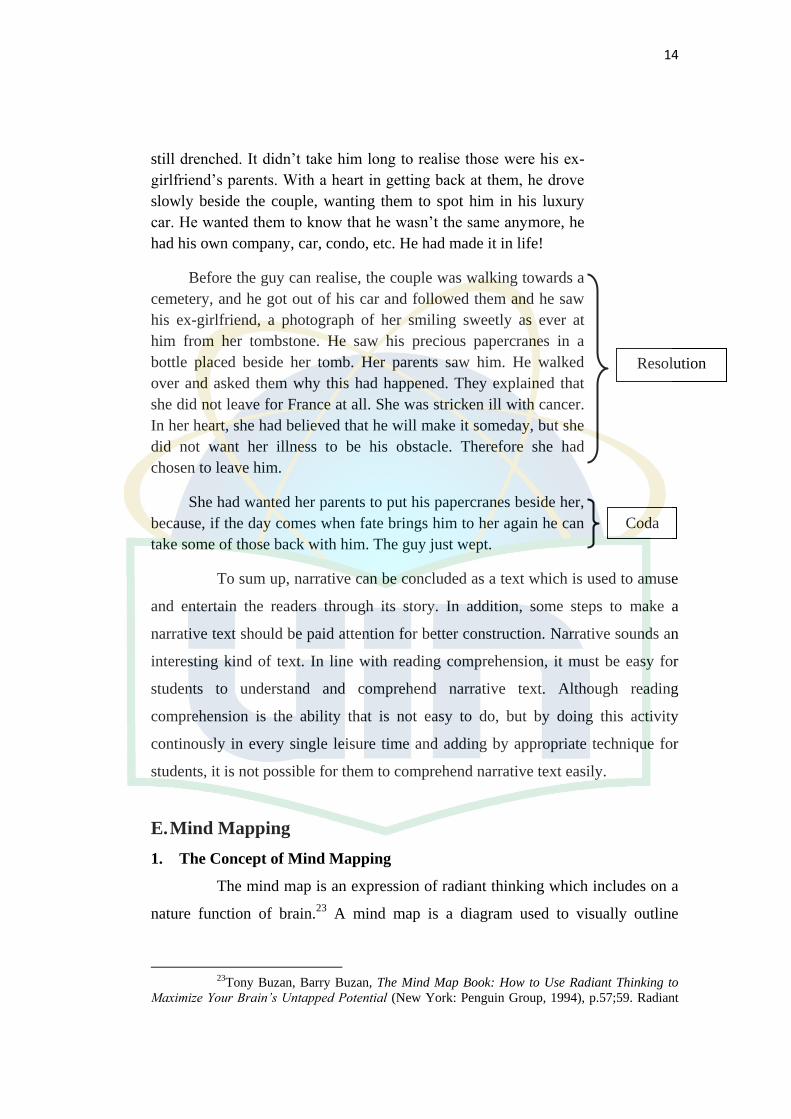
still drenched. It didn‟t take him long to realise those were his ex-
girlfriend‟s parents. With a heart in getting back at them, he drove
slowly beside the couple, wanting them to spot him in his luxury
car. He wanted them to know that he wasn‟t the same anymore, he
had his own company, car, condo, etc. He had made it in life!
Before the guy can realise, the couple was walking towards a
cemetery, and he got out of his car and followed them and he saw
his ex-girlfriend, a photograph of her smiling sweetly as ever at
him from her tombstone. He saw his precious papercranes in a
bottle placed beside her tomb. Her parents saw him. He walked
over and asked them why this had happened. They explained that
she did not leave for France at all. She was stricken ill with cancer.
In her heart, she had believed that he will make it someday, but she
did not want her illness to be his obstacle. Therefore she had
chosen to leave him.
She had wanted her parents to put his papercranes beside her,
because, if the day comes when fate brings him to her again he can
take some of those back with him. The guy just wept.
To sum up, narrative can be concluded as a text which is used to amuse
and entertain the readers through its story. In addition, some steps to make a
narrative text should be paid attention for better construction. Narrative sounds an
interesting kind of text. In line with reading comprehension, it must be easy for
students to understand and comprehend narrative text. Although reading
comprehension is the ability that is not easy to do, but by doing this activity
continously in every single leisure time and adding by appropriate technique for
students, it is not possible for them to comprehend narrative text easily.
E. Mind Mapping
1. The Concept of Mind Mapping
The mind map is an expression of radiant thinking which includes on a
nature function of brain.23
A mind map is a diagram used to visually outline
23Tony Buzan, Barry Buzan, The Mind Map Book: How to Use Radiant Thinking to
Maximize Your Brain’s Untapped Potential (New York: Penguin Group, 1994), p.57;59. Radiant
Resolution
Coda
15
information which often created around a single word or text, placed in the center,
to which associated ideas, words, and concepts are added. Major categories
radiate from a central node and lesser categories are sub-branches of larger
branches. Categories can represent words, ideas, tasks, or other items related to a
central key word or idea.
Based on the definition above, it can be concluded that a mind-map is a
creative way to represent idea or information through diagram.
Mind mapping is a method to optimize learning capacities and
understanding of how the elements of complex structures are connected. Buzan
cited by Maier, “Mind-mapping was designed to use both sides to increase
memory retention and productivity.”24
It is because the brain works in different
ways; different people think in different ways. However, while students thinking
and reasoning follow a structure that is personal to theirselves, they still use a
number of techniques that apply to most people. There are four essential
characteristics of mind mapping:25
a) The subject of attention is crystallised on a central image.
b) The main theme of the subject radiate from the sentral image as branches.
c) Branches comprise a key image or key word printed on an associated line.
Topic of lesser are also represented as branches attached to higher level
branches.
d) The branches form are a connected modal structures.
Mind map may be enhanced and enriched through colour, pictures,
codes, and dimension to add interest, beauty, and individuality. This is used to
help in increasing creativity, memory and specifically the recall of information.26
There are several principles in making mind mapping, as states below:27
a) Use emphasis
Thinking refers to associative thought processes that proceed from or connect to central point;
burst of thought. 24P.S. Meier, Mind-mapping-a tool for eliciting and representing knowledge held by
diverse informants (Guildford: University of Surrey, 2007), p.1. 25Tony Buzan, TheMind Map Book: How to Use....Op.Cit., p.59. 26
Ibid., p.60. 27Tony Buzan and Bary Buzan, The Mind Map Book, (London: BBC Worldwide
Limited, 2000), p.87-88.
16
1) Always use a central image.
2) Use images throughout personal mind map.
3) Use three or more colours per central image.
4) Use dimension in images and around words.
5) Use synaesthesia (the blending of the physical senses).
6) Use variations of size of printing, line, and image.
7) Use organised spacing.
8) Use appropriate spacing.
b) Use association
1) Use arrows when want to make connections within and across the branch
pattern.
2) Use colours.
3) Use codes.
c) Be clear
1) Use only one key word per line.
2) Print all words.
3) Print key words on lines.
4) Make line length equal to word length.
5) Make major branches connect to central image.
6) Connect lines to other lines.
7) Make the central lines thicker.
8) Make the boundaries „embrace‟ the branch outline.
9) Make the images as clear as possible.
10) Keep the paper placed horizontally.
11) Keep the printing as upright as possible.
d) Develop a personal style
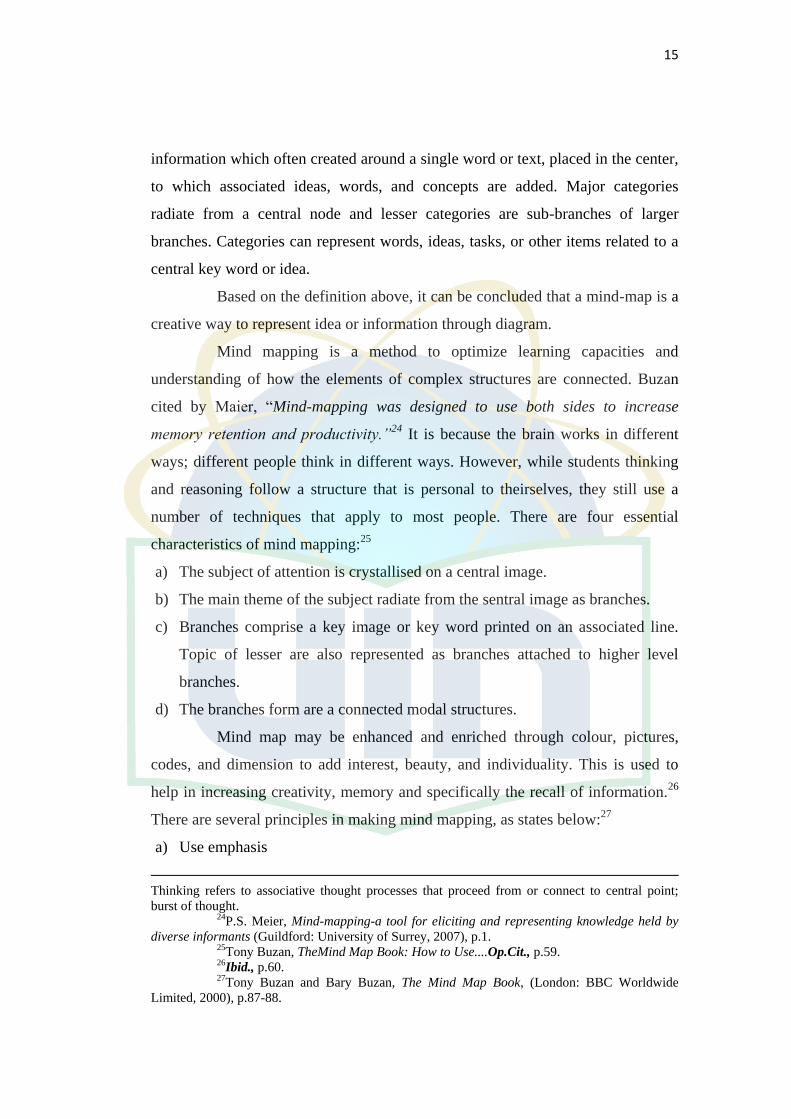
In summary, mind mapping can be maximized in using through colors,
pictures, and connections. These terms will be more useful when the students also
use their creativity in the process. It is undeniable that creativity lets the students
to think free in mapping their minds about the reading materials. Hence, the
students can comprehend the reading materials much easier.
17
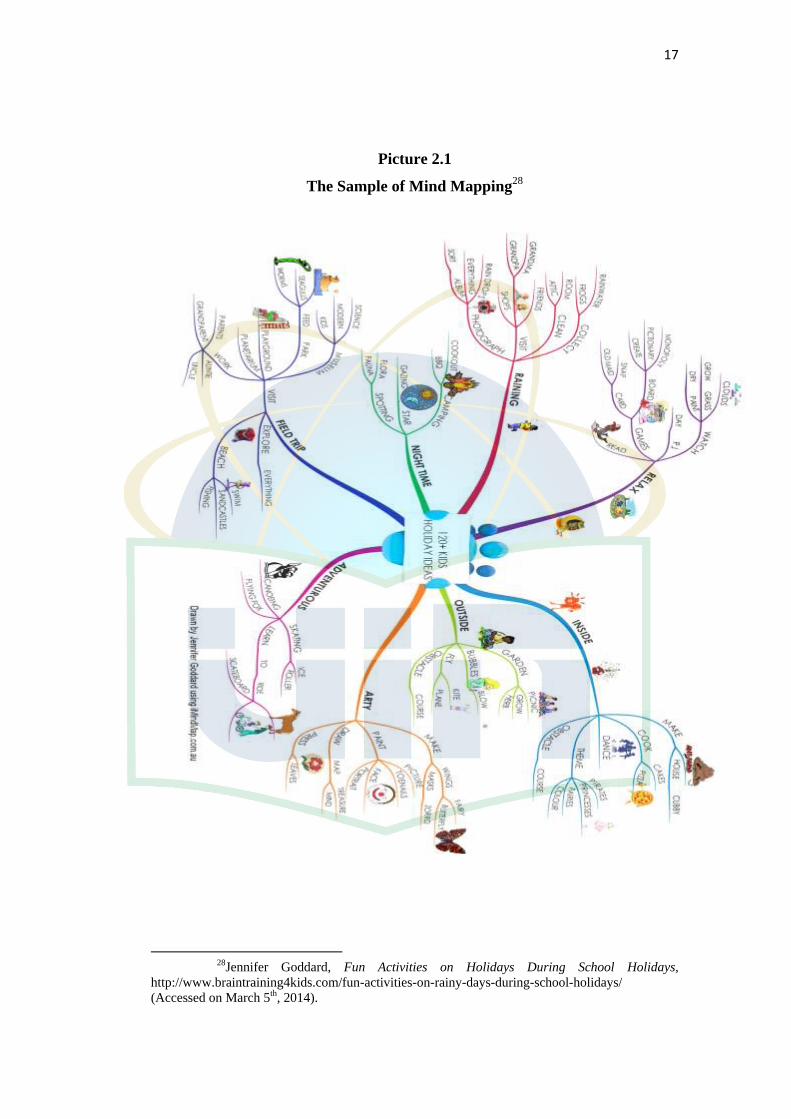
Picture 2.1
The Sample of Mind Mapping28
28Jennifer Goddard, Fun Activities on Holidays During School Holidays,
http://www.braintraining4kids.com/fun-activities-on-rainy-days-during-school-holidays/
(Accessed on March 5th, 2014).
18
2. The Purposes of Mind Mapping
Everything happens for a purpose. As the way to help the students
easier in reading comprehension, using mind mapping also has purpose.
Generally, the purpose of mind mapping is to associate between ideas, topics or
things.29
Besides, there are several specific purposes of mind mapping below:30
a) Mind mapping activates whole brain.
b) Mind mapping fixes the mental tangled.
c) Mind mapping lets the students focus on main explanation.
d) Mind mapping helps to show the relationship between the separated
information parts.
e) Mind mapping gives clear description wholly and specifically.
f) Mind mapping lets the students to group the concept and compare it.
Based on the explanation above, mind mapping is hoped to help the
students in getting better learning process. By activating the whole brain
activities, it can be concluded that mind mapping is expected to make the students
easier in comprehending the text or written information.
3. The Procedure of Mind Mapping
Making mind mapping is easy. The students can remember many
information through this way. Here are several steps to make mind mapping:31
a) Starting from the center of the blank paper. It is better to rotate the paper, so
you can use it horizontally (it helps the brain feels free to spread the ideas).
b) Using picture or photo as the central of the idea. A picture has thousand
meanings and help the students to use their imagination. A central picture
makes the students focus, concentrate, and feel interested in what they are
mapping.
29Martin Davies, Concept Mapping, MindMapping and ArgumentMapping: What are
The Differences and Do They Matter?(Springer Science+Business Media B.V, 2010), p.11. 30
Tony Buzan, Buku Pintar Mind Map, terj. Susi Purwoko (Jakarta: Gramedia Pustaka
Utama, 2013), p.6. 31
Ibid., Tony Buzan, p.15-16.
19
c) Using colors. Colors have same role as pictures, brain will stimulate an idea
through colorful form. It gives mind map more alive and adds creative
thinking energy for the students.
d) Linking the main branches with the central picture and linking within the
supporting branches. An association has important role in brain activity, by
linking two or more things will make the students easier to understand and
remember.
e) Making curved line, not straight line. The straight line will only make the
brain bored.
f) Using only a keyword to every single line. This is used to give flexibility in
making the mind map.
g) Using pictures. Every single picture has thousand meanings as same as
central picture.
4. The Advantages and Disadvantages of Mind Mapping
Mind mapping as a technique to help the students in learning reading
comprehension cannot be separated with the advantages and disadvantages in its
use. Facilitating these problems, the writer states several views below for these
terms.
Those few headlines shows the advantages of using mind maps
whenever students want to get things done faster, more effectively, and with better
end results. Here are some advantages:32
a) Mind map helps the students to speed up their think rapidity.
b) Mind map takes the students to develop new ideas quickly.
c) Mind map gives easy way for the students to plan, communicate, be creative,
arrange, and explain the ideas fastly and efficiently when they want to work
with others.
d) Mind map facilitates the students to understand a complicated system or
structure because mind map delivers the students to be focused on the ideas.
32
Ibid., Tony Buzan, p. 6;110.
20
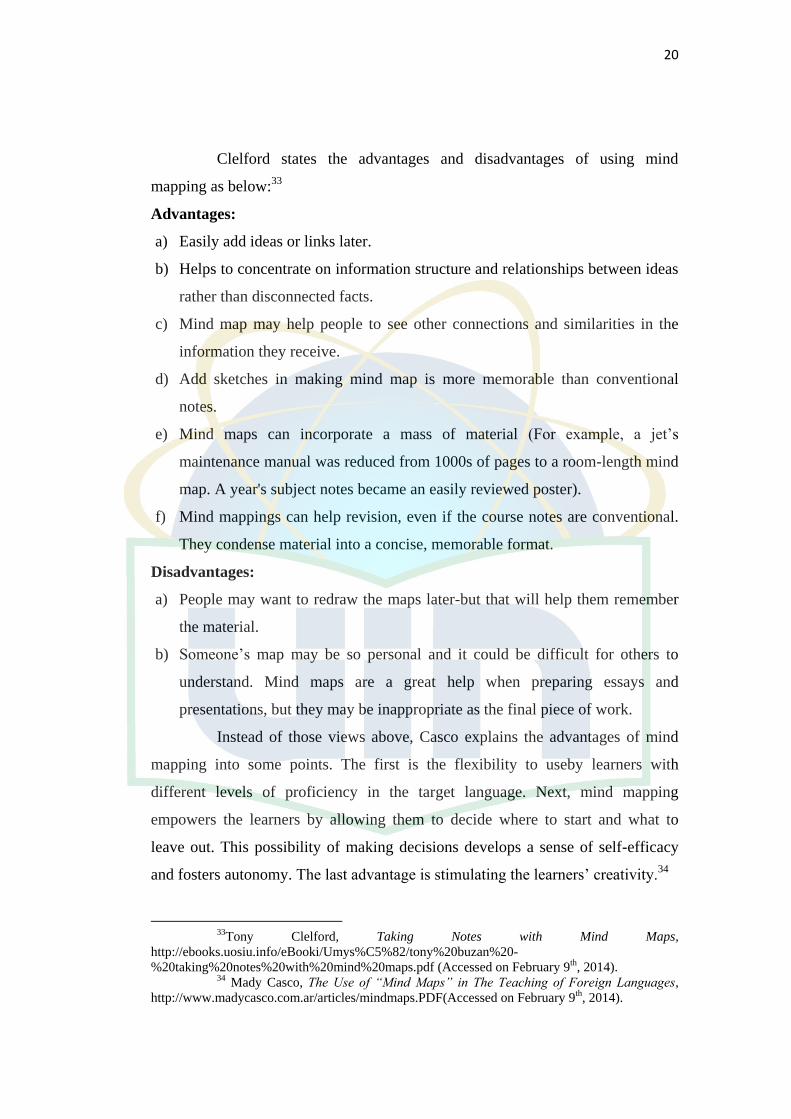
Clelford states the advantages and disadvantages of using mind
mapping as below:33
Advantages:
a) Easily add ideas or links later.
b) Helps to concentrate on information structure and relationships between ideas
rather than disconnected facts.
c) Mind map may help people to see other connections and similarities in the
information they receive.
d) Add sketches in making mind map is more memorable than conventional
notes.
e) Mind maps can incorporate a mass of material (For example, a jet‟s
maintenance manual was reduced from 1000s of pages to a room-length mind
map. A year's subject notes became an easily reviewed poster).
f) Mind mappings can help revision, even if the course notes are conventional.
They condense material into a concise, memorable format.
Disadvantages:
a) People may want to redraw the maps later-but that will help them remember
the material.
b) Someone‟s map may be so personal and it could be difficult for others to
understand. Mind maps are a great help when preparing essays and
presentations, but they may be inappropriate as the final piece of work.
Instead of those views above, Casco explains the advantages of mind
mapping into some points. The first is the flexibility to useby learners with
different levels of proficiency in the target language. Next, mind mapping
empowers the learners by allowing them to decide where to start and what to
leave out. This possibility of making decisions develops a sense of self-efficacy
and fosters autonomy. The last advantage is stimulating the learners‟ creativity.34
33Tony Clelford, Taking Notes with Mind Maps,
http://ebooks.uosiu.info/eBooki/Umys%C5%82/tony%20buzan%20-
%20taking%20notes%20with%20mind%20maps.pdf (Accessed on February 9th, 2014). 34 Mady Casco, The Use of “Mind Maps” in The Teaching of Foreign Languages,
http://www.madycasco.com.ar/articles/mindmaps.PDF(Accessed on February 9th, 2014).
21
From those explanation above, it can be concluded that mind mapping
naturally just a technique which has both positive and negative things inside.
Oftentimes, the learners can take the advantages through this technique,
meanwhile the disadvantages cannot be separated from its use. Hence, it depends
on the user to maximize the advantages of using mind mapping.
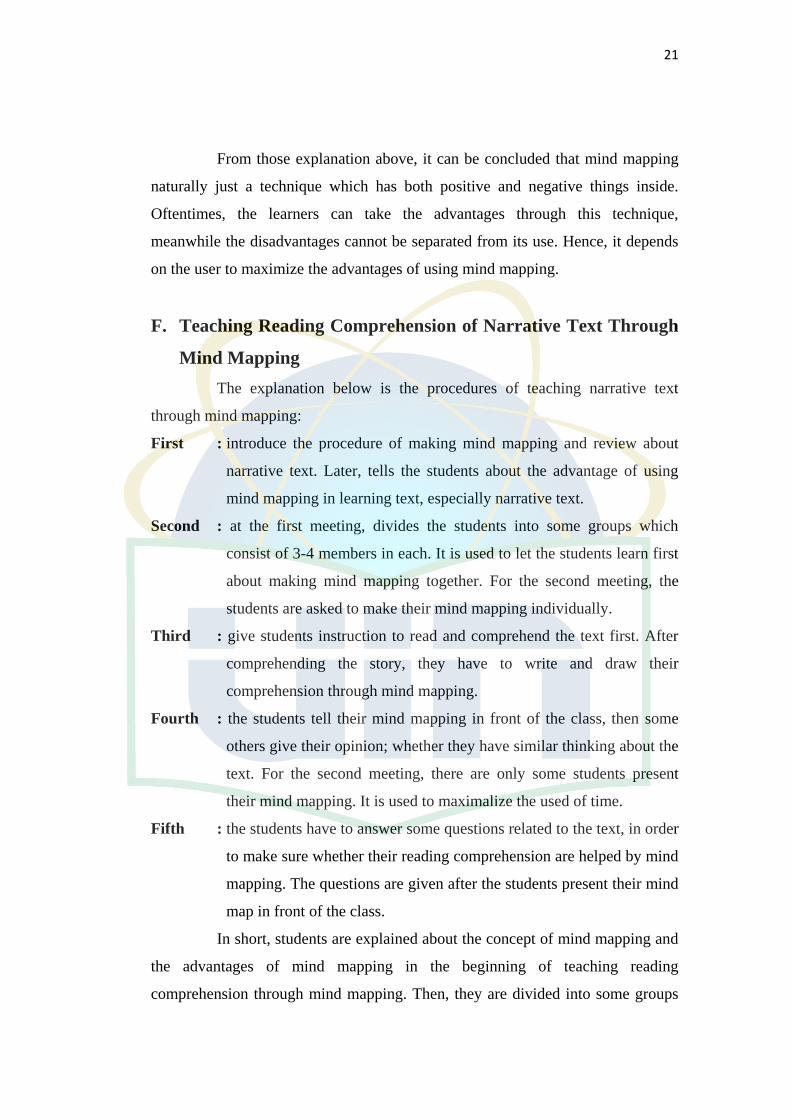
F. Teaching Reading Comprehension of Narrative Text Through
Mind Mapping
The explanation below is the procedures of teaching narrative text
through mind mapping:
First : introduce the procedure of making mind mapping and review about
narrative text. Later, tells the students about the advantage of using
mind mapping in learning text, especially narrative text.
Second : at the first meeting, divides the students into some groups which
consist of 3-4 members in each. It is used to let the students learn first
about making mind mapping together. For the second meeting, the
students are asked to make their mind mapping individually.
Third : give students instruction to read and comprehend the text first. After
comprehending the story, they have to write and draw their
comprehension through mind mapping.
Fourth : the students tell their mind mapping in front of the class, then some
others give their opinion; whether they have similar thinking about the
text. For the second meeting, there are only some students present
their mind mapping. It is used to maximalize the used of time.
Fifth : the students have to answer some questions related to the text, in order
to make sure whether their reading comprehension are helped by mind
mapping. The questions are given after the students present their mind
map in front of the class.
In short, students are explained about the concept of mind mapping and
the advantages of mind mapping in the beginning of teaching reading
comprehension through mind mapping. Then, they are divided into some groups
22
to draw their own mind mapping. After that, they are asked to comprehend
narrative text in group which later they are asked to draw its mind mapping based
on what they comprehend about the text. Then, they have to present their mind
mapping in front of the class. at the end of the presentation, the students discuss
whether or not each group of students have similar idea about the text. Finally, the
students have to answer the questions about the text. It is used to know their
comprehension. In this case, the teacher has role as facilitator.
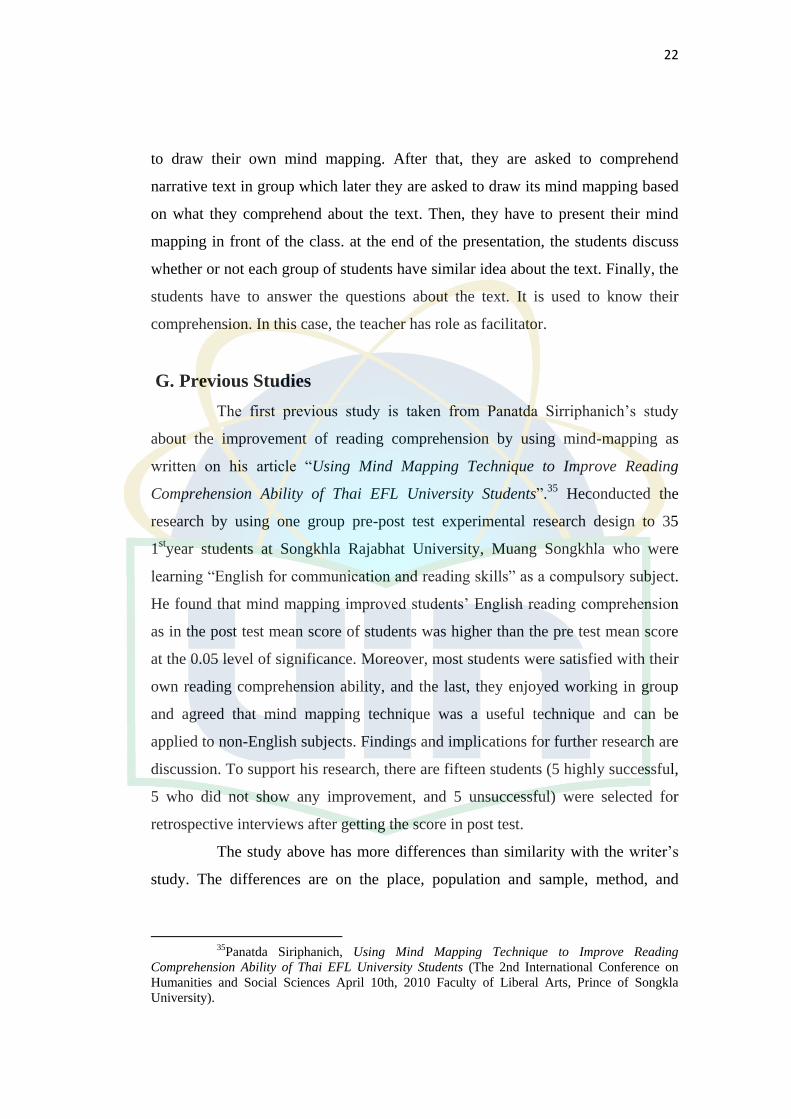
G. Previous Studies
The first previous study is taken from Panatda Sirriphanich‟s study
about the improvement of reading comprehension by using mind-mapping as
written on his article “Using Mind Mapping Technique to Improve Reading
Comprehension Ability of Thai EFL University Students”.35
Heconducted the
research by using one group pre-post test experimental research design to 35
1styear students at Songkhla Rajabhat University, Muang Songkhla who were
learning “English for communication and reading skills” as a compulsory subject.
He found that mind mapping improved students‟ English reading comprehension
as in the post test mean score of students was higher than the pre test mean score
at the 0.05 level of significance. Moreover, most students were satisfied with their
own reading comprehension ability, and the last, they enjoyed working in group
and agreed that mind mapping technique was a useful technique and can be
applied to non-English subjects. Findings and implications for further research are
discussion. To support his research, there are fifteen students (5 highly successful,
5 who did not show any improvement, and 5 unsuccessful) were selected for
retrospective interviews after getting the score in post test.
The study above has more differences than similarity with the writer‟s
study. The differences are on the place, population and sample, method, and
35Panatda Siriphanich, Using Mind Mapping Technique to Improve Reading
Comprehension Ability of Thai EFL University Students (The 2nd International Conference on
Humanities and Social Sciences April 10th, 2010 Faculty of Liberal Arts, Prince of Songkla
University).
23
design of the study. The only similarity with the writer‟s study is on the use of
mind mapping as the way to know the effectiveness in reading comprehension.
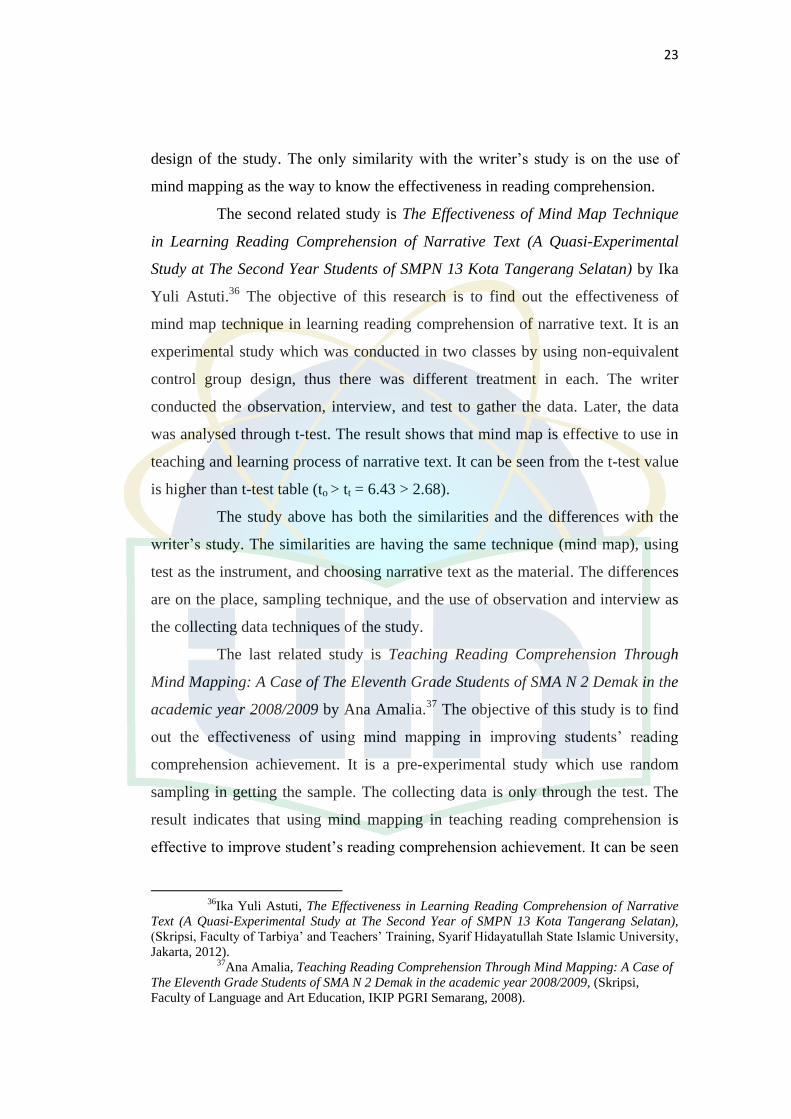
The second related study is The Effectiveness of Mind Map Technique
in Learning Reading Comprehension of Narrative Text (A Quasi-Experimental
Study at The Second Year Students of SMPN 13 Kota Tangerang Selatan) by Ika
Yuli Astuti.36
The objective of this research is to find out the effectiveness of
mind map technique in learning reading comprehension of narrative text. It is an
experimental study which was conducted in two classes by using non-equivalent
control group design, thus there was different treatment in each. The writer
conducted the observation, interview, and test to gather the data. Later, the data
was analysed through t-test. The result shows that mind map is effective to use in
teaching and learning process of narrative text. It can be seen from the t-test value
is higher than t-test table (to > tt = 6.43 > 2.68).
The study above has both the similarities and the differences with the
writer‟s study. The similarities are having the same technique (mind map), using
test as the instrument, and choosing narrative text as the material. The differences
are on the place, sampling technique, and the use of observation and interview as
the collecting data techniques of the study.
The last related study is Teaching Reading Comprehension Through
Mind Mapping: A Case of The Eleventh Grade Students of SMA N 2 Demak in the
academic year 2008/2009 by Ana Amalia.37
The objective of this study is to find
out the effectiveness of using mind mapping in improving students‟ reading
comprehension achievement. It is a pre-experimental study which use random
sampling in getting the sample. The collecting data is only through the test. The
result indicates that using mind mapping in teaching reading comprehension is
effective to improve student‟s reading comprehension achievement. It can be seen
36Ika Yuli Astuti, The Effectiveness in Learning Reading Comprehension of Narrative
Text (A Quasi-Experimental Study at The Second Year of SMPN 13 Kota Tangerang Selatan),
(Skripsi, Faculty of Tarbiya‟ and Teachers‟ Training, Syarif Hidayatullah State Islamic University,
Jakarta, 2012). 37Ana Amalia, Teaching Reading Comprehension Through Mind Mapping: A Case of
The Eleventh Grade Students of SMA N 2 Demak in the academic year 2008/2009, (Skripsi,
Faculty of Language and Art Education, IKIP PGRI Semarang, 2008).
24
from the result of pre-test and post-test; the average score of pre-test = 12,6 and
the standard deviation = 8,88. Meanwhile, the average score of post-test = 21,7
and the standard deviation = 9.
The study above has both the similarities and differences with the
writer‟s study. Mind mapping as the technique studied and test as the instrument
are the similarities in this case, while the differences are on the place, sampling
technique, and the research design.
H. Conceptual Framework
Reading comprehension is one of important English aspects which
should be mastered by students. The fact states, especially in Indonesia, students
can answer the questions correctly when they can comprehend the text in national
exam. In fact, some students are still getting difficult to comprehend the text, so
do in SMA Mathla‟ul Huda Parung Panjang Bogor. They have low achievements
in facing text questions, like getting main idea, supporting details, and even
deciding the schematic structure of the text (narrative). Undeniable, there are
many aspects engage in this problem. Mostly, the problems faced are getting the
main idea and the information stated. This situation is adding up by students‟
reading habit that low; they think that reading is bored activity to do. Jeremy
Harmer states that students need to be engaged with what they are reading. In
other words, the students should be involved in joyful reading.38
Using mind mapping as a technique will help students comprehend
what they read joyfully. As stated before, reading comprehension is important to
be learned to increase students‟ comprehension especially in the target language
text form. By arising students‟ interest in comprehending the text through mind
mapping, students can explore their knowledge and vocabulary in the target
language materials.
Helping students in comprehending what they read, especially narrative
text, is good as long as the technique used be able to increase students‟
38 Jack C. Richards and Theodore S. Rodgers, Approaches and Methods in Language
Teaching, (New York: Cambridge University Press, 1986), p. 9.
25
achievement in reading comprehension materials. In line with this, mind mapping
becomes an alternative way in teaching reading comprehension. This technique is
choosen because it can stimulate the students‟ pleasure in teaching and learning
process of reading comprehension; they are free to write and draw what they
comprehend about the materials.
If students get in used with this technique, the writer assumes that
students get better achievement in reading comprehension. Moreover, it can be
effective in teaching and learning process of reading comprehension in classroom.
Therefore, the writer wants to teach reading comprehension, especially narrative
text, by using mind mapping.
I. Hypotheses
In line with the question of the study, the writer formulates two
hypotheses that be tested by “t” test. According to Creswell, there are two kinds of
hypothesis which have to be made before the researchers do their experimental
research.39
Hypotheses are formulated to draw a connection between two
variables.40
The two hypotheses are null hypothesis (Ho) and alternative
hypothesis (Ha) that described as follows:
1. The Null Hypothesis (Ho)
This hypothesis states that there is no difference mean between the two
groups as population. If the null hypothesis is false, it means that there is a
high probability effectiveness of mind mapping technique. The writer
formulates the null hypothesis (Ho) as follow:
“Using mind mapping technique is not effective in improving students‟
reading comprehension achievement at the second grade students of SMA
Mathla‟ul Huda Parung Panjang Bogor.”
39 John W. Creswell, Educational Research (3rd ed.), (New Jersey: Pearson Prentice
Hall, 2008), p. 137. 40Suharsimi Arikunto, Prosedur Penelitian Suatu Pendekatan Praktik, (Jakarta: PT.
Rineka Cipta, 2006), p. 73.
26
2. The Alternative Hypothesis (Ha)
This hypothesis is the null hypothesis opposite. It is examined statistically.
The writer uses this hypothesis as follows:
“Using mind mapping technique is effective in improving students‟ reading
comprehension achievement at the second grade students of SMA Mathla‟ul
Huda Parung Panjang Bogor.”
27
CHAPTER III
RESEARCH METHODOLOGY
This chapter discusses the research design and method, the place and
time of the research, the population and sample of the research, the data collection
technique, the content of the intervention, the data analysis technique, and the
statistical hypotheses.
A. The Research Design
This research was conducted quantitavely through quasi-experimental
design. McMillan and Schumacher state that quasi-experimental research is a
good design of the research because although it is not true experiments, it
provides reasonable controlled over most sources of invalidity and it is usually
stronger than the pre-experimental design.1 Quasi-experimental design focuses on
treatment and outcome, hence the data was taken from pre-test and post-test in
order to know whether or not mind mapping is effective than expository technique
in improving students’ reading comprehension achievement. In this research
design, there are two kinds of classes used. There are the experimental class
which used mind mapping technique and the controlled class by expository
technique.
B. The Place and Time of The Research
The research was held in SMA Mathla’ul Huda which is located on Jl.
Raya Mohammad Toha No.10, Parung Panjang Bogor 16360. This research was
carried out for a month, start from February 4th
, 2014 to March 4th
, 2014 in the
even semester 2013/2014.
1James H. McMillan and Sally Schumacher, Research in Education-6th ed., (Boston:
Pearson Education, 2006), p. 273.
28
C. The Population and Sample of The Research
A population is a group of elements or cases, whether individuals,
objects, or events, that conform to specific criteria and to which the results of the
research are generalized.2 In this case, the population of this research is the second
grade students of SMA Mathla’ul Huda Parung Panjang Bogor. There are only
two classes of the second class, therefore the technique of sampling that used by
the writer is quota sampling. Quota sampling is used when the researcher is
unable to take a probability sample but is still able to select subjects on the basis
of characteristics of the population.3
In this research, the population were 80 second grade students in two
classes. The writer took XI IPS as the experimental class that has 40 students and
XI IPA as the controlled class that has 40 students. XI IPS was chosen as the
experimental class because it had lower mean score in pre-test than XI IPA; XI
IPS was 52,71 and XI IPA was 54,29. The experimental class was taught reading
comprehension through mind mapping technique, while the other was taught
through expository technique. The teaching and learning process was carried out
for four meetings.
In the last, the writer only got 35 students’ data as sample in each class.
This condition happened because there were some students who did not come in
each meeting, either in pre-test, treatment, or post-test. Hence, the writer decided
to take only 35 students as sample in each class based on their attendance.
D. The Data Collection Technique
To know the effectiveness of mind mapping technique in this
quantitative research, the writer used test as the instruments to get the data
through multiple choice questions. There were two kinds of test used:
2Ibid., p.119.
3Ibid., p.126.
29
1. Pre-test
Pre-test was delivered at the first time before the writer applied the
treatment in both experimental and controlled class. The pre-test was held
on February 14th
, 2014.
2. Post-test
Post-test was held as the final test after the writer applied the treatment. It
is used to see whether or not mind mapping effective to improve students’
reading comprehension achievement. The post-test was held on March 4th
,
2014.
Each test was arranged into 20 items of multiple choices taken from
some students’ English books. The tests were given both to the experimental and
controlled classes’ students.
Before giving the tests to the sample, the writer had tested the tests to
the second grade students of SMA PGRI 4 Bogor. It was held to know the validity
and reliability of pre-test and post-test. The validity and reliability of the
instrument were analyzed by using ANATEST software.
The result shows that the instrument were reliable. The reliability score
is 0.74 while the standard of reliable is 0.60. Hence, it can be concluded that is is
reliable. At last, the writer limited the questions into 20 from 30 questions that
were tested, with 6 questions were eliminated and some others were choosen as
the questions after edited. (for further data, see appendix 1)
E. The Content of The Intervention
This study is focused on students’ achievement of reading
comprehension in narrative text. The writer designed four meeting in this study.
In the first meeting, the pre-test was given to get students’ background
knowledge. The second to the third meeting, the students were taught about
narrative text through different treatment. While the experiment class was taught
through mind mapping technique, the controlled class was taught by expository
technique. After giving the treatment, the students in each class had to answer
some questions related to the text. It is used to know whether the students got
30
higher improvement in their reading comprehension achievement after using mind
mapping than using expository. In the last meeting, the post-test was given to
check whether students’ achievement of reading comprehension in narrative text
increased or not.
F. The Data Analysis Technique
The gathered data are used to find out the differences of
students’achievement in experimental class and controlled class. In line with this,
the writer uses statistic calculation through t-test formula in manual calculation
and SPSS (Statistic Product and Statistic Solution). It is used to examine the
significance difference of students’ reading comprehension achievement between
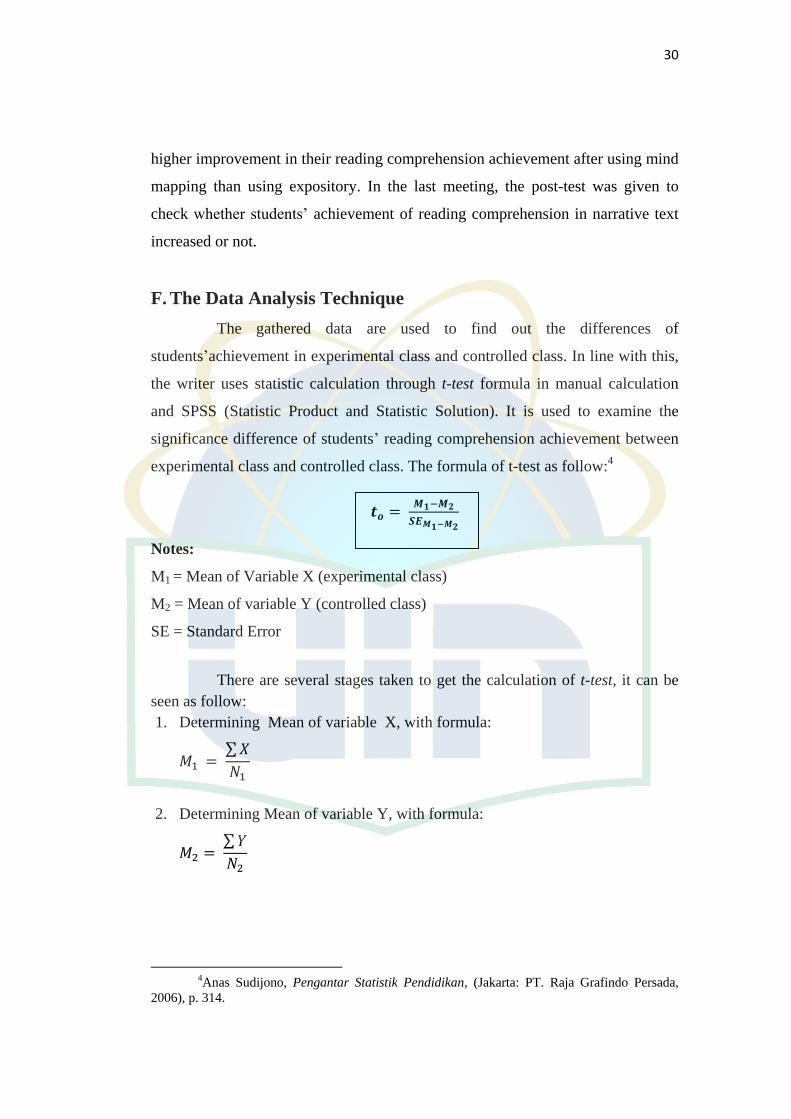
experimental class and controlled class. The formula of t-test as follow:4
Notes:
M1 = Mean of Variable X (experimental class)
M2 = Mean of variable Y (controlled class)
SE = Standard Error
There are several stages taken to get the calculation of t-test, it can be
seen as follow:
1. Determining Mean of variable X, with formula:
∑
2. Determining Mean of variable Y, with formula:
∑
4Anas Sudijono, Pengantar Statistik Pendidikan, (Jakarta: PT. Raja Grafindo Persada,
2006), p. 314.
31
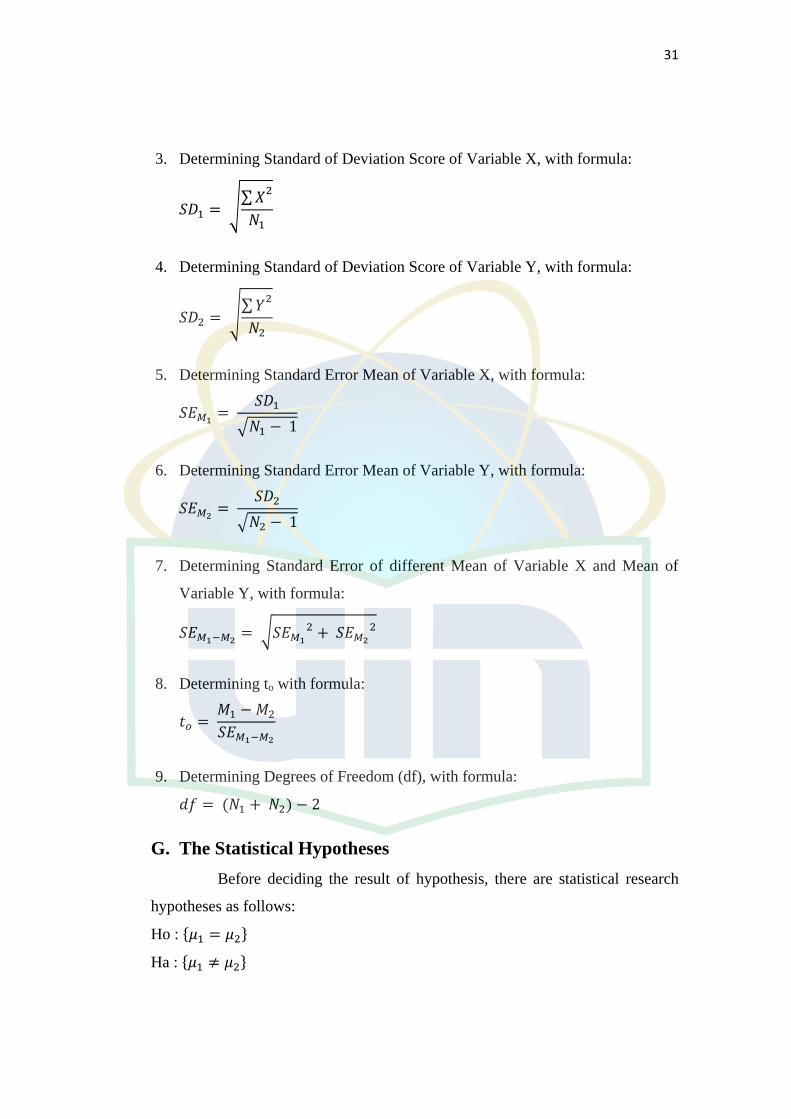
3. Determining Standard of Deviation Score of Variable X, with formula:
√∑
4. Determining Standard of Deviation Score of Variable Y, with formula:
√∑
5. Determining Standard Error Mean of Variable X, with formula:
√
6. Determining Standard Error Mean of Variable Y, with formula:
√
7. Determining Standard Error of different Mean of Variable X and Mean of
Variable Y, with formula:
√
8. Determining to with formula:
9. Determining Degrees of Freedom (df), with formula:
G. The Statistical Hypotheses
Before deciding the result of hypothesis, there are statistical research
hypotheses as follows:
Ho : { }
Ha : { }
32
Notes:
Ho = Null hypothesis
Ha = Alternative hypothesis
μ1= students’ reading comprehension achievement, who are taught through mind
mapping.
μ2 = students’ reading comprehension achievement, who are taught without mind
mapping.
The writer’s assumption of those hypotheses are as follow:
1. If to > ttable, the Null Hypothesis (Ho) is rejected and alternative hypothesis
(Ha) is accepted. It means there is a significant difference of students’ reading
comprehension achievement between students who are taught through mind
mapping and students who are taught without mind mapping.
2. If to < ttable, the Null hypothesis (Ho) is accepted and alternative hypothesis
(Ha) is rejected. It means there is no a significant difference of students’
reading comprehension achievement between students who are taught
through mind mapping and students who are taught without mind mapping.
33
CHAPTER IV
RESEARCH FINDING
This chapter presents findings of the study. The findings describe into
the data description, the data analysis, and the data interpretation.
A. The Data Description
This part shows the general description of students’ scores in both the
experimental class and the control class. The description is divided into some
sections: the pre-test scores, the post-test scores, and the gained scores.
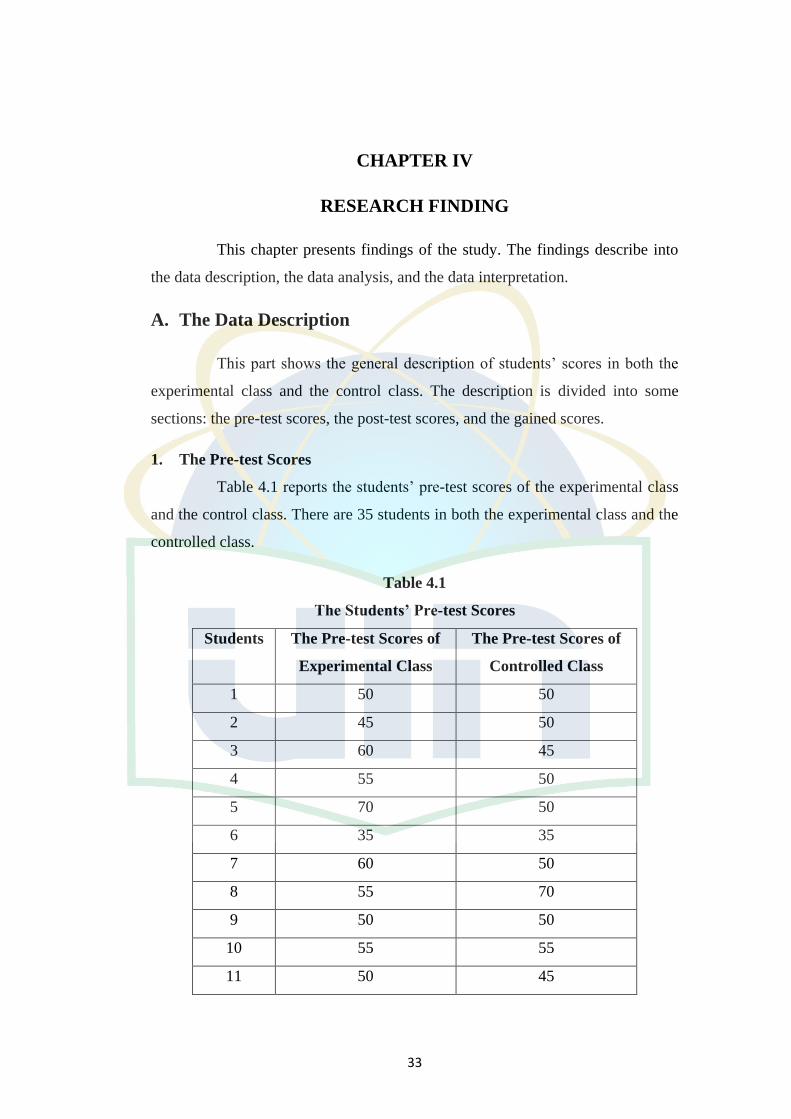
1. The Pre-test Scores
Table 4.1 reports the students’ pre-test scores of the experimental class
and the control class. There are 35 students in both the experimental class and the
controlled class.
Table 4.1
The Students’ Pre-test Scores
Students The Pre-test Scores of
Experimental Class
The Pre-test Scores of
Controlled Class
1 50 50
2 45 50
3 60 45
4 55 50
5 70 50
6 35 35
7 60 50
8 55 70
9 50 50
10 55 55
11 50 45
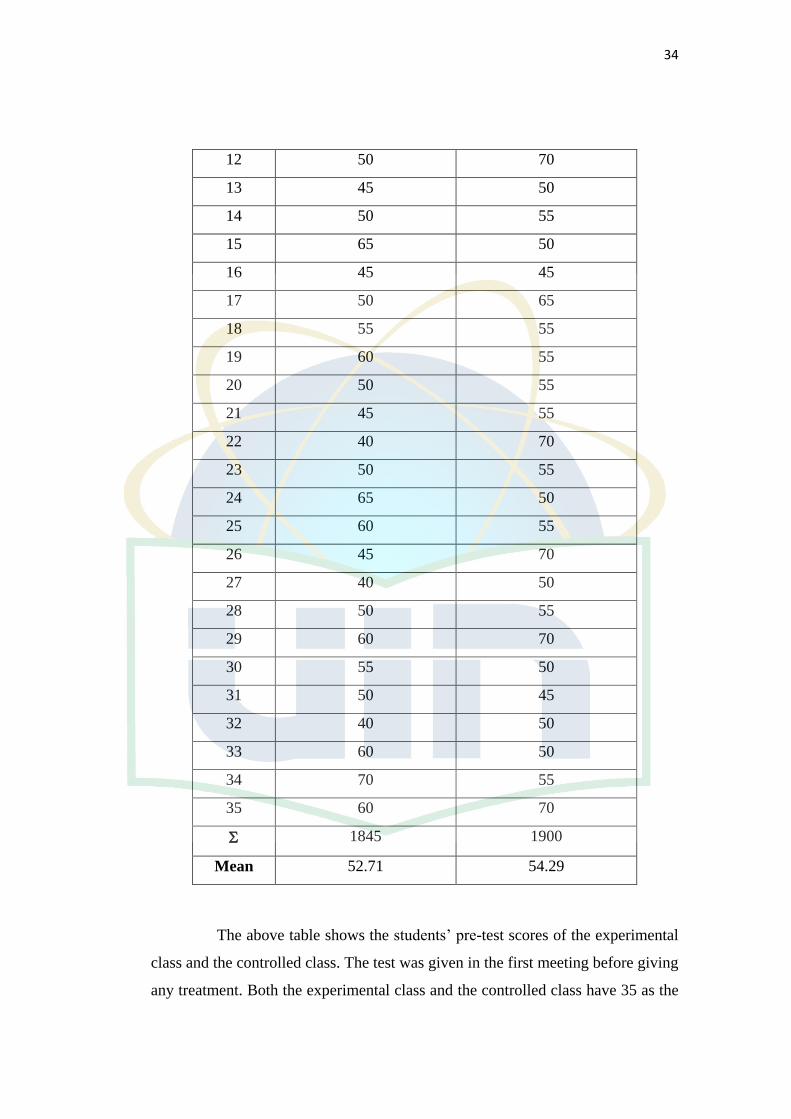
34
12 50 70
13 45 50
14 50 55
15 65 50
16 45 45
17 50 65
18 55 55
19 60 55
20 50 55
21 45 55
22 40 70
23 50 55
24 65 50
25 60 55
26 45 70
27 40 50
28 50 55
29 60 70
30 55 50
31 50 45
32 40 50
33 60 50
34 70 55
35 60 70
1845 1900
Mean 52.71 54.29
The above table shows the students’ pre-test scores of the experimental
class and the controlled class. The test was given in the first meeting before giving
any treatment. Both the experimental class and the controlled class have 35 as the
35
lowest score of pre-test, 50 as the median score, and 70 as the highest score.
Besides, the mean score of experimental class is 52.71 and the controlled class is
54.29. Hence, it can be concluded that the pre-test scores of the experimental class
and the controlled class seemed to be equivalent.
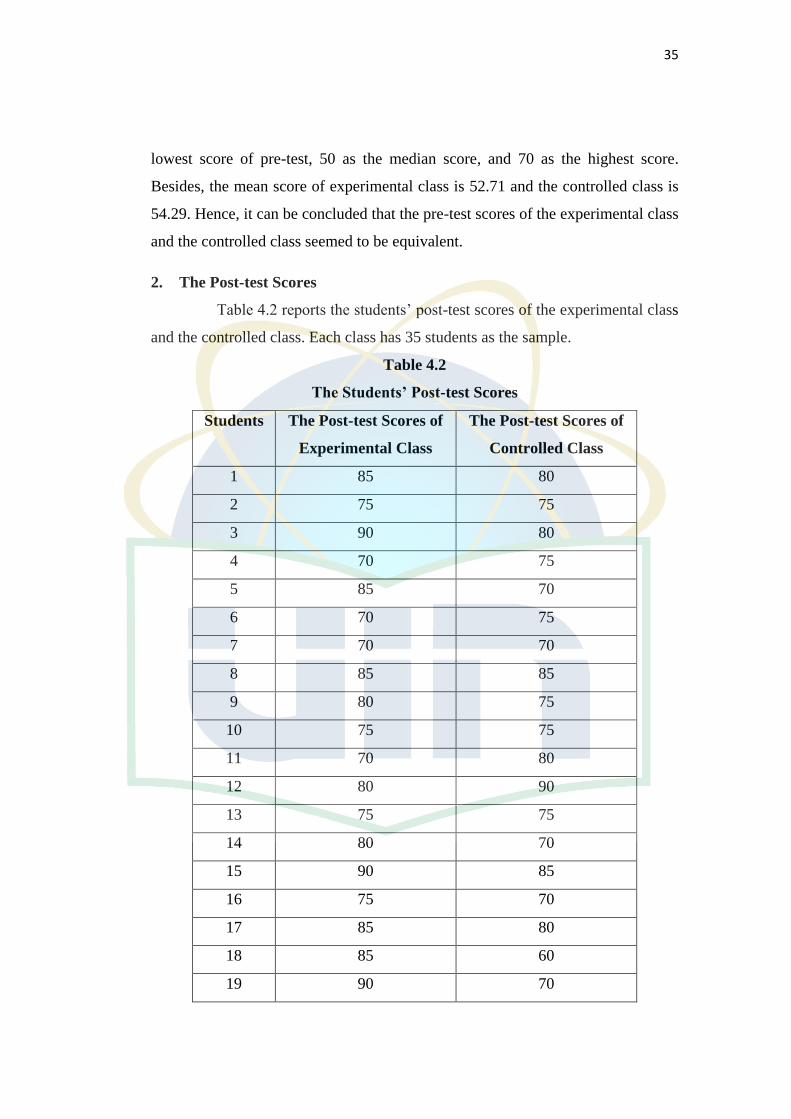
2. The Post-test Scores
Table 4.2 reports the students’ post-test scores of the experimental class
and the controlled class. Each class has 35 students as the sample.
Table 4.2
The Students’ Post-test Scores
Students The Post-test Scores of
Experimental Class
The Post-test Scores of
Controlled Class
1 85 80
2 75 75
3 90 80
4 70 75
5 85 70
6 70 75
7 70 70
8 85 85
9 80 75
10 75 75
11 70 80
12 80 90
13 75 75
14 80 70
15 90 85
16 75 70
17 85 80
18 85 60
19 90 70
36
20 80 55
21 85 50
22 75 55
23 80 60
24 75 50
25 70 80
26 85 85
27 85 70
28 70 75
29 80 55
30 75 80
31 85 70
32 75 85
33 85 65
34 95 65
35 80 80
2795 2520
Mean 79.86 72.00
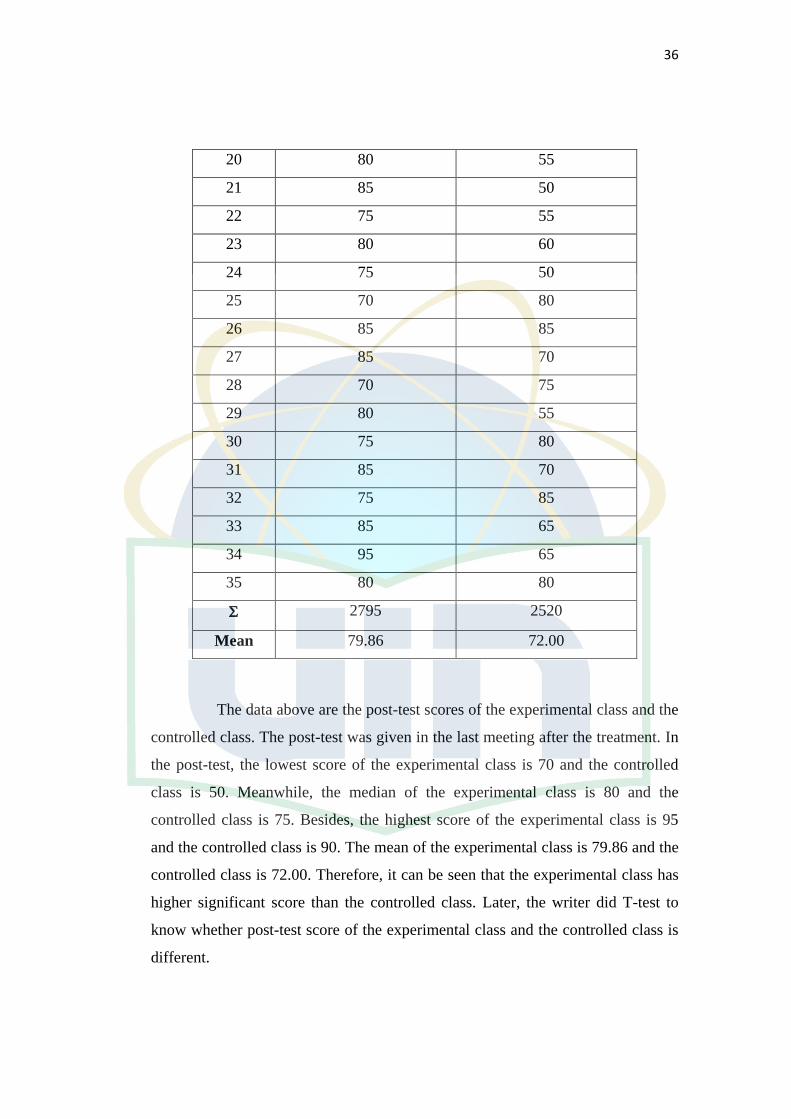
The data above are the post-test scores of the experimental class and the
controlled class. The post-test was given in the last meeting after the treatment. In
the post-test, the lowest score of the experimental class is 70 and the controlled
class is 50. Meanwhile, the median of the experimental class is 80 and the
controlled class is 75. Besides, the highest score of the experimental class is 95
and the controlled class is 90. The mean of the experimental class is 79.86 and the
controlled class is 72.00. Therefore, it can be seen that the experimental class has
higher significant score than the controlled class. Later, the writer did T-test to
know whether post-test score of the experimental class and the controlled class is
different.
37
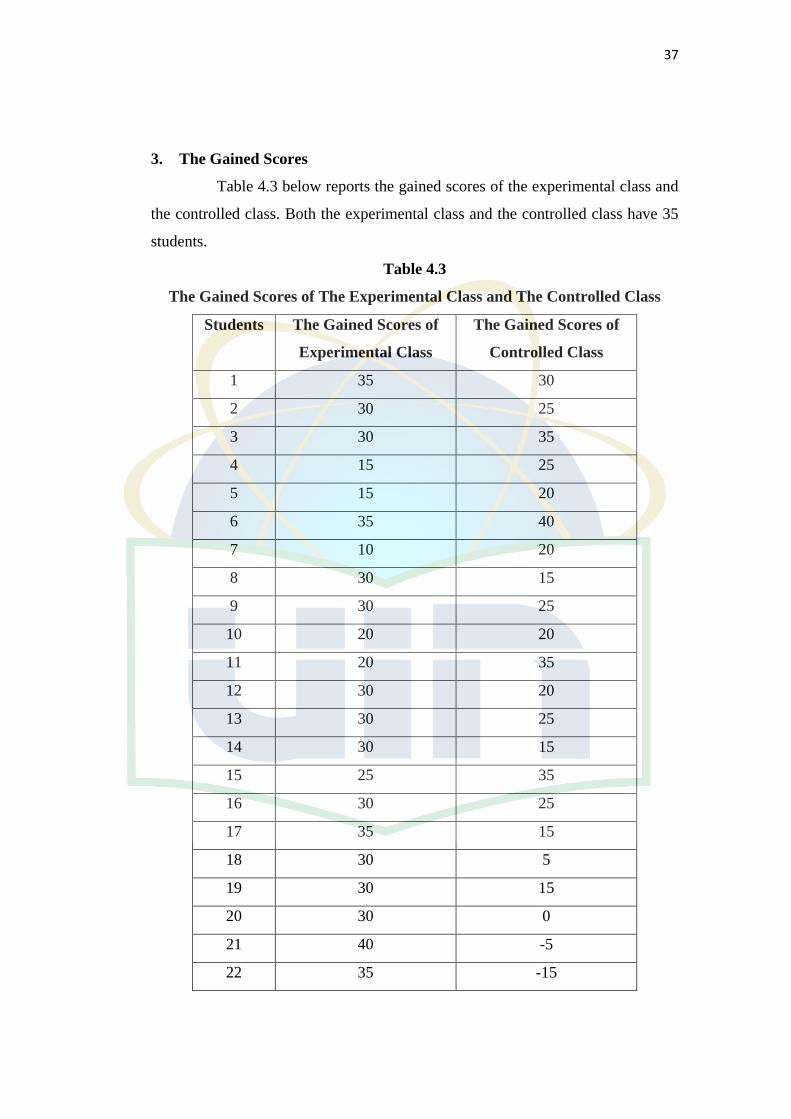
3. The Gained Scores
Table 4.3 below reports the gained scores of the experimental class and
the controlled class. Both the experimental class and the controlled class have 35
students.
Table 4.3
The Gained Scores of The Experimental Class and The Controlled Class
Students The Gained Scores of
Experimental Class
The Gained Scores of
Controlled Class
1 35 30
2 30 25
3 30 35
4 15 25
5 15 20
6 35 40
7 10 20
8 30 15
9 30 25
10 20 20
11 20 35
12 30 20
13 30 25
14 30 15
15 25 35
16 30 25
17 35 15
18 30 5
19 30 15
20 30 0
21 40 -5
22 35 -15
38
23 30 5
24 10 0
25 10 25
26 40 15
27 45 20
28 20 20
29 20 -15
30 20 30
31 35 25
32 35 35
33 25 15
34 25 10
35 20 10
950 620
Mean 27.14 17.71
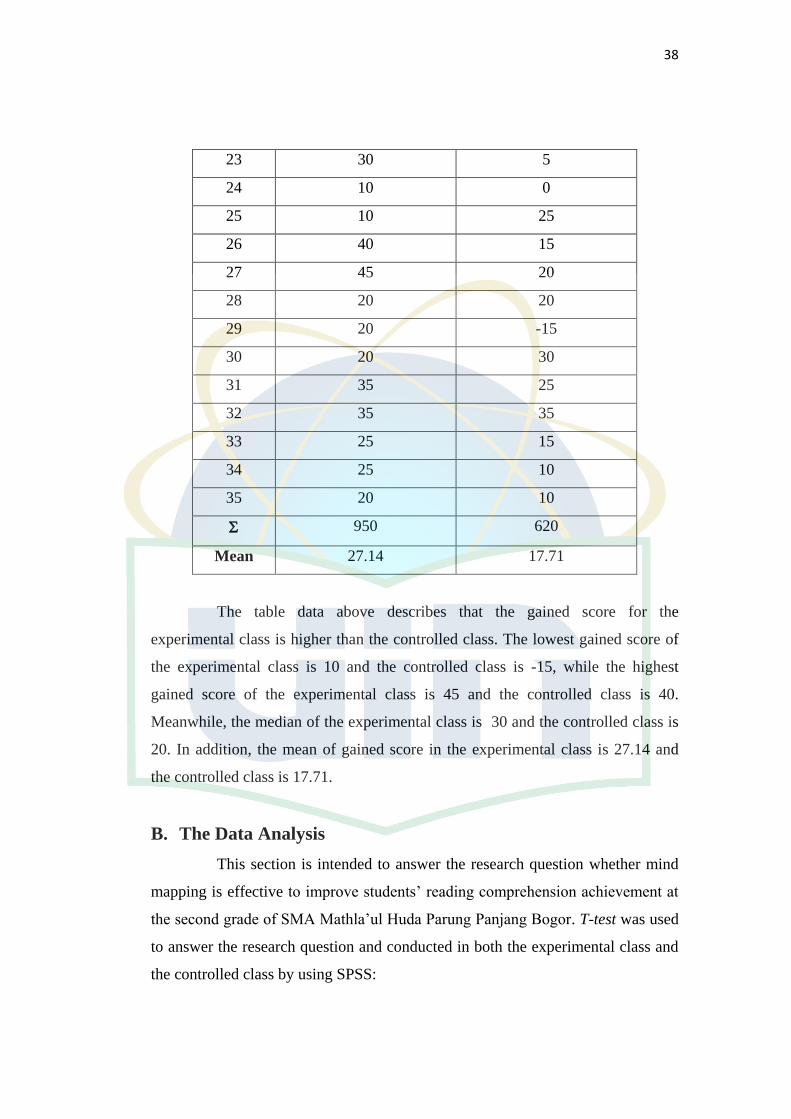
The table data above describes that the gained score for the
experimental class is higher than the controlled class. The lowest gained score of
the experimental class is 10 and the controlled class is -15, while the highest
gained score of the experimental class is 45 and the controlled class is 40.
Meanwhile, the median of the experimental class is 30 and the controlled class is
20. In addition, the mean of gained score in the experimental class is 27.14 and
the controlled class is 17.71.
B. The Data Analysis
This section is intended to answer the research question whether mind
mapping is effective to improve students’ reading comprehension achievement at
the second grade of SMA Mathla’ul Huda Parung Panjang Bogor. T-test was used
to answer the research question and conducted in both the experimental class and
the controlled class by using SPSS:
39
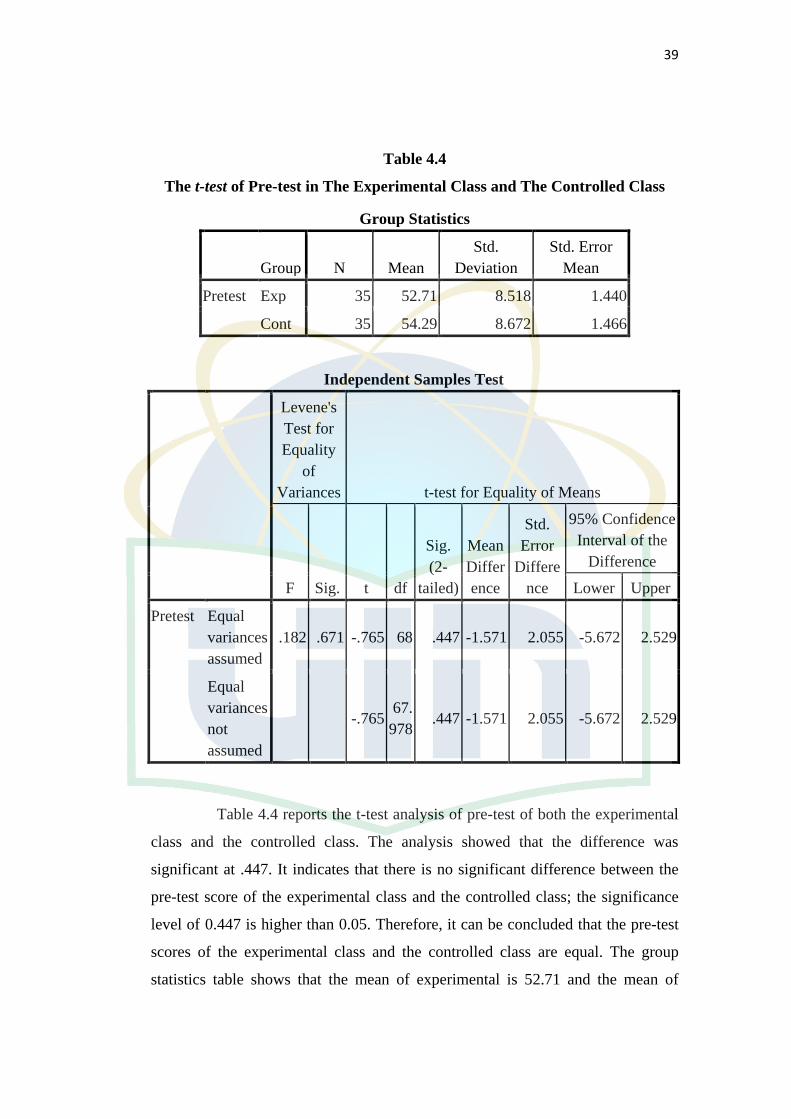
Table 4.4
The t-test of Pre-test in The Experimental Class and The Controlled Class
Group Statistics
Group N Mean
Std.
Deviation
Std. Error
Mean
Pretest Exp 35 52.71 8.518 1.440
Cont 35 54.29 8.672 1.466
Independent Samples Test
Levene's
Test for
Equality
of
Variances t-test for Equality of Means
F Sig. t df
Sig.
(2-
tailed)
Mean
Differ
ence
Std.
Error
Differe
nce
95% Confidence
Interval of the
Difference
Lower Upper
Pretest Equal
variances
assumed
.182 .671 -.765 68 .447 -1.571 2.055 -5.672 2.529
Equal
variances
not
assumed
-.765 67.
978 .447 -1.571 2.055 -5.672 2.529
Table 4.4 reports the t-test analysis of pre-test of both the experimental
class and the controlled class. The analysis showed that the difference was
significant at .447. It indicates that there is no significant difference between the
pre-test score of the experimental class and the controlled class; the significance
level of 0.447 is higher than 0.05. Therefore, it can be concluded that the pre-test
scores of the experimental class and the controlled class are equal. The group
statistics table shows that the mean of experimental is 52.71 and the mean of
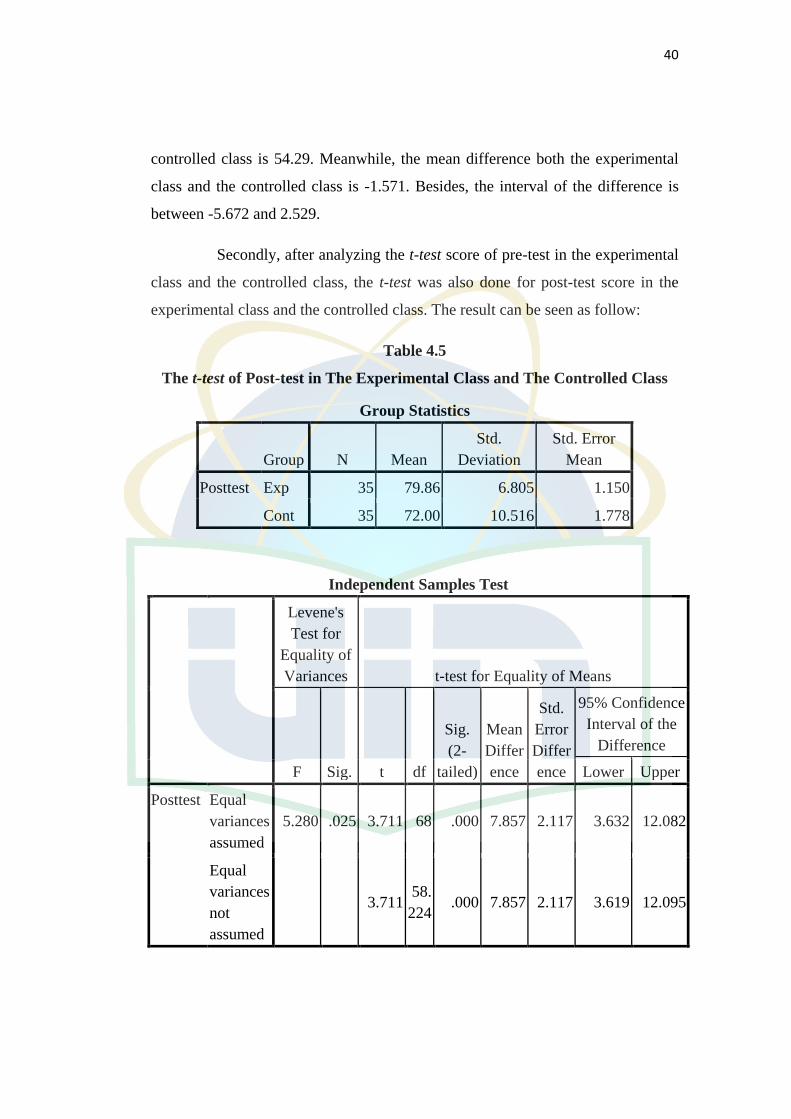
40
controlled class is 54.29. Meanwhile, the mean difference both the experimental
class and the controlled class is -1.571. Besides, the interval of the difference is
between -5.672 and 2.529.
Secondly, after analyzing the t-test score of pre-test in the experimental
class and the controlled class, the t-test was also done for post-test score in the
experimental class and the controlled class. The result can be seen as follow:
Table 4.5
The t-test of Post-test in The Experimental Class and The Controlled Class
Group Statistics
Group N Mean
Std.
Deviation
Std. Error
Mean
Posttest Exp 35 79.86 6.805 1.150
Cont 35 72.00 10.516 1.778
Independent Samples Test
Levene's
Test for
Equality of
Variances t-test for Equality of Means
F Sig. t df
Sig.
(2-
tailed)
Mean
Differ
ence
Std.
Error
Differ
ence
95% Confidence
Interval of the
Difference
Lower Upper
Posttest Equal
variances
assumed
5.280 .025 3.711 68 .000 7.857 2.117 3.632 12.082
Equal
variances
not
assumed
3.711 58.
224 .000 7.857 2.117 3.619 12.095
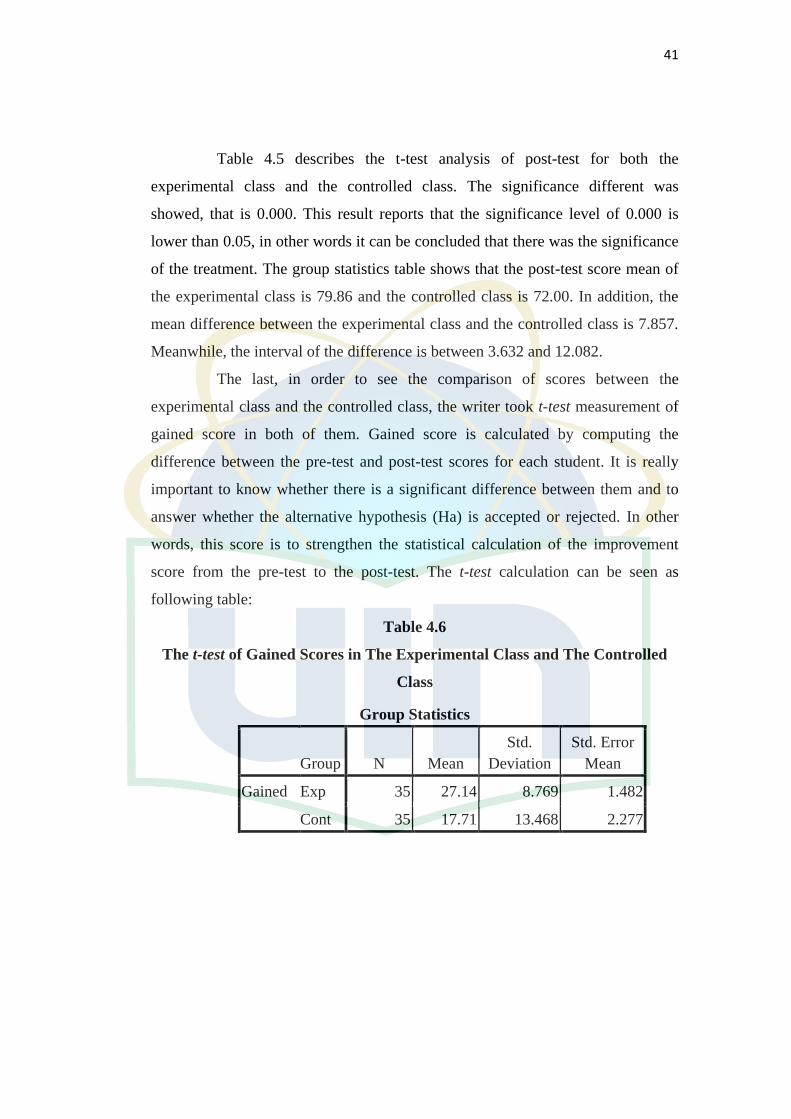
41
Table 4.5 describes the t-test analysis of post-test for both the
experimental class and the controlled class. The significance different was
showed, that is 0.000. This result reports that the significance level of 0.000 is
lower than 0.05, in other words it can be concluded that there was the significance
of the treatment. The group statistics table shows that the post-test score mean of
the experimental class is 79.86 and the controlled class is 72.00. In addition, the
mean difference between the experimental class and the controlled class is 7.857.
Meanwhile, the interval of the difference is between 3.632 and 12.082.
The last, in order to see the comparison of scores between the
experimental class and the controlled class, the writer took t-test measurement of
gained score in both of them. Gained score is calculated by computing the
difference between the pre-test and post-test scores for each student. It is really
important to know whether there is a significant difference between them and to
answer whether the alternative hypothesis (Ha) is accepted or rejected. In other
words, this score is to strengthen the statistical calculation of the improvement
score from the pre-test to the post-test. The t-test calculation can be seen as
following table:
Table 4.6
The t-test of Gained Scores in The Experimental Class and The Controlled
Class
Group Statistics
Group N Mean
Std.
Deviation
Std. Error
Mean
Gained Exp 35 27.14 8.769 1.482
Cont 35 17.71 13.468 2.277
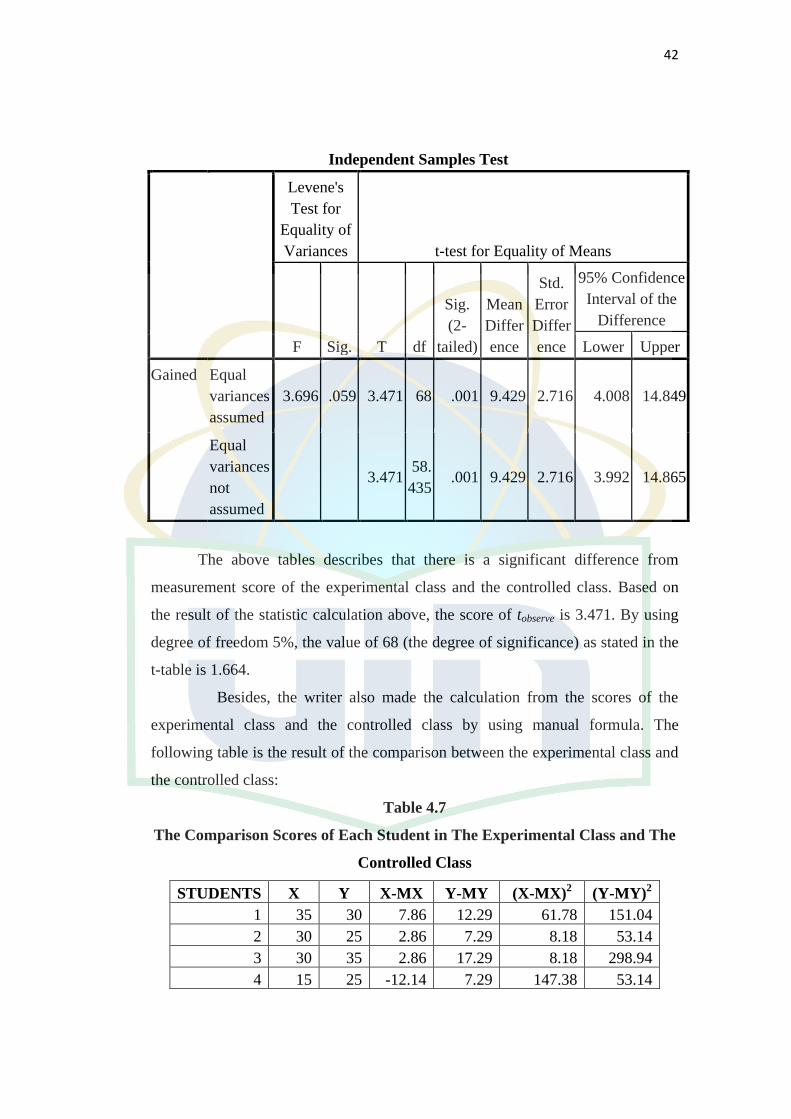
42
The above tables describes that there is a significant difference from
measurement score of the experimental class and the controlled class. Based on
the result of the statistic calculation above, the score of tobserve is 3.471. By using
degree of freedom 5%, the value of 68 (the degree of significance) as stated in the
t-table is 1.664.
Besides, the writer also made the calculation from the scores of the
experimental class and the controlled class by using manual formula. The
following table is the result of the comparison between the experimental class and
the controlled class:
Table 4.7
The Comparison Scores of Each Student in The Experimental Class and The
Controlled Class
STUDENTS X Y X-MX Y-MY (X-MX)2 (Y-MY)
2
1 35 30 7.86 12.29 61.78 151.04
2 30 25 2.86 7.29 8.18 53.14
3 30 35 2.86 17.29 8.18 298.94
4 15 25 -12.14 7.29 147.38 53.14
Independent Samples Test
Levene's
Test for
Equality of
Variances t-test for Equality of Means
F Sig. T df
Sig.
(2-
tailed)
Mean
Differ
ence
Std.
Error
Differ
ence
95% Confidence
Interval of the
Difference
Lower Upper
Gained Equal
variances
assumed
3.696 .059 3.471 68 .001 9.429 2.716 4.008 14.849
Equal
variances
not
assumed
3.471 58.
435 .001 9.429 2.716 3.992 14.865
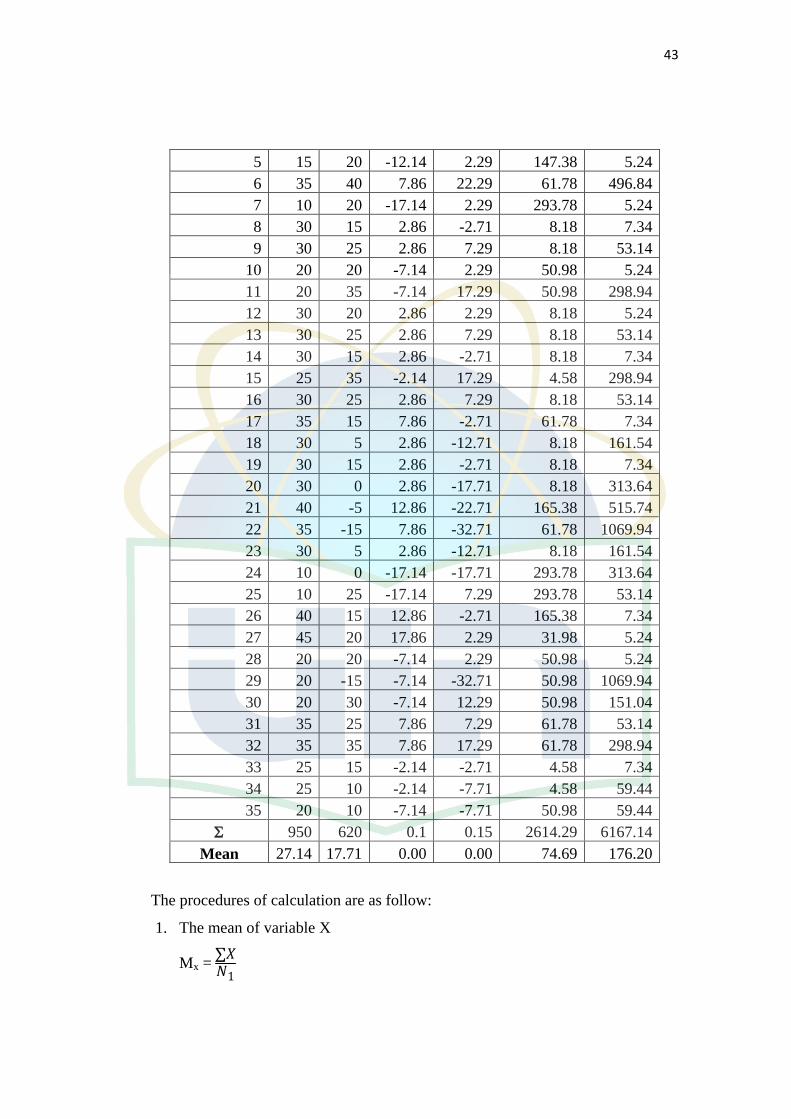
43
5 15 20 -12.14 2.29 147.38 5.24
6 35 40 7.86 22.29 61.78 496.84
7 10 20 -17.14 2.29 293.78 5.24
8 30 15 2.86 -2.71 8.18 7.34
9 30 25 2.86 7.29 8.18 53.14
10 20 20 -7.14 2.29 50.98 5.24
11 20 35 -7.14 17.29 50.98 298.94
12 30 20 2.86 2.29 8.18 5.24
13 30 25 2.86 7.29 8.18 53.14
14 30 15 2.86 -2.71 8.18 7.34
15 25 35 -2.14 17.29 4.58 298.94
16 30 25 2.86 7.29 8.18 53.14
17 35 15 7.86 -2.71 61.78 7.34
18 30 5 2.86 -12.71 8.18 161.54
19 30 15 2.86 -2.71 8.18 7.34
20 30 0 2.86 -17.71 8.18 313.64
21 40 -5 12.86 -22.71 165.38 515.74
22 35 -15 7.86 -32.71 61.78 1069.94
23 30 5 2.86 -12.71 8.18 161.54
24 10 0 -17.14 -17.71 293.78 313.64
25 10 25 -17.14 7.29 293.78 53.14
26 40 15 12.86 -2.71 165.38 7.34
27 45 20 17.86 2.29 31.98 5.24
28 20 20 -7.14 2.29 50.98 5.24
29 20 -15 -7.14 -32.71 50.98 1069.94
30 20 30 -7.14 12.29 50.98 151.04
31 35 25 7.86 7.29 61.78 53.14
32 35 35 7.86 17.29 61.78 298.94
33 25 15 -2.14 -2.71 4.58 7.34
34 25 10 -2.14 -7.71 4.58 59.44
35 20 10 -7.14 -7.71 50.98 59.44
950 620 0.1 0.15 2614.29 6167.14
Mean 27.14 17.71 0.00 0.00 74.69 176.20
The procedures of calculation are as follow:
1. The mean of variable X
Mx =
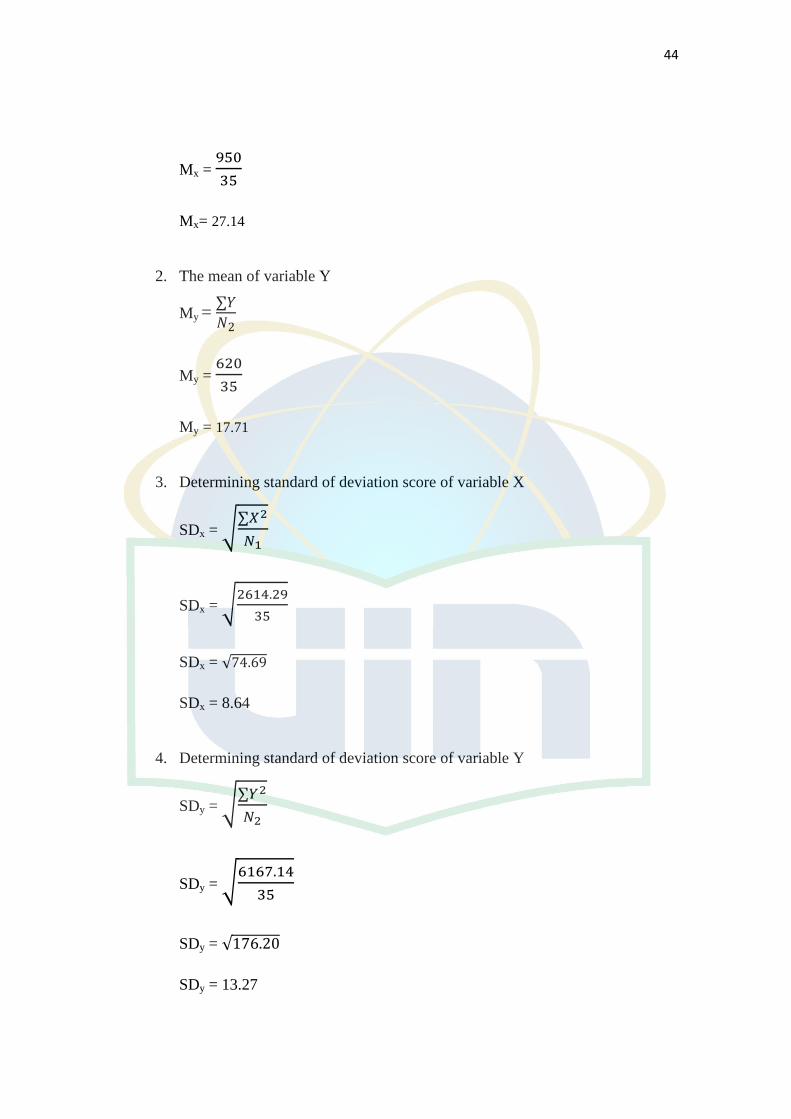
44
Mx =
Mx= 27.14
2. The mean of variable Y
My =
My =
My = 17.71
3. Determining standard of deviation score of variable X
SDx = √
SDx = √
SDx = √
SDx = 8.64
4. Determining standard of deviation score of variable Y
SDy = √
SDy = √
SDy = √
SDy = 13.27
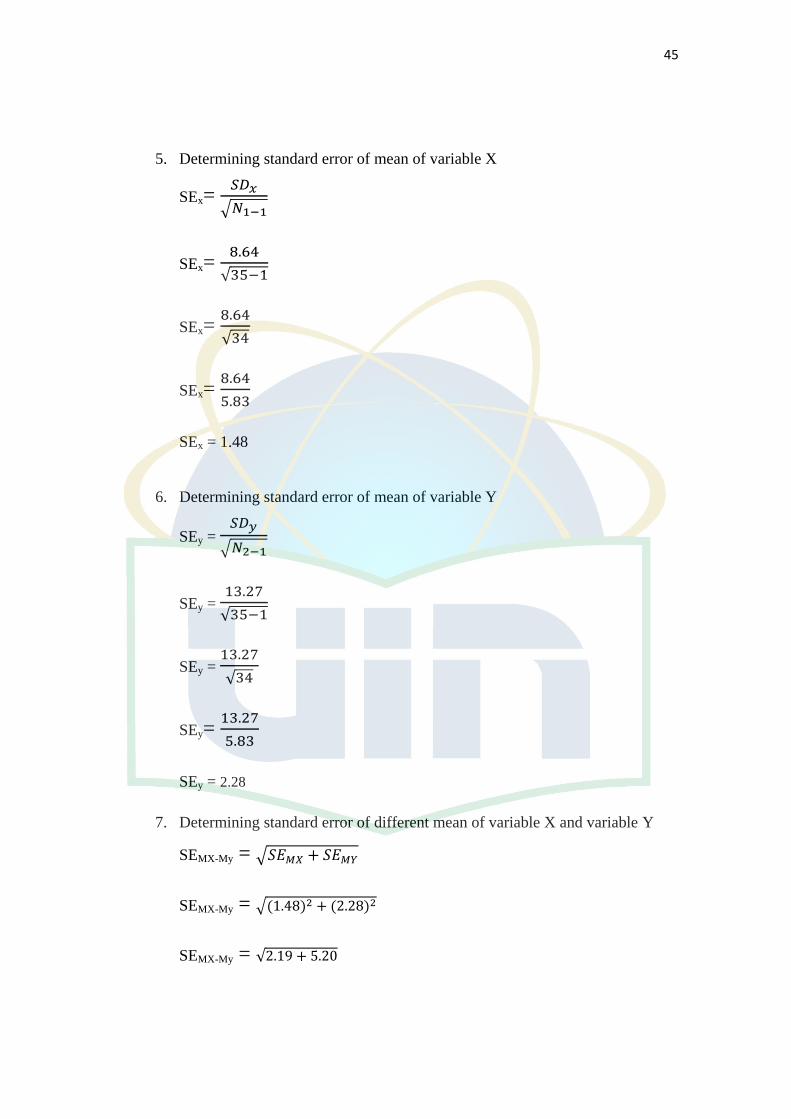
45
5. Determining standard error of mean of variable X
SEx=
√
SEx=
√
SEx=
√
SEx=
SEx = 1.48
6. Determining standard error of mean of variable Y
SEy =
√
SEy =
√
SEy =
√
SEy=
SEy = 2.28
7. Determining standard error of different mean of variable X and variable Y
SEMX-My = √
SEMX-My = √
SEMX-My = √
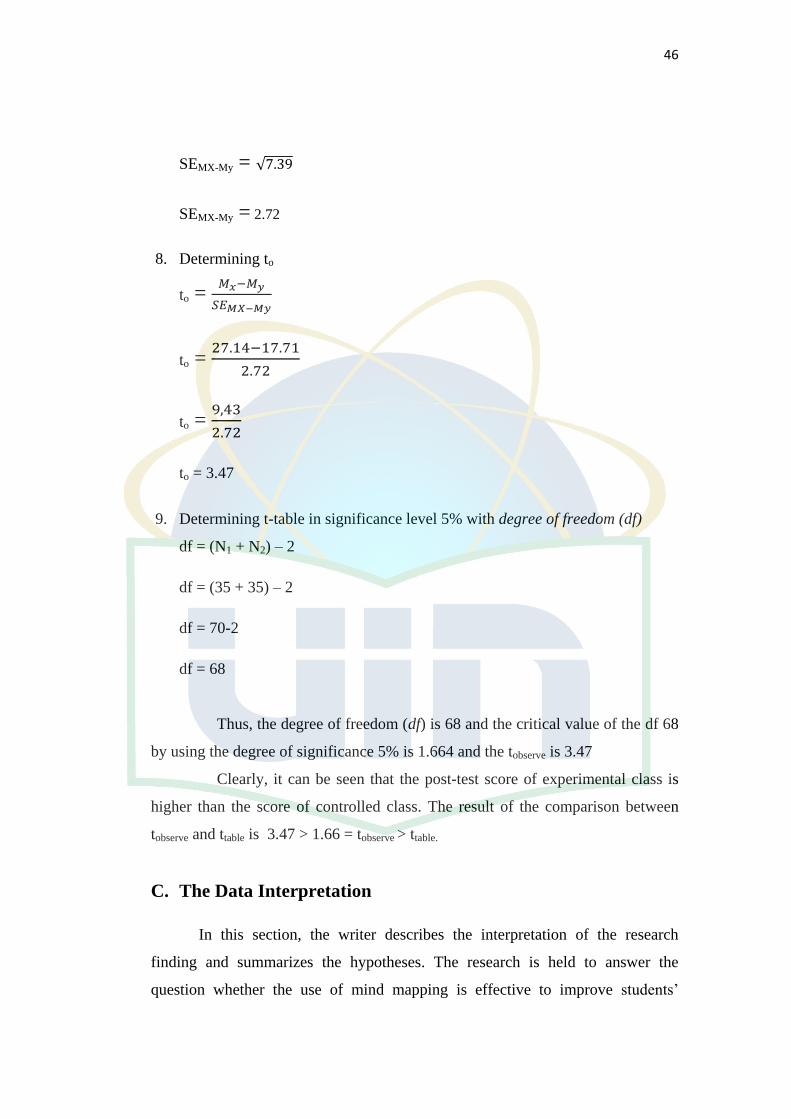
46
SEMX-My = √
SEMX-My = 2.72
8. Determining to
to =
to =
to =
to = 3.47
9. Determining t-table in significance level 5% with degree of freedom (df)
df = (N1 + N2) – 2
df = (35 + 35) – 2
df = 70-2
df = 68
Thus, the degree of freedom (df) is 68 and the critical value of the df 68
by using the degree of significance 5% is 1.664 and the tobserve is 3.47
Clearly, it can be seen that the post-test score of experimental class is
higher than the score of controlled class. The result of the comparison between
tobserve and ttable is 3.47 > 1.66 = tobserve > ttable.
C. The Data Interpretation
In this section, the writer describes the interpretation of the research
finding and summarizes the hypotheses. The research is held to answer the
question whether the use of mind mapping is effective to improve students’
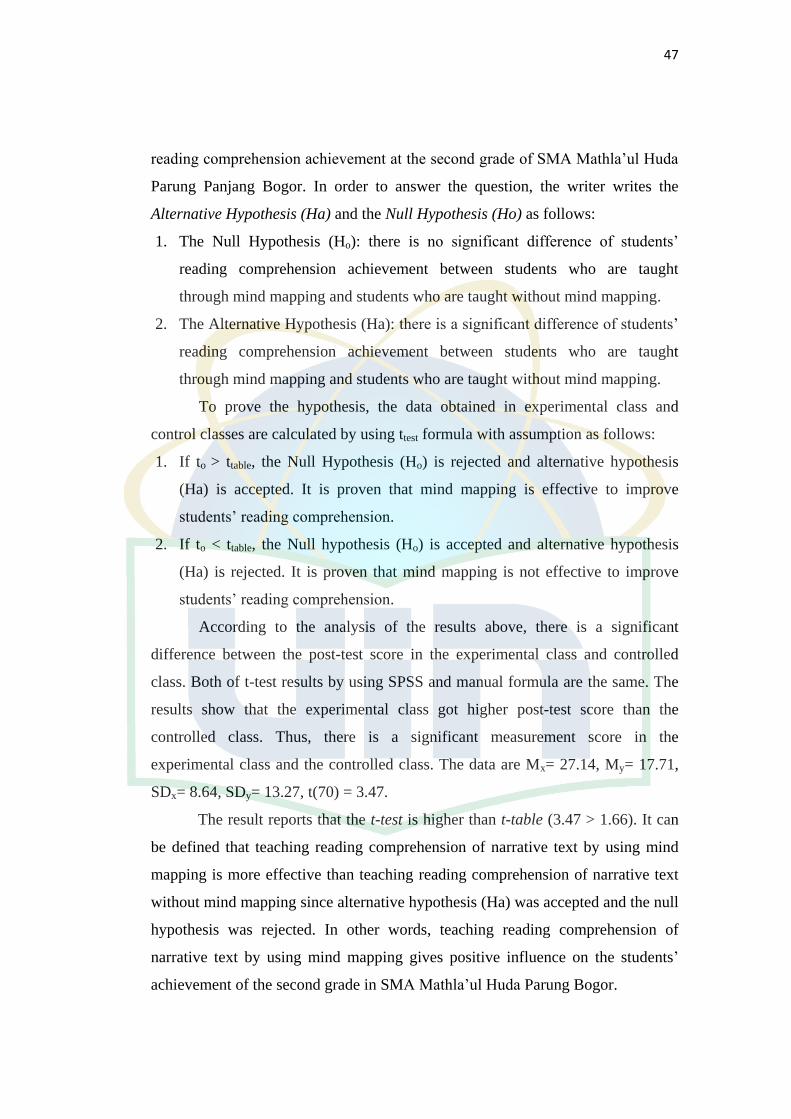
47
reading comprehension achievement at the second grade of SMA Mathla’ul Huda
Parung Panjang Bogor. In order to answer the question, the writer writes the
Alternative Hypothesis (Ha) and the Null Hypothesis (Ho) as follows:
1. The Null Hypothesis (Ho): there is no significant difference of students’
reading comprehension achievement between students who are taught
through mind mapping and students who are taught without mind mapping.
2. The Alternative Hypothesis (Ha): there is a significant difference of students’
reading comprehension achievement between students who are taught
through mind mapping and students who are taught without mind mapping.
To prove the hypothesis, the data obtained in experimental class and
control classes are calculated by using ttest formula with assumption as follows:
1. If to > ttable, the Null Hypothesis (Ho) is rejected and alternative hypothesis
(Ha) is accepted. It is proven that mind mapping is effective to improve
students’ reading comprehension.
2. If to < ttable, the Null hypothesis (Ho) is accepted and alternative hypothesis
(Ha) is rejected. It is proven that mind mapping is not effective to improve
students’ reading comprehension.
According to the analysis of the results above, there is a significant
difference between the post-test score in the experimental class and controlled
class. Both of t-test results by using SPSS and manual formula are the same. The
results show that the experimental class got higher post-test score than the
controlled class. Thus, there is a significant measurement score in the
experimental class and the controlled class. The data are Mx= 27.14, My= 17.71,
SDx= 8.64, SDy= 13.27, t(70) = 3.47.
The result reports that the t-test is higher than t-table (3.47 > 1.66). It can
be defined that teaching reading comprehension of narrative text by using mind
mapping is more effective than teaching reading comprehension of narrative text
without mind mapping since alternative hypothesis (Ha) was accepted and the null
hypothesis was rejected. In other words, teaching reading comprehension of
narrative text by using mind mapping gives positive influence on the students’
achievement of the second grade in SMA Mathla’ul Huda Parung Bogor.
48
CHAPTER V
Conclusion and Suggestion
A. Conclusion
This research was conducted by using quasi-experimental design which
is aimed to find out whether mind mapping is effective to improve students’
reading comprehension achievement. Based on the statistical calculation at the
previous chapter, there is a significant difference between teaching reading
comprehension of narrative text by using mind mapping technique and without
using mind mapping technique. The result shows that the value of t-test (3.47) is
higher than ttable (1.66) at the significance level 5%, it means that the Null
Hypothesis (H0) is rejected and the Alternative Hypothesis (Ha) is accepted.
Hence, mind mapping technique is effective to improve students’ achievement in
reading comprehension of narrative text at the second grade of SMA Mathla’ul
Huda Parung Panjang Bogor.
B. Suggestion
The writer wants to give following suggestions based on the conclusion
above:
1. The teachers have to be creative in order to make teaching and learning
process become more interesting, enjoyable, and effective for students.
2. The students have to force theirselves to read more the reading text in
order to get more knowledge and make reading activity becomes habit.
3. Both the teachers and students can well collaborate in teaching and
learning process. It is used to make them easier in solving the problems
faced in teaching and learning process.
The suggestion above are given based on the research that was done by
the writer. The writer hopes the suggestion can give positive contribution for
improving the teaching and learning process in SMA Mathla’ul Huda Parung.
49
BIBLIOGRAPHY
Ajideh, Parviz. Schema Theory-Based Pre-Reading Tasks: A Neglected Essential
in The ESL Reading Class. The Reading Matrix Vol.3. No.1, April
2003.
Anderson, Mark. Kathy Anderson. Text Types in English 3. Melbourne:
MacMillan Education. 2003.
Apriliawati, Anis. Comprehending Text Types. Bekasi: Ganesha Exact. 2009.
Arikunto, Suharsimi. Prosedur Penelitian Suatu Pendekatan Praktik. Jakarta: PT.
Rineka Cipta. 2006.
Brown, H. Douglas. Language Assessment-Principles and Classroom Practices. New
York: Longman, 2004.
Buzan, Tony. Buku Pintar Mind Map, terj. Susi Purwoko. Jakarta: Gramedia
Pustaka Utama. 2013.
Buzan, Tony. Barry Buzan. The Mind Map Book. London: BBC Worldwide
Limited. 2002.
Buzan, Tony. Barry Buzan. The Mind Map Book: How to Use Radiant Thinking to
Maximize Your Brain’s Untapped Potential. New York: Penguin
Group. 1994.
Caldwell, JoAnne Schudt. Comprehension Assessment-A Classroom Guide. New
York: The Guildford Press. 2008.
Casco, Mady. The Use of “Mind Maps” in The Teaching of Foreign Languages.
http://www.madycasco.com.ar/articles/mindmaps.PDF. Accessed on
February 9th
, 2014.
Clelford, Tony. Taking Notes with Mind Maps.
http://ebooks.uosiu.info/eBooki/Umys%C5%82/tony%20buzan%20-
%20taking%20notes%20with%20mind%20maps.pdf. Accessed on
February 9th
, 2014.
Creswell, John W. Educational Research (3rd
ed.). New Jersey: Pearson Prentice
Hall. 2008.
Davies, Martin. Concept Mapping, Mind Mapping and Argument Mapping: What
are The Differences and Do They Matter? Springer Science+Business
Media B.V. 2010.
Donough, Jo Mc. Christopher Shaw. Materials and Methods in ELT: A Teacher’s
Guide-2nd
. Malden: Blackwell Publishing. 2003.
50
Goddard, Jennifer. Fun Activities on Holidays During School Holidays.
http://www.braintraining4kids.com/fun-activities-on-rainy-days-during-
school-holidays/. Accessed on March 5th
, 2014.
Grabe, William. Fredricka L.Stoller. Teaching and Researching Reading. Oxford:
Pearson Education. 2002.
Grabe, William. Fredricka L. Stoller. Reading for Academic Purposes: Guidelines
for the ESL/EFL Teacher, Teaching English as A Second or Foreign
Language, 3rd
Ed. Marianne Celce-Murcia. Boston: Heinle & Heinle.
2001.
Harmer, Jeremy. Approaches and Methods in Language Teaching-8th Ed. New
York: Cambridge University Press. 1992.
Harmer, Jeremy. The Practice of English Language Teaching-4th Ed. Oxford:
Pearson Longman. 2007.
Hawkins, Barbara. Teaching Children to Read in a Second Language, Teaching
English as A Second or Foreign Language, 2nd
Ed. Marianne Celce-
Murcia. Boston: Heinle & Heinle. 1991.
Kurniawan, Ashadi. Improving Students’ Reading Comprehension on Narrative
Text Through Story Mapping Strategy. Skripsi, Teacher Training and
Education Faculty, Tanjungpura University, Pontianak. 2013.
Lems, Kristin. et.al. Teaching Reading to English Languager Learners: Insight
from Linguistics. New York: The Guildford Press. 2010.
McMillan, James H.. Sally Schumacher. Research in Education-6th ed. Boston: Pearson
Education. 2006.
McNamara, et.al. Reading Strategies strand in English Language Arts College
Board Standards for College Success™ as cited by the College Board
College Board Standards. 2006.
Meier, P.S. Mind-Mapping-A Tool for Eliciting and Representing Knowledge
Held by Diverse Informants. Guildford: University of Surrey. 2007.
NSW Department of Education and Training. Teaching Comprehension
Strategies. 2010.
Nuttall, Christine. Teaching Reading Skills in a Foreign Language. Portsmouth:
Heinemann. 1989.
Oakhill, Jane V. Kate Cain. Assessment of comprehension in reading, The
Psychological Assessment of Reading. John R. Beech and Chris
Singleton. London: Routledge. 1997.
51
Paris, Dr. Scott. Developing Comprehension Skills.
http://media.wix.com/ugd/37184e_2c198e440de641efab7a9f78e2be47c
3.pdf Accessed on February 9th
, 2014.
Piercey, Dorothy. Reading Activities in Content Area-2nd Ed. Boston: Allyn and
Bacon. 1982.
Priyono, Joko. Interlanguage: English for Senior High School Students XI Science
and Social Study Programme. Jakarta: Pusat Perbukuan, Departemen
Pendidikan Nasional. 2008.
Richards, Jack C. Theodore S. Rodgers. Approaches and Methods in Language
Teaching. New York: Cambridge University Press. 1986.
Shoebottom, Paul. The Importance of Reading. https://utahcharters.org/wp-
content/uploads/2012/02/Interesting-Reading-Facts-1.pdf. 2013.
Siahaan, Sanggam. Kisno Shinoda. Generic Text Structure. Yogyakarta: Graha
Ilmu. 2008.
Siriphanich, Panatda. Using Mind Mapping Technique to Improve Reading
Comprehension Ability of Thai EFL University Students. The 2nd
International Conference on Humanities and Social Sciences April 10th
,
2010 Faculty of Liberal Arts, Prince of Songkla University.
Sudijono, Anas. Pengantar Statistik Pendidikan. Jakarta: PT. Raja Grafindo Persada.
2006.
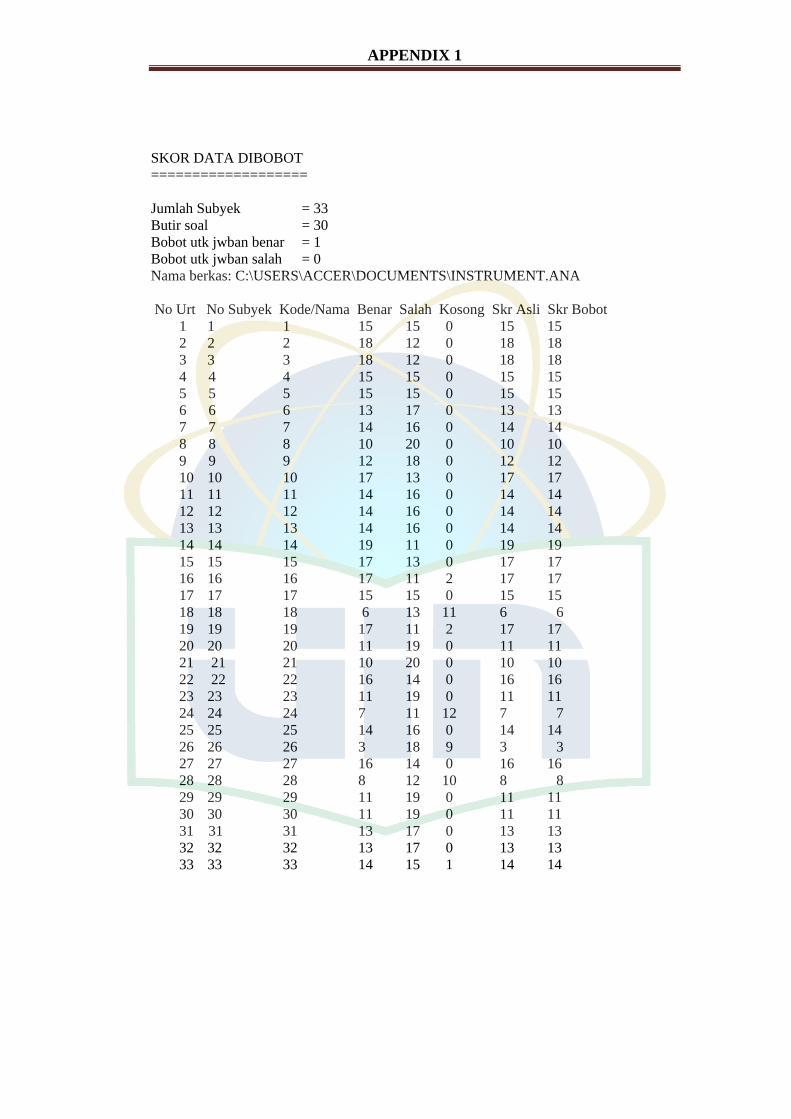
APPENDIX 1
SKOR DATA DIBOBOT
===================
Jumlah Subyek = 33
Butir soal = 30
Bobot utk jwban benar = 1
Bobot utk jwban salah = 0
Nama berkas: C:\USERS\ACCER\DOCUMENTS\INSTRUMENT.ANA
No Urt No Subyek Kode/Nama Benar Salah Kosong Skr Asli Skr Bobot
1 1 1 15 15 0 15 15
2 2 2 18 12 0 18 18
3 3 3 18 12 0 18 18
4 4 4 15 15 0 15 15
5 5 5 15 15 0 15 15
6 6 6 13 17 0 13 13
7 7 7 14 16 0 14 14
8 8 8 10 20 0 10 10
9 9 9 12 18 0 12 12
10 10 10 17 13 0 17 17
11 11 11 14 16 0 14 14
12 12 12 14 16 0 14 14
13 13 13 14 16 0 14 14
14 14 14 19 11 0 19 19
15 15 15 17 13 0 17 17
16 16 16 17 11 2 17 17
17 17 17 15 15 0 15 15
18 18 18 6 13 11 6 6
19 19 19 17 11 2 17 17
20 20 20 11 19 0 11 11
21 21 21 10 20 0 10 10
22 22 22 16 14 0 16 16
23 23 23 11 19 0 11 11
24 24 24 7 11 12 7 7
25 25 25 14 16 0 14 14
26 26 26 3 18 9 3 3
27 27 27 16 14 0 16 16
28 28 28 8 12 10 8 8
29 29 29 11 19 0 11 11
30 30 30 11 19 0 11 11
31 31 31 13 17 0 13 13
32 32 32 13 17 0 13 13
33 33 33 14 15 1 14 14
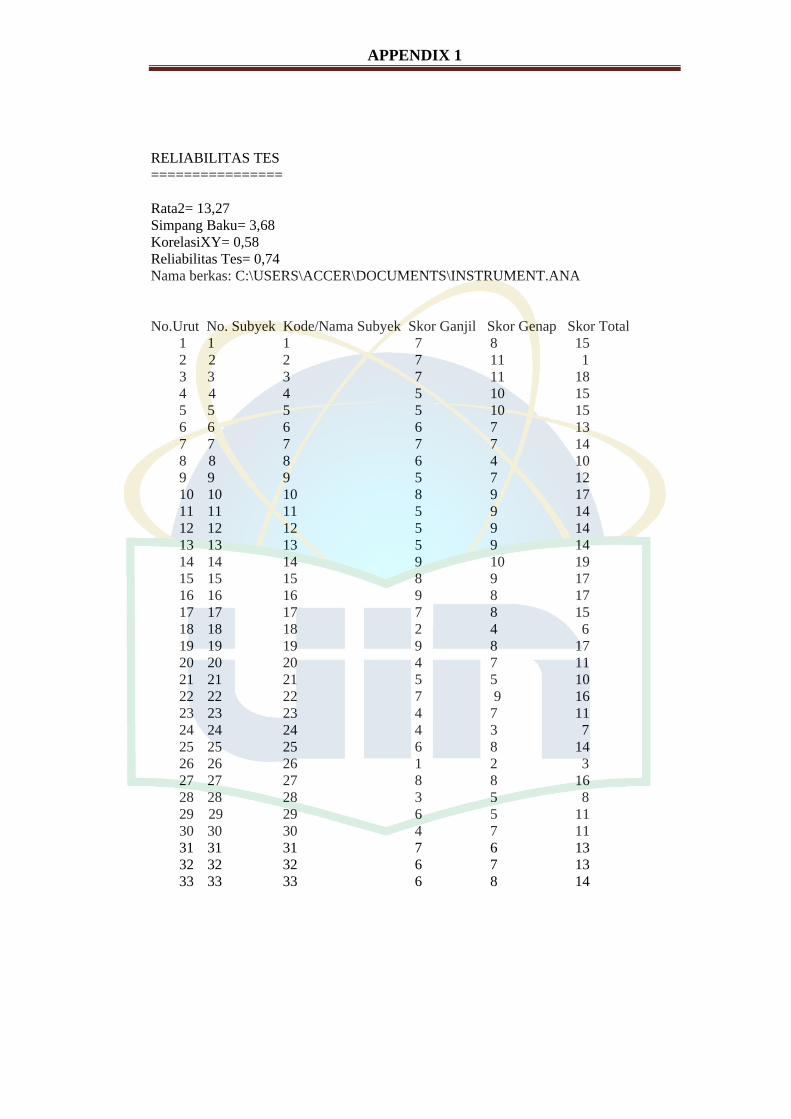
APPENDIX 1
RELIABILITAS TES
================
Rata2= 13,27
Simpang Baku= 3,68
KorelasiXY= 0,58
Reliabilitas Tes= 0,74
Nama berkas: C:\USERS\ACCER\DOCUMENTS\INSTRUMENT.ANA
No.Urut No. Subyek Kode/Nama Subyek Skor Ganjil Skor Genap Skor Total
1 1 1 7 8 15
2 2 2 7 11 1
3 3 3 7 11 18
4 4 4 5 10 15
5 5 5 5 10 15
6 6 6 6 7 13
7 7 7 7 7 14
8 8 8 6 4 10
9 9 9 5 7 12
10 10 10 8 9 17
11 11 11 5 9 14
12 12 12 5 9 14
13 13 13 5 9 14
14 14 14 9 10 19
15 15 15 8 9 17
16 16 16 9 8 17
17 17 17 7 8 15
18 18 18 2 4 6
19 19 19 9 8 17
20 20 20 4 7 11
21 21 21 5 5 10
22 22 22 7 9 16
23 23 23 4 7 11
24 24 24 4 3 7
25 25 25 6 8 14
26 26 26 1 2 3
27 27 27 8 8 16
28 28 28 3 5 8
29 29 29 6 5 11
30 30 30 4 7 11
31 31 31 7 6 13
32 32 32 6 7 13
33 33 33 6 8 14
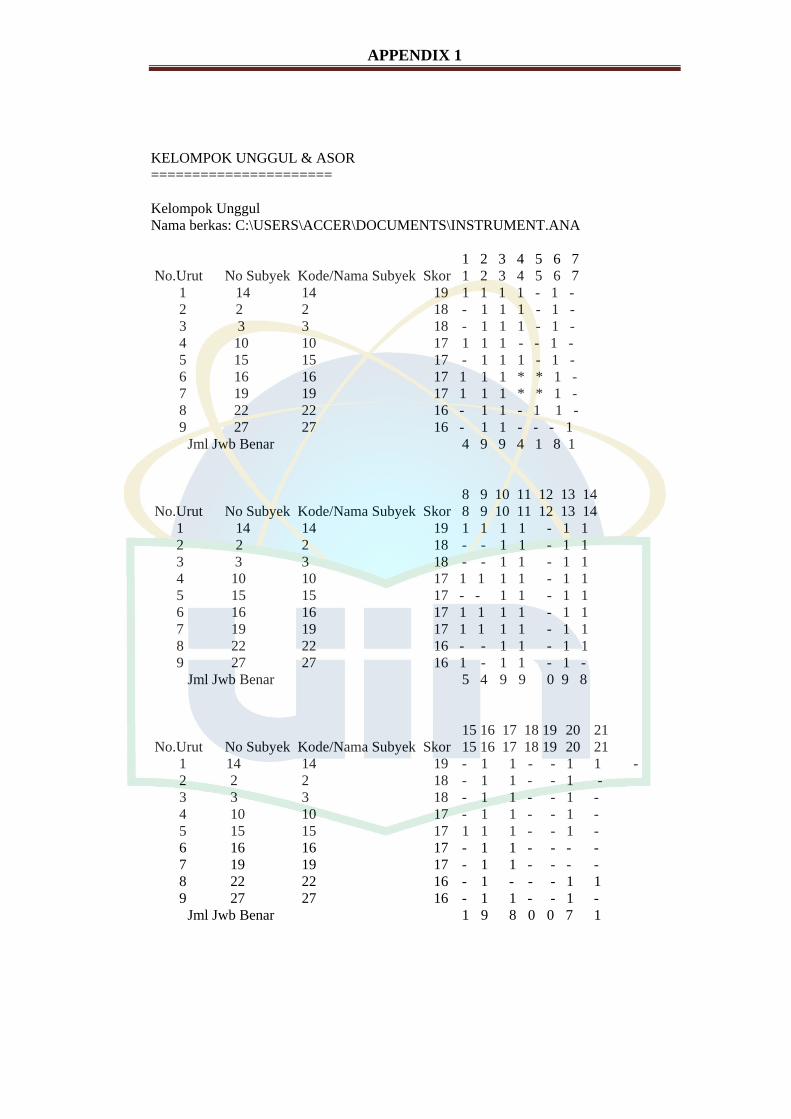
APPENDIX 1
KELOMPOK UNGGUL & ASOR
======================
Kelompok Unggul
Nama berkas: C:\USERS\ACCER\DOCUMENTS\INSTRUMENT.ANA
1 2 3 4 5 6 7
No.Urut No Subyek Kode/Nama Subyek Skor 1 2 3 4 5 6 7
1 14 14 19 1 1 1 1 - 1 -
2 2 2 18 - 1 1 1 - 1 -
3 3 3 18 - 1 1 1 - 1 -
4 10 10 17 1 1 1 - - 1 -
5 15 15 17 - 1 1 1 - 1 -
6 16 16 17 1 1 1 * * 1 -
7 19 19 17 1 1 1 * * 1 -
8 22 22 16 - 1 1 - 1 1 -
9 27 27 16 - 1 1 - - - 1
Jml Jwb Benar 4 9 9 4 1 8 1
8 9 10 11 12 13 14
No.Urut No Subyek Kode/Nama Subyek Skor 8 9 10 11 12 13 14
1 14 14 19 1 1 1 1 - 1 1
2 2 2 18 - - 1 1 - 1 1
3 3 3 18 - - 1 1 - 1 1
4 10 10 17 1 1 1 1 - 1 1
5 15 15 17 - - 1 1 - 1 1
6 16 16 17 1 1 1 1 - 1 1
7 19 19 17 1 1 1 1 - 1 1
8 22 22 16 - - 1 1 - 1 1
9 27 27 16 1 - 1 1 - 1 -
Jml Jwb Benar 5 4 9 9 0 9 8
15 16 17 18 19 20 21
No.Urut No Subyek Kode/Nama Subyek Skor 15 16 17 18 19 20 21
1 14 14 19 - 1 1 - - 1 1 -
2 2 2 18 - 1 1 - - 1 -
3 3 3 18 - 1 1 - - 1 -
4 10 10 17 - 1 1 - - 1 -
5 15 15 17 1 1 1 - - 1 -
6 16 16 17 - 1 1 - - - -
7 19 19 17 - 1 1 - - - -
8 22 22 16 - 1 - - - 1 1
9 27 27 16 - 1 1 - - 1 -
Jml Jwb Benar 1 9 8 0 0 7 1
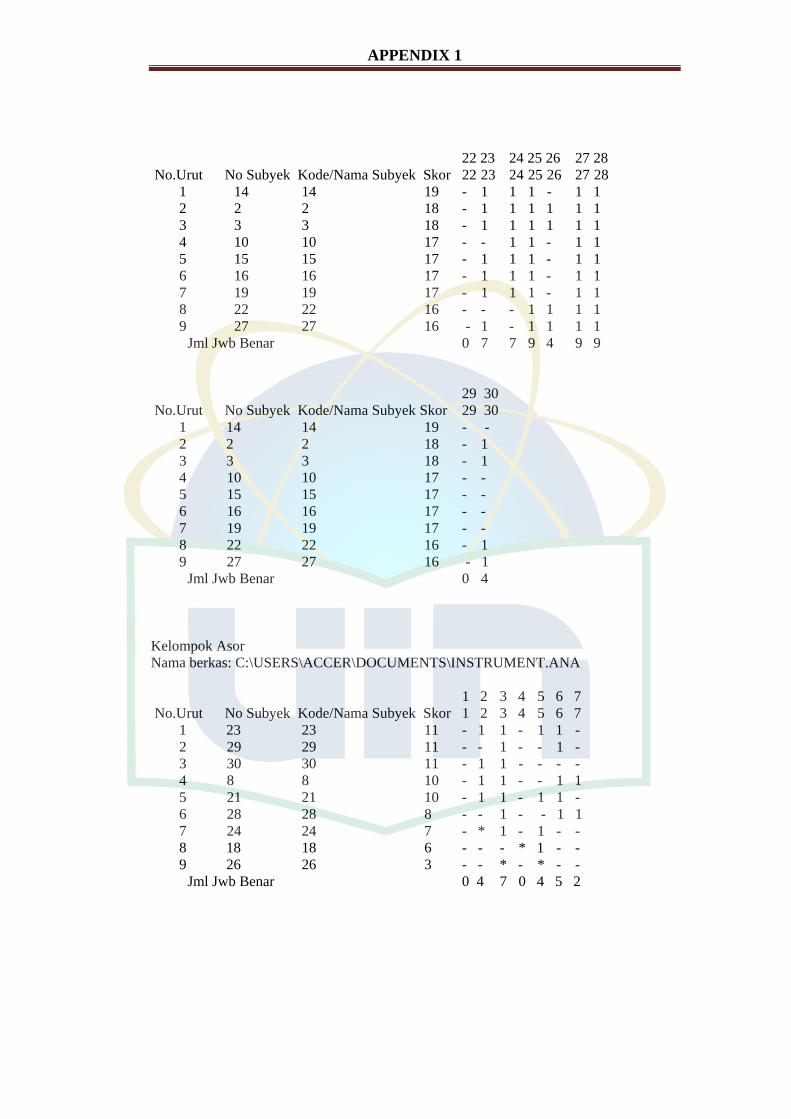
APPENDIX 1
22 23 24 25 26 27 28
No.Urut No Subyek Kode/Nama Subyek Skor 22 23 24 25 26 27 28
1 14 14 19 - 1 1 1 - 1 1
2 2 2 18 - 1 1 1 1 1 1
3 3 3 18 - 1 1 1 1 1 1
4 10 10 17 - - 1 1 - 1 1
5 15 15 17 - 1 1 1 - 1 1
6 16 16 17 - 1 1 1 - 1 1
7 19 19 17 - 1 1 1 - 1 1
8 22 22 16 - - - 1 1 1 1
9 27 27 16 - 1 - 1 1 1 1
Jml Jwb Benar 0 7 7 9 4 9 9
29 30
No.Urut No Subyek Kode/Nama Subyek Skor 29 30
1 14 14 19 - -
2 2 2 18 - 1
3 3 3 18 - 1
4 10 10 17 - -
5 15 15 17 - -
6 16 16 17 - -
7 19 19 17 - -
8 22 22 16 - 1
9 27 27 16 - 1
Jml Jwb Benar 0 4
Kelompok Asor
Nama berkas: C:\USERS\ACCER\DOCUMENTS\INSTRUMENT.ANA
1 2 3 4 5 6 7
No.Urut No Subyek Kode/Nama Subyek Skor 1 2 3 4 5 6 7
1 23 23 11 - 1 1 - 1 1 -
2 29 29 11 - - 1 - - 1 -
3 30 30 11 - 1 1 - - - -
4 8 8 10 - 1 1 - - 1 1
5 21 21 10 - 1 1 - 1 1 -
6 28 28 8 - - 1 - - 1 1
7 24 24 7 - * 1 - 1 - -
8 18 18 6 - - - * 1 - -
9 26 26 3 - - * - * - -
Jml Jwb Benar 0 4 7 0 4 5 2
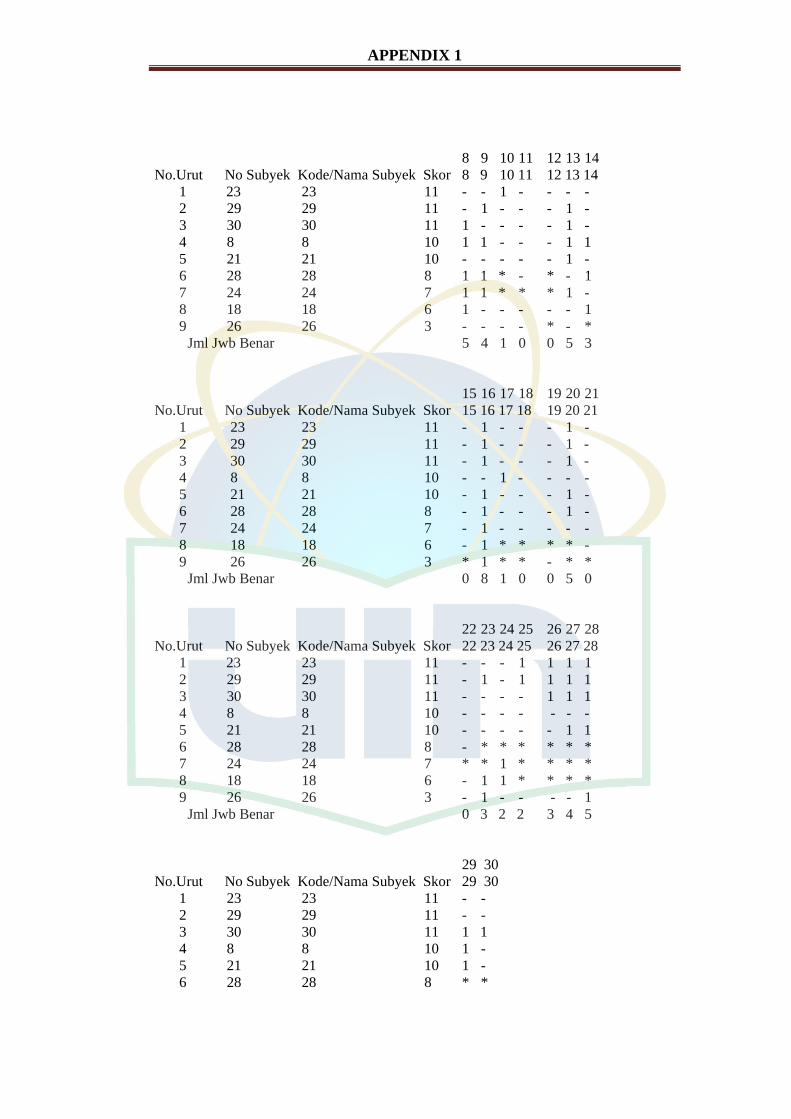
APPENDIX 1
8 9 10 11 12 13 14
No.Urut No Subyek Kode/Nama Subyek Skor 8 9 10 11 12 13 14
1 23 23 11 - - 1 - - - -
2 29 29 11 - 1 - - - 1 -
3 30 30 11 1 - - - - 1 -
4 8 8 10 1 1 - - - 1 1
5 21 21 10 - - - - - 1 -
6 28 28 8 1 1 * - * - 1
7 24 24 7 1 1 * * * 1 -
8 18 18 6 1 - - - - - 1
9 26 26 3 - - - - * - *
Jml Jwb Benar 5 4 1 0 0 5 3
15 16 17 18 19 20 21
No.Urut No Subyek Kode/Nama Subyek Skor 15 16 17 18 19 20 21
1 23 23 11 - 1 - - - 1 -
2 29 29 11 - 1 - - - 1 -
3 30 30 11 - 1 - - - 1 -
4 8 8 10 - - 1 - - - -
5 21 21 10 - 1 - - - 1 -
6 28 28 8 - 1 - - - 1 -
7 24 24 7 - 1 - - - - -
8 18 18 6 - 1 * * * * -
9 26 26 3 * 1 * * - * *
Jml Jwb Benar 0 8 1 0 0 5 0
22 23 24 25 26 27 28
No.Urut No Subyek Kode/Nama Subyek Skor 22 23 24 25 26 27 28
1 23 23 11 - - - 1 1 1 1
2 29 29 11 - 1 - 1 1 1 1
3 30 30 11 - - - - 1 1 1
4 8 8 10 - - - - - - -
5 21 21 10 - - - - - 1 1
6 28 28 8 - * * * * * *
7 24 24 7 * * 1 * * * *
8 18 18 6 - 1 1 * * * *
9 26 26 3 - 1 - - - - 1
Jml Jwb Benar 0 3 2 2 3 4 5
29 30
No.Urut No Subyek Kode/Nama Subyek Skor 29 30
1 23 23 11 - -
2 29 29 11 - -
3 30 30 11 1 1
4 8 8 10 1 -
5 21 21 10 1 -
6 28 28 8 * *
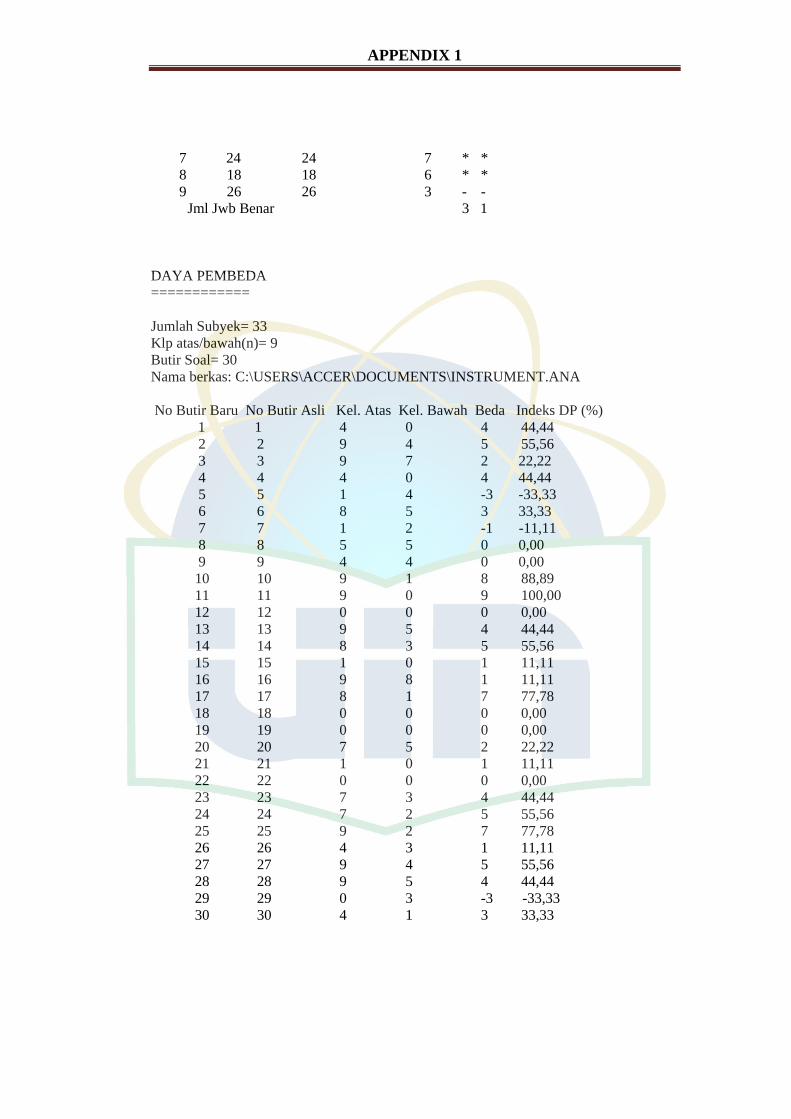
APPENDIX 1
7 24 24 7 * *
8 18 18 6 * *
9 26 26 3 - -
Jml Jwb Benar 3 1
DAYA PEMBEDA
============
Jumlah Subyek= 33
Klp atas/bawah(n)= 9
Butir Soal= 30
Nama berkas: C:\USERS\ACCER\DOCUMENTS\INSTRUMENT.ANA
No Butir Baru No Butir Asli Kel. Atas Kel. Bawah Beda Indeks DP (%)
1 1 4 0 4 44,44
2 2 9 4 5 55,56
3 3 9 7 2 22,22
4 4 4 0 4 44,44
5 5 1 4 -3 -33,33
6 6 8 5 3 33,33
7 7 1 2 -1 -11,11
8 8 5 5 0 0,00
9 9 4 4 0 0,00
10 10 9 1 8 88,89
11 11 9 0 9 100,00
12 12 0 0 0 0,00
13 13 9 5 4 44,44
14 14 8 3 5 55,56
15 15 1 0 1 11,11
16 16 9 8 1 11,11
17 17 8 1 7 77,78
18 18 0 0 0 0,00
19 19 0 0 0 0,00
20 20 7 5 2 22,22
21 21 1 0 1 11,11
22 22 0 0 0 0,00
23 23 7 3 4 44,44
24 24 7 2 5 55,56
25 25 9 2 7 77,78
26 26 4 3 1 11,11
27 27 9 4 5 55,56
28 28 9 5 4 44,44
29 29 0 3 -3 -33,33
30 30 4 1 3 33,33
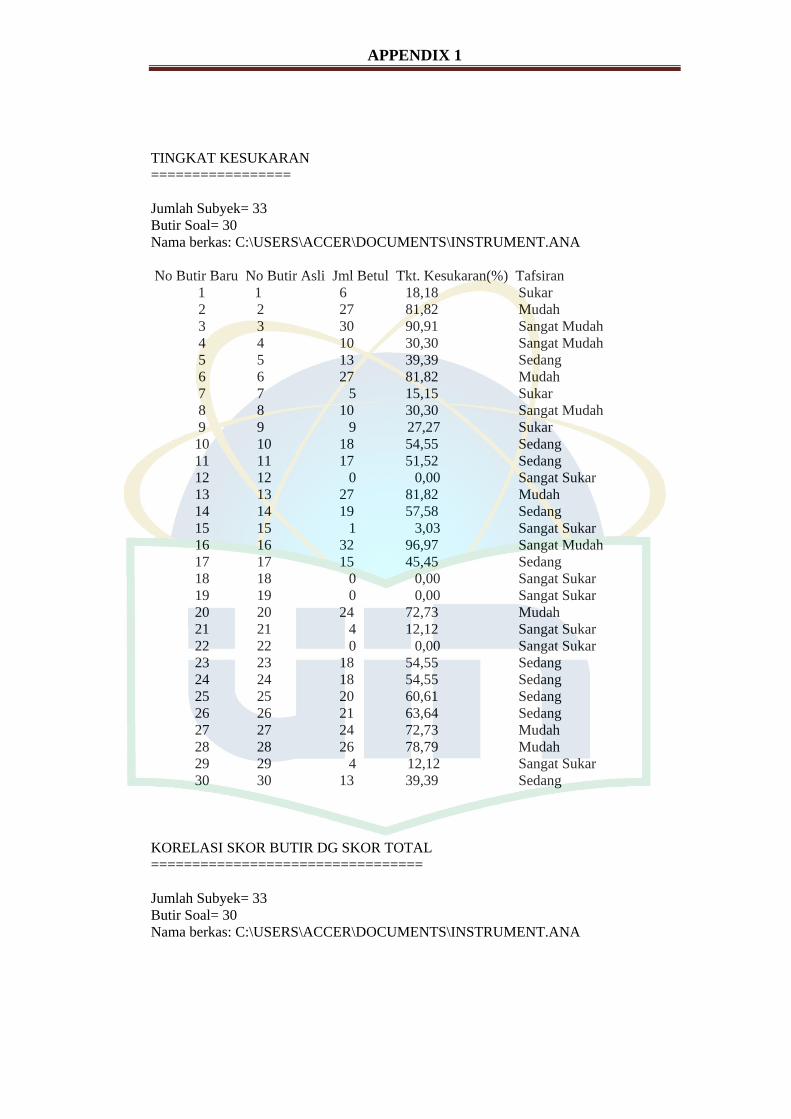
APPENDIX 1
TINGKAT KESUKARAN
=================
Jumlah Subyek= 33
Butir Soal= 30
Nama berkas: C:\USERS\ACCER\DOCUMENTS\INSTRUMENT.ANA
No Butir Baru No Butir Asli Jml Betul Tkt. Kesukaran(%) Tafsiran
1 1 6 18,18 Sukar
2 2 27 81,82 Mudah
3 3 30 90,91 Sangat Mudah
4 4 10 30,30 Sangat Mudah
5 5 13 39,39 Sedang
6 6 27 81,82 Mudah
7 7 5 15,15 Sukar
8 8 10 30,30 Sangat Mudah
9 9 9 27,27 Sukar
10 10 18 54,55 Sedang
11 11 17 51,52 Sedang
12 12 0 0,00 Sangat Sukar
13 13 27 81,82 Mudah
14 14 19 57,58 Sedang
15 15 1 3,03 Sangat Sukar
16 16 32 96,97 Sangat Mudah
17 17 15 45,45 Sedang
18 18 0 0,00 Sangat Sukar
19 19 0 0,00 Sangat Sukar
20 20 24 72,73 Mudah
21 21 4 12,12 Sangat Sukar
22 22 0 0,00 Sangat Sukar
23 23 18 54,55 Sedang
24 24 18 54,55 Sedang
25 25 20 60,61 Sedang
26 26 21 63,64 Sedang
27 27 24 72,73 Mudah
28 28 26 78,79 Mudah
29 29 4 12,12 Sangat Sukar
30 30 13 39,39 Sedang
KORELASI SKOR BUTIR DG SKOR TOTAL
=================================
Jumlah Subyek= 33
Butir Soal= 30
Nama berkas: C:\USERS\ACCER\DOCUMENTS\INSTRUMENT.ANA
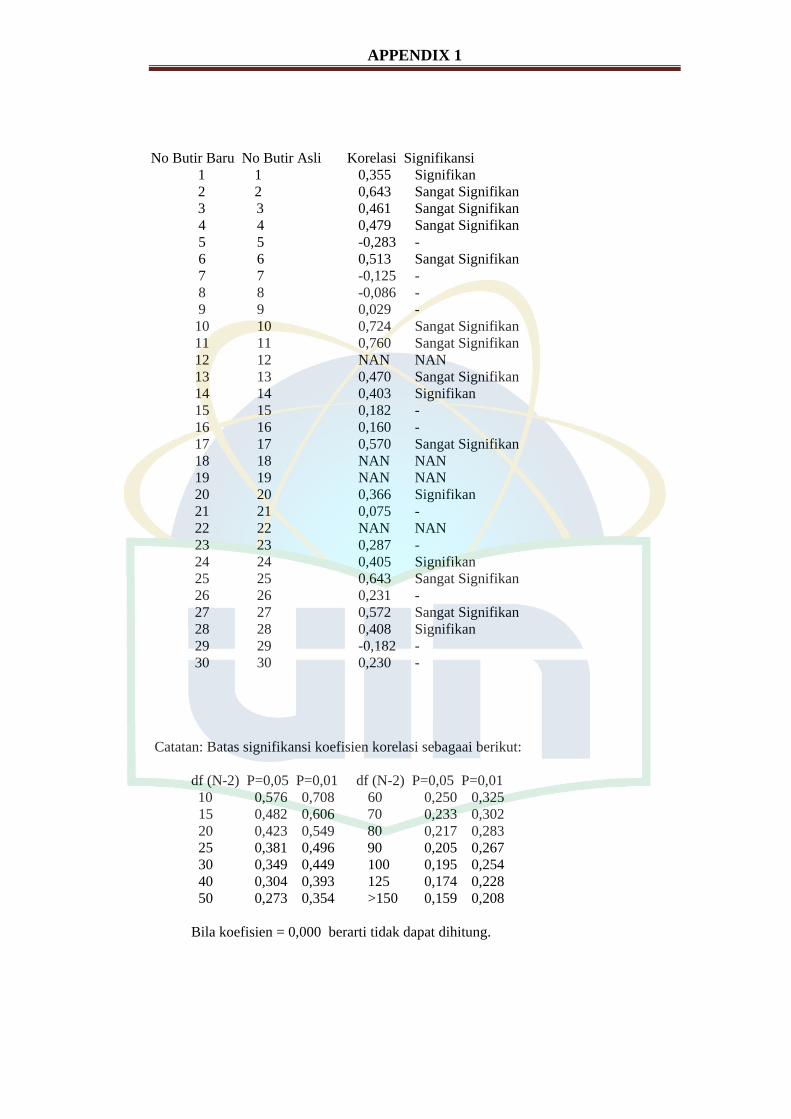
APPENDIX 1
No Butir Baru No Butir Asli Korelasi Signifikansi
1 1 0,355 Signifikan
2 2 0,643 Sangat Signifikan
3 3 0,461 Sangat Signifikan
4 4 0,479 Sangat Signifikan
5 5 -0,283 -
6 6 0,513 Sangat Signifikan
7 7 -0,125 -
8 8 -0,086 -
9 9 0,029 -
10 10 0,724 Sangat Signifikan
11 11 0,760 Sangat Signifikan
12 12 NAN NAN
13 13 0,470 Sangat Signifikan
14 14 0,403 Signifikan
15 15 0,182 -
16 16 0,160 -
17 17 0,570 Sangat Signifikan
18 18 NAN NAN
19 19 NAN NAN
20 20 0,366 Signifikan
21 21 0,075 -
22 22 NAN NAN
23 23 0,287 -
24 24 0,405 Signifikan
25 25 0,643 Sangat Signifikan
26 26 0,231 -
27 27 0,572 Sangat Signifikan
28 28 0,408 Signifikan
29 29 -0,182 -
30 30 0,230 -
Catatan: Batas signifikansi koefisien korelasi sebagaai berikut:
df (N-2) P=0,05 P=0,01 df (N-2) P=0,05 P=0,01
10 0,576 0,708 60 0,250 0,325
15 0,482 0,606 70 0,233 0,302
20 0,423 0,549 80 0,217 0,283
25 0,381 0,496 90 0,205 0,267
30 0,349 0,449 100 0,195 0,254
40 0,304 0,393 125 0,174 0,228
50 0,273 0,354 >150 0,159 0,208
Bila koefisien = 0,000 berarti tidak dapat dihitung.
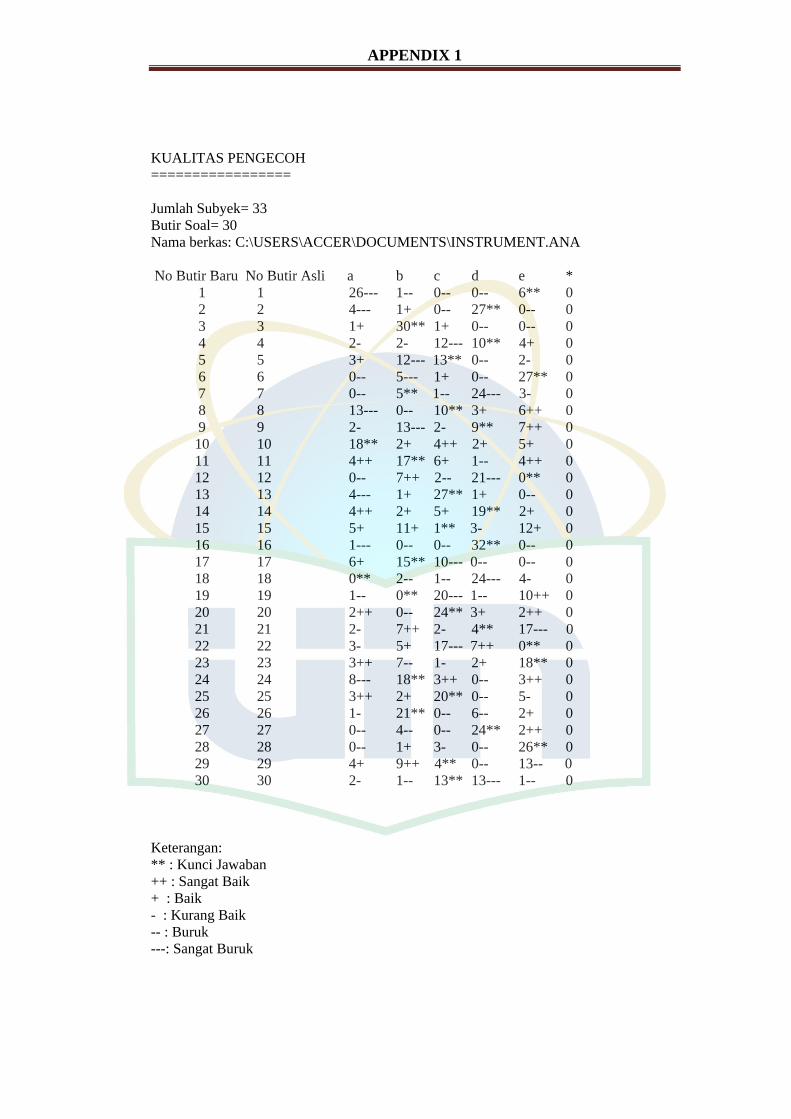
APPENDIX 1
KUALITAS PENGECOH
=================
Jumlah Subyek= 33
Butir Soal= 30
Nama berkas: C:\USERS\ACCER\DOCUMENTS\INSTRUMENT.ANA
No Butir Baru No Butir Asli a b c d e *
1 1 26--- 1-- 0-- 0-- 6** 0
2 2 4--- 1+ 0-- 27** 0-- 0
3 3 1+ 30** 1+ 0-- 0-- 0
4 4 2- 2- 12--- 10** 4+ 0
5 5 3+ 12--- 13** 0-- 2- 0
6 6 0-- 5--- 1+ 0-- 27** 0
7 7 0-- 5** 1-- 24--- 3- 0
8 8 13--- 0-- 10** 3+ 6++ 0
9 9 2- 13--- 2- 9** 7++ 0
10 10 18** 2+ 4++ 2+ 5+ 0
11 11 4++ 17** 6+ 1-- 4++ 0
12 12 0-- 7++ 2-- 21--- 0** 0
13 13 4--- 1+ 27** 1+ 0-- 0
14 14 4++ 2+ 5+ 19** 2+ 0
15 15 5+ 11+ 1** 3- 12+ 0
16 16 1--- 0-- 0-- 32** 0-- 0
17 17 6+ 15** 10--- 0-- 0-- 0
18 18 0** 2-- 1-- 24--- 4- 0
19 19 1-- 0** 20--- 1-- 10++ 0
20 20 2++ 0-- 24** 3+ 2++ 0
21 21 2- 7++ 2- 4** 17--- 0
22 22 3- 5+ 17--- 7++ 0** 0
23 23 3++ 7-- 1- 2+ 18** 0
24 24 8--- 18** 3++ 0-- 3++ 0
25 25 3++ 2+ 20** 0-- 5- 0
26 26 1- 21** 0-- 6-- 2+ 0
27 27 0-- 4-- 0-- 24** 2++ 0
28 28 0-- 1+ 3- 0-- 26** 0
29 29 4+ 9++ 4** 0-- 13-- 0
30 30 2- 1-- 13** 13--- 1-- 0
Keterangan:
** : Kunci Jawaban
++ : Sangat Baik
+ : Baik
- : Kurang Baik
-- : Buruk
---: Sangat Buruk
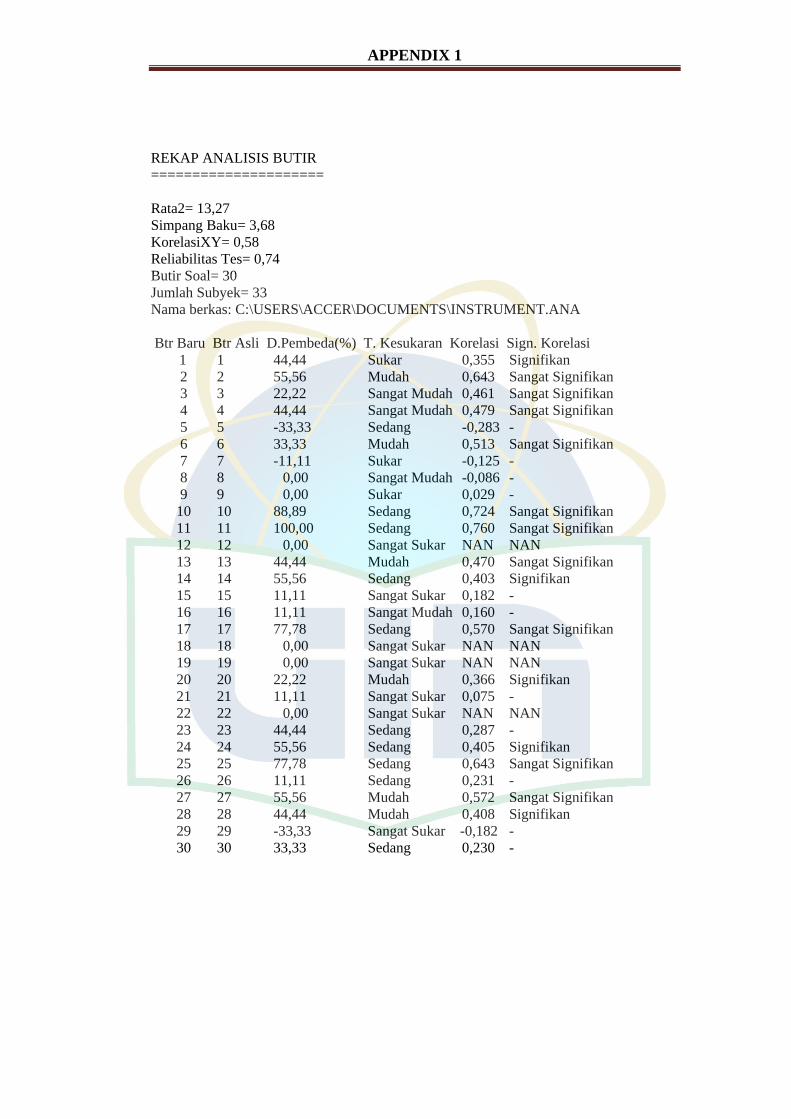
APPENDIX 1
REKAP ANALISIS BUTIR
=====================
Rata2= 13,27
Simpang Baku= 3,68
KorelasiXY= 0,58
Reliabilitas Tes= 0,74
Butir Soal= 30
Jumlah Subyek= 33
Nama berkas: C:\USERS\ACCER\DOCUMENTS\INSTRUMENT.ANA
Btr Baru Btr Asli D.Pembeda(%) T. Kesukaran Korelasi Sign. Korelasi
1 1 44,44 Sukar 0,355 Signifikan
2 2 55,56 Mudah 0,643 Sangat Signifikan
3 3 22,22 Sangat Mudah 0,461 Sangat Signifikan
4 4 44,44 Sangat Mudah 0,479 Sangat Signifikan
5 5 -33,33 Sedang -0,283 -
6 6 33,33 Mudah 0,513 Sangat Signifikan
7 7 -11,11 Sukar -0,125 -
8 8 0,00 Sangat Mudah -0,086 -
9 9 0,00 Sukar 0,029 -
10 10 88,89 Sedang 0,724 Sangat Signifikan
11 11 100,00 Sedang 0,760 Sangat Signifikan
12 12 0,00 Sangat Sukar NAN NAN
13 13 44,44 Mudah 0,470 Sangat Signifikan
14 14 55,56 Sedang 0,403 Signifikan
15 15 11,11 Sangat Sukar 0,182 -
16 16 11,11 Sangat Mudah 0,160 -
17 17 77,78 Sedang 0,570 Sangat Signifikan
18 18 0,00 Sangat Sukar NAN NAN
19 19 0,00 Sangat Sukar NAN NAN
20 20 22,22 Mudah 0,366 Signifikan
21 21 11,11 Sangat Sukar 0,075 -
22 22 0,00 Sangat Sukar NAN NAN
23 23 44,44 Sedang 0,287 -
24 24 55,56 Sedang 0,405 Signifikan
25 25 77,78 Sedang 0,643 Sangat Signifikan
26 26 11,11 Sedang 0,231 -
27 27 55,56 Mudah 0,572 Sangat Signifikan
28 28 44,44 Mudah 0,408 Signifikan
29 29 -33,33 Sangat Sukar -0,182 -
30 30 33,33 Sedang 0,230 -
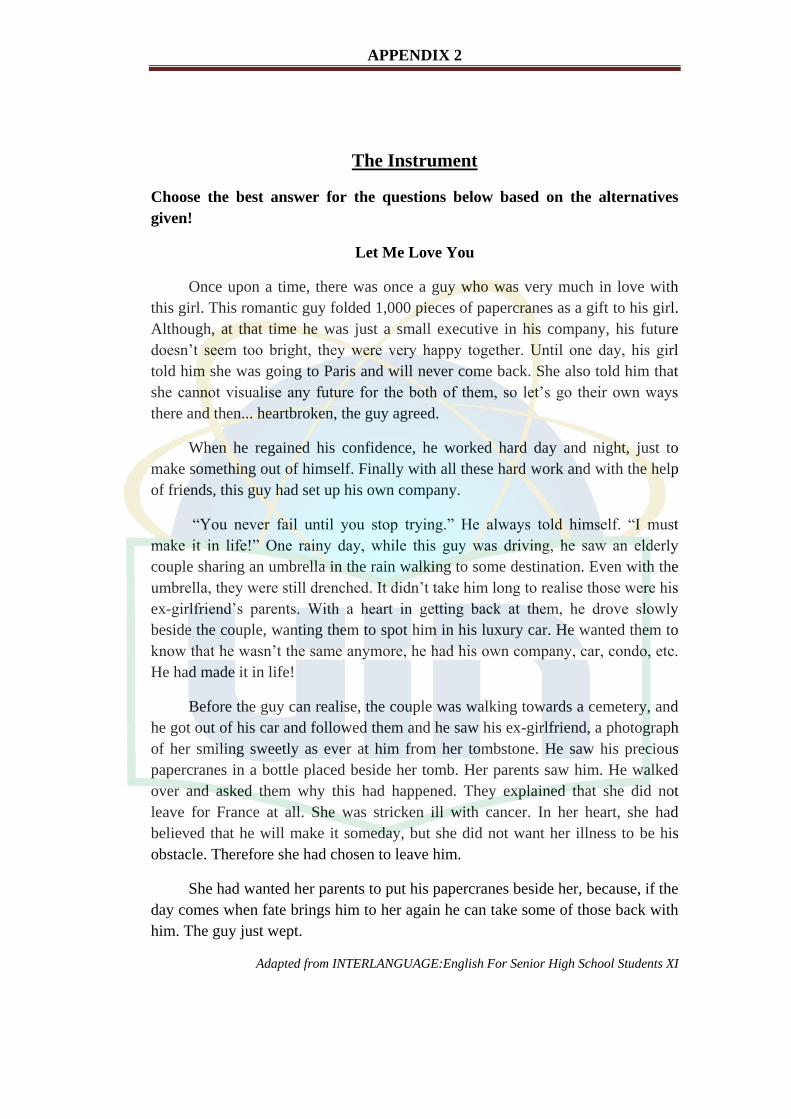
APPENDIX 2
The Instrument
Choose the best answer for the questions below based on the alternatives
given!
Let Me Love You
Once upon a time, there was once a guy who was very much in love with
this girl. This romantic guy folded 1,000 pieces of papercranes as a gift to his girl.
Although, at that time he was just a small executive in his company, his future
doesn’t seem too bright, they were very happy together. Until one day, his girl
told him she was going to Paris and will never come back. She also told him that
she cannot visualise any future for the both of them, so let’s go their own ways
there and then... heartbroken, the guy agreed.
When he regained his confidence, he worked hard day and night, just to
make something out of himself. Finally with all these hard work and with the help
of friends, this guy had set up his own company.
“You never fail until you stop trying.” He always told himself. “I must
make it in life!” One rainy day, while this guy was driving, he saw an elderly
couple sharing an umbrella in the rain walking to some destination. Even with the
umbrella, they were still drenched. It didn’t take him long to realise those were his
ex-girlfriend’s parents. With a heart in getting back at them, he drove slowly
beside the couple, wanting them to spot him in his luxury car. He wanted them to
know that he wasn’t the same anymore, he had his own company, car, condo, etc.
He had made it in life!
Before the guy can realise, the couple was walking towards a cemetery, and
he got out of his car and followed them and he saw his ex-girlfriend, a photograph
of her smiling sweetly as ever at him from her tombstone. He saw his precious
papercranes in a bottle placed beside her tomb. Her parents saw him. He walked
over and asked them why this had happened. They explained that she did not
leave for France at all. She was stricken ill with cancer. In her heart, she had
believed that he will make it someday, but she did not want her illness to be his
obstacle. Therefore she had chosen to leave him.
She had wanted her parents to put his papercranes beside her, because, if the
day comes when fate brings him to her again he can take some of those back with
him. The guy just wept.
Adapted from INTERLANGUAGE:English For Senior High School Students XI
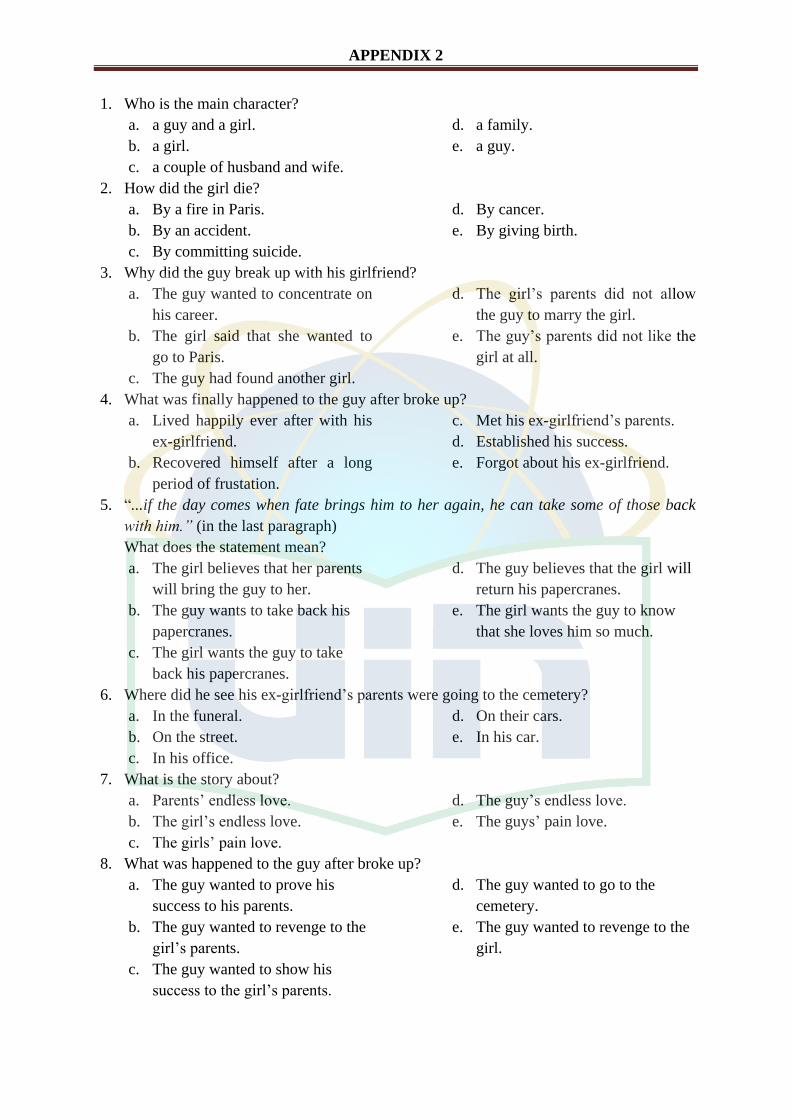
APPENDIX 2
1. Who is the main character?
a. a guy and a girl.
b. a girl.
c. a couple of husband and wife.
d. a family.
e. a guy.
2. How did the girl die?
a. By a fire in Paris.
b. By an accident.
c. By committing suicide.
d. By cancer.
e. By giving birth.
3. Why did the guy break up with his girlfriend?
a. The guy wanted to concentrate on
his career.
b. The girl said that she wanted to
go to Paris.
c. The guy had found another girl.
d. The girl’s parents did not allow
the guy to marry the girl.
e. The guy’s parents did not like the
girl at all.
4. What was finally happened to the guy after broke up?
a. Lived happily ever after with his
ex-girlfriend.
b. Recovered himself after a long
period of frustation.
c. Met his ex-girlfriend’s parents.
d. Established his success.
e. Forgot about his ex-girlfriend.
5. “...if the day comes when fate brings him to her again, he can take some of those back
with him.” (in the last paragraph)
What does the statement mean?
a. The girl believes that her parents
will bring the guy to her.
b. The guy wants to take back his
papercranes.
c. The girl wants the guy to take
back his papercranes.
d. The guy believes that the girl will
return his papercranes.
e. The girl wants the guy to know
that she loves him so much.
6. Where did he see his ex-girlfriend’s parents were going to the cemetery?
a. In the funeral.
b. On the street.
c. In his office.
d. On their cars.
e. In his car.
7. What is the story about?
a. Parents’ endless love.
b. The girl’s endless love.
c. The girls’ pain love.
d. The guy’s endless love.
e. The guys’ pain love.
8. What was happened to the guy after broke up?
a. The guy wanted to prove his
success to his parents.
b. The guy wanted to revenge to the
girl’s parents.
c. The guy wanted to show his
success to the girl’s parents.
d. The guy wanted to go to the
cemetery.
e. The guy wanted to revenge to the
girl.
APPENDIX 2
9. What can we learn from this story?
a. Love cannot be forced.
b. Everything happens for a reason.
c. Love is universal.
d. Fate will show someone’s way of
life.
e. Love is pain.
10. What is the resolution part of the story?
a. The guy knew the truth.
b. The guy went to the cemetery.
c. The girl told her illness.
d. The guy followed the girl’s
parents.
e. The girl left her papercranes.
11. “...she did not want her illness to be his obstacle.” (in the fourth paragraph)
The underlined word has similar meaning with...
a. Sadness.
b. Barrier.
c. Spirit.
d. Harm.
e. Pain.
12. “...she cannot visualise any future for the both of them.” (in the first paragraph)
What does the statement mean?
a. There is a chance for their
relationship in the future.
b. She cannot realize the man’s love
in the future.
c. She does not worry about her
relationship in the future.
d. She cannot picture the future of
her relationship.
e. There is no hope for their
relationship in the future.
13. “...she did not want her illness to be his obstacle.” (in the fourth paragraph)
The underlined word refers to...
a. The girl.
b. The girl’s father.
c. The guy.
d. The guy’s father.
e. The girl and the guy.
14. “...he can take some of those back with him.” (in the last paragraph)
The underlined word refers to...
a. The guy’s love.
b. The bottle of papercranes
c. The girl’s love.
d. The papercranes.
e. Both the guy and girl’s love.
15. When was the girl’s parents aware for the guy attendance in the cemetery?
a. After the guy looked at the girl’s
picture.
b. Before the guy went out from the
cemetery.
c. After the guy looked at the
papercranes.
d. Before the guy wept.
e. After the guy asked the truth.
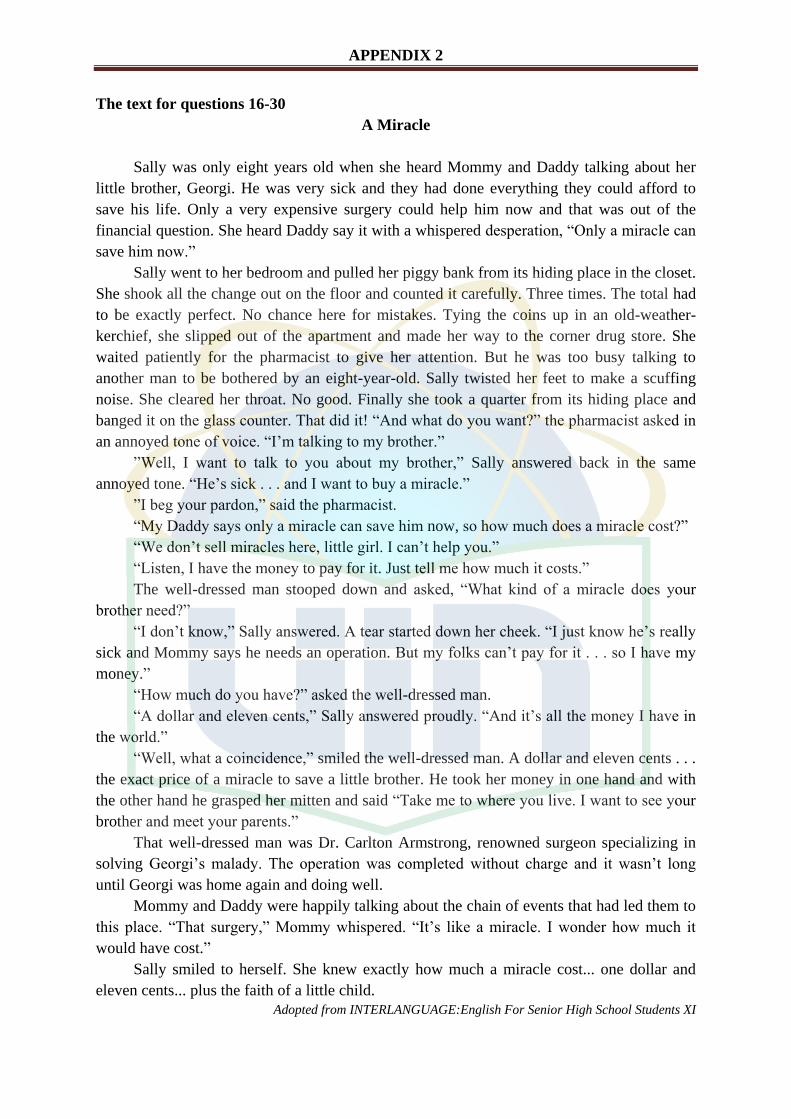
APPENDIX 2
The text for questions 16-30
A Miracle
Sally was only eight years old when she heard Mommy and Daddy talking about her
little brother, Georgi. He was very sick and they had done everything they could afford to
save his life. Only a very expensive surgery could help him now and that was out of the
financial question. She heard Daddy say it with a whispered desperation, “Only a miracle can
save him now.”
Sally went to her bedroom and pulled her piggy bank from its hiding place in the closet.
She shook all the change out on the floor and counted it carefully. Three times. The total had
to be exactly perfect. No chance here for mistakes. Tying the coins up in an old-weather-
kerchief, she slipped out of the apartment and made her way to the corner drug store. She
waited patiently for the pharmacist to give her attention. But he was too busy talking to
another man to be bothered by an eight-year-old. Sally twisted her feet to make a scuffing
noise. She cleared her throat. No good. Finally she took a quarter from its hiding place and
banged it on the glass counter. That did it! “And what do you want?” the pharmacist asked in
an annoyed tone of voice. “I’m talking to my brother.”
”Well, I want to talk to you about my brother,” Sally answered back in the same
annoyed tone. “He’s sick . . . and I want to buy a miracle.”
”I beg your pardon,” said the pharmacist.
“My Daddy says only a miracle can save him now, so how much does a miracle cost?”
“We don’t sell miracles here, little girl. I can’t help you.”
“Listen, I have the money to pay for it. Just tell me how much it costs.”
The well-dressed man stooped down and asked, “What kind of a miracle does your
brother need?”
“I don’t know,” Sally answered. A tear started down her cheek. “I just know he’s really
sick and Mommy says he needs an operation. But my folks can’t pay for it . . . so I have my
money.”
“How much do you have?” asked the well-dressed man.
“A dollar and eleven cents,” Sally answered proudly. “And it’s all the money I have in
the world.”
“Well, what a coincidence,” smiled the well-dressed man. A dollar and eleven cents . . .
the exact price of a miracle to save a little brother. He took her money in one hand and with
the other hand he grasped her mitten and said “Take me to where you live. I want to see your
brother and meet your parents.”
That well-dressed man was Dr. Carlton Armstrong, renowned surgeon specializing in
solving Georgi’s malady. The operation was completed without charge and it wasn’t long
until Georgi was home again and doing well.
Mommy and Daddy were happily talking about the chain of events that had led them to
this place. “That surgery,” Mommy whispered. “It’s like a miracle. I wonder how much it
would have cost.”
Sally smiled to herself. She knew exactly how much a miracle cost... one dollar and
eleven cents... plus the faith of a little child.
Adopted from INTERLANGUAGE:English For Senior High School Students XI
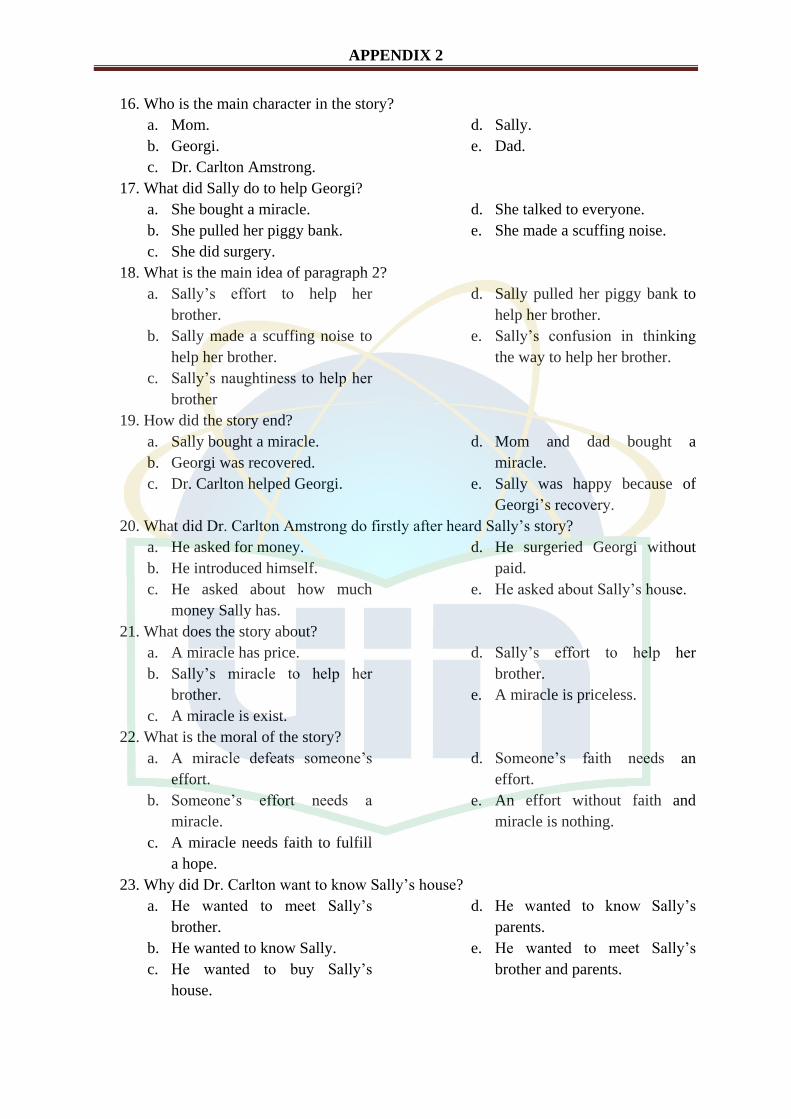
APPENDIX 2
16. Who is the main character in the story?
a. Mom.
b. Georgi.
c. Dr. Carlton Amstrong.
d. Sally.
e. Dad.
17. What did Sally do to help Georgi?
a. She bought a miracle.
b. She pulled her piggy bank.
c. She did surgery.
d. She talked to everyone.
e. She made a scuffing noise.
18. What is the main idea of paragraph 2?
a. Sally’s effort to help her
brother.
b. Sally made a scuffing noise to
help her brother.
c. Sally’s naughtiness to help her
brother
d. Sally pulled her piggy bank to
help her brother.
e. Sally’s confusion in thinking
the way to help her brother.
19. How did the story end?
a. Sally bought a miracle.
b. Georgi was recovered.
c. Dr. Carlton helped Georgi.
d. Mom and dad bought a
miracle.
e. Sally was happy because of
Georgi’s recovery.
20. What did Dr. Carlton Amstrong do firstly after heard Sally’s story?
a. He asked for money.
b. He introduced himself.
c. He asked about how much
money Sally has.
d. He surgeried Georgi without
paid.
e. He asked about Sally’s house.
21. What does the story about?
a. A miracle has price.
b. Sally’s miracle to help her
brother.
c. A miracle is exist.
d. Sally’s effort to help her
brother.
e. A miracle is priceless.
22. What is the moral of the story?
a. A miracle defeats someone’s
effort.
b. Someone’s effort needs a
miracle.
c. A miracle needs faith to fulfill
a hope.
d. Someone’s faith needs an
effort.
e. An effort without faith and
miracle is nothing.
23. Why did Dr. Carlton want to know Sally’s house?
a. He wanted to meet Sally’s
brother.
b. He wanted to know Sally.
c. He wanted to buy Sally’s
house.
d. He wanted to know Sally’s
parents.
e. He wanted to meet Sally’s
brother and parents.
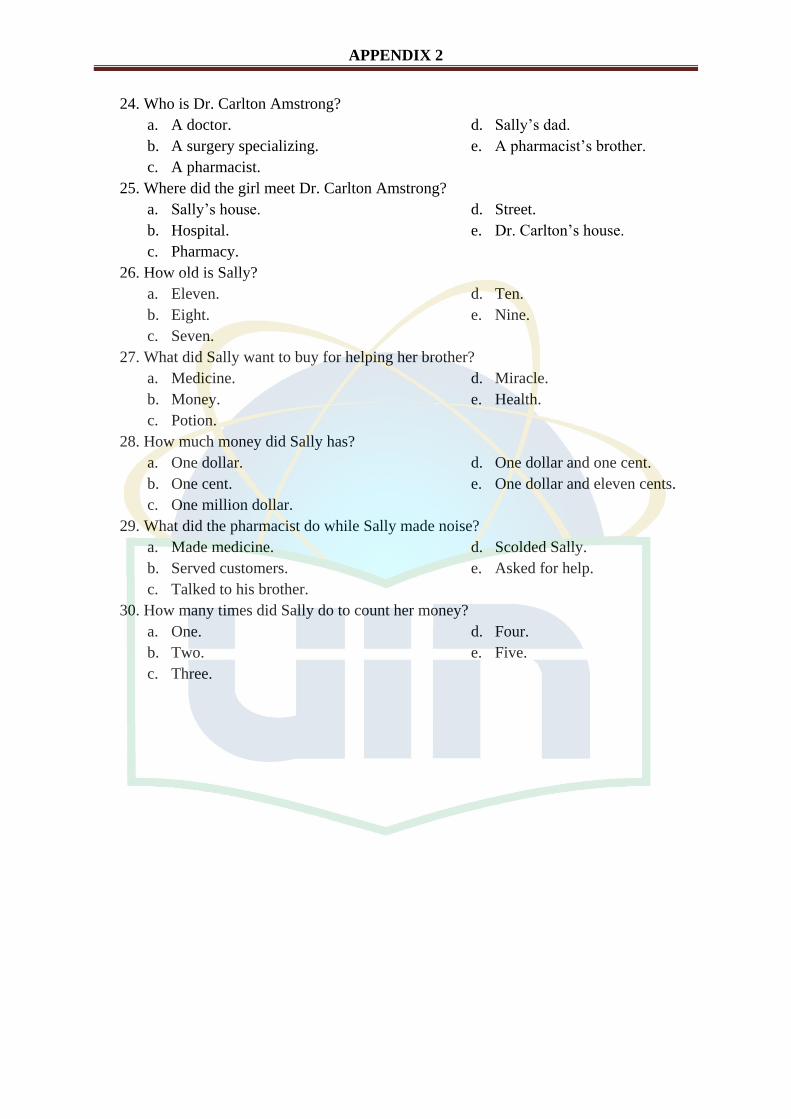
APPENDIX 2
24. Who is Dr. Carlton Amstrong?
a. A doctor.
b. A surgery specializing.
c. A pharmacist.
d. Sally’s dad.
e. A pharmacist’s brother.
25. Where did the girl meet Dr. Carlton Amstrong?
a. Sally’s house.
b. Hospital.
c. Pharmacy.
d. Street.
e. Dr. Carlton’s house.
26. How old is Sally?
a. Eleven.
b. Eight.
c. Seven.
d. Ten.
e. Nine.
27. What did Sally want to buy for helping her brother?
a. Medicine.
b. Money.
c. Potion.
d. Miracle.
e. Health.
28. How much money did Sally has?
a. One dollar.
b. One cent.
c. One million dollar.
d. One dollar and one cent.
e. One dollar and eleven cents.
29. What did the pharmacist do while Sally made noise?
a. Made medicine.
b. Served customers.
c. Talked to his brother.
d. Scolded Sally.
e. Asked for help.
30. How many times did Sally do to count her money?
a. One.
b. Two.
c. Three.
d. Four.
e. Five.
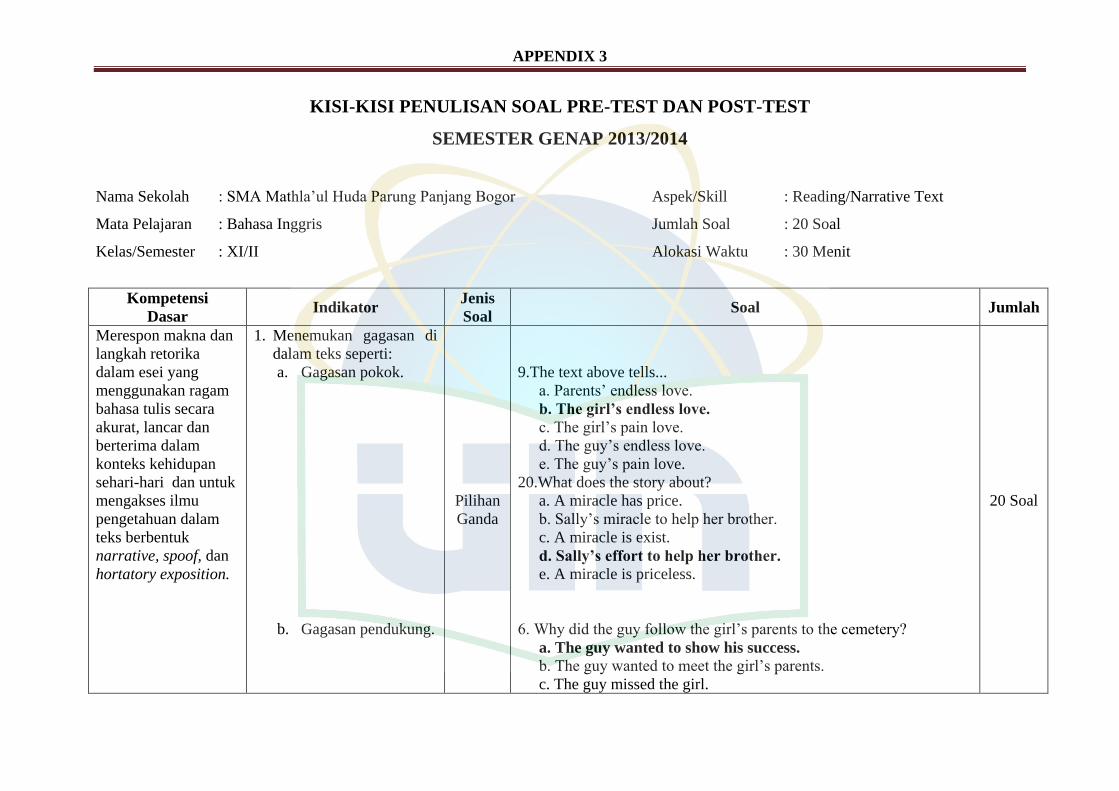
APPENDIX 3
KISI-KISI PENULISAN SOAL PRE-TEST DAN POST-TEST
SEMESTER GENAP 2013/2014
Nama Sekolah : SMA Mathla’ul Huda Parung Panjang Bogor Aspek/Skill : Reading/Narrative Text
Mata Pelajaran : Bahasa Inggris Jumlah Soal : 20 Soal
Kelas/Semester : XI/II Alokasi Waktu : 30 Menit
Kompetensi
Dasar Indikator
Jenis
Soal Soal Jumlah
Merespon makna dan
langkah retorika
dalam esei yang
menggunakan ragam
bahasa tulis secara
akurat, lancar dan
berterima dalam
konteks kehidupan
sehari-hari dan untuk
mengakses ilmu
pengetahuan dalam
teks berbentuk
narrative, spoof, dan
hortatory exposition.
1. Menemukan gagasan di
dalam teks seperti:
a. Gagasan pokok.
b. Gagasan pendukung.
Pilihan
Ganda
9.The text above tells...
a. Parents’ endless love.
b. The girl’s endless love.
c. The girl’s pain love.
d. The guy’s endless love.
e. The guy’s pain love.
20.What does the story about?
a. A miracle has price.
b. Sally’s miracle to help her brother.
c. A miracle is exist.
d. Sally’s effort to help her brother.
e. A miracle is priceless.
6. Why did the guy follow the girl’s parents to the cemetery?
a. The guy wanted to show his success.
b. The guy wanted to meet the girl’s parents.
c. The guy missed the girl.
20 Soal
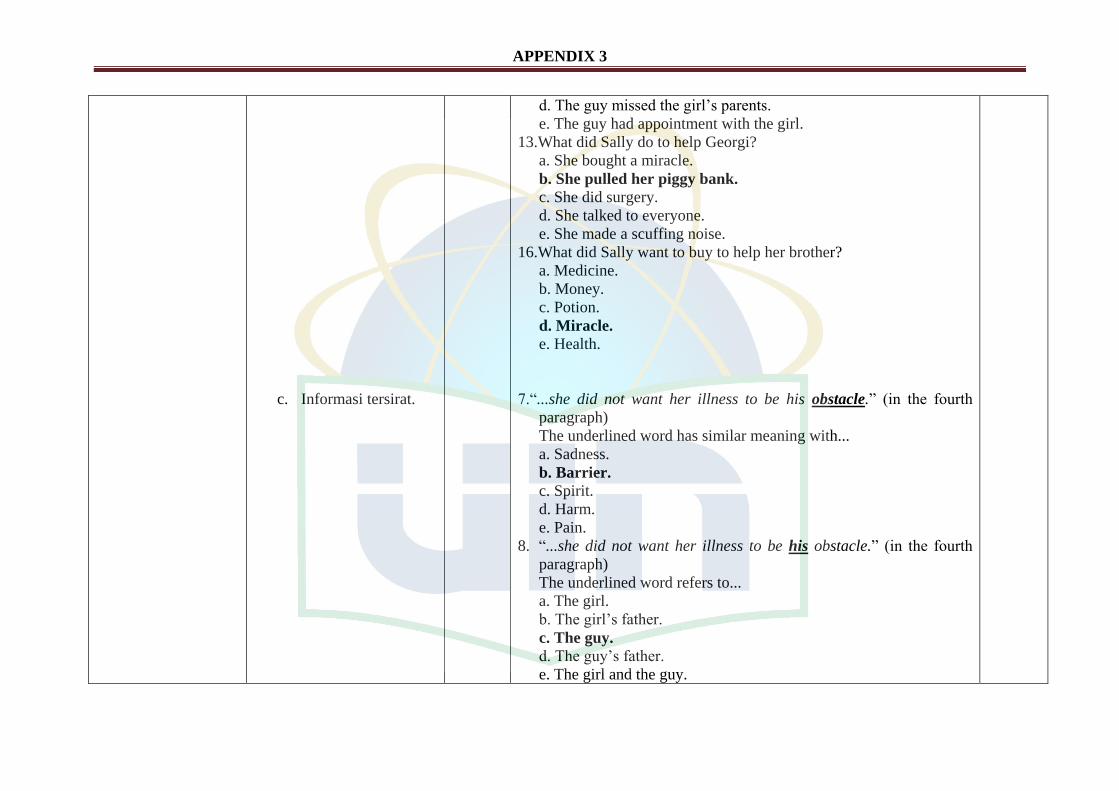
APPENDIX 3
c. Informasi tersirat.
d. The guy missed the girl’s parents.
e. The guy had appointment with the girl.
13.What did Sally do to help Georgi?
a. She bought a miracle.
b. She pulled her piggy bank.
c. She did surgery.
d. She talked to everyone.
e. She made a scuffing noise.
16.What did Sally want to buy to help her brother?
a. Medicine.
b. Money.
c. Potion.
d. Miracle.
e. Health.
7.“...she did not want her illness to be his obstacle.” (in the fourth
paragraph)
The underlined word has similar meaning with...
a. Sadness.
b. Barrier.
c. Spirit.
d. Harm.
e. Pain.
8. “...she did not want her illness to be his obstacle.” (in the fourth
paragraph)
The underlined word refers to...
a. The girl.
b. The girl’s father.
c. The guy.
d. The guy’s father.
e. The girl and the guy.
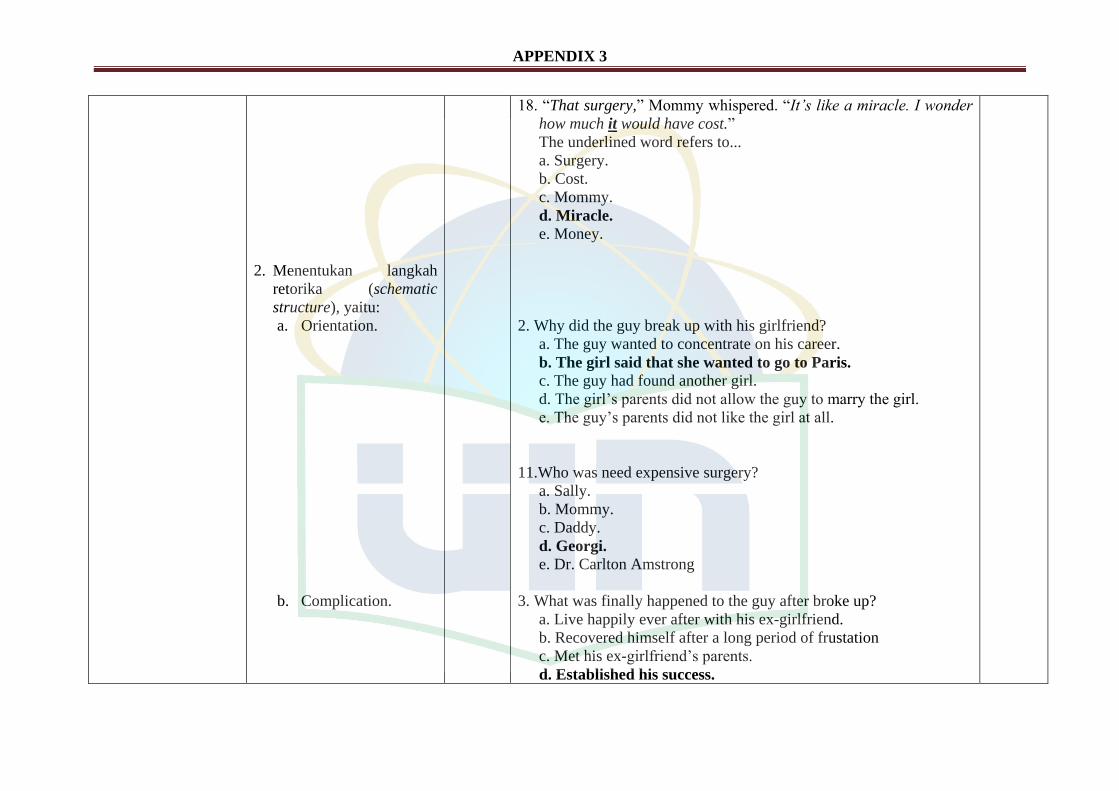
APPENDIX 3
2. Menentukan langkah
retorika (schematic
structure), yaitu:
a. Orientation.
b. Complication.
18. “That surgery,” Mommy whispered. “It’s like a miracle. I wonder
how much it would have cost.”
The underlined word refers to...
a. Surgery.
b. Cost.
c. Mommy.
d. Miracle.
e. Money.
2. Why did the guy break up with his girlfriend?
a. The guy wanted to concentrate on his career.
b. The girl said that she wanted to go to Paris.
c. The guy had found another girl.
d. The girl’s parents did not allow the guy to marry the girl.
e. The guy’s parents did not like the girl at all.
11.Who was need expensive surgery?
a. Sally.
b. Mommy.
c. Daddy.
d. Georgi.
e. Dr. Carlton Amstrong
3. What was finally happened to the guy after broke up?
a. Live happily ever after with his ex-girlfriend.
b. Recovered himself after a long period of frustation
c. Met his ex-girlfriend’s parents.
d. Established his success.
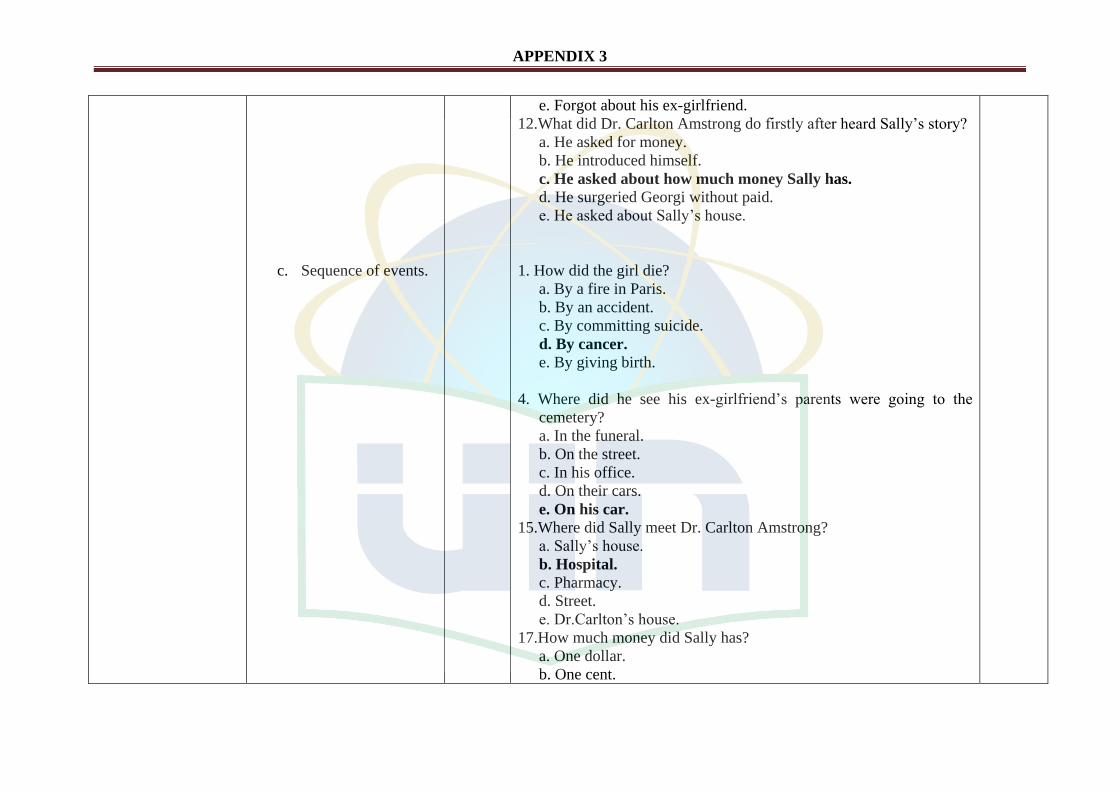
APPENDIX 3
c. Sequence of events.
e. Forgot about his ex-girlfriend.
12.What did Dr. Carlton Amstrong do firstly after heard Sally’s story?
a. He asked for money.
b. He introduced himself.
c. He asked about how much money Sally has.
d. He surgeried Georgi without paid.
e. He asked about Sally’s house.
1. How did the girl die?
a. By a fire in Paris.
b. By an accident.
c. By committing suicide.
d. By cancer.
e. By giving birth.
4. Where did he see his ex-girlfriend’s parents were going to the
cemetery?
a. In the funeral.
b. On the street.
c. In his office.
d. On their cars.
e. On his car.
15.Where did Sally meet Dr. Carlton Amstrong?
a. Sally’s house.
b. Hospital.
c. Pharmacy.
d. Street.
e. Dr.Carlton’s house.
17.How much money did Sally has?
a. One dollar.
b. One cent.
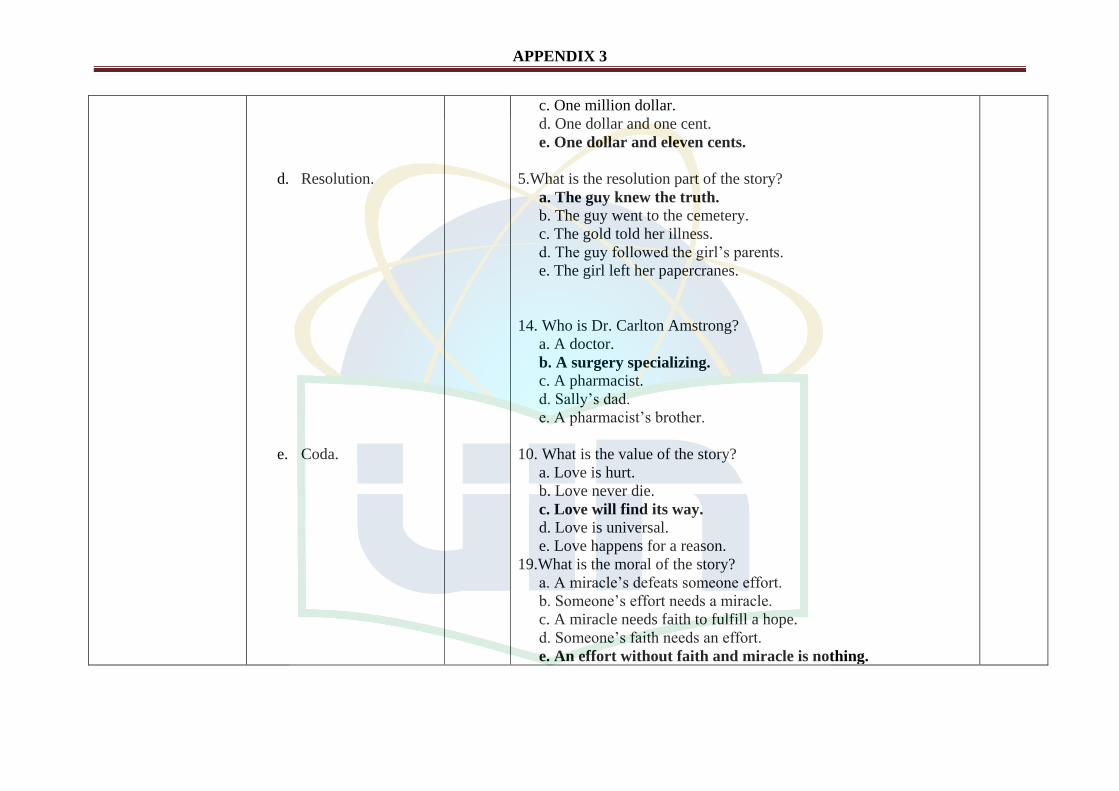
APPENDIX 3
d. Resolution.
e. Coda.
c. One million dollar.
d. One dollar and one cent.
e. One dollar and eleven cents.
5.What is the resolution part of the story?
a. The guy knew the truth.
b. The guy went to the cemetery.
c. The gold told her illness.
d. The guy followed the girl’s parents.
e. The girl left her papercranes.
14. Who is Dr. Carlton Amstrong?
a. A doctor.
b. A surgery specializing.
c. A pharmacist.
d. Sally’s dad.
e. A pharmacist’s brother.
10. What is the value of the story?
a. Love is hurt.
b. Love never die.
c. Love will find its way.
d. Love is universal.
e. Love happens for a reason.
19.What is the moral of the story?
a. A miracle’s defeats someone effort.
b. Someone’s effort needs a miracle.
c. A miracle needs faith to fulfill a hope.
d. Someone’s faith needs an effort.
e. An effort without faith and miracle is nothing.
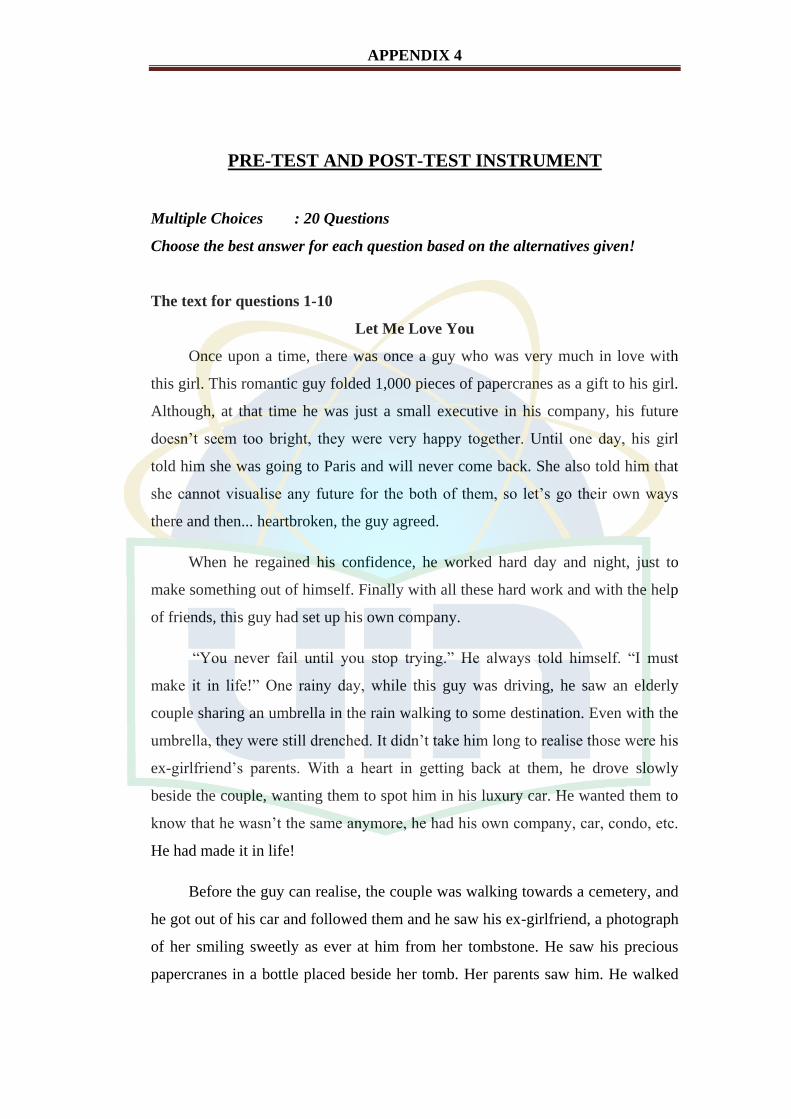
APPENDIX 4
PRE-TEST AND POST-TEST INSTRUMENT
Multiple Choices : 20 Questions
Choose the best answer for each question based on the alternatives given!
The text for questions 1-10
Let Me Love You
Once upon a time, there was once a guy who was very much in love with
this girl. This romantic guy folded 1,000 pieces of papercranes as a gift to his girl.
Although, at that time he was just a small executive in his company, his future
doesn’t seem too bright, they were very happy together. Until one day, his girl
told him she was going to Paris and will never come back. She also told him that
she cannot visualise any future for the both of them, so let’s go their own ways
there and then... heartbroken, the guy agreed.
When he regained his confidence, he worked hard day and night, just to
make something out of himself. Finally with all these hard work and with the help
of friends, this guy had set up his own company.
“You never fail until you stop trying.” He always told himself. “I must
make it in life!” One rainy day, while this guy was driving, he saw an elderly
couple sharing an umbrella in the rain walking to some destination. Even with the
umbrella, they were still drenched. It didn’t take him long to realise those were his
ex-girlfriend’s parents. With a heart in getting back at them, he drove slowly
beside the couple, wanting them to spot him in his luxury car. He wanted them to
know that he wasn’t the same anymore, he had his own company, car, condo, etc.
He had made it in life!
Before the guy can realise, the couple was walking towards a cemetery, and
he got out of his car and followed them and he saw his ex-girlfriend, a photograph
of her smiling sweetly as ever at him from her tombstone. He saw his precious
papercranes in a bottle placed beside her tomb. Her parents saw him. He walked
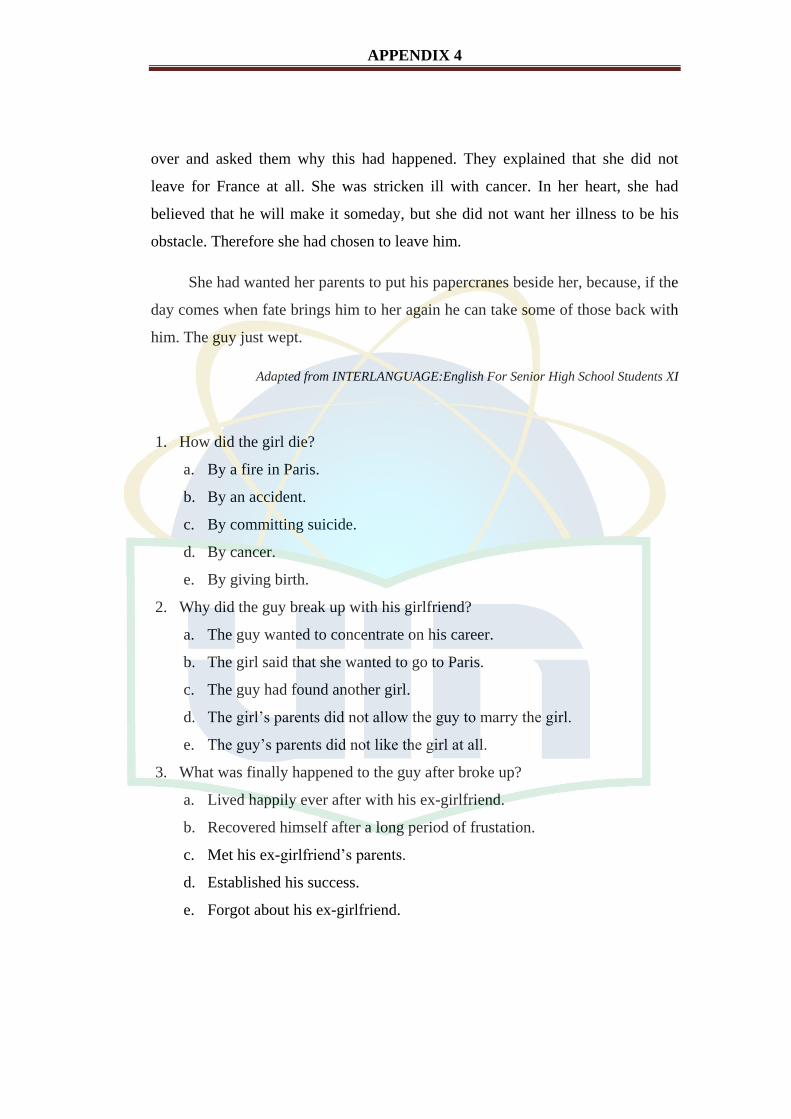
APPENDIX 4
over and asked them why this had happened. They explained that she did not
leave for France at all. She was stricken ill with cancer. In her heart, she had
believed that he will make it someday, but she did not want her illness to be his
obstacle. Therefore she had chosen to leave him.
She had wanted her parents to put his papercranes beside her, because, if the
day comes when fate brings him to her again he can take some of those back with
him. The guy just wept.
Adapted from INTERLANGUAGE:English For Senior High School Students XI
1. How did the girl die?
a. By a fire in Paris.
b. By an accident.
c. By committing suicide.
d. By cancer.
e. By giving birth.
2. Why did the guy break up with his girlfriend?
a. The guy wanted to concentrate on his career.
b. The girl said that she wanted to go to Paris.
c. The guy had found another girl.
d. The girl’s parents did not allow the guy to marry the girl.
e. The guy’s parents did not like the girl at all.
3. What was finally happened to the guy after broke up?
a. Lived happily ever after with his ex-girlfriend.
b. Recovered himself after a long period of frustation.
c. Met his ex-girlfriend’s parents.
d. Established his success.
e. Forgot about his ex-girlfriend.
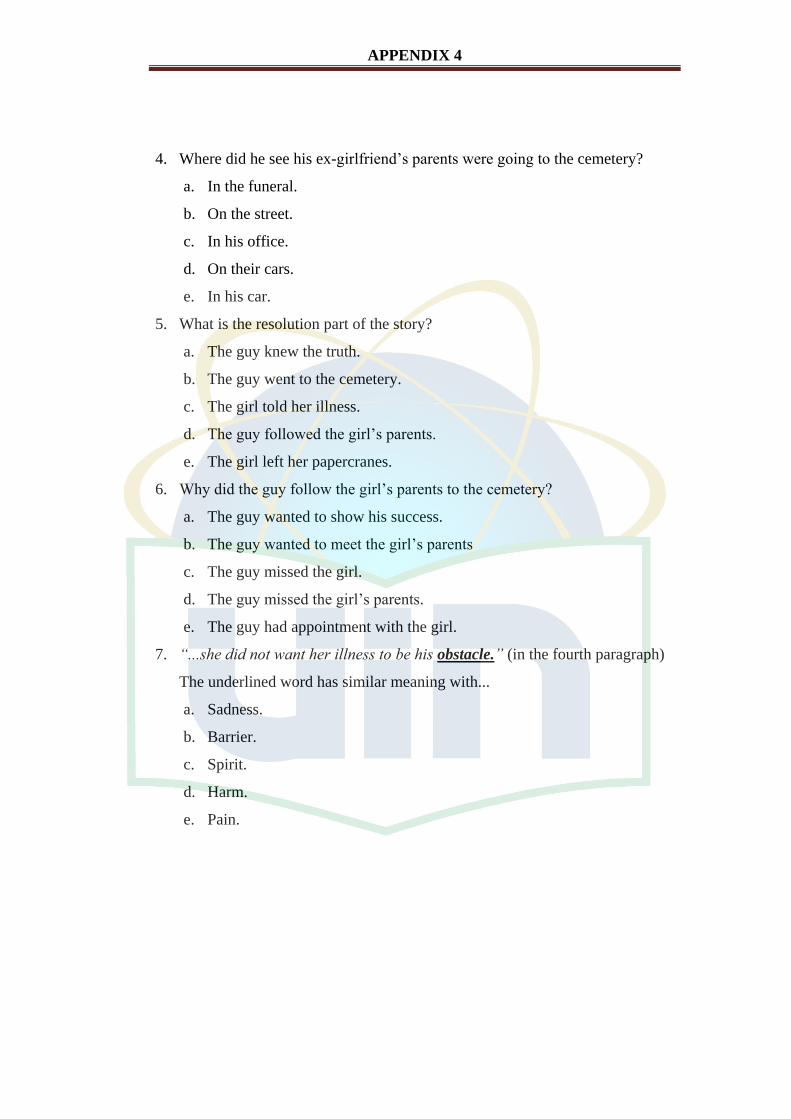
APPENDIX 4
4. Where did he see his ex-girlfriend’s parents were going to the cemetery?
a. In the funeral.
b. On the street.
c. In his office.
d. On their cars.
e. In his car.
5. What is the resolution part of the story?
a. The guy knew the truth.
b. The guy went to the cemetery.
c. The girl told her illness.
d. The guy followed the girl’s parents.
e. The girl left her papercranes.
6. Why did the guy follow the girl’s parents to the cemetery?
a. The guy wanted to show his success.
b. The guy wanted to meet the girl’s parents
c. The guy missed the girl.
d. The guy missed the girl’s parents.
e. The guy had appointment with the girl.
7. “...she did not want her illness to be his obstacle.” (in the fourth paragraph)
The underlined word has similar meaning with...
a. Sadness.
b. Barrier.
c. Spirit.
d. Harm.
e. Pain.
APPENDIX 4
8. “...she did not want her illness to be his obstacle.” (in the fourth paragraph)
The underlined word refers to...
a. The girl.
b. The girl’s father.
c. The guy.
d. The guy’s father.
e. The girl and the guy.
9. The text above tells...
a. The girl’s pain love.
b. The couple’s pain love.
c. The guy’s endless love.
d. The girl’s endless love.
e. The guy’s pain love.
10. What is the value of the story?
a. Love is hurt.
b. Love never die.
c. Love will find its way.
d. Love is universal.
e. Love happens for a reason.
The text for questions 11-20
A Miracle
Sally was only eight years old when she heard Mommy and Daddy talking
about her little brother, Georgi. He was very sick and they had done everything
they could afford to save his life. Only a very expensive surgery could help him
now and that was out of the financial question. She heard Daddy say it with a
whispered desperation, “Only a miracle can save him now.”
Sally went to her bedroom and pulled her piggy bank from its hiding place
in the closet. She shook all the change out on the floor and counted it carefully.
Three times. The total had to be exactly perfect. No chance here for mistakes.
APPENDIX 4
Tying the coins up in an old-weather-kerchief, she slipped out of the apartment
and made her way to the corner drug store. She waited patiently for the
pharmacist to give her attention. But he was too busy talking to another man to be
bothered by an eight-year-old. Sally twisted her feet to make a scuffing noise. She
cleared her throat. No good. Finally she took a quarter from its hiding place and
banged it on the glass counter. That did it! “And what do you want?” the
pharmacist asked in an annoyed tone of voice. “I’m talking to my brother.”
”Well, I want to talk to you about my brother,” Sally answered back in the
same annoyed tone. “He’s sick . . . and I want to buy a miracle.”
”I beg your pardon,” said the pharmacist.
“My Daddy says only a miracle can save him now, so how much does a
miracle cost?”
“We don’t sell miracles here, little girl. I can’t help you.”
“Listen, I have the money to pay for it. Just tell me how much it costs.”
The well-dressed man stooped down and asked, “What kind of a miracle
does your brother need?”
“I don’t know,” Sally answered. A tear started down her cheek. “I just know
he’s really sick and Mommy says he needs an operation. But my folks can’t pay
for it . . . so I have my money.”
“How much do you have?” asked the well-dressed man.
“A dollar and eleven cents,” Sally answered proudly. “And it’s all the
money I have in the world.”
“Well, what a coincidence,” smiled the well-dressed man. A dollar and
eleven cents . . . the exact price of a miracle to save a little brother. He took her
money in one hand and with the other hand he grasped her mitten and said “Take
me to where you live. I want to see your brother and meet your parents.”
That well-dressed man was Dr. Carlton Armstrong, renowned surgeon
specializing in solving Georgi’s malady. The operation was completed without
charge and it wasn’t long until Georgi was home again and doing well.
APPENDIX 4
Mommy and Daddy were happily talking about the chain of events that had
led them to this place. “That surgery,” Mommy whispered. “It’s like a miracle. I
wonder how much it would have cost.”
Sally smiled to herself. She knew exactly how much a miracle cost... one
dollar and eleven cents... plus the faith of a little child.
Adopted from INTERLANGUAGE:English For Senior High School Students XI
11. Who was need expensive surgery?
a. Sally.
b. Mommy.
c. Daddy.
d. Georgi.
e. Dr. Carlton Amstrong.
12. What did Dr. Carlton Amstrong do firstly after heard Sally’s story?
a. He asked for money.
b. He introduced himself.
c. He asked about how much money Sally has.
d. He surgeried Georgi without paid.
e. He asked about Sally’s house.
13. What did Sally do to help Georgi?
a. She bought a miracle.
b. She pulled her piggy bank.
c. She did surgery.
d. She talked to everyone.
e. She made a scuffing noise.
14. Who is Dr. Carlton Amstrong?
a. A doctor.
b. A surgery specializing.
c. A pharmacist.
d. Sally’s dad.
e. A pharmacist’s brother.
APPENDIX 4
15. Where did Sally meet Dr. Carlton Amstrong?
a. Sally’s house.
b. Hospital.
c. Pharmacy.
d. Street.
e. Dr. Carlton’s house.
16. What did Sally want to buy for helping her brother?
a. Medicine.
b. Money.
c. Potion.
d. Miracle.
e. Health.
17. How much money did Sally has?
a. One dollar.
b. One cent.
c. One million dollar.
d. One dollar and one cent.
e. One dollar and eleven cents.
18. “That surgery,” Mommy whispered. “It’s like a miracle. I wonder how much
it would have cost.”
The underlined word refers to...
a. Surgery.
b. Cost.
c. Mommy.
d. Miracle.
e. Money.
APPENDIX 4
19. What can we learn from the story?
a. A miracle defeats someone’s effort.
b. Someone’s effort needs a miracle.
c. A miracle needs faith to fulfill a hope.
d. Someone’s faith needs an effort.
e. An effort without faith and miracle is nothing.
20. What does the story about?
a. A miracle has price.
b. Sally’s miracle to help her brother.
c. A miracle is exist.
d. Sally’s effort to help her brother.
e. A miracle is priceless.
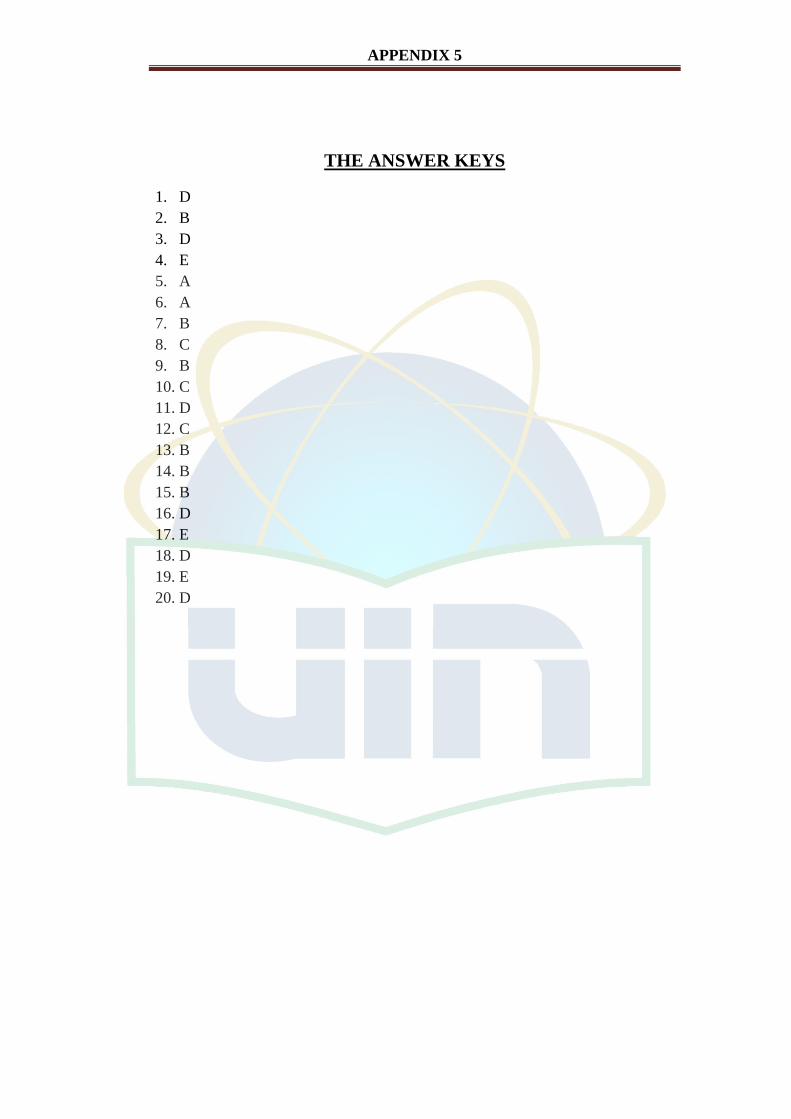
APPENDIX 5
THE ANSWER KEYS
1. D
2. B
3. D
4. E
5. A
6. A
7. B
8. C
9. B
10. C
11. D
12. C
13. B
14. B
15. B
16. D
17. E
18. D
19. E
20. D
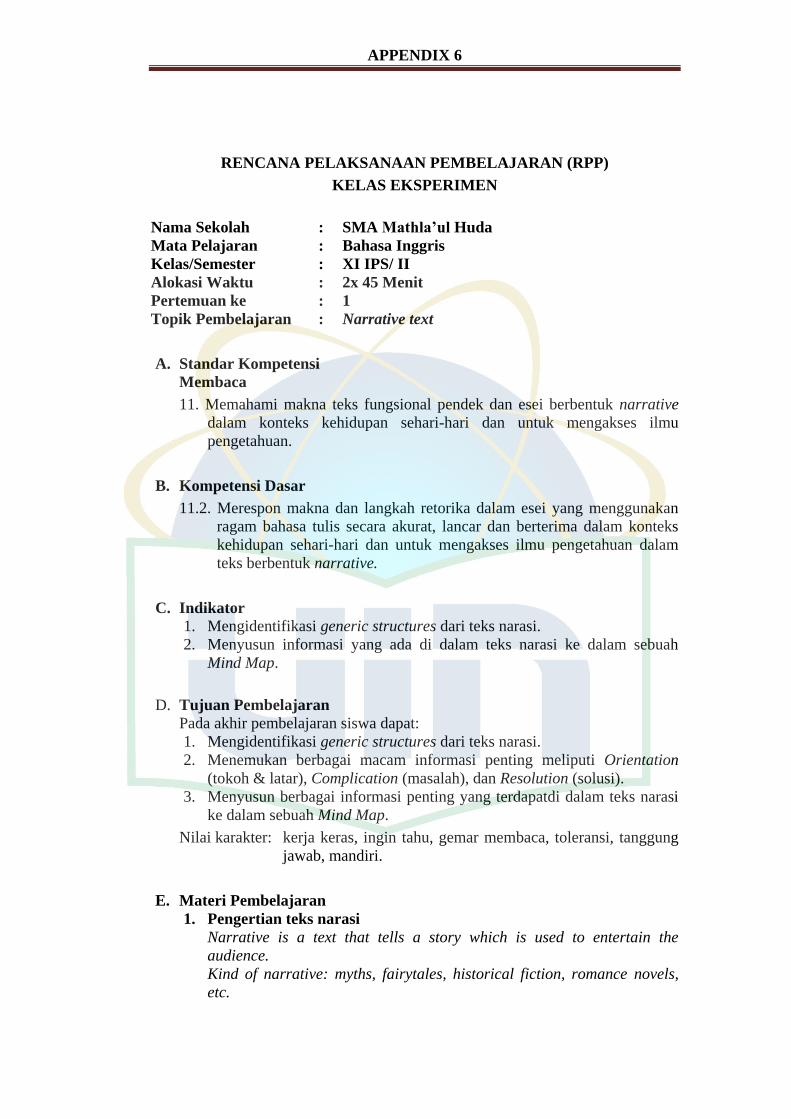
APPENDIX 6
RENCANA PELAKSANAAN PEMBELAJARAN (RPP)
KELAS EKSPERIMEN
Nama Sekolah : SMA Mathla’ul Huda
Mata Pelajaran : Bahasa Inggris
Kelas/Semester : XI IPS/ II
Alokasi Waktu : 2x 45 Menit
Pertemuan ke : 1
Topik Pembelajaran : Narrative text
A. Standar Kompetensi
Membaca
11. Memahami makna teks fungsional pendek dan esei berbentuk narrative
dalam konteks kehidupan sehari-hari dan untuk mengakses ilmu
pengetahuan.
B. Kompetensi Dasar
11.2. Merespon makna dan langkah retorika dalam esei yang menggunakan
ragam bahasa tulis secara akurat, lancar dan berterima dalam konteks
kehidupan sehari-hari dan untuk mengakses ilmu pengetahuan dalam
teks berbentuk narrative.
C. Indikator
1. Mengidentifikasi generic structures dari teks narasi.
2. Menyusun informasi yang ada di dalam teks narasi ke dalam sebuah
Mind Map.
D. Tujuan Pembelajaran
Pada akhir pembelajaran siswa dapat:
1. Mengidentifikasi generic structures dari teks narasi.
2. Menemukan berbagai macam informasi penting meliputi Orientation
(tokoh & latar), Complication (masalah), dan Resolution (solusi).
3. Menyusun berbagai informasi penting yang terdapatdi dalam teks narasi
ke dalam sebuah Mind Map.
Nilai karakter: kerja keras, ingin tahu, gemar membaca, toleransi, tanggung
jawab, mandiri.
E. Materi Pembelajaran
1. Pengertian teks narasi
Narrative is a text that tells a story which is used to entertain the
audience.
Kind of narrative: myths, fairytales, historical fiction, romance novels,
etc.
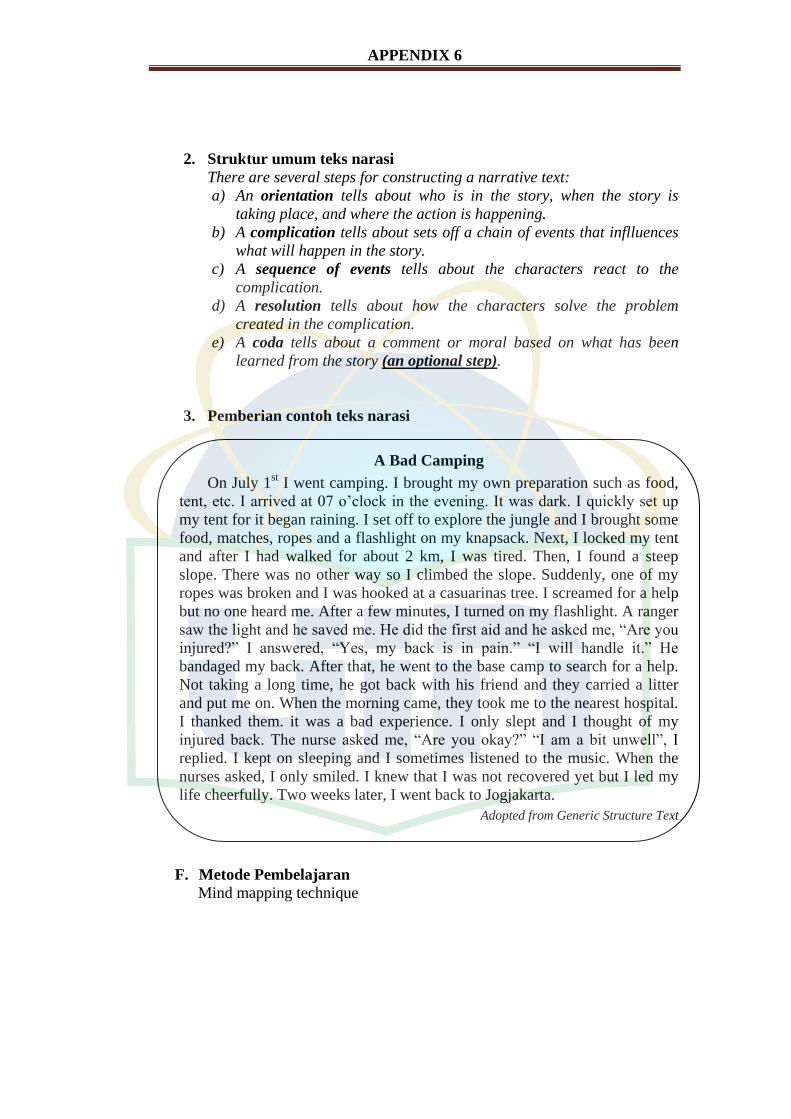
APPENDIX 6
2. Struktur umum teks narasi
There are several steps for constructing a narrative text:
a) An orientation tells about who is in the story, when the story is
taking place, and where the action is happening.
b) A complication tells about sets off a chain of events that inflluences
what will happen in the story.
c) A sequence of events tells about the characters react to the
complication.
d) A resolution tells about how the characters solve the problem
created in the complication.
e) A coda tells about a comment or moral based on what has been
learned from the story (an optional step).
3. Pemberian contoh teks narasi
A Bad Camping
On July 1st I went camping. I brought my own preparation such as food,
tent, etc. I arrived at 07 o’clock in the evening. It was dark. I quickly set up
my tent for it began raining. I set off to explore the jungle and I brought some
food, matches, ropes and a flashlight on my knapsack. Next, I locked my tent
and after I had walked for about 2 km, I was tired. Then, I found a steep
slope. There was no other way so I climbed the slope. Suddenly, one of my
ropes was broken and I was hooked at a casuarinas tree. I screamed for a help
but no one heard me. After a few minutes, I turned on my flashlight. A ranger
saw the light and he saved me. He did the first aid and he asked me, “Are you
injured?” I answered, “Yes, my back is in pain.” “I will handle it.” He
bandaged my back. After that, he went to the base camp to search for a help.
Not taking a long time, he got back with his friend and they carried a litter
and put me on. When the morning came, they took me to the nearest hospital.
I thanked them. it was a bad experience. I only slept and I thought of my
injured back. The nurse asked me, “Are you okay?” “I am a bit unwell”, I
replied. I kept on sleeping and I sometimes listened to the music. When the
nurses asked, I only smiled. I knew that I was not recovered yet but I led my
life cheerfully. Two weeks later, I went back to Jogjakarta.
Adopted from Generic Structure Text
F. Metode Pembelajaran
Mind mapping technique
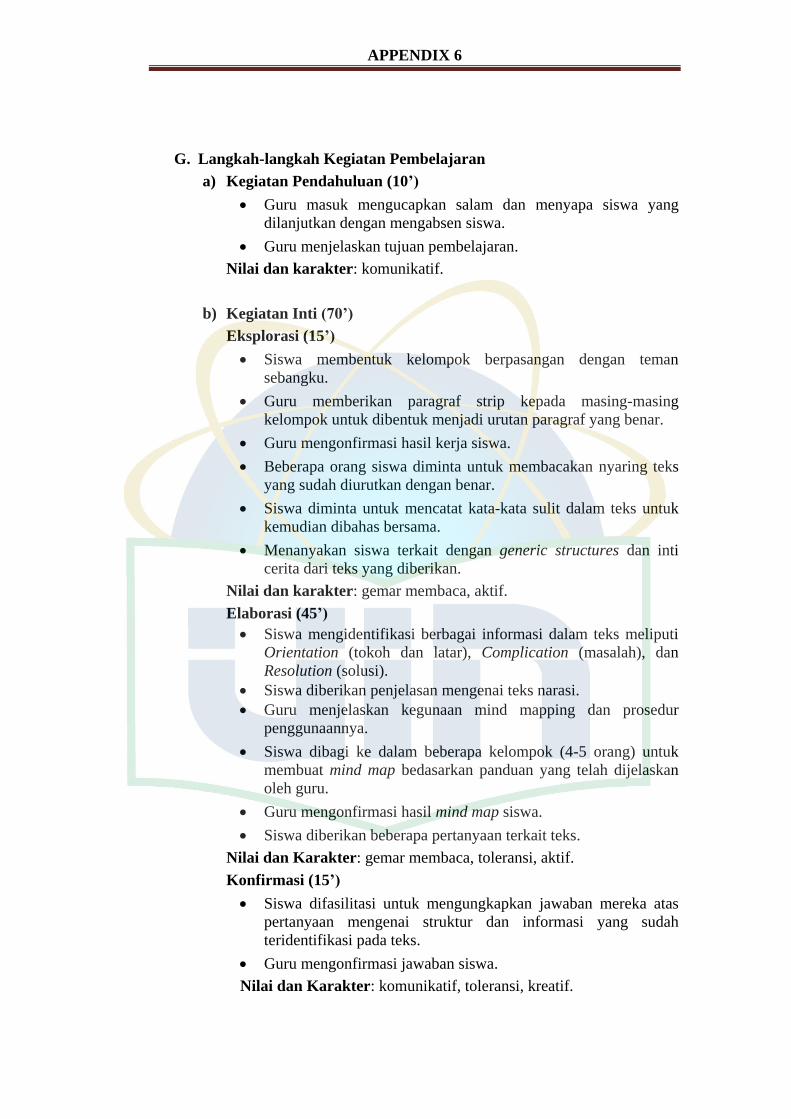
APPENDIX 6
G. Langkah-langkah Kegiatan Pembelajaran
a) Kegiatan Pendahuluan (10’)
Guru masuk mengucapkan salam dan menyapa siswa yang
dilanjutkan dengan mengabsen siswa.
Guru menjelaskan tujuan pembelajaran.
Nilai dan karakter: komunikatif.
b) Kegiatan Inti (70’)
Eksplorasi (15’)
Siswa membentuk kelompok berpasangan dengan teman
sebangku.
Guru memberikan paragraf strip kepada masing-masing
kelompok untuk dibentuk menjadi urutan paragraf yang benar.
Guru mengonfirmasi hasil kerja siswa.
Beberapa orang siswa diminta untuk membacakan nyaring teks
yang sudah diurutkan dengan benar.
Siswa diminta untuk mencatat kata-kata sulit dalam teks untuk
kemudian dibahas bersama.
Menanyakan siswa terkait dengan generic structures dan inti
cerita dari teks yang diberikan.
Nilai dan karakter: gemar membaca, aktif.
Elaborasi (45’)
Siswa mengidentifikasi berbagai informasi dalam teks meliputi
Orientation (tokoh dan latar), Complication (masalah), dan
Resolution (solusi).
Siswa diberikan penjelasan mengenai teks narasi.
Guru menjelaskan kegunaan mind mapping dan prosedur
penggunaannya.
Siswa dibagi ke dalam beberapa kelompok (4-5 orang) untuk
membuat mind map bedasarkan panduan yang telah dijelaskan
oleh guru.
Guru mengonfirmasi hasil mind map siswa.
Siswa diberikan beberapa pertanyaan terkait teks.
Nilai dan Karakter: gemar membaca, toleransi, aktif.
Konfirmasi (15’)
Siswa difasilitasi untuk mengungkapkan jawaban mereka atas
pertanyaan mengenai struktur dan informasi yang sudah
teridentifikasi pada teks.
Guru mengonfirmasi jawaban siswa.
Nilai dan Karakter: komunikatif, toleransi, kreatif.
APPENDIX 6
c) Kegiatan Penutup (5’)
Siswa difasilitasi untuk mengungkapkan kesulitan selama proses
belajar.
Guru memberikan kesimpulan terhadap materi yang telah
disampaikan, kemudian dilanjutkan dengan menutup proses
belajar.
Nilai dan Karakter: komunikatif.
Penugasan Mandiri
Membuat sebuah mind map secara berkelompok dari teks narasi yang telah
diberikan.
H. Sumber Belajar
a) Buku Interlanguage: English for Senior High School Students XI.
b) Buku Generic Text Structure, Yogyakarta: Graha Ilmu, 2008.
c) Text Types in English 3, Australia: MacMillan, 2003.`
d) Paragraf strip (terlampir), blank paper.
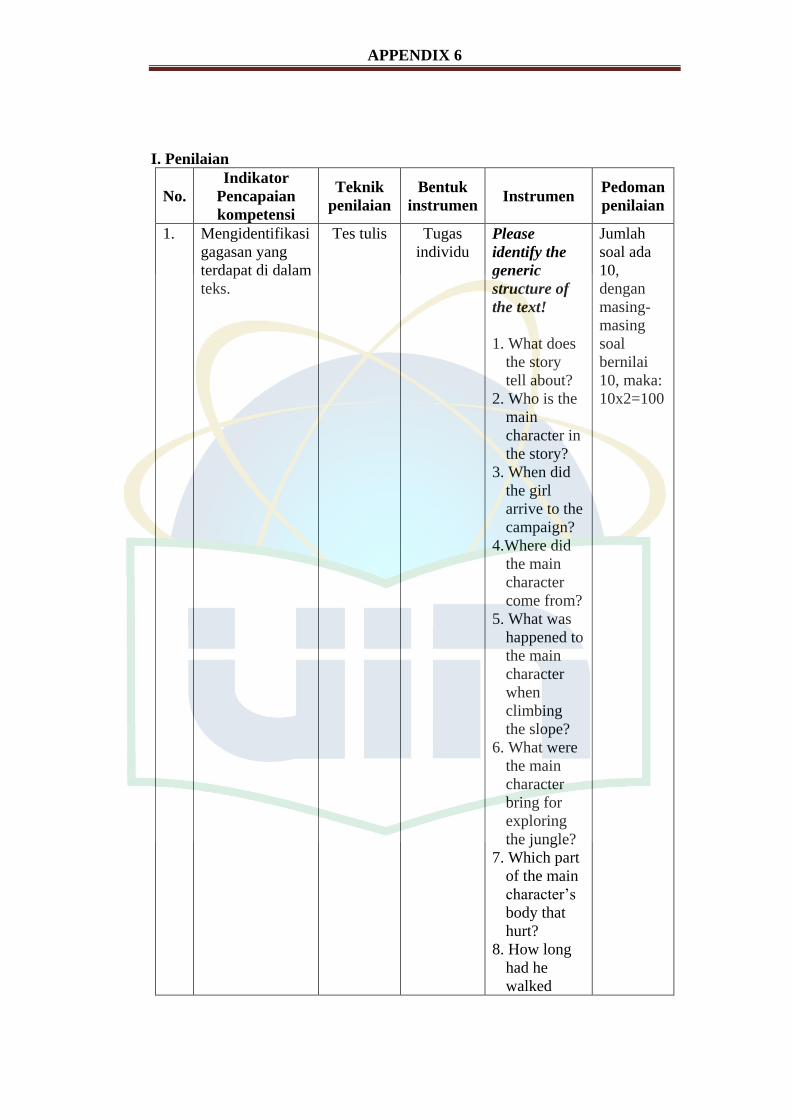
APPENDIX 6
I. Penilaian
No.
Indikator
Pencapaian
kompetensi
Teknik
penilaian
Bentuk
instrumen Instrumen
Pedoman
penilaian
1.
Mengidentifikasi
gagasan yang
terdapat di dalam
teks.
Tes tulis
Tugas
individu
Please
identify the
generic
structure of
the text!
1. What does
the story
tell about?
2. Who is the
main
character in
the story?
3. When did
the girl
arrive to the
campaign?
4.Where did
the main
character
come from?
5. What was
happened to
the main
character
when
climbing
the slope?
6. What were
the main
character
bring for
exploring
the jungle?
7. Which part
of the main
character’s
body that
hurt?
8. How long
had he
walked
Jumlah
soal ada
10,
dengan
masing-
masing
soal
bernilai
10, maka:
10x2=100
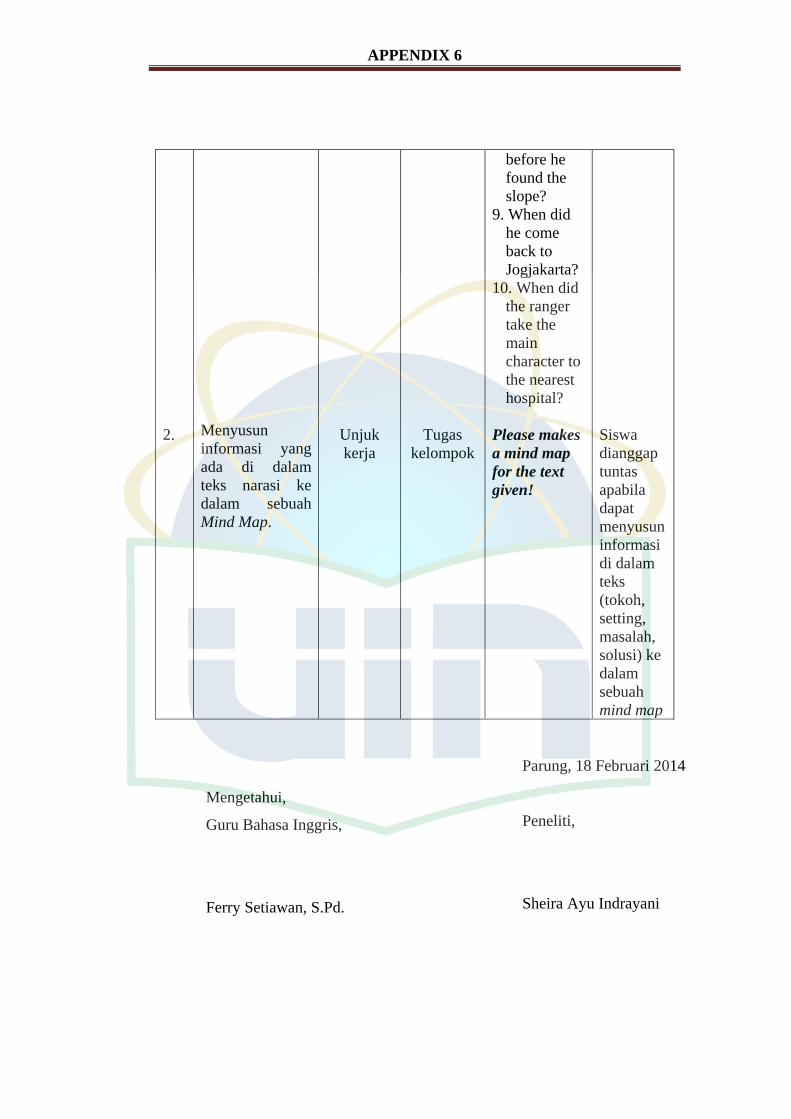
APPENDIX 6
2.
Menyusun
informasi yang
ada di dalam
teks narasi ke
dalam sebuah
Mind Map.
Unjuk
kerja
Tugas
kelompok
before he
found the
slope?
9. When did
he come
back to
Jogjakarta?
10. When did
the ranger
take the
main
character to
the nearest
hospital?
Please makes
a mind map
for the text
given!
Siswa
dianggap
tuntas
apabila
dapat
menyusun
informasi
di dalam
teks
(tokoh,
setting,
masalah,
solusi) ke
dalam
sebuah
mind map
Mengetahui,
Guru Bahasa Inggris,
Ferry Setiawan, S.Pd.
Parung, 18 Februari 2014
Peneliti,
Sheira Ayu Indrayani
APPENDIX 6
RENCANA PELAKSANAAN PEMBELAJARAN (RPP)
KELAS EKSPERIMEN
Nama Sekolah : SMA Mathla’ul Huda
Mata Pelajaran : Bahasa Inggris
Kelas/Semester : XI IPS/ II
Alokasi Waktu : 2x 45 Menit
Pertemuan ke : 2
Topik Pembelajaran : Narrative text
A. Standar Kompetensi
Membaca
11. Memahami makna teks fungsional pendek dan esei berbentuk narrative
dalam konteks kehidupan sehari-hari dan untuk mengakses ilmu
pengetahuan.
B. Kompetensi Dasar
11.2. Merespon makna dan langkah retorika dalam esei yang menggunakan
ragam bahasa tulis secara akurat, lancar dan berterima dalam konteks
kehidupan sehari-hari dan untuk mengakses ilmu pengetahuan dalam
teks berbentuk narrative.
C. Indikator
1. Mengidentifikasi generic structures dari teks narasi.
2. Menyusun informasi yang ada di dalam teks narasi ke dalam sebuah
Mind Map.
D. Tujuan Pembelajaran
Pada akhir pembelajaran siswa dapat:
1. Mengidentifikasi generic structures dari teks narasi.
2. Menemukan berbagai macam informasi penting meliputi Orientation
(tokoh & latar), Complication (masalah), dan Resolution (solusi).
3. Menyusun berbagai informasi penting yang terdapatdi dalam teks narasi
ke dalam sebuah Mind Map.
Nilai karakter: kerja keras, ingin tahu, gemar membaca, toleransi, tanggung
jawab, mandiri.
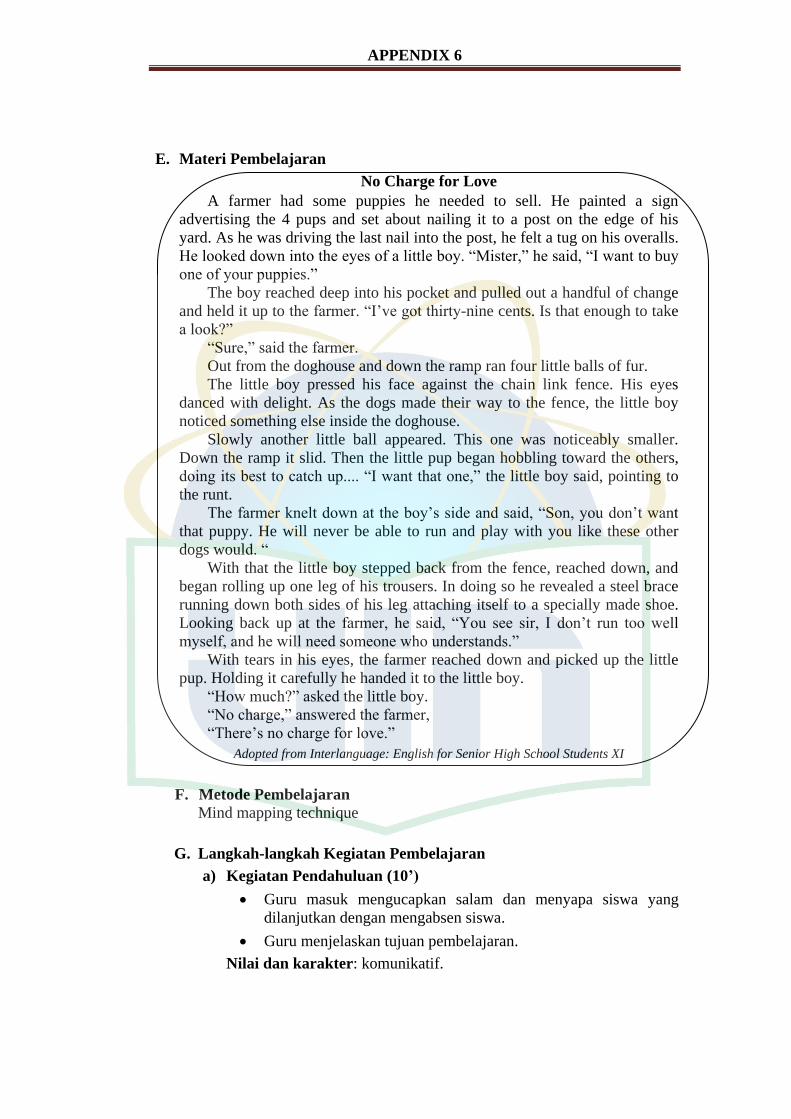
APPENDIX 6
E. Materi Pembelajaran
No Charge for Love
A farmer had some puppies he needed to sell. He painted a sign
advertising the 4 pups and set about nailing it to a post on the edge of his
yard. As he was driving the last nail into the post, he felt a tug on his overalls.
He looked down into the eyes of a little boy. “Mister,” he said, “I want to buy
one of your puppies.”
The boy reached deep into his pocket and pulled out a handful of change
and held it up to the farmer. “I’ve got thirty-nine cents. Is that enough to take
a look?”
“Sure,” said the farmer.
Out from the doghouse and down the ramp ran four little balls of fur.
The little boy pressed his face against the chain link fence. His eyes
danced with delight. As the dogs made their way to the fence, the little boy
noticed something else inside the doghouse.
Slowly another little ball appeared. This one was noticeably smaller.
Down the ramp it slid. Then the little pup began hobbling toward the others,
doing its best to catch up.... “I want that one,” the little boy said, pointing to
the runt.
The farmer knelt down at the boy’s side and said, “Son, you don’t want
that puppy. He will never be able to run and play with you like these other
dogs would. “
With that the little boy stepped back from the fence, reached down, and
began rolling up one leg of his trousers. In doing so he revealed a steel brace
running down both sides of his leg attaching itself to a specially made shoe.
Looking back up at the farmer, he said, “You see sir, I don’t run too well
myself, and he will need someone who understands.”
With tears in his eyes, the farmer reached down and picked up the little
pup. Holding it carefully he handed it to the little boy.
“How much?” asked the little boy.
“No charge,” answered the farmer,
“There’s no charge for love.”
Adopted from Interlanguage: English for Senior High School Students XI
F. Metode Pembelajaran
Mind mapping technique
G. Langkah-langkah Kegiatan Pembelajaran
a) Kegiatan Pendahuluan (10’)
Guru masuk mengucapkan salam dan menyapa siswa yang
dilanjutkan dengan mengabsen siswa.
Guru menjelaskan tujuan pembelajaran.
Nilai dan karakter: komunikatif.
APPENDIX 6
b) Kegiatan Inti (70’)
Eksplorasi (15’)
Beberapa orang siswa diminta untuk membacakan nyaring teks
yang sudah diurutkan dengan benar.
Siswa diminta untuk mencatat kata-kata sulit dalam teks untuk
kemudian dibahas bersama.
Menanyakan siswa terkait dengan generic structures dan inti
cerita dari teks yang diberikan.
Nilai dan karakter: gemar membaca, aktif.
Elaborasi (45’)
Siswa mengidentifikasi berbagai informasi dalam teks meliputi
Orientation (tokoh dan latar), Complication (masalah), dan
Resolution (solusi).
Guru mengulang kembali materi yang telah diajarkan
sebelumnya terkait dengan narasi.
Siswa secara individu diminta untuk membuat mind map dari
teks yang diberikan
Beberapa orang siswa diminta menampilkan dan menjelaskan
mind map mereka di depan kelas.
Guru mengonfirmasi hasil kerja siswa.
Siswa diberikan beberapa pertanyaan terkait teks.
Nilai dan Karakter: gemar membaca, toleransi, aktif.
Konfirmasi (15’)
Siswa difasilitasi untuk mengungkapkan jawaban mereka atas
pertanyaan mengenai struktur dan informasi yang sudah
teridentifikasi pada teks.
Guru mengonfirmasi jawaban siswa.
Nilai dan Karakter: komunikatif, toleransi, kreatif.
c) Kegiatan Penutup (5’)
Siswa difasilitasi untuk mengungkapkan kesulitan selama proses
belajar.
Guru memberikan kesimpulan terhadap materi yang telah
disampaikan, kemudian dilanjutkan dengan menutup proses
belajar.
Nilai dan Karakter: komunikatif.
Penugasan Mandiri
Membuat sebuah mind map secara individu dari teks narasi yang telah
diberikan.
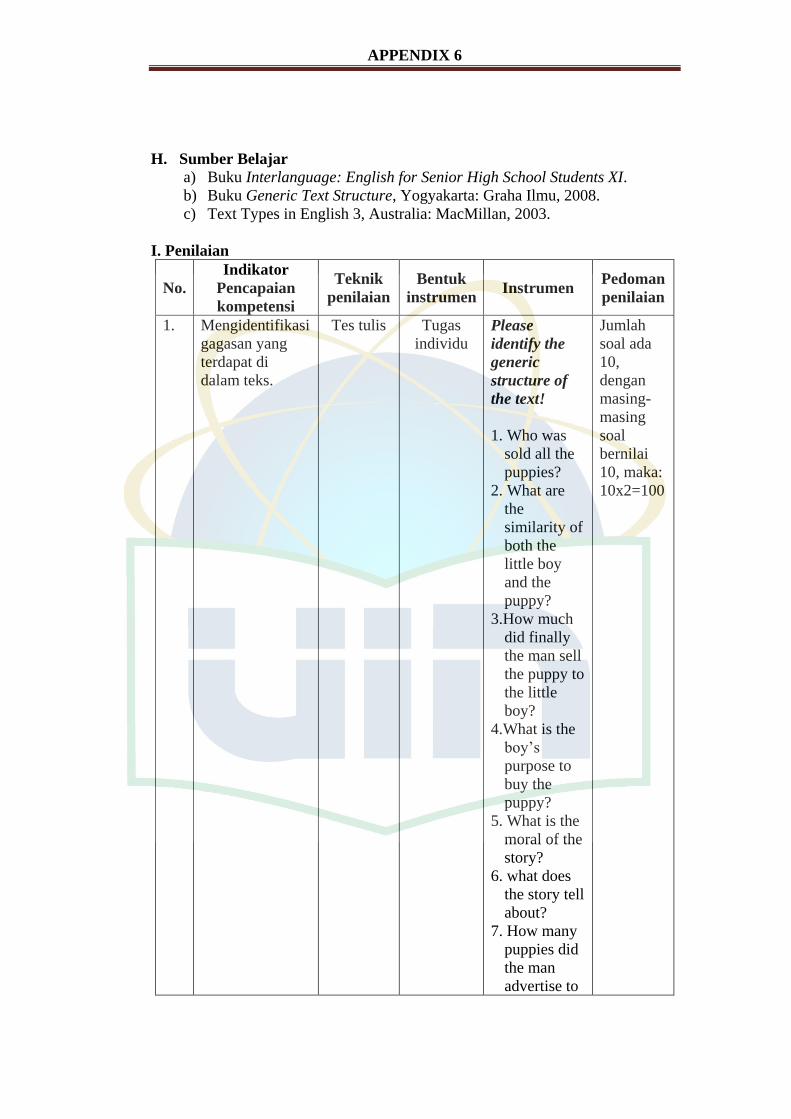
APPENDIX 6
H. Sumber Belajar
a) Buku Interlanguage: English for Senior High School Students XI.
b) Buku Generic Text Structure, Yogyakarta: Graha Ilmu, 2008.
c) Text Types in English 3, Australia: MacMillan, 2003.
I. Penilaian
No.
Indikator
Pencapaian
kompetensi
Teknik
penilaian
Bentuk
instrumen Instrumen
Pedoman
penilaian
1.
Mengidentifikasi
gagasan yang
terdapat di
dalam teks.
Tes tulis
Tugas
individu
Please
identify the
generic
structure of
the text!
1. Who was
sold all the
puppies?
2. What are
the
similarity of
both the
little boy
and the
puppy?
3.How much
did finally
the man sell
the puppy to
the little
boy?
4.What is the
boy’s
purpose to
buy the
puppy?
5. What is the
moral of the
story?
6. what does
the story tell
about?
7. How many
puppies did
the man
advertise to
Jumlah
soal ada
10,
dengan
masing-
masing
soal
bernilai
10, maka:
10x2=100
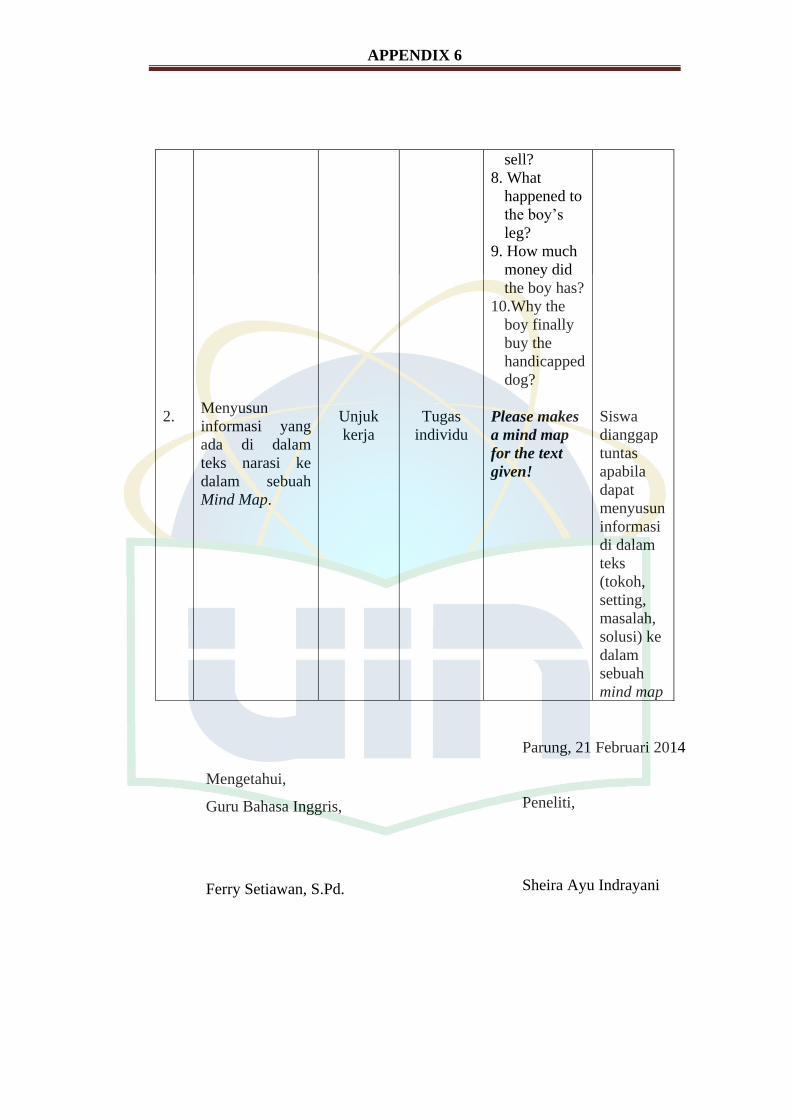
APPENDIX 6
2.
Menyusun
informasi yang
ada di dalam
teks narasi ke
dalam sebuah
Mind Map.
Unjuk
kerja
Tugas
individu
sell?
8. What
happened to
the boy’s
leg?
9. How much
money did
the boy has?
10.Why the
boy finally
buy the
handicapped
dog?
Please makes
a mind map
for the text
given!
Siswa
dianggap
tuntas
apabila
dapat
menyusun
informasi
di dalam
teks
(tokoh,
setting,
masalah,
solusi) ke
dalam
sebuah
mind map
Mengetahui,
Guru Bahasa Inggris,
Ferry Setiawan, S.Pd.
Parung, 21 Februari 2014
Peneliti,
Sheira Ayu Indrayani
APPENDIX 6
RENCANA PELAKSANAAN PEMBELAJARAN (RPP)
KELAS KONTROL
Nama Sekolah : SMA Mathla’ul Huda
Mata Pelajaran : Bahasa Inggris
Kelas/Semester : XI IPA/ II
Alokasi Waktu : 2x 45 Menit
Pertemuan Ke : 1
Topik Pembelajaran : Narrative text
A. Standar Kompetensi
Membaca
11. Memahami makna teks fungsional pendek dan esei berbentuk narrative
dalam konteks kehidupan sehari-hari dan untuk mengakses ilmu
pengetahuan.
B. Kompetensi Dasar
11.2. Merespon makna dan langkah retorika dalam esei yang menggunakan
ragam bahasa tulis secara akurat, lancar dan berterima dalam konteks
kehidupan sehari-hari dan untuk mengakses ilmu pengetahuan dalam
teks berbentuk narrative.
C. Indikator
1. Menerjemahkan teks.
2. Mengidentifikasi generic structures dari teks.
D. Tujuan Pembelajaran
Pada akhir pembelajaran siswa dapat:
1. Menerjemahkan teks narasi yang telah diberikan ke dalam Bahasa
Indonesia.
2. Mengidentifikasi generic structures dari teks narasi.
3. Menjawab pertanyaan-pertanyaan seputar teks yang diberikan.
Nilai karakter: kerja keras, ingin tahu, gemar membaca, toleransi, tanggung
jawab, mandiri.
E. Materi Pembelajaran
1. Pengertian teks narasi
Narrative is a text that tells a story which is used to entertain the
audience.
Kind of narrative: myths, fairytales, historical fiction, romance novels,
etc.
2. Struktur umum teks narasi
There are several steps for constructing a narrative text:
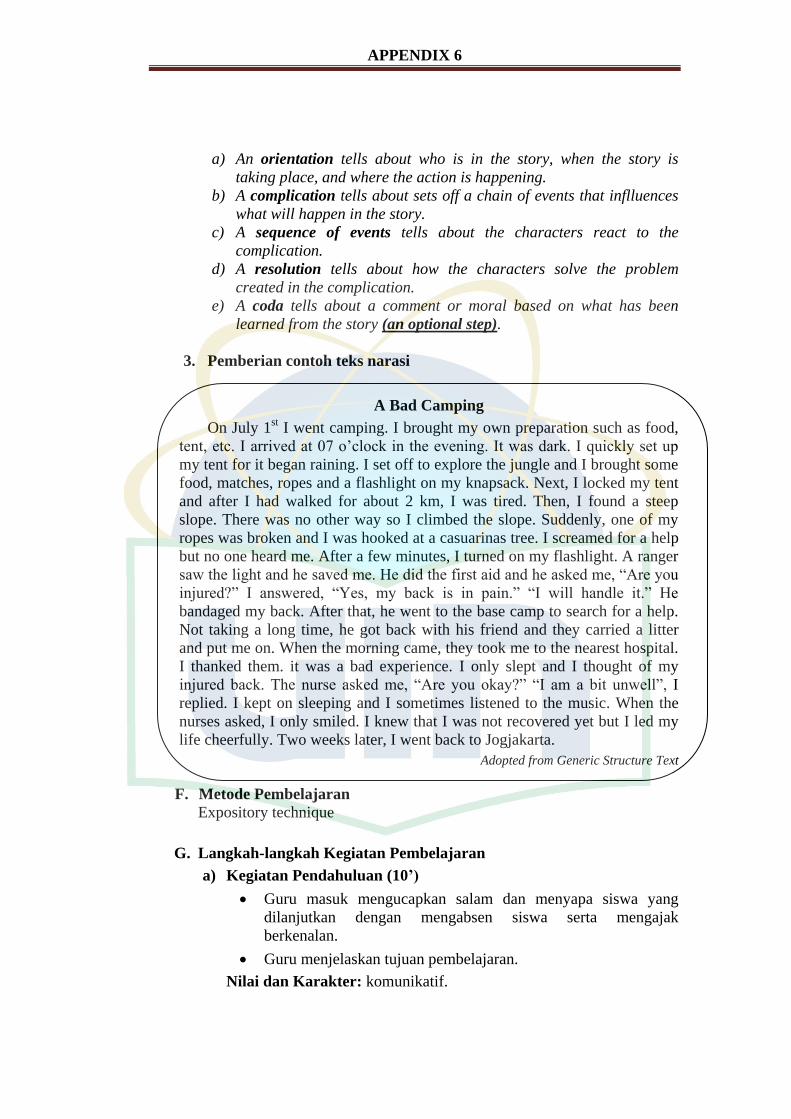
APPENDIX 6
a) An orientation tells about who is in the story, when the story is
taking place, and where the action is happening.
b) A complication tells about sets off a chain of events that inflluences
what will happen in the story.
c) A sequence of events tells about the characters react to the
complication.
d) A resolution tells about how the characters solve the problem
created in the complication.
e) A coda tells about a comment or moral based on what has been
learned from the story (an optional step).
3. Pemberian contoh teks narasi
A Bad Camping
On July 1st I went camping. I brought my own preparation such as food,
tent, etc. I arrived at 07 o’clock in the evening. It was dark. I quickly set up
my tent for it began raining. I set off to explore the jungle and I brought some
food, matches, ropes and a flashlight on my knapsack. Next, I locked my tent
and after I had walked for about 2 km, I was tired. Then, I found a steep
slope. There was no other way so I climbed the slope. Suddenly, one of my
ropes was broken and I was hooked at a casuarinas tree. I screamed for a help
but no one heard me. After a few minutes, I turned on my flashlight. A ranger
saw the light and he saved me. He did the first aid and he asked me, “Are you
injured?” I answered, “Yes, my back is in pain.” “I will handle it.” He
bandaged my back. After that, he went to the base camp to search for a help.
Not taking a long time, he got back with his friend and they carried a litter
and put me on. When the morning came, they took me to the nearest hospital.
I thanked them. it was a bad experience. I only slept and I thought of my
injured back. The nurse asked me, “Are you okay?” “I am a bit unwell”, I
replied. I kept on sleeping and I sometimes listened to the music. When the
nurses asked, I only smiled. I knew that I was not recovered yet but I led my
life cheerfully. Two weeks later, I went back to Jogjakarta.
Adopted from Generic Structure Text
F. Metode Pembelajaran
Expository technique
G. Langkah-langkah Kegiatan Pembelajaran
a) Kegiatan Pendahuluan (10’)
Guru masuk mengucapkan salam dan menyapa siswa yang
dilanjutkan dengan mengabsen siswa serta mengajak
berkenalan.
Guru menjelaskan tujuan pembelajaran.
Nilai dan Karakter: komunikatif.
APPENDIX 6
b) Kegiatan Inti (75’)
Eksplorasi (15’)
Beberapa orang siswa diminta untuk membacakan teks yang
diberikan dengan nyaring.
Meminta siswa mencari kata-kata sulit yang terdapat dalam teks
dan menuliskan di papan tulis.
Nilai dan Karakter: aktif, gemar membaca.
Elaborasi (45’)
Menerjemahkan teks narasi kata per kata secara bersama-sama.
Meminta sebagian siswa untuk menceritakan kembali cerita
tersebut dengan menggunakan bahasa Indonesia.
Meminta siswa menggolongkan kata kerja tertentu ke dalam
kelompok kata kerja past tense.
Mempelajari generic structures teks narasi.
Siswa mengidentifikasi generic structures dan informasi dalam
teks tersebut meliputi tokoh, latar, masalah, dan solusi.
Meminta setiap siswa untuk menjawab pertanyaan yang
berkaitan dengan teks yang diberikan.
Nilai dan Karakter: gemar membaca.
Konfirmasi (15’)
Siswa difasilitasi untuk mengungkapkan jawaban mereka atas
pertanyaan mengenai struktur sdan informasi yang sudah
teridentifikasi pada teks.
Guru mengonfirmasi jawaban siswa.
Nilai dan Karakter: toleransi, aktif.
c) Kegiatan Penutup (5’)
Siswa difasilitasi untuk mengungkapkan kesulitan selama proses
belajar.
Guru memberikan kesimpulan terhadap materi yang telah
disampaikan, kemudian dilanjutkan dengan menutup proses
belajar.
Nilai dan Karakter: komunikatif.
Penugasan Mandiri
Menjawab soal-soal yang berhubungan dengan teks narasi yang diberikan
oleh guru.
H. Sumber Belajar
a) Buku Interlanguage: English for Senior High School Students XI.
b) Buku Generic Text Structure, Yogyakarta: Graha Ilmu, 2008.
c) Text Types in English 3, Australia: MacMillan, 2003.
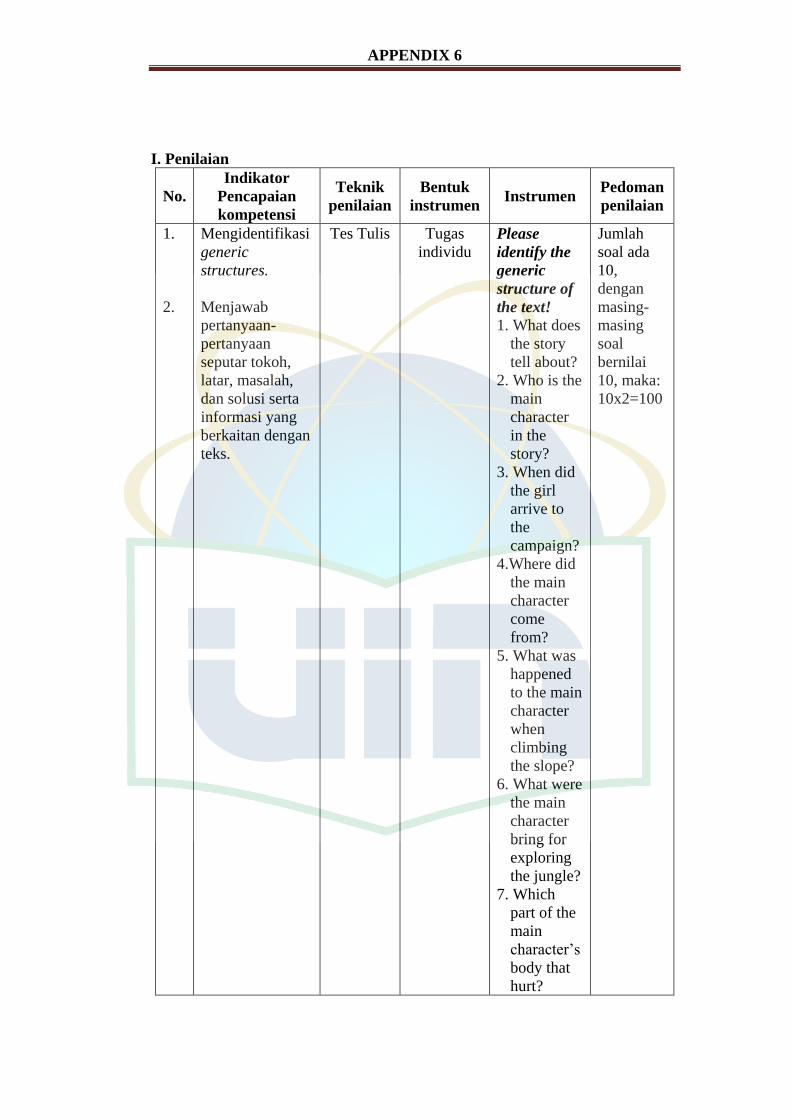
APPENDIX 6
I. Penilaian
No.
Indikator
Pencapaian
kompetensi
Teknik
penilaian
Bentuk
instrumen Instrumen
Pedoman
penilaian
1.
2.
Mengidentifikasi
generic
structures.
Menjawab
pertanyaan-
pertanyaan
seputar tokoh,
latar, masalah,
dan solusi serta
informasi yang
berkaitan dengan
teks.
Tes Tulis
Tugas
individu
Please
identify the
generic
structure of
the text!
1. What does
the story
tell about?
2. Who is the
main
character
in the
story?
3. When did
the girl
arrive to
the
campaign?
4.Where did
the main
character
come
from?
5. What was
happened
to the main
character
when
climbing
the slope?
6. What were
the main
character
bring for
exploring
the jungle?
7. Which
part of the
main
character’s
body that
hurt?
Jumlah
soal ada
10,
dengan
masing-
masing
soal
bernilai
10, maka:
10x2=100
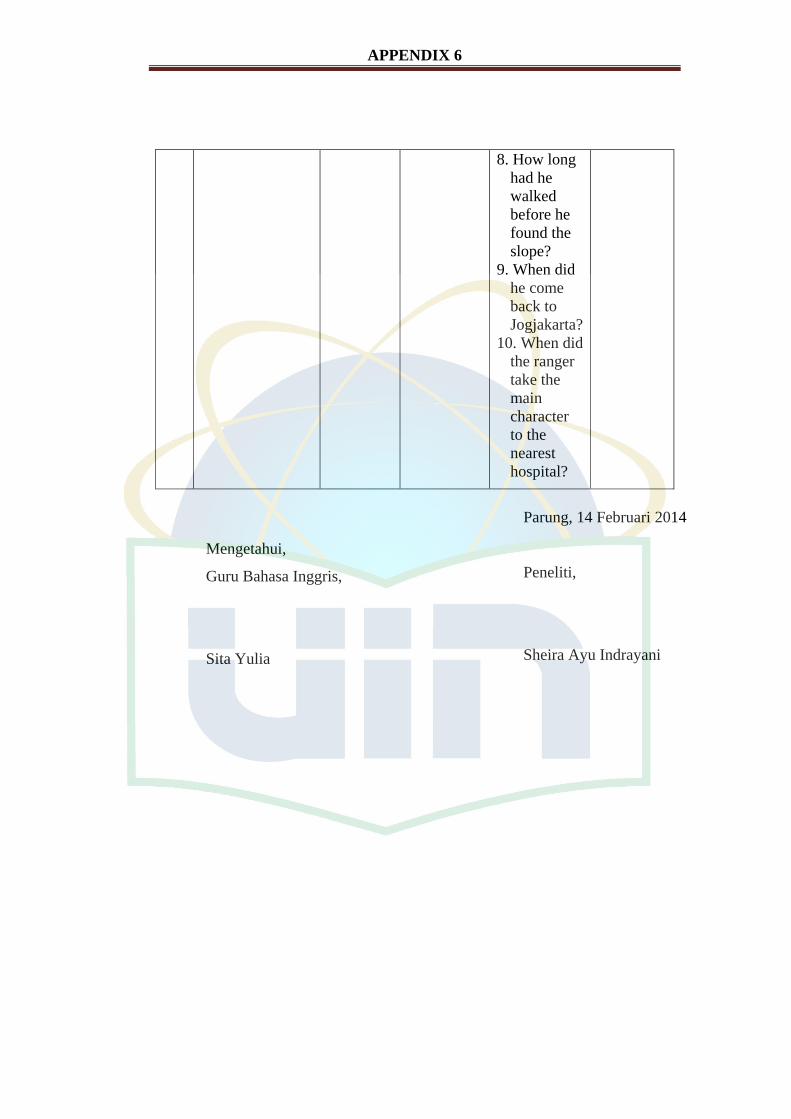
APPENDIX 6
8. How long
had he
walked
before he
found the
slope?
9. When did
he come
back to
Jogjakarta?
10. When did
the ranger
take the
main
character
to the
nearest
hospital?
Mengetahui,
Guru Bahasa Inggris,
Sita Yulia
Parung, 14 Februari 2014
Peneliti,
Sheira Ayu Indrayani

APPENDIX 6
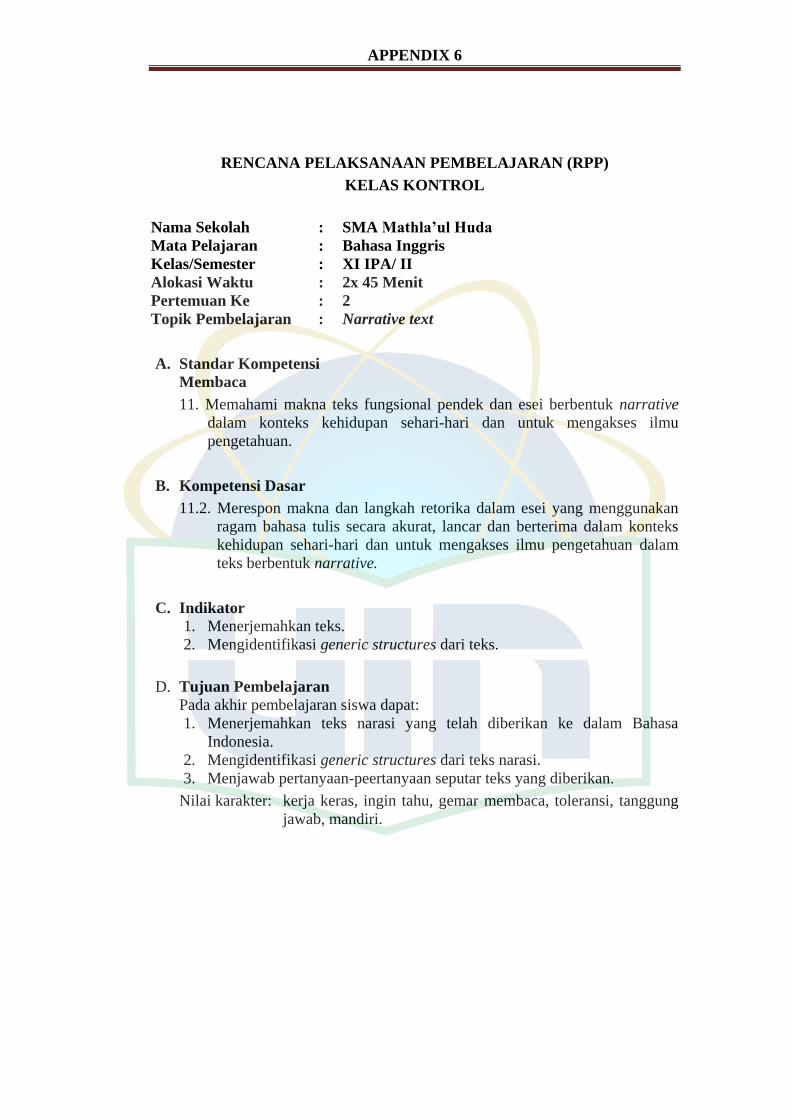
APPENDIX 6
RENCANA PELAKSANAAN PEMBELAJARAN (RPP)
KELAS KONTROL
Nama Sekolah : SMA Mathla’ul Huda
Mata Pelajaran : Bahasa Inggris
Kelas/Semester : XI IPA/ II
Alokasi Waktu : 2x 45 Menit
Pertemuan Ke : 2
Topik Pembelajaran : Narrative text
A. Standar Kompetensi
Membaca
11. Memahami makna teks fungsional pendek dan esei berbentuk narrative
dalam konteks kehidupan sehari-hari dan untuk mengakses ilmu
pengetahuan.
B. Kompetensi Dasar
11.2. Merespon makna dan langkah retorika dalam esei yang menggunakan
ragam bahasa tulis secara akurat, lancar dan berterima dalam konteks
kehidupan sehari-hari dan untuk mengakses ilmu pengetahuan dalam
teks berbentuk narrative.
C. Indikator
1. Menerjemahkan teks.
2. Mengidentifikasi generic structures dari teks.
D. Tujuan Pembelajaran
Pada akhir pembelajaran siswa dapat:
1. Menerjemahkan teks narasi yang telah diberikan ke dalam Bahasa
Indonesia.
2. Mengidentifikasi generic structures dari teks narasi.
3. Menjawab pertanyaan-peertanyaan seputar teks yang diberikan.
Nilai karakter: kerja keras, ingin tahu, gemar membaca, toleransi, tanggung
jawab, mandiri.
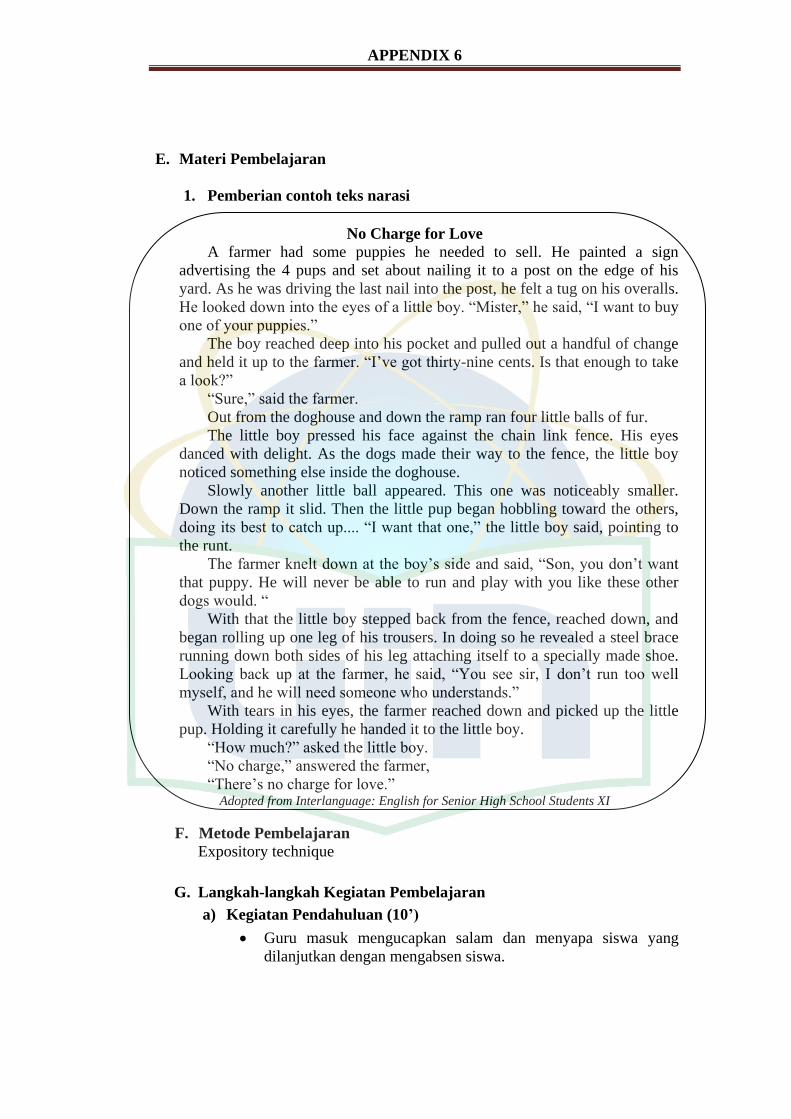
APPENDIX 6
E. Materi Pembelajaran
1. Pemberian contoh teks narasi
No Charge for Love
A farmer had some puppies he needed to sell. He painted a sign
advertising the 4 pups and set about nailing it to a post on the edge of his
yard. As he was driving the last nail into the post, he felt a tug on his overalls.
He looked down into the eyes of a little boy. “Mister,” he said, “I want to buy
one of your puppies.”
The boy reached deep into his pocket and pulled out a handful of change
and held it up to the farmer. “I’ve got thirty-nine cents. Is that enough to take
a look?”
“Sure,” said the farmer.
Out from the doghouse and down the ramp ran four little balls of fur.
The little boy pressed his face against the chain link fence. His eyes
danced with delight. As the dogs made their way to the fence, the little boy
noticed something else inside the doghouse.
Slowly another little ball appeared. This one was noticeably smaller.
Down the ramp it slid. Then the little pup began hobbling toward the others,
doing its best to catch up.... “I want that one,” the little boy said, pointing to
the runt.
The farmer knelt down at the boy’s side and said, “Son, you don’t want
that puppy. He will never be able to run and play with you like these other
dogs would. “
With that the little boy stepped back from the fence, reached down, and
began rolling up one leg of his trousers. In doing so he revealed a steel brace
running down both sides of his leg attaching itself to a specially made shoe.
Looking back up at the farmer, he said, “You see sir, I don’t run too well
myself, and he will need someone who understands.”
With tears in his eyes, the farmer reached down and picked up the little
pup. Holding it carefully he handed it to the little boy.
“How much?” asked the little boy.
“No charge,” answered the farmer,
“There’s no charge for love.” Adopted from Interlanguage: English for Senior High School Students XI
F. Metode Pembelajaran
Expository technique
G. Langkah-langkah Kegiatan Pembelajaran
a) Kegiatan Pendahuluan (10’)
Guru masuk mengucapkan salam dan menyapa siswa yang
dilanjutkan dengan mengabsen siswa.
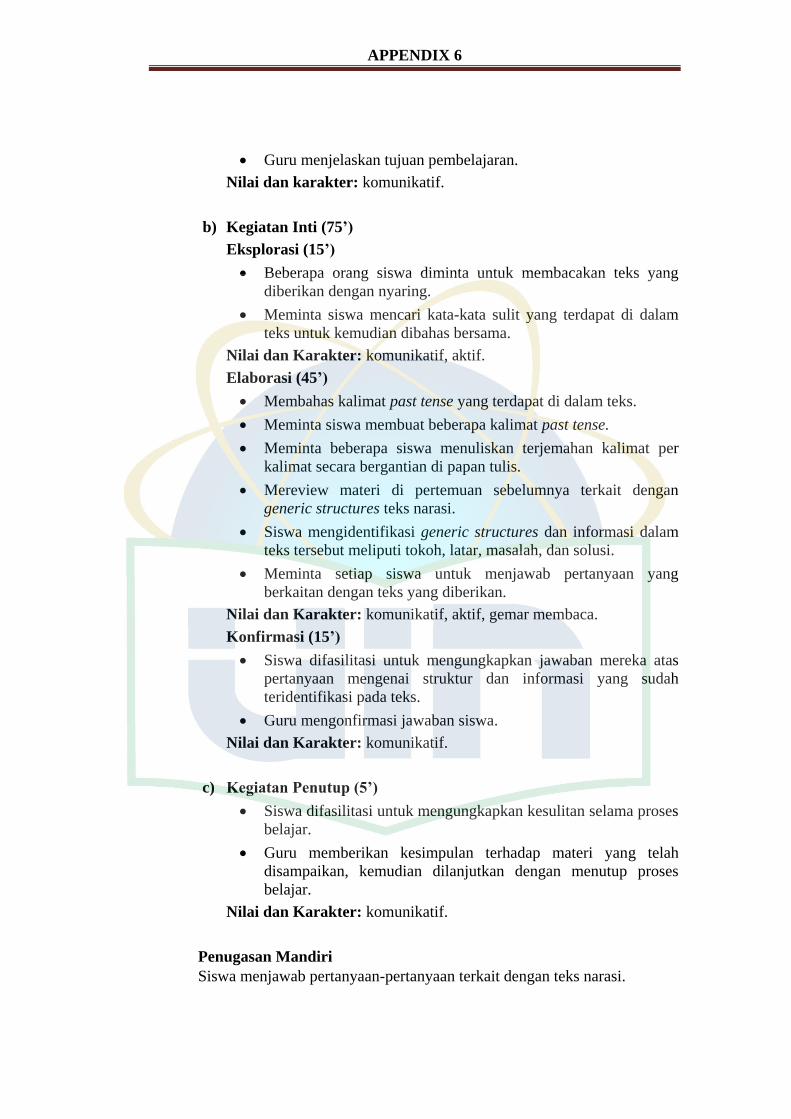
APPENDIX 6
Guru menjelaskan tujuan pembelajaran.
Nilai dan karakter: komunikatif.
b) Kegiatan Inti (75’)
Eksplorasi (15’)
Beberapa orang siswa diminta untuk membacakan teks yang
diberikan dengan nyaring.
Meminta siswa mencari kata-kata sulit yang terdapat di dalam
teks untuk kemudian dibahas bersama.
Nilai dan Karakter: komunikatif, aktif.
Elaborasi (45’)
Membahas kalimat past tense yang terdapat di dalam teks.
Meminta siswa membuat beberapa kalimat past tense.
Meminta beberapa siswa menuliskan terjemahan kalimat per
kalimat secara bergantian di papan tulis.
Mereview materi di pertemuan sebelumnya terkait dengan
generic structures teks narasi.
Siswa mengidentifikasi generic structures dan informasi dalam
teks tersebut meliputi tokoh, latar, masalah, dan solusi.
Meminta setiap siswa untuk menjawab pertanyaan yang
berkaitan dengan teks yang diberikan.
Nilai dan Karakter: komunikatif, aktif, gemar membaca.
Konfirmasi (15’)
Siswa difasilitasi untuk mengungkapkan jawaban mereka atas
pertanyaan mengenai struktur dan informasi yang sudah
teridentifikasi pada teks.
Guru mengonfirmasi jawaban siswa.
Nilai dan Karakter: komunikatif.
c) Kegiatan Penutup (5’)
Siswa difasilitasi untuk mengungkapkan kesulitan selama proses
belajar.
Guru memberikan kesimpulan terhadap materi yang telah
disampaikan, kemudian dilanjutkan dengan menutup proses
belajar.
Nilai dan Karakter: komunikatif.
Penugasan Mandiri
Siswa menjawab pertanyaan-pertanyaan terkait dengan teks narasi.
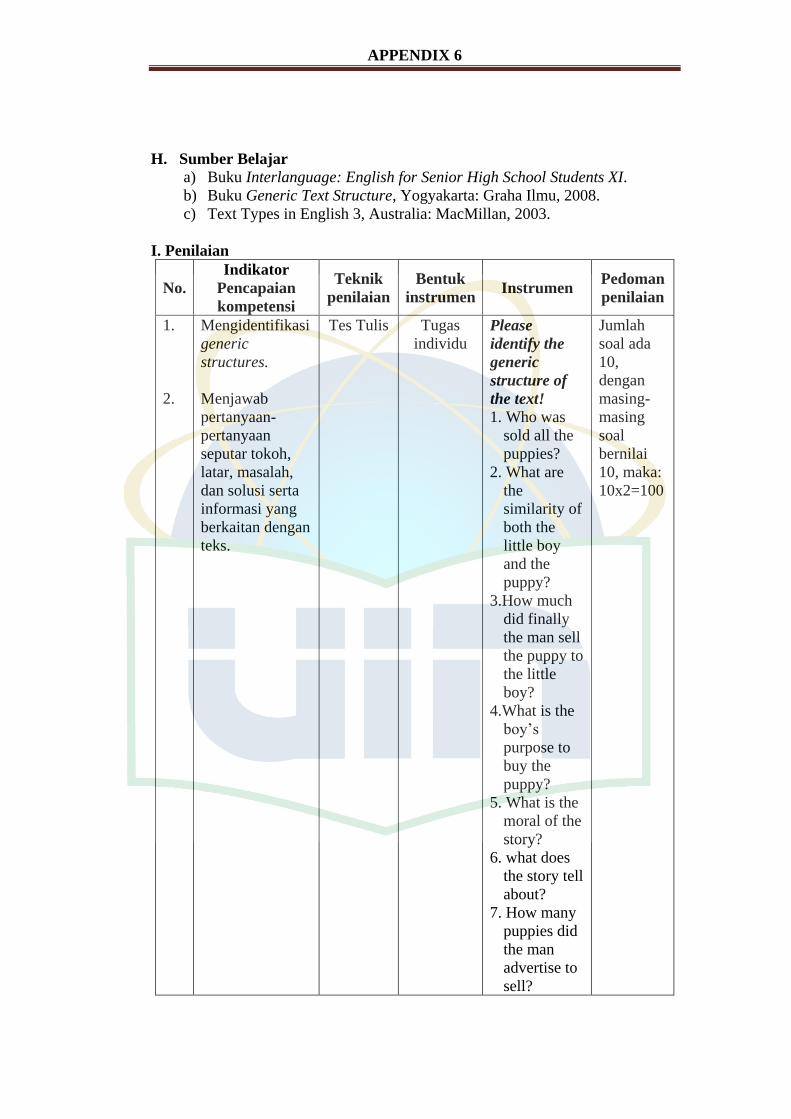
APPENDIX 6
H. Sumber Belajar
a) Buku Interlanguage: English for Senior High School Students XI.
b) Buku Generic Text Structure, Yogyakarta: Graha Ilmu, 2008.
c) Text Types in English 3, Australia: MacMillan, 2003.
I. Penilaian
No.
Indikator
Pencapaian
kompetensi
Teknik
penilaian
Bentuk
instrumen Instrumen
Pedoman
penilaian
1.
2.
Mengidentifikasi
generic
structures.
Menjawab
pertanyaan-
pertanyaan
seputar tokoh,
latar, masalah,
dan solusi serta
informasi yang
berkaitan dengan
teks.
Tes Tulis
Tugas
individu
Please
identify the
generic
structure of
the text!
1. Who was
sold all the
puppies?
2. What are
the
similarity of
both the
little boy
and the
puppy?
3.How much
did finally
the man sell
the puppy to
the little
boy?
4.What is the
boy’s
purpose to
buy the
puppy?
5. What is the
moral of the
story?
6. what does
the story tell
about?
7. How many
puppies did
the man
advertise to
sell?
Jumlah
soal ada
10,
dengan
masing-
masing
soal
bernilai
10, maka:
10x2=100
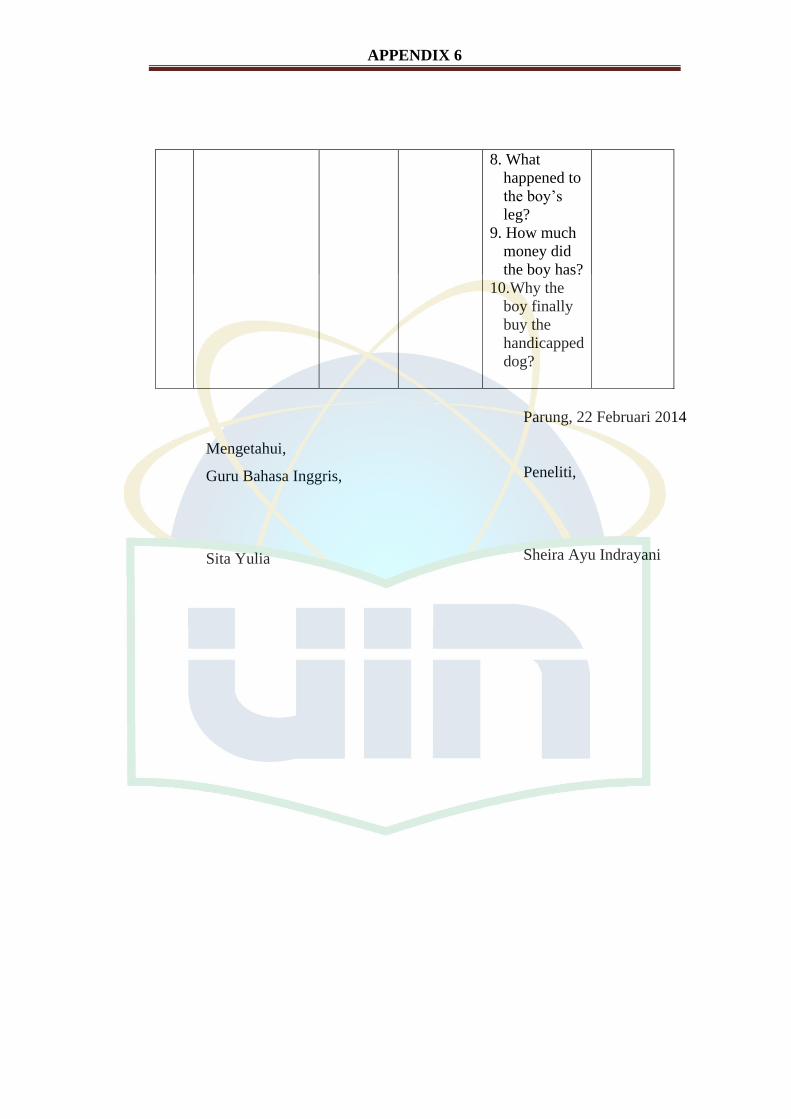
APPENDIX 6
8. What
happened to
the boy’s
leg?
9. How much
money did
the boy has?
10.Why the
boy finally
buy the
handicapped
dog?
Mengetahui,
Guru Bahasa Inggris,
Sita Yulia
Parung, 22 Februari 2014
Peneliti,
Sheira Ayu Indrayani
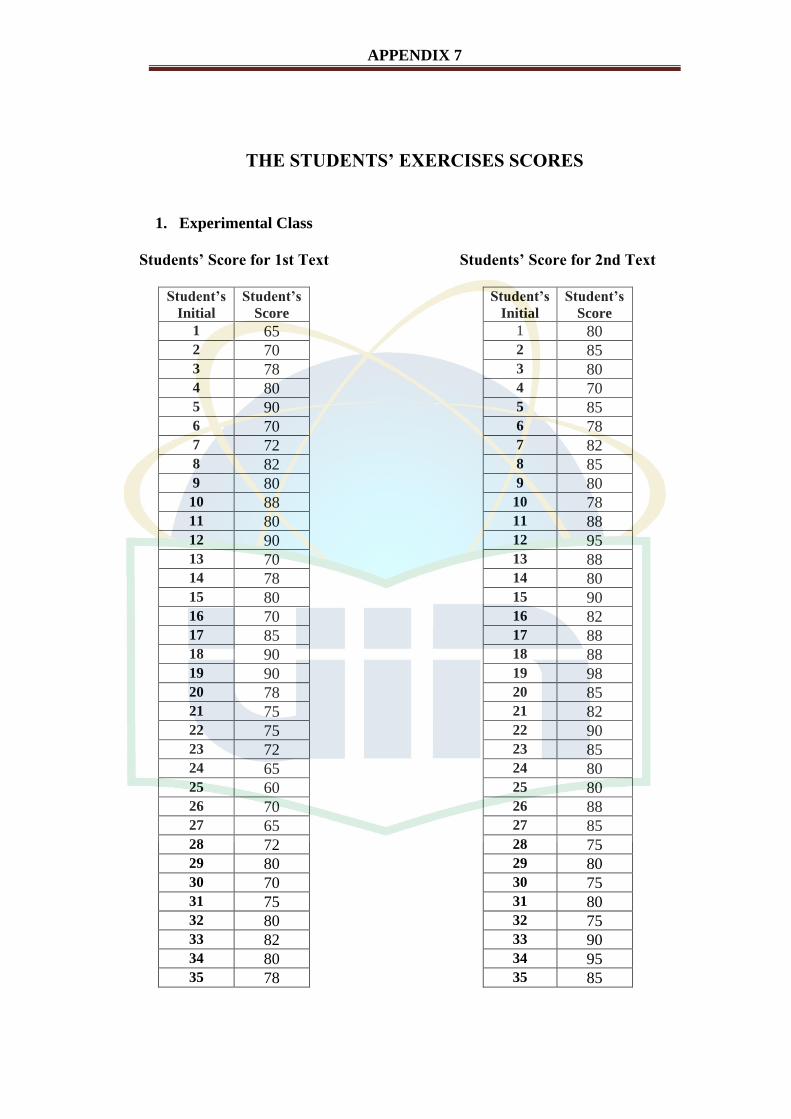
APPENDIX 7
THE STUDENTS’ EXERCISES SCORES
1. Experimental Class
Students’ Score for 1st Text
Student’s
Initial
Student’s
Score
1 65 2 70 3 78 4 80 5 90 6 70 7 72 8 82 9 80 10 88 11 80 12 90 13 70 14 78 15 80 16 70 17 85 18 90 19 90 20 78 21 75 22 75 23 72 24 65 25 60 26 70 27 65 28 72 29 80 30 70 31 75 32 80 33 82 34 80 35 78
Students’ Score for 2nd Text
Student’s
Initial
Student’s
Score
1 80 2 85 3 80 4 70 5 85 6 78 7 82 8 85 9 80
10 78 11 88 12 95 13 88 14 80 15 90 16 82 17 88 18 88 19 98 20 85 21 82 22 90 23 85 24 80 25 80 26 88 27 85 28 75 29 80 30 75 31 80 32 75 33 90 34 95 35 85
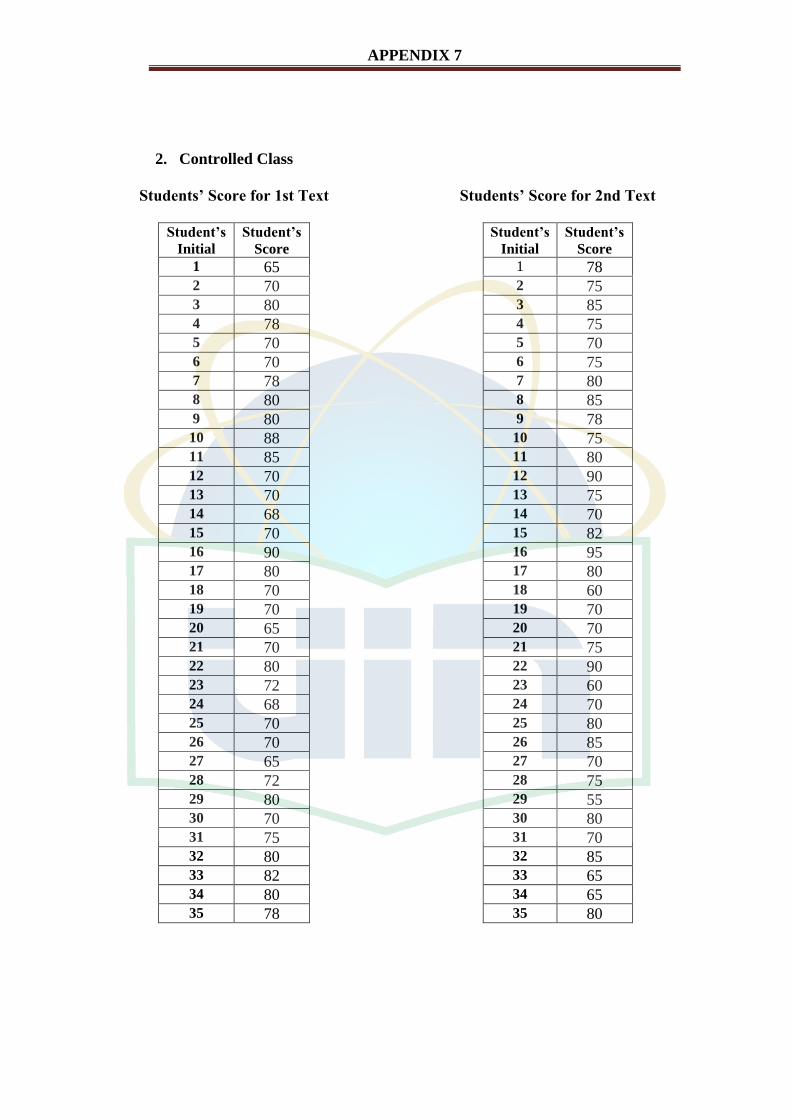
APPENDIX 7
2. Controlled Class
Students’ Score for 1st Text
Student’s
Initial
Student’s
Score
1 65 2 70 3 80 4 78 5 70 6 70 7 78 8 80 9 80 10 88 11 85 12 70 13 70 14 68 15 70 16 90 17 80 18 70 19 70 20 65 21 70 22 80 23 72 24 68 25 70 26 70 27 65 28 72 29 80 30 70 31 75 32 80 33 82 34 80 35 78
Students’ Score for 2nd Text
Student’s
Initial
Student’s
Score
1 78 2 75 3 85 4 75 5 70 6 75 7 80 8 85 9 78
10 75 11 80 12 90 13 75 14 70 15 82 16 95 17 80 18 60 19 70 20 70 21 75 22 90 23 60 24 70 25 80 26 85 27 70 28 75 29 55 30 80 31 70 32 85 33 65 34 65 35 80
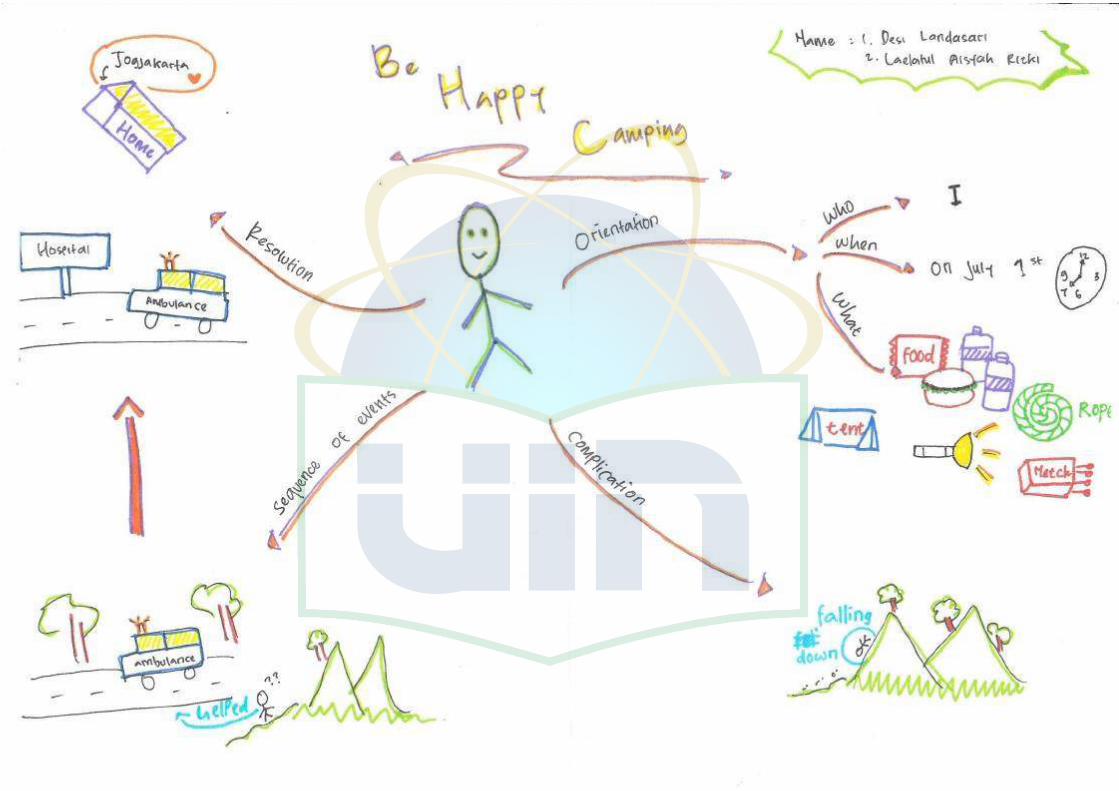
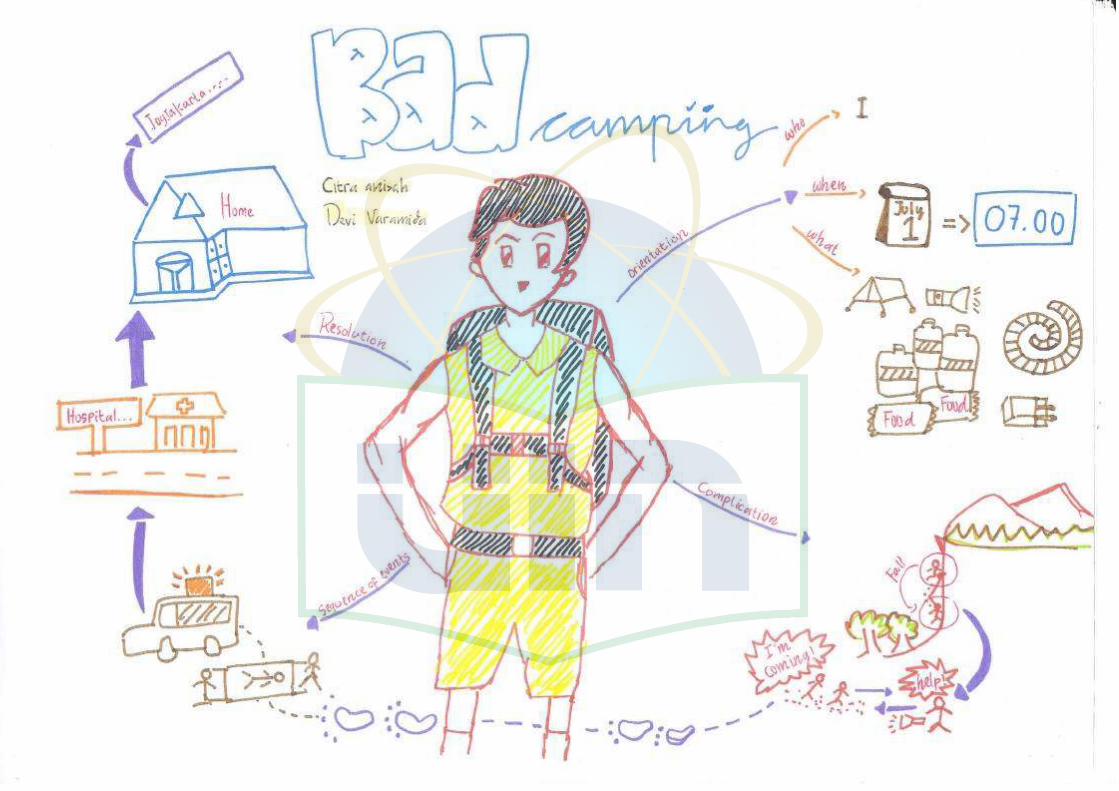
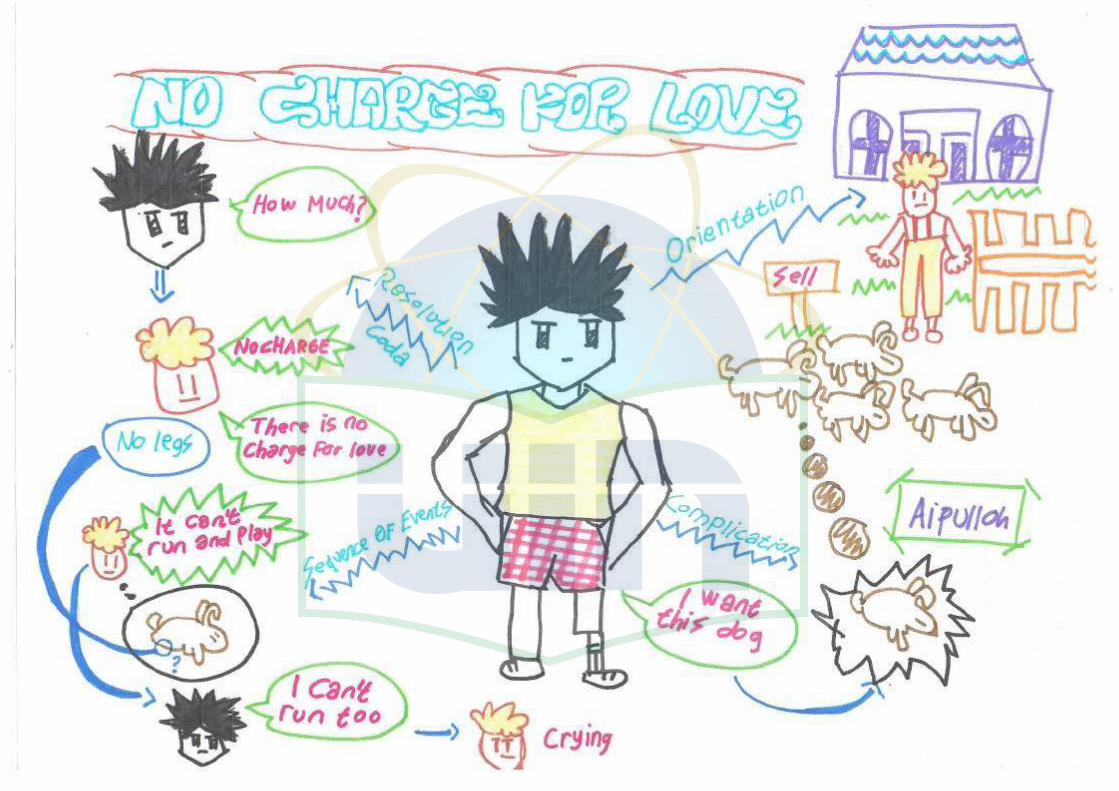
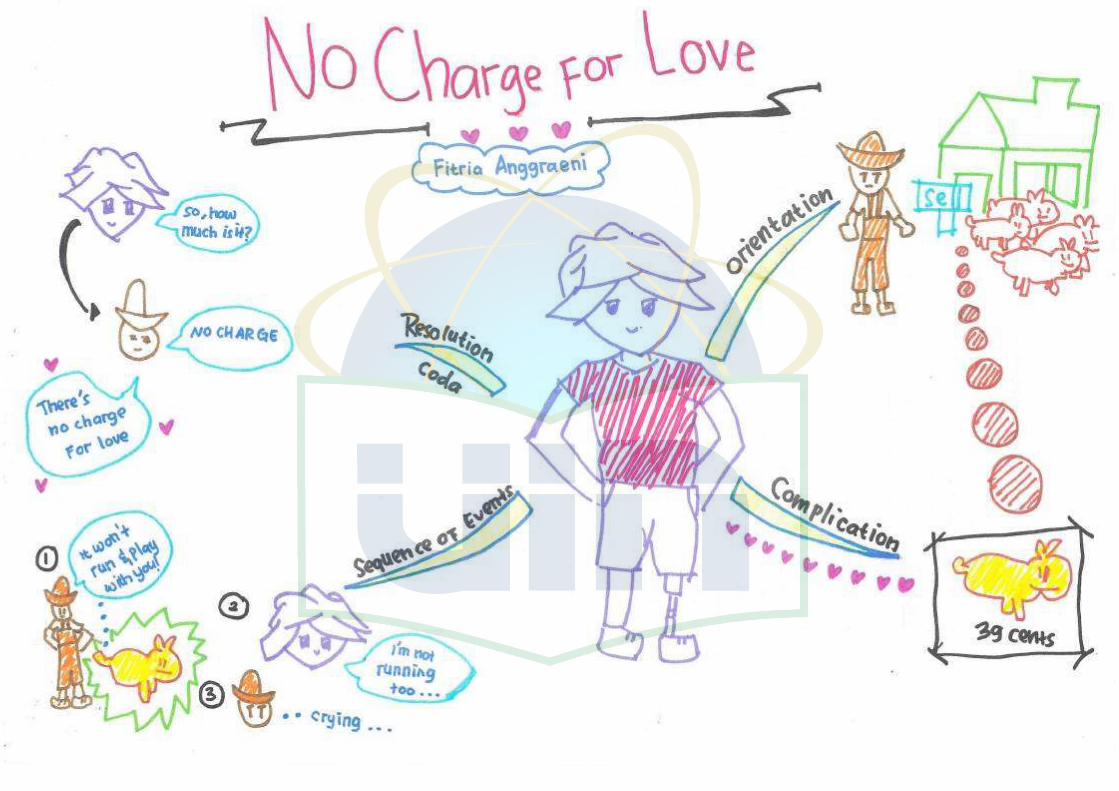
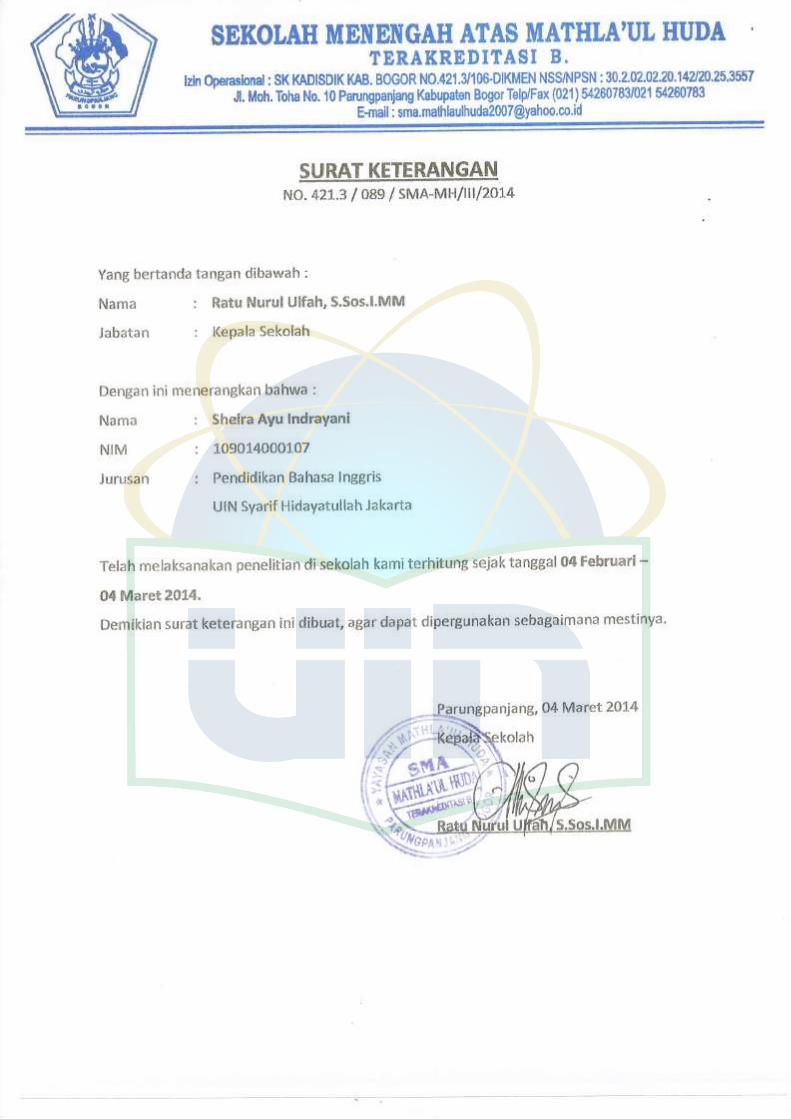
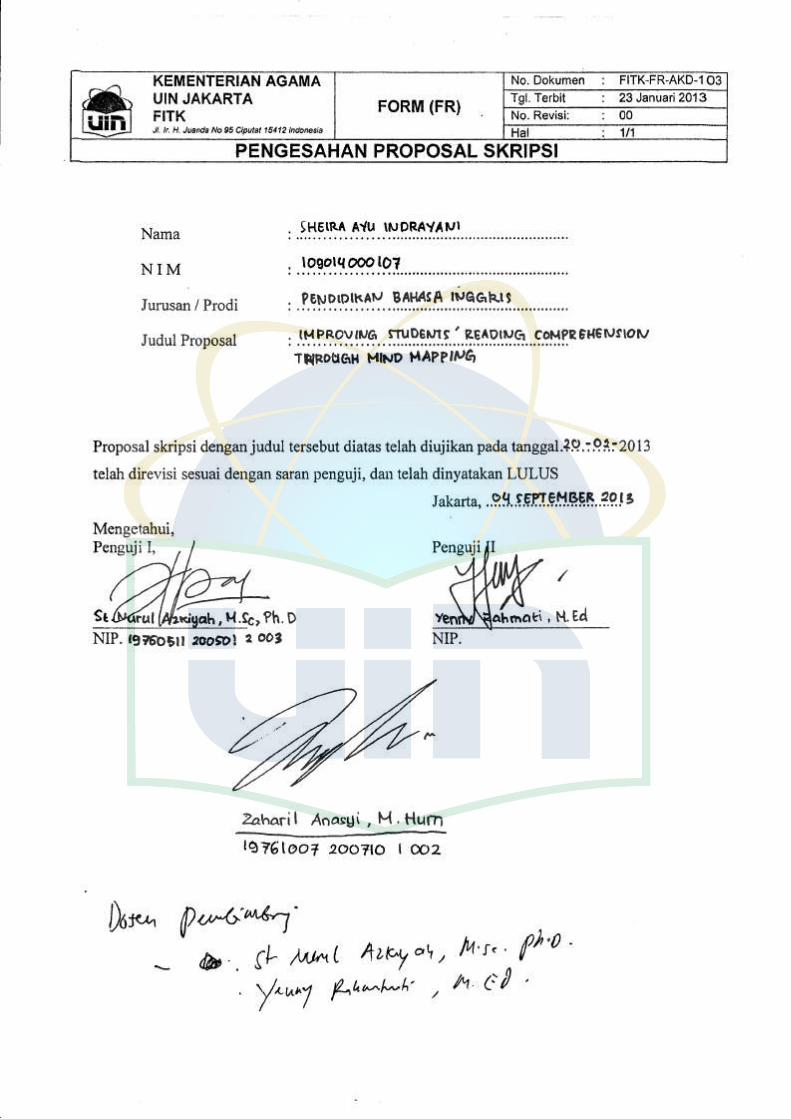
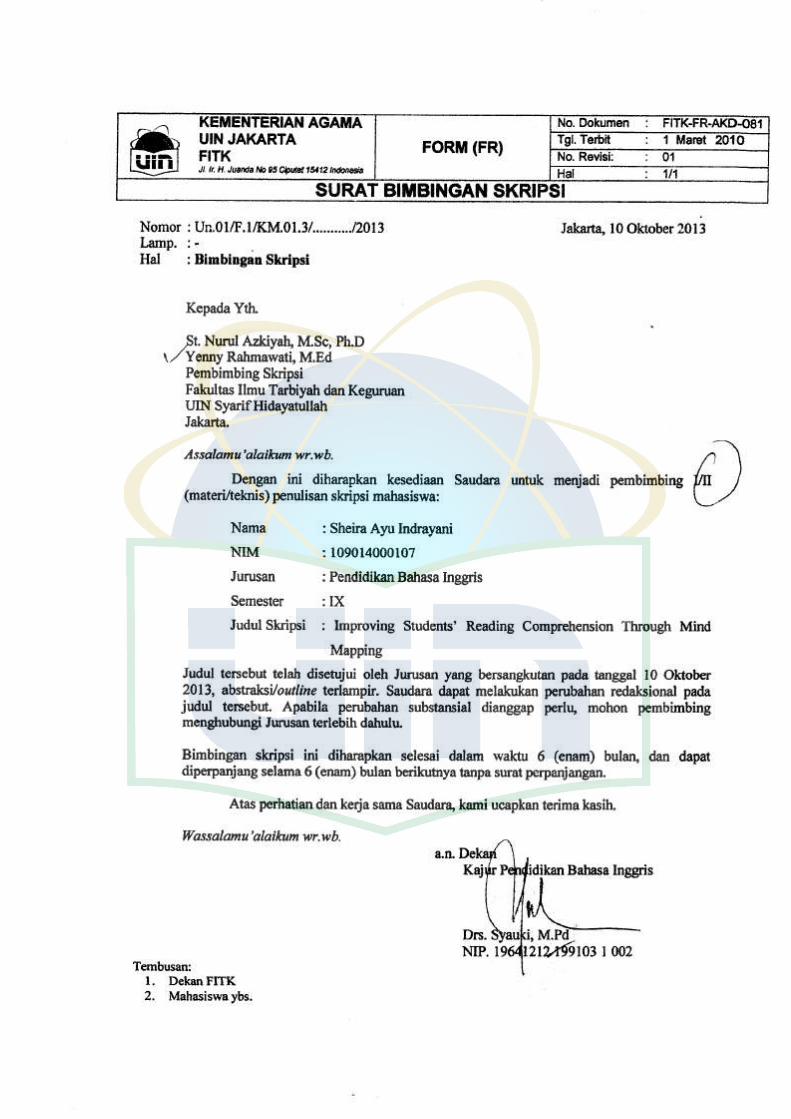
Related Documents