In Washington State, the juvenile courts are a division of the state’s superior court system. The juvenile courts have jurisdiction over persons under the age of 18 who are alleged to have committed a crime. In certain circumstances, however, state law requires youth to be “declined jurisdiction” in the juvenile court and the case is then transferred into adult criminal court. The Washington State Institute for Public Policy (WSIPP) was asked to evaluate the effectiveness of the law that declines youth from the juvenile court. 1,2 This report contains our findings and is divided into four parts: 1) Background on juvenile decline laws, 2) Our outcome evaluation on the effectiveness of Washington State’s juvenile decline law, 3) Review of the national research literature on the effectiveness of transferring juveniles to the adult court system, and 4) Our estimates of the benefits and costs associated with this policy. An appendix is provided for supplemental information and technical detail. 1 This project was initiated by the Washington State Partnership Council on Juvenile Justice and was approved by WSIPP’s Board of Directors on September 17, 2012. 2 The preparation of this report was aided by the Office of Juvenile Justice, Juvenile Justice & Rehabilitation Administration, and Department of Social & Health Services through a federal grant from the Office of Juvenile Justice & Delinquency Prevention of the U.S. Department of Justice authorized under the Juvenile Justice, Runaway Youth and Missing Children’s Act Amendments of 1992 through a grant approved by the Washington State Partnership Council on Juvenile Justice (WA-PCJJ). Washington State Institute for Public Policy December 2013 The Effectiveness of Declining Juvenile Court Jurisdiction of Youth Summary In Washington State, the juvenile courts have jurisdiction over youth under the age of 18 who are charged with committing a crime. Under certain circumstances, however, the juvenile courts are declined jurisdiction and youth are automatically sentenced as adults. Since 1994, about 1,300 Washington youth have been processed in the adult system under the automatic decline law. For this report, we examined whether the automatic decline law results in higher or lower offender recidivism for those who were sentenced as adults. To answer this question, we compared recidivism rates of youth who were automatically declined after the 1994 law with youth who would have been declined had the law existed prior to that time. We employed numerous tests, all of which demonstrate that recidivism is higher for youth who are automatically declined jurisdiction in the juvenile court. These findings are similar to other rigorous evaluations conducted nationally by other researchers. When possible, WSIPP conducts benefit-cost analysis to understand the long-term financial impacts of programs and policies to society and others. Limitations in the juvenile justice literature, however, prohibit us from empirically investigating the potential benefits (or costs) of avoided crimes due to an increased length of stay in confinement for automatically declined youth. 110 Fifth Avenue SE, Suite 214 ● PO Box 40999 ● Olympia, WA 98504 ● 360.586.2677 ● www.wsipp.wa.gov Suggested citation: Drake, E. (2013). The effectiveness of declining juvenile court jurisdiction of youthful offenders (Doc. No. 13-12-1902). Olympia: Washington State Institute for Public Policy.

Welcome message from author
This document is posted to help you gain knowledge. Please leave a comment to let me know what you think about it! Share it to your friends and learn new things together.
Transcript

In Washington State, the juvenile courts are a
division of the state’s superior court system. The
juvenile courts have jurisdiction over persons under
the age of 18 who are alleged to have committed a
crime. In certain circumstances, however, state law
requires youth to be “declined jurisdiction” in the
juvenile court and the case is then transferred into
adult criminal court.
The Washington State Institute for Public Policy
(WSIPP) was asked to evaluate the effectiveness of
the law that declines youth from the juvenile
court.1,2 This report contains our findings and is
divided into four parts:
1) Background on juvenile decline laws,
2) Our outcome evaluation on the
effectiveness of Washington State’s juvenile
decline law,
3) Review of the national research literature on
the effectiveness of transferring juveniles to
the adult court system, and
4) Our estimates of the benefits and costs
associated with this policy.
An appendix is provided for supplemental
information and technical detail.
1 This project was initiated by the Washington State Partnership
Council on Juvenile Justice and was approved by WSIPP’s Board of
Directors on September 17, 2012. 2 The preparation of this report was aided by the Office of Juvenile
Justice, Juvenile Justice & Rehabilitation Administration, and
Department of Social & Health Services through a federal grant from
the Office of Juvenile Justice & Delinquency Prevention of the U.S.
Department of Justice authorized under the Juvenile Justice, Runaway
Youth and Missing Children’s Act Amendments of 1992 through a
grant approved by the Washington State Partnership Council on
Juvenile Justice (WA-PCJJ).
Washington State Inst itute for Publ ic Pol icy
December 2013
The Effectiveness of Declining Juvenile Court Jurisdiction of Youth
Summary
In Washington State, the juvenile courts have
jurisdiction over youth under the age of 18 who are
charged with committing a crime. Under certain
circumstances, however, the juvenile courts are
declined jurisdiction and youth are automatically
sentenced as adults.
Since 1994, about 1,300 Washington youth have been
processed in the adult system under the automatic
decline law. For this report, we examined whether the
automatic decline law results in higher or lower
offender recidivism for those who were sentenced as
adults.
To answer this question, we compared recidivism
rates of youth who were automatically declined after
the 1994 law with youth who would have been
declined had the law existed prior to that time. We
employed numerous tests, all of which demonstrate
that recidivism is higher for youth who are
automatically declined jurisdiction in the juvenile
court. These findings are similar to other rigorous
evaluations conducted nationally by other
researchers.
When possible, WSIPP conducts benefit-cost analysis
to understand the long-term financial impacts of
programs and policies to society and others.
Limitations in the juvenile justice literature, however,
prohibit us from empirically investigating the
potential benefits (or costs) of avoided crimes due to
an increased length of stay in confinement for
automatically declined youth.
110 Fifth Avenue SE, Suite 214 ● PO Box 40999 ● Olympia, WA 98504 ● 360.586.2677 ● www.wsipp.wa.gov
Suggested citation: Drake, E. (2013). The effectiveness of
declining juvenile court jurisdiction of youthful offenders
(Doc. No. 13-12-1902). Olympia: Washington State Institute
for Public Policy.

2
I. Background & Research Approach
In Washington State, adults charged with felony
crimes have their cases heard in the superior court
system. For adults found guilty of a crime,
sentences are prescribed by the ranges in the
state’s sentencing guidelines.3 Depending on the
seriousness of the crime and a person’s criminal
history, some sentences result in confinement in
prison or community supervision.
The juvenile courts are a division of the superior
court system. These courts have jurisdiction of
youth under the age of 18 charged with criminal
offenses. Like the adult system, the juvenile courts
follow sentencing guidelines prescribed in statute
that are also based on the seriousness of a crime
and a youth’s criminal history.4
Washington State law allows prosecutors to
petition to transfer a youth to adult court, at the
discretion of the juvenile court.5 This type of
transfer is known as a discretionary decline of
jurisdiction.
3 RCW 9.94A, Sentencing Reform Act of 1981.
4 RCW 13.40.0357.
5 RCW 13.40.110.
In addition to discretionary transfer, the 1994
Washington State Legislature passed the Youth
Violence Reduction Act establishing an automatic
decline of jurisdiction to the adult court for certain
youth. Youth ages 16 and 17 are automatically
“declined” to the adult court when charged with the
following violent felonies:6
Serious violent felony (murder 1 and 2,
manslaughter 1, assault 1, kidnapping 1, and
rape 1)
Violent felony (with a criminal history of one
or more serious violent felonies)
Violent felony (with a criminal history of two
or more violent felonies)
Violent felony (with a criminal history of
three or more class A felonies, class B
felonies, vehicular assault, or manslaughter
2 committed after the 13th birthday and
prosecuted separately)
The 1997 Legislature revised the automatic transfer
criteria and added the following offenses:
Robbery 1, rape of a child 1, or drive-by
shooting
Burglary 1 (with a criminal history of any
prior felony or misdemeanor)
Violent felony with a deadly weapon
Section II of this report presents our evaluation of
the effect of the state’s automatic decline law on
crime.
6 RCW 13.04.030. In 1999, the Washington State Supreme Court
determined that the adult court cannot retain jurisdiction over a
juvenile if the charges against the youth are amended so the case no
longer meets the automatic transfer criteria (State v. Mora, 138 Wn.2d,
June 3, 1999).

3
Confinement of Declined Youth
The Department of Corrections (DOC) has legal
authority over declined youth. DOC policy
designates a youthful offender as any person under
the age of 18 who is convicted and sentenced as an
adult.7
Federal laws ensure certain protections of youth in
the adult criminal justice system.8 Youthful
offenders under the jurisdiction of DOC are housed
separately from adult offenders as required by
Washington State law.9
7 Department of Corrections Policy 320.500.
8 Such laws include the Juvenile Justice Delinquency and Prevention Act
and the Prison Rape Elimination Act. 9 RCW 70.01.410
Declined youth are managed under the Youthful
Offender Program (YOP), which is a coordinated
effort between staff at DOC and the Juvenile
Rehabilitation Administration (JRA). Under current
practice, declined youth less than age 18 are
housed at JRA.10 If the youth is expected to be
released from confinement prior to age 21, the
youth remains at JRA. If the youth is expected to
be released after the age of 21, the case is reviewed
at the age of 18 to determine if the youth is able to
complete his/her sentence at DOC.11
10
Prior to July 2004, the Youthful Offender Program for male offenders
was physically located at DOC’s Clallam Bay Corrections Center. Prior
to August 2000, females were housed at DOC’s Washington
Corrections Center for Women. Communication with Arlene Scott-
Young at DOC and Jennifer Redman at JRA. 11
Communication with Jennifer Redman at JRA.

4
II. Outcome Evaluation
When the 1997 Legislature modified juvenile
sentencing laws, it directed WSIPP to evaluate the
impact of the changes in jurisdiction of juvenile
offenders.12 In 2003, WSIPP published findings on
the effectiveness of the juvenile decline of
jurisdiction laws.13 These findings were
inconclusive, however, since the law had not been
implemented long enough to sufficiently examine
its impact on recidivism.
The current evaluation was initiated by the
Washington State Partnership Council on Juvenile
Justice (Partnership Council), which asked WSIPP to
undertake the study. The Partnership Council
serves in an advisory role to the Governor by
commenting on the state’s juvenile justice and
prevention needs.14
The WSIPP Board of Directors approved this project
in 2012. The primary research tasks were to:
Conduct an outcome evaluation of the
effectiveness of Washington State’s juvenile
decline law,
Review the national research literature on
the effectiveness of juvenile decline laws,
and
Estimate the benefits and costs associated
with this policy.
12
RCW 13.40.0357. 13
R. Barnoski (2003). Changes in Washington State’s jurisdiction of
juvenile offenders: Examining the impact. (Doc. No. 03-01-1203).
Olympia: Washington State Institute for Public Policy. 14
Executive Order 10-03. Establishing the Washington State
Partnership Council on Juvenile Justice. September 13, 2010. Retrieved
from: http://www.digitalarchives.wa.gov/GovernorGregoire/execorders/
eo_10-03.pdf
Research Design
The best way to determine the effectiveness of a
policy is to compare the outcomes of those who are
subject to the policy with a similar group of people
who would have been eligible, but the policy did
not apply. In an ideal research setting, youth would
be randomly assigned to either a treatment or a
comparison group and any observed differences in
recidivism rates could be attributed to the law.
For the current study, however, since the decline of
jurisdiction law was implemented statewide, it was
not possible to randomly assign youth to different
groups. Instead of random assignment we use
statistical controls to compare the recidivism rates
of youthful offenders before the 1994 law to rates
after the law.
The implementation of the 1994 law requiring
automatic decline of juvenile court jurisdiction
created a unique situation allowing us to select
youth who would have met the exact age and
offense criteria prior to the law. Using this research
design, we can observe whether youth who were
automatically declined had different recidivism
rates than youth who would have been eligible, but
were not automatically declined, prior to the
implementation of the law.
Because this condition does not exist for youth who
were declined jurisdiction due to prosecutorial
discretion, we were unable to construct a valid
comparison group of those youth to test the effects
of this law. Therefore, our outcome evaluation
focuses on the effect of automatic decline of
jurisdiction on recidivism, not on discretionary
decline of jurisdiction.

5
Exhibit 1
Differences Between the Study Groups
Variable Pre-
group
Automatic
decline
group
p-
value
Criminal history score 13.3 10.1 0.000
Prior juvenile felony adjs. 1.7 2.0 0.048
Age at index offense 16.4 16.6 0.000
Age at-risk 17.9 20.1 0.000
Black 24% 28% 0.115
White 69% 65% 0.199
Male 95% 94% 0.493
Number 446 770
Study Groups
Using WSIPP’s criminal history database and the
eligibility criteria described in the sidebar on this
page, we created study groups to examine the
effectiveness of the automatic decline law.15
We identified the automatic decline group by
locating youth who had cases filed in adult superior
court after July 1, 1994 and met the eligibility
criteria for automatic decline.16
We then constructed a comparison group of youth
who would have been automatically declined had
the law existed prior to its implementation in
1994.17 We selected youth whose cases were filed
in juvenile court between January 1, 1992 through
June 30, 1994.
To examine recidivism, youth in the pre-group and
decline group had to be at-risk for recidivism in the
community for 36 months. Thus, we included youth
who became at-risk in the community through
2009.
15
WSIPP’s criminal history database was developed to conduct criminal
justice research at the request of the legislature. The database is a
synthesis of data from the Administrative Office of the Courts and the
Department of Corrections. We conducted a matching process using
the court case number and the primary identification number from the
data systems to link criminal history records. The criminal history
database is intended for research purposes only. 16
If a case was filed in adult superior court, but did not meet the
eligibility criteria for automatic waiver, we assumed the case was a
discretionary decline and was therefore, not included in our study. 17
More detail on our technical methods and data processing are
contained in the technical appendix.
This selection process resulted in a total of 446
youth in the pre-group who would have been
eligible for automatic decline had it existed prior to
1994 and 770 youth in the automatic decline group.
We compared the decline group with the pre-
group to estimate the differences between the
groups on key characteristics. Exhibit 1 shows that
there are some differences between the groups.
Most importantly, youth in the automatic decline
group have lower criminal history scores, meaning
that these youth have a lower likelihood of
recidivating. We addressed the differences using
statistical analyses to control for these factors.
6
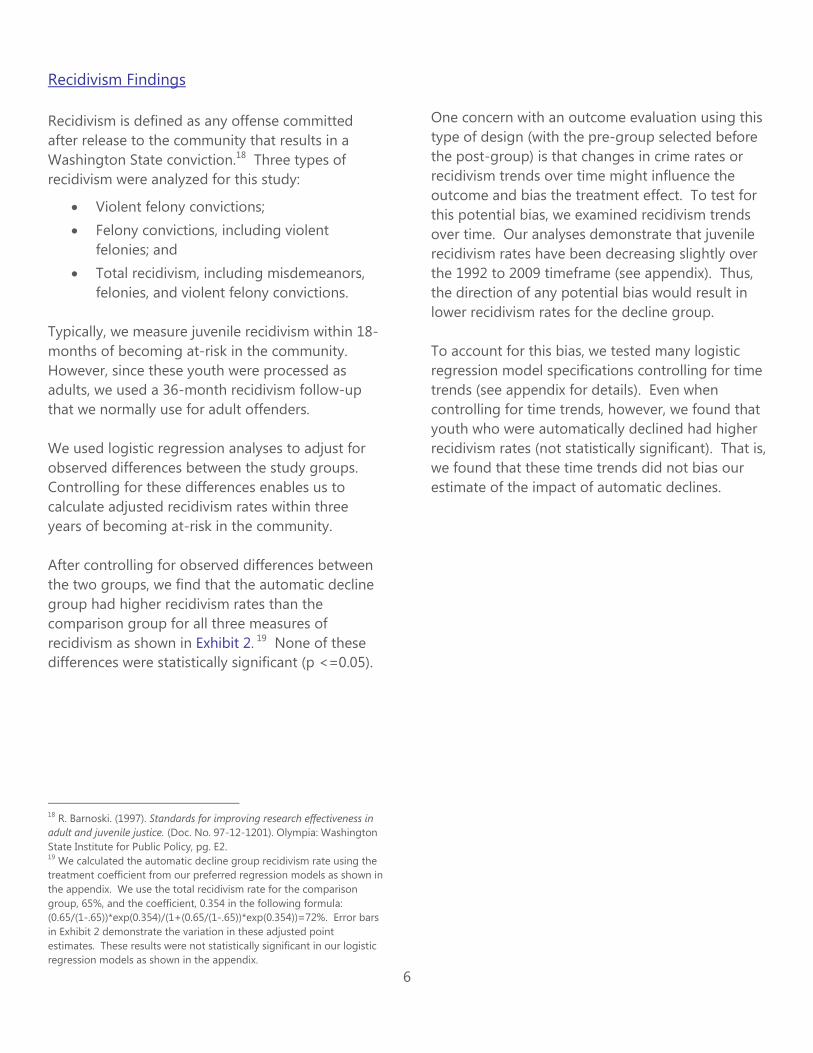
Recidivism Findings
Recidivism is defined as any offense committed
after release to the community that results in a
Washington State conviction.18 Three types of
recidivism were analyzed for this study:
Violent felony convictions;
Felony convictions, including violent
felonies; and
Total recidivism, including misdemeanors,
felonies, and violent felony convictions.
Typically, we measure juvenile recidivism within 18-
months of becoming at-risk in the community.
However, since these youth were processed as
adults, we used a 36-month recidivism follow-up
that we normally use for adult offenders.
We used logistic regression analyses to adjust for
observed differences between the study groups.
Controlling for these differences enables us to
calculate adjusted recidivism rates within three
years of becoming at-risk in the community.
After controlling for observed differences between
the two groups, we find that the automatic decline
group had higher recidivism rates than the
comparison group for all three measures of
recidivism as shown in Exhibit 2. 19 None of these
differences were statistically significant (p <=0.05).
18
R. Barnoski. (1997). Standards for improving research effectiveness in
adult and juvenile justice. (Doc. No. 97-12-1201). Olympia: Washington
State Institute for Public Policy, pg. E2. 19
We calculated the automatic decline group recidivism rate using the
treatment coefficient from our preferred regression models as shown in
the appendix. We use the total recidivism rate for the comparison
group, 65%, and the coefficient, 0.354 in the following formula:
(0.65/(1-.65))*exp(0.354)/(1+(0.65/(1-.65))*exp(0.354))=72%. Error bars
in Exhibit 2 demonstrate the variation in these adjusted point
estimates. These results were not statistically significant in our logistic
regression models as shown in the appendix.
One concern with an outcome evaluation using this
type of design (with the pre-group selected before
the post-group) is that changes in crime rates or
recidivism trends over time might influence the
outcome and bias the treatment effect. To test for
this potential bias, we examined recidivism trends
over time. Our analyses demonstrate that juvenile
recidivism rates have been decreasing slightly over
the 1992 to 2009 timeframe (see appendix). Thus,
the direction of any potential bias would result in
lower recidivism rates for the decline group.
To account for this bias, we tested many logistic
regression model specifications controlling for time
trends (see appendix for details). Even when
controlling for time trends, however, we found that
youth who were automatically declined had higher
recidivism rates (not statistically significant). That is,
we found that these time trends did not bias our
estimate of the impact of automatic declines.

7
Exhibit 2
36-Month Adjusted Recidivism Rates by Type of Recidivism
72%
57%
38%
65%
43%
23%
0%
10%
20%
30%
40%
50%
60%
70%
80%
Total Felony Violent felony
Reci
div
ism
rate
Automatic decline group
Pre-group
One theoretical reason why recidivism rates may
have been higher for youth who were automatically
declined is that processing youth in the adult
system has a criminogenic effect—the tendency to
increase crime.20 From this study, however, we are
unable to distinguish why declined youth had
higher recidivism rates. It is unknown whether
processing youth through the adult court or
housing youth in the adult system21 or some other
unknown factor contributed to this effect.
20
Aizer, A. & Doyle, J. (2013). Juvenile incarceration, human capital, and
future crime: Evidence from randomly-assigned judges. National Bureau
of Economic Research. 21
Not all declined youth serve their sentence at DOC (see Section I).
Transfer to DOC is dependent on the youth’s age as well as other
factors such as vulnerability. Unfortunately, due to multicolinearity
between location of confinement, time, and the treatment variable
(decline), the data do not allow us to test whether the place of
confinement has an effect on recidivism.
A second reason could be related to increased time
in confinement. Youth in the decline group spent
an average of 32 months in confinement versus
youth in the pre-group who spent 12 months in
confinement. We were able to test this theory and
found no statistically significant relationship
between the increased length of stay and
recidivism.22
22
This finding, however, is contrary to our recent meta-analysis of adult
research where we found that increasing length of stay of adults in
prison leads to a small decrease in recidivism. (see Aos, S. & Drake, E.
(2013) Prison, police, and programs: Evidence-based options that reduce
crime and save money. (Doc. No. 13-10-1901). Olympia: Washington
State Institute for Public Policy.)

8
III. Systematic Review of the Literature
In addition to our analysis of Washington’s juvenile
decline laws, we were asked to review the national
research literature on the effectiveness of
transferring juveniles to the adult court system. The
sidebar on this page highlights WSIPP’s general
approach to systematic reviews of the literature and
technical detail is provided in the appendix of this
report.23
We systematically reviewed the literature and
located all studies that evaluated the impact of
juvenile decline laws on crime (or recidivism).
We assessed whether each study met WSIPP’s
minimum standards of research rigor. For example,
to be included in our review, a study must have
demonstrated that there was no, or minimal,
selection bias, particularly in the comparison group.
Three studies were rigorous enough to be included
in the meta-analysis (including the effect from the
outcome evaluation in Section II of this report). For
each of these studies, we calculated an individual
“effect size.” An effect size is a metric that
measures the degree to which a program has been
shown to change an outcome (such as recidivism)
for program participants relative to a comparison
group.
23
For additional detail, see technical manual
www.wsipp.wa.gov/rptfiles/BCTechnicalManual.pdf
WSIPP’s Approach to Systematic Reviews
At the direction of the Washington State legislature,
WSIPP conducts systematic reviews of evaluation
research to determine what public policies and
programs work and which ones do not work. These
evidence-based reviews cover adult and juvenile
corrections, child welfare, mental health, substance
abuse, prevention, and education.
When WSIPP is asked to conduct a systematic
review, we follow a number of steps to ensure a
rigorous finding. These criteria include:
1) Considering all available studies we can
locate on a topic rather than selecting only a
few; that is, we do not “cherry pick” studies to
include in our reviews.
2) Requiring that an evaluation’s research
design include treatment and comparison
groups from intent-to-treat samples.
Random assignment studies are preferred,
but we include quasi-experimental studies
when the study uses appropriate statistical
techniques to control for selection bias.
We then use a formal statistical procedure, called
meta-analysis, to calculate an average “effect size,”
which indicates the expected magnitude of the
relationship between the treatment and the
outcome of interest.

9
All three studies in the meta-analysis found that
declining youth to adult court is associated with an
increase in recidivism. The weighted average effect
size is 0.130 (SE = 0.054). This effect is statistically
significant at p = 0.017). The effect sizes are
reported in Exhibit 3.
We also found several evaluations examining the
impact of juvenile decline laws on general
deterrence.24 Unfortunately, however, none of
these studies met our minimum standards of rigor
to be included in our meta-analysis.
24
General deterrence refers to the effect that punishment has on the
general population. For example, an individual may make the choice to
remain crime-free because the threat of punishment prevents him or
her from committing a crime.
Exhibit 3
Effect Sizes for Decline of Jurisdiction Studies
-0.200 0.000 0.200 0.400
Effect Size
Weighted average effect size
Drake, 2013
Fagan et al., 2007
Fagan 1995

10
IV. Benefit-Cost Analysis
When possible, we use WSIPP’s benefit-cost model
to generate return-on-investment statistics for all
evaluations for the legislature. The results provide
a consistent comparison with the benefit-cost
results of other programs and policies.25
In benefit-cost analyses of criminal justice
programs, the valuation of benefits in monetary
terms often takes the form of savings when crime is
avoided. Crime can produce many costs, including
those associated with the criminal justice system as
well as those incurred by crime victims. When
crime is avoided, these reductions lead to monetary
savings or benefits. WSIPP’s benefit-cost analysis
estimates the number and types of crimes avoided
due to the effects of a policy and determines the
monetary value associated with reduced or incurred
crimes.
The result of our study of the effect of automatic
decline laws provides an estimate of how declining
juvenile court jurisdiction of youth affects
recidivism compared with similar youth sentenced
prior to the law. We found an increase in recidivism
for those who were automatically declined (though
not statistically significant at conventional levels).
In addition to this specific deterrent effect,
however, the juvenile decline law can also affect
crime rates in Washington by what criminologists
call “incapacitation” which accounts for crimes
averted during a period of confinement.
Empirical research indicates that statewide crime
rates are affected by statewide incarceration rates.26
For example, if everyone in Washington were
25
Lee, S., Aos, S., Drake, E., Pennucci, A., Klima, T., Miller, M., Anderson,
L., Mayfield, J., & Burley, M. (2012). Return on investment: Evidence-
based options to improve statewide outcomes (Doc. No. 12-04-1201).
Olympia: Washington State Institute for Public Policy. 26
Nagin, D. (2013). Deterrence in the twenty-first century: A review of
the evidence. Crime and Justice: A review of research. Chicago, IL:
University of Chicago Press. Marvell, T. B. (2010). Prison population
and crime. Handbook on the economics of crime, B. L. Benson & P. R.
Zimmerman (Eds.). Cheltenham, UK: Edward Elgar Publishing.
incarcerated then the crime rate would drop to
zero. On the other extreme, if no one were
incarcerated, then the crime rate would be higher
than it is today.
The result of the automatic decline law has been to
increase the statewide incarceration rate by
imposing, on average, a longer length of stay in
confinement. From our evaluation in Section II, we
found that youth in the decline group were
confined an average of 33 months compared with
youth in the pre-group who were confined an
average of 13 months. Thus, the law could affect
crime in Washington through an incapacitation
effect. This difference between the groups
translates to an increase of 1.66 in prison average
daily population.
The empirical task is to calculate this incapacitation
effect by estimating how changes in the
incarceration rate affect the crime rate. Recently,
WSIPP produced an incapacitation model to
estimate the number of crimes avoided or incurred
when incarceration rates change.27
The body of research that drives this model was
derived, however, from the effects of incarcerating
adult offenders. At this time, unfortunately, no
body of research estimates the effect of
incapacitation of juvenile offenders on crime.28
Therefore, we are unable to reliably estimate how
many crimes society avoids when incarcerating
youth.
Given our findings from the adult incapacitation
literature, we can presume that the number of
crimes avoided through incapacitating youth will be
27
Aos, S. & Drake, E. (2013). See also: Aos, S. & Drake, E. (2010).
WSIPP’s benefit-cost tool for states: Examining policy options in
sentencing and corrections. (Doc. No. 10-08-1201). Olympia:
Washington State Institute for Public Policy. 28
Aizer, A. & Doyle, J. (2013). Juvenile incarceration, human capital, and
future crime: Evidence from randomly-assigned judges. National Bureau
of Economic Research.

11
greater than zero. That is, assumptions from the
adult incapacitation literature would lead us to
believe that some crime is avoided. We are unable,
however, to empirically estimate how many crimes
are avoided per juvenile offender incarcerated.29
We provide benefit-cost findings for the recidivism
effect in Section II.
Benefit-Cost Findings
Typically, the sum of the estimated benefits, along
with the costs, provides a statewide view on
whether a program produces benefits that exceed
costs. Since we are unable to provide a complete
picture of the benefits and costs of the decline of
juvenile court jurisdiction law, however, our benefit-
cost analysis is incomplete.
29
We tested this assumption by examining briefly the incarceration-crime
relationship of juvenile offenders in Washington State using county panel
data as modeled in Aos & Drake (2013). We used county-level UCR crime
data from 1982 to 2011 for Washington’s 39 counties as the dependent
variable and Washington’s annual total statewide juvenile incarceration
rate for juvenile offenders. Results indicate a negative elasticity. Our
model is not rigorous enough to account for simultaneity which biases a
coefficient downward (meaning the incapacitation effect would be larger),
thus we cannot estimate how many crimes are avoided due to
incapacitation, but we can conclude that incapacitation is likely to reduce
crime.
The benefit-cost estimates of this policy, thus far,
are displayed in Exhibit 4. As demonstrated in
Exhibit 4, we cannot estimate the empirical benefits
to taxpayers and crime victims of the incapacitation
effect.
The cost of the policy is $72,585 per youth
automatically declined from the juvenile court.30 In
addition to the cost of incarceration, we also found
an increase in recidivism—a cost to taxpayers and
crime victims. Results from our benefit-cost model
indicate that the increase in recidivism costs is
$2,168 to taxpayers and $8,071 to crime victims per
offender—a total of $10,239 in costs per offender.
30
To estimate the cost per youth declined, we multiplied the cost per
youth per year in JRA facilities., $37,000, plus $6,726 per offender to
operate the Youthful Offender Program (includes DOC and JRA staff)
multiplied by 1.66 years (20 months increased length of stay for
declined offenders).

12
Exhibit 4
Monetary Benefits and Costs of Declining Juvenile Court Jurisdiction per Automatically Declined Offender
Benefits# to taxpayers and crime victims
1 Incapacitation An evidence-based finding
cannot be estimated at this
time for juvenile offenders.
2 Decreased crime victim cost due to increased incapacitation
3 Decreased taxpayer cost due to increased incapacitation
Costs to taxpayers and crime victims
4 Additional cost to confine declined youth $72,585
5 Recidivism effect:
6 Increased crime victim cost due to increased recidivism $8,071
7 Increased taxpayer cost due to increased recidivism $2,168
Bottom Line
9 Total net benefits per participant An evidence-based finding
cannot be estimated at this
time for juvenile offenders.
10 Benefit-to-cost ratio
11 Monte Carlo risk analysis## #Benefits and costs are life-cycle present-values per participant, in 2012 dollars.
##We assess the risk in our bottom-line estimates by running our benefit-cost model 5,000 times to determine the odds that the policy
will at least break even.

13
Findings and Limitations
Several limitations to our findings must be
considered.
First, we were able to detect that there is an
increase in recidivism when juveniles are
automatically declined from the juvenile court.
While the results from our own evaluation of
Washington offenders were not statistically
significant, the meta-analysis of all available
literature is statistically significant (p = 0.017). We
were not able to understand why we found this
effect. We were able to test whether this effect was
associated with an increased length of stay and that
factor does not appear to play a role. The question
still remains as to why the effect was an increase in
recidivism.
Second, evaluations that measure recidivism are
“retrospective” by design, which means that we did
not evaluate the effectiveness of declining juvenile
court jurisdiction as it operates today. During the
time period of our study, the majority of the youth
included in our outcome evaluation were physically
transferred and housed at DOC. Today, however,
declined youth are housed at JRA facilities.
Although state laws have since imposed separate
housing restrictions between adult and juvenile
offenders, it is unknown how current practice may
or may not impact recidivism differently.
Third, although we were able to monetize the costs
and benefits of the recidivism effect of declined
youth, two important components of this policy
have gone unmeasured—incapacitation and
general deterrence. At this time, we are unable to
quantify the impact of incapacitating youth for an
average of 20 additional months in confinement.
We are also unable to empirically estimate the
general deterrent effects of the decline of juvenile
court jurisdiction law on youth at large.

14
Appendix
I. Outcome Evaluation of Washington State’s Juvenile Decline of Jurisdiction Laws……………………….…..14
II. Meta-Analysis and Benefit-Cost Analysis……………………………………………………………………………….….…..….20
III. Recidivism Trends in Washington State………………..………..…………………………………………………………………29
IV. Treatment……………………………………..…………………………………………………………………………………….………….….31
Technical Appendix The Effectiveness of Declining Juvenile Court Jurisdiction of Youth
I. Outcome Evaluation of Washington State’s Juvenile Decline of Jurisdiction Laws
The Washington State Institute for Public Policy (WSIPP) has a criminal history database that is a synthesis of
criminal charge information for individuals. The database was developed using data from the Administrative
Office of the Courts (AOC) and the Department of Corrections (DOC) with the intent to conduct legislatively
mandated research in a timely fashion. This comprehensive database can be used to determine an offender’s
criminal history or to calculate recidivism. We used this database to select the study groups and to calculate
criminal history and analyze recidivism for this report.
While every effort is made to accurately identify persons across data sources, 100% accuracy is not possible. For
example, multiple birth dates and aliases force us to make processing decisions about the data. Thus, the data
should not be used for auditing purposes; however the database does provide a reasonably accurate source of
criminal charge data for reporting and analysis at the aggregate level.
A. Data Processing
Study Groups. We included youth who were automatically declined to the adult court according to RCW
13.04.030 and youth who would have met those criteria had the law existed in the pre-period. The pre-group is
defined by youth whose offense dates were between July 1, 1991 and June 30, 1994. Juveniles in the pre-group
were ages 16 or 17 at the time of the first offense date who met the offense criteria:
Serious violent felony (murder 1 and 2, manslaughter 1, assault 1, kidnapping 1, and rape 1)
Violent felony (with a criminal history of one or more serious violent felonies)
Violent felony (with a criminal history of two or more violent felonies)
Violent felony (with a criminal history of three or more class A felonies, class B felonies, vehicular assault,
or manslaughter 2 committed after the 13th birthday and prosecuted separately)
In the decline group, we identified adult cases filed in superior court that met the offense criteria and ages 16 or
17 at the time of the first offense date.31
The decline group is defined by youth whose offense dates were after
July 1, 1994.
31
To be eligible for a decline of jurisdiction hearing, RCW 13.04.030 states that the youth must be age 16 or 17 at the time of the offense,
while RCW 13.40.110 states that the youth must be age 16 or 17 at the time the information is filed. We followed the eligibility criteria in
RCW 13.04.030 (age at the time of the offense). There were 63 youth in our decline study group age 18 or older at the file date. We tested
the sensitivity of our results (Section B of this appendix) by excluding these 63 youth and it did not impact our overall findings.

15
If a youth had multiple dates of birth, we used the first date of birth (making the person older). If the offense
date was missing, the first file date was used.
Recidivism. Recidivism is defined as any offense committed after release to the community that resulted in a
Washington State court conviction.32
The follow-up period is 36-months from the time the offender was “at-risk”
in the community—the date an offender was in the community with the potential to re-offend. Typically, we use
18 months follow-up for juvenile offenders, however, since the intention of the policy is to process youth
through the adult system, we used a 36-month follow-up period, which is our standard for adult offenders. We
have found that this timeframe allows the researcher to capture approximately 80% of re-offense behavior when
compared with a longer follow-up.33
Thus, we have determined that 36-months is a sufficient follow-up period.
We limited the study groups to youth who became at-risk in the community through 2009 in order to calculate
36-month recidivism rates.
In addition to the follow-up period, time is needed to allow an offense to be processed in the criminal justice
system. The criminal justice process includes the time period between the date recorded for the commission of a
subsequent offense and the resulting conviction of that offense. In our previous work, we have found that a 12-
month adjudication period is adequate for adult offenders.
When data from DOC or Juvenile Rehabilitation Administration (JRA) indicated the youth was incarcerated, the
release date from the respective institution was used as the youth’s at-risk date. We do not have access to
detention data for juveniles held at local jurisdictions; therefore, if a youth was not confined in DOC or the JRA,
we used the adjudication date as the at-risk date.
B. Sensitivity Testing of Recidivism Findings
We ran alternative model specifications to test the sensitivity of our recidivism findings displayed in Exhibit A1.
We used logistic regression analysis with felony recidivism as the dependent variable. The “treatment” variable,
Auto-Declined, was coded as a 1 for youth who were automatically declined in the post-period (after
implementation of the automatic decline law) and 0 for youth who were eligible, but were not declined in the
pre-period (prior to the implementation of the automatic decline law).
Results from model (1) show a negative coefficient—a reduction in recidivism—before we added covariates to
the model. In model (2), covariates controlling for important characteristics that impact recidivism were added
to the model and the treatment coefficient became positive. In model (3), our preferred model, fixed effects
were added to capture any unobserved trends over time and the treatment variable remains positive.
32
R. Barnoski (1997). Standards for improving research effectiveness in adult and juvenile justice. (Doc. No. 97-12-1201). Olympia: Washington
State Institute for Public Policy, pg. 2. 33
Ibid.

16
Exhibit A1
Sensitivity of Model Specifications
Dependent variable =
Felony recidivism (1) (2) (3)
Parameter
estimate
Standard
error
P-
value
Parameter
estimate
Standard
error
P-
value
Parameter
estimate
Standard
error
P-
value
Intercept -0.289 0.096 0.003 0.646 0.609 0.289 0.744 0.968 0.443
Auto-Declined (1=Y, 0=N) -0.078 0.121 0.572 0.237 0.152 0.119 0.555 0.420 0.186
Criminal history -- -- -- 0.048 0.015 0.002 0.045 0.016 0.005
Age at risk -- -- -- -0.146 0.029 0.000 -0.177 0.034 0.000
Black -- -- -- 0.497 0.142 0.000 0.479 0.146 0.001
Other race -- -- -- 0.429 0.532 0.420 0.390 0.533 0.465
Male -- -- -- 0.787 0.306 0.010 0.795 0.311 0.011
Prior juvenile felony adjs. -- -- -- 0.144 0.048 0.003 0.183 0.051 0.000
Year 1 -- -- -- -- -- -- -0.434 0.821 0.597
Year 2 -- -- -- -- -- -- 0.495 0.596 0.406
Year 3 -- -- -- -- -- -- 0.517 0.570 0.365
Year 4 -- -- -- -- -- -- 0.540 0.560 0.335
Year 5 -- -- -- -- -- -- 0.767 0.553 0.165
Year 6 -- -- -- -- -- -- -0.770 0.515 0.135
Year 7 -- -- -- -- -- -- -0.076 0.478 0.874
Year 8 -- -- -- -- -- -- -0.408 0.460 0.375
Year 9 -- -- -- -- -- -- -0.117 0.407 0.773
Year 10 -- -- -- -- -- -- -0.145 0.386 0.707
Year 11 -- -- -- -- -- -- 0.094 0.370 0.799
Year 12 -- -- -- -- -- -- 0.137 0.399 0.731
Year 13 -- -- -- -- -- -- 0.224 0.403 0.578
Year 14 -- -- -- -- -- -- 0.194 0.375 0.606
Year 15 -- -- -- -- -- -- 0.808 0.389 0.038
Year 16 -- -- -- -- -- -- 1.056 0.421 0.012
Year 17 -- -- -- -- -- -- 0.139 0.422 0.741
Number of observations 1,216 1,195 1,195
Model fit:
Schwartz criterion 1,667 1,541 1,626
AUC 0.508 0.694 0.714
Pseudo R-squared 0.0003 0.1145 0.1410

17
Our preferred model for all three measures of recidivism (felony recidivism, violent felony recidivism, and total
recidivism including felony or misdemeanor) is displayed in Exhibit A2. Results from these models indicate a
positive relationship between automatic declines and recidivism across all measures. None of the models are
statistically significant at conventional levels, but automatic declines are found to be marginally significant for
violent felony recidivism (p = 0.102).
Exhibit A2
Preferred Model Estimates by Type of Recidivism
Recidivism Dependent
Variable: Felony (1) Violent (2) Total (3)
Parameter
estimate
Standard
error
P-
value
Parameter
estimate
Standard
error
P-
value
Parameter
estimate
Standard
error
P-
value
Intercept 0.744 0.968 0.443 -2.011 1.150 0.080 2.019 0.970 0.037
Auto-Declined (1=Y, 0=N) 0.555 0.420 0.186 0.727 0.444 0.102 0.354 0.429 0.409
Criminal history 0.045 0.016 0.005 0.049 0.017 0.004 0.098 0.017 0.000
Age at Risk -0.177 0.034 0.000 -0.118 0.039 0.003 -0.164 0.033 0.000
Black 0.479 0.146 0.001 0.754 0.158 0.000 0.439 0.156 0.005
Other race 0.390 0.533 0.465 0.219 0.617 0.723 0.646 0.594 0.276
Male 0.795 0.311 0.011 1.381 0.486 0.005 0.641 0.278 0.021
Prior juvenile felony adjs. 0.183 0.051 0.000 0.069 0.047 0.141 0.057 0.056 0.308
Year 1 -0.434 0.821 0.597 -0.807 1.210 0.505 -0.539 0.806 0.504
Year 2 0.495 0.596 0.406 0.666 0.663 0.315 -0.578 0.617 0.348
Year 3 0.517 0.570 0.365 0.582 0.637 0.361 -0.225 0.592 0.703
Year 4 0.540 0.560 0.335 0.802 0.619 0.195 -0.357 0.581 0.538
Year 5 0.767 0.553 0.165 0.912 0.597 0.127 -0.380 0.573 0.507
Year 6 -0.770 0.515 0.135 -0.142 0.568 0.803 -0.787 0.553 0.154
Year 7 -0.076 0.478 0.874 0.177 0.535 0.741 -0.871 0.498 0.080
Year 8 -0.408 0.460 0.375 -0.644 0.581 0.268 -0.708 0.456 0.121
Year 9 -0.117 0.407 0.773 -0.085 0.475 0.859 -0.656 0.408 0.108
Year 10 -0.145 0.386 0.707 -0.284 0.469 0.545 -0.805 0.383 0.036
Year 11 0.094 0.370 0.799 0.057 0.438 0.896 -0.306 0.374 0.414
Year 12 0.137 0.399 0.731 -0.374 0.508 0.462 -0.773 0.397 0.052
Year 13 0.224 0.403 0.578 0.328 0.471 0.486 -0.221 0.392 0.572
Year 14 0.194 0.375 0.606 0.282 0.437 0.519 -0.674 0.370 0.069
Year 15 0.808 0.389 0.038 0.554 0.447 0.216 0.009 0.392 0.982
Year 16 1.056 0.421 0.012 0.556 0.485 0.252 0.260 0.430 0.546
Year 17 0.139 0.422 0.741 -0.094 0.512 0.855 -0.283 0.412 0.492
Number of observations 1,195 1,195 1,195
Model fit:
Schwartz criterion 1,626 1,346 1,574
AUC 0.714 0.697 0.722
Pseudo R-squared 0.141 0.090 0.142

18
Time trends. As demonstrated in Section III later in this appendix, it was necessary to control for long-term
trends because recidivism rates and juvenile arrest rates, in general, have declined slightly over time. This finding
is consistent with adult recidivism rates in Washington State.34
Due to the nature of our research design (pre-
and post-law study groups), not controlling for these time trends could potentially bias a treatment effect in
favor of reducing recidivism. That is, without accounting for observed and unobserved time trends, if the
treatment coefficient were negative, that estimate could simply be capturing already declining crime trends.
We captured time trends using year fixed effects based on the youth’s at-risk date for recidivism. Due to the
nature of the research design, the treatment variable was defined by time (pre- and post-law changes); therefore
inherently creating multicolinearity among the treatment variable and the year fixed effects. We used the
variance inflation factor from an ordinary least squares regression to test for multicolinearity (felony recidivism as
the dependent variable and the covariates from our preferred model). The estimates were below 2 for all year
dummies and below 8 for the treatment variable.
We also conducted a likelihood ratio test to compare the fit of models (2) and (3) from Exhibit A1 (the nested
and full models, respectively) and determine whether the difference between the two models is statistically
significantly different. Findings show that model (3), with fixed year effects, is a statistically significantly better fit
than the nested model (p = 0.01). Although multicolinearity will bias the standard errors, it will not affect the
precision of the coefficients and it is important to capture trends over time due to the nature of the research
design.
As a final test of time trends, we restricted the sample to youth only released through 2004 (as compared with
the full sample who were released through 2009) to test if there was a treatment effect for a more
contemporaneous sample (n = 876). These results closely mirrored the findings from our preferred models in
Exhibit A2. All treatment variable coefficients were positive and not statistically significant at the traditional level.
The treatment variable was positive and marginally significant for violent felony recidivism (p = 0.087).
Location. Not all declined youth serve their sentence at DOC. Transfer to DOC is dependent on the youth’s age
as well as other factors such as vulnerability. Unfortunately, due to multicolinearity between location of
confinement of the youth, time, and the treatment variable (Auto-Declined), which is defined by time, the data do
not allow us to test whether the place of confinement had an effect on recidivism. The variance inflation factors
for these variables exceeded 10 indicating multicolinearity.
Length of stay. We ran several models testing the effect of length of stay in confinement. First, we ran an
ordinary least squares regression model with length of stay as the dependent variable with the covariates from
our preferred model in Exhibit A2. Results indicated that the treatment variable, whether a youth was declined
from juvenile court or not, did not have a statistically significant effect on length of stay when controlling for all
other factors. We further tested the impact of length of stay on felony recidivism by interacting the treatment
variable with length of stay in confinement. The interaction term itself was also not statistically significant (p =
0.2903). We tested the joint significance of the treatment variable and the interaction term and it was also not
statistically significant (p = 0.1959).
Race. In order to determine whether the automatic decline law was more or less effective for black or Hispanic
youth, we tested the effects by interacting the dummy variables for race with the treatment variable (similar to
our analysis for length of stay in confinement); thus, creating two interaction terms. The interaction terms were
not statistically significant for black youth (p = 0.7669) or for Hispanic youth (p = 0.1550). We tested the joint
significance of the treatment variable and the interaction terms which were also not statistically significant for
34
E. Drake, (2011). Washington State recidivism trends: Adult offenders released from prison (1990-2006). (Doc. No. 11-01-1201). Olympia:
Washington State Institute for Public Policy.

19
black youth (p = 0.3985) or for Hispanic youth (p = 0.1908). As a final test, we restricted the data in our
regression model to include only black youth (n = 313) and then only Hispanic youth (n = 176). Using our
preferred model covariates for felony recidivism, we found that the treatment variable was positive, but not
statistically significant for black youth (p = 0.2618) or for Hispanic youth (p = 0.5022). Thus, we found that the
treatment, automatic declines, is not different for black youth or for Hispanic youth compared to all youth
declined.

20
II. Meta-Analysis and Benefit-Cost Analysis
The Washington State legislature often directs WSIPP to update its review of the benefits and costs of programs
and policies to improve public outcomes. For example, the legislature or the WSIPP Board of Directors has asked
WSIPP to identify public policies that have been shown to improve the following broad outcomes of public
interest: crime, education, child maltreatment, substance abuse, mental health, employment and workforce
development, health care, and general prevention.
WSIPP built its first model in 1997 to estimate the economic value of programs that reduce crime. As WSIPP
received additional assignments from the Washington legislature, the benefit-cost model was revised and
expanded to cover other public policy outcomes. Our ongoing goal is to provide Washington policy makers with
better “bottom-line” estimates each successive legislative session.
There are three basic steps to WSIPP’s analysis:
1. What Works? First, we conduct a systematic review of the research literature to identify policies and
programs that have demonstrated an ability to improve the outcomes. The objective is to draw
statistical conclusions about what works—and what does not—to achieve improvements in the
outcomes, along with an estimate of the statistical error involved.
2. What Makes Economic Sense? The second basic step involves applying economic calculations to put a
monetary value on the improved outcomes (from the first step). Using WSIPP’s benefit-cost model, the
estimated benefits are then compared to the costs of programs to arrive at a set of economic bottom
lines for the investments.
3. How Risky are the Estimates? Part of the process of estimating a return on investment involves assessing
the riskiness of the estimates. Any rigorous modeling process, such as the one described here, involves
many individual estimates and assumptions. Our analytical goal is to deliver two benefit-cost bottom-
line measures: an expected return on investment and, given the uncertainty, the odds that the
investment will at least break even.
In this section of the appendix, we provide technical detail specifically relevant to the current assignment on
estimating the effectiveness of the decline of jurisdiction of youth in the juvenile court. For a comprehensive
review of WSIPP’s approach to identifying evidence-based public policies, see our technical manual: Washington
State Institute for Public Policy, (2013). Benefit-Cost Technical Manual: Methods and User Guide. (Document No.
13-09-1201b). Olympia, WA: Author.
A. Meta-Analysis
The first step in our approach produces estimates of policies and programs that have been shown to improve
particular outcomes. We carefully analyze all high-quality studies from the United States and elsewhere to
identify well-researched interventions that have achieved outcomes (as well as those that have not). We look for
research studies with strong, credible evaluation designs, and we ignore studies with weak research methods.
Our empirical approach follows a meta-analytic framework to assess systematically all relevant evaluations we
can locate on a given topic. By including all rigorous studies in a meta-analysis, we are making a statement
about the average effectiveness of a policy as measured in all relevant studies. For example, in determining
whether declining a youth’s jurisdiction in juvenile court impacts crime, we do not rely on just one evaluation.
Rather, we compute a meta-analytic average effect from all the rigorous studies.

21
Mean-difference effect size. To estimate the effects of programs and policies on outcomes, we employ statistical
procedures researchers have developed to facilitate systematic reviews of evaluation evidence. This set of
procedures is called “meta-analysis.”35
For this study, we coded mean-difference effect sizes following the
procedures in Lipsey and Wilson.36
For dichotomous measures, we used the D-cox transformation to approximate
the mean difference effect size, as described in Sánchez-Meca, Marín-Martínez, and Chacón-Moscoso.37
We chose
to use the mean-difference effect size rather than the odds ratio effect size because we code both dichotomous
and continuous outcomes (odds ratio effect sizes could also have been used with appropriate transformations).
Outcome measures of interest. The primary outcome of interest is crime. Our preference was to code convictions;
however, if primary researchers did not report convictions, we coded other available measures of crime. Some
studies reported multiple measures of the same outcome (e.g., arrest and incarceration). In such cases, we meta-
analyzed the similar measures and used the combined effect size in the meta-analysis. As a result, each study
sample coded in this analysis is associated with a single effect size for a given outcome.
Methodological Quality. Not all research is of equal quality, and this greatly influences the confidence that can
be placed in the results of a study. Some studies are well-designed and implemented, and the results can be
viewed as accurate representations of whether the program itself worked. Other studies are not designed as
well, and less confidence can be placed in any reported results. In particular, studies of inferior research design
cannot completely control for sample selection bias or other unobserved threats to the validity of reported
research results. This does not mean that results from these studies are of no value, but it does mean that less
confidence can be placed in any cause-and-effect conclusions drawn from the results.
To account for the differences in the quality of research designs, we use a 6-point scale (with values ranging from
zero to five) as a way to adjust the reported results. On this scale, a rating of “5” reflects an evaluation in which
the most confidence can be placed: a well-implemented random assignment study. Generally, as the evaluation
ranking gets lower, less confidence can be placed in any reported differences (or lack of differences) between the
program and comparison or control groups.38
A rating of “0” reflects an evaluation that does not have a
comparison group or has a comparison group that is not equivalent to the treatment group (for example,
because individuals in the comparison group opted to forgo treatment).
On the 0-to-5 scale as interpreted by WSIPP, each study is rated as follows.
A “5” is assigned to an evaluation with well-implemented random assignment of subjects to a treatment
group and a control group that does not receive the treatment/program. A good random assignment study
should also indicate how well the random assignment actually occurred by reporting values for pre-existing
characteristics for the treatment and control groups.
A “4” rating is used to designate an experimental random assignment design that had problems in
implementation. For example, there could be some crossover between the treatment and control groups or
differential attrition rates (such as 10 % study dropouts among participants versus 25% among non-
participants).
A “3” is assigned to an observational study that employs a rigorous quasi-experimental research design with
a program and matched comparison group, controlling with statistical methods for self-selection bias that
35
In general, we follow the meta-analytic methods described in: Lipsey, M. W., & Wilson, D. (2001). Practical meta-analysis. Thousand Oaks,
CA: Sage Publications. 36
Ibid. 37
Sánchez-Meca, J., Marín-Martínez, F., & Chacón-Moscoso, S. (2003). Effect-size indices for dichotomized outcomes in meta-analysis.
Psychological Methods, 8(4), 448-467. 38
In a meta-analysis of juvenile delinquency evaluations, random assignment studies produced effect sizes only 56% as large as nonrandom
assignment studies. Lipsey, M. W. (2003). Those confounded moderators in meta-analysis: Good, bad, and ugly. The Annals of the American
Academy of Political and Social Science, 587(1), 69-81.

22
might otherwise influence outcomes. These quasi-experimental methods may include estimates made with a
convincing instrumental variables modeling approach, or a Heckman approach to modeling self-selection.39
A “2” indicates a non-experimental evaluation where the program and comparison groups were reasonably
well matched on pre-existing differences in key variables. There must be evidence presented in the
evaluation that indicates few, if any, significant differences were observed in these salient pre-existing
variables. Alternatively, if an evaluation employs sound multivariate statistical techniques (e.g., logistic
regression) to control for pre-existing differences, then a level “2” study with some differences in pre-existing
variables can qualify as a level 3.
A “1” is used when a level “3” or a “2” study design was less well implemented or didn’t use many statistical
controls.
A “0” involves a study with program and comparison groups that lack comparability on pre-existing variables
and no attempt was made to control for these differences in the study. A zero rating also is used in studies
where no comparison group is utilized. Instead, the relationship between a program and an outcome, i.e.,
drug use, is analyzed before and after the program.
We do not use the results from evaluations rated as a “0” on this scale, because they do not include a
comparison group and, thus, no context to judge program effectiveness. In this study, we only considered
evaluations that were rated at least a 1 on this scale.
Systematic review findings. Some studies examined specific deterrence while others addressed general
deterrence. Specific deterrence is the notion that individual offenders are less likely to commit future crime
because of experiencing punishment. General deterrence is the notion that others, or society at-large, will be
deterred from committing crime for fear of punishment.
Exhibit A3 lists the studies that met our minimum standard of rigor—rated as a 1 or higher on the rigor scale—to
be included in our meta-analysis. In addition to two rigorous studies that we found, both of which were natural
experiments, we also included the effect of our study in this report. We coded the coefficient from our preferred
multiple regression model using felony recidivism as the outcome.
Juveniles who were declined to the adult court were coded as the treatment group and youth who remained in
the juvenile justice system were coded as the comparison group. Thus, a positive effect size indicates an increase
in recidivism for youth who were declined and a negative effect size indicates a decrease in recidivism. The
weighted mean effect size for this group of studies was 0.190 (SE = 0.098, p-value = 0.052).
39
For a discussion of these methods, see Rhodes, W., Pelissier, B., Gaes, G., Saylor, W., Camp, S., & Wallace, S. (2001). Alternative solutions to
the problem of selection bias in an analysis of federal residential drug treatment programs. Evaluation Review, 25(3), 331-369.

23
Exhibit A3
Rigorous Studies Used in the Meta-Analysis
Author and
year of
publication
Description and methods Effect
size Full citation
Drake, 2013
This study uses a natural experiment
comparing recidivism rates of youth who
were automatically declined after the law
came into effect with youth who would have
been eligible had the law existed prior to that
time. Multiple regression mode analysis was
used to control for relevant observed
characteristics. Multiple sensitivity tests
demonstrated that recidivism is not lowered
for youth who are automatically declined
jurisdiction in the juvenile court.
0.214
Drake, E. (2013). The effectiveness of declining
juvenile court jurisdiction of youthful offenders
(Doc. No. 13-12-1901). Olympia: Washington
State Institute for Public Policy.
Fagan et al.,
2007
This study uses a natural experiment
comparing adolescent felony offenders
prosecuted in criminal court in New York City
to those charged in juvenile court in New
Jersey. The authors use criminal court cases
from three counties in New York and juvenile
court cases from three matched counties in
New Jersey. The authors use many multiple
regression models and control for relevant
case characteristics. They examine arrests
and incarcerations.
0.065
Fagan, J., Kupchick, A., & Liberman, A. (2007).
Be careful what you wish for: Legal sanctions
and public safety among adolescent offenders in
juvenile and criminal court. Public Law Research
Paper no. 03-61. Columbia Law School, New
York.
Fagan, 1995
This study uses a natural experiment
examining youth adjudicated in 1981 and
1982 in four counties within New York and
New Jersey. These cases were randomly
sampled from the population. Since this is a
metropolitan area that shares similar
demographic, social and cultural
commonalities, the author can compare
youth automatically transferred to adult court
in New York to equivalent youth who were
not transferred in New Jersey. The author
specifically looks at adolescents age 15-16
charged with robbery 1 & 2 and burglary 1.
He compares the recidivism rates in the four
counties. The author uses a proportional
hazard model for time to first re-arrest
controlling for sentence length.
0.188
Fagan, J. (1995). Separating the men from the
boys: The comparative advantage of juvenile
versus criminal court sanctions on recidivism
among adolescent felony offenders (NCJ No.
165071). In J. C. Howell, B. Krisberg, et. al.,
(Eds.), Sourcebook on serious, violent, and
chronic juvenile offenders (pp. 238-260).
Washington, DC: US Dept of Justice, National
Institute of Justice.

24
We reviewed six other studies that were commonly cited throughout the literature; however those studies did
not meet our minimum standard of rigor to be included in our meta-analysis. Exhibit A4 displays those studies
and the reason for exclusion. Typically, these studies had selection bias issues that would not allow us to
confidently attribute the causal effect of declining juveniles to the adult system on recidivism.
Exhibit A4
Citations and Summary of Studies Reviewed but not Included in the Analysis
due to Methodological Rigor
Author and
Year of
Publication
Description and Methods Reason for Exclusion Full Citation
Bishop et
al., 1996
The authors compare
recidivism rates of juvenile
offenders in Florida and
contemporaneously match
these offenders to
delinquents retained in the
juvenile system.
The transfer process is not
sufficiently described to
determine why some
offenders are transferred and
others are not. Thus, selection
bias is a threat to causality
even after observed variables
are controlled.
Bishop, D. M., Frazier, C. E.,
Lanza-Kaduce, L., & Winner, L.
(1996). The transfer of juveniles
to criminal court: Does it make
a difference? Crime &
Delinquency, 42(2), 171-191.
Jordan,
2011
Youth in Pennsylvania are
automatically waived to adult
court based on age and
offense criteria. Youth may be
decertified by a judge
(reverse waived) back to
juvenile court. Out of 308
youth, 173 were retained in
adult court and 135 were
decertified to juvenile court.
The authors use propensity
score matching on observed
characteristics to match the
contemporaneous groups
(waived and reverse waived
youth). This technique does
not fully account for the
unobserved selection bias of
the youth who were reverse
waived back to juvenile court.
Jordan, K. L. (2012). Juvenile
transfer and recidivism: A
propensity score matching
approach. Journal of Crime and
Justice, 35(1), 53-67.
Lanza-
Kaduce et
al., 2005
The authors examine adult
felony recidivism for 475
matched pairs in Florida,
comparing juveniles
transferred to adult court and
those retained in the juvenile
justice system.
The authors do not explain
why some juveniles were not
transferred to criminal courts.
Although the authors control
for various case
characteristics, they do not
control for unobservable
variables, such as the reasons
that prompt prosecutors to
apply for transfer. There may
be inherent differences
between the treatment and
control group that are not
accounted for.
Lanza-Kaduce, L., Lane, J.,
Bishop, D. M., & Frazier, C. E.
(2005). Juvenile offenders and
adult felony recidivism: The
impact of transfer. Journal of
Crime & Justice, 28(1), 59-77.

25
Exhibit A4, cont.
Author and
Year of
Publication
Description and Methods Reason for Exclusion Full Citation
Loughran
et al., 2010
The authors examine 654
youths between the ages of
14 and 17 in Maricopa
County, Arizona. Authors use
propensity score matching for
transferred and non-
transferred youths. The
transfer process for youths
can be judicial, prosecutorial,
or statutory.
Authors use propensity score
matching on
contemporaneous study
groups. This technique does
not fully account for selection
bias that threatens causality.
Loughran, T. A., Mulvey, E. P.,
Schubert, C. A., Chassin, L. A.,
Losoya, S., Steinberg, L., . . .
Cauffman, E. (2010). Differential
effects of adult court transfer
on juvenile offender recidivism.
Law and Human Behavior, 34(6),
476-488.
Myers,
2003
The authors evaluate the
discretionary waiver of youth
processed in 1994 in
Pennsylvania, prior to the
implementation of a new law
on statutory waivers. The
authors perform a control
function approach where the
residuals from first stage
equation are used as a
control variable in the second
stage equation.
The control function requires
the use of an instrumental
variable, which is not included
in the authors’ regression
model.
Myers, D.L. (2003). The
recidivism of violent youths in
juvenile and adult court: A
consideration of selection bias.
Youth Violence and Juvenile
Justice 1(1), 79-101.
Podkopacz
& Feld,
1996
The authors analyze 330
transfer motions from 1986 to
1992, examining the
recidivism of transferred
youth in Hennepin County,
Minnesota.
This study is not an outcome
evaluation with a valid
comparison group. The aim of
the article is to determine the
characteristics that influence
the judicial waiver decision
with a brief analysis on
recidivism without any
statistical controls.
Podkopacz, M. R., & Feld, B. C.
(1996). The end of the line: An
empirical study of judicial
waiver. The Journal of Criminal
Law and Criminology, 86(2),
449-492.

26
We also examined studies that measure the effect of juvenile decline laws on general deterrence. Unfortunately,
however, there were only three such studies and none were sufficiently rigorous or provided enough information
to code these studies and conduct a meta-analysis.
Exhibit A5
General Deterrence Studies Reviewed but not Included in the Analysis
due to Methodological Rigor
Author and
year of
publication
Description and methods Reason for exclusion Full citation
Jensen &
Metsger,
1994
Authors do time-series analysis
in Idaho to test general
deterrence of juvenile waiver
laws in Montana and Wyoming
as a comparison state.
The authors include three
control variables; however the
relevance of those variables is
questionable (infant mortality
as a measure of economic
deprivation, population under
age 18, and the number of
agencies reporting UCR
crime).
Jensen, E. L., & Metsger, L. K.
(1994). A test of the deterrent
effect of legislative waiver on
violent juvenile crime. Crime &
Delinquency, 40(1), 96-104.
Singer &
McDowall,
1988
The authors use a time series
analysis for before and after
New York's Juvenile Offender
Law of 1978 was implemented.
They examine the impact on
crime rates, specifically looking
at juvenile arrest rates.
The authors disaggregate the
results, but do not provide
the number of juveniles. Thus,
there is not enough
information to code an effect
size.
Singer, S. I., & McDowall, D.
(1988). Criminalizing
delinquency: The deterrent
effects of the New York Juvenile
Offender Law. Law and Society
Review, 22(3), 521-535.
Steiner &
Wright, 2006
The authors use a multiple
interrupted time series model
using 14 states' monthly
juvenile arrest rates (violent
index crimes). They examine
the data five years before and
five years after laws of
automatic decline of jurisdiction
are implemented. The authors
use an ARIMA model, which
controls for serial dependence.
The authors do not include
control variables in their
analysis. Further, they do not
provide enough information
to code an effect size.
Steiner, B., & Wright, E. (2006).
Assessing the relative effects of
state direct file waiver laws on
violent juvenile crime:
Deterrence or irrelevance. The
Journal of Criminal Law &
Criminology, 96(4).
Risler et al.,
1998
The authors examine mean
arrest rates before and after the
Georgia Legislative Waiver was
implemented.
The authors do not use any
control variables.
Risler, E. A., Sweatman, T., &
Nackerud, L. (1998). Evaluating
the Georgia legislative waiver's
effectiveness in deterring
juvenile crime. Research on Social
Work Practice, 8(6), 657-667.

27
B. Benefit-Cost
We include estimates of the long-term benefits and costs of programs and policies. In most cases, this involves
WSIPP projections well into the future. Projections are necessary, because most evidence about programs comes
from evaluations with relatively short follow-up periods. It is rare to find longitudinal program evaluations. This
problem, of course, is not unique to public programs. Most private investment decisions are based on past
performance, and future results are projected by entrepreneurs or investment advisors based on certain
assumptions. We adopt that private-sector investment approach in this model. We forecast, using a consistent
and empirically based framework, the long-term benefits and costs of programs and policies. We then assess
the riskiness of the projections.
At this time, we are unable to estimate the full benefits and costs of the law to automatically decline youth from
the juvenile court. Our estimates only include the meta-analytic findings from our specific deterrent effect. We
are not able to estimate the benefits and costs of incapacitation and general deterrence.
Three Perspectives on Benefits and Costs. We present these monetary estimates from three distinct perspectives:
the benefits that accrue solely to program participants, those received by taxpayers, and any other measurable
(non-participant and non-taxpayer) monetary benefits. The sum of these three perspectives provides a “total
Washington” view on whether a program produces benefits that exceed costs. Restricting the focus solely to the
taxpayer perspective can also be useful for certain fiscal analysis and state budget preparation.
Criminal Justice System Resources. Calculating the monetary value of benefits from a reduction in crime requires
the estimation of several essential elements. The four essential elements necessary for WSIPP to conduct its
benefit-cost analysis of criminal justice programs include the estimation of:
1. Risk of reconviction. We estimate the risk of being reconvicted of a crime for program participants
relative to a base population of offenders who do not participate in the evidence-based program. These
avoided crimes are estimated using criminal recidivism data from a base population of offenders who
did not participate in the evidence-based program. Combining the effect size with criminal recidivism
information from the untreated offenders allows us to estimate and compare the cumulative recidivism
rates of offenders who participated in the evidence-based program with offenders who did not
participate.
2. Criminal justice system response. We estimate the criminal justice system’s response to crime and the
resources used when crime occurs. We estimate the volume of crime that comes to the attention of the
criminal justice system. Then, in conjunction with the program effect size, we estimate how much crime
is avoided and the monetary benefits to taxpayers that result from this avoidance. For criminal justice
system resources, such as police, courts, and prison, we estimate the frequency and duration of
utilization for each resource affected. For example, if a conviction occurs, we estimate the probability
that a certain type of offense (e.g., rape) results in a certain type of sanction (e.g., prison or probation)
and the average length of time the sanction will be used.
3. Crimes in Washington. We estimate the total crime that occurs in Washington State including both
crimes reported and not reported to the police to estimate the true impact of evidence-based programs
on crime. To do this, we estimate the total number of crimes that occur statewide in Washington. We
scale-up statewide reported crimes to include crimes that do not necessarily result in a conviction, which
includes crimes that were not reported to the police. From this, we estimate the total number of crimes
that occur per conviction. This number is used in conjunction with recidivism data from the offender
base population described previously to estimate the total number of crimes per conviction.
4. Costs. Costs for each criminal justice system resource, victimization costs, and evidence-based program
costs are estimated. The costs paid by taxpayers for each significant part of the local and state criminal
justice system, such as police and sheriffs, superior courts and county prosecutors, local juvenile

28
detention facilities, local adult jails, state juvenile rehabilitation, and state adult corrections agencies,
were estimated. Marginal operating costs were estimated for these components as well as annualized
capital costs, when applicable.
Cost Inputs. To conduct a benefit-cost analysis of declining jurisdiction of the juvenile court, we needed to
estimate the cost of incarcerating a youth—the equivalent to a program cost. Under current policy, youth who
are declined are under the jurisdiction of DOC, but housed at JRA until the age of 18 or, in some instances, the
age of 21. We communicated with DOC, JRA, and legislative staff to estimate the cost of the program. JRA
receives funding for declined youth as part of their budget. These youth are included in the forecasted JRA
population. Thus, the cost for these youth is $37,000 per offender per year.40
In addition to the base cost to
house declined youth, DOC reimburses JRA for the cost of any special or extraordinary medical services, legal
services and three full-time equivalent JRA staff dedicated to the Youthful Offender Program.41
DOC also has
1.65 full-time equivalent staff dedicated to managing the Youthful Offender Program. These additional costs,
divided by the average daily population in Fiscal Year 2013 equal $6,726 per youth. Thus, the total cost per
youth per year is $43,726. Because declined youth are incarcerated for 1.66 years longer than youth who are not
declined (20 months), this translates to $72,585 per declined youth.
40
Correspondence with Mary Mulholland from the Office of Program Research, House of Representatives. 41
Correspondence with Jennifer Redman, Youthful Offender Program, Juvenile Rehabilitation Administration.

29
III. Recidivism Trends in Washington State
To provide context to this report, we analyzed historical recidivism trends for youth in the juvenile justice system.
We analyzed data for three populations: youth releasing from JRA, youth sentenced to detention, and youth
sentenced to probation. Youth were at-risk for 36-months after release from JRA or upon adjudication if not
confined. We analyzed total recidivism (including felony and misdemeanor), felony recidivism, and violent felony
recidivism.
0%
10%
20%
30%
40%
50%
60%
70%
80%
90%
1992 1996 2000 2004 2008
Reci
div
ism
Rate
Fiscal Year At-Risk
JRA
Detention
Probation
0%
10%
20%
30%
40%
50%
60%
70%
80%
90%
1992 1996 2000 2004 2008
Reci
div
ism
Rate
Fiscal Year At-Risk
JRA
Detention
Probation
0%
10%
20%
30%
40%
50%
60%
70%
80%
90%
1992 1996 2000 2004 2008
Reci
div
ism
Rate
Fiscal Year At-Risk
JRA
Detention
Probation
Total Recidivism
Felony Recidivism
Violent Felony Recidivism
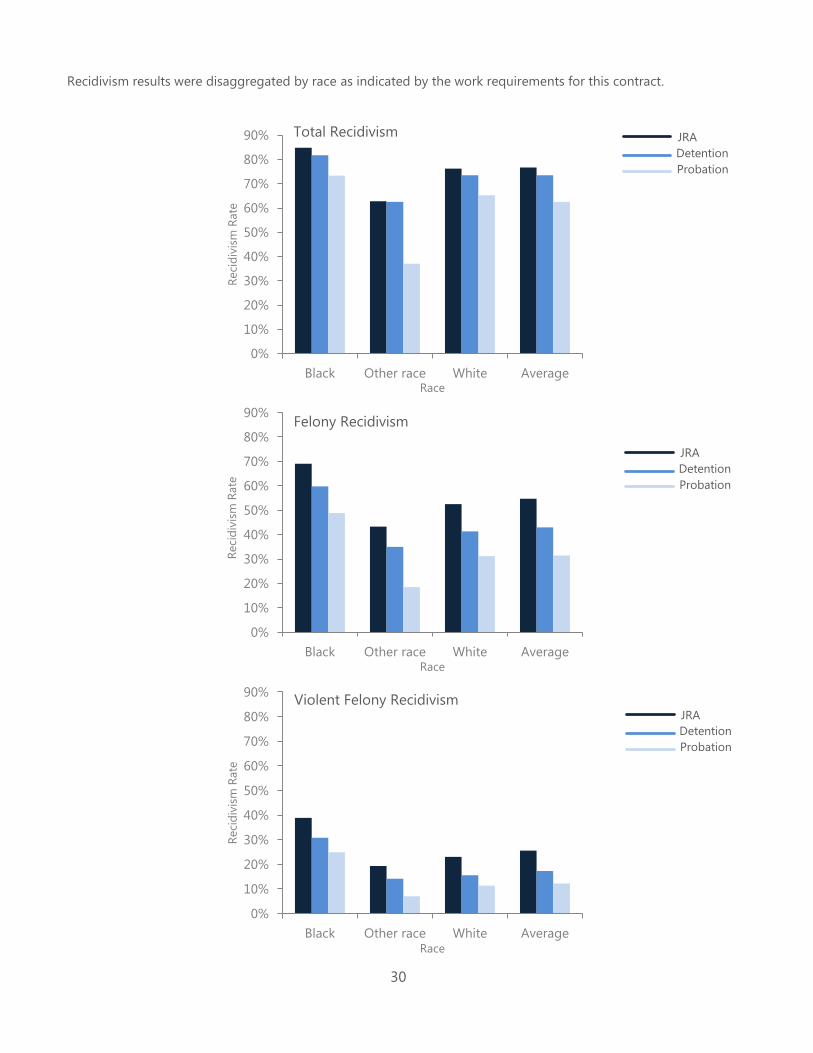
30
Recidivism results were disaggregated by race as indicated by the work requirements for this contract.
0%
10%
20%
30%
40%
50%
60%
70%
80%
90%
Black Other race White Average
Reci
div
ism
Rate
Race
0%
10%
20%
30%
40%
50%
60%
70%
80%
90%
Black Other race White Average
Reci
div
ism
Rate
Race
0%
10%
20%
30%
40%
50%
60%
70%
80%
90%
Black Other race White Average
Reci
div
ism
Rate
Race
Total Recidivism
Felony Recidivism
Violent Felony Recidivism
JRA
Detention
Probation
JRA
Detention
Probation
JRA
Detention
Probation

31
IV. Treatment
As part of the work requirements for this contract, we examined whether juveniles who were declined jurisdiction
received treatment programs at the Department of Corrections (DOC).42
We received data through a special
request from DOC.
Using data from the outcome evaluation reported in Section II of this report, we were able to determine how
many youth who were physically located in DOC facilities and participated in treatment programs. Of the 770
automatically declined youth, 750 youth were found in DOC's database. Ninety percent of those youth were in
prison and the remaining 10% were supervised in the community.
Of the 750 automatically declined youth found in DOC's database, 78% were determined to have participated in
some programming while in custody of DOC. It should be noted that 40% of the youth who were determined
not to have participated in any programming were released from DOC custody prior to 1999 which is when DOC
had the ability to electronically capture programming data in their data system.
Of the youth who participated in a program, 92% participated in more than one program (up to five programs).
Displayed below are the percentages of youth participating in programs by the type of program.
Program Percentage Participating
Chemical dependency 5%
Education 85%
Offender change 76%
Vocational 53%
Work 88%
Total youth participating 585
Description of Programs
Chemical dependency includes inpatient, outpatient, and therapeutic communities.
Education includes the Youthful Offender Program high school diploma program, basic skills programs,
job readiness, and English as a second language.
Offender change includes stress and anger management, victim awareness, job hunter, and parenting
skills.
Vocation includes Youthful Offender Program vocational grant as well as a variety of vocational training
including information technology, electronic systems, math for the trades, and building maintenance.
Work includes institutional support jobs such as food service, custodian, forestry, and work crews.
42
Prior to 2004, JRA did not have an automated tracking system; thus, treatment/program data were not available for youth in our study.
Although these data were not available, it should be noted, however, that Washington state law requires that education be provided to
common school age children who are confined (see, for example, RCW 28A.190, RCW 28A.193, and 28A.194).

32
W a s h i n g t o n S t a t e I n s t i t u t e f o r P u b l i c P o l i c y
The Washington State Legislature created the Washington State Institute for Public Policy in 1983. A Board of Directors—representing the legislature, the
governor, and public universities—governs the Institute and guides the development of all activities. The Institute’s mission is to carry out practical research,
at legislative direction, on issues of importance to Washington State.
For further information, contact:
Elizabeth Drake at 360.586.2767, [email protected] Document No. 13-12-1902
Related Documents