Egyptian J. Nutrition and Feeds (2021), 24(1): 55-76 Issued by The Egyptian Society of Nutrition and Feeds THE EFFECT OF YEAST (SACCHAROMYCES CEREVISAE), GARLIC (ALLIUM SATIVUM) AND THEIR COMBINATION AS FEED ADDITIVES IN FINISHING DIETS ON THE PERFORMANCE, RUMINAL FERMENTATION, AND IMMUNE STATUS OF LAMBS K.Z. Kewan 1 ; M. M. Ali 2 ; B.M. Ahmed 2 ; Sara, A. El-Kolty 2 ; U. A. Nayel 2 1 Department of Animal and Poultry Production, Desert Research Center, Cairo, Egypt, 2 Department of Animal Production, Faculty of Agriculture, Menoufia University, Egypt. Corresponding author: [email protected] (Received 6/1/2021, accepted 21/2/2021) SUMMARY our groups of male lambs (seven animals/ group) were used to study the effect of natural (garlic powder; Allium sativum) and biological (dry yeast; Saccharomyces cerevisiae) additives and their combination in finishing diets as compared to control diet on feed utilization and animal performance. Animals were 8 months of age and 35.8kg ± 0. 41 as average body weight. Animals were fed a basal diet including concentrate feed mixture (CFM) at level of 70% of total requirement and berseem hay (BH) was offered ad lib. The experimental diets were: 1) a basal diet without additive (control), (C); 2) a basal diet supplemented with 6g dry yeast (2.44x10 11 cfu/g)/head/day, (Y); 3) a basal diet supplemented with 40g garlic powder/head/day, (G), and 4) a basal diet supplemented with 3g dry yeast plus 20g garlic powder/head/day, (YG). The results revealed that all feed additive treatments showed higher (P<0.05) digestibility values of DM, OM, CP, CF and NFE, than non-additive diet (C). The highest (P<0.05) values were observed for animals fed G diet; however, C group showed the lowest (P<0.05) digestibility values. The G diet showed the highest (P<0.05) value of TDN% (73.56%) and C showed the lowest one (69.20%). However, the DCP% was not affected (P<0.05) by additives and its values ranged between 11.81 and 12.27%. Animals fed enriched diets (Y, G and YG) showed higher ADG (180, 184 and 186 g/d, respectively) compared to control group (160g/d). Additives have no significant effect on feed intake either in the form of CFM or the roughage and consequently the total feed intake. All feed additives and their combination significantly (P<0.05) enhanced, with the same extent, the feed efficiency indicators of the enriched diets compared with control one. Yeast/garlic combined addition revealed the highest daily profit percentage relative to control (42%) followed by garlic (34.0%) and then yeast alone (31%) treatments. Energy utilization was significantly different (P<0.05) between the test groups where, the G group showed the highest values, but C group was the lowest values. When the combined additive (YG) was supplemented, N balance exhibited 15.2% increase above the control group. The concentration of blood immunoglobulins (IgA) and IgG differed (P <0.05) among groups being their concentration were enhanced by the respective additives. It could be concluded that using feed additive such as dry yeast (6 gm/h/d) or garlic powder (40 gm/h/d) or their combination (3gm plus 20 gm, respectively) in finishing diets of lamb tended to increase digestibility coefficients for most of nutrients, increasing nutritive value as TDN and appeared to increase the daily gain as well as enhanced the immune status of animals. Keywords: Yeast, garlic, lambs, performance, in vitro, fermentation and blood. INTRODUCTION The ruminant livestock industry plays a major role in the production of both of meat and milk as a key source of protein for human consumption. Sheep worldwide are mostly owned by poor rural families who lack modern management skills, and thus have poor feeding and housing practices with insufficient adoption of technologies which are important to improve productivity. Various dietary additives are widely used in ruminant diets modulate rumen metabolism, which ultimately improves nutrient use and animal performance. Enhancing feed quality and utilization by using certain feed additives may be considered a partial vertical solution to the problem of negative feed balance of total digestible nutrients F

Welcome message from author
This document is posted to help you gain knowledge. Please leave a comment to let me know what you think about it! Share it to your friends and learn new things together.
Transcript

Egyptian J. Nutrition and Feeds (2021), 24(1): 55-76
Issued by The Egyptian Society of Nutrition and Feeds
THE EFFECT OF YEAST (SACCHAROMYCES CEREVISAE), GARLIC
(ALLIUM SATIVUM) AND THEIR COMBINATION AS FEED ADDITIVES IN
FINISHING DIETS ON THE PERFORMANCE, RUMINAL FERMENTATION,
AND IMMUNE STATUS OF LAMBS
K.Z. Kewan1; M. M. Ali
2; B.M. Ahmed
2; Sara, A. El-Kolty
2; U. A. Nayel
2
1Department of Animal and Poultry Production, Desert Research Center, Cairo, Egypt,
2Department of Animal Production, Faculty of Agriculture, Menoufia University, Egypt.
Corresponding author: [email protected]
(Received 6/1/2021, accepted 21/2/2021)
SUMMARY
our groups of male lambs (seven animals/ group) were used to study the effect of natural (garlic
powder; Allium sativum) and biological (dry yeast; Saccharomyces cerevisiae) additives and their
combination in finishing diets as compared to control diet on feed utilization and animal
performance. Animals were 8 months of age and 35.8kg ± 0. 41 as average body weight. Animals were fed a
basal diet including concentrate feed mixture (CFM) at level of 70% of total requirement and berseem hay
(BH) was offered ad lib. The experimental diets were: 1) a basal diet without additive (control), (C); 2) a
basal diet supplemented with 6g dry yeast (2.44x10¹¹cfu/g)/head/day, (Y); 3) a basal diet supplemented with
40g garlic powder/head/day, (G), and 4) a basal diet supplemented with 3g dry yeast plus 20g garlic
powder/head/day, (YG). The results revealed that all feed additive treatments showed higher (P<0.05)
digestibility values of DM, OM, CP, CF and NFE, than non-additive diet (C). The highest (P<0.05) values
were observed for animals fed G diet; however, C group showed the lowest (P<0.05) digestibility values. The
G diet showed the highest (P<0.05) value of TDN% (73.56%) and C showed the lowest one (69.20%).
However, the DCP% was not affected (P<0.05) by additives and its values ranged between 11.81 and
12.27%. Animals fed enriched diets (Y, G and YG) showed higher ADG (180, 184 and 186 g/d, respectively)
compared to control group (160g/d). Additives have no significant effect on feed intake either in the form of
CFM or the roughage and consequently the total feed intake. All feed additives and their combination
significantly (P<0.05) enhanced, with the same extent, the feed efficiency indicators of the enriched diets
compared with control one. Yeast/garlic combined addition revealed the highest daily profit percentage
relative to control (42%) followed by garlic (34.0%) and then yeast alone (31%) treatments. Energy
utilization was significantly different (P<0.05) between the test groups where, the G group showed the
highest values, but C group was the lowest values. When the combined additive (YG) was supplemented, N
balance exhibited 15.2% increase above the control group. The concentration of blood immunoglobulins
(IgA) and IgG differed (P <0.05) among groups being their concentration were enhanced by the respective
additives. It could be concluded that using feed additive such as dry yeast (6 gm/h/d) or garlic powder (40
gm/h/d) or their combination (3gm plus 20 gm, respectively) in finishing diets of lamb tended to increase
digestibility coefficients for most of nutrients, increasing nutritive value as TDN and appeared to increase the
daily gain as well as enhanced the immune status of animals.
Keywords: Yeast, garlic, lambs, performance, in vitro, fermentation and blood.
INTRODUCTION
The ruminant livestock industry plays a major role in the production of both of meat and milk as a key
source of protein for human consumption. Sheep worldwide are mostly owned by poor rural families who
lack modern management skills, and thus have poor feeding and housing practices with insufficient
adoption of technologies which are important to improve productivity. Various dietary additives are
widely used in ruminant diets modulate rumen metabolism, which ultimately improves nutrient use and
animal performance. Enhancing feed quality and utilization by using certain feed additives may be
considered a partial vertical solution to the problem of negative feed balance of total digestible nutrients
F

Kewan et al.
56
(TDN) and digestible crude protein (DCP) which stated for a long period in the animal production sector
of Egypt. There is need to save about 3.4 million tons of TDN over the total actual amount produced (9.6
million tons) to cover that required (13.0 million tons) as reported by Alnaimy et al. (2017).
Many workers applied chemical substances (antibiotics and hormones) as growth promoters in animal
feeding to enhance the growth rate and to provide significant economic income. Using Herbs, spices,
have received greater attention as potential alternatives to antibiotic growth promotants, since they are
considered as natural products (Abd El-Latif et al., 2019). There are numerous investigations that focused
on utilization of natural plant as feed additives in animals (Frankic et al., 2009). The addition of herbal
additives to animals feed can also help stimulate the immune response (Khosravi et al., 2010) and
improve digestibility of the feedstock, thereby enhancing quality of locally available feed source which in
turn, helps to increase the production of sheep in our country. Among the well-known herbal additives
include garlic which is small herbal plant of 30 to 50cm height and belongs to the Amaryllidaceae family.
Garlic has many medicinal properties and is known to improve the immune system. Garlic (Allium
sativum) has ant-imicrobial, anti-oxidant, and anti-hypertensive properties and has been used as a flavor
in the animal nutrition industry (Rivlin, 2001 and Sivam, 2001).
There is no study focused on the impacts of yeast and garlic powder together on the rumen
fermentation patterns and nutrient digestibility. It was hypothesized that the combination of both products
may have an additive effect on stimulating fermentation and digestion of plant cells in the rumen. So the
main research objective of this study is to examine the effect of yeast or garlic powder and combination
of both as additives on lamb performance. The specific objectives of this study were to evaluate growth
response of finishing lambs as well as economic efficiency; to evaluate the apparent digestibility of
nutrients and rumen fermentation in lambs fed diets supplemented with yeast and/or garlic powder and to
assess the impacts of feed additives on the immune status of animals.
MATERIALS AND METHODS
The farm experiment and the lab work were carried out at Animal Production Department, Faculty of
Agriculture, Menoufia University, and the part of the fermentation study was accomplished at Maryout
Research Station, Desert Research Center, Ministry of Agriculture.
Growth trial:
A complete randomized block design was followed in a growth trial for twenty-four male lambs
which were divided into four groups (seven lambs/ group). Each group was housed in three pens and
distributed as follows: 2, 2, and 3 lambs/pen. Animals were 8 months of age with an average body weight of 35.8kg (± 0. 41 SE). Animals were
weighted weekly before morning feeding. Animals were fed a basal diet (control) including concentrate
feed mixture (CFM) at level of 70% of total requirement of growth as recommended by NRC (1985) and
berseem hay (BH) was offered ad lib. The control ration was offered to the first group without additives,
while the other three experimental groups received the control ration supplemented with dry yeast and/or
garlic powder. The investigational diets were: 1) a basal diet without additive (control), (C); 2) a basal
diet supplemented with 6g dry yeast (2.44x10¹¹
cfu/g)/head/day, (Y); 3) a basal diet supplemented with
40g garlic powder/head/day, (G), and 4) a basal diet supplemented with 3g dry yeast plus 20g garlic
powder/head/day, (YG). The concentrate feed mixture was formulated as follows: yellow corn 50%,
cotton seed meal 25.0%, wheat bran 22.0%, limestone 1.6%, common salt 1.0%, mineral and vitamin
mixture 0.4%. The amount of CFM was offered daily in two portions at 09:00 AM and 17:00 PM;
however, water was available for animals all times throughout the experiment.
Immunological blood parameters for lambs:
Blood samples were collected in two tubes before feeding via the jugular vein from each lamb. The
first tube to separate the blood plasma so it contains ethylene tetra acetic acid (EDTA) to prevent blood
clotting to the white blood cell (WBC’s) count (Kolmer et al., 1951). The other tube for separating blood
serum so it was without anti-coagulant and centrifuged 2h after collection at 3500 rpm for 20 minutes,
then analyzed for immunoglobulin A (IgA) and immunoglobulin G (IgG) using enzyme-linked
immunosorbent assay method (Thomas, 1998).

Egyptian J. Nutrition and Feeds (2021)
57
Economic indicators:
Market prices in 2019 were used to calculate the economic indicators expressed in Egyptian pounds
(L.E.). The prices were assigned as follows; Berseem hay L.E. 2900/ton; concentrate feed mixture L.E.
4500/ton; dry yeast L.E. 22/ kg; garlic powder L.E. 35/ kg and live body weight L.E. 60/ kg.
Digestibility, nitrogen balance, and water metabolism trials:
Twelve adult rams (50.41kg±0.61) were placed in individual metabolic cages (1.6 m x 0.53 m) and
offered the same previous four rations (3 rams/ rations) for two weeks as an adaptation period followed
by a week-long collection period. Water was offered twice daily, and water intake was recorded. Daily
excreted feces from each animal were collected. Exactly 20% of the weight-based samples were taken
and dried at 60 ºC for 72 hours. Urine was collected daily in plastic jars, acidified (using 100 ml of 4N
H2SO4), measured and 10% of the volume was sampled for nitrogen determination. Feed and fecal
samples were ground through a 1 mm sieve on a Wiley mill grinder and sub samples were taken for each
animal for subsequent analysis. Feed and fecal samples were analyzed for dry matter (DM), crude protein
(CP), crude fiber (CF), ether extract (EE) and ash. Urine samples were analyzed for nitrogen (N) content
accordance with the AOAC (2005). During the collection period, free drinking water intake was recorded.
Daily water excretion through feces and urine were estimated. Data of water intake and excretion were
related to the live body mass (BW0.82
) of the animals as advised by Macfarlane and Howard (1970).
Rumen fermentation trials:
Four adult rumen-cannulated Barki rams with an average body weight of 47.9.0 ±1.7 kg were
arranged in Latin square design for four periods (15days each) to study the effect of experimental diets on
the deferential protozoal count and other fermentation criteria. Ruminal contents were sampled at zero, 3,
6 and 12h post-morning feeding to record the pH and determine concentration of NH3-N, and volatile
fatty acid (VFA). Ruminal pH was immediately measured using a digital pH meter (WPA CD70).
Samples of rumen fluid were analyzed for ammonia-nitrogen (NH3-N) according to Preston (1995). Total
volatile fatty acids (TVFAs) were determined using steam distillation method described in Warner
(1964).
Apart from the collected sample at zero time were immediately flittered through one layer of gauze,
then fixed and stained with 4 times the volume of salt solution of green-methyl formalin as described by
Ogimoto and Imai (1981), then stored in a dark place until examination. Subsequent identification of
genera and protozoa species was followed as described in Dehority (1993).
The in vitro gas production technique was used to estimate in vitro degradation of both DM and OM
(IVDMD & IVOMD), as well as methane production for experimental regimes (as total mixed rations).
Ruminal content (50:50 v/v) collected via cannula was squeezed through four-layered cheesecloth and the
filtrate liquid was incubated in a water bath at 39 °C saturated with CO2 until further inoculation. The
incubation medium was prepared according to Menke et al. (1979) description. Each 200 mg DM sample
was incubated in 100-mL glass serum bottles where 30 mL of the incubation medium was added. The
samples were incubated in triplicate and the cumulated gas production was monitored 3, 6, 12, 24, and
48h post incubation. Three bottles containing rumen juice and artificial saliva without sample were used
as blank to correct for gas production values released from rumen contents.
Data on gas production were adapted for to the following model from France et al. (2000): A = b × [1
– e–k (t – L
)], Where: A is the volume of gas production at time t; b is the asymptotic gas production (based
on mL/200 mg DM); k is the rate of gas production per hour from the slowly fermentable feed fraction b;
and L is the discrete lag time prior to gas production.
The partitioning factor (PF) was calculated as the ratio between the true digested DM (mg) to the
volume of gas (mL in 24 h).
IVDMD and IVOMD were determined after terminal of each incubation time by recovery of the
undigested fraction. The true degradability of DM and OM (TDDM & TDOM) was determined at 24h
after reflux residual content with a 50 mL neutral detergent solution for 3h at 105°C. After recording the
final gas volume at 24h of incubation, 4 ml NaOH (10 M) was injected in each bottle to measure methane
volume as described by Demeyer et al. (1988).
The microbial protein (MCP) was calculated in accordance with Czerkawaski (1986), where 19.3 g
microbial nitrogen produced per kg TDOM.
Kewan et al.
58
Calculations and statistical analysis:
Growth energy (GE) and digestible energy (DE) for the tested rations were calculated by equations
reported by Nehring and Haenlien (1973) as follows:
GE (M cal/kg DM) = 5.72 CP + 9.50 EE + 4.79 CF + 4.03 NFE
DE (M cal /kg DM) = 5.72 DCP + 9.05 DEE + 4.8 DCF + 4.06 DNFE
Metabolizable energy (ME) was calculated as DE X 0.82 (NRC, 1985). The net energy for
maintenance (NEm) or growth (NEg) was computed as outlined by Rattray et al. (1973).
NEm = 0.79 ME - 0.4 ; NEg = 0.58 ME - 0.52
Data of growth and digestibility trials were analyzed using Statistical Analytical System (SAS, 2002),
Version, 9.3.1, according to the General Linear Model as a completely randomized design with animals as
block. The model of statistics was the following: Yij = µ + Ti + eij
Where: Yij = the observation; µ = Overall mean; Ti = the fixed effect of the treatments; eij = Random error
component assumed to be normally distributed.
The statistical model associated with a Latin square design for the fermentation trials is:
Yijk = µ + αi + Tj + βk + εijk ; Where µ is the baseline mean, αi is the block effect associated with row i, βk
is the block effect associated with column k, Tj is the jth
treatment effect, and εijk is a random error.
The Duncan multiple range test was performed (Duncan, 1955) to detect significant differences among
means.
RESULTS AND DISCUSSION
Chemical composition of feeds and experimental feed additives:
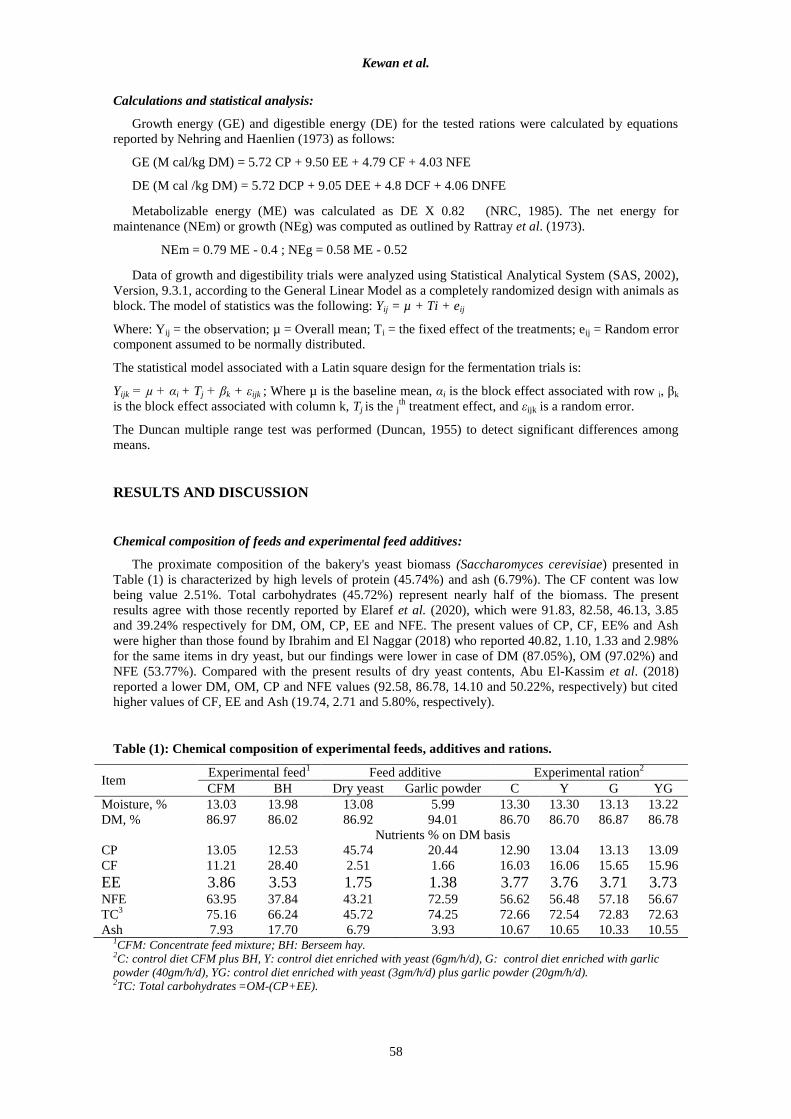
The proximate composition of the bakery's yeast biomass (Saccharomyces cerevisiae) presented in
Table (1) is characterized by high levels of protein (45.74%) and ash (6.79%). The CF content was low
being value 2.51%. Total carbohydrates (45.72%) represent nearly half of the biomass. The present
results agree with those recently reported by Elaref et al. (2020), which were 91.83, 82.58, 46.13, 3.85
and 39.24% respectively for DM, OM, CP, EE and NFE. The present values of CP, CF, EE% and Ash
were higher than those found by Ibrahim and El Naggar (2018) who reported 40.82, 1.10, 1.33 and 2.98%
for the same items in dry yeast, but our findings were lower in case of DM (87.05%), OM (97.02%) and
NFE (53.77%). Compared with the present results of dry yeast contents, Abu El-Kassim et al. (2018)
reported a lower DM, OM, CP and NFE values (92.58, 86.78, 14.10 and 50.22%, respectively) but cited
higher values of CF, EE and Ash (19.74, 2.71 and 5.80%, respectively).
Table (1): Chemical composition of experimental feeds, additives and rations.
Item Experimental feed
1 Feed additive Experimental ration
2
CFM BH Dry yeast Garlic powder C Y G YG
Moisture, % 13.03 13.98 13.08 5.99 13.30 13.30 13.13 13.22
DM, % 86.97 86.02 86.92 94.01 86.70 86.70 86.87 86.78
Nutrients % on DM basis
CP 13.05 12.53 45.74 20.44 12.90 13.04 13.13 13.09
CF 11.21 28.40 2.51 1.66 16.03 16.06 15.65 15.96
EE 3.86 3.53 1.75 1.38 3.77 3.76 3.71 3.73 NFE 63.95 37.84 43.21 72.59 56.62 56.48 57.18 56.67
TC3
75.16 66.24 45.72 74.25 72.66 72.54 72.83 72.63
Ash 7.93 17.70 6.79 3.93 10.67 10.65 10.33 10.55 1CFM: Concentrate feed mixture; BH: Berseem hay. 2C: control diet CFM plus BH, Y: control diet enriched with yeast (6gm/h/d), G: control diet enriched with garlic
powder (40gm/h/d), YG: control diet enriched with yeast (3gm/h/d) plus garlic powder (20gm/h/d). 2TC: Total carbohydrates =OM-(CP+EE).

Egyptian J. Nutrition and Feeds (2021)
59
The chemical composition of garlic powder (Local market product) is shown in Table (1). The results
are similar to the earlier results of Otunola et al. (2010), where moisture, CP, EE, CF, total carbohydrates
and ash contents in garlic sample were 4.55, 15.33, 0.72, 2.10, 73.22 and 4.08% respectively on dry basis
(95.45%). Petropoulos, et al. (2018) studied 14 Greek garlic genotypes, and they detected significant
differences in nutrients contents. The range values on DM basis were calculated to be 31.67- 42.64% DM,
3.59-5.73% Ash, 10.83-22.85% CP, 0.28-1.10% Fat, 70.93-84.50% carbohydrate, 94.27-96.41% OM and
3821-3901 Kcal/kg DM as an energy content. Garlic is relatively high in CP (20.44%), which is close to
that declared by Sahli et al. (2018) which found a value of 22.9% and 18.8%, respectively. However, Abu
El-Kassim et al. (2018) reported a lower CP value (14.10%). Garlic contained appreciable amounts of
carbohydrates and protein and these results emphasize that it can be classified as carbohydrate and
protein-rich spice (Abayomi et al., 2018). Furthermore, the high CP content of garlic was due to the
presence of active metabolites such as allicin, ajoene and capsaicin as reported earlier by Dashak et al.
(2001). The herein values from this study were higher than those reported for moisture and CP at 4.88 and
17.35% respectively by Nwinuka et al. (2005) and similar to the values of 73.03, 0.68, 4.06% reported for
carbohydrate, ether extract and ash contents, respectively by the same authors. The result is in
disagreement with the reports from Mariam and Devi (2016) who stated that, garlic contains 3.91%
moisture, 19.75% CP, 0.49% EE, 1.73% CF, 66.36% carbohydrate and 3.39% ash on dry matter basis.
Observed differences in chemical composition compared to literature may be related to genetic varieties
and possibly to substrate analyzed mainly for cell wall. Furthermore, Petropoulos et al., (2018), indicated
that apart from the genotype, both of growing conditions and cultivating practices also have a significant
impact on the feeding value of garlic bulbs. In addition, plant density, fertilizer application rate and soil
type have been reported to significantly affect the protein content of garlic bulbs (Diriba-Shiferaw et al.,
2014).
Animal performance and economic indicators:
The ADG values revealed significant (P<0.05) differences across experimental groups (Table 2),
where animal groups fed enrichment diets (Y, G and YG) showed higher values compared to control
group (160 g/d) but on the same time the treated groups were comparable between each other. Relative to
control group, the feed additives improved ADG by 12.5, 15.0 and 16.25% for Y, G and YG,
respectively. Higher ADG in animals fed yeast supplemented diets (Y and YG) can be attributed to
improved propiono-genesis process via yeast (Kawas et al., 2007). Malekkhahi et al. (2015) reported no
effect of yeast culture supplementation on ADG or FCR in growing lambs. Hassan and Mohammed
(2014) concluded that the addition of S. cerevisiae to the high concentrate diet improved the digestibility
of CP and CF as well as ADG (143.7 g/d) in Awassi male lambs. Numerous studies (Garg et al., 2009;
Milewski, 2009) have reported an increasing gain due to the addition of S. cerevisiae to sheep diet.
Ahmed and Salah (2002) estimated a higher increase (13.8 and 30.2%) as a result of the addition of S.
cerevisiae to sheep at a rate of 4 and 8 g/day, respectively, compared to the control diet. Maamouri et al.
(2014) recorded 145 g/day and 223 g/day as the daily weight gain for respective lambs of (C) group and
(Y) one. Payandeh and Kafilzadeh (2007) found that finishing lambs received diet supplemented with S.
cervisiae had a significantly higher ADG (209 vs. 177 g day-1
) but without positive effect on feed
conversion ratio. These results are in harmony with those obtained on West African Dwarf goats fed diets
supplanted with garlic powder (Ikyume et al., 2017) or sheep supplemented with yeast (Zeid et al., 2011).
However, the current results contrast with that those of Tatara et al. (2008) who reported that garlic did
not have a significantly effect on the growth rate although an improvement in growth was observed.
Additionally, Bampidis et al. (2005) reported that weight gain was not significantly affected by dietary
garlic pulp and husk supplementation in growing lambs compared to control group. Garlic powder
supplementation in Ikyume et al. (2017) study had no significant effect on the feed conversion ratio
(FCR) of West WAD goats. This result is consistent with that found by Strickland et al. (2009) where the
inclusion of raw garlic in the diet of Merino lambs aged 6 months reduced the FCR.
Data concerning feed intake based on DM basis (Table 2), indicates that, the feed additive have no
effect on feed intake either in the form of CFM or the roughage and consequently the total feed intake.
Feed intake (g/head/d) expressed as TDNI was affected by the experimental feed additives, where
animal’s group fed G diet showed the highest value of TDNI but the C group showed the lowest value
and the other two groups (Y and YG) were similar. On the other hand, DCPI expressed as g/head/d (Table
2) was not affected (P<0.05) by treatments although G group showed higher value compared with the
other three groups. The lack of effect of Yeast and/or garlic powder on DMI in this study may be
attributed to the high proportion of concentrates (high energy intake) in the diet. These results agreed with
Hassan and Mohammed (2014) and Malekkhahi et al. (2015) who found no significant impact on DM
intake as a result of S. cerevisiae supplementation. However, on contrary to current results, a positive
influence of SC on DM intake in growing animals was observed by Lascano et al. (2009).

Kewan et al.
60
Table (2): Changes in body weight, consumption criteria and economic indicators for lambs fed
with enriched diets.
1Price of year 2019; CFM 4500 LE/T, BH 2900 LE/T, Yeast, 22 LE/Kg, Garlic 35 LE/Kg, LBW 60 LE/ Kg.
Economic indicators were calculated based on as fed basis including feed additives.
a and b means at the same raw with different superscript letters are significantly (P< 0.05) different.
Data of feed utilization efficiency expressed as DM/Gain, TDN/Gain or DCP/Gain are present in
Table (2). The finding provides evidence that all feed additives and their combination significantly
(P<0.05) enhanced, with same extent, the previous mentioned feed efficiency indicators of the enriched
diets compared with control one. The best feed efficiency obtained by YG additive may be attributed to
the beneficial effects of yeast plus garlic. Where yeast provided stimulator factors and essential nutrients
specially protein, energy, minerals and vitamins that better utilized by sheep (Zaki, 2016). These factors
and essential nutrients resulted in some change in the digestive function that led to increasing the
availability and utilization of nutrients in the rumen and could have a significant impact on the feed
utilization and growth rate. Moreover, garlic has improved the use of energy and nitrogen from the diet.
Briefly, it could be concluded that, yeast and/or garlic powder improved DM/Gain by 10.29, 11.17 and
14.05%, TDN/Gain by 6.87, 5.75 and 9.74% and DCP/Gain by 8.41, 8.41 and 11.21%. This result
confirms that a low growth rate lead to a high ratio of feed to live weight gain. These results are
consistent with those found by Maamouri et al. (2014) for yeast and Ghosh et al. (2010) for garlic
powder. However, Hassan and Mohammed (2014) found that addition of S. cerevisiae (5 g/ head/d) in
lamb diets had no effect on FCR value, also Zhong et al. (2019) found that lambs fed basal diet without or
with 50g garlic powder per kg diet for 84d resulted in no significant change in feed conversion ratio.
The economic indicators were calculated for the animal groups fed the experimental finishing diets
under the present study (Table 2). Its logic matter to find supplemented diets revealed higher daily feed
cost compared to control one. All treatment groups revealed higher daily gain and consequently resulted
in higher price. From these results, it could be concluded that adding yeast and yeast plus garlic powder to
rations of lambs were more effective in increasing the daily profit percentage relative to control, being
values 36 and 29%, respectively. However, garlic alone revealed a negative value mainly because of its
high price so the use of garlic additive in finishing diet of growing lambs is restricted by a low price case.
Item Experimental diet
SEM
P value
C Y G YG
Body weight
IBW, kg 35.7 36.5 35.2 36.0 1.26 0.779
FBW, kg 44.5 46.4 45.3 46.2 0.88 0.610
ADG, g 160b 180
a 184
a 186
a 3.23 <0.001
Advantage, % - 12.5 15.0 16.25 - -
Feed & nutrients intake (g DM/head/d)
CFM 1042 1045 1075 1035 10.69 0.207
B. Hay 405 415 402 410 12.17 0.884
Total DMI 1447 1460 1477 1445 17.82 0.569
TDN 1001b
1050ab
1086a
1050ab
20.24 0.051
DCP 171 177 181 177 3.78 0.292
Feed utilization efficiency (g/g)
DM/Gain 9.04a
8.11b
8.03b
7.77b
0.19 <0.001
TDN/Gain 6.26a
5.83ab
5.90ab
5.65b
0.16 0.039
DCP/Gain 1.07a
0.98b
0.98b
0.95b
0.03 0.028
Economic indicators1
Price of daily gain, LE 9.60 10.80 11.04 11.16 - -
Daily CFM cost, LE 5.39 5.54 6.96 6.13 - -
Daily hay cost, LE 1.37 1.40 1.36 1.38 - -
Total daily feed cost, LE 6.76 6.94 8.32 7.51 - -
Daily Profit, LE 2.84 3.86 2.72 3.65 - -
Relative daily profit, % 100 136 96 129
Improvement, % 0.0 36.0 -4.0 29.0 - -

Egyptian J. Nutrition and Feeds (2021)
61
Immunological blood indicators:
The data presented in Table (3) summarized the effect of the experimental finishing diets on
immunological blood indicators in lambs. An increase in the ratio of neutrophils to lymphocytes (N/L
ratio) as an immune parameter proposed as a marker of chronic stressful situations in farm animals
(Trevisi and Bertoni, 2009). The N/L ratio in the present study (Table 3) showed progressively higher
values with group C (0.24), which is indicative of stress. A higher N/L ratio may also indicate a health
issue for the animal, reflecting a weakened immune system and often as a result, an unhealthy animal
(Hyun-Sun et al., 2009). The lower N/L ratio observed in the respective feed additive groups probably
reflects an identical humoral immune response in lambs. Data in Table (3) revealed that immunoglobulins
(IgA) and IgG differed (P <0.05) among groups being their concentration were enhanced by the
respective additives. These results were consistent with those obtained by El-Shereef (2019).
Table (3): Immunological blood indicators in sheep fed yeast and/or garlic supplementation.
Item Experimental diet
SEM P
Value C Y G YG
Neutrophils (N), (x103/µl) 17.63
a 6.50
b 6.93
b 7.10
b 1.22 <0.001
Lymphocytes (L), (x103/µl) 72.85
b 87.10
a 79.25
ab 89.70
a 4.00 0.004
N/L ratio 0.24 0.07 0.09 0.08 - -
IgA, (IU/l) 5.33b 8.33
a 8.10
a 8.67
a 0.69 0.032
IgG, (IU/l) 7.43c 12.90
b 12.33
b 14.67
a 0.94 0.003
SEM: standard error of the mean, P value: probability value
a, b and c means at the same raw with different superscript letters are significantly (P< 0.05) different.
Energy and nitrogen utilization:
Data of gross energy (GE), digestible energy (DE), metabolizable energy (ME) and net energy for
maintenance (NEm) and for growth (NEg) of lambs are presented in Table (4). It could be noticed that the
GE was not significantly (P> 0.05) different among groups, being values ranged between 5.99 and 6.14
Mcal/d. It might be due to that feed intake was not different among groups. However, other criteria of
energy utilization (DE, ME, NEm and NEg Mcal/d) were significantly (P<0.05) different across the
experimental groups, where, the G group showed the highest values but C group was the lowest values,
however both Y and YG groups showed comparable values. The same trend was observed for NEg as a
ratio of GE and ME. These findings may explain the enhanced effect of the tested additives on the basal
diets and was in accordance with finding of (El-Meccawi et al, 2009) who stated that the energy balance
of small ruminants is dependent on the quality of their diets. The TVFAs are the final products of rumen
microbial fermentation and represent the major supply of ME for ruminants (Van Soest, 1982). Therefore,
using garlic as a feed additive may be responsible for the improvement of energy production and
carbohydrate metabolism in animal received diets supplemented with garlic. The present result of NEg
was in accordance with that found by Klevenhusen et al. (2011) who found that the concentrate
supplemented with 4 g diallyl di-sulphide (an important component of garlic oil) increased (P = 0.07)
body energy retention to be 4.06 MJ/d as compared with un-supplemented animals (3.48 MJ/d).
The impacts of Y, G or YG additives on N intake, fecal N, urinary N and N balance are shown in
Table (4). Animals fed diet supplemented with G showed slight increase (P< 0.05) in N intake (NI) and
lower N voided via feces (FN), however, both Y and YG groups showed comparable (P< 0.05) values and
were in between G and C groups. As DMI was similar among the experimental groups so significant
differences observed in NI was not attributed to DMI but mainly to additives nitrogen intake where it was
0.44, 1.31 and 0.88 g N/d for Y, G YG groups, respectively as compared to non-additive group. No
significant (P< 0.05) effects due to supplement of Y, G or their combination were observed on the urinary
nitrogen (UN), total voided nitrogen (TVN) or its relative percentage to NI (UN/NI% and TVN/NI%) as
compared to the control group. A lower (P<0.05) nitrogen loss in the feces of the supplemented groups
especially the focus of G group, but not observed in UN, emphasis that both of G and Y were more
effective for N digestion than the absorption pathways. When the combined additives (YG) were
supplemented, N balance exhibited 15.2% increase above the control group, whereas Y or G
supplementation had similar values and located between Y and YG groups.
In accordance, Sallam et al. (2014) reported that microbial feed additives brought about less excretion
of urinary and fecal nitrogen, which led to improvement in nitrogen balance. Cole et al. (1992) showed
that lambs fed YC had higher N retention than the control which confirms our findings. The higher
retention of N in group Y may be explained by the optimal ruminal NH3-N concentration that appears to

Kewan et al.
62
result from increased incorporation of N into microbial protein as a consequence of stimulated microbial
activity (Malekkhahi et al., 2015). The results of N balance in this study contrast with that of Mungoi et
al. (2012) who reported no effect of supplementing yeast on N balance in lambs. In earlier work,
Amagase (2006) found antioxidant effects for the bioactive components of Garlic could play a role in
improving the use of N in sheep fed hay supplemented with garlic leaf.
Table (4): Use of energy and nitrogen in lambs fed finishing diets enriched with yeast and/or garlic
powder.
Item* Experimental diet
SEM
P value
C Y G YG
Energy utilization:
GE, M cal/d 5.99 6.05 6.14 5.99 0.07 0.439
DE, Mcal/d 3.74b 3.92
ab 4.03
a 3.91
ab 0.08 0.099
ME, Mcal/d 3.07b 3.22
ab 3.31
a 3.21
ab 0.07 0.096
NEm, Mcal/d 2.38b 2.50
ab 2.57
a 2.49
ab 0.05 0.097
NEg, Mcal/d 1.26b 1.35
ab 1.40
a 1.34
ab 0.04 0.105
NEg/GE% 20.93b 22.23
ab 22.80
a 22.34
ab 0.59 0.158
NEg/ME% 40.87b 41.80
ab 42.21
a 41.73
ab 0.39 0.111
N utilization:
Total NI (TNI), g/head/d 29.87b 30.47
ab 31.02
a 30.25
ab 0.36 0.174
Fecal N (FN), g/head/d 7.84a 7.44
ab 6.68
b 7.00
ab 0.34 0.100
FN/NI % 26.25a 24.42
ab 21.53
b 23.14
b 1.07 0.023
N absorbed (NA), g/head/d 22.03c 23.03
bc 24.34
a 23.25
ab 0.41 0.003
NA/ NI % 73.75b 75.58
ab 78.47
a 76.86
a 1.07 0.022
Urine N (UN), g/head/d 15.57 15.76 17.08 15.81 0.56 0.223
UN/ NI % 52.13 51.72 55.06 52.26 1.66 0.497
TVN*, g 23.41 23.2 23.76 22.81 0.48 0.570
TVN/ NI % 78.37 76.14 76.60 75.40 1.02 0.237
N retained (NR), g/head/d 6.46b 7.27
ab 7.26
ab 7.44
a 0.29 0.094
NR/TNI, % 21.63 23.86 23.40 24.60 1.02 0.215
NR/NA, % 29.32 31.57 29.83 32.00 1.56 0.614
NR, mg/ kg BW 128.9 146.0 144.7 148.6 7.14 0.214 *GE: gross energy; DE: digestible energy; ME: metabolizable energy; NEm: net energy for maintenance; NEg: net
energy for growth; *TVN: Total voided N; SEM: standard error of the mean; P value: probability value
a, b and c means at the same raw with different superscript letters are significantly (P< 0.05) different.
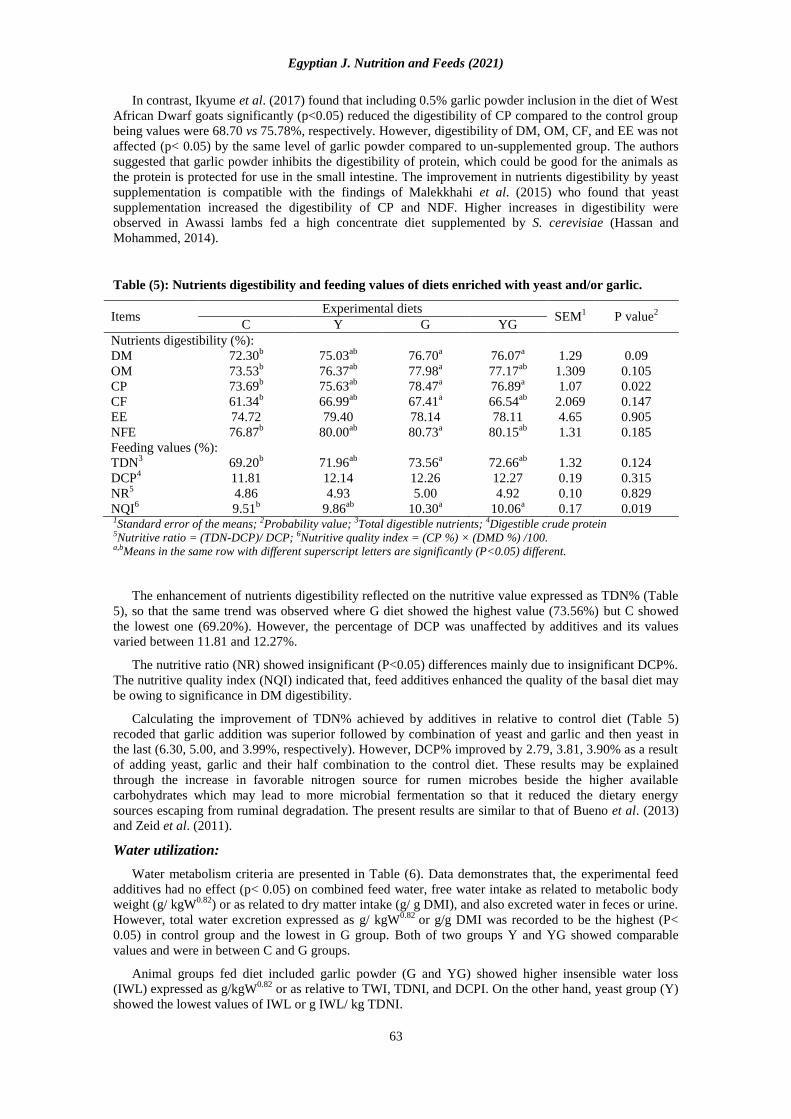
Digestibility and feeding values of diets:
Table (5) presents nutrients digestibility and feeding values of the experimental diets. All feed
additive treatments resulted in higher (P<0.05) digestibility values of DM, OM, CP, CF and NFE, but not
in the C diet. In general, the highest (P<0.05) values were observed in animals fed G diet. However, C
group showed the lowest (P<0.05) digestibility values for the same items. The digestibility of the EE was
not affected (P<0.05) by the experimental additives. This result may be due to the digestibility of fat is
not affected by the presence of yeast in the gastrointestinal tract, since yeast do not hydrolyze bile acids,
and fat emulsion in mixed micelles (El-Hennawy et al., 1994). The observed increment in digestibility
coefficient of major nutrients of enriched feed additive diets may be attributed to its high metabolizable
energy content compared to their content of control diet (Kewan et al., 2019). Otherwise, garlic powder
could alter the microbial population profile, reducing the activity of Prevotella spp which is mainly
responsible for protein degradation and amino acids deamination leading to improved protein digestion
and metabolism (El-Shereef, 2019).
These results are consistent with those obtained by Zhong et al. (2019) which found that the
digestibility of DM (p = 0.019) and CP (p = 0.007) increased by garlic powder supplementation (5% or
50g/ kg DM feed) however, lipid digestibility was not affected by the same supplementation. The values
were 64.21, 74.38, 72.28% DM, CP, EE for garlic vs 60.29, 68.27, 69.97% for control. Also, the present
results agree with those obtained by El-Shereef (2019) who noticed that the addition of garlic powder (2%
of DMI) considerably enhanced the apparent digestibility of DM, OM, CF and CP compared to control
ration being values were 59.6 vs 55.9% DMD; 56.8 vs 53.7% OM; 60.9 vs 52.5% CF; 70.6 vs 65.1% CP
for garlic powder treatment vs control ration, respectively.
Egyptian J. Nutrition and Feeds (2021)
63
In contrast, Ikyume et al. (2017) found that including 0.5% garlic powder inclusion in the diet of West
African Dwarf goats significantly (p<0.05) reduced the digestibility of CP compared to the control group
being values were 68.70 vs 75.78%, respectively. However, digestibility of DM, OM, CF, and EE was not
affected (p< 0.05) by the same level of garlic powder compared to un-supplemented group. The authors
suggested that garlic powder inhibits the digestibility of protein, which could be good for the animals as
the protein is protected for use in the small intestine. The improvement in nutrients digestibility by yeast
supplementation is compatible with the findings of Malekkhahi et al. (2015) who found that yeast
supplementation increased the digestibility of CP and NDF. Higher increases in digestibility were
observed in Awassi lambs fed a high concentrate diet supplemented by S. cerevisiae (Hassan and
Mohammed, 2014).
Table (5): Nutrients digestibility and feeding values of diets enriched with yeast and/or garlic.
Items Experimental diets
SEM1
P value2
C Y G YG
Nutrients digestibility (%):
DM 72.30b 75.03
ab 76.70
a 76.07
a 1.29 0.09
OM 73.53b 76.37
ab 77.98
a 77.17
ab 1.309 0.105
CP 73.69b 75.63
ab 78.47
a 76.89
a 1.07 0.022
CF 61.34b 66.99
ab 67.41
a 66.54
ab 2.069 0.147
EE 74.72 79.40 78.14 78.11 4.65 0.905
NFE 76.87b 80.00
ab 80.73
a 80.15
ab 1.31 0.185
Feeding values (%):
TDN3
69.20b 71.96
ab 73.56
a 72.66
ab 1.32 0.124
DCP4
11.81 12.14 12.26 12.27 0.19 0.315
NR5 4.86 4.93 5.00 4.92 0.10 0.829
NQI6 9.51
b 9.86
ab 10.30
a 10.06
a 0.17 0.019
1Standard error of the means; 2Probability value; 3Total digestible nutrients; 4Digestible crude protein 5Nutritive ratio = (TDN-DCP)/ DCP; 6Nutritive quality index = (CP %) × (DMD %) /100. a,bMeans in the same row with different superscript letters are significantly (P<0.05) different.
The enhancement of nutrients digestibility reflected on the nutritive value expressed as TDN% (Table
5), so that the same trend was observed where G diet showed the highest value (73.56%) but C showed
the lowest one (69.20%). However, the percentage of DCP was unaffected by additives and its values
varied between 11.81 and 12.27%.
The nutritive ratio (NR) showed insignificant (P<0.05) differences mainly due to insignificant DCP%.
The nutritive quality index (NQI) indicated that, feed additives enhanced the quality of the basal diet may
be owing to significance in DM digestibility.
Calculating the improvement of TDN% achieved by additives in relative to control diet (Table 5)
recoded that garlic addition was superior followed by combination of yeast and garlic and then yeast in
the last (6.30, 5.00, and 3.99%, respectively). However, DCP% improved by 2.79, 3.81, 3.90% as a result
of adding yeast, garlic and their half combination to the control diet. These results may be explained
through the increase in favorable nitrogen source for rumen microbes beside the higher available
carbohydrates which may lead to more microbial fermentation so that it reduced the dietary energy
sources escaping from ruminal degradation. The present results are similar to that of Bueno et al. (2013)
and Zeid et al. (2011).
Water utilization:
Water metabolism criteria are presented in Table (6). Data demonstrates that, the experimental feed
additives had no effect (p< 0.05) on combined feed water, free water intake as related to metabolic body
weight (g/ kgW0.82
) or as related to dry matter intake (g/ g DMI), and also excreted water in feces or urine.
However, total water excretion expressed as g/ kgW0.82
or g/g DMI was recorded to be the highest (P<
0.05) in control group and the lowest in G group. Both of two groups Y and YG showed comparable
values and were in between C and G groups.
Animal groups fed diet included garlic powder (G and YG) showed higher insensible water loss
(IWL) expressed as g/kgW0.82
or as relative to TWI, TDNI, and DCPI. On the other hand, yeast group (Y)
showed the lowest values of IWL or g IWL/ kg TDNI.

Kewan et al.
64
The respective feed additives increased metabolic water intake as compared with non-additive diet but
it did not reach to be significant, although mean values of combined metabolic water intake are mainly
related to TDNI of each diet (Kewan et al., 2017). Higher values of total water loss recorded for C group
may be resulted as a consequence of higher water turnover rate and/or digesta flow (Araújo et al., 2010).
However, the higher (P < 0.05) insensible water loss observed in the YG group may be attributed to the
inclusion of garlic powder which may cause increasing of heat increment that result from diet
fermentation which may lead to increase water needed for body cooling system (Kewan et al., 2017),
however yeast group (Y) showed lower insensible water loss as the yeast may have anti-oxidative stress
effects for animals (Hyun-Sun et al., 2009).
Table (6): Water utilization in rams fed diets enriched with yeast and/ or garlic powder.
Item Experimental diet
SEM P value C Y G YG
Metabolic body weight, kgW0.82
24.87 24.87 24.92 24.86 0.52 0.999
Feed combined water, g/kgW0.82
8.96 9.05 8.99 8.98 0.21 0.993
Free water intake (FWI):
g/ kgW0.82
157.7 141.8 139.6 157.7 9.65 0.381
g/ g DMI 2.69 2.39 2.34 2.67 0.13 0.122
Metabolic water, g/kgW0.75
24.29 25.45 26.45 25.42 0.76 0.356
Total water intake TWI, g/kgW0.82
191.0 176.3 175.0 192.1 10.18 0.524
Fecal water (FW):
g/ kgW0.82
18.07 17.22 15.47 17.76 1.47 0.612
% of TWI 9.46 9.77 8.84 9.25 0.68 0.806
Urine water (UW):
g/ kgW0.82
89.35 81.15 70.57 70.61 6.59 0.144
% of TWI 46.78a 46.03
ab 40.33
ab 36.76
b 2.78 0.088
Total water excretion (TWE):
g/ kgW0.82
107.4a 98.4
ab 86.0
b 88.4
ab 7.38 0.167
% of TWI 56.23a 55.81
ab 49.14
ab 46.02
b 2.96 0.085
g/ g DMI 1.83a 1.64
ab 1.45
b 1.50
ab 0.11 0.068
Insensible water loss (IWL):
g/kgW0.82
83.60ab
77.90b 89.00
ab 103.7
a 7.52 0.161
% of TWI 43.77b 44.19
ab 50.86
ab 53.98
a 2.97 0.105
g/kg TDNI 2.07ab
1.85b 2.04
ab 2.36
a 0.17 0.218
g/g DCPI 12.15ab
10.94b 12.15
ab 13.98
a 0.95 0.175
g/g NR 330.4 275.7 307.6 335.4 29.64 0.479 SEM: standard error of the mean, P value: probability value
a, and b means at the same raw with different superscript letters are significantly (P< 0.05) different.
In vitro rumen fermentation parameters:
Rumen pH, NH3-N and TVFA:
In vitro rumen pH, NH3-N, and TVFA concentrations at 0, 3, 6, and 12 post-feeding rams on control,
Y, G and YG supplemented diets are given in Table (7). The garlic and control diets were similar (P<
0.001) in pH at zero time and also the same finding was observed for Y and YG diets. It can be observed
that, pH value was higher at zero than other all incubation times or in other words, it almost declined with
progressing of time from zero up to 12h for all the experimental diets with significant differences at all
tested diets. Gradual decreasing of rumen pH with progressing time may be due to higher concentrate
otherwise higher organic acids resulted from fermentation caused by feed additives may explain the
gradually significant decreasing of rumen pH against the time detected in the current study. The present
results contrast with those reported by Sahli et al. (2018) who found no changes in the in vitro
fermentation of the rumen by including garlic powder. Also, the pH of rumen liquor was not affected by
garlic treatment in sheep (Kongmun et al., 2010 and Abu El-Kassim et al., 2018) or dairy goats (Kholif et
al., 2012). On the other hand, Yang, et al. (2004) and Gaafar, et al. (2009) found that adding yeast led to
an increase in ruminal pH by decreasing the ruminal lactate concentrations through increased activity of
lactate fermenting bacteria (Selenomonas ruminantium and Megasphaera elsdenii) in the rumen.

Egyptian J. Nutrition and Feeds (2021)
65
Ammonia-nitrogen concentration (Table 7) was not affected (p> 0.05) by the experimental diets at
zero time of feeding. Diets included garlic powder (G and YG) showed higher (P<0.001) NH3-N
concentration at early hours (3 and 6h) as compared to the other experimental diets but Y diet was the
highest at the late hour (12) post-feeding. The CP content of Y, G and YG were higher than C diets owing
to feed additives, so the results herein showed that supplemented diets produce higher (p<0.001) NH3-N
as compared with C diet. This may be explained by the possible difference in the degradability of CP in
the rumen between supplemented and un-supplemented diets. The increased concentration of NH3-N
suggests that yeast and garlic have increased the ruminal degradable protein and hence the ability of
produce higher levels of microbial protein. Carbohydrates are the most important source of energy for the
uptake of NH3-N by microorganisms; therefore, the rate of carbohydrate fermentation was highly related
to the rate of rumen protein degradation to NH3-N and then production of microbial protein (Van Soest,
1982). Previous studies showed that concentration of ammonia-N decreased significantly (P< 0.05) in
animals fed garlic (Abu EL-Kassim et al., 2018) or yeast (Lascano and Heinrichs, 2009) as compared to
that fed control diet. This decline may be attributed to the increased incorporation of ammonia in
microbial protein (Chaucheyras and Fonty, 2001), and the stimulation of microbial activity (Lascano and
Heinrichs, 2009), or it can be a direct effect of yeast on the reduction of CP degradation (Eweedah, et al.,
2005).
Table (7): The effect of yeast and/or garlic feed additives on in vitro rumen fermentation.
Incubation hour Experimental diet
SEM P value C Y G YG
Rumen liquor pH
0 6.63a 6.56
b 6.63
a 6.55
b <0.01 <0.001
3h 5.87a 5.78
c 5.80b
c 5.81
b <0.01 <0.001
6h 5.65a 5.64
a 5.63
b 5.63
b <0.01 0.02
12h 5.48a 5.46
b 5.45
b 5.46
b <0.01 0.019
NH3-N, mg/dL
0 9.80 9.80 11.55 10.15 0.55 0.16
3h 19.63c 21.25
bc 34.23
a 22.75
b 0.55 <0.001
6h 24.08b 24.07
b 26.63
b 33.55
a 0.80 <0.001
12h 23.93b 26.30
a 16.30
c 22.53
b 0.67 <0.001
TVFA, meq/dL
0 3.28 3.50 3.50 3.49 0.07 0.18
3h 5.50b 5.05
b 5.53
b 6.28
a 0.16 0.005
6h 6.28c 7.50
a 7.28
a 6.78
b 0.13 0.001
12h 9.05a 8.03
b 8.28
b 8.06
b 0.16 0.008
SEM: standard error of the mean, P value: probability value
a, b and c means at the same raw with different superscript letters are significantly (P< 0.05) different.
Our results regarding ruminal pH and NH3-N disagreed with those obtained by Putnam, et al. (1997),
where they reported no significant effect of adding yeast on the concentration of ammonia-N or the pH of
the rumen fluid. This disagreement may be attributed to differences in the level of addition and/or
different SC strains used. Newbold et al. (1995) stated that certain yeast strains are effective while others
are not.
Higher values of rumen ammonia concentration at 6h for YG and at 12h in Y group may be attributed
to an increase in proteolysis and protein deamination by micro-organisms and increase the ruminal non
ammonia nitrogen pools resulted after addition of S. cerevisiae living cells (Galip, 2006). Higher value of
rumen ammonia in G group at 3h was in consistence with that found in lactating cows fed garlic oil (Yang
et al., 2007) however Ikyume et al. (2017), observed reduced NH3-N concentration during fermentation
as a result of garlic supplementation.
The total VFA concentration (Table 7) was not affected (P> 0.05) by the experimental diets at zero
hour post-feeding. It was noticed that the experimental additives have main effect within 6h post feeding,
where combined YG increased (p< 0.01) the TVFA concentration at 3h as compared to the other
experimental diets. However, separate Y or G supplementation increased TVFA at 6h as compared to
both of the other two groups (C and YG). The control diet showed the highest (P< 0.01) TVFA
concentration at 12h as compared to the other supplemented diets.

Kewan et al.
66
The previous data concerning high TVAs at 6hr for Y group matches well to those reported for sheep
by Komonna (2007). They reported that the total VFA was higher in supplemented groups with YC
compared to the control group. In contrast, the work of Ismaiel et al. (2010) on sheep and Gado et al.
(1998) on goats revealed insignificant differences in total VFA due to yeast culture supplementation.
High TVFA at 6h for G group was in accordance with that reported by Zhong et al. (2019) who found
that garlic powder supplementation increased total VFA in dairy goats as well as in sheep. However,
Ikyume et al. (2017) did not observe significant differences due to garlic supplementing.
DM and OM degradability:
As apparent digestibility is not enough to evaluate the nutritive value of ruminant feeds, therefore it is
necessary to determine the ruminal kinetics of digesting dietary nutrients. In vitro degradation data for
DM and OM are presented in Table (8). Respective additive showed significant effect at all incubation
times except at 12h. For DM, the intercept value (a) for the different treatments representing dry mater
degraded (DMD) from soluble fraction ranged from 17.50 to 20.19 and it was significantly different (P<
0.05) among treatments. Where Y diet showed the highest value and G had the lowest one. In addition, all
kinetic constants; dry mater degraded from the insoluble fraction (b), the potential extent of DMD (a+b),
the degradation rate constant for the insoluble fraction (c); and also the effective degradability were
significantly different among treatments (P<0.05). It seems that G had the highest values followed by YG,
Y and then C group.
The effective degradability of DM and OM for the experimental diets is given in Table (8). Data were
calculated using rumen outflow rates of 2, 4 and 8%h-1
. There were significant differences (p< 0.01)
among diets where G diet displayed the highest values as compared to other diets.
Table (8): The effect of yeast and/or garlic feed additives on in vitro degradability of DM and OM
Item
Experimental diet SE
M
Experimental diet SEM
C Y G YG C Y G YG In Vitro DM degradability (%) In Vitro OM degradability%
0h 15.08a 14.72a 12.59b 12.46b 0.31 2.19 2.55 2.29 2.40 0.20
3h 36.57b 36.22b 39.47a 38.04ab 0.85 19.60a 13.35b 5.92c 17.92a 0.77
6h 43.53ab 44.88ab 48.87a 42.54b 1.79 31.61c 35.81b 34.47b 40.63a 0.86
12h 46.03 46.16 47.16 45.88 0.42 41.20c 50.07a 47.99b 49.55ab 0.52
24h 55.28d 60.39c 65.5a 63.26b 0.26 52.66c 59.13a 56.61b 57.15ab 0.74
48h 66.09b 74.27a 74.94a 75.61a 0.59 78.67a 83.39b 83.06b 78.67c 0.41
DM kinetics OM kinetics
A 18.73ab 20.19a 17.50b 18.74ab 0.51 7.12a 3.24b 1.10c 6.00a 0.36
B 43.05b 52.79a 54.01a 56.33a 1.12 77.01b 80.16b 83.98a 78.15b 1.02
a+b 61.78b 72.98a 71.51a 75.07a 1.34 84.14 83.40 85.08 84.15 0.97
C 0.117a 0.074b 0.114a 0.073b 0.01 0.047b 0.066a 0.059a 0.065a >0.01
ED0.02 55.48b 61.71a 62.91a 62.97a 0.39 77.01b 80.16b 83.10a 78.15b 1.02
ED0.04 50.80c 54.42b 56.78a 55.15b 0.27 77.01b 80.16b 83.98a 78.15b 1.03
ED0.08 44.29b 45.54b 48.53a 45.65b 0.60 77.01b 80.16b 83.98a 78.15b 1.03
True DMD24h True OMD24h
% 65.34d 83.68b 85.33a 73.30c 0.32 58.98d 79.30a 72.99b 66.34c 0.95
Improve1% 18.20d 38.56a 30.27b 19.03c 0.05 11.99d 34.11a 28.94b 16.07c 0.25
Improve2% - 28.08 26.55 15.25 - - 34.45 23.75 12.47 -
SEM: standard error of the mean, P value: probability value. a, b and c are degradation constants. 1Calculated based on apparent DMD24h;
2Calculated based on true DMD of control diet.
a, b and c means at the same raw with different superscript letters are significantly (P< 0.05) different.
True DM degradability (Table 8) was exclusively higher by G additive then Y and YG in the second
category. However, the highest improvement based on apparent DMD at 24h was revealed by yeast
followed by garlic powder and then YG combination. Ryan and Gray, 1989) showed that the rate of
substrate fermentation increase as a result for multiplication of bacterial numbers by S. cerevisiae
supplementation. Hadjipanayiotou et al. (1997) claimed that the use of S. cerevisiae did not affect the
digestibility of nutrient, whereas Plata et al. (1994) found positive in vivo or in situ responses. Garlic
powder supplemented treatment (16 mg) increased in vitro true digestibility (IVTD) as compared to the
control (P<0.01). However, Yang et al. (2007) observed that garlic supplementation did not affect the
total digestibility’s of DM, OM, fiber and starch, while ruminal DM and OM digestibility was increased
(Kongmun et al., 2010). Sahli, et al. (2018) demonstrated an increase (P <0.001) in in vitro gas
production with the addition of 32 and 64 mg garlic powder. They added that, TOMD was similar for all

Egyptian J. Nutrition and Feeds (2021)
67
the doses (0, 4, 8, 16, 32 mg) except for 64 mg, where a small but significant (P <0.001) increase was
observed (77.7%).
Ikyume et al. (2018) found that garlic inclusion had no (P>0.05) influence on the measured in vitro
digestibility kinetics. Where, IDMD was not statistically (P>0.05) significant, garlic powder 0.5% group
had numerically higher value (68.11%) while the control had the least value of 65.23%. The non-
significantly in vitro organic matter digestibility (OMD) ranged between 68.47% and 84.32%. The
highest percentage OMD was observed in the garlic powder 0.5% group while the control group had the
least value of 68.47%. Favorable ruminal digestion responses to yeast culture feeding in sheep include an
increase DM and OM degradation (Kamel et al., 2004). The present results are within that range reported
for roughage and concentrate by Mabjeesh et al. (2000) where the IVDMD of roughages ranged from 47
to 61%, the highest for grass hay and lowest for clover hay. The value of IVDMD for grains varied from
63 to 92%, the highest value rcorded for corn. CP supplements also showed a wide range of IVDMD
values, 55 to 91%, the lowest for cottonseed meal and the highest for fish meal. The IVDMD of whole
cottonseed was low compared to other feedstuffs, averaging 38%.
All in vitro OM degradability (Table 8) at different incubation times and its kinetic values otherwise
true OM degradability as well as its improvement based on either apparent OMD24h of the same diet or
true OMD for control diet were parallel to the same criteria of DMD as found by Guney et al. (2016). It is
well accepted that the significant differences observed in OMD among the experiment diets mainly
resulted from feed additive effects on the same basal diet. It means that yeast, garlic powder and its
combination showed higher OM fermentation along with the different period of fermentation. So, its
modifications effects are still unknown, but we can expect from the other data of the present results that
yeast addition mainly affect through stimulate the fibrolytic bacteria (Chaucheyras et al., 2019) or garlic
supplements inhibit Archaea, which produce methane in the rumen (Kamel et al., 2004). Khattab et al.
(2010) showed that dried yeast and garlic recorded higher (P< 0.05) values of IVDMD and IVOMD than
control. The improvement of IVDMD and IVOMD with combinations may be attributed to one or more of
the following reasons; 1) available in essential ingredients such as vitamins, enzymes and essential amino
and fatty acids for microflora from yeast (El-Ashry et al., 2001), 2) improvement in the flora environment
for better digestibility with yeast (Campanile et al., 2008), 3) the medicinal oils of garlic (Khater et al.,
2009). It could be concluded that the present feed additive treatments were the most effective treatment in
increasing dry matter and organic matter disappearances from nutritional point of view.
Rumen protozoa and total gas and methane yield:
The values of ruminal ciliate protozoa count as affected by the experimental treatments are illustrated
in Table (9). A significant (P<0.05) difference was observed for different differential species
(Entodenium sp., Epidenium sp., Diplodenium sp.) except Polyplastron sp. and total count due to
experimental treatments at zero-time of feeding. The present results indicated that the highest density was
recorded for Entodinum spp which is ferment cellulose and protein while the lowest densities recorded for
Diplodinum spp and Polyolastron spp which is ferment cellulose, especially that Polyolastron spp can
digest 50% of cellulose in the rumen (Hungate, 1966). The high count of Entodinum spp matched with
lower ruminal pH in the experimental groups as it has tolerance for lower pH (Aziz et al., 2018) and can
be explained that Entodinium spp. is responsible for the use of lactic acid formed in the rumen (Khaled
and Baraka, 2011) and direct feed microbial that produce lactate (e.g. Lactobacillus acidophilus) maintain
a tonic level of lactic acid in the rumen, which has the potential to stimulate microorganisms that utilize
lactic acid (Nocek et al., 2002).
The data confirmed that Y displayed the highest (P<0.05) values for the differential species and total
count at zero hour sampling time of feeding followed by C, while G had the lowest (P<0.05) values. It
seems that garlic powder diet decreased (P< 0.05) the count (×105/mL) of Entodenium sp., Epidenium sp.
and Diplodenium sp. as compared with control diet. Where, yeast supplement may have factors that
encourage increasing the previous species to make record the highest (P<0.05) values for the same order
of protozoa species.
The present results of C group were higher than that found in goats fed diets with 70:30% concentrate
to roughage ratio (Aziz et al., 2018), this may be due to sheep was higher than goats in protozoa count as
reported by Baraka (2012). With regard to protozoa number, it is clear the redaction effect on garlic
powder in microbial activities. The antimicrobial properties of the aromatic plants are attributed in part to
essential oils (Panghal et al., 2011). Similar results were found by Nassar et al. (2017) who clarified that
the addition of garlic powder or oil in rations of Barki sheep reduces (P<0.05) the population of
protozoal. Concerning yeast supplementation effect, the results were in accordance with those of Brossard
et al. (2006) who stated that yeasts tended to increase the ruminal protozoal population (P< 0.1). Contrary

Kewan et al.
68
to current results, Hernández et al. (2009) showed that the addition of yeast to lambs fed early and mature
orchard grass altered ruminal protozoa without affecting feed intake, total tract digestion and N balance.
Table (9):Total count and differential of rumen protozoa at zero time of feeding lambs and in vitro
gas yield and kinetics for diets enriched with yeast and/or garlic.
Item Experimental diet
SEM P value C Y G YG
Protozoal Differential Count (x 105/mL)
Entodenium sp. 6.70b
8.17a
4.44d
5.10c
0.43 0.048
Epidenium sp. 3.71b
6.13a
2.68d
2.99c
0.36 0.044
Diplodenium sp. 0.66b
1.97a
0.51c
0.54c
0.17 0.049
Polyplastron sp. 0.48 0.47 0.45 0.44 0.18 0.611
Total (x 105/mL) 11.55
b 16.74
a 8.08
d 9.07
c 0.44 0.050
Total gas yield; TGY (ml/200mg DM)
TGY3h 16.13a 15.78
a 12.27
b 15.28
a 0.38 >0.001
TGY6h 24.53a 23.03
a 17.53
c 18.03
c 0.21 >0.001
TGY12h 28.03a 27.03
b 21.53
c 21.53
c 0.20 >0.001
TGY24h 30.53a 28.28
b 19.53
d 21.53
c 0.53 >0.001
TGY48h 32.2a 30.87
b 27.08
c 24.53
d 0.40 >0.001
PF* 1.93c 2.81
b 3.75
a 3.08
b 0.10 <0.001
Kinetic constants:
A 2.78b 3.78
b 11.87
a 11.96
a 0.72 <0.001
B 28.41a 25.79
a 18.63
b 11.95
c 0.83 <0.001
a+b 31.19a 29.57
a 30.50
a 23.91
b 1.13 0.007
C 0.219a 0.215
a 0.041
c 0.117
b 0.02 <0.001
Methane yield:
CH4 yield24h, ml 18.57 18.41 8.20 11.74 0.22 <0.001
CH4: TGY ratio 60.84 65.09 41.97 54.55 0.51 >0.001
CH4 energy (MJ/d) 5.30 5.30 2.39 3.34 - -
CH4 energy/GEI % 21.15 20.94 9.30 13.33 - -
Microbial protein synthesis:
MCP (g/kg TDOM) 71.14c 95.66
a 88.04
b 80.02
b 0.96 <0.001
*The ratio of true digestible organic matter (mg) to gas volume (milliliters in 24 h); a, b ans c are gas yield constants.
SEM: standard error of the mean, P value: probability value
a, b and c means at the same raw with different superscript letters are significantly (P< 0.05) different.
Fermentation gas yield and kinetic constants:
Gas production reflects all nutrients fermented (soluble as well as insoluble) and fractions that are not
fermentable do not contribute to the gas yield (GY). The amount of gas produced is influenced by the rate
of fermentation of carbohydrate, the molar proportions of the VFA and the amount of VFA produced
(Dijkstra et al., 2005). Differences in the ‘a’ and ‘c’ parameters indicate different fermentation patterns,
suggesting that Y is fermented more rapidly and to a greater extent. The cumulated gas production
(ml/200 mg DM) for each diet the kinetics values of gas production models are given in Table (9). The
total gas yield (TGY, ml/200 mg DM) increased (P<0.001) with developing fermentation time up to 48h
for all experimental diets except for G that dropped GY at 24h. The diet of Yeast (Y) increased (P<0.05)
the b fraction, as also shown by the C-diet, whereas it was lower (P<0.001) with the G alone and the
combination YG. In contrast, the intercept fraction (a) increased (P<0.001) in G and YG diets. The later
diets showed lower rate of fermentation (c) as compared with C and Y diets. The total gas yield at 24h of
incubation of Y, G and YG found to be lower than those found for C diet. The present results are lower
than those reported for barley (64-71 ml), wheat (60-73 ml) and corn grains (60-82 ml) by Getachew et
al. (2002), these finding might be due to applying the gas production technique herein with total mixed
rations. The high gas yield as well as the OMD value of the respective additive groups could be attributed
to a higher fermentation process resulting by intact the feed additives with the basal diet. Potential gas
production (a) was not significantly different in study of Ikyume et al. (2018) and ranged between 15.54-
27.65 ml. But, the highest value 27.65 ml was observed in the control group compared to all
supplemented groups that having a similar value of 15.54 ml. The constant gas production rate (c) was
also observed to be non-significant (P> 0.05) across treatment groups and ranged from 1.22 and 1.73

Egyptian J. Nutrition and Feeds (2021)
69
ml/hr. The highest gas production rate was observed in the 1% garlic powder group (1.73 ml/h) with the
least value recorded in the control group (1.22 ml/h). Incubation time (t) was not significant (P>0.05)
across the treated groups and ranged from -5.96 to -0.7h. The highest incubation time was recorded in the
garlic powder 0.5% group with the least time found to be in the control group (Ikyume et al., 2018).
Higher PF values (Table 9) in respective additive diets especially G reflected high ratio of OM
fermented to gas production as compared with C diet. According to Geneviève et al. (2018), the quantity
of gas produced in the rumen is inversely correlated with microbial yield, which means that the PF value
reflects changes in microbial biomass yield. Favorable rumen digestion responses to yeast culture feeding
in ruminants include increased degradation of DM and OM (Kamel et al., 2004) and stimulation of total
and cellulolytic bacterial numbers (Newbold et al., 1995). Based on mean growth, there was a tendency
for S. cerevisiae supplementation to increase rumen bacteria, whereas control treatment decreased rumen
bacteria (Riyanti and Evvyernie, 2016).
Methane yield:
Data in Table (9) obviously showed that diets contained garlic powder (G and YG) were most
effective in reduction of energy lost when expressed as a ratio of methane production to gross energy
intake. Ikyume et al. (2018) found that garlic inclusion had no (p>0.05) influence on all the in vitro
digestibility kinetics measured except methane (CH4) output, Gas volume (GV), CH4: GV ratio,
metabolizable energy, and short chain fatty acids. They also found that methane to gas volume ratio
expressed in percentage significantly (P<0.05) decreased with increasing amount of garlic powder
supplementation (0, 0.5, 1.0 and 1.5%). While the highest value of 75 % was observed in the control
group, the garlic powder 1.5% group had the least value of 19.02 %. In vitro dry matter digestibility
(IDMD) was not statistically (P> 0.05) significant, GP 0.5% group had numerically higher value
(68.11%) while the control had the least value of 65.23%. The addition of garlic powder to the diet of
rams considerably reduced production of CH4 by 38% (Kim et al., 2018).
Microbial protein synthesis:
Microbial protein (MCP) synthesized in the rumen provides the majority of the protein supplied to the
small intestine of ruminants, which represents 50 to 80% of total absorbable protein (Firkins et al., 2007).
The microbial protein was affected by feed additives (Table 9). Where, MCP synthesis was more
enhanced (P<0.001) by yeast than other treatments. However, Wanapat et al. (2008 and 2013) showed
opposite results to this finding that garlic supplementation did not produce significant changes in the
synthesis of microbial proteins and/or urinary purine derivatives. The multiplication of number of
bacterial by yeast supplementation may increase the rate of fermentation of the substrate and the synthesis
of MCP (Ryan and Gray, 1989). The addition of yeast (Y) stimulated rumen microbial growth through the
use of specific soluble growth factors such as organic acids, B vitamins and provided amino acids
(Waldrip and Martin, 1993). The positive effect of the addition of SC in the present study is consistent
with the findings of many workers (Guedes et al., 2008). Relating garlic addition, Ikyume et al. (2018)
stated that the number of bacteria increased (P> 0.05) numerically and consequently increased the
microbial protein as the level of garlic powder supplementation increased. The highest count was
recorded in the garlic powder 1.5% group while the least value was observed in the control group.
CONCLUSION
It could be concluded that using feed additive such as dry yeast (6 gm/h/d) or garlic powder (40
gm/h/d) or its combination (3gm plus 20 gm) in finishing diets of lamb tended to increase digestibility for
most of nutrients, increasing nutritive value as TDN and appeared to increase the daily gain. Furthermore
these feed additives have enhanced feed efficiency and improved the immune status of animals. Although
the addition of garlic powder alone is restricted by a low price case, it is most effective in reducing energy
loss when expressed as a ratio between methane production and gross energy intake and also proved
effective in reducing methane emissions from sheep and therefore contributing to global warming.
REFERENCES
Abayomi, Y.; S.S. Fagbuaro and S.O.K. Fajemilehin (2018). Chemical composition, phytochemical and
mineral profile of garlic (Allium sativum). Journal of Bioscience and Biotechnology Discovery, 3(5):
105-109.

Kewan et al.
70
Abd El-Latif, S.A.; M.A. Toson and H.A. Mehany (2019). Effect of Dietary Onion, Garlic, Red Pepper
and Anise as Natural Feed Additives on Some Hematological Studies of Japanese Quail Chicks. Acta
Scientific Nutritional Health, Volume 3 Issue 9.
Abu El-Kassim, M.A.; G.A. Abd El-Hafez; S.M. Mousaand and E.H. Hassan (2018). Effect of Dietary
Onion, Garlic and Fenugreek Seeds Powder on Feed Intake, Blood Metabolites and Rumen
Fermentation in Ossimi Ewes. Assiut J. Agric. Sci., 49 (2): 38-48.
Ahmed, B.M. and M.S. Salah (2002). Effect of yeast cultures as an additive to sheep feed on
performance, digestibility, nitrogen balance and rumen fermentation. Journal of King Saudi
University. Agriculture Science. 14(1):1-13.
Alnaimy, A.; A. E. Gad; M.M. Mustafa; M.A.A. Atta and H.A.M. Basuony (2017). Using of citrus by-
products in farm animals feeding. Open Access J Sci.,1(3):58‒67.
Amagase H.; B.L. Petesch; H. Matsuura; S. Kasuga and Y. Itakura (2006). Intake of garlic and its
bioactive components. J. Nutr., 131:955-962.
AOAC. (2005). Association of Official Analytical Chemists. Official Methods of Analysis, 18th ed.,
Washington, D.C. Accessed 4/25/16.
Araújo, G. L. D.; T. V. Voltolini; M. L. Chizzotti; S. H. N. Turco and F. F. R. de Carvalho (2010). Water
and small ruminant production. Revista Brasileira de Zootecnia, Vol.39, (Supl. especial):326-336.
Aziz, Hend, A.; M.S. Nassar; H.S. Badway and M.H. Abd Elrahaman (2018). Rumen fermentations and
rumen ciliate protozoa of goat kids fed diets with different concentrate: roughage ratio. Egypt. J. Nutr.
and Feeds, 21(3): 667-683.
Bampidis V.A.; V. Christodoulou; E. Christaki; P. Floroupaneri and A.B. Spais (2005). Effect of dietary
garlic bulb and garlic husk supplementation on performance and carcass characteristics of growing
lambs. Anim. Feed. Sci. and Tech., 121:273-283
Baraka, T. A. (2012). Comparative Studies of Rumen pH, Total Protozoa Count, Generic and Species
Composition of Ciliates in Camel, Buffalo, Cattle, Sheep and Goat in Egypt. J. American Sci., 8(2):
448-462.
Brossard, L.; F. Chaucheyras-Durand; B. Michalet-Doreau and C. Martin (2006). Dose effect of live
yeasts on rumen microbial communities and fermentations during butyric latent acidosis in sheep: new
type of interaction. Anim. Sci., 82: 829–836.
Bueno, M.S.; M.H.T. Watanabe; J. Issakowicz and A.C.K. Sampaio (2013). Active yeast (Saccharomyces
cerevisiae) supplementation improves digestibility of lamb diet .J. Agric. Vet. Sci., 2(6) (Mar. - Apr.
2013), PP 21-26.
Campanile, G.; F. Zicarelli; D. Vecchio; C. Pacelli, G. Neglia; A. Balestrieri; R. Di Palo and F. Infascelli
(2008). Effects of Saccharomyces cerevisiae on in vivo organic matter digestibility and milk yield in
buffalo cows. Livestock Sci., 114:358-361.
Chaucheyras, D. F.; A. Ameilbonne; P. Auffret; M. Bernard; M. Mialon; L. Dunière and E. Forano
(2019). Supplementation of live yeast-based feed additive in early life promotes rumen microbial
colonization and fibrolytic potential in lambs. Scientific Reports, 9:1-15.
Chaucheyras, D. F. and G. Fonty (2001). Establishment of cellulolytic bacteria and development of
fermentative activities in the rumen of gnotobiotically-reared lambs receiving the microbial additive
Saccharomyces cerevisiae CNCM I-1077. Reprod. Nutr. Dev., 41: 57-68.
Cole, N.A., C.W. Purdy and D.P. Hutcheson (1992(. Influence of yeast culture on feeder calves and
lambs. J .Anim. Sci., 70: 1682-1689.
Czerkawaski, J.W. (1986). An Introduction To Rumen Studies. Pergamon Press, Oxford, New York.
Dashak, D. A.; M.L. Dawang and N.B. Lucas (2001). An assessment of the proximate composition of
locally produced spices known as dadawa basso and dadawa kawla from three markets in Plateau
State of Nigeria. Food Chem., 75(2), 231- 235.
Dehority, B. A. (1993). Laboratory Manual For Classification And Morphology Of Rumen Ciliate
Protozoa. CRC Press.

Egyptian J. Nutrition and Feeds (2021)
71
Demeyer, D.; M. De Meulemeester; K. De Graeve and B.W. Gupta (1988). Effect of fungal treatment on
nutritive value of straw. Med. Fac. Landbouww. Rijksuniv. Gent, 53: 1811–1819.
Dijkstra, J.; E. Kebreab; A. Bannink; J. France and S. Lopez (2005). Application of the gas production
technique in feed evaluation systems for ruminants. Anim. Feed Sci. Technol., 123–124: 561–578.
Diriba-Shiferaw, G.; R. Nigussie-Dechassa; K. Woldetsadik; G. Tabor and J.J. Sharma (2014). Bulb
quality of Garlic (Allium sativum L.) as influenced by the application of inorganic fertilizers. African
J. Agric. Res., 9: 778–790.
Duncan, D. B. (1955). Multiple ranges and multiple F-test. Biometrics, 11: 1- 42.
Elaref, M.Y., H.A.M. Hamdon; U.A. Nayel, U.A.; A.Z.M. Salem and U.Y. Anele (2020). Influence of
dietary supplementation of yeast on milk composition and lactation curve behavior of Sohagi ewes,
and the growth performance of their newborn lambs. Small Ruminant Research, 1, 191: 106176.
El-Ashry, M. A.; A.M. Khoif; H.A. El-Alamy; H.M. El-Sayed and T.A. El-Hamamsy (2001). Effect of
dietary supplemented with medicinal herbs on nutrient digestibility and some blood metabolities of
buffalo calves. Egypt. J. Nutr. and Feeds, 4:21-33.
El-Hennawy, A.A.; C.T. Tse Wong and S.A. Kocoshis (1994). Failure of Saccharomyces boulardii to
hydrolyse bile acid in vitro. Micro Bios, 80:23-29.
El-Meccawi, S.; M. Kama; A. Brosh and A.A. Degen (2009). Energy intake, heat production and energy
and nitrogen balances of sheep and goats fed wheat straw as a sole diet. Livestock Sci., 125: 88–91.
El-Shereef, A.A. (2019). Blood serum biochemical changes and milk fatty acids profile due to using
Garlic plant as feed additives for sheep. Asian Journal of Research in Anim. Vet. Sci., 4(4): 1-8.
Eweedah, N.M.; M.K. Mohsen; M.I. Bassiouni; M.F. Ali, and M.M. Khalafalla (2005). Performance of
lambs fed on rations containing soybean meal treated with formaldehyde and probiotics. 1. Feeding
value, rumen fermentation and degradability. Egyp. J. Nutr. and Feeds (Special Issue), 8:361.
Firkins, J. L.; Z. Yu and M. Morrison (2007). Ruminal nitrogen metabolism: perspectives for integration
of microbiology and nutrition for dairy. J. Dairy Sci. 90 (E. Suppl.):E1-E16.
France, J.; J. Dijkstra; M.S. Dhanoa; D. Lopez; A.Z.M. Salem and R. Rojo (2000). Estimating the extent
of degradation of ruminant feeds from a description of their gas production profiles observed in vitro:
derivation of models and other mathematical considerations. Br. J Nutr., 83: 143-150.
Frankic, T.; M. Voljc; J. Salobir and V. Rezar (2009). Use of herbs and spices and their extract in animal
nutrition. Acta agriculturae Slovenica, 94 (2): 95-102.
Gaafar H.M.A.; A.M. Mohi; M.I. Basiuoni and K.F. El-Riedy (2009). Effect of concentrate to roughage
ratio and baker's yeast supplementation during hot season on performance of lactating buffaloes.
Slovak, J Anim. Sci., 42(4):188-195.
Gado, H. M.; H.M. Metwally and F.A.F. Salem (1998). Effect of yeast culture and monensin on the
performance of Baladi goats fed ensiled potato. Animal Agric. Sci. Ain Shams Univ., Cairo, 43(2):
419 – 429.
Galip, N. (2006). Effects of dietary Saccharomyces cerevisiae live yeast culture supplementation on
ruminal digestion and protozoa count in rams fed with diets with low or high ratio forage/concentrate.
Revue Méd. Vét., 157, 12: 609-613.
Garg, D.D.; T. Sharma and R.K. Dhuria (2009). Evaluation groundnut straw based complete feed blocks
alone and in combination with yeast in ration of sheep. Anim. Nutr. Feed Tech., 2:9.
Geneviève, Z.; K. Adama, B. Balé; C.S. Patricia; L.N. Leando; N. Vincent, T. H. Hamadou; H. Hervé, L.
Helder and A.A. Luiz (2018). In vitro rumen fermentation characteristics, methane production and
rumen microbial community of two major Acacia species used in sahelian region of Burkina Faso.
Tropical and Subtropical Agroecosystems, 21 (2018): 357 – 366.
Getachew, G.; G.M. Crovetto; M. Fondevila; U. Krishnamoorthy; B. Singh; M. Spanghero; H. Steingass;
P.H. Robinson and M.M. Kailas (2002). Laboratory variation of 24 h in vitro gas production and
estimated metabolizable energy values of ruminant feeds. Anim. Feed Sci. Tech., 102: 169–180.
Kewan et al.
72
Ghosh, S.; R.K. Mehla; S.K. Sirohi and R Biswatjit. (2010). The effect of dietary garlic supplementation
on body weight gain, feed intake, feed conversion efficiency, fecal score, fecal coliform count and
feed cost in crossbred dairy calves. Tropic. Anim. Health and Prod., 42:961-968.
Guedes, C.M.; D. Goncalves and M.A.M. Rodrigues (2008). Dias A. Effects of a Saccharomyces
cerevisiae yeast on ruminal fermentation and fiber degradation of maize silages in cows. Journal of
Anim. Feed Sci. Tech., 145:27-40.
Guney, M.; C. Kale; D. Bolat and S. Deniz (2016). Determination of the yield characteristics and in vitro
digestibility of barley forage harvested in different vegetation periods. Indian J. Anim. Res., 50 (6):
947-950.
Hadjipanayiotou, M.; I. Antoniou and A. Photiou (1997). Effects of the inclusion of yeast culture on the
performance of dairy ewes and goats and the degradation of feedstuffs. Livest. Prod. Sci.., 48: 129-
134.
Hassan, S.A. and S.F. Mohammed (2014). Effects of Saccharomyces cerevisiae supplementation on
growth rate and nutrient digestibility in Awassi lambs fed diets with different roughage to concentrate
ratios. Biochem. and Biotech. Res., Vol. 2(3), pp. 37-43.
Hernández, R.; S. S. González; J.M. Pinos-Rodríguez; M.E. Ortega; A. Hernández ; G. Bueno and M.
Cobos (2009). Effect of a yeast culture on nitrogen balance and digestion in lambs fed early and
mature orchard grass. J. Appl. Anim. Res., 35: 53-56.
Hungate, R.E. (1966). The Rumen Protozoa. The Rumen And Its Microbes, pp. 92-147. New York:
Academic Press.
Hyun-Sun, Y.; Ellis, M., Curtis, S. E. and Johnson, R. W. (2009). Environmental temperature, space
allowance, and regrouping: Additive effects of multiple concurrent stressors in growing pigs. J. Swine
Health and Prod., 13 (3): 131-138.
Ibrahim E.M. and El Naggar, Soad (2018). Nutrient digestibility, productive performance and some
serum biochemical indicators as affected by substitution of soybean meal for inactive dry yeast in
growing lambs diet. Egypt. J. Nutr. Feeds, 21 (2): 345-353.
Ikyume, T.T.; O.S. Sowande; P.A. Dele; A.O. Yusuf; S. Monday; O.K. Egunjobi and O. Fatoba (2017).
Effect of varying levels of garlic (Allium sativum) powder on growth, apparent nutrient digestibility,
rumen ecology, blood profile and cost analysis of feeding West African Dwarf goats. Mal. J. Anim.
Sci., 20 (2): 61-74.
Ikyume, T. T.; O.S. Sowande; P.A. Dele; A.O. Yusuf; S. Monday; O.K. Egunjobi and T. Fatoba (2018).
In Vitro fermentation and rumen microbial count of West African Dwarf goats fed garlic (Allium
sativum) powder. Bull. Anim. Hlth. Prod. Afr., (2018), 66, 491-499
Ismaiel, A.M.; A.H. El-Far and I.I. Abou-Ganema (2010). Effect of Tonilisat and Roemin W2
supplementations on the performance of lambs. Int. J. Bio. and Life Sci., 6 (4):222-229
Kamel, H. E.M.; J. Sekine; A.M. El-Waziry and M.H.M Yacout (2004). Effect of Saccharomyces
cerevisiae on the synchronization of organic matter and nitrogen degradation kinetics and microbial
nitrogen synthesis in sheep fed Berseem hay (Trifolium alexandrinum). Small Ruminant Research, 52:
211–216.
Kawas J.R.; R. Garcia-Castillo; F. GarzaCazares; H. Fimbres-Durazo; E. Olivares Saenz; G. Hernandez-
Vidal and C.D. Lu (2007). Effects of sodium bicarbonate and yeasts on productive performance and
carcass characteristics of light – weight lambs fed finishing diets. Small Ruminant Research. 67:157-
163
Kewan, K.Z.; F.A. Salem; A.Z.M. Salem; A.R. Abdou; H.M. El-Sayed; S.S. Eisa; E.A. Zaki and N.E.
Odongo (2019). Nutritive utilization of Moringa oleifera tree stalks treated with fungi and yeast to
replace clover hay in growing lambs. Agroforest Syst., 93:161–173.
Kewan; K.Z.; Ahlam. R. Abdou; E.A. Zaki; F.A. Salem; H.M. El-Sayed and S.S. Eisa, S.S. (2017). Using
of biological treatments to enhance nutrients of Moringa stalks before utilized in ruminant feeding as a
sole diet. Res. J. Anim. Vet. Sci., 9(2): 16-22.
Khaled, N.F and T.A. Baraka (2011). Influence of TOMOKO® (Direct-Fed Microbials) on productive
performance, selected rumen and blood constituents in Barky finishing lambs. J. Amer. Sci., 7: 564-
570.

Egyptian J. Nutrition and Feeds (2021)
73
Khater, H.F.; M.Y. Ramadan and R.S. El-Madawy (2009). Lousicidal, ovicidal and repellent efficacy of
some essential oils against lice and flies infesting water buffaloes in Egypt. Vet. Parasitol, 164: 257–
266.
Khattab, H.M.; S.A.H. Abo El-Nor; S.M. Kholif; H.M. El-Sayed; O.H. Abd El-Shaiffy and M. Saada
(2010). Effect of different additive sources on milk yield and composition of lactating buffaloes.
Lives. Sci., 131: 8-14.
Kholif S.M.; T.A. Morsy; M.M. Abdo; O.H. Matloup and A.A. Abu El-Ella (2012). Effect of
supplementing lactating goats rations with garlic, cinnamon or ginger oils on milk yield, milk
composition and milk fatty acids profile. J. Life Sci., 4(1):27-34.
Khosravi, A.; F. Boldaji; B. Dastar and S. Hasani (2010). Immune response and performance of broiler
chicks fed protexin and propionic acid. Internat. J. Poult. Sci., 9: 188-191.
Kim, J.Y.; Ghassemi Nejad J.; J.Y. Park; B.H. Lee; M. Hanada; B.W. Kim and K.I. Sung (2018). In vivo
evaluation of garlic (Allium sativum) supplementation to rice straw-based diet on mitigation of CH4
and CO2 emissions and blood profiles using crossbreed rams. J. Sci. Food Agric., 98: 5197–5204.
Klevenhusen F.; S. Duval; J.O. Zeitz; M. Kreuzer and C.R. Soliva (2011). Diallyl disulphide and
lovastatin: effects on energy and protein utilisation in, as well as methane emission from sheep. Arch.
Anim. Nutr., 65 (4): 255–266.
Kolmer, J.A.; I.H. Spouling and H.W. Robinson (1951). Approved Laboratory Techniques (5th Ed). New
York: Appleton-Century Crofts. Pp: 1180.
Komonna, O.F.A. (2007). Phsiological and nutritional responses of sheep to some feed additives. Ph.D.
Thesis, Fac. Agric., Minufiya University.
Kongmun P.; M. Wanapat; P. Pakdee; C. Navanukraw (2010). Effect of coconut oil and garlic powder on
in vitro fermentation using gas production technique. Livestock Sci., 127: 38-44.
Lascano, G.J., and A.J. Heinrichs (2009). Rumen fermentation pattern of dairy heifers fed restricted
amounts of low, medium, and high concentrate diets without and with yeast culture. Livestock Sci.,
124:48–57.
Lascano G.J.; G.I. Zanton; F.X. Suarez-Mena and A.J. Heinrichs (2009). Effect of limit feeding high and
low-concentrate diets with Saccharomyces cerevisiae on digestibility and on dairy heifer growth and
first-lactation performance. J. Dairy Sci., 92:5100-5010.
Maamouri, O.; B. Jemmali; I. Badri; H. Selmi and H. Rouissi. (2014). Effects of yeast (Saccharomyces
cerevisiae) feed supplement on growth performances in "Queue Fine de l’Ouest" lambs. J. New Sci.,
8(1).
Mabjeesh, S. J.; M. Cohen and A. Arieli (2000). In Vitro Methods for Measuring the Dry Matter
Digestibility of Ruminant Feedstuffs: Comparison of Methods and Inoculum Source. J. Dairy Sci.,
83:2289–2294.
Macfarlane, W.V. and B. Howard (1970). Water in the physiological ecology of ruminants. In:
Physiology of digestion and metabolism in the ruminant. A.T. Phillipson Editor, Oriel Press.
England. pp.217-229.
Malekkhahi, M.; A.M. Tahmasbi; A.A. Naserian; M. Danesh Mesgaran; J.L. Kleen and A.A. Parand,
(2015). Effects of essential oils, yeast culture and malate on rumen fermentation, blood metabolites,
growth performance and nutrient digestibility of Baluchi lambs fed high-concentrate diets. J. Anim.
Physiol. Anim. Nutr., 99: 221–229.
Mariam, M.B. and U.C. Devi (2016). Chemical and shelf life analysis of dry garlic powder: A golden
Herb. Internat. J. Agric. Food Sci. Tech. 7(1): 1-6.
Menke K.H., Raab L., Salewski A., Steingass H., Fritz D. and Schneider W. (1979). The estimation of the
digestibility and metabolizable energy content of ruminant feeding stuffs from the gas production
when they are incubated with rumen liquor in vitro. J. Agric. Sci., 93:217–22.
Milewski, S. (2009). Effect of yeast preparations Saccharomyces cerevisiae on meat performance traits
and blood hematological indices in sucking lambs. Med Wet; 65: 51–54.
Mungoi, M.; C. Flores; R. Casals and G. Caja (2012). Effect of malate and starch source on digestibility
and nutrient balance of growing- fattening lambs. Anim. Feed Sci. Tech., 22: 154–162.
Kewan et al.
74
Nassar, M.; A. El Shereef and S. Abo Bak. (2017). Influence of feeding garlic plant either as powder or
oil on reproductive performance of ewes. GSC Biol. Pharma. Sci., 01(03):059-061.
Nehring, K. and G. F. W. Haenlein (1973). Feed evaluation and ration calculation based on net energy fat.
Journal of Animal Science, 36(5): 949-964.
Newbold, C. J.; R.J. Wallace; X.B. Chen and F.M. McIntosh (1995). Different strains of Saccharomyces
cerevisiae differ in their effects on ruminal bacterial numbers in-vitro and in sheep. Canadian J. Anim.
Sci., 73: 1811–1818.
Nocek, J.E; W.P. Kautz; J.A.Z. Leedle and J.G. Allman (2002). Ruminal supplementation of direct-fed
microbials on diurnal pH variation and in situ digestion in dairy cattle. J. Dairy Sci., 85: 429-433.
NRC (1985). National Research Council, Nutrient Requirements of Sheep, Sixth Revised Edition.
National Academy Press, Washington, DC, USA.
Nwinuka, N. M.; G.O. Ibeh and G.I. Ekeke (2005). Proximate composition and levels of some toxicants
in four commonly consumed spices. J. Appl. Sci. Environ. Manage., 9(1), 150-155.
Ogimoto, K. and S. Imai (1981). Atlas of rumen microbiology. Japan Scientific Soc. Press, Tokyo.
Otunola, G. A.; O.B. Oloyede; T. Adenike; T. Oladiji and A.J. Afolayan (2010). Comparative analysis of
the chemical composition of three spices Allium sativum, Zingiber officinale Rosc. and Capsicum
frutescens L. commonly consumed in Nigeria. Afr. J. Biotechnol., 9(41), 6927-6931.
Panghal M, V.; Kaushal and J.P. Yadav (2011). In vitro antimicrobial activity of ten medicinal plants
against clinical isolates of oral cancer cases. Annals of Clinic. Microbiol. Antimicro. 2011;10: 21.
Payandeh, S. and F. Kafilzadeh (2007). The effect of yeast (Saccharomyces cerevisiae) on nutrient intake,
digestibility and finishing performance of lambs fed a diet based on dried molasses sugar beet-pulp.
Pakistan J. Biol. Sci., 10(2): 4426-4431.
Petropoulos, S.A.; A. Fernandes; G. Ntatsi; K. Petrotos; L. Barros and I.C.F.R. Ferreira (2018).
Nutritional value, chemical characterization, and bulb morphology of Greek Garlic Landraces.
Molecules, 23, 319
Plata, P. F.; M.G.D. Mendoza; J.R.B. Gama and M.S. Gonzalez (1994). Effect of a yeast culture
(Saccharomyces cerevisiae) on neutral detergent fiber digestion in steers fed oat straw-based diets.
Anim. Feed Sci. Tech., 49.3-4: 203-210.
Preston, T. R. (1995). Biological and for research workers. Chap. 9 in: Animal Feeding: A manual for
research workers. Rome. FAO, p.191- 264.
Putnam D.E.; C.G. Schwab; M.T. Socha; N.L. Whitehouse; N.A. Kierstead and B.D. Garthwaite (1997).
Effect of yeast culture in the diets of early lactation dairy cows on ruminal fermentation and passage
of nitrogen fractions and amino acids to the small intestine. J. Dairy Sci., 80:374-384.
Rattray, P.V.; W.N. Garrett; N. Hinman; I. Garcia and J. Castillo (1973). A system for expressing the net
energy requirements and net energy content of feeds for young sheep. J. Anim. Sci., 36: 115.
Rivlin, R.S. (2001). Historical perspective on the use of garlic. J. Nutr., 131: 951S–954S.
Riyanti, L. and D. Evvyernie (2016). In vitro fermentation characteristics and rumen microbial population
of diet supplemented with Saccharomyces cerevisiae and rumen microbe probiotics. Media
Peternakan, 39 (1): 40-45.
Ryan J. P. and W.R. Gray (1989). Effect of high strength yeast culture ab initio utilizes a residual source
of volatile fatty acids in strained ruminal fluid from hay-fed sheep. Biochemical Society Transactions,
17 (2): 392–393.
Sahli, F.; C. Darej and N. Moujahed (2018). Potential of white garlic powder (Allium sativum L.) to
modify in vitro ruminal fermentation. South African J. Anim. Sci., 48 (No. 2): 253-260.
Sallam, S. M.A.; A.M. Allam and S.A. Najadi (2014). Comparison of two products of direct-fed
microbial supplementation on the nutrient utilization and ruminal fermentation in sheep. J. Agri. Sci.,
6 (3): 159-167.
SAS (2002). Statistical Analysis Systems Institute Inc., Release 8.1, Cary, NC., USA.

Egyptian J. Nutrition and Feeds (2021)
75
Sivam, G.P. (2001). Protection against Helicobacter pylori and other bacterial infections by garlic. J.
Nutr., 131: 1106S–1108S.
Strickland, V.J.; G.L. Krebs and W. Potts (2009). Pumpkin kernel and garlic as alternative treatments for
the control of Haemonchus contortus in sheep. Anim. Prod. Sci., 49: 139-144.
Tatara, M. R.; E. Sliwa; K. Dudek; A. Gawron and T. Piersiak (2008). Aged garlic extract and allicin
improve performance and gastrointestinal tract development of piglets reared in artificial sow. Ann.
Agric. Environ. Med., 15:63-69.
Thomas, L. (1998). Immunoglobulins (Ig). In: Thomas L, ed. Clinical laboratory diagnostics. Use and
assessment of clinical laboratory results. Frankfurt/Main: TH-Books Verlagsgesellschaft, 667-678.
Trevisi, E and G. Bertoni (2009). Some physiological and biochemical methods for acute and chronic
stress evaluation in dairy cows. Ital. J. Anim. Sci., vol. 8 (Suppl. 1): 265-286
Van Soest, P.J. (1982). Nutritional Ecology of the Ruminant, 2nd ed. Cornell University Press, New
York, pp. 266, 301.
Waldrip, H.M. and S.A. Martin (1993). Effects of an Aspergillus oryzae fermentation extract and other
factors on lactate utilization by the ruminal bacterium Megasphaera elsdenii. J. Anim. Sci., 71:2770.
Wanapat, M., S. Kang, P. Khejornsart and S. Wanapat (2013). Effects of plant herb combination
supplementation on rumen fermentation and nutrient digestibility in beef cattle. Asian Australas. J.
Anim. Sci., 26 (8): 1127-1136.
Wanapat, M., P. Khejornsart, P. Parkdee and S. Wanapat (2008). Effect of supplementation of garlic
powder on rumen ecology and digestibility of nutrients in ruminants. J. Sci. Food Agric., 88:2231-
2237.
Warner, A.C.I. (1964). Production of volatile fatty acids in the rumen, methods of measurement. Nutr.
Abst. and Rev., 34: 339.
Yang, W. Z; C. Benchaar; B.N. Ametaj; A.V. Chaves; M.L. He and T.A. McAllister (2007). Effects of
garlic and juniper berry essential oils on ruminal fermentation and on the site and extent of digestion
in lactating cows. J. Dairy Sci., 90:5671–5681.
Yang, W.Z., K.A. Beauchemin; D.D. Vedres; G.R. Ghorbani; D. Colombatto and D.P. Morgavi (2004).
Effects of direct-fed microbial supplementation on ruminal acidosis, digestibility, and bacterial protein
synthesis in continuous culture. Anim. Feed Sci. and Tech., 114: 179–193.
Zaki, E.A. (2016). Nutritional performance of small ruminants fed by products of moringa under desert
environmental conditions. Ph. D. Thesis, Institute Studies of Environmental Studies and Research,
Ain Shams University, Egypt.
Zeid, A.M.M.; M.K. Mohsen; M.A. Ibrahem and A.M.E. Elkamhawy (2011). Effect of feeding rations
supplemented with chamomile flowers and dried yeast on productive performance of sheep. J. Animal
and Poultry Prod., Mansoura Univ., 2 (6): 167- 184, 2011
Zhong, R.; H. Xiang; L. Cheng; C. Zhao; F. Wang; X. Zhao and Y. Fang (2019). Effects of feeding Garlic
powder on growth performance, rumen fermentation, and the health status of lambs infected by
gastrointestinal Nematodes. Animals, 9 (3) 102: 122.
Kewan et al.
76
للحولاى تأثيز الخويزة والثىم أو هخلىطهوا كإضافاث غذائيت على الأداء وتخوزاث الكزش والحالت الواعيت
الوغذاة على علائق اهيت
خالذ سيي العابذيي كيىاى1
، هاجذ هزواى محمد علي2
، بزكاث محمد أحوذ2
، سارة عبذ الزحين القلتي2
،أساهه أبى العش ايل2
.هصز -القاهزة –الوطزيت – هزكش بحىث الصحزاء –والذواجي قسن تغذيت الحيىاى 1
.هصز-هىفيت -شبيي الكىم -جاهعت الوىفيت –كليت الشراعت –قسن الإتاج الحيىاي 2
انثو اندبف يخهطب عه الأداء حخزاث انكزع انحبنت انبعت نهحلا يظحق حذف ذ انذراطت ان حمى حأثز انخزة
كدى. 35.8شر بخطظ س 8اطخخذيج أربعت يدعبث ي انحلا )طبعت حلا/ يدعت( عز انغذاة عه عهمت بت، نذا
بج انعبيلاث انغذائت % ي احخبخبث ان انكهت يع حمذى درض بزطى حخ انشبع. ك70غذج انحلا عه عهف يزكش بظبت
عهمت ، خزاو خزة/ رأص/ و6عهمت أطبطت يع إضبفت ، (انمبرت)عهمت عهمت أطبطت )عهف يزكش + درض( بذ إضبفت كبنخبن:
خزاو ثو خبف/ رأص/ و 20خزاو خزة + 3عهمت أطبطت يع إضبفت يخهط ي خزاو ثو خبف/ رأص/ و 40أطبطت يع إضبفت
أضحج انخبئح يب ه:
يعبيلاث ضى انبدة اندبفت، انبدة انعضت، انبزح انخبو، الأنبف انخبو، %( 5 يعت أدث الإضبفبث انغذائت ان ححظ )يظخ -
.انمبرتدعت نظخخهص انخبن ي انخزخ. أظزث يدعت انثو أعه انمى بب كبج ألم انمى ان
انمبرت%( بب كبج عهمت 73.56%( لت غذائت ف صرة يزكببث كهت يضيت )5أظزث عهمت انثو اندبف أعه )يظخ -
%( ببلإضبفبث انغذائت 5 يعت %(. أيب انمت انغذائت نهعلائك ف صرة بزح يضو فهى حخأثز يعب )يظخ69.20الألم )
%.12.27 11.81يضع انذراطت حزحج انمى ب
خى/و ندعت 160، 186، 184، 180ذل ان كبج انمى ف يع انمبرت يدعت حفلج يدعبث الإضبفت يعب عه -
عه انخان. انمبرتانخزة، انثو، يخهط انخزة يع انثو،
.بدعت انمبرتحشببج الإضبفبث ف ححظ انكفبءة انخحهت يمبرت -
بب حشببج يدعخ انخزة انثو انمبرتت % أعه ي يدع15.2حممج يدعت يخهط الإضبفخ خزخ يحخدش بمذار -
يخهط الإضبفت. انمبرتكبج انمى ب يدعخ
.انمبرت%( حزكش اندهبنبث انبعت ف انذو يمبرت بدعت 5 يعت أدث الإضبفبث يضع انذراطت ان ححظ )يظخ -
خزاو 3خزاو ثو خبف/ رأص/ و أ يخهط يب بعذل 40زاو خزة/ رأص/ و أ خ 6ا اطخخذاو ظخخح ي ذ انذراطت يب ه:
خزاو ثو/ رأص/ و كئضبفبث غذائت ف انعهمت انبت نهحلا انبيت أدث ان ححظ ضى انعبصز انغذائت انمت انغذائت ف 20+
، نك اطخخذاو يظحق انثو اني رفع انحبنت انبعت نهحلاصرة يزكببث كهت يضيت ببلإضبفت ان ححظ يعذل ان
اندذز ببنلاحظت انخبثز الإدبب نهثو ف خفض إخبج انثب ببنخبن خفض انفمذ ف طبلت . عذ رخص ثفمظ ك بفزد
.حمهم الإحخببص انحزار ف انبئتيب ؤد ان انغذاء
Related Documents