The Effect of Work-Attire on Perceptions of Competency of Women in the Workplace Dissertation submitted in partial fulfilment of the requirements for degree of Master of Science in Applied Psychology at the University of Canterbury Greer Alsop University of Canterbury 2021

Welcome message from author
This document is posted to help you gain knowledge. Please leave a comment to let me know what you think about it! Share it to your friends and learn new things together.
Transcript
The Effect of Work-Attire on Perceptions of Competency of Women in the Workplace
Dissertation submitted in partial fulfilment of the requirements for degree of
Master of Science in Applied Psychology
at the University of Canterbury
Greer Alsop
University of Canterbury
2021
2
Table of Contents
Table of Contents ............................................................................................................................................ 2
Acknowledgements ......................................................................................................................................... 3
1.0 Abstract .................................................................................................................................................... 4
2.0 Introduction .............................................................................................................................................. 5
2.1 Overview ................................................................................................................................................... 5
2.2 History of Clothing in the Workplace.................................................................................................................. 6
2.3 Theoretical Framework ..................................................................................................................................... 10
2.4 Perceptions and Observations........................................................................................................................... 10
2.5 Gender Bias, Stereotyping and Person-Role-Fit Judgments............................................................................. 12
2.6 Previous Research and the Current Study ........................................................................................................ 15
3.0 Method .................................................................................................................................................... 20
3.1 Design ................................................................................................................................................................ 20
3.2 Participants ....................................................................................................................................................... 21
3.3 Photographs ...................................................................................................................................................... 21
3.4 Manipulation check ........................................................................................................................................... 22
3.5 Experimental Materials ..................................................................................................................................... 24
3.6 Dependent variables .......................................................................................................................................... 24
3.7 Procedure .......................................................................................................................................................... 25
4.0 Results ..................................................................................................................................................... 26
4.1 Repeated Measures Analysis ............................................................................................................................. 27
4.2 Hypothesis Testing ............................................................................................................................................ 29
5.1 Implication and Application for this Study........................................................................................................ 32
5.2 Limitations & Future Research ......................................................................................................................... 34
5.3 Conclusion ......................................................................................................................................................... 36
References .................................................................................................................................................... 37
Appendix A: Information and Consent Form................................................................................................ 45
Appendix B: Perceptions Questionnaire ........................................................................................................ 46
Appendix C: Questionnaire Distribution Email Template ............................................................................. 55
Appendix E: Tests of Sphericity and Greenhouse-Geisser Corrections .......................................................... 62
3
Acknowledgements
First, I would like to thank my supervising professor Chris Burt, whose gentle guidance and
confidence in me has allowed me to realize my own capability and competence. Secondly, to the
2019 APSY cohort, I may never find a group of people as spectacular, compassionate and quick-
witted ever again, so I will treasure our memories from these last two years dearly. Third, to my
parents Louise and Bruce Alsop. I could write 100 pages and I still wouldn’t be able to express
how thankful I am to you both. Thank you for always being there, and always knowing what to
say, for bringing me calmness and never joining my chaos. And finally, to Jerhime Sanders. You
moved to New Zealand for me and supported my dreams without a second thought, the words
thank you and I love you will never be enough. So I won’t just say words, I will live by them,
always.
Author
Greer Alsop
4
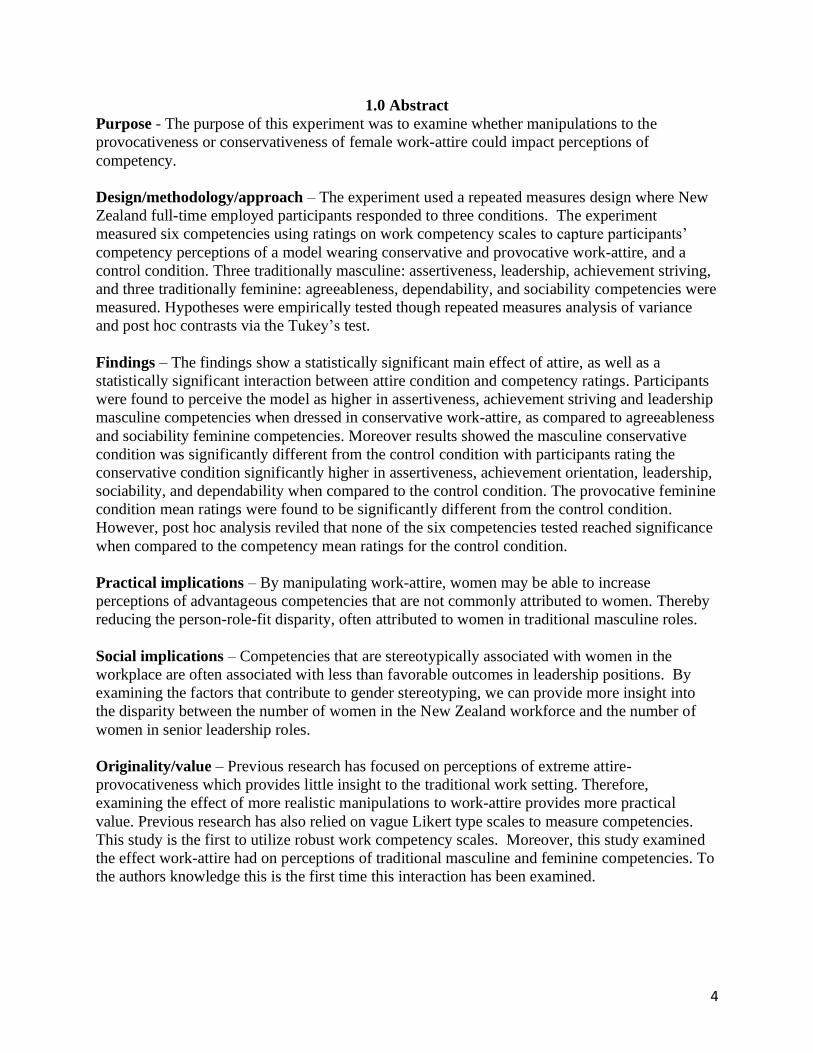
1.0 Abstract
Purpose - The purpose of this experiment was to examine whether manipulations to the
provocativeness or conservativeness of female work-attire could impact perceptions of
competency.
Design/methodology/approach – The experiment used a repeated measures design where New
Zealand full-time employed participants responded to three conditions. The experiment
measured six competencies using ratings on work competency scales to capture participants’
competency perceptions of a model wearing conservative and provocative work-attire, and a
control condition. Three traditionally masculine: assertiveness, leadership, achievement striving,
and three traditionally feminine: agreeableness, dependability, and sociability competencies were
measured. Hypotheses were empirically tested though repeated measures analysis of variance
and post hoc contrasts via the Tukey’s test.
Findings – The findings show a statistically significant main effect of attire, as well as a
statistically significant interaction between attire condition and competency ratings. Participants
were found to perceive the model as higher in assertiveness, achievement striving and leadership
masculine competencies when dressed in conservative work-attire, as compared to agreeableness
and sociability feminine competencies. Moreover results showed the masculine conservative
condition was significantly different from the control condition with participants rating the
conservative condition significantly higher in assertiveness, achievement orientation, leadership,
sociability, and dependability when compared to the control condition. The provocative feminine
condition mean ratings were found to be significantly different from the control condition.
However, post hoc analysis reviled that none of the six competencies tested reached significance
when compared to the competency mean ratings for the control condition.
Practical implications – By manipulating work-attire, women may be able to increase
perceptions of advantageous competencies that are not commonly attributed to women. Thereby
reducing the person-role-fit disparity, often attributed to women in traditional masculine roles.
Social implications – Competencies that are stereotypically associated with women in the
workplace are often associated with less than favorable outcomes in leadership positions. By
examining the factors that contribute to gender stereotyping, we can provide more insight into
the disparity between the number of women in the New Zealand workforce and the number of
women in senior leadership roles.
Originality/value – Previous research has focused on perceptions of extreme attire-
provocativeness which provides little insight to the traditional work setting. Therefore,
examining the effect of more realistic manipulations to work-attire provides more practical
value. Previous research has also relied on vague Likert type scales to measure competencies.
This study is the first to utilize robust work competency scales. Moreover, this study examined
the effect work-attire had on perceptions of traditional masculine and feminine competencies. To
the authors knowledge this is the first time this interaction has been examined.
5
2.0 Introduction
2.1 Overview
As the new decade begins, we are given a unique opportunity to reflect on women’s
position in the labour market today, as compared to ten years ago. At first glance things appear
optimistic. Fortune boasting record numbers of female CEO’s on the Fortune 500 list, 33 out of
the 500 respectably (Zillman, 2019). In 2019, New Zealand celebrated a pay gap of 9.3% between
male and female employees in the same role, the third smallest percentage since 1998 (Stats.NZ,
2019). New Zealand also experienced record numbers of women in the work force, women now
making up the majority of the workforce when all forms of employment are included (NZ.Stat,
2019). The number of New Zealand women in full-time work has also increased, with 775,000
women now working full-time, compared to 584,000 a decade ago (NZ.Stat, 2019). Despite these
glowing statistics however, there is still an overwhelming lack of New Zealand women in senior
leadership positions (Austin, 2016). In 2015, the proportion of New Zealand women in senior
leadership roles dropped from 31% to 19%, with this figure remaining steady over the last six
years (Davies, 2018). Thus, New Zealand’s exponential growth of women in the workplace is not
being reflected in the number of females in senior management positions.
It stands to reason then, that there may be variables hindering women’s career progress in
New Zealand workplaces. One area that may provide some insight into women’s progression, or
lack thereof, is the realm of work-attire. Clothing is used as a social tool for indicating roles,
expressing the self, and perceiving others (Ericksen, & Sirgy, 1992; Piacentini, & Mailer, 2004).
While it is generally accepted that clothing plays a large and important role in our day-to-day lives,
there is still relatively little known about its role in the workplace. Despite this, organizations spend
thousands of dollars yearly providing, and maintaining dress codes and work uniforms (Soloman,
1987).
6
What is already understood is that women have a unique relationship with their appearance.
Women spend more time thinking about, and maintaining their appearance (Abbey, Cozzarelli,
McLaughlin, & Harnish, 1987 ; Sinclair, 2011), are more likely to experience negative affect due
to their appearance (Glick, Larsen, Johnson, & Branstiter, 2005; Kwon, 1994), and are objectified
and dehumanized based on appearance by both men and other women (Awasthi, 2017; Kellie,
Blake, & Brooks, 2019 ; Vaes, Paladino, & Puvia, 2011). Thus, it is reasonable to predict women
may also experience similar hardships with regards to their appearance in the workplace. This
experimental research paper will therefore examine whether manipulations to the provocativeness
or conservativeness of women’s work-attire can impact perceptions of work related competency.
Specifically, how will these manipulations effect perceptions of traditionally masculine and
feminine competencies?
The introduction will begin with a brief historical overview of the role of clothing in the
workplace, followed by an explanation of the competency perception process. A theoretical
framework drawing on symbolic interaction, cognitive theory, gender bias, and stereotyping
literature is proposed. These theories are then applied to person-role-fit judgments and competency
perception outcomes to complete the theoretical framework. Finally, relevant parallel research will
be drawn on, and hypotheses proposed. A review of the strengths and limitations of previous
research in this field will also be given. The social and practical contributions of the current
experimental research will be examined throughout.
2.2 History of Clothing in the Workplace
The first academic to examine clothing as more than a protective feature was Veblen
(1953). His theory suggested women wore clothing to express social status and core values of
society (Veblen, 1953). Later, academics came to understand clothing was much more complex.
7
Clothing was shown to be an essential social tool used for indicating roles, expressing the symbol
of the self, and developing perceptions of others (Ericksen, & Sirgy, 1992; Kaiser, 1983;
Piacentini, & Mailer, 2004). For women in particular, clothing has had a unique, all be it restrictive
history. While male attire has developed through practicality, female attire has developed through
various phases of sex-distinction (Gilman, 2002). Thus, men’s clothing has come to inherently
represent many roles and identities such as; athlete, judge, businessman, lawyer, doctor, academic,
and more. While women, have been ascribed one: Feminine. This label persisting even now and
undercutting women’s potential.
Sixty years ago, workplace attire was unmistakable. A suit, tie, hat, and a white shirt was
the iconic uniform of all white collar workers (primarily male at this time). Their attire not only
identifying their occupation, but also their social status (De Casanova, 2015). The white-collar
uniform was iconic in that it also represented the widespread social and occupational conformity
present at that time. As the western world begin to move away from a sense of conformity and
more towards the individual imperative, work attire followed suit. By the late 1980s causal Fridays
had become common place, initially believed to have resulted from ‘Aloha Fridays’ in Hawaii
where workers were permitted to wear the traditional Hawaiian shirt during the warmer part of the
year (De Casanova, 2015).
In the 1990’s the traditional understanding of work attire was challenged even further
(Karl, McIntyre Hall, Peluchette, 2013; Peluchette & Karl, 2007). During this time, many
technological organizations traded traditional corporate attire in favor of casual attire altogether
(Karl, McIntyre Hall, Peluchette, 2013), this trend endured and spread to multiple industries in the
current decade. This shift can partially be explained by the millennial generation preference for
casual attire (Karunarathne & Hettiarachchi, 2019). With millennials now making up the majority
8
of the work force, millennial attire preferences have heavily influenced work-attire trends.
Karunarathne and Hettiarachchi (2019) noted this change, and investigated recent work-attire
preferences in South Africa. They found that 80% of the participants preferred causal work attire
over business causal and formal, citing promotion of productivity as participant’s central reason
for preference (Karunarathne & Hettiarachchi, 2019). Other academics have argued that casual
work attire can reflect an egalitarian workplace, and can help foster positive cultures in the
workplace (Littlefiled, 1994). Others believe it may increase perceptions of friendliness, as
demonstrated by Karl, McIntyre Hall, and Peluchette (2013). Using a self-report method,
MacIntyre Hall and Pelcuchette surveyed 260 public workers who had experience with casual and
formal attire in the workplace. Respondents indicated that they felt more trustworthy when wearing
casual attire, but more competent and authoritative when wearing formal work attire.
Thus, despite the increase in causal work attire popularity, it still cannot be said that casual
work attire is more effective than business formal attire. Furthermore, there seems to be many
factors that can influence causal or formal attire preference. For example, the economic condition
(De Casanova, 2015). During periods of economic growth such as the technology boom of the
1980’s, work attire became more causal. Conversely, during the 2008 finical crisis work attire
moved back to formal (De Casanova, 2015). This suggests formal work attire is used as a tool to
increase individual’s confidence, motivation and determination, in times of economic instability.
In a sense, formal work attire can be thought of as a ‘power suit’.
The study of formal attire in the workplace has received markedly more attention than
casual attire, potentially due the ‘power suit’ phenomenon (De Casanove, 2015; Kwon, Johnson-
Hillery, 1998). As demonstrated by Brase and Richmon (2004) formal work attire has been shown
to increase authority and trustworthy perceptions of others (Brase & Richmond, 2004; Peluchette,
9
& Karl, 2007; Sebastian & Bristow, 2008). Brase and Richmond (2004) investigated the effect of
formal attire by examining perceptions of doctors donning formal and informal attire. Seventy
eight participants viewed and rated pictures of doctors in formal and casual attire, with and without
a white coat. The results indicated that patients perceived doctors as more authoritative and
trustworthy when wearing formal attire and a white coat. Counter to previous research, Brase and
Richmand also discovered that casual attire reduced patient perceptions of friendliness and trust,
especially for female viewers (Brase & Richmond, 2004).
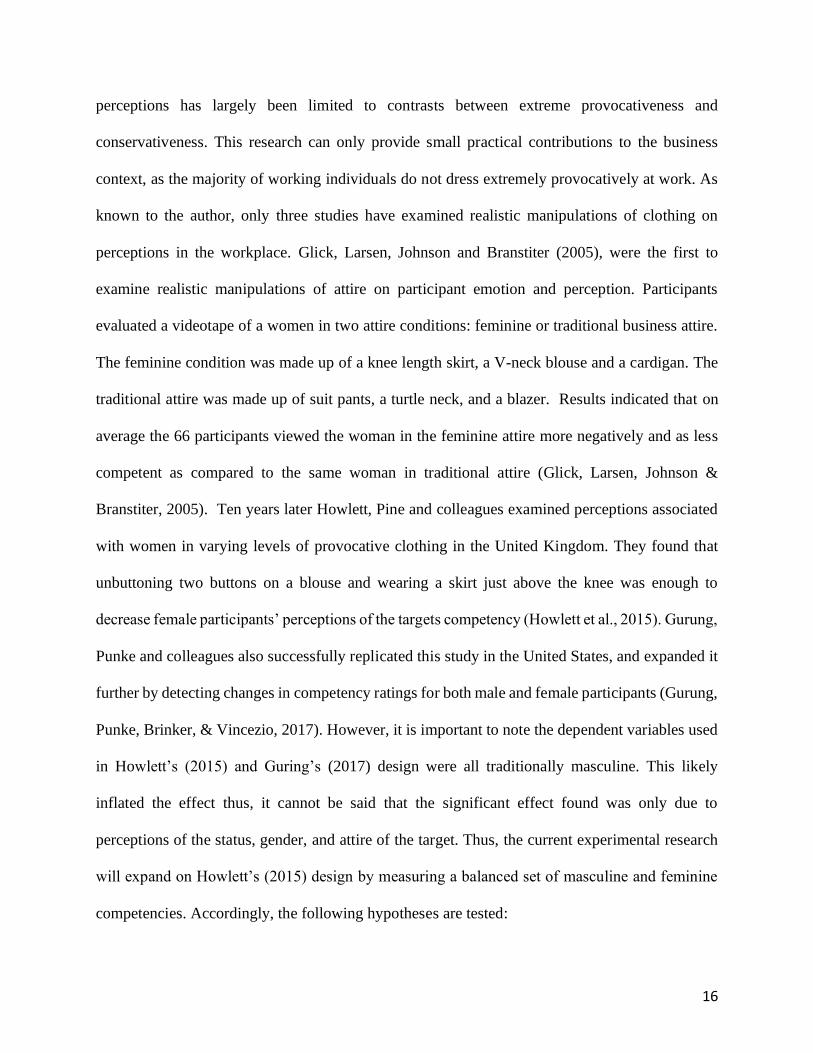
However, what this body of research has failed to target and understand, is the unique
impact work-attire has on women. Specifically, could traditional masculine formal work-attire
increase perceptions of a females competence? Thus, the current study aims to identify how
manipulations to woman’s work-attire can complement or devastate perceptions of woman’s
competencies in the workplace. The framework shown in Figure 1, adapted from Rafaeli and Pratt
(1993) has been proposed as means of explaining this process.
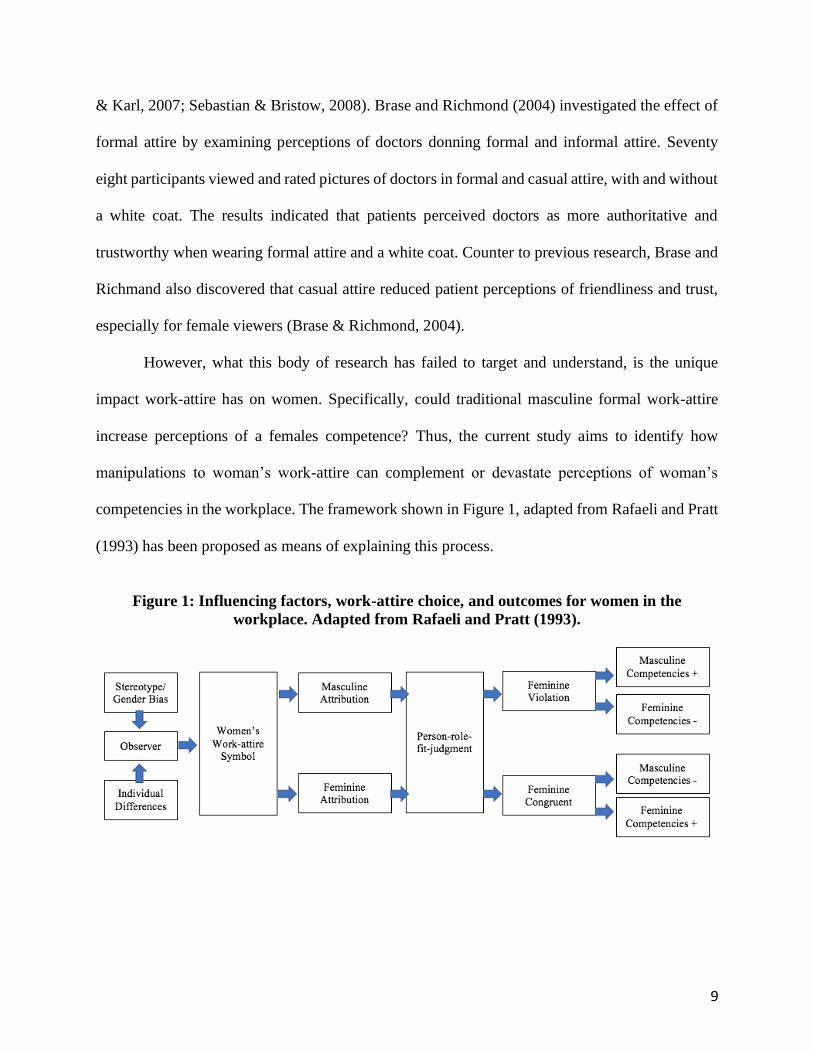
Figure 1: Influencing factors, work-attire choice, and outcomes for women in the
workplace. Adapted from Rafaeli and Pratt (1993).
10
2.3 Theoretical Framework
Based on the theoretical underpinnings discussed in detail below, the author offers the
following framework as shown graphically in Figure 1. Firstly, observer individual differences
such as; personality, experiences, knowledge, gender biases, and other enduring schemas influence
what cues are selected, and what meanings are ascribed when observing an individual’s attire. To
illustrate, the observer may select ‘blazer’ and ‘trousers’ to ascribe a masculine attribution to target
female. Once cues have been selected, the observer makes a person-role-fit judgment. For
example, do the cues ‘blazer’ and ‘trousers’ fit the role of ‘female’. When the answer is no, a
violation occurs and the observer perceives the women to possess less feminine competencies such
as; social ability, agreeableness, and dependability. Conversely, the author argues perceived
masculine competencies such as; assertiveness, achievement striving, and leadership could
increase.
2.4 Perceptions and Observations
Clothing is an important tool for formulating initial judgments of others (Kasier, 1983;
Kwon & Johnson-Hillery, 1998) as well as communicating information about the self (Bem, 1972;
Kellerman & Laird, 1982; Kwon, 1994; Ruoh-Nan, Yurchisin, & Watchravesringkan, 2011).
Peluchette, Karl and Rust (2006) examined the impact and value individuals placed on work-attire
and discovered that individuals use workplace attire to manage impressions of others, while also
utilizing personal attire to increase positive self-perceptions (Peluchette, Karl & Rust, 2006). The
process by which clothing effects perceptions however, requires a much larger explanation. A
synthesis of symbolic interactionist and cognitive theoretical perspectives will be used for the
11
purposes of this research as per the recommendations of Kaiser (1983). This synthesis will allow
for a holistic understanding of the way in which an individual forms interpersonal perceptions.
Symbolic interaction theory suggests individuals define and interpret symbols based on
prescribed meanings assigned to the symbol (Forsythe, 1987; Kaiser, 1983). Therefore, in the
context of clothing, individuals draw on the meaning assigned to the clothing symbol. For example,
Kellerman and Laird (1982) conducted an experiment in which participants were instructed to
wear a pair of eyeglasses while completing an intelligence test. As a result, participants believed
they had performed better on the intelligence testing, despite their actual results showing no
improvement (Kellerman & Laird, 1982). Thus, the eyeglasses acted as a symbol of ‘intelligence’
and by wearing the eyeglasses the individual experienced a change in self-perception.
Cognitive theory also plays an important role in the formulation of attire based perceptions.
Cognitive theory suggest that individuals select situational cues as a means to make sense of their
world (Kaiser, 1983). Furthermore, in order to engage in efficient perception making, individuals
select and amplify cues based on their ability to be useful in making inferences about traits or
probable behaviors (Forsythe, 1990; Kaiser, 1983). Attribution theory explains this process further.
Attribution theory concerns the specific type of inferences a perceiver selects in order explain the
outcome of an interaction (Kaiser, 1983; Kelley & Michela, 1980). Perceivers ‘attribute’
inferences that are consistent with the clothing cues observed (Kaiser, 1983). This often leads to
the perceiver relying on stereotypes to inform their judgments. For example, observing a male in
a suit may lead to the perceiver relying on the traditional masculine stereotype. Thus, the individual
maybe perceived as being a manager, as the role of manager is consistent with the cues of ‘man’
and ‘suit’ (Forsythe,1990; Kaiser 1983; Kelley & Michela, 1980).
12
Applying attribution theory and symbolic theory to the framework of this research is
reasonable as the cues selected have prominent and easily identifiable constructs. The effect of
clothing on perceptions can be varied due to the dynamic and fast paced nature of fashion trends,
fortunately work-attire has a rather stable narrative. Although there have been fluctuations between
casual and formal attire preference in the workplace, the general understanding of ‘what’ work
attire looks like has largely remained unchanged (Franz & Norton, 2001; Karl, McLntyre Hall,
Peluchette, 2013; Saiki, 2013). Participants from a range of backgrounds including HR managers,
fashion experts (Franz & Norton, 2001) and low-income job seekers (Saiki, 2013), have
demonstrated the ability to firmly identify men’s formal (suit, shirt, and tie) and women’s formal
(pants/skirt, shirt, dress) business attire. As such, business formal attire will be utilized for the
purposes of the current experiment. This will ensure measurement of perceptions as related to
work-attire are less likely to be influenced by changes and preferences in fashion. Moreover,
appearance related sex stereotypes have a long and enduring history with ascribed masculine and
feminine business attire (Abbey, Cozzarelli, McLaughlin, & Harnish, 1987; Kaiser, 1983) this
history and its implications in the formulation of perceptions are considered hereunder.
2.5 Gender Bias, Stereotyping and Person-Role-Fit Judgments
When making observations, individuals select particular cues in order to make sense of an
interaction (Kaiser, 1983; Kelley & Michela, 1980). Perceivers ‘attribute’ inferences that are
consistent with the clothing cues observed (Kaiser, 1983), often resulting in the use of gender
biases. Gender biases are a simple way our brain can connect past experiences and make sense of
current or future events, allowing for quick perception making. It is defined as “common,
culturewide beliefs about how men and women differ in personal qualities and characteristics”
13
(Haslett, Geis, & Carter, 1992, p. 29). Both males and females experience gender bias in many
contexts, yet in the workplace, it is disproportionately women who are left at a disadvantage
(Abbey et al., 1987; Dennis, & Kunkel, 2004; Drydakis, Sidiropoulou, Bozani, Selmanovic, &
Patnaik, 2018; Heliman, & Stopeck, 1985; Kellie, Blake, & Brooks, 2019). Moreover, the
occurrence of gender stereotyping of women in the workplace has been shown to be influenced by
the appearance of the individual (Abbey et al., 1987; Dennis, & Kunkel, 2004; Drydakis,
Sidiropoulou, Bozani, Selmanovic, & Patnaik, 2018; Heliman, & Stopeck, 1985). In 1987, Abbey
et al., examined male and female perceptions of male and female targets wearing revealing and
non-revealing work clothing. They found that male participants rated the female targets higher on
sexual traits than the parallel male targets. This research highlighted how misrepresentation of
sexual intent increases the risk of sexual harassment and assault in the workplace.
Thus, women are disadvantaged and endangered by common culture wide beliefs about
how women should dress and behave. In addition, women’s competency in the workplace can be
diminished based on gender associations. Traditional female qualities, cataloged under
communality, are often associated with empathy, social sensitivity and loyalty (Dennis, & Kunkel,
2004; Heliman, 2012; Drydakis et al., 2018). These traditional feminine qualities are often marked
as disadvantageous in a leadership positions (Drydakis et al., 2018; Howlett et al., 2015).
Conversely traditional male characteristics catalogued under agency, are associated with highly
advantageous outcomes. These include: achievement orientation, assertiveness, leadership,
emotional control, and technical competence. All competencies that have been identified as
valuable in leadership positions (Dennis, & Kunkel, 2004; Heliman, 2012; Drydakis et al., 2018).
As noted, the occurrence of gender stereotyping of women in the workplace has been
shown to be influenced by the appearance of the individual. This was examined further by Heilman
14
and Stopeck (1985), who suggested attractiveness could increase performance evaluations of a
woman in a traditional feminine role; such as a secretary, or administrator. This was because the
gender stereotype associated with a woman ‘fit’ the role ascribed. Conversely, attractiveness
decreased performance evaluations of a woman in managerial roles (Heilman & Stopeck, 1985).
This is because the gender stereotype of a sensitive, empathetic woman clashes with traditional
masculine role of manager (Heilman & Stopeck, 1985). This double-edged relationship can be
further explained by the person-job fit model (Heilman, 1983). As attractiveness is associated with
traditional femininity, it ‘fits’ feminine work roles. Managerial positions however, are traditionally
masculine. Therefore, the presence of feminine characteristics of a female manager creates a
disparity between the traditional masculine role, and the individual’s gender biased fit. This
disparity, eventuates in perceptions of competency inadequacy (Heilman, & Stopeck, 1985).
Appearance itself however, can be influenced by many variables. Namely, clothing. When
women are perceived as being dressed inappropriately the observer makes a person-role-fit
judgement, when a disparity occurs, perceptions of inadequacy follow. Gurung and Chrouser
(2007) examined perceptions of prestigious female athletes who were portrayed provocatively in
sports magazines. Their findings highlighting that even Olympic female athletes were perceived
as less intelligent and less physically capable when dressed in revealing clothing (Gurung &
Chrouser, 2007). Clothing provocativeness and competencies have also been examined in the
political realm. Smith, Liss and colleagues (2018) used eye tracking technology on 191 participants
who were asked to view pictures of a female politician in different outfits. They found that
participants viewed the provocative outfit for longer, and made more negative judgments the
longer they looked. Female candidates wearing revealing clothing were perceived as less; honest,
trustworthy, competent, and electable (Smith, Liss, Erchull, Kelly, Adragna, & Baines, 2018). In
15
a traditional business setting, Glick, Johnson and Branster (2005) examined perceptions of women
dressed in sexy clothing in regards to high and low status job compatibility. Their research
suggesting women dressed in sexy clothing in high status roles were perceived as less intelligent,
competent, and capable. While perceptions of sexually dressed women in lower status roles did
not change (Glick, Johnson & Branster, 2005). But perhaps the most alarming research was that
of Graff, Murnen and Smolack (2012) who found pre-teen girls dressed in a sexualized manor
were rated as less accomplished, intelligent, competent, self-efficacious, and moral than their
conservatively dressed counterparts (Graff, Murnen, & Smolak, 2012). To conduct their study
Graff et al asked 162 male and female students to rate one of 3 pictures of girl in the 5th grade. In
each picture the clothing of the target was manipulated to either represent; childlike, somewhat
sexualized, and sexualized attire. Attire significantly impacted ratings of the young girl’s
competencies (Graff, Murnen, & Smolak, 2012).
These studies suggest that sexualized attire can create a sizable disparity between the
person-role-fit regardless of the female’s age, status, or context. Any indication of femininity in a
traditional masculine role can lead to person-role-fit disparity, further extending to perceptions of
competency inadequacy. Not because of any real evidence, but simply because of the stereotypical
cues signaled by appearance. So what then might occur when a women reduces perceived
femininity by increasing the masculinity of her attire? Could this reduce the person-role-fit
disparity between women in leadership positions?
2.6 Previous Research and the Current Study
This research paper will now examine previous literature as a means of rationalizing the
theoretical framework of the current experiment. Previous research on the effects of attire on
16
perceptions has largely been limited to contrasts between extreme provocativeness and
conservativeness. This research can only provide small practical contributions to the business
context, as the majority of working individuals do not dress extremely provocatively at work. As
known to the author, only three studies have examined realistic manipulations of clothing on
perceptions in the workplace. Glick, Larsen, Johnson and Branstiter (2005), were the first to
examine realistic manipulations of attire on participant emotion and perception. Participants
evaluated a videotape of a women in two attire conditions: feminine or traditional business attire.
The feminine condition was made up of a knee length skirt, a V-neck blouse and a cardigan. The
traditional attire was made up of suit pants, a turtle neck, and a blazer. Results indicated that on
average the 66 participants viewed the woman in the feminine attire more negatively and as less
competent as compared to the same woman in traditional attire (Glick, Larsen, Johnson &
Branstiter, 2005). Ten years later Howlett, Pine and colleagues examined perceptions associated
with women in varying levels of provocative clothing in the United Kingdom. They found that
unbuttoning two buttons on a blouse and wearing a skirt just above the knee was enough to
decrease female participants’ perceptions of the targets competency (Howlett et al., 2015). Gurung,
Punke and colleagues also successfully replicated this study in the United States, and expanded it
further by detecting changes in competency ratings for both male and female participants (Gurung,
Punke, Brinker, & Vincezio, 2017). However, it is important to note the dependent variables used
in Howlett’s (2015) and Guring’s (2017) design were all traditionally masculine. This likely
inflated the effect thus, it cannot be said that the significant effect found was only due to
perceptions of the status, gender, and attire of the target. Thus, the current experimental research
will expand on Howlett’s (2015) design by measuring a balanced set of masculine and feminine
competencies. Accordingly, the following hypotheses are tested:
17
Hypothesis 1: manipulations of work-attire will interact with participants’ perceptions of
traditional masculine competencies. Conservative, masculine attire will elicit higher
traditional masculine competency (assertive, achievement oriented and leadership) ratings.
Hypothesis 2: manipulations of work-attire will interact with participants’ perceptions of
traditional feminine competencies. Provocative, feminine work-attire will elicit higher
traditional feminine competency (agreeable, sociable and dependable) ratings.
Previous research has focused on a number of competencies with relation to clothing
perceptions. However, empirical rational for choosing said competencies is few and far between.
Many studies have used disproportionate numbers of masculine and feminine competencies, some
have not identified the masculine or feminine orientation of the competencies being measured, and
others have used only a single ‘competence’ scale. Thus, this current study will provide a robust,
empirically driven set of masculine and feminine competencies, that can be used in future research.
Care was taken for selection of each of the competencies for the current study. The BEM Sex-Role
Inventory was the first tool employed to identify appropriate masculine and feminine
competencies. The BEM Sex-Role-Inventory is an empirically proven, robust tool used to measure
an individual’s identification with traditional masculine and feminine qualities (Donnelly &
Twenge, 2016). Since its creation in the 1990’s it has remained one of the most frequently used
sex-role measurements in psychology (Donnelly & Twenge, 2016). Thus, the BSRI was used to
reduce the potential competency pool down to 20 masculine and 20 feminine. This list of
competencies was then compared against the list of competencies in Fleishman Job Analysis
Survey (FJAS) to provide a second line of screening.
18
The FJAS is along established job analysis tool used as a common taxonomy for work
related competencies (Fleishman & Reilly, 1992). Matching the competencies identified in the
BSRI against the FJAS taxonomy allowed for the identification of specific work-related masculine
and feminine competencies thus, supporting the validity of the study. An examination of
competencies measured in previous perception literature was then used to identify the top three
most characteristic masculine and feminine competences. Traditional masculine competencies:
assertiveness, leadership and achievement striving were selected based on consistent evidence that
assertiveness, achievement striving and leadership were defining characteristics of masculinity
(Abbey et al., 1987; Dennis, & Kunkel, 2004; Drydakis et al., 2018; Heilman, 2012; Heilman &
Saruwatari, 1979). Traditional feminine competencies were less stable across the literature.
However, variations of agreeableness, dependability, and social ability were the most consistent
across perception research (Dennis, & Kunkel, 2004; Drydakis et al., 2018; Howlett et al., 2015;
Karl, McLntyre Hall, & Peluchette, 2013).
Previous research has also failed to provide any practical solutions to contest sex-role-fit
disparities. While there is only a handful of studies regarding women’s work attire and perceptions
of competency, all have failed to offer a practical suggestion to how the sex-role-fit violation can
be mitigated. One potential answer to this conundrum, is to increase perceptions of women’s
masculine characteristics, as suggested by Drydakis, Sidiropoulou and colleagues (2018).
Drydakis examined the way organizations responded to female job applicants who exhibited
masculine or feminine qualities. In this study, job applications were formulated to either display
masculine or feminine qualities of the applicant. Interestingly, they found women who exhibited
masculine characteristics were 4.3% more likely to be hired in both traditional masculine and
feminine roles. Moreover, women who exhibited masculine characteristics received a 10% higher
19
wage offer compared to those who displayed feminine qualities (Drydakis et al., 2018). If
conveying masculine qualities in a job application is able to increase the likelihood a women is
hired for a traditionally male role, could conveying masculine qualities in the workplace also
increase women’s growth into leadership positions? Hypothesis 1 of the current experiment will
seek to answer this question. Furthermore Sánchez and Lehnert (2019) examined the effect of
perceived competency on leadership aspirations of women in America. Sánchez surveyed 599
university faculty, finding women’s leadership aspirations positively correlated with perceptions
of competency (Sánchez, C. M., & Lehnert, K. (2019). Consequently, as traditional female
competencies are perceived as less advantageous in leadership positions, many women do not feel
competent enough to aspire for senior leadership roles. Moreover, the aforementioned study
showed that women in middle management who had aspired for top level management when they
first entered the work force, reported losing interest after facing barriers to top leadership positions
deeply rooted in discrimination and socialization (Sánchez, C. M., & Lehnert, K. (2019). Thus,
could conveying masculine leadership qualities in the workplace increase women’s competencies,
facilitating their growth into leadership positions?
In summary, based on the previous literature in the realm of work-attire and perceptions,
the current experiment aimed to: expand on the understanding of the role women’s attire on
competency in the workplace, provide a robust set of masculine and feminine workplace
competencies for future research, and to provide an empirically driven strategy for reducing
person-role-fit disparity’s for women in the workplace. Drawing from Howlett (2015) and
Gurnug’s (2017) design, the current experiment used a repeated measures design where
participants responded to three conditions. An online questionnaire was used to capture
participants’ competency perceptions of a model wearing conservative and provocative work-
20
attire, and a control condition. No previous research has included a control condition thus, this
experiment has provided future research with a more reliable, and valid design. The current
experiment has also expanded on previous literature by measuring six different competencies using
work competency scales. Three traditionally masculine: assertiveness, leadership, achievement
striving, and three traditionally feminine: agreeableness, dependability, and social ability. Thus,
providing a new robust set of competencies to be used for future work competency research.
To the author’s knowledge, this experiment was the first to examine the effect of
manipulations of work-attire provocativeness and perceptions of competencies in New Zealand.
Moreover, this experiment examined how work-attire provocativeness interacts with perceptions
of traditional masculine and feminine competencies. To the author’s knowledge, this was the first
research of its kind in New Zealand, or elsewhere.
3.0 Method
3.1 Design
Data were collected from a questionnaire to capture New Zealand participant’s perceptions
of a women in her late 20’s, dressed in different work-attires. A full copy of the questionnaire can
be found in Appendix A and B. The experiment used a repeated measures design where
participants viewed and rated three photographs of the model wearing one of three outfits presented
in a randomized order. Participants rated each photo (condition) on perceived traditional
masculine competencies: leadership, assertiveness, and achievement striving, and traditional
feminine competencies: agreeableness, social ability, and dependability (rating order randomized).
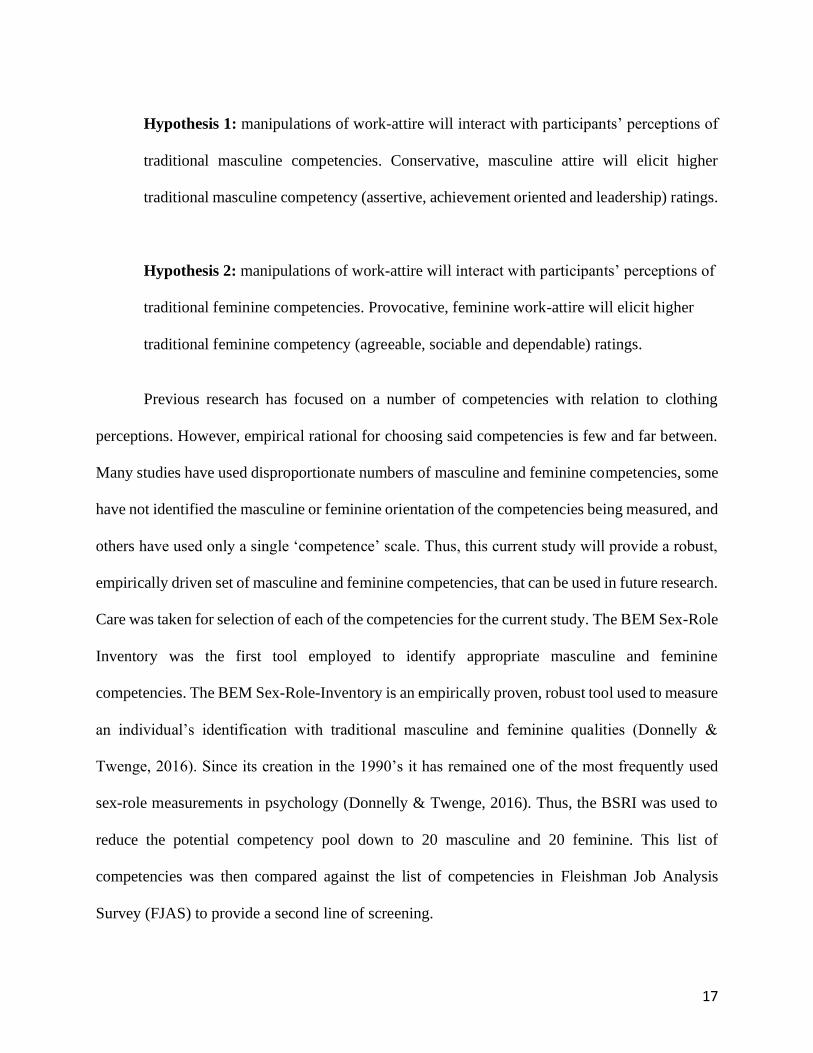
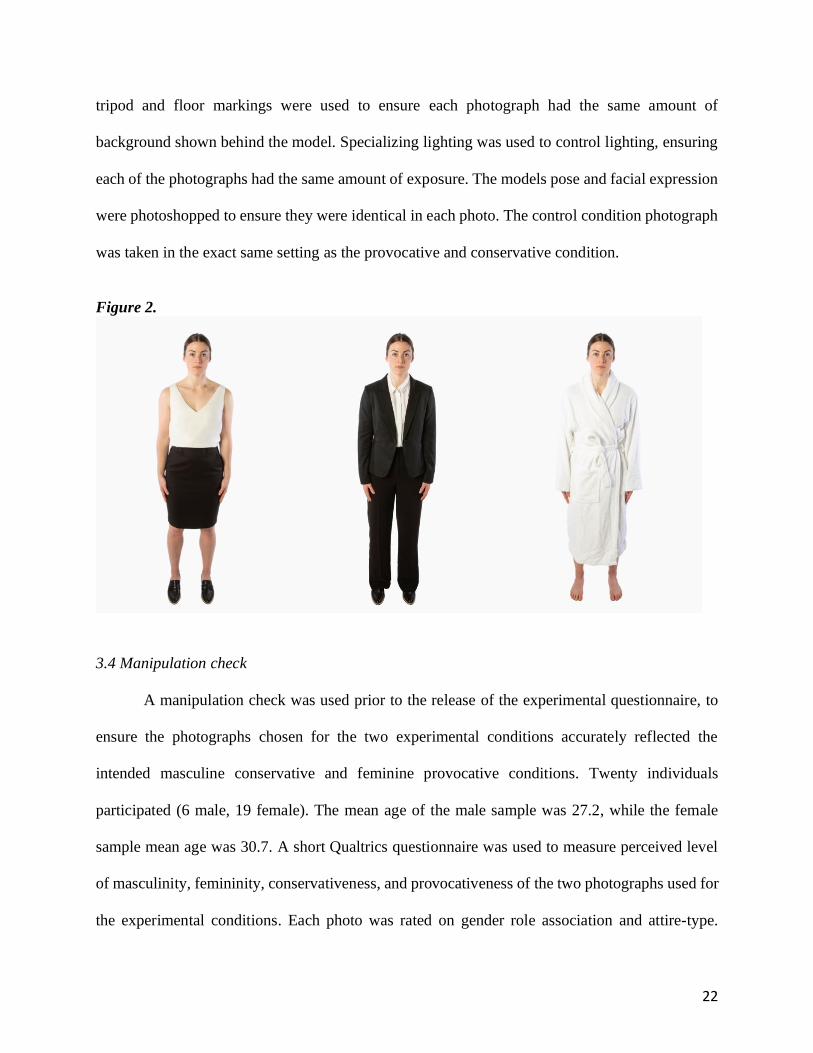
The clothing categories used in the experiment are shown in Figure 2 and are described as:
• Conservative: masculine work-attire (suit pants, buttoned shirt, blazer)
• Provocative: feminine work-attire (camisole, knee length skirt)
21
• Control: unisex work-inappropriate-attire (Ankle length bathrobe)
3.2 Participants
A potential pool of 115 participants were gathered from a large public sector Government
run organization. This organization was selected due to availably however, it proved advantageous
due to its large staff size and its varying business units. A total of 45 responses were obtained, thus
a response rate of 39% was achieved. Unfortunately, 16 rows of data were removed using listwise
deletion due to incomplete responses and satisficing bias. Satisficing bias is when participants
respond to questions based on ease, rather than giving the best answer (Krosnick, Narayan, &
Smith, 1996). Responses that contained satisficing bias could not be applied due to identical
responding for every scale. In addition, incomplete responses were not salvageable by means of
mean substitution due to the large amount of missing ratings. Thus, a total of 29 suitable responses
were included in the analysis for this experiment, still meeting the power analysis criteria.
G*power was used to determine sufficient sample size. To achieve a power of .95, with an effect
size of 0.3, a minimum total N of 20 was deemed satisfactory. The sample obtained was made up
of 14 males and 15 female New Zealand employees currently in full-time work (0.85 FTE or more).
The average age of male participants was 48, while the average age of female participants was 41.
3.3 Photographs
Photographs of the same female in each of the work-attire and control conditions were
taken specifically for the study (see Figure 2). The female was a European New Zealander in her
late 20’s, of average height and build. Photographs of the provocative, conservative and control
attire conditions were taken with the same white background. A professional photographer with a
22
tripod and floor markings were used to ensure each photograph had the same amount of
background shown behind the model. Specializing lighting was used to control lighting, ensuring
each of the photographs had the same amount of exposure. The models pose and facial expression
were photoshopped to ensure they were identical in each photo. The control condition photograph
was taken in the exact same setting as the provocative and conservative condition.
Figure 2.
3.4 Manipulation check
A manipulation check was used prior to the release of the experimental questionnaire, to
ensure the photographs chosen for the two experimental conditions accurately reflected the
intended masculine conservative and feminine provocative conditions. Twenty individuals
participated (6 male, 19 female). The mean age of the male sample was 27.2, while the female
sample mean age was 30.7. A short Qualtrics questionnaire was used to measure perceived level
of masculinity, femininity, conservativeness, and provocativeness of the two photographs used for
the experimental conditions. Each photo was rated on gender role association and attire-type.
23
Gender role association was measured with two scales: masculinity and femininity. Masculinity
was measured using a seven point scale ranging from ‘not at all masculine’ to ‘very masculine’.
Similarly, femininity was measured using a seven point scale ranging from ‘not at all feminine’ to
‘very feminine’. A seven point scale was also used to measure attire type, ranging from: very
conservative to very provocative. The order of the photographs and scales were randomized, with
an approximately equal order of each. Participants were recruited using a convenience sampling
method.
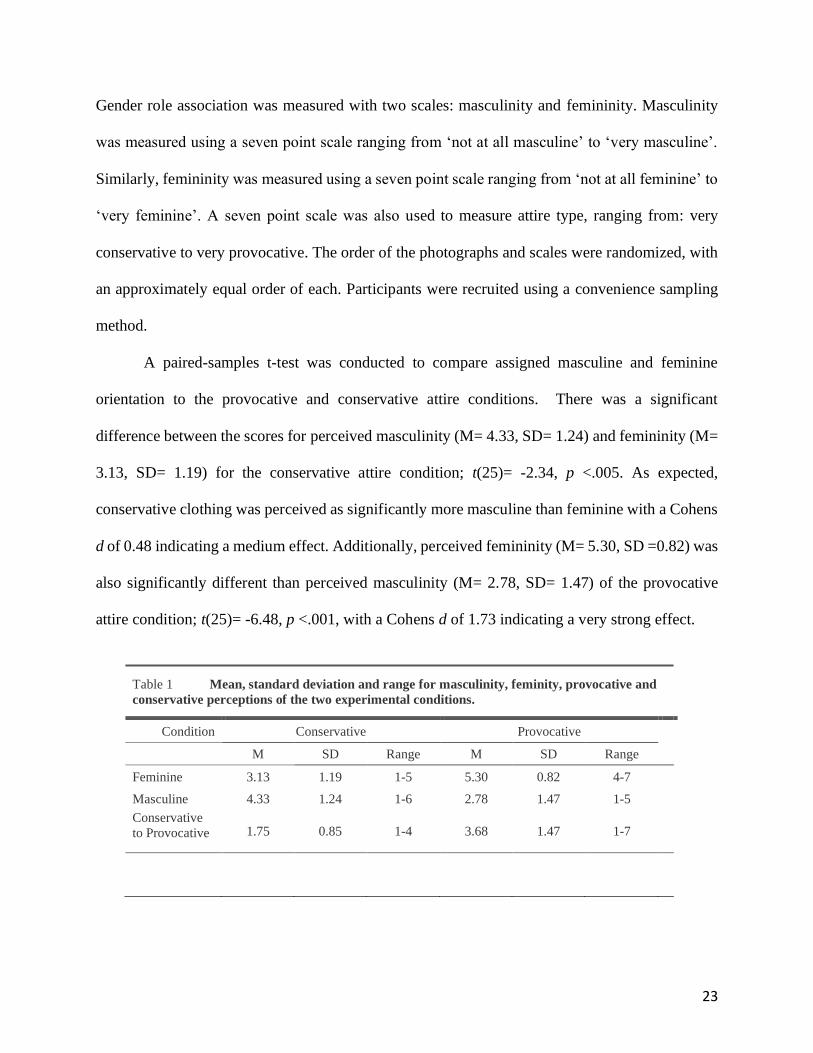
A paired-samples t-test was conducted to compare assigned masculine and feminine
orientation to the provocative and conservative attire conditions. There was a significant
difference between the scores for perceived masculinity (M= 4.33, SD= 1.24) and femininity (M=
3.13, SD= 1.19) for the conservative attire condition; t(25)= -2.34, p <.005. As expected,
conservative clothing was perceived as significantly more masculine than feminine with a Cohens
d of 0.48 indicating a medium effect. Additionally, perceived femininity (M= 5.30, SD =0.82) was
also significantly different than perceived masculinity (M= 2.78, SD= 1.47) of the provocative
attire condition; t(25)= -6.48, p <.001, with a Cohens d of 1.73 indicating a very strong effect.
Table 1 Mean, standard deviation and range for masculinity, feminity, provocative and
conservative perceptions of the two experimental conditions.
Condition Conservative Provocative
M SD Range M SD Range
Feminine 3.13 1.19 1-5 5.30 0.82 4-7
Masculine 4.33 1.24 1-6 2.78 1.47 1-5
Conservative
to Provocative 1.75 0.85 1-4 3.68 1.47 1-7
24
3.5 Experimental Materials
The experimental materials were presented using Qualtrics software. The first section
began with a general information cover page, followed by a descriptive statistic information
collection page. All materials can be found in Appendix A and B. Information on participant
gender, age, ethnicity, current/ most recent job, level of current/ most recent job, and number of
years in current/ most recent job were collected. Consent was also collected in section one. The
second section contained the three conditions and their corresponding measurement scales. The
photos and scales were arranged as follows: one photo appeared (in randomized order) in the
middle of the screen, listed below the photo were each of the seven scales (also in a randomized
order). The photos were coded to follow the participant as they scrolled down the page. This
allowed the photo and the scale to be fully visible at the same time regardless of the device used.
The photos were scaled down to 279px width and 411.21px height using a converter to eliminate
distortion. Upon completion of the scales, the participant would navigate to the next page, and
generate the next photograph and list of scales. This continued until each of the three conditions
were viewed and rated. The order of the three photos was randomized. Thus, there was nine
possible orders. The random ordering of photographs were counterbalanced to ensure each
condition appeared in each position an equal number of times. The order of the scales listed below
each photo were also randomized to control for respondent fatigue.
3.6 Dependent variables
Six single item Fleishman’s Job Analysis Scales (Fleishman & Reilly, 1995) were used in
the experiment to rate individual competencies. Three traditionally associated with masculinity:
leadership, assertiveness, and achievement striving, and three traditionally associated with
25
femininity: agreeableness, social ability, and dependability. Each scale began with a definition of
the competency, followed by a sliding scale ranging from one to seven. Given that each construct
was measured with a single item scale it was not possible to calculate scale alpha values.
Competency definitions were quoted directly from the FJAS inventory, however the
anchored ratings attached the FJAS were removed as the examples used were not relevant to the
experiment at hand. Each of the seven point scales were labeled from “not at all [agreeable/
sociable/ dependable/ leader oriented / assertive/ achievement oriented]” to “extremely [agreeable/
sociable/ dependable/ leader oriented / assertive/ achievement oriented]”. In addition, the FJAS
titles “social sensitivity” and “leadership” were changed. These titles were unsuitable for the Likert
type scale as they would read “not at all leadership” and “extremely leadership”. Thus, leadership
was changed to leader oriented and social sensitivity was changes to sociable.
3.7 Procedure
The Qualtrics link was sent out via email (Appendix C) to potential participants. The study
was open for a duration of seven days. Once the participant clicked the link, they were presented
with a general information page. The page informed participants of the estimated completion time,
five to ten minutes respectably. Participants were informed that the study aim was to gather
information on perceptions in the New Zealand workplace. A contact email for the supervising
professor was given at this time, and participants were prompted to make contact if they that any
questions or concerns. Confidentiality of the participant was also ensured at this time. Participants
were then informed that completion of the study indicated that they consented to their data being
used for the purpose of the study. Navigating to the next page began the study, presenting the first
photograph. The photograph appeared in the middle of the screen. Below the photo was the six
26
competency scales in randomized order. This format continued for each of the three randomly
ordered photographs. Once all three photos were rated the participant was thanked and logged off.
4.0 Results
The participants ranged in job function and level with 35.7% working in corporate
positions, 21.4% in trades and services, and 21.4% in information technology. The remaining
21.5% were made up of construction workers, aviation specialists, and science and technology
specialists. 32.1% of participants were in senior management positions, followed by supervisors
at 17.8% and managers at 14.2%. The remaining 35.9% was made up of graduate roles, entry level
workers, team leaders and chief executive officers. The mean duration of participants most recent
or current role was 5.36 years, with a range of 1 to 40 years. These results suggest the sample as a
whole had a sufficient exposure to different work attire over time from a range of business units
and levels.
Prior to analysis the raw data was examined for bias and errors. Due to the presence of
incomplete responses, and satisficing bias 16 rows of data were excluded using listwise deletion.
Satisficing bias is when participants respond to questions based on ease, rather than giving the best
answer (Krosnick, Narayan, & Smith, 1996). Responses that contained satisficing bias could not
be applied due to identical responding for every scale. In addition, incomplete responses were not
salvageable by means of mean substitution due to the large amount of missing ratings. Descriptive
statistics were then gathered. Mean ratings, standard deviations and ranges for the six
competencies scales for each attire condition were calculated are shown in Table 2. Mean
competency ratings for each attire condition, at first glance seem to be in line with predictions.
The conservative condition elicited the highest mean ratings for assertiveness, achievement
orientation and agreeableness. The provocative condition produced the highest mean ratings for
27
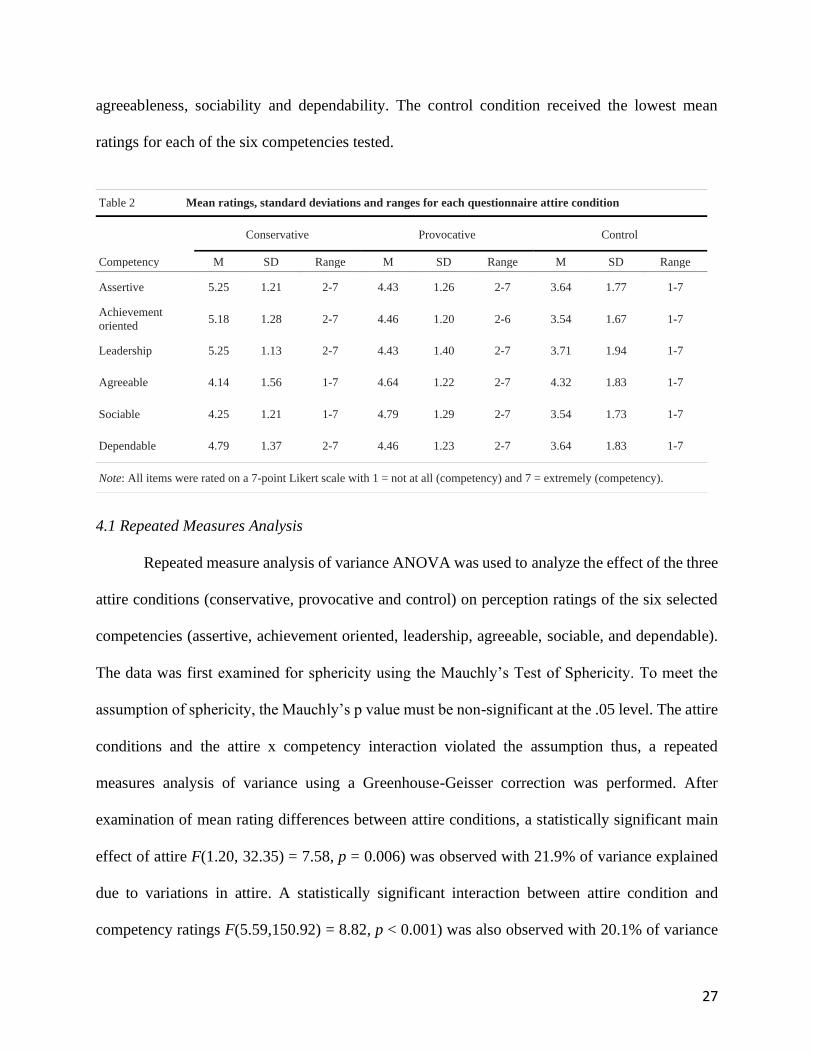
agreeableness, sociability and dependability. The control condition received the lowest mean
ratings for each of the six competencies tested.
4.1 Repeated Measures Analysis
Repeated measure analysis of variance ANOVA was used to analyze the effect of the three
attire conditions (conservative, provocative and control) on perception ratings of the six selected
competencies (assertive, achievement oriented, leadership, agreeable, sociable, and dependable).
The data was first examined for sphericity using the Mauchly’s Test of Sphericity. To meet the
assumption of sphericity, the Mauchly’s p value must be non-significant at the .05 level. The attire
conditions and the attire x competency interaction violated the assumption thus, a repeated
measures analysis of variance using a Greenhouse-Geisser correction was performed. After
examination of mean rating differences between attire conditions, a statistically significant main
effect of attire F(1.20, 32.35) = 7.58, p = 0.006) was observed with 21.9% of variance explained
due to variations in attire. A statistically significant interaction between attire condition and
competency ratings F(5.59,150.92) = 8.82, p < 0.001) was also observed with 20.1% of variance
Table 2 Mean ratings, standard deviations and ranges for each questionnaire attire condition
Conservative Provocative Control
Competency M SD Range M SD Range M SD Range
Assertive 5.25 1.21 2-7 4.43 1.26 2-7 3.64 1.77 1-7
Achievement
oriented 5.18 1.28 2-7 4.46 1.20 2-6 3.54 1.67 1-7
Leadership 5.25 1.13 2-7 4.43 1.40 2-7 3.71 1.94 1-7
Agreeable 4.14 1.56 1-7 4.64 1.22 2-7 4.32 1.83 1-7
Sociable 4.25 1.21 1-7 4.79 1.29 2-7 3.54 1.73 1-7
Dependable 4.79 1.37 2-7 4.46 1.23 2-7 3.64 1.83 1-7
Note: All items were rated on a 7-point Likert scale with 1 = not at all (competency) and 7 = extremely (competency).
28
explained due to the interaction. Thus, a potential large main effect of attire type on competency
ratings was plausible as both of these results exceeded the .14 explained variance criteria (Miles
& Shevlin, 2001). However, which competencies each condition was effecting required further
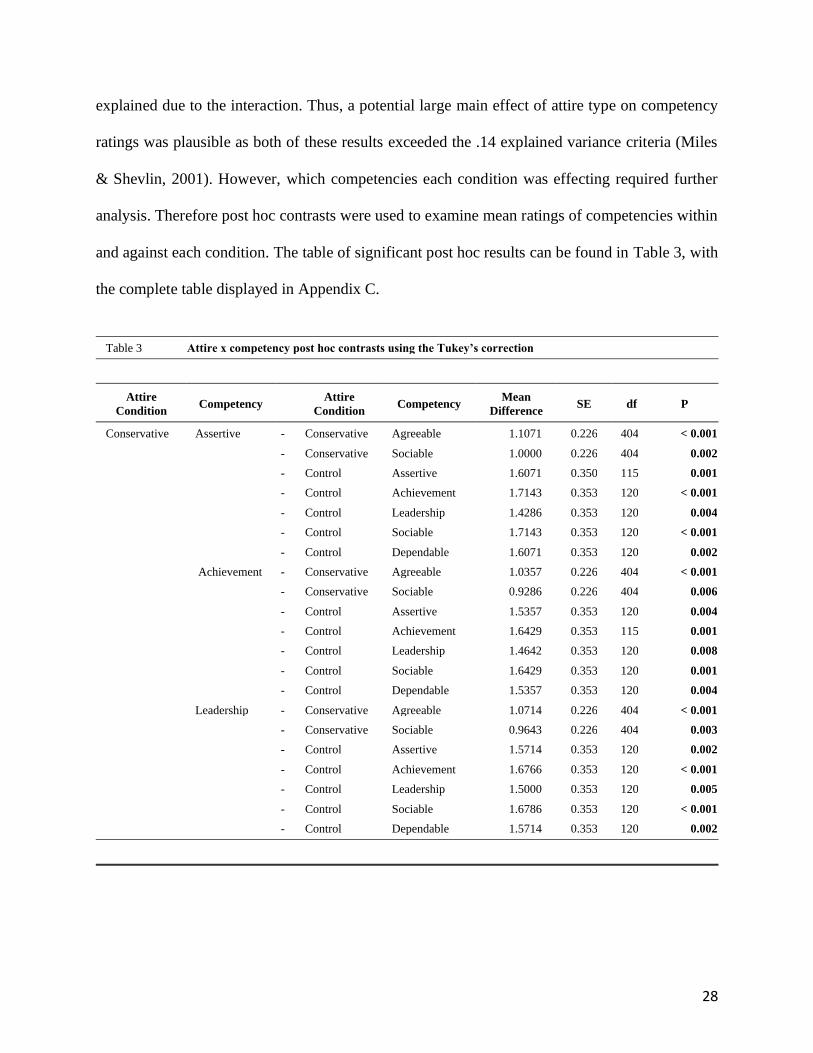
analysis. Therefore post hoc contrasts were used to examine mean ratings of competencies within
and against each condition. The table of significant post hoc results can be found in Table 3, with
the complete table displayed in Appendix C.
Table 3 Attire x competency post hoc contrasts using the Tukey’s correction
Attire
Condition Competency
Attire
Condition Competency
Mean
Difference SE df P
Conservative Assertive - Conservative Agreeable 1.1071 0.226 404 < 0.001
- Conservative Sociable 1.0000 0.226 404 0.002
- Control Assertive 1.6071 0.350 115 0.001
- Control Achievement 1.7143 0.353 120 < 0.001
- Control Leadership 1.4286 0.353 120 0.004
- Control Sociable 1.7143 0.353 120 < 0.001
- Control Dependable 1.6071 0.353 120 0.002
Achievement - Conservative Agreeable 1.0357 0.226 404 < 0.001
- Conservative Sociable 0.9286 0.226 404 0.006
- Control Assertive 1.5357 0.353 120 0.004
- Control Achievement 1.6429 0.353 115 0.001
- Control Leadership 1.4642 0.353 120 0.008
- Control Sociable 1.6429 0.353 120 0.001
- Control Dependable 1.5357 0.353 120 0.004
Leadership - Conservative Agreeable 1.0714 0.226 404 < 0.001
- Conservative Sociable 0.9643 0.226 404 0.003
- Control Assertive 1.5714 0.353 120 0.002
- Control Achievement 1.6766 0.353 120 < 0.001
- Control Leadership 1.5000 0.353 120 0.005
- Control Sociable 1.6786 0.353 120 < 0.001
- Control Dependable 1.5714 0.353 120 0.002
29
4.2 Hypothesis Testing
Post hoc contrasts were performed using the more conservative Tukey’s correction to
determine if the provocative and conservative attire conditions had a significant impact on
perceived feminine and masculine competencies. Upon examination, it was discovered that the
conservative condition was the only condition to demonstrate meaningful differences in
competency ratings. In line with predictions, the model in the conservative attire was perceived
as; significantly more assertive (M = 5.25, SD = 1.21) leadership oriented (M = 5.25, SD = 1.21)
and achievement oriented (M = 5.18, SD = 1.28), when compared to ratings of agreeableness (M
= 4.14, SD = 1.56) and sociability (M = 4.25, SD = 1.37). Thus, masculine competency ratings
were significantly higher than feminine competencies.
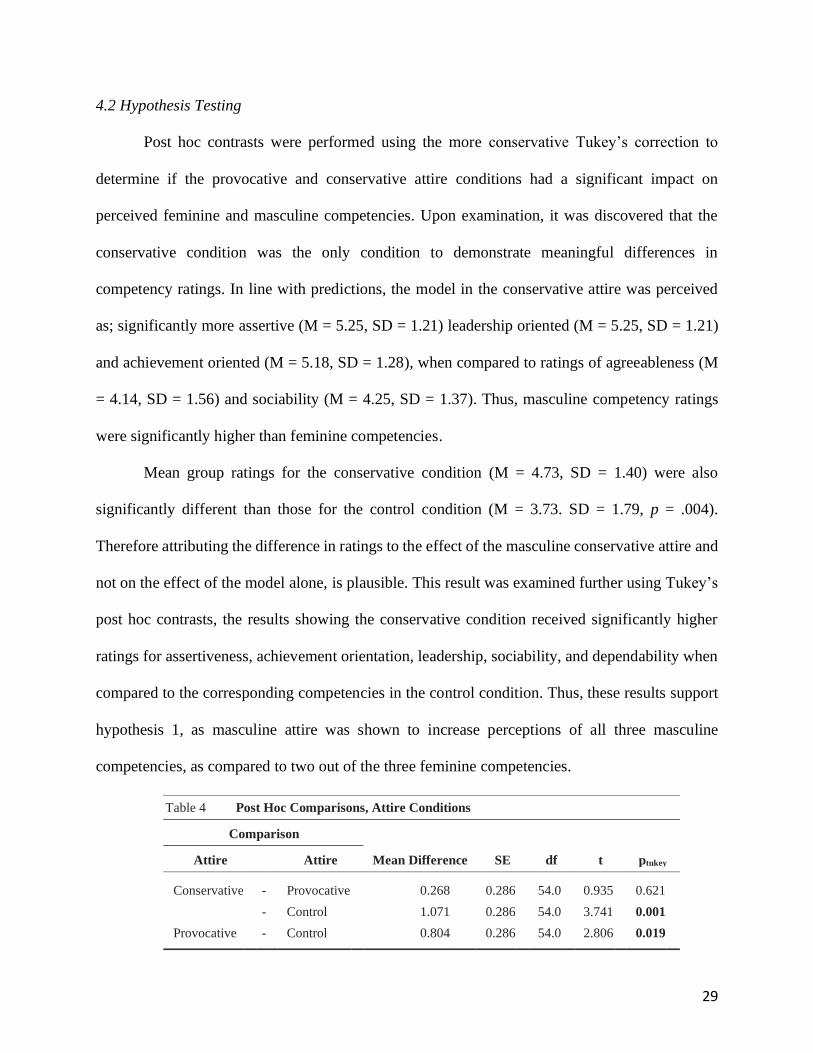
Mean group ratings for the conservative condition (M = 4.73, SD = 1.40) were also
significantly different than those for the control condition (M = 3.73. SD = 1.79, p = .004).
Therefore attributing the difference in ratings to the effect of the masculine conservative attire and
not on the effect of the model alone, is plausible. This result was examined further using Tukey’s
post hoc contrasts, the results showing the conservative condition received significantly higher
ratings for assertiveness, achievement orientation, leadership, sociability, and dependability when
compared to the corresponding competencies in the control condition. Thus, these results support
hypothesis 1, as masculine attire was shown to increase perceptions of all three masculine
competencies, as compared to two out of the three feminine competencies.
Table 4 Post Hoc Comparisons, Attire Conditions
Comparison
Attire Attire Mean Difference SE df t ptukey
Conservative - Provocative 0.268 0.286 54.0 0.935 0.621
- Control 1.071 0.286 54.0 3.741 0.001
Provocative - Control 0.804 0.286 54.0 2.806 0.019
30
However, the provocative condition ratings, did not differ significantly when compared to
the ratings for the other conditions. Mean ratings for each of the three feminine competencies
(agreeable, dependable and sociable) measured were not significantly different in the provocative
condition, nor were any of the three masculine competencies (assertive, leadership and
achievement oriented). Despite discovering the control condition was significantly different than
the provocative condition (M = 3.73. SD = 1.79, p = .023) no significant difference between
competency ratings was observed. Thus, these results did not support hypothesis 2, as there was
no significant difference in feminine competency ratings as related to the feminine provocative
attire. A discussion around the interpretation and limitations of these results are explored
hereunder.
5.0 Discussion
The aim of this experimental research was to examine whether manipulations to the
provocativeness or conservativeness of women’s work-attire could impact working New
Zealanders perceptions of a women’s masculine and feminine competencies. Specifically, this
study explored two hypotheses: Hypothesis 1 proposed wearing masculine, conservative work
attire could increase perceptions of women’s masculine competencies (assertive, achievement
oriented and leadership) as compared to feminine competencies. Hypothesis 2 proposed that
wearing feminine, provocative work attire could increases perceptions of women’s perceived
feminine competencies (agreeable, sociable and dependable) as compared to the tested masculine
competencies. Hypotheses were tested using repeated measures analysis of variance using a
Greenhouse-Geisser correction due to violation of sphericity. The analysis signaled significant
31
differences between attire conditions as well as significant interactions between attire and
competency ratings.
Post hoc results suggested participants perceived the individual in the masculine
conservative attire condition as significantly higher in assertiveness, leadership and achievement
orientation as compared to the feminine competency of sociability and agreeableness. In addition
participants perceived the conservative masculine condition as significantly higher in
assertiveness, achievement orientation, leadership, sociability, and dependability as compared to
the corresponding competencies perceptions of the control condition. Thus, these results support
hypothesis 1, as masculine attire was shown to increase perceptions all three masculine
competencies (assertiveness, achievement orientation and leadership), as compared to two out of
the three feminine competencies (agreeableness and dependability). These results are consistent
with findings from previous research (Howlett et al., 2015; Glick, Larsen, Johnson, & Branstiter,
2005; Gurung, Punke, Brinker, & Vincezio, 2017). These results suggest women may increase
perceptions of key work related masculine competencies by wearing suit pants, a shirt and a blazer.
Thus, by dressing in traditional masculine work attire women may be able to reduce the person-
role-fit violation that can occur when women are evaluated for or in traditional masculine positions
such as a managerial or senior leadership roles.
However, contrary to previous findings, the provocative condition showed no significant
effect on any of the six competencies tested. However, participant mean ratings of the feminine
competency were trending in the predicted direction. Participants rated the individual in the
feminine provocative attire as less assertive, leader oriented and achievement oriented as compared
to the conservative masculine attire. Moreover, participants also rated the provocative attire higher
in the three feminine competencies as compared to both the control and masculine conservative
32
attire. However significance differences between mean ratings were not achieved, therefore
hypothesis 2 was ultimately rejected.
This finding conflicts with previous research by Howlett et.al (2015) Glick (2005) and
Gurung, Punke, Brinker, & Vincezio (2017) who’s findings suggest that wearing a blouse with an
exposed neckline and a skirt above the knee was enough to significantly decrease perceptions of
competency. Reasons this current study may not have reached the same result could be due to
cultural differences. These previous studies were conducted in the United Kingdom and the United
States of America where the leadership gap is considerably larger than that of New Zealand. New
Zealand has had longer exposure and normalization of women in power such as prime ministers;
Helen Clarke (1999-2008), and Jacinda Ardern (2017-current). It maybe that femininity is not
viewed as such a disadvantage in New Zealand as compared to the UK and USA. The major
difference between the current experiment and previous research however, is that Howellt and
Gurung summed the means of each competency rating together to create a ‘global’ competency
score. In the case of Howlett, this global score included the mean ratings for ’confidence’ which
the author later shows to be non-significant. Thus, their findings and how they drew their
conclusions may not be justifiable.
5.1 Implication and Application for this Study
The findings of this research may help our understanding of competencies that are
stereotypically associated with women in the workplace based on their attire. Competencies
traditionally associated with women are often cataloged under communality, and are associated
with empathy, social sensitivity and loyalty (Dennis, & Kunkel, 2004; Heliman, 2012; Drydakis
et al., 2018). These traditional feminine qualities are often marked as disadvantageous in a
33
leadership positions (Drydakis et al., 2018; Howlett et al., 2015). Conversely traditional male
characteristics catalogued under agency, are associated with highly advantageous outcomes. These
include: achievement orientation, assertiveness, leadership, emotional control, and technical
competence. All competencies that have been identified as valuable in leadership positions
(Dennis, & Kunkel, 2004; Heliman, 2012; Drydakis et al., 2018). It is plausible this common
association may therefore be a contributing factor to the large and enduring leadership gap in the
New Zealand workforce. The findings of this experiment support the notion that by manipulating
work-attire, women may be able increase perceptions of advantageous competencies that are not
commonly attributed to women. Thereby reducing the person-role-fit disparity often attributed to
women in traditional masculine roles.
The results of this study however, also showed that there’s no significant advantage of
dressing feminine. In this study, feminine attire did not meaningfully effect perceptions of any of
the six competencies tested. Thus, contrary to what was hypothesized, dressing feminine did not
increase feminine competencies and nor did it decrease masculine competencies. It seems, that the
degree of feminine work attire used in this experiment has no competency advantage in the
workplace, yet this does not mean there is no disadvantage. A disadvantage in this case is not
limited to a reduction in perceptions of competence, rather, a disadvantage is merely a condition
that reduces the chances of success. As demonstrated, competency ratings of the control condition
were similar to that of the feminine condition. Thus, it is assumed the attire made no impact on
perceptions above and beyond what was already attributed to the individual. In line with previous
literature, it is possible that men in masculine attire would also not be perceived as anything above
and beyond what is already perceived about the individual. The issue here is that men are naturally
perceived as more competent than women. Which is why the masculine condition increased
34
perceptions of competencies, because the masculine cue has a higher baseline of perceived
competency as compared to the baseline for feminine cues. Therefore this points to an unconscious
bias among New Zealanders that women are women, but men are more.
5.2 Limitations & Future Research
This study however, was no exception to limitations. Sample size was much smaller than
expected, only exceeding the minimum power criteria by eight responses. One potential
explanation for the small sample size was the nature of the questionnaire. In total, 16 responses
were either incomplete or subjected to bias. The survey on average took participants less than four
minutes to complete so the length of the questionnaire was not unattractively long. Nevertheless,
the repetitiveness of the questioning may have caused participants to become fatigued and either
exit the questionnaire, or repeat the same rating for every question until the questionnaire was
complete. This is not unusual in repeated measure designs thus, future research should explore
additional ways of holding participant attention to increase sample size. Perhaps the use of a
between groups design with random assignment to groups could be used as an alternative. Thus,
participants would only receive one of the conditions for rating, therefore removing the need to
answer the same questions three times over, as well as reducing the time of completion, and risk
of fatigue.
Another limiting factor that may have impacted the results was the manipulation of the
attire conditions. In the current study a non-result was found for the provocative condition. One
plausible explanation for the non-result in this current experimental research could be a weak
manipulation. Care was taken to test the strength of the manipulation prior to undertaking the
experiment. The results indicated that the provocative condition was significantly different from
35
the masculine condition however, the mean rating for the provocativeness of the condition (M =
3.68, SD = 1.47) was relatively low. This result equated to “slightly conservative” on the seven
point scale used which ranged from very conservative (1) to very provocative (7). Although the
median rating was slightly higher, reaching 4.0 it was still not high enough to be considered in the
provocative domain. The literature used to form the theoretical bases indicated that gender based
stereotyping could be triggered by feminine cues. However, it appears provocativeness may play
a more influential role in impacting perceptions of competency. Thus, future manipulation should
aim to reach a “slightly provocative” level, as well as “very feminine” levels.
The current research was also limited to testing attire manipulation on a comparatively
young female model, which may not fit well with the age cohorts applying for senior managerial
roles. Thus, future research could expand on practical and social contributions by also examining
competency perceptions of an older female model. In addition, future research could also
examine males perceived competencies based on attire type. This would allow for more
meaningful comparisons of the disadvantages women may experience as a result of gender
biases triggered by feminine attire cues in the workplace. Moreover, separation and comparison
of male and female participant perceptions could be examined, as previous research shows men
and women perceive other women differently (Abbey et al., 1987; Dennis, 2004; Awasthi, 2017).
However, in this study the male/female sample sizes were simply too low to include gender as a
factor in the analyses.
Finally, like all research conducted in 2020, the generalization of findings of this study
are limited to the current climate of the COVID19 pandemic. Representation of powerful women
in media has become incredibly common with Prime Minister Jacinda Ardern being nationally
broadcast multiple times a day during the worst of the COVID pandemic in New Zealand. This
36
normalization of women in powerful traditional masculine roles may have impacted competency
ratings in the current study.
5.3 Conclusion
The current study gives important insight into how New Zealanders perceive
competencies of women in the workplace based on their attire. The results of this study highlight
that women may be able to increase perceptions of traditional male competencies by wearing suit
pants, a shirt and a blazer. Specifically, by doing this woman may be able to increase perceptions
of assertiveness, leadership and achievement orientation. Thus, this research has identified a
new tool women can use in the effort to reduce the leadership gap and person-role-fit violations.
Additionally this research has highlighted that dressing in a moderately feminine way may not
have any competency perceptual advantage, and therefore women maybe at a constant
disadvantage as compared to males, who maybe naturally attributed with the same benefits in
perceptions observed with the masculine attire condition. Further research could expand on these
findings by replicating the study using a male model to determine perception differences. Yet,
perhaps the most encouraging finding is that perceptions of women in feminine attire do not
significantly decrease like they have in previous minor provocative attire studies, conducted in
the UK and the USA. Perhaps New Zealand perceptions of women are changing, and perhaps in
the coming decade, New Zealand will finally experience a six year overdue reduction in the
leadership gap.
37
References
Abbey, A., Cozzarelli, C., McLaughlin, K., & Harnish, R. J. (1987). The Effects of Clothing and
dyad sex composition on perceptions of sexual intent: Do women and men evaluate these
cues differently. Journal of Applied Social Psychology, 17(2), 108-126.
doi:10.1111/j.1559-1816.1987.tb00304.x
Ashmore, R. D., & Del Boca, F. K. (1979). Sex stereotypes and implicit personality theory:
Toward a cognitive-social psychological conceptualization. Sex Roles, 5(2), 219-248.
doi:10.1007/BF00287932
Austin, H. M. (2016). Women in education, science and leadership in New Zealand: a personal
reflection. Studies in Higher Education, 41(5), 914-919.
Awasthi, B. (2017). From attire to assault: Clothing, objectification, and de-humanization - a
possible prelude to sexual violence? Frontiers in psychology, 8, 338-338.
doi:10.3389/fpsyg.2017.00338
Bem, D. J. (1972). Self-perception theory. Advances in Experimental Social Psychology, 6(1), 1-
62.
Bonnet, J. L., & McAlexander, B. (2013). First impressions and the reference encounter: The
influence of affect and clothing on librarian approachability. Journal of Academic
Librarianship, 39(4), 335-346. doi:10.1016/j.acalib.2012.11.025
Brase, G. L., & Richmond, J. (2004). The white–coat effect: Physician attire and perceived
authority, friendliness, and attractiveness. Journal of Applied Social Psychology, 34(12),
2469-2481. doi:10.1111/j.1559-1816.2004.tb01987.x
38
Burt, C. D., Halloumis, S.A., McIntyre. S., & Blackmore, H. S. (2010). Using colleague and
team photographs in recruitment advertisements: Effects on applicant attraction. Asia
Pacific Journal of Human Resources 48(2). doi:10.1177/1038411109355358.
Cardon, P. W., & Okoro, E. A. (2009). Professional characteristics communicated by formal
versus casual workplace attire. Business Communication Quarterly, 72(3), 355-360.
doi:10.1177/1080569909340682
Carr, D. L., Davies, T. L., & Lavin, A. M. (2010). The impact of instructor attire on college
student satisfaction. College Student Journal, 44(1), 101-111.
Chatelain, A. M. (2015). The effect of academics’ dress and gender on student perceptions of
instructor approachability and likeability. Journal of Higher Education Policy &
Management, 37(4), 413-423. doi:10.1080/1360080X.2015.1056598
Davis, L. L., & Lennon, S. J. (1988). Social cognition and the study of clothing and human
behavior. Social Behavior & Personality: An International Journal, 16(2).
Davies, S. (2018) Proportion of women in NZ senior leadership roles has hit rock bottom.
Retrieved from https://www.grantthornton.co.nz/press/press-releases-2018/proportion-of-
women-in-nz-senior-leadership-roles-has-hit-rock-bottom/
De Casanova, E. M. (2015). Buttoned up: Clothing, conformity, and white-collar masculinity:
Cornell University Press.
Dennis, M. R., & Kunkel, A. D. (2004). Perceptions of men, women, and CEOs: The effects of
gender identity. Social Behavior and Personality, 32(2), 155-171.
doi:http://dx.doi.org/10.2224/sbp.2004.32.2.155
39
Donnelly, K., & Twenge, J. M. (2017). Masculine and feminine traits on the bem sex-role
inventory, 1993–2012 a cross-temporal meta-analysis. Sex Roles, 76(9-10), 556-565.
doi:10.1007/s11199-016-0625-y
Drydakis, N., Sidiropoulou, K., Bozani, V., Selmanovic, S., & Patnaik, S. (2018). Masculine vs
feminine personality traits and women’s employment outcomes in britain: A field
experiment. International Journal of Manpower, 39(4), 621-630. doi:10.1108/IJM-09-
2017-0255
Ericksen, M. K., & Sirgy, M. J. (1992). Employed females' clothing preference, self‐image
congruence, and career anchorage. Journal of Applied Social Psychology, 22(5), 408-422.
Fiske, S. T., & Taylor, S. E. (2013). Social cognition: From brains to culture (2nd ed.). London:
SAGE.
Fleishman, E. A., & Reilly, M. E. (1995). Fleishman job analysis survey (F-JAS). Management
Research Institute.
Forsythe, S. M. (1987). Effect of clothing on perception of masculine and feminine managerial
traits. Perceptual and Motor Skills, 65(2), 531-534.
Forsythe, S. M. (1990). Effect of applicant's clothing on interviewer's decision to hire. Journal of
Applied Social Psychology, 20(19), 1579-1595.
Franz, T., & Norton, S. T. (2001). Investigating business casual dress policies: Questionnaire
development and exploratory research. Applied HRM Research, 6(2), 79.
Gilman, C. P. (2002). The dress of women: A critical introduction to the symbolism and
sociology of clothing (No. 193). Greenwood Publishing Group.
Glick, P., Larsen, S., Johnson, C., & Branstiter, H. (2005). Evaluations of sexy women in low-
and high-status jobs. Psychology of Women Quarterly, 29(4), 389-395.
40
Graff, K., Murnen, S., & Smolak, L. (2012). Too sexualized to be taken seriously? perceptions of
a girl in childlike vs. sexualizing clothing. Sex Roles, 66(11-12), 764-775.
doi:10.1007/s11199-012-0145-3
Gurney, D. J., Howlett, N., Pine, K., Tracey, M., & Moggridge, R. (2017). Dressing up posture:
The interactive effects of posture and clothing on competency judgements. The British
Journal of Psychology, 108(2), 436-451. doi:10.1111/bjop.12209
Gurung, R. A. Punke, E., Brickner, M., & Badalamenti, V. (2018). Power and provocativeness:
The effects of subtle changes in clothing on perceptions of working women. Journal of
Social Psychology, 158(2), 252-255. Retrieved from
http://ezproxy.canterbury.ac.nz/login?url=https://search.ebscohost.com/login.aspx?direct
=true&db=s3h&AN=127437135&site=ehost-live
Gurung, R. A., Brickner, M., Leet, M., & Punke, E. (2018). Dressing “in code”: Clothing rules,
propriety, and perceptions. Journal of Social Psychology, 158(5), 553-557.
doi:10.1080/00224545.2017.1393383
Haslett, B., Geis, F. L., & Carter, M. R. (1992). The organizational woman: Power and paradox:
Greenwood Publishing Group.
Heilman, M. E. (1983). Understanding occupational sex bias. Research in organizational
behavior (Vol. 5). JAI Greenwich, CT.
Heilman, M. E. (2012). Gender stereotypes and workplace bias. Research in Organizational
Behavior, 32, 113-135.
Heilman, M. E., & Saruwatari, L. R. (1979). When beauty is beastly: The effects of appearance
and sex on evaluations of job applicants for managerial and nonmanagerial jobs.
41
Organizational Behavior and Human Performance, 23(3), 360-372.
doi:https://doi.org/10.1016/0030-5073(79)90003-5
Heilman, M. E., & Stopeck, M. H. (1985). Being attractive, advantage or disadvantage?
Performance-based evaluations and recommended personnel actions as a function of
appearance, sex, and job type. Organizational Behavior and Human Decision Processes,
35(2), 202-215. doi:https://doi.org/10.1016/0749-5978(85)90035-4
Howlett, N., Pine, K., Cahill, N., Orakçıoğlu, İ., & Fletcher, B. (2015). Unbuttoned: The
interaction between provocativeness of female work attire and occupational status. Sex
Roles, 72(3-4), 105-116. doi:10.1007/s11199-015-0450-8
Karl, K. A., McLntyre Hall, L., & Peluchette, J. V. (2013). City employee perceptions of the
impact of dress and appearance: You are what you wear. Public Personnel Management,
42(3), 452-470. doi:10.1177/0091026013495772
Kaiser, S. B. (1983). Toward a contextual social psychology of clothing: A synthesis of symbolic
interactionist and cognitive theoretical perspectives. Clothing and Textiles Research
Journal, 2(1), 1-9.
Karunarathne, P., & Hettiarachchi, U. (2019). The impression of work wear attire in the apparel
industry.
Kellerman, J. M., & Laird, J. D. (1982). The effect of appearance on self‐perceptions. Journal of
Personality, 50(3), 296-351.
Kelley, H. H., & Michela, J. L. (1980). Attribution theory and research. Annual review of
psychology, 31(1), 457-501.
Kellie, D. J., Blake, K. R., & Brooks, R. C. (2019). What drives female objectification? An
investigation of appearance-based interpersonal perceptions and the objectification of
42
women. Public Library of Science One, 14(8).
doi:http://dx.doi.org/10.1371/journal.pone.0221388
Kiddie, T. (2009). Recent trends in business casual attire and their effects on student job seekers.
Business Communication Quarterly, 72(3), 350-354. doi:10.1177/1080569909340681
Krosnick, J. A., Narayan, S. S., & Smith, W. R. (Eds.). (1996). Satisficing in surveys initial
evidence Braverman, M. T., & Slater, J. K. (Eds.). Advances in survey research (pp. 29–
44). San Francisco: Jossey-Bass
Kwon, Y.-H. (1994). The influence of appropriateness of dress and gender on the self-perception
of occupational attributes. Clothing and Textiles Research Journal, 12(3), 33-39.
Kwon, Y.-H., & Johnson-Hillery, J. (1998). College students' perceptions of occupational
attributes based on formality of business attire. Perceptual and Motor Skills, 87(3), 987-
994.
Lennon, S. J. (1990). Effects of clothing attractiveness on perceptions. Home Economics
Research Journal, 18(4), 303-310.
Littlefield, Y. (1994). Dress codes erode. The Journal of Business Strategy, 15(4), 7.
Miles, J., & Shevlin, M. (2001). Applying regression and correlation: A guide for students and
researchers. SAGE.
Peluchette, J. V., & Karl, K. (2007). The impact of workplace attire on employee self-
perceptions. Human Resource Development Quarterly, 18(3), 345-360.
doi:10.1002/hrdq.1208
Peluchette, J. V., Karl, K., & Rust, K. (2006). Dressing to impress: Beliefs and attitudes
regarding workplace attire. Journal of Business and Psychology, 21(1), 45-63. Retrieved
from www.jstor.org/stable/25473469
43
Piacentini, M., & Mailer, G. (2004). Symbolic consumption in teenagers' clothing
choices. Journal of Consumer Behaviour: An International Research Review, 3(3), 251-
262.
Rafaeli, A., & Pratt, M. G. (1993). Tailored meanings: On the meaning and impact of
organizational dress. The Academy of Management Review, 18(1), 32-55.
doi:10.2307/258822
Rafaeli, A., Dutton, J., Harquail, C. V., & Mackie-Lewis, S. (1997). Navigating by attire: The
use of dress by female administrative employees. Academy of Management Journal,
40(1), 9-45.
Ruoh-Nan, Y., Yurchisin, J., & Watchravesringkan, K. (2011). Does formality matter? Effeccts
of employee clothing formality on consumers’ service quality expectations and store
image perceptions. International Journal of Retail & Distribution Management, 39(5),
346-362.
Saiki, D. (2013). Identification of workplace dress by low-income job seekers. Journal of
Employment Counseling, 50(2), 50-58. doi:10.1002/j.2161-1920.2013.00024.x
Sánchez, C. M., & Lehnert, K. (2019). The unbearable heaviness of leadership: The effects of
competency, negatives, and experience on women's aspirations to leadership. Journal of
Business Research, 95, 182-194. doi:https://doi.org/10.1016/j.jbusres.2018.10.033
Sebastian, R. J., & Bristow, D. (2008). Formal or informal? The impact of style of dress and
forms of address on business students' perceptions of professors. Journal of Education for
Business, 83(4), 196-201. doi:10.3200/JOEB.83.4.196-201
44
Shet, S. V., Patil, S., & Chandawarkar, M. R. (2019). Competency based superior performance
and organizational effectiveness. International Journal of Productivity and Performance
Management.
Smith, J. K., Liss, M., Erchull, M. J., Kelly, C. M., Adragna, K., & Baines, K. (2018). The
relationship between sexualized appearance and perceptions of women’s competence and
electability. Sex Roles, 79(11/12), 671-682. doi:10.1007/s11199-018-0898-4
Solomon, M. R., & Douglas, S. P. (1987). Diversity in product symbolism: The case of female
executive clothing. Psychology & Marketing, 4(3), 189-212.
doi:10.1002/mar.4220040304
Sullivan, S. E. (1997). Do clothes really make the woman? The use of attire to enhance work
performance. The Academy of Management Executive (1993-2005), 11(4), 90-91.
Retrieved from http://www.jstor.org.ezproxy.canterbury.ac.nz/stable/4165429
Vaes, J., Paladino, P., & Puvia, E. (2011). Are sexualized women complete human beings? Why
men and women dehumanize sexually objectified women. European Journal of Social
Psychology, 41(6), 774-785.
Veblen, T. (1953). The Theory of the Leisure Class. New York: New American Library of
World Literature.
Yates, J., Hooley, T., & Bagri, K. K. (2017). Good looks and good practice: The attitudes of
career practitioners to attractiveness and appearance. British Journal of Guidance &
Counselling, 45(5), 547-561. doi:10.1080/03069885.2016.1237615
Zillman, C. (2019, May 16). The Fortune 500 Has More Female CEOs Than Ever Before.
Retrieved from https://fortune.com/2019/05/16/fortune-500-female-ceos/
45
Appendix A: Information and Consent Form
An Investigation of Workplace Competency
This questionnaire is used to gather information about workplace competencies. The participant
is asked to view, and rate a series of photographs on a range of competencies. Completion of this
questionnaire is estimated to take between 5 to 10 minutes. This questionnaire is mobile and
desktop compatible.
Completion of the survey items implies consent. The results of the project may be published, but
you may be assured of the complete confidentiality of data gathered in this investigation. All
electronic data will be stored in a password protected computer in a locked room, and no person
outside of the research team will have access to data. A thesis is a public document and will be
available through the UC Library. Data will be destroyed after five years, unless a publication
outlet requires extended archiving of the data.
The project is being carried out in partial fulfilment of the requirements for the degree of Master
of Science in Applied Psychology at the University of Canterbury by Greer Alsop, under the
supervision of Associate Professor Christopher Burt, who can be contacted at
[email protected]. He will be pleased to discuss any concerns you may have
about participation in the project.
This project has been reviewed and approved under the policy of the University of Canterbury
Human Ethics Committee, and participants should address any complaints to The Chair, Human
Ethics Committee, University of Canterbury, Private Bag 4800, Christchurch (human-
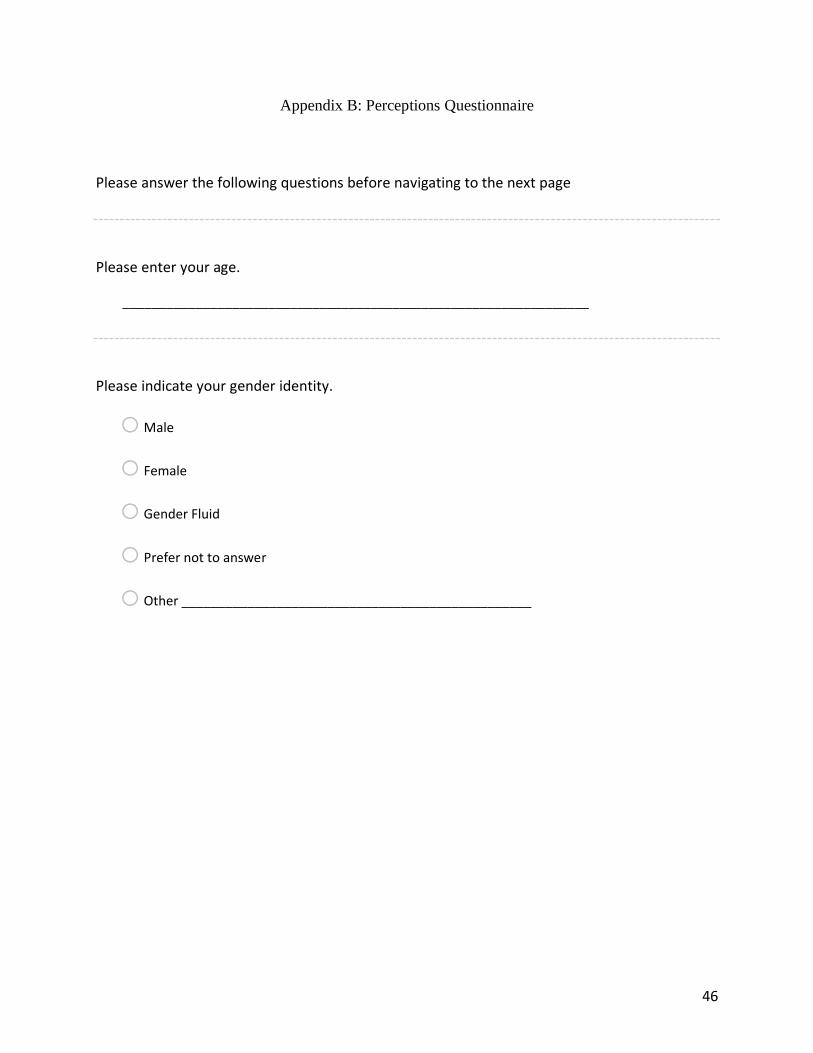
46
Appendix B: Perceptions Questionnaire
Please answer the following questions before navigating to the next page
Please enter your age.
________________________________________________________________
Please indicate your gender identity.
o Male
o Female
o Gender Fluid
o Prefer not to answer
o Other ________________________________________________
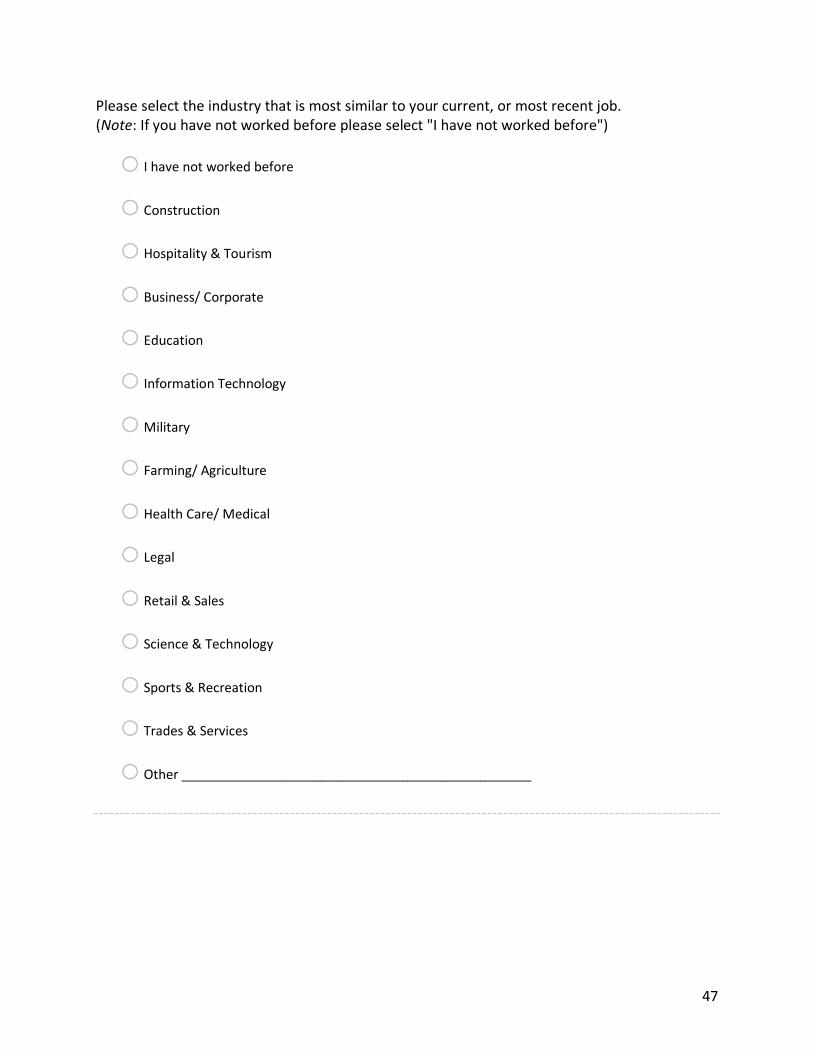
47
Please select the industry that is most similar to your current, or most recent job. (Note: If you have not worked before please select "I have not worked before")
o I have not worked before
o Construction
o Hospitality & Tourism
o Business/ Corporate
o Education
o Information Technology
o Military
o Farming/ Agriculture
o Health Care/ Medical
o Legal
o Retail & Sales
o Science & Technology
o Sports & Recreation
o Trades & Services
o Other ________________________________________________
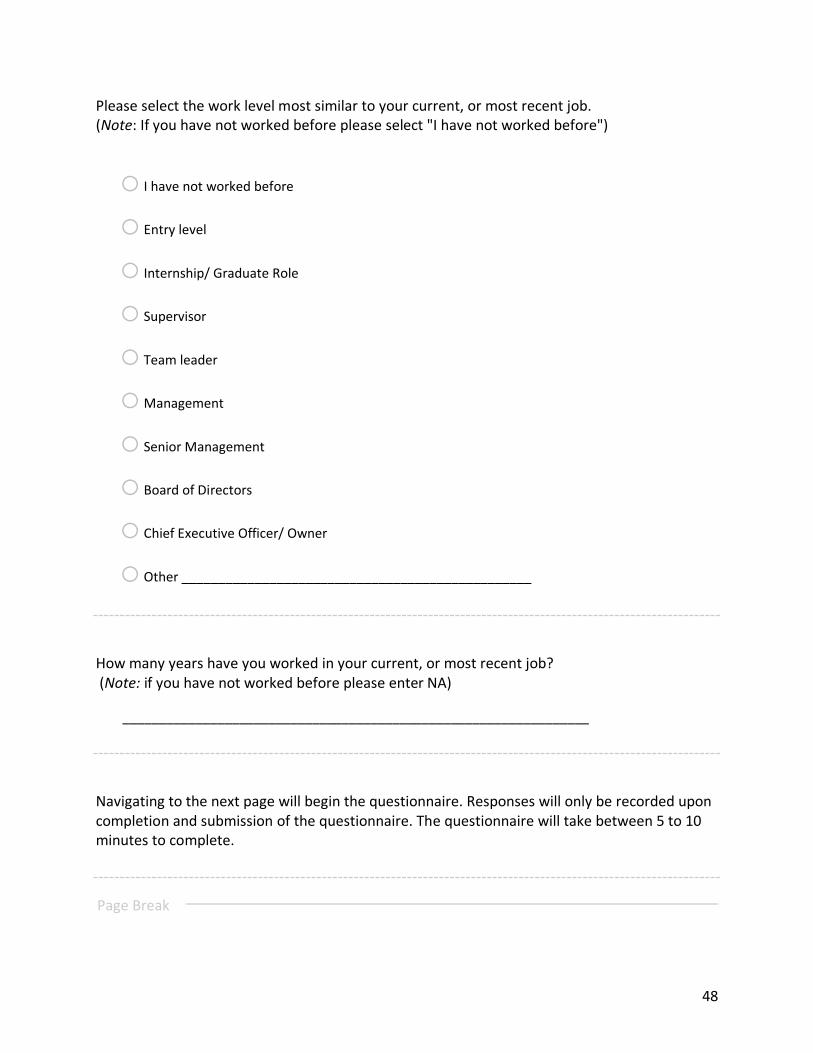
48
Please select the work level most similar to your current, or most recent job. (Note: If you have not worked before please select "I have not worked before")
o I have not worked before
o Entry level
o Internship/ Graduate Role
o Supervisor
o Team leader
o Management
o Senior Management
o Board of Directors
o Chief Executive Officer/ Owner
o Other ________________________________________________
How many years have you worked in your current, or most recent job? (Note: if you have not worked before please enter NA)
________________________________________________________________
Navigating to the next page will begin the questionnaire. Responses will only be recorded upon completion and submission of the questionnaire. The questionnaire will take between 5 to 10 minutes to complete.
Page Break
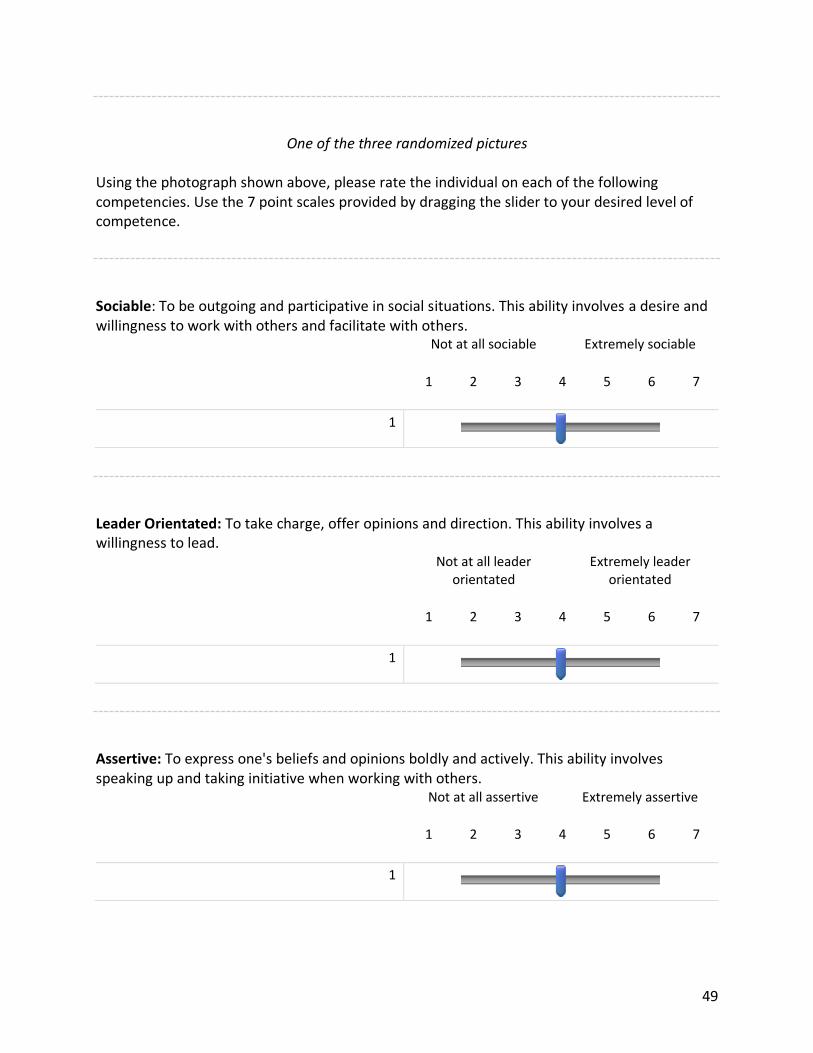
49
One of the three randomized pictures
Using the photograph shown above, please rate the individual on each of the following competencies. Use the 7 point scales provided by dragging the slider to your desired level of competence.
Sociable: To be outgoing and participative in social situations. This ability involves a desire and willingness to work with others and facilitate with others.
Not at all sociable Extremely sociable
1 2 3 4 5 6 7
1
Leader Orientated: To take charge, offer opinions and direction. This ability involves a willingness to lead.
Not at all leader orientated
Extremely leader orientated
1 2 3 4 5 6 7
1
Assertive: To express one's beliefs and opinions boldly and actively. This ability involves speaking up and taking initiative when working with others.
Not at all assertive Extremely assertive
1 2 3 4 5 6 7
1
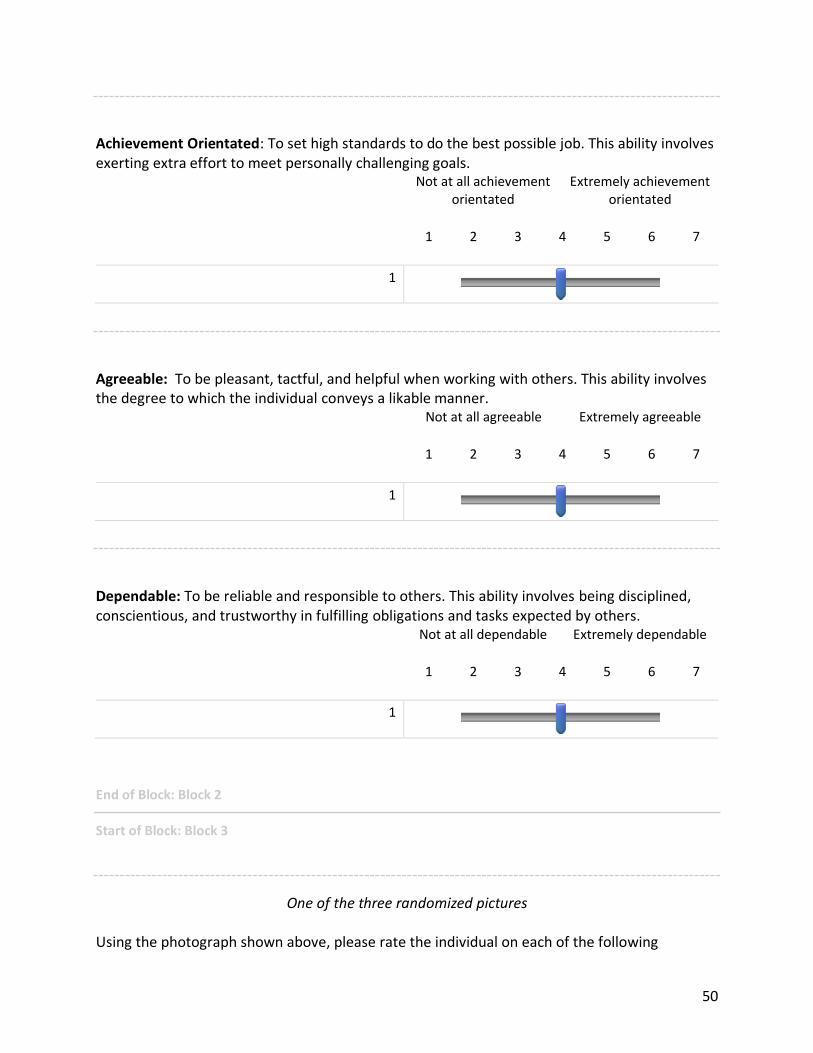
50
Achievement Orientated: To set high standards to do the best possible job. This ability involves exerting extra effort to meet personally challenging goals.
Not at all achievement orientated
Extremely achievement orientated
1 2 3 4 5 6 7
1
Agreeable: To be pleasant, tactful, and helpful when working with others. This ability involves the degree to which the individual conveys a likable manner.
Not at all agreeable Extremely agreeable
1 2 3 4 5 6 7
1
Dependable: To be reliable and responsible to others. This ability involves being disciplined, conscientious, and trustworthy in fulfilling obligations and tasks expected by others.
Not at all dependable Extremely dependable
1 2 3 4 5 6 7
1
End of Block: Block 2
Start of Block: Block 3
One of the three randomized pictures Using the photograph shown above, please rate the individual on each of the following
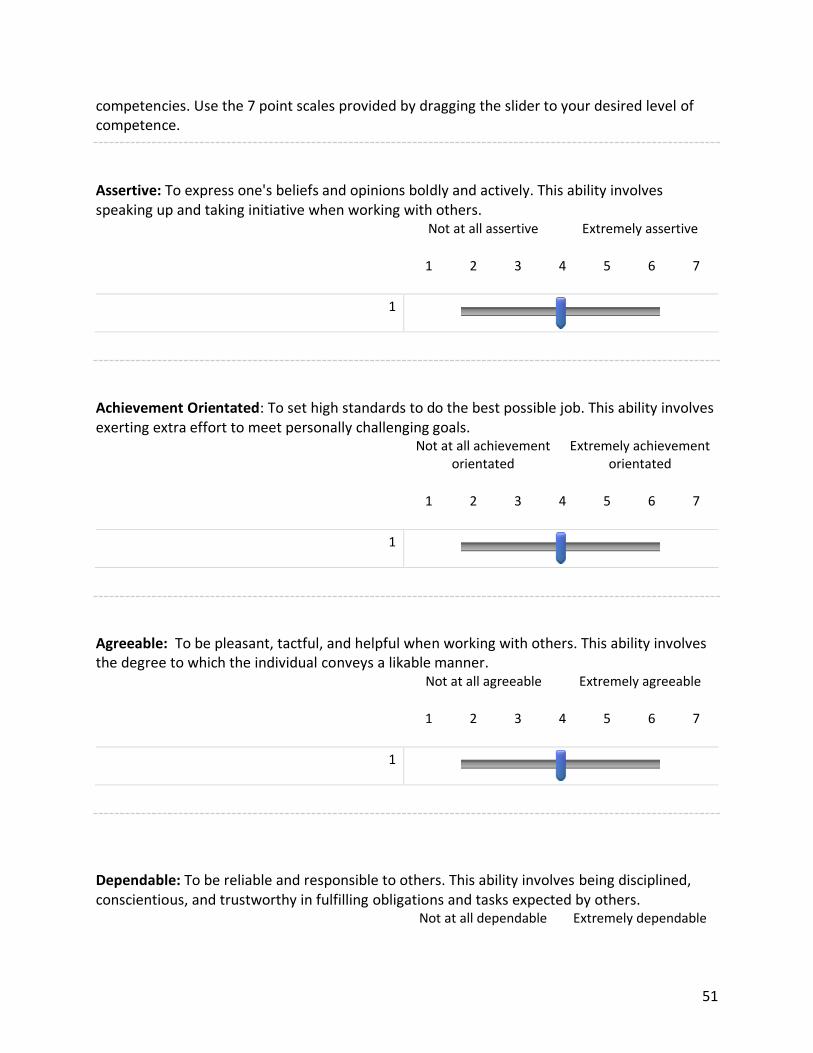
51
competencies. Use the 7 point scales provided by dragging the slider to your desired level of competence.
Assertive: To express one's beliefs and opinions boldly and actively. This ability involves speaking up and taking initiative when working with others.
Not at all assertive Extremely assertive
1 2 3 4 5 6 7
1
Achievement Orientated: To set high standards to do the best possible job. This ability involves exerting extra effort to meet personally challenging goals.
Not at all achievement orientated
Extremely achievement orientated
1 2 3 4 5 6 7
1
Agreeable: To be pleasant, tactful, and helpful when working with others. This ability involves the degree to which the individual conveys a likable manner.
Not at all agreeable Extremely agreeable
1 2 3 4 5 6 7
1
Dependable: To be reliable and responsible to others. This ability involves being disciplined, conscientious, and trustworthy in fulfilling obligations and tasks expected by others.
Not at all dependable Extremely dependable
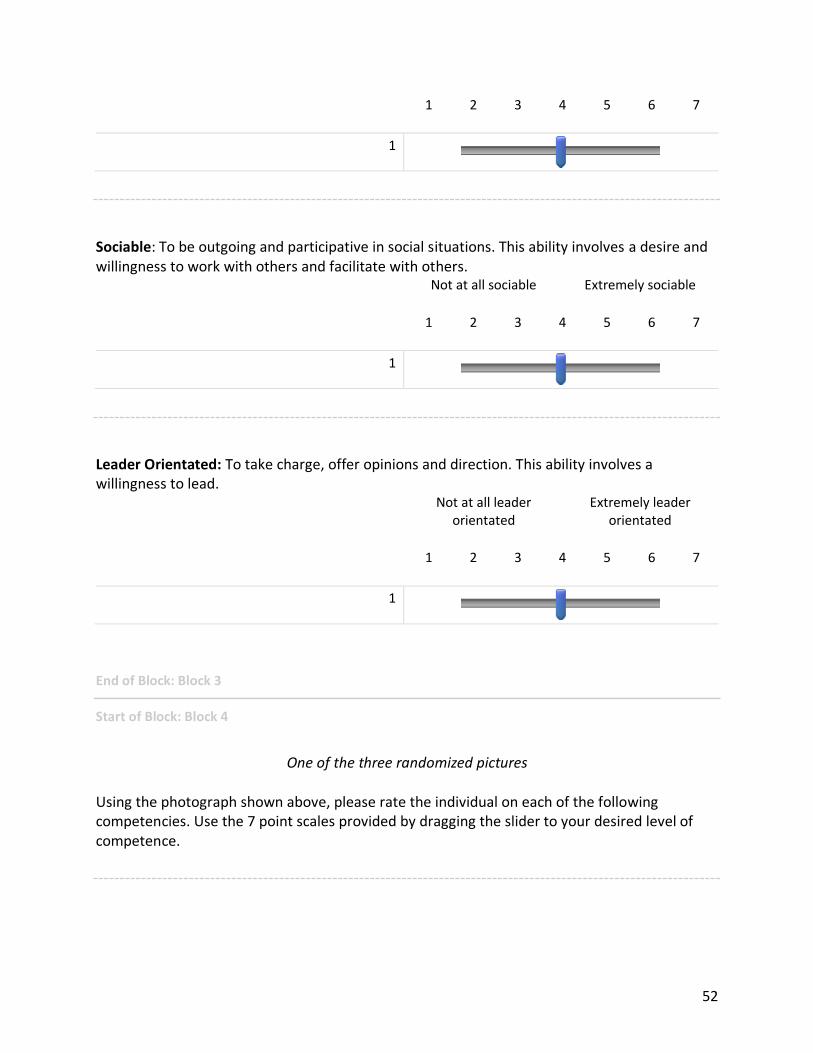
52
1 2 3 4 5 6 7
1
Sociable: To be outgoing and participative in social situations. This ability involves a desire and willingness to work with others and facilitate with others.
Not at all sociable Extremely sociable
1 2 3 4 5 6 7
1
Leader Orientated: To take charge, offer opinions and direction. This ability involves a willingness to lead.
Not at all leader orientated
Extremely leader orientated
1 2 3 4 5 6 7
1
End of Block: Block 3
Start of Block: Block 4
One of the three randomized pictures
Using the photograph shown above, please rate the individual on each of the following competencies. Use the 7 point scales provided by dragging the slider to your desired level of competence.
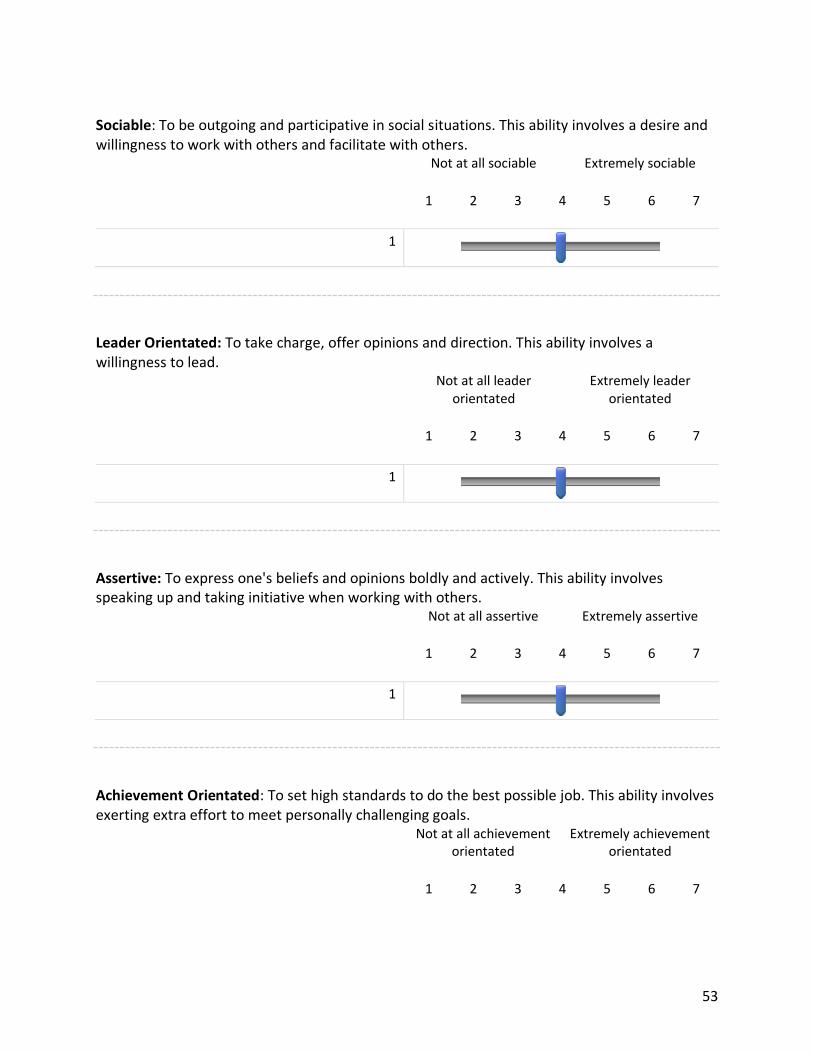
53
Sociable: To be outgoing and participative in social situations. This ability involves a desire and willingness to work with others and facilitate with others.
Not at all sociable Extremely sociable
1 2 3 4 5 6 7
1
Leader Orientated: To take charge, offer opinions and direction. This ability involves a willingness to lead.
Not at all leader orientated
Extremely leader orientated
1 2 3 4 5 6 7
1
Assertive: To express one's beliefs and opinions boldly and actively. This ability involves speaking up and taking initiative when working with others.
Not at all assertive Extremely assertive
1 2 3 4 5 6 7
1
Achievement Orientated: To set high standards to do the best possible job. This ability involves exerting extra effort to meet personally challenging goals.
Not at all achievement orientated
Extremely achievement orientated
1 2 3 4 5 6 7
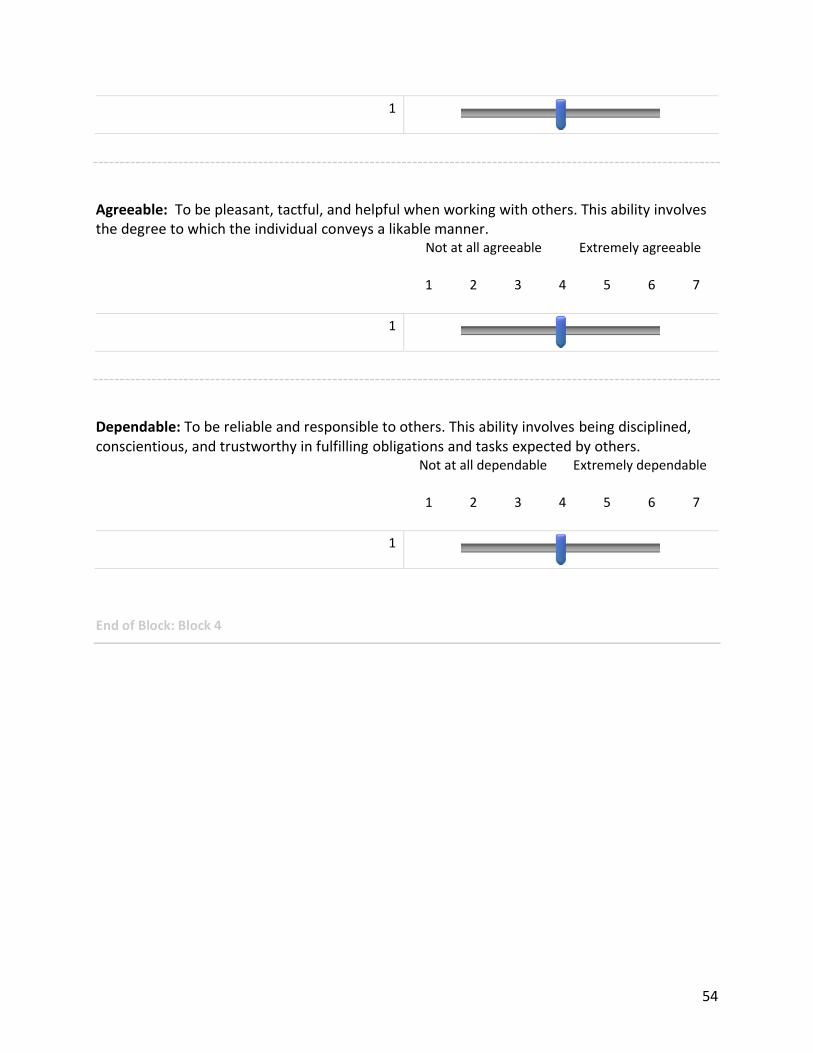
54
1
Agreeable: To be pleasant, tactful, and helpful when working with others. This ability involves the degree to which the individual conveys a likable manner.
Not at all agreeable Extremely agreeable
1 2 3 4 5 6 7
1
Dependable: To be reliable and responsible to others. This ability involves being disciplined, conscientious, and trustworthy in fulfilling obligations and tasks expected by others.
Not at all dependable Extremely dependable
1 2 3 4 5 6 7
1
End of Block: Block 4
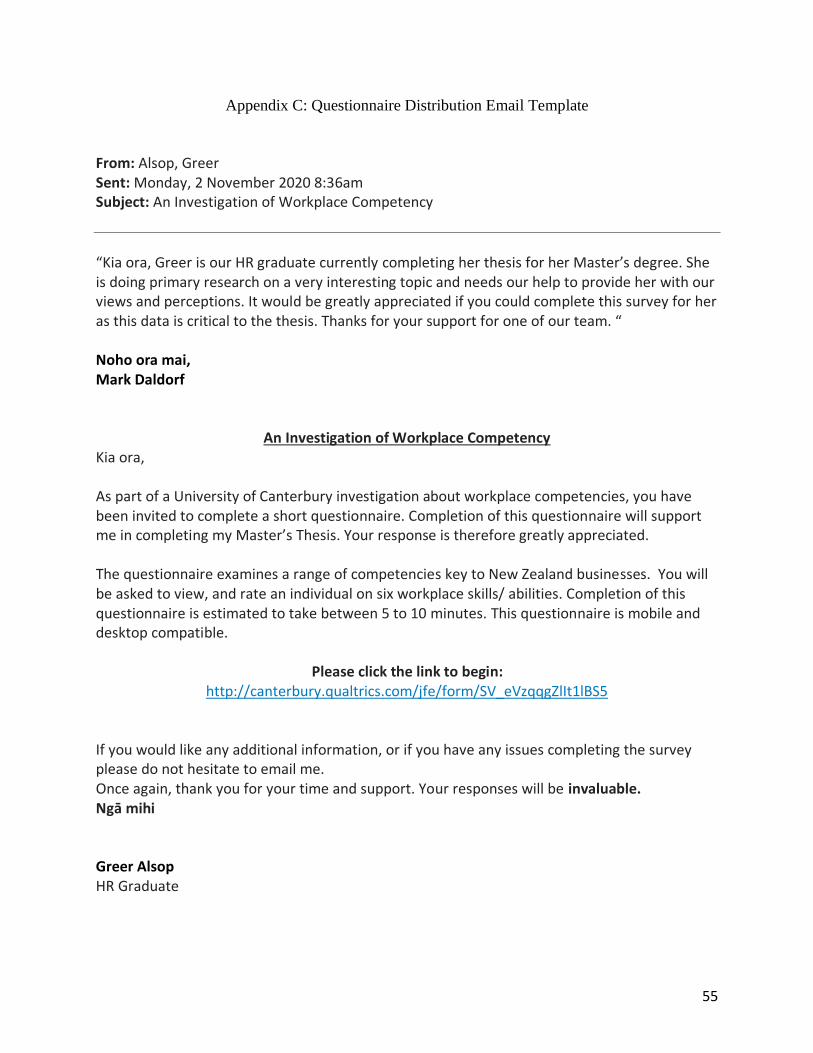
55
Appendix C: Questionnaire Distribution Email Template
From: Alsop, Greer Sent: Monday, 2 November 2020 8:36am Subject: An Investigation of Workplace Competency
“Kia ora, Greer is our HR graduate currently completing her thesis for her Master’s degree. She is doing primary research on a very interesting topic and needs our help to provide her with our views and perceptions. It would be greatly appreciated if you could complete this survey for her as this data is critical to the thesis. Thanks for your support for one of our team. “ Noho ora mai, Mark Daldorf
An Investigation of Workplace Competency Kia ora, As part of a University of Canterbury investigation about workplace competencies, you have been invited to complete a short questionnaire. Completion of this questionnaire will support me in completing my Master’s Thesis. Your response is therefore greatly appreciated. The questionnaire examines a range of competencies key to New Zealand businesses. You will be asked to view, and rate an individual on six workplace skills/ abilities. Completion of this questionnaire is estimated to take between 5 to 10 minutes. This questionnaire is mobile and desktop compatible.
Please click the link to begin: http://canterbury.qualtrics.com/jfe/form/SV_eVzqqgZlIt1lBS5
If you would like any additional information, or if you have any issues completing the survey please do not hesitate to email me. Once again, thank you for your time and support. Your responses will be invaluable. Ngā mihi Greer Alsop HR Graduate
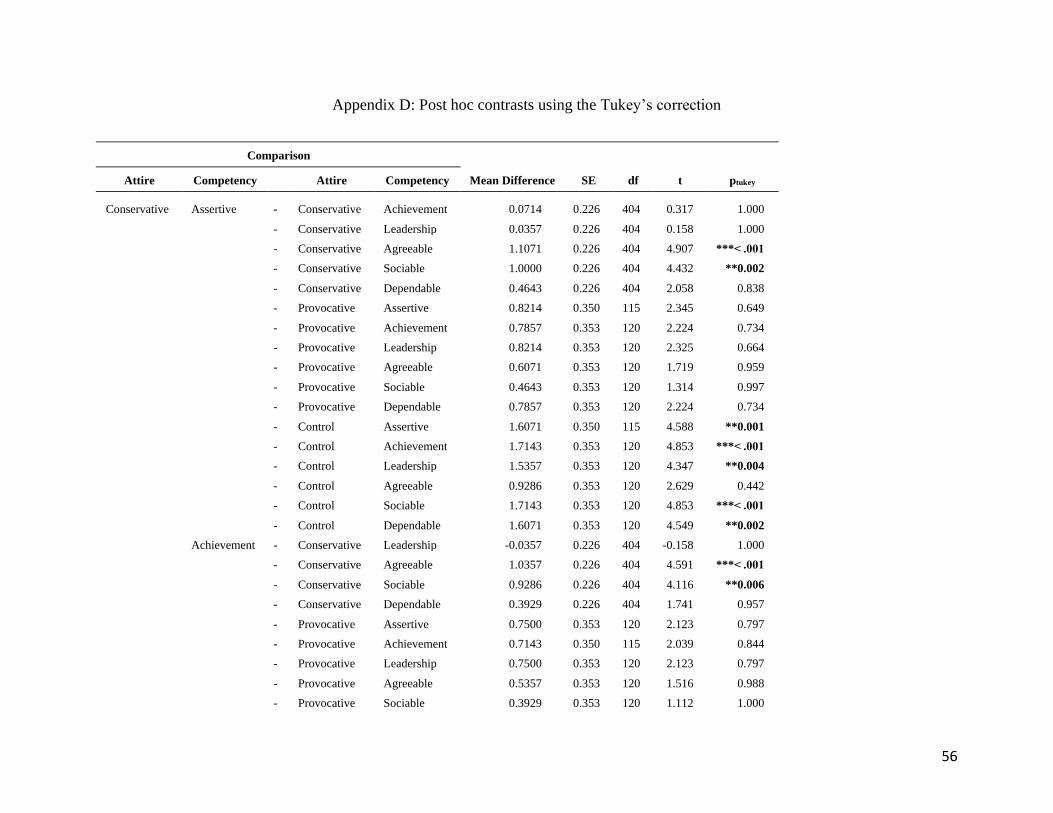
56
Appendix D: Post hoc contrasts using the Tukey’s correction
Comparison
Attire Competency Attire Competency Mean Difference SE df t ptukey
Conservative Assertive - Conservative Achievement 0.0714 0.226 404 0.317 1.000
- Conservative Leadership 0.0357 0.226 404 0.158 1.000
- Conservative Agreeable 1.1071 0.226 404 4.907 ***< .001
- Conservative Sociable 1.0000 0.226 404 4.432 **0.002
- Conservative Dependable 0.4643 0.226 404 2.058 0.838
- Provocative Assertive 0.8214 0.350 115 2.345 0.649
- Provocative Achievement 0.7857 0.353 120 2.224 0.734
- Provocative Leadership 0.8214 0.353 120 2.325 0.664
- Provocative Agreeable 0.6071 0.353 120 1.719 0.959
- Provocative Sociable 0.4643 0.353 120 1.314 0.997
- Provocative Dependable 0.7857 0.353 120 2.224 0.734
- Control Assertive 1.6071 0.350 115 4.588 **0.001
- Control Achievement 1.7143 0.353 120 4.853 ***< .001
- Control Leadership 1.5357 0.353 120 4.347 **0.004
- Control Agreeable 0.9286 0.353 120 2.629 0.442
- Control Sociable 1.7143 0.353 120 4.853 ***< .001
- Control Dependable 1.6071 0.353 120 4.549 **0.002
Achievement - Conservative Leadership -0.0357 0.226 404 -0.158 1.000
- Conservative Agreeable 1.0357 0.226 404 4.591 ***< .001
- Conservative Sociable 0.9286 0.226 404 4.116 **0.006
- Conservative Dependable 0.3929 0.226 404 1.741 0.957
- Provocative Assertive 0.7500 0.353 120 2.123 0.797
- Provocative Achievement 0.7143 0.350 115 2.039 0.844
- Provocative Leadership 0.7500 0.353 120 2.123 0.797
- Provocative Agreeable 0.5357 0.353 120 1.516 0.988
- Provocative Sociable 0.3929 0.353 120 1.112 1.000
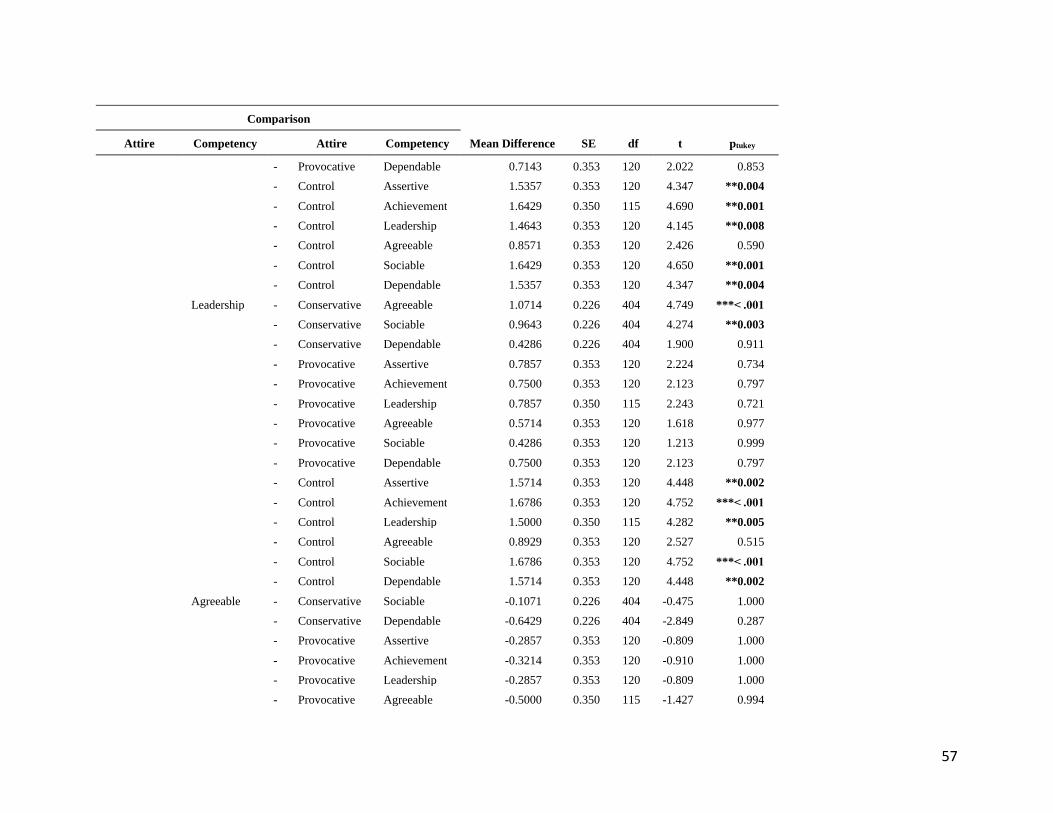
57
Comparison
Attire Competency Attire Competency Mean Difference SE df t ptukey
- Provocative Dependable 0.7143 0.353 120 2.022 0.853
- Control Assertive 1.5357 0.353 120 4.347 **0.004
- Control Achievement 1.6429 0.350 115 4.690 **0.001
- Control Leadership 1.4643 0.353 120 4.145 **0.008
- Control Agreeable 0.8571 0.353 120 2.426 0.590
- Control Sociable 1.6429 0.353 120 4.650 **0.001
- Control Dependable 1.5357 0.353 120 4.347 **0.004
Leadership - Conservative Agreeable 1.0714 0.226 404 4.749 ***< .001
- Conservative Sociable 0.9643 0.226 404 4.274 **0.003
- Conservative Dependable 0.4286 0.226 404 1.900 0.911
- Provocative Assertive 0.7857 0.353 120 2.224 0.734
- Provocative Achievement 0.7500 0.353 120 2.123 0.797
- Provocative Leadership 0.7857 0.350 115 2.243 0.721
- Provocative Agreeable 0.5714 0.353 120 1.618 0.977
- Provocative Sociable 0.4286 0.353 120 1.213 0.999
- Provocative Dependable 0.7500 0.353 120 2.123 0.797
- Control Assertive 1.5714 0.353 120 4.448 **0.002
- Control Achievement 1.6786 0.353 120 4.752 ***< .001
- Control Leadership 1.5000 0.350 115 4.282 **0.005
- Control Agreeable 0.8929 0.353 120 2.527 0.515
- Control Sociable 1.6786 0.353 120 4.752 ***< .001
- Control Dependable 1.5714 0.353 120 4.448 **0.002
Agreeable - Conservative Sociable -0.1071 0.226 404 -0.475 1.000
- Conservative Dependable -0.6429 0.226 404 -2.849 0.287
- Provocative Assertive -0.2857 0.353 120 -0.809 1.000
- Provocative Achievement -0.3214 0.353 120 -0.910 1.000
- Provocative Leadership -0.2857 0.353 120 -0.809 1.000
- Provocative Agreeable -0.5000 0.350 115 -1.427 0.994
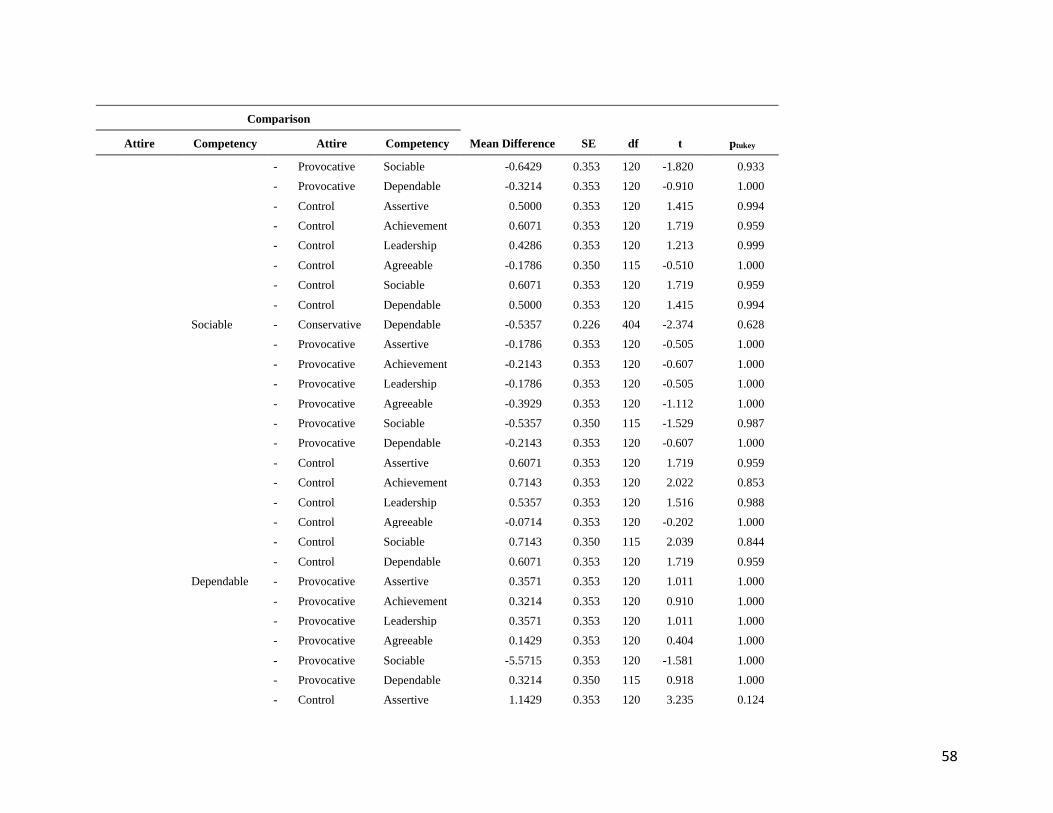
58
Comparison
Attire Competency Attire Competency Mean Difference SE df t ptukey
- Provocative Sociable -0.6429 0.353 120 -1.820 0.933
- Provocative Dependable -0.3214 0.353 120 -0.910 1.000
- Control Assertive 0.5000 0.353 120 1.415 0.994
- Control Achievement 0.6071 0.353 120 1.719 0.959
- Control Leadership 0.4286 0.353 120 1.213 0.999
- Control Agreeable -0.1786 0.350 115 -0.510 1.000
- Control Sociable 0.6071 0.353 120 1.719 0.959
- Control Dependable 0.5000 0.353 120 1.415 0.994
Sociable - Conservative Dependable -0.5357 0.226 404 -2.374 0.628
- Provocative Assertive -0.1786 0.353 120 -0.505 1.000
- Provocative Achievement -0.2143 0.353 120 -0.607 1.000
- Provocative Leadership -0.1786 0.353 120 -0.505 1.000
- Provocative Agreeable -0.3929 0.353 120 -1.112 1.000
- Provocative Sociable -0.5357 0.350 115 -1.529 0.987
- Provocative Dependable -0.2143 0.353 120 -0.607 1.000
- Control Assertive 0.6071 0.353 120 1.719 0.959
- Control Achievement 0.7143 0.353 120 2.022 0.853
- Control Leadership 0.5357 0.353 120 1.516 0.988
- Control Agreeable -0.0714 0.353 120 -0.202 1.000
- Control Sociable 0.7143 0.350 115 2.039 0.844
- Control Dependable 0.6071 0.353 120 1.719 0.959
Dependable - Provocative Assertive 0.3571 0.353 120 1.011 1.000
- Provocative Achievement 0.3214 0.353 120 0.910 1.000
- Provocative Leadership 0.3571 0.353 120 1.011 1.000
- Provocative Agreeable 0.1429 0.353 120 0.404 1.000
- Provocative Sociable -5.5715 0.353 120 -1.581 1.000
- Provocative Dependable 0.3214 0.350 115 0.918 1.000
- Control Assertive 1.1429 0.353 120 3.235 0.124
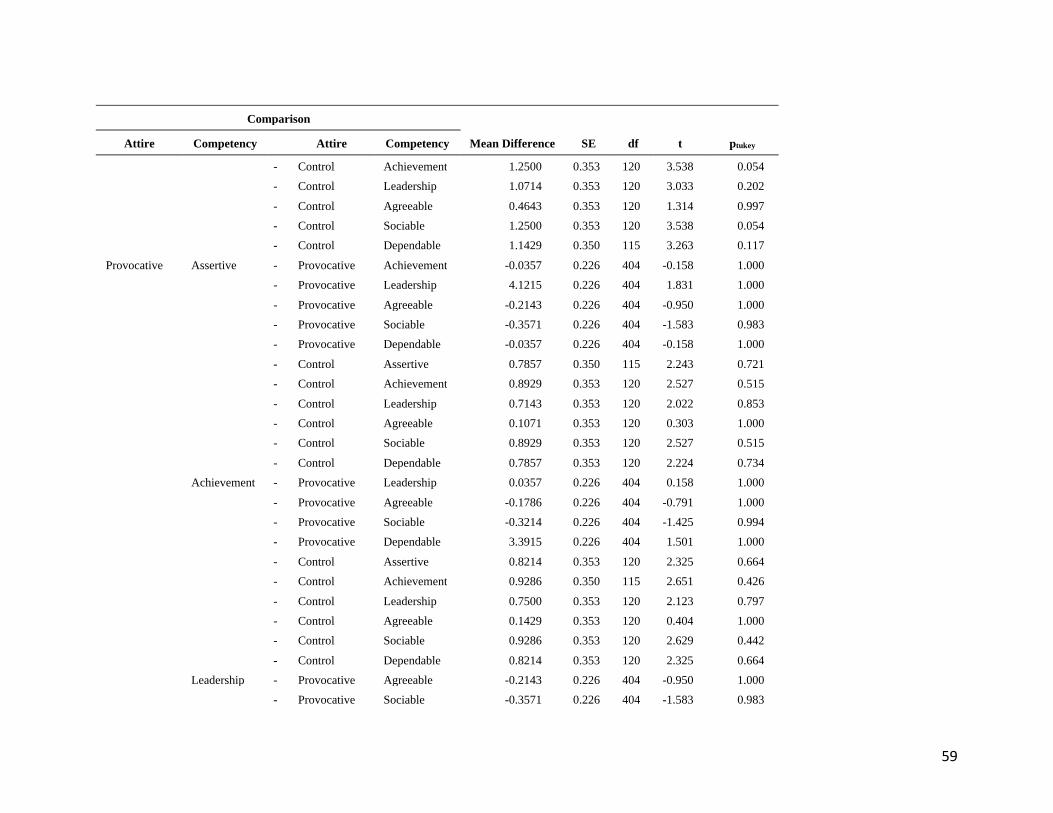
59
Comparison
Attire Competency Attire Competency Mean Difference SE df t ptukey
- Control Achievement 1.2500 0.353 120 3.538 0.054
- Control Leadership 1.0714 0.353 120 3.033 0.202
- Control Agreeable 0.4643 0.353 120 1.314 0.997
- Control Sociable 1.2500 0.353 120 3.538 0.054
- Control Dependable 1.1429 0.350 115 3.263 0.117
Provocative Assertive - Provocative Achievement -0.0357 0.226 404 -0.158 1.000
- Provocative Leadership 4.1215 0.226 404 1.831 1.000
- Provocative Agreeable -0.2143 0.226 404 -0.950 1.000
- Provocative Sociable -0.3571 0.226 404 -1.583 0.983
- Provocative Dependable -0.0357 0.226 404 -0.158 1.000
- Control Assertive 0.7857 0.350 115 2.243 0.721
- Control Achievement 0.8929 0.353 120 2.527 0.515
- Control Leadership 0.7143 0.353 120 2.022 0.853
- Control Agreeable 0.1071 0.353 120 0.303 1.000
- Control Sociable 0.8929 0.353 120 2.527 0.515
- Control Dependable 0.7857 0.353 120 2.224 0.734
Achievement - Provocative Leadership 0.0357 0.226 404 0.158 1.000
- Provocative Agreeable -0.1786 0.226 404 -0.791 1.000
- Provocative Sociable -0.3214 0.226 404 -1.425 0.994
- Provocative Dependable 3.3915 0.226 404 1.501 1.000
- Control Assertive 0.8214 0.353 120 2.325 0.664
- Control Achievement 0.9286 0.350 115 2.651 0.426
- Control Leadership 0.7500 0.353 120 2.123 0.797
- Control Agreeable 0.1429 0.353 120 0.404 1.000
- Control Sociable 0.9286 0.353 120 2.629 0.442
- Control Dependable 0.8214 0.353 120 2.325 0.664
Leadership - Provocative Agreeable -0.2143 0.226 404 -0.950 1.000
- Provocative Sociable -0.3571 0.226 404 -1.583 0.983
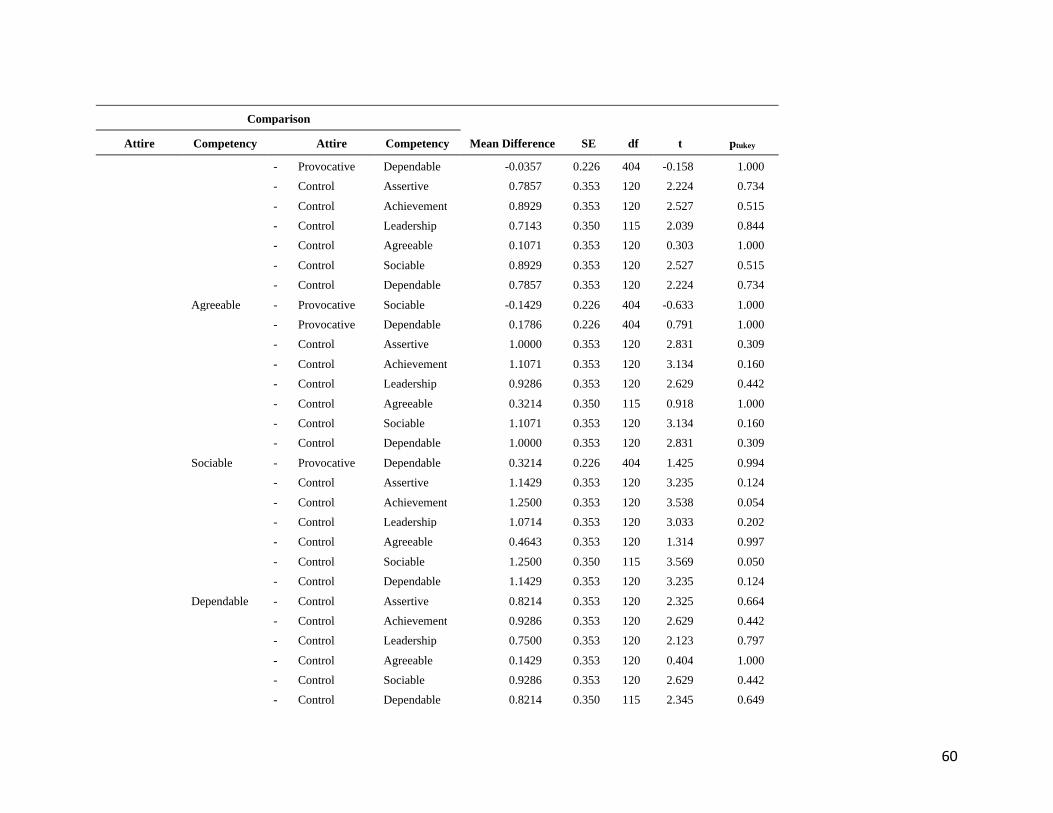
60
Comparison
Attire Competency Attire Competency Mean Difference SE df t ptukey
- Provocative Dependable -0.0357 0.226 404 -0.158 1.000
- Control Assertive 0.7857 0.353 120 2.224 0.734
- Control Achievement 0.8929 0.353 120 2.527 0.515
- Control Leadership 0.7143 0.350 115 2.039 0.844
- Control Agreeable 0.1071 0.353 120 0.303 1.000
- Control Sociable 0.8929 0.353 120 2.527 0.515
- Control Dependable 0.7857 0.353 120 2.224 0.734
Agreeable - Provocative Sociable -0.1429 0.226 404 -0.633 1.000
- Provocative Dependable 0.1786 0.226 404 0.791 1.000
- Control Assertive 1.0000 0.353 120 2.831 0.309
- Control Achievement 1.1071 0.353 120 3.134 0.160
- Control Leadership 0.9286 0.353 120 2.629 0.442
- Control Agreeable 0.3214 0.350 115 0.918 1.000
- Control Sociable 1.1071 0.353 120 3.134 0.160
- Control Dependable 1.0000 0.353 120 2.831 0.309
Sociable - Provocative Dependable 0.3214 0.226 404 1.425 0.994
- Control Assertive 1.1429 0.353 120 3.235 0.124
- Control Achievement 1.2500 0.353 120 3.538 0.054
- Control Leadership 1.0714 0.353 120 3.033 0.202
- Control Agreeable 0.4643 0.353 120 1.314 0.997
- Control Sociable 1.2500 0.350 115 3.569 0.050
- Control Dependable 1.1429 0.353 120 3.235 0.124
Dependable - Control Assertive 0.8214 0.353 120 2.325 0.664
- Control Achievement 0.9286 0.353 120 2.629 0.442
- Control Leadership 0.7500 0.353 120 2.123 0.797
- Control Agreeable 0.1429 0.353 120 0.404 1.000
- Control Sociable 0.9286 0.353 120 2.629 0.442
- Control Dependable 0.8214 0.350 115 2.345 0.649
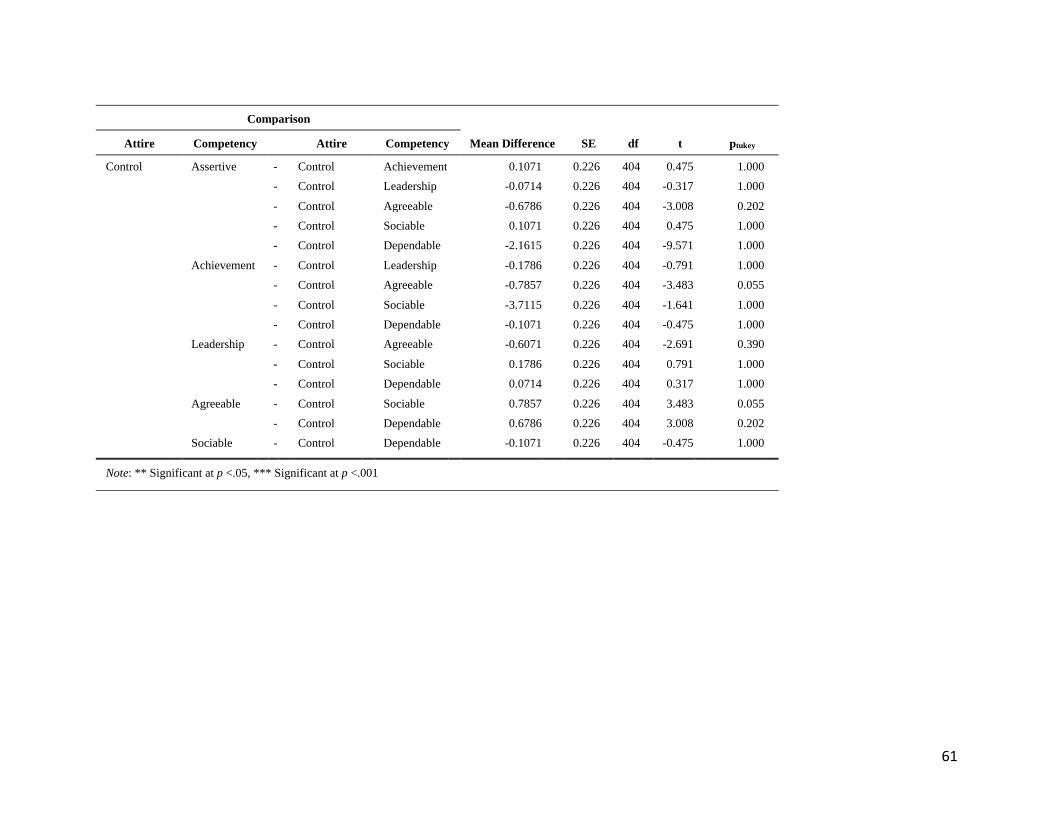
61
Comparison
Attire Competency Attire Competency Mean Difference SE df t ptukey
Control Assertive - Control Achievement 0.1071 0.226 404 0.475 1.000
- Control Leadership -0.0714 0.226 404 -0.317 1.000
- Control Agreeable -0.6786 0.226 404 -3.008 0.202
- Control Sociable 0.1071 0.226 404 0.475 1.000
- Control Dependable -2.1615 0.226 404 -9.571 1.000
Achievement - Control Leadership -0.1786 0.226 404 -0.791 1.000
- Control Agreeable -0.7857 0.226 404 -3.483 0.055
- Control Sociable -3.7115 0.226 404 -1.641 1.000
- Control Dependable -0.1071 0.226 404 -0.475 1.000
Leadership - Control Agreeable -0.6071 0.226 404 -2.691 0.390
- Control Sociable 0.1786 0.226 404 0.791 1.000
- Control Dependable 0.0714 0.226 404 0.317 1.000
Agreeable - Control Sociable 0.7857 0.226 404 3.483 0.055
- Control Dependable 0.6786 0.226 404 3.008 0.202
Sociable - Control Dependable -0.1071 0.226 404 -0.475 1.000
Note: ** Significant at p <.05, *** Significant at p <.001
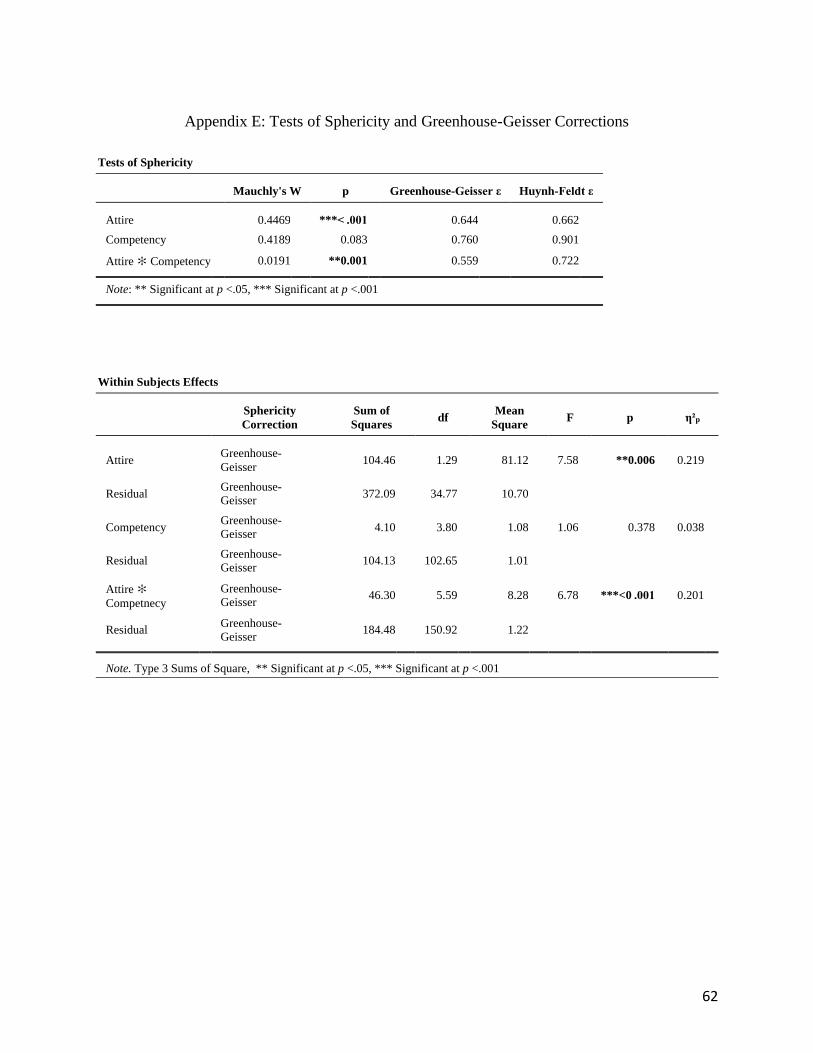
62
Appendix E: Tests of Sphericity and Greenhouse-Geisser Corrections
Tests of Sphericity
Mauchly's W p Greenhouse-Geisser ε Huynh-Feldt ε
Attire 0.4469 ***< .001 0.644 0.662
Competency 0.4189 0.083 0.760 0.901
Attire ✻ Competency 0.0191 **0.001 0.559 0.722
Note: ** Significant at p <.05, *** Significant at p <.001
Within Subjects Effects
Sphericity
Correction
Sum of
Squares df
Mean
Square F p η²p
Attire Greenhouse-
Geisser 104.46 1.29 81.12 7.58 **0.006 0.219
Residual Greenhouse-
Geisser 372.09 34.77 10.70
Competency Greenhouse-
Geisser 4.10 3.80 1.08 1.06 0.378 0.038
Residual Greenhouse-
Geisser 104.13 102.65 1.01
Attire ✻
Competnecy Greenhouse-
Geisser 46.30 5.59 8.28 6.78 ***<0 .001 0.201
Residual Greenhouse-
Geisser 184.48 150.92 1.22
Note. Type 3 Sums of Square, ** Significant at p <.05, *** Significant at p <.001
Related Documents