Boundary-Layer Meteorol DOI 10.1007/s10546-013-9834-x ARTICLE The Effect of Wind-Turbine Wakes on Summertime US Midwest Atmospheric Wind Profiles as Observed with Ground-Based Doppler Lidar Michael E. Rhodes · Julie K. Lundquist Received: 11 November 2012 / Accepted: 17 June 2013 © The Author(s) 2013. This article is published with open access at Springerlink.com Abstract We examine the influence of a modern multi-megawatt wind turbine on wind and turbulence profiles three rotor diameters ( D) downwind of the turbine. Light detection and ranging (lidar) wind-profile observations were collected during summer 2011 in an operating wind farm in central Iowa at 20-m vertical intervals from 40 to 220 m above the surface. After a calibration period during which two lidars were operated next to each other, one lidar was located approximately 2 D directly south of a wind turbine; the other lidar was moved approximately 3 D north of the same wind turbine. Data from the two lidars during southerly flow conditions enabled the simultaneous capture of inflow and wake conditions. The inflow wind and turbulence profiles exhibit strong variability with atmospheric stability: daytime profiles are well-mixed with little shear and strong turbulence, while nighttime profiles exhibit minimal turbulence and considerable shear across the rotor disk region and above. Consistent with the observations available from other studies and with wind-tunnel and large-eddy simulation studies, measurable reductions in wake wind-speeds occur at heights spanning the wind turbine rotor (43–117 m), and turbulent quantities increase in the wake. In generalizing these results as a function of inflow wind speed, we find the wind-speed deficit in the wake is largest at hub height or just above, and the maximum deficit occurs when wind speeds are below the rated speed for the turbine. Similarly, the maximum enhancement of turbulence kinetic energy and turbulence intensity occurs at hub height, although observations at the top of the rotor disk do not allow assessment of turbulence in that region. The wind shear below turbine hub height (quantified here with the power-law coefficient) is found to be a useful parameter to identify whether a downwind lidar observes turbine wake or free-flow conditions. These field observations provide data for validating turbine-wake models and wind-tunnel observations, and for guiding assessments of the impacts of wakes on surface turbulent fluxes or surface temperatures downwind of turbines. M. E. Rhodes · J. K. Lundquist (B ) Department of Atmospheric and Oceanic Sciences, 311 UCB, University of Colorado, Boulder, CO 80309-0311, USA e-mail: [email protected] J. K. Lundquist National Renewable Energy Laboratory, Golden, CO 80401, USA 123

Welcome message from author
This document is posted to help you gain knowledge. Please leave a comment to let me know what you think about it! Share it to your friends and learn new things together.
Transcript
Boundary-Layer MeteorolDOI 10.1007/s10546-013-9834-x
ARTICLE
The Effect of Wind-Turbine Wakes on Summertime USMidwest Atmospheric Wind Profiles as Observedwith Ground-Based Doppler Lidar
Michael E. Rhodes · Julie K. Lundquist
Received: 11 November 2012 / Accepted: 17 June 2013© The Author(s) 2013. This article is published with open access at Springerlink.com
Abstract We examine the influence of a modern multi-megawatt wind turbine on wind andturbulence profiles three rotor diameters (D) downwind of the turbine. Light detection andranging (lidar) wind-profile observations were collected during summer 2011 in an operatingwind farm in central Iowa at 20-m vertical intervals from 40 to 220 m above the surface.After a calibration period during which two lidars were operated next to each other, onelidar was located approximately 2D directly south of a wind turbine; the other lidar wasmoved approximately 3D north of the same wind turbine. Data from the two lidars duringsoutherly flow conditions enabled the simultaneous capture of inflow and wake conditions.The inflow wind and turbulence profiles exhibit strong variability with atmospheric stability:daytime profiles are well-mixed with little shear and strong turbulence, while nighttimeprofiles exhibit minimal turbulence and considerable shear across the rotor disk region andabove. Consistent with the observations available from other studies and with wind-tunnel andlarge-eddy simulation studies, measurable reductions in wake wind-speeds occur at heightsspanning the wind turbine rotor (43–117 m), and turbulent quantities increase in the wake. Ingeneralizing these results as a function of inflow wind speed, we find the wind-speed deficitin the wake is largest at hub height or just above, and the maximum deficit occurs when windspeeds are below the rated speed for the turbine. Similarly, the maximum enhancement ofturbulence kinetic energy and turbulence intensity occurs at hub height, although observationsat the top of the rotor disk do not allow assessment of turbulence in that region. The windshear below turbine hub height (quantified here with the power-law coefficient) is found to bea useful parameter to identify whether a downwind lidar observes turbine wake or free-flowconditions. These field observations provide data for validating turbine-wake models andwind-tunnel observations, and for guiding assessments of the impacts of wakes on surfaceturbulent fluxes or surface temperatures downwind of turbines.
M. E. Rhodes · J. K. Lundquist (B)Department of Atmospheric and Oceanic Sciences, 311 UCB, University of Colorado,Boulder, CO 80309-0311, USAe-mail: [email protected]
J. K. LundquistNational Renewable Energy Laboratory, Golden, CO 80401, USA
123
M. E. Rhodes, J. K. Lundquist
Keywords Diurnal cycle · Turbine wakes · Wind energy · Wind profiles · Lidar
1 Introduction
A global transition to renewable energy sources is possible due to abundant renewableresources and technology (Jacobson and Delucchi 2011). Wind energy is a leading renew-able energy source for the United States (Milligan et al. 2009), partially due to the largewind resource that occurs in the US Midwest. The Midwest also serves as the hub of USagriculture (USDA 2012), so any potential impacts of wind turbines on agriculture couldhave significant economic effects. In particular, concern exists that increased turbulence inturbine wakes may alter surface temperatures (Zhou et al. 2012) or fluxes (Baidya Roy 2011)downwind. Additionally, turbulent wakes affect the energy production of turbines locateddownwind of other turbines (Barthelmie et al. 2007, among others). However, it is not yetknown whether wind-turbine wakes have a beneficial or detrimental impact on crop growth(Rajewski et al. 2013) primarily due to the lack of detailed observations of the atmosphereand of the surface exchanges of heat, momentum, moisture, and carbon dioxide upwind anddownwind of operational turbines. Such observations are essential to determine wake impacton the local environment.
A wind farm or wind plant, most commonly used for utility-scale applications, is agroup of tens or hundreds of individual horizontal-axis wind turbines (typically of capacity1.5 MW or greater) installed over an area on the order of many square kilometres. Typically,two to four turbines are found per km2 in modern wind plants. Each turbine in the windfarm has blades that produce electricity by converting horizontal momentum in the airflowinto rotation of a generator. The area swept by the turbine blades is referred to here as therotor disk. A region of reduced wind speeds and increased turbulence, called the wake, existsdownwind of each turbine as a result of the interaction between the flow and rotor. Wakesfrom upwind turbines are responsible for decreased power output and increased turbine load-ing at downwind turbines in the wind farm (Frandsen 2007; Barthelmie et al. 2010, amongothers). Because turbine wakes have removed momentum from the flow, less momentum isavailable for the downwind turbines to extract.
Wind-turbine wakes induce atmospheric changes over a range of scales as documentedthrough wind-tunnel studies, computer flow simulations, and field observations. Previousobservational campaigns on turbines observe that downwind of a turbine there is a discerniblewake region characterized by reduced horizontal wind speed and increased turbulence (Bakerand Walker 1984; Hogström et al. 1988; Magnusson and Smedman 1994; Käsler et al. 2010;Trujillo et al. 2011; Iungo et al. 2013; Smalikho et al. 2013). Chamorro and Porté-Agel (2010)used a wind tunnel to determine the effects of a model wind turbine on fluid flow. Measur-ing mean and turbulence values of the flow under neutral conditions, they found signaturesof turbine wakes at distances up to 20D downwind in the wind tunnel. Furthermore, theyfound the wake momentum deficit to be axially symmetric while wake-driven turbulencecharacteristics were concentrated above hub height. Wu and Porté-Agel (2011) comparedthese wind-tunnel simulations to neutrally stratified large-eddy simulations (LES) to identifyoptimal approaches for representing wind turbines in LES. While both LES and wind-tunnelstudies provide insights into what might be expected from field campaigns, only field cam-paigns are able to capture real interactions between wind farms and atmosphere dynamics.Of course, test conditions such as wind speed and wind direction may not be controlledduring a field campaign while they can be specified in a wind tunnel or in computational flowsimulation.
123

The Effect of Wind-Turbine Wakes
Turbine-wake measurement field campaigns often involve both in situ and remote sensinginstrumentation. Standard atmospheric wind measurements are made with in situ measure-ments such as cup or sonic anemometers, which must be mounted on towers that can interferewith the measurements. Additionally, towers pose logistical problems due to the high mea-surement heights required to sample turbine wakes. Tethered kites and remotely pilotedvehicles outfitted with onboard hotwire anemometers (Baker and Walker 1984; Hogströmet al. 1988; Frehlich et al. 2003; Kocer et al. 2011) observe details of turbulence withinwakes at multiple locations on the scale of seconds to minutes without the flow disruption oftowers. Remote sensing technology, including acoustic, microwave, and laser systems, havethe ability to observe turbine wakes at multiple locations. Lidar systems offer the ability tomeasure winds high above the ground and over long distances without having to erect a largemeteorological tower at each measurement location.
In the present study, we aggregate over 100 h of lidar inflow and wake observationsto document turbine mean and turbulent wake characteristics for a range of inflow windspeeds. Our dataset includes several cases of wakes occurring during nocturnal low-level jetconditions (Blackadar 1957; Whiteman et al. 1997; Banta et al. 2002). Section 2 qualifiesthe ability of this type of lidar to observe inhomogeneous flow such as wind-turbine wakes,and describes the observational dataset. Section 3 describes the undisturbed, or “inflow”wind and turbulence profiles to quantify the Midwest atmospheric boundary layer. In Sect. 4,we summarize the dependence of wake characteristics on inflow wind speed, and Sect. 5highlights a case study of wake variability during nocturnal stable conditions; we emphasizethis case because plentiful wind resources in the Midwest arise from the nocturnal low-leveljet that occurs during such conditions. In Sect. 6 we compare the present results with thoseobtained in previous field studies, wind-tunnel studies, and simulations, and we suggeststrategies for future lidar investigations of wind-turbine wakes.
2 Observational Dataset
As part of the Crop/Wind-energy EXperiment 2011 (CWEX-11) (Rajewski et al. 2013), twovertically profiling Doppler wind lidars (Windcube V1, described in Courtney et al. 2008)were deployed within an operating wind farm in the agricultural fields of central Iowa, USA(Fig. 1). Historical data indicate that this region often experiences strong southerly winds(Fig. 2), and so the lidars were sited north and south of a turbine to intentionally sample turbineinflow and wakes during southerly flow. Except during a brief intercomparison period, onelidar (CU1) was located approximately 165 m south (2.2D) of a row of six modern multi-megawatt wind turbine generators (WTG) placed in a line running from west to east; thesecond lidar (CU2) was located 250 m north (3.4D) of the WTG row. In addition to thelidars, other equipment interrogated the effects of turbine wakes on the agricultural cropsin the vicinity, including an array of two surface-flux stations south and north of the wind-turbine row, and an Integrated Surface Flux System (ISFS) south of the turbine row andan additional three ISFSs north of the turbines (NCAR ISFS 2012). Surface-flux data wererecorded for the duration of the lidar operational period; these data are discussed in Rajewskiet al. (2013). To focus on the turbine wakes specifically, only the lidar data are discussedhere; future work will explore the impact of the wakes on surface quantities.
The WTG observed in this study is a GE 1.5 SLE, which has an 80-m hub height and 74-mrotor diameter extending from 43 to 117 m above ground level (a.g.l.). The turbine beginsto rotate at a cut-in speed of 3 m s−1, below which no power is produced. Electrical powerproduction reaches a maximum at 14 m s−1, the rated speed for the turbines. At speeds > the
123

M. E. Rhodes, J. K. Lundquist
Fig. 1 A diagram of the field site shows an east–west row of wind turbines (B1–B6) indicated by circles.Square markers show the locations of each lidar system; triangles indicate the locations of NCAR surface-fluxstations
Fig. 2 A wind rose from the southern lidar measurements at 80 m a.g.l. indicates a predominantly southerlyflow. Data from the entire observational period are included
rated speed, power production remains constant with increasing wind speed. At the cut-outspeed of 25 m s−1, the turbine ceases rotation.
The row of WTGs pictured in Fig. 1 is located at the southern end of a larger utility-sizedwind farm at an elevation of approximately 335 m above sea level. The landscape surroundingthe study site consists of soybean and corn agricultural fields, with corn as the primary cropsurrounding the lidars and WTGs. Small farms and homesteads interrupt the upwind fetch,with the closest homesteads approximately 600 m to the north-west and south–south-eastfrom the lidars. A few metres north of the turbines and running parallel to the row of wind
123

The Effect of Wind-Turbine Wakes
turbines, a 10-m-wide gravel access road connects the WTGs. The lidar observational periodbegan on 30 June and concluded on 16 August 2011. Approximate sunrise occurred between0430 and 0515 local standard time (LST) while sunset ranged from 1915 to 2000 LST.
The lidar system records the radial velocity of boundary-layer aerosols at a half openingangle φ (approximately 30◦ from vertical) in each of the four cardinal directions once persecond. Line-of-sight velocities at each of the lidar’s ten range gates are converted to zonal,meridional, and vertical wind speeds at each height assuming flow homogeneity throughoutthe volume scanned by the lidar. (The impact of flow inhomogeneities on the measurementsis discussed in Sect. 2.1.) The lidars record horizontal and vertical components of windspeed every second for each specified height; these components are then averaged for a2-min period to quantify horizontal and vertical components of the flow and the variances ofthose quantities. Any data that do not meet the carrier-to-noise ratio threshold of −22 dB areomitted from the recorded 2-min average. Wind shear, directional shear, horizontal turbulenceintensity, vertical turbulence intensity, and a form of turbulent kinetic energy are calculatedbased on the 2-min data from the measured wind-speed components, wind direction, wind-speed variance, and measurement height. Periods of precipitation (as measured at the localISFS stations) are omitted due to potential lidar signal contamination (Aitken et al. 2012).
2.1 Lidar Observations of Inhomogeneous Flow
In the CWEX domain, the lidar observations of flow into the turbine can be assumed to behomogeneous across the measurement volume. However, observations in the wake regionlikely incorporate inhomogeneous flow, and so the uncertainty of lidar velocity measure-ments in such flow must be assessed. The size of the volume sampled by the lidar varieswith the height h of the measurement. For the Windcube v1 in the present campaign, hranged from 40 to 220 m a.g.l. With a half-opening angle φ of approximately 30◦, the line-of-sight measurements at height h are collected over a horizontal extent of 2h sin φ (orapproximately h). The effective probe length of the Windcube v1 is 18 m. Therefore, at analtitude of 40 m, the Windcube velocity measurements collected over a 4-s period representa volume 40 m in the horizontal, 18 m in the vertical, and centered at 40 m above the surface.Similarly, at an altitude of 100 m, the Windcube velocity measurements collected over a 4-speriod represent a volume 100 m in the horizontal, 18 m in the vertical, centered at 100 mabove the surface.
At hub height (here, 80 m elevation), a turbine wake has a horizontal extent or width thesize of the rotor disk (approximated here as 80 m); at either 60 or 100 m a.g.l., the wakewidth would be approximately 70 m. Very few measurements of wake expansion have beendocumented, but in the offshore wind farm Horns Rev, wakes have been observed to expandby 5–10◦ as they move downwind (Barthelmie et al. 2010). With a 5◦ wake expansion, thewake region at 80 m a.g.l. would expand to approximately 124 m wide by the time thewake reaches the downwind lidar located at 3.4D (250 m) downwind, so that the wake willencompass the entire Windcube sampling volume at that elevation. Similarly, the wake at100 m above the surface would expand to 114 m width at a location 3.4D downwind of theturbine, and so the wake would again envelop the Windcube sampling volume. Therefore, itis reasonable to assume that for southerly flow, the downwind lidar samples turbine wake atall altitudes 100 m and below. The measurement volume of the downwind lidar may exceedthat of the wake itself at 120 m a.g.l., and so information on the transverse component ofthe flow in the wake at the top of the rotor disk cannot be collected with certainty usingthe experimental design here. However, the estimates of the streamwise velocity would becollected within the wake. (We are hopeful that estimates of wake expansion will become
123

M. E. Rhodes, J. K. Lundquist
more precise based on observational studies in the future, particularly studies using scanningDoppler lidar (Käsler et al. 2010; Iungo et al. 2013; Smalikho et al. 2013) or radar (Hirth andSchroeder 2013).)
It is useful to quantify wake characteristics throughout the rest of the rotor disk, 100 m andbelow, recognizing that the measurements are likely sampling inhomogeneous flow. Bingölet al. (2008) quantified lidar measurement uncertainty due to inhomogeneous flow for thespecial case of the mean velocity field varying linearly across the measurement volumedefined by the half-opening angle φ (nominally 30◦ for the Windcube v1). They found thelidar measurements of the zonal (u), meridional (v) and vertical (w) velocity components atmeasurement altitude h have an uncertainty given by a function only of the variation of thevertical velocity w as it varies in the zonal (x), meridional (y), and vertical (z) components:
ulidar(h) = u(h) + h∂w(h)
∂x, (1)
vlidar(h) = v(h) + h∂w(h)
∂y, (2)
wlidar(h) = w(h) − h
2 cos (ϕ)tan2(ϕ)
∂w(h)
∂z. (3)
In inhomogeneous flow, then, the uncertainty of velocity measurements is a function ofthe variation in vertical velocity across the horizontal extent (x or y) of the measurementvolume. Note that, although variations in the horizontal velocities are permitted in this model,by continuity those terms may be replaced with variations in the vertical velocity as shownin Bingöl et al. (2008). The horizontal extent (x or y) of the measurement volume is, byvirtue of ϕ ≈ 30◦, approximately h, simplifying (1)–(3) after discretization of the partialderivatives to
ulidar(h) = u(h) + �w(h), (4)
vlidar(h) = v(h) + �w(h), (5)
wlidar(h) = w(h) − h
3√
3
�w(h)
�z, (6)
where �z is the effective probe length of the Windcube, 18 m (Courtney et al. 2008). There-fore, uncertainties in the lidar estimates of the horizontal velocity components are on theorder of the vertical velocity variation within the wake. Uncertainties in the vertical velocitymeasurements are a function of the magnitude of the vertical velocity and h/(3
√3�z) where
the denominator ≈94 m. To quantify uncertainty of lidar measurements in inhomogeneousflow, then, it is important to quantify the variation of vertical velocity in a wake.
Using two Doppler lidars, Iungo et al. (2013) report observations of the horizontal andvertical velocity components in the wake of a 2.3 MW turbine, which is larger than theturbine studied here. They find “the mean vertical velocity is shown to be roughly negligiblefor all the tested downstream locations,” consistent with the modeling studies of Porte-Agelet al. (2011) and Wu and Porté-Agel (2011). Close inspection of the figures of Iungo et al.(2013) suggests a variation of vertical velocity in the wake of less than 0.7 m s−1. Therefore,according to Eqs. 4 and 5, we expect an error of <1 m s−1 in the horizontal wind-speedmeasurements within the wake reported herein, for measurements at heights 100 m and below.More detailed quantification of lidar uncertainty, perhaps using detailed computational fluiddynamics simulations, may be possible.
123

The Effect of Wind-Turbine Wakes
Fig. 3 Hub-height comparison of 10-min average horizontal wind speed for the two lidar units at the upwindsite during the 2-day intercomparison period
2.2 Lidar Intercomparison
The two lidars were co-located during the first two days of the 2011 observational campaignto quantify any bias in wind-speed measurement between the two lidar units. Both units weresited at the CU1 site (Fig. 1) separated by approximately 3 m. During the intercomparison,wind speeds were less than 20 m s−1 and wind direction was mostly from the south–south-west, unaffected by any turbines. 10-min averaged wind speeds from both units comparewell (Fig. 3): the slope is near unity and the y-intercept of the ordinary least-squares bestfit is close to zero. A high coefficient of determination, 0.998, shows a strong correlationbetween the data from each lidar. R2 values between the lidar units exceeded 0.997 whencomparing wind speed and direction at all heights within the rotor disk. Both wind-speedand wind-direction data are highly correlated between the two lidars at all heights duringthe intercomparison. We conclude there was no detectable bias in wind speed between thetwo instruments. After the intercomparison period, the lidars were located at their respectivelocations shown in Fig. 1 to capture both upwind and wind-turbine wake data.
2.3 Wake Definition
During the CWEX observational campaign, wind direction was frequently (but not always)from the south (Fig. 2). Using the hub-height wind speed and wind direction as measuredby the upwind lidar (CU1), we define periods when the northerly lidar (CU2) likely sampledthe turbine wake. Requirements included a CU1 wind speed >3 m s−1 (to ensure turbineoperation). A wind direction requirement based on the wake expansion of 5–10◦ observed byBarthelmie et al. (2010) was calculated: wind directions between 167◦ and 195◦ should placea wake from turbine B3 (Fig. 1) directly over the lidar at CU2 so that all four beams from thelidar sample wake. Other wind directions produce wakes from other turbines; the analysishere incorporates only wakes from turbine B3, located directly between the two lidars.
123

M. E. Rhodes, J. K. Lundquist
In excess of 4,000 10-min time periods are available for analysis; more than 600 timeperiods (6,000 min) meet the criteria based on wind speed, wind direction, and precipitationfor a wind-turbine wake detected by the lidar. Approximately half of the data presented here(55 h) were collected between the hours of 0700 and 1900 LST, providing an even distributionof daytime and nighttime conditions.
2.4 Quantities Observed
From the 2-min estimates of the two horizontal components (u, v) and the vertical component(w) of wind velocity, as well as the variances of these quantities over the 2-min period, severaluseful quantities can be calculated. 10-min averages of these quantities are presented in thefigures below.
Previous investigations have observed enhanced turbulence intensity in the wake. Turbu-lence intensity is calculated from the variances (σ 2) of the u and v components of the flowas in Eq. 7,
I =√
σ 2u + σ 2
v
U, (7)
where U is the mean horizontal wind speed (Stull 1988) at the level at which the velocities areobserved. (Note that some investigators focusing on wind-tunnel studies, such as Chamorroand Porté-Agel (2009), normalize turbulence intensity with hub-height wind speed ratherthan the wind speed at the altitude of the measurement.) In the wind energy industry, tur-bulence intensity is usually calculated over a 10-min period, although it is likely that otheraveraging times are more appropriate for capturing all the energetic length scales of turbulentfluctuations (Mahrt 1998).
These variances may also be used to calculate a quantity approximating turbulent kineticenergy (TKE), a measure of turbulence in the atmosphere (Eq. 8). TKE incorporates bothhorizontal and the vertical components of flow variability (Stull 1988), and so an estimate oflidar TKE (here E) can be calculated as,
E = 0.5(σ 2
u + σ 2v + σ 2
w
). (8)
In a detailed comparison of tower-based sonic anemometry to ground-based lidar, Satheet al. (2011) suggest that ground-based lidar systems fail to accurately calculate horizontaland vertical variances as compared to sonic anemometry. Without tower data for comparisonhere, we do not suggest that the lidar can directly calculate TKE as it would be measured bya sonic anemometer. Rather, we provide a comparison between two similar lidar systems asthey quantify fluctuations in the wind as represented by E .
The wind profile power law (Eq. 9) compares wind-speed measurements between twoheights zi and zi+1. The power law is used in the wind energy industry not because it is anaccurate portrayal of the true wind profile, but because the resulting coefficient α capturesinformation about wind shear that is easily comparable between multiple geographic locations(Schwartz and Elliott 2006),
Ui+1
Ui=
(zi+1
zi
)α
. (9)
In neutral stability, α = 1/7 is commonly used for approximations (Brower 2012). Thisassumption does not hold true for strongly stable or strongly unstable atmospheric conditionsor under high wind shear conditions (Walter et al. 2009; Wharton and Lundquist 2012a,b,among others). Large positive values of α indicate a large increase of wind speed with height;
123
The Effect of Wind-Turbine Wakes
negative values indicate a decrease of wind speed with height. Changes of wind direction withheight are not captured by the power-law coefficient. As discussed in the references above,the use of α to quantify wind shear is not optimal, as it implicitly assumes a logarithmic windprofile that may only be expected in the surface layer or under neutral stratification. Herein itis used only to facilitate comparisons with previous work. Wherever possible, we recommendquantification of the complete wind-speed and wind-direction profiles rather than analysisof only a power-law coefficient α calculated between two levels.
3 Atmospheric Boundary-Layer Properties as Observed with Lidar
Before examining the properties of the waked or disturbed wind profile, it is useful to char-acterize the upwind or unwaked wind profile to assess averaged atmospheric boundary-layercharacteristics of the summertime Midwest boundary layer. We focus on time periods withsoutherly flow (wind directions between 150◦ and 210◦); this span of wind directions isslightly larger than that used by the wake characterization study in Sect. 4. Because of dataloss due to variations in power-generator performance, precipitation events, wind-directionshifts, and air quality, data availability varies with time of day and of height (Fig. 4a): how-ever, at least 30 data points contribute to information at each height and time of day, withover 50 data points in many cases.
An increase of wind speed with height at all times of day is observed (Fig. 4b), as wouldbe expected near the surface. Between 0800 and 1600 local time, the increase of wind speedwith height is subtle, between 2 and 3 m s−1 between 40 and 220 m above the surface:convective mixing during the daytime ensures only slight variations of wind speed withheight. During nocturnal conditions, on the other hand, strong variations of wind speedwith height occur, with wind-speed differences up to 9 m s−1 between 40 and 220 m abovethe surface. The nocturnal wind-speed profiles are consistent with those expected whennocturnal low-level jets are present (Banta et al. 2002, among others). Similarly, the winddirection (Fig. 4c) exhibits subtle variations (approximately 5◦) during well-mixed daytimeconditions. However, the nocturnal decoupling of the boundary layer is accompanied bystrong wind-direction shifts in excess of 35◦ between the top and bottom heights sampled bythe lidar.
Turbulence intensity, as measured by the upwind lidar, exhibits a classic pattern of strongturbulence during the day and reduced turbulence at night (Fig. 4d). Note that because windspeeds are reduced during the day (Fig. 4b), the turbulence intensity is enhanced during theday. When E is considered, daytime values also exceed nocturnal values (figure not shown).This regular diurnal pattern is also evident in the time series of the change of wind directionwith height (Fig. 4e), presented here as calculated across the turbine rotor disk (between40 and 120 m). These data are presented for the contrast with observations of minimal veerdocumented in northern European sites (Cariou et al. 2010). The lidar data suggest strongdaytime convective turbulence couples flow at lower levels with that at upper levels, solittle variation in wind speed or direction occurs during the day. Nighttime conditions, withminimal turbulence and no mixing, enable the decoupling and resulting acceleration andveering of winds at upper levels.
The power-law coefficient, which measures the variation of wind speed with height, alsoexhibits strong diurnal variability (Fig. 4f) when calculated either across the turbine rotor disk(between 40 and 120 m) or across the extent sampled by the lidar (between 40 and 220 m).Note that the lowest measurement available from the lidar is at 40 m above the surface, and sothese α values are lower than would be expected for comparison to other studies that calculate
123

M. E. Rhodes, J. K. Lundquist
Fig. 4 10-min averages of a data availability, b median wind speed, c mean wind direction, d turbulenceintensity, e power-law coefficient, and f wind-direction difference for times with hub-height wind directionsranging between 150◦ and 210◦
shear between a surface-layer measurement (10 m, for example) and altitudes at the turbinerotor disk (Walter et al. 2009). The marked diurnal variations in atmospheric stability are animportant trait of atmospheric behaviour in the US Midwest region.
4 Wake Properties Vary with Inflow Wind Speed
Wake characteristics are expected to depend on inflow wind speed and elevation within therotor disk. 10-min mean differences of horizontal wind speed and turbulence intensity datawere categorized based on the upwind wind speed at the time of the difference measurement.
123
The Effect of Wind-Turbine Wakes
Upwind wind-speed bins are defined in 0.5 m s−1 increments from 2 to 16 m s−1, the availablerange of wind speeds observed throughout the 7-week study period during southerly flowconditions. At least twenty 10-min data points contribute to each unique wind-speed andheight bin presented here.
4.1 Wake Wind-Speed Deficit
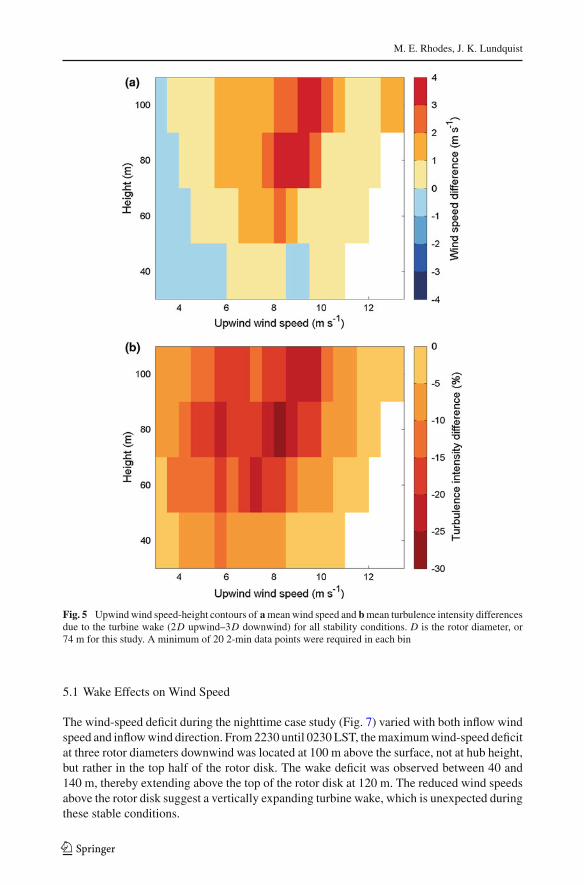
The magnitude of the wind-speed deficit in the wake has been found to vary with altitudewithin the wake in field measurements (Baker and Walker 1984; Hogström et al. 1988;Chamorro and Porté-Agel 2010; Käsler et al. 2010). The wind-tunnel observations of Calet al. (2010) and LES of Wu and Porté-Agel (2011) find a maximum deficit at hub height,as do the lidar observations of Iungo et al. (2013). We also find the average wake deficitexhibits largest values at or just above hub height (80–100 m) (Fig. 5a). The magnitude ofthe deficit depends on the upwind wind speed, with the maximum deficit occurring at windspeeds just below rated speed, on the order of 10 m s−1. These observations are consistentwith expectations for pitch-control turbines such as those studied here: although the turbinewill extract the maximum amount of energy at wind speeds below rated, at wind speeds abovethe rated speed the blades pitch so that no additional power is generated as the wind speedincreases. At wind speeds above the rated speed, blades are pitched to extract less momentumfrom the flow and the wind-speed deficit can be smaller than at lower wind speeds.
4.2 Wake Turbulence Intensity Enhancement
Previous investigations have observed enhanced turbulence intensity in the wake. This regionof enhanced turbulence increases damaging loads on downwind turbines. Further, if thisenhanced turbulence penetrates to the surface, it may modify surface-atmosphere exchangesof heat, momentum, moisture, and carbon dioxide. We observe a distinct region of turbulenceenhancement at turbine hub height (Fig. 5b). As with the wind-speed deficit, the largestenhancement of turbulence occurs at wind speeds below rated. Other observations havenoted turbulence enhancement also at the top of the rotor disk (Iungo et al. 2013). Given thatour measurement volume at the top of the rotor disk is possibly sampling non-wake flowas discussed in Sect. 2.1, the measurements here do not support or deny the existence ofenhanced turbulence at the top of the rotor disk.
5 Stable Nighttime Case Study
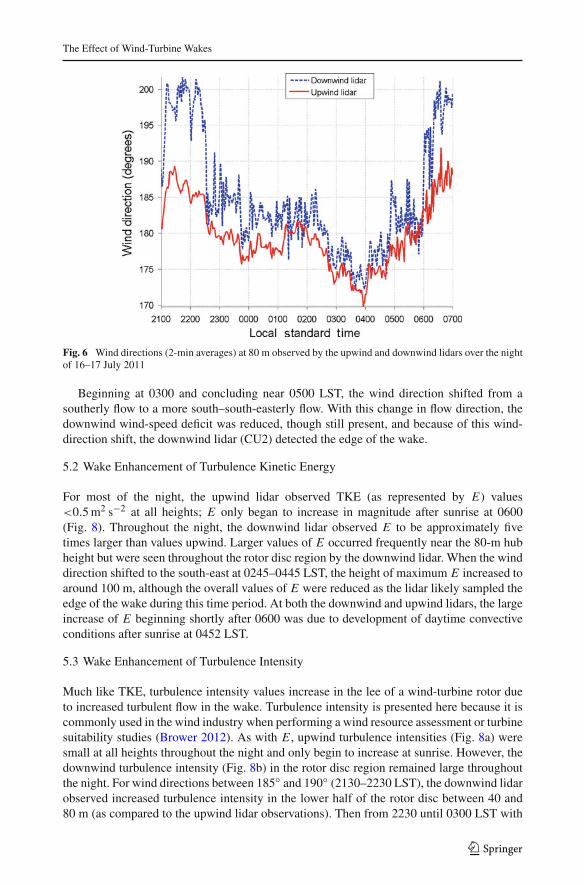
Stable conditions are of particular interest for wake studies, as wakes are expected to retaintheir integrity and propagate for longer distances during stable conditions, as compared toconvective conditions in which strong background turbulence may erode a wake rapidly (Fitchet al. 2013). A night with consistent southerly flow during the CWEX campaign allows closeexamination of wake impacts during stable conditions. The nocturnal case study began at2100 LST on 16 July 2011 and concluded at 0700 LST on 17 July 2011; sunset occurredat 1947 LST on 16 July, and sunrise followed at 0452 LST on 17 July. Weather conditionsduring the event consisted of southerly flow at wind-turbine hub height with wind-directionvariations from 170◦ to 195◦ (Fig. 6). Average hub-height wind speeds were about 9 m s−1
and decreased throughout the night to 7 m s−1 with some variation. Synoptically, Iowa wassituated between an anticyclone to the east and a weak low pressure system to the north-west,which resulted in southerly winds observed at hub height.
123
M. E. Rhodes, J. K. Lundquist
Fig. 5 Upwind wind speed-height contours of a mean wind speed and b mean turbulence intensity differencesdue to the turbine wake (2D upwind–3D downwind) for all stability conditions. D is the rotor diameter, or74 m for this study. A minimum of 20 2-min data points were required in each bin
5.1 Wake Effects on Wind Speed
The wind-speed deficit during the nighttime case study (Fig. 7) varied with both inflow windspeed and inflow wind direction. From 2230 until 0230 LST, the maximum wind-speed deficitat three rotor diameters downwind was located at 100 m above the surface, not at hub height,but rather in the top half of the rotor disk. The wake deficit was observed between 40 and140 m, thereby extending above the top of the rotor disk at 120 m. The reduced wind speedsabove the rotor disk suggest a vertically expanding turbine wake, which is unexpected duringthese stable conditions.
123
The Effect of Wind-Turbine Wakes
Fig. 6 Wind directions (2-min averages) at 80 m observed by the upwind and downwind lidars over the nightof 16–17 July 2011
Beginning at 0300 and concluding near 0500 LST, the wind direction shifted from asoutherly flow to a more south–south-easterly flow. With this change in flow direction, thedownwind wind-speed deficit was reduced, though still present, and because of this wind-direction shift, the downwind lidar (CU2) detected the edge of the wake.
5.2 Wake Enhancement of Turbulence Kinetic Energy
For most of the night, the upwind lidar observed TKE (as represented by E) values<0.5 m2 s−2 at all heights; E only began to increase in magnitude after sunrise at 0600(Fig. 8). Throughout the night, the downwind lidar observed E to be approximately fivetimes larger than values upwind. Larger values of E occurred frequently near the 80-m hubheight but were seen throughout the rotor disc region by the downwind lidar. When the winddirection shifted to the south-east at 0245–0445 LST, the height of maximum E increased toaround 100 m, although the overall values of E were reduced as the lidar likely sampled theedge of the wake during this time period. At both the downwind and upwind lidars, the largeincrease of E beginning shortly after 0600 was due to development of daytime convectiveconditions after sunrise at 0452 LST.
5.3 Wake Enhancement of Turbulence Intensity
Much like TKE, turbulence intensity values increase in the lee of a wind-turbine rotor dueto increased turbulent flow in the wake. Turbulence intensity is presented here because it iscommonly used in the wind industry when performing a wind resource assessment or turbinesuitability studies (Brower 2012). As with E , upwind turbulence intensities (Fig. 8a) weresmall at all heights throughout the night and only begin to increase at sunrise. However, thedownwind turbulence intensity (Fig. 8b) in the rotor disc region remained large throughoutthe night. For wind directions between 185◦ and 190◦ (2130–2230 LST), the downwind lidarobserved increased turbulence intensity in the lower half of the rotor disc between 40 and80 m (as compared to the upwind lidar observations). Then from 2230 until 0300 LST with
123
M. E. Rhodes, J. K. Lundquist
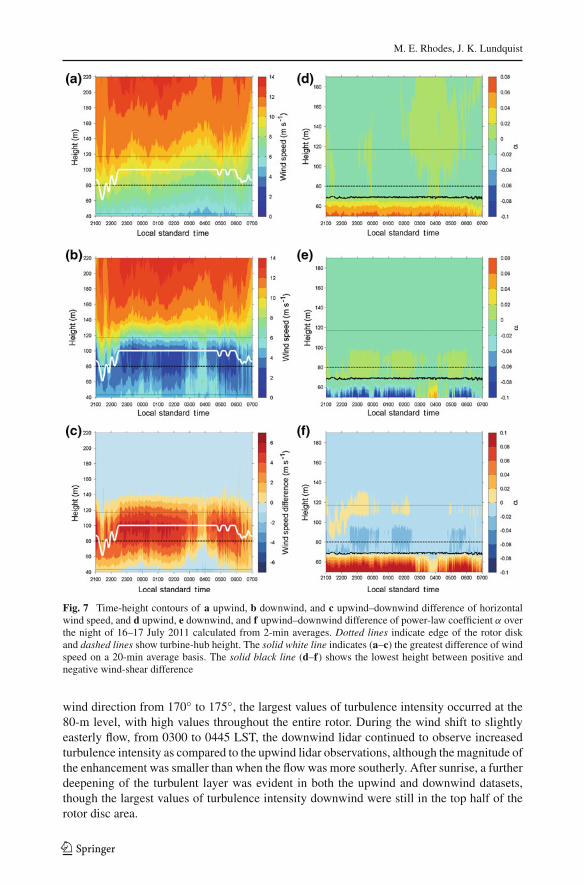
Fig. 7 Time-height contours of a upwind, b downwind, and c upwind–downwind difference of horizontalwind speed, and d upwind, e downwind, and f upwind–downwind difference of power-law coefficient α overthe night of 16–17 July 2011 calculated from 2-min averages. Dotted lines indicate edge of the rotor diskand dashed lines show turbine-hub height. The solid white line indicates (a–c) the greatest difference of windspeed on a 20-min average basis. The solid black line (d–f) shows the lowest height between positive andnegative wind-shear difference
wind direction from 170◦ to 175◦, the largest values of turbulence intensity occurred at the80-m level, with high values throughout the entire rotor. During the wind shift to slightlyeasterly flow, from 0300 to 0445 LST, the downwind lidar continued to observe increasedturbulence intensity as compared to the upwind lidar observations, although the magnitude ofthe enhancement was smaller than when the flow was more southerly. After sunrise, a furtherdeepening of the turbulent layer was evident in both the upwind and downwind datasets,though the largest values of turbulence intensity downwind were still in the top half of therotor disc area.
123

The Effect of Wind-Turbine Wakes
Fig. 8 Time-height contours of a upwind, b downwind, and c upwind–downwind difference of the lidar-determined E , and d upwind, e downwind, and f upwind–downwind difference of horizontal turbulenceintensity over the night of 16–17 July 2011 calculated from 2-min averages. Dotted lines indicate edge ofthe rotor disk and dashed lines show turbine-hub height. The solid white lines indicate the greatest differenceupwind versus downwind on a 20-min average basis
5.4 Wake Impacts on the Power-Law Coefficient α
Upwind α values (Fig. 7d) remained near zero for most of the heights observed, but below70 m, α increased to between 0.02 and 0.08, reflecting the strong wind shear closer to thesurface as the wind speed increased with height. Downwind (Fig. 7e), 50–70 m α exhibitednegative values between −0.1 and −0.02 from 50 to 70 m, indicating that wind speeds inthe bottom half of the rotor disk decreased with height due to the momentum extractionfrom the turbine. Between 70 and 100 m, α ranged from 0.02 to 0.04, indicating increasingwind speeds with height. Of note, this pattern changes during the easterly wind shift around
123

M. E. Rhodes, J. K. Lundquist
0330 to 0400 LST where the values of α resembled values observed upwind of the turbine,suggesting that during this time period, the lidar did not sample a turbine wake. Additionally,the distinct sign change of the power-law coefficient during a period when the wake was notsampled suggests the utility of α (or the sign of wind shear) as a parameter for determiningwake versus non-wake conditions.
6 Discussion and Conclusions
Wind turbines have a measureable effect on atmospheric flow as determined using data fromwind-profiling lidars located approximately two rotor diameters (160 m) upwind and threerotor diameters (240 m) downwind of a multi-MW three-bladed horizontal axis wind-turbinegenerator (WTG). The “undisturbed” flow upwind of the turbine in this summertime USMidwest location is marked by a strong diurnal cycle of moderate and daytime winds withlittle shear and strong nocturnal low-level jets with considerable shear; the nocturnal flowshows evidence of changes in wind direction on the order of 20◦ across typical turbine rotor-disk altitudes. We find reduced wind speed, enhanced TKE, and enhanced turbulence intensitywithin the wake, and that the characteristics of the wake vary with inflow wind speed.
After quantifying the error that can be expected from lidar measurements of inhomoge-neous flow in the turbine wake, over 100 h of data were aggregated to quantify the variabilityof the wake as a function of inflow wind speed. At all wind speeds, the height of maxi-mum wind-speed reduction is at hub height or the range gate immediately above the hub.In neutrally stratified wind-tunnel observations, Chamorro and Porté-Agel (2009) found themaximum wind speed reduction at 3D downwind to be very close to hub height. Similarly,Cal et al. (2010) report a wake-velocity minimum at hub height. In reporting other mea-surements of wakes in the atmosphere, various authors have asserted that maximum velocitydeficits occur below hub height (Elliott and Barnard 1990), at hub height (Kambezidis et al.1990), “somewhat” above hub height (Magnusson and Smedman 1994; Helmis et al. 1995)or “near” hub height (Barthelmie et al. 2003). The results found here are thus consistent withthe wide range reported previously. Further, we find that the maximum deficit occurs at windspeeds just below the rated wind speed for the turbine, consistent with expectations based onthe variation in the tip-speed ratio and thrust coefficient of the turbine (Elliott and Barnard1990; Magnusson and Smedman 1994; Helmis et al. 1995; Barthelmie et al. 2007).
The turbine wake is also characterized by enhanced turbulence, which can induce largeloads and stresses on downwind turbines. We find the height of maximum TKE enhancementto be at hub height in both a 100-h aggregation of wake characteristics and in a stableboundary-layer case study, with the caveat that observations at the top of the rotor diskare not available due to the measurement volume of the lidar at that altitude. Using neutralboundary-layer wind-tunnel observations, Chamorro and Porté-Agel (2009) found the heightof maximum turbulence enhancement to be above hub height, in the top half of the rotor disk,associated with the high turbulence levels produced by the turbine blade-tip vortices. Thepresent observations differ in that we see the turbulence intensity and the TKE at maximumlevels closer to hub height in both stable conditions and unstable conditions, in contrast tothe neutral conditions used in the wind tunnel. The wind-tunnel measurements and the LESof Wu and Porté-Agel (2011) normalize turbulence intensity by the hub-height inflow valueinstead of the value at that height. (We have also normalized our data by hub-height inflowvalues (not shown), and find no meaningful difference with the data presented here.) Calet al. (2010) found maximum Reynolds shear stresses in the wake in the top half of therotor disk. As shown in their Fig. 15, the streamwise velocity variance is at a maximum
123

The Effect of Wind-Turbine Wakes
in the centre of the top half of the disk, while the vertical velocity variance also has amaximum value in the top of the rotor disk. Other field investigations (Magnusson andSmedman 1994) have noted two distinct maxima in the turbulence profile of the wake,attributed to the tip vortices off the blades, at distances of approximately four rotor diametersdownwind.
Our case study emphasizes that observations of the wake are highly dependent on theinflow wind direction: subtle changes in wind direction were sufficient to remove the wakefrom the sampling volume of the lidar. The sign of the wind-speed shear (often expressedas α, the power-law coefficient) in the lower half of the rotor disk (between 50 and 70 m) isa useful determinant of wake versus non-wake downwind conditions. Because momentumextraction in the rotor disc region produces negative shear in the lower half of the rotor, theshear is a clear indicator of the wind-turbine wake and may prove a more precise tool thanupwind wind direction for definition of wake periods for fixed downwind measurements. Thestrong effect of the wake on the shear of the lower boundary layer has also been observed inthe wind-tunnel study of Cal et al. (2010). We conclude that evaluating the sign of the windshear is a simple identifier for wake conditions and is potentially of use for quantifying wakebehaviour and propagation.
The present work has provided insight into the impact of turbine wakes on the atmosphereat one location downwind of a single turbine. To understand the spatial extent of turbine wakesand their evolution downstream, however, future field studies should incorporate scanninglidar to investigate how a wake evolves far downwind of a turbine (Käsler et al. 2010; Iungoet al. 2013; Smalikho et al. 2013). Scanning lidar captures information across a verticalprofile of the wake or horizontal scans that span wake and non-wake conditions over tens ofseconds. Additionally, use of a radiometer or instrumented tall tower to measure temperatureand moisture profiles in the atmospheric boundary layer would allow for better understandingof stability conditions and impacts of the turbine wake on the moisture flux (Friedrich et al.2012). In situ flux measurements of moisture, heat, or trace gases from meteorological towersthat span the distance between standard 10-m meteorological stations and the 40-m lowestlidar measurement level would provide a more complete understanding of how wind-turbinewakes propagate to, and interact with, the surface. Field observations such as these providedata critical for validating turbine-wake models (Churchfield et al. 2012) and wind-tunnelobservations, and for guiding assessments of the impacts of wakes on surface fluxes or surfacetemperatures downwind of turbines.
Acknowledgments The authors gratefully acknowledge the efforts of our collaborators in the CWEX exper-iment, including the Iowa State Team of Dr. Gene Takle, Dan Rajewski, Russ Doorenbos, Kris Spoth, JimmyCayer, and the NCAR team including Dr. Steve Oncley and Dr. Tom Horst. We also extend appreciation to thewind farm operators and the landowners who permitted the deployment of the lidar systems, and to Dr. BrankoKosovic, Ms. Alice DuVivier, Dr. Andrew Clifton, and Mr. Brian Vanderwende for useful discussions andsuggestions. We express appreciation for the helpful comments of two anonymous reviewers. This work wassupported by the National Renewable Energy Laboratory under APUP UGA-0-41026-22. NREL is a nationallaboratory of the US Department of Energy, Office of Energy Efficiency and Renewable Energy, operated bythe Alliance for Sustainable Energy, LLC.
Open Access This article is distributed under the terms of the Creative Commons Attribution License whichpermits any use, distribution, and reproduction in any medium, provided the original author(s) and the sourceare credited.
References
Aitken ML, Rhodes ME, Lundquist JK (2012) Performance of a wind-profiling lidar in the region of windturbine rotor disks. J Atmos Ocean Technol 29:347–355
123

M. E. Rhodes, J. K. Lundquist
Baidya Roy S (2011) Simulating impacts of wind farms on local hydrometeorology. J Wind Eng Ind Aerodyn99:491–498
Baker RW, Walker SN (1984) Wake measurements behind a large horizontal axis wind turbine generator. SolEnergy 33:5–12
Banta RM, Newsom RK, Lundquist JK, Pichugina YL, Coulter RL, Mahrt L (2002) Nocturnal low-level jetcharacteristics over Kansas during CASES-99. Boundary-Layer Meteorol 105(2):221–252
Barthelmie RJ, Folkerts L, Ormel FT, Sanderhoff P, Eecen PJ, Stobbe O, Nielsen NM (2003) Offshore windturbine wakes measured by SODAR. J Atmos Ocean Technol 20:466–477
Barthelmie RJ, Frandsen ST, Nielsen MN, Pryor SC, Rethore P-E, Jørgensen HE (2007) Modelling andmeasurements of power losses and turbulence intensity in wind turbine wakes at Middelgrunden offshorewind farm. Wind Energy 10:517–528
Barthelmie RJ, Pryor SC, Frandsen ST, Hansen KS, Schepers JG, Rados K, Schlez W, Neubert A, Jensen LE,Neckelmann S (2010) Quantifying the impact of wind turbine wakes on power output at offshore windfarms. J Atmos Ocean Technol 27:1302–1317
Bingöl F, Mann J, Foussekis D (2008) Modeling conically scanning lidar error in complex terrain withWAsP engineering. Danmarks Tekniske Universitet, Risø Nationallaboratoriet for Bæredygtig Energi,2008. 16 pp (Denmark. Forskningscenter Risoe. Risoe-R; No. 1664(EN)). http://orbit.dtu.dk/services/downloadRegister/3332817/ris-r-1664.pdf
Blackadar AK (1957) Boundary layer wind maxima and their significance for the growth of nocturnal inver-sions. Bull Am Meteorol Soc 38:283–290
Brower M (2012) Wind resource assessment. Wiley, New YorkCal RB, Lebrón J, Castillo L, Kang HS, Meneveau C (2010) Experimental study of the horizontally aver-
aged flow structure in a model wind-turbine array boundary layer. J Renew Sustain Energy 2:013106–1-013106-25
Cariou N, Wagner R, Gottschall J (2010) Analysis of vertical wind direction and speed gradients for data fromthe Met. Mast at Høvsøre. Danmarks Tekniske Universitet, Risø Nationallaboratoriet for Bæredygtig Energi.34 pp. http://www.risoe.dk/en/Knowledge_base/publications/Reports/ris-r-1733.aspx?sc_lang=da
Chamorro LP, Porté-Agel F (2009) A wind-tunnel investigation of wind-turbine wakes: boundary-layer tur-bulence effects. Boundary-Layer Meteorol 132:129–149
Chamorro LP, Porté-Agel F (2010) Effects of thermal stability and incoming boundary-layer flow character-istics on wind-turbine wakes: a wind-tunnel study. Boundary-Layer Meteorol 136:515–533
Churchfield MJ, Lee S, Michalakes J, Moriarty PJ (2012) A numerical study of the effects of atmospheric andwake turbulence on wind turbine dynamics. J Turbul 13:1–32
Courtney M, Wagner R, Lindelöw P (2008) Testing and comparison of lidars for profile and turbulencemeasurements in wind energy. IOP Conf Ser Earth Environ Sci 1:012021. doi:10.1088/1755-1315/1/1/012021
Elliott DL, Barnard JC (1990) Observations of wind turbine wakes and surface roughness effects on wind flowvariability. Sol Energy 45:265–283
Fitch A, Lundquist JK, Olson JB (2013) Mesoscale influences of wind farms throughout a diurnal cycle. MonWeather Rev (in press). doi:10.1175/MWR-D-12-00185.1
Frandsen ST (2007) Turbulence and turbulence-generated structural loading in wind turbine clusters. 135 pp.http://www.risoe.dtu.dk/rispubl/VEA/veapdf/ris-r-1188.pdf
Frehlich R, Meillier Y, Jensen ML, Balsley B (2003) Turbulence measurements with the CIRES tetheredlifting system during CASES-99: calibration and spectral analysis of temperature and velocity. J AtmosSci 60:2487–2495
Friedrich K, Lundquist JK, Aitken M, Kalina EA, Marshall RF (2012) Stability and turbulence in theatmospheric boundary layer: a comparison of remote sensing and tower observations. Geophys Res Lett39:1–6
Helmis CG, Papadopoulos KH, Asimakopoulos DN, Papageorgas PG, Soilemes AT (1995) An experimentalstudy of the near-wake structure of a wind turbine operating over complex terrain. Sol Energy 54:413–428
Hirth BD, Schroeder JL (2013) Documenting wind speed and power deficits behind a utility-scale wind turbine.J Appl Meteorol Climatol 52:39–46. doi:10.1175/JAMC-D-12-0145.1
Hogström DA, Kambezidis H, Helmis C, Smedman A (1988) A field study of the wake behind a 2 MW windturbine. Atmos Environ 22:803–820
Iungo GV, Wu Y-T, Porté-Agel F (2013) Field measurements of wind turbine wakes with lidars. J AtmosOcean Technol 30:274–287. doi:10.1175/JTECH-D-12-00051.1
Jacobson MZ, Delucchi MA (2011) Providing all global energy with wind, water, and solar power, partI: technologies, energy resources, quantities and areas of infrastructure, and materials. Energy Policy39:1154–1169
123

The Effect of Wind-Turbine Wakes
Kambezidis HD, Asimakopoulos DN, Helmis CG (1990) Wake measurements behind a horizontal-axis 50kW wind turbine. Sol Wind Technol 7:177–184
Käsler Y, Rahm S, Simmet R, Kühn M (2010) Wake measurements of a multi-MW wind turbine with coherentlong-range pulsed doppler wind lidar. J Atmos Ocean Technol 27:1529–1532
Kocer G, Mansour M, Chokani N, Abhari RS, Muller M (2011) Full-scale wind turbine near-wake measure-ments using an instrumented uninhabited aerial vehicle. J Sol Energy Eng 133:041011–1-041011-8
Magnusson M, Smedman AS (1994) Influence of atmospheric stability on wind turbine wakes. Wind Eng18:139–151
Mahrt L (1998) Flux sampling errors for aircraft and towers. J Atmos Ocean Technol 15:416–429. doi:10.1175/1520-0426(1998)0150416:FSEFAA2.0.CO;2
Milligan M, Lew D, Corbus D, Piwko R, Miller N, Clark K, Jordan G, Freeman L, Zavadil B, SchuergerM (2009) Large-scale wind integration studies in the United States: preliminary results. NREL/CP-550-46527, 8 pp
Porte-Agel F, Wu Y-T, Lu H, Conzemius R (2011) Large-eddy simulation of atmospheric boundary layer flowthrough wind turbines and wind farms. J Wind Eng Ind Aerodyn 99:154–168
Rajewski DA et al (2013) Crop wind energy experiment (CWEX): observations of surface-layer, boundarylayer, and mesoscale interactions with a wind farm. Bull Am Meteorol Soc 94:655–672
Sathe A, Mann J, Gottschall J, Courtney MS (2011) Can wind lidars measure turbulence? J Atmos OceanTechnol 28:853–868
Schwartz MN, Elliott DL (2006) Wind shear characteristics at central plains tall towers. National RenewableEnergy Laboratory, 13 pp
Smalikho IN, Banakh VA, Pichugina YL, Brewer WA, Banta RM, Lundquist JK, Kelley ND (2013) Lidarinvestigation of atmosphere effect on a wind turbine wake. J Atmos Ocean Technol. doi:10.1175/JTECH-D-12-00108.1
Stull RB (1988) An introduction to boundary-layer meteorology. Kluwer, Dordrecht, 666 ppTrujillo J-J, Bingöl F, Larsen GC, Mann J, Kühn M (2011) Light detection and ranging measurements of wake
dynamics. Part II: Two-dimensional scanning. Wind Energy 14:61–75USDA (2012) US county crop harvest. http://www.nass.usda.gov/Charts_and_Maps/Crops_County/index.aspWalter K, Weiss CC, Swift AHP, Chapman J, Kelley ND (2009) Speed and direction shear in the stable
nocturnal boundary layer. J Sol Energy Eng 131:011013–1-011013-7Wharton S, Lundquist JK (2012a) Atmospheric stability affects wind turbine power collection. Environ Res
Lett 7:014005–1-014005-9Wharton S, Lundquist JK (2012b) Assessing atmospheric stability and its impacts on rotor-disk wind charac-
teristics at an onshore wind farm. Wind Energy 15:525–546Whiteman CD, Bian X, Zhong S (1997) Low-level jet climatology from enhanced rawindsonde observations
at a site in the southern Great Plains. J Appl Meteorol 36:1363–1376Wu Y-T, Porté-Agel F (2011) Large-eddy simulation of wind-turbine wakes: evaluation of turbine parametri-
sations. Boundary-Layer Meteorol 138:345–366Zhou L, Tian Y, Roy SB, Thorncroft C, Bosart LF, Hu Y (2012) Impacts of wind farms on land surface
temperature. Nat Clim Chang 2:539–543
123
Related Documents