THE EFFECT OF THE TCJA INDIVIDUAL INCOME TAX PROVISIONS ACROSS INCOME GROUPS AND ACROSS THE STATES Frank Sammartino, Philip Stallworth, and David Weiner March 28, 2018 ABSTRACT The Tax Cut and Jobs Act (TCJA) will reduce individual income taxes on average for all income groups and in all states. Unlike prior Tax Policy Center reports, this analysis focuses on the distribution of the individual income tax changes, and does not include changes in the corporate income tax, excise taxes, or estate and gift taxes. It also extends the analysis to include the distribution of the individual income tax changes across the states. We estimate that in 2018, the TCJA will cut individual income taxes for 65 percent of households overall, but raise taxes for about 6 percent of households. Only 27 percent of households in the lowest income-quintile will receive a tax cut (or an increase in their tax refund), with most having no material change in their taxes. The individual income tax cuts as a percentage of after-tax income will be largest for high-income households, particularly those in the 95th to 99th percentile of the income distribution. We estimate that between 60 and 76 percent of taxpayers in every state will receive a tax cut. The individual income tax cut will average about 1.8 percent of after-tax income across all states, exceed 2.1 percent of after-tax income in seven states, and fall below 1.5 percent of after-tax income in California, New York, and Oregon.

Welcome message from author
This document is posted to help you gain knowledge. Please leave a comment to let me know what you think about it! Share it to your friends and learn new things together.
Transcript

THE EFFECT OF THE TCJA INDIVIDUAL INCOME TAX PROVISIONS ACROSS INCOME GROUPS AND ACROSS THE STATES Frank Sammartino, Philip Stallworth, and David Weiner March 28, 2018 ABSTRACT
The Tax Cut and Jobs Act (TCJA) will reduce individual income taxes on average for all income groups and in all states. Unlike prior Tax Policy Center reports, this analysis focuses on the distribution of the individual income tax changes, and does not include changes in the corporate income tax, excise taxes, or estate and gift taxes. It also extends the analysis to include the distribution of the individual income tax changes across the states. We estimate that in 2018, the TCJA will cut individual income taxes for 65 percent of households overall, but raise taxes for about 6 percent of households. Only 27 percent of households in the lowest income-quintile will receive a tax cut (or an increase in their tax refund), with most having no material change in their taxes. The individual income tax cuts as a percentage of after-tax income will be largest for high-income households, particularly those in the 95th to 99th percentile of the income distribution. We estimate that between 60 and 76 percent of taxpayers in every state will receive a tax cut. The individual income tax cut will average about 1.8 percent of after-tax income across all states, exceed 2.1 percent of after-tax income in seven states, and fall below 1.5 percent of after-tax income in California, New York, and Oregon.

T AX P OL IC Y CE N TE R | URB AN IN S TI T UT E & BR OO KING S IN S TI TU T IO N 2
The recently enacted Tax Cut and Jobs Act (TCJA) 1 made major changes to the individual and corporate income
tax, estate and gift taxes, and certain federal excise taxes. The individual income tax provisions (which include
changes to the tax treatment of pass-through business income and losses) account for most of the change in
after-tax income for the vast majority of households. However, cuts in the corporate income and estate taxes
drive much of the increase in after-tax income for the highest-income taxpayers. 2
The most significant changes to the individual income tax include reducing income tax rates and expanding
tax brackets; repealing personal exemptions but increasing the standard deduction and the child tax credit and
creating a new dependent tax credit; limiting or restricting certain itemized deductions; increasing the
alternative minimum tax exemption amounts; introducing a new deduction for a portion of certain types of
business income; and putting a limit on deductible business losses. These changes took effect on January 1,
2018, but expire after December 31, 2025.
In this analysis, we consider the effects of the individual income tax provisions on taxpayers in different
income groups and across states. We exclude changes to the corporate income tax, estate and gift taxes, excise
taxes, and the elimination of the Affordable Care Act individual mandate penalty. 3
DISTRIBUTION OF THE INDIVIDUAL INCOME TAX CHANGES
We estimate that the TCJA will reduce individual income taxes by about $1,260 on average in 2018, increasing
after-tax incomes 1.7 percent (table 1). Taxes will decline on average across all income groups. Taxpayers in the
bottom income-quintile (those with income less than $25,000) will see an average tax cut of $40, or 0.3 percent
of after-tax income. Taxpayers in the middle income-quintile (those with income between about $49,000 and
$86,000) will receive an average tax cut of about $800, or 1.4 percent of after-tax income. Taxpayers in the 95th
to 99th income percentiles (those with income between about $308,000 and $733,000) will benefit the most as
a share of after-tax income, with an average tax cut of about $11,200 or 3.4 percent of after-tax income.
Taxpayers in the top 1 percent of the income distribution (those with income more than $733,000) will receive
an average cut of nearly $33,000, or 2.2 percent of after-tax income.
Including the major corporate income and estate and gift tax provisions raises the average tax cut to about
$1,600.4 Taxpayers in the top 1 percent gain the most from those provisions as their estimated tax cut
increases by $18,000 to $51,000, or by 1.2 percentage points of after-tax income (from 2.2 to 3.4 percent). For
taxpayers in income groups below the top 10 percent, the tax cuts from those provisions amount to 0.3 percent
or less of after-tax income. 5

T AX P OL IC Y CE N TE R | URB AN IN S TI T UT E & BR OO KING S IN S TI TU T IO N 3
WINNERS AND LOSERS
The impact of the TCJA on individual taxpayers will differ depending on their income sources, marital status,
family composition, and other characteristics that affect eligibility for certain income tax provisions. Our
estimates of the number of taxpayers who will pay more tax or less tax than under current law exclude certain
minor provisions, for which it is difficult to assign the tax changes to specific taxpayers.
We estimate that in 2018, just under 65 percent of taxpayers will receive a tax cut from the included
individual income tax provisions—averaging about $2,200—and about 6 percent will see an average tax
increase of about $2,800 (table 2). 6 In the bottom income-quintile, 27 percent will receive a tax cut and about 1
percent will have a tax increase, with the rest having no material change in their income tax. In the middle
income-quintile, 82 percent will receive a tax cut and 9 percent will have a tax increase. In the top income-
quintile, 90 percent will receive a tax cut and 10 percent will have a tax increase.7
Change (% Points)
Under the Proposal (%)
Lowest Quintile 0.3 0.9 -40 -0.3 3.8
Second Quintile 1.0 5.6 -320 -0.9 7.8
Middle Quintile 1.4 12.2 -780 -1.2 12.6
Fourth Quintile 1.6 19.4 -1,480 -1.3 16.0
Top Quintile 2.2 63.6 -5,790 -1.7 23.8
All 1.7 100.0 -1,260 -1.4 18.4
Addendum
80-90 1.7 13.7 -2,430 -1.3 18.8
90-95 1.7 9.5 -3,500 -1.4 20.6
95-99 3.4 23.5 -11,190 -2.5 22.7
Top 1 Percent 2.2 16.8 -32,650 -1.5 31.1
Lowest Quintile 0.4 1.0 -60 -0.4 3.7
Second Quintile 1.2 5.2 -380 -1.1 7.6
Middle Quintile 1.6 11.2 -930 -1.4 12.4
Fourth Quintile 1.9 18.4 -1,810 -1.6 15.8
Top Quintile 2.9 65.3 -7,640 -2.2 23.3
All 2.2 100 -1,610 -1.8 18.1
Addendum
80-90 2.0 13.1 -2,970 -1.6 18.5
90-95 2.2 9.6 -4,550 -1.8 20.2
95-99 4.1 22.1 -13,480 -3.1 22.2
Top 1 Percent 3.4 20.5 -51,140 -2.3 30.3
Note: Refer to TPC's Model Estimates (T18-0028) for further information.
Individual Income Tax Provisions
All Provisions
Average Federal Tax Rate
Source: Urban-Brookings Tax Policy Center Microsimulation Model (version 0217-1).
Expanded Cash Income Percentile
Percent Change in After-Tax Income
Share of Total Federal Tax
Change (%)
Average Federal Tax Change ($)
TABLE 1
Distribution of Federal Tax Change from H.R.1, The Tax Cuts and Jobs Actby Expanded Cash Income Percentile, 2018

T AX P OL IC Y CE N TE R | URB AN IN S TI T UT E & BR OO KING S IN S TI TU T IO N 4
Over 70 percent of taxpayers in the lowest income quintile will see no material change in their taxes from
the individual income tax provisions of the TCJA (this group contains a relatively large number of non-filers of
income tax returns). Federal individual income taxes are negative on average for taxpayers in this income group
because they receive more in refundable tax credits, such as the earned income tax credit (EITC) and the
additional child tax credit (ACTC), than they owe in income taxes. The TCJA modestly expanded the ACTC
(mostly for taxpayers in the second quintile) but did not change the EITC.8
Percent of Tax Units
Average Tax Change ($)
Percent of Tax Units
Average Tax Change ($)
Lowest Quintile 27.0 -190 1.4 750
Second Quintile 64.9 -550 5.6 660
Middle Quintile 82.2 -1,050 9.1 850
Fourth Quintile 88.9 -1,810 9.8 1,280
Top Quintile 89.8 -7,170 9.6 8,120
All 64.8 -2,180 6.3 2,760
Addendum
80-90 89.0 -2,950 10.5 1,770
90-95 89.6 -4,100 9.8 1,830
95-99 93.9 -12,130 5.6 5,630
Top 1 Percent 83.1 -51,310 16.1 77,320
Lowest Quintile 53.9 -130 1.2 810
Second Quintile 86.8 -480 4.6 740
Middle Quintile 91.3 -1,090 7.3 910
Fourth Quintile 92.5 -2,070 7.3 1,360
Top Quintile 93.7 -8,510 6.2 8,800
All 80.4 -2,140 4.8 2,770
Addendum
80-90 92.3 -3,370 7.6 1,800
90-95 94.4 -4,910 5.5 1,890
95-99 97.3 -13,890 2.7 8,260
Top 1 Percent 90.7 -61,940 9.3 93,910
Note: Refer to TPC's Model Estimates (T18-0029) for further information.
Individual Income Tax Provisions
All Provisions
Expanded Cash Income Percentile
Tax Units with Tax Increase or Cut
With Tax Cut With Tax Increase
Source: Urban-Brookings Tax Policy Center Microsimulation Model (version 0217-1).
TABLE 2
Tax Units with a Tax Change from H.R.1, The Tax Cuts and Jobs Actby Expanded Cash Income Percentile, 2018

T AX P OL IC Y CE N TE R | URB AN IN S TI T UT E & BR OO KING S IN S TI TU T IO N 5
DISTRIBUTION ACROSS STATES
The impact of the TCJA across states will differ depending on the economic and demographic characteristics of
state populations as well as state-specific characteristics that may affect ultimate income tax liability. Average
federal income taxes will decline in all states, but by varying amounts.9 Because we are not able to identify
taxpayers with active pass-through business losses by state, we do not include the provision of the TCJA that
limits deductible losses for those businesses in our estimates for the states. This provision affects a small
number of generally very high income taxpayers. The omission of this provision has little effect on the estimates
for taxpayers in income groups other than the top 1 percent and a very modest effect on the overall results—
raising the overall percentage increase in after-tax income from 1.7 to 1.8 percent, and the overall average tax
cut from $1,260 to $1,330.
In most states the average change in after-tax income in 2018 is close to the national average of 1.8 percent
(figure 1). However, the tax cut will exceed 2.1 percent of after-tax income in seven states (Alaska, Louisiana,
North Dakota, South Dakota, Texas, Washington, and Wyoming) and fall below 1.5 percent of after-tax income
in three states (California, New York, and Oregon).10
FIGURE 1
Percentage Change in After-Tax Income, 2018
Less than 1.5% 1.5% - 2.1% More than 2.1%
AK ME
WI VT NH
WA ID MT ND MN IL MI NY MA
OR NV WY SD IA IN OH PA NJ CT RI
CA UT CO NE MO KY WV VA MD DE
AZ NM KS AR TN NC SC DC
OK LA MS AL GA
HI TX FL
Source: Urban-Brookings Tax Policy Center Microsimulation Model (version 0217-1),Table T18-0028.

T AX P OL IC Y CE N TE R | URB AN IN S TI T UT E & BR OO KING S IN S TI TU T IO N 6
The percentage of taxpayers with a tax increase from the major individual provisions (figure 2) will range
from less than 4 percent in six states (Alaska, Indiana, North Dakota, South Dakota, West Virginia, and
Wyoming) and more than 8 percent in six states (California, Connecticut, District of Columbia, Maryland, New
Jersey, and New York), with tax increases for more than 9 percent of taxpayers in Maryland, New Jersey and the
District of Columbia.
A CLOSER LOOK AT THREE STATES
There is more variation in the size of the tax cuts across states for taxpayers in specific income groups than in
the overall state averages. Some of this reflects differences in the way people earn income (for example larger
tax cuts where more people can take the new deduction for business income), and some of this reflects
FIGURE 2
Percentage of Tax Units with Tax Increase, 2018
Less than 4.0% 4.0% - 8.0% More than 8.0%
AK ME
WI VT NH
WA ID MT ND MN IL MI NY MA
OR NV WY SD IA IN OH PA NJ CT RI
CA UT CO NE MO KY WV VA MD DE
AZ NM KS AR TN NC SC DC
OK LA MS AL GA
HI TX FL
Source: Urban-Brookings Tax Policy Center Microsimulation Model (version 0217-1),Table T18-0029.

T AX P OL IC Y CE N TE R | URB AN IN S TI T UT E & BR OO KING S IN S TI TU T IO N 7
differences in family composition (and thus the trade-off between the loss of dependent exemption and the
increase in the CTC). Much of the difference across states, however, results from the limit on the state and local
tax (SALT) deduction.
The TCJA capped the annual itemized deduction for state and local taxes at $10,000. Under prior law,
taxpayers could deduct the full amount of their state and local property taxes and either income or sales taxes if
they itemized their deductions (although the alternative minimum tax (AMT) limited the tax benefit from the
SALT deduction for many higher-income taxpayers). TPC estimates that about one-quarter of households will
claim the SALT deduction on their 2017 tax return, with about two-thirds of the tax benefit from the deduction
going to households with income of $200,000 or more.11
The TCJA nearly doubled standard deductions. As a result, many more taxpayers will take a standard
deduction rather than itemizing. TPC estimates that the number of itemizers will fall in 2018 from about 47
million who would have taken the deduction under prior law to about 19 million, or from 26 percent to 11
percent of households. 12 But for taxpayers who continue to itemize, the limit on the SALT deduction will have a
significant impact that will vary by state.
To illustrate these differences, we consider three states, New York, Virginia, and Texas. These states are
representative of states with high (NY), medium (VA) and low (TX) state taxes as a percentage of state income.
They are also representative of states in which the TCJA individual income tax cuts as a percentage of after-tax
income are below (1.4 percent in NY), equal to (1.8 percent in VA), and above (2.2 percent in TX) the national
average tax cut of 1.8 percent.
The percentage change in after-tax income from the individual income tax provisions of the TCJA are very
close to the national average for taxpayers in the three lowest income quintiles in all three states in 2018.13 The
increase in after-tax income for taxpayers in the middle income-quintile is 0.1 percentage point higher than the
national average in Texas and 0.1 percentage points lower than the national average for middle-income
taxpayers in New York and Virginia. However, there are notable differences across the three state for higher-
income taxpayers, particularly for those with incomes in the top twenty percent of the income distribution.
For example, the national average increase in after-tax income for taxpayers in the 80th-90th percentile is 1.7
percent in 2018, but for taxpayers in that income group, the increase is 2.1 percent in Texas, 1.6 percent in
Virginia, and only 1.3 percent in New York (figure 3). The differences are starker for taxpayers in the top one
percent. The national average increase in after-tax income is 2.6 percent for taxpayers in that income group but
4.1 percent in Texas, 2.9 percent in Virginia, and 1.3 percent for taxpayers in New York.
Perhaps surprisingly, the increase in after-tax income for taxpayers in the 95th-99th percentile in New York is
much closer to the national average, 3.1 percent for them compared with 3.4 percent for all taxpayers in that
income group. The reason is that taxpayers in that income range were the most likely to pay the individual
alternative minimum tax (AMT) under prior law, which would have significantly reduced or even eliminated the

T AX P OL IC Y CE N TE R | URB AN IN S TI T UT E & BR OO KING S IN S TI TU T IO N 8
tax benefit from their state and local tax deduction. Because the TCJA raises the AMT exemption thresholds,
sparing most high-income taxpayers from the AMT in 2018, these taxpayers will be able to benefit from
deducting their state and local taxes up to the new $10,000 limit. The remaining few taxpayers that will pay the
AMT in 2018 will tend to be further toward the very top of the income distribution.
A similar story emerges with respect to the small percentage of taxpayers within each income group that
pay higher individual income taxes (and thus have a reduction in after-tax income) because of the TCJA. Overall,
the individual income tax provisions will increase taxes for about 6 percent of taxpayers nationwide in 2018;
about the same percentage for taxpayers in Texas, but a slightly higher 8 percent in New York and Virginia. But
again, more significant differences emerge among upper income groups.
Individual income taxes will increase for about 11 percent of taxpayers in the 80th-90th percentile
nationwide in 2018, but for about 8 percent of taxpayers in that income group in Texas, 11 percent in Virginia,
and 16 percent of those taxpayers in New York (figure 4). About 16 percent of U.S. taxpayers with income in the
top one percent will see an increase in individual income taxes, but only 5 percent of taxpayers with income in
the top one percent in Texas and 11 percent in Virginia, compared to 29 percent of taxpayers in that income
group in New York.

T AX P OL IC Y CE N TE R | URB AN IN S TI T UT E & BR OO KING S IN S TI TU T IO N 9
THE EFFECT OF THE $10,000 LIMIT ON THE SALT DEDUCTION
To see how much of the differences across states result from the $10,000 limit on the SALT deduction, we
simulate an alternative version of the TCJA in which there is no limit on the itemized deduction for state and
local taxes. All other provisions are the same as in the previous estimates.
Without the limit on the SALT deduction the national average individual income tax cut in 2018 would
increase from about $1,300 to about $1,700 and the average increase in after-tax income would rise from 1.8 to
2.3 percent. There would be very little change, on average, for taxpayers in the four lowest income-quintiles.
For taxpayers in the top quintile the average individual income tax cut would increase by $2,500 from about
$6,200 to about $8,700, and the average increase in after-tax income would rise from 2.4 to 3.3 percent. For
taxpayers with income in the top one percent, the average individual income tax cut would also rise
substantially from $40,100 to $71,000, and the average increase in after-tax income would rise from 2.6 to 4.7
percent.
Without the limit on the SALT deduction, the national average income tax cuts and the average increases in
after-tax incomes would be more equal across high-income taxpayers in New York, Virginia, and Texas. The
national average increase in after-tax income in 2018 for taxpayers in the 80th-90th percentile would be 1.9
percent for the TCJA without the SALT deduction limit. For taxpayers in that income group the increase would
be 2.2 percent in Texas, 1.7 percent in Virginia, and 1.8 percent in New York (figure 5). For taxpayers in the top

T AX P OL IC Y CE N TE R | URB AN IN S TI T UT E & BR OO KING S IN S TI TU T IO N 10
one percent, the national average increase in after-tax income in 2018 would be 4.7 percent without the SALT
deduction limit, 4.6 percent for taxpayers in that income group in Texas, 4.9 percent in Virginia, and 4.3 percent
in New York.
The percentage of high-income taxpayers with a tax increase would be lower without the SALT deduction
limit and more similar across the three states in 2018 (figure 6). Individual income taxes for 2018 would increase
for about 7 percent of taxpayers in the 80th-90th percentile nationwide without the SALT deduction limit, and
for about 7 percent of taxpayers in that income group in Texas, 8 percent in Virginia, and 6 percent in New
York. While the percentage of taxpayers in the top one percent with a tax increase would be much closer across
the states without the SALT deduction limit, some differences would remain. Only about 3 percent of taxpayers
nationwide with income in the top one percent would see an increase in individual income taxes without the
SALT deduction limit, about 3 percent of taxpayers with income in the top one percent in Texas, 2 percent
Virginia, and about 5 percent of taxpayers in that income group in New York.

T AX P OL IC Y CE N TE R | URB AN IN S TI T UT E & BR OO KING S IN S TI TU T IO N 11
ANALYSIS AND CONCLUSIONS
About two-thirds of taxpayers will receive a tax cut from the individual income tax provisions of the TCJA in
2018. Most (70 percent) households in the lowest income-quintile will not see a reduction in their individual
income taxes. Conversely, about 65 percent of households in the second income-quintile will see a reduction in
their individual income taxes, as will over 80 percent of households in the middle, and higher income-quintiles.
The individual income tax cuts, relative to after-tax income, tilt in favor of high-income taxpayers, particularly
those in the 95th-99th percentiles of the income distribution.
There is not a great deal of variation in the effects of the TCJA individual income tax provisions across
households in different states, except for higher-income households. In states where state and local taxes are a
higher percentage of state income, the individual income tax cuts will be lower than average and the
percentage of taxpayers in each income group with a tax increase will be higher than average for taxpayers in
upper income-groups, particularly for the top 1 percent of the income distribution. Removing the SALT
deduction limit would reduce the disparity in the tax cuts from the TCJA individual income tax provisions across
taxpayers in different states, but it also would increase the tax cut for high-income taxpayers and substantially
increase the revenue cost of the legislation.
From a tax policy standpoint, there are different ways to view the SALT deduction limit. For example,
Burman and Sammartino observe: “The $10,000 limit is one progressive element of a law that

T AX P OL IC Y CE N TE R | URB AN IN S TI T UT E & BR OO KING S IN S TI TU T IO N 12
disproportionately benefits the rich. In 2018, 96 percent of the additional tax from the limitation of the SALT
deduction falls on the top 20 percent of taxpayers and 57 percent on the top one percent. It also raises a lot of
money—nearly $650 billion over 10 years.”14
Another view is that limiting the SALT deduction restricts an important federal tax benefit to the states that
increases progressivity at the state level. Tracy Gordon explains: “Although imperfect, the SALT deduction
encouraged states to spend more than they otherwise would on important public services and to tilt their
revenue systems toward progressive income taxes. Both steps may have helped reduce income inequality.”15
And then there is the question of fairness across the states. New York Governor Andrew Cuomo offers one
view: “Washington has launched an all-out, direct attack on New York State's economic future,” Cuomo said at
his “State of the State” address in Albany. “It is crass. It is ugly. It is divisive. It is partisan legislating. It is an
economic civil war. Make no mistake: They are aiming to hurt us.”16
An open letter to Congress from the American Legislative Exchange Council (ALEC) offers a different view:
”Thanks to SALT, income earners and businesses in lower-taxed states pay a higher effective federal income tax
rate than their high-taxed counterparts since they deduct less from their taxable income. In effect, citizens in
more fiscally responsible regions subsidize the malfeasance of politicians thousands of miles away.”17
In response to the limit on deductible taxes, states are exploring several alternatives that would allow
taxpayers to deduct those taxes in other ways. One proposal is to reduce state income taxes but make up that
revenue with employer payroll taxes, which remain deductible for the employer under the new law. If employers
reduce employee wages to cover the cost of the new payroll tax, workers would see their wages go down, but
that decrease could be offset by a state income tax credit equal to the reduction in wages or other
modifications to state income taxes, leaving their net income after state taxes unchanged. Because of the
reduction in wages, workers would also see their federal employee payroll taxes go down. If the employer
payroll tax applied to all wages, this would essentially extend federal deductibility of state income taxes to all
workers, not just to those who itemize deductions. A reduction in wages would also reduce federal income
taxes for some workers but would increase them for others due to the way some refundable tax credits operate.
An alternative proposal is to establish special charitable organizations to support specific state and local
programs, such as for funding K–12 education, and give taxpayers who donate to these organizations an
income tax credit for their donations. If the credit rate was 100 percent, this would leave their income after state
taxes unchanged and allow them to deduct their charitable contributions on their federal income tax return.
There are numerous examples of similar charitable donation programs already in place. Over thirty states
provide special tax credits or tax deduction for certain charitable contributions. Taxpayers can also claim a
federal deduction for the contributions and are not required to reduce their deduction by the amount of the tax
benefit they receive from the state.18 The latter feature provided an additional benefit to taxpayers who were
on the AMT and thus could not deduct their state and local taxes but could deduct charitable contributions.

T AX P OL IC Y CE N TE R | URB AN IN S TI T UT E & BR OO KING S IN S TI TU T IO N 13
Others, however, have questioned the efficacy of this end run around the SALT deduction limit, including
Treasury’s tax legislative counsel. 19
The state and local tax deduction has been a feature of the federal income tax since its inception. It has
survived past attempts at major restrictions, notably the elimination and then partial revival of the deduction for
state and local sales tax. For that reason, many observers believe that the current limit on the SALT deduction is
far from a settled issue, particularly as that provision, along with most other individual income tax provisions,
expires after 2025.20
APPENDIX
($) (%)Change
(% Points)
Under the Proposal
(%)Alabama 1.4 0.9 1.9 1.3 -1,240 -9.1 -1.6 15.9
Alaska 0.2 0.2 2.5 0.3 -1,740 -9.9 -2.0 17.9
Arizona 1.9 1.5 1.8 1.8 -1,250 -8.2 -1.5 16.9
Arkansas 0.8 0.5 1.8 0.7 -1,130 -8.4 -1.5 15.8
California 11.8 14.0 1.5 10.2 -1,150 -5.6 -1.2 19.6
Colorado 1.6 1.8 2.0 2.0 -1,630 -7.9 -1.6 18.6
Connecticut 1.1 2.4 1.8 1.6 -1,870 -5.9 -1.4 22.1
Delaware 0.3 0.3 1.8 0.3 -1,370 -7.7 -1.5 17.7
District of Columbia 0.2 0.4 1.7 0.3 -1,580 -5.6 -1.3 22.3
Florida 6.9 6.2 2.0 6.7 -1,290 -8.1 -1.6 17.9
Georgia 3.3 2.2 1.7 2.7 -1,070 -7.8 -1.4 16.8
Hawaii 0.5 0.3 1.7 0.4 -1,150 -7.6 -1.4 16.8
Idaho 0.4 0.3 1.7 0.4 -1,100 -8.2 -1.4 15.6
Illinois 4.2 4.6 1.9 4.6 -1,470 -7.5 -1.5 18.9
Indiana 2.1 1.4 1.9 1.9 -1,210 -9.0 -1.6 16.0
Iowa 0.9 0.7 2.0 1.0 -1,440 -8.8 -1.6 16.6
Kansas 0.9 0.8 2.0 1.0 -1,460 -8.9 -1.7 17.0
Kentucky 1.3 0.8 1.8 1.1 -1,120 -8.4 -1.5 16.0
Louisiana 1.3 0.9 2.1 1.4 -1,390 -9.5 -1.7 16.5
Maine 0.4 0.3 1.7 0.4 -1,170 -7.8 -1.4 16.7
Maryland 1.9 2.4 1.7 2.1 -1,480 -6.5 -1.4 19.4
Massachusetts 2.1 3.5 1.9 2.8 -1,790 -6.7 -1.5 20.8
Michigan 3.3 2.5 1.8 2.8 -1,160 -8.0 -1.5 16.7
Minnesota 1.7 1.8 1.8 1.8 -1,440 -7.2 -1.4 18.5
Mississippi 0.9 0.4 1.8 0.7 -1,040 -9.5 -1.5 14.5
Missouri 1.9 1.4 1.8 1.7 -1,220 -8.0 -1.5 16.8
Montana 0.3 0.2 1.8 0.3 -1,180 -8.4 -1.5 15.9
Nebraska 0.6 0.5 2.0 0.6 -1,450 -8.6 -1.6 17.0
Nevada 0.9 0.8 2.0 0.9 -1,300 -8.1 -1.6 17.8
New Hampshire 0.4 0.5 2.1 0.6 -1,710 -8.0 -1.6 18.9
New Jersey 2.8 4.3 1.7 3.2 -1,490 -6.0 -1.3 20.3
New Mexico 0.7 0.4 1.8 0.5 -1,090 -8.9 -1.5 15.5
New York 6.4 9.7 1.4 5.9 -1,210 -5.0 -1.1 21.2
North Carolina 2.9 2.1 1.7 2.5 -1,150 -7.8 -1.4 16.7
North Dakota 0.2 0.2 2.7 0.4 -2,170 -10.8 -2.1 17.6
Ohio 3.7 2.8 1.9 3.5 -1,260 -8.3 -1.5 17.0
Oklahoma 1.1 0.9 2.0 1.2 -1,380 -9.0 -1.6 16.6
Oregon 1.2 0.9 1.5 0.9 -1,040 -6.7 -1.2 17.0
Pennsylvania 4.2 4.0 1.9 4.2 -1,330 -7.7 -1.5 17.9
Rhode Island 0.3 0.3 1.6 0.3 -1,200 -6.9 -1.3 17.8
South Carolina 1.4 0.9 1.7 1.2 -1,070 -8.1 -1.4 15.9
South Dakota 0.3 0.2 2.4 0.4 -1,690 -10.5 -1.9 16.5
Tennessee 2.0 1.4 2.0 2.0 -1,310 -9.1 -1.7 16.7
Texas 7.7 8.0 2.2 9.7 -1,670 -8.9 -1.8 18.4
Utah 0.8 0.6 1.8 0.7 -1,250 -8.2 -1.5 16.3
Vermont 0.2 0.2 1.7 0.2 -1,180 -7.3 -1.4 17.1
Virginia 2.5 3.0 1.8 3.0 -1,560 -7.1 -1.4 18.8
Washington 2.2 2.6 2.1 2.8 -1,710 -8.2 -1.7 18.9
West Virginia 0.6 0.3 1.8 0.5 -1,130 -9.0 -1.5 15.3
Wisconsin 1.8 1.5 1.8 1.7 -1,280 -7.8 -1.5 17.2
Wyoming 0.2 0.2 2.2 0.3 -1,720 -8.7 -1.8 18.5
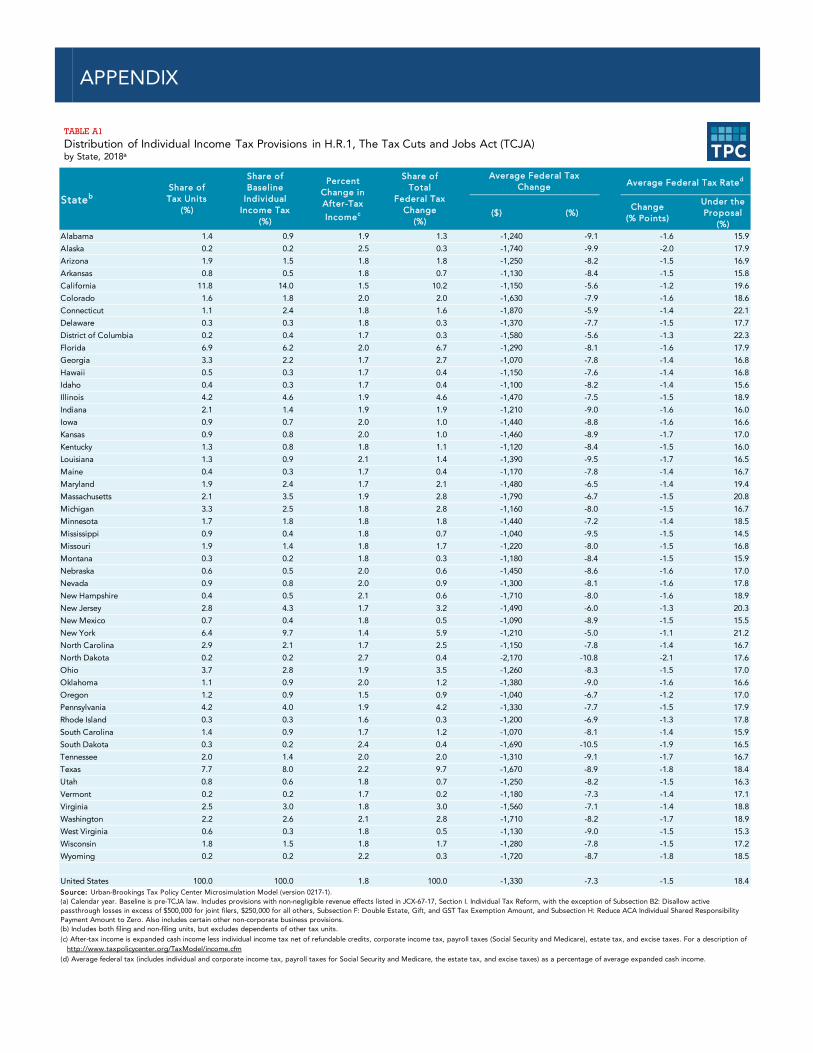
United States 100.0 100.0 1.8 100.0 -1,330 -7.3 -1.5 18.4
http://www.taxpolicycenter.org/TaxModel/income.cfm
Average Federal Tax Rated
Source: Urban-Brookings Tax Policy Center Microsimulation Model (version 0217-1). (a) Calendar year. Baseline is pre-TCJA law. Includes provisions with non-negligible revenue effects listed in JCX-67-17, Section I. Individual Tax Reform, with the exception of Subsection B2: Disallow active passthrough losses in excess of $500,000 for joint filers, $250,000 for all others, Subsection F: Double Estate, Gift, and GST Tax Exemption Amount, and Subsection H: Reduce ACA Individual Shared Responsibility Payment Amount to Zero. Also includes certain other non-corporate business provisions. (b) Includes both filing and non-filing units, but excludes dependents of other tax units.(c) After-tax income is expanded cash income less individual income tax net of refundable credits, corporate income tax, payroll taxes (Social Security and Medicare), estate tax, and excise taxes. For a description of
(d) Average federal tax (includes individual and corporate income tax, payroll taxes for Social Security and Medicare, the estate tax, and excise taxes) as a percentage of average expanded cash income.
Average Federal Tax ChangeShare of
Tax Units (%)
Share of Baseline
Individual Income Tax
(%)
Stateb
Percent Change in After-Tax
Incomec
Share of Total
Federal Tax Change
(%)
TABLE A1
Distribution of Individual Income Tax Provisions in H.R.1, The Tax Cuts and Jobs Act (TCJA)by State, 2018a

T AX P OL IC Y CE N TE R | URB AN IN S TI T UT E & BR OO KING S IN S TI TU T IO N 15
Percent of Tax Units
Average Tax Change ($)
Percent of Tax Units
Average Tax Change ($)
Alabama 67.8 -1,880 5.7 960
Alaska 60.1 -2,890 3.1 730
Arizona 66.9 -1,960 6.1 1,100
Arkansas 67.7 -1,730 4.8 1,160
California 62.3 -2,170 8.6 2,510
Colorado 70.1 -2,390 5.5 1,160
Connecticut 65.1 -3,130 8.4 2,420
Delaware 70.8 -1,990 5.1 1,110
District of Columbia 68.1 -2,570 9.4 2,300
Florida 61.2 -2,180 5.3 1,100
Georgia 61.0 -1,850 6.7 1,050
Hawaii 65.5 -1,870 5.7 1,400
Idaho 64.8 -1,830 6.6 1,510
Illinois 64.9 -2,370 6.4 1,300
Indiana 63.9 -1,940 3.7 1,100
Iowa 71.9 -2,060 5.1 1,020
Kansas 65.8 -2,270 4.3 1,180
Kentucky 66.6 -1,750 4.5 1,230
Louisiana 70.3 -2,030 5.3 1,110
Maine 69.5 -1,770 5.4 1,280
Maryland 67.9 -2,360 9.4 1,490
Massachusetts 67.4 -2,800 7.3 1,740
Michigan 61.5 -1,950 4.5 1,040
Minnesota 69.3 -2,200 6.3 1,620
Mississippi 68.3 -1,590 5.7 1,020
Missouri 66.1 -1,920 5.1 1,210
Montana 65.4 -1,870 5.5 1,090
Nebraska 70.8 -2,100 5.3 1,130
Nevada 64.6 -2,090 5.7 1,100
Tax Units with Tax Increase or Cutc
With Tax Cut With Tax IncreaseStateb
TABLE A2
Tax Units with a Tax Change from the Major Individual Income Tax Provisions in H.R.1, The Tax Cuts and Jobs Act (TCJA)by State, 2018a

T AX P OL IC Y CE N TE R | URB AN IN S TI T UT E & BR OO KING S IN S TI TU T IO N 16
New Hampshire 71.0 -2,500 5.8 1,170
New Jersey 61.5 -2,740 10.2 2,120
New Mexico 63.1 -1,780 4.3 980
New York 60.9 -2,400 8.3 3,340
North Carolina 66.3 -1,840 6.3 1,210
North Dakota 75.4 -2,880 4.0 1,100
Ohio 68.7 -1,890 4.4 1,130
Oklahoma 68.1 -2,080 4.7 1,130
Oregon 62.7 -1,840 7.6 1,570
Pennsylvania 63.2 -2,180 5.1 1,190
Rhode Island 64.2 -2,000 7.0 1,400
South Carolina 66.8 -1,690 5.7 1,140
South Dakota 69.9 -2,420 3.6 870
Tennessee 66.4 -2,030 4.8 1,090
Texas 68.1 -2,520 5.5 1,250
Utah 68.0 -1,910 6.2 980
Vermont 67.0 -1,860 5.3 1,360
Virginia 69.8 -2,350 7.7 1,380
Washington 68.2 -2,570 5.8 910
West Virginia 64.8 -1,810 2.8 1,860
Wisconsin 66.1 -2,030 5.4 1,380
Wyoming 66.1 -2,620 3.8 1,120
United States 64.8 -2,180 6.3 1,630
(c) Includes tax units with a change in federal tax burden of $10 or more in absolute value.
Source: Urban-Brookings Tax Policy Center Microsimulation Model (version 0217-1). (a) Calendar year. Baseline is pre-TCJA law. Includes provisions with non-negligible revenue effects listed in JCX-67-17, Section I. Individual Tax Reform with the exception of Subsection B2: Disallow active passthrough losses in excess of $500,000 for joint filers, $250,000 for all others, Subsection F: Double Estate, Gift, and GST Tax Exemption Amount, Subsection H: Reduce ACA Individual Shared Responsibility Payment Amount to Zero, exclusion for employer-provided qualified moving expense reimbursements, repeal of deduction for moving expenses (other than members of the Armed Forces), retirement plan and casualty loss relief for certain disaster areas, repeal of deduction for alimony payments and corresponding inclusion in income, simplified accounting for small business, modify treatment of S corporation conversions into C corporations, limitation and repeal of deduction by employers of expenses for certain fringe benefits, modification of limitation on excessive employee remuneration, and tax gain on the sale of a partnership interest on look-thru basis. Also includes certain non-corporate business provisions.(b) Includes both filing and non-filing units, but excludes dependents of other tax units.

T AX P OL IC Y CE N TE R | URB AN IN S TI T UT E & BR OO KING S IN S TI TU T IO N 17
($) (%)Change
(% Points)
Under the Proposal
(%)Alabama 1.4 0.9 2.0 1.1 -1,310 -9.6 -1.7 15.8
Alaska 0.2 0.2 2.5 0.3 -1,760 -10.0 -2.0 17.9
Arizona 1.9 1.5 2.0 1.6 -1,390 -9.1 -1.7 16.7
Arkansas 0.8 0.5 2.0 0.6 -1,250 -9.4 -1.6 15.6
California 11.8 14.0 2.4 13.3 -1,910 -9.2 -1.9 18.9
Colorado 1.6 1.8 2.3 1.8 -1,880 -9.1 -1.8 18.4
Connecticut 1.1 2.4 2.9 2.0 -3,000 -9.5 -2.2 21.2
Delaware 0.3 0.3 2.1 0.3 -1,590 -9.0 -1.7 17.4
District of Columbia 0.2 0.4 2.8 0.3 -2,520 -8.9 -2.1 21.5
Florida 6.9 6.2 2.2 5.8 -1,420 -8.9 -1.7 17.8
Georgia 3.3 2.2 2.1 2.5 -1,270 -9.2 -1.7 16.5
Hawaii 0.5 0.3 2.0 0.4 -1,360 -8.9 -1.6 16.6
Idaho 0.4 0.3 1.9 0.3 -1,280 -9.5 -1.6 15.4
Illinois 4.2 4.6 2.4 4.5 -1,820 -9.3 -1.9 18.6
Indiana 2.1 1.4 2.1 1.7 -1,330 -9.8 -1.7 15.8
Iowa 0.9 0.7 2.2 0.9 -1,640 -10.0 -1.8 16.4
Kansas 0.9 0.8 2.3 0.9 -1,610 -9.8 -1.8 16.8
Kentucky 1.3 0.8 2.0 1.0 -1,290 -9.7 -1.7 15.8
Louisiana 1.3 0.9 2.3 1.2 -1,490 -10.2 -1.9 16.4
Maine 0.4 0.3 2.0 0.3 -1,380 -9.2 -1.7 16.4
Maryland 1.9 2.4 2.4 2.3 -2,040 -9.0 -1.9 18.9
Massachusetts 2.1 3.5 2.7 3.2 -2,510 -9.4 -2.1 20.2
Michigan 3.3 2.5 2.1 2.6 -1,330 -9.3 -1.7 16.5
Minnesota 1.7 1.8 2.3 1.9 -1,870 -9.4 -1.9 18.1
Mississippi 0.9 0.4 1.9 0.6 -1,110 -10.1 -1.6 14.4
Missouri 1.9 1.4 2.1 1.6 -1,410 -9.3 -1.7 16.5
Montana 0.3 0.2 2.1 0.3 -1,360 -9.7 -1.7 15.7
Nebraska 0.6 0.5 2.3 0.6 -1,670 -10.0 -1.9 16.7
Nevada 0.9 0.8 2.1 0.8 -1,390 -8.6 -1.7 17.7
New Hampshire 0.4 0.5 2.3 0.5 -1,920 -8.9 -1.8 18.7
New Jersey 2.8 4.3 2.6 4.0 -2,380 -9.6 -2.1 19.6
New Mexico 0.7 0.4 2.0 0.5 -1,170 -9.6 -1.6 15.3
New York 6.4 9.7 2.6 8.2 -2,150 -9.0 -2.0 20.3
North Carolina 2.9 2.1 2.0 2.4 -1,360 -9.2 -1.7 16.5
North Dakota 0.2 0.2 2.8 0.3 -2,280 -11.3 -2.2 17.5
Ohio 3.7 2.8 2.2 3.2 -1,460 -9.6 -1.8 16.8
Oklahoma 1.1 0.9 2.2 1.0 -1,530 -10.0 -1.8 16.4
Oregon 1.2 0.9 2.0 1.0 -1,400 -9.0 -1.6 16.6
Pennsylvania 4.2 4.0 2.2 4.0 -1,600 -9.3 -1.8 17.6
Rhode Island 0.3 0.3 2.1 0.3 -1,530 -8.8 -1.7 17.4
South Carolina 1.4 0.9 2.0 1.0 -1,230 -9.3 -1.6 15.7
South Dakota 0.3 0.2 2.4 0.3 -1,730 -10.8 -2.0 16.4
Tennessee 2.0 1.4 2.1 1.6 -1,360 -9.4 -1.7 16.7
Texas 7.7 8.0 2.4 8.2 -1,790 -9.5 -1.9 18.3
Utah 0.8 0.6 2.1 0.7 -1,460 -9.5 -1.7 16.1
Vermont 0.2 0.2 2.0 0.2 -1,440 -8.9 -1.7 16.8
Virginia 2.5 3.0 2.3 2.9 -1,930 -8.8 -1.8 18.5
Washington 2.2 2.6 2.3 2.4 -1,830 -8.8 -1.8 18.8
West Virginia 0.6 0.3 2.0 0.4 -1,240 -9.9 -1.7 15.1
Wisconsin 1.8 1.5 2.2 1.7 -1,530 -9.4 -1.8 16.9
Wyoming 0.2 0.2 2.3 0.2 -1,790 -9.0 -1.8 18.4
United States 100.0 100.0 2.3 100.0 -1,680 -9.2 -1.8 18.0
http://www.taxpolicycenter.org/TaxModel/income.cfm(d) Average federal tax (includes individual and corporate income tax, payroll taxes for Social Security and Medicare, the estate tax, and excise taxes) as a percentage of average expanded cash income.
Average Federal Tax Change Average Federal Tax Rated
Source: Urban-Brookings Tax Policy Center Microsimulation Model (version 0217-1). (a) Calendar year. Baseline is pre-TCJA law. Includes provisions with non-negligible revenue effects listed in JCX-67-17, Section I. Individual Tax Reform, with the exception of Subsection B2: Disallow active passthrough losses in excess of $500,000 for joint filers, $250,000 for all others, Subsection F: Double Estate, Gift, and GST Tax Exemption Amount, and Subsection H: Reduce ACA Individual Shared Responsibility Payment Amount to Zero. Also includes certain other non-corporate business provisions. (b) Includes both filing and non-filing units, but excludes dependents of other tax units.(c) After-tax income is expanded cash income less individual income tax net of refundable credits, corporate income tax, payroll taxes (Social Security and Medicare), estate tax, and excise taxes. For a description of
StatebShare of Tax Units
(%)
Share of Baseline
Individual Income Tax
(%)
Percent Change in After-Tax
Incomec
Share of Total
Federal Tax Change
(%)
TABLE A3
Distribution of Individual Income Tax Provisions in H.R.1, The Tax Cuts and Jobs Act (TCJA)No SALT Limitby State, 2018a

T AX P OL IC Y CE N TE R | URB AN IN S TI T UT E & BR OO KING S IN S TI TU T IO N 18
Percent of Tax Units
Average Tax Change ($)
Percent of Tax Units
Average Tax Change ($)
Alabama 67.9 -1,990 5.6 930
Alaska 60.2 -2,930 3.0 710
Arizona 67.1 -2,150 5.9 980
Arkansas 67.9 -1,890 4.6 910
California 64.6 -3,020 6.4 980
Colorado 70.4 -2,710 5.2 900
Connecticut 67.8 -4,440 5.6 820
Delaware 71.3 -2,280 4.7 800
District of Columbia 70.5 -3,610 7.0 980
Florida 61.4 -2,360 5.1 890
Georgia 61.4 -2,150 6.4 910
Hawaii 66.0 -2,100 5.2 830
Idaho 65.2 -2,050 6.2 1,250
Illinois 66.2 -2,800 4.9 870
Indiana 64.0 -2,110 3.5 950
Iowa 72.4 -2,290 4.6 790
Kansas 66.1 -2,470 4.0 870
Kentucky 67.0 -1,960 3.9 810
Louisiana 70.4 -2,170 5.2 1,040
Maine 70.4 -1,990 4.4 770
Maryland 70.0 -2,970 7.3 840
Massachusetts 69.3 -3,650 5.3 880
Michigan 62.0 -2,200 4.1 860
Minnesota 70.3 -2,700 5.2 830
Mississippi 68.4 -1,690 5.6 970
Missouri 66.4 -2,180 4.8 990
Montana 65.8 -2,100 5.1 800
Nebraska 71.4 -2,370 4.7 850
Stateb
Tax Units with Tax Increase or Cutc
With Tax Cut With Tax Increase
TABLE A4
Tax Units with a Tax Change from the Major Individual Income Tax Provisions in H.R.1, The Tax Cuts and Jobs Act (TCJA)No SALT Limitby State, 2018a

T AX P OL IC Y CE N TE R | URB AN IN S TI T UT E & BR OO KING S IN S TI TU T IO N 19
Nevada 64.7 -2,210 5.6 990
New Hampshire 72.2 -2,690 4.5 760
New Jersey 64.8 -3,750 6.7 930
New Mexico 63.2 -1,900 4.2 910
New York 63.5 -3,430 5.6 880
North Carolina 66.8 -2,110 5.7 930
North Dakota 75.5 -3,020 3.9 1,030
Ohio 69.3 -2,130 3.8 780
Oklahoma 68.3 -2,280 4.5 1,000
Oregon 64.4 -2,220 5.7 730
Pennsylvania 64.2 -2,530 4.1 860
Rhode Island 65.8 -2,390 5.4 960
South Carolina 67.1 -1,900 5.4 960
South Dakota 70.0 -2,480 3.5 830
Tennessee 66.5 -2,100 4.7 1,050
Texas 68.6 -2,660 5.0 1,080
Utah 68.4 -2,180 5.8 780
Vermont 68.1 -2,150 4.2 720
Virginia 70.7 -2,820 6.8 1,160
Washington 68.7 -2,690 5.2 780
West Virginia 65.0 -1,920 2.7 920
Wisconsin 67.0 -2,320 4.4 770
Wyoming 66.1 -2,720 3.7 930
United States 65.8 -2,610 5.3 930Source: Urban-Brookings Tax Policy Center Microsimulation Model (version 0217-1). (a) Calendar year. Baseline is pre-TCJA law. Includes provisions with non-negligible revenue effects listed in JCX-67-17, Section I. Individual Tax Reform with the exception of Subsection B2: Disallow active passthrough losses in excess of $500,000 for joint filers, $250,000 for all others, Subsection F: Double Estate, Gift, and GST Tax Exemption Amount, Subsection H: Reduce ACA Individual Shared Responsibility Payment Amount to Zero, exclusion for employer-provided qualified moving expense reimbursements, repeal of deduction for moving expenses (other than members of the Armed Forces), retirement plan and casualty loss relief for certain disaster areas, repeal of deduction for alimony payments and corresponding inclusion in income, simplified accounting for small business, modify treatment of S corporation conversions into C corporations, limitation and repeal of deduction by employers of expenses for certain fringe benefits, modification of limitation on excessive employee remuneration, and tax gain on the sale of a partnership interest on look-thru basis. Also includes certain non-corporate business provisions. (b) Includes both filing and non-filing units, but excludes dependents of other tax units. (c) Includes tax units with a change in federal tax burden of $10 or more in absolute value.

NOTES
T AX P OL IC Y CE N TE R | U RB A N I N ST I T U TE & B RO O KI NG S I N S TI T U TI O N 20
1 More formally, Public Law 115-97, An Act to Provide for Reconciliation Pursuant to Titles II and V of the Concurrent Resolution on the Budget for Fiscal Year 2018.
2 Ben Page, “Most Taxpayers’ Benefits Come Mainly from the TCJA’s Individual Provisions, But the Rich Get Much of Their Tax Cuts from Corporate Changes,” TaxVox (blog) Tax Policy Center, February 19, 2018.
3 Specifically, we include provisions with non-negligible revenue effects listed in JCX-67-17, Section I (Individual Tax Reform), except Subsection F (Double Estate, Gift, and GST Tax Exemption Amount), and Subsection H (Reduce ACA Individual Shared Responsibility Payment Amount to Zero). We also include certain provisions from Section II (Business Tax Reform), as they apply to non-corporate businesses.
4TPC Staff, “Distributional Analysis of the Conference Agreement for the Tax Cuts and Jobs Act,” Tax Policy Center, December 18, 2017.
5 For an explanation of how TPC allocates corporate income and estate and gift taxes see: Brief Description of the Tax Model | Tax Policy Center
6 The remaining taxpayers would see no material change in their individual income tax.
7 Including the major corporate income and estate tax provisions would increase the estimated percentage of taxpayers with a tax cut to 80 percent. The largest increases would come in the bottom two income quintiles in which many taxpayers will see no change from the individual income tax provisions but receive a small tax cut from their allocated share of the reduction in corporate taxes.
8 Over time, the changed price index the TCJA uses for inflation adjustments of individual income tax parameters will reduce the value of the EITC compared to prior law.
9 The primary data source for the TPC tax model is the annual public-use file (PUF) produced by the Statistics of Income (SOI) Division of the Internal Revenue Service (IRS). Because the PUF records are not state representative, TPC uses a reweighting approach to divide each observation’s national weight into a separate weight for each of the 50 states and the District of Columbia. For more information see: Surachai Khitatrakun, Gordon B. Mermin, Norton Francis,” Incorporating State Analysis into the Tax Policy Center's Microsimulation Model: Documentation and Methodology” Tax Policy Center, March 30, 2016.
10 Estimates for all the states are in the Appendix.
11 T17-0114 - Tax Benefit of the Deduction and Refund for State and Local Taxes, Baseline: Current Law, Distribution of Federal Tax Change by Expanded Cash Income Level, 2017 | Tax Policy Center
12 T18-0001 - Impact on the Number of Itemizers of H.R.1, The Tax Cuts and Jobs Act (TCJA), By Expanded Cash Income Level, 2018 | Tax Policy Center
13 Taxpayers are ranked according to the income distribution for the entire population, not just the population in their state.
14 Leonard E. Burman and Frank Sammartino, “State Responses to the TCJA’s SALT Deduction Limit May Be Costly and Favor High-Income Residents," TaxVox (blog) Tax Policy Center, January 30, 2018.
15 Tracy Gordon, “The Price We Pay for Capping the SALT Deduction,” TaxVox (blog) Tax Policy Center, February 15, 2018.
16 Jeff Stein, “Cuomo says New York will sue over GOP tax law,” Wonkblog, The Washington Post, January 3, 2018.
17 ALEC,”Reduce Tax Rates for All Taxpayers by Eliminating Unproductive SALT Deduction," An Open Letter to Congress: American Legislative Exchange Council, October 17, 2017.
18“Federal Income Tax Treatment of Charitable Contributions Entitling Donor to a State Tax Credit by Joseph Bankman, David Gamage, Jacob Goldin, Daniel Jacob Hemel, Darien Shanske, Kirk J. Stark, Dennis J. Ventry, Manoj Viswanathan. UCLA School of Law, Law-Econ Research Paper No. 18-02, January 8, 2018 (revised March 13, 2018).

T AX P OL IC Y CE N TE R | URB AN IN S TI T UT E & BR OO KING S IN S TI TU T IO N 21
19 Richard Rubin, “Treasury Skeptical About States Allowing Charitable Giving to Work Around New Cap,” The Wall Street Journal, January 25, 2018.
20 Jim Tankersley, “Washington's Fight Over Taxes is Only Just Beginning," The New York Times, February 23, 2018.

ABOUT THE AUTHORS
T AX P OL IC Y CE N TE R | URB AN IN S TI T UT E & BR OO KING S IN S TI TU T IO N 22
Frank Sammartino is a senior fellow at the Urban-Brookings Tax Policy Center and an affiliate of Urban’s State
and Local Finance Initiative. His current work focuses on the interaction among federal, state, and local tax
policies and on the influence of tax and transfer policies on income inequality.
Philip Stallworth is a research assistant in the Urban-Brookings Tax Policy Center. He primarily works on the
federal tax model. He holds a bachelor’s degree in mathematics with a concentration in statistics from Reed
College.
David Weiner worked on tax policy issues for 30 years at the U.S. Congressional Budget Office (CBO) and at the
U.S. Department of Treasury. He retired from his position as head of CBO's Tax Analysis Division in 2016 and is
now an independent consultant. He has a Master of Public Policy degree from the University of Michigan.
We are grateful to all our funders, who make it possible for Urban’s State and Local Finance Initiative and the Urban-Brookings Tax Policy Center to advance its mission. Information about our funders is available at https://www.urban.org/policy-centers/cross-center-initiatives/state-and-local-finance-initiative/about.
The views expressed are those of the authors and should not be attributed the Urban-Brookings Tax Policy Center, the Urban Institute, the Brookings Institution, their trustees, or their funders. Funders do not determine research findings or the insights and recommendations of our experts. Further information on Urban’s funding principles is available at http://www.urban.org/aboutus/our-funding/funding-principles; further information on Brookings’ donor guidelines is available at http://www.brookings.edu/support-brookings/donor-guidelines.
Copyright © 2018. Tax Policy Center. Permission is granted for reproduction of this file, with attribution to the Urban-Brookings Tax Policy Center.

The Tax Policy Center is a joint venture of the Urban Institute and Brookings Institution.
For more information, visit taxpolicycenter.org or email [email protected]
Related Documents