THE EFFECT OF THE EXTERNAL LABOR MARKET ON THE GENDER PAY GAP AMONG EXECUTIVES CRISTINA QUINTANA-GARCI ´ A AND MARTA M. ELVIRA* To date, few empirical studies have explored potential differences in the effects of external labor market hiring on the compensation of male and female managers. Using longitudinal data from a sam- ple of public high-technology firms on individual top executives’ total compensation in the United States, and the separate compo- nents of base and variable pay, the authors study the effects of being an external hire for men and women. The results suggest that women who are external labor market hires are disadvantaged, in both base and variable compensation, compared with internal placements. The analyses also provide some evidence that having greater representation of women in top positions reduces the disad- vantaging effects for women of being an external hire. W omen’s representation in top management is the subject of ample research (e.g., Reskin and McBrier 2000; Kalev, Dobbin, and Kelly 2006). Far less is known about gender differences in work outcomes once women reach top executive positions (Gayle, Golan, and Miller 2012; Shin 2012). As has been stressed recently, ‘‘access to high-paying jobs and the rewards that await workers once they are hired are important factors in studying the gender pay gap’’ (Kahn 2014: 285). Specifically, a significant pay gap exists between male and female executives that is attributable to unobserved factors, with estimates varying between 5% and 16% (Bertrand and Hallock 2001; Blau and Kahn 2006; Mun ˜oz-Bullo ´n 2010; Elkinawy and Stater 2011, but see Gayle et al. 2012 for contrary evidence). The still unex- plained portion of pay differentials is usually interpreted as evidence of gender inequality (Elvira and Saporta 2001; Elkinawy and Stater 2011), *CRISTINA QUINTANA-GARCI ´ A is an Associate Professor of Management and Director of the Santander Center for Corporate Social Responsibility at the University of Ma ´laga (Spain). MARTA M. ELVIRA is the Puig Chair Professor of Global Leadership Development and Associate Dean for Research at IESE Business School. The study has been partially supported by the aforementioned center. We gratefully acknowledge the feedback received from Emilio Castilla, Lisa Cohen, Olav Sorenson, Miguel Canela, participants in the EGOS colloquium in Rotterdam (2014), the ILR School of Cornell University confer- ence ‘‘Increasing Inclusion/Reducing Discrimination: What Works?’’ in New York City (2015), IESE’s Entrepreneurship Research Workshop, and anonymous reviewers of earlier versions of this manuscript. Correspondence can be sent to the authors at [email protected] or [email protected]. KEYWORDs: gender pay gap, executive compensation, external recruitment, inequality ILR Review, 70(1), January 2017, pp. 132–159 DOI: 10.1177/0019793916668529. Ó The Author(s) 2016 Journal website: ilr.sagepub.com Reprints and permissions: sagepub.com/journalsPermissions.nav

Welcome message from author
This document is posted to help you gain knowledge. Please leave a comment to let me know what you think about it! Share it to your friends and learn new things together.
Transcript

THE EFFECT OF THE EXTERNAL LABOR MARKET
ON THE GENDER PAY GAP AMONG EXECUTIVES
CRISTINA QUINTANA-GARCIA AND MARTA M. ELVIRA*
To date, few empirical studies have explored potential differencesin the effects of external labor market hiring on the compensationof male and female managers. Using longitudinal data from a sam-ple of public high-technology firms on individual top executives’total compensation in the United States, and the separate compo-nents of base and variable pay, the authors study the effects of beingan external hire for men and women. The results suggest thatwomen who are external labor market hires are disadvantaged, inboth base and variable compensation, compared with internalplacements. The analyses also provide some evidence that havinggreater representation of women in top positions reduces the disad-vantaging effects for women of being an external hire.
Women’s representation in top management is the subject of ampleresearch (e.g., Reskin and McBrier 2000; Kalev, Dobbin, and Kelly
2006). Far less is known about gender differences in work outcomes oncewomen reach top executive positions (Gayle, Golan, and Miller 2012; Shin2012). As has been stressed recently, ‘‘access to high-paying jobs and therewards that await workers once they are hired are important factors instudying the gender pay gap’’ (Kahn 2014: 285). Specifically, a significantpay gap exists between male and female executives that is attributable tounobserved factors, with estimates varying between 5% and 16% (Bertrandand Hallock 2001; Blau and Kahn 2006; Munoz-Bullon 2010; Elkinawy andStater 2011, but see Gayle et al. 2012 for contrary evidence). The still unex-plained portion of pay differentials is usually interpreted as evidence ofgender inequality (Elvira and Saporta 2001; Elkinawy and Stater 2011),
*CRISTINA QUINTANA-GARCIA is an Associate Professor of Management and Director of the SantanderCenter for Corporate Social Responsibility at the University of Malaga (Spain). MARTA M. ELVIRA is thePuig Chair Professor of Global Leadership Development and Associate Dean for Research at IESEBusiness School. The study has been partially supported by the aforementioned center. We gratefullyacknowledge the feedback received from Emilio Castilla, Lisa Cohen, Olav Sorenson, Miguel Canela,participants in the EGOS colloquium in Rotterdam (2014), the ILR School of Cornell University confer-ence ‘‘Increasing Inclusion/Reducing Discrimination: What Works?’’ in New York City (2015), IESE’sEntrepreneurship Research Workshop, and anonymous reviewers of earlier versions of this manuscript.Correspondence can be sent to the authors at [email protected] or [email protected].
KEYWORDs: gender pay gap, executive compensation, external recruitment, inequality
ILR Review, 70(1), January 2017, pp. 132–159DOI: 10.1177/0019793916668529. � The Author(s) 2016
Journal website: ilr.sagepub.comReprints and permissions: sagepub.com/journalsPermissions.nav

although we need to understand fully how various employment practicesaffect compensation. For example, in recent decades external market forcesare increasingly influencing the organizational distribution of work andrewards (Bidwell, Briscoe, Fernandez-Mateo, and Sterling 2013). Becausemuch research on gender inequality has focused on internal promotions,little is known about the impact of external hiring on pay differentials(Fernandez and Abraham 2011).
In this study, we explore the effects of adopting an external labor market(ELM) strategy on gender differences in executive compensation. The the-ory of incomplete information, social capital, and the opportunity structurefor discrimination framework serve as the study’s foundation. On the onehand, promotion within the firm differs from external hiring in the level ofinformation that a firm has about employees (Granovetter 1981; Halaby1988). Differences in access to such information might affect the character-istics of workers who enter jobs through hiring versus internal promotionand, consequently, their pay levels (Bidwell 2011). On the other hand, forexecutives, base salary is complemented by variable pay, usually subject toless formalization and more subjective valuation, which opens a structuralopportunity for differential treatment in compensation between male andfemale executives.
At the management level, to our knowledge, few studies explore theeffect of ELM moves on male and female managers’ compensation. Someresearch suggests that the process of changing companies explains much ofthe observed gender gap. Brett and Stroh (1997) studied a sample of man-agers at different levels from 20 Fortune 500 companies. Examining onlycash compensation while controlling for human capital and industry, thisstudy showed that male managers who changed companies between 1989and 1991 improved their compensation relative to those who remained intheir firms. This effect was not observed for female managers. Researchinga sample of 1992 MBA graduates and considering practically the same vari-ables as above, Dreher and Cox (2000) also concluded that pay differentialsamong graduates who changed employers were a white male phenomenon.Similarly, using data from U.S. managers and professionals collectedthrough surveys in 1991 and 1999, Lam and Dreher (2004) found that cashcompensation levels (base salary plus bonus) were significantly higheramong males who followed an ELM strategy than among men whoremained with the same firm (stayers). Again this pattern does not appearamong female managers, for whom cash compensation was similar betweenstayers and movers.
Some contradictory evidence exists: Valcour and Tolbert (2003), using asample of primarily managerial and professional employees in dual-earnercouples in the United States, found no gender earnings differences forintra- and interorganizational mobility. For both men and women, movingbetween organizations tends to depress earnings while job changes withinan organization relate to increased earnings. More recently, Kronberg
EXTERNAL LABOR MARKET’S EFFECT ON EXECUTIVE GENDER PAY GAP 133
(2013) found that in the 1990s externalization closed the gender gap mostlyamong workers who already occupied good positions (such as executivejobs) and left a firm voluntarily.
Overall, most prior studies have considered cash compensation as theoutcome variable, have lacked information about employers (i.e., firm char-acteristics and organizational practices), and have mixed managers belong-ing to different organizational levels (though pay components typicallydiffer across levels). Regarding the first issue, a large (if not the largest) por-tion of executives’ total compensation comes from long-term components(i.e., restricted stock awards, stock options, and other long-term incentivepayouts) (Elkinawy and Stater 2011; Gayle et al. 2012; Shin 2012). The useof stock options, incentive bonuses, and other components of variable com-pensation may widen the pay gap between women and men (Elvira andGraham 2002; Munoz-Bullon 2010). Base pay is determined largely by thelevel of an individual’s occupational category whereas variable pay is setthrough a less formalized process.
Given prior research limitations, our study aims to advance understand-ing of how ELM moves relate to the gender gap in executive compensationby 1) focusing on top executives, who may constitute a relatively homoge-neous group in terms of pay elements, work experience, skills and abilities,and education (Bell 2005); 2) taking into account the total direct compen-sation awarded to executives, while analyzing the gender pay gap separatelyfor base salary and variable pay; and 3) including organizational variablessuch as the proportion of women in top executive positions, in addition toconsidering individual human capital and firm-level factors. For the empiri-cal setting, we have chosen firms from the high-technology sectors, whichshow an increasing influence of external market forces on labor practices(DiPrete, Goux, and Maurin 2002; Siegel and Hambrick 2005) and thatoperate in similar labor market conditions, allowing for relative datahomogeneity.
Women Executives’ Compensation and External Managerial Recruitment
Research shows a persistent gender wage gap, which has been explainedfrom various perspectives. Human capital theory (Becker 1964; Hashimoto1981) predicts that earnings differences emerge from variation in the broadarray of individual abilities and educational investments among workers. Acommon empirical finding is that women have inadequate firm-specifichuman capital, different educational backgrounds, shorter tenures, andmore interrupted careers than do men. These variables partially explain thegender wage gap (Blau and Beller 1988). Nevertheless, the evidence for thishuman capital hypothesis is mixed. For instance, Petersen and Saporta(2004) indicated that initial gender differences in job levels and salariesdecrease to the extent of disappearing as seniority increases. This equaliza-tion may happen because, with seniority, it becomes harder to discriminate
134 ILR REVIEW

and also because more information is available about employees. Such adeclining gap should mean that once women break the glass ceiling andbecome top executives, their compensation would equal that of their malecounterparts.
Few articles on the executive pay gap have measures of education or workexperience. Gayle et al. (2012) showed that female executives have back-grounds and experiences that differ from male executives and that womenare paid more and have higher pay-for-performance sensitivity than do menwith a similar rank, background, and experience. They also found thatwomen are promoted internally more quickly than men are (as long as theyremain in the firm), which results in their having significantly less job expe-rience than male executives have.
We wonder whether the gender gap might widen with the increasing reli-ance on external hiring. Firms using internal labor markets (ILMs) torecruit and promote managers should have access to accumulated perfor-mance information to help place competent internal employees (female ormale) with suitable human capital in executive positions (Bidwell 2011).Then individuals would be promoted and rewarded according to their abil-ity and skills, if and when they were assigned to a more senior position (Fee,Hadlock, and Pierce 2006).
Consistent with the theory of incomplete information, the trend towardmarket-based employment has reduced the influence of firm-specifichuman capital on pay and thus, the rewards to seniority. As a result, exter-nally hired managers may obtain a salary premium relative to those who arepromoted internally. Employers have incomplete information about outsidepotential employees. Because many higher-level jobs are subject to greatuncertainty and demand a threshold level of performance, firms mayrequire stronger visible credentials from outside hires than from those peo-ple promoted from within (Fee et al. 2006; Bidwell 2011). The purchase ofskills valuable to the firm requires the provision of extra rewards in order toattract employees and to obtain their agreement to this sort of transactionalemployment relationship (Valcour and Tolbert 2003). Another potentialreason for higher pay is that experienced managers receiving an ELM offermay anticipate short-term employment. Companies that tend to hire man-agers from outside the organization do not emphasize career developmentor security. Consequently, expectations of short-term employment may leadto greater compensation in exchange for the lack of employment security(Brett and Stroh 1997).
Research indicates that ELM career moves generally lead to compensa-tion advantages for men but not for women (Brett and Stroh 1997; Dreherand Cox 2000; Lam and Dreher 2004). For women at the executive level,several factors may result in a cumulative career disadvantage attributable toELM career strategies. Because less is known at the point of hire comparedwith the time of promotion, the decision on which working conditions (e.g.,pay) to offer is usually highly subjective. As a result, differential treatment in
EXTERNAL LABOR MARKET’S EFFECT ON EXECUTIVE GENDER PAY GAP 135
setting salaries is more likely to affect new hires than long-tenure employ-ees, whose actual performance has been observed (Gerhart 1990). The sta-tus of a new hire leaves women more vulnerable to differential treatmentbecause such an approach is easier to justify when less information is avail-able (Petersen and Saporta 2004; Kronberg 2013).
Some employers may even stereotype women as less sophisticated negoti-ators and offer them lower salaries and/or take a harder bargainingapproach (Dreher and Cox 2000). If women are less inclined to negotiatetheir wage upward (Babcock and Laschever 2003), then their pay maydecline more when negotiations are more frequent, such as in externaltransitions. Additionally, female managers may be disadvantaged in theELM because they are less well connected than male managers to formaland informal social networks that provide access to career opportunitiesand information. The use of such networks, especially for external hiring,has grown over time (Marsden and Hurlbert 1988; Moss and Tilly 2001).Network-based hiring generates gender inequality in access to jobs andfavors the persistence of differential allocation to higher levels (Fernandezand Sosa 2005; Gorman and Kmec 2009).
Overall, incomplete information and social capital research suggestpotential mechanisms that disadvantage women in external mobility. Thus,a growing emphasis on ELMs among executives may lead to higher com-pensation levels for men and generate more opportunities for gender paygap increases. Our baseline hypothesis is as follows.
Hypothesis 1: The compensation penalty for female executives relative to menrecruited through the external labor market will be larger than that of internallypromoted employees.
Beyond gender-specific characteristics, organizational structures offervarying opportunities for unjustified differential treatment of men andwomen. The opportunity structure for discrimination refers to the structuralconditions under which discrimination is feasible and successful, focusingon dimensions that may inhibit or facilitate differential treatment (seePetersen and Saporta 2004). We surmise that the increasing use of incentiveand performance-based compensation may unwittingly open the door togender biases. Base pay, the fixed component of compensation, is deter-mined largely by the individual’s job rank rather than job performance.Differential treatment of men and women in base salary for the same posi-tion is presumably easy to document, the evidence is mostly unambiguous,and the potential complainant is clear (the woman discriminated against).The opposite holds when compensation depends not only on the positionoccupied but also on the employee’s productivity, qualifications, or merit.Bonuses, stock options, and other long-term components of compensationare more often performance-based and thus subject to greater uncertainty
136 ILR REVIEW

and lower transparency. These variable pay elements could justify pay differ-ences within jobs that can be hard to assess (Petersen and Saporta 2004).
The limited formalization of setting variable pay gives firms greater dis-cretion in designing pay plans and criteria for pay allocation (Elvira andGraham 2002). For instance, women are considered to be more risk-averseand less confident than men, so they are expected to behave in ways thatare different from men during pay negotiations. These expectations mayreinforce the gender gap by encouraging women to choose less risky paypackages (Kulich et al. 2011). Therefore, relative to base salary, variable paymay represent a structural opportunity for differential treatment (Petersenand Saporta 2004), which might be more likely to occur during hiring thanduring promotion because it is harder for external candidates to detect andchallenge discrimination (Bidwell et al. 2013).
Empirical evidence indicates that the gender earnings gap is greater forvariable pay than for base salary. Chauvin and Ash (1994) found that mostof the unexplained difference in total pay between male and female busi-ness school graduates was attributable to gender differences in theperformance-contingent portion of pay (commissions, bonuses, and profitsharing). Using data from all full-time employees of a financial corporation,Elvira and Graham (2002) reported that women in the same occupationsand with similar characteristics (tenure and performance rating) receivedlower bonuses than men. Studies of U.S. firms’ top executives found that asubstantial part of the estimated gap in total pay was because of differencesin variable pay (Elkinawy and Stater 2011; Munoz-Bullon 2010).
In short, existing research suggests that the use of incentive pay couldwiden the earnings gap between women and men, so we hypothesize thefollowing.
Hypothesis 2: The penalty for female executives relative to men will be larger forvariable than for fixed compensation, especially among employees recruitedthrough the ELM.
Another organizational characteristic typically related to the gender wagegap is the sex composition of organizations, occupations, or work groups.Regarding executives, the proportion of women in top management hasgrown substantially, even as women continue to be underrepresented. Datasuggest that women’s pay increases in jobs with a higher proportion ofwomen employed in that type of job. As women advance through the ranks,any differences in the treatment of men and women that arise from imper-fect information about women’s abilities will narrow (Bell 2005).Furthermore, social identity theory suggests that people have a tendency toevaluate in-group members more favorably than out-group members and todevelop mutual liking and attraction (Tajfel and Turner 1979). Consistentwith these processes, male decision makers are more likely than theirfemale counterparts to hire and promote male candidates (Beckman and
EXTERNAL LABOR MARKET’S EFFECT ON EXECUTIVE GENDER PAY GAP 137

Phillips 2005; Gorman 2006). Thus an increasing female presence in topcorporate jobs may help reduce the gender gap in executive pay (Shin2012). Wages would also be higher because the higher proportion ofwomen would give them more organizational power (Pfeffer 1981) andwould potentially facilitate actions in favor of other women on the top man-agement team (TMT), for example, in job allocation and compensationdecisions.
A higher representation of women in the TMT can have a positive impacton female executives’ pay. Evidence suggests that women across an organi-zation earn more when they have female managers (Hultin and Szulkin1999) or a female CEO (Cardoso and Winter-Ebmer 2010; Flabbi, Macis,Moro, and Schivardi 2014). Bertrand and Hallock (2001) found that as theparticipation of women in top managerial jobs grew, the gender compensa-tion gap declined. Expectations that women are risk-averse and less confi-dent than men when negotiating their pay may increase the gender gap byencouraging women to accept a lower variable compensation (Byrnes,Miller, and Schafer 1999; Kulich et al. 2011). Such expectations may causenegative reactions toward those women who do not comply with genderstereotypes. For example, women are penalized socially more than men arefor negotiating for higher pay (Bowles and Babcock 2012). A higher pro-portion of women in the TMT may help increase the bargaining power ofother females, encouraging them to negotiate for desirable job conditions(Beckman and Phillips 2005). When a higher proportion of female manag-ers are employed, women are more likely to be negotiating the terms oftheir employment with other women and to have a greater likelihood ofsuccess (Rousseau 2005; Cohen and Broschak 2013). The presence ofwomen in the TMT and in other top corporate jobs can also be a proxy forsome of the firm’s cultural and institutional climate, such as female-friendliness or an egalitarian environment (Shin 2012).
The board of directors, which often includes some members of the TMT,directly influences the design of compensation packages for top executives,as it is legally responsible for monitoring, rewarding and, if necessary, firingtop executives. A greater proportion of female directors on the board couldbe associated with a more favorable evaluation of female executives andgreater access to compensation information for executives generally, thuspotentially reducing the gender gap in pay. In fact, evidence does supportthat having more female board members is associated with a smaller gendergap in executive compensation (Shin 2012). Using various data samplesfrom ExecuComp over the long term, Bell (2005), Elkinawy and Stater(2011), and Carter, Franco, and Gine (2015) found that female representa-tion in the boardroom mitigates the gender pay gap among executives.
We expect these female representation effects to be magnified for exter-nal hires, for whom negotiations may take center stage in the recruiting pro-cess from the start and are typically more visible than for internallypromoted candidates whose career follows an accepted path.
138 ILR REVIEW
Therefore, we hypothesize the following.
Hypothesis 3: The pay penalty for female executives will be reduced in firms with ahigher proportion of women at the firm’s top levels, especially among employeesrecruited through the ELM.
Methods
Data and Sample
Our research question is especially salient in settings such as high technol-ogy and other growing sectors in which employment relationships relyincreasingly on ELMs, as manifested by the decline in average employmenttenure (DiPrete et al. 2002). Moreover, the high-technology sectors arecharacterized by a flatter wage-tenure profile among the more highly edu-cated workers than in more traditional industries (DiPrete et al. 2002).These features make it easier to analyze the dynamics of the ELM relative toindustries that still rely heavily on ILMs. Focusing on high-technology manu-facturing firms also enables relatively homogeneous data to be obtainedbecause such firms operate in similarly dynamic environments, with the cor-responding consequences for executive rewards compared with relativelystable settings (Siegel and Hambrick 2005).
Specifically, we study a panel data set of U.S. public high-technology man-ufacturing firms. We use the executive year as the level of analysis and cre-ate a database using different sources of information. The panel of U.S.public high-technology firms is drawn from Thomson Reuters Datastream’sASSET4 ESG, the world’s largest environmental, social, and governance rat-ing database. It contains objective and systematic quantitative and qualita-tive company-level data on public companies worldwide for at least fouryears for most companies, with 2007 to 2011 being the most commonperiod. Therefore, we identify a panel of firms with available informationon organizational practices that are explanatory variables in this study forthe stated period. Variables drawn from this database include the percent-age of women on the board of directors and a range of diversity manage-ment practices. ASSET4 ESG contains data on 167 U.S. public high-technology manufacturing companies.1
Having selected the companies, we draw information concerning com-pensation of their top executives from the ExecuComp database. For thehighest-paid executives of the U.S. public companies, ExecuComp containscomprehensive information on base salary and variable components ofcompensation (bonuses, total value of restricted stock grants, total value ofstock options granted, long-term incentive payouts, and so forth) as
1The high-technology manufacturing sectors identified from the ASSET4 ESG are aerospace/defense;biotechnology/medical research; biotechnology/pharmaceuticals; communications equipment; comput-ers/office equipment; healthcare equipment/suppliers; and semiconductors/semiconductor equipment.This selection derives directly from the OECD definition of high-technology sectors (OECD 2011).
EXTERNAL LABOR MARKET’S EFFECT ON EXECUTIVE GENDER PAY GAP 139
reported in the proxy statements required by the U.S. Securities andExchange Commission (SEC). The percentage of women among top execu-tives is also estimated using ExecuComp. Biographical information (includ-ing whether hiring was from the internal or the external labor market) oneach executive is obtained from the annual meeting proxy statements orForm 10-K, which are filed with the SEC. The SEC requires firms to followstrict format guidelines, producing a high level of consistency across reports.Regarding other firm-level variables, performance data (return on assets)and firm size (number of employees) come from Form 10-K’s financialinformation.
As a result of this selection process, data availability constraints (missingdata for one or more variables regarding organizational practices or person-nel information for executives), and the elimination of two outlier observa-tions (two CEOs whose total direct compensation is zero), our final sampleincludes 2,600 executive-year observations (814 unique individuals) from atotal of 105 high-technology firms for the period 2006 to 2011 (with a maxi-mum of five-year observations for each firm).
Measures
Dependent Variables
‘‘Total direct compensation’’ derives from the measure reported as TDC2by ExecuComp. TDC2 represents ex post total compensation consisting ofsalary, bonus, other annual compensation, total value of restricted stockgrants, long-term incentive payouts, all other compensation, and the valueof options exercised. This measure appears in thousands of 2011 constantdollars. We use a logarithmic transformation of TDC2 to account for itsskewed distribution. To estimate the two dependent variables useful for test-ing Hypotheses 2 and 3, we disaggregate total direct compensation into twoforms of pay: ‘‘base salary,’’ which is the part of TDC2 that does not dependon the individual’s job performance, and ‘‘variable pay,’’ which includes theremaining components of TDC2 (bonus, other annual compensation, totalvalue of restricted stock grants, and so forth). We also take these variables inthousands of 2011 constant dollars and use their logarithmic transformation.
Independent Variables
The first independent variable used in the regression analysis is ‘‘femaleexecutive,’’ measured by a dummy variable that assumes value 1 if the exec-utive is female, and 0 otherwise. Then, we include in the models anotherindependent variable called ‘‘executive hired through the ELM,’’ coded asa dummy variable with value 1 when the executive (male or female) washired externally. These executives remain coded as an external hire in sub-sequent years, which allows us to compare the compensation with the exec-utives who reached the TMT position through internal promotion. ‘‘Female
140 ILR REVIEW
executive hired through the ELM’’ is the main variable, an interactionbetween the two previously described values.
Finally, to test Hypothesis 3, three independent variables concerningwomen’s representation are included: ‘‘percentage of women in the topmanagement team,’’ ‘‘percentage of women on the board,’’ and ‘‘femaleCEO,’’ which is a dummy variable taking value 1 when the CEO is a woman,and 0 otherwise.
Control Variables
We control for several individual and firm-level variables that may influenceexecutive compensation. Concerning human capital, we consider four attri-butes: ‘‘occupation title,’’ ‘‘age,’’ ‘‘firm tenure,’’ and ‘‘job tenure.’’ We con-struct occupational categories based on the annual title variable inExecuComp. More than 13,100 unique occupation titles are in this data-base, and many of these titles represent similar occupations. Based on previ-ous studies (Bertrand and Hallock 2001; Munoz-Bullon 2010), we construct11 broad occupational titles: chief executive officer (CEO)/chair, vice chair,president, chief financial officer (CFO), chief operating officer (COO),other chief officers, executive vice president, senior vice president, groupvice president, vice president, and other occupations. These occupationaltitles are operationalized as dummy variables that take value 1 when theexecutive occupied such a function, and 0 otherwise. We also include exec-utives’ age, firm tenure (number of years at their firm of employment), andjob tenure (number of years in the current occupation) as proxies for expe-rience that affect compensation (Munoz-Bullon 2010; Kulich et al. 2011).Information related to other human capital variables (e.g., education, expe-rience in the industry, total number of companies for which the executivehas worked) is not reported consistently for a large portion of the sample,so we omit it from the analysis.
Executive pay is a function of firm size, which in turn has been proxiedby various measures (Renner, Rives, and Bowlin 2002). We have operation-alized ‘‘firm size’’ as the logarithm of the number of employees. Finally, ifmanagers are paid for performance, compensation should increase as prof-itability rises (Munoz-Bullon 2010). To control for firm performance, weuse return on assets (ROA).
Gender pay differences may be reduced in companies that implementdiversity practices to promote a diverse workplace, enhancing perceptionsof organizational justice and inclusion (Reskin and McBrier 2000; Kalevet al. 2006). Thus, we include controls for six organizational practices: theexistence of a diversity and equal opportunity policy, the promotion of posi-tive discrimination, the existence of a work–life balance policy, the provisionof flexible working hours that promote work–life balance, support foremployee skill training or career development, and the provision of regularstaff and business management training for managers. These variables are
EXTERNAL LABOR MARKET’S EFFECT ON EXECUTIVE GENDER PAY GAP 141
included in the ASSET4 ESG database in terms of yes/no descriptions. Wecode the variables 1 when the practice is present in a firm (yes), and 0otherwise.
We apply the generalized estimating equation (GEE) regression method,which is particularly suited to control for firm heterogeneity. The GEE algo-rithm accounts for correlation between records within the same cluster(data collected about the same firm during successive periods of time), thusproviding improved standard error estimates and more efficient parameterestimators than fixed- and random-effects models (Liang and Zeger 1986;Zorn 2001; Castilla 2007). The GEE approach is less computationally inten-sive than either fixed effects or random effects. Therefore, it often provesless subject to instability and convergence problems.
Results
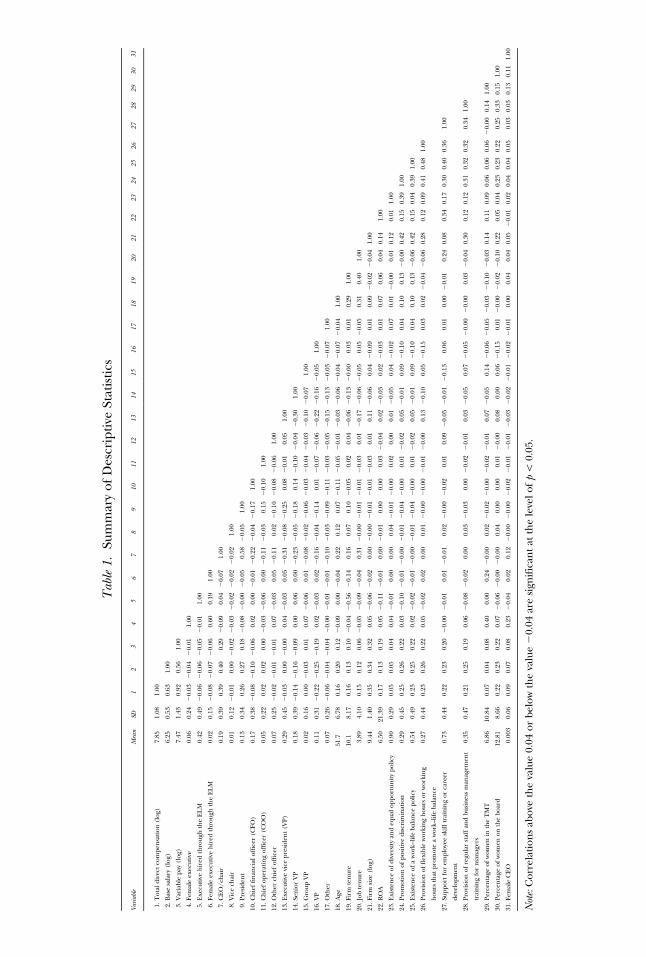
Table 1 reports descriptive statistics (mean, standard deviations, and corre-lations) for the variables used in the analyses.
Concerning women’s representation in top executive positions, 64 out of814 executives in the sample (7.86%) are female. Female executives repre-sent 174 out of 2,600 executive-year observations in the study (6.69%). Weobtained information for 2,564 executive observations related to the labormarket used to recruit them (174 female and 2,390 male executives). Outof 167 firms in the sample, 48 have at least one woman in their TMTs(28.74% of the sample). Only four women are CEOs in this sample, consis-tent with the known number in this sector. The ELM was used to hire38.50% of all female executives compared with 42.34% of male executives.This tendency has been changing in recent years as ELM career strategiesgrow in importance. We have identified 253 new executive recruitments inour database over the past six years: 13 out of 25 new female executives(52.00%) were recruited externally, compared with 150 out of 228 newmale executives (65.79%). In absolute values, the mean of variable pay is$4,340,700 compared with a base salary mean of $593,800. The substantiveamount of variable compensation validates the significance of the gendergap in this component.
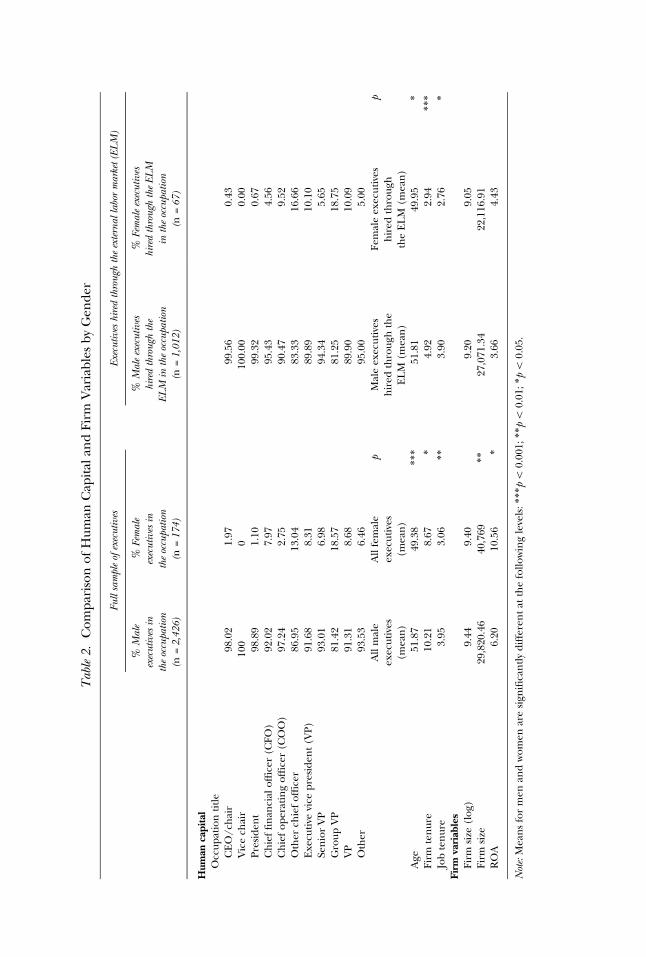
Table 2 presents descriptive statistics regarding gender differences inhuman capital, as well as firm size and profitability, first for the full sampleand then for the subsample of externally recruited executives. Concerningthe share of women in each occupation, the low proportion of women inthe top three occupational categories (CEO/chair, vice chair, and presi-dent) is remarkable. Women in the sample and the subsample were abouttwo years younger than the men, had about two fewer years of seniority inthe firms, and had one fewer year in the current position. The difference inindividual characteristics is small but statistically significant, so these mightrelate to the gender gap. Female executives work in significantly larger firmsthan their male counterparts do (in terms of number of employees).
142 ILR REVIEW
Tab
le1.
Sum
mar
yof
Des
crip
tive
Stat
isti
cs
Vari
able
Mea
nSD
12
34
56
78
910
1112
1314
1516
1718
1920
2122
2324
2526
2728
2930
31
1.T
otal
dire
ctco
mpe
nsa
tion
(log
)7.
851.
081.
00
2.B
ase
sala
ry(l
og)
6.25
0.53
0.63
1.00
3.V
aria
ble
pay
(log
)7.
471.
430.
920.
561.
00
4.Fe
mal
eex
ecut
ive
0.06
0.24
20.
032
0.04
20.
011.
00
5.E
xecu
tive
hir
edth
roug
hth
eE
LM
0.42
0.49
20.
062
0.06
20.
052
0.01
1.00
6.Fe
mal
eex
ecut
ive
hir
edth
roug
hth
eE
LM
0.02
0.15
20.
082
0.07
20.
060.
600.
191.
00
7.C
EO
/ch
air
0.19
0.39
0.39
0.40
0.29
20.
090.
042
0.07
1.00
8.V
ice
chai
r0.
010.
122
0.01
0.00
20.
022
0.03
20.
022
0.02
20.
021.
00
9.Pr
esid
ent
0.13
0.34
0.26
0.27
0.18
20.
082
0.00
20.
050.
582
0.05
1.00
10.C
hie
ffi
nan
cial
offi
cer
(CFO
)0.
170.
382
0.08
20.
102
0.06
0.02
0.00
20.
012
0.22
20.
042
0.17
1.00
11.C
hie
fop
erat
ing
offi
cer
(CO
O)
0.05
0.22
0.02
0.02
0.00
20.
032
0.06
0.00
20.
112
0.03
0.15
20.
101.
00
12.O
ther
chie
fof
fice
r0.
070.
252
0.02
20.
012
0.01
0.07
20.
030.
052
0.11
0.02
20.
102
0.08
20.
061.
00
13.E
xecu
tive
vice
pres
iden
t(V
P)0.
290.
452
0.03
0.00
20.
000.
042
0.03
0.05
20.
312
0.08
20.
250.
082
0.01
0.05
1.00
14.S
enio
rV
P0.
180.
392
0.14
20.
162
0.09
0.00
0.06
0.00
20.
232
0.05
20.
180.
142
0.10
20.
042
0.30
1.00
15.G
roup
VP
0.02
0.16
0.00
20.
030.
010.
072
0.06
0.01
20.
082
0.02
20.
062
0.03
20.
042
0.03
20.
102
0.07
1.00
16.V
P0.
110.
312
0.22
20.
252
0.19
0.02
20.
030.
022
0.16
20.
042
0.14
0.01
20.
072
0.06
20.
222
0.16
20.
051.
00
17.O
ther
0.07
0.26
20.
062
0.04
20.
042
0.00
20.
012
0.01
20.
102
0.03
20.
092
0.11
20.
032
0.05
20.
152
0.13
20.
032
0.07
1.00
18.A
ge51
.76.
780.
160.
200.
122
0.09
0.00
20.
040.
220.
120.
072
0.11
20.
052
0.01
20.
032
0.06
20.
042
0.07
20.
041.
00
19.F
irm
ten
ure
10.1
8.17
0.16
0.13
0.10
20.
042
0.56
20.
140.
160.
070.
102
0.05
0.02
0.04
20.
062
0.13
20.
000.
030.
010.
291.
00
20.J
obte
nur
e3.
894.
100.
150.
120.
062
0.05
20.
092
0.04
0.31
20.
002
0.01
20.
012
0.03
0.01
20.
172
0.06
20.
050.
052
0.05
0.31
0.40
1.00
21.F
irm
size
(log
)9.
441.
400.
350.
340.
320.
052
0.06
20.
020.
002
0.00
20.
012
0.01
20.
030.
010.
112
0.06
0.04
20.
090.
010.
092
0.02
20.
041.
00
22.R
OA
6.50
21.3
90.
170.
130.
190.
052
0.11
20.
010.
002
0.01
0.00
0.00
0.03
20.
040.
022
0.03
0.02
20.
030.
010.
070.
060.
040.
141.
00
23.E
xist
ence
ofdi
vers
ity
and
equa
lopp
ortu
nit
ypo
licy
0.90
0.29
0.05
0.05
0.04
0.04
20.
010.
000.
000.
042
0.01
20.
000.
020.
000.
012
0.05
0.04
20.
020.
070.
012
0.00
0.01
0.12
0.01
1.00
24.P
rom
otio
nof
posi
tive
disc
rim
inat
ion
0.29
0.45
0.25
0.26
0.22
0.03
20.
102
0.01
20.
002
0.01
20.
042
0.00
0.01
20.
020.
052
0.01
0.09
20.
100.
040.
100.
132
0.00
0.42
0.15
0.39
1.00
25.E
xist
ence
ofa
wor
k–lif
eba
lan
cepo
licy
0.54
0.49
0.23
0.25
0.22
0.02
20.
022
0.01
20.
002
0.01
20.
042
0.00
0.01
20.
020.
052
0.01
0.09
20.
100.
040.
100.
132
0.06
0.42
0.15
0.04
0.39
1.00
26.P
rovi
sion
offl
exib
lew
orki
ng
hou
rsor
wor
kin
g
hou
rsth
atpr
omot
ea
wor
k–lif
eba
lan
ce
0.27
0.44
0.23
0.26
0.22
0.05
20.
020.
020.
000.
012
0.00
20.
002
0.01
20.
000.
132
0.10
0.05
20.
150.
030.
022
0.04
20.
060.
280.
120.
090.
410.
481.
00
27.S
uppo
rtfo
rem
ploy
eesk
illtr
ain
ing
orca
reer
deve
lopm
ent
0.73
0.44
0.22
0.23
0.20
20.
002
0.01
0.01
20.
010.
022
0.00
20.
020.
010.
092
0.05
20.
012
0.13
0.06
0.01
0.00
20.
010.
240.
080.
340.
170.
300.
400.
361.
00
28.P
rovi
sion
ofre
gula
rst
aff
and
busi
nes
sm
anag
emen
t
trai
nin
gfo
rm
anag
ers
0.35
0.47
0.21
0.25
0.19
0.06
20.
082
0.02
0.00
0.03
20.
030.
002
0.02
20.
010.
032
0.05
0.07
20.
052
0.00
20.
000.
032
0.04
0.30
0.12
0.12
0.31
0.32
0.32
0.34
1.00
29.P
erce
nta
geof
wom
enin
the
TM
T6.
8610
.84
0.07
0.04
0.08
0.40
0.00
0.24
20.
000.
022
0.02
20.
002
0.02
20.
010.
072
0.05
0.14
20.
062
0.05
20.
032
0.10
20.
030.
140.
110.
090.
060.
060.
062
0.00
0.14
1.00
30.P
erce
nta
geof
wom
enon
the
boar
d12
.81
8.66
0.22
0.23
0.22
0.07
20.
062
0.00
20.
000.
040.
000.
000.
012
0.00
0.08
0.00
0.06
20.
150.
012
0.00
20.
022
0.10
0.22
0.05
0.04
0.23
0.23
0.22
0.25
0.33
0.15
1.00
31.F
emal
eC
EO
0.00
30.
060.
090.
070.
080.
232
0.04
0.02
0.12
20.
002
0.00
20.
022
0.01
20.
012
0.03
20.
022
0.01
20.
022
0.01
0.00
0.04
0.04
0.05
20.
010.
020.
040.
040.
050.
030.
030.
130.
111.
00
Not
e:C
orre
lati
ons
abov
eth
eva
lue
0.04
orbe
low
the
valu
e2
0.04
are
sign
ific
ant
atth
ele
velo
fp\
0.05
.
Tab
le2.
Com
pari
son
ofH
uman
Cap
ital
and
Firm
Var
iabl
esby
Gen
der
Full
sam
ple
ofex
ecut
ives
Exec
utiv
eshi
red
thro
ugh
the
exte
rnal
labo
rm
arke
t(EL
M)
%M
ale
exec
utiv
esin
the
occu
patio
n(n
=2,
426)
%Fe
mal
eex
ecut
ives
inth
eoc
cupa
tion
(n=
174)
%M
ale
exec
utiv
eshi
red
thro
ugh
the
ELM
inth
eoc
cupa
tion
(n=
1,01
2)
%Fe
mal
eex
ecut
ives
hire
dth
roug
hth
eEL
Min
the
occu
patio
n(n
=67
)
Hum
anca
pita
lO
ccup
atio
nti
tle
CE
O/c
hai
r98
.02
1.97
99.5
60.
43V
ice
chai
r10
00
100.
000.
00Pr
esid
ent
98.8
91.
1099
.32
0.67
Ch
ief
finan
cial
offi
cer
(CFO
)92
.02
7.97
95.4
34.
56C
hie
fop
erat
ing
offi
cer
(CO
O)
97.2
42.
7590
.47
9.52
Oth
erch
ief
offi
cer
86.9
513
.04
83.3
316
.66
Exe
cuti
vevi
cepr
esid
ent
(VP)
91.6
88.
3189
.89
10.1
0Se
nio
rV
P93
.01
6.98
94.3
45.
65G
roup
VP
81.4
218
.57
81.2
518
.75
VP
91.3
18.
6889
.90
10.0
9O
ther
93.5
36.
4695
.00
5.00
All
mal
eex
ecut
ives
(mea
n)
All
fem
ale
exec
utiv
es(m
ean
)
pM
ale
exec
utiv
esh
ired
thro
ugh
the
EL
M(m
ean
)
Fem
ale
exec
utiv
esh
ired
thro
ugh
the
EL
M(m
ean
)
p
Age
51.8
749
.38
***
51.8
149
.95
*
Firm
ten
ure
10.2
18.
67*
4.92
2.94
***
Job
ten
ure
3.95
3.06
**
3.90
2.76
*
Firm
vari
able
sFi
rmsi
ze(l
og)
9.44
9.40
9.20
9.05
Firm
size
29,8
20.4
640
,769
**
27,0
71.3
422
,116
.91
RO
A6.
2010
.56
*3.
664.
43
Not
e:M
ean
sfo
rm
enan
dw
omen
are
sign
ific
antl
ydi
ffer
ent
atth
efo
llow
ing
leve
ls:*
**p\
0.00
1;**p\
0.01
;*p\
0.05
.
Female executives work for companies with significantly higher accountingperformance, an important determinant of executive compensation.Analyzing the subsample of executives hired through the ELM, however, wesee no significant difference in firm size and corporate performancebetween female and male executives’ companies.
Table 3 shows regression results examining the effect of using the ELMto recruit executives based on total direct compensation. The modelsinclude an additional set of variables at each stage. First, we enter the mainindependent variables regarding whether recruitment was through theELM (model 1 in Table 3). Then, we use hierarchical regression analysis toincorporate the control variables for human capital, firm characteristics,and organizational practices in models 2 and 3.
Consistent with Hypothesis 1, coefficients in Table 3 show that femaleexecutives encounter a significant disadvantage in total direct compensationif hired through the ELM, after accounting for control variables (the nega-tive effect amounts to 46.2% of compensation in model 3). The variable‘‘female executive’’ has a positive effect (b = 0.241, p \ 0.05 in model 3).That is, after controls, female executives have higher total compensationthan do men, but this advantage is significantly reduced if the woman is anoutside hire. Thus, the main comparison effects are between females whoare external hires and those who are internal placements.
We ran an additional model that confirms this result relates to a pre-mium in compensation associated with the ILM for female executives.Notice that model 1 in Table 3 as well as models 1 and 2 in Table 4 showthat, in general, externally hired executives are paid less than those pro-moted internally. This result contrasts with previous research on samples ofemployees and CEOs (e.g., Harris and Helfat 1997; Murphy and Zabojnık2004; Bidwell 2011). Nevertheless, after controlling for firm characteristicsand organizational practices, the variable ‘‘executive hired through theELM’’ loses significance.
Among the control variables (Table 3, model 3), firm size has a relevantand significant positive effect on executive compensation, confirming thatlarger companies pay better than smaller ones (Brett and Stroh 1997;Renner et al. 2002): larger firms employ better-qualified and better-paidmanagers (Kostiuk 1990; Munoz-Bullon 2010). ROA also has a positiveimpact on total compensation, as expected (Munoz-Bullon 2010). Both firmand job tenure, reflecting experience (Munoz-Bullon 2010; Kulich et al.2011), are associated with higher total compensation. Three organizationalpractices positively influence executive pay: the promotion of positive dis-crimination, the existence of a work–life balance policy, and support foremployee skill training or career development.
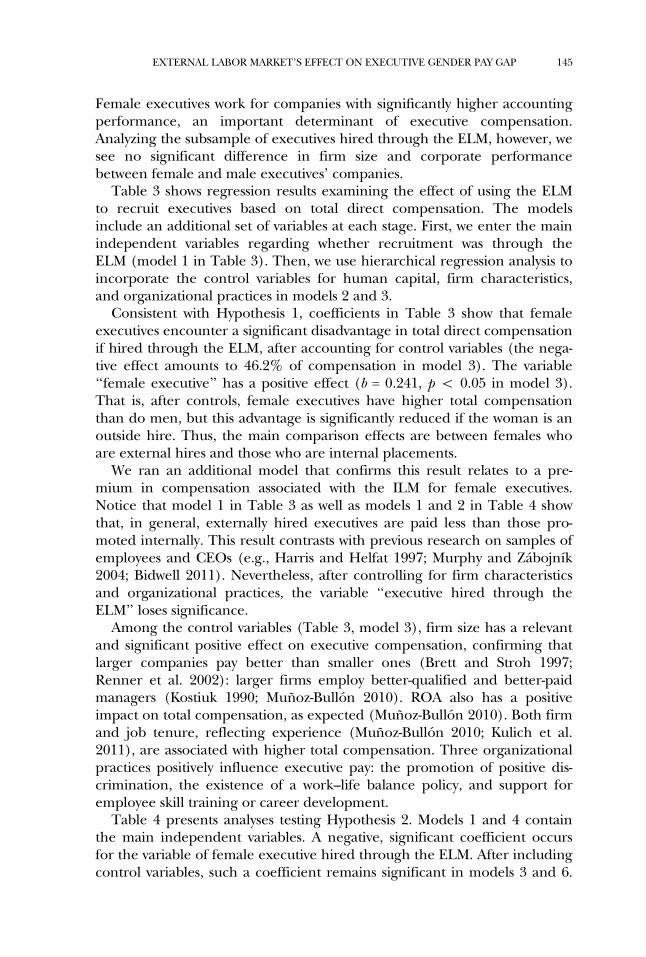
Table 4 presents analyses testing Hypothesis 2. Models 1 and 4 containthe main independent variables. A negative, significant coefficient occursfor the variable of female executive hired through the ELM. After includingcontrol variables, such a coefficient remains significant in models 3 and 6.
EXTERNAL LABOR MARKET’S EFFECT ON EXECUTIVE GENDER PAY GAP 145

Table 3. GEE Regression Results on Total Direct Compensation
Total Direct Compensation (log TDC2)
Model 1 Model 2 Model 3
Female executive 0.097 (0.107) 0.315** (0.101) 0.241* (0.093)Executive hired through the ELM 20.112* (0.044) 20.045 (0.050) 0.055 (0.047)Female executive hired through the
ELM (interaction: female executive3 executives hired through theELM)
20.587** (0.173) 20.554** (0.157) 20.462** (0.145)
Human capitalOccupation title
CEO/chair 0.834*** (0.086) 0.874*** (0.079)Vice chair 20.220 (0.161) 20.263 (0.149)President 0.031 (0.074) 0.053 (0.068)Chief financial officer (CFO) 0.025 (0.054) 0.031 (0.050)Chief operating officer (COO) 0.214* (0.101) 0.328*** (0.093)Other chief officer 0.045 (0.082) 0.142 (0.076)Executive vice president (VP) 0.018 (0.074) 20.044 (0.069)Senior VP 20.245** (0.081) 20.119* (0.075)Group VP 0.031 (0.138) 20.029 (0.127)VP 20.630*** (0.089) 20.420*** (0.082)Other 20.274** (0.095) 20.317*** (0.088)
Age 0.010** (0.003) 0.003 (0.003)Firm tenure 0.009** (0.003) 0.008*** (0.003)Job tenure 0.000 (0.005) 0.010* (0.005)
Firm variablesFirm size (log) 0.211*** (0.016)ROA 0.004*** (0.000)
Organizational practicesExistence of a diversity and equal
opportunity policy20.045 (0.060)
Promotion of positivediscrimination
0.101* (0.049)
Existence of a work–life balancepolicy
0.224*** (0.045)
Provision of flexible working hoursor working hours that promote awork–life balance
20.062 (0.053)
Support for employee skill trainingor career development
0.198*** (0.047)
Provision of regular staff andbusiness management training forits managers
20.025 (0.045)
Constant 7.897*** (0.028) 7.169*** (0.176) 5.177*** (0.216)N (executive-year observations) 2,561 2,424 2,333Wald chi-square 26.05*** 652.18*** 1309.45***
Notes: ELM, external labor market. Standard errors are in parentheses. After controls, female executiveshave higher total compensation than do men, but this advantage is significantly reduced if the womanis an outside hire. Thus, the main comparison effects are between females who are external hires andthose who are internal placements.***p \ 0.001; **p \ 0.01; *p \ 0.05 (two-tailed test).
146 ILR REVIEW

Tab
le4.
GE
ER
egre
ssio
nR
esul
tson
Bas
eSa
lary
and
Var
iabl
ePa
y
Bas
esa
lary
(log
)Va
riab
lepa
y(l
og(T
DC
2–
Bas
esa
lary
))
Mod
el1
Mod
el2
Mod
el3
Mod
el4
Mod
el5
Mod
el6
Fem
ale
exec
utiv
e2
0.02
2(0
.052
)0.
083
(0.0
48)
0.04
8(0
.042
)0.
179
(0.1
44)
0.38
5**
(0.1
43)
0.26
9*(0
.134
)E
xecu
tive
hir
edth
roug
hth
eE
LM
20.
053*
(0.0
21)
20.
053*
(0.0
24)
20.
008
(0.0
21)
20.
107
(0.0
59)
20.
053
(0.0
71)
0.07
1(0
.068
)Fe
mal
eex
ecut
ive
hir
edth
roug
hth
eE
LM
(in
tera
ctio
n:f
emal
eex
ecut
ive3
exec
utiv
esh
ired
thro
ugh
the
EL
M)
20.
205*
(0.0
84)
20.
190*
(0.0
75)
20.
142*
(0.0
66)
20.
722*
*(0
.232
)2
0.69
7**
(0.2
24)
20.
536*
(0.2
11)
Hum
anca
pita
lO
ccup
atio
nti
tle
CE
O/c
hai
r0.
402*
**
(0.0
41)
0.42
2***
(0.0
36)
0.91
3***
(0.1
23)
0.99
1***
(0.1
15)
Vic
ech
air
20.
063
(0.0
76)
20.
077
(0.0
68)
20.
371
(0.2
32)
20.
370
(0.2
19)
Pres
iden
t0.
059
(0.0
35)
0.09
5**
(0.0
31)
20.
055
(0.1
05)
20.
028
(0.0
99)
Ch
ief
finan
cial
offi
cer
(CFO
)2
0.00
1(0
.026
)0.
003
(0.0
23)
0.01
5(0
.077
)0.
029
(0.0
72)
Ch
ief
oper
atin
gof
fice
r(C
OO
)0.
037
(0.0
48)
0.08
6*(0
.042
)0.
147
(0.1
42)
0.31
3*(0
.135
)O
ther
chie
fof
fice
r0.
030
(0.0
39)
0.07
2*(0
.034
)0.
077
(0.1
16)
0.22
3*(0
.110
)E
xecu
tive
vice
pres
iden
t(V
P)0.
023
(0.0
35)
20.
016
(0.0
31)
0.07
9(0
.106
)0.
019
(0.0
99)
Sen
ior
VP
20.
158*
**
(0.0
38)
20.
093*
*(0
.034
)2
0.21
4(0
.115
)2
0.04
7(0
.108
)G
roup
VP
20.
095
(0.0
65)
20.
126*
(0.0
57)
0.14
8(0
.194
)0.
097
(0.1
82)
VP
20.
348*
**
(0.0
42)
20.
238*
**
(0.0
37)
20.
681*
**
(0.1
26)
20.
418*
**
(0.1
19)
Oth
er2
0.08
0(0
.045
)2
0.09
7*(0
.040
)2
0.25
9(0
.135
)2
0.28
8*(0
.127
)A
ge0.
008*
**
(0.0
01)
0.00
4**
(0.0
01)
0.01
3*(0
.004
)0.
005
(0.0
04)
Firm
ten
ure
0.00
0(0
.001
)2
0.00
1(0
.001
)0.
005
(0.0
04)
0.00
8(0
.004
)Jo
bte
nur
e0.
001
(0.0
02)
0.00
7**
(0.0
02)
20.
018*
(0.0
07)
20.
008
(0.0
07)
Firm
vari
able
sFi
rmsi
ze(l
og)
0.12
4***
(0.0
07)
0.25
5***
(0.0
23)
RO
A0.
000*
(0.0
00)
0.00
7***
(0.0
01)
(con
tinue
d)
Tab
le4.
Con
tin
ued
Bas
esa
lary
(log
)Va
riab
lepa
y(l
og(T
DC
2–
Bas
esa
lary
))
Mod
el1
Mod
el2
Mod
el3
Mod
el4
Mod
el5
Mod
el6
Org
aniz
atio
nalp
ract
ices
Exi
sten
ceof
adi
vers
ity
and
equa
lop
port
unit
ypo
licy
20.
039
(0.0
27)
20.
047
(0.0
86)
Prom
otio
nof
posi
tive
disc
rim
inat
ion
0.02
8(0
.022
)0.
057
(0.0
71)
Exi
sten
ceof
aw
ork–
life
bala
nce
polic
y0.
103*
**
(0.0
20)
0.27
0(0
.065
)
Prov
isio
nof
flex
ible
wor
kin
gh
ours
orw
orki
ng
hou
rsth
atpr
omot
ea
wor
k–lif
eba
lan
ce
20.
029
(0.0
24)
20.
088
(0.0
77)
Supp
ort
for
empl
oyee
skill
trai
nin
gor
care
erde
velo
pmen
t0.
087*
**
(0.0
21)
0.26
1(0
.068
)
Prov
isio
nof
regu
lar
staf
fan
dbu
sin
ess
man
agem
ent
trai
nin
gfo
rit
sm
anag
ers
0.03
3(0
.020
)2
0.02
8(0
.066
)
Con
stan
t6.
281*
**
(0.0
14)
5.82
1***
(0.0
84)
4.63
7***
(0.0
90)
7.50
8***
(0.0
38)
6.65
7***
(0.2
50)
4.22
4***
(0.3
12)
N(e
xecu
tive
-yea
rob
serv
atio
ns)
2,56
42,
427
2,34
72,
550
2,41
32,
322
Wal
dch
i-squ
are
21.9
4***
777.
42***
1614
.28
17.5
8***
337.
32***
788.
63***
Not
es:E
LM
,ext
ern
alla
bor
mar
ket.
Stan
dard
erro
rsar
ein
pare
nth
eses
.***
p\
0.00
1;**p\
0.01
;*p\
0.05
(tw
o-ta
iled
test
).

Also, the compensation penalty for female executives hired through theELM is larger for variable pay (b = 0.536) than for base salary (b = 0.142),confirming Hypothesis 2. Externally recruited women made less in variablepay than their male counterparts, even after considering occupation, age,tenure, firm characteristics, and organizational practices.
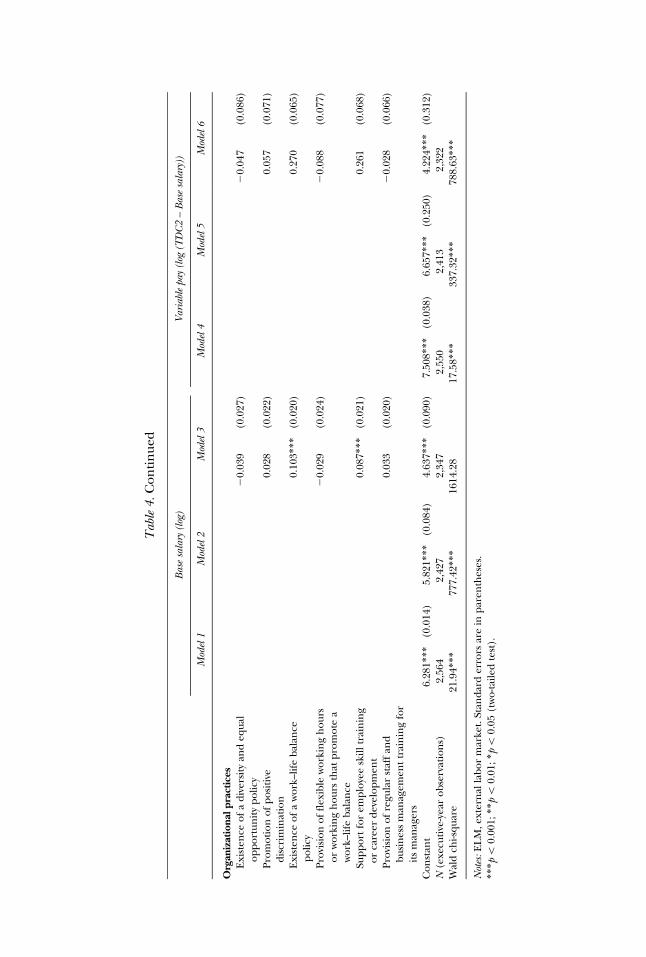
To test Hypothesis 3, we conduct regression analyses relating women’srepresentation in top executive levels to base salary and variable compensa-tion. The results appear in Table 5.
The gender penalty for female executives hired through the ELM losessignificance for base salary (see model 1) and is reduced for variable com-pensation, but remains significant after the inclusion of female representa-tion. (The gap falls by about 20%, from 20.536 to 20.446 as model 3 inTable 5 shows.) For fixed and variable components of compensation, onlytwo practices have a statistically significant effect on variable pay: the exis-tence of a work–life balance policy and support for employee skill trainingor career development. Models 2 and 4 in Table 5 include the interactionterms between the significant variables related to female representation(the percentage of women in the TMT and on the board) and female exec-utives hired through the ELM. The results indicate that such interactionsare not statistically significant. Hence, women’s representation variables donot seem to have a moderating effect.
To understand these results better, we run supplementary analyses thatoffer suggestive evidence for Hypothesis 3. As shown in Table 6, we separatethe base salary and variable pay of executives recruited through the ELM bygender. This exploration offers a more accurate and direct analysis abouthow the different measures of representation of women in top positionsseparately influence the variable compensation for men and women. Forexternally hired executives, the presence of women on the board has a sig-nificant impact on the base salary of both women and men. Nevertheless,the value of the coefficients is very close to zero. Note that for the variablepay of externally recruited female executives, the coefficient of the percent-age of women in the TMT is positive and significant. By contrast, the per-centage of women in the TMT and as CEO have a negative and significantinfluence on compensation for their male counterparts. Consistent withHypothesis 3, a higher level of female representation in top positions mayrepresent a useful mechanism to reduce the gender gap in the compensa-tion component, for which the penalty is larger.
Finally, to check the robustness of our results, we include in all previouslyestimated models a control regarding the gender composition of the execu-tive occupations, measured by the proportion of women in each occupa-tion. This analysis should help identify whether a potential source of thedifferential treatment is the devaluation of individual women relative tomen in the same occupation (Elvira and Graham 2002). The results (avail-able on request) show that such control is not significant and does not alterour prior findings, perhaps because women are underrepresented in all
EXTERNAL LABOR MARKET’S EFFECT ON EXECUTIVE GENDER PAY GAP 149

Tab
le5.
GE
ER
egre
ssio
nR
esul
tson
Bas
eSa
lary
and
Var
iabl
ePa
y(l
og)
wit
hFe
mal
eR
epre
sen
tati
onV
aria
bles
Bas
esa
lary
(log
)Va
riab
lepa
y(l
og(T
DC
2–
Bas
esa
lary
))
Mod
el1
Mod
el2
Mod
el3
Mod
el4
Fem
ale
exec
utiv
e2
0.00
7(0
.046
)2
0.00
4(0
.046
)2
0.00
2(0
.145
)0.
002
(0.1
46)
Exe
cuti
veh
ired
thro
ugh
the
EL
M0.
000
(0.0
21)
0.00
0(0
.021
)0.
107
(0.0
68)
0.10
7(0
.068
)Fe
mal
eex
ecut
ive
hir
edth
roug
hth
eE
LM
(in
tera
ctio
n:f
emal
eex
ecut
ive
3ex
ecut
ive
hir
edth
roug
hth
eE
LM
)2
0.12
9(0
.067
)2
0.25
1(0
.165
)2
0.44
6*(0
.212
)2
0.50
5(0
.524
)
Hum
anca
pita
lO
ccup
atio
nti
tle
CE
O/c
hai
r0.
405*
**
(0.0
37)
0.40
5***
(0.0
37)
0.99
8***
(0.1
19)
0.99
9***
(0.1
18)
Vic
ech
air
20.
090
(0.0
72)
20.
090
(0.0
72)
20.
311
(0.2
30)
20.
312
(0.2
30)
Pres
iden
t0.
095*
*(0
.032
)0.
093*
*(0
.032
)2
0.05
2(0
.100
)2
0.05
6(0
.100
)C
hie
ffin
anci
alof
fice
r(C
FO)
0.00
5(0
.023
)0.
004
(0.0
23)
0.04
0(0
.073
)0.
039
(0.0
73)
Ch
ief
oper
atin
gof
fice
r(C
OO
)0.
079
(0.0
43)
0.07
9(0
.044
)0.
327*
(0.1
37)
0.33
5*(0
.138
)O
ther
chie
fof
fice
r0.
072*
(0.0
35)
0.07
1*(0
.035
)0.
263*
(0.1
11)
0.26
4*(0
.111
)E
xecu
tive
vice
pres
iden
t(V
P)2
0.02
0(0
.032
)2
0.02
1(0
.032
)0.
031
(0.1
01)
0.02
9(0
.101
)Se
nio
rV
P2
0.09
7**
(0.0
35)
20.
097*
*(0
.035
)2
0.01
3(0
.110
)2
0.01
5(0
.110
)G
roup
VP
20.
149*
(0.0
58)
20.
151*
(0.0
58)
0.05
0(0
.183
)0.
047
(0.1
83)
VP
20.
227*
**
(0.0
38)
20.
229*
**
(0.0
38)
20.
326*
*(0
.120
)2
0.33
0**
(0.1
20)
Oth
er2
0.09
4*(0
.041
)2
0.09
4*(0
.041
)2
0.24
1(0
.128
)2
0.24
1(0
.128
)A
ge0.
004
(0.0
01)
0.00
4**
(0.0
01)
0.00
4(0
.004
)0.
004
(0.0
04)
Firm
ten
ure
20.
000
(0.0
01)
20.
000
(0.0
01)
0.01
1*(0
.004
)0.
011*
(0.0
04)
Job
ten
ure
0.00
7**
(0.0
02)
0.00
7**
(0.0
02)
20.
007
(0.0
07)
20.
007
(0.0
07)
Firm
vari
able
sFi
rmsi
ze(l
og)
0.12
6***
(0.0
07)
0.12
6***
(0.0
07)
0.26
7***
(0.0
24)
0.26
5***
(0.0
24)
RO
A0.
000*
(0.0
00)
0.00
0*(0
.000
)0.
007*
**
(0.0
01)
0.00
7***
(0.0
01)
Org
aniz
atio
nalp
ract
ices
Exi
sten
ceof
adi
vers
ity
and
equa
lopp
ortu
nit
ypo
licy
20.
043
(0.0
27)
20.
043
(0.0
27)
20.
079
(0.0
87)
20.
079
(0.0
87)
Prom
otio
nof
posi
tive
disc
rim
inat
ion
0.02
1(0
.023
)0.
022
(0.0
23)
0.03
1(0
.072
)0.
029
(0.0
72)
Exi
sten
ceof
aw
ork–
life
bala
nce
polic
y0.
102*
**
(0.0
20)
0.10
2***
(0.0
20)
0.25
7***
(0.0
65)
0.25
8***
(0.0
65)
(con
tinue
d)
Tab
le5.
Con
tin
ued
Bas
esa
lary
(log
)Va
riab
lepa
y(l
og(T
DC
2–
Bas
esa
lary
))
Mod
el1
Mod
el2
Mod
el3
Mod
el4
Prov
isio
nof
flex
ible
wor
kin
gh
ours
orw
orki
ng
hou
rsth
atpr
omot
ea
wor
k–lif
eba
lan
ce2
0.03
7(0
.024
)2
0.03
7(0
.024
)2
0.10
7(0
.077
)2
0.10
0(0
.077
)
Supp
ort
for
empl
oyee
skill
trai
nin
gor
care
erde
velo
pmen
t0.
081*
**
(0.0
22)
0.08
2***
(0.0
22)
0.22
7**
(0.0
77)
0.22
1**
(0.0
70)
Prov
isio
nof
regu
lar
staf
fan
dbu
sin
ess
man
agem
ent
trai
nin
gfo
rit
sm
anag
ers
0.01
9(0
.021
)0.
019
(0.0
21)
20.
110
(0.0
67)
20.
110
(0.0
67)
Fem
ale
repr
esen
tatio
nva
riab
les
F1:P
erce
nta
geof
wom
enin
the
TM
T0.
002*
(0.0
00)
0.00
2*(0
.000
)0.
008*
*(0
.002
)0.
009*
*(0
.002
)F2
:Per
cen
tage
ofw
omen
onth
ebo
ard
0.00
3**
(0.0
01)
0.00
3**
(0.0
01)
0.01
6***
(0.0
03)
0.01
5***
(0.0
03)
F3:F
emal
eC
EO
0.10
5(0
.156
)0.
078
(0.1
59)
0.34
0(0
.490
)0.
295
(0.4
98)
Mod
erat
ing
effe
cts
offe
mal
ere
pres
enta
tion
vari
able
sIn
tera
ctio
n:F
13
fem
ale
exec
utiv
esh
ired
thro
ugh
the
EL
M0.
001
(0.0
05)
20.
006
(0.0
16)
Inte
ract
ion
:F2
3fe
mal
eex
ecut
ives
hir
edth
roug
hth
eE
LM
0.00
5(0
.006
)0.
015
(0.0
19)
Con
stan
t4.
642*
**
(0.1
02)
4.65
8(0
.102
)3.
920*
**
(0.3
19)
3.94
7(0
.321
)N
(exe
cuti
ve-y
ear
obse
rvat
ion
s)2,
282
2,28
22,
270
2,27
0W
ald
chi-s
quar
e17
63.0
3***
1764
.83*
**
834.
33***
835.
54***
Not
es:E
LM
,ext
ern
alla
bor
mar
ket.
Stan
dard
erro
rsar
ein
pare
nth
eses
.***
p\
0.00
1;**p\
0.01
;*p\
0.05
(tw
o-ta
iled
test
).

Tab
le6.
GE
ER
egre
ssio
nR
esul
tson
Var
iabl
ePa
y(l
og)
ofE
xecu
tive
sH
ired
thro
ugh
the
EL
M
Bas
esa
lary
offe
mal
eex
ecut
ives
hire
dth
roug
hth
eEL
M
Bas
esa
lary
ofm
ale
exec
utiv
eshi
red
thro
ugh
the
ELM
Vari
able
pay
offe
mal
eex
ecut
ives
hire
dth
roug
hth
eEL
M
Vari
able
pay
ofm
ale
exec
utiv
eshi
red
thro
ugh
the
ELM
Hum
anca
pita
lO
ccup
atio
ntit
leC
EO
/ch
air
0.16
6*0.
071
0.05
5***
(0.0
15)
20.
021
(0.1
05)
1.40
3***
(0.2
93)
Vic
ech
air
—2
0.03
7(0
.032
)2
0.07
1(0
.204
)2
0.83
9(0
.570
)Pr
esid
ent
—0.
025*
(0.0
12)
0.01
8(0
.089
)2
0.29
2(0
.249
)C
hie
ffi
nan
cial
offi
cer
(CFO
)0.
000
(0.0
20)
0.00
1(0
.009
)2
0.04
5(0
.064
)0.
220
(0.1
80)
Ch
ief
oper
atin
gof
fice
r(C
OO
)0.
269*
**
(0.0
55)
20.
000
(0.0
18)
0.14
8(0
.121
)2
0.32
6(0
.339
)O
ther
chie
fof
fice
r2
0.02
3(0
.019
)0.
017
(0.0
15)
0.27
9**
(0.0
98)
20.
226
(0.2
74)
Exe
cuti
vevi
cepr
esid
ent
(VP)
0.24
4***
(0.0
47)
0.00
2(0
.013
)0.
196*
(0.0
90)
20.
386
(0.2
51)
Sen
ior
VP
0.21
0***
(0.0
50)
20.
003
(0.0
13)
0.13
1(0
.098
)2
0.38
6(0
.273
)G
roup
VP
0.17
4**
(0.0
55)
20.
006
(0.0
30)
0.10
6(0
.162
)2
0.97
6*(0
.452
)V
P0.
193*
**
(0.0
49)
20.
024
(0.0
16)
0.26
6*(0
.106
)2
0.61
3*(0
.298
)O
ther
0.31
0***
(0.0
64)
20.
009
(0.0
16)
0.09
3(0
.113
)0.
020
(0.3
17)
Age
20.
002
(0.0
01)
0.00
1*(0
.000
)0.
001
(0.0
03)
0.08
1***
(0.0
10)
Firm
ten
ure
0.00
1(0
.003
)0.
002*
(0.0
01)
20.
018*
**
(0.0
03)
20.
285*
**
(0.0
09)
Job
ten
ure
0.00
2(0
.004
)2
0.00
1(0
.001
)0.
008
(0.0
06)
0.06
9***
(0.0
18)
Firm
vari
able
sFi
rmsi
ze(l
og)
0.02
1*(0
.008
)0.
015*
**
(0.0
03)
20.
003
(0.0
21)
20.
023
(0.0
61)
RO
A2
0.00
0(0
.000
)0.
000*
*(0
.000
)2
0.00
1(0
.001
)2
0.00
4(0
.002
)
(con
tinue
d)

Tab
le6.
Con
tin
ued
Bas
esa
lary
offe
mal
eex
ecut
ives
hire
dth
roug
hth
eEL
M
Bas
esa
lary
ofm
ale
exec
utiv
eshi
red
thro
ugh
the
ELM
Vari
able
pay
offe
mal
eex
ecut
ives
hire
dth
roug
hth
eEL
M
Vari
able
pay
ofm
ale
exec
utiv
eshi
red
thro
ugh
the
ELM
Org
aniz
atio
nalp
ract
ices
Exi
sten
ceof
adi
vers
ity
and
equa
lopp
ortu
nit
ypo
licy
20.
014
(0.0
29)
20.
002
(0.0
10)
20.
080
(0.0
77)
0.01
4(0
.216
)Pr
omot
ion
ofpo
siti
vedi
scri
min
atio
n2
0.01
0(0
.019
)0.
033
(0.0
18)
0.01
7(0
.064
)0.
249
(0.1
80)
Exi
sten
ceof
aw
ork–
life
bala
nce
polic
y0.
021
(0.0
16)
20.
003
(0.0
07)
20.
092
0.05
80.
171
(0.1
62)
Prov
isio
nof
flex
ible
wor
kin
gh
ours
orw
orki
ng
hou
rsth
atpr
omot
ea
wor
k–lif
eba
lan
ce0.
007
(0.0
17)
20.
012
(0.0
09)
0.02
1(0
.068
)2
0.35
2(0
.190
)
Supp
ort
for
empl
oyee
skill
trai
nin
gor
care
erde
velo
pmen
t0.
025
(0.0
21)
0.02
3**
(0.0
08)
0.16
3(0
.061
)0.
167
(0.1
72)
Prov
isio
nof
regu
lar
staf
fan
dbu
sin
ess
man
agem
ent
trai
nin
gfo
rit
sm
anag
ers
0.01
9(0
.020
)0.
009
(0.0
08)
20.
095
(0.0
60)
20.
029
(0.1
67)
Fem
ale
repr
esen
tatio
nva
riab
les
Perc
enta
geof
wom
enin
the
TM
T0.
000
(0.0
00)
20.
000
(0.0
00)
0.02
6***
(0.0
02)
20.
036*
**
(0.0
06)
Perc
enta
geof
wom
enon
the
boar
d0.
003*
**
(0.0
00)
0.00
0*(0
.000
)2
0.00
3(0
.003
)2
0.00
6(0
.008
)Fe
mal
eC
EO
——
0.80
5(0
.424
)2
2.43
7*(1
.184
)C
onst
ant
1.39
6(0
.087
)1.
568
(0.0
38)
0.04
8(0
.281
)1.
950*
*(0
.785
)N
(exe
cuti
ve-y
ear
obse
rvat
ion
s)67
1,01
267
1,01
2W
ald
chi-s
quar
e13
9.06
***
332.
54***
233.
18***
324.
72***
Not
es:E
LM
,ext
ern
alla
bor
mar
ket.
Stan
dard
erro
rsar
ein
pare
nth
eses
.Th
esy
mbo
l‘‘—
’’re
pres
ents
coef
fici
ents
omit
ted
byST
AT
A.
***
p\
0.00
1;**p\
0.01
;*p\
0.05
(tw
o-ta
iled
test
).

occupations. (The highest proportion in an occupation is 18.57%, as seenin Table 2.) Moreover, we check whether different shares of variable pay forwomen and men could explain gender pay disparities at the executive level.We estimate variable compensation as a proportion of total pay indepen-dently for female and male executives. The share of variable pay for womenis 76.90% while for men it is 78.40%. The difference is not statistically signif-icant. Because the three female representation variables could be correlatedwith an unobservable variable related to the likelihood of there beingfemales in top positions, we estimate models 2 and 4 in Table 5, addingfemale proportion variables and their interactions with the variable femaleexecutives hired through the ELM separately. (Results available on request.)The three female representation measures remain positive and significantbut their interaction effects are not significant. Thus, the previous resultsare confirmed.
Additional analyses focusing on a subsample of executives who haveremained in their job for at least five years (n = 678) show no gender gapwith base salary or variable pay. (Results available on request.) Additionally,running the models in Table 6, we confirm that the presence of women inthe TMT positively influences fixed and variable compensation of femaleexecutives hired externally but has a negative effect on both for their malecounterparts. This finding seems to confirm that female representation inTMTs may reduce executive gender pay gaps in the long term, after athreshold of tenure in the job has been reached. Nevertheless, we are cau-tious about generalizing this result because the subsample represents only26.07% of the full study sample.
Discussion and Conclusion
Limited research attention has been paid to the relationship between theincreasing influence of the ELM and the gender wage gap, especially at thetop executive level where the gap seems most persistent. We examine thisrelationship, considering also the effects of the levels of female representa-tion at the top of the firms. We find that ELM hiring has a negative and sig-nificant effect on total direct compensation for female executives. Ourfindings are consistent with prior evidence that female managers benefitless than male managers do from ELM career strategies (Brett and Stroh1997; Dreher and Cox 2000; Lam and Dreher 2004). Additional analysesshow that women encounter a premium in total pay when promotedthrough the ILM. This result confirms the analysis of Gayle et al. (2012),who found that female executives’ pay depends more on rank, background,and experience. The advantage for female executives in the ILM is attribu-table to differential promotion rates, as women are promoted more quicklythan men; also, treatment of men and women becomes more equal asseniority increases (Petersen and Saporta 2004; Gayle et al. 2012). Based onthe theory of incomplete information, we surmise that significant
154 ILR REVIEW

differences occur in the mechanism governing internal versus externallabor markets. Different forms of mobility lead to different employmentoutcomes (Bidwell 2011). Formalized pay processes within the ILM andaccumulated personnel information tend to favor compensation for femaleexecutives. The fact that more performance-relevant information is avail-able probably explains why inequality diminishes (Petersen and Saporta2004). The lower performance and skill information and the amount of dis-cretion in setting salaries through the ELM appear to widen the gender paygap among executives. This finding is consistent with recent evidence that,for highly qualified women, formal hiring practices reduce the gender wagegap (Abendroth, Melzer, Kalev, and Tomaskovic-Devey 2015).
Note that the gender gap for total compensation of externally hired exec-utives is mainly because of differences in variable pay awards, as reported inprior studies below the executive suite (Elvira and Graham 2002; Munoz-Bullon 2010; Elkinawy and Stater 2011). The gap identified in our studycannot be explained by the segregation of women into smaller or less profit-able companies: there were no significant differences in firm size for femaleand male executives hired externally. Likewise, corporate performance failsto explain the gender wage gap between executives hired through theELM. This fact is inconsistent with the glass cliff theory, which predicts thatwomen and other occupational minorities are more likely to occupy leader-ship positions in organizations that are struggling, in crisis, or at risk of fail-ing (Ryan and Haslam 2007; Cook and Glass 2014). Our results, however, fitother empirical evidence demonstrating that no significant relationship isfound between company profitability and the gender of the CEO and direc-tors (Adams, Gupta, and Leeth 2009; Elsaid and Ursel 2011). The earningsgap may result from the opportunity for differential treatment that variablecompensation affords. Women are considered more risk-averse than men,so they may be expected to negotiate their base salary more forcefully thantheir stock-based compensation (Munoz-Bullon 2010). Additionally, apotential source of this differential treatment could be the devaluation ofindividual women relative to men in the same job (Elvira and Graham2002). The theory of devaluation, considered at the individual level, sug-gests that social roles and skills associated with women are devalued in rela-tion to characteristics associated with men (Steinberg 1990; England 1992).That subjective valuation in society is institutionalized in the wage-settingprocesses. Firms may pay individual executives based on the perceived pro-ductivity of their gender groups, with women viewed as being less produc-tive than men. Hence, a devaluation perspective may explain inequalityassociated with variable pay, which affords a structural opportunity for dif-ferential treatment of male and female executives.
Regarding the compensation component when the gender gap is larger,our findings suggest that the presence of women in the TMT positivelyinfluences the variable pay of externally hired female executives, while ithas a negative impact on that of their male counterparts. Female CEOs also
EXTERNAL LABOR MARKET’S EFFECT ON EXECUTIVE GENDER PAY GAP 155

appear to be associated with lower compensation for male executives hiredthrough the ELM. We interpret this result as evidence that the executivegender pay gap narrows, and it may reflect homophily among women tomen’s disadvantage (Elliott and Smith 2004). This result is consistent within-group biases explained by social identity and demographic similarity the-ories, as well as with previous empirical evidence that higher female repre-sentation among managers and CEOs relates to lower gender inequality(Kalev et al. 2006; Cohen and Huffman 2007) and, in particular, a lowergender gap in compensation (Bell 2005; Shin 2012). It seems that womenevaluate other women more favorably than men do. Additionally, women inorganizations with a higher proportion of female managers may havegreater bargaining power and so be more effective at negotiating employ-ment terms (Beckman and Phillips 2005; Cohen and Broschak 2013).Finally, networks may advance women’s conditions if they have more socialties with women than with men (Bell 2005). As a result, inequality might bealleviated.
It is possible that other unmeasured variables account for the results,such as the reputation of companies or research institutions where the exec-utive worked previously, the specific recruitment methods used in the ELM,and the potential gender difference in the compensation negotiation pro-cess. Future research using questionnaires or other sources of informationcontaining data on these variables would help address this question.
ReferencesAbendroth, Anja-Kristin, Silvia Maja Melzer, Alexandra Kalev, and Donald Tomaskovic-
Devey. 2015. Contact, power and practice: Can we reduce workplace gender inequality?ILR School of Cornell University conference, Increasing Inclusion/Reducing Discrimina-tion: What Works? New York City, June 4–5.
Adams, Susan M., Atul Gupta, and John D. Leeth. 2009. Are female executives over-represented in precarious leadership positions? British Journal of Management 20(1): 1–12.
Babcock, Linda, and Sara Laschever. 2003. Women Don’t Ask: Negotiation and the Gender Divide.Princeton, NJ: Princeton University Press.
Becker, Gary S. 1964. Human Capital. Chicago: University of Chicago Press.Beckman, Christine M., and Damon J. Phillips. 2005. Interorganizational determinants of
promotion: Client leadership and the attainment of women attorneys. American SociologicalReview 70(4): 678–701.
Bell, Linda A. 2005. Women-led firms and the gender gap in top executive jobs. IZA Discus-sion Paper No. 1689. Bonn, Germany: Institute for the Study of Labor.
Bertrand, Marianne, and Kevin F. Hallock. 2001. The gender gap in top corporate jobs.Industrial and Labor Relations Review 55(1): 3–21.
Bidwell, Matthew J. 2011. Paying more to get less: Specific skills, incomplete information andthe effects of external hiring versus internal mobility. Administrative Science Quarterly 56(3):369–407.
Bidwell, Matthew, Forrest Briscoe, Isabel Fernandez-Mateo, and Adina Sterling. 2013. Theemployment relationship and inequality: How and why changes in employment practicesare reshaping rewards in organizations. Academy of Management Annals 7(1): 61–121.
Blau, Francine D., and Andrea H. Beller. 1988. Trends in earnings differentials by gender,1971–1981. Industrial and Labor Relations Review 41(4): 513–29.
156 ILR REVIEW

Blau, Francine D., and Lawrence M. Kahn. 2006. The gender pay gap: Going, going . . . butnot gone. In Francine D. Blau, Mary C. Brinton, and David B. Grusky (Eds.), The DecliningSignificance of Gender? pp. 37-66. New York: Russell Sage Foundation.
Bowles, Hannah R., and Linda Babcock. 2012. How can women escape the compensationnegotiation dilemma? Relational accounts are one answer. Psychology of Women Quarterly37(1): 80–96.
Brett, Jeanne M., and Linda K. Stroh. 1997. Jumping ship: Who benefits from an externallabor market career strategy? Journal of Applied Psychology 82(3): 331–41.
Byrnes, James P., David C. Miller, and William D. Schafer. 1999. Gender differences in risktaking: A meta-analysis. Psychological Bulletin 125(3): 367–83.
Cardoso, Ana R., and Rudolf Winter-Ebmer. 2010. Female-led firms and gender wage poli-cies. Industrial and Labor Relations Review 64(4): 143–63.
Carter, Mary Ellen, Francesca Franco, and Mireia Gine. 2015. Executive gender pay gaps:The roles of board diversity and female risk aversion. Social Science Research Network.Accessed at http://ssrn.com/abstract=2503883.
Castilla, Emilio J. 2007. Dynamic Analysis in the Social Sciences. San Diego: Academic Press.Chauvin, Keith W., and Ronald A. Ash. 1994. Gender earnings differentials in total pay, base
pay, and contingent pay. Industrial and Labor Relations Review 47(4): 634–49.Cohen, Lisa E., and Joseph P. Broschak. 2013. Whose jobs are these? The impact of the pro-
portion of female managers on the number of new management jobs filled by women ver-sus men. Administrative Science Quarterly 58(4): 509–41.
Cohen, Philip N., and Matt L. Huffman. 2007. Working for the woman? Female managersand the gender wage gap. American Sociological Review 72(5): 681–704.
Cook, Alison, and Christy Glass. 2014. Above the glass ceiling: When are women and racial/ethnic minorities promoted to CEO? Strategic Management Journal 35(7): 1080–89.
DiPrete, Thomas A., Dominique Goux, and Eric Maurin. 2002. Internal labor markets andearnings trajectories in the post-Fordist economy. Social Science Research 31(2): 175–96.
Dreher, George F., and Taylor H. Cox Jr. 2000. Labor market mobility and cash compensa-tion: The moderating effects of race and gender. Academy of Management Journal 43(5):890–900.
Elkinawy, Susan, and Mark Stater. 2011. Gender differences in executive compensation: Var-iation with board gender composition and time. Journal of Economics and Business 63(1):23–45.
Elliott, James R., and Ryan A. Smith. 2004. Race, gender and workplace power. AmericanSociological Review 69(3): 365–86.
Elsaid, Eahab, and Nancy D. Ursel. 2011. CEO succession, gender and risk-taking. Gender inManagement: An International Journal 26(7): 499–512.
Elvira, Marta M., and Mary E. Graham. 2002. Not just a formality: Pay system formalizationand sex-related earnings effects. Organization Science 13(6): 601–17.
Elvira, Marta M., and Ishak Saporta. 2001. How does collective bargaining affect the genderpay gap? Work and Occupations 28(4): 469–90.
England, Paula. 1992. From status attainment to segregation and devaluation. ContemporarySociology 21(5): 643–47.
Fee, Edward C., Charles J. Hadlock, and Joshua R. Pierce. 2006. Promotions in the internaland external labor market: Evidence from professional football coaching careers. Journalof Business 79(2): 821–50.
Fernandez, Roberto M., and Mable Abraham. 2011. Glass ceilings and glass doors? Internaland external hiring in an organizational hierarchy. MIT Sloan School Working Paper4895-11.
Fernandez, Roberto M., and M. Lourdes Sosa. 2005. Gendering the job: Networks andrecruitment at a call center. American Journal of Sociology 111(3): 859–904.
Flabbi, Luca, Mario Macis, Andrea Moro, and Fabiano Schivardi. 2014. Do female executivesmake a difference? The impact of female leadership on gender gaps and firm perfor-mance. CEPR Discussion Paper DP10228. Social Science Research Network. Accessed athttp://ssrn.com/abstract=2518714.
EXTERNAL LABOR MARKET’S EFFECT ON EXECUTIVE GENDER PAY GAP 157
Gayle, George-Levi, Limor Golan, and Robert A. Miller. 2012. Gender differences in execu-tive compensation and job mobility. Journal of Labor Economics 30(4): 829–72.
Gerhart, Barry. 1990. Gender differences in current and starting salaries: The role of perfor-mance, college major, and job title. Industrial and Labor Relations Review 43(4): 418–33.
Gorman, Elizabeth H. 2006. Work uncertainty and the promotion of professional women:The case of law firm partnership. Social Forces 85(2): 865–90.
Gorman, Elizabeth H., and Julie A. Kmec. 2009. Hierarchical rank and women’s organiza-tional mobility: Glass ceilings in corporate law firms. American Journal of Sociology 114(5):1428–74.
Granovetter, Mark S. 1981. Toward a sociological theory of income differences. In Ivar Berg(Ed.), Sociological Perspectives on Labor Markets, pp. 11–47. New York: Academic Press.
Halaby, Charles N. 1988. Action and information in the job mobility process: The searchdecision. American Sociological Review 53(1): 9–25.
Harris, Dawn, and Constance Helfat. 1997. Specificity of CEO human capital and compensa-tion. Strategic Management Journal 18(11): 895–920.
Hashimoto, Masanori. 1981. Firm-specific human capital as a shared investment. AmericanEconomic Review 71(3): 475–82.
Hultin, Mia, and Ryszard Szulkin. 1999. Wages and unequal access to organizational power:An empirical test of gender discrimination. Administrative Science Quarterly 44(3): 453–72.
Kahn, Lawrence M. 2014. New evidence on gender and the labor market: A symposium. ILRReview 67(2): 283–86.
Kalev, Alexandra, Frank Dobbin, and Erin Kelly. 2006. Best practices or best guesses? Asses-sing the efficacy of corporate affirmative action and diversity policies. American SociologicalReview 71(4): 589–617.
Kostiuk, Peter F. 1990. Firm size and executive compensation. Journal of Human Resources25(1): 90–105.
Kronberg, Anne-Kathrin. 2013. Stay or leave? Externalization of job mobility and the effecton the U.S. gender earnings gap, 1979–2009. Social Forces 91(4): 1117–46.
Kulich, Clara, Grzegorz Trojanowski, Michelle K. Ryan, S. Alexander Haslam, and Luc D. R.Renneboog. 2011. Who gets the carrot and who gets the stick? Evidence of gender dispari-ties in executive remuneration. Strategic Management Journal 32(3): 301–21.
Lam, Simon S. K., and George F. Dreher. 2004. Gender, extra-firm mobility, and compensa-tion attainment in the United States and Hong Kong. Journal of Organizational Behavior25(7): 791–805.
Liang, Kung-Yee, and Scott L. Zeger. 1986. Longitudinal data analysis using generalized lin-ear models. Biometrika 73(1): 13–22.
Marsden, Peter V., and Jeanne S. Hurlbert. 1988. Social resources and mobility outcomes: Areplication and extension. Social Forces 66(4): 1038–59.
Moss, Philip, and Chris Tilly. 2001. Stories Employers Tell: Race, Skill, and Hiring in America. NewYork: Russell Sage Foundation.
Munoz-Bullon, Fernando. 2010. Gender-compensation differences among high-level execu-tives in the United States. Industrial Relations 49(3): 346–70.
Murphy, Kevin J., and Jan Zabojnık. 2004. CEO pay and appointments: A market-basedexplanation for recent trends. American Economic Review 94(2): 192–96.
[OECD] Organisation for Economic Co-operation and Development. 2011. ISIC Rev. 3Technology Intensity Definition. OECD Directorate for Science, Technology and Indus-try. Accessed at http://www.oecd.org/sti/ind/48350231.pdf.
Petersen, Trond, and Ishak Saporta. 2004. The opportunity structure for discrimination.American Journal of Sociology 109(4): 852–901.
Pfeffer, Jeffrey. 1981. Power in Organizations. Cambridge, MA: Ballinger.Renner, Celia, Janet M. Rives, and William F. Bowlin. 2002. The significance of gender in
explaining senior executive pay variations: An exploratory study. Journal of ManagerialIssues 14(3): 331–45.
Reskin, Barbara, and Debra B. McBrier. 2000. Why not ascription? Organizations’ employ-ment of male and female managers. American Sociological Review 65(2): 210–33.
158 ILR REVIEW
Rousseau, Denise M. 2005. Idiosyncratic Deals: When Workers Bargain for Themselves. New York:M. E. Sharpe.
Ryan, Michelle K., and S. Alexander Haslam. 2007. The glass cliff: Exploring the dynamicssurrounding the appointment of women to precarious leadership positions. Academy ofManagement Review 32(2): 549–72.
Shin, Taekjin. 2012. The gender gap in executive compensation: The role of female directorsand chief executive officers. Annals of the American Academy of Political and Social Sciences639: 258–78.
Siegel, Phyllis A., and Donald C. Hambrick. 2005. Pay disparities within top managementgroups: Evidence of harmful effects on performance of high-technology firms. Organiza-tion Science 16(3): 259–74.
Steinberg, Ronnie J. 1990. Social construction of skill: Gender, power, and comparableworth. Work and Occupations 17(4): 449–82.
Tajfel, Henri, and John C. Turner. 1979. An integrative theory of intergroup conflict. InWilliam G. Austin and Stephen Worchel (Eds.), The Social Psychology of Intergroup Relations,pp. 39–47. Monterey, CA: Brooks-Cole.
Valcour, P. Monique, and Pamela Tolbert. 2003. Gender, family and career in the era ofboundarylessness: Determinants and effects of intra- and inter-organizational mobility.International Journal of Human Resource Management 14(5): 768–87.
Zorn, Christopher J. W. 2001. Generalized estimating equation models for correlated data: Areview with applications. American Journal of Political Science 45(2): 470–90.
EXTERNAL LABOR MARKET’S EFFECT ON EXECUTIVE GENDER PAY GAP 159
Related Documents


