THE EFFECT OF TACHYCARDIC IRREGULARITY ON VENTRICULAR REPOLARIZATION DYNAMICS By Joseph Kenneth Prinsen A DISSERTATION Submitted to Michigan State University in partial fulfillment of the requirements for the degree of Pharmacology and Toxicology – Doctor of Philosophy 2013

Welcome message from author
This document is posted to help you gain knowledge. Please leave a comment to let me know what you think about it! Share it to your friends and learn new things together.
Transcript

THE EFFECT OF TACHYCARDIC IRREGULARITY ON VENTRICULAR REPOLARIZATION DYNAMICS
By
Joseph Kenneth Prinsen
A DISSERTATION
Submitted to Michigan State University
in partial fulfillment of the requirements for the degree of
Pharmacology and Toxicology – Doctor of Philosophy
2013

ABSTRACT
THE EFFECT OF TACHYCARDIC IRREGULARITY ON VENTRICULAR REPOLARIZATION DYNAMICS
By
Joseph Kenneth Prinsen
By the year 2050, it is estimated that 10 million Americans will be living with atrial
fibrillation, a fast and chaotically irregular heart rhythm. For years, case reports and
clinical studies have shown that patients paradoxically die suddenly from new
ventricular arrhythmias occurring soon after the termination of atrial fibrillation, a
condition called proarrhythmia. In contrast, patients have a low risk of these
arrhythmias while they experience atrial fibrillation. This dichotomy of risk is not seen
in patients with regular tachycardias. This dissertation includes the hypothesis that the
irregularity of the ventricular response observed during atrial fibrillation alters
repolarization in a way that could confer protection from developing repolarization-
related arrhythmias. Because many patients with atrial fibrillation are treated with drugs
that block IKr, such as dofetilide, and nearly all forms of proarrhythmic death are
associated with abnormal repolarization caused by blocking IKr, an additional
hypothesis is that repolarization may be further altered with dofetilide treatment. To test
these hypotheses, domestic pigs were anesthetized and paced in the right atrium of the
heart with a random sequence to mimic the irregular tachycardia of atrial fibrillation.
Controls were designed to account for the heart rate variation of atrial fibrillation. Since
QT intervals vary with heart rate, formulas have been developed to correct the QT
interval for changing rates. These correction formulas were tested and found to be
unreliable for group QT correction, therefore in the dofetilide arm of these studies,
constant rate pacing at 150 beats/min was used for baseline comparisons. After fixed,
sinusoidal, and random tachypacing treatments, these studies found that the QT interval
and TpTe segment did not change, while the beat-to-beat variability index and QT
interval recovery varied extensively across individual pigs. Each pig had a unique
response, but no pattern could be attributed to the type of tachypacing. Dofetilide, when
administered to pigs, has an unusual dual-effect elimination that has not been
previously described. The serum concentration of dofetilide, was lower during random
tachypacing compared to sinusoidal tachypacing, suggesting that the clinical theory of
protection may be due to a pharmacokinetic protective effect during atrial fibrillation.
Random and sinusoidal tachypacing in dofetilide treated pigs is associated with an
increase in the RT interval just after the termination of tachypacing. This suggests that
tachycardia of any type may confer a post-tachycardia vulnerability though irregularity
per se did not alter repolarization differently than the control forms of tachypacing.

iv
The efforts and any benefits associated with the information summarized within
are dedicated to my parents, whose simple life lessons drove my motivation
toward academics.
Anna M. Prinsen
Philip S. Prinsen

v
ACKNOWLEDGEMENTS
I would like to acknowledge and thank the members of my guidance committee
for their contributions to my training. Each helped shape my graduate and
medical school experience in a general sense, but also in individual and special
ways.
Dr. Gregory Fink (co-mentor)
Dr. James Galligan
Dr. Donald Sefcik
Dr. Marc Bailie
This dissertation would not be possible if not for the expert technical assistance
of several key contributors.
Thoralf Hoelzer-Maddox
Robert Burnett
Scott Robinson
Aaron Weinzierl
A special debt of gratitude is owed to the Michigan State University D.O. - Ph.D.
program, especially Dr. J. Justin McCormick, Bethany Heinlein, and Suzanne
Kolher.

vi
This dissertation could not have been written without the guidance and patience
of Dr. Bari Olivier, who not only served as my committee chairman and mentor,
but also a friend, who encouraged and challenged me throughout my graduate
and medical school experience, never accepting less that my best effort.
Forever will I be grateful to Brett Groenleer for his support throughout my
professional training.
vii
TABLE OF CONTENTS
LIST OF TABLES x
LIST OF FIGURES xii
LIST OF ABBREVIATIONS xviii
CHAPTER ONE - INTRODUCTION 1 OVERVIEW 1 INTRODUCTION TO CARDIAC ELECTRICAL PROPERTIES 3 REPOLARIZATION-RELATED ARRHYTHMIAS 7 ATRIAL FIBRILLATION 8 ANTIARRHYTHMIC DRUGS 11 REPOLARIZATION IMPAIRMENT 14 MOLECULAR DETERMINATES OF REPOLARIZATION 16 ATRIAL FIBRILLATION, REPOLARIZATION-RELATED ARRHYTHMIA 24
& ANTIARRHYTHMIC DRUGS ANIMAL MODEL 26 OVERALL HYPOTHESIS & SPECIFIC AIMS 27 CHAPTER TWO – METHODS 29 OVERVIEW 29 ANIMALS 30 HIGH RIGHT ATRIAL TACHYPACING 32 DATA ACQUISITION & ASSESSMENT 37 QT INTERVAL ASSESSMENT 39 QT INTERVAL CORRECTION 39 ASSESSMENT OF REPOLARIZATION DISPERSION 42 SECONDARY MEASURES OF REPOLARIZATION 43 QT ADAPTATION 43 QT (RT) INTERVAL MEMORY ASSESSMENT 44 DOFETILIDE ASSESSMENT 45 DATA & STATISTICAL ANALYSIS 46 CHAPTER THREE – THE EFFECT OF TACHYCARDIC 48 IRREGULARITY ON VENTRICULAR REPOLARIZATION DYNAMICS IN NORMAL DOMESTIC PIGS INTRODUCTION 48 SPECIFIC METHODS 50 DATA 53
CHARACTERIZATION OF AN EXPERIMENTAL MODEL FOR 53 STUDYING CARDIAC REPOLARIZATION
viii
EVALUATION OF THE EFFECT OF REPETITIVE PACING 53 ON THE PRE-PACING BASELINE INHERENT VENTRICULAR RATE EVALUATION OF THE EFFECT OF TACHYPACING ON THE QT 60
INTERVAL AND TpTe SEGMENT
EVALUATION OF QT DYNAMIC DURING AND AFTER 60 TACHYPACING
OVERALL CONCLUSION 69 CHAPTER FOUR – THE QT EFFECT AND PHAMRMACOKINETIC 70 PROFILE OF DOFETILIDE IN TACHYPACED DOMESTIC PIGS INTRODUCTION 70 SPECIFIC METHODS 72 DATA 76 DOFETILIDE EFFICIENCY ASSESSMENT 76 BASELINE CHARACTERISTICS 78 PHARACOKINETICS AND REPOLARIZATION DYNAMICS 80
OF DOFETILIDE ELECTROCARDIOGRAPHIC AND HEMODYNAMICS 85 EFFECTS OF DOFETILIDE
OVERALL CONCLUSION 88 CHAPTER FIVE – THE EFFECT OF TACHYCARDIC IRREGULARITY 89 ON THE RECOVERY OF REPOLARIZATION PROLONGATION IN IKr ANTAGONIZED DOMESTIC PIGS INTRODUCTION 89 SPECIFIC METHODS 90 DATA 93 DOFETILIDE EXPOSURE WHILE PACING 93 EVALUATION OF THE EFFECT OF TACHYPACING ON 95
THE QT INTERVAL IN PIGS TREATED WITH DOFETILIDE DOFETILIDE EXPOSURE WHILE TACHYPACING 99 EVALUATION OF THE EFFECT OF TACHYPACING ON 101
TPTE IN PIGS TREATED WITH DOFETILIDE
OVERALL CONCLUSION 104 CHAPTER SIX – DISCUSSION 105 SHORT-TERM IRREGULAR TACHYPACING FAILS TO 105
DIFFERENTIALLY ALTER COMMONLY USED REPOLARIZATION PARAMETERS WHEN COMPARED TO REGULARLY VARYING, OR FIXED TACHYPACING
RECOVERY FROM SHORT-TERM IRREGULAR TACHYPACING 109 IS NOT ASSOCIATED WITH ALTERED QT OR QT DYNAMICS
SERUM DOFETILIDE CONCENTRATION IS DECREASED IN 111 RANDOM TACHYPACING COMPARED TO FIXED OR SINUSOIDAL
ix
DOFETILIDE ALTERS REPOLARIZATION, BUT DOES NOT ALTER 112 IT DIFFERENTIALLY FOR RANDOM VERSUS SINUSOIDAL TACHYPACING
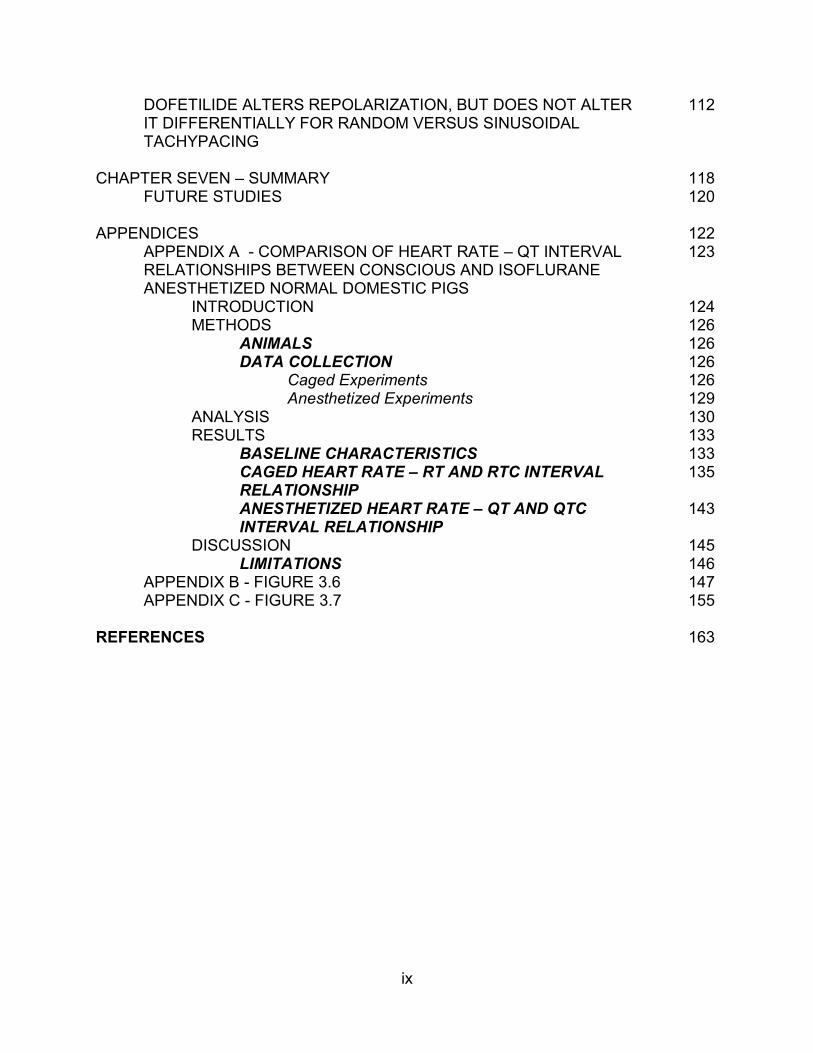
CHAPTER SEVEN – SUMMARY 118 FUTURE STUDIES 120 APPENDICES 122
APPENDIX A - COMPARISON OF HEART RATE – QT INTERVAL 123 RELATIONSHIPS BETWEEN CONSCIOUS AND ISOFLURANE ANESTHETIZED NORMAL DOMESTIC PIGS INTRODUCTION 124 METHODS 126 ANIMALS 126 DATA COLLECTION 126 Caged Experiments 126 Anesthetized Experiments 129 ANALYSIS 130 RESULTS 133 BASELINE CHARACTERISTICS 133 CAGED HEART RATE – RT AND RTC INTERVAL 135
RELATIONSHIP ANESTHETIZED HEART RATE – QT AND QTC 143
INTERVAL RELATIONSHIP DISCUSSION 145 LIMITATIONS 146 APPENDIX B - FIGURE 3.6 147 APPENDIX C - FIGURE 3.7 155 REFERENCES 163
x
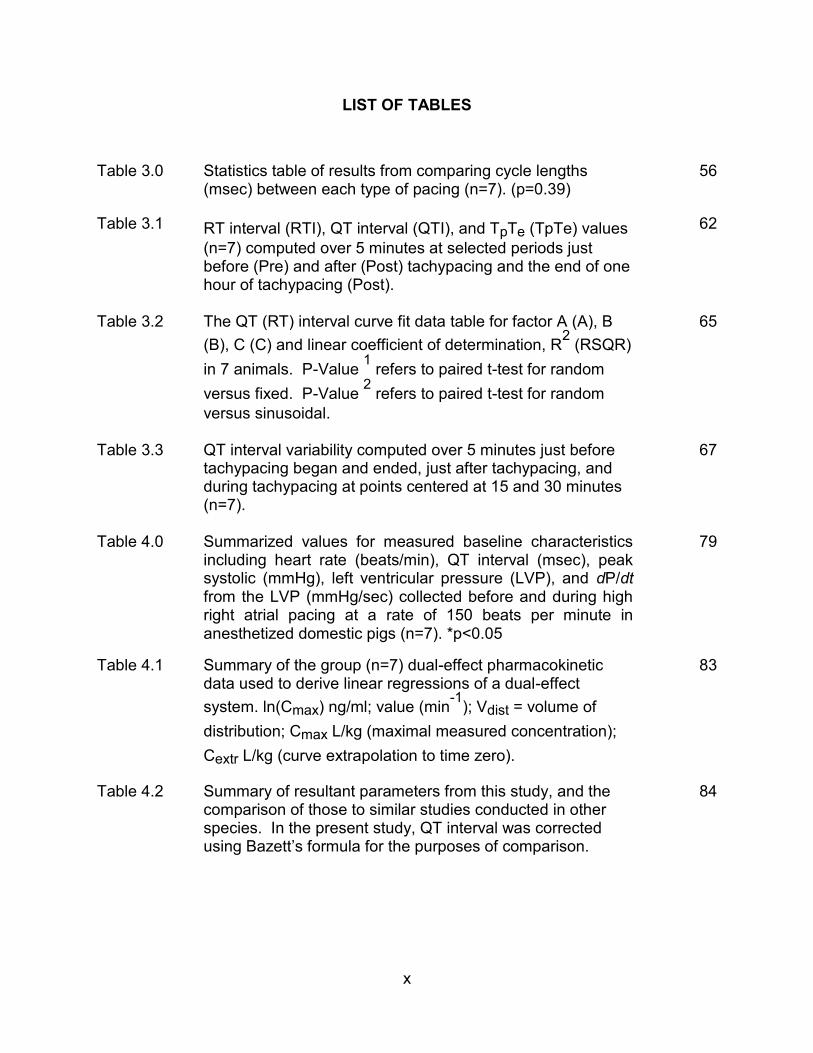
LIST OF TABLES
Table 3.0 Statistics table of results from comparing cycle lengths (msec) between each type of pacing (n=7). (p=0.39)
56
Table 3.1 RT interval (RTI), QT interval (QTI), and TpTe (TpTe) values
(n=7) computed over 5 minutes at selected periods just before (Pre) and after (Post) tachypacing and the end of one hour of tachypacing (Post).
62
Table 3.2 The QT (RT) interval curve fit data table for factor A (A), B
(B), C (C) and linear coefficient of determination, R2 (RSQR)
in 7 animals. P-Value 1 refers to paired t-test for random
versus fixed. P-Value 2 refers to paired t-test for random
versus sinusoidal.
65
Table 3.3 QT interval variability computed over 5 minutes just before tachypacing began and ended, just after tachypacing, and during tachypacing at points centered at 15 and 30 minutes (n=7).
67
Table 4.0 Summarized values for measured baseline characteristics including heart rate (beats/min), QT interval (msec), peak systolic (mmHg), left ventricular pressure (LVP), and dP/dt from the LVP (mmHg/sec) collected before and during high right atrial pacing at a rate of 150 beats per minute in anesthetized domestic pigs (n=7). *p<0.05
79
Table 4.1 Summary of the group (n=7) dual-effect pharmacokinetic data used to derive linear regressions of a dual-effect
system. ln(Cmax) ng/ml; value (min-1
); Vdist = volume of
distribution; Cmax L/kg (maximal measured concentration);
Cextr L/kg (curve extrapolation to time zero).
83
Table 4.2 Summary of resultant parameters from this study, and the comparison of those to similar studies conducted in other species. In the present study, QT interval was corrected using Bazett’s formula for the purposes of comparison.
84

xi
Table 4.3 Summary of resulting QT interval, maximum systolic
pressure from LVP (maxSPLVP) and the positive dP/dt
following dofetilide infusion (t0). The values are normalized
to the animals individual baseline parameters (n=7) and compared to controls (n=3) paced at 150 beats/min.
87
Table 5.0 QT and TpTe (TpTe) summary of dofetilide treated domestic pigs paced at 150 beats/min for the entire experiment (Control) or with pacing interrupted by one hour of sinusoidal (Sine) or Random tachypacing.
103
Table A.1 Summarized values for measured electrocardiographic parameters, instantaneous heart rate (beats per minute), R to R interval (msec), QT/RT interval (msec), the peak of T to the end of T wave (Tpeak – Tend), and the duration of the QRS complex in caged and isoflurane anesthetized domestic pigs (n=9).
134
Table A.2 Observed variance of the slope between subjects (n=10) following the application of correction formulas from data in caged natural hear rate (black), heart rate limited conscious (blue), and heart rate limited anesthetized (red) pigs. Variance values for Hodges (*1109.6 and 339.3, respectively) and Yoshinaga (# 20.1) are not shown due to being non-characteristically high. [The text in this figure is not meant to be decipherable, but for visual reference only.]
138
Table A.3 Twenty-nine commonly used QT interval correction formulas applied, using the RT interval, to the uncorrected heart rate – RT interval data and the residual slope following correction in anesthetized pigs (n=10).
144
xii
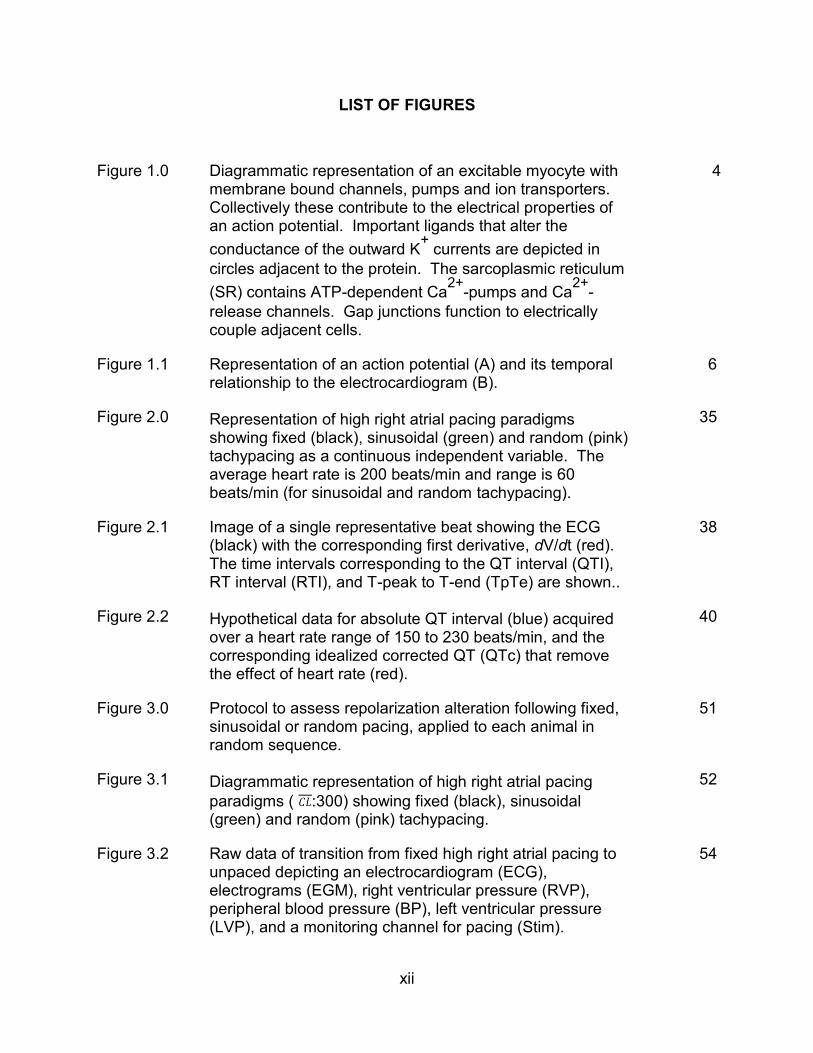
LIST OF FIGURES
Figure 1.0 Diagrammatic representation of an excitable myocyte with membrane bound channels, pumps and ion transporters. Collectively these contribute to the electrical properties of an action potential. Important ligands that alter the
conductance of the outward K+ currents are depicted in
circles adjacent to the protein. The sarcoplasmic reticulum
(SR) contains ATP-dependent Ca2+
-pumps and Ca2+
-
release channels. Gap junctions function to electrically couple adjacent cells.
4
Figure 1.1 Representation of an action potential (A) and its temporal relationship to the electrocardiogram (B).
6
Figure 2.0 Representation of high right atrial pacing paradigms showing fixed (black), sinusoidal (green) and random (pink) tachypacing as a continuous independent variable. The average heart rate is 200 beats/min and range is 60 beats/min (for sinusoidal and random tachypacing).
35
Figure 2.1 Image of a single representative beat showing the ECG (black) with the corresponding first derivative, dV/dt (red). The time intervals corresponding to the QT interval (QTI), RT interval (RTI), and T-peak to T-end (TpTe) are shown..
38
Figure 2.2 Hypothetical data for absolute QT interval (blue) acquired over a heart rate range of 150 to 230 beats/min, and the corresponding idealized corrected QT (QTc) that remove the effect of heart rate (red).
40
Figure 3.0 Protocol to assess repolarization alteration following fixed, sinusoidal or random pacing, applied to each animal in random sequence.
51
Figure 3.1 Diagrammatic representation of high right atrial pacing
paradigms ( :300) showing fixed (black), sinusoidal (green) and random (pink) tachypacing.
52
Figure 3.2 Raw data of transition from fixed high right atrial pacing to unpaced depicting an electrocardiogram (ECG), electrograms (EGM), right ventricular pressure (RVP), peripheral blood pressure (BP), left ventricular pressure (LVP), and a monitoring channel for pacing (Stim).
54

xiii
Figure 3.3 Pre-pacing cycle lengths comparing Pre-fixed (PreFP), Pre-Sinusoidal (PreSP), and Pre-random paced (PreRP) between groups (n=7). Vertical bars represent the SEM. (p=0.39)
55
Figure 3.4 Average heart rate (beats/min) before and after fixed, sinusoidal (Sine), and random tachypacing (n=7). Data was averaged over 5 minutes calculated just before and after tachypacing.
58
Figure 3.5 Change in fixed, sinusoidal (sine) and random pacing cycle lengths (CL) compared to the pre-pacing interval at 30-second post-pacing intervals (n=7). (p=0.41)
59
Figure 3.6 Poincare plots as a visual representation of the QT interval beat-to-beat variability of repolarization (BVR) each representing the RT interval as a function of the previous RT interval in a single subject (n=7). [The text in this figure is not meant to be decipherable, but is for visual reference only.] Refer to Appendix B for individual decipherable graphs.
63
Figure 3.7 QT (RT) interval adaptations over 250 beats following the termination of fixed, sinusoidal (Sine), and random tachypacing. Each graph represents a single animal (n=7). [The text in this figure is not meant to be decipherable, but is for visual reference only.] Refer to Appendix C for individual decipherable graphs.
64
Figure 3.8 The QT interval curve fit “c Factor” comparison across the three (Fixed, Sinusoidal (Sine), and Random Pacing) treatment groups (n=7).
66
Figure 3.9 QT variability index (RTvi) computed over 5 minutes at select center-points during the experiment corresponding to before, during (Early-15 min, Mid-30 min, Late-60 min), and after sinusoidal and random tachypacing (n=7).
68
Figure 4.0 Protocol to assess the pharmacokinetic and pharmacodynamics response to a single bolus injection of dofetilide
74
Figure 4.1 Study Design including the schedule for blood harvesting relative to pacing initiation.
75
xiv
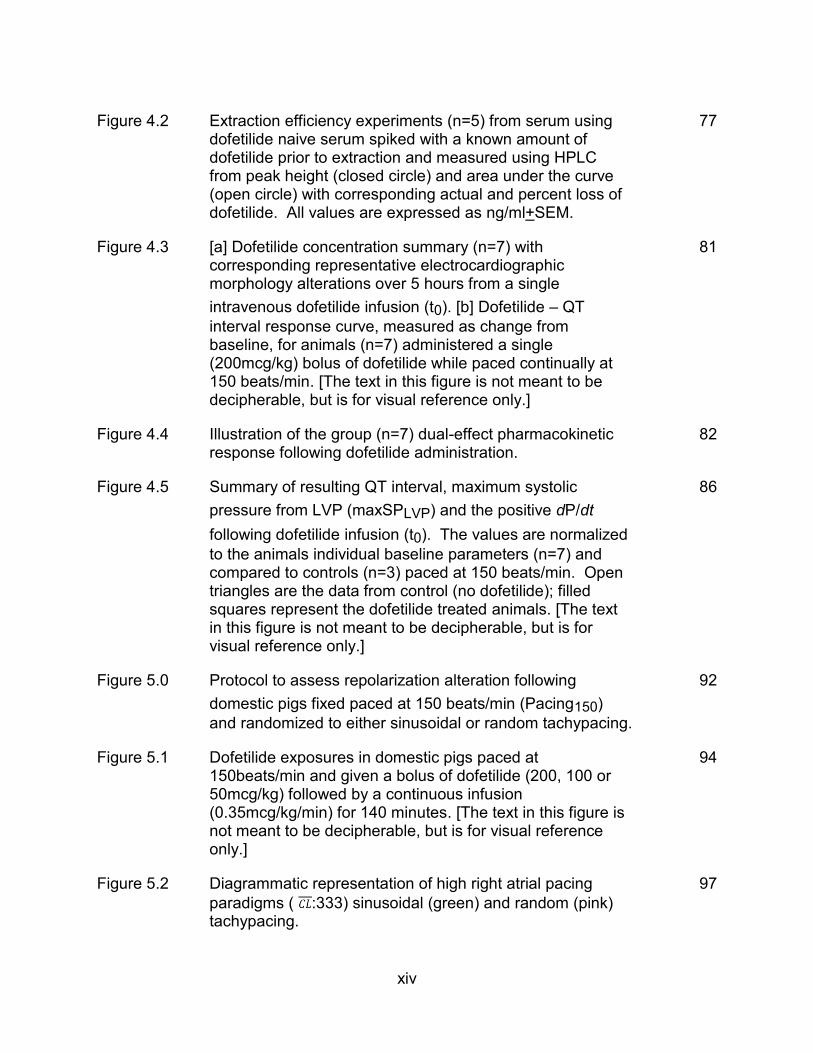
Figure 4.2 Extraction efficiency experiments (n=5) from serum using dofetilide naive serum spiked with a known amount of dofetilide prior to extraction and measured using HPLC from peak height (closed circle) and area under the curve (open circle) with corresponding actual and percent loss of dofetilide. All values are expressed as ng/ml+SEM.
77
Figure 4.3 [a] Dofetilide concentration summary (n=7) with corresponding representative electrocardiographic morphology alterations over 5 hours from a single
intravenous dofetilide infusion (t0). [b] Dofetilide – QT
interval response curve, measured as change from baseline, for animals (n=7) administered a single (200mcg/kg) bolus of dofetilide while paced continually at 150 beats/min. [The text in this figure is not meant to be decipherable, but is for visual reference only.]
81
Figure 4.4 Illustration of the group (n=7) dual-effect pharmacokinetic response following dofetilide administration.
82
Figure 4.5 Summary of resulting QT interval, maximum systolic
pressure from LVP (maxSPLVP) and the positive dP/dt
following dofetilide infusion (t0). The values are normalized
to the animals individual baseline parameters (n=7) and compared to controls (n=3) paced at 150 beats/min. Open triangles are the data from control (no dofetilide); filled squares represent the dofetilide treated animals. [The text in this figure is not meant to be decipherable, but is for visual reference only.]
86
Figure 5.0 Protocol to assess repolarization alteration following
domestic pigs fixed paced at 150 beats/min (Pacing150)
and randomized to either sinusoidal or random tachypacing.
92
Figure 5.1 Dofetilide exposures in domestic pigs paced at 150beats/min and given a bolus of dofetilide (200, 100 or 50mcg/kg) followed by a continuous infusion (0.35mcg/kg/min) for 140 minutes. [The text in this figure is not meant to be decipherable, but is for visual reference only.]
94
Figure 5.2 Diagrammatic representation of high right atrial pacing
paradigms ( :333) sinusoidal (green) and random (pink) tachypacing.
97
xv
Figure 5.3 QT (RT) assessment of dofetilide treated domestic pigs paced at 150 beats/min for the entire experiment (Dofetilide Time Control) or with pacing interrupted by one hour of sinusoidal (Sine) or Random tachypacing. (*p=0.042)
98
Figure 5.4 Dofetilide exposures in domestic pigs exposed to dofetilide and paced at 150beats/min and treated with either Control pacing (150 beats/min) for the entire experiment or with pacing interrupted by one hour of sinusoidal (Sine) or Random tachypacing. (*p<0.05)
100
Figure 5.5 Transmural dispersion of repolarization assessment (TpTe)
of dofetilide treated domestic pigs paced at 150 beats/min for the entire experiment (Dofetilide Time Control) or with pacing interrupted by one hour of sinusoidal (Sine) or Random tachypacing.
102
Figure A.1 Study Design including the first phase for pigs that are
caged1 (and unanesthetized (Free Roaming) and second
phase conducted in pigs anesthetized with isoflurane
(Anesthetized)2.
128
Figure A.2 Representative fiduciary points from the automated morphology-based analysis of the lead V1 electrocardiogram (dark tracing) comparing the RT interval with the corresponding dV/dt. The lighter tracing represents the first derivative of the original electrocardiogram with corresponding isoelectric line. The dotted lines are the fiduciary points used to mark the beginning and end of the RT interval.
131
xvi
Figure A.3 Twenty-nine commonly used QT interval correction formulas and the application of these formulas, using the RT interval, to the linear regression of the heart rate-RT interval data in caged pigs (n=10). RR is the time interval between successive QRS complexes in seconds; HR is the instantaneous heart rate in beats per minute; QT is the interval from the beginning of the QRS complex to the end of the T wave in seconds. Adams, 1936(1); Arrowood et al., 1993(2); Bazett, 1920(2); Boudoulas, 1981(4); Fridericia, 1920(5); Sagie et al., 1992(6); Hodges, 1997(7); Hodges et al., 1983(8); Kawataki et al., 1984(9); Klingfield et al., 1995(10); Kovacs, 1985(11); Larsen & Skulason, 1941(12); Lecocq et al., 1989(13); Lijung, 1950(14); Mayeda, 1934(15); Rautaharju et al., 1990(16); Rickards & Norman, 1981(17); Sarma et al., 1984(18); Schlamowitz, 1946(19); Simonson et al., 1962(20); Todt et al., 1992(21); Van de Water et al., 1989(22); Wohlfart & Pahlm, 1994(23); Yoshinaga et al., 1993(24). [The text in this figure is not meant to be decipherable, but for visual reference only.]
136
Figure A.4 Observed variance of the slope between subjects (n=10) following the application of correction formulas from data in caged natural hear rate (black), heart rate limited conscious (blue), and heart rate limited anesthetized (red) pigs. Variance values for Hodges (*1109.6 and 339.3, respectively) and Yoshinaga (# 20.1) are not shown due to being non-characteristically high. [The text in this figure is not meant to be decipherable, but for visual reference only.]
141
Figure B.1 Figure 3.6 Graph A Enlarged 148
Figure B.2 Figure 3.6 Graph B Enlarged 149
Figure B.3 Figure 3.6 Graph C Enlarged 150
Figure B.4 Figure 3.6 Graph D Enlarged 151
Figure B.5 Figure 3.6 Graph E Enlarged 152
Figure B.6 Figure 3.6 Graph F Enlarged 153
Figure B.7 Figure 3.6 Graph G Enlarged 154
Figure C.1 Figure 3.7 Graph A Enlarged 156
Figure C.2 Figure 3.7 Graph B Enlarged 157

xvii
Figure C.3 Figure 3.7 Graph C Enlarged 158
Figure C.4 Figure 3.7 Graph D Enlarged 159
Figure C.5 Figure 3.7 Graph E Enlarged 160
Figure C.6 Figure 3.7 Graph F Enlarged 161
Figure C.7 Figure 3.7 Graph G Enlarged 162

xviii
LIST OF ABREVIATIONS
AF
Atrial fibrillation
ANOVA Analysis of variance
ATPase Enzyme that catalyzes breakdown of adenosine triphosphate
ATXII
Anemone toxin
AUC Area under the curve
AV Atrial ventricular
beats/min Beats per minute
BPM Beats per minute
BVR Beat-to-beat variability
Ca2+
Ionized calcium
CL
Cycle length
CO2 Carbon dioxide
dP/dt Derivative of pressure to the derivative of time
E-4031 Experimental class III antiarrhythmic drug
ECG Electrocardiogram
EDTA
Ethylenediaminetetraacetic acid
EGM Endocardial electrogram
f Frequency
FDA US Food and Drug Administration
hERG Human Ether-A-Go-Go
HPLC High pressure liquid chromatography
xix
HR
Heart rate
HRA High right atrial
Hz Hertz
IACUC
Institutional Animal Care and Use Committee
ICaL L-type calcium current
Ik1 Inward potassium current rectifier
IKr Delayed rectifier outward potassium current
IKs Slow-delayed rectifier outward potassium current
INa Fast sodium current
INCX Sodium-calcium exchanger
Ito Outward potassium current
Ito,f Outward potassium current/ fast
Ito,s Outward potassium current/ slow
kHz Kilohertz
Kv Voltage gated potassium channel
KVLQT1
Potassium channel protein is encoded by the KCNQ1 gene
Ke Elimination rate Constant
LQT Long QT
LQT1 Long QT type 1
Fisher’s LSD Least significant difference test
LVe Left and right ventricular electrogram
LVP Left ventricle pressure
LVPpeak Peak left ventricle pressure

xx
mcg/kg Microgram per kilogram
mcg/kg/min Microgram per kilogram per min
Mg2+
Ionized magnesium
min Minutes
minK Can assemble with KvLQT1 to form a slow delayed potassium rectifier channel
ml Milliliter
ml/kg/hour Milliliter per kilogram per hour
mM
Millimolar
mm Millimeter
mmHg Millimeters of mercury
mRNA Messenger ribonucleic acid
msec or ms Milliseconds
mV Millivolts
NaCl Sodium chloride
NCX Sodium-calcium exchange
ng/ml Nanograms per milliliter
NIH National Institutes of Health (United States)
nm Nanometer
PK Pharmacokinetic
PKA
Protein kinase A
PKC
Protein kinase C
PR (interval)
ECG time period from the start of the p-wave and ending at the start of the QRS complex
xxi
PreFP Pre-fixed pacing
PreRP Pre-random pacing
PreSP Pre-sine wave pacing
PVT Polymorphic ventricular tachycardia
QRS
Q-wave R-wave S-wave
QTc Corrected QT interval
QTI QT interval
QTvi QT variability
RRA Repolarization-related arrhythmia
R-R intervals R-wave to R-wave of the ECG
RSQR R2
RTc
RT correction
RTI RT interval
RV Right ventricular
RVe Right ventricular electrogram
RTvi RT variability
SCD Sudden cardiac death
SEM Standard error of the mean
Stim Pacing
t0 Initial time
tau Time constant
Tend End of the T-Wave
Torsades Torsades de Pointes

xxii
TpTe
Peak of the T-wave to the end of the T-wave
µl Microliter
V1 Electrocardiographic lead corresponding to leave V1
VW Vaughan-Williams antiarrhythmic classification
1
CHAPTER ONE - INTRODUCTION
OVERVIEW
Atrial fibrillation (AF) is the most frequent arrhythmia encountered in clinical practice
today. Additional clinical trials have shown that ventricular heart rate control provides
equivalent benefit to rhythm conversion into sinus rhythm. As a result, more people
than ever are living with atrial fibrillation and an irregular ventricular response. For
many years, case reports and clinical studies have pointed out that patients
paradoxically had sudden death from new ventricular arrhythmias occurring soon after
the termination of AF. Many of these arrhythmias are thought to be associated with
altered repolarization, or “repolarization related arrhythmias” (RRAs). RRAs such as
Torsade de Pointe are associated with prolongation of the action potential, often due to
abnormalities in ionic currents. There is a correlation between the magnitude of this
repolarization delay and the risk for RRA. Some of the drugs used to convert the
rhythm of AF to sinus rhythm, and to facilitate electrical or ablative rhythm conversion
impair repolarization currents and prolong the QT interval of the electrocardiogram; a
surrogate for action potential duration.
Patients with AF have a lower incidence of repolarization-related arrhythmia (RRA)
compared to patients who experience RRAs soon after the termination of atrial

2
fibrillation. This occurs whether the termination mechanism is drug or a combination of
drug and radiofrequency ablation. The same phenomenon is not seen in other regular
forms of supraventricular tachycardia. When controlled for similar ventricular rates and
medications, patients who remained in AF had lower rates of ventricular arrhythmias
than AF patients converted back to sinus rhythm. This suggests that the irregularity and
not the rate of the tachycardia may be involved in protection from repolarization-related
arrhythmia. It is hypothesized that the irregularity of the ventricular response observed
during atrial fibrillation alters repolarization in a manner that could confer protection for
the development of repolarization-related arrhythmias and/or that conversion from the
AF state to a normal regular rhythm is associated with increased RRA risk. Since many
patients are converted from AF to sinus rhythm using (in part) IKr blocking medications,
delayed rectifier antagonism may be a requirement for unmasking the proarrhythmic
potential following the termination of atrial fibrillation.
If the irregularity of atrial fibrillation is related to its apparent protective effect, it might
occur through a modifying effect of irregularity on repolarization properties of the heart.
There remains a paucity of information elucidating the mechanisms responsible for atrial
fibrillation induced repolarization modification. The irregularly of atrial fibrillation is a
defining characteristic, making it a prime candidate for study. A synthesis of the recent
evidence points to the need for a more complete investigation of how irregularity
influences cardiac repolarization and the development of repolarization-related
arrhythmia. Controlled studies in animal models are needed to more fully understand
3
these mechanisms. This dissertation reports on the acute effects of transient irregular
tachypacing on ventricular repolarization.
INTRODUCTION TO CARDAC ELECTRICAL PROPERTIES
Impulse formation and propagation within the heart is determined intrinsically by the
electrical characteristics of the cardiac cell membrane, ion channel function, intracellular
and tissue factors. Membrane-bound proteins carry current, in the form of transported
ions and respond to cellular signaling molecules. There is a complex interaction
between these transmembrane proteins (Figure 1.0). Excitatory currents are carried by
the voltage-dependent sodium and calcium channels and are transferred from cell to
cell through gap junctions. These junctions are one factor responsible for determining
the speed of impulse propagation, while the type and distribution of potassium channels
(and to a lesser extent chloride channels) determine the time course of repolarization.
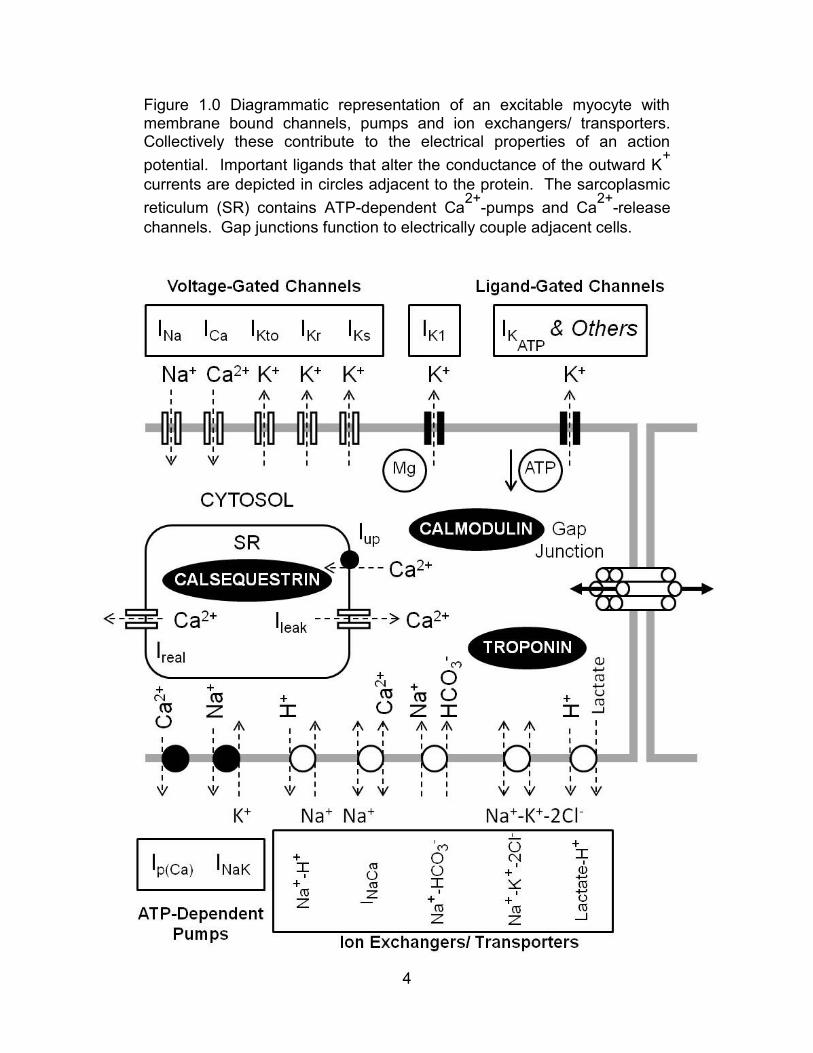
4
Figure 1.0 Diagrammatic representation of an excitable myocyte with membrane bound channels, pumps and ion exchangers/ transporters. Collectively these contribute to the electrical properties of an action
potential. Important ligands that alter the conductance of the outward K+
currents are depicted in circles adjacent to the protein. The sarcoplasmic
reticulum (SR) contains ATP-dependent Ca2+
-pumps and Ca2+
-release
channels. Gap junctions function to electrically couple adjacent cells.
5
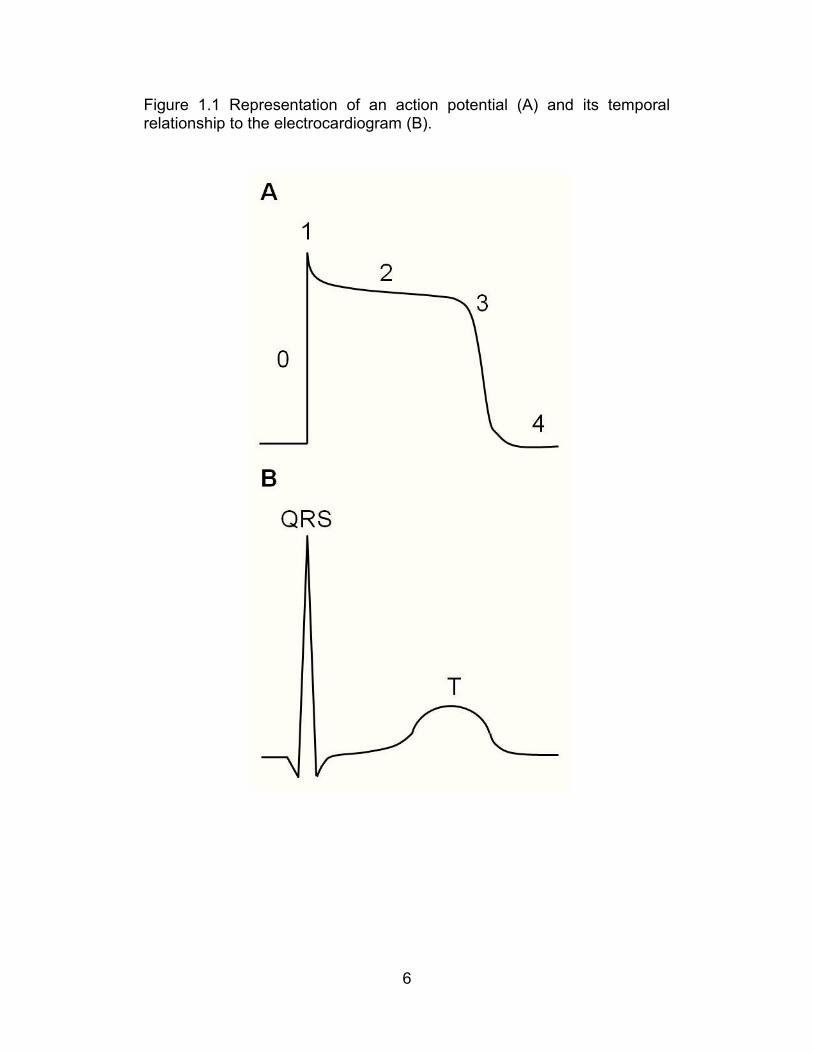
Currents across the cell membrane result in a time-dependent change in voltage and
are graphically represented as the action potential (Figure 1.1A). The activation of the
contractile components results from the rise in intracellular calcium brought as a result
of the voltage change occurring throughout the phases of the action potential (i.e. 0-4).
Small fluxes in calcium are augmented by the so-called calcium induced calcium
release from the sarcoplasmic reticulum though the interaction with the cardiac
ryanodine receptor. The action potential represents the time-varying voltage pattern for
an individual cell, or groups of cells. The characteristics for a given group of cells are
determined by the cells gene and protein expression. Within the heart there is a
diversity of channels with particular properties. The action potential morphology varies
among heart regions and when perturbed by extracardiac stressors. Regional
differences are also determined by the spatial heterogeneity of channel protein
expression. The molecular expression of membrane proteins is a dynamic process with
a relatively short time constant that can be altered by stressors (such as disease) and
contributing to differences in channel type and density: an idea typically referred to as
electrical remodeling.
Action potentials are not typically recorded in clinical medicine. This is in part due to the
difficulty and potential complications brought about by the inherent invasiveness of their
acquisition. As an alternative, the electrocardiogram (ECG) is used to measure
electrical events through the recording and augmenting of electrical signals on the
surface of the body. The ECG represents electrical events for the entire heart (Figure
1.1B).
6
Figure 1.1 Representation of an action potential (A) and its temporal relationship to the electrocardiogram (B).
7
REPOLARIZATION-RELATED ARRHYTHMIAS
The term polymorphic ventricular tachycardia (PVT) resulted from a series of
syndromes described in the 1950’s and 60’s that first described sudden death
associated with QT interval prolongation (Jervella & Lange-Nielsen, 1957; Ward, 1964).
The term Torsades de Pointes or simply Torsades was popularized soon after to
describe a specific type of PVT that arose from QT interval prolongation and slow heart
rates (Dessertenne, 1966). It was found that drugs could produce a similar syndrome of
QT interval prolongation and PVT (Selzer & Wray, 1964; Redleaf & Lerner, 1968).
Cardiovascular (antiarrythmics) and non-cardiovacular drugs can both cause QT
interval prolongation. Terfenadine, a drug introduced in the United States in 1985, was
reported to induce PVT in the late 1980’s and resulted in its withdrawal by the FDA
(Monahan et al., 1990). Terfenadine blocks the delayed rectifier current, IKr (Honig et
al., 1992; Honig et al., 1993; Woosley et al., 1993]) resulting in QT interval prolongation
and proarrhythmia. Delayed rectifier current antagonism is the mechanism responsible
for most forms of drug-induced PVT (Roden & Viswanathan, 2005). It is also the
underlying basis for the term repolarization-related arrhythmias (RRA) used in this
dissertation. As a consequence of this and other evidence, regulatory agencies such as
the FDA consider the risk of RRA to be a critical element of drug safety. Prolonged
ventricular repolarization has been used as a surrogate marker to suggest a heightened
potential for developing RRA. Essentially all compounds in development now must be
tested for their QT interval prolonging propensity (Roden et al., 2007). Drug induced
8
prolongation of 6 milliseconds or more can flag a compound for more regulatory scrutiny
(Shah, 2005; USFDA, 2005; Darpo et al., 2006). Though QT interval prolongations
have been correlated with increased risk of RRA; the association remains poorly
defined. Therefore a comprehensive assessment of repolarization (not just
prolongation) is widely considered to be important because a variety of repolarization
perturbations can lead to conditions of electrical instability and potentially SCD.
It is known that PVT, specifically Torsades, can degenerate to lethal arrhythmias such
as ventricular fibrillation or asystole (Del Rosario et al., 2010). This manifestation of
electrical instability and sudden cardiac death are clinically important end-points and a
heightened understanding of the causative mechanism is paramount.
ARTRIAL FIBRILLATION
As first defined by William Harvey in 1628, atrial fibrillation is a supraventricular
tachyarrhythmia with progressive deteriorating atrial mechanical function (Harvey,
1628). On an electrocardiogram, it is characterized by the replacement of P-waves with
oscillations or fibrillatory waves of various morphologies, often with a rapid ventricular
response that is classically described as irregularly-irregular. The ventricular rate varies
based primarily on the electrophysiology of the AV node. It is modulated by autonomic
tone, drug therapy, and structural changes (Fuster et al., 2011). The typical course of
atrial fibrillation is a ventricular rate higher than sinus rhythm (Prystowsky, 2008).
9
Atrial fibrillation is the most frequent arrhythmia encountered in clinical practice today. It
is an emerging epidemic that carries with it increased risks of thromboembolic stroke,
congestive heart failure, cognitive decline, and premature death. Paroxysmal atrial
fibrillation episodes self-terminate. Persistent atrial fibrillation will not stop
spontaneously but sinus rhythm may be restored with treatment, and permanent atrial
fibrillation occurs when all attempts to restore sinus rhythm have been abandoned. The
natural history is for paroxysmal episodes to increase until they become persistent.
Therefore, atrial fibrillation is a progressive disease that goes through periods where the
episodes of fibrillation can last, for the average patient, for several minutes to several
hours (Fuster et al., 2006). The lifetime risk of developing atrial fibrillation for men and
women over age 40 is 25% (Lloyd-Jones et al., 2004). Moreover, the number of
persons in the United States living with atrial fibrillation is projected to exceed 10 million
by 2050 (Miyasaka et al., 2006). The mechanism for induction and perpetuation of atrial
fibrillation is variable and complex despite it being the most common arrhythmia
encountered in clinical medicine (Richter et al., 2011).
The number of publications relating to the study of atrial fibrillation has increased 8-fold
in a 15 year period (1983-1998) and outpaced the literature of other arrhythmias
(Prystowsky, 2008). Despite this trend, current therapies remain suboptimal. The
advent of both modern drugs that selectively block cardiac ion channels and of
advanced interventional techniques provide a modest degree of risk-reduction in
mortality and morbidity related to long-term atrial fibrillation (Fuster et al., 2011). Highly
effective curative or palliative treatments are, however, still unavailable. Historically, the
10
treatment of atrial fibrillation was focused on converting the rhythm of atrial fibrillation to
sinus rhythm. However, the current treatment consensus is targeted at lowering the
ventricular rate to control the symptoms of atrial fibrillation. This was derived from
multiple studies summarized in the AFFIRM trial that showed no improvement in the
morbidity, and a trend toward lower mortality, among people who remained in atrial
fibrillation with a slower ventricular rate versus those converted to sinus rhythm (Fuster
et al., 2006; Camm et al., 2007; Camm, 2010; Fuster et al., 2011). This strategy leaves
a large population living with an irregular ventricular response. The substantial lifetime
risk coupled with a lack of mechanistic evidence, despite a high level of relevant clinical
publications and a growing population living with stable atrial fibrillation, suggests a
need for further mechanistic studies in model organisms.
It seems paradoxical that the restoration of sinus rhythm from atrial fibrillation would
increase the risk of arrhythmia. However, within an hour after the conversion of
supraventricular tachycardia (with a 76% frequency of atrial fibrillation) to sinus rhythm,
studies have suggested that the incidence of developing repolarization-related
arrhythmia could be as high as 62% (Minardo et al., 1988; Prystowsky, 1996).
Atrial fibrillation is distinct in part due to its irregular ventricular rhythm. The potential
altered risk for RRA, imparted by AF, has not been clinically observed during or
following the termination of other supraventricular tachycardias. Fixed-rate
supraventricular tachycardias as compared to AF have not been noted to have a
decreased incidence of RRA during tachycardia (Martin et al., 2011). Shortly after the
11
termination of atrial fibrillation, there is an increased incidence of RRA; this has not
been observed after other fixed-rate tachycardias. This is true even when controlling for
the average ventricular rates during the tachyarrhythmias (Page et al., 2002). In AF,
patients with similar ventricular rates who were converted into sinus rhythm had a
higher rate of RRA than those who remained in AF (Darbar et al., 2008). Therefore, it is
unclear if these findings represent a protective factor operating through AF or a post-
conversion vulnerability due to the transition to normal sinus rhythm, or both. For
either instance, this suggests that the irregularity, and not the rate, of the tachycardia
may be involved in modulating the post-conversion vulnerability or protection from RRA.
Similarly, if having AF exerts a protective affect by decreasing the risk for the
development of RRA, it follows that after the termination of AF; repolarization is restored
to a more arrythmogenic state and can be detected.
ANTIARRHYTHMIC DRUGS
Many antiarrhythmic drugs carry a proarrhythmic risk of greater than one percent.
Dofetilide, sotalol, and quinidine can produce this cardiotoxic effect by blocking the
delayed rectifier current similarly to terfenadine (Roden et al., 1986; Soyka et al., 1990;
Coplen et al., 1990; Torp-Pedersen et al., 1999; Darpo, 2007) Speculations regarding
the discrepancies between the incidence of RRAs among non-cardiovascular
(<1/10,000) and cardiovascular drugs include the individual characteristics of the
population treated with these drugs, and the magnitude of the QT interval prolongation
(Roden et al., 2007). It is understood that certain populations are more vulnerable:

12
females and patients with pre-existing sarcolemal ion channel dysfunctions
(“channelopathies”), hypokalemia, bradycardia, and/or heart block (Roden, 1998).
Despite these known risks enhancers, some patients have high risks for reasons that
are still unclear. These population characteristics are often not accounted for in human
studies examining the relationship of AF to repolarization, refractoriness, or RRAs,
suggesting that animal models may be needed to more completely understand the
individual factors that modify repolarization and refractoriness (Darpo, 2007).
Many antiarrhythmics modify the ventricular rate, a phenomenon associated with a
modification of repolarization and refractoriness. In animals and humans, low
ventricular heart rates are associated with an increased likelihood for the development
of RRAs (Brandt & Win-Kuang, 1995). It has been suggested that the incidence of RRA
would be negligible above a threshold ventricular rate defined as more than 70
beats/min (Pinski et al., 2002). The QT interval is rate-dependant and prolongs at low
heart rates; therefore it is possible that the QT interval prolongation observed at low
heart rates (or because of a combination of factors or epiphenomenon) imposes
arrhythmia vulnerability.
Women have a higher risk than men for developing RRAs in response to compounds
that prolong cardiac repolarization. At birth, the QT interval adjusted for heart rate is
similar between men and women (Stramba-Badiale, 1995). During and after puberty,
there is a shortening of the QT interval corresponding to a rise in testosterone in males,
which is thought to account for the heightened risk of RRA among females (Rautaharju,
13
1992; James et al., 2007). Further studies show that estrogen like hormones decrease
IKr and testosterone hormones increase IKr expression (Kurokawa, 2008). Sex
hormones also alter the binding properties of drugs to IKr ion channels (James &
Hancox, 2003; Kurokawa, 2008). Recent studies have supported the role of
testosterone in a reduced risk of RRAs in males (Jonsson, 2010): the activation of IKr
channels via testosterone binding to androgen receptors (Ridley, 2008). However,
despite extensive studies, the exact biological basis for these observations has not
been determined (Kurokawa, 2008).
In a recent study, Boulet described a loss-of-function mutation in the KCNQ1 gene that
encodes for the IKs channel in a patient who had episodes of RRA and a normal QT
interval suggesting that repolarization channelopathies may promote RRA but not
manifest repolarization delay (Boulet, 2006). This type of “concealed long QT
syndrome” suggests the need for alternative, clinically practical diagnostic measures of
repolarization that assess the risk for repolarization impairment with high fidelity (Varro
& Papp, 2006). Individuals with genetic abnormalities relating to abnormal
repolarization ion channels may be more at risk for RRA that those with a normal
genetic background.
Hypokalemia and, to a lesser extent, hyperkalemia have been associated with the
development or RRA. Low extracellular potassium increases Ik1 and IKs and reduces
IKr (Yang et al., 1997). These alterations favor QT interval lengthening (Sanguinetti &
14
Jurkiewicz, 1992). IKr blocking drugs when administered to subjects with a potassium
deficiency have been implicated in depressing the repolarizing current (Yang & Roden,
1996). However, this finding seems paradoxical when considering the increase risk for
RRA with high potassium, and therefore recent findings have been questioned
(Limberis, 2006).
REPOLARIZATION IMPAIRMENT
The concept of “repolarization reserve” has emerged in the last 15 years as a theory
(Roden, 1998, 2006, 2008) to explain impairment of repolarization based on multiple
factors responsible for risk or protection from RRAs. This concept has been validated
experimentally (Iost, 1999; Varro, 2000, Lengyel, 2001, Jost, 2005) and has been used
to explain RRAs from complex pharmacology often complicated by systemic disease.
This principle has been attributed to known conditions that modify the risk for the
development of RRAs: drug effects, ion channels, genetic determinates, and certain
diseases. The theory of repolarization reserve is explained by Roden as:
“The concept of “repolarization research,” the idea is that the complexity of
repolarization includes some redundancy. As a consequence, loss of 1
component (such as IKr) ordinarily will not lead to failure of repolarization
(i.e. marked QT prolongation); as a corollary, individuals with subclinical
15
lesions in other components of the system, say IKs or calcium current,
may display no QT change until IKr block is superimposed.” (Roden, 2008)
Recent studies have indicated that repolarization reserved is a dynamically changing
property of cardiac muscle. IKr antagonists, such as dofetilide when incubated with dog
ventricular myocytes elicited shorter action potential duration and blunted dofetilide
induced prolongation (Xiao et al., 2008b). Enhancement of IKs was noted in myocytes
exposed to chronic dofetilide compared to untreated cell during patch-clamp
experiments. The MinK and KvLQT1 protein levels were increased; however, the
mRNA fold change was unaltered, suggesting post-translational regulation. It was also
shown that microRNA was attenuated in cells treated with dofetilide (Luo et al., 2007).
Based on these findings, chronic reduction of IKr leads to upregulation of IKs,
representing an example of feedback of ion channel function.
Repolarization impairments can be difficult to measure and quantify. In the laboratory,
repolarization reserve can be measured by drugs that enhance repolarization (e.g.
veratridine or ATXII). Treatment would be expected to produce action potential
shortening that opposes the potassium channel current. The observed limited action
potential duration predicts, and is correlated to, strong repolarization reserved. IKr
inhibition may also be used for assessing impairment of repolarization and may be
preferable because most drugs that have liability for RRAs, inhibit this current. The
16
evoked repolarization lengthening mainly assesses currents other than IKr where IKr
functioning is preserved (Volders et al., 1999).
Traditional QT interval or QTc measurements from electrocardiograms are likely not
sufficient to fully evaluate repolarization. The addition of other parameters such as
Tpeak to Tend, QT variability index (Thomsen et al., 2004), or short term QT variability
(Berger, 2003) may have value in higher risk patients in the clinic for RRAs.
Pharmacologic tests to evaluate repolarization are an additional option; however, these
types of clinical studies raise ethical concerns in humans related to their risk/benefit
profile (Kilborn et al., 2000).
MOLECULAR DETERMINATES OF REPOLARIZATION
Heart rate, through impulse formation and repolarization, is determined by the
electrophysiology of the cardiac myocytes functioning as individual cells and complexed
with other cells as tissues and organs (figure 1.0). Sarcolemmal membrane proteins
act to transport ions and modulate mechanical stress while responding to internal and
external signals. Protein channels of the myocyte membrane respond to voltage or
ligands that modify the opening, closing, inactivation, and signal processing of the cell.
Specific potassium and calcium channels determine the kinetics of repolarization and
refractoriness. These channels reflect a complex relationship that impacts
arrythmogenesis and are described below.
17
During the short period of time when activation and inactivation coincide, a sodium
current called the Na+ window current can be recorded (Attwell et al., 1979). This fast
sodium current (INa) is largely inactivated within a few milliseconds; however, the
sodium current does not disappear completely during the portion of the action potential
representing repolarization. During the plateau phase, a persistent sodium inward
current, opposing potassium mediated repolarization and delaying complete
repolarization (Carmeliet, 1987). Heart failure, long QT syndrome type 3, as well as the
administration of veratrine or ATXII increase the sodium mediated repolarization
prolongation (Schwartz et al., 1995). The functional change is a decrease in
repolarization reserve, or increase in repolarization prolongation, but with a greater
increase of inward current; therefore, QT interval prolongation may occur.
The calcium current is also involved in repolarization, but the extent of its involvement is
not fully understood and seems to be highly complex. The L-type calcium current (ICaL)
exhibits slow inactivation and a tight dependence on cytosolic calcium concentrations.
Throughout a period of depolarization and repolarization, calcium concentrations cycle
dramatically, regulated by many factors including the sarcoplasmic/endoplasmic
reticulum calcium ATPase, phospholamban, ryanodine receptor, calmodulin, as well as
protein kinase A and C (Bers, 2001). The impact from alterations in these factors is
difficult to predict accurately and remains one of the most elusive targets for action
potential modeling. An examination of increased inward current, including both sodium
and calcium, reveals a shift in the positive direction of the plateau phase imparting an
18
enhancement in activating potassium current, an outward current. This alteration,
depending on the function of other currents, would shorten repolarization.
INCX (NCX) restores low concentration of intracellular calcium during diastole (Blaustein
& Lederer, 1999). As the membrane potential is changing throughout the cardiac cycle,
three sodium ions are exchanged for two calcium ions in a cyclic electrogenic
mechanism that is dependent on intracellular calcium concentrations. Just prior to
depolarization, the intracellular calcium concentration is low, the membrane potential is
negative, and the NCX is outward. During the plateau phase, early/late repolarization
and diastole, the NCX is inward. Under conditions of calcium overload, NCX may act as
a trigger for early/late afterdepolarizations that can contribute to RRAs (Bers et al.,
2002). The NCX is pathologically upregulated during heart failure (Schillinger et al.,
2000). A full understanding of this current is lacking due mainly to the absence of
specific antagonists for the NCX. Bers found that NCX is functionally expressed
differently throughout several regions of the ventricles, resulting in altered transmural
dispersion of repolarization (Xiong et al., 2005). NCX abnormalities in combination with
pathological heart failure, decreased repolarization reserve, and altered dispersion, can
augment the risk for RRAs.
Calcium cycling has regulatory function on a diverse number of ion channels in the
heart. Sodium channels are regulated by calmodulin (Tan et al., 2002) as well as their
short-term density distribution (Casini et al., 2009). Rapid pacing, as a model to induce
a tachycardiomyopathy in a dog, downregulates It0 via the calcium-calmodulin
19
dependent protein kinase II and calcineurin/NFAT system (Xiao et al., 2008).
Calmodulin, along with calcium and calmodulin-dependant protein kinase II, has not
only been shown to regulate It0 (Tessier et al., 1999; Sergeant et al., 2005), but also to
correct channel assembly and gating properties of the delayed rectifier current
(Shamgar et al., 2006; Ghosh et al., 2006). Calcium was also shown to have a role in
regulating the delayed rectifier current in guinea pigs (Tohse et al., 1987) by the
inhibition of the hERG channel (Schönherr et al., 2000). Calmodulin-dependant protein
kinase II has demonstrated effects on the properties of It0 and Ik1 in cardiac disease
(Nerbonne, 2011). The science behind beat-to-beat variability of repolarization is
related to calcium cycling in the chronic AV-block dog model (Oros et al., 2008). Cardiac
repolarization T-wave alternans is associated with alterations of calcium cycling (Pruvot
et al., 2004). These alterations in calcium handling play a clear role in repolarization.
The inward rectifier potassium current (Ik1) operates as an inward rectifier though Kir
2.1, 2.2 and 2.3. The Ik1 decreases as membrane potentials approach zero and
increase as potential become more negative than -30 mV. Matsuda has shown that
magnesium (Mg2+
) and amines from intracellular sources modulate electrogenic
properties (Matsuda et al., 1987). With increasing membrane potentials the Mg2+
or
amine related block is reduced and Ik1 increases. Diastole favors channel opening and
opposes depolarizations from calcium overload-related delayed afterdepolarization or
enhanced automaticity. Dysregulation of these channels favors the triggering of
20
arrhythmias by permitting the threshold for extrasystoles to be met and propagated. A
smaller IKr increases the total repolarization and heterogeneity; however, this
concentration is highly variable between species. Indeed, dogs, guinea pigs, and
rabbits have a strong IKr contribution to repolarization (Varro et al, 1993), while humans
have a weak IKr contribution (Jost et al., 2008). This suggests that these channels play
a small yet important role in human proarrhythmia and in combination with other
channelopathies, alter the risk for RRAs. Andersen-Tawil-syndrome (long QT type 7), a
genetic disorder with a mutation in Kir 2.1, has a high risk for RRA but only a slight QT
interval prolongation (Zhang et al., 2005). Modeling experiments have supported that
Ik1 is important for repolarization homeostasis during late repolarization and diastole
(Ishihara et al., 2009).
The transient outward potassium current (It0) has slow (It0,s) and fast (It0,f) components
with channels consisting of Kv1.4 and Kv4.2/3, respectively. Ito is a large current, at
membrane potentials greater than -20 mV, with rapid kinetics for activating (<2 sec) and
inactivating (5-10 sec) outward currents (Patel & Cambell, 2005). Although Ito largely
contributes to phase 1 depolarization, the role it plays in altering the action potential
duration is limited. Indeed, this current can affect the amplitude of the resultant plateau
phase, thus playing a role in activation, inactivation and deactivation channel kinetics.
Ito has an additional slower phase of depolarization that is responsible for directly
maintaining the plateau of the action potential. The density of these channels varies

21
between the subendocardium, midmyocardium, and subepicardium. This may
contribute to modification of the transmural heterogeneity and the risk for RRA (Litovsky
& Antzelevitch, 1988; Antzelevitch & Fish, 2001). Humans and dogs carry the dominant
alpha subunit protein (Kv4.3), while rabbits carry the Kv1.4 (Fulop et al., 2006; Wang et
al., 1999). This indicates Ito is species dependant. In humans, It0 alone does not lead to
dramatic repolarization changes but may if complexed with other channel dysfunctions.
The slow-delayed rectifier outward potassium current (IKs) activates slowly (0.5-1 sec)
and deactivates rapidly (100-200 msec) at negative potentials throughout the late
plateau phase of the action potential (Jost et al., 2007). It is comprised of KvLQT1,
MinK and MIRP protein subunits. Due to the slow kinetics and low amplitude signal
(<20 mV), under normal conditions, IKs has little influence on the absolute duration of
repolarization (Varro et al., 2000; Jost et al., 2005). According to Carmeliet, under the
influence of a higher membrane voltage and action potential lengthening, IKs acts as a
reserve for additional channels to augment repolarization, and thus is a main contributor
toward repolarization reserve by opposing excessive action potential lengthening
(Carmeliet, 2006). During sympathetic outflow, IKs activation via PKA (in addition to its
normal activation by PKC), increases the IKs amplitude and density of IKs channels,
while decreasing the membrane potential (Yazawa & Kameyama, 1990; Walsh & Kass,
1991). Sympathetic activation also enhances L-type calcium release, shifting
membrane voltages in a positive direction. The IKs may act as a negative feedback
22
element, limiting the extent to which repolarization can be prolonged during high
sympathetic states (Han et al., 2001; Volders et al., 2003). An example is acquired or
congenital long QT 1 (LQT1) syndrome, where an IKs blocking drug or a loss-of-function
mutation, with concomitant sympathetic stimulation, leaves the ICA,L unopposed,
resulting in repolarization prolongation leading to a heightened risk for RRAs (Johnson,
2010). Altered IKs functioning has also been associated with increases in transmural
dispersion of repolarization as demonstrated by the establishment of a link between
increased differences in regional repolarization and the heightened risk for RRAs (Akar
et al., 2002).
The delayed rectifier outward potassium current (IKr) activates rapidly (<40 msec) at
membrane potentials greater than -30 mV. IKr channels are largely closed during the
plateau phase of the action potential, but open when the membrane potentials approach
zero. The kinetics of recovery are quick, enabling each channel to cycle during a single
repolarization interval. Opposite to what one might predict, increased extracellular
potassium concentrations enhance, while decreasing potassium concentrations depress
IKr (Sanguinetti & Jurkiewicz, 1992; Yang et al., 1997). Low potassium concentrations
accentuate internalization and degradation of the channel in rabbit hearts and in human
cell lines (Guo et al., 2009). It has been suggested that IKr may play a role in positive
feedback by contributing toward repolarization lengthening when repolarization is
already prolonged especially do to other factors such as a slow heart rate or
23
channelopathy (Virag et al., 2009). IKr plays a similar role to IK1, although IK1 is optimal
at membrane potentials over a lower range of potentials (Virag et al., 2009). Also, when
action potential durations are lengthened, there is a lower repolarization contribution
from IKr/IK1, further weakening the force of repolarization. This supports the concept of
heightened vulnerability when depolarizing factors (INa, ICa,L, NCX) are increased or
repolarizing factors (IK1, IKs, Na/K ATPase) are decreased. A small reduction in IKr may
cause a significant prolongation in repolarization at slow heart rates or have a
prolongation effect when combined with other contributors to repolarization
prolongation. The delayed rectifier current is thought to be the most important
component to repolarization. In most species, including humans, potent inhibition of IKr
has a substantial influence on repolarization lengthening (Varro et al., 2000; Lengyel et
al., 2001; Jost et al., 2005). Compensatory mechanisms from outward currents play an
important role in the negative feedback on repolarization prolongation, whereby
incomplete inhibition of IKr may not result in detectable repolarization lengthening. IKr is
a major outward current involved in repolarization and because excessive impairment of
IKr leads to RRAs, it represents a primary target for mechanistic studies.
24
ATRIAL FIBRILLATION, REPOLARIZATION-RELATED ARRHYTHMIA
& ANTIARRHYTHMIC DRUGS
It has been clinically noted that repolarization-related arrhythmia is relatively uncommon
during atrial fibrillation (Härtel et al., 1970; Arstall et al., 1992; Faber et al., 1994;
Hohnloser et al., 1995). However, following the successful conversion of atrial
fibrillation to sinus rhythm with antiarrhythmics, it has been observed that the rate of
repolarization-related arrhythmias increase in these patients compared to similar
patients treated for rate control alone (Stambler et al., 1996; McCray et al., 2006;
Darbar & Roden, 2006). A similar finding was shown in a recent systematic study to
identify risk factors for RRA in a large group of subjects. One hundred human subjects
with atrial fibrillation received an intravenous infusion of almokalant, a drug with specific
IKr antagonist effects, and five out of six patients who developed RRA were in the sinus
rhythm group (Houltz et al., 1998). This suggests that a poorly defined characteristic(s)
of atrial fibrillation, or the transition from atrial fibrillation to sinus rhythm, is involved in
modulating the risk of developing RRAs.
Atrial fibrillation is a major disease that often necessitates the initiation of antiarrhythmic
therapy (Darbar & Roden, 2006). Drugs used for the conversion of atrial fibrillation to
sinus rhythm during management often prolong ventricular repolarization via hERG
channel blockade. Blocking the hERG channel prolongs the IKr current, the current that
is principally responsible for ventricular repolarization and represented globally by the
QT interval on the electrocardiogram. In human clinical studies suggesting a protective
25
effect (from RRA development) imparted from atrial fibrillation or a post-conversion
vulnerability following conversion from AF to sinus rhythm, the successful conversion of
atrial fibrillation is often improved by the administration of IKr blockers. Many
antiarrhythmics that have antagonistic properties towards the IKr channel prolong
repolarization and also decrease the ventricular rate, a risk factor for the development of
RRAs. Numerous studies have demonstrated that IKr is an important target for
understanding the mechanism by which repolarization is linked to AF (Kano et al.,
2005). Therefore delayed rectifier antagonism may be a requisite for unmasking
proarrhythmic potential following the termination of atrial fibrillation.
The ventricular heart rate is inversely coupled to the QT interval. Atrial fibrillation
naturally has a ventricular rate higher than a “normal” sinus rhythm. Recent evidence
suggests that the high rate alone may play a protective role from dofetilide induced
RRAs (Oosterhoff, 2010). This is in agreement with the evidence that low ventricular
rate may increase arrhythmia vulnerability (Pinski et al., 2002). Estimates for the risk of
proarrhythmic death following catheter ablative conversion of atrial fibrillation are
approximately 5% (Evans, 1991). However, in clinical studies examining the incidence
of arrhythmia in patients given similar antiarrhythmic drugs for the treatment of atrial
fibrillation, those that remained in atrial fibrillation had a lower incidence of RRA
compared to those who were converted to sinus rhythm, despite having similar
ventricular rates (Darbar et al., 2008). This suggests that rate alone may be insufficient
to account for the potential protection afforded by atrial fibrillation.
26
The fidelity of the change in the QT interval with ventricular rate is not well coupled.
The latency of the QT interval during atrial fibrillation is slow to respond to changes in a
beat-to-beat manner. When the QT interval remained relatively steady during atrial
fibrillation and following conversion to sinus rhythm, prolongation was observed (Choy,
1999; Darbar et al., 2004). This suggests that a mechanism by which irregular
tachypacing alters QT dynamics might require a more complete QT interval
assessment. Because the QT interval is evident on the surface ECG recording and is
commonly monitored in this class of patients, a more thorough understanding could
suggest a convenient method to asses risk in the clinic.
ANIMAL MODEL
Different species have different sets and relative activities of ion channels important to
repolarization. (Hashimoto, 2008). Rats, though convenient for study, do not possess
the IKr (rapidly activating delayed rectifier potassium) current, which is vital to the study
of RRAs (Regan et al., 2005). Other animals have only weak versions of Ito (transient
outward potassium current) (Bachmann et al., 2001). Rabbit’s possess IKr, IKs and Ito;
however, their functional kinetics differs significantly from that of humans (Janse, 2004).
Pigs have repolarization currents similar to humans (IKr, IKs, and Ito) and are large
enough to allow the experimental instrumentation needed for these studies (Salata at
el., 1996). Pigs also have heart rate variability that is similar to humans and dissimilar
to other potential model organisms (Stubhan et al., 2008).
27
In vivo animal studies in pigs provide a better understanding of whole animal physiology
and mechanisms involved in the pathogenesis of atrial fibrillation. There is a body of
arrhythmia literature based on studies in this species, and it is the species closest to
humans in which these experiments are technically feasible. This is in part due to their
surface area to organ ratio and electrophysiology being similar to those of humans
(Rubart et al., 1997; Kates et al., 1984) and in part due to the similarity of the coronary
vessels’ reactivity and adrenergic receptor distribution between pigs and humans, and
dissimilarity to other model systems (Hidaka et al., 1985). Previous studies have used
pigs as a model for the study of drug-induced QT interval prolongation (Kano et al.,
2005). The porcine model also has the distinct feature of developing congestive heart
failure following rapid pacing at rates that approximate those observed in atrial
fibrillation that is similar to that which is seen in humans (Kates et al., 1984; Maisel et
al., 2003).
OVERALL HYPOTHESIS & SPECIFIC AIMS
The overall hypothesis of this project is that tachycardic irregularity alters ventricular
repolarization properties in porcine hearts. Further, this alteration will be consistent with
clinical observations for protection, and post-conversion vulnerability, from RRAs in
patients with atrial fibrillation. The following specific aims (and hypotheses) are
designed to test this overall hypothesis.
28
First Arm - Specific Aim 1
Evaluate and compare models of tachypacing repolarization during
and after fixed and sinusoidal pacing, to random pacing.
Hypothesis
Transient irregular, as compared to fixed and sinusoidal
atrial overdrive tachypacing alters ventricular repolarization
dynamics.
Second Arm - Specific Aim 2
Characterize the pharmacokinetic and QT effect of dofetilide in
domestic pigs.
Third Arm - Specific Aim 3
Evaluate and compare the repolarization effects of dofetilide during
and after sinusoidal and random tachypacing.
Hypothesis
IKr antagonist treatment with dofetilide alters repolarization
dynamics in the presence of irregular tachypacing
differently than its effects during sinusoidal tachypacing.
29
CHAPTER TWO - METHODS
OVERVIEW
Several parameters have been used in the literature to quantify repolarization and the
likelihood of developing RRAs (Sticherling et al., 2000). The absolute QT interval,
corrected QT interval (QTc), variance of the QTc, and the electrocardiographic T wave
segment from peak to end (TpTe) are typical markers of repolarization. In this research
these were measured in domestic pigs before, during, and after periods of tachypacing.
Temporal markers of repolarization were also explored, including the gain parameters of
the QT interval recovery after tachypacing, and sequential-beat QT interval variability
(i.e. Poincare plots). Each was examined immediately following the termination of
tachypacing. The QT variance was examined using an index representing the log-ratio
between the QT interval variability and the heart rate variability, each normalized to the
corresponding mean value. These selections were developed to comprehensively
evaluate repolarization during and after tachypacing in normal and dofetilide treated
pigs. The evaluation of animals given dofetilide was limited to an assessment of
hemodynamic parameters, the QT interval and TpTe duration.
30
ANIMALS
All protocols involving animals were approved by the Michigan State University
Institutional Animal Care and Use Committee (IACUC); a facility accredited by the
Association for Assessment and Accreditation of Laboratory Animal Care International
that conforms to the Guide for the Care and Use of Laboratory Animals (NIH Publication
No. 85-23, revised 1996). Female farm pigs weighing 35 (+4) kg were used in most
experiments. The time control animals to test the final specific aim of this project
included two males in the cohort. In animals given dofetilide, pigs weighing 46 (+6) kg
were used due to animal availability. These animals were acquired from the Michigan
State University Swine Teaching and Research Facility and were approximately 3-4
months old and not sexually mature. After arrival, pigs were acclimatized for at least
one day under controlled temperature and humidity conditions with alternate 12 hour
light-dark cycles. Pigs were monitored daily and offered water ad libitum and food twice
per day. The animals enrolled in these studies were checked regularly by licensed
veterinarians, veterinary technicians and staff of the vivarium of Michigan State
University.
All procedures were performed in fully anesthetized pigs using approved anesthetics for
induction and maintenance. In pigs, a lack of response to mild noxious stimuli and
muscle tone was used to assess the initial state of anesthesia. During the study,
appropriate depth of anesthesia was monitored by the stability of heart rate,
temperature, respiratory rate and arterial pressure. Following surgery, all animals were
31
euthanized by administration of an overdose of sodium pentobarbital (100mg/kg). This
method is consistent with the recommendations of the Panel on Euthanasia of the
American Veterinary Medical Association (2013 edition).
Sedatives or additional anesthesia adjuvants, utilized to facilitate induction of
anesthesia, can alter ion channel function. Therefore, such premedications were not
used because normal electrophysiology, an important factor in this study, could be
altered. For induction of anesthesia, pigs were exposed to isofluorane (5%) using a
mask, brought to a suitable plane of anesthesia, for subsequent endotracheal
intubation. Anesthesia was maintained using an inhaled isoflurane/oxygen mixture
(2.75+0.5%). Animals were placed on a ventilator with a tidal volume (450+100ml) and
rate (19+3breaths/min) adjusted to maintain a near normal end tidal pCO2 (Datascope
Corp, Paramus, NJ) of 35-45 Torr. A 22-gauge catheter-over needle through the ear
vein was utilized to obtain peripheral intravenous access. Intravenous isotonic fluid
(Lactated Ringers) was given as a maintenance infusion (2.2ml/kg/hour) to account for
sensible and insensible fluid loss.
The neck’s vessels were exposed via a minor surgical approach. The right external
jugular vein and carotid artery were isolated. The artery was cannulated with a 10F
double lumen sheath and the vein cannulated with a 14F triple lumen catheter. These
venous ports were used for the insertion of the high right atrial (HRA), right ventricular
electrogram (RVe) and right ventricular (RV) Millar pressure catheter. Left ventricular
pressures were acquired with a Millar solid state pressure transducer catheter (Millar
32
Instruments, Houston, TX), advanced through the carotid artery, amplified (Grass
Instruments, Warwick, RI) and collected at a sample rate of 1 kHz. The left (LVe) and
right (RVe) ventricular electrograms were acquired using a dacron electrophysiology
catheter (St. Jude Medical, Minneapolis, MN) advanced into the right and left ventricular
apex. The femoral vessels were accessed percutaneously to place a 5F and 7F size
single lumen catheter into the artery and vein, respectively. The femoral vein was used
for blood collection and the reinfusion of isotonic normal saline (0.9% NaCl) for volume
replenishment. The femoral artery was used for peripheral cardiac blood pressure
recording using a solid-state external pressure transducer calibrated to mercury. When
adequate access to the femoral artery was not possible, access to a second carotid
artery was substituted.
Standard surface electrocardiographic leads were collected, including lead V1. All
catheter positions were confirmed with fluoroscopy and the voltage for atrial pacing
stimulation (SD9 – Grass Produce Group, W Warwick, RI) was established based on
doubling the pacing threshold.
HIGH RIGHT ATRIAL TACHYPACING
Central to the first arm of studies in this dissertation is high right atrial pacing which
involves fixed, sinusoidal, and random pacing (Figure 2.0). These three types of pacing
had the same duration and same average heart rate. Sinusoidal and random pacing
had the same variance (+1.2%). The fixed rate pacing is performed at a constant cycle
33
length that is equal to the average for sinusoidal and random pacing. The “random”
pacing type was a uniformly distributed pseudorandom pattern bounded by the peak
and nadir of the sinusoidal R-R intervals. The sinusoidal pattern of pacing is based on
an average heart rate, high enough so that the nadir of the wavelength is higher than
the animals’ natural heart rate. Otherwise, extra beats could occur that could
complicate data interpretation. The range of heart rate values was selected based on
those commonly encountered during paroxysmal atrial fibrillation. The frequency of the
sinusoidal pattern was selected based on the respiratory frequency in a relaxed subject
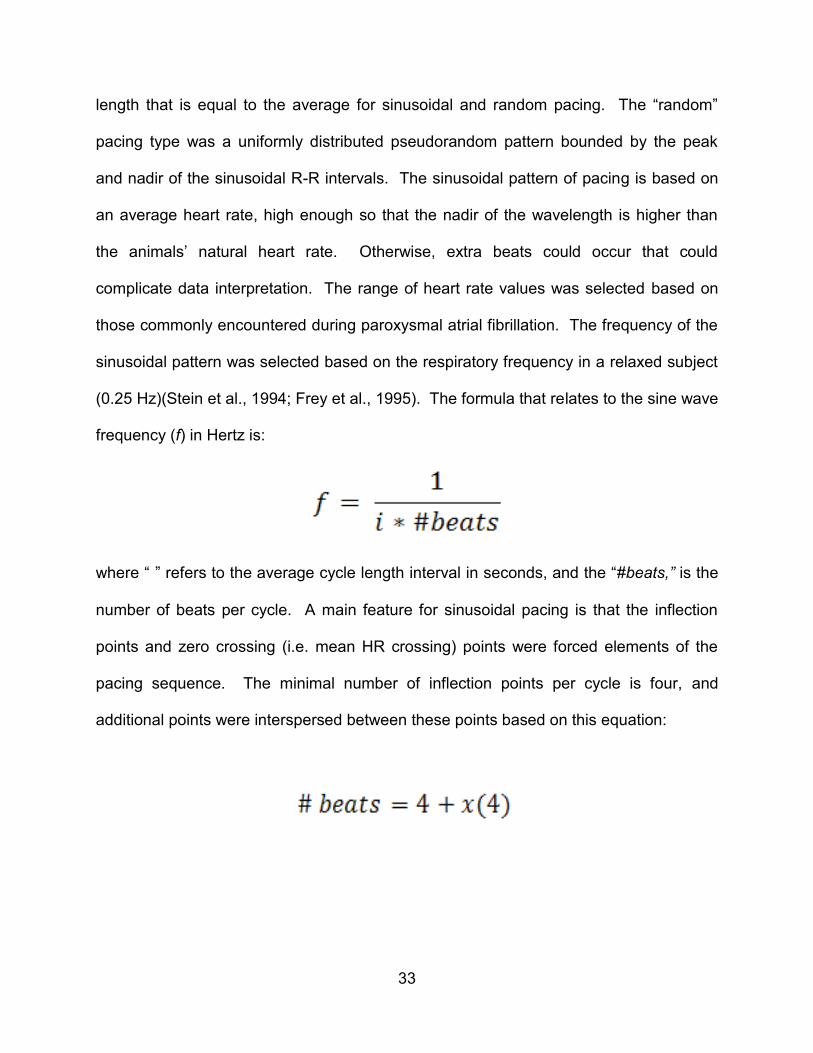
(0.25 Hz)(Stein et al., 1994; Frey et al., 1995). The formula that relates to the sine wave
frequency (f) in Hertz is:
where “ ” refers to the average cycle length interval in seconds, and the “#beats,” is the
number of beats per cycle. A main feature for sinusoidal pacing is that the inflection
points and zero crossing (i.e. mean HR crossing) points were forced elements of the
pacing sequence. The minimal number of inflection points per cycle is four, and
additional points were interspersed between these points based on this equation:

34
where “ ” refers to the number of interspersed beats that are zero or positive integers.
The more beats per cycle, the more closely this pacing sequence mimics a true sine
wave, and the lower the frequency for any given average cycle length.
35
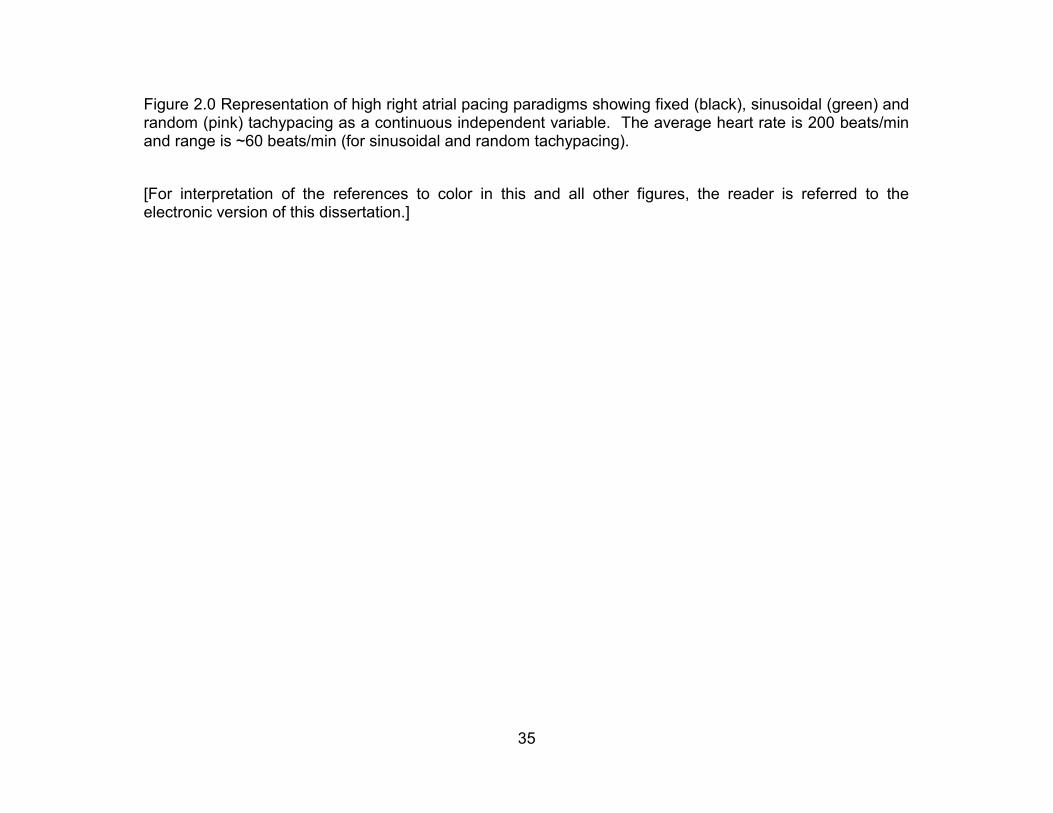
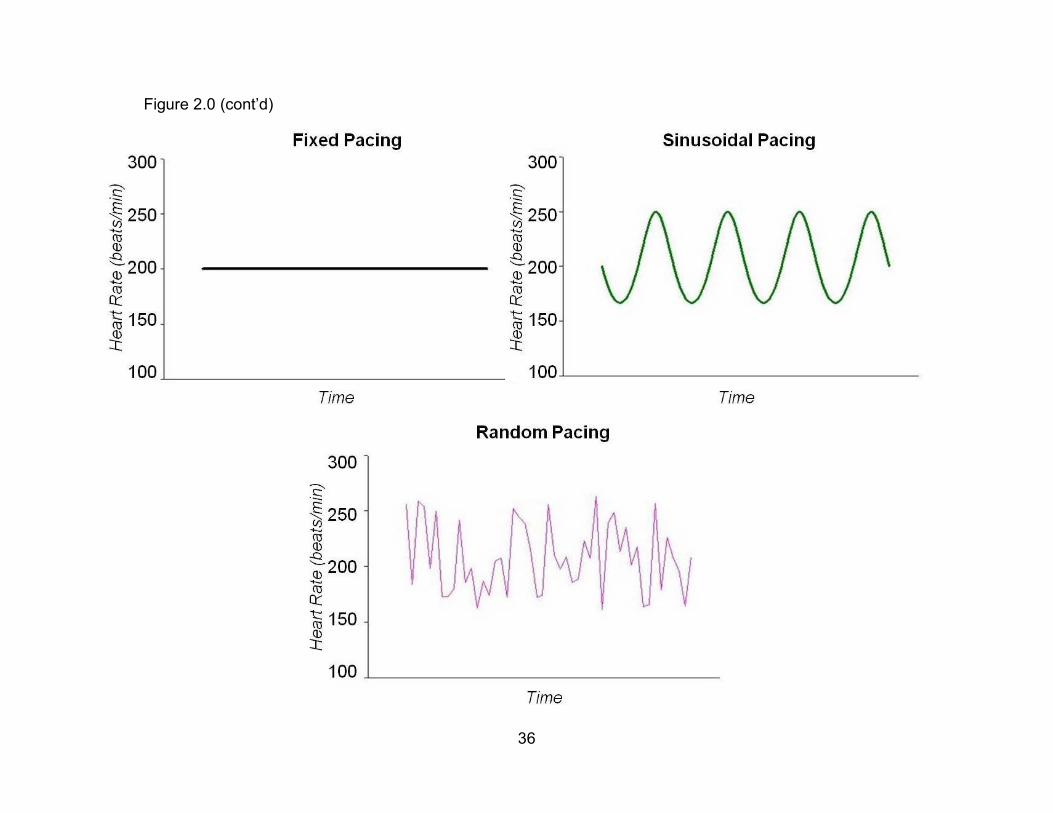
Figure 2.0 Representation of high right atrial pacing paradigms showing fixed (black), sinusoidal (green) and random (pink) tachypacing as a continuous independent variable. The average heart rate is 200 beats/min and range is ~60 beats/min (for sinusoidal and random tachypacing).
[For interpretation of the references to color in this and all other figures, the reader is referred to the electronic version of this dissertation.]
36
Figure 2.0 (cont’d)
37
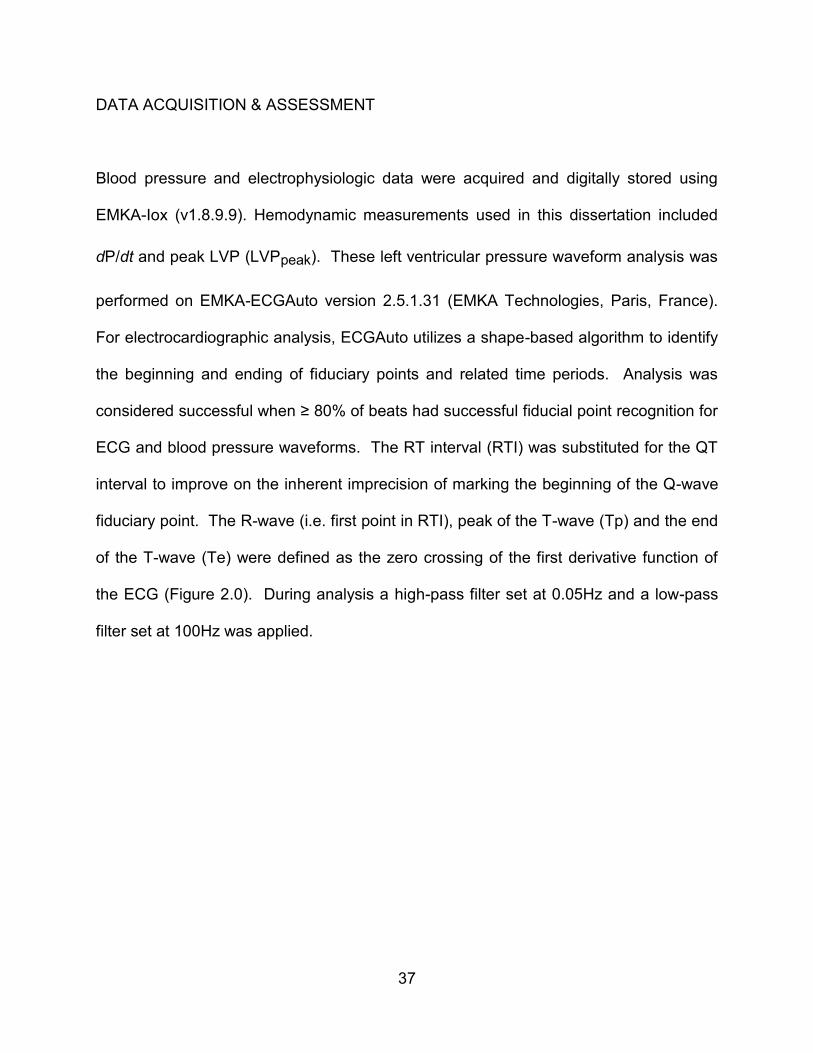
DATA ACQUISITION & ASSESSMENT
Blood pressure and electrophysiologic data were acquired and digitally stored using
EMKA-Iox (v1.8.9.9). Hemodynamic measurements used in this dissertation included
dP/dt and peak LVP (LVPpeak). These left ventricular pressure waveform analysis was
performed on EMKA-ECGAuto version 2.5.1.31 (EMKA Technologies, Paris, France).
For electrocardiographic analysis, ECGAuto utilizes a shape-based algorithm to identify
the beginning and ending of fiduciary points and related time periods. Analysis was
considered successful when ≥ 80% of beats had successful fiducial point recognition for
ECG and blood pressure waveforms. The RT interval (RTI) was substituted for the QT
interval to improve on the inherent imprecision of marking the beginning of the Q-wave
fiduciary point. The R-wave (i.e. first point in RTI), peak of the T-wave (Tp) and the end
of the T-wave (Te) were defined as the zero crossing of the first derivative function of
the ECG (Figure 2.0). During analysis a high-pass filter set at 0.05Hz and a low-pass
filter set at 100Hz was applied.
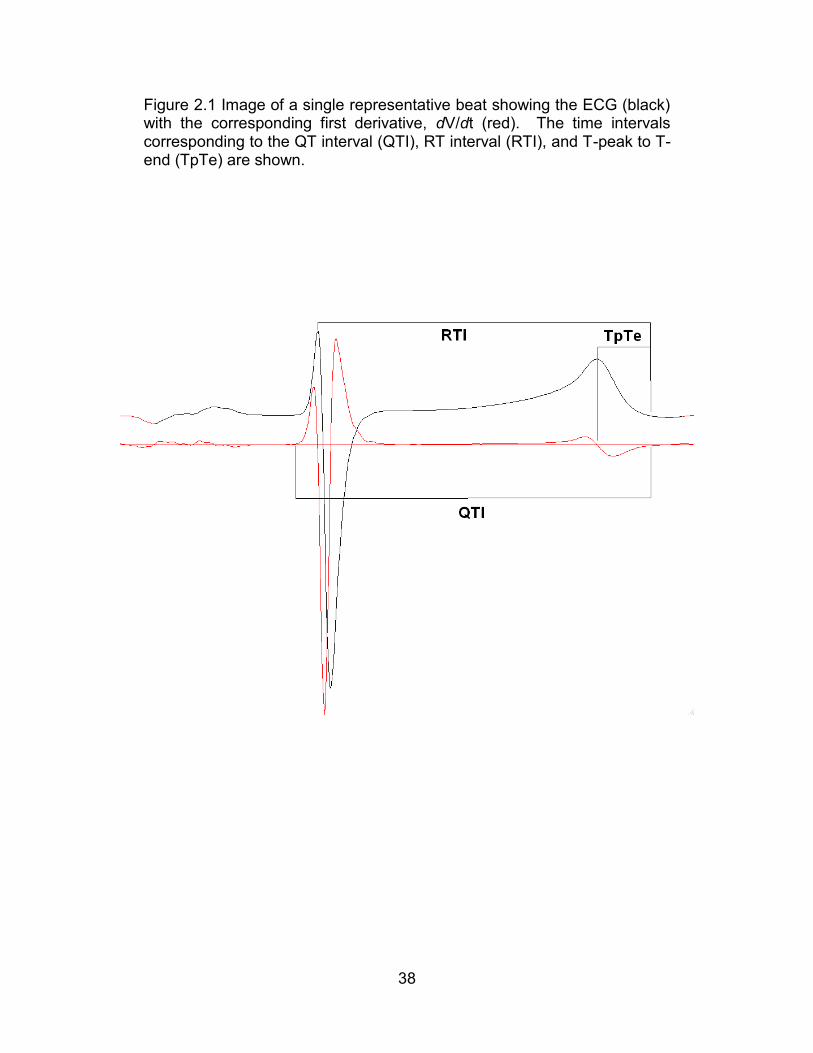
38
Figure 2.1 Image of a single representative beat showing the ECG (black) with the corresponding first derivative, dV/dt (red). The time intervals corresponding to the QT interval (QTI), RT interval (RTI), and T-peak to T-end (TpTe) are shown.
39
QT INTERVAL ASSESSMENT
Clinically, repolarization is measured using the QT interval of the electrocardiogram.
Replacing the QT interval with the RT interval (peak of R-wave to T-end) has the
advantage of being able to easily mark the beginning of the interval and avoids a
potential measurement error in QT interval determination. However, as illustrated in
Figure 2.1, the RT interval leaves out a portion of the QT interval corresponding to a
section of the QRS duration. The QRS duration is the portion of the ECG that is a
surrogate for whole heart depolarization. In any given complex, the QT and RT interval
should be similar, and if they are not, it suggests a measurement error from alterations
in depolarization rather than repolarization. For simplicity, the term QT is used in the
remainder of this dissertation to refer to either QT (other studies) or RT (these studies)
intervals.
QT INTERVAL CORRECTION
The duration of repolarization is heart rate dependent; the faster the ventricular rate, the
shorter the duration of repolarization. The QT interval has been mathematically related
to the proceeding cardiac cycle length in an effort to correct for changes in heart rate.
These correction formulas were developed so that QT intervals, measured at various
heart rates in humans or animal models, could be conveniently compared (Figure 2.2).
The heart rate corrected QT interval has been validated utilizing experimental (Vincze et
al., 2008; Farkas et al., 2009) and clinical (Schoenwald & Isaacs, 1974) data.
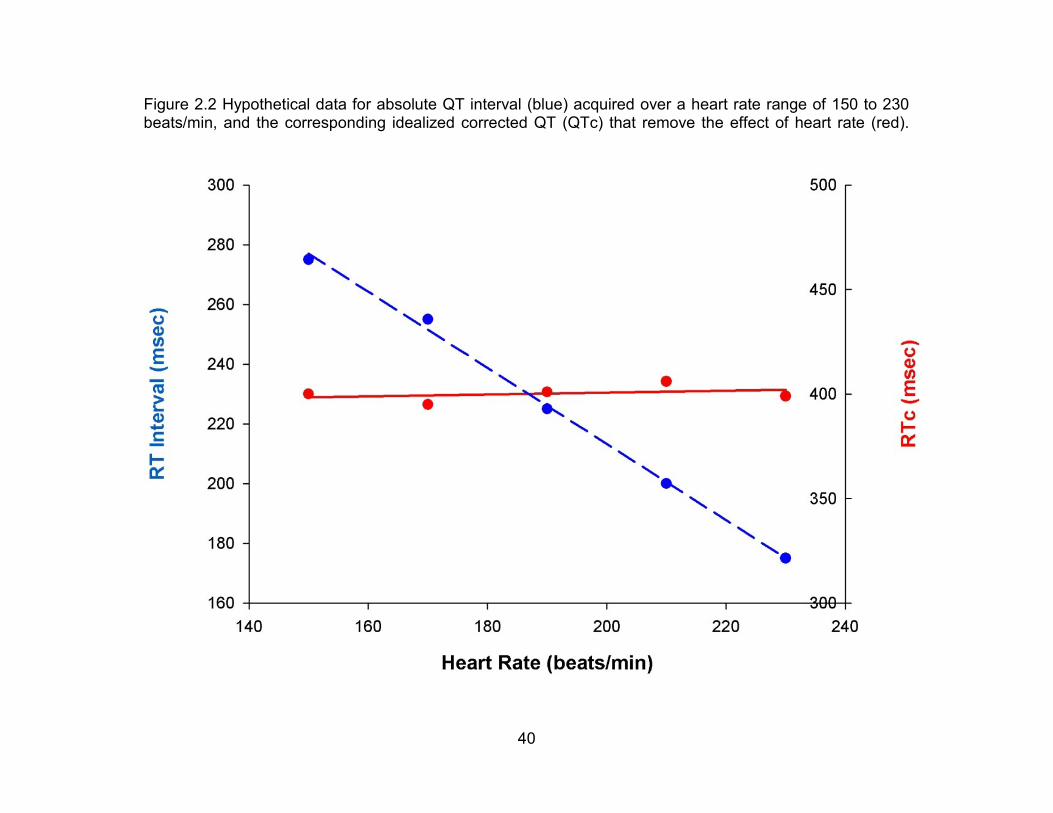
40
Figure 2.2 Hypothetical data for absolute QT interval (blue) acquired over a heart rate range of 150 to 230 beats/min, and the corresponding idealized corrected QT (QTc) that remove the effect of heart rate (red).
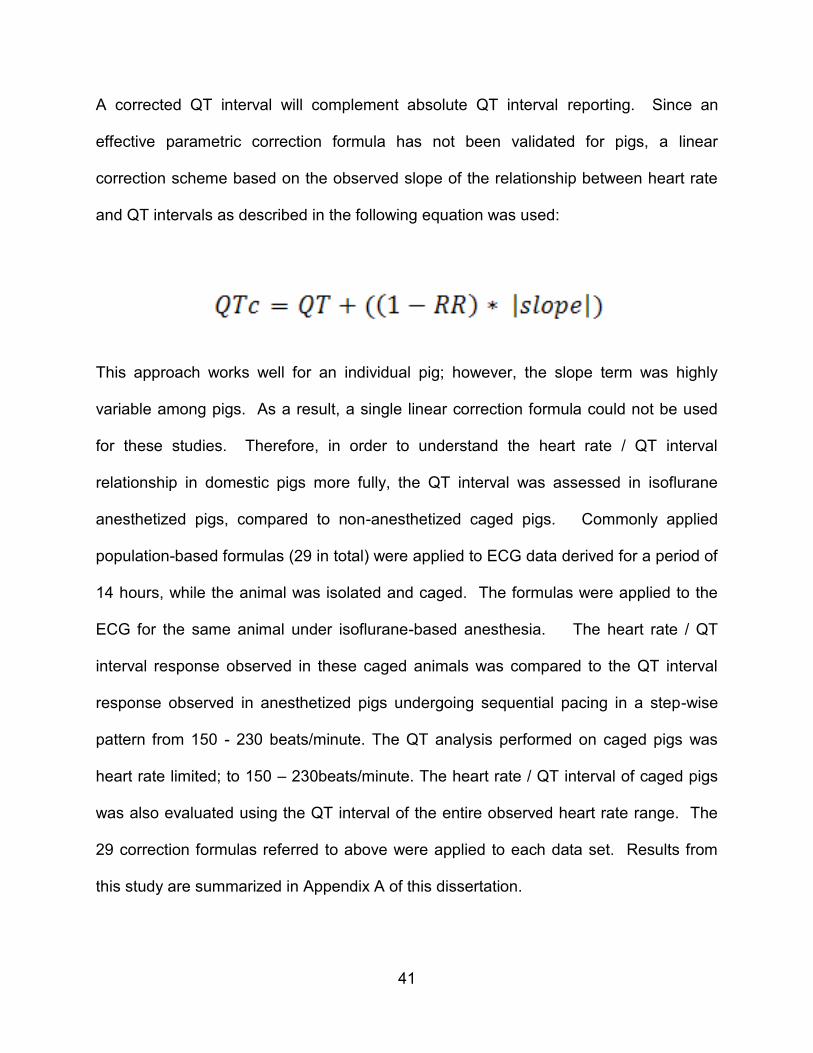
41
A corrected QT interval will complement absolute QT interval reporting. Since an
effective parametric correction formula has not been validated for pigs, a linear
correction scheme based on the observed slope of the relationship between heart rate
and QT intervals as described in the following equation was used:
This approach works well for an individual pig; however, the slope term was highly
variable among pigs. As a result, a single linear correction formula could not be used
for these studies. Therefore, in order to understand the heart rate / QT interval
relationship in domestic pigs more fully, the QT interval was assessed in isoflurane
anesthetized pigs, compared to non-anesthetized caged pigs. Commonly applied
population-based formulas (29 in total) were applied to ECG data derived for a period of
14 hours, while the animal was isolated and caged. The formulas were applied to the
ECG for the same animal under isoflurane-based anesthesia. The heart rate / QT
interval response observed in these caged animals was compared to the QT interval
response observed in anesthetized pigs undergoing sequential pacing in a step-wise
pattern from 150 - 230 beats/minute. The QT analysis performed on caged pigs was
heart rate limited; to 150 – 230beats/minute. The heart rate / QT interval of caged pigs
was also evaluated using the QT interval of the entire observed heart rate range. The
29 correction formulas referred to above were applied to each data set. Results from
this study are summarized in Appendix A of this dissertation.
42
The efficacies of the corrections were assessed as the slope of the residual QTc versus
heart rate relationship. Perfect correction is indicted by a residual slope of zero. The
magnitude of the error was strongly influenced by the success in attaining a residual
slope of zero. As the heart rate deviates from 60 beats/min, the greater the magnitude
of the error. Slopes at heart rates of 150 beats/min or greater would correlate to an
unacceptable risk if they resulted in errors greater than 6 msec (King et al. 2006).
The initial evaluation using these formulas yielded results suggesting that there is a high
degree of intra and inter-animal variability in correction efficacy. The error introduced by
using the correction formulas was unacceptable for experimental studies due to this
large variation.
Therefore, the absolute QT intervals were used when comparing repolarization
parameters among pacing types. For the evaluation of dofetilide pharmacokinetics
(Chapter 4), and the evaluation of sinusoidal and random tachypacing with dofetilide
treatment (Chapter 5), fixed-rate pacing was used before and after periods when
sinusoidal or random tachypacing did not occur. This use of fixed-rate pacing stabilizes
the heart rate and alleviates the need for the use of heart rate correction formulas.
ASSESSMENT OF REPOLARIZATION DISPERSION
The interval from the peak of the T-wave to the end of the T-wave (TpTe) can serve as
an index of transmural dispersion of repolarization (Antzelevitch, 2001). Increased
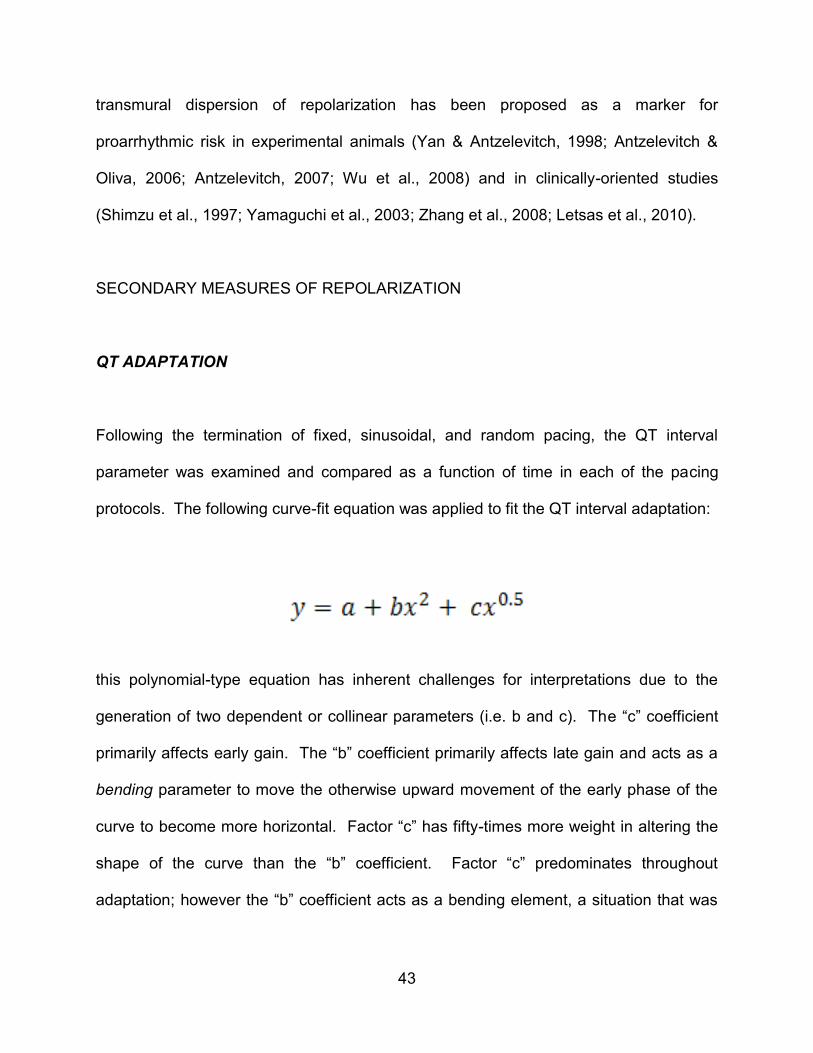
43
transmural dispersion of repolarization has been proposed as a marker for
proarrhythmic risk in experimental animals (Yan & Antzelevitch, 1998; Antzelevitch &
Oliva, 2006; Antzelevitch, 2007; Wu et al., 2008) and in clinically-oriented studies
(Shimzu et al., 1997; Yamaguchi et al., 2003; Zhang et al., 2008; Letsas et al., 2010).
SECONDARY MEASURES OF REPOLARIZATION
QT ADAPTATION
Following the termination of fixed, sinusoidal, and random pacing, the QT interval
parameter was examined and compared as a function of time in each of the pacing
protocols. The following curve-fit equation was applied to fit the QT interval adaptation:
this polynomial-type equation has inherent challenges for interpretations due to the
generation of two dependent or collinear parameters (i.e. b and c). The “c” coefficient
primarily affects early gain. The “b” coefficient primarily affects late gain and acts as a
bending parameter to move the otherwise upward movement of the early phase of the
curve to become more horizontal. Factor “c” has fifty-times more weight in altering the
shape of the curve than the “b” coefficient. Factor “c” predominates throughout
adaptation; however the “b” coefficient acts as a bending element, a situation that was
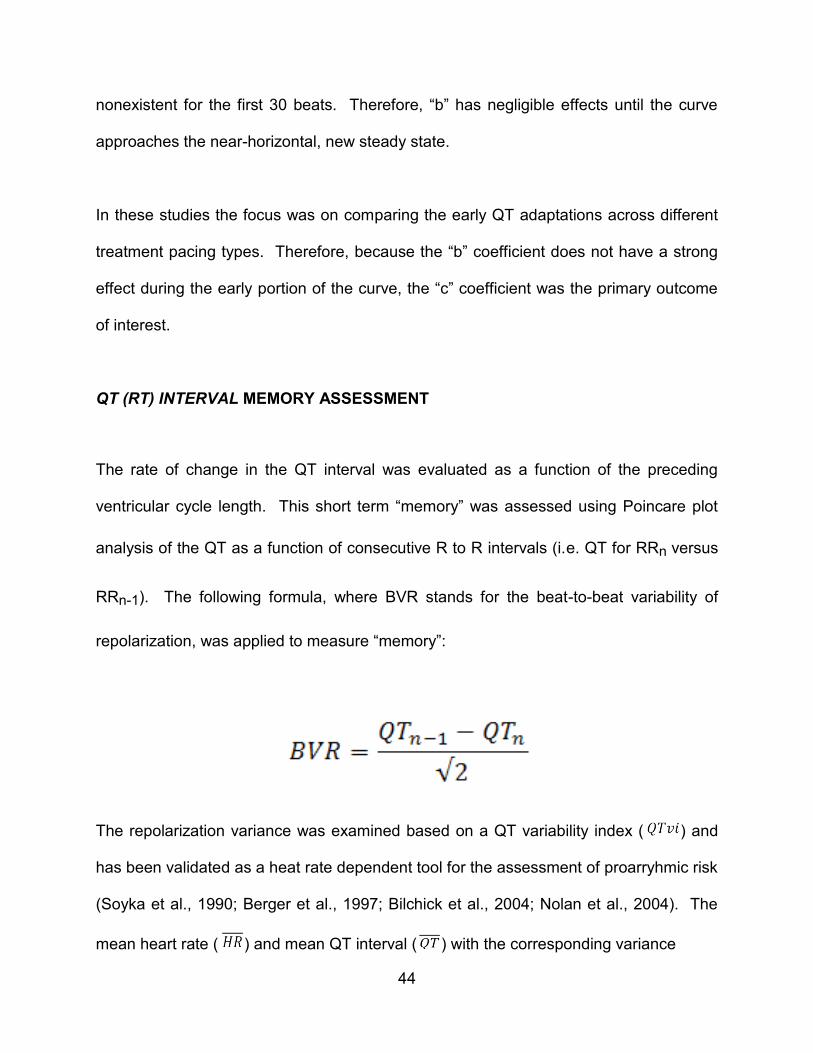
44
nonexistent for the first 30 beats. Therefore, “b” has negligible effects until the curve
approaches the near-horizontal, new steady state.
In these studies the focus was on comparing the early QT adaptations across different
treatment pacing types. Therefore, because the “b” coefficient does not have a strong
effect during the early portion of the curve, the “c” coefficient was the primary outcome
of interest.
QT (RT) INTERVAL MEMORY ASSESSMENT
The rate of change in the QT interval was evaluated as a function of the preceding
ventricular cycle length. This short term “memory” was assessed using Poincare plot
analysis of the QT as a function of consecutive R to R intervals (i.e. QT for RRn versus
RRn-1). The following formula, where BVR stands for the beat-to-beat variability of
repolarization, was applied to measure “memory”:
The repolarization variance was examined based on a QT variability index ( ) and
has been validated as a heat rate dependent tool for the assessment of proarryhmic risk
(Soyka et al., 1990; Berger et al., 1997; Bilchick et al., 2004; Nolan et al., 2004). The
mean heart rate ( ) and mean QT interval ( ) with the corresponding variance
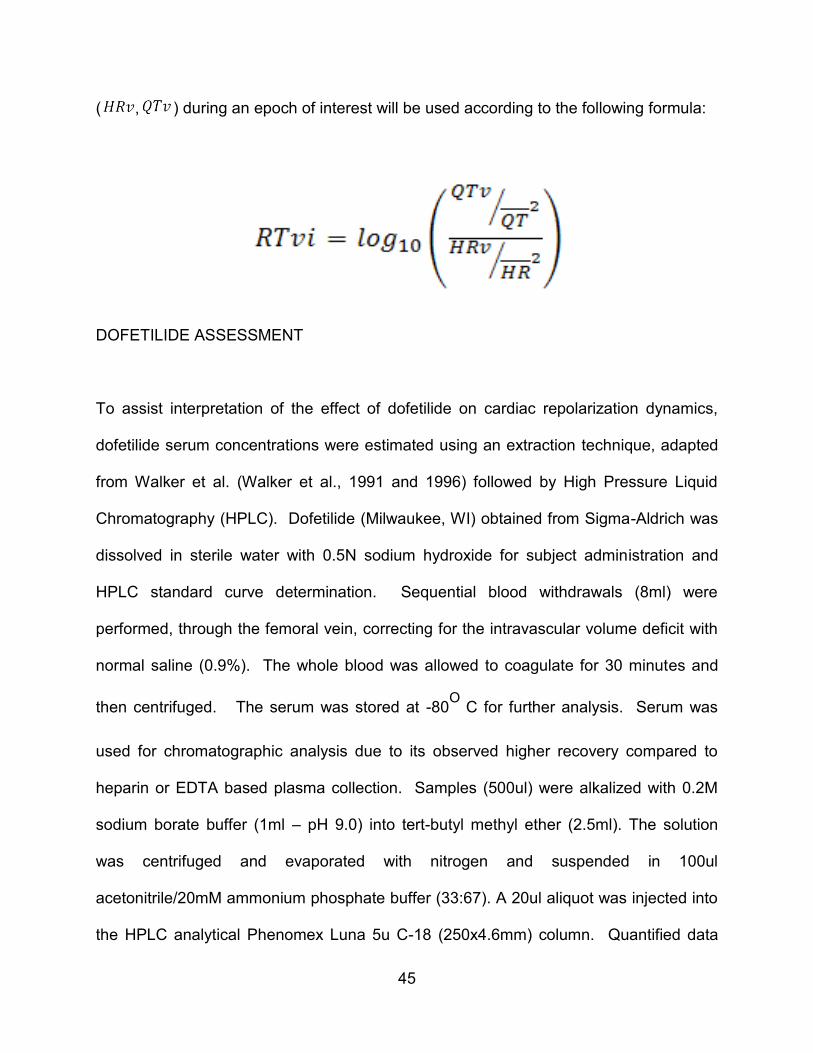
45
( , ) during an epoch of interest will be used according to the following formula:
DOFETILIDE ASSESSMENT
To assist interpretation of the effect of dofetilide on cardiac repolarization dynamics,
dofetilide serum concentrations were estimated using an extraction technique, adapted
from Walker et al. (Walker et al., 1991 and 1996) followed by High Pressure Liquid
Chromatography (HPLC). Dofetilide (Milwaukee, WI) obtained from Sigma-Aldrich was
dissolved in sterile water with 0.5N sodium hydroxide for subject administration and
HPLC standard curve determination. Sequential blood withdrawals (8ml) were
performed, through the femoral vein, correcting for the intravascular volume deficit with
normal saline (0.9%). The whole blood was allowed to coagulate for 30 minutes and
then centrifuged. The serum was stored at -80O
C for further analysis. Serum was
used for chromatographic analysis due to its observed higher recovery compared to
heparin or EDTA based plasma collection. Samples (500ul) were alkalized with 0.2M
sodium borate buffer (1ml – pH 9.0) into tert-butyl methyl ether (2.5ml). The solution
was centrifuged and evaporated with nitrogen and suspended in 100ul
acetonitrile/20mM ammonium phosphate buffer (33:67). A 20ul aliquot was injected into
the HPLC analytical Phenomex Luna 5u C-18 (250x4.6mm) column. Quantified data
46
was interpreted at 230nm. The extraction efficiency and limit of detection was
established based upon an experiment using serum, exposed to excess dofetilide, just
prior to the execution of the extraction procedure (Chapter 4). The chromatograms
were integrated with Waters Millennium system (2000 version).
DATA & STATISTICAL ANALYSIS
Throughout this dissertation, results are presented in customary units unless otherwise
specified. Units of heart rate are beats per minute (beats/min), pressure in millimeters of
mercury (mmHg), myocardial contractility as a first derivative of pressure with respect to
time (dP/dt), and time in minutes (min) or milliseconds (msec). Data are presented
using the mean as the measure of central tendency and standard error of the mean
(SEM) as the measure of dispersion.
Some comparisons involve repeated measures over time. A repeated measures
analysis of variance (ANOVA) was used for these analyses. In some cases these
repeats over time span substantially different physiologic conditions such as unpaced,
pacing at 150 beats/min, and tachypacing. In these instances, repeated measures
ANOVA analyses were restricted to data within a condition. For example, data were
occasionally collected during baseline, during pacing at 150 beats/min, during test
tachypacing, and during the post-tachypacing period. Rather than consider all of this a
one-factor repeated measures design spanning all experimental conditions, analyses
were restricted to like conditions (i.e. repeated measures during test tachypacing).
47
When comparisons involve time or groups as factors, differences were assessed by a
repeated measures ANOVA with Fisher’s Least Significant Differences used for post
hoc testing if needed. Interactive effects were tested using linear contrasts. When only
two groups or times were compared, a student’s t-test was considered sufficient for the
analysis. A statistically significant difference was defined as a nominal type 1 error rate
of less than 5% (p<0.05).
48
CHAPTER THREE – THE EFFECT OF TACHYCARDIC IRREGULARITY ON
VENTRICULAR REPOLARIZATION DYNAMICS IN NORMAL DOMESTIC PIG
INTRODUCTION
It is difficult to create a controlled study in humans with atrial fibrillation due to a milieu
of disparate intra-subject characteristics. This is complicated by ethical limitations on
human experimentation. Therefore, controlled studies in animals were needed to more
fully manipulate cardiac rate and regularity in order to evaluate and describe its effects
on cardiac repolarization. Domestic pigs were selected for study in part because they
are suitably sized to allow for catheter manipulation and invasive electrophysiology
studies. More importantly, pigs are similar to humans with regard to major
depolarization and repolarization currents. Current animal models that mimic atrial
fibrillation have several undesirable characteristics. They rely on the creation of a
structurally abnormal heart with drugs, vascular occlusion or a combination of both.
These hearts are structurally abnormal and often require the co-treatment with drugs
that frequently alter the hearts electrophysiology. These features, coupled with the
unpredictable and often transient nature of the atrial fibrillation necessitates a more
controlled animal model. Our model of temporary atrial overdrive pacing was designed
to study the effects of tachypacing on the hearts’ repolarization. It has the advantage of
being able to control the onset and termination of tachypacing independent of additional
49
drugs. One limitation is that it does not accurately mimic the atrial hemodynamics of
naturally occurring atrial fibrillation: It has a partially preserved atrial contraction.
Reductionism approaches a scientific question relying on the assumption that the
behavior of a component tissue or cell, when extrapolated to the whole organism, will
organize in a non-complex way. Reductionisms’ approach has added considerably to
the body of scientific knowledge and has posed many interesting hypotheses. These
hypotheses can only be properly explored and found to be valid for an organism if they
are tested in an organismal model. Indeed, mathematical models are unavailable to
explore this complex system because modeling requires the assumption that the parts
of a system summate to the whole: An assumption that is not currently consistent with
reality. Whole animals also have an intact central nervous system and mechanoelectric
feedback operating through both intra and extra-cardiac ganglia. Whole animal studies,
by using minimally invasive techniques, can control extra-cardiac effects that play a role
in modifying cardiac repolarization.
This arm of study is designed to study the effects of fixed rate, sinusoidal and random
pacing on typically used repolarization parameters and how these parameters change
over time. This line of study is designed to test the hypothesis that transient irregular,
as compared to fixed and sine wave overdrive atrial tachypacing alters ventricular
repolarization dynamics.
50
SPECIFIC METHODS
Domestic pigs (n=7) were anesthetized with isoflurane and instrumented as previously
described. The basic protocol is outlined in Figure 3.0. Animals were allowed to
develop a stable hemodynamic (blood pressure and heart rate) baseline after animal
preparations were completed. Thereafter, baseline data were collected for 30 minutes.
High right atrial pacing was performed in order to simulate the random ventricular
response observed during atrial fibrillation, the fixed response as seen with fixed-rate
tachycardias and sinusoidal to control for the variation of random pacing. This
technique of tachypacing was used to test the main hypotheses in this chapter: random
pacing alters ventricular repolarization differently than fixed or sinusoidal pacing. The
advantage of high right atrial pacing is that the depolarization current travels though the
His-Purkinje system similarly to atrial fibrillation. However, this is a limited model of
atrial fibrillation because it does not account for the observed loss of atrial contraction
during atrial fibrillation. Pacing stimuli were applied to high right atrium for 60 minutes
and randomized into three groups: Fixed, sine and random pacing. Each subject
received all three pacing treatments. Fixed rate pacing was delivered at a rate of 200
beats/min (CL: 300 milliseconds) while sinusoidal pacing was delivered at a mean rate
of 200 beats per minute with a frequency of 0.25 Hertz and a range of 60 beats/min.
Random pacing was a uniform pseudo-random sequence distributed around a mean of
200 beats per minute with a variance similar to that of a sine wave pacing protocol
(Figure 3.1).

51
Figure 3.0 Protocol to assess repolarization alteration following fixed, sinusoidal or random pacing, applied to each animal in random sequence.

52
Figure 3.1 Diagrammatic representation of high right atrial pacing
paradigms ( :300) showing fixed (black), sinusoidal (green) and random (pink) tachypacing.

53
DATA
CHARACTERIZATION OF AN EXPERIMENTAL MODEL FOR STUDYING CARDIAC
REPOLARIZATION
Electrical and mechanical coupling was confirmed during pacing (Figure 3.2).
Ventricular rates were selected based on being reasonable physiologic rates
encountered during atrial fibrillation in the domestic pig as well as being higher than the
resting heart rate of anesthetized pig; however, not excessively high as to induce
atrioventricular nodal blockade.
EVALUATION OF THE EFFECT OF REPETITIVE PACING ON THE PRE-PACING
BASELINE INHERENT VENTRICULAR RATE
Having shown the feasibility of high right atrial pacing to induce fixed, sine wave and
random ventricular capture, we next apply this to a cohort of animals. The QT interval
changes with the heart rate in a reciprocal fashion. Therefore tachypacing for a period
will alter the QT interval. The order of protocols (fixed, sine wave or random) within
each experiment (pig) was randomized. Due to the potential of the heart rate to
fluctuate based on the preceding tachypacing protocol, it is important to check whether
inherent ventricular rate changes prior to each pacing protocol. The summary of this
analysis is contained in Figure 3.3 and Table 3.0. There was no significant difference in
pre-pacing cycle lengths between each pacing type (p=0.39): Pre-fixed pacing (PreFP),
Pre-sine wave pacing (PreSP) and Pre-random pacing (PreRP).
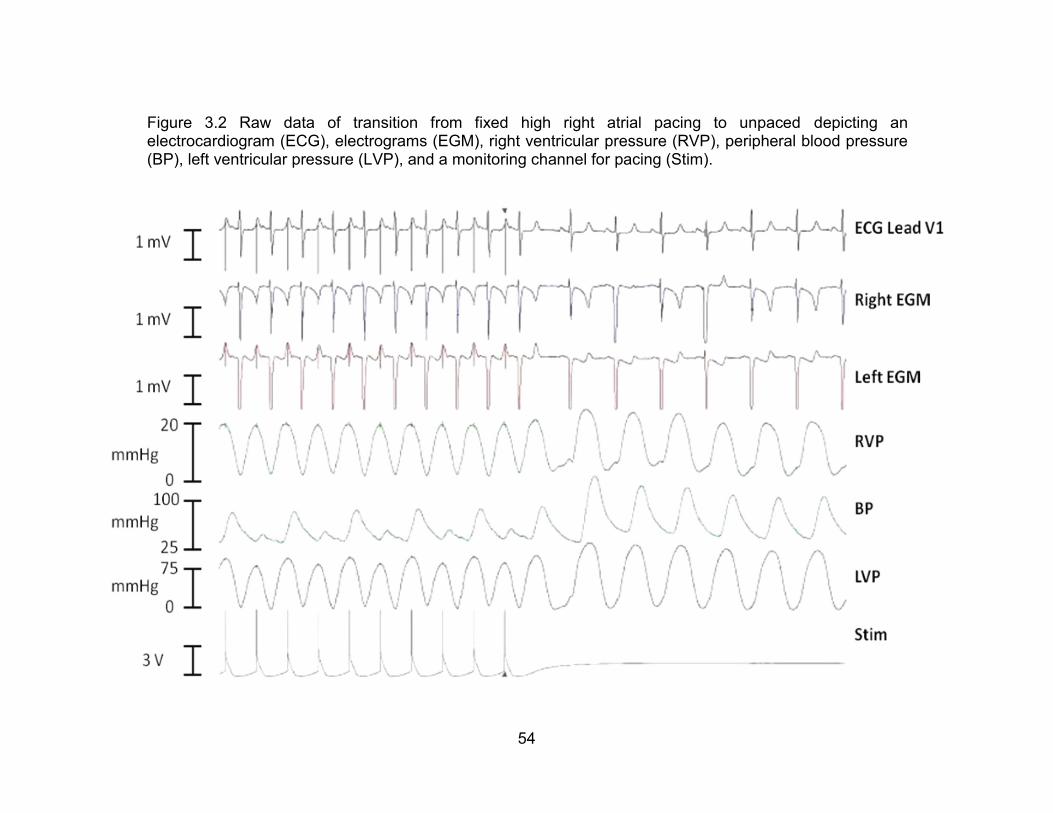
54
Figure 3.2 Raw data of transition from fixed high right atrial pacing to unpaced depicting an electrocardiogram (ECG), electrograms (EGM), right ventricular pressure (RVP), peripheral blood pressure (BP), left ventricular pressure (LVP), and a monitoring channel for pacing (Stim).
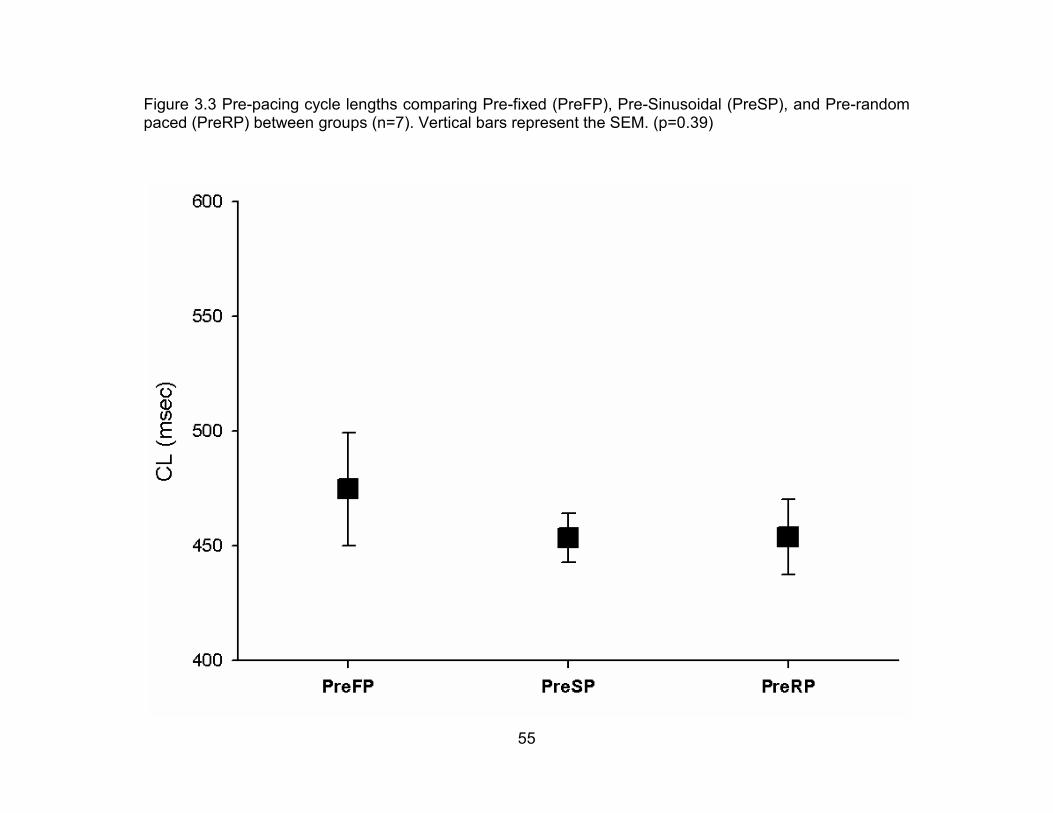
55
Figure 3.3 Pre-pacing cycle lengths comparing Pre-fixed (PreFP), Pre-Sinusoidal (PreSP), and Pre-random paced (PreRP) between groups (n=7). Vertical bars represent the SEM. (p=0.39)
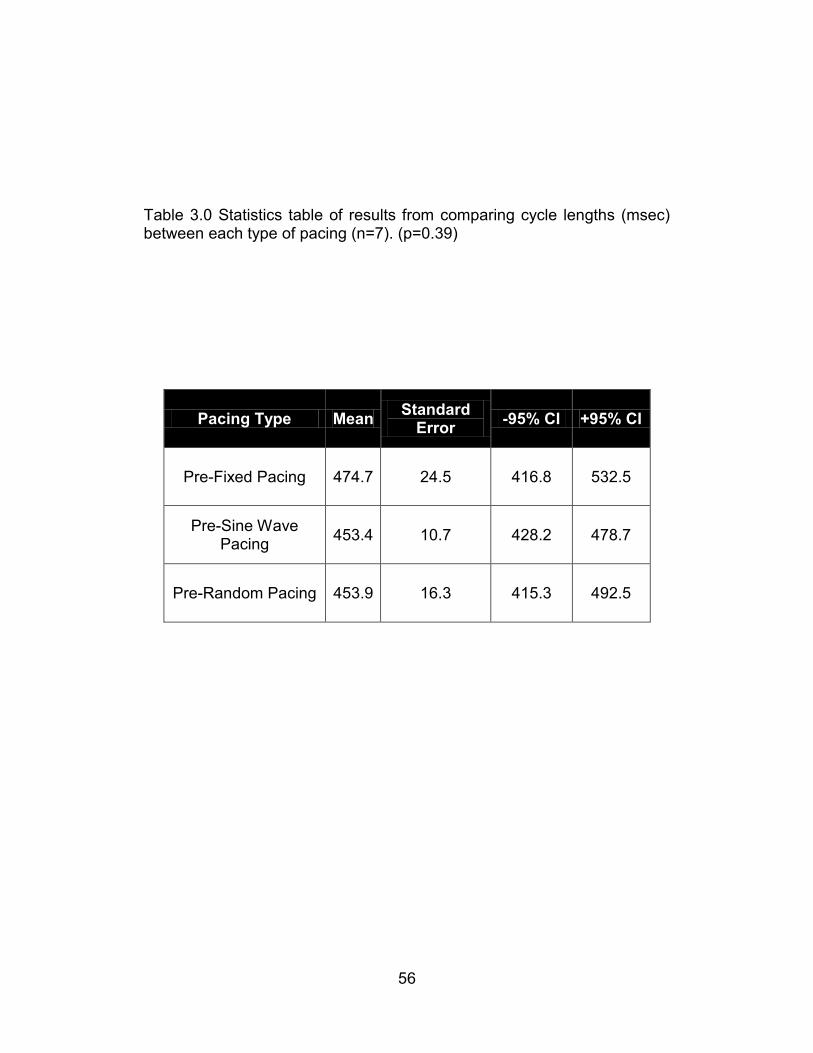
56
Table 3.0 Statistics table of results from comparing cycle lengths (msec) between each type of pacing (n=7). (p=0.39)
Pacing Type Mean Standard
Error -95% CI +95% CI
Pre-Fixed Pacing 474.7 24.5 416.8 532.5
Pre-Sine Wave Pacing
453.4 10.7 428.2 478.7
Pre-Random Pacing 453.9 16.3 415.3 492.5
57
Heart rate changes with the QT interval in a reciprocal fashion. Therefore tachypacing
for a period will alter the QT interval. Therefore, it is important to determine if and to
what extent the QT interval is itself affected by tachypacing. Specifically we are
interested in the potential alteration of the intrinsic ventricular cycle length before and
after pacing so that for future studies we can more fully evaluate the QT interval while
providing consideration for the magnitude QT interval changes brought about from heart
rate changes. Here I hypothesize that ventricular heart rate remains unchanged before
and after fixed, sinusoidal and random tachypacing. The summary of this analysis is
contained in Figure 3.4 and 3.5. The fixed (p=0.18), sine (p=0.21), and random
(p=0.16) pre-pacing cycle length was not significantly different than post-pacing. Each
post-pacing 30-second intervals did not show any significant difference within the group
or between groups (p=0.41).
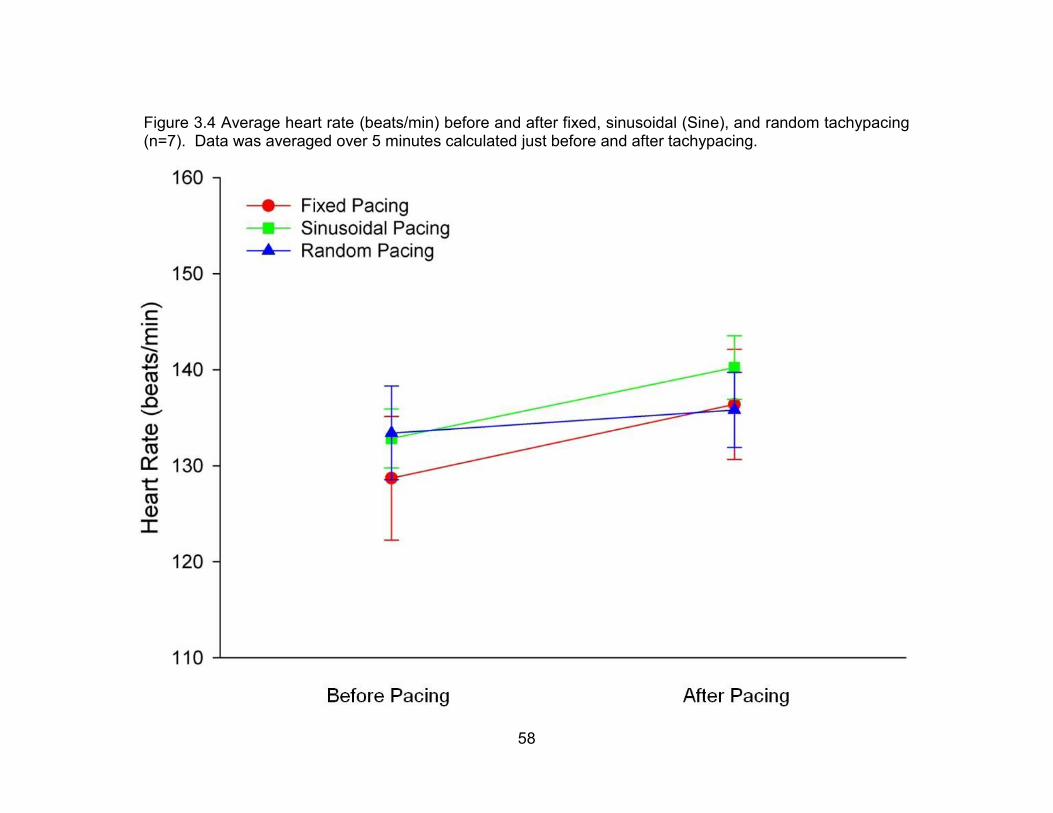
58
Figure 3.4 Average heart rate (beats/min) before and after fixed, sinusoidal (Sine), and random tachypacing (n=7). Data was averaged over 5 minutes calculated just before and after tachypacing.

59
Figure 3.5 Change in fixed, sinusoidal (sine) and random pacing cycle lengths (CL) compared to the pre-pacing interval at 30-second post-pacing intervals (n=7). (p=0.41)
60
EVALUATION OF THE EFFECT OF TACHYPACING ON THE QT INTERVAL AND
TpTe SEGMENT
Using statistical methods previously described, fixed, sinusoidal, and random
tachypacing does not differentially alter the QT interval during or shortly after the
termination of tachypacing. The TpTe segment duration was evaluated as a surrogate
for transmural dispersion of repolarization. During and after periods of tachypacing the
TpTe segment duration was not differentially significantly altered (Table 3.1).
EVALUATION OF QT DYNAMIC DURING AND AFTER TACHYPACING
Poincare plots provide a visual representation of beat-to-beat variability of repolarization
(BVR). Figure 3.6 is a summary of the data in 7 animals for the QT interval as a
function of the previous QT interval. The average BVR for fixed (0.40+0.056),
sinusoidal (0.57+0.203), and random (0.40+0.061) was not significantly different
between fixed and random (p=0.95) or sinusoidal and random (p=0.37). Figure 3.7
provides a summary for the QT adaption following the termination of tachypacing over
the first 250 beats. The curve fit was applied as previously outlined and the summary of
the statistics is contained within Table 3.2. Figure 3.8 provides a graphical reorientation
of the “c” coefficient, the parameter of prime importance due to its influence on the early
gain of the QT response. This and the other coefficients were not significantly different.
The QT variability index (QTvi) is summarized it Table 3.3. Evaluations were for 5
minutes of data just prior and after tachypacing, at 15, 30 and 60 minutes during

61
tachypacing of one hour. These pre-pacing (p=0.33), post-pacing (p=0.19) QTvi and
the group QTvi during pacing (p=0.14) was not significantly different (Figure 3.9).
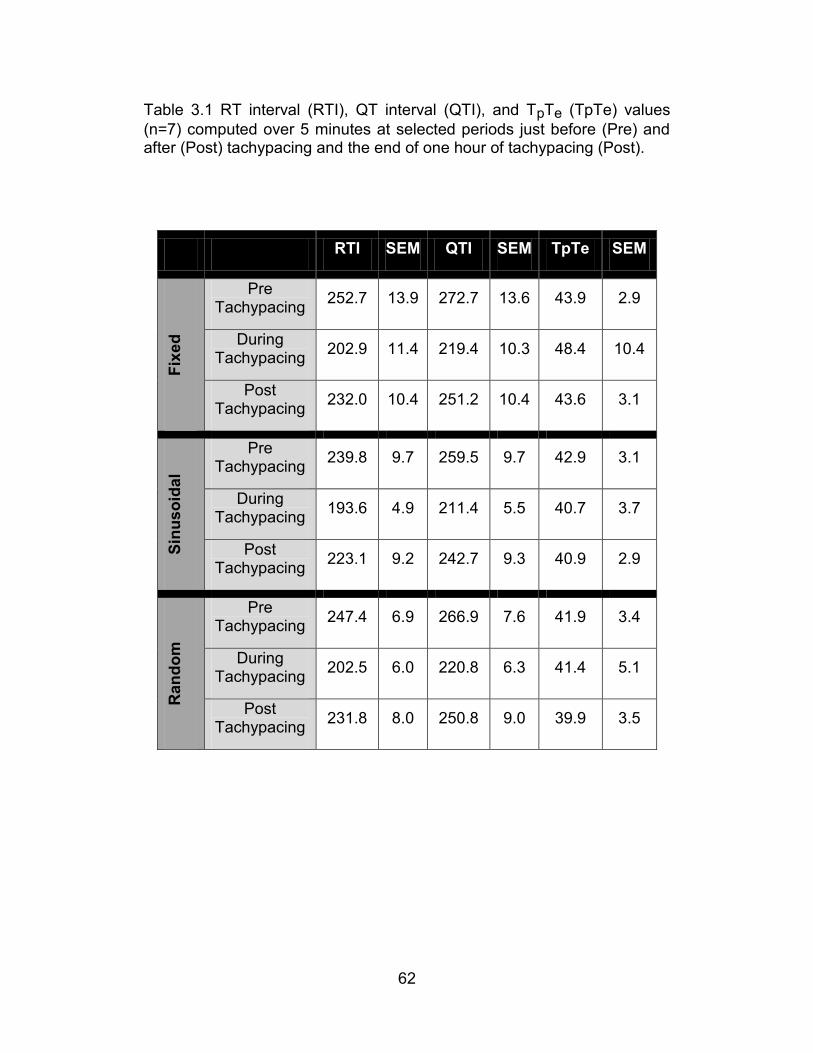
62
Table 3.1 RT interval (RTI), QT interval (QTI), and TpTe (TpTe) values
(n=7) computed over 5 minutes at selected periods just before (Pre) and after (Post) tachypacing and the end of one hour of tachypacing (Post).
RTI SEM QTI SEM TpTe SEM
Fix
ed
Pre Tachypacing
252.7 13.9 272.7 13.6 43.9 2.9
During Tachypacing
202.9 11.4 219.4 10.3 48.4 10.4
Post Tachypacing
232.0 10.4 251.2 10.4 43.6 3.1
Sin
us
oid
al
Pre Tachypacing
239.8 9.7 259.5 9.7 42.9 3.1
During Tachypacing
193.6 4.9 211.4 5.5 40.7 3.7
Post Tachypacing
223.1 9.2 242.7 9.3 40.9 2.9
Ran
do
m
Pre Tachypacing
247.4 6.9 266.9 7.6 41.9 3.4
During Tachypacing
202.5 6.0 220.8 6.3 41.4 5.1
Post Tachypacing
231.8 8.0 250.8 9.0 39.9 3.5

63
Figure 3.6 – Poincare plots as a visual representation of the QT interval beat-to-beat variability of repolarization (BVR) each representing the RT interval as a function of the previous RT interval in a single subject (n=7). [The text in this figure is not meant to be decipherable, but is for visual reference only.] Refer to Appendix B for individual decipherable graphs.
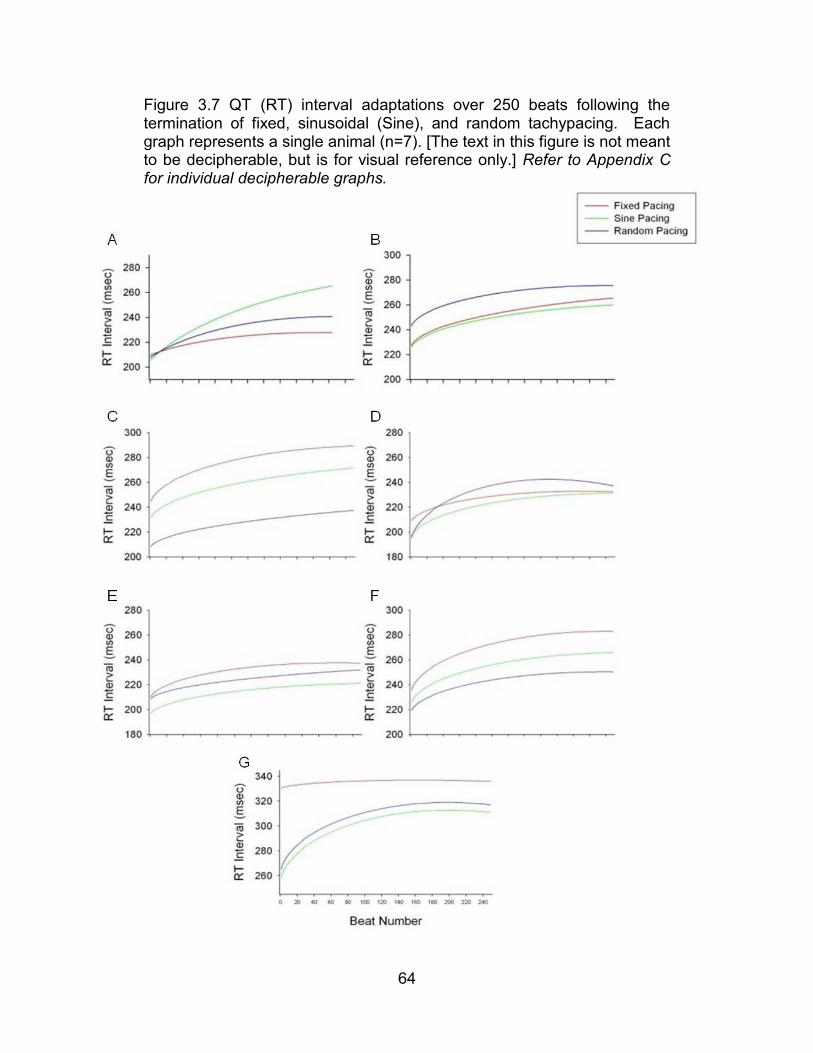
64
Figure 3.7 QT (RT) interval adaptations over 250 beats following the termination of fixed, sinusoidal (Sine), and random tachypacing. Each graph represents a single animal (n=7). [The text in this figure is not meant to be decipherable, but is for visual reference only.] Refer to Appendix C for individual decipherable graphs.
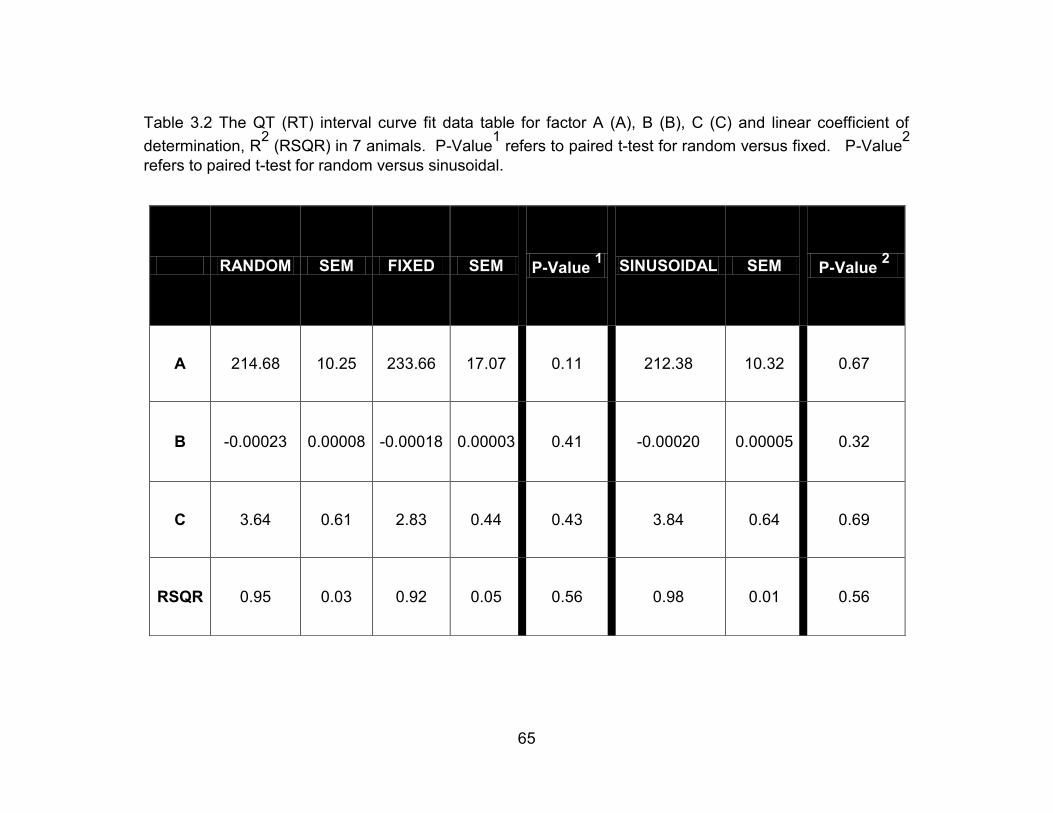
65
Table 3.2 The QT (RT) interval curve fit data table for factor A (A), B (B), C (C) and linear coefficient of
determination, R2 (RSQR) in 7 animals. P-Value
1 refers to paired t-test for random versus fixed. P-Value
2
refers to paired t-test for random versus sinusoidal.
RANDOM SEM FIXED SEM P-Value 1 SINUSOIDAL SEM P-Value
2
A 214.68 10.25 233.66 17.07 0.11 212.38 10.32 0.67
B -0.00023 0.00008 -0.00018 0.00003 0.41 -0.00020 0.00005 0.32
C 3.64 0.61 2.83 0.44 0.43 3.84 0.64 0.69
RSQR 0.95 0.03 0.92 0.05 0.56 0.98 0.01 0.56

66
Figure 3.8 The QT interval curve fit “c Factor” comparison across the three (Fixed, Sinusoidal (Sine), and Random Pacing) treatment groups (n=7).
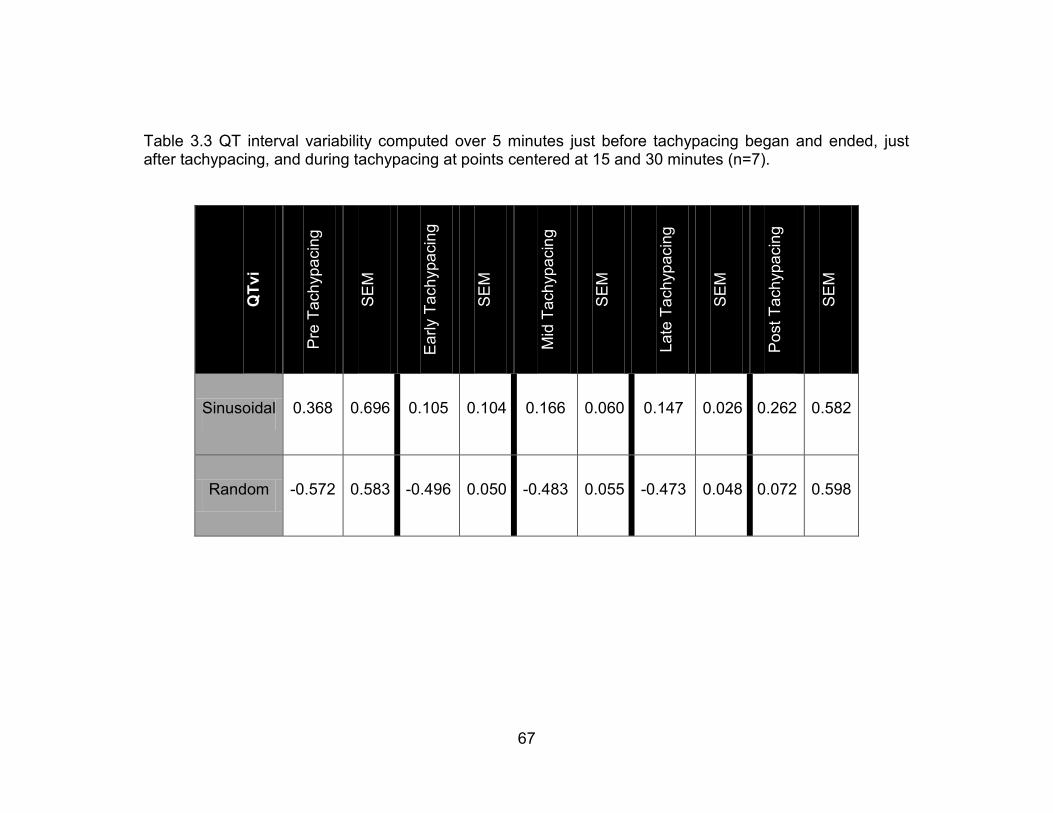
67
Table 3.3 QT interval variability computed over 5 minutes just before tachypacing began and ended, just after tachypacing, and during tachypacing at points centered at 15 and 30 minutes (n=7).
QT
vi
Pre
Tach
yp
acin
g
SE
M
Ea
rly T
ach
ypa
cin
g
SE
M
Mid
Tach
yp
acin
g
SE
M
La
te T
ach
yp
acin
g
SE
M
Po
st
Tach
ypa
cin
g
SE
M
Sinusoidal 0.368 0.696 0.105 0.104 0.166 0.060 0.147 0.026 0.262 0.582
Random -0.572 0.583 -0.496 0.050 -0.483 0.055 -0.473 0.048 0.072 0.598
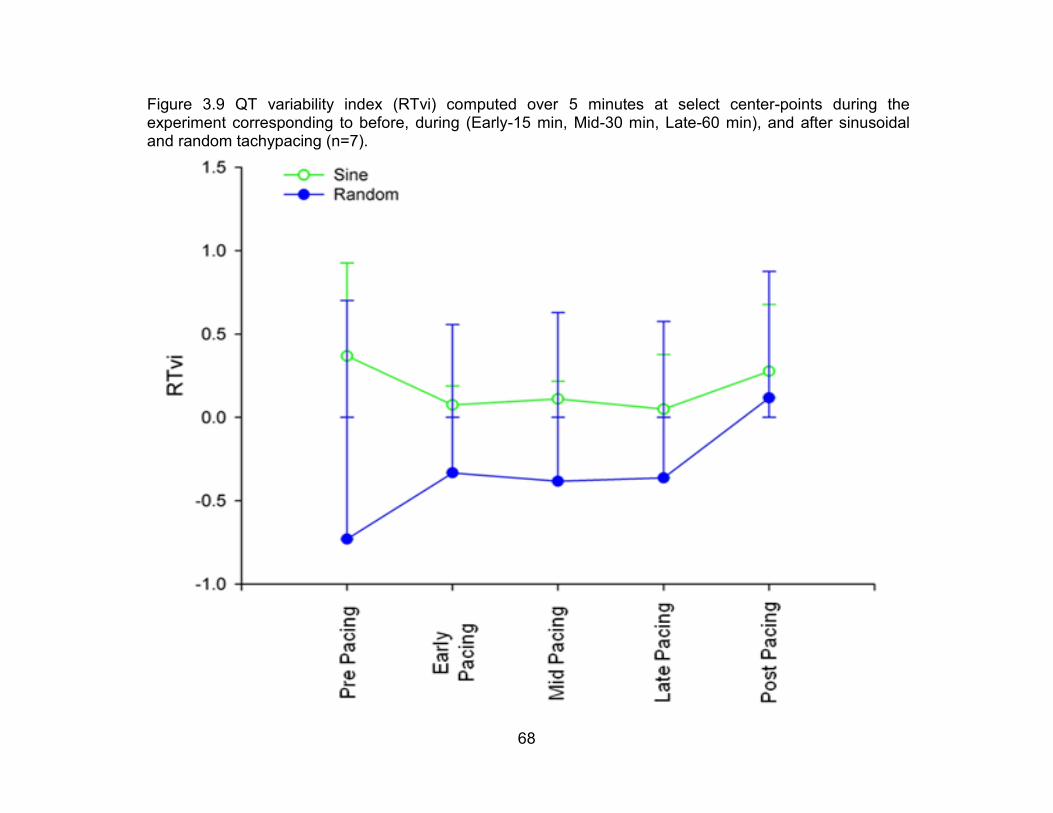
68
Figure 3.9 QT variability index (RTvi) computed over 5 minutes at select center-points during the experiment corresponding to before, during (Early-15 min, Mid-30 min, Late-60 min), and after sinusoidal and random tachypacing (n=7).

69
OVERALL CONCLUSION
These experiments found that a comprehensive list of repolarization parameters is not
differentially affected either during or shortly after fixed, sinusoidal, and random
tachypacing.
70
CHAPTER FOUR – THE QT EFFECT AND PHAMRMACOKINETIC PROFILE OF
DOFETILIDE IN TACHYPACED DOMESTIC PIGS
INTRODUCTION
Drug induced QT interval changes remain a concern that restricts potentially efficacious
compounds from reaching the market (Malik, 2005). Heightened scrutiny from
pharmaceutical regulators has slowed preclinical drug development; one-third of all drug
withdrawals between 1900 and 2006 were a result of QT interval prolongation (Shah,
2006). This is due to the understanding that certain non-sedating antihistamine,
antifungal, psychotropic and chemotherapeutic compounds are associated with
arrythmogenic sudden death. These findings have spurred research trying to elucidate
the mechanism of drug induced QT interval liability. Yet, the typical animal models
aimed at understanding the mechanisms of QT interval-mediated sudden death have
failed to adequately explain its underlying mechanisms (Dumotier & Georgieva, 2007).
This suggests the need to expand studies to include other animal models.
In animal models, the QT interval is frequently used as a surrogate to measure the
effects of compounds on cardiac ventricular repolarization. QT interval prolongation is
associated with the development of repolarization-related arrhythmias such as Torsades
(Pollard, 2010). Previous reports have suggested a varied pharmacokinetic response
between humans, dogs and monkeys: species typically used in drug testing. Indeed,
71
humans given similar doses to monkeys are far less sensitive to the QT prolongation
effects of dofetilide. Despite this, monkeys had a 3-fold lower exposure (i.e. AUC) than
man. Dogs given 10 times the dose of either monkeys or humans had a similar QTc
change to monkeys. The lower plasma exposure in monkeys seems to be related to an
increased risk for repolarization-related arrhythmia (Haushalter et al. 2008) and is
consistent to work in humans that shows a lower risk correlating with lower exposures
(Allen et al, 2000). The fundamental pharmacokinetics underlying these observations
may relate to altered bioavailability from oral administration or clearance effects (Smith
et al., 1992).
Dofetilide is a VW Class III antiarrhythmic that is given clinically for the correction of life-
threatening arrhythmias. It is known to cause QT interval prolongation and have a
dose-dependent correlation with the risk for developing sudden cardiac death in
humans and animal models. Altered repolarization by dofetilide is mediated through
selective inhibition of the potassium current (IK) via its inhibition of hERG (IK,rapid) and
KVLQT1/minK (IK,slow) (Varro et al., 2004). Nearly all forms of drug liability risk
associated with repolarization-related arrhythmia have been due to delayed rectifier
inhibition (Kano et al., 2005; Witchel, 2011).
The findings from the previous studies described in this dissertation indicate that
repolarization may not be altered as a result of short-term tachypacing in normal
72
domestic pigs. In the human clinical studies that suggested post-conversion
vulnerability to RRAs, successful conversion of atrial fibrillation was often facilitated by
the administration of IKr blockers. Therefore in order to test the hypothesis that IKr
antagonism is involved in mediating these findings, dofetilide was chosen as the IKr
blocker to use in these experimental subjects. There is a lack of information related to
the pharmacokinetics of dofetilide in the domestic pig. As a result, a preliminary study
was designed and undertaken to define these important features of the drug in this
model. The objectives of this chapter are to determine the pharmacokinetic profile of
dofetilide following a single intravenous injection and to examine the degree of
repolarization prolongation introduced by the administration of dofetilide. We also are
presenting data on factors that can play a modifying role on sudden cardiac death,
including blood pressure, QRS duration, myocardial contractility and heart rate.
SPECIFIC METHODS
Domestic pigs (n=7) were anesthetized with isoflurane and instrumented as previously
described. The basic protocol is outlined in Figure 4.0. Baseline data was collected for
15 minutes without pacing, and then continued for another 300 minutes during high right
atrial, fixed rate pacing at 150 beats/min. The animals were then administered, through
a peripheral ear vein, a 5-minute infusion of dofetilide (Sigma-Aldrich, St. Louis, MO) at
a dose of 200mcg/kg. While pacing continued for 300 minutes, sequential 8ml blood

73
withdraws for serum continued according to the outline in Figure 4.1. After 5 hours, the
pacing was terminated, and an additional 15 minutes of data was collected.

74
Figure 4.0 Protocol to assess the pharmacokinetic and pharmacodynamics response to a single bolus injection of dofetilide.
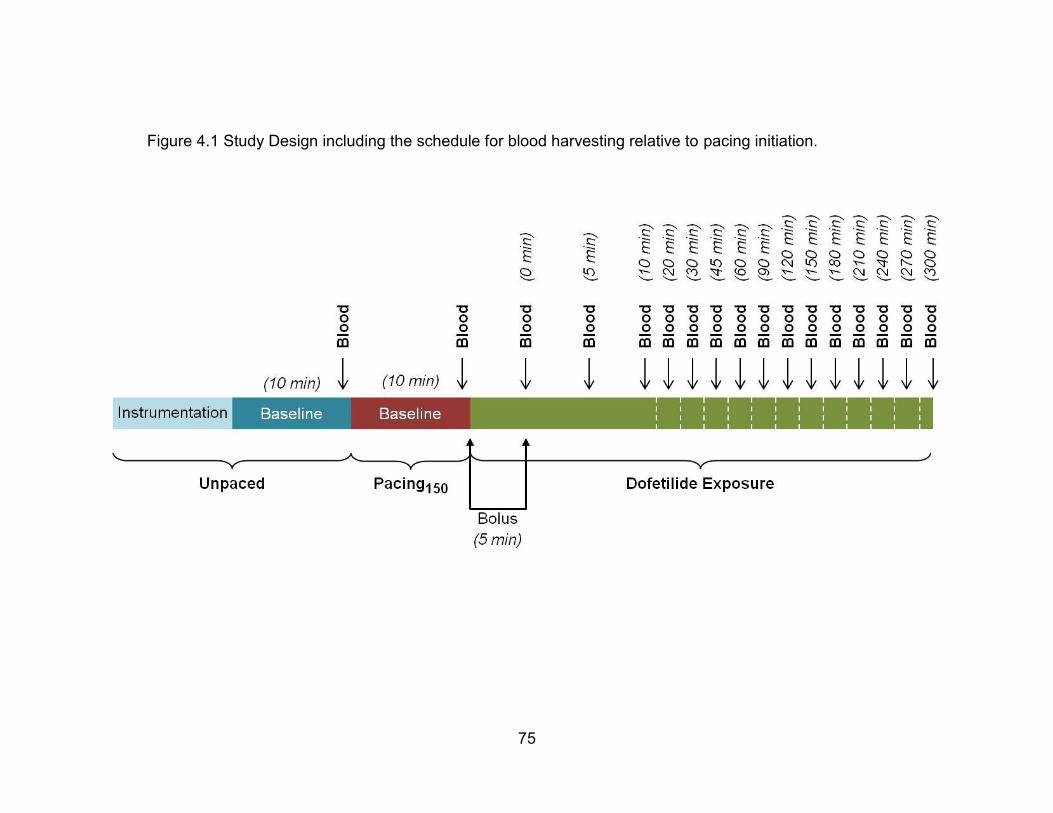
75
Figure 4.1 Study Design including the schedule for blood harvesting relative to pacing initiation.
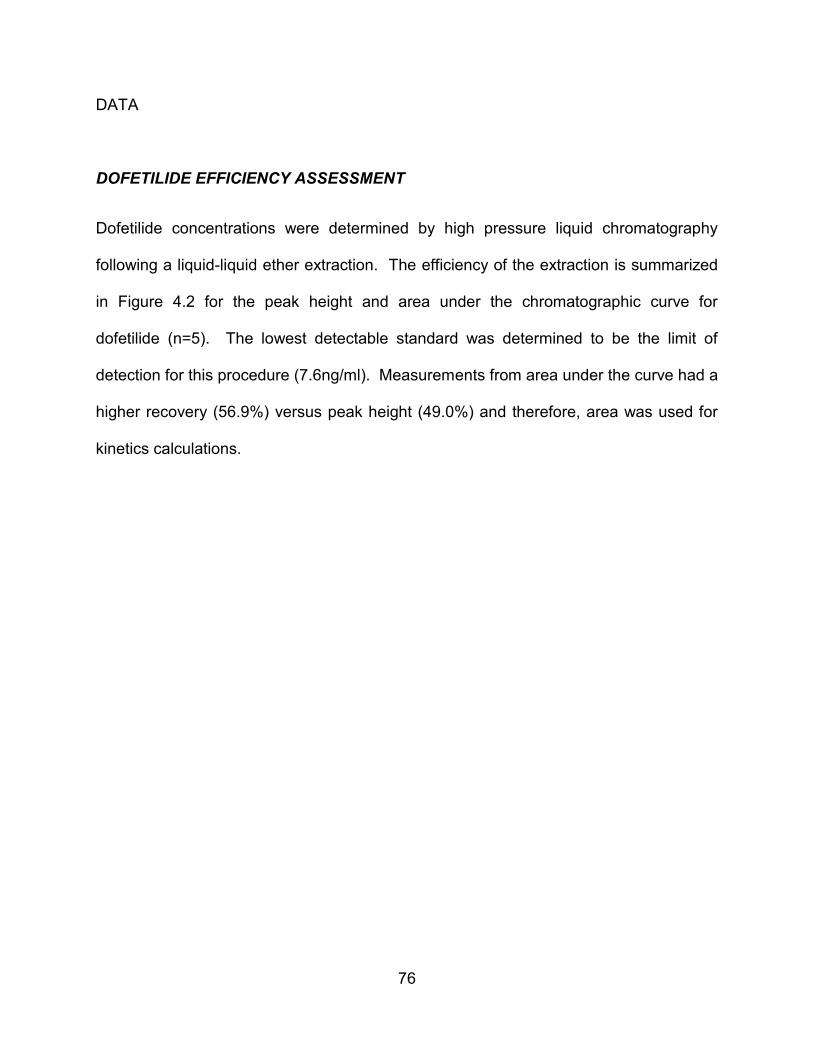
76
DATA
DOFETILIDE EFFICIENCY ASSESSMENT
Dofetilide concentrations were determined by high pressure liquid chromatography
following a liquid-liquid ether extraction. The efficiency of the extraction is summarized
in Figure 4.2 for the peak height and area under the chromatographic curve for
dofetilide (n=5). The lowest detectable standard was determined to be the limit of
detection for this procedure (7.6ng/ml). Measurements from area under the curve had a
higher recovery (56.9%) versus peak height (49.0%) and therefore, area was used for
kinetics calculations.
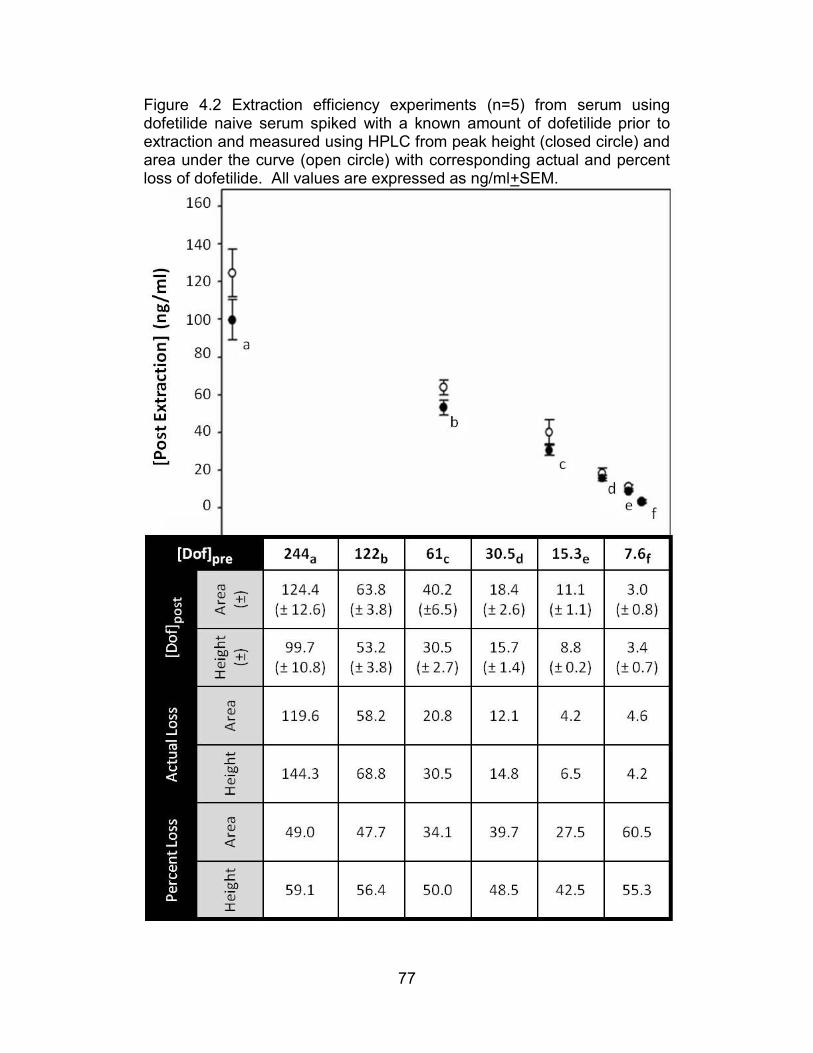
77
Figure 4.2 Extraction efficiency experiments (n=5) from serum using dofetilide naive serum spiked with a known amount of dofetilide prior to extraction and measured using HPLC from peak height (closed circle) and area under the curve (open circle) with corresponding actual and percent loss of dofetilide. All values are expressed as ng/ml+SEM.

78
BASELINE CHARACTERISTICS
Hemodynamic and electrocardiographic parameters for the period just prior, and just
after beginning of pacing are summarized in Table 4.0. The prepacing heart rate was
significantly increased (24.9+7.8 beats/min) to 150 beats/min. A corresponding and
statistically significant reduction in QT interval (23.6+10.5msec), Tpeak to Tend segment
(1.5+1.6msec) were observed. The QRS duration, peak systolic pressure and dP/dt
were not significantly altered.
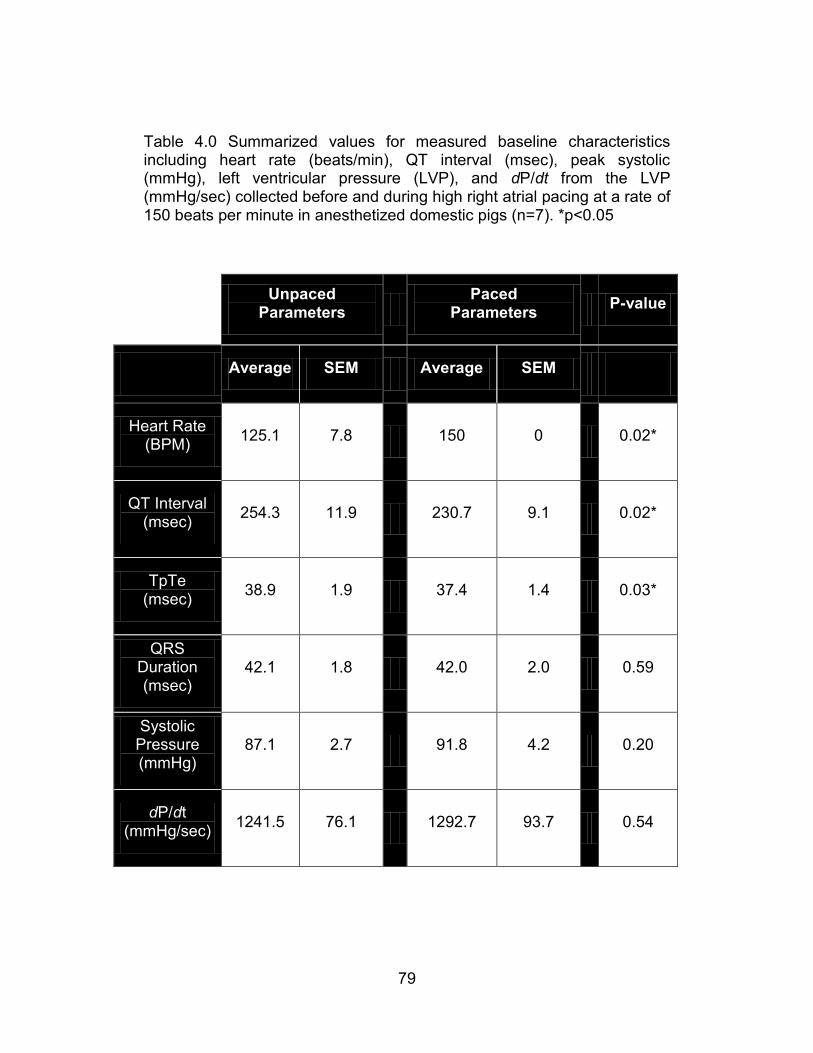
79
Table 4.0 Summarized values for measured baseline characteristics including heart rate (beats/min), QT interval (msec), peak systolic (mmHg), left ventricular pressure (LVP), and dP/dt from the LVP (mmHg/sec) collected before and during high right atrial pacing at a rate of 150 beats per minute in anesthetized domestic pigs (n=7). *p<0.05
Unpaced Parameters
Paced
Parameters P-value
Average SEM Average SEM
Heart Rate (BPM)
125.1 7.8 150 0 0.02*
QT Interval (msec)
254.3 11.9 230.7 9.1 0.02*
TpTe (msec)
38.9 1.9 37.4 1.4 0.03*
QRS Duration (msec)
42.1 1.8 42.0 2.0 0.59
Systolic Pressure (mmHg)
87.1 2.7 91.8 4.2 0.20
dP/dt (mmHg/sec)
1241.5 76.1 1292.7 93.7 0.54
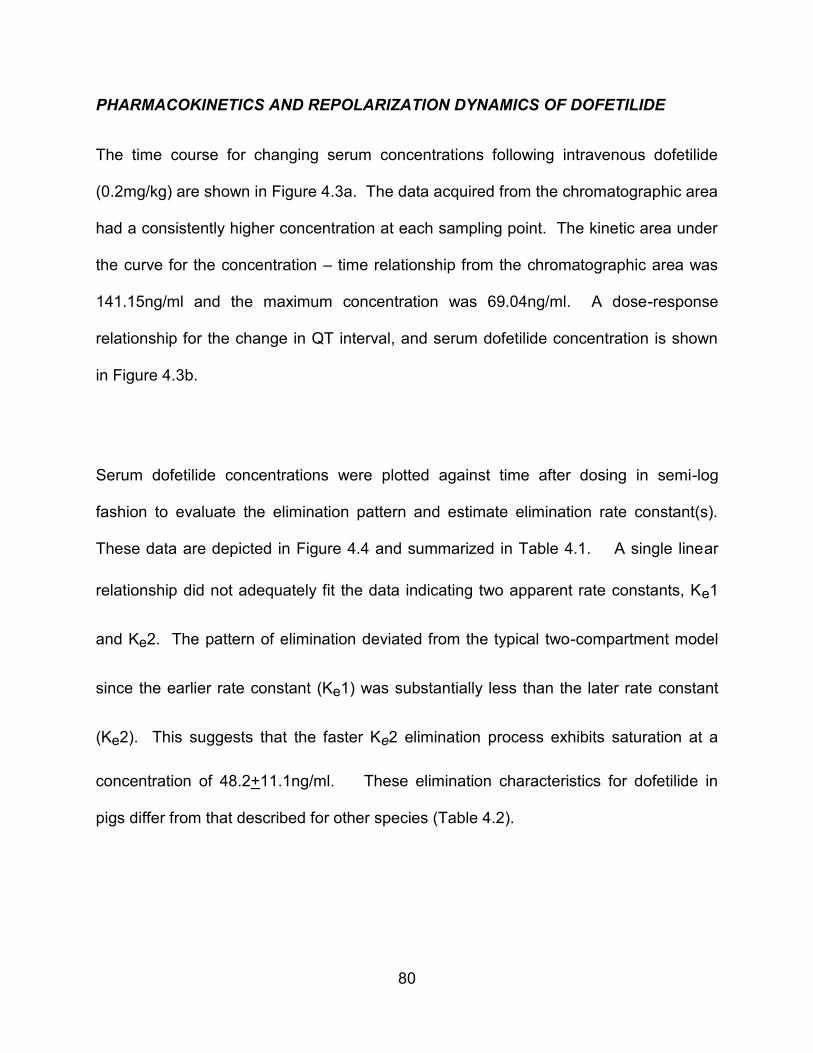
80
PHARMACOKINETICS AND REPOLARIZATION DYNAMICS OF DOFETILIDE
The time course for changing serum concentrations following intravenous dofetilide
(0.2mg/kg) are shown in Figure 4.3a. The data acquired from the chromatographic area
had a consistently higher concentration at each sampling point. The kinetic area under
the curve for the concentration – time relationship from the chromatographic area was
141.15ng/ml and the maximum concentration was 69.04ng/ml. A dose-response
relationship for the change in QT interval, and serum dofetilide concentration is shown
in Figure 4.3b.
Serum dofetilide concentrations were plotted against time after dosing in semi-log
fashion to evaluate the elimination pattern and estimate elimination rate constant(s).
These data are depicted in Figure 4.4 and summarized in Table 4.1. A single linear
relationship did not adequately fit the data indicating two apparent rate constants, Ke1
and Ke2. The pattern of elimination deviated from the typical two-compartment model
since the earlier rate constant (Ke1) was substantially less than the later rate constant
(Ke2). This suggests that the faster Ke2 elimination process exhibits saturation at a
concentration of 48.2+11.1ng/ml. These elimination characteristics for dofetilide in
pigs differ from that described for other species (Table 4.2).

81
Figure 4.3 [a] Dofetilide concentration summary (n=7) with corresponding representative electrocardiographic morphology alterations over 5 hours from a single intravenous dofetilide infusion (t0). [b] Dofetilide – QT interval response curve, measured as change from baseline, for animals (n=7) administered a single (200mcg/kg) bolus of dofetilide while paced continually at 150 beats/min.
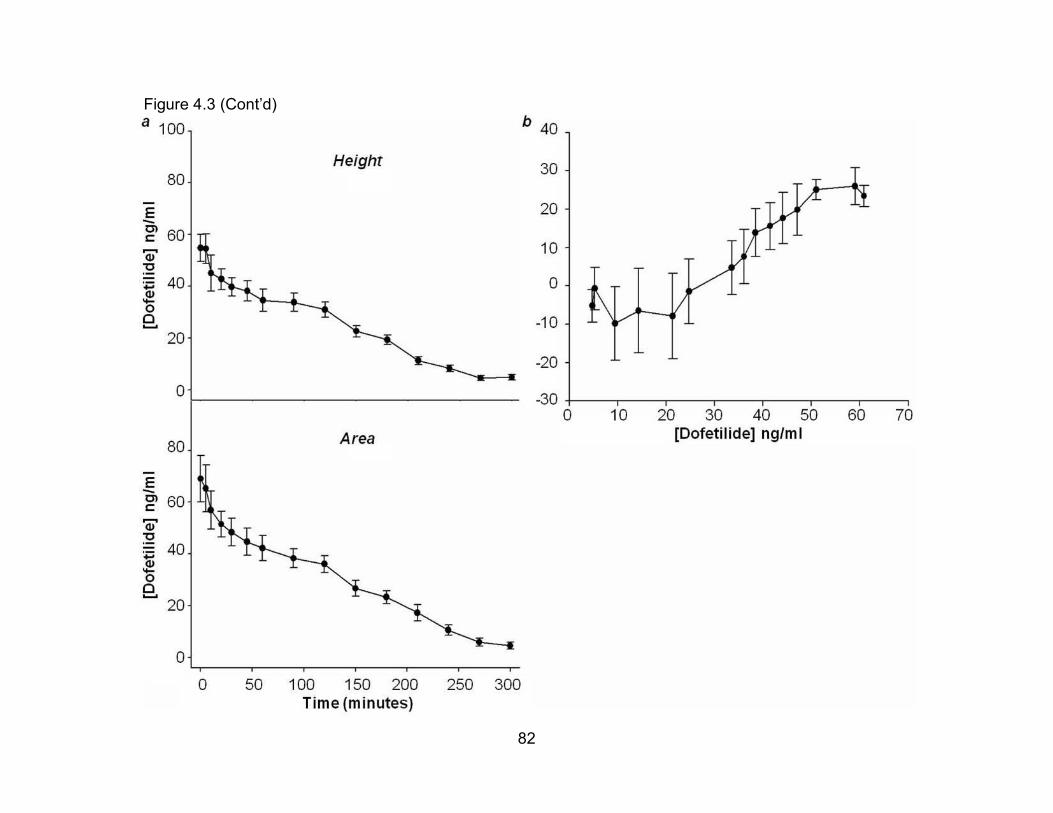
82
Figure 4.3 (Cont’d)
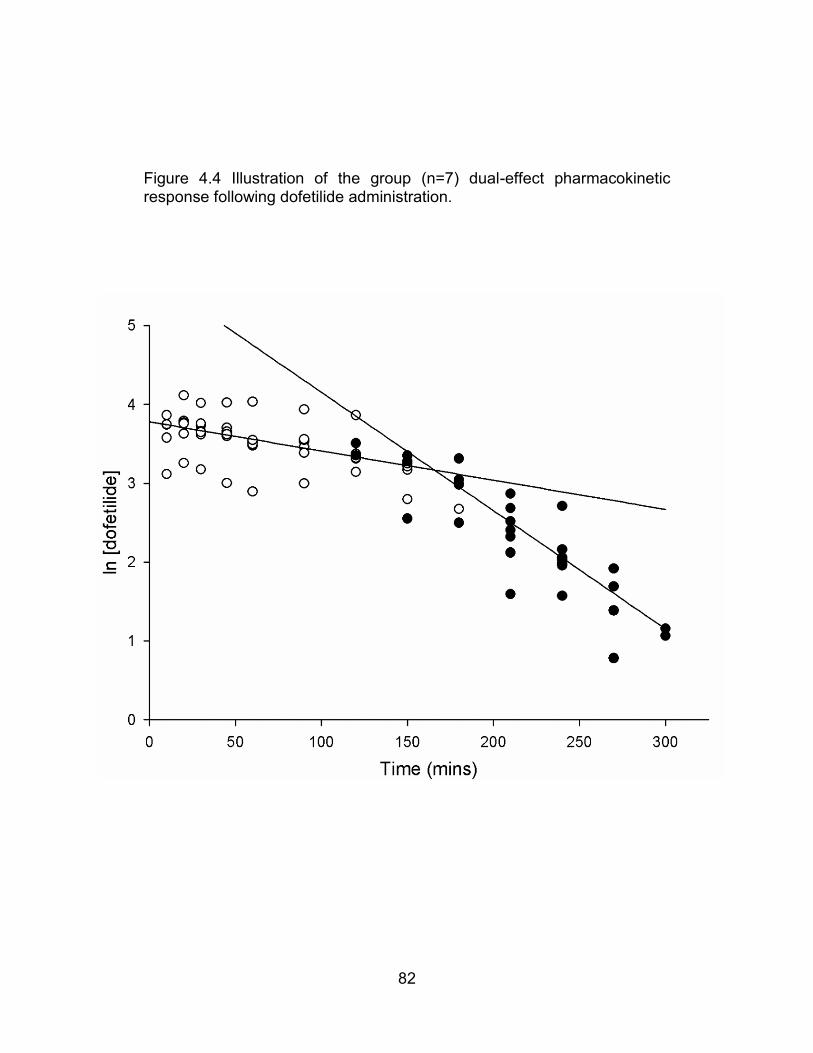
82
Figure 4.4 Illustration of the group (n=7) dual-effect pharmacokinetic response following dofetilide administration.
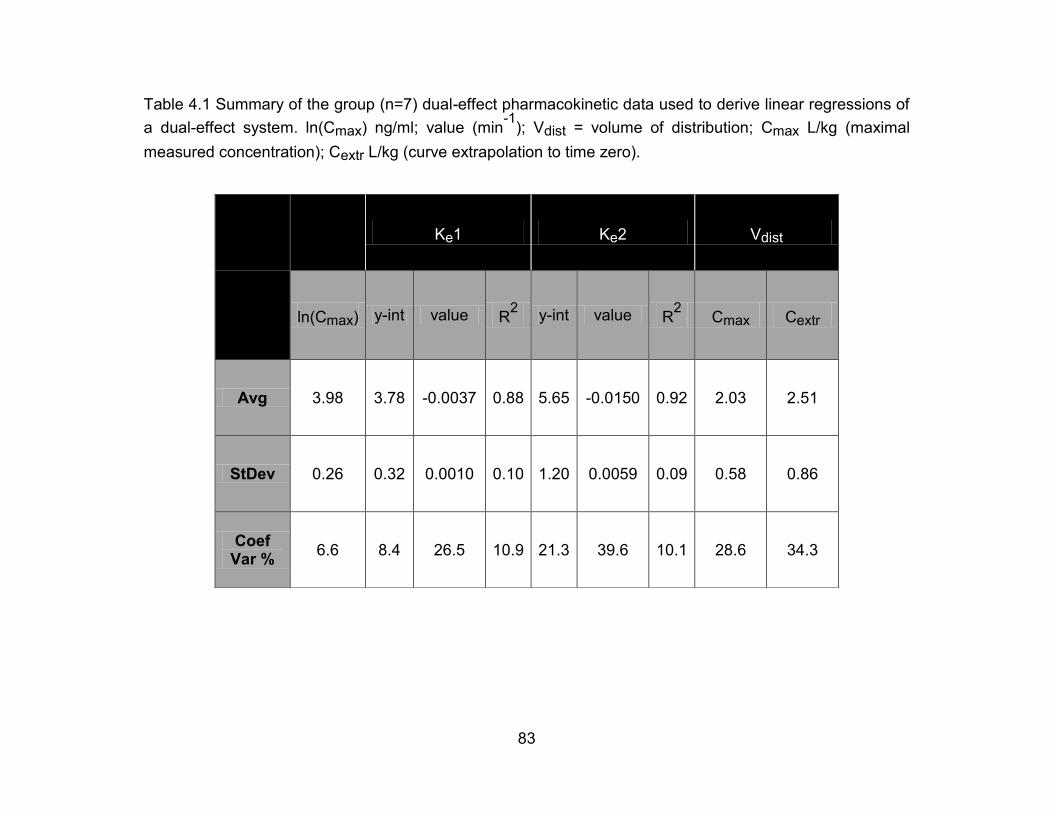
83
Table 4.1 Summary of the group (n=7) dual-effect pharmacokinetic data used to derive linear regressions of
a dual-effect system. ln(Cmax) ng/ml; value (min-1
); Vdist = volume of distribution; Cmax L/kg (maximal
measured concentration); Cextr L/kg (curve extrapolation to time zero).
Ke1 Ke2 Vdist
ln(Cmax) y-int value R2 y-int value R
2 Cmax Cextr
Avg 3.98 3.78 -0.0037 0.88 5.65 -0.0150 0.92 2.03 2.51
StDev 0.26 0.32 0.0010 0.10 1.20 0.0059 0.09 0.58 0.86
Coef Var %
6.6 8.4 26.5 10.9 21.3 39.6 10.1 28.6 34.3

84
Table 4.2 Summary of resultant parameters from this study, and the comparison of those to similar studies conducted in other species. In the present study, QT interval was corrected using Bazett’s formula for the purposes of comparison.
Species Dose
(mg/kg) C max (ng/ml)
AUC (ng/ml) Max change in QTc (ms)
References
Swine 0.2 69.04 141.15 57 Present Study
Dog 0.3 60.15 261.89 64 Haushalter et al. (2008)
Monkey 0.03 1.85 6.37 50 Haushalter et al. (2008)
Human 0.04 3.55 18.89 19 Allen et al.
(2000)

85
ELECTROCARDIOGRAPHIC AND HEMODYNAMICS EFFECTS OF DOFETILIDE
The QT interval, compared to baseline (n=3), reached its maximal within 10 minutes
after completion of the dofetilide infusion. The QT interval steadily returned to control
levels at 175 minutes after dosing (Figure 4.5; Table 4.3). Unlike the slowly declining
QT interval, peak left ventricular systolic pressure and dP/dt increased steadily after
dosing, both reached a maximum 220 minutes post dosing with a maximal change in
peak left ventricular pressure of 10.5mmHg, and left ventricular dP/dt of 310mmHg/min.
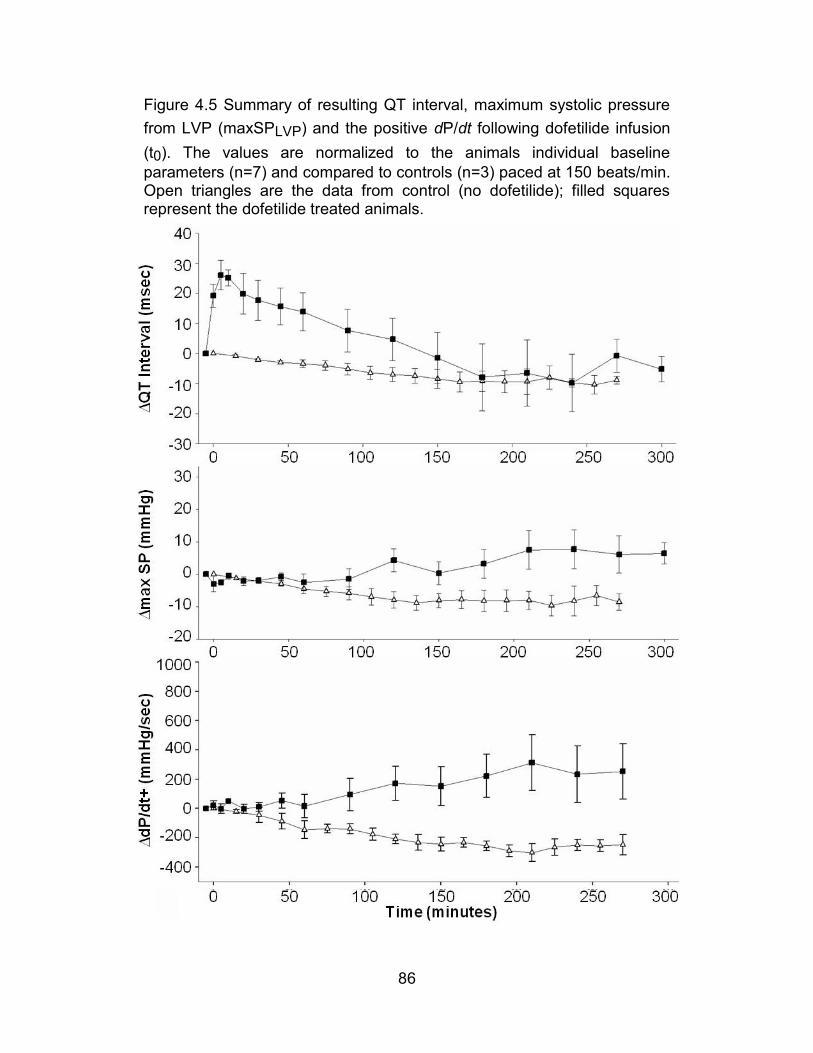
86
Figure 4.5 Summary of resulting QT interval, maximum systolic pressure
from LVP (maxSPLVP) and the positive dP/dt following dofetilide infusion
(t0). The values are normalized to the animals individual baseline
parameters (n=7) and compared to controls (n=3) paced at 150 beats/min. Open triangles are the data from control (no dofetilide); filled squares represent the dofetilide treated animals.

87
Table 4.3 Summary of resulting QT interval, maximum systolic pressure from LVP (maxSPLVP) and the
positive dP/dt following dofetilide infusion (t0). The values are normalized to the animals individual baseline
parameters (n=7) and compared to controls (n=3) paced at 150 beats/min.
88
OVERALL CONCLUSION
Dofetilide, when administered to pigs, has a dual-effect elimination that is unusual and
previously unreported. Dofetilide induces a dose dependent increase in QT interval,
peak LV pressure, and dP/dt. When expressed as the ratio of change in QT interval to
CMax, pigs are similar to dogs, but substantially less sensitive to dofetilide than
monkeys or humans.

89
CHAPTER FIVE – THE EFFECT OF TACHYCARDIC IRREGULARITY ON THE
RECOVERY OF REPOLARIZATION PROLONGATION IN IKr ANTAGONIZED
DOMESTIC PIGS
INTRODUCTION It is well established that certain antiarrhythmic drugs have a substantial risk of RRA of
one percent or more. Drugs such as quinidine, sotalol, ibutilide and dofetilide are all
examples of drugs that enhance RRA risk, especially when combined with
cardiovascular disease such as atrial fibrillation (Soyka et al., 1990; Torp-Pedersen et
al., 1999; Coplen et al., 1990; Roden et al., 1986; Stambler et al., 1996). Atrial
fibrillation is the current primary indication, and a large percentage are receiving,
antiarrhythmic drug therapy (Darbar & Roden, 2006). Dofetilide, compared to other
agents, is a specific antagonist for the IKr: the currently implicated mechanism for in
nearly all forms of RRA liability. It also has strong reverse-use dependence, meaning
that the drugs pharmacodynamics action is facilitated at lower heart rates, yet restricted
at higher rates. The mechanism responsible for this with dofetilide is not completely
understood but is shared by other drugs with similar IKr effects such as E4031 and
sotalol.
A clinical observation over the past 25 years has been that RRAs often occur in patients
with atrial fibrillation after conversion to sinus rhythm (McCray, et al., 2006). This could
logically represent either a protection from RRA during atrial fibrillation or vulnerability
90
toward RRA after conversion to sinus rhythm. Because atrial fibrillation patients receive
antiarrhythmic drug therapy and have a heightened risk for RRA, atrial fibrillation itself
might exert a poorly understood influence on the QT interval both during the arrhythmia
or shortly after its conversion to sinus rhythm. Atrial fibrillation is distinct, in part due to
its irregular heart rate. Understanding mechanisms underlying atrial fibrillation
repolarization effects would be an important step forward in understanding the increase
risk for RRA when an IKr antagonist is used.
Having evaluated the repolarization response of fixed, sinusoidal and random paced
normal domestic pigs and finding there to be no significant alteration of repolarization
indices, the focus is shifted to a study of the effect of sinusoidal and random pacing in
domestic pigs treated with dofetilide. This study is designed to test the hypothesis that
IKr antagonist treatment with dofetilide alters repolarization dynamics in the presence of
irregular tachypacing differently than its effects during sine wave tachypacing.
SPECIFIC METHODS
Domestic pigs (n=7) were anesthetized with isoflurane and instrumented as previously
described. The basic protocol is outlined in Figure 5.0. Baseline data was collected for
at least 15 minutes without pacing and continued after initiating high right atrial pacing
at 150 beats per minute. After 10 minutes of pacing at 150 beats/min, animals were
then administered, a 5-minute infusion of dofetilide (Sigma-Aldrich, St. Louis, MO)
91
through a peripheral ear vein, at a dose of 50mcg/kg. This loading infusion was
followed by a continuous rate infusion of 0.35mcg/kg/min. The dose for dofetilide
administration was based on the pharmacokinetic results summaries in Chapter 4 of this
dissertation. The experimental intent was to study QT interval dynamics while serum
concentrations of dofetilide are relatively constant. The nominal goal was a deviation of
15% or less from the 10-minute serum concentration. It was calculated based on the
average Ke1 (-0.0037 min-1
), which represents the slower, high-capacity elimination.
This does was selected because a) it is similar to doses in the literature given to pigs
and dogs b) it generates a detectable plasma concentration of dofetilide, and c) based
on previous work QT interval was predicted to increase by approx 20-30 msec while still
maintaining a 1:1 AV conduction rate at high atrial pacing rates. The continuous
infusion rate was calculated with the assumption of a one-compartment model. This
was justified because the desired serum concentration exceeded the saturation for Ke2.
Sequential 8ml blood draws for serum collection were performed according to the
outline in Figure 4.1. After 300 minutes the pacing was terminated and an additional 15
minutes of data was collected.

92
Figure 5.0 Protocol to assess repolarization alteration following domestic pigs fixed paced at 150 beats/min
(Pacing150) and randomized to either sinusoidal or random tachypacing.
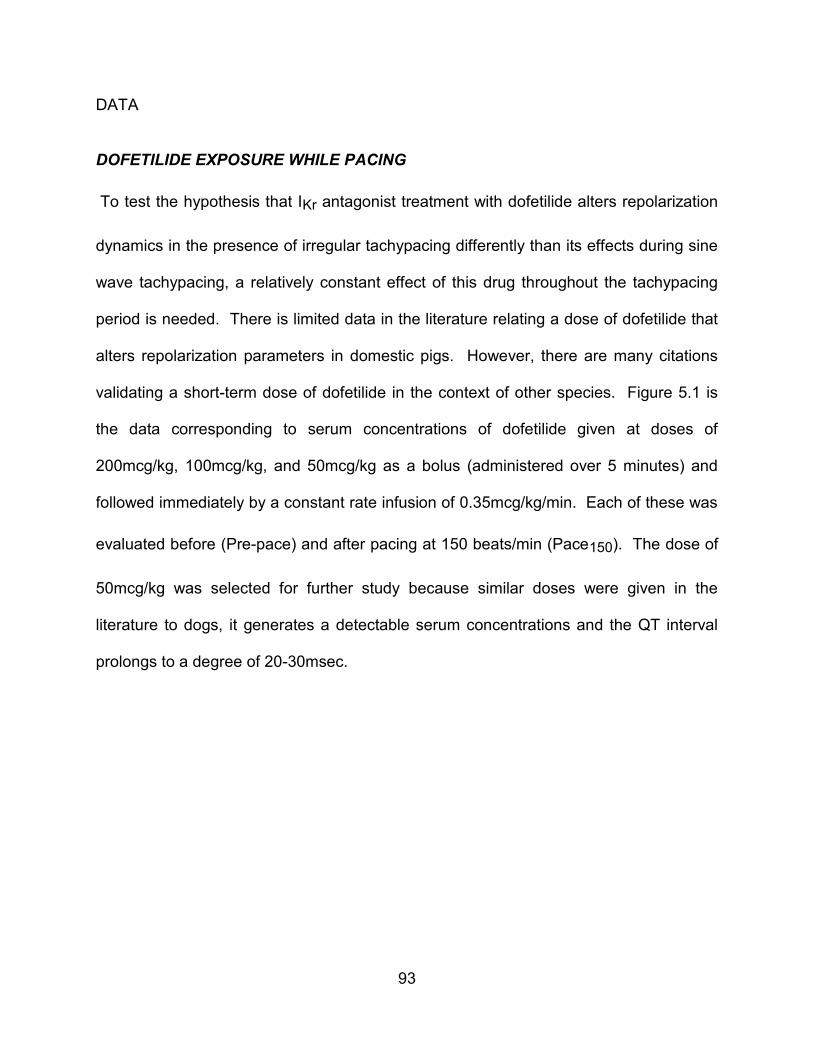
93
DATA
DOFETILIDE EXPOSURE WHILE PACING
To test the hypothesis that IKr antagonist treatment with dofetilide alters repolarization
dynamics in the presence of irregular tachypacing differently than its effects during sine
wave tachypacing, a relatively constant effect of this drug throughout the tachypacing
period is needed. There is limited data in the literature relating a dose of dofetilide that
alters repolarization parameters in domestic pigs. However, there are many citations
validating a short-term dose of dofetilide in the context of other species. Figure 5.1 is
the data corresponding to serum concentrations of dofetilide given at doses of
200mcg/kg, 100mcg/kg, and 50mcg/kg as a bolus (administered over 5 minutes) and
followed immediately by a constant rate infusion of 0.35mcg/kg/min. Each of these was
evaluated before (Pre-pace) and after pacing at 150 beats/min (Pace150). The dose of
50mcg/kg was selected for further study because similar doses were given in the
literature to dogs, it generates a detectable serum concentrations and the QT interval
prolongs to a degree of 20-30msec.
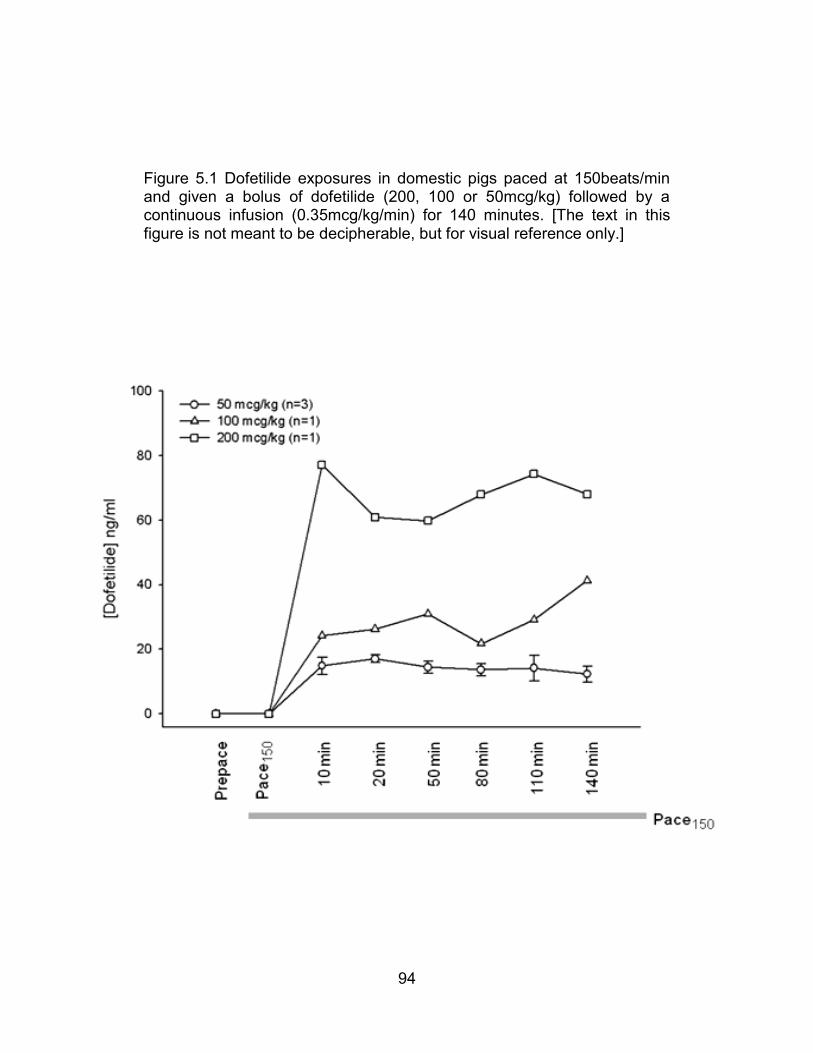
94
Figure 5.1 Dofetilide exposures in domestic pigs paced at 150beats/min and given a bolus of dofetilide (200, 100 or 50mcg/kg) followed by a continuous infusion (0.35mcg/kg/min) for 140 minutes. [The text in this figure is not meant to be decipherable, but for visual reference only.]

95
EVALUATION OF THE EFFECT OF TACHYPACING ON THE QT INTERVAL IN PIGS
TREATED WITH DOFETILIDE
The instantaneous heart rate for tachypacing was adjusted in this arm of the study to
prevent a loss of 1:1 AV nodal conduction. This was necessary because dofetilide can
depress AV nodal conduction. The average heart rate for sinusoidal and random
pacing was set to 180beats/min (CL = 333msec), and the control pacing was performed
at the lowest heart rate pacing rate. The range of heart rates was retained and set to 60
beats/min as outlined in Figure 5.2.
Pigs in the control group were fixed-paced at 150 beats/min (Pace150) throughout the
experiment (Figure 5.3). For the sinusoidal and random groups, pacing at 150beats/min
was discontinued (at time -60) and tachypacing was initiated for one hour. After the
termination of tachypacing, pacing at 150 beats/min was resumed. After cessation of
tachypacing, the QT interval was evaluated every 5 minutes for 30 minutes, and then at
the end of one hour for 5 additional minutes. The QT interval for the control group
increased shortly after initiating dofetilide but steadily declined for the remainder of the
data collection period despite relatively constant serum dofetilide concentrations. This
control response resembles what would be seen with tachyphylaxis. In contrast, QT
interval for sinusoidal and random tachypacing declined during tachypacing as
expected, but then recovered to the pre-tachypacing level. Neither tachypacing group
exhibited any semblance of tachypacing, even one hour after tachypacing cessation.
Irregular tachypacing did not differentially affect repolarization compared to sinusoidal

96
tachypacing. The experimental hypothesis was therefore not sustained. However, the
results did suggest a possible mechanism for post tachypacing RRA vulnerability.
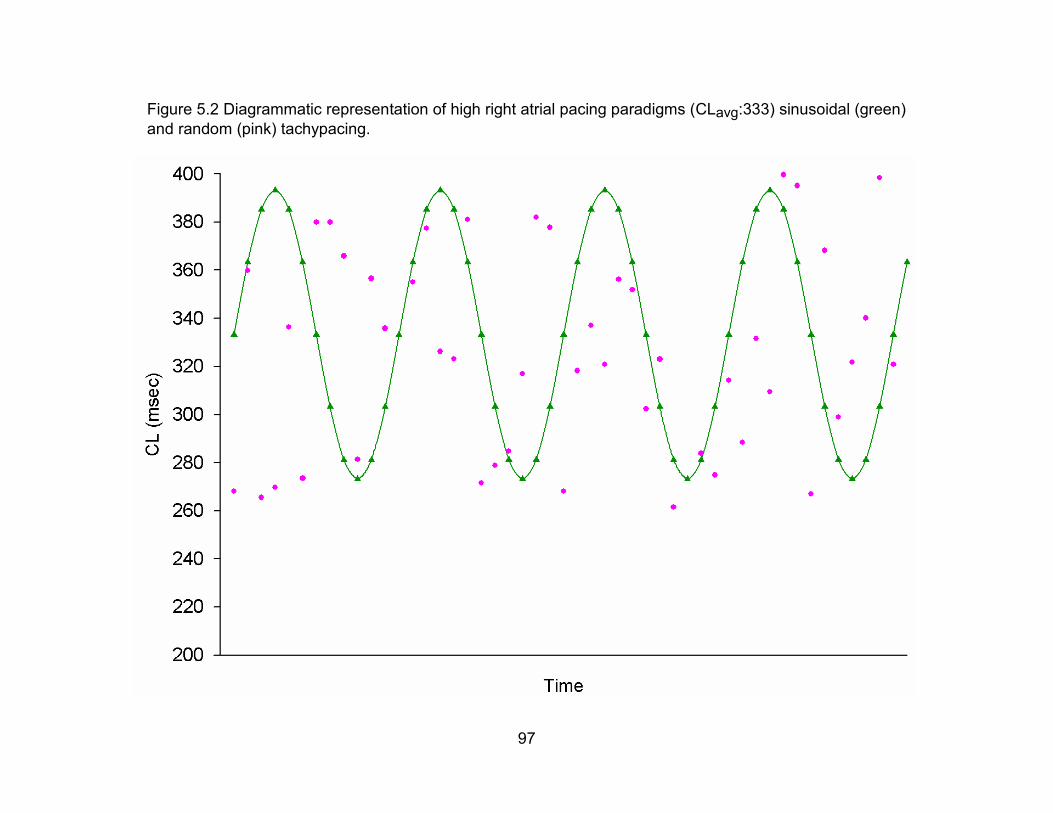
97
Figure 5.2 Diagrammatic representation of high right atrial pacing paradigms (CLavg:333) sinusoidal (green)
and random (pink) tachypacing.
98
Figure 5.3 QT (RT) assessment of dofetilide treated domestic pigs paced at 150 beats/min for the entire experiment (Dofetilide Time Control) or with pacing interrupted by one hour of sinusoidal (Sine) or Random tachypacing. (*p=0.042)
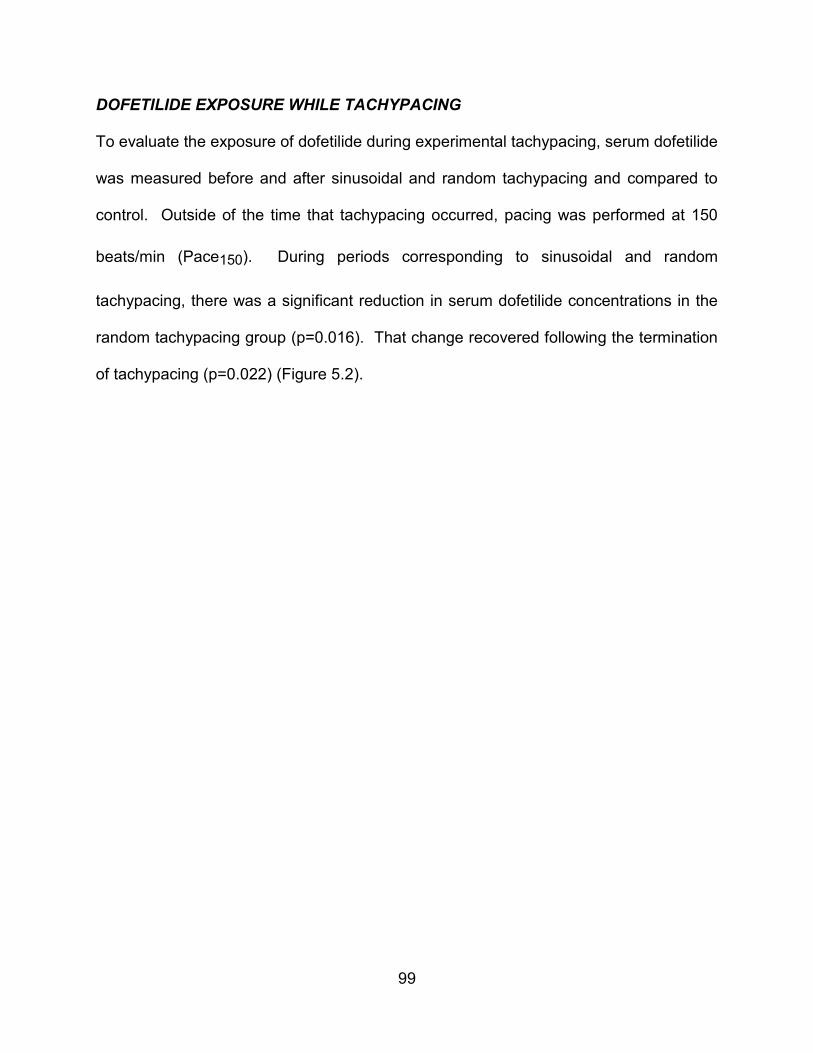
99
DOFETILIDE EXPOSURE WHILE TACHYPACING
To evaluate the exposure of dofetilide during experimental tachypacing, serum dofetilide
was measured before and after sinusoidal and random tachypacing and compared to
control. Outside of the time that tachypacing occurred, pacing was performed at 150
beats/min (Pace150). During periods corresponding to sinusoidal and random
tachypacing, there was a significant reduction in serum dofetilide concentrations in the
random tachypacing group (p=0.016). That change recovered following the termination
of tachypacing (p=0.022) (Figure 5.2).
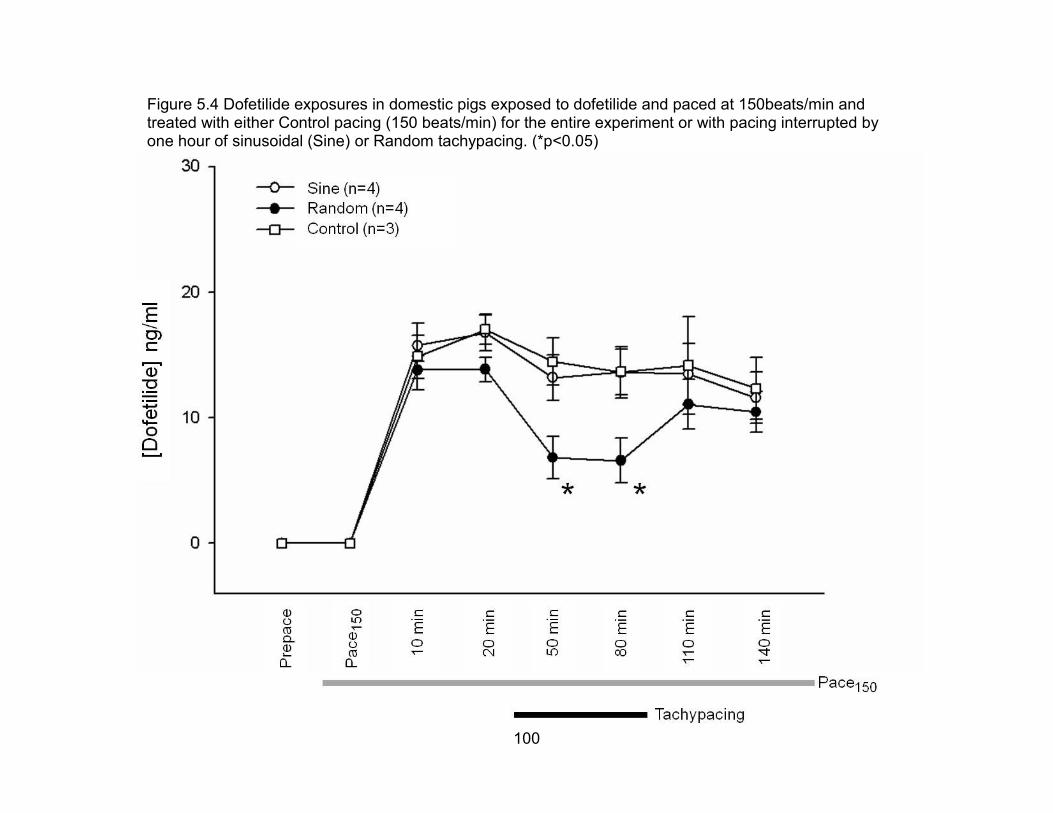
100
Figure 5.4 Dofetilide exposures in domestic pigs exposed to dofetilide and paced at 150beats/min and treated with either Control pacing (150 beats/min) for the entire experiment or with pacing interrupted by one hour of sinusoidal (Sine) or Random tachypacing. (*p<0.05)
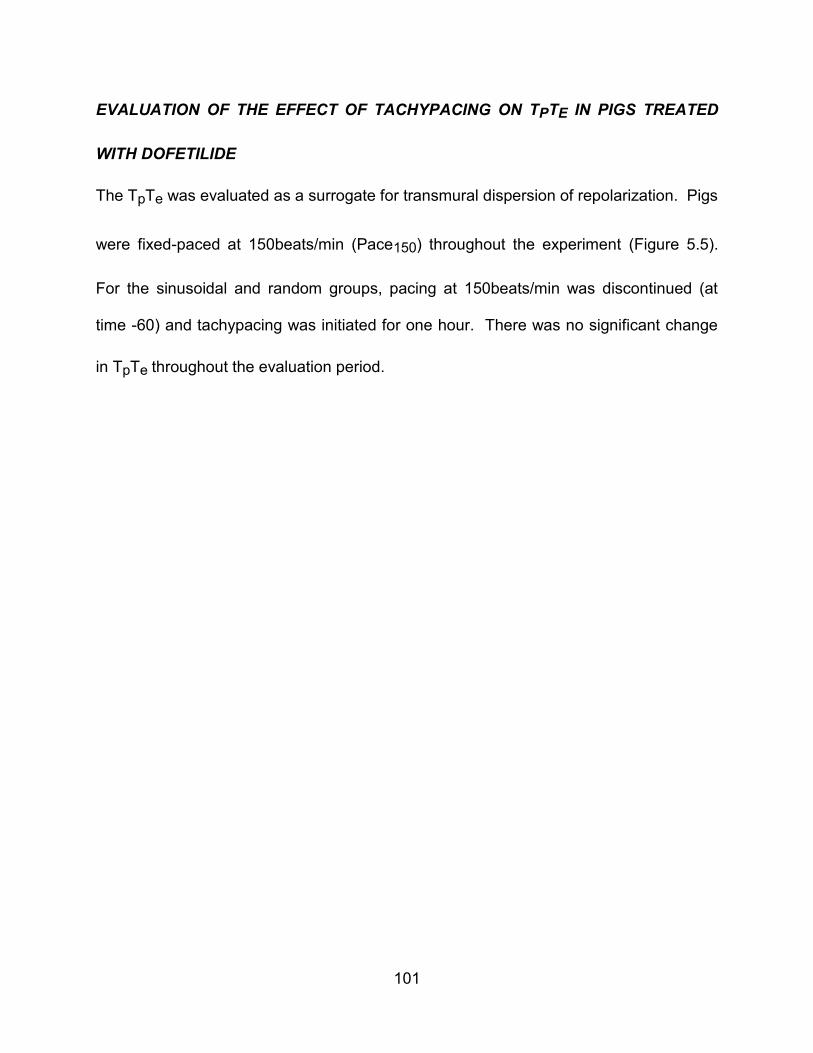
101
EVALUATION OF THE EFFECT OF TACHYPACING ON TPTE IN PIGS TREATED
WITH DOFETILIDE
The TpTe was evaluated as a surrogate for transmural dispersion of repolarization. Pigs
were fixed-paced at 150beats/min (Pace150) throughout the experiment (Figure 5.5).
For the sinusoidal and random groups, pacing at 150beats/min was discontinued (at
time -60) and tachypacing was initiated for one hour. There was no significant change
in TpTe throughout the evaluation period.

102
Figure 5.5 Transmural dispersion of repolarization assessment (TpTe) of dofetilide treated domestic pigs
paced at 150 beats/min for the entire experiment (Dofetilide Time Control) or with pacing interrupted by one hour of sinusoidal (Sine) or Random tachypacing.

103
Table 5.0 QT and TpTe (TpTe) summary of dofetilide treated domestic pigs paced at 150 beats/min for the entire experiment (Control) or with pacing interrupted by one hour of sinusoidal (Sine) or Random tachypacing.
QTI
Rel Time -60 -30 -5 0 5 10 15 20 25 60
Sine RTI 270.7 245.7 244.2 270.7 274.3 272.5 272.0 271.5 270.5 270.4
Sine SEM 4.4 6.5 5.9 3.6 4.0 3.1 2.7 2.9 3.2 3.6
Random RTI 273.4 240.9 239.1 273.4 272.5 270.8 270.5 270.4 270.1 269.6
Random SEM 4.4 5.3 5.2 4.4 6.6 6.3 6.4 6.7 6.7 7.2
Control RTI 261.6 246.6
238.7
236.1 232.6
Control SEM 5.6 6.8
9.5
9.6 10.2
TpTe
Rel Time -60 -30 -5 0 5 10 15 20 25 60
Sine TpTe 48.2 42.6 43.8 43.4 45.2 45.9 45.9 46.0 45.3 45.0
Sine SEM 1.0 2.6 2.6 0.9 1.4 1.2 1.2 1.2 1.0 1.1
Random TpTe 49.5 44.3 43.7 48.0 49.0 48.9 49.5 49.7 49.5 47.8
Random SEM 2.7 3.0 2.7 2.8 3.4 3.1 3.1 3.2 3.1 3.7
Control TpTe 50.0 45.3
46.1
49.1 45.5
Control SEM 3.4 0.5
1.9
1.5 1.4

104
OVERALL CONCLUSION
Dofetilide, an antiarrhythmic that is also proarrhythmic, has a lower serum concentration
during random tachypacing compared to sinusoidal tachypacing, suggesting that the
clinical theory of protection may be due to a pharmacokinetic protective effect during
atrial fibrillation. Random and sinusoidal tachypacing in dofetilide treated pigs is
associated with an increase in the QT interval just after the termination of tachypacing
to levels indistinguishable from pre-tachypacing levels. This suggests that tachycardia
of any type may confer a post-tachycardia vulnerability due to a fast, rather than an
irregular, heart rate.
105
CHAPTER SIX - DISCUSSION
SHORT-TERM IRREGULAR TACHYPACING FAILS TO DIFFERENTIALLY ALTER
COMMONLY USED REPOLARIZATION PARAMETERS WHEN COMPARED TO
REGULARLY VARYING, OR FIXED TACHYPACING
The results of this dissertation do not support the hypothesis that a putative protection
effect during atrial fibrillation is provided by changes in QT interval or QT interval
dynamics. During tachypacing, the QT interval shortened; consistent with its expected
rate dependency. There was no difference between sinusoidal and random
tachypacing for QT interval, TpTe or QT variability. Fixed tachypacing was included in
this arm of the study to mimic a fixed-rate tachycardia such as a rapid supraventricular
arrhythmia. The rate was set to be the average rate of sinusoidal and random pacing.
The QT interval and TpTe evaluation between fixed tachypacing and sinusoidal
tachypacing was not different.
There are several possibilities for these findings including some technical limitations of
the study design and execution. These data were evaluated for several minutes at each
interval spread to include baseline, during tachypacing, and after the termination of
tachypacing. The three time intervals evaluated during tachypacing presented a
particular challenge for data analysis. For each beat during tachypacing, there is a
corresponding pacemaker induced stimulation spike. This spike has the potential to be
106
superimposed on the previous T wave, altering the detection accuracy of the peak-of-T,
or end-of-T fiducial points. This could diminish the accuracy of the QT interval and TpTe
analyses. This need to exclude heart beats vulnerable to this problem had to be
balanced with the need to maintain successful analysis from a large and representative
sample of beats at each heart interval. The selection of heart beats for analysis was
performed by an automated system (EMKA-ECGAuto) that uses user selected ECG
models to select its included beats. This automation could conceivably create a
selection bias favoring beats with morphology that more closely matches the model beat
and inadvertently selects for a subset of all realized heart beat and QT intervals.
However, it is impossible to completely eliminate this limitation because the pacing
spike occurs with a reproducible stimulation to ventricular excitation coupling interval.
Therefore, certain beats will always be impossible to model due to the pacing spike
occurring at the same time as the end of the T-wave. This potential problem is greater
for rhythms with varying heart beat intervals.
Another consideration is the one hour duration of tachypacing. Is this duration too short
for the putative protective effect to emerge? One hour was set as the duration of
tachypacing because it reflects a reasonable period based on previous studies
examining altered electrophysiology as seen in paroxysmal atrial fibrillation. It is also a
reasonable approximation for the total duration of paroxysmal atrial fibrillation.
Electrophysiology studies that examined short term pacing (<30 minutes) showed that
this can increase cardiac refractoriness by 25 msec and that paroxysmal AF, a condition
107
that precedes permanent AF, occurs for short periods, encompassing the one hour
selection (Daoud et al., 1996).
In addition to time, the heart rate window for tachypacing selected for these experiments
might have been unfavorable with regard to detecting RRA protection. The rates
selected were higher than those encountered in most humans with atrial fibrillation, but
were generally proportional since porcine heart rates tend to be higher than humans.
More work would have to be done over a wider range of paced rates to explore this in
detail.
Animals selected for most of these studies were female. This was intentionally done
because human females represent a population that is more susceptible to RRAs.
However, this only is true for humans after sexual maturity (i.e. after puberty). The
mechanism for this is not completely understood but in theory it is dependent on sex
hormones. Female humans, following sexual maturity, have an average QT interval
that is longer than a man. Because these domestic pigs have not attained sexual
maturity, it is unlikely that the sex factor is involved in effecting the results.
The disparity between the findings in this study and the clinical reports of humans
suggesting RRA protection during atrial fibrillation could be explained by several
mechanisms. First, the porcine subjects of this study were a relatively homogeneous
and normal group of immature animals which contrasts with most human clinical atrial
fibrillation cohorts. Moreover, patient referral bias could unknowingly select for a subset
108
of humans predisposed to a certain outcome (RRA protection or vulnerability). Finally,
the outcome of interest in some clinical studies was RRAs, while in these studies,
repolarization surrogates were the primary outcomes. Kaab et al., reported that patients
who experienced RRA with QT interval prolonging drugs, developed more QTc
lengthening after intravenous sotolol (an IKr blocking drug), then those in a RRA
resistant control group even though both groups had normal baseline QTc durations.
(Kaab et al., 2003).
It seems paradoxical that, in the clinic, the achievement and maintenance of sinus
rhythm predisposes susceptible patients to the development of RRAs. However, certain
characteristics of these human clinical studies may contribute to the data being
misinterpreted. In clinical studies, interpretation of results must be considered in light of
the subject’s characteristics. A heterogeneous study group may cloud conclusions, or
may suggest new and interesting lines of research. RRAs are prevalent in patients with
structural heart disease, hypokalemia, or receive non-antiarrhythmic drugs with hERG
channel blocking effects. These important factors have been proposed as explanations
for the protection afforded by atrial fibrillation or the vulnerability after conversion to
sinus rhythm. Some patients with a QTc interval within the normal range may respond
to drug treatment with excessive lengthening of repolarization and arrhythmias,
occasionally leading to sudden cardiac death. In other patients, these drugs do not
even prolong cardiac potential duration or only lengthen it moderately. In accordance
with these observations, these factors were not studied as part of this dissertation. The

109
justification for selecting repolarization as a surrogate for RRA, rather than to study RRA
susceptibility directly was related to the difficulty in predictably quantifying RRA and
answering question that suggest that tachycardia alters global repolarization.
Two other potential explanations for the “negative” results deserve note. First, is the
issue of statistical power. A power analysis was performed prior to conducting the
experiments and as a result we expected to be able to maintain a power level of 0.60 or
greater using an effect size of 0.56 (ratio of average observed difference to the variance
of observed differences – estimated from pilot studies). Only seven were able to be
successfully analyzed due to one animal having data that was not interpretable due to
the pacing spike falling on end of T-wave during fixed pacing and then again at similar
heart intervals during sinusoidal and random tachypacing evaluation. However, the
results do not suggest even a trend for a difference in the QT parameters measured
during tachypacing. Accordingly, an underpowered study is not considered a likely
explanation for the lack of differential repolarization. Finally, the original theory of a
protective effect of atrial fibrillation may simply be wrong.
RECOVERY FROM SHORT-TERM IRREGULAR TACHYPACING IS NOT
ASSOCIATED WITH ALTERED QT OR QT DYNAMICS
Neither QT, QT adaption curves, QT variability, beat-to-beat QT variability, or TpTe are
differentially affected between random and sine wave tachypacing. Due to the potential
error introduced by heart rate correction, these data were analyzed using the absolute
110
QT interval. Although the natural heart rates following termination of the three types of
tachypacing are similar, small changes in the QT interval may be inadvertently missed.
The most effective solution is to introduce fixed-rate pacing at a basal rate lower than
that was used for used to comparing sinusoidal and random tachypacing to
supraventricular arrhythmia. This would then permit the evaluation of dynamical
changes in QT, with a high degree of reliability, so that the main effect would be QT
interval modulation. This method was used for subsequent experiments.
The dynamics of repolarization has been assessed in numerous studies that examine
beat-to-beat variability of repolarization (BVR) and the QT variability index (QTvi).
Poincare plots are used to represent BVR visually and were found in the studies in this
dissertation to be highly variable between animals. Thomsen et al. used BVR to predict
d-sotolol induced RRA in dogs (2004). Similarly, the block of IKr and IKs, a known
combination that promotes risk for RRAs, was predicted by BVR (Lengyel, 2007). This
is also predictive for RRAs in experimental pharmaceutical compounds (e.g. AZD1305),
and summarized in an interesting study by Hinterseer et al., who found that the BVR of
the QT interval is increased in human patients with drug-induced LQT syndrome
(Carlsson et al., 2009; Hinterseer et al., 2008). Ronald Berger at the Johns Hopkins
University developed the formula for QT interval variability (QTvi) as the log-ratio
between the QT interval and heart rate variability, each normalized by the squared
mean of the respective time series, as a measure of RRA risk (Berger et al., 1997).
These studies in normal pigs did not result in values that met statistical significance
111
between sinusoidal and random tachypacing. The fixed pacing group was excluded
from these comparisons because, during pacing, the heart rate variation was zero,
making the application of the formula impossible. Most application of QTvi has been to
subjects in sinus rhythm. Indeed, little is known about its predictive power during real or
simulated atrial fibrillation.
SERUM DOFETILIDE CONCENTRATION IS DECREASED IN RANDOM
TACHYPACING COMPARED TO FIXED OR SINUSOIDAL
An initial examination of the data indicates a possible mechanism for protection during
atrial fibrillation because dofetilide exposure is a proarrhythmic risk factor. During
irregular tachypacing, the serum dofetilide concentration was significantly reduced; a
finding not observed for either fixed or sinusoidal tachypacing. These studies were not
designed to identify a mechanism or explanation for this unexpected result. Rapid
onset and reversible effects on blood pH, and thus dofetilide assay accuracy, or
tachypacing mediated shifts across fluid compartments are speculative mechanisms
that might explain this interesting finding.
Due to the QT prolonging effects of dofetilide, a parallel fall in QT interval would have
been predicted during the time of reduced serum concentration in the randomly paced
group. This did not occur. However, it is possible that the strong reverse-use
dependency of dofetilide attenuates any apparent change in QT interval
responsiveness. It is possible that at lower irregular tachycardic rates, this reduction in
112
serum dofetilide concentration might be associated with changes in QT intervals that
could confer some protection. Darbar et al., found that the cycle length to QT interval
relationship was flat in humans experiencing atrial fibrillation so the lack of a
corresponding change in QT might not indicate the absence of a parallel
electrophysiologic effect (Darbar et al., 2004).
While the results of these studies in pigs did not directly support a protective effect of
tachycardic irregularity, the changing dofetilide concentrations are interesting and
deserve further experimental attention. The altered pharmacokinetics of dofetilide
during random tachypacing should be further explored as a possible explanation for the
putative clinically observed atrial fibrillation protection. There is a lack of data in the
literature on how dofetilide exposures are altered during tachypacing. Enhanced
metabolism does not explain the observed findings because the serum concentrations
recover to pre-tachypacing levels after the termination of tachypacing.
DOFETILIDE ALTERS REPOLARIZATION, BUT DOES NOT ALTER IT
DIFFERENTIALLY FOR RANDOM VERSUS SINUSOIDAL TACHYPACING
The findings did not support an effect of dofetilide to alter repolarization in the post-
irregular pacing period in a way that would suggest increased risk for RRAs relative to
sinusoidal tachypacing. Despite this, during the post-tachycardia period, both
sinusoidal and random pacing have lengthened QT intervals compared to control pigs

113
that were paced at 150 beats/min. This data suggests that tachycardia, and not
irregularity per se, confers heightened risk for RRAs or proarrhythmia.
This post-tachypacing return to prolonged QT intervals has been reported for patients
with atrial fibrillation converted to sinus rhythm. The mechanism appears to be more
complex than simply a return to previously established QT duration as heart rate falls,
since the QT interval of the dofetilide treated control group steadily declines over time.
This is not seen in the tachypacing groups which experience a sustained QT
prolongation, even one hour after cessation of the induced tachycardia. Differential
dofetilide exposure does not explain this disparity since all groups had similar (and
slightly declining) serum concentrations over time. Whatever the mechanism involved,
the results of these studies indicate that protection and post-conversion vulnerability
could be a result of rate related alterations.
The post-tachypacing QT finding has to be interpreted in light of the methodologies
employed. Because of the limitations for heart rate correction formulas mentioned
earlier, the post-tachypacing analyses had to be conducted at a selected, fixed heart
rate. The selection of a pacing rate for this analysis could induce some bias. A rate of
150 beats/min might be non-ideal for detecting post conversion risk. This rate issue is
also likely to be somewhat species specific. Typical resting heart rates for humans are
about 80 beats/min, a rate that is 40 beats/min lower than the average human
ventricular rate during atrial fibrillation (120 beats/min). In pigs the resting heart rate is
higher than humans (116+4.3 beats/min). Therefore, pigs have a natural heart rate that
114
is roughly one-third to one-half greater than adult humans. The average heart rate for
tachypacing in the final arm of these studies was 180 beats/min. This increase is 1/3
higher than the average ventricular rate for humans with untreated atrial fibrillation. This
indicates that the findings within this dissertation are likely relevant to the human
disease.
Atrial fibrillation has a natural heart rate that is higher than the heart rate during sinus
rhythm. A well established risk factor for RRA is a slow heart rate. Therefore, it is
logical that tachycardia itself may provide protection from the development of
arrhythmia. Indeed, it has been shown that temporary pacing, at rates of 90-100
beats/min, can acutely prevent RRAs (Sclarovsky et al., 1979; DiSegni et al., 1980).
However, the mechanism for this has not been defined The QT interval lengthening in
pigs observed after the termination of tachypacing (both sinusoidal and random),
persists for the duration of the monitoring period (one hour). Because of a lack of
preliminary evidence, experiments were not designed to monitor for QT interval
prolongation for over one hour. Although the QT interval prolongation findings are
statistically significant, the physiologic relevance needs to be considered. Bauman et
al., noted in a 23-patient study that 74% of RRAs occurred within one week from the
conversion from atrial fibrillation to sinus rhythm (Bauman et al., 1984). In an 11 patient
study, Roden et al., demonstrated that 75% of RRAs occurred within three days or less
(Roden et al., 1986). However, other reports indicated that the average time to RRA
may be 4.7 years (Oberg et al., 1994). This conflicting evidence suggests that
alterations in repolarization lasting only seconds to minutes may not be physiologically
115
meaningful.
It may be that fast heart rates alone may be responsible for the presumed protection
during atrial fibrillation because the conversion of atrial fibrillation is often (but not
always) accompanied by a sudden slowing in ventricular rate. In a study, involving 12
subjects, the extent of QT interval prolongation was examined during intravenous
dofetilide administration. It was found that, despite there being no heart rate effect, the
extent of QT prolongation in the dofetilide treated group, was greater than in the group
converted to sinus rhythm (Choy et al., 1999).
The results for excess QT interval prolongation observed in the studies performed at
Vanderbilt may represent a unique population (the patients with both atrial fibrillation
and sinus rhythm had equal heart rates) (Choy et al., 1999; Darbar et al., 2004; Darbar
et al., 2008). It is unusual to have ventricular rates that are equivalent during sinus
rhythm and atrial fibrillation. During the conversion of atrial fibrillation to sinus rhythm, it
is far more common to observe a drop in heart rate. Because of the rate dependence of
the QT interval, it can be predicted that a corresponding increase in QT duration will be
observed after conversion to sinus rhythm. In the Vanderbilt studies, it was noted that
patients had a marked increase in QT interval duration after conversion to sinus rhythm,
despite an attenuated heart rate change (Choy et al., 1999). These findings may be
explained by an epiphenomenon that is predicated by a subclinical mutation that
decreases repolarization reserve. In our studies, sinusoidal and randomly paced pigs

116
treated with dofetilide exhibited a decreased QT interval trend that was almost identical
to the dofetilide treated control pigs paced at 150 beats/min. Preliminary predictions
were that tachypacing would produce further QT interval reductions compared to control
pigs. However, this attenuated QT interval reduction is supported by findings in humans
that dofetilide attenuates the QT interval increase during atrial fibrillation (Darbar et al.,
2004). Following the termination of sinusoidal and random tachypacing in dofetilide
treated pigs, the QT interval significantly increased. The increased QT interval occurs
in patients following dofetilide-induced conversion of atrial fibrillation to sinus rhythm
(Choy et al., 1999). The changes we observed did not suggest that there was a
difference between short-term sinusoidal or random tachypacing following its
termination. Yet these findings are provocative because, compared to pigs treated with
dofetilide and paced at 150 beats/min, both of these tachypacing treatments
significantly increased. This directly supports the theory that tachypacing alone (with
dofetilide treatment) may alter repolarization favoring risk following the conversion of
atrial fibrillation to sinus rhythm. It remains possible that the random variation control
(i.e. sinusoidal pacing) may provide the substrate to the heart, equivalent to random
pacing. Perhaps the hearts physiology is altered due to a difference in cycle length that
is not differentiated by the application of this particular type of sinusoidal tachypacing.
Repolarization itself has been shown to be a dynamic feature, exemplified by a study in
by Xiao et al. showing that paced ventricular myocytes treated with dofetilide have
shorter action potential durations and a depressed dofetilide response (Xiao et al.,
2008). One controversial theory has been that antagonism of IKr may lead to
117
compensatory up-regulation of IKs (Lou et al., 2007). This suggests that repolarization
may be regulated through feedback ion channel functioning, and altered by disease or
chronic drug treatment. These factors should be taken into account by pharmacologists
involved in drug discovery and toxicology.
118
CHAPTER SEVEN - SUMMARY
Data presented in this dissertation support results from clinical studies that suggest
heart rate irregularity may contribute to a protection or post-conversion vulnerability. In
this research, an atrial tachypacing model capable of mimicking the irregularity of atrial
fibrillation was established. This irregularity is a defining and unique characteristic of
atrial fibrillation. Once this model was refined, it was used to assess whether irregular
atrial tachypacing alters repolarization dynamics differently that repetitive sinusoidal
tachypacing. This repetitive sinusoidal tachypacing had a variance and average heart
rate equivalent to irregular tachypacing. Sinusoidal, irregular, and fixed-rate atrial
tachypacing treatments were administered to normal, anesthetized domestic pigs, and
demonstrated that irregular short-term tachypacing fails to differentially alter commonly
used repolarization parameters, either during or after the termination of tachypacing.
Having established this finding, dofetilide was selected to block the IKr current, which
has proven to be involved in nearly all forms of drug-induced proarrhythmic liability. The
hypothesis tested was that dofetilide would unmask effects of irregular tachypacing that
are not evident in untreated normal animals. Due to the lack of available data in the
literature, the pharmacokinetics and pharmacodynamics of dofetilide was evaluated in
pigs. The data was used to establish an intravenous dofetilide administration protocol
that produced steady-state serum concentrations, which allowed the study of the effect
of dofetilide on short-term atrial tachypacing in pigs.

119
The main findings described in this dissertation are summarized as follows.
During tachypacing, neither QT interval nor QTvi were significantly different between
tachypacing groups. Similarly, in the post-tachypacing period, none of the
repolarization parameters tested was differentially affected by the type of tachypacing.
These results do not support an effect of irregular (or any type) tachypacing on
repolarization that would likely confer protection against RRAs.
Dofetilide, when administered to pigs, is eliminated in a dual kinetic process in a pattern
that has not been reported before.
Dofetilide, an antiarrhythmic that is also proarrhythmic, has a lower serum concentration
during random tachypacing compared to sinusoidal tachypacing. Though this suggests
a possible mechanism for a protective effect during irregular tachycardias like atrial
fibrillation, the reduction in dofetilide concentrations were not accompanied by evident
changes in repolarization. The significance of this finding requires additional
investigation.
Random and sinusoidal tachypacing in dofetilide treated pigs is associated with an
increase in the RT interval just after the termination of tachypacing that persists for at
least 60 minutes. This persistent elevation in QT interval is different for both forms of
tachypacing relative to control animals. This suggests that tachycardia of any type may
confer a post-tachycardia vulnerability to RRAs due to a fast, rather than an irregular,
120
heart rate. This post tachypacing QT prolongation was only observed in the presence
of IKr blockade, suggesting an important combined effect of tachycardia and drug
induced IKr inhibition.
FUTURE STUDIES
The experiments described in this dissertation use repolarization parameters as a
surrogate for risk for RRAs. Future experiments could include a direct evaluation for the
role of irregularity in the development of RRAs in animals treated with dofetilide. The
selection of an animal model seems to be important for experiments involving dofetilide,
as supported by the pharmacokinetic data in this dissertation that suggests a novel
dual-effect elimination system. This line of study would focus on understanding whether
QT interval changes or altered dofetilide exposure, change the risk for RRAs. Such
experiments require an animal model with predictable ability to generate RRAs, even in
the context of drug (dofetilide) and atrial fibrillation or random tachypacing. If the
prediction of a lower risk for RRA during random tachypacing is validated, then
mechanistic studies would involve altering the dofetilide serum concentration during
random pacing so that it is equivalent to control or sinusoidal pacing. The hypothesis
for this future study would be that the risk for RRA would be equal to control and
sinusoidal pacing. If the QT interval attenuation is then restored during heightened
dofetilide exposure, then it suggested that the risk alteration is mediated though
heightened exposure to dofetilide and that the dofetilide exposure is strongly coupled to
the repolarization currents responsible for QT interval prolongation.

121
Understanding more fully the role of fixed-rate tachypacing during dofetilide treatment is
another important future experiment. Fixed-rate tachypacing at rates equal to the
average for sinusoidal and random would be administered for one hour. If the post-
tachypacing QT interval prolongation is not observed, it indicates that alterations in
heart rate are important to post-tachycardia QT interval lengthening. Additional studies
would be performed and aimed at understanding the precise rate alteration that induces
a QT interval prolongation.
The details relating to IKr block, action potential prolongation, QT interval lengthening,
and RRA risk, are a superb model for translational science. The work toward
understanding the role for random rate tachycardias elucidated here is an example of
findings that may add some clarity in this field. Proarrhythmia has formed the
vulnerable point in drug treatment for atrial fibrillation and other arrhythmias. Based on
findings from this dissertation and expert research in this field, it is hoped that drug
compounds can be found that reduce the potential for RRAs.

122
APPENDICES

123
APPENDIX A - COMPARISON OF HEART RATE – QT INTERVAL RELATIONSHIPS
BETWEEN CONSCIOUS AND ISOFLURANE ANESTHETIZED NORMAL DOMESTIC
PIGS
124
INTRODUCTION
Numerous recent publications have pointed to the inadequacy of using a single heart
rate correction formula for all species and under all conditions (Malik, 2001; Malik, 2002;
Desai et al., 2003; Shah & Hajian, 2003; King et al., 2006). Studies involving the
measurement of the QT interval often rely on having a robust heart rate correction
formula that normalizes the QT interval to the heart rate (Soloviev et al., 2006). This
enables a convenient surrogate measure of repolarization independent of heart rate-
related repolarization alterations. Although imperfect, the corrected QT interval acts as
a surrogate for proarrhythmic risk (Haverkamp et al., 2000).
Studying the QT interval in pigs can play an important role in the assessment of
compounds or other interventions that have effects on cardiac repolarization. Due to
the similarity to humans in cardiac anatomy and ion channel distribution, domestic pigs
are an acceptable model for conduction-related studies (Bharati et al., 1991). This is in
part due to their surface area to organ ratio and electrophysiology being similar to those
of humans (Rubart et al., 1997; Kates et al., 1984), and in part due to the similarity of
the coronary vessels’ reactivity and adrenergic receptor distribution between pigs and
humans, and dissimilarity to other model systems (Hidaka et al., 1985). Previous
studies suggest that pigs can be used as a suitable model of human disease for the
study of drug-induced QT interval prolongation (Kano et al., 2005).

125
The increased proarrhythmic risk associated with prolongation of the QT interval is an
important parameter that is monitored by the US Food and Drug Administration (FDA)
for new drug compounds. Indeed, a QT increase of 6 msec is used by the FDA as a
threshold for heightened concern for repolarization-related arrhythmia or Torsades (E14
Clinical Eval QT/QTc, 2005). Previous work has demonstrated that the degree of
correction formula-induced error similar to, or greater than the 6 msec concern
threshold. Therefore, the error introduced from a correction formula that is non-optimal
may confound the interpretation of proarrhythmic risk (King et al., 2006).
While awake, pigs can be difficult to manipulate; therefore experiments are often
conducted while the subjects are anesthetized. Isoflurane is a commonly used
anesthetic used for the induction and maintenance of general anesthesia. Isoflurane is
known to reduce contractility, depress cardiac output and alter autonomic tone, although
it is one of the least cardiotoxic anesthetics (Gross, 2009). In dogs, every volatile
anesthetic induces QT prolongation and isoflurane causes QTc prolongation
independent of the animal’s autonomic state (Riley, 1988).
Little is known about how cardiac repolarization in the pig is modified by isoflurane-
based anesthesia. The objective of this study is to evaluate the QT interval as a
repolarization parameter, and to establish the heart rate / QT interval relationship,
during caged, unanesthetized periods and compare that to a time period during general
anesthesia. We hypothesize that pigs under isoflurane anesthesia with have a different
126
heart rate / QT relationship than while caged, and the optimum correction formula while
caged will be different than during isoflurane anesthesia.
METHODS
ANIMALS
This study was approved by the All University Animal Care and Use Committee of
Michigan State University and conformed to the Guide for the Care and Use of
Laboratory Animals (NIH Publication No. 85-23, revised 1996).
Farm raised female pigs were acquired from facilities located at Michigan State
University. Food and water was supplied ad libitum. Animals were studied prior to
reaching sexual maturity and had similar weights (average body weight: 34 + 4 kg). All
animals were acclimated prior to data collection for at least 48 hours.
DATA COLLECTION
Caged Experiments
Unanesthetized studies were performed with the animal in isolation from human
contact, fitted with jackets, surface electrocardiogram (ECG) electrodes, and
radiotelemeters. Data collection was for 14 hours and consisted of an equal light and
dark cycle in order to balance potential circadian mediated QT effects and to minimize

127
the exposure to noise from caretakers. Data collection began at 6PM and continued
until 8AM the following day (Figure A.1).
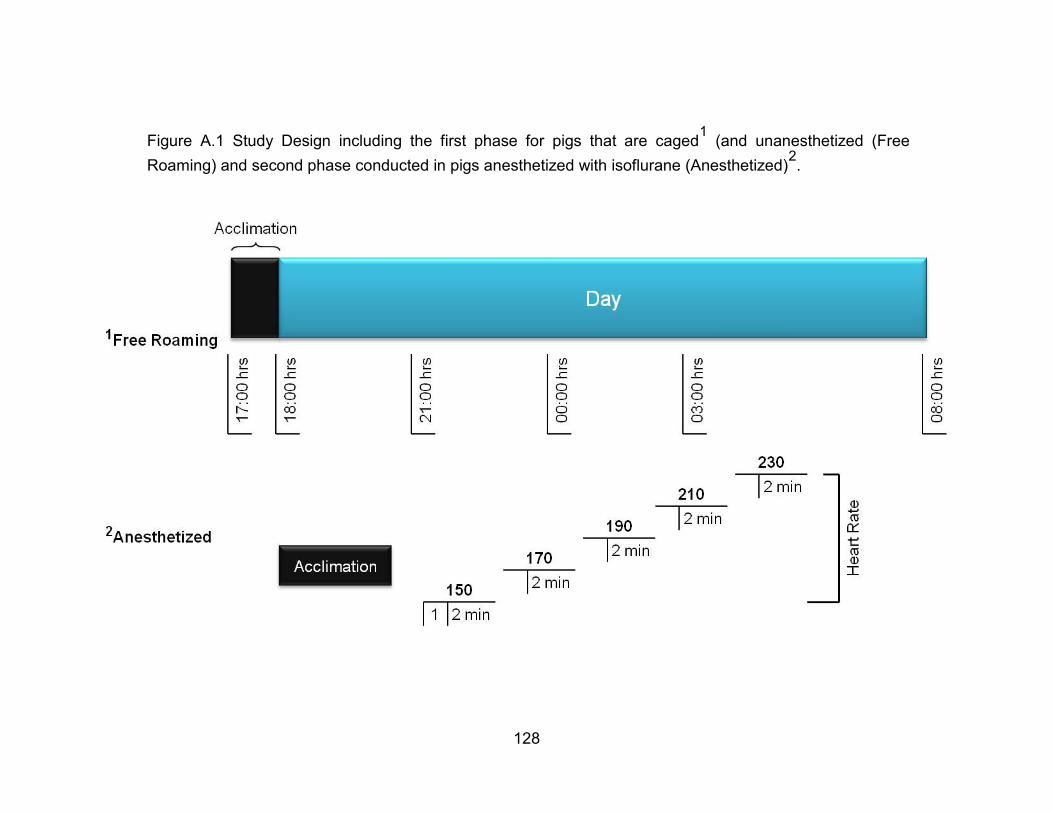
128
Figure A.1 Study Design including the first phase for pigs that are caged1 (and unanesthetized (Free
Roaming) and second phase conducted in pigs anesthetized with isoflurane (Anesthetized)2.
129
Data collection was performed gathering ECG data in a modified lead configuration
pattern for analysis of repolarization and heart rate parameters. The Nehb-Spori lead
system (position 1) was used for analysis because it has been shown to allow the
greatest precision for marking the T-end in the caged-unanesthetized pig (Nahas et al.,
2002). The Nehb-Spori lead corresponding to standard lead II was used for the heart
rate / QT assessment.
Anesthetized Experiments
Anesthesia was induced and maintained by inhaled isoflurane (Abbott Laboratories,
Chicago, IL) mixed with oxygen. Following endotracheal intubation the animal was
placed on a ventilator (Hallowell EMC, Pittsfield, MA) at a rate (18 + 2 breaths/minute)
and tidal volume (400 + 75 ml) to maintain an end tidal CO2 (Datascope Corp,
Paramus, NJ) of 35-45 Torr. Intravenous access was achieved through the ear vein
and external jugular vein. Intravenous isotonic fluid (Lactated Ringers) was
administered at a rate of 2.2 ml/kg/hour.
Pacing was performed with a dacron electrophysiology catheter (St. Jude Medical,
Minneapolis, MN) advanced into the high right atria through a jugular vein that was
isolated and accessed surgically. The position was confirmed with fluoroscopy and the
voltage for stimulation (SD9 - Grass Product Group, W. Warwick, RI) was established
based on doubling the pacing threshold. ECG signals were collected at a sample rate
of 1 kHz on a digital recording system using lead V1 for heart rate / QT interval analysis.
Subjects underwent a high right-atrial tachypacing ramp at 150, 170, 190, 210 and 230
130
beats per minute for three minute durations. The first minute was excluded from the
analysis due to the potential for bias stemming from any repolarization memory effect
(Figure A.1). Baseline parameters were analyzed following one hour of isoflurane
anesthesia using the exact Nehb-Spori lead configuration and telemetry system used
for the caged data collection.
ANALYSIS
Data was acquired using EMKA-Iox (v1.8.9.9) and interval measurements performed on
EMKA-ECG auto version 2.5.1.31 (EMKA Technologies, Paris, France). EMKA utilizes
a shape-based algorithm to identify the beginning and ending of time periods. Template
beats were extracted to form a library consisting of the minimal number of beats (3 + 2)
to reach an acceptable yield and for the data for heart rate step changes, a model beat
was used for each of the five step changes. All interpretable ECG complexes were
taken over 14 hours for the free roaming and the final 2 of 3 minutes at each paced,
heart rate step increment. Baseline data was collected during anesthetized during a 15
minute period prior a pacing intervention. We considered the successful evaluation of a
minimum of 80% of recorded intervals to be an acceptable yield. The RT interval was
substituted for the QT interval to improve the imprecision based on marking the
beginning of the Q-wave fiduciary point. The R-wave, T-peak and the end-of-T were
identified by a zero-slope, first derivative function derived from the ECG (Figure A.2).
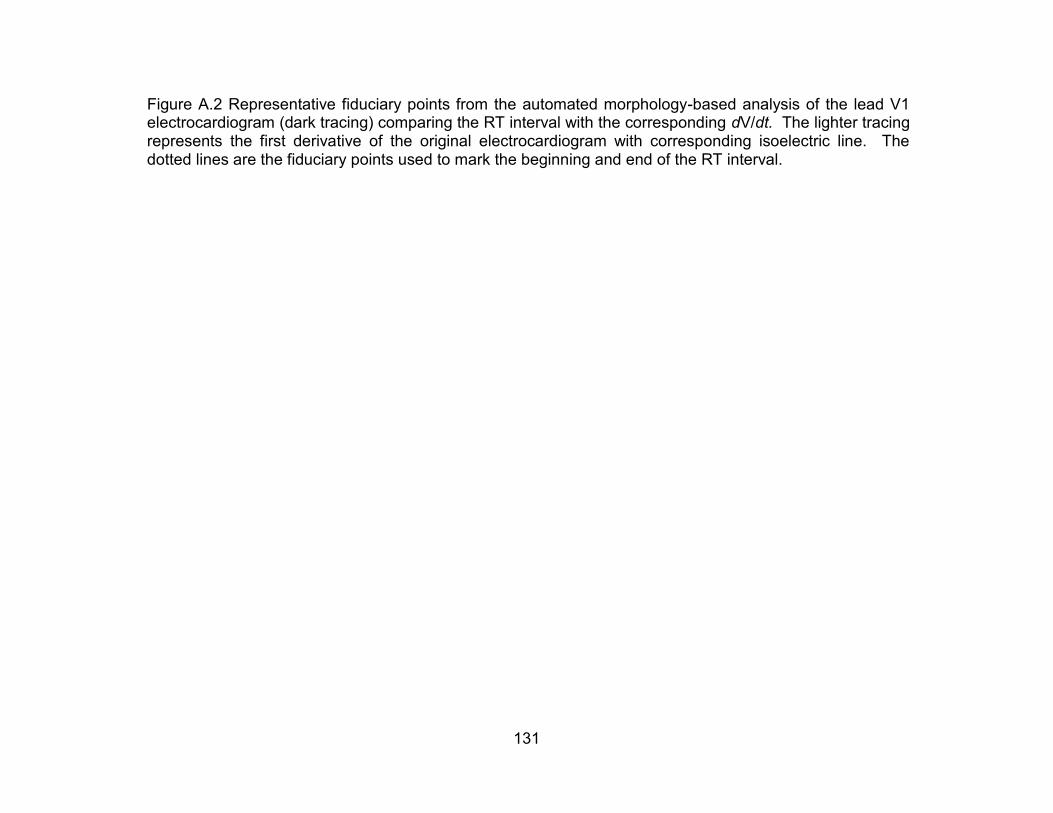
131
Figure A.2 Representative fiduciary points from the automated morphology-based analysis of the lead V1 electrocardiogram (dark tracing) comparing the RT interval with the corresponding dV/dt. The lighter tracing represents the first derivative of the original electrocardiogram with corresponding isoelectric line. The dotted lines are the fiduciary points used to mark the beginning and end of the RT interval.

132
Figure A.2 (Cont’d)
133
The central tendency of the data is presented as mean plus or minus the standard error
of the mean (SEM). A paired t-test was used to compare baseline electrocardiographic
data between caged and isoflurane anesthesia conditions and the residual slopes
between treatments. Differences were considered to be significant at p<0.05.
RESULTS
BASELINE CHARACTERISTICS
Electrocardiographic parameters relevant to repolarization are summarized in Table
A.1. The QT and RT interval was significantly different between caged pigs and pigs
under isoflurane-based anesthesia, while the remaining parameters (heart rate and
Tpeak to Tend) were not significantly different.

134
Table A.1 Summarized values for measured electrocardiographic parameters, instantaneous heart rate (beats per minute), R to R interval
(msec), QT/RT interval (msec), the peak of T to the end of T wave (Tpeak
– Tend), and the duration of the QRS complex in caged and isoflurane
anesthetized domestic pigs (n=9).
Baseline ECG Parameters
Caged SEM Anesthetized SEM P-value
Heart Rate 119.6 0.15 106.9 0.09 0.19
R-R Interval 515.9 0.63 576.1 0.43 0.15
QT Interval 270.3 0.13 309.3 0.10 0.04*
RT Interval 254.1 0.13 289.9 0.10 0.02*
Tpeak - Tend 42.5 0.03 46.6 0.04 0.92
QRS Duration 52.6 0.03 57.1 0.02 0.15
PR Interval 100.0 0.06 97.6 0.05 0.37
135
CAGED HEART RATE – RT AND RTC INTERVAL RELATIONSHIP
The slope of the heart rate / RT relationship within the data gathered under caged
unanesthetized conditions compared to the same data limiting the heart rate to 150 to
230 beats/min was not significantly different (-0.76+0.08 versus -1.32+0.11,
respectively). Following the application of formula based correction, various formulas
over and under-corrected for heart rate based on the residual slope. Table A.2 shows
the residual slope comparison between full and limited heart rate conditions for caged
animals with each of 29 correction formulas applied. The variance between subjects for
each of these correction formulas is high between the full and limited heart rate data
(Figure A.4).
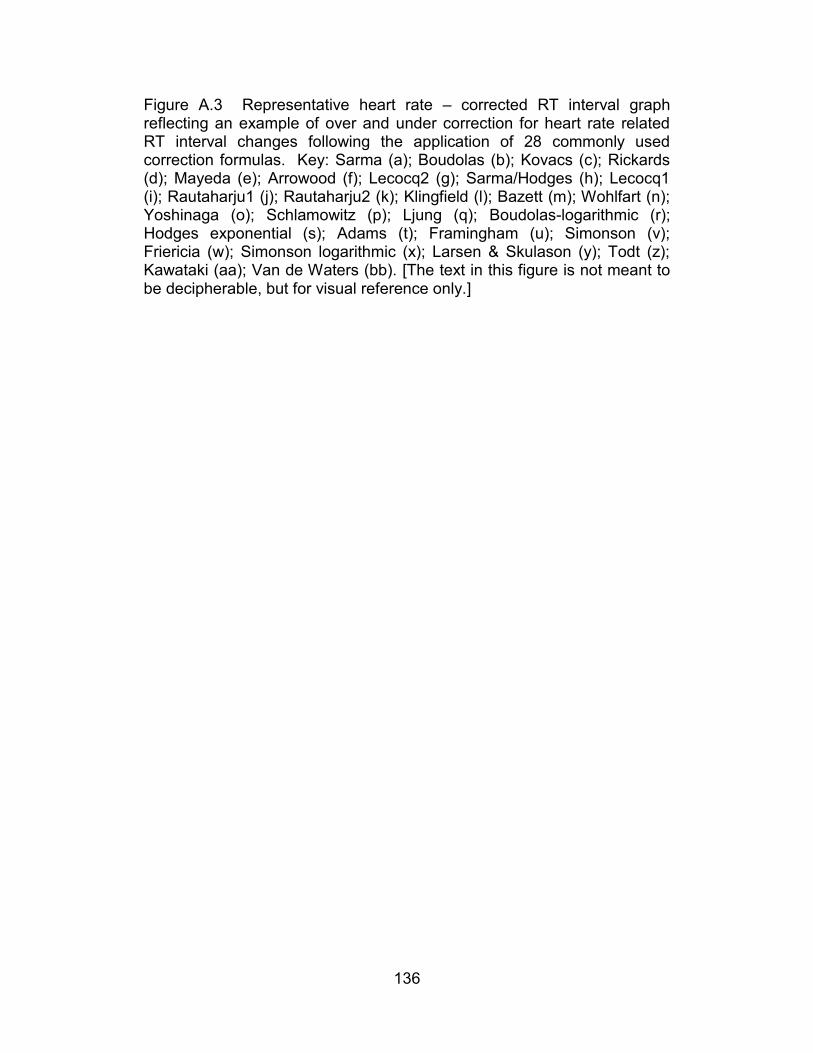
136
Figure A.3 Representative heart rate – corrected RT interval graph reflecting an example of over and under correction for heart rate related RT interval changes following the application of 28 commonly used correction formulas. Key: Sarma (a); Boudolas (b); Kovacs (c); Rickards (d); Mayeda (e); Arrowood (f); Lecocq2 (g); Sarma/Hodges (h); Lecocq1 (i); Rautaharju1 (j); Rautaharju2 (k); Klingfield (l); Bazett (m); Wohlfart (n); Yoshinaga (o); Schlamowitz (p); Ljung (q); Boudolas-logarithmic (r); Hodges exponential (s); Adams (t); Framingham (u); Simonson (v); Friericia (w); Simonson logarithmic (x); Larsen & Skulason (y); Todt (z); Kawataki (aa); Van de Waters (bb). [The text in this figure is not meant to be decipherable, but for visual reference only.]
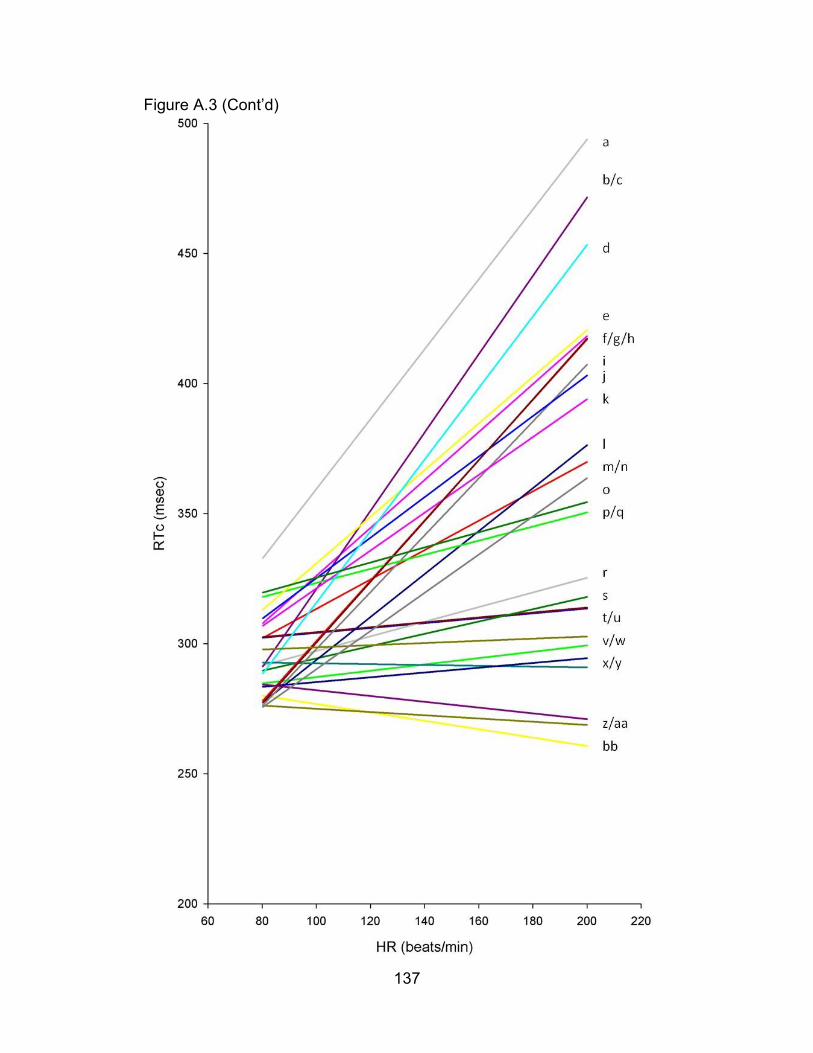
137
Figure A.3 (Cont’d)
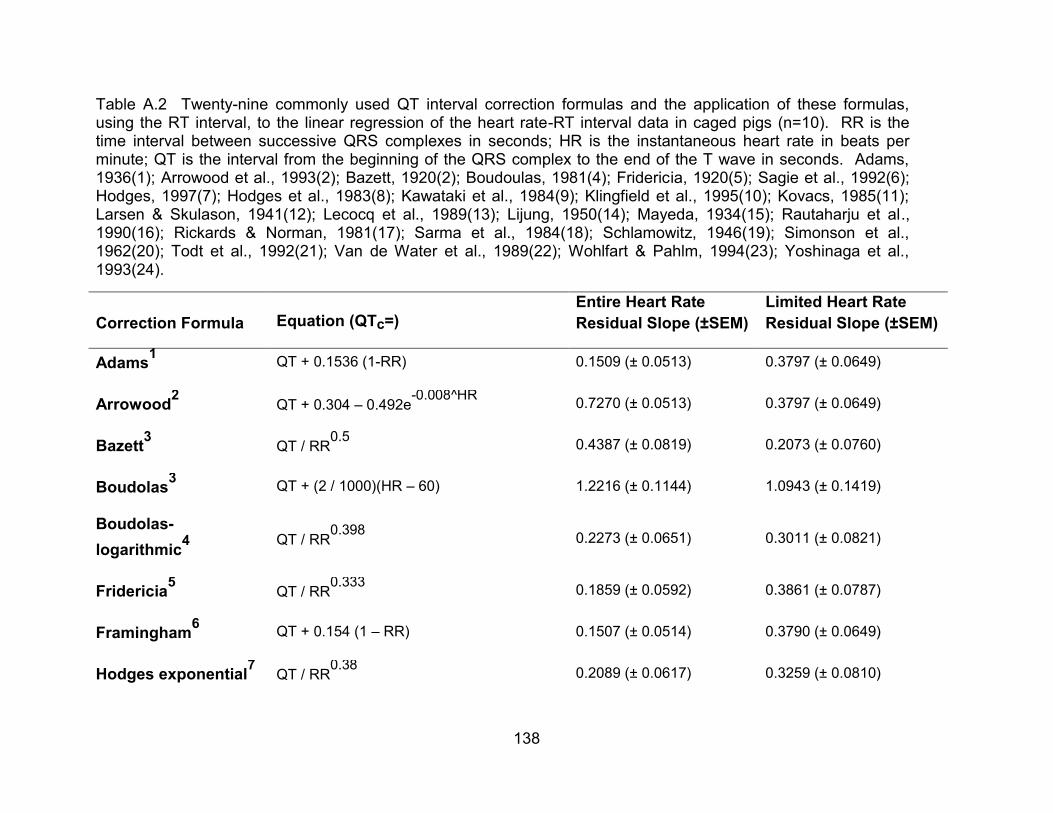
138
Table A.2 Twenty-nine commonly used QT interval correction formulas and the application of these formulas, using the RT interval, to the linear regression of the heart rate-RT interval data in caged pigs (n=10). RR is the time interval between successive QRS complexes in seconds; HR is the instantaneous heart rate in beats per minute; QT is the interval from the beginning of the QRS complex to the end of the T wave in seconds. Adams, 1936(1); Arrowood et al., 1993(2); Bazett, 1920(2); Boudoulas, 1981(4); Fridericia, 1920(5); Sagie et al., 1992(6); Hodges, 1997(7); Hodges et al., 1983(8); Kawataki et al., 1984(9); Klingfield et al., 1995(10); Kovacs, 1985(11); Larsen & Skulason, 1941(12); Lecocq et al., 1989(13); Lijung, 1950(14); Mayeda, 1934(15); Rautaharju et al., 1990(16); Rickards & Norman, 1981(17); Sarma et al., 1984(18); Schlamowitz, 1946(19); Simonson et al., 1962(20); Todt et al., 1992(21); Van de Water et al., 1989(22); Wohlfart & Pahlm, 1994(23); Yoshinaga et al., 1993(24).
Correction Formula Equation (QTc=)
Entire Heart Rate
Residual Slope (±SEM)
Limited Heart Rate
Residual Slope (±SEM)
Adams1
QT + 0.1536 (1-RR) 0.1509 (± 0.0513) 0.3797 (± 0.0649)
Arrowood2
QT + 0.304 – 0.492e-0.008^HR
0.7270 (± 0.0513) 0.3797 (± 0.0649)
Bazett3
QT / RR0.5
0.4387 (± 0.0819) 0.2073 (± 0.0760)
Boudolas3
QT + (2 / 1000)(HR – 60) 1.2216 (± 0.1144) 1.0943 (± 0.1419)
Boudolas-
logarithmic4 QT / RR
0.398 0.2273 (± 0.0651) 0.3011 (± 0.0821)
Fridericia5
QT / RR0.333
0.1859 (± 0.0592) 0.3861 (± 0.0787)
Framingham6
QT + 0.154 (1 – RR) 0.1507 (± 0.0514) 0.3790 (± 0.0649)
Hodges exponential7
QT / RR0.38
0.2089 (± 0.0617) 0.3259 (± 0.0810)
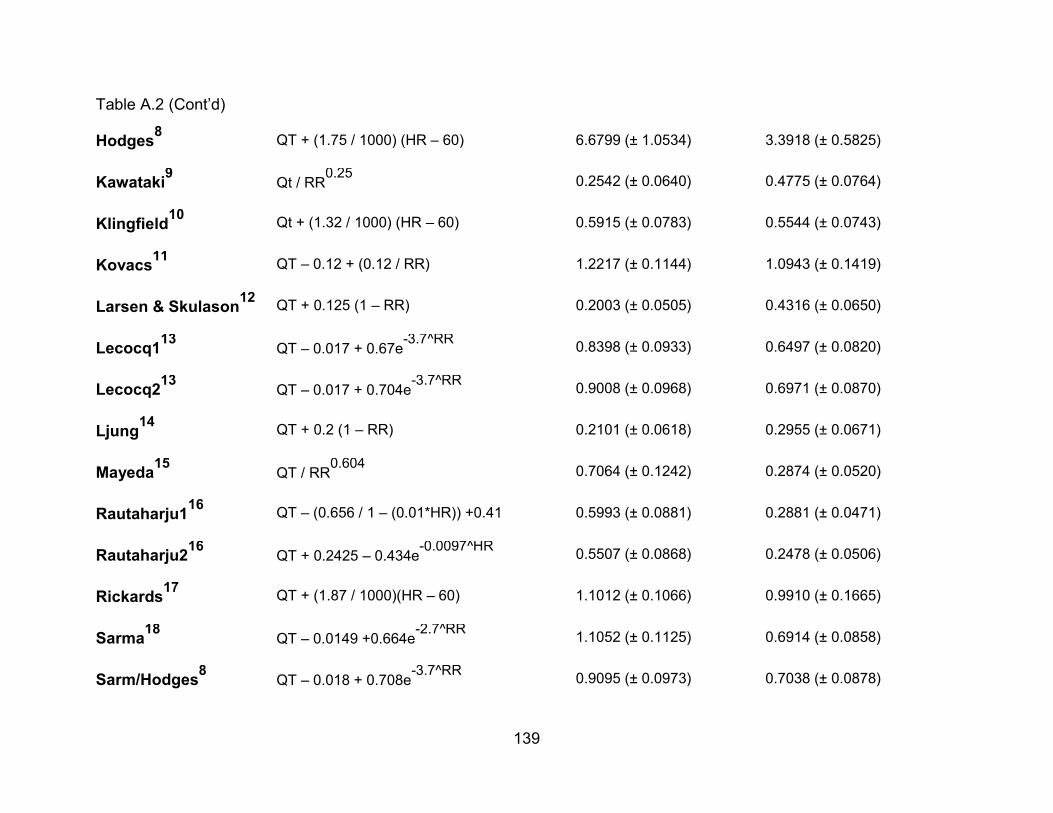
139
Table A.2 (Cont’d)
Hodges8
QT + (1.75 / 1000) (HR – 60)
6.6799 (± 1.0534)
3.3918 (± 0.5825)
Kawataki9
Qt / RR0.25
0.2542 (± 0.0640) 0.4775 (± 0.0764)
Klingfield10
Qt + (1.32 / 1000) (HR – 60) 0.5915 (± 0.0783) 0.5544 (± 0.0743)
Kovacs11
QT – 0.12 + (0.12 / RR) 1.2217 (± 0.1144) 1.0943 (± 0.1419)
Larsen & Skulason12
QT + 0.125 (1 – RR) 0.2003 (± 0.0505) 0.4316 (± 0.0650)
Lecocq113
QT – 0.017 + 0.67e-3.7^RR
0.8398 (± 0.0933) 0.6497 (± 0.0820)
Lecocq213
QT – 0.017 + 0.704e-3.7^RR
0.9008 (± 0.0968) 0.6971 (± 0.0870)
Ljung14
QT + 0.2 (1 – RR)
0.2101 (± 0.0618) 0.2955 (± 0.0671)
Mayeda15
QT / RR0.604
0.7064 (± 0.1242) 0.2874 (± 0.0520)
Rautaharju116
QT – (0.656 / 1 – (0.01*HR)) +0.41 0.5993 (± 0.0881) 0.2881 (± 0.0471)
Rautaharju216
QT + 0.2425 – 0.434e-0.0097^HR
0.5507 (± 0.0868) 0.2478 (± 0.0506)
Rickards17
QT + (1.87 / 1000)(HR – 60) 1.1012 (± 0.1066) 0.9910 (± 0.1665)
Sarma18
QT – 0.0149 +0.664e-2.7^RR
1.1052 (± 0.1125) 0.6914 (± 0.0858)
Sarm/Hodges8
QT – 0.018 + 0.708e-3.7^RR
0.9095 (± 0.0973) 0.7038 (± 0.0878)

140
Table A.2 (Cont’d)
Schlamowitz19
QT + 0.205 (1 - RR)
0.2249 (± 0.0630)
0.2864 (± 0.0675)
Simonson20
QT + 0.14 (1 – RR) 0.1668 (± 0.0507) 0.4044 (± 0.0648)
Simonson
logarithmic20 QT / RR
0.32 0.1849 (± 0.0607) 0.4017 (± 0.0782)
Todt21
QT + 0.1 (1 - RR) 0.2699 (± 0.0551) 0.4770 (± 0.0659)
Van de Water22
QT + 0.087 (1 – RR) 0.3061 (± 0.0616) 0.4956 (± 0.0672)
Wohlfart23
QT + (1.23 / 1000)(HR – 60) 0.5080 (± 0.0747) 0.4829 (± 0.0700)
Yoshinaga24
QT / RR0.31
0.1868 (± 0.0619) 0.4133 (± 0.0778)
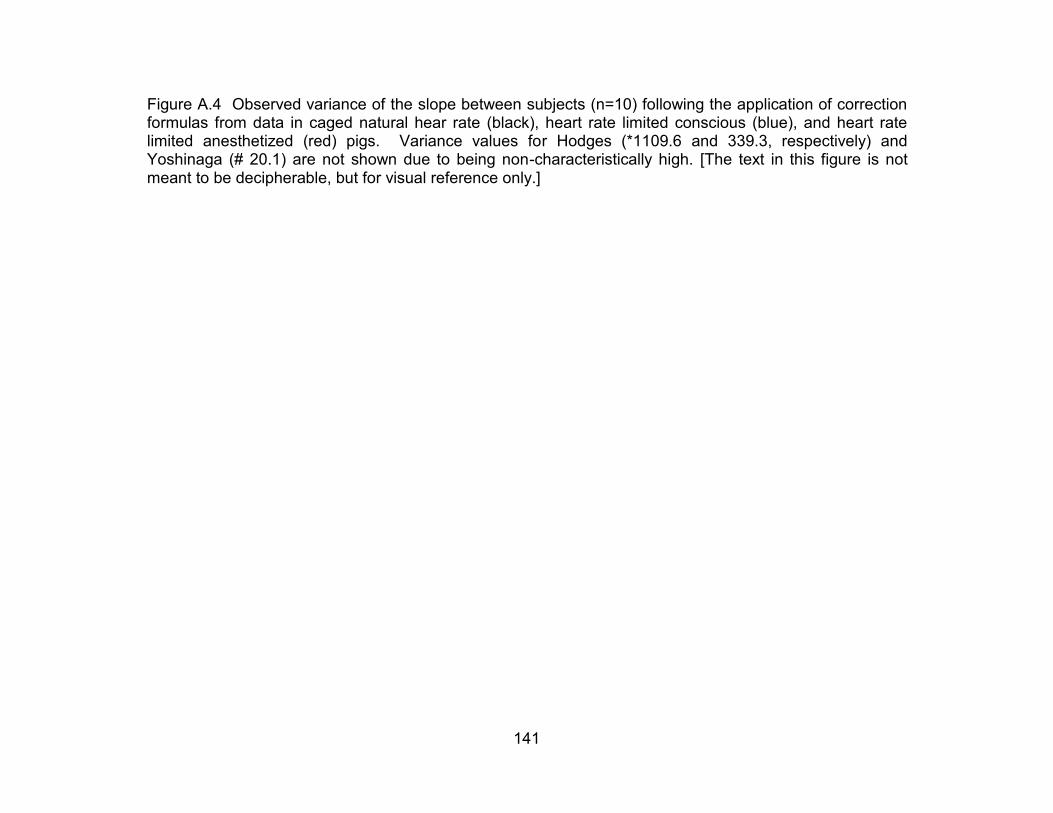
141
Figure A.4 Observed variance of the slope between subjects (n=10) following the application of correction formulas from data in caged natural hear rate (black), heart rate limited conscious (blue), and heart rate limited anesthetized (red) pigs. Variance values for Hodges (*1109.6 and 339.3, respectively) and Yoshinaga (# 20.1) are not shown due to being non-characteristically high. [The text in this figure is not meant to be decipherable, but for visual reference only.]
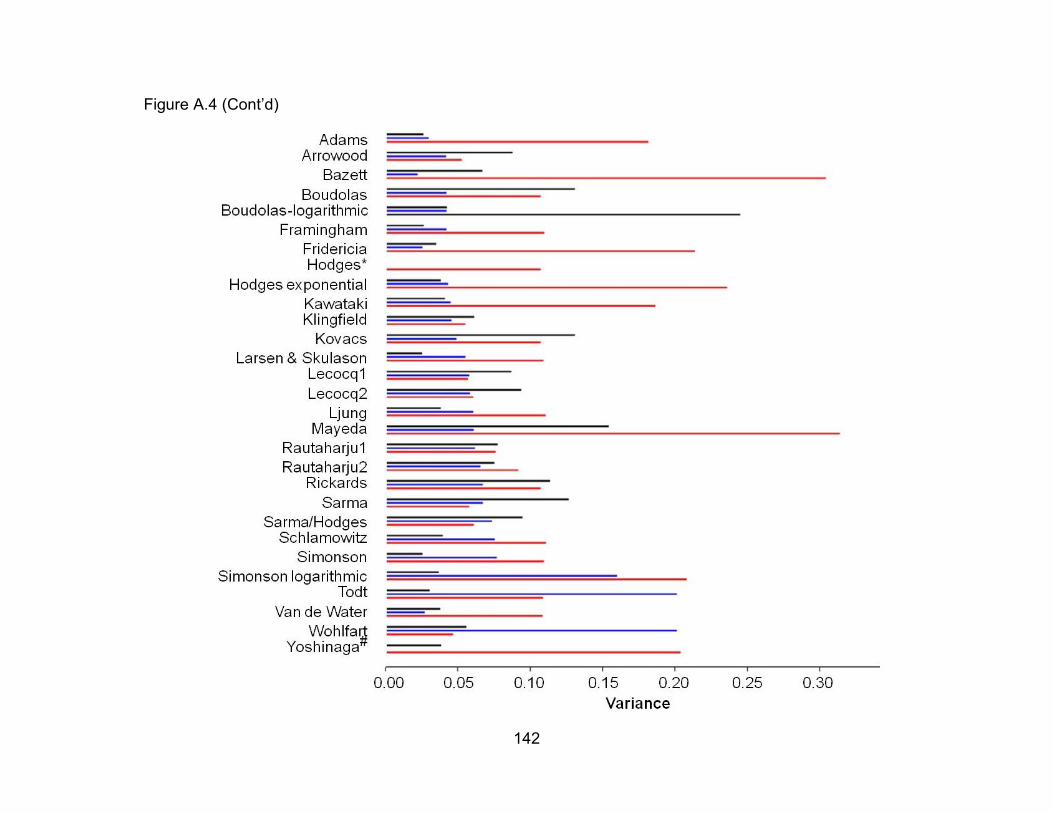
142
Figure A.4 (Cont’d)
143
ANESTHETIZED HEART RATE – QT AND QTC INTERVAL RELATIONSHIP
Following the application of formula based correction, various formulas over and under-
corrected for heart rate based on the residual slope. Table A.3 shows the residual
slope, with each of 29 correction formulas applied, for correction formulas applied to
pigs undergoing pacing-induced step changes in heart rate. The variance of the slope
between subjects for each of these correction formulas is highly variable between caged
and anesthetized with a limited heart rate data (Figure A.4).
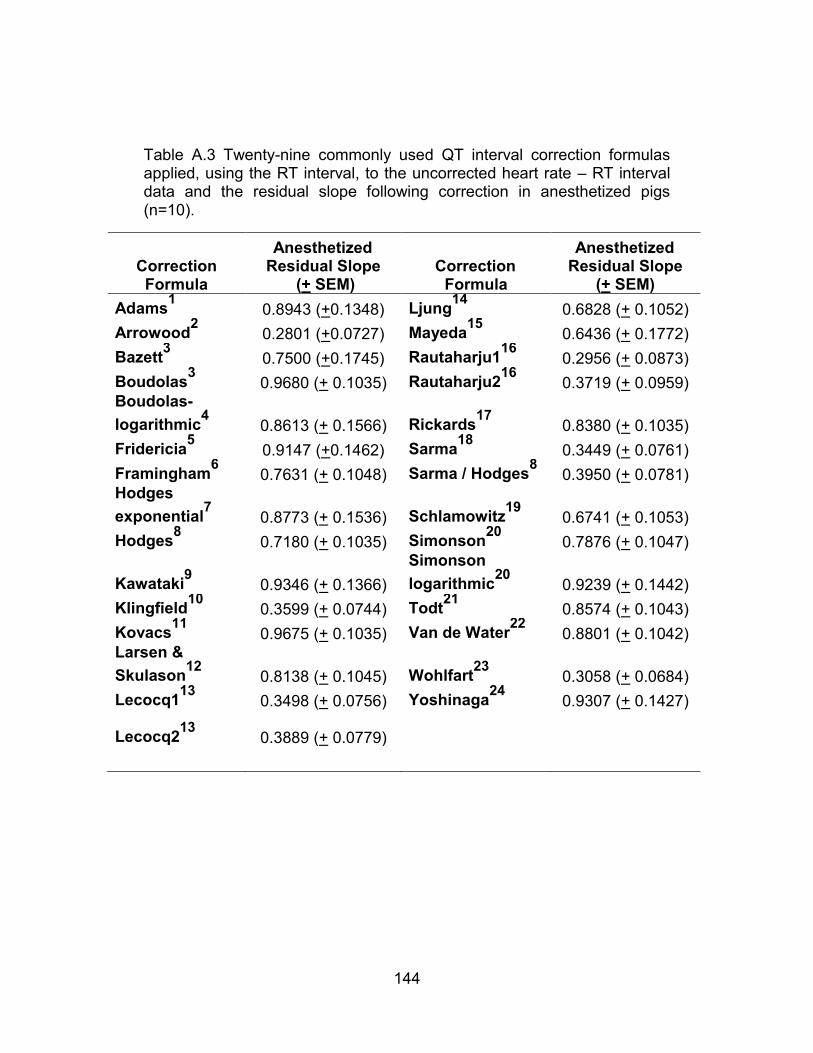
144
Table A.3 Twenty-nine commonly used QT interval correction formulas applied, using the RT interval, to the uncorrected heart rate – RT interval data and the residual slope following correction in anesthetized pigs (n=10).
Correction Formula
Anesthetized Residual Slope
(+ SEM) Correction
Formula
Anesthetized Residual Slope
(+ SEM)
Adams1
0.8943 (+0.1348) Ljung14
0.6828 (+ 0.1052)
Arrowood2
0.2801 (+0.0727) Mayeda15
0.6436 (+ 0.1772)
Bazett3
0.7500 (+0.1745) Rautaharju116
0.2956 (+ 0.0873)
Boudolas3
0.9680 (+ 0.1035) Rautaharju216
0.3719 (+ 0.0959) Boudolas-
logarithmic4
0.8613 (+ 0.1566) Rickards17
0.8380 (+ 0.1035)
Fridericia5
0.9147 (+0.1462) Sarma18
0.3449 (+ 0.0761)
Framingham6
0.7631 (+ 0.1048) Sarma / Hodges8
0.3950 (+ 0.0781) Hodges
exponential7
0.8773 (+ 0.1536) Schlamowitz19
0.6741 (+ 0.1053)
Hodges8
0.7180 (+ 0.1035) Simonson20
0.7876 (+ 0.1047)
Kawataki9
0.9346 (+ 0.1366)
Simonson
logarithmic20
0.9239 (+ 0.1442)
Klingfield10
0.3599 (+ 0.0744) Todt21
0.8574 (+ 0.1043)
Kovacs11
0.9675 (+ 0.1035) Van de Water22
0.8801 (+ 0.1042) Larsen &
Skulason12
0.8138 (+ 0.1045) Wohlfart23
0.3058 (+ 0.0684)
Lecocq113
0.3498 (+ 0.0756) Yoshinaga24
0.9307 (+ 0.1427)
Lecocq213
0.3889 (+ 0.0779)
145
DISCUSSION
The inadequacies of QT interval correction have been previously described. The
problem extends to domestic pigs as well. A superior, or even consistently better, set
of correction formulas that could be used across all experimental conditions was not
identified from the data of this study. The pigs of this study were domestic pigs which
are only suitable for short term studies, because of their rapid growth rates. For
chronic research studies, minipigs are more commonly used. Further work would be
needed to determine if the results of this study are applicable to other porcine strains.
This study supports the state dependence of the heart rate – QT interval relationship.
The formula that corrects for the confounding effects of heart rate changes is different
during isoflurane-based general anesthesia than during caged, unanesthetized periods.
Isoflurane is a commonly employed drug during experimental procedures, and
investigators studying repolarization should be aware of the potential bias when making
QT comparisons between these two physiologic states.
Awake and unrestrained pigs, have a high degree of variance in the residual slope of
the corrected QT relationship. This was true for all of the correction formulas studied.
No single formula in this study was found to be uniquely superior for correction. This is
consistent with the Nahas et al., who reported that, individual corrections for Gottingen
minipigs were superior to population based correction formulas (Nahas et al., 2002).
146
Several population based correction formulas performed well by having a residual-slope
approximating zero. Specifically, for domestic swine that are not anesthetized, Adams,
Framingham and Simonson formulas are preferred. Isoflurane is a commonly used
anesthetic that is known to cause prolongation of the QT interval; however, its effect on
the heart rate-QT interval relationship has not been resolved. Under this anesthesia,
the heart rate / QT interval relationship is altered and different correction formulas
provide more robust correction. The top formulas in this study were Arrowood,
Rautaharju1 and Wohlfart. However, this relationship was evaluated only for
tachycardic heart rates and this interpretation must take that into consideration.
LIMITATIONS
Our pacing ramps were performed under a limited range of tachycardic heart rates.
This was done as to allow for overdrive high right atrial pacing. Indeed, while most
correction formulas were derived from naturally occurring changes in the QT interval,
other possible mechanisms may participate in the heart rate – QT relationship. Care
should be used when drawing conclusions from this data outside of these heart rates
and in light of the possible bias in accuracy. However, our results are consistent with
previous studies that predict that the heart rate – QT relationship would be different
depending on the physiologic state (awake versus anesthetized).
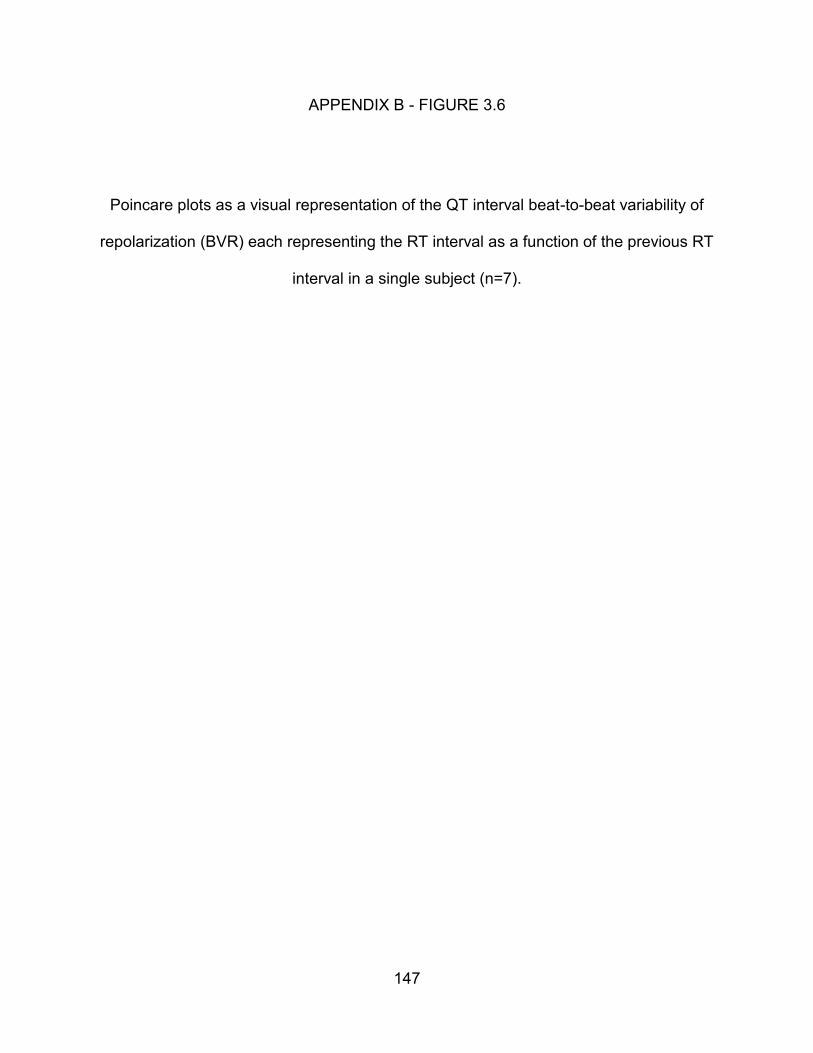
147
APPENDIX B - FIGURE 3.6
Poincare plots as a visual representation of the QT interval beat-to-beat variability of
repolarization (BVR) each representing the RT interval as a function of the previous RT
interval in a single subject (n=7).
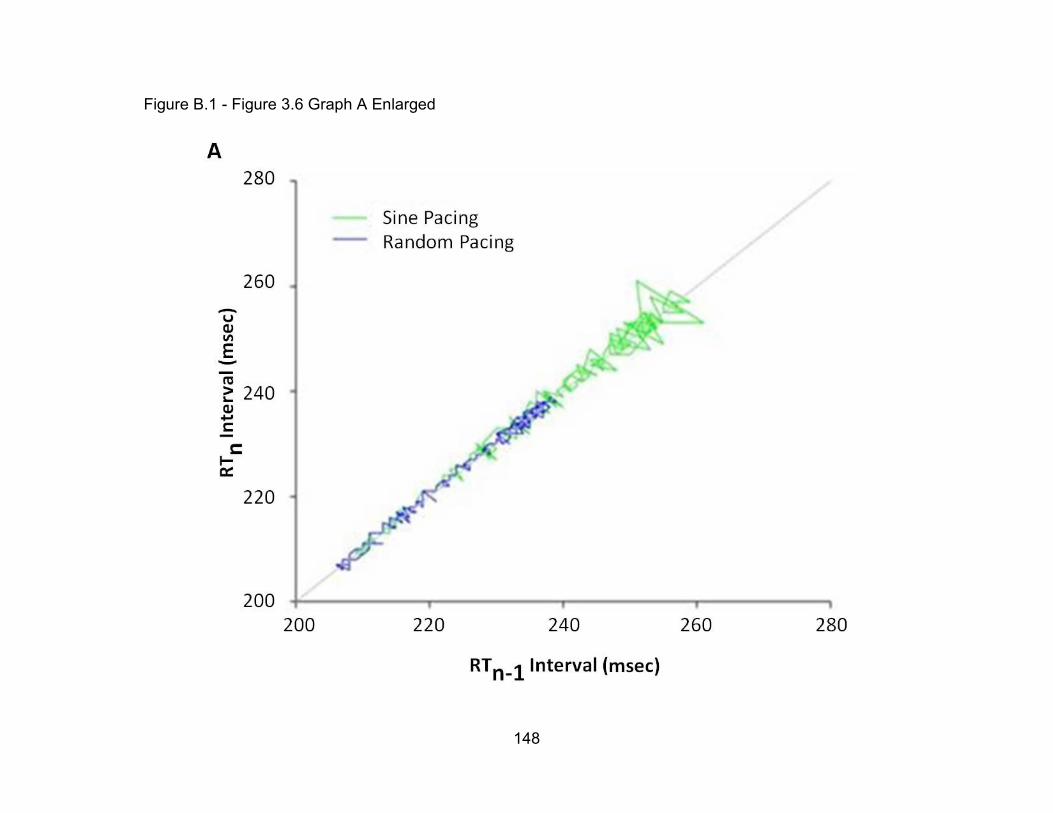
148
Figure B.1 - Figure 3.6 Graph A Enlarged
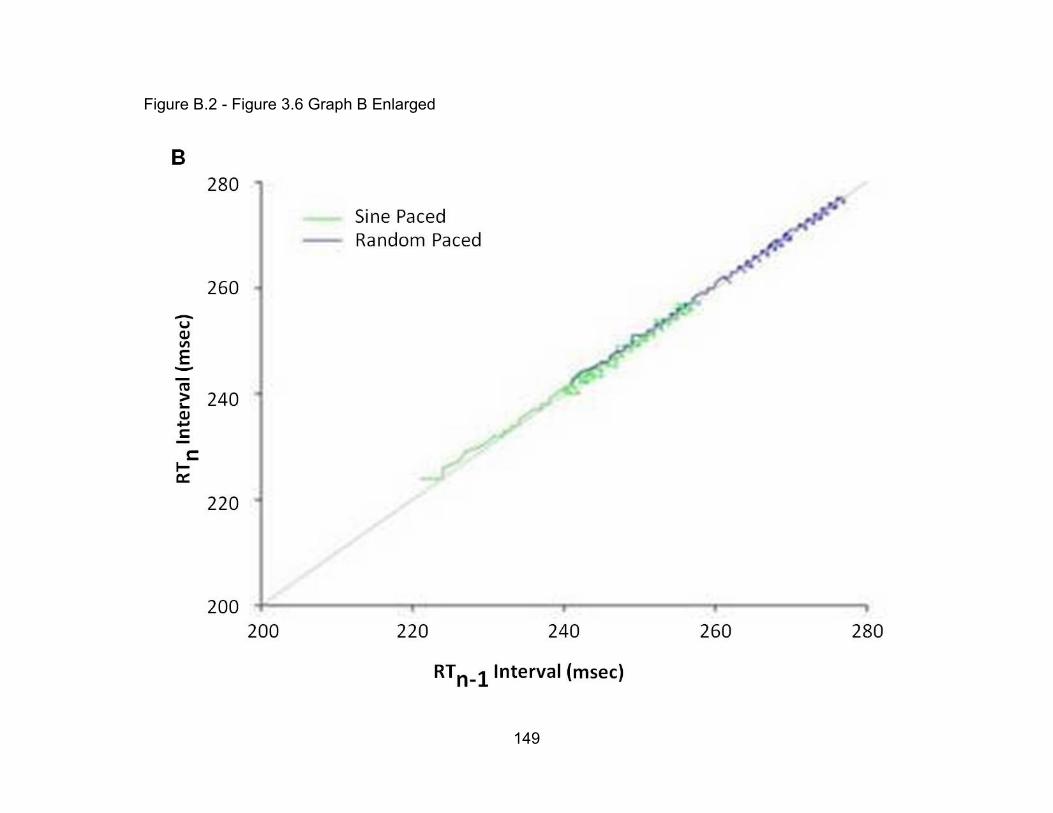
149
Figure B.2 - Figure 3.6 Graph B Enlarged
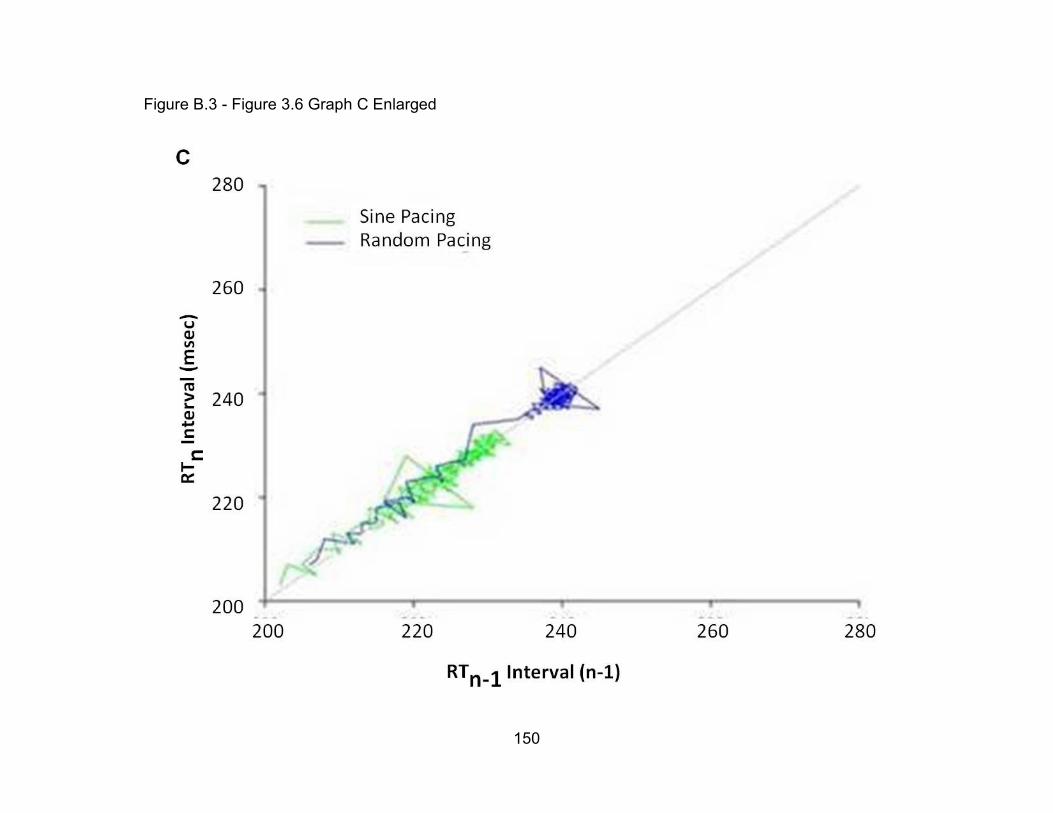
150
Figure B.3 - Figure 3.6 Graph C Enlarged
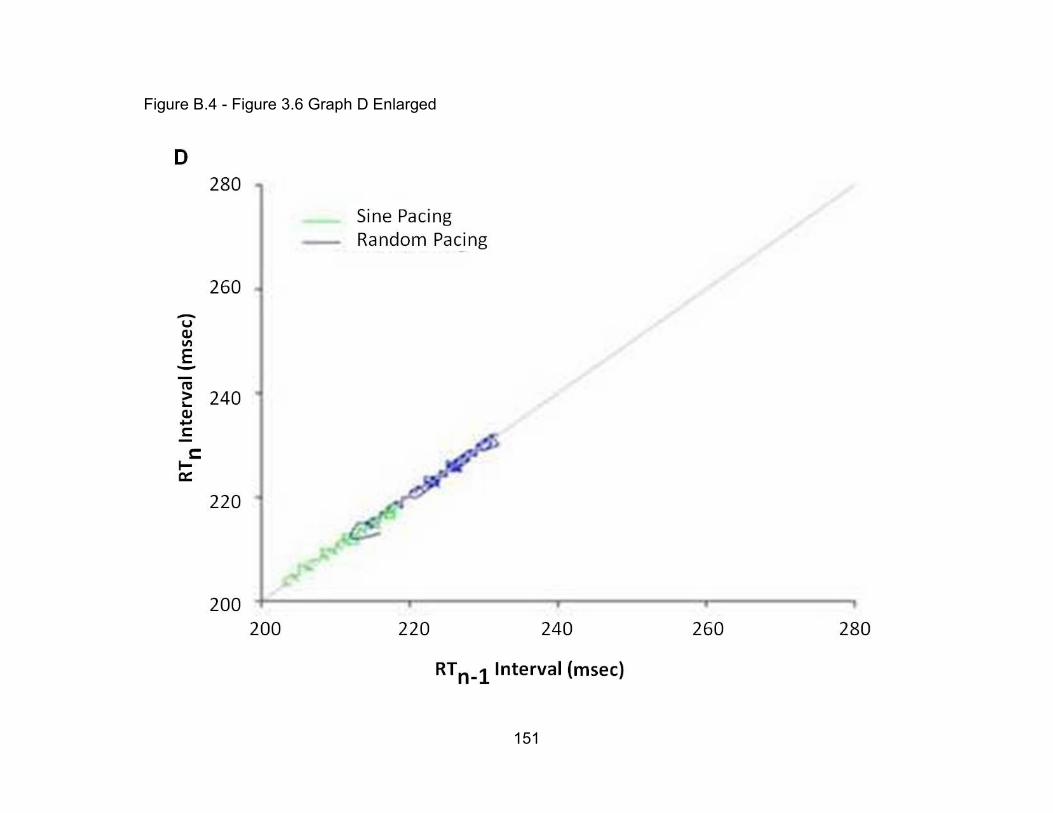
151
Figure B.4 - Figure 3.6 Graph D Enlarged
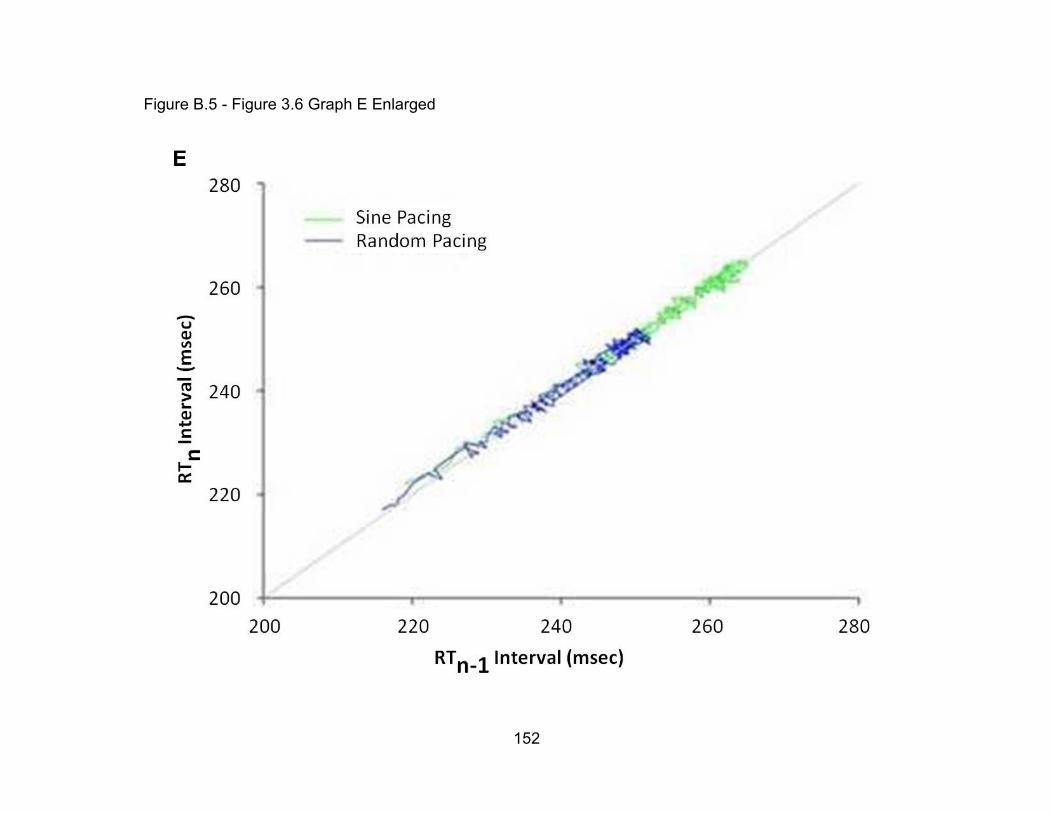
152
Figure B.5 - Figure 3.6 Graph E Enlarged
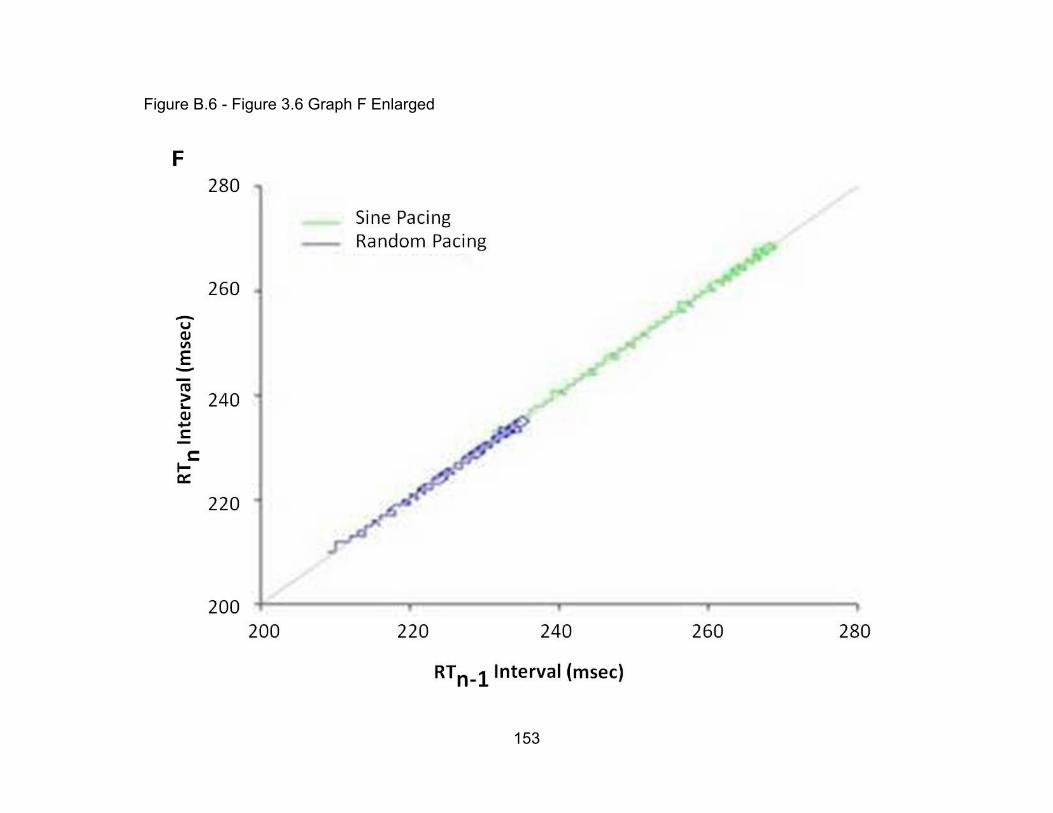
153
Figure B.6 - Figure 3.6 Graph F Enlarged

154
Figure B.7 - Figure 3.6 Graph G Enlarged
155
APPENDIX C - FIGURE 3.7
QT (RT) interval adaptations over 250 beats following the termination of fixed,
sinusoidal (Sine), and random tachypacing. Each graph represents a single animal
(n=7).
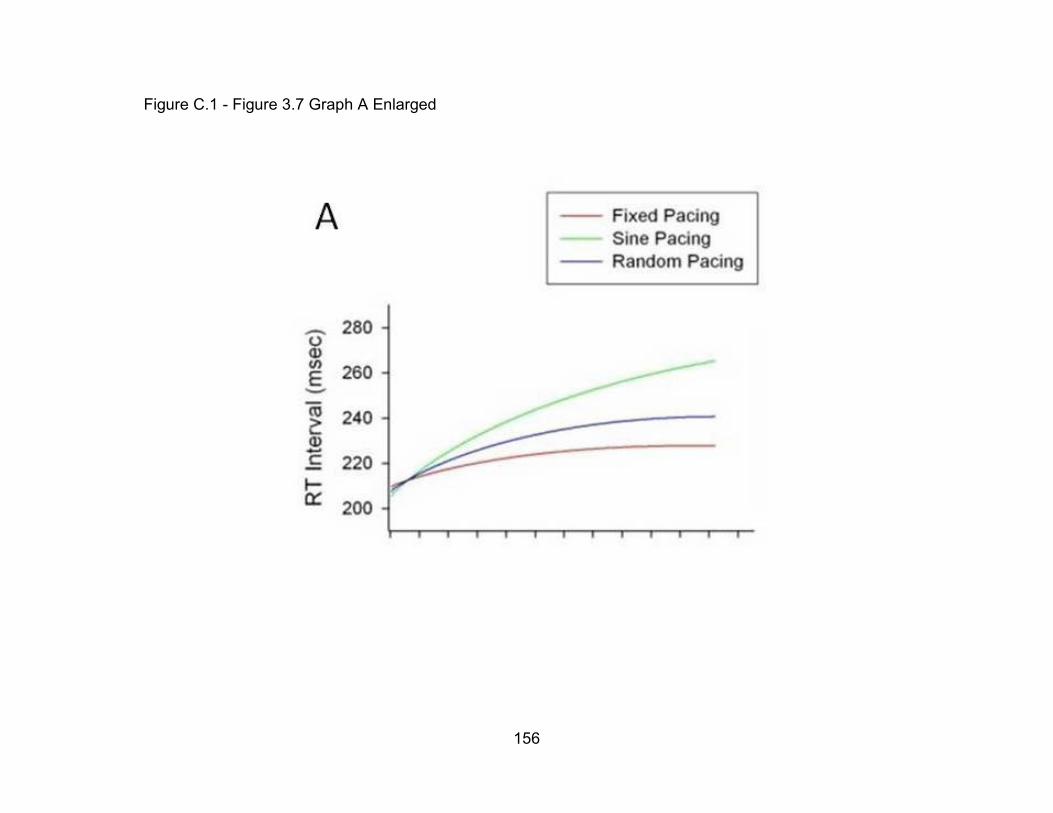
156
Figure C.1 - Figure 3.7 Graph A Enlarged
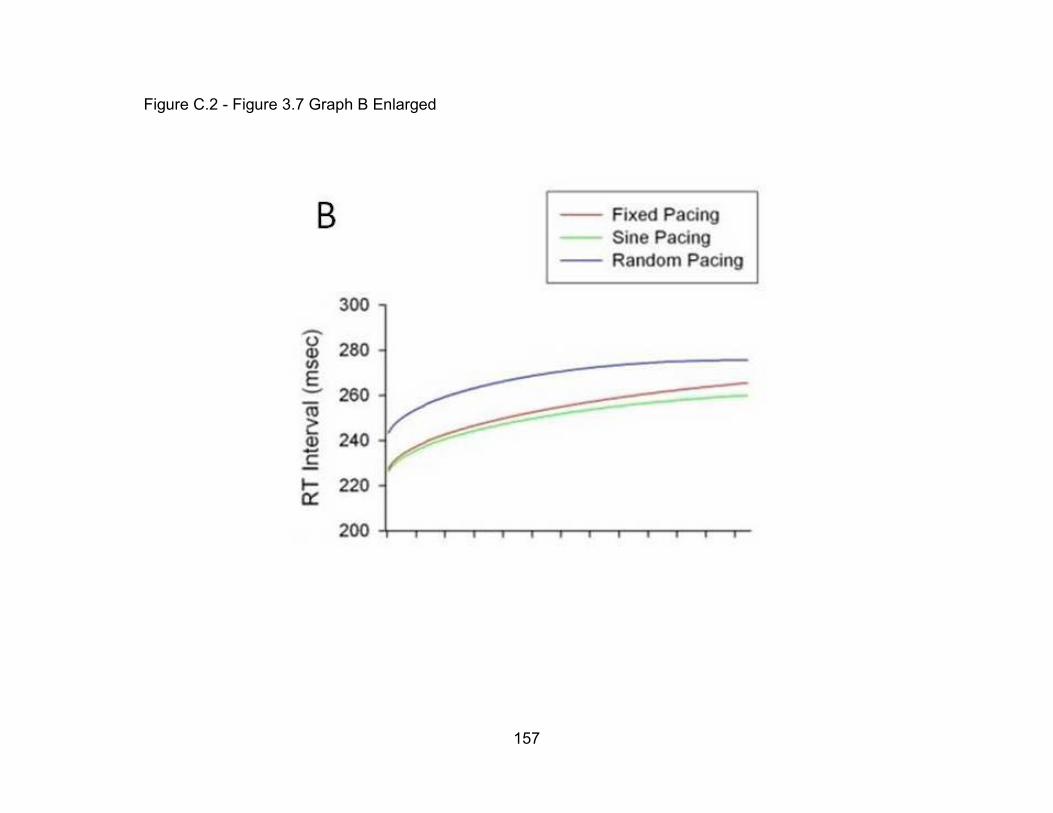
157
Figure C.2 - Figure 3.7 Graph B Enlarged
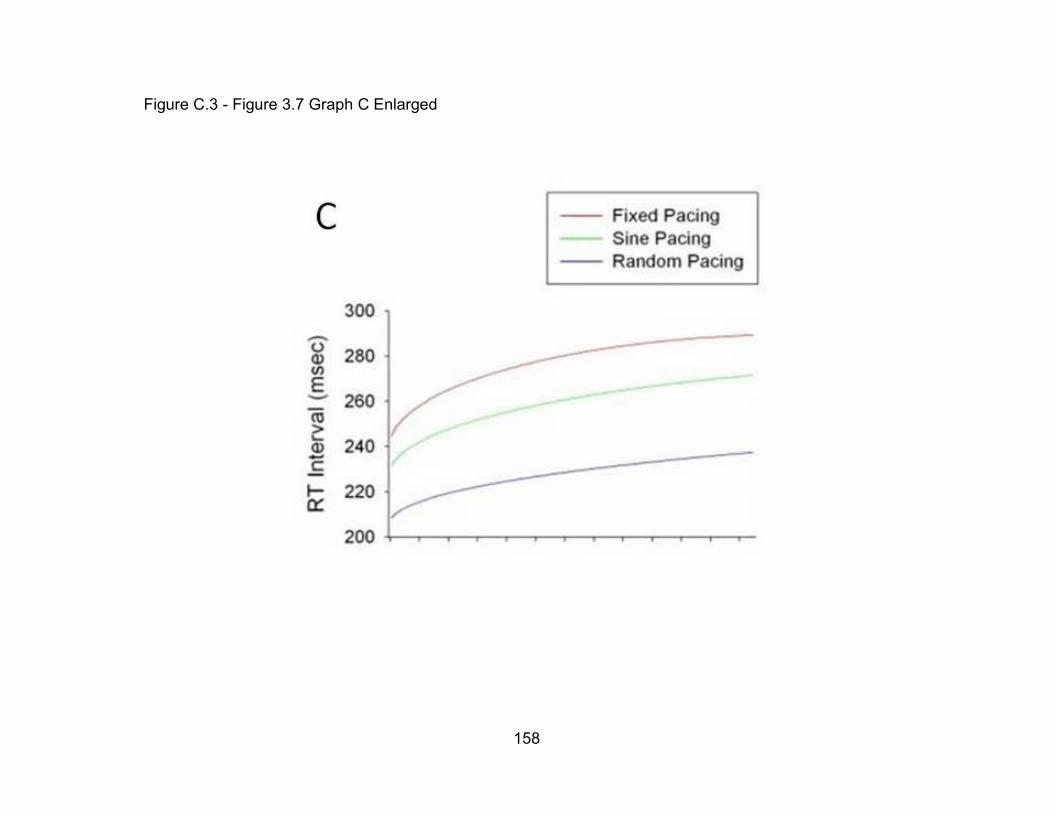
158
Figure C.3 - Figure 3.7 Graph C Enlarged

159
Figure C.4 - Figure 3.7 Graph D Enlarged
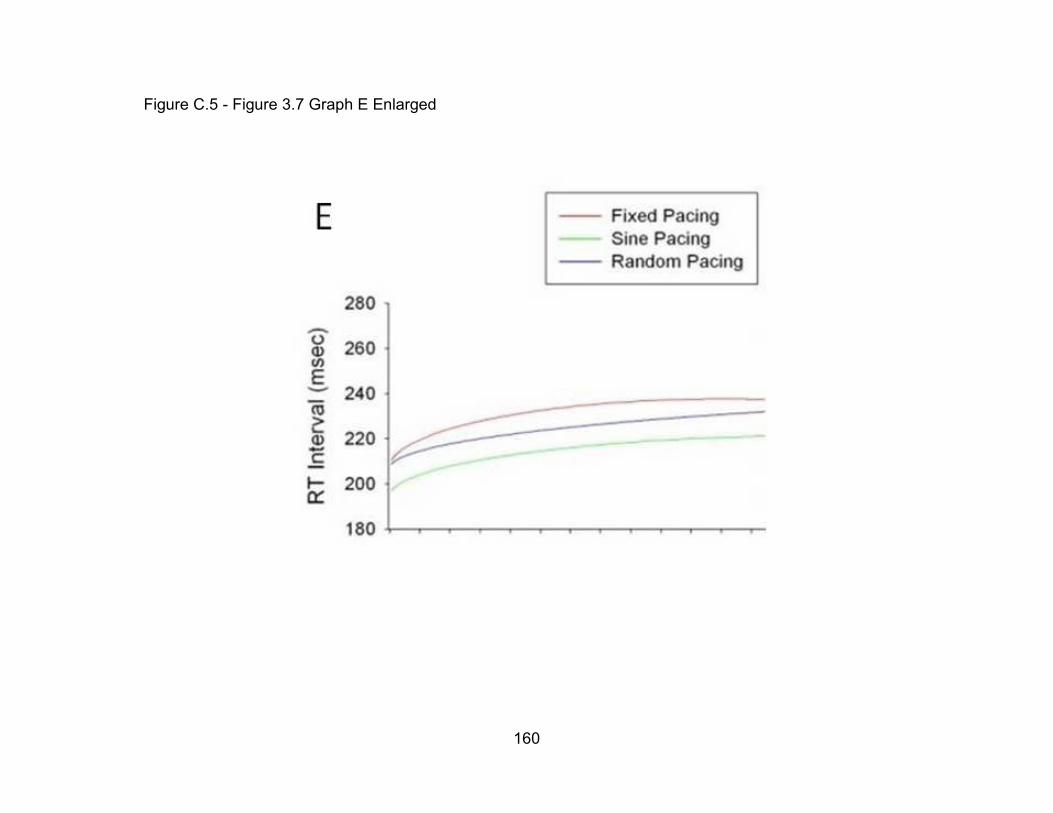
160
Figure C.5 - Figure 3.7 Graph E Enlarged
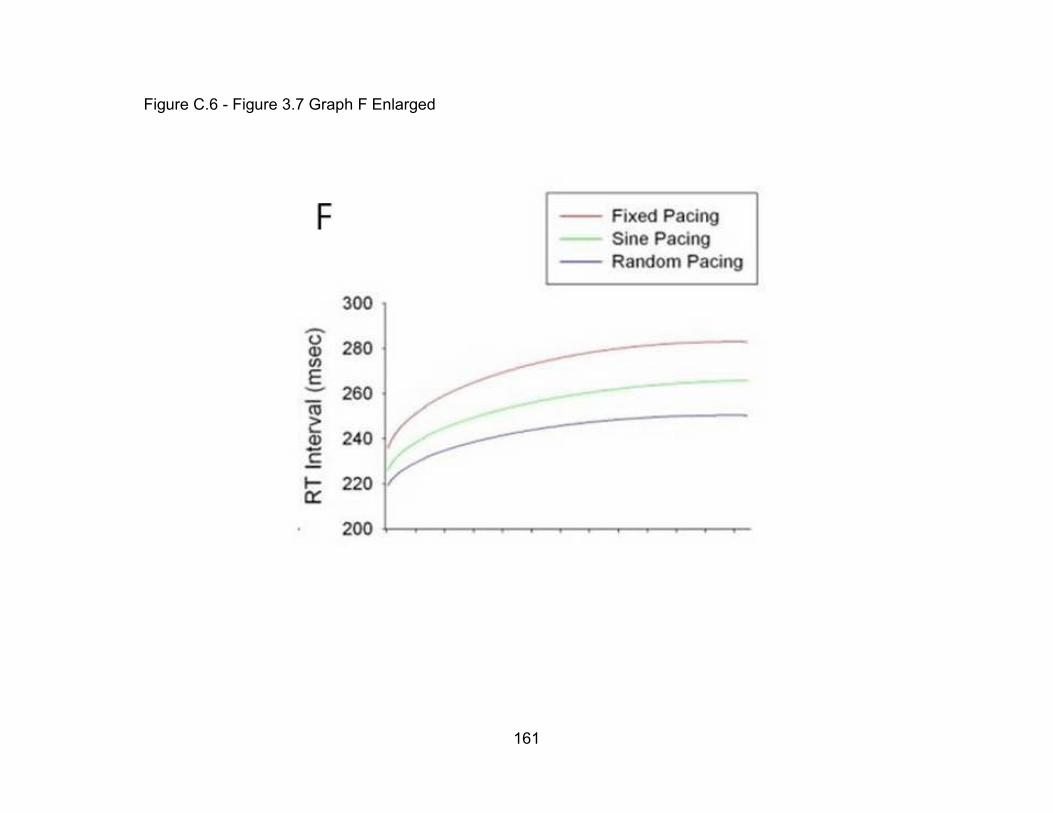
161
Figure C.6 - Figure 3.7 Graph F Enlarged

162
Figure C.7 - Figure 3.7 Graph G Enlarged

163
REFERENCES
164
REFERENCES
Ackermann, MJ. et al. "HRS/EHRA expert consensus statement on the state of genetic
testing for the channelopathies and cardiomyopathies." Europace, 2011: 13:
1077-1109.
Adams, W. "The normal duration of the electrocardiographic complex." J Clin Invest,
1936: 15: 335-342.
Akar, FG et al. "Unique teopgraphical distribution of M cells underlies reentrant
mechanism of torsade de pointes in the long-QT syndrome." Circulation, 2002:
1247-53.
Allen, MJ. et al. "The pharmacokinetics and pharmacodynamics of oral dofetilide after
twice daily and three times daily dosing." Br J Clin Pharmacol, 2000: 50: 247-
253.
Alt, E. "Ventricular tachycardia initiated solely by reduced pacing rate during routine
pacemaker follow-up." Clin Cardiol, 1996: 19(8):668-71.
Andersen, HR. et al. "Dofetilide reduces the incidence of ventricular fibrillation during
acute myocardial ischemia. A randomized study in pigs." Cardiovascular
Research, 1994: 28: 1635-1640.
Antzelevitch, C. "Ionic, molecular, and cellular bases of QT-interval prolongation and
torsade de pointes." Europace, 2007: 9(Suppl 4) iv4-15.
Antzelevitch, C, and A Oliva. "Amplification of spatial dispersion of repolarization
underlies sudden cardiac death associated with catecholaminergic polymorphic
VT, long QT, short QT, and Brugada syndromes." J Intern Med , 2006: 259 (1):
48-58.
Antzelevitch, C, and J Fish. "Electrical heterogeneity within the ventricular wall." Basic
Res Cardiol, 2001: 96: 517-27.
Antzelevitch, C. "Tpeak-Tend interval as an index of transmural dispersion of
repolarization." Eur J Clin Invest, 2001: 31: 555-557.
Arrowood, JA et al. "Modulation of the QT interval: Effects of graded exercise and reflex
cardiovascular stimulation." J Appl Physiol, 1993: 75: 2217-2223.
Arstall, MA et al. "Sotalol-induced torsade de pointes: management with magnesium
infusion." Postgrad Med J, 1992: 68: 289-90.

165
Atiga, W. et al. "Beat-to-beat repolarization liability identifies patients at risk for sudden
cardiac death." J. Cardiovasc Electrophysiol, 1988: 9(9): 899-908.
Attwell, D. et al. "The steady state TTX-sensitive (“window”) sodium current in cardiac
Purkinje fibres." Pflug Arch Eur J Physiol, 1979: 379: 137-142.
AVMA Panel on Euthanasia. AVMA Guidelines for the Euthanasia of Animals: 2013
Edition. Schaumburg, IL: American Veterinary Medical Association, 2013.
Bachmann, A. et al. "Characterization of a novel Kv1.5 channel blocker in Xenopus
oocytes, CHO cells, human and rat cardiomyocytes." Arch Pharmacol, 2001:
364: 472-478.
Bauman, JL et al. "Torsades de pointes due to quinidine: observations in 31 patients."
Am Heart J, 1984: 107: 425-30.
Bazett, JC. "An analysis of time relations of electrocardiograms." Heart, 1920: 7: 353-
370.
Berger, RD et al. "Beat-to-beat QT interval variability: novel evidence for repolarization
liability in ischemic and nonischemic dilated cardiomyopathy." Circulation, 1997:
96 (5): 1557-65.
Berger, RD. "QT variability ." J Electrocardio, 2003: 36: 83-87.
Bers, D. Excitation-contraction coupling and cardiac contractile force. Dordrecht-Boston-
London: Kluwer Academic Publishers, 2001.
Bers, DM et al. "Upregulated Na/Ca exchange is involved in both contractile dysfunction
and arrhythmogenesis in heart failure." Basic Res Cardiol, 2002: 97 (Suppl 1):
136-142.
Bharati, S. et al. "The conduction system of the swine heart." Chest, 1991: 100: 207-
212.
Bilchick, K et al. "Temporal repolarization liability differences among genotyped patients
with the long QT syndrome." Am J Cadiol, 2004: 94 (10): 1312-6.
Blaustein, MP, and WJ Lederer. "Sodium/calcium exchange: its physiological
implications." Physiol Rev, 1999: 79: 763-854.
Boudoulas, H et al. "Linear relationship between electrical systole, mechanical systole,
and heart rate." Chest , 1981: 80: 613-617.
Boulet, IR et al. "Functional effects of KCNQ1 mutation associated with the long QT."
Cardiovasc Res, 2006: 70: 466-74.

166
Brachmann, J et al. "Bradycardia-dependent triggered activity: Relevance to drug-
induced multiform ventricular tachycardia." Circulation, 1983: 68: 209-217.
Brandt, R, and S Win-Kuang. "Bradycardia-Induced polymorphic ventricular tachycardia
after atrioventricular junction ablation for sinus tachycardia-induced
cardiomyopathy." J Cardiovasc Electrophysiol, 1995: 6: 630-633.
Camm, AJ. "Quality of life in patients with atrial fibrillation." Rev Esp Cardiol, 2010:
63(12): 1393-1395.
Camm, AJ. et al. "Rate control in the medical management of atrial fibrillation." Heart,
2007: 93; 35-38.
Carlsson, L et al. "Assessment of the ion channel-blocking profile of the novel combined
ion channel blocker AZD1305 and its proarrhythmic potential versus dofetilide in
the methozamine-sensitized rabbit in vivo." J Cardiovasc Pharmacol, 2009: 54
(1): 82-9.
Carmeliet, E. "Repolarization reserve in cardiac cells." J Med Biol Eng, 2006: 26: 97-
105.
Carmeliet, E. "Slow inactivation of the sodium current in rabbit cardiac Purkinje fibres."
Pflug Arch Eur J Physiol, 1987: 408: 18-26.
Casini, S. et al. "Intracellular calcium modulation of voltage-gated sodium channels in
ventricular myocytes." Cardiovasc Res, 2009: 81:72-81.
Champeroux, P et al. "Calculation of QT shift in non-clinical safety pharmacology
studies." J Pharmacol Toxicol Methods, 2009: 59 (2): 73-85.
Choy, AM. "Exaggerated QT Prolongation after cardioversion of atrial fibrillation." J Am
Col of Cardio, 1999a: 34(2): 396-401.
Choy, AMJ. "Increased sensitivity to QT prolonging drug therapy immediately after
cardioversion to sinus rhythm." J Am Coll Cardiol, 1999b: 94: I202.
Chugh, SS et al. "Sudden cardiac death with apparently normal heart." Circulation,
2000: 102: 649-654.
Chung, MK. "Is hospital admission for initation of antiarrhythmic therapy with sotalol for
atrial arrhythmias required? Yield of in-hospital monitoring and prediction of risk
for significant arrhythmia complications." J Am Coll Cardiol, 1998: 32: 169-76.
167
Coplen, SE. et al. "Efficacy and safety of quinidine therapy for maintenance of sinus
rhythm after cardioversion. A meta-analysis of randomized control trials."
Circulation, 1990: 82; 1106-1116.
Crozier, I et al. "Electorphysiological effects of atrial natriuretic peptide on the cardiac
conduction system in man ." Pacing Clin Electophysiol , 1993: 4 Pt 1: 738-42.
Daoud, EG et al. "Effect of an irregular ventricular rhythm on cardiac output." Am J
Cardiol, 1996: 12: 1433-6.
Darbar, D, and DM Roden. "Future of antiarrythmic drugs." Curr Opin Cardiol, 2006: 21;
361-367.
Darbar, D. et al. "Marked steepening of the QT restitution following cardioversion of
atrial fibrillation." Heart Rhythm, 2004: 1(1) May Supp: S192.
Darbar, DM. et al. " Persistent atrial fibrillation is associated with reduced risk of
torsades de pointes in patients with drug-induced long qt syndrome." J Am Coll
Cardiol, 2008: 51(8); 836-842.
Darpo, B. "Detection and reporting of drug-induced proarrhythmias: room for
improvement." Europace, 2007: 168: iv23-36.
Darpo, B. et al. "Clinical evaluation of QT/QTc prolongation and proarrhythmic potential
for nonantiarrhythmic drugs: The International Conference on Harmonization of
Technical Requirements for Registration of Pharmaceuticals for Human use E14
Guideline." J Clin Pharmacol, 2006: 46; 498-507.
Del Rosario, ME et al. "Drug-induced QT prolongation and sudden death." Mo Med,
2010: 107(1): 53-58.
Desai, M et al. "Variability of heart rate correction methods for the QT interval." Br J Clin
Pharmacol, 2003: 55(6):511-7.
DeSilva, RA. "Central nervous system risk factors in sudden cardiac death." Ann NY
Acad Sci, 1982: 382: 143-161.
Dessertenne, F. "La tachycardie ventriculaire a deux foyers opposes variables." Arch
Mal Coeur Vaiss , 1966: 59; 263-272.
DiSegni, E et al. "Overdrive pacing in quinidine syncope and other long QT-interval
syndromes." Arch Intern Med, 1980: 1036-40.
168
Dumotier, BM, and AV Georgieva. "Preclinical cardio-safety assessment of
trosadogenic risk and alternative methods to animal experimentation: The
inseparable twins." Cell Biol Toxicol, 2007: 23: 293-302.
Egashira, K. et al. "Effects of cocaine on epicardial coronary artery reactivity in
miniature swine after endothelial injury and high cholesterol feeding. In vivo and
in vitro analysis." J Clin Invest, 1991: 88: 1307-1314.
El-Sherif, N et al. "Mechanism of arrhythmogenicity of the short-long cardiac sequence
that precedes ventricular tachyarrhythmmias in the long QT syndrome:
Tridimensional mapping of activation and recovery patterns." J Am Coll Cardiol,
1999: 33: 1415-23.
Evans, G. "Predictors of in-hospital mortality after DC catheter ablation of
atrioventricular junction." Circulation, 1991: 84: 1924-1937.
Faber, TS. "Drug-induced torsade de pointes. Incidence, management and prevention."
Drug safety : an international journal of medical toxicology and drug experience,
1994: 6: 463-76.
Farkas, AS et al. "The role of the Na+/Ca2+ exchanger, 1(Na) and 1(CaL) in the
genesis of dofetilide -induced torsades de pointes in isolated AV-Blocked rabbit
hearts." Br Pharacol, 2009: 100 (24): 2437-42.
Fossa, AA. "Assessing QT prolongation in conscious dogs: validation of a beat-to-beat
method." Pharmacol Ther, 2008: 119 (2): 133-40.
Frey, B et al. "Diurnal variation of ventricular response to atrial fibrillation in patients with
advanced heart failure." Am Heart J, 1995: 1: 58-65.
Fridericia, LS. "Die Sstolendauer im electrocardiogram bei normaken menschen und bei
herzkranken." Acta Med Scand, 1920: 53: 469-486.
Friedlander, Y. et al. "Family history as a risk factor for primary cardiac arrest."
Circulation, 1998: 97(2):155-60.
Fülöp, L et al. "Effects of sex hormones on ECG parameters and expression of cardiac
ion channels in dogs." Acta Physiol, 2006: 188: 163-71.
Fuster, V et al. "ACC/AHA/ESC guidelines for the management of patients with atrial
fibrillation. A report of the American College of Cardiology/American Heart
Association Task Force on Practice Guidelines and the European Society of
Cardiology Committee for Practice Guide." Eur Heart J, 2001: 20: 1852-923.

169
Fuster, V. et al. "ACC/AHA/ESC 2006 Guidelines for the management of patients with
atrial fibrillation." Circulation, 2006: 114; e257-e354.
Fuster, V. et al. "2011 ACCF/AHA/HRS focused updates incorporated into the
ACC/AHA/ESC 2006 guidelines for the management of patients with atrial
fibrillation." J. Am Coll Cardio, 2011: 57(11); 0735-1097.
Gallacher, DJ. "In vivo mechanisms precipitating torsades de pointes in a canine model
of drug-induced long-QT1 syndrome." Cardiovasc Res , 2007: 2: 247-56.
Ghosh, S. et al. "KCNQ1 assembly and function is blocked by long-QT syndrome
mutations that disrupt interaction with calmodulin." Circ Res, 2006: 98: 1048-
1054.
Goette, A et al. "Increased expression of extracellular signal-regulated kinase and
angiotensin-converting enzymes in human atria during atrial fibrillation." J Am
Coll Cardiol, 2000: 35: 1669-77.
Gross, DR. "Animal models in cardiovascular research. Springer, 2009." Anesth Analg,
1988: 67: 741-749.
Gross, GJ. "Bradycardia-mediated ventricular electrical remodeling." J Cardiovascular
Electrophysiol, 2006: 17 Suppl 1: S178-S182.
Guo, J et all. "Extracellular K+ concentration controls cell surface density of Ikr in rabbit
hearts and of the HERG channel in human cell lines." J Clin Invest, 2009: 119:
2745-57.
Hamdan, MH et al. "Increased sympathetic activity after atrioventricular junction ablation
in patients with chronic atrial fibrillation." J Am Coll Cardiol, 2000: 36: 151-58.
Han, W et al. "Slow delayed rectifier current and repolarization in canine cardiac
Purkinje cells." Am J Physiol, 2001: H1075-80.
Härtel, G et al. "Value of quinidine in maintenance of sinus rhythm after electric
conversion of atrail fibrillation." Br Heart J, 1970: 32: 57-60.
Harvey, W. "On The Motion Of The Heart And Blood In Animals." In Scientific papers;
physiology, medicine, surgery, geology, with introductions, notes and
illustrations, by The Harvard classics v. 38. New York City: P. F. Collier & Son,
1628.
Hashimoto, K. "Torsades de pointes liability inter-model comparisons: The experience
of the QT PRODACT initiative." Pharm & Therapeutics, 2008: 119: 195-198.

170
Haushalter, TM et al. "The cardiovascular and pharmacokinetic profile of dofetilide in
conscious telemetered beagle dogs and cynomolgus monkeys." Br J Pharmacol,
2008: 154: 1457-1464.
Haverkamp, W. et al. "The potential for QT prolongation and pro-arrhythmia by non-
antiarrhythmic drugs: Clinical and regulatory implications Report on a Policy
Conference of the European Society of Cardiology." Cardiovasc Res, 2000: 47:
219-233.
Hidaka, H. et al. "Pharmacological comparison of captopril and MK-422 by a new
method for measuring activity of angiotensin converting enzyme (ACE). ." Jpn
Circ J, 1985: 49: 1175-1179.
Hinterseer, M et al. "Beat-to-beat variability of QT intervals is increased in patients with
drug induced long-QT syndrome: a case control pilot study." Eur Heart J, 2008:
29 (2): 185-90.
Hinterseer, M et al. "Relation of increased short-term variability of QT interval to
congenital long-QT syndrome." Am J Cardiol, 2009: 103 (9): 1244-8.
Hnatkova, K, and M Malik. ""Optimum" Formulae for Heart Rate Correction of the QT
interval." Pacing Clin Electrophysiol, 1999: 11: 1683-87.
Hodges, M et al. "Bazett’s QT correction reviewed: Evidence that a linear correction for
heart rate is better." J Am Coll Cardiol, 1983: 1: 694.
Hodges, M. "Rate correction of the QT interval." Card Electrophysiol Rev, 1997: 3: 360-
363.
Hohnloser, SH et al. "Efficacy and proarrhythmic hazards of pharmacologic
cardioversoin of atrial fibrillation: Prospective comparison of sotalol versus
quinidine." J Am Coll Cardiol, 1995: 26: 852-58.
Honig, PK. et al. "Changes in the pharmacokinetics and electrocardiographic
pharmacodynamics of terfenadine with concomitant administration of
erythromycin." Clin PHarmacol Ther, 1992: 52; 231-238.
Honig, PK. et al. "Terfenadine-ketoconazole interaction. Pharmacokinetic and
electrocardiographic consequences." JAMA, 1993: 269; 1513-1518.
Houltz, B et al. "Electrocardiographic and clinical predictors of torsades de pointes
induced by almokalant infusion in patients with chronic atrial fibrillation or flutter."
PACE, 1998: 21: 1044-57.
171
Iost, N. "Does Iks play an important role in the repolarization in normal human
ventricular muscle?" ." Circulation, 1999: 200 (Suppl 1): I-495.
Ishihara, K et al. "Role of Mg(2+) block of the inward rectifier K(+) current in cardiac
repolarization reserve: A quantitative simulation." J Mol Cell Cardiol, 2009:
47(1):76-84.
James, A, and J Hancox. "Sex, drugs and arrhythmia: are gender differences in risk of
torsades de pointes simply a matter of testosterone? ." Cardiovasc Res , 2003:
57(1): 1-4.
James, AF et al. "Recent advances in understanding sex differences in cardiac
repolarization." Prog Biophys Mol Biol, 2007: 94: 265-319.
Janse, MJ. "Electrophysiological changes in heart failure and their relationship to
arrhythomogenesis." Cardiovasc Research, 2004: 61: 208-217.
Jervella, A, and F. Lange-Nielsen. "Congenital deaf-mutism, functional heart disease
with prolongation of the Q-T interval and sudden death." Am Heart J, 1957: 54;
59-68.
John, RM. et al. "Ventricular arrhythmias and sudden cardiac death." The Lancet, 2012:
380: 1520-1529.
Johnson, DM et al. "Ika restricts excessive beat-to-beat variability of repolarization
during beta-adrenergic receptor stimulation." J Mol Cell Cardiol, 2010: 48: 122-
30.
Jonsson, MK. "Gender disparity in cardiac electophysiology: implications for cardiac
safety pharmacology." Pharmacol Ther, 2010: 127: 9-18.
Jost, N et al. "Molecular basis of repolarization reserve differences between dogs and
man." Circulation, 2008: 118 Suppl: 342.
Jost, N et al. "Restricting excessive cardiac action potential and QT prolongation: a vital
role for Ika in human ventricular muscle." Circulation, 2005: 112: 1392-99.
Jost, N et al. "Slow delay rectifier potassium current (Iks) and the repolarization reserve
." Ann Nonivas Electrocardiol , 2007: 12: 64-78.
Jouven, X et al. "Predicting sudden death in the population: the Paris Prospective Study
I." Circulation, 1999: 99(15):1978-83.
172
Kääb, S et al. "Sotalol testing unmasks altered repolarization in patients with suspected
acquired long-QT-syndrome--a case-control pilot study using i.v. sotalol." Eur
Heart J, 2003: 7: 649-57.
Kano, M. et al. "QT PRODACT: Usability of miniature pigs in safety pharmacology
studies: Assessment for drug-induced QT interval prolongation." J Pharmacol
Sci, 2005: 99: 501-511.
Kates, RA. et al. "Comparative cardiovascular effects of verapamil, nifedipine, and
diltiazem during halothane anesthesia in swine." Anesthesiology, 1984: 61: 10-
18.
Kawataki, M et al. "Relation between QT interval and heart rate: Applications and
limitations of Bazett’s formula." J Electrocardiol, 1984: 17: 371-376.
Kijtawornrat, A. et al. " A canine model of sustained atrial fibrillation induced by rapid
atrial pacing and phenylephrine." Comp Med, 2008: 58(5): 490-493.
Kilborn, MJ et al. "Determination of QT response phenotype with low-dose ibutilide."
Circulation, 2000: 102: II-673.
King, A et al. "Magnitude of error introduced by application of heart rate correction
formulas to the canine QT interval." Ann Noninvasive Electrocardiol, 2006:
11(4):289-98.
Klingfield, P et al. "QTc behavior during treadmill exercise as a function of the
underlying QT-heart rate relationship." J Electrocardiol, 1995: 28(suppl): 206-
210.
Knobloch, K. et al. "Atrial-selective antiarrhythmic actions of novel Ik ur vs. Ikr, Iks, and
IKAch class 1c drugs and beta blockers in pigs." Med Sci Monit, 2004: 10(7):
BR221-228.
Knobloch, K. et al. "Electrophysiological and antiarrhythmic effects of the novel Ikur
channel blockers, S9947 and S20951, on left vs. right pig atrium in vivo in
comparison with Ikr blockers dofetilide, azimilide, d,l-sotalol and ibutilide."
Naunyn-Schmiedeberg’s Arch Pharmacol, 2002: 366: 482-487.
Knudsen, CW et al. "Impact of atrial fibrillation on thedianostic performance of B-type
natriuretic peptide concentration in dyspneic patients: An analysis from the
breathing not properly multinational study." J Am Coll Cardiol , 2005: 46: 838-44.
Kong, MH. et al. "Systematic review of the incidence of sudden cardiac death in the
United States." JACC, 2011: 57(7): 794-801.
173
Kovacs, SJ. "The duration of the QT interval as a function of heart rate: A derivation
based on physical principles and a comparison to measured values." Am Heart J,
1985: 110: 872-878.
Krahn, AD et al. "Beta blockers normalize QT hysteresis in long QT syndrome ." Am
Heart J, 2002: 143 (3): 528-34.
Kurokawa, J et al. "Acute effects of oestrogen on guinea pig and human Ika channels
and drug-induced prolongation of cardiac repolarization." J Physiol, 2008: 586:
2961-2973.
Kurokawa, K et al. "Current issues and future perspectives of chronic renal failure."
Nephrology, 2002: 7: S145–S150.
Larsen, K., and TD Skulason. "Det normale electrocardiogram. I. Analyse of
ekstremitelsafledningerne has 100 sunde mennesker I aldermen fra 30 til 50
Aar." Nord Med, 1941: 9: 350-358.
Lecocq, B et al. "Physiologic relation between cardiac cycle and QT duration in healthy
volunteers." Am J Cardiol, 1989: 63: 481-486.
Lengyel, C. "Effect of a neuroprotective drug, eliprodil on cardiac repolarization:
importance of the decreased repolarization reserve in the development of
proarrhythmic risk." Br J Pharmacol, 2004: 1: 152-58.
Lengyel, C et al. "Combined pharmacological block of I(Kr) and I(Ks) increases short-
term QT interval variability and provokes torsades de pointes." Br J Pharmacol,
2007: 151 (7): 941-51.
Lengyel, CS et al. "Pharmacological block of the slow component of the outward
delayed rectifier current Ika fails to lengthen rabbit ventricular muscle QTc and
action potential duration." Br J Pharmacol, 2001: 132: 101-10.
Letsas, KP et al. "Tpeak-Tend interval and Tpeak-Tend/ QT ratio as markers of
ventricular tachycardia inducibility in subjects with Brugada ECG Phenotype."
Europace, 2010: 12 (2): 271-4.
Limberis, JT et al. "Altering extracellular potassium concentration does not modulate
drug blocking of human ether-a-go-go-related gene (hERG) channels." Clin Exp
Pharmacol Physiol, 2006: 33: 1059-65.
Linz, DK et al. "Effect of atrial electrical remodeling on the efficacy of antiarrhythmic
drugs: Comparison of amiodarone with Ikr- and Ito/Ikur-blockade in vivo." J
Cardiovasc Electrophysiol, 2007: 18(12): 1313-1320.
174
Litovsky, SH, and C Antzelevitch. "Transient outward current prominent in canine
ventricular epidcadium but not endocardium." Cic Res, 1988: 62: 116-26.
Ljung, O. "A simple formula for clinical interpretation of the QT interval data." Acta med
Scand, 1950: 136: 293-301.
Lloyd-Jones, DM. et al. "Lifetime risk for development of atrial fibrillation: The
Framingham Heart Study." Circulation, 2004: 110; 1042-6.
Lown, B. "Sudden Cardiac Death: The major challenge confronting contemporary
cardiology." Am J Cardiol, 1979: 43, 313.
Lown, B. "Electrical reversion of cardiac arrhythmias." Br Heart J, 1967: 29: 469-489.
Ludwig, K. "Neue Versuche uber die Beihilfe der Nerven zur Speichelabsonderungen."
Zeit rate. Med, 1851: 1: 255-277.
Luo, X et al. "Transcriptional activation by stimulating protein 1 and post-transcriptional
repression by muscle-specific microRNAs of Ika-encoding genes and potential
implications in regional heterogeneity of their expressions." J Cell Physiol, 2007:
212: 358-67.
MacWilliam, JA. "Cardiac failure and sudden death." Br Med J, 1889: 1: 6-8.
Maeno, et al. "Differences in effects of end-plate potentials between procaine and
lidocaine as revealed by voltage-clamp experiments." J Neurophysiol, 1971:
34(1): 58-70.
Maisel, WH. et al. "Atrial fibrillation in heart failure: epidemiology, pathophysiology, and
rationale for therapy." Am J Cardiol, 2003: 91: 2D-8D.
Malik, M. "Assessment of drug-induced QT prolongation: To bin or not to bin?" Clinical
Pharmacology and Therapeutics, 2005: 77: 241-246.
Malik, M. "Problems of heart rate correction in assessment of drug-induced QT interval
prolongation." J Cardiovasc Elsectorphysiol, 2001: 4: 411-20.
Malik, M. "The imprecision in heart rate correction may lead to artificial observations of
drug induced QT interval changes." Pacing Clin Electrophysiol, 2002: 2: 209-16.
Martin, CA et al. "Recent developments in the management of patients at risk for
sudden cardiac death." Postgrad Med, 2011: 123(2): 84-94.
Matsuda, H et al. "Ohmic conductance through the inwardly rectifying K+ channel and
blocking by internal Mg2+." Nature, 1987: 325: 156-58.

175
Mayeda, I. "On the time relation between the systolic duration of the heart and the pulse
rate." Acta Scholae Med Univ Imp Kioto, 1934: 17: 53-55.
McCray, R. et al. "Persistent atrial fibrillation is associated with reduced risk of torsades
de pointes in patients with drug-induced long QT syndrome." Heart Rhythm,
2006: 17; 337-340.
Minardo, J et al. "Clinical characteristics of patients with ventricular fibrillation during
antiarrhythmic drug therapy." NEJM, 1988: 319: 257-262.
Miyasaka, Y et al. "Secular trends in incidence of atrial fibrillation in Olmsted County,
Minnesota, 1980 to 2000, and implications on the projections for future
prevalence." Circulation, 2006: 114: 119-125.
Monahan, BP. et al. "Torsades de pointes occurring in association with terfenadine
use." JAMA, 1990: 264; 2788-2790.
Muller, JE. et al. "Circadian variation in the frequency of sudden cardiac death."
Circulation, 1987: 75: 131-138.
Myerburg, RJ, and A Castellanos. Cardiac arrest and sudden cardiac death.
Braunwalkd EA, ed. Heart Disease: A textbook of cardiovascular medicine. 6th
ed: 890-931, 2001.
Nahas, K. et al. "Electrocardiographic monitoring in the Gottingen minipig." Comp Med,
2002: 52(3): 258-264.
National Research Council. Guide for the Care and Use of Laboratory Animals (8th
Edition). Washington, D.C.: National Academies Press, 1996.
Neher, and Sakmann. "Single channel currents recorded from membrane of denervated
frog muscle fibres." Nature, 1976: 260: 799-802.
Nerbonne, JM. "Repolarizing Cardiac Potassium Channels: Multiple Sites and
Mechanisms for CaMKII-Mediated Regulation." Heart Rhythm (online), Jan 2011.
Nolan, E. et al. "Circadian changes in the QT variability index in the beagle dog." Clin &
Exper Pharm & Physiol, 2004: 31: 783-785.
Oberg, K et al. "'Late' proarrhythmia due to quinidine." Am J Cardiol, 1994: 74: 192-94.
Oosterhoff, P. " High-rate pacing reduces variability of repolarization and prevents
repolarization-dependent arrhythmnias in dogs with chronic AV block." J
Cardiovasc Electrophysiol, 2010: 21: 1384-1391.
176
Oros, A. et al. "The canine model with chronic, complete atrioventricular block."
Pharmacol Ther, 2008: 119: 168-178.
Page, R. el al. "Antiarrhythmic effects of azimilide in paroxysmal supraventricular
tachycardia: Efficacy and dose-response." Am Heart J, 2002: 143: 643-649.
Patel, SP, and DL Cambell. "Transient outward potassium current "Ito", phenotypes in
the mammalian left ventricle: underlying molecular, cellular and biophysical
mechanisms." J Physiol, 2005: 569: 7-39.
Pinski, S. et al. "What is the minimal pacing rate that prevents Torsades de Pointes?
Insights from patients with permanent pacemakers." J Pacing Clin Electrophysiol,
2002: 25 : 1612-1615.
Pollard, CE. "An introduction to QT interval prolongation and non-clinical approaches to
assessing and reducing risk." British J of Pharmacology, 2010: 159: 12-21.
Pruvot, EJ et al. "Role of Calcium Cycling Versus Restitution in the Mechanism of
Repolarization Alternans." Circ Res, 2004: 94: 1083-90.
Prystowsky, E. "Proarrhythmica during drug treatment of supraventricular tachycardia:
paradoxical risk of sinus rhythm for sudden death." Am J Cardiol, 1996: 78(suppl
8A): 35-41.
Prystowsky, E. "The history of atrial fibrillation: The last 100 years." J Cardio Electro,
2008: 19(6): 575-582.
Rautaharju, PM et al. "Sex differences in the evolution of the electrocardiographic QT
interval with age." Can J Cardiol, 1992: 8(7):690-5.
Redleaf, P, and I Lerner. "Thiazide-induced hypokalemia with associated major
ventricular arrhythmias." JAMA, 1968: 206; 1302-1304.
Regan, et al. "Novel method to assess cardiac electrophysiology in the rat." J
Cardiovasc Pharmacol, 2005: 46(1): 68-75.
Richter, U. et al. "A novel approach to propagation pattern analysis in intracardiac atrial
fibrillation signals." Ann Biomed Eng, 2011: 39(1): 310-323.
Rickards, AF, and J Norman. "Relation between QT interval and heart rate: New design
of physiologically adaptive cardiac pacemaker." Br Heart J, 1981: 45: 56-61.
Ridley, JM et al. "Modulation by testosterone of an endogenous hERG potassium
channel current." J Physiol Pharmacol, 2008: 59(3):395-407.
177
Roden, DM. "Long QT syndrome: reduced repolarization reserve and the genetic link." J
Intern Med, 2006: 259(1):59-69.
Roden, DM. "Repolarization reserve: a moving target." Circulation, 2008: 118(10):981-2.
Roden, DM. "Taking the 'idio' out of 'idiosyncratic': predicting torsades de pointes."
Pacing Clin Electrophysiol, 1998: 259; 59-69.
Roden, DM, and ME Anderson. "The pause that refreshes, or does it? Mechanisms in
tosades de pointes." Heart, 2000: 84: 235-37.
Roden, DM, and PC Viswanathan . "Genetics of acquired long QT syndrome." J Clin
Invest, 2005: 115; 2025-2032.
Roden, DM. et al. "Incidence and clinical features of the quinidine-associated long QT
syndrome: implications for patient care." Am Heart J, 1986: 111; 1088-1093.
Roden, DM. et al. "On the relationship among QT interval, atrial fibrillation, and torsade
de pointes." Europace, 2007: 9 (Suppl 4); iv1-3.
Rosario, ME et al Del. "Drug-induced QT prolongation and sudden death." Mo Med,
2010: 107(1): 53-58.
Rubart, M. et al. "Transient tachycardia superimposed on bradycardia prolongs
repolarization in isolated canine ventricular myocytes." JACC (abstract), Feb.
1997: 62-63A.
Rubart, M., and DP. Zipes. "Transient tachycardia superimposed on bradycardia
prolongs repolarization in isolated canine ventricular myocytes." JACC (abstract),
1997: Feb. 1997: 62-63A.
Sagie, A et al. "An improved method for adjusting the QT interval for heart rate (the
Frammingham Heart Study)." Am J Cardiol, 1992: 70: 797-801.
Salata, J. et al. "Ik of rabbit ventricle is composed of two currents: evidence for Iks." Am.
J. Physiol, 1996: 271: H2477-H2489.
Sanguinetti, MC, and NK Jurkiewicz. "Role of external Ca2+ and K+ in gating of cardiac
delayed rectifier K+ currents." Ffugers Arch, 1992: 420: 180-186.
Sarma, JSM et al. "An exponential formula for heart rate dependence of QT interval
during exercise and cardiac pacing in humans: Reevaluation of Bazett’s formula."
Am J Cardiol, 1984: 54: 103-108.
178
Satoh, T., and DP. Zipes. "Rapid rates during bradycardia prolong ventricular
refractoriness and facilitate verntricular tachycardia induction with cesium in
dogs." Circulation, 1996: 94: 217-227.
Schillinger, W. et al. "Impaired contractile performance of cultured rabbit ventricular
myocytes after adenoviral gene transfer of Na+-Ca2+ exchanger." Circ Res,
2000: 87: 581-587.
Schlamowitz, I. "An analysis of the time relationships within the cardiac cycle in the
electrocardiograms of normal men. I. the duration of the Q-T interval and its
relationship to the cycle length (R-R interval)." Am Heart J, 1946: 31: 329-342.
Schoenwald, RD, and VE Isaacs. "Qt corrected for heart rate: anew approach and its
application ." Arch Int Parmacodyn Ther, 1974: 211 (1): 34-48.
Schönherr, R et al. "Inhibition of human ether à go-go potassium channels by
Ca(2+)/calmodulin." EMBOJ, 2000: 19(13):3263-71.
Schwartz, PJ et al. "Long QT syndrome patients with mutations of the SCN5A and
HERG genes have differential responses to Na+ channel blockade and to
increases in heart rate. Implications for gene specific therapy." Circulation, 1995:
92: 3381-86.
Sclarovsky, S et al. "Polymorphous ventricular tachycardia: Clinical features and
treatment." Am J Cardiol, 1979: 44: 339-45.
Selzer, A, and H Wray. "Quinidine syncope: Paroxysmal ventricular fibrillation occurring
during treatment of chronic atrial arrhythmias." Circulation, 1964: 30; 17-26.
Sergeant, GP et al. "Regulation of Kv4.3 currents by Ca2+/calmodulin-dependent
protein kinase II." Am J Phsiol Cell Physiol, 2005: 288: C304-13.
Shah, A, and G. Hajian. "A maximum likelihood approach for estimating the QT
correction factor using mixed effects model." Statist Med, 2003: 22: 1901-1909.
Shah, RR. "Can pharmacogenetics help rescue drugs withdrawn from the market?"
Pharmacogenomics, 2006: 7: 889-908.
Shah, RR. "Drugs, QTc interval prolongation and final ICH E14 guideline: an important
milestone with challenges ahead." Drug Saf, 2005: 28; 1009-1028.
Shah, RR. "The significance of QT interval in drug development." Br J Clin Pharmacol,
2002: 54(2):188-202.
179
Shamgar, L et al. "Calmodulin is essential for cardiac Iks Channel gating and assembly:
impaired function in long-QT mutations." Circ Res, 2006: 98: 1055-63.
Shimizu, W. et al. "Sodium channel block with mexiletine is effective in reducing
dispersion of repolarization and preventing torsades de pointes in LQT2 and
LQT3 models of the long-QT syndrome." Circulation, 1997: 96: 2038-2047.
Shinbane, J et al. "Tachycardia-induced cardiomyopathy: A review of animal models
and clinical studies ." J Am Coll Cardiol , 1997: 29:709-15.
Silvet, H et al. "Brain natriuretic peptide is elevated in outpatients with atrial fibrillation."
Am J Cardiol, 2003: 92: 1124-27.
Simonson, E et al. "The normal Q-T interval." Am Heart J, 1962: 63: 747-753.
Smith, DA. et al. "Pharmacokinetics and metabolism of dofetilide in mouse, rat, dog and
man." Xenobiotica, 1992: 22(6): 709-719.
Soloviev, MV et al. "Different species require different correction factors for the QT
interval." Cardiovasc Toxicol, 2006: 6(2): 145-157.
Soyka, LF. et al. "Clinical safety profile of sotalol in patients with arrhythmias." Am J
Cardiol, 1990: 65; 74A-81A.
Stambler, BS. et al. " Efficacy and safety of repeated intravenous doses of ibutilide for
rapid conversion of atrial flutter or fibrillation. Ibutilide Repeat Dose Study
Investigators." Circulation, 1996: 94; 1613-1621.
Stein, KM et al. "Variability of the ventricular response in atrial fibrillation and prognosis
in chronic nonischemic mitral regurgitation." Am J Cardiol, 1994: 9: 906-11.
Stevenson, LW. "Implantable cardioverter-defibrillators for primary prevention of sudden
death in heart failure: Are there enough bangs for the bucks?" Circulation, 2006:
114: 101-103.
Sticherling, C. et al. "Effects of digoxin on acute, atrial fibrillation-induced changes in
atrial refractoriness." Circulation, 2000: 102; 2503-2508.
Stramba-Badiale, M et al. "Are gender differences in QTc present at birth? MISNES
Investigators. Multicenter Italian Study on Neonatal Electrocardiography and
Sudden Infant Death Syndrome." Am J Cardiol, 1995: 75(17):1277-8.
Stubhan, M. et al. "Evaluation of cardiovascular and ECG parameters in the normal,
freely moving Gottingen Minipig." J of Pharm & Tox Methods, 2008: 57: 202-211.
180
Tan, HL et al. "A calcium sensor in the sodium channel modulates cardiac excitability."
Nature, 2002: 415: 442-47.
Tessier, S et al. "Regulation of the transient outward K+ current by Ca2+/calmodulin-
dependent protein kinases II in human atrial myocytes." Circ Res, 1999: 85: 810-
19.
Thomsen, MB et al. "Increased short-term variability of repolarization predicts d-sotalol-
induced torsades de pointes in dogs." Circulation, 2004: 110: 2453-59.
Todt, H et al. "Mode of QT correction for heart rate:Implications for the detection of
inhomogeneous repolarization after myocardial infarction." Am Heart J, 1992:
124: 602-609.
Tohse, N et al. "Intracellular Ca2+ and protein kinase C modulate K+ current in guinea
pig heart cells ." Am J Physiol , 1987: 253: H1321-24.
Tomaselli, GF. et al. "Sudden cardiac death in heart failure. The role of abnormal
repolarization." Circulation, 1994: 90: 2534-2539.
Torp-Pedersen, C. et al. "Dofetilide in patients with congestive heart failure and left
ventricular dysfunction. Danish Investigations of Arrhythmia and Mortality on
Dofetilide Study Group." N Engl J Med , 1999: 341; 857-865.
U.S. Dept. of Health and Human Services. Guidance for Industry-E14 clinical evaluation
of QT/QTc interval prolongation and proarrhythmic potential for non-
antiarrhythmic drugs. Washington, D.C.: US Govt. Press, 2005, 1-16.
US Food and Drug Administration. .21 CFR 361. Washington, D.C.: USFDA, April 1,
1991.
US Food and Drug Administration. Guidance for Industry: E14 clinical evaluation of
QT/QTc interval prolongation and proarrhythmic potential for non-antiarrhythmic
drugs. US Food and Drug Administration, 2005.
Van de Water, A et al. "An improved method to correct the QT interval of the
electrocardiogram for changes in heart rate." J Pharmacol Methods, 1989: 22:
207-217.
Varro, A et al. "Ionic currents and action potentials in rabbit, rat, and guinea pig
ventricular myocytes." Basic Res Cardiol , 1993: 88: 93-102.
Varro, A et al. "The role of Ika in dog ventricular muscle and Purkinje fibre
repolarization." J Physiol, 2000: 523: 67-81.

181
Varro, A, and JG Papp. "Low penetrance, subclinical congenital LQTS: concealed LQTS
or silent LQTS?" Cardiovasc Res, 2006: 70(3):404-6.
Varro, A. et al. "Theoretical possibilities for the development of novel antiarrhythmic
drugs." Curr Med Chem, 2004: 11(1): 1-11.
Vincze, D et al. "Relevance of anesthesia for dofetilide-induced torsades de pointes in
alpha-adrenoceptor-stimulated rabbits." Br J Pharmacol, 2008: 153 (1): 75-89.
Virag, L et al. "Self-augmentation of the repolarization legthening is related to the shape
of the action potential: the role of the intrinsic properties of Ikr and Ikl and its
implication to the reverse rate dependency." Br J Pharmacol, 2009: 156: 1076-
84.
Volders, PG et al. "Downregulation of delayed rectifier K+ currents in dogs with chronic
complete atrioventricular block and acquire torsades de pointes." Circulation,
1999: 100: 2455-61.
Volders, PGA et al. "Probing the contribution of Ika to canine ventricular repolarization.
Key role for ß-adrenergic receptor stimulation." Circulation, 2003: 107: 2753-60.
Walker, DK et al. "Liquid-liquid extraction and high-performance liquid chromatography
for the determination of a novel antidysrhythmuc agent in human urine." J
Chromatogr, 1991: 568(2):475-80.
Walker, DK et al. "Pharmacokinetics of a series of bis in the beagle dog." Xenobiotica,
1996: 26(10):1101-11.
Walsh, KB, and RS Kass. "Distinct voltage-dependent regulation of a heart-delayed Ik
by protein kinases A and C." Am J Physiol , 1991: 261: C1081-90.
Wang, Z et al. "Potential molecular basis of different physiological properties of the
transient outward K+ current in rabbit and human arterial myocytes." Circ Res,
1999: 84: 551-61.
Ward, C et al. "A new familial cardiac syndrome in children." J Ir Med Assoc, 1964: 54;
103-106.
Wiggers, CJ. "Pathways of medical progress." Science, 1940: 91: 25.
Wirth, KJ et al. "Atrial effects of the novel K(+)-channel-blocker AVE0118 in
anesthetized pigs." Cardiovasc Res, 2003: 60(2):298-306.
Wirth, KJ et al. "In vitro and in vivo effects of the atrial selective antiarrhythmic
compound AVE1231." J Cardiovasc Pharmacol, 2007: 49(4): 197-206.
182
Wirth, KJ et al. "KATP channel blocker HMR 1883 reduces monophasic action potential
shortening during coronary ischemia in anesthetized pigs." Naunyn
Schmiedebergs Arch Pharmacol, 2000: 361(2):155-60.
Wirth, KJ, and K. Knoblock. "Differential effects of dofetilide, amiodarone, and class 1c
drugs on left and right atrial refractoriness and left atrial vulnerability in pigs."
Naunyn-Schmiedeberg’s Arch Pharmacol, 2001: 363: 166-174.
Witchel, HJ. "Drug-induced hERG block and long QT syndrome." Cardiovasc Ther,
2011: 29(9): 251-259.
Wohlfart, B, and O. Pahlm. "Normal values for QT intervals in ECG during ramp
exercise on bicycle." Clin Physiol, 1994: 14: 371-377.
Woosley, RL. et al. "Mechanism of the cardiotoxic actions of terfenadine." JAMA, 1993:
269; 1532-1536.
World Health Organization. WHO Scientific Group on Sudden Cardiac Death. Sudden
Cardiac Death: report of a WHO scientific group. WHO Publication, 1985, 726.
Wu, L et al. "Role of late sodium current in modulating the proarrhythmic and
antiarrhythmic effects of quinidine ." Heart Rhythm, 2008: 5 (12): 1726-34.
Xiao, L et al. "Feedback remodeling of cardiac potassium current expression. A novel
potential mechanism for control of repolarization reserve." Circulation, 2008a:
118: 983-92.
Xiao, L et al. "Mechanisms underlying rate-dependent remodeling of transient outward
potassium current in canine ventricular myocytes." Circ Res, 2008b: 103: 733-42.
Xiong, W et al. "Transmural heterogeneity of Na+-Ca2+ exchange: evidence for
differential expression in normal and failing hearts." Circ Res, 2005: 97: 207-09.
Yamaguchi, M et al. "T wave peak-to-end interval and QT dispersion in acquired long
QT syndrome: A new index for arrhythmogenicity." Clin Sci (London), 2003: 105
(6): 671-6.
Yan, GX, and C Antzelevitch. "Cellular basis for the normal T wave and the
electrocardiographic manifestations of the long-QT syndrome." Circulation, 1998:
(18): 1928-36.
Yang, T et al. "Rapid inactivation determines the rectification and [K+]o dependence of
the rapid component of the delayed rectifier K+ current in cardiac cells." Circ
Res, 1997: 80(6):782-9.
183
Yang, T, and DM Roden. "Extracellular potassium modulation of drug block Ikr
Implications for torsade de pointes and reverse use-dependence ." Circulation,
1996: 93: 207-411.
Yazawa, K, and M Kameyama. "Mechanism of receptor-mediated modulation of the
delayed outward potassium current in guinea-pig ventricular myocytes." J
Physiol, 1990: 421: 135-50.
Yoshinaga, M et al. "Exponential correction of QT interval to minimize the effect of the
heart rate in children. ." Jpn Circ J, 1993: 57: 102-108.
Zhang, H et al. "Repolarization and vulnerability to re-entry in the human heart with
short QT syndrome arising from KCNQ1 mutation: a simulation study." Prog
Biophys Mol Biol , 2008: 96 (1-3): 112-31.
Zhang, L et al. "Electrocardiographic features in Andersen-Tawil syndrome patients with
KCNJ2 mutations: characteristics T-U wave predicts the KCNJ2 genotype."
Circulation, 2005: 111: 2720-26.
Zhao, N. "Effects of baroreflex stimulation on the ECG in chronic cardiac sympathetic-
denervation neonatal swine." Clinical autonomic research, 1998: (8): 287.
Zipes, DP. "Electrophysiological remodeling of the heart owing to rate." Circulation,
1997: 95: 1745-48.
Zipes, DP, and HJJ Wellens. "Sudden cardiac death." Circulation, 1998: 98:2334-2351.
Zoll, PM. "Resuscitation of the heart in ventricular standstill by external electric
stimulation." N Engl J Med, 1952: 247; 768-771.
Related Documents