eScholarship provides open access, scholarly publishing services to the University of California and delivers a dynamic research platform to scholars worldwide. Lawrence Berkeley National Laboratory Lawrence Berkeley National Laboratory Peer Reviewed Title: The effect of specific chloride adsorption on the electrochemical behavior of ultrathin Pd films deposited on Pt(111) in acid solution Author: Arenz, M. Stamenkovic, V. Schmidt, T.J. Wandelt, K. Ross, P.N. Markovic, N.M. Publication Date: 10-01-2002 Publication Info: Lawrence Berkeley National Laboratory Permalink: http://escholarship.org/uc/item/1pk2g6tf

Welcome message from author
This document is posted to help you gain knowledge. Please leave a comment to let me know what you think about it! Share it to your friends and learn new things together.
Transcript
eScholarship provides open access, scholarly publishingservices to the University of California and delivers a dynamicresearch platform to scholars worldwide.
Lawrence Berkeley National LaboratoryLawrence Berkeley National Laboratory
Peer Reviewed
Title:The effect of specific chloride adsorption on the electrochemical behavior of ultrathin Pd filmsdeposited on Pt(111) in acid solution
Author:Arenz, M.Stamenkovic, V.Schmidt, T.J.Wandelt, K.Ross, P.N.Markovic, N.M.
Publication Date:10-01-2002
Publication Info:Lawrence Berkeley National Laboratory
Permalink:http://escholarship.org/uc/item/1pk2g6tf

LBNL-51674
The effect of specific chloride adsorption on the electrochemical
behavior of ultrathin Pd films deposited on Pt(111) in acid solution
M. Arenza*, V. Stamenkovicb, T.J. Schmidtc, K. Wandelta, P.N. Rossb, N.M. Markovicb*
a Institut für Physikalische und Theoretische Chemie, Universität Bonn, Wegelerstr.12,
D-53115 Bonn, Germany
b Materials Science Division, Lawrence Berkeley National Laboratory, University of
California, Berkeley, CA 94720 USA
c present address: Paul-Scherrer-Institut, CH-5232 Villingen-PSI, Switzerland
* corresponding authors: [email protected], [email protected]
Abstract
The electrochemical behavior of thin Pd films supported on a Pt(111) electrode is
investigated by cyclic voltammetry (CV) and in-situ Fourier transform infrared (FTIR)
spectroscopy. It is demonstrated that in perchloric acid solution underpotential deposition
of hydrogen (Hupd) and hydroxyl adsorption (OHad) is in strong competition with the
adsorption of Cl- anions, the latter being present as a trace impurity in HClO4. The
interaction of Cl- with Pd is rather strong, controlling the adsorption of Hupd and OHad as
well as the kinetic rate of CO oxidation. The microscopic insight (the binding sites) of the
adsorbed CO (COad) and the rate of CO oxidation (established from CO2 production) on
Pt(111) modified with a (sub)monolayer of Pd is elucidated by means of Fourier infrared
1
(FTIR) spectroscopy. The appearance of both the characteristic Pt(111)-COad and
Pt(111)1 ML Pd-COad stretching bands on a Pt(111) surface covered by 0.5 ML Pd
confirms previous findings that the Pd atoms agglomerate into islands and that the bare Pt
areas and the Pd islands behave according to their own surface chemistry. The systematic
increase of the Pd surface coverage results in a gradual change in the catalytic properties
of Pt(111)-xPd electrodes towards CO oxidation, from those characteristic of bare
Pt(111) to those which are characteristic for Pt(111) covered with 1 ML of Pd.
Keywords: Electrochemical methods, Reflection spectroscopy, Metal-electrolyte
interfaces, Adsorption kinetics, Carbon monoxide, Platinum, Palladium
2
1. Introduction
During the last decade there has been a substantial progress in the field of surface
(electro)chemistry on bimetallic surfaces which are created by deposition of ultrathin
metal films on well-characterized surfaces. After the successful UHV studies [1-3] and
complementary quantum-chemical calculations [4-6], the adsorption and catalytic
properties of pseudomorphic Pd films supported on Pt [7-11] and Au [12-15] single
crystals has also received considerable attention in the field of surface electrochemistry.
For example, the morphology and stability of Pd films on Pt(111) were examined by
utilizing in-situ surface x-ray diffraction [11] and FTIR measurements [16, 17]. SXS
studies demonstrated that both UHV and electrochemically deposited films are
pseudomorphic, i.e. the position of the Pd atoms is in registry with the underlying
substrate. The palladium (sub)monolayer films are rather stable in the potential region
between hydrogen evolution and oxide formation, showing no sign of hydrogen
absorption, characteristic for bulk Pd and also observed for 3D Pd islands deposited on
Pt(hkl) with ΘPd > 1 ML [18]. FTIR characterization of COad on Pt(111) modified with
0ML < ΘPd < 1ML was used as an indirect probe in order to establish whether Pd forms
2D island or whether the Pd atoms are dispersed on the surface much more randomly, as
seen for example for the deposition of Bi on transition metals [19]. The fact that three
different C-O stretching bands, corresponding to COad on Pd and on the bare Pt substrate,
are observed on a Pt(111) electrode partially covered by Pd, indirectly suggested that Pd
atoms form islands and that Pt and Pd exhibit their own individual surface chemistry [16,
17]. Very recently, it has been proposed that the kinetics of CO oxidation on Pt(hkl) is
not governed only by the surface concentration of COad and OHad species, but is also
3
strongly affected by the delicate balance between the coverage of COad, OHad and anions
from the respective supporting electrolyte [20].
The objective of the present paper is to elucidate the relationship between the
structure and the composition of the Pt(111)-xPd surface and the kinetics of CO oxidation
in perchloric acid solution. It will be shown that the strong interaction between Pd and Cl-
controls both the adsorption of Hupd and OHad as well as the kinetic rate of CO oxidation.
FTIR measurements confirm that the Pd atoms coalesce into islands on Pt(111), forming
a bimetallic surface in which the Pt and Pd patches retain their own characteristic surface
electrochemistry. It will be shown that the systematic increase of the Pd surface coverage
results in an increasing inhibition of CO oxidation, suggesting that Pt atoms are more
active for CO oxidation than Pd atoms. This finding is consistent with a stronger Pd-Cl
than Pt-Cl interaction, e.g., Clad acts primarily as a site blocking inhibitor for OHad
adsorption on Pd sites.
2. Experimental
2.1 Electrochemical measurements
The pretreatment and mounting of the Pt(111) single crystal in a rotating disk
electrode configuration was fully described previously [21]. In short, following crystal
cleaning by flame annealing in a hydrogen flame and cooling in a mild argon stream the
crystal was protected by a drop of ultra pure water, transferred to and mounted into the
disk position of an insertable ring-disk electrode (RDE) assembly (Pine Instruments).
Subsequently, the electrode was transferred into the electrochemical cell. For the
electrochemical deposition of palladium the clean, flame annealed Pt(111) sample was
subjected to a potential cycling between 0.05 < E <0.9 V in a 0.05 M H2SO4 + 5⋅10-6 M 4
PdO solution with a sweep rate of 50 mV/s. The amount of Pd deposited was controlled
by monitoring the continuous change of the voltammetric features from those
characteristic of bare Pt(111) to those of a pseudomorphic monolayer of palladium. Since
the onset of 3-D palladium growth, indicated by a second peak at about 0.3 V in the
cyclic voltammogram [20], may actually start shortly before the completion of the
pseudomorphic monolayer, the formation of the peak at 0.3 V during palladium
deposition was avoided. The palladium coverage, indicated in the text, is calculated using
a calibration curve established by plotting the charge densities in the Hupd-region of the
CV’s of UHV-prepared Pt(111)-xPd surfaces against the Pd coverage x as determined by
low energy ion scattering (LEIS) [17]. After the electrochemical Pd deposition, the
electrode was rinsed with ultra pure water and transferred either into the in-situ FTIR cell
or to a thermostated standard three compartment electrochemical cell for recording the
cyclic voltammograms, both containing 0.1 M HClO4 solution. For the electrochemical
cell a circulating constant temperature bath (Fischer Isotemp Circulator) maintained the
temperature of the electrolyte constant within ± 0.5 K.
The acid solutions were prepared from concentrated sulfuric acid (Baker Ultrex)
and concentrated perchloric acid (EM Science Suprapure), respectively, using triply
pyrodistilled water. Prior to each experiment all solutions were deaerated by purging with
argon (Air Products 5N5 purity). The reference electrode for the electrochemical cells
was a saturated calomel electrode (SCE) separated from the working electrode
compartment by a closed electrolyte bridge in order to avoid chloride contamination. All
potentials shown in the text, however, refer to the reversible hydrogen electrode in the
5
same solution, calibrated from the reversible potential for the hydrogen
evolution/oxidation reaction.
2.2 FTIR measurements
For the in-situ FTIR measurements a Nicolet Nexus 670 spectrometer was
available with a nitrogen cooled MCT detector. All IR measurements were performed in
a spectroelectrochemical glass cell designed for an external reflection mode in a thin
layer configuration. The cell is coupled at its bottom with a CaF2 prism beveled at 60°
from the surface normal. Prior to each measurement, a cyclic voltammogram was
recorded in order to check the cleanliness of the electrode surface. Subsequently the
solution was saturated with CO (Spectra Gases N4.5) for at least 3 min. holding the
electrode potential at 0.05 V. For the CO oxidation measurements in argon saturated
perchloric acid at first CO was adsorbed by purging the solution for 5 minutes with CO
and subsequently for 20 minutes with argon, before pressing the sample onto the prism.
The spectra were recorded with a resolution of 8 cm-1. All measurements were performed
using p-polarized light. In order to obtain a single beam spectrum 100 scans were
collected at each potential resulting in a recording time of 50 s. Absorbance spectra were
calculated as the ratio –log(R/R0) where R and R0 are the reflectance values
corresponding to the sample and reference spectra, respectively. Reference spectra were
recorded either at 1.0 V, where COad is completely oxidized, or at 0.05 V before the onset
of COad oxidation. The reference potential in the spectroelectrochemical cell was
controlled by a reversible hydrogen electrode (RHE).
3. Results and discussion
6
3.1 Cyclic voltammetry
In Figure 1a the cyclic voltammogram of bare Pt(111) in perchloric acid solution
is compared to the voltammograms of two Pt(111)-xPd electrodes (with x ≈ 0.15 and
x 1, respectively) in order to establish how the systematic increase of the Pd surface
coverage modifies the voltammetric profiles of Pt(111). The CV of bare Pt(111) exhibits
three characteristic potential regions: the hydrogen underpotential deposition region
(H
≈
upd, 0 < E < 0.375 V) is followed first by the double-layer potential region
(0.375 < E < 0.6 V) and then by the so-called “butterfly” feature (0.6 < E < 0.85 V).
There remains some disagreement over the identity of the processes producing the
butterfly feature in perchloric acid, particularly the sharp peak near 0.8 V. In previous
work from this laboratory [22,23], we have suggested the primary process is the
formation of adsorbed OH, co-adsorbed with a small amount of chloride (present as an
impurity in perchloric acid at a concentration of at least 10-7 M in even the most
meticulously prepared electrolyte). Ito and co-workers [24] suggested the OH was
co-adsorbed with specifically adsorbed perchlorate anion, not chloride. Based on Monte
Carlo simulations, Koper and co-workers suggested the sharp peak is produced by an
order-disorder transition in the adsorbed OH. We note here, as we have done before [25],
that for the butterfly feature in alkaline solution, where there is neither perchlorate nor
chloride anion, there is no sharp peak and the total charge is as high or higher than in
perchloric acid. It seems to us that the sharp peak may indeed be associated with an
order-disorder transition, but not involving OH alone, but OH with a co-adsorbed anion,
most probably (in our opinion) chloride. We shall come back to this issue of chloride in
the perchloric acid in discussing the results with Pd modified surfaces.
7

Figure 1 shows that the deposition of Pd on Pt(111) produces significant changes
in the cyclic voltammogram. A close inspection of Figure 1 reveals that there are three
characteristics in the voltammetric profiles that demonstrate the effect of Pd. The first is
an increase of the charge in the Hupd region with an increase of the Pd surface coverage,
presumably due to a stronger Pt(111)-Pd-Hupd interaction compared to the Pt(111)-Hupd
interaction. As shown in Figure 1b, the Hupd charge increases from about (161±5) µC/cm2
for bare Pt(111) to a value of (240±5) µC/cm2 for a full monolayer of Pd on Pt(111) (as a
guide for the eye a dashed line is included to Figure 1b anticipating a linear dependency).
These charges correspond to hydrogen coverages of (0.67±0.02) ML and
(1.00±0.02) ML, respectively (for any adsorbate, 1ML is defined as one monovalent
molecule/adatom adsorbed per Pt surface atom, or 1.5 x 10¹⁵ molecules/cm2, which is
equivalent to 240 µC/cm2). This observation has been reported previously also for Hupd in
sulfuric acid [10] and alkaline [17] solutions. The second characteristic is that the peak
position for the butterfly feature shifts negatively due to an increase of ΘPd, by up to
about 0.1 V from the position on bare Pt(111) to that on Pt(111) modified with a
pseudomorphic Pd layer. This finding is consistent with the stronger affinity of Pd to
oxygen [28, 29], as recently discussed for the oxide formation on Pt(111)-Pd in alkaline
solution [17]. The third characteristic is that the charge associated with the “butterfly”
formation decreases with increasing ΘPd (see Figure 1c). Note, that the voltammograms
of the palladium films illustrated in Figure 1 show some similarities and differences with
the results recently presented by Alvarez et al. [27]. In agreement with reference [27] is
the shape of the CV at low potentials and the integrated charge in the Hupd region. In the
8

OH adsorption potential region, however, there is no (small) sharp peak as reported in
ref. [27]. The authors claim that this sharp peak is characteristic of highly-ordered
Pt(111) substrates for the deposition, and does not occur on less well-ordered Pt(111)
surfaces. The absence of this small peak in our voltammetry is probably indicative of the
relative imperfection of our flame-annealed bulk single crystal versus the Clavilier
“bead” single crystal employed in [27]. One aspect of the voltammetry not discussed in
ref. [27], although it is present in their data as well as ours, is the decrease in total charge
in OH adsorption region upon Pd deposition. This is a surprising result with respect to the
greater oxophilicity of Pd. One possible explanation of this apparently conflicting
behavior of palladium surface atoms (note, that there might be an electronic influence of
the underlying platinum substrate) in HClO4 is the supposition that the adsorption of OH-
on the Pd sites is inhibited by the competitive adsorption of chloride anions. Small
concentrations of chloride may be preexisting as a trace impurity even in “ultrapure”
HClO4 and/or may be generated by the reduction of perchlorate ions catalyzed by
palladium [32]. Consequently, the stronger Pd-Cl interaction (indicated by the higher
bond energy in Pd-Cl than in Pt-Cl compounds [31]) may mean that OHad cannot displace
all the Clad from the surface, thereby leading to the “loss” of charge from ca. 80 µC/cm2
on Pt(111) to ca. 60 µC/cm2 on the Pt(111)-1 ML Pd surface in perchloric acid solution.
At slow sweep rates (10 mV/s), the charge under the “butterfly” feature on the Pd
covered Pt(111) surface decreases even further to ca. 50 µC/cm2 whereas under identical
experimental conditions the charge associated with the butterfly feature on bare Pt(111)
remains unaffected.
9

In order to elucidate the possible role of very small amounts of chloride present in
perchloric acid solution on the adsorption of Hupd and OHad on a Pt(111)-Pd electrode, in
the present work the Cl- concentration was intentionally increased in the vicinity of the
electrode surface. In electrochemical experiments, the rate of mass transport of reactants
to the electrode surface can usually be increased by the application of several methods,
including the rotation of the electrode (or the stirring of the solution), a decrease of the
sweep rate, an increase of the temperature, and an increase of the reactant concentration
in the electrolyte. An enhanced mass-transport of the small amount of Cl- (ca. 10-7 M)
from the bulk of “pure” HClO4 solution to the electrode surface by forced convection
should have a similar effect as the addition of chloride to the electrolyte. Therefore in
Figure 2 voltammetric profiles of the Pt(111)-Pd electrode in 0.1 M HClO4 and in 0.1 M
HClO4 containing 10-6 M Cl- are presented with and without rotating the electrode. As
can be seen in Figures 2c and d, the rotation of the electrode (1600 rpm) has a significant
effect on both the shape of the Hupd peaks and on the adsorption of OH-. In particular, the
observed Hupd peaks in the voltammogram of the rotated electrode exhibit an asymmetry,
in contrast to the relatively symmetrical Hupd peaks observed with a stationary electrode.
This asymmetry displays the fact, that upon rotating the electrode the current density in
the Hupd peak is increased in the cathodic sweep of the CV, whereas in the anodic sweep
the observed current densities in the Hupd potential region are the same in the stationary
experiments and under enhanced mass-transfer conditions. On the other hand in the OH-
adsorption potential region no peak can be observed anymore when rotating the
electrode, indicating the complete blocking of the OHad adsorption by another species.
10

In the experiments presented in Figure 2b Cl- is intentionally added to the
solution. The observed voltammetric features in the presence of small amounts of
chloride (10-6 M HCl) are qualitatively similar to the effect induced by a rotation of the
electrode in “pure” HClO4. Whereas the Hupd region in the anodic scan remains
unaffected by the addition of small amounts of chloride, in the cathodic scan the various
Hupd peaks merge into a single peak located at 0.2 V. Furthermore the OH- adsorption is
largely suppressed.
Interestingly, a very similar behavior is observed for the adsorption of hydrogen
on Pt(100) in HClO4 containing 5 x 10⁻⁶ M Cl- [32]. In order to explain the asymmetry of
the Hupd peaks on Pt(100) in the presence of trace levels of Cl-, the authors suggested that
the diffusion controlled adsorption of Cl- is responsible for the observed asymmetry. For
details see reference [32]. Here the same reasoning is adopted and described in the
following. We suggest, that the asymmetry of the Hupd peaks induced by the rotation of
the Pt(111)-Pd electrode is due to an increased mass-transport of Cl- from the bulk of the
HClO4 solution to the electrode surface and due to an enhanced adsorption of Cl- anions
on the Pd sites. Consequently, the surface coverage of Clad is higher on the RDE,
resulting in an almost complete blocking of the OH- adsorption. This leads to a shift of
the Hupd peak, which follows the desorption of Clad, to lower potentials when sweeping
the potential from the positive limit to negative potentials, thereby producing a sharp
peak located at ca. 0.2 V. After desorption, Cl- diffuses away from the surface, and then
re-adsorbs slowly in the positive sweep reaching the maximum surface coverage at the
positive potential limit. The asymmetry observed in the Hupd potential region is, therefore,
completely controlled by the different Clad surface coverage in the positive and negative
11

sweep direction. Diffusion and Hupd desorption simultaneously control the Cl- adsorption
during the anodic sweep. Clearly, under enhanced mass-transfer conditions even traces of
Cl- present in ‘pure” HClO4 control completely the oxide formation on the Pt(111)-Pd
surface. Therefore the observed effect of small amounts of chloride (10-6 M HCl), which
are intentionally added to the solution (see Figure 2b), is qualitatively similar to the effect
of rotation.
Very recently, it was shown that with an increased amount of chloride added to
the perchloric acid (10-3 M HCl) , the cyclic voltammogram of Pt(111)-1ML Pd becomes
symmetrical again and simultaneous desorption/adsorption peaks can be seen in the
anodic cycle of the Hupd potential region and vice versa in the cathodic cycle [33]. Notice
that the same behavior was observed for the Pt(100)-Cl system in ref. [32] suggesting that
trace amounts of Cl- and not the high concentration of perchlorate anions control the
adsorption properties of the Pt(111)-Pd surface. Although the binding energy of OHad is
stronger on Pd than on Pt, due to the strong Pd-Cl interaction, the OHad coverage is
higher on Pt(111) than on Pt(111)-1MLPd, a fact which will have consequences for our
interpretation of the catalytic activity of Pt and Pd surfaces.
3.2 In-situ FTIR measurements
In our recent paper the electrooxidation of carbon monoxide on Pt(111)-xPd in
alkaline solution was studied by FTIR spectroscopy [17]. The results clearly
demonstrated that the kinetic rate of CO oxidation is inhibited on Pt(111) modified by Pd,
despite of the fact that the adsorption of OHad is enhanced on Pd sites. As an explanation
for these results we suggested that the kinetic rate of CO oxidation is strongly affected by 12

the delicate balance between the coverage and the nature of the electroactive species, the
Pd-OHad interaction being too strong to effectively oxidize adsorbed CO. In order to
demonstrate that in acid solution competitive anion adsorption also plays a significant
role in the kinetics of CO oxidation at the Pt(111)-xPd interfaces, the representative FTIR
results for molecular level characterization of the surface chemistry of COad on the Pd
modified Pt(111) surface in HClO4 with and without Cl- are summarized in the
Figures 3-6. When appropriate, these results will be compared with the corresponding
results obtained in alkaline solutions.
In-situ FTIR measurements were performed on several thin palladium films with
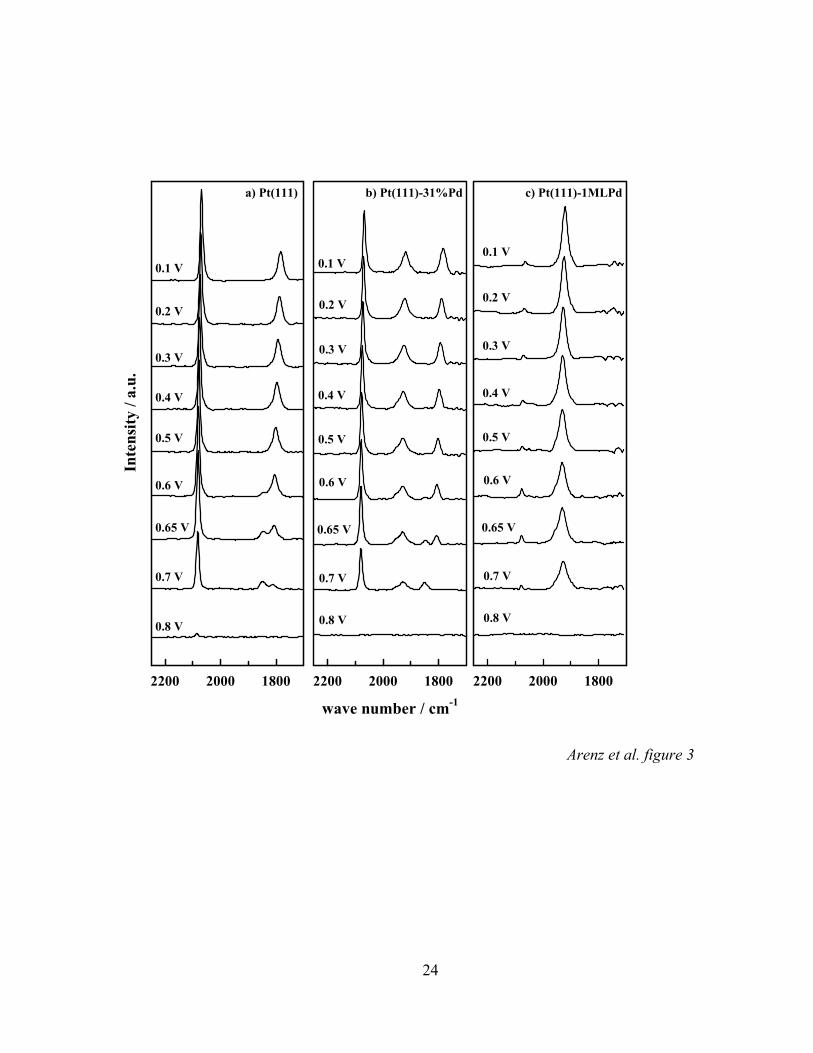
different Pd coverages supported on Pt(111). Figure 3 depicts potential dependent series
of infrared spectra of CO adsorbed on three different Pt(111)-xPd surfaces in CO
saturated perchloric acid solution. The reference spectra were recorded at 1.0 V. The
behavior of COad on Pt(111) (x = 0, Figure 3a) is well known [34] and shall therefore be
addressed first. At cathodic potentials below 0.6 V characteristic C-O stretching bands
near 2070 and near 1790 cm-1, corresponding to CO adsorbed on atop- and three-fold
hollow sites, respectively, can be distinguished. Going to more anodic potentials, the
band of the hollow species is replaced by a new C-O stretching band at about 1840 cm-1,
which can be related to the presence of bridge bonded CO. Comparison of the potential
dependent intensity changes for the three-fold and bridge CO bands with surface X-ray
scattering (SXS) data suggested that the three-fold hollow band (in combination with the
on-top band) is related to a p(2 x 2)-3CO structure whereas the loss of this ordered
structure is reflected by the appearance of the bridge-bonded CO band [34]. This change
in the adsorption geometry is accompanied by the onset of COad oxidation (see CO2
13

production in unsaturated perchloric acid solution in Figure 4), which begins at a
potential of about 0.55 V. As discussed in reference [34-36], COad is oxidatively removed
by reaction with OHad through a Langmuir-Hinshelwood mechanism.
For Pt(111) covered with a full monolayer of Pd FTIR spectra in CO saturated
0.1 M HClO4 (Figure 3c) reveal only one single absorption band near 1920 cm-1. This
finding is consistent with FTIR investigations of Inukai et al. [16] and Gil et al. [37] in
sulfuric acid solution, where the absorption peak has been assigned to bridge-bonded
COad. In line with these studies, the band for COad on 1 ML of Pd here also may be
denoted as CO adsorbed at Pd bridge sites. Besides the major Pd-COad band also a small
band at about 2070 cm-1 is present in the spectra. From Figure 3a it is clear that this band
corresponds to the adsorption of CO on very small Pd-free platinum islands. Therefore,
we conclude that the Pt(111) electrode is (almost completely) covered with a
pseudomorphic palladium monolayer. The pseudomorphic growth of palladium on
Pt(111) and its stability in acid [11] and alkaline solutions is confirmed by SXS
measurements.
In Figure 3b a series of FTIR measurements of COad on a Pt(111)-xML Pd
electrode with x = 0.31 can be seen. Even though FTIR spectra were recorded at surfaces
modified by electrochemical Pd deposition in several submonolayer-to-monolayer
quantities, this selected series of spectra is representative in order to demonstrate all
important features of CO surface electrochemistry on a Pd modified Pt(111) surface in
perchloric acid solution. At low potentials, three different C-O stretching bands near
1800 cm-1, 1920 cm-1 and 2070 cm-1 can be distinguished in the spectra. By comparison
with Figures 3a and 3c, these bands can clearly be assigned to multi-coordinated CO
14

adsorbed on Pt, CO bridge-bonded on Pd and CO adsorbed a-top on Pt atoms,
respectively. As discussed in previous work, the superposition of the Pt-CO and Pd-CO
bands and the lack of a second Pd-CO band are indications for the growth of palladium
islands of monoatomic height [16, 17].
As shown in the previous section, the effect of anions in the supporting electrolyte
should also be taken into account when analyzing the CO oxidation reaction, i.e.,
−+ ++→+ eHCOOHCO adad 2 (Eq. 1).
While anions cannot compete with CO for the same adsorption sites, anions are always in
strong competition with OHad adsorption. In Figure 4 we compare CO2 production on
three different surfaces under the same experimental conditions. These measurements
were recorded in argon-purged perchloric acid solution in order to prevent readsorption
of CO from the electrolyte and to separate the amount of CO2 formed on the different
surfaces more clearly. It can be seen that despite of the more or less same onset potential
for the adsorption of OH species on Pt(111)-Pd and Pt(111) in the voltammograms
(Figure 1) on a surface modified by Pd the onset of CO-oxidation is shifted to more
positive potentials. This finding is in contrast to our results in alkaline solution, where the
same onset of CO2 production was found for Pt(111) and Pt(111)-Pd [17]. Assuming that
for the oxidation of COad on Pt(111) and Pt(111)-Pd, respectively, the same
Langmuir-Hinshelwood mechanism is active and bearing in mind that the formation of
OHad starts at defect sites and steps on the surface [36], based on our voltametric results
it is reasonable to suggest that Cl- can effectively suppress the onset potential and the rate
of OHad formation, and thus the onset and the rate of CO oxidation (CO2 production in
Figure 4).
15
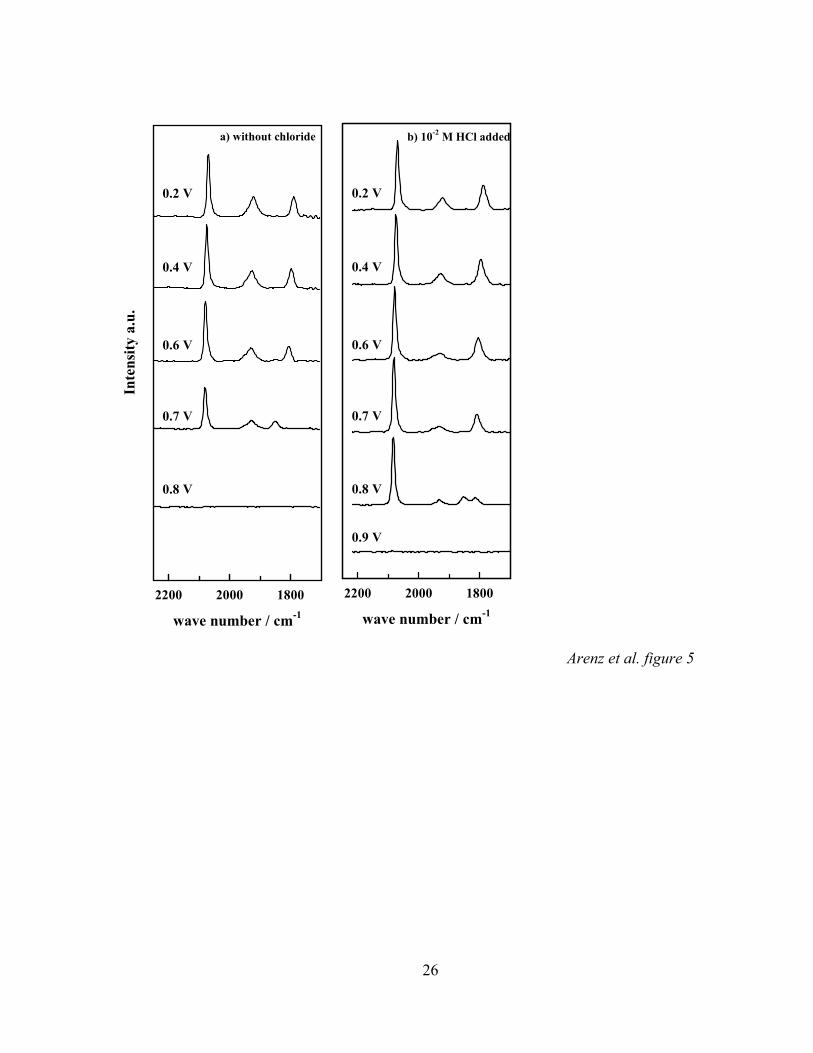
For further support of the hypothesis of competitive anion adsorption, we
compare the possible effects of Cl- on the rate of CO oxidation (CO2 production) in
HClO4 and HClO4 containing different amounts of Cl- at the same pH of the solution. The
corresponding FTIR results are shown in Figure 5 for CO adsorption on a Pt(111)-xML
Pd electrode with x = 0.31. The measurements of Fig. 5 a are performed in perchloric
acid whereas the spectra in Fig.5b are recorded in the same solution containing 10-2 M
HCl, both solutions being CO saturated (the evaluated palladium coverage in Fig. 5 b is
slightly different, x = 0.29). Comparing the two series it is obvious that the chloride
increases the stability of the COad layer towards oxidation. Whereas in the chloride free
electrolyte the CO adlayer is completely oxidized at 0.8 V, in the chloride containing
electrolyte at 0.8 V both CO adsorbed on palladium and adsorbed on platinum can be
detected. We sought to confirm the possible role of Cl- anions by monitoring the CO2
production from solution containing different amounts of Cl-. As depicted in Figure 6,
increasing the Cl concentration, namely to 10-4 M and 10-2 M, respectively, shifts the
onset potential for CO2 production to more positive potentials, is in line with the notion
that Cl competes with OHad for the active sites. As a result, the kinetics of CO oxidation
is hindered in the presence of Cl- anions. The kinetics of the surface reaction given in
Eq.1 is strongly affected by the delicate balance between the coverage of COad, OHad and
anions, as discussed in our previous papers [20, 38-40].
4. Conclusion
A combination of cyclic voltammetry and in-situ FTIR investigations has been
used in order to describe the electrochemical behavior of thin palladium films supported
on Pt(111) in perchloric acid solution. It has been shown that palladium affects the cyclic
16

voltammetry in perchloric acid in three characteristic ways. First of all, the hydrogen
coverage in Hupd potential region is calculated to be 1ML, independent of the pH of the
solution. This high coverage is attributed due to the strong interaction of Pd with
hydrogen and/or the absence of lateral repulsion of the Hupd. Secondly, the onset potential
for OHad formation is shifted to more negative potentials, but the charge density of the
butterfly peak is considerably lower on Pt(111)-1MLPd than on bare Pt(111). The former
is attributed to the greater oxophilicity of Pd vs. Pt, while the latter is attributed to
competitive adsorption of chloride anions present as an impurity. This hypothesis is
supported by additional experiments using intentionally added chloride.
The electrooxidation of COad on Pt(111)-xPd films in perchloric acid solution is
discussed in terms of the chloride impurity hypothesis. On the palladium films, the onset
potential for oxidation is shifted towards more positive potentials. This apparently
contradictory behavior is attributed to the effect of specific chloride adsorption on the
formation of OHad on the Pd sites.
Acknowledgments
This work was supported by the Director, Office of Science, Office of Basic Energy
Sciences, Division of Materials Sciences, U.S. Department of Energy under Contract
No. DE-AC03-76SF00098. M. A. acknowledges the German Academic Exchange
Service (DAAD) for a scholarship.
17
References
[1] Rodriguez, J.A. and D.W. Goodman, Science, 1992. 257(5072): p. 897-903. [2] Campbell, R.A., J.A. Rodriguez, and D.W. Goodman, Physical Review B-
Condensed Matter, 1992. 46(11): p. 7077-87. [3] Han, M., P. Mrozek, and A. Wieckowski, Physical Review B-Condensed Matter,
1993. 48(11): p. 8329-8335. [4] Hammer, B., Y. Morikawa, and J.K. Norskov, Physical Review Letters, 1996.
76(12): p. 2141-2144. [5] Mavrikakis, M., B. Hammer, and J.K. Norskov, Physical Review Letters, 1998.
81(13): p. 2819-2822. [6] Pallassana, V., M. Neurock, L.B. Hansen, B. Hammer, and J.K. Norskov, Physical
Review B, 1999. 60(8): p. 6146-6154. [7] Attard, G. and A. Bannister, Journal of Electroanalytical Chemistry, 1991. 300: p.
467. [8] Clavilier, J., M.J. Llorca, J.M. Feliu, and A. Aldaz, Journal of Electroanalytical
Chemistry, 1991. 310: p. 429. [9] Baldauf, M. and D.M. Kolb, Journal of Physical Chemistry, 1996. 100(27): p.
11375-11381. [10] Climent, V., N.M. Markovic, and P.N. Ross, Journal of Physical Chemistry B,
2000. 104(14): p. 3116-3120. [11] Markovic, N.M., C.A. Lucas, V. Climent, V. Stamenkovic, and P.N. Ross,
Surface Science, 2000. 465(1-2): p. 103-114. [12] Baldauf, M. and D.M. Kolb, Electrochimica Acta, 1993. 38(15): p. 2145-2153. [13] Kibler, L.A., M. Kleinert, R. Randler, and D.M. Kolb, Surface Science, 1999.
443(1-2): p. 19-30. [14] Naohara, H., S. Ye, and K. Uosaki, Journal of Electroanalytical Chemistry, 1999.
473(1-2): p. 2-9. [15] Kibler, L.A., M. Kleinert, and D.M. Kolb, Surface Science, 2000. 461(1-3): p.
155-167. [16] Inukai, J. and M. Ito, Journal of Electroanalytical Chemistry, 1993. 358(1-2): p.
307-315. [17] Arenz, M., V. Stamenkovic, T.J. Schmidt, K. Wandelt, P.N. Ross, and N.M.
Markovic, Surface Science, 2002. 506(3): p. 287-296. [18] Ball, M., C.A. Lucas, N.M. Markovic, V. Stamenkovic, and P.N. Ross, submitted
to Surface Science, 2002. [19] Paffett, M.T., C.T. Campbell, and T.N. Taylor, Journal of Chemical Physics,
1986. 85(10): p. 6176-6185. [20] Markovic, N.M., C.A. Lucas, B.N. Grgur, and P.N. Ross, Journal of Physical
Chemistry B, 1999. 103(44): p. 9616-9623. [21] Markovic, N.M., H.A. Gasteiger, and P.N. Ross, Journal of Physical Chemistry,
1995. 99(11): p. 3411-3415. [22] Markovic, N.M. and P.N. Ross, Journal of Electroanalytical Chemistry, 1992.
330: p. 499. 18
[23] Sawatari, Y., J. Inukai, and M. Ito, Journal of Electron Spectroscopy & Related Phenomena, 1993. 64-65: p. 515.
[24] Wagner, F.T. and P.N. Ross, Journal of Electroanalytical Chemistry, 1988. 250: p. 301.
[25] Markovic, N.M., T.J. Schmidt, B.N. Grgur, H.A. Gasteiger, R.J. Behm, and P.N. Ross, Journal of Physical Chemistry B, 1999. 103(40): p. 8568-8577.
[26] Koper, and M.T.M, Lukkien, J.J., Journal of Electroanalytical Chemistry, 2000. 485: p. 161
[27] Alvarez, B., J.M. Feliu, and Clavilier, J., Electrochemistry Communications, 2002. 4: p. 379.
[28] Tarasevich, B.J., D.A. Rand, and R. Woods, Journal of Electroanalytical Chemistry, 1973. 44: p. 83.
[29] Tarasevich, M.R., A. Sadkowski, and E. Yeager, Oxygen Electrochemistry, in Comprehensive Treatise in Electrochemistry, B.E. Conway, et al., Editors. 1983, Plenum Press: New York.
[30] Kibler, L.A., private communication. [31] CRC Handbook of Chemistry and Physics. 66th ed, ed. R.C. Weast. 1986, Boca
Raton, FL: CRC Press. [32] Markovic, N.M., M. Hanson, G. McDougall, and E. Yeager, Journal of
Electroanalytical Chemistry, 1986. 214: p. 555-566. [33] Schmidt, T.J., N.M. Markovic, V. Stamenkovic, P.N. Ross, G. Attard, and D.
Watson, submitted to Langmuir, 2002. [34] Akemann, W., K.A. Friedrich, and U. Stimming, Journal of Chemical Physics,
2000. 113(16): p. 6864-6874. [35] Lucas, C.A., N.M. Markovic, and P.N. Ross, Surface Science, 1999. 425(1): p.
L381-L386. [36] Lebedeva, N.P., M.T.M. Koper, J. Feliu, and R.A. v. Santen, Journal of
Electroanalytical Chemistry (in press), 2002. [37] Gil, A., A. Clotet, J.M. Ricart, F. Illas, B. Alvarez, A. Rodes, and J.M. Feliu,
Journal of Physical Chemistry B, 2001. 105(30): p. 7263-7271. [38] Markovic, N.M., B.N. Grgur, C.A. Lucas, and P.N. Ross, Surface Science, 1997.
384(1-3): p. L805-L814. [39] Markovic, N.M., B.N. Grgur, C.A. Lucas, and P.N. Ross, Journal of Physical
Chemistry B, 1999. 103(3): p. 487-495. [40] Markovic, N.M., C.A. Lucas, A. Rodes, V. Stamenkovic, and P.N. Ross, Surface
Science, 2002. 499: p. L149-L158.
19

Figure Captions
Figure 1: a) Cyclic voltammograms of Pt(111)-xPd electrodes in 0.1 M HClO4; scan rate
50 mV/s at room temperature; the palladium coverage x increases from x = 0 to
x = 0.15 and x = 1 (counted from top); b) CV Hupd peak area versus palladium
coverage; c) CV anodic peak area versus palladium coverage.
Figure 2: Cyclic voltammograms of Pt(111)-1ML Pd; scan rate 50 mV/s at room
temperature; a) in 50 mM HClO4; b) in 0.1 M HClO4 containing 10-6 M HCl c)
same conditions as in (a) but rotation of electrode with 1600 rpm; d) same
conditions as in (b) but rotation of electrode with 1600 rpm.
Figure 3: Series of infrared spectra of COad on (a) Pt(111), (b) Pt(111)-31%Pd and (c)
Pt(111)-1MLPd obtained by stepping the applied potential in a positive
direction in CO saturated 0.1 M HClO4 solution; each spectrum was
accumulated from 100 interferometer scans each the potential indicated; the
reference potential was taken at 1.0 V vs. RHE.
Figure 4: CO2 production from COad oxidation on three Pt(111)-xPd surfaces in argon
purged perchloric acid solution as a function of the electrode potential, –0.05 V
was used as reference potential.
Figure 5: Series of infrared spectra of COad on Pt(111)-31%Pd in CO saturated
0.1 M HClO4 solution; in (b) 10-2 M HCl are added; each spectrum was
accumulated from 100 interferometer scans at each potential indicated; the
reference potential was 1.0 V vs. RHE.
Figure 6: Comparison of the CO2 production as a function of Pd coverage.
20

21

E / VRHE
0.0 0.2 0.4 0.6 0.8 1.0
I / m
Acm
-2
0.05
Pd coverage / ML0.0 0.2 0.4 0.6 0.8 1.0
Cha
rge
/ µC
cm
-2
140
160
180
200
220
240
260
Pd coverage / ML0.0 0.2 0.4 0.6 0.8 1.0
Cha
rge
/ µC
cm
-2
505560657075808590
a)
c)
b)
∼1 ML Pd
0 ML Pd
∼0.15 ML Pd
Hupd peak
OHad peak
Arenz et al. figure 1
22

-0.1
0.0
0.1
a)
I / m
Acm
-2
I [m
A/c
m2 ]
-0.1
0.0
0.1
b)
E / VRHE
0.0 0.2 0.4 0.6 0.8 1.0
-0.3
-0.2
-0.1
0.0
0.1 c)
I / m
Acm
-2
E / VRHE
0.0 0.2 0.4 0.6 0.8 1.0
I [m
A/c
m2 ]
-0.3
-0.2
-0.1
0.0
0.1d)
0.1M HClO4
without rotation0.1M HClO4 + 10-6M HClwithout rotation
0.1M HClO4
1600 rpm0.1M HClO4 + 10-6M HCl1600 rpm
Arenz et al. figure 2
23
wave number / cm-1
180020002200180020002200
Inte
nsity
/ a.
u.
0.1 V
0.5 V
0.65 V
0.6 V
0.7 V
0.2 V
0.3 V
0.4 V
0.8 V
0.1 V
0.5 V
0.6 V
0.7 V
0.2 V
0.3 V
0.4 V
0.8 V
0.65 V
a) Pt(111) b) Pt(111)-31%Pd
180020002200
c) Pt(111)-1MLPd
0.1 V
0.5 V
0.6 V
0.7 V
0.2 V
0.3 V
0.4 V
0.8 V
0.65 V
Arenz et al. figure 3
24

E /VRHE
0.4 0.6 0.8 1.0
CO
2 int
ensi
ty a
.u.
Pt(111)Pt(111)-54%PdPt(111)-Pd
0.02
Arenz et al. figure 4
25
wave number / cm-1
180020002200
0.7 V
0.6 V
0.4 V
0.2 V
0.8 V
0.9 V
wave number / cm-1
180020002200
Inte
nsity
a.u
.a) without chloride
0.7 V
0.6 V
0.4 V
0.2 V
0.8 V
b) 10-2 M HCl added
Arenz et al. figure 5
26

E /VRHE
0.4 0.6 0.8 1.0
Inte
nsity
a.u
.
Pt(111)-31%Pd without Cl-
Pt(111)-28%Pd with 10-4 M HClPt(111)-28.5%Pd with 10-2 M HCl
CO2 intensity
0.02
Arenz et al. figure 6
27
Related Documents