The effect of reporting methods for dosing times on the estimation of pharmacokinetic parameters of escitalopram Yuyan Jin 1 , Bruce G. Pollock 2,3 , Ellen Frank 2 , Jeff Florian 1 , Margaret Kirshner 2 , Andrea Fagiolini 2 , David J. Kupfer 2 , Marc R. Gastonguay 4 , Gail Kepple 2 , Yan Feng 5 , and Robert R. Bies 1,2 1Department of Pharmaceutical Sciences, University of Pittsburgh, Pittsburgh, PA 2Department of Psychiatry, University of Pittsburgh,a Pittsburgh, PA 3Rotman Research Institute, University of Toronto, Ontario, CA 4Metrum Institute, Tariffville, CT 5Strategic Modeling and Simulation, BMS, Princeton, NJ Abstract The objective of this study was to compare population pharmacokinetic (PPK) models of escitalopram developed from dosage times recorded by a medication event monitoring system (MEMS) versus the reported times from patients with diagnosed depression. 73 patients were prescribed doses of 10,15 or 20 mg of escitalopram daily. Sparse blood samples were collected at weeks 4, 12, 24 and 36 with 185 blood samples obtained from the 73 patients. NONMEM was used to develop a PPK model based on dosing records obtained from MEMS prior to each blood sample time. A separate PPK analysis using NONMEM was performed for the same population using the patient reported last dosing time and assuming a steady state condition as the model input. Objective function values (OFV) and goodness of fit plots were used as model selection criteria. The absolute mean difference in the last dosing time between MEMS and patient reported times was 4.48 ± 10.12 hrs. A one compartment model with first-order absorption and elimination was sufficient for describing the data. Estimated oral clearance (CL/F) to escitalopram was statistically insensitive to reported dosing methods, (MEMS vs. patient reported: 25.5 (7.0%) vs. 26.9 (6.6%) L/hr). However, different dosing report methods resulted in significantly different estimates on the volume of distribution (V/F) (MEMS vs. Patient reported: 1000 (17.3%) vs. 767 (17.5%) L) and the absorption rate constant Ka (MEMS vs. Patient reported: 0.74 (45.7%) vs. 0.51 (35.4%) hr −1 ) for escitalopram. Furthermore, the parameters estimated from the MEMS method were similar to literature reported values for V/F (∼1100L) and Ka (∼ 0.8−0.9 hr −1 ) arising from traditional PK approaches. Keywords medication event monitoring system (MEMS); population pharmacokinetics; escitalopram; selective serotonin reuptake inhibitors (SSRI); antidepressant INTRODUCTION Population pharmacokinetic (PPK) analysis is a robust tool for obtaining valuable pharmacokinetic information from large clinical trials, where protocols may be limited to sparse drug concentration sampling 1 . However, it is difficult to obtain accurate dosing times from these clinical trials, as most dosages are not taken under direct observation. This is especially true for outpatients with chronic disease 2-4 . Population PK model input comprised NIH Public Access Author Manuscript J Clin Pharmacol. Author manuscript; available in PMC 2009 May 29. Published in final edited form as: J Clin Pharmacol. 2009 February ; 49(2): 176–184. doi:10.1177/0091270008327538. NIH-PA Author Manuscript NIH-PA Author Manuscript NIH-PA Author Manuscript

Welcome message from author
This document is posted to help you gain knowledge. Please leave a comment to let me know what you think about it! Share it to your friends and learn new things together.
Transcript
The effect of reporting methods for dosing times on the estimationof pharmacokinetic parameters of escitalopram
Yuyan Jin1, Bruce G. Pollock2,3, Ellen Frank2, Jeff Florian1, Margaret Kirshner2, AndreaFagiolini2, David J. Kupfer2, Marc R. Gastonguay4, Gail Kepple2, Yan Feng5, and Robert R.Bies1,2
1Department of Pharmaceutical Sciences, University of Pittsburgh, Pittsburgh, PA
2Department of Psychiatry, University of Pittsburgh,a Pittsburgh, PA
3Rotman Research Institute, University of Toronto, Ontario, CA
4Metrum Institute, Tariffville, CT
5Strategic Modeling and Simulation, BMS, Princeton, NJ
AbstractThe objective of this study was to compare population pharmacokinetic (PPK) models ofescitalopram developed from dosage times recorded by a medication event monitoring system(MEMS) versus the reported times from patients with diagnosed depression. 73 patients wereprescribed doses of 10,15 or 20 mg of escitalopram daily. Sparse blood samples were collected atweeks 4, 12, 24 and 36 with 185 blood samples obtained from the 73 patients. NONMEM was usedto develop a PPK model based on dosing records obtained from MEMS prior to each blood sampletime. A separate PPK analysis using NONMEM was performed for the same population using thepatient reported last dosing time and assuming a steady state condition as the model input. Objectivefunction values (OFV) and goodness of fit plots were used as model selection criteria. The absolutemean difference in the last dosing time between MEMS and patient reported times was 4.48 ± 10.12hrs. A one compartment model with first-order absorption and elimination was sufficient fordescribing the data. Estimated oral clearance (CL/F) to escitalopram was statistically insensitive toreported dosing methods, (MEMS vs. patient reported: 25.5 (7.0%) vs. 26.9 (6.6%) L/hr). However,different dosing report methods resulted in significantly different estimates on the volume ofdistribution (V/F) (MEMS vs. Patient reported: 1000 (17.3%) vs. 767 (17.5%) L) and the absorptionrate constant Ka (MEMS vs. Patient reported: 0.74 (45.7%) vs. 0.51 (35.4%) hr−1) for escitalopram.Furthermore, the parameters estimated from the MEMS method were similar to literature reportedvalues for V/F (∼1100L) and Ka (∼ 0.8−0.9 hr−1) arising from traditional PK approaches.
Keywordsmedication event monitoring system (MEMS); population pharmacokinetics; escitalopram; selectiveserotonin reuptake inhibitors (SSRI); antidepressant
INTRODUCTIONPopulation pharmacokinetic (PPK) analysis is a robust tool for obtaining valuablepharmacokinetic information from large clinical trials, where protocols may be limited tosparse drug concentration sampling 1. However, it is difficult to obtain accurate dosing timesfrom these clinical trials, as most dosages are not taken under direct observation. This isespecially true for outpatients with chronic disease 2-4. Population PK model input comprised
NIH Public AccessAuthor ManuscriptJ Clin Pharmacol. Author manuscript; available in PMC 2009 May 29.
Published in final edited form as:J Clin Pharmacol. 2009 February ; 49(2): 176–184. doi:10.1177/0091270008327538.
NIH
-PA Author Manuscript
NIH
-PA Author Manuscript
NIH
-PA Author Manuscript
of the patient reported last dosing time and a steady state assumption is the most commonlyused approach in PPK analysis with sparse sampling 2-5. Unfortunately, a significant drawbackto this approach is the steady state assumption which neglects partial adherence of outpatientsto prescribed medication regimens, dosing frequency, and the timing of doses 3, 4. In fact, onlyan average of 43−78% adherence has been reported for outpatients with chronic treatment 6.As such, the assumption of a steady state condition during PPK modeling may not beappropriate for data sets containing patients with partial adherence.
One method for obtaining accurate outpatient dosing records is the medication eventmonitoring system (MEMS), an electronic system which has been commercially availablesince 1989 6. MEMS detects medication bottle opening and closing over time and records theseevents 2. It is one of the most effective indirect methods for accurately determining the patientadherence 2, 4, 6, 7. MEMS generated information provides an alternative method for modeldevelopment, providing detailed dosing records and allowing the assumption of a steady statecondition to be avoided 2, 5. This approach has been successfully employed for PPK analysiswith a lopinavir study providing for the recreation of the entire concentration versus time profileover the entire treatment duration 5.
Escitalopram, the S-enantiomer of antidepressant citalopram, is a commonly prescribedselective serotonin reuptake inhibitors (SSRI) 8, 9. It selectively binds to the primary reuptakeinhibitory site of the serotonin transporter to produce its antidepressant effects 10, 11.Escitalopram has activity against both depression 8, 11-14 and anxiety disorders 8, 15, 16.After oral administration, maximum plasma concentrations of escitalopram are reached inabout 4 hours 9, 17, 18 with a half-life of 27−32 hours 9, 17, 18. Therefore, it is commonlygiven as a once daily dose 17, 18.
The goal of this study was to compare the PPK parameter estimates using input profiles basedon dosage history times recorded by the MEMS versus input profiles based on the last patientreported dosage time and assuming a steady state condition. Two separate PPK models forescitalopram were developed based on these separate sets of recorded dosing times with asubsequent comparison of PPK model parameters. In addition, due to difficulties commonlyencountered during model development for orally administered drug, two separate modelparameterizations were evaluated involving either a fixed or estimated oral compartmentabsorption rate (Ka).
SUBJECTS AND METHODSSubjects and Sampling
Escitalopram PK data was obtained from the Pittsburgh patients in a large randomized clinicaltrial (Clinical Trials Gov Identifier: NCT00073697) conducted at two international treatmentsites, including the University of Pittsburgh and the University of Pisa, Italy(http://clinicaltrials.gov/ct/show/NCT00073697). In summary, 73 patients, aged 18−66 yearsold were recruited. The patients were in an episode of non-psychotic major depression definedby the DSM-IV diagnosis and were not receiving any other anti-depressant treatments. A dailydose of 10, 15, or 20 mg of escitalopram was prescribed to patients over 69−441 days. Bloodsamples (10 ml) for the determination of escitalopram drug concentrations were collected atweeks 4, 12, 24 and 36, and a total of 185 samples were available for the data analysis. Theactual sample times and dates of all blood draws were recorded along with the date and timeof the patient reported time for the last dose. Concurrently, the entire dosing history wasmonitored using the MEMS system.
Jin et al. Page 2
J Clin Pharmacol. Author manuscript; available in PMC 2009 May 29.
NIH
-PA Author Manuscript
NIH
-PA Author Manuscript
NIH
-PA Author Manuscript
Determination of escitalopram ConcentrationsBlood samples (10 ml) were collected by venipuncture using a tourniquet and a 21g needleinto lavender top Vacutainer tubes containing 15 % EDTA. The blood was placed in arefrigerated tabletop centrifuge (5°C) and processed for 10 minutes at 1500g. The plasma layerwas transferred into 5 ml polypropylene tubes and frozen at −70°C until analyzed.
Escitalopram was measured by reverse-phase high performance liquid chromatography(HPLC) using ultraviolet detection at a wavelength of 210 nm. This method was developed bythe Geriatric Psychopharmacology Laboratory at the University of Pittsburgh. Plasma isextracted using liquid-liquid extraction (ethyl acetate in heptane; 2:8, v/v) and back-extractedinto 0.025 M potassium phosphate, pH 2.4. Separation is completed using a Nucleosil-100 C185 um HPLC column, 120mm × 4.6 mm i.d. with a flow rate of 1.0 ml/minute. The assay islinear in the range of 2.5−500 ng/ml with an inter-assay variability (C.V.) of 2.9−3.93% andaccuracy (C.V.) of 1.8−3.9%. The limit of quantitation for escitalopram 2.5 ng/ml for this assay.
Data AnalysisDosing discrepancies between MEMS recorded and patient reported last dosing time werecalculated as the MEMS recorded time minus the patient reported time as shown in the Equation1:
Equation 1
Positive values indicate the MEMS recorded times were later than patient reported times, whilea negative value reflects that the patient reported times were later. The absolute time intervalbetween the two recording methods was also calculated by taking the absolute value ofEquation 1.
Nonlinear mixed-effects modeling was used to develop PPK models in NONMEM® (version5.1.1). The PPK models consisted of a PK structure model and a statistical model wherebetween subject and within subject variability were described. To consider multiple dosingeffects on each observed escitalopram concentration, the PPK model was developed based onthe ten day dosing history recorded by MEMS prior to each observed concentration. The tenday dosing records involved in the analysis were longer than five times the literature reportedhalf-life (27−32 hr) of escitalopram, and doses given before these dosing records should notaffect the measured escitalopram concentration 17, 18. A PPK analysis using NONMEM wasalso evaluated in the same population using the patient reported last dosing time with theassumption of a steady state condition. One and two-compartment linear mammillary PKmodels with first-order absorption and elimination were evaluated during model development.Model parameters were estimated using the first-order conditional estimation (FOCE) withinteraction method. Objective function values and goodness of fit plots were used as modelselection criteria. Diagnostic plots and post-processing of NONMEM® outputs wereperformed using R® (version 2.6.2) and SPSS® (version 14.0).
RESULTSPopulation reported last dosing time
185 blood samples from 73 patients were available for data analysis with study statisticssummarized in Table 1. A discrepancy in the last dosing time between the two reported dosingmethods was observed. The mean and standard deviation of the absolute time intervals in thelast dosing time between the two different reported dosing methods was 4.48 ± 10.12 hrs.However, the time intervals (MEMS reported last dosing time minus the patient reported) were
Jin et al. Page 3
J Clin Pharmacol. Author manuscript; available in PMC 2009 May 29.
NIH
-PA Author Manuscript
NIH
-PA Author Manuscript
NIH
-PA Author Manuscript
almost symmetrically distributed with a median value and standard deviation of 0.133 ± 11.073hrs. A histogram plot of time intervals calculated from the clinical trial is shown in Figure 1.
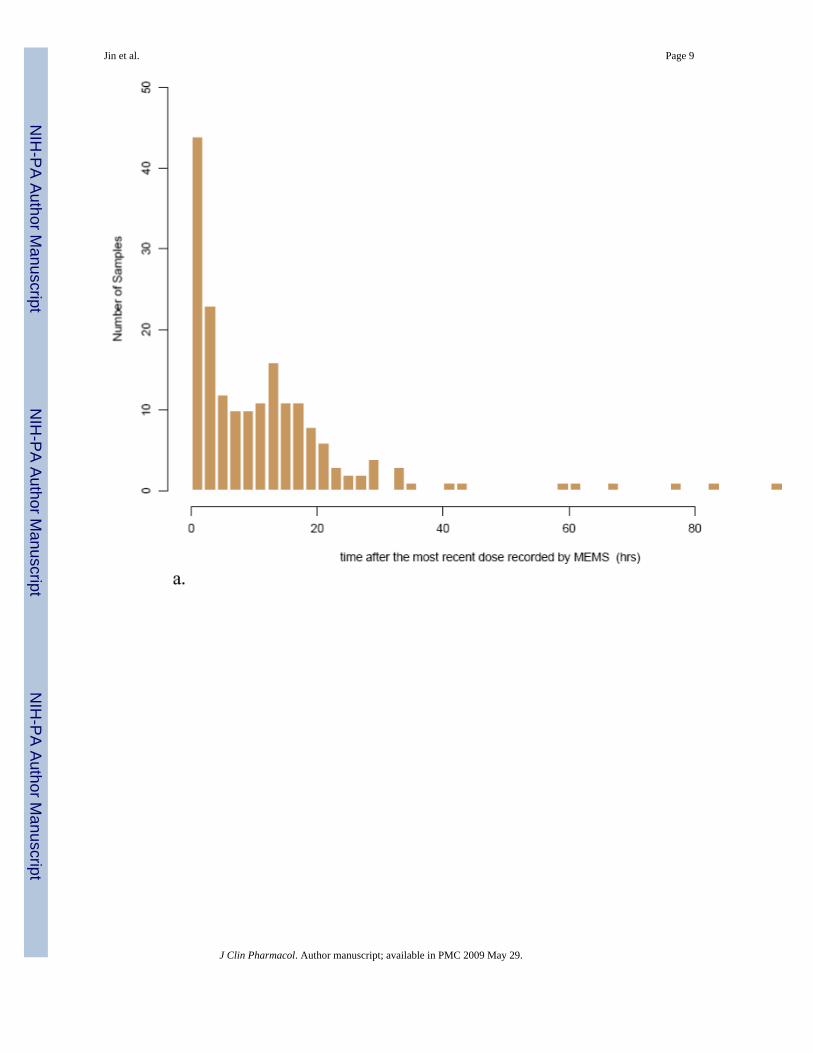
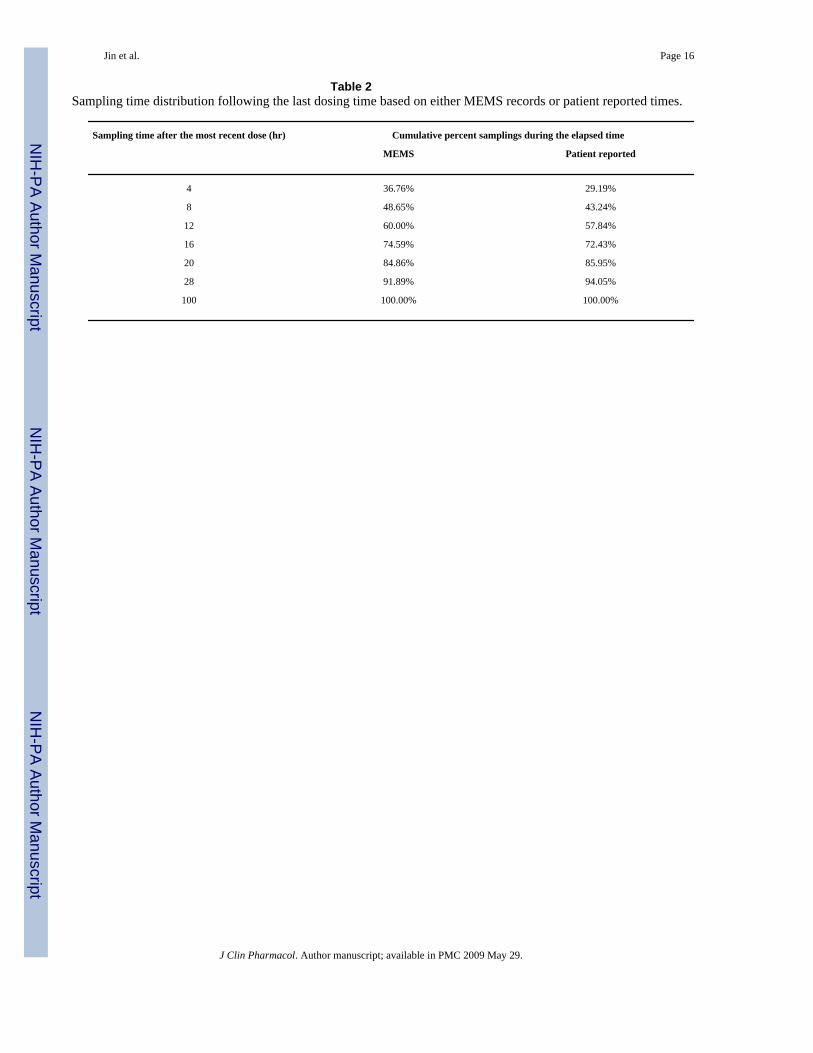
Population pharmacokinetics analysisThe proportion of blood samples collected during selected time intervals based on MEMS orpatient reported last dosing times are shown in Table 2. Within the first four hours after themost recent dose, a total of 36.76% (68 observations) and 29.19% (54 observations) of theblood samples were collected based on the MEMS and patients reported dosing times,respectively. A frequency histogram further illustrates this sampling distribution forescitalopram concentration measurements after the most recent dose for MEMS (Figure 2a)and patient self reported dosage times (Figure 2b), respectively.
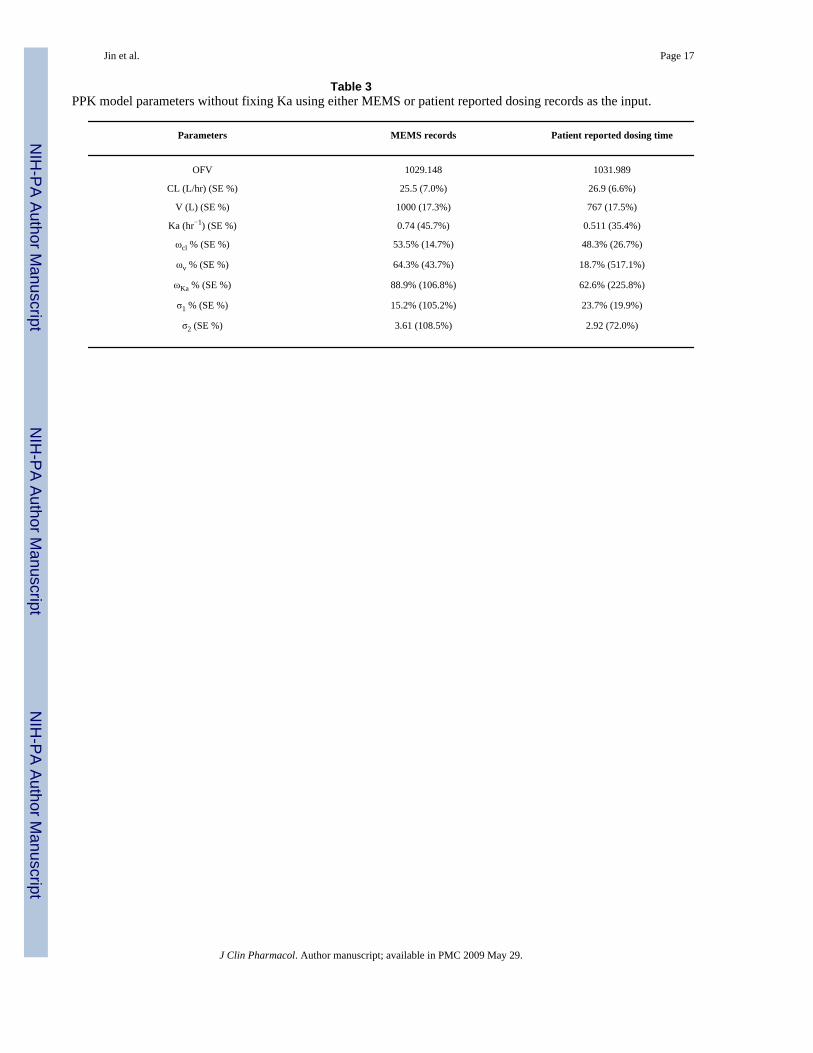
Although PPK with sparse sampling are typically modeled with a fixed Ka value, initialmodeling attempts focused on estimating Ka in addition to the other PK parameters. Numericalconvergence was achieved when modeling concentration data based on either patient reportedlast dosing time as the model input with a steady state condition assumption or MEMS dosinghistory as the model input. A one compartment model with first order absorption andelimination accurately described the data. Goodness of fit plots for models developed from theMEMS records (Figure 3) and from patient reported last dosing time (figure 4) demonstratethat the models adequately described the data. The scatter plots of the observed versus predictedpopulation concentrations and observed versus predicted individual concentrations weredistributed symmetrically around the line of unity. The weighted residuals were also distributedsymmetrically around zero with certain variance. Estimates for the full set of population PKparameters along with the standard errors from both models are listed in Table 2. Estimatedoral clearance, volume of distribution, and absorption rate for escitalopram were 25.5L/hr (SE:7.0%), 1000 L (SE: 17.3%), and 0.74 hr−1(SE: 45.7%), respectively, for the model developedfrom MEMS records, and 26.9 L/hr (SE: 6.6%) , 767 L (SE: 17.5%) , and 0.511 hr−1 (SE:35.4%) for the model developed from the patient reported last dose times. Population clearance,volume of distribution and absorption differed by 5%, 23.3%, and 31% using the MEMS dosageinputs versus the patient reported last dosing time and a steady state assumption. Parametersestimated from MEMS methods were similar to the literature reported volume of distribution(∼1100 L) and absorption rate (∼0.8 − 0.9 hr−1) following oral administration 17, 18.
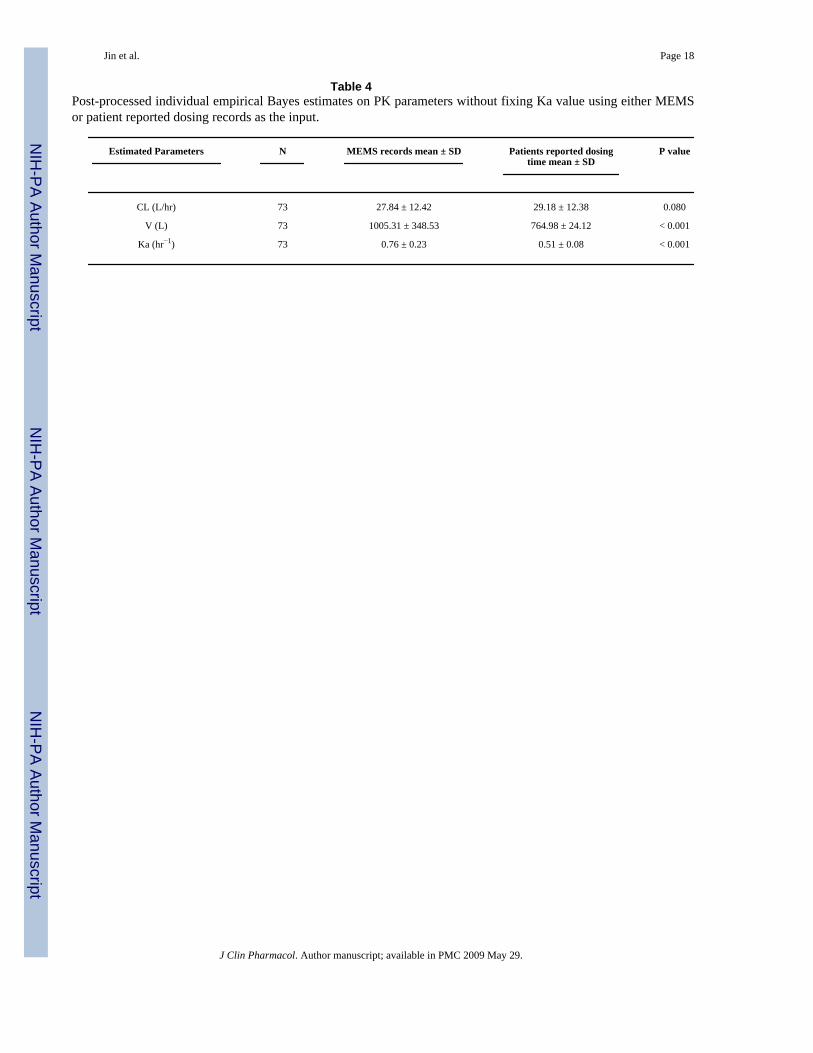
Post-processing results for individual parameter estimates are listed in Table 3. A paired t-testshowed that there was no significant difference in the estimated oral clearance of escitaloprambetween models in these 73 patients for the empirical Bayes estimates of the clearanceparameter. However, different reported dosing methods resulted in significantly differentmodel estimates for the volume of distribution (P<0.001) and absorption rate (P<0.001) forescitalopram at the level of the individual empirical Bayes estimates.
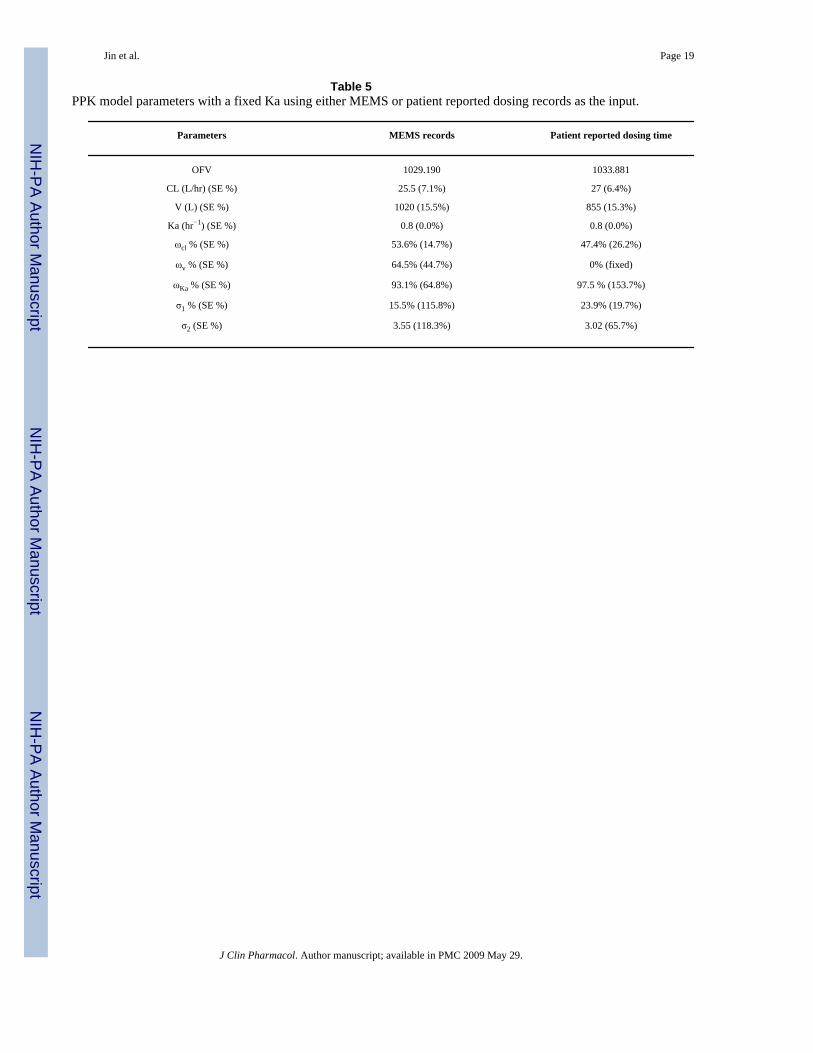
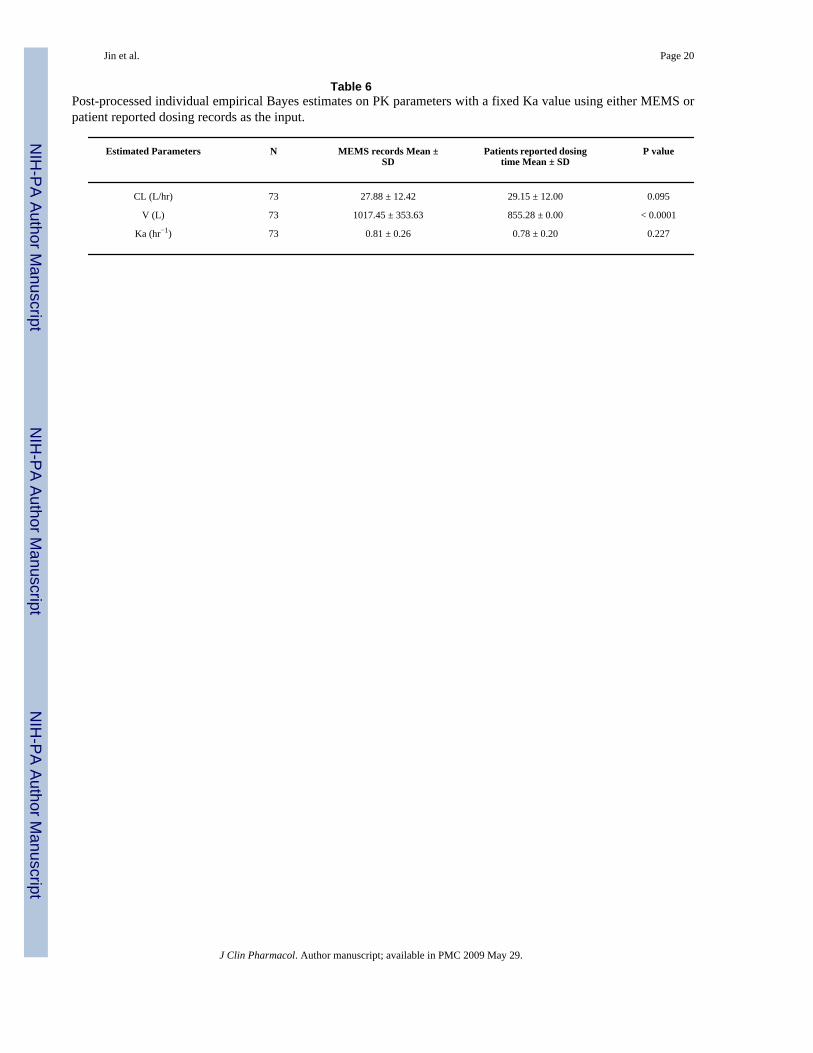
The population PK model was also assessed by fixing Ka to the literature reported value of 0.8hr−1 17, 18. Goodness of fit plots for models developed from the MEMS records and patientreported dose time are presented in Figure 5 and Figure 6, respectively. PPK parametersestimates along with their standard errors are listed in Table 4. Post-processing of individualparameter estimates from NONMEM output is shown in the Table 5. As before, there was nosignificant difference in estimated clearance using different dosing reporting methods duringmodel development. However, estimates on volume of distribution were still sensitive(P<0.001) to the reported dosing methods even with the Ka value fixed to the literature valuein both models.
Jin et al. Page 4
J Clin Pharmacol. Author manuscript; available in PMC 2009 May 29.
NIH
-PA Author Manuscript
NIH
-PA Author Manuscript
NIH
-PA Author Manuscript
DISCUSSIONIn this study, we successfully performed a PPK analysis for orally administered escitalopramusing two different reported dosing methods as the input to the model. The inputs consideredwere either the MEMS generated dosing histories or the patient reported last dosing time. Thisapproach is analogous to that described by Vrijens et al. during a PPK analysis of the druglopinavir 5.
It is well known that accurately estimating the Ka value is a challenge in PPK analysis,especially when data sampling is sparse19, 20. In this study, however, 36.76% (68observations) and 29.19% (54 observations) of the blood samples were collected before themaximal concentration following the most recent MEMS recorded and patient reported dose,respectively. Hence, initial modeling attempts included the estimation of a Ka value in additionto the other PK parameters. Numerical convergence was achieved for both models. There were5%, 23.3%, and 31% differences in the estimated population clearance, volume of distribution,and absorption rate, respectively, between the two models. Also, the estimated oral clearanceof escitalopram was statistically insensitive to model inputs based on either the MEMS (25.5L/hr) or patient reported dosing times (26.9 L/hr). Different reported dosing methods resultedin significantly different estimates for the volume of distribution and absorption rate constantfor escitalopram both at the population level (MEMS vs. patient reported: V/F 1000 L vs. 767L; Ka 0.74 vs. 0.51 hr−1) and at post-processed individual level (MEMS vs. patient reported:V/F 1005.31 L vs. 764.98 L; Ka 0.76 vs. 0.51 hr−1). Furthermore, estimates from the MEMSmodel were closer to the literature reported V/F (∼1100L) and Ka (∼0.8−0.9 hr−1) 17, 18.Knowing the dosing history from the MEMS, Ka was more accurately predicted even whenconcentration data were sparse, and the estimated Ka population value from MEMS model wasalmost equivalent to that reported in the literature 17, 18. Hence, it is likely that inaccuratepatient reported dosing times in addition to sparse sampling are the primary difficulties forobtaining accurate Ka values from study data. A study conducted by Vrijens et al. 5 attemptedto model liponavir concentration data using these two reported dosing report methods. Theseresults showed that model convergence was not achieved using patient reported last dosingtime assuming steady state conditions for the model input. In contrast, numerical convergencewas achieved when the MEMS dosing history was used as the model input. In our study,numerical convergence was achieved for both reported dosing history and model structures,and clearance could be reasonably estimated in all cases This was likely due to the longer halflife of the escitalopram (27 ∼ 32 hours) compared to shorter half life of lopinavir (5 ∼ 6 hours).21 As a few hour deviation in recorded dosing time may have a relatively small effect onclearance estimation for a drug with a longer half-life. PPK parameters were correctly predictedpreviously for a longer half-life drug, citalopram (t1/2: 30hr), using patient reported last dosingtime with a steady state assumption modeling approach 20. In contrast, both a higher bias andimprecision in predicted clearance were reported when utilizing a similar analysis for theshorter half-life drug, risperidone (t1/2: 6−7 hrs) 19. In this study, the absolute time interval inthe reported last dosing time between the two patient dosing histories was 4.48 hrs, which onlyaccounted for 13∼16% of half-life of the escitalopram.
The investigators anticipated that the findings would be consistent with Vrijens et al5 withrespect to convergence problems and biased PK parameter estimates. It was surprising that theresults contradicted their findings with adequate convergence of the model and little bias inthe clearance estimation at both the individual and population level for escitalopram given thepatient reported time of last dose. This may be accounted for in differences in study design,patient population or the long half-life of escitalopram. In particular, it may be that the patients,knowing they were being monitored, provided more accurate times of last dose informationthan otherwise would have been collected. 22
Jin et al. Page 5
J Clin Pharmacol. Author manuscript; available in PMC 2009 May 29.
NIH
-PA Author Manuscript
NIH
-PA Author Manuscript
NIH
-PA Author Manuscript

In this study, the use of MEMS dosage histories versus the patient reported time of last dose,helped with the determination of absorption (Ka) and distribution (Vd), but clearancedetermination was virtually unaffected. Despite this, patterns of drug exposure may be criticalin evaluating response, non-response, and toxicity. These patterns cannot be generated orrecreated using the time of last dose information. Exposures calculated in this manner may notonly have incorrect PK parameter values but only provide an average exposure over a periodof time. This pattern of exposure and response issue is not addressed in this study._ Thenecessity of MEMS monitoring may be determined by the drug half-life and the nature of theconcentration effect relationship and the sensitivity of this relationship to patterns of exposurethat are not captured in the PPK analysis using reported time of last dose.
REFERENCES1. Sheiner LB, Rosenberg B, Marathe VV. Estimation of population characteristics of pharmacokinetic
parameters from routine clinical data. J Pharmacokinet Biopharm 1977;5:445–479. [PubMed: 925881]2. Vrijens B, Goetghebeur E. Electronic monitoring of variation in drug intakes can reduce bias and
improve precision in pharmacokinetic/pharmacodynamic population studies. Stat Med 2004;23:531–544. [PubMed: 14755387]
3. Vrijens B, Goetghebeur E. The impact of compliance in pharmacokinetic studies. Stat Methods MedRes 1999;8:247–262. [PubMed: 10636337]
4. Vrijens B, Gross R, Urquhart J. The odds that clinically unrecognized poor or partial adherence confusespopulation pharmacokinetic/pharmacodynamic analyses. Basic Clin Pharmacol Toxicol 2005;96:225–227. [PubMed: 15733218]
5. Vrijens B, Tousset E, Rode R, et al. Successful projection of the time course of drug concentration inplasma during a 1-year period from electronically compiled dosing-time data used as input toindividually parameterized pharmacokinetic models. J Clin Pharmacol 2005;45:461–467. [PubMed:15778427]
6. Osterberg L, Blaschke T. Adherence to medication. N Engl J Med 2005;353:487–497. [PubMed:16079372]
7. Liu H, Golin CE, Miller LG, et al. A comparison study of multiple measures of adherence to HIVprotease inhibitors. Ann Intern Med 2001;134:968–977. [PubMed: 11352698]
8. Waugh J, Goa KL. Escitalopram : a review of its use in the management of major depressive andanxiety disorders. CNS Drugs 2003;17:343–362. [PubMed: 12665392]
9. Crone CC, Gabriel GM. Treatment of anxiety and depression in transplant patients: pharmacokineticconsiderations. Clin Pharmacokinet 2004;43:361–394. [PubMed: 15086275]
10. Owens MJ, Knight DL, Nemeroff CB. Second-generation SSRIs: human monoamine transporterbinding profile of escitalopram and R-fluoxetine. Biol Psychiatry 2001;50:345–350. [PubMed:11543737]
11. Wade A, Michael Lemming O, Bang Hedegaard K. Escitalopram 10 mg/day is effective and welltolerated in a placebo-controlled study in depression in primary care. Int Clin Psychopharmacol2002;17:95–102. [PubMed: 11981349]
12. Gorman JM, Korotzer A, Su G. Efficacy comparison of escitalopram and citalopram in the treatmentof major depressive disorder: pooled analysis of placebo-controlled trials. CNS Spectr 2002;7:40–44. [PubMed: 15131492]
13. Rapaport MH, Bose A, Zheng H. Escitalopram continuation treatment prevents relapse of depressiveepisodes. J Clin Psychiatry 2004;65:44–49. [PubMed: 14744167]
14. Burke WJ, Gergel I, Bose A. Fixed-dose trial of the single isomer SSRI escitalopram in depressedoutpatients. J Clin Psychiatry 2002;63:331–336. [PubMed: 12000207]
15. Davidson JR, Bose A, Korotzer A, Zheng H. Escitalopram in the treatment of generalized anxietydisorder: double-blind, placebo controlled, flexible-dose study. Depress Anxiety 2004;19:234–240.[PubMed: 15274172]
16. Stahl SM, Gergel I, Li D. Escitalopram in the treatment of panic disorder: a randomized, double-blind, placebo-controlled trial. J Clin Psychiatry 2003;64:1322–1327. [PubMed: 14658946]
Jin et al. Page 6
J Clin Pharmacol. Author manuscript; available in PMC 2009 May 29.
NIH
-PA Author Manuscript
NIH
-PA Author Manuscript
NIH
-PA Author Manuscript
17. Rao N. The clinical pharmacokinetics of escitalopram. Clin Pharmacokinet 2007;46:281–290.[PubMed: 17375980]
18. Sogaard B, Mengel H, Rao N, Larsen F. The pharmacokinetics of escitalopram after oral andintravenous administration of single and multiple doses to healthy subjects. J Clin Pharmacol2005;45:1400–1406. [PubMed: 16291715]
19. Bies RR, Mulsant BH, Rosen J, et al. Population pharmacokinetics as a method to detect variablerisperidone exposure in patients suffering from dementia with behavioral disturbances. Am J GeriatrPharmacother 2005;3:87–91. [PubMed: 16129385]
20. Bies RR, Feng Y, Lotrich FE, et al. Utility of sparse concentration sampling for citalopram in elderlyclinical trial subjects. J Clin Pharmacol 2004;44:1352–1359. [PubMed: 15545305]
21. Saez-Llorens X, Violari A, Deetz CO, et al. Forty-eight-week evaluation of lopinavir/ritonavir, a newprotease inhibitor, in human immunodeficiency virus-infected children. Pediatr Infect Dis J2003;22:216–224. [PubMed: 12634581]
22. Urquhart J. Role of patient compliance in clinical pharmacokinetics. A review of recent research.Clin Pharmacokinet 1994;27:202–215. [PubMed: 7988102]
Jin et al. Page 7
J Clin Pharmacol. Author manuscript; available in PMC 2009 May 29.
NIH
-PA Author Manuscript
NIH
-PA Author Manuscript
NIH
-PA Author Manuscript
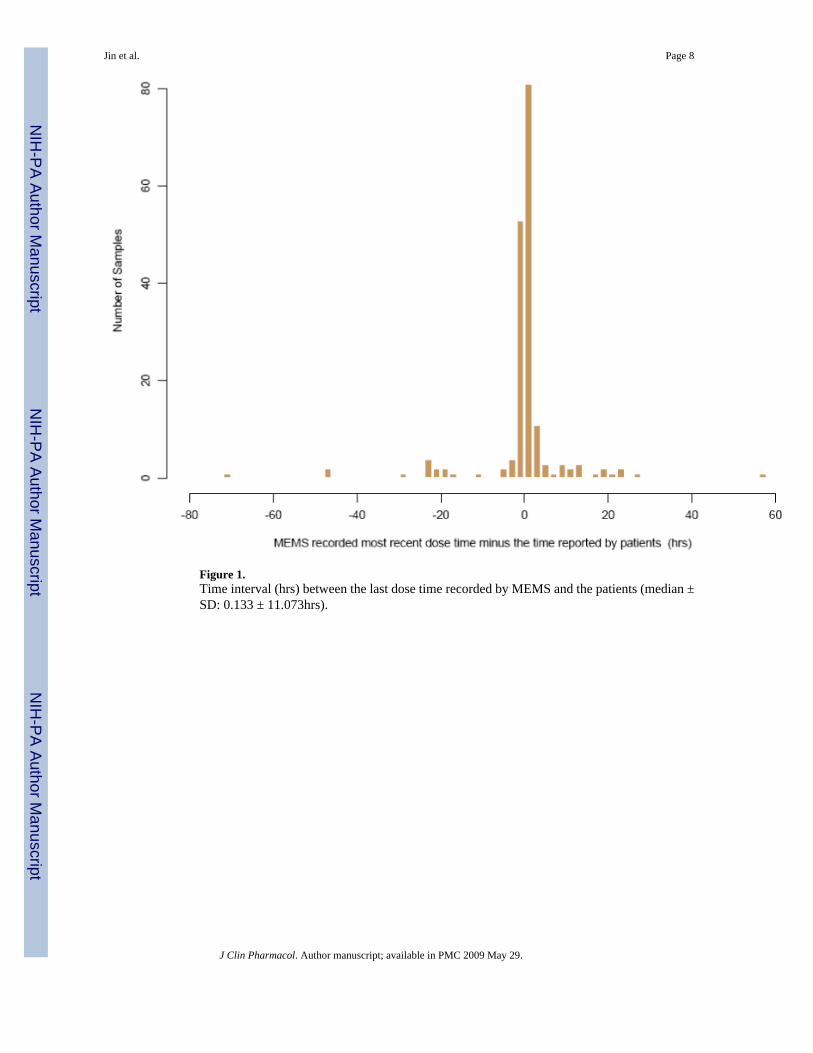
Figure 1.Time interval (hrs) between the last dose time recorded by MEMS and the patients (median ±SD: 0.133 ± 11.073hrs).
Jin et al. Page 8
J Clin Pharmacol. Author manuscript; available in PMC 2009 May 29.
NIH
-PA Author Manuscript
NIH
-PA Author Manuscript
NIH
-PA Author Manuscript
Jin et al. Page 9
J Clin Pharmacol. Author manuscript; available in PMC 2009 May 29.
NIH
-PA Author Manuscript
NIH
-PA Author Manuscript
NIH
-PA Author Manuscript

Figure 2.Frequency histogram showing the sampling distribution for escitalopram samplingmeasurements based on a) MEMS records and b) patient reported dosing times. The x-axis isbroken into 4-hour bins, and the y-axis is the number of blood samplings during that time range.
Jin et al. Page 10
J Clin Pharmacol. Author manuscript; available in PMC 2009 May 29.
NIH
-PA Author Manuscript
NIH
-PA Author Manuscript
NIH
-PA Author Manuscript
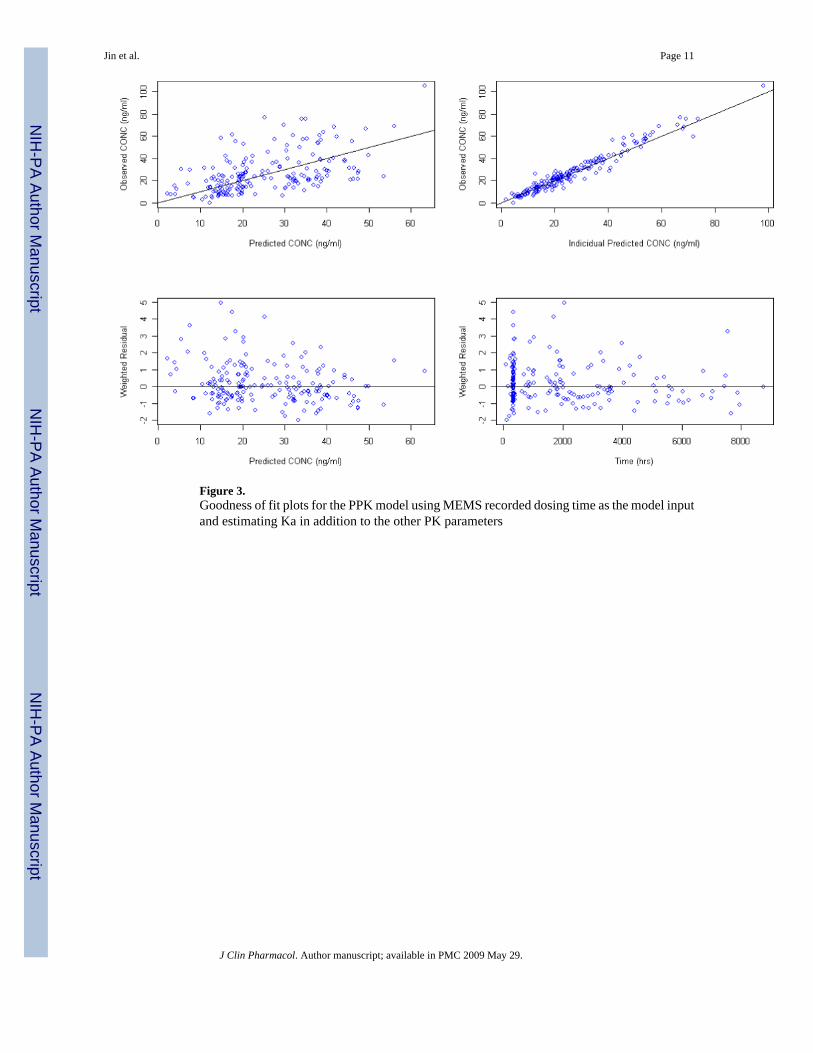
Figure 3.Goodness of fit plots for the PPK model using MEMS recorded dosing time as the model inputand estimating Ka in addition to the other PK parameters
Jin et al. Page 11
J Clin Pharmacol. Author manuscript; available in PMC 2009 May 29.
NIH
-PA Author Manuscript
NIH
-PA Author Manuscript
NIH
-PA Author Manuscript
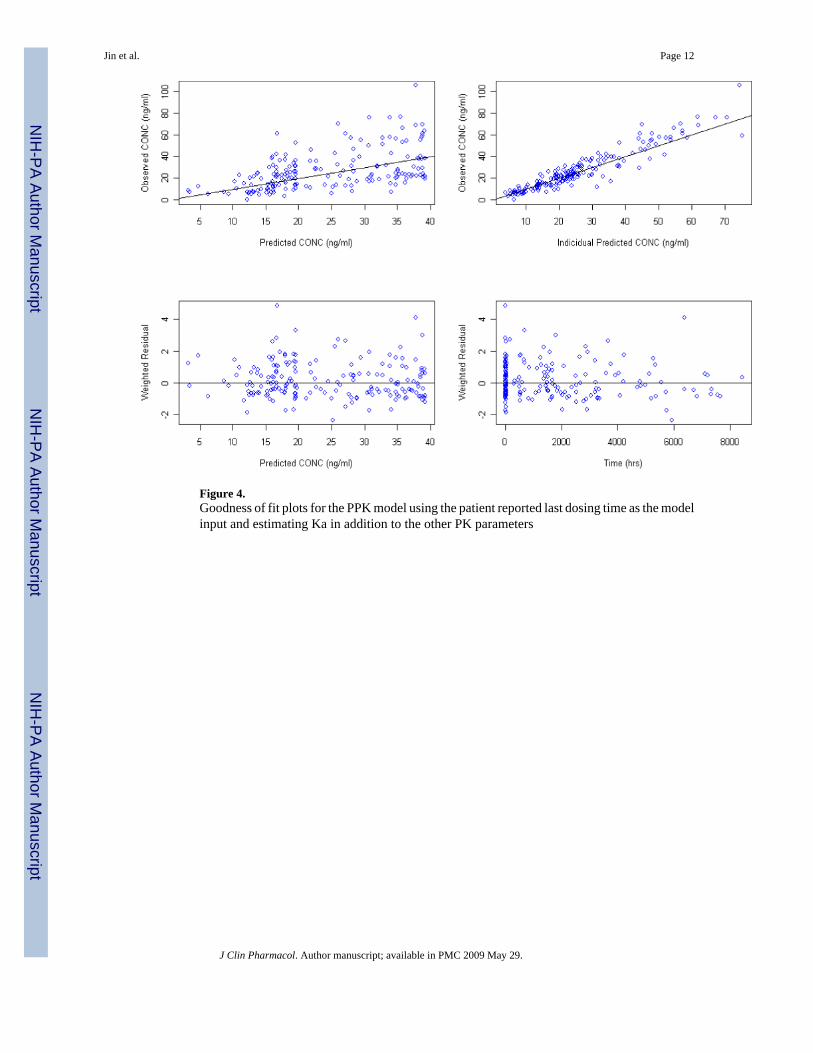
Figure 4.Goodness of fit plots for the PPK model using the patient reported last dosing time as the modelinput and estimating Ka in addition to the other PK parameters
Jin et al. Page 12
J Clin Pharmacol. Author manuscript; available in PMC 2009 May 29.
NIH
-PA Author Manuscript
NIH
-PA Author Manuscript
NIH
-PA Author Manuscript

Figure 5.Goodness of fit plots for the PPK model using MEMS recorded dosing time as the model inputand Ka fixed to 0.8 hr−1
Jin et al. Page 13
J Clin Pharmacol. Author manuscript; available in PMC 2009 May 29.
NIH
-PA Author Manuscript
NIH
-PA Author Manuscript
NIH
-PA Author Manuscript
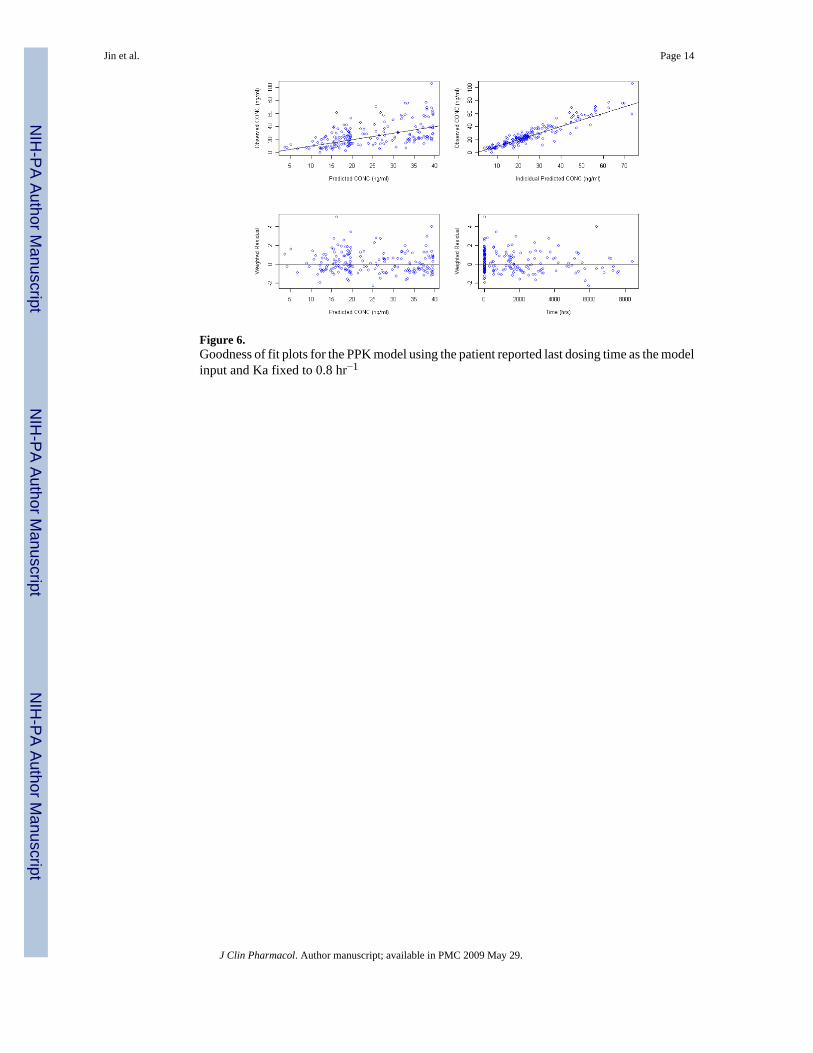
Figure 6.Goodness of fit plots for the PPK model using the patient reported last dosing time as the modelinput and Ka fixed to 0.8 hr−1
Jin et al. Page 14
J Clin Pharmacol. Author manuscript; available in PMC 2009 May 29.
NIH
-PA Author Manuscript
NIH
-PA Author Manuscript
NIH
-PA Author Manuscript

NIH
-PA Author Manuscript
NIH
-PA Author Manuscript
NIH
-PA Author Manuscript
Jin et al. Page 15
Table 1Patient democratic information
Demographics Mean ± SD
Number of Subjects 73
Number of Observations 185
Age (years) 39.47 ± 11.35
Weight (lb) 81.83 ± 43.81
Sex Male: 32
Female: 41
Caucasian: 67
African american: 2
Asian: 1
Race American Indian & African
American: 1
American Indian & Caucasian: 1
Unknown :1
J Clin Pharmacol. Author manuscript; available in PMC 2009 May 29.
NIH
-PA Author Manuscript
NIH
-PA Author Manuscript
NIH
-PA Author Manuscript
Jin et al. Page 16
Table 2Sampling time distribution following the last dosing time based on either MEMS records or patient reported times.
Sampling time after the most recent dose (hr) Cumulative percent samplings during the elapsed time
MEMS Patient reported
4 36.76% 29.19%
8 48.65% 43.24%
12 60.00% 57.84%
16 74.59% 72.43%
20 84.86% 85.95%
28 91.89% 94.05%
100 100.00% 100.00%
J Clin Pharmacol. Author manuscript; available in PMC 2009 May 29.
NIH
-PA Author Manuscript
NIH
-PA Author Manuscript
NIH
-PA Author Manuscript
Jin et al. Page 17
Table 3PPK model parameters without fixing Ka using either MEMS or patient reported dosing records as the input.
Parameters MEMS records Patient reported dosing time
OFV 1029.148 1031.989
CL (L/hr) (SE %) 25.5 (7.0%) 26.9 (6.6%)
V (L) (SE %) 1000 (17.3%) 767 (17.5%)
Ka (hr−1) (SE %) 0.74 (45.7%) 0.511 (35.4%)
ωcl % (SE %) 53.5% (14.7%) 48.3% (26.7%)
ωv % (SE %) 64.3% (43.7%) 18.7% (517.1%)
ωKa % (SE %) 88.9% (106.8%) 62.6% (225.8%)
σ1 % (SE %) 15.2% (105.2%) 23.7% (19.9%)
σ2 (SE %) 3.61 (108.5%) 2.92 (72.0%)
J Clin Pharmacol. Author manuscript; available in PMC 2009 May 29.
NIH
-PA Author Manuscript
NIH
-PA Author Manuscript
NIH
-PA Author Manuscript
Jin et al. Page 18
Table 4Post-processed individual empirical Bayes estimates on PK parameters without fixing Ka value using either MEMSor patient reported dosing records as the input.
Estimated Parameters N MEMS records mean ± SD Patients reported dosingtime mean ± SD
P value
CL (L/hr) 73 27.84 ± 12.42 29.18 ± 12.38 0.080
V (L) 73 1005.31 ± 348.53 764.98 ± 24.12 < 0.001
Ka (hr−1) 73 0.76 ± 0.23 0.51 ± 0.08 < 0.001
J Clin Pharmacol. Author manuscript; available in PMC 2009 May 29.
NIH
-PA Author Manuscript
NIH
-PA Author Manuscript
NIH
-PA Author Manuscript
Jin et al. Page 19
Table 5PPK model parameters with a fixed Ka using either MEMS or patient reported dosing records as the input.
Parameters MEMS records Patient reported dosing time
OFV 1029.190 1033.881
CL (L/hr) (SE %) 25.5 (7.1%) 27 (6.4%)
V (L) (SE %) 1020 (15.5%) 855 (15.3%)
Ka (hr−1) (SE %) 0.8 (0.0%) 0.8 (0.0%)
ωcl % (SE %) 53.6% (14.7%) 47.4% (26.2%)
ωv % (SE %) 64.5% (44.7%) 0% (fixed)
ωKa % (SE %) 93.1% (64.8%) 97.5 % (153.7%)
σ1 % (SE %) 15.5% (115.8%) 23.9% (19.7%)
σ2 (SE %) 3.55 (118.3%) 3.02 (65.7%)
J Clin Pharmacol. Author manuscript; available in PMC 2009 May 29.
NIH
-PA Author Manuscript
NIH
-PA Author Manuscript
NIH
-PA Author Manuscript
Jin et al. Page 20
Table 6Post-processed individual empirical Bayes estimates on PK parameters with a fixed Ka value using either MEMS orpatient reported dosing records as the input.
Estimated Parameters N MEMS records Mean ±SD
Patients reported dosingtime Mean ± SD
P value
CL (L/hr) 73 27.88 ± 12.42 29.15 ± 12.00 0.095
V (L) 73 1017.45 ± 353.63 855.28 ± 0.00 < 0.0001
Ka (hr−1) 73 0.81 ± 0.26 0.78 ± 0.20 0.227
J Clin Pharmacol. Author manuscript; available in PMC 2009 May 29.
Related Documents