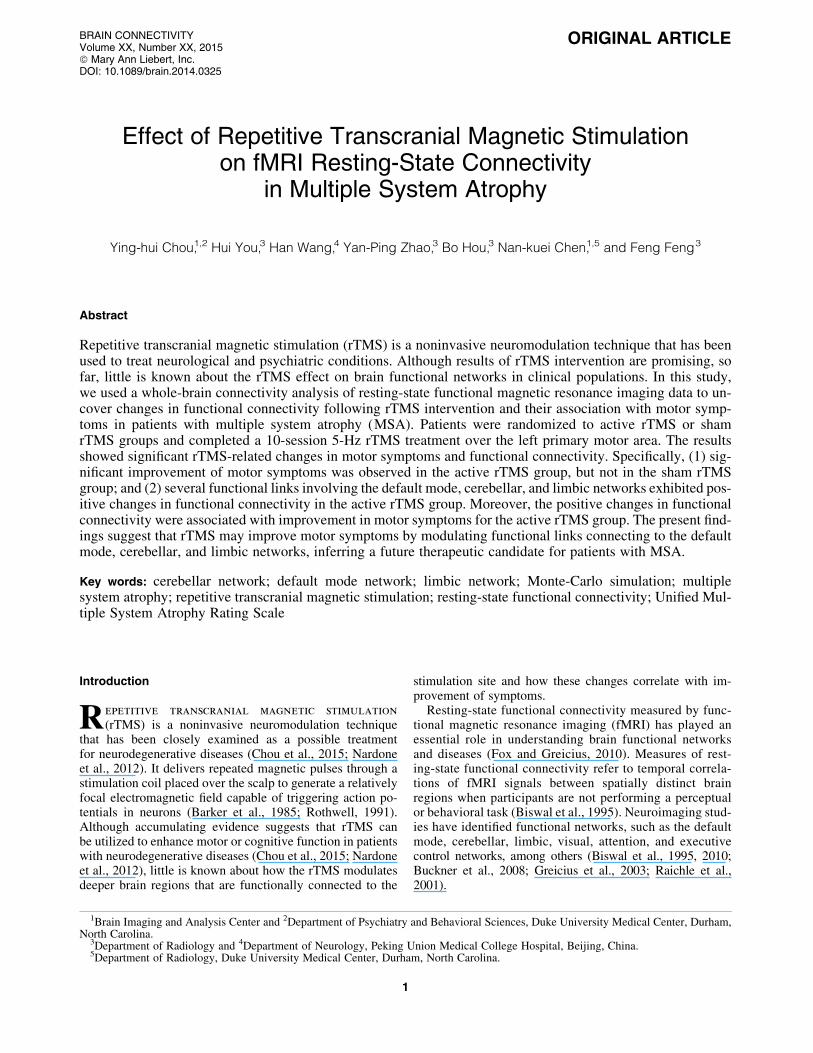
ORIGINAL ARTICLE Effect of Repetitive Transcranial Magnetic Stimulation on fMRI Resting-State Connectivity in Multiple System Atrophy Ying-hui Chou, 1,2 Hui You, 3 Han Wang, 4 Yan-Ping Zhao, 3 Bo Hou, 3 Nan-kuei Chen, 1,5 and Feng Feng 3 Abstract Repetitive transcranial magnetic stimulation (rTMS) is a noninvasive neuromodulation technique that has been used to treat neurological and psychiatric conditions. Although results of rTMS intervention are promising, so far, little is known about the rTMS effect on brain functional networks in clinical populations. In this study, we used a whole-brain connectivity analysis of resting-state functional magnetic resonance imaging data to un- cover changes in functional connectivity following rTMS intervention and their association with motor symp- toms in patients with multiple system atrophy (MSA). Patients were randomized to active rTMS or sham rTMS groups and completed a 10-session 5-Hz rTMS treatment over the left primary motor area. The results showed significant rTMS-related changes in motor symptoms and functional connectivity. Specifically, (1) sig- nificant improvement of motor symptoms was observed in the active rTMS group, but not in the sham rTMS group; and (2) several functional links involving the default mode, cerebellar, and limbic networks exhibited pos- itive changes in functional connectivity in the active rTMS group. Moreover, the positive changes in functional connectivity were associated with improvement in motor symptoms for the active rTMS group. The present find- ings suggest that rTMS may improve motor symptoms by modulating functional links connecting to the default mode, cerebellar, and limbic networks, inferring a future therapeutic candidate for patients with MSA. Key words: cerebellar network; default mode network; limbic network; Monte-Carlo simulation; multiple system atrophy; repetitive transcranial magnetic stimulation; resting-state functional connectivity; Unified Mul- tiple System Atrophy Rating Scale Introduction R epetitive transcranial magnetic stimulation (rTMS) is a noninvasive neuromodulation technique that has been closely examined as a possible treatment for neurodegenerative diseases (Chou et al., 2015; Nardone et al., 2012). It delivers repeated magnetic pulses through a stimulation coil placed over the scalp to generate a relatively focal electromagnetic field capable of triggering action po- tentials in neurons (Barker et al., 1985; Rothwell, 1991). Although accumulating evidence suggests that rTMS can be utilized to enhance motor or cognitive function in patients with neurodegenerative diseases (Chou et al., 2015; Nardone et al., 2012), little is known about how the rTMS modulates deeper brain regions that are functionally connected to the stimulation site and how these changes correlate with im- provement of symptoms. Resting-state functional connectivity measured by func- tional magnetic resonance imaging (fMRI) has played an essential role in understanding brain functional networks and diseases (Fox and Greicius, 2010). Measures of rest- ing-state functional connectivity refer to temporal correla- tions of fMRI signals between spatially distinct brain regions when participants are not performing a perceptual or behavioral task (Biswal et al., 1995). Neuroimaging stud- ies have identified functional networks, such as the default mode, cerebellar, limbic, visual, attention, and executive control networks, among others (Biswal et al., 1995, 2010; Buckner et al., 2008; Greicius et al., 2003; Raichle et al., 2001). 1 Brain Imaging and Analysis Center and 2 Department of Psychiatry and Behavioral Sciences, Duke University Medical Center, Durham, North Carolina. 3 Department of Radiology and 4 Department of Neurology, Peking Union Medical College Hospital, Beijing, China. 5 Department of Radiology, Duke University Medical Center, Durham, North Carolina. BRAIN CONNECTIVITY Volume XX, Number XX, 2015 ª Mary Ann Liebert, Inc. DOI: 10.1089/brain.2014.0325 1

Welcome message from author
This document is posted to help you gain knowledge. Please leave a comment to let me know what you think about it! Share it to your friends and learn new things together.
Transcript
ORIGINAL ARTICLE
Effect of Repetitive Transcranial Magnetic Stimulationon fMRI Resting-State Connectivity
in Multiple System Atrophy
Ying-hui Chou,1,2 Hui You,3 Han Wang,4 Yan-Ping Zhao,3 Bo Hou,3 Nan-kuei Chen,1,5 and Feng Feng3
Abstract
Repetitive transcranial magnetic stimulation (rTMS) is a noninvasive neuromodulation technique that has beenused to treat neurological and psychiatric conditions. Although results of rTMS intervention are promising, sofar, little is known about the rTMS effect on brain functional networks in clinical populations. In this study,we used a whole-brain connectivity analysis of resting-state functional magnetic resonance imaging data to un-cover changes in functional connectivity following rTMS intervention and their association with motor symp-toms in patients with multiple system atrophy (MSA). Patients were randomized to active rTMS or shamrTMS groups and completed a 10-session 5-Hz rTMS treatment over the left primary motor area. The resultsshowed significant rTMS-related changes in motor symptoms and functional connectivity. Specifically, (1) sig-nificant improvement of motor symptoms was observed in the active rTMS group, but not in the sham rTMSgroup; and (2) several functional links involving the default mode, cerebellar, and limbic networks exhibited pos-itive changes in functional connectivity in the active rTMS group. Moreover, the positive changes in functionalconnectivity were associated with improvement in motor symptoms for the active rTMS group. The present find-ings suggest that rTMS may improve motor symptoms by modulating functional links connecting to the defaultmode, cerebellar, and limbic networks, inferring a future therapeutic candidate for patients with MSA.
Key words: cerebellar network; default mode network; limbic network; Monte-Carlo simulation; multiplesystem atrophy; repetitive transcranial magnetic stimulation; resting-state functional connectivity; Unified Mul-tiple System Atrophy Rating Scale
Introduction
Repetitive transcranial magnetic stimulation(rTMS) is a noninvasive neuromodulation technique
that has been closely examined as a possible treatmentfor neurodegenerative diseases (Chou et al., 2015; Nardoneet al., 2012). It delivers repeated magnetic pulses through astimulation coil placed over the scalp to generate a relativelyfocal electromagnetic field capable of triggering action po-tentials in neurons (Barker et al., 1985; Rothwell, 1991).Although accumulating evidence suggests that rTMS canbe utilized to enhance motor or cognitive function in patientswith neurodegenerative diseases (Chou et al., 2015; Nardoneet al., 2012), little is known about how the rTMS modulatesdeeper brain regions that are functionally connected to the
stimulation site and how these changes correlate with im-provement of symptoms.
Resting-state functional connectivity measured by func-tional magnetic resonance imaging (fMRI) has played anessential role in understanding brain functional networksand diseases (Fox and Greicius, 2010). Measures of rest-ing-state functional connectivity refer to temporal correla-tions of fMRI signals between spatially distinct brainregions when participants are not performing a perceptualor behavioral task (Biswal et al., 1995). Neuroimaging stud-ies have identified functional networks, such as the defaultmode, cerebellar, limbic, visual, attention, and executivecontrol networks, among others (Biswal et al., 1995, 2010;Buckner et al., 2008; Greicius et al., 2003; Raichle et al.,2001).
1Brain Imaging and Analysis Center and 2Department of Psychiatry and Behavioral Sciences, Duke University Medical Center, Durham,North Carolina.
3Department of Radiology and 4Department of Neurology, Peking Union Medical College Hospital, Beijing, China.5Department of Radiology, Duke University Medical Center, Durham, North Carolina.
BRAIN CONNECTIVITYVolume XX, Number XX, 2015ª Mary Ann Liebert, Inc.DOI: 10.1089/brain.2014.0325
1
In this study, we investigated the relationship betweenrTMS intervention, resting-state functional connectivity,and motor symptoms in patients with multiple system atro-phy (MSA). MSA is an adult-onset, sporadic, progressiveneurodegenerative disease characterized by a combinationof symptoms that affect both the autonomic nervous systemand movement (Gilman et al., 2008; Wenning et al., 2013).The defining neuropathology of MSA consists of degenera-tive lesions of the central autonomic, striatonigral, and olivo-pontocerebellar structures with glial cytoplasmic inclusionscomprising filamentous a-synuclein proteins (Ozawa et al.,2006; Papp et al., 1989; Spillantini et al., 1998). Some ofthe motor symptoms, such as bradykinesia, rigidity, gait in-stability, and tremor, are similar to those of Parkinson’s dis-ease (PD) (Wenning et al., 1997). However, patients withMSA usually respond poorly to dopamine replacement ther-apy (Gilman et al., 2008). Given the limited efficacy of phar-macological treatment in improving motor symptoms ofMSA (Gilman et al., 2008), there is a clinical need to deter-mine whether and how rTMS could benefit this population.
The first aim of the study was to examine the effect ofhigh-frequency rTMS over the primary motor cortex (M1)on motor symptoms in MSA patients, inspired by previousfindings that the high-frequency rTMS to the M1 of PD pa-tients could alleviate their motor symptoms (see Chouet al., 2015, for a review). The second aim was to use awhole-brain functional connectivity analysis to (1) identifyneuronal networks that were modulated by the rTMS inter-vention and (2) assess whether the rTMS-induced functionalconnectivity modulation was associated with changes inmotor symptoms.
Materials and Methods
Patients
Twenty-one right-handed MSA patients with predomi-nantly parkinsonian features (i.e., bradykinesia, rigidity,and gait instability) were prospectively enrolled in thisstudy. All patients fulfilled the diagnosis of probable MSAwith predominant parkinsonism according to the establishedconsensus criteria (Gilman et al., 2008). All of our patientsdid not respond well to the levodopa treatment. Exclusioncriteria included significant medical or psychiatric illness,history of epilepsy or seizure, pregnancy, and mental dis-eases. Two patients were excluded due to uncertainty ofthe MSA diagnosis during follow-up. Characteristics of thestudy population are summarized in Table 1.
Research design
This was a randomized, double-blind sham rTMS-controlled study. All patients were randomly assigned intoeither an active rTMS group or a sham rTMS group accord-ing to a computer-generated randomization list. The rTMSprocedure was performed by an experienced technicianwho did not participate in the evaluations. Both patientsand clinical investigators were blind to the rTMS group as-signment. Each patient completed a protocol comprisingpre-rTMS evaluation (including motor examination of theUnified Multiple System Atrophy Rating Scale [UMSARS-II] and resting-state fMRI), rTMS intervention (sessions1–5, one session per day), mid-rTMS evaluation (UMSARS-II
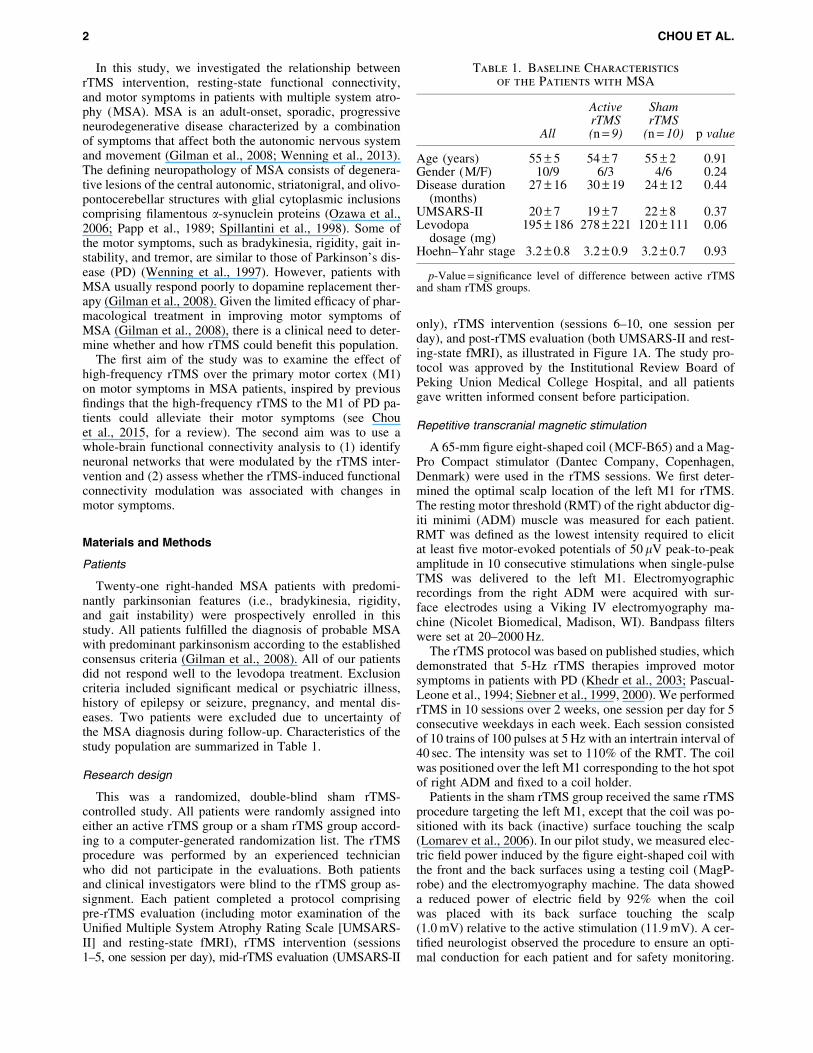
only), rTMS intervention (sessions 6–10, one session perday), and post-rTMS evaluation (both UMSARS-II and rest-ing-state fMRI), as illustrated in Figure 1A. The study pro-tocol was approved by the Institutional Review Board ofPeking Union Medical College Hospital, and all patientsgave written informed consent before participation.
Repetitive transcranial magnetic stimulation
A 65-mm figure eight-shaped coil (MCF-B65) and a Mag-Pro Compact stimulator (Dantec Company, Copenhagen,Denmark) were used in the rTMS sessions. We first deter-mined the optimal scalp location of the left M1 for rTMS.The resting motor threshold (RMT) of the right abductor dig-iti minimi (ADM) muscle was measured for each patient.RMT was defined as the lowest intensity required to elicitat least five motor-evoked potentials of 50 lV peak-to-peakamplitude in 10 consecutive stimulations when single-pulseTMS was delivered to the left M1. Electromyographicrecordings from the right ADM were acquired with sur-face electrodes using a Viking IV electromyography ma-chine (Nicolet Biomedical, Madison, WI). Bandpass filterswere set at 20–2000 Hz.
The rTMS protocol was based on published studies, whichdemonstrated that 5-Hz rTMS therapies improved motorsymptoms in patients with PD (Khedr et al., 2003; Pascual-Leone et al., 1994; Siebner et al., 1999, 2000). We performedrTMS in 10 sessions over 2 weeks, one session per day for 5consecutive weekdays in each week. Each session consistedof 10 trains of 100 pulses at 5 Hz with an intertrain interval of40 sec. The intensity was set to 110% of the RMT. The coilwas positioned over the left M1 corresponding to the hot spotof right ADM and fixed to a coil holder.
Patients in the sham rTMS group received the same rTMSprocedure targeting the left M1, except that the coil was po-sitioned with its back (inactive) surface touching the scalp(Lomarev et al., 2006). In our pilot study, we measured elec-tric field power induced by the figure eight-shaped coil withthe front and the back surfaces using a testing coil (MagP-robe) and the electromyography machine. The data showeda reduced power of electric field by 92% when the coilwas placed with its back surface touching the scalp(1.0 mV) relative to the active stimulation (11.9 mV). A cer-tified neurologist observed the procedure to ensure an opti-mal conduction for each patient and for safety monitoring.
Table 1. Baseline Characteristicsof the Patients with MSA
All
ActiverTMS(n = 9)
ShamrTMS
(n = 10) p value
Age (years) 55 – 5 54 – 7 55 – 2 0.91Gender (M/F) 10/9 6/3 4/6 0.24Disease duration
(months)27 – 16 30 – 19 24 – 12 0.44
UMSARS-II 20 – 7 19 – 7 22 – 8 0.37Levodopa
dosage (mg)195 – 186 278 – 221 120 – 111 0.06
Hoehn–Yahr stage 3.2 – 0.8 3.2 – 0.9 3.2 – 0.7 0.93
p-Value = significance level of difference between active rTMSand sham rTMS groups.
2 CHOU ET AL.
Each patient received the rTMS intervention at the same timeevery morning (11:00 AM). Patients could take their usualantiparkinsonian medications, if any, after the rTMS stimu-lation or evaluations.
Clinical rating scale
The UMSARS-II (i.e., total motor score) was used to as-sess the severity of signs and symptoms of MSA (Wenninget al., 2004). The UMSARS has been validated to assessrates of progression and is sensitive to change over time(Geser et al., 2006). The UMSARS-II contains 14 questionswith higher scores representing more severe signs or symp-toms. The UMSARS-II measures were obtained from pa-tients at baseline and within 1 h following the 5th and the10th sessions of rTMS intervention. The overall score ofeach patient was log transformed to improve the normalityfor statistical analyses.
Imaging protocol
Each patient was scanned on a 3T Signa Excite II VHi MRscanner (GE Healthcare, Milwaukee, Wisconsin). Foam padsand ear plugs were used to reduce head motion and scannoise. The imaging protocol consisted of the axial planegradient-echo echo-planar imaging sequence sensitive tothe blood oxygen level-dependent (BOLD) contrast (repeti-tion time = 2000 msec, echo time = 30 msec, flip angle = 90!,field of view = 24 · 24 cm, in-plane matrix size = 64 · 64,
slice thickness = 5 mm with 1-mm gap, 20 slices with whole-brain coverage, scan time = 8 min, 240 volumes), whole-brain three-dimensional T1-weighted spoiled gradient-recalledsequence, and other routine structural MRI sequences. Thepatients were instructed to remain still, keep their eyesclosed, and not to think of anything particular during fMRIdata acquisition.
fMRI data analysis
The preprocessing of fMRI data was conducted throughthe Duke Brain Imaging and Analysis Center preprocessingpipelines based on the tools from the Oxford Centre forFunctional MRI of the Brain Software Library (FSL version5.0.1, www.fmrib.ox.ac.uk/fsl) and locally developed Mat-lab codes (MathWorks, Natick, MA). The first four volumeswere discarded to reach the T1 steady state. The data werecorrected for slice-timing differences and motion (six pa-rameters: three translations and three rotations). The datawere then registered to the Montreal Neurological Institute(MNI) 152 template using a 12 degrees of freedom affinetransformation implemented in the FSL Linear Image Reg-istration Tool. All subsequent analyses were conducted in theMNI standard space. We regressed out the six-parameterrigid body head motion (obtained from motion correction),the averaged time course profiles in the white matter, andthe averaged time course profiles in the cerebrospinal fluidregions to reduce non-neuronal contributions to BOLD
FIG. 1. (A) A randomized, double-blind sham rTMS-controlled research design. All patients were randomly assigned intoeither an active rTMS or a sham rTMS group. Each patient completed a 10-session rTMS treatment consisting of pre-rTMSevaluation, rTMS intervention (sessions 1–5), mid-rTMS evaluation, rTMS intervention (sessions 6–10), and post-rTMSevaluation. (B) Changes in the UMSARS-II score between different time points for the active rTMS and sham rTMS groups.The active rTMS group (filled circles) exhibited a significant improvement in motor symptoms (i.e., decreased UMSARS-IIscore or negative values) between the post-rTMS and pre-rTMS and between the post-rTMS and mid-rTMS evaluations. Thetime effects were not significant for the sham rTMS group (open circles). n/Ngroup[and n/NgroupYdenotes the number of par-ticipants (out of the total number of participants within a group) that exhibited increased and decreased UMSARS-II scores,respectively, between different time points.
RTMS, CONNECTIVITY, AND MULTIPLE SYSTEM ATROPHY 3
correlations (Van Dijk et al., 2010). We also removed con-stant offsets and linear drift. Time domain signals with theirfrequencies less than 0.08 Hz were retained.
For each participant, the preprocessed low-frequencyfMRI data were parceled into a set of 116 brain regions(90 within the cerebral cortex and 26 within the cerebellum)using an Automated Anatomical Labeling template (AAL,Tzourio-Mazoyer et al., 2002). Each participant’s BOLDtime series was averaged within each brain region. Weused Pearson correlation as the metric of association be-tween the time series for each pair of the 116 brain regions.This resulted in a 116 · 116 correlation matrix with 6670([116 · 115]/2) unique inter-regional correlation coefficients(r). These inter-regional r values were transformed to Zr val-ues with Fisher’s r-to-z transformation (Fisher, 1921).
Statistical analysis
First, to examine whether active rTMS was more effectiverelative to the sham rTMS on changes in the UMSARS-IIscore, we performed a two-way analysis of variance (ANOVA)with rTMS groups (active rTMS vs. sham rTMS) as an inde-pendent factor and time (pre-rTMS vs. mid-rTMS vs. post-rTMS) as a repeated factor. Second, to identify the functionallinks that were significantly influenced by rTMS, we per-formed a two-way ANOVA on each functional connectionof the whole brain with rTMS groups (active rTMS vs.sham rTMS) as an independent factor and time (pre-rTMSvs. post-rTMS) as a repeated factor. Third, we examinedwhether changes in functional connectivity of links identi-fied by the whole-brain two-way ANOVA were significantlyassociated with changes in motor symptoms in the activerTMS group.
For the whole-brain two-way ANOVA, we performed6670 separate statistical tests. Multiple comparisons werecorrected using a degree-based correction (Supplemen-tary Data; Supplementary Data are available online atwww.liebertpub.com/brain). Briefly, methodologically sim-ilar to the network-based statistics (Zalesky et al., 2010) andcluster correction in voxel-based task fMRI analysis (Formanet al., 1995), our multiple comparisons were corrected basedon nonrandom data distribution patterns. Based on our10,000 Monte Carlo simulations, the number of functionallinks connected to a single region (i.e., the degree) should beat least 15 for matrix-based fMRI analysis of a 116 · 116matrix size (i.e., with 6670 separate statistical tests) to cor-rect for multiple comparisons at p < 0.05.
Results
rTMS effect on UMSARS-II score
All patients tolerated rTMS well without adverse effects.Before participation, all patients were informed orally andin a written form that they would be randomly assignedinto either the active or sham rTMS group. At the end ofthe study, participants were interviewed regarding theirexpectation of benefits and group assignment. All of the pa-tients thought they had received the active rTMS treatment.The UMSARS-II score at baseline, age, gender, disease du-ration, estimated levodopa dosage, and Hoehn–Yahr stagewas not significantly different between the active rTMSand the sham rTMS groups (Table 1).
Figure 1B illustrates score changes in the UMSARS-IIbetween different time points for each patient. All patients inthe active rTMS group exhibited a decreased UMSARS-IIscore after the 10-session rTMS intervention (mean change =!3.39 – 2.41, mean percentage change = 21% – 15%), whileonly 60% of patients in the sham rTMS group showed a de-creased UMSARS-II score (mean change =!1.45 – 2.07,range = 7% – 12%). An ANOVA of the UMSARS-II scoreyielded a significant main effect of time, F(2,34) = 11.41,p = 0.0002, and a significant rTMS group · time interaction,F(2,34) = 4.04, p = 0.03. The rTMS group · time interactionoccurred because the time effect was significant for the activerTMS group, F(2,16) = 8.84, p = 0.003, but not for the shamrTMS group, F(2,18) = 3.03, p = 0.07.
The time effect observed in the active rTMS group repre-sented a significant improvement in the motor symptomscore in the post-rTMS condition (i.e., after the 10th session)relative to the pre-rTMS condition (i.e., the baseline),F(1,8) = 11.84, p = 0.009, and the mid-rTMS condition (i.e.,after the 5th session), F(1,8) = 16.12, p = 0.004. The effectsize (Cohen’s d) for difference in score change betweengroups was 0.92, indicating a large effect favoring activerTMS over sham rTMS after the 10-session rTMS interven-tion. Given the effect size estimated and a type I error of 5%,our sample size provided enough power (97%, type II er-ror = 3%) to detect the rTMS effect.
The active rTMS group had a relatively higher dose ofdopaminergic medication at baseline than the sham rTMSgroup ( p = 0.06). To examine whether the dose of dopami-nergic medication at baseline could be a confounding factorfor the observed effects, we conducted two additional analy-ses. First, we included the estimated levodopa dosage as acovariate to the ANOVA. The results of the ANOVA showedthat inclusion of the estimated levodopa dosage as a covari-ate did not change the findings; in other words, the effects oftime, F(2,32) = 6.49, p = 0.004, and rTMS group · time inter-action, F(2,32) = 3.66, p = 0.04, remained significant.
Second, we split the patients into two groups based on thelevodopa dosage (high L-dopa vs. low L-dopa group). AnANOVA of the UMSARS-II score with dosage (high L-dopa group vs. low L-dopa group) as an independent fac-tor and time (pre-rTMS vs. mid-rTMS vs. post-rTMS) as arepeated factor yielded a significant main effect of time,F(2,34) = 9.53, p = 0.0005. The main effect of dosage,F(2,34) = 0.36, p = 0.5544, and the interaction effect of dos-age · time, F(2,34) = 2.19, p = 0.1271, were not significant.The nonsignificant main effect of dosage and nonsignificantdosage · time interaction effect indicated that (1) motorsymptoms were not significantly different between the highL-dopa and low L-dopa groups across time points and (2)the time effect did not significantly differ between the highL-dopa and low L-dopa groups. The additional analyses ex-cluded the potential confounding effect of L-dopa dosageand provide further support of the rTMS intervention effect.
rTMS-induced changes in functional connectivity
For the resting-state fMRI data, no excessive head motionduring fMRI scans was found for any patient (rotation < 1!;translation < 1.5 mm), and the head motion did not signifi-cantly differ between the two rTMS groups or betweenpre-rTMS and post-rTMS conditions. Although there were
4 CHOU ET AL.
no significant differences in head motion and dopaminergicmedication between the active and sham rTMS groups, wecontrolled for these two factors while performing theANOVA of functional connectivity.
The two-way analysis of covariance (ANCOVA) withrTMS (active rTMS vs. sham rTMS) as an independent fac-tor and time (pre-rTMS vs. post-rTMS) as a repeated factor
on each functional link of the whole brain produced a signif-icant interaction effect between rTMS group and time for 47functional links (Fig. 2). The 47 functional links were iden-tified because their change in functional connectivity (post-rTMS minus pre-rTMS) was significantly different betweenthe active rTMS and the sham rTMS groups at p < 0.05,and the number of significant links connected to a single
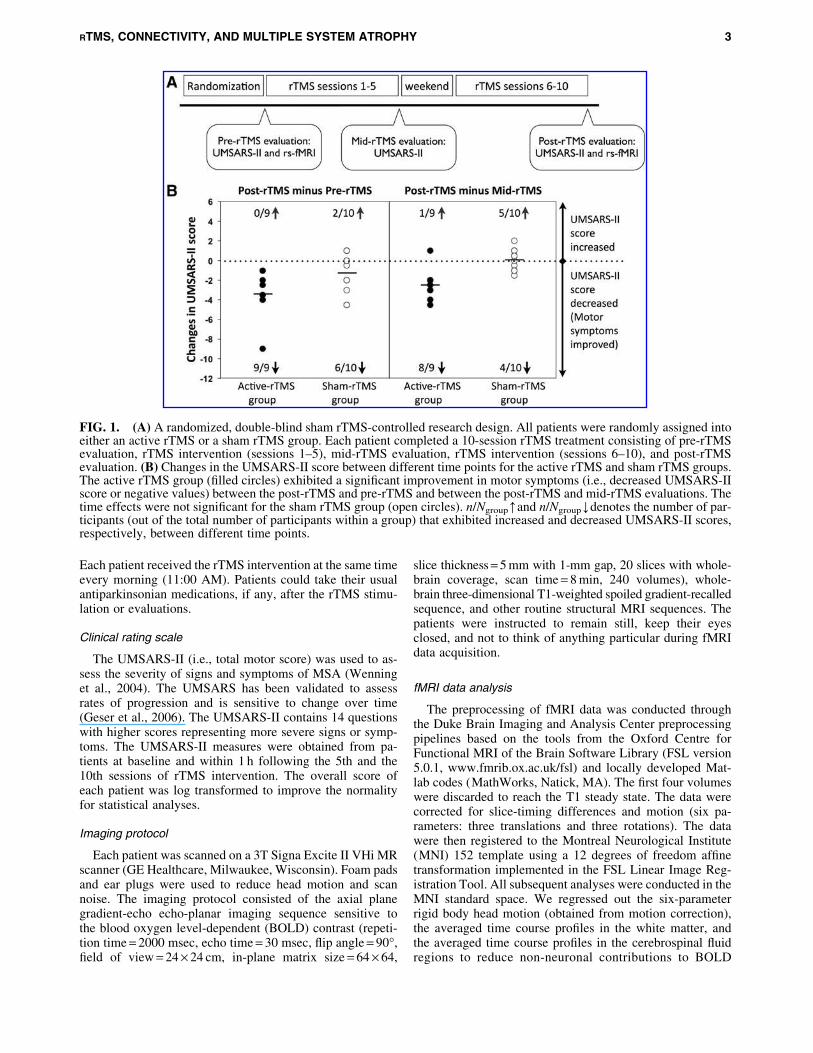
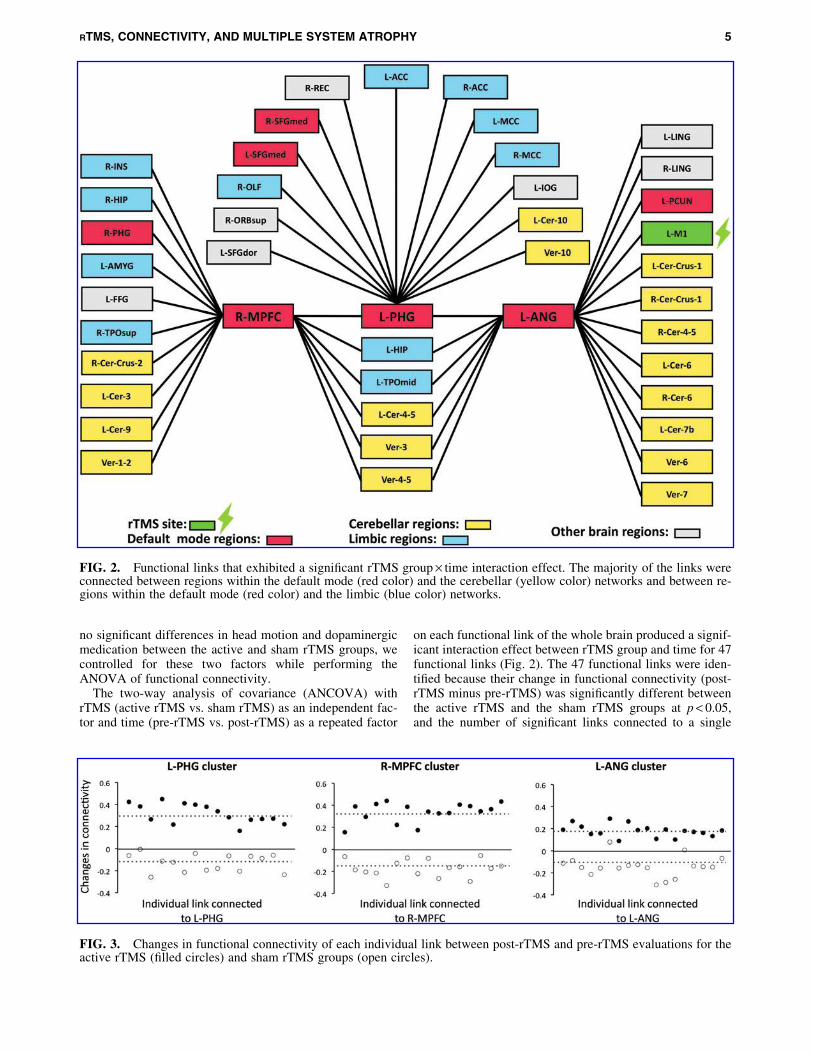
FIG. 2. Functional links that exhibited a significant rTMS group · time interaction effect. The majority of the links wereconnected between regions within the default mode (red color) and the cerebellar (yellow color) networks and between re-gions within the default mode (red color) and the limbic (blue color) networks.
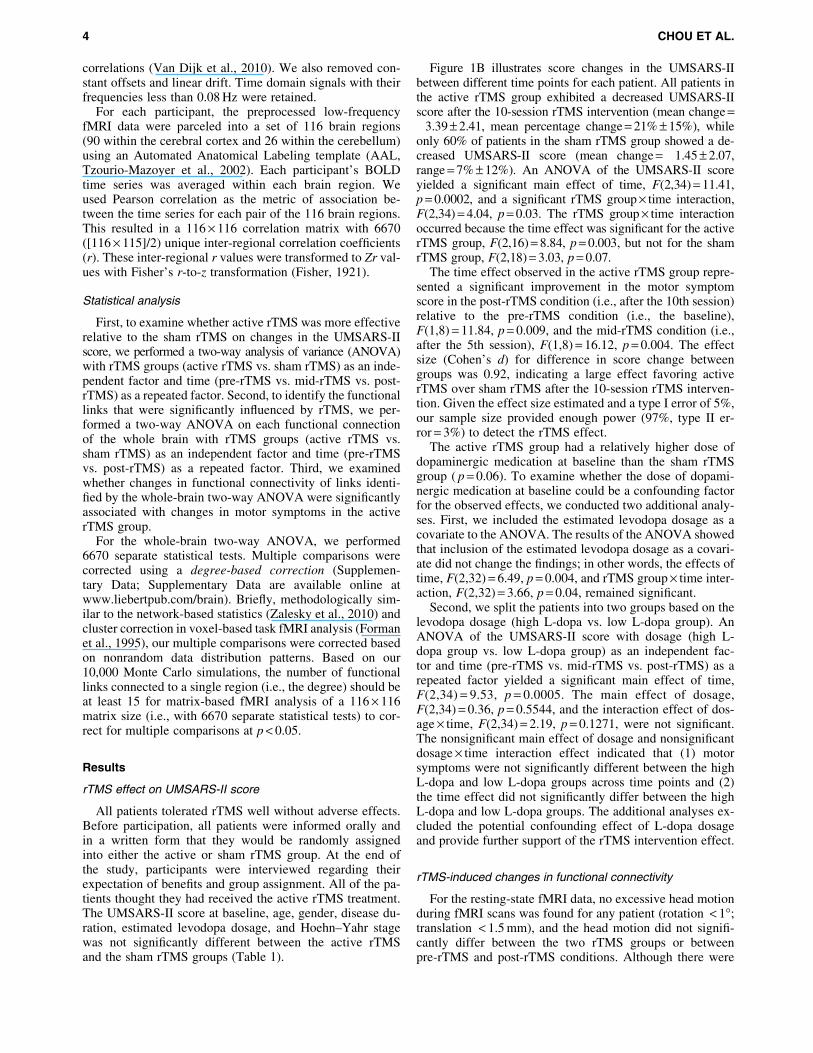
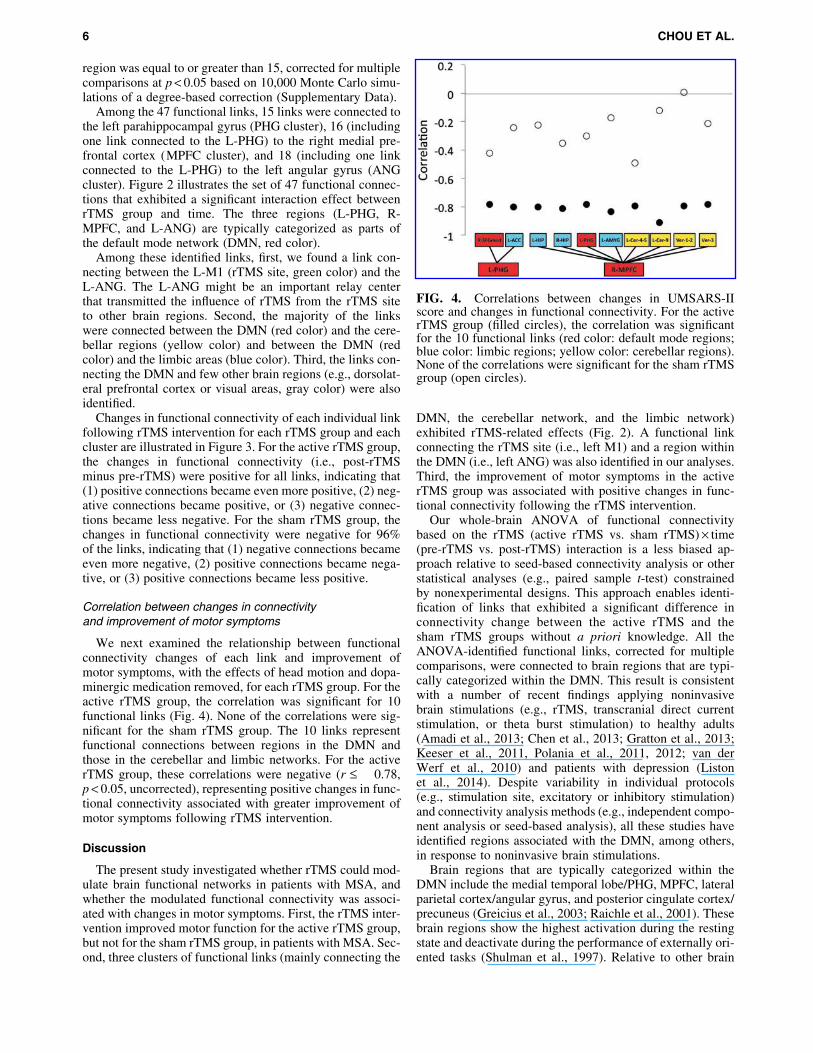
FIG. 3. Changes in functional connectivity of each individual link between post-rTMS and pre-rTMS evaluations for theactive rTMS (filled circles) and sham rTMS groups (open circles).
RTMS, CONNECTIVITY, AND MULTIPLE SYSTEM ATROPHY 5
region was equal to or greater than 15, corrected for multiplecomparisons at p < 0.05 based on 10,000 Monte Carlo simu-lations of a degree-based correction (Supplementary Data).
Among the 47 functional links, 15 links were connected tothe left parahippocampal gyrus (PHG cluster), 16 (includingone link connected to the L-PHG) to the right medial pre-frontal cortex (MPFC cluster), and 18 (including one linkconnected to the L-PHG) to the left angular gyrus (ANGcluster). Figure 2 illustrates the set of 47 functional connec-tions that exhibited a significant interaction effect betweenrTMS group and time. The three regions (L-PHG, R-MPFC, and L-ANG) are typically categorized as parts ofthe default mode network (DMN, red color).
Among these identified links, first, we found a link con-necting between the L-M1 (rTMS site, green color) and theL-ANG. The L-ANG might be an important relay centerthat transmitted the influence of rTMS from the rTMS siteto other brain regions. Second, the majority of the linkswere connected between the DMN (red color) and the cere-bellar regions (yellow color) and between the DMN (redcolor) and the limbic areas (blue color). Third, the links con-necting the DMN and few other brain regions (e.g., dorsolat-eral prefrontal cortex or visual areas, gray color) were alsoidentified.
Changes in functional connectivity of each individual linkfollowing rTMS intervention for each rTMS group and eachcluster are illustrated in Figure 3. For the active rTMS group,the changes in functional connectivity (i.e., post-rTMSminus pre-rTMS) were positive for all links, indicating that(1) positive connections became even more positive, (2) neg-ative connections became positive, or (3) negative connec-tions became less negative. For the sham rTMS group, thechanges in functional connectivity were negative for 96%of the links, indicating that (1) negative connections becameeven more negative, (2) positive connections became nega-tive, or (3) positive connections became less positive.
Correlation between changes in connectivityand improvement of motor symptoms
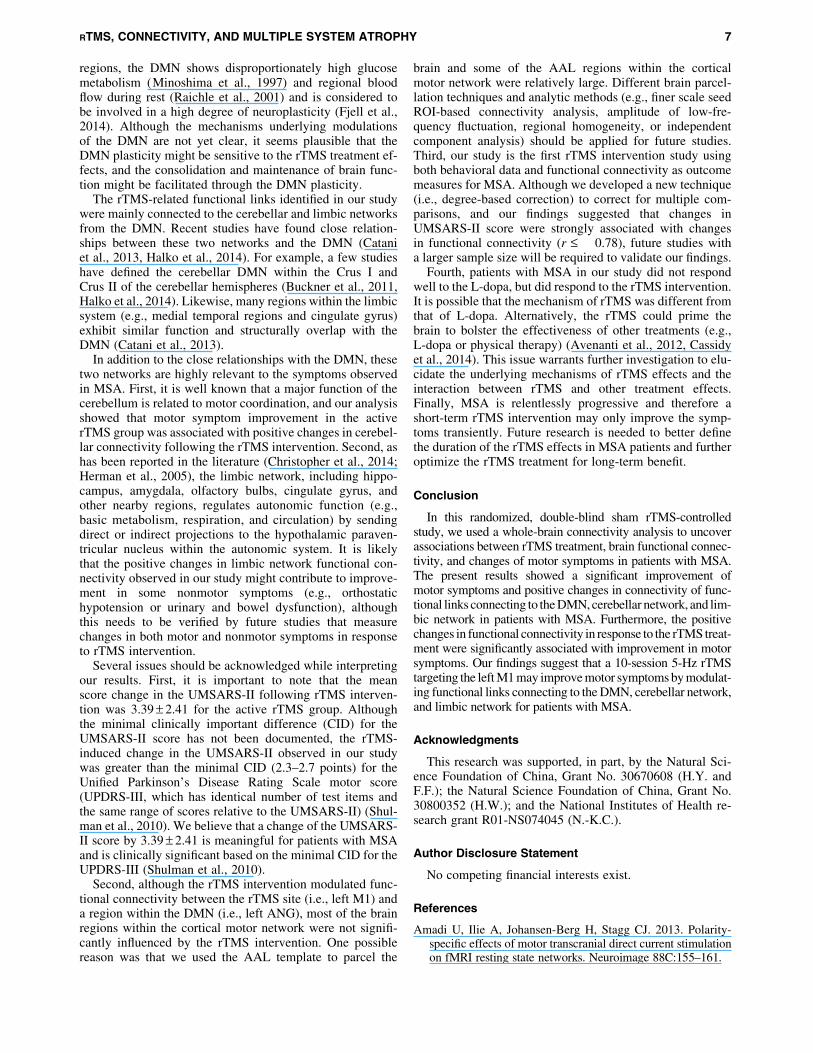
We next examined the relationship between functionalconnectivity changes of each link and improvement ofmotor symptoms, with the effects of head motion and dopa-minergic medication removed, for each rTMS group. For theactive rTMS group, the correlation was significant for 10functional links (Fig. 4). None of the correlations were sig-nificant for the sham rTMS group. The 10 links representfunctional connections between regions in the DMN andthose in the cerebellar and limbic networks. For the activerTMS group, these correlations were negative (r £ !0.78,p < 0.05, uncorrected), representing positive changes in func-tional connectivity associated with greater improvement ofmotor symptoms following rTMS intervention.
Discussion
The present study investigated whether rTMS could mod-ulate brain functional networks in patients with MSA, andwhether the modulated functional connectivity was associ-ated with changes in motor symptoms. First, the rTMS inter-vention improved motor function for the active rTMS group,but not for the sham rTMS group, in patients with MSA. Sec-ond, three clusters of functional links (mainly connecting the
DMN, the cerebellar network, and the limbic network)exhibited rTMS-related effects (Fig. 2). A functional linkconnecting the rTMS site (i.e., left M1) and a region withinthe DMN (i.e., left ANG) was also identified in our analyses.Third, the improvement of motor symptoms in the activerTMS group was associated with positive changes in func-tional connectivity following the rTMS intervention.
Our whole-brain ANOVA of functional connectivitybased on the rTMS (active rTMS vs. sham rTMS) · time(pre-rTMS vs. post-rTMS) interaction is a less biased ap-proach relative to seed-based connectivity analysis or otherstatistical analyses (e.g., paired sample t-test) constrainedby nonexperimental designs. This approach enables identi-fication of links that exhibited a significant difference inconnectivity change between the active rTMS and thesham rTMS groups without a priori knowledge. All theANOVA-identified functional links, corrected for multiplecomparisons, were connected to brain regions that are typi-cally categorized within the DMN. This result is consistentwith a number of recent findings applying noninvasivebrain stimulations (e.g., rTMS, transcranial direct currentstimulation, or theta burst stimulation) to healthy adults(Amadi et al., 2013; Chen et al., 2013; Gratton et al., 2013;Keeser et al., 2011, Polania et al., 2011, 2012; van derWerf et al., 2010) and patients with depression (Listonet al., 2014). Despite variability in individual protocols(e.g., stimulation site, excitatory or inhibitory stimulation)and connectivity analysis methods (e.g., independent compo-nent analysis or seed-based analysis), all these studies haveidentified regions associated with the DMN, among others,in response to noninvasive brain stimulations.
Brain regions that are typically categorized within theDMN include the medial temporal lobe/PHG, MPFC, lateralparietal cortex/angular gyrus, and posterior cingulate cortex/precuneus (Greicius et al., 2003; Raichle et al., 2001). Thesebrain regions show the highest activation during the restingstate and deactivate during the performance of externally ori-ented tasks (Shulman et al., 1997). Relative to other brain
FIG. 4. Correlations between changes in UMSARS-IIscore and changes in functional connectivity. For the activerTMS group (filled circles), the correlation was significantfor the 10 functional links (red color: default mode regions;blue color: limbic regions; yellow color: cerebellar regions).None of the correlations were significant for the sham rTMSgroup (open circles).
6 CHOU ET AL.
regions, the DMN shows disproportionately high glucosemetabolism (Minoshima et al., 1997) and regional bloodflow during rest (Raichle et al., 2001) and is considered tobe involved in a high degree of neuroplasticity (Fjell et al.,2014). Although the mechanisms underlying modulationsof the DMN are not yet clear, it seems plausible that theDMN plasticity might be sensitive to the rTMS treatment ef-fects, and the consolidation and maintenance of brain func-tion might be facilitated through the DMN plasticity.
The rTMS-related functional links identified in our studywere mainly connected to the cerebellar and limbic networksfrom the DMN. Recent studies have found close relation-ships between these two networks and the DMN (Cataniet al., 2013, Halko et al., 2014). For example, a few studieshave defined the cerebellar DMN within the Crus I andCrus II of the cerebellar hemispheres (Buckner et al., 2011,Halko et al., 2014). Likewise, many regions within the limbicsystem (e.g., medial temporal regions and cingulate gyrus)exhibit similar function and structurally overlap with theDMN (Catani et al., 2013).
In addition to the close relationships with the DMN, thesetwo networks are highly relevant to the symptoms observedin MSA. First, it is well known that a major function of thecerebellum is related to motor coordination, and our analysisshowed that motor symptom improvement in the activerTMS group was associated with positive changes in cerebel-lar connectivity following the rTMS intervention. Second, ashas been reported in the literature (Christopher et al., 2014;Herman et al., 2005), the limbic network, including hippo-campus, amygdala, olfactory bulbs, cingulate gyrus, andother nearby regions, regulates autonomic function (e.g.,basic metabolism, respiration, and circulation) by sendingdirect or indirect projections to the hypothalamic paraven-tricular nucleus within the autonomic system. It is likelythat the positive changes in limbic network functional con-nectivity observed in our study might contribute to improve-ment in some nonmotor symptoms (e.g., orthostatichypotension or urinary and bowel dysfunction), althoughthis needs to be verified by future studies that measurechanges in both motor and nonmotor symptoms in responseto rTMS intervention.
Several issues should be acknowledged while interpretingour results. First, it is important to note that the meanscore change in the UMSARS-II following rTMS interven-tion was 3.39 – 2.41 for the active rTMS group. Althoughthe minimal clinically important difference (CID) for theUMSARS-II score has not been documented, the rTMS-induced change in the UMSARS-II observed in our studywas greater than the minimal CID (2.3–2.7 points) for theUnified Parkinson’s Disease Rating Scale motor score(UPDRS-III, which has identical number of test items andthe same range of scores relative to the UMSARS-II) (Shul-man et al., 2010). We believe that a change of the UMSARS-II score by 3.39 – 2.41 is meaningful for patients with MSAand is clinically significant based on the minimal CID for theUPDRS-III (Shulman et al., 2010).
Second, although the rTMS intervention modulated func-tional connectivity between the rTMS site (i.e., left M1) anda region within the DMN (i.e., left ANG), most of the brainregions within the cortical motor network were not signifi-cantly influenced by the rTMS intervention. One possiblereason was that we used the AAL template to parcel the
brain and some of the AAL regions within the corticalmotor network were relatively large. Different brain parcel-lation techniques and analytic methods (e.g., finer scale seedROI-based connectivity analysis, amplitude of low-fre-quency fluctuation, regional homogeneity, or independentcomponent analysis) should be applied for future studies.Third, our study is the first rTMS intervention study usingboth behavioral data and functional connectivity as outcomemeasures for MSA. Although we developed a new technique(i.e., degree-based correction) to correct for multiple com-parisons, and our findings suggested that changes inUMSARS-II score were strongly associated with changesin functional connectivity (r £ !0.78), future studies witha larger sample size will be required to validate our findings.
Fourth, patients with MSA in our study did not respondwell to the L-dopa, but did respond to the rTMS intervention.It is possible that the mechanism of rTMS was different fromthat of L-dopa. Alternatively, the rTMS could prime thebrain to bolster the effectiveness of other treatments (e.g.,L-dopa or physical therapy) (Avenanti et al., 2012, Cassidyet al., 2014). This issue warrants further investigation to elu-cidate the underlying mechanisms of rTMS effects and theinteraction between rTMS and other treatment effects.Finally, MSA is relentlessly progressive and therefore ashort-term rTMS intervention may only improve the symp-toms transiently. Future research is needed to better definethe duration of the rTMS effects in MSA patients and furtheroptimize the rTMS treatment for long-term benefit.
Conclusion
In this randomized, double-blind sham rTMS-controlledstudy, we used a whole-brain connectivity analysis to uncoverassociations between rTMS treatment, brain functional connec-tivity, and changes of motor symptoms in patients with MSA.The present results showed a significant improvement ofmotor symptoms and positive changes in connectivity of func-tional links connecting to the DMN, cerebellar network, and lim-bic network in patients with MSA. Furthermore, the positivechanges in functional connectivity in response to the rTMS treat-ment were significantly associated with improvement in motorsymptoms. Our findings suggest that a 10-session 5-Hz rTMStargeting the left M1 may improve motor symptoms by modulat-ing functional links connecting to the DMN, cerebellar network,and limbic network for patients with MSA.
Acknowledgments
This research was supported, in part, by the Natural Sci-ence Foundation of China, Grant No. 30670608 (H.Y. andF.F.); the Natural Science Foundation of China, Grant No.30800352 (H.W.); and the National Institutes of Health re-search grant R01-NS074045 (N.-K.C.).
Author Disclosure Statement
No competing financial interests exist.
References
Amadi U, Ilie A, Johansen-Berg H, Stagg CJ. 2013. Polarity-specific effects of motor transcranial direct current stimulationon fMRI resting state networks. Neuroimage 88C:155–161.
RTMS, CONNECTIVITY, AND MULTIPLE SYSTEM ATROPHY 7
Avenanti A, Coccia M, Ladavas E, Provinciali L, Ceravolo MG.2012. Low-frequency rTMS promotes use-dependent motorplasticity in chronic stroke: a randomized trial. Neurology78:256–264.
Barker AT, Jalinous RI, Freeston L. 1985. Non-invasive magneticstimulation of human motor cortex. Lancet 1:1106–1107.
Biswal B, Yetkin FZ, Haughton VM, Hyde JS. 1995. Functionalconnectivity in the motor cortex of resting human brain usingecho-planar MRI. Magn Reson Med 34:537–541.
Biswal BB, Mennes M, Zuo XN, Gohel S, Kelly C, Smith S. M,Beckmann CF, Adelstein JS, Buckner RL, Colcombe S,Dogonowski AM, Ernst M, Fair D, Hampson M, HoptmanMJ, Hyde JS, Kiviniemi VJ, Kotter R, Li SJ, Lin CP, LoweMJ, Mackay C, Madden DJ, Madsen KH, Margulies DS,Mayberg HS, McMahon K, Monk CS, Mostofsky SH,Nagel BJ, Pekar JJ, Peltier SJ, Petersen SE, Riedl V, Romb-outs SA, Rypma B, Schlaggar BL, Schmidt S, Seidler RD,Siegle GJ, Sorg C, Teng GJ, Veijola J, Villringer A, WalterM, Wang L, Weng XC, Whitfield-Gabrieli S, WilliamsonP, Windischberger C, Zang YF, Zhang H. Y, CastellanosFX, Milham MP. 2010. Toward discovery science ofhuman brain function. Proc Natl Acad Sci U S A 107:4734–4739.
Buckner RL, Andrews-Hanna JR, Schacter DL. 2008. Thebrain’s default network: anatomy, function, and relevanceto disease. Ann N Y Acad Sci 1124:1–38.
Buckner RL, Krienen FM, Castellanos A, Diaz JC, Yeo BT.2011. The organization of the human cerebellum estimatedby intrinsic functional connectivity. J Neurophysiol 106:2322–2345.
Cassidy JM, Gillick BT, Carey JR. 2014. Priming the brain tocapitalize on metaplasticity in stroke rehabilitation. PhysTher 94:139–150.
Catani M, Dell’acqua F, Thiebaut de Schotten M. 2013. A re-vised limbic system model for memory, emotion and behav-iour. Neurosci Biobehav Rev 37:1724–1737.
Chen AC, Oathes DJ, Chang C, Bradley T, Zhou ZW, WilliamsLM, Glover GH, Deisseroth K, Etkin A. 2013. Causal inter-actions between fronto-parietal central executive and default-mode networks in humans. Proc Natl Acad Sci U S A110:19944–19949.
Chou YH, Hickey PT, Sundman M, Song AW, Chen NK. 2015.Effects of repetitive transcranial magnetic stimulation onmotor symptoms in Parkinson disease: A systematic reviewand meta-analysis. JAMA Neurol [Epub ahead of print];doi: 10.1001/jamaneurol.2014.4380.
Christopher L, Koshimori Y, Lang AE, Criaud M, Strafella AP.2014. Uncovering the role of the insula in non-motor symp-toms of Parkinson’s disease. Brain 137(Pt 8):2143–2154.
Fisher RA. 1921. On the probable error of a coefficient of corre-lation deduced from a small sample. Metron 1:3–32.
Fjell AM, McEvoy L, Holland D, Dale AM, Walhovd KB, Alz-heimer’s Disease Neuroimaging I. 2014. What is normal innormal aging? Effects of aging, amyloid and Alzheimer’sdisease on the cerebral cortex and the hippocampus. ProgNeurobiol 117:20–40.
Forman SD, Cohen JD, Fitzgerald M, Eddy WF, Mintun MA,Noll DC. 1995. Improved assessment of significant activationin functional magnetic resonance imaging (fMRI): use of acluster-size threshold. Magn Reson Med 33:636–647.
Fox MD, Greicius M. 2010. Clinical applications of resting statefunctional connectivity. Front Syst Neurosci 4:19.
Geser F, Wenning GK, Seppi K, Stampfer-Kountchev M,Scherfler C, Sawires M, Frick C, Ndayisaba JP, Ulmer H,
Pellecchia MT, Barone P, Kim HT, Hooker J, Quinn NP,Cardozo A, Tolosa E, Abele M, Klockgether T, OstergaardK, Dupont E, Schimke N, Eggert KM, Oertel W, DjaldettiR, Poewe W. 2006. Progression of multiple system atrophy(MSA): a prospective natural history study by the EuropeanMSA Study Group (EMSA SG). Mov Disord 21:179–186.
Gilman S, Wenning GK, Low PA, Brooks DJ, Mathias CJ,Trojanowski JQ, Wood NW, Colosimo C, Durr A, FowlerCJ, Kaufmann H, Klockgether T, Lees A, Poewe W, QuinnN, Revesz T, Robertson D, Sandroni P, Seppi K, VidailhetM. 2008. Second consensus statement on the diagnosis ofmultiple system atrophy. Neurology 71:670–676.
Gratton C, Lee TG, Nomura EM, D’Esposito M. 2013. The ef-fect of theta-burst TMS on cognitive control networks mea-sured with resting state fMRI. Front Syst Neurosci 7:124.
Greicius MD, Krasnow B, Reiss AL, Menon V. 2003. Functionalconnectivity in the resting brain: a network analysis of the de-fault mode hypothesis. Proc Natl Acad Sci U S A 100:253–258.
Halko MAFarzan F, Eldaief MC, Schmahmann JD, Pascual-Leone A. 2014. Intermittent theta-burst stimulation of thelateral cerebellum increases functional connectivity of thedefault network. J Neurosci 34:12049–12056.
Herman JP, Ostrander MM, Mueller NK, Figueiredo H. 2005.Limbic system mechanisms of stress regulation: hypothal-amo-pituitary-adrenocortical axis. Prog Neuropsychophar-macol Biol Psychiatry 29:1201–1213.
Keeser D, Meindl T, Bor J, Palm U, Pogarell O, Mulert C, Bru-nelin J, Moller HJ, Reiser M, Padberg F. 2011. Prefrontaltranscranial direct current stimulation changes connectivityof resting-state networks during fMRI. J Neurosci 31:15284–15293.
Khedr EM, Farweez HM, Islam H. 2003. Therapeutic effect of re-petitive transcranial magnetic stimulation on motor function inParkinson’s disease patients. Eur J Neurol 10:567–572.
Liston C, Chen AC, Zebley BD, Drysdale AT, Gordon R,Leuchter B, Voss HU, Casey BJ, Etkin A, Dubin MJ. 2014.Default mode network mechanisms of transcranial magneticstimulation in depression. Biol Psychiatry 76:517–526.
Lomarev MP, Kanchana S, Bara-Jimenez W, Iyer M, Wasser-mann EM, Hallett M. 2006. Placebo-controlled study ofrTMS for the treatment of Parkinson’s disease. Mov Disord21:325–331.
Minoshima S, Giordani B, Berent S, Frey KA, Foster NL, KuhlDE. 1997. Metabolic reduction in the posterior cingulate cor-tex in very early Alzheimer’s disease. Ann Neurol 42:85–94.
Nardone R, Bergmann J, Christova M, Caleri F, Tezzon F,Ladurner G, Trinka E, Golaszewski S. 2012. Effect of trans-cranial brain stimulation for the treatment of Alzheimer dis-ease: a review. Int J Alzheimers Dis 2012:687909.
Ozawa T, Healy DG, Abou-Sleiman PM, Ahmadi KR, Quinn N,Lees AJ, Shaw K, Wullner U, Berciano J, Moller JC, KammC, Burk K, Josephs KA, Barone P, Tolosa E, Goldstein DB,Wenning G, Geser F, Holton JL, Gasser T, Revesz T, WoodNW. 2006. The alpha-synuclein gene in multiple system atro-phy. J Neurol Neurosurg Psychiatry 77:464–467.
Papp MI, Kahn JE, Lantos PL. 1989. Glial cytoplasmic inclu-sions in the CNS of patients with multiple system atrophy(striatonigral degeneration, olivopontocerebellar atrophyand Shy-Drager syndrome). J Neurol Sci 94:79–100.
Pascual-Leone A, Valls-Sole J, Brasil-Neto JP, Cammarota A,Grafman J, Hallett M. 1994. Akinesia in Parkinson’s disease.II. Effects of subthreshold repetitive transcranial motor cor-tex stimulation. Neurology 44:892–898.
8 CHOU ET AL.
Polania R, Paulus W, Antal A, Nitsche MA. 2011. Introducinggraph theory to track for neuroplastic alterations in the restinghuman brain: a transcranial direct current stimulation study.Neuroimage 54:2287–2296.
Polania R, Paulus W, Nitsche MA. 2012. Modulating cortico-striatal and thalamo-cortical functional connectivity withtranscranial direct current stimulation. Hum Brain Mapp33:2499–2508.
Raichle ME, MacLeod AM, Snyder AZ, Powers WJ, GusnardDA, Shulman GL. 2001. A default mode of brain function.Proc Natl Acad Sci U S A 98:676–682.
Rothwell R. 1991. Physiological studies on electric and mag-netic stimulation of the human brain. In Levy WJ, CraccoRQ, Barker AT and Rothwell JC. Magnetic Motor Stimula-tion: Basic Principles and Clinical Experience. Amsterdam,Elsevier; pp. 29–35.
Shulman GL, Fiez JA, Corbetta M, Buckner RL, Miezin FM,Raichle ME, Petersen SE. 1997. Common blood flowchanges across visual tasks: II. Decreases in cerebral cortex.J Cogn Neurosci 9:648–663.
Shulman LM, Gruber-Baldini AL, Anderson KE, Fishman PS,Reich SG, Weiner WJ. 2010. The clinically important differ-ence on the unified Parkinson’s disease rating scale. ArchNeurol 67:64–70.
Siebner HR, Mentschel C, Auer C, Conrad B. 1999. Repetitivetranscranial magnetic stimulation has a beneficial effect onbradykinesia in Parkinson’s disease. Neuroreport 10:589–594.
Siebner HR, Rossmeier C, Mentschel C, Peinemann A, Conrad B.2000. Short-term motor improvement after sub-threshold 5-Hzrepetitive transcranial magnetic stimulation of the primarymotor hand area in Parkinson’s disease. J Neurol Sci 178:91–94.
Spillantini MG, Crowther RA, Jakes R, Cairns NJ, Lantos PL,Goedert M. 1998. Filamentous alpha-synuclein inclusionslink multiple system atrophy with Parkinson’s disease anddementia with Lewy bodies. Neurosci Lett 251:205–208.
Tzourio-Mazoyer N, Landeau B, Papathanassiou D, Crivello F,Etard O, Delcroix N, Mazoyer B, Joliot M. 2002. Automatedanatomical labeling of activations in SPM using a macro-scopic anatomical parcellation of the MNI MRI single-subject brain. Neuroimage 15:273–289.
van der Werf YD, Sanz-Arigita EJ, Menning S, van den HeuvelOA. 2010. Modulating spontaneous brain activity using repeti-tive transcranial magnetic stimulation. BMC Neurosci 11:145.
Van Dijk KR, Hedden T, Venkataraman A, Evans KC, LazarSW, Buckner. 2010. RL. Intrinsic functional connectivity
as a tool for human connectomics: theory, properties, and op-timization. J Neurophysiol 103:297–321.
Wenning GK, Geser F, Krismer F, Seppi K, Duerr S, Boesch S,Kollensperger M, Goebel G, Pfeiffer KP, Barone P, Pellec-chia MT, Quinn NP, Koukouni V, Fowler CJ, Schrag A,Mathias CJ, Giladi N, Gurevich T, Dupont E, OstergaardK, Nilsson CF, Widner H, Oertel W, Eggert KM, AlbaneseA, del Sorbo F, Tolosa E, Cardozo A, Deuschl G, HellriegelH, Klockgether T, Dodel R, Sampaio C, Coelho M, DjaldettiR, Melamed E, Gasser T, Kamm C, Meco G, Colosimo C,Rascol O, Meissner WG, Tison F, Poewe W. 2013. The nat-ural history of multiple system atrophy: a prospective Euro-pean cohort study. Lancet Neurol 12:264–274.
Wenning GK, Tison F, Ben Shlomo Y, Daniel SE, Quinn NP.1997. Multiple system atrophy: a review of 203 pathologi-cally proven cases. Mov Disord 12:133–147.
Wenning GK, Tison F, Seppi K, Sampaio C, Diem A, Yekhlef F,Ghorayeb I, Ory F, Galitzky M, Scaravilli T, Bozi M, Colo-simo C, Gilman S, Shults CW, Quinn N. P, Rascol O, PoeweW. 2004. Development and validation of the Unified Multi-ple System Atrophy Rating Scale (UMSARS). Mov Disord19:1391–1402.
Zalesky A, Fornito A, Bullmore ET. 2010. Network-based statis-tic: identifying differences in brain networks. Neuroimage53:1197–1207.
Address correspondence to:Nan-kuei Chen
Brain Imaging and Analysis CenterBox 3918
Duke University Medical CenterDurham, NC 27710
E-mail: [email protected]
or
Han WangDepartment of Neurology
Peking Union Medical College HospitalBeijingChina
E-mail: [email protected]
RTMS, CONNECTIVITY, AND MULTIPLE SYSTEM ATROPHY 9
Supplementary Data
Materials and Methods
Statistical analysis
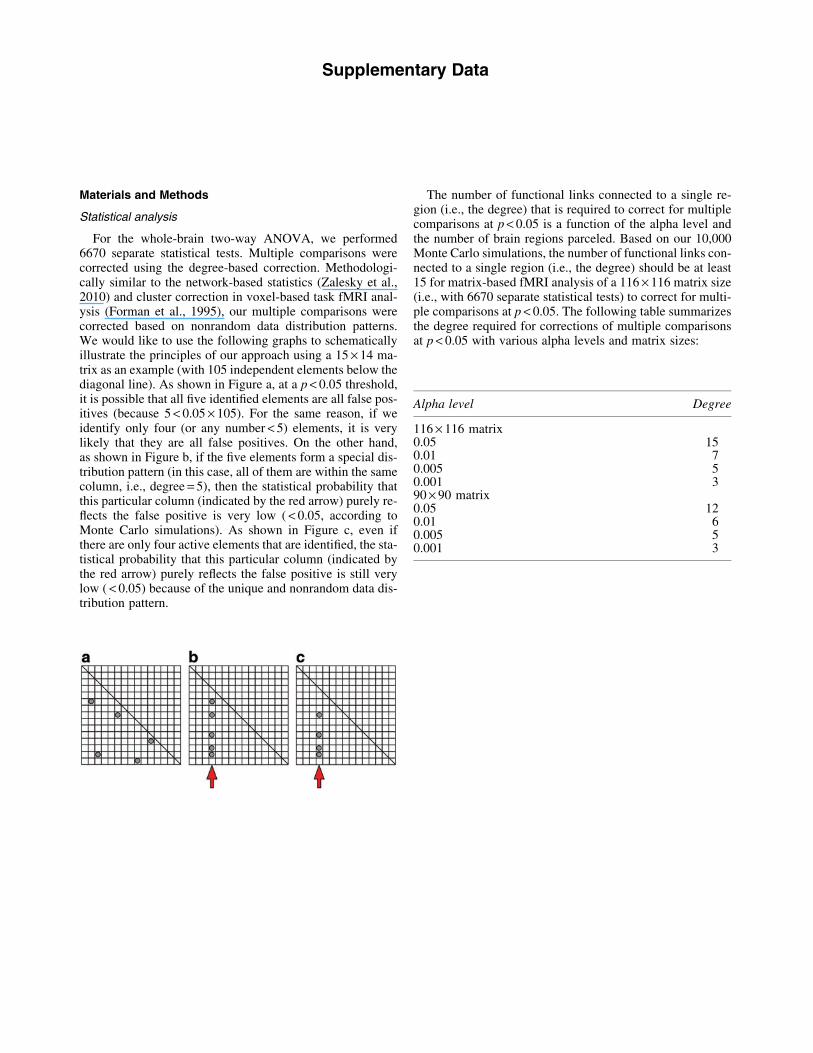
For the whole-brain two-way ANOVA, we performed6670 separate statistical tests. Multiple comparisons werecorrected using the degree-based correction. Methodologi-cally similar to the network-based statistics (Zalesky et al.,2010) and cluster correction in voxel-based task fMRI anal-ysis (Forman et al., 1995), our multiple comparisons werecorrected based on nonrandom data distribution patterns.We would like to use the following graphs to schematicallyillustrate the principles of our approach using a 15 · 14 ma-trix as an example (with 105 independent elements below thediagonal line). As shown in Figure a, at a p < 0.05 threshold,it is possible that all five identified elements are all false pos-itives (because 5 < 0.05 · 105). For the same reason, if weidentify only four (or any number < 5) elements, it is verylikely that they are all false positives. On the other hand,as shown in Figure b, if the five elements form a special dis-tribution pattern (in this case, all of them are within the samecolumn, i.e., degree = 5), then the statistical probability thatthis particular column (indicated by the red arrow) purely re-flects the false positive is very low ( < 0.05, according toMonte Carlo simulations). As shown in Figure c, even ifthere are only four active elements that are identified, the sta-tistical probability that this particular column (indicated bythe red arrow) purely reflects the false positive is still verylow ( < 0.05) because of the unique and nonrandom data dis-tribution pattern.
The number of functional links connected to a single re-gion (i.e., the degree) that is required to correct for multiplecomparisons at p < 0.05 is a function of the alpha level andthe number of brain regions parceled. Based on our 10,000Monte Carlo simulations, the number of functional links con-nected to a single region (i.e., the degree) should be at least15 for matrix-based fMRI analysis of a 116 · 116 matrix size(i.e., with 6670 separate statistical tests) to correct for multi-ple comparisons at p < 0.05. The following table summarizesthe degree required for corrections of multiple comparisonsat p < 0.05 with various alpha levels and matrix sizes:
Alpha level Degree
116 · 116 matrix0.05 150.01 70.005 50.001 390 · 90 matrix0.05 120.01 60.005 50.001 3
Related Documents