' CIVJL ENGINEERING STUDIES d, RESEARCH SERIES NO. 271 PRIVATE COMMUNICATION NOT FOR PUBLICATION THE EFFECT OF REINFORCEMENT ON ANCHORAGE ZONE CRACKS IN PRESTRESSED CONCRETE MEMBERS ," '.' "0 ... ,;;' fj:-' I:) .. L ,: Ur-c-ana" Illi::.'l' . , iLOis 6180l by PETER GERGELY METE A. SOZEN and CHESTER P. SIESS Issued as a Part of PROGRESS REPORT NO. 12 of the INVESTIGATION OF PRESTRESSED REINFORCED CONCRETE FOR HIGHWAY BRIDGES UNIVERSITY OF ILLINOIS URBANA, ILLINOIS JULY 1963

Welcome message from author
This document is posted to help you gain knowledge. Please leave a comment to let me know what you think about it! Share it to your friends and learn new things together.
Transcript
~'~'l ' CIVJL ENGINEERING STUDIES
d, ~RUCTURAL RESEARCH SERIES NO. 271
PRIVATE COMMUNICATION
NOT FOR PUBLICATION
THE EFFECT OF REINFORCEMENT ON ANCHORAGE ZONE CRACKS
IN PRESTRESSED CONCRETE MEMBERS
," '.' ~
"0
u~;.~- ... ,;;' fj:-' I:) .. L -:~.J ,: .-~
Ur-c-ana" Illi::.'l' .
, iLOis 6180l by
PETER GERGELY
METE A. SOZEN
and CHESTER P. SIESS
Issued as a Part of
PROGRESS REPORT NO. 12 of the
INVESTIGATION OF PRESTRESSED REINFORCED CONCRETE FOR HIGHWAY BRIDGES
UNIVERSITY OF ILLINOIS
URBANA, ILLINOIS
JULY 1963

THE ~FFECT OF REINFORCEMENT ON ANCHORAGE ZONE CRACKS
IN PRESTRESSED CONCRETE MEMBERS
by
Peter Gergely M. A. Sozen C. P. Siess
Prepared as a Part of an ~nvestigation
Conducted by
THE ENGiNEERiNG EXPERIMENT STATION UN~VERS~TY OF ILL~NOdS
In cooperation with
THE DiV~S~ON Of H~GHWAYS STATE Of ~Ll~NO~S
and
U. S. DEPARTMENT OF COMMERCE BUREAU Of PUS L ~ C ROAD 5
Proj ect nm- 10
INVESTiGAT~ON Of PRESTRESSED RE!NfORCED CONCRETE fOR H~GHWAY 3R!DGES
Urbana, ~ 1 1 i no i s
,July 1963

{/
l..
~.
1 ~
4.
6.
70
- iii-
TABLE OF CONTENTS
i.NTRODUCTIONo 0 0
Introductory Remarks 0 0
Object and Scope 0 •
Acknowledgments. Notation 0 • 0 0 0 •
ANALYSIS OF ANCHORAGE ZONE STRESSES
Introductory Remarks • 0 0
Analysis of Stresses 0 •
Results of Analysis. ~
Comparison with Results Obtained lnvestigatorso 0 • 0 • 0 • 0 0 0
,OOO._etO
by Various :
RESULTS OF TESTS ON SPECiMENS WITHOUT REINFORCEMENT.
: 1 1
.2 4
6
6 6 8
10
13
3.1 Introductory Remarks ~ 0 0 0 • 0 0 •••• 0 • 13 3.2 Behavior of Specimens wIthout Reinforcement. • 14 3.3 Comparison of Analytical and Experimental Results .• ~. 22
ANALYSIS OF END BLOCKS WITH TRANSVERSE REINFORCEMENT.
Introductory Remarks ••.•••• 0 • 0
Equil ibrlum Condltlons In the End Block ••
RESULTS OF TESTS ON SPEC~MENS WiTH REINFORCEMENT.
5 .. 1 5.2 5.3 5.4 5.5 5.6 5Q7
Introductory Remarks. Rectangular Beams •• ~-Beams. 0 0 0 0 • 0
Comparison of the Behavior of Rectangular and i-Beams •• Bond 0 0 0 0 0 Q 0 0 0 Q 0 0 0 0 0 0 0 0 0 0 0 0 0 0 0 0
Con c IUS j on So. 0 0 • • a 0 • 0 0 0 0 0 • 0 • • 0 • • • 0
Reconcil lat~on of Theoretical and Experimental Results.
DES~GN RECOMMENDAT!ONSo 0
6.1 Introductory Remarks 0 •
6.2 Specifications for Deslgno 0
6.3 !11ustrative Examples •..
5 UMMARY • .
7. 1 7.2 7.3 7.4 7.5
Object and Scope 0 • 0 • 0 0
Behavior of Specimens without Reinforcement •. Behavior of Specimens with Reinforcement Bond -51 i P Re 1 at ions hlp • • • • • • Results of Practical Significance •••.
24
24 25
28
28 29 32 33 36 40 41
45
45 47 49
53
53 54 55 55 57
-j',/-
TABLE OF CONTENTS (Continued)
REF ERENe ES •
f'~GURESo
APPENDIX A. REViEW Of WORK RELATED TO ANCHORAGE ZONE STRESSES !N PRESTRESSEP ,CONe,RETE SEAMS 0 0 <" 0
Ao ij Methods of Investlgatlon 0 • 0 • 0 ••
Ao2 Major Variables. 0 0 0 0 0 0 0 0 •
Ao3 Areas of Apparent Agreeme~t in Analytical StudJes. · 0 0 . 0 ,. 0 . · . . A.4 .A.reas of Apparent Agreement ~ n Studies. · " 0 . 0 0 . 0 · 0 .
Ao5 Areas of Apparent Disagreement Stud nes 0 · . . 0 . . 0 . · . 0
Ao6 .Areas of Apparent Disagreement Stud J es 0 0 0 . 0 0 0 0 0 0
APPEND~X 80 M,t~TER~A.l,S~ FA8R~CAT~ON:~ AND TEST~NG
Materials •••• 0
Descrlptlon of Spec!mens 0
Casting and Curing. Instrumentat~on ••• loading Apparatus. Tes t Procedu re • • •
APPEND~X Co DESCR~PT~ON OF COMPUTER PROGRAM 0
Jntroductory Remarks Details of Numerical ~npiJt Data ••• F 'j OVIf D J 039 ram • Output Data.
Procedure
. . · . 0
Experimental . 0 . · 0 . · In Ana 1 yt 1 ca 1 . 0 0 · 0 . · 1 n Experimenta I
0 0 . 0 ·
57
59
118
118 121
121
125
134
138
149
. 149 150 152 152 154 ISS
164
]64 164 ]66 166 ]67
..::. .'
.~
~
'-."
.:......:.;
:' .. :.
~ .

Table No ..
B. 1
B.2
-v-
LIST OF TABLES
Properties of Rectangular Specimens .•
Properties of Specimens with I-Sections.
Page
.:~ 156
1157
Figure Noo
2\1 1
202
203
204
2.5
2.6
207
208
209
3., 1
302a
302b
3.2c
303a
3.3b
3.4
305
306a
-vi -
L~ST OF F~GURES
Boundary Conditions for Fin~te Difference So lu t i on 0 • 0 0 0 0 0 0 0 0 0 0 0 0
Contours of Equal Transverse Stress 0
Magnitudes and Points of Action of Tensile Forces on ~ongiiudinal Sections in the Tension Zone. 0 0
Effect of PoissonDs Ratio on Transverse Strains
Longitudinal Stresses from GuyonDs Solution and from the Finite Difference Solution 0 0 0
Transverse Stresses from Guyonis Solution and from the Finite Difference Solution I' 0
Magnel DS So]ution 0
Transverse Stresses Compared with the Results of the Symmetrical Pr1sm MethodQ 0 0 • 0 0 0
Stresses Along Line of Load by ~yengar and from the;Finite Difference Solutiono 0 0 0 0 0 0
o •
o 0
Measured RelatJonships Between load and Transverse Strain for Spec!menR'L 0 • 0.00 0 •• 00 I'
Measured Relatjonsh~ps Between load and Transverse
59
60
61
62
63
64
65
66
67
68
Strain for Spec!men R20 0 • 0 0 0 I' 0 0 0 0 0 0 69
Measured Relationships Between Load and Transverse Strain for Specimen R20 0 0 I' 0 0 0 •••••• 70
Measured Relat~onsh~ps Between Load and Transverse Strain for Specimen R2 •••• 0 •• • 0 I' • Q. 71
Measured Relationships Between Load and Transverse Strain for Specimen R30 I' 0 0 0 •• • •• 0 a I' 72
Measured Relationships Between Load and Transverse Strain for Spec~men R3 •• 0 • 0 I' 0 0 • 0 0 73
Measured DistrJbution of Transverse Srrains Along Line of Load and Along Cen!er line for Specimen R20 74
Development or Cracks in Specimen R30 0 75
Measured Relationships Between Load and Transverse Strain for Specimen T2. I' • 0 0 I' 0 0 0 0 0 0 I' 76
\. .. )
Figure No.
3.7a
3.8
3.9
3. 12
3. 13
3. 15
3. 16
4. 1
4.2
5.1
5 .. 3
-v i i-
:L I ST OF F LGURES (Cont i nued)
Measured Relationships Between Load and T~ansverse Strain for· Specimen T2. • .. • • .... •• ~ • 0 ,
.Measured Relationsh~ps Between Load and· Transverse Stra.in.for·Spec·imen·T3... • •.• •. • •••••
Measur.edRe1atlonships Between Load and Transverse Strain for Specimen T3 •••••• 0 0 ..... 0 ..
M~asured Relationships Between Load and Transverse Strain for Specimen T7. 0 0 ••• 0 0 •• 0 ...
Transverse Strains at Points Along Centerline for Specimen T2 0 ... 0 0 0 0 0 •• 0 0 0 , • • .. 0 0 •
Transverse· Strains at P6ints Along the Line of Load for SpecimensiT2.and,T3 .. 0 • .. • • • 0 • 0
Develop~ent of CYacks in I-Beams.
Transverse Sttains at Points Along the Line of Load for Specimen T7. • .•• 0
Measured Transverse Strains Along Line of Load for SpecImens R3 and T3 .••
Measured Transverse Strains Along the Center Line for Sp~cimens R3 and T2 0 ••• ·0
Comparison of Measured Transverse Strains Along the Line of the Load with the Finite Differe~ce SolutIon. 0 • o· " 0 0
Comparison of Measured Transverse Strains Along Center Line with the Finite Difference Solution 0 •
Forces on Free Body . 0 0 ..
Conditions of Forces and Stresses in the Cracked Beam 0 .. 0 • 0
Measured Relationsh~ps Between Load and Stirrup Strain for Specimens.Rli, R.i2, R14;andR17. 0 •
Measured Relationships Between Load and Stirrup Force for Specimens Rl1, R12, R14 and R17 • 0 ~
Measured RelationshIps Between Load and Stirrup Strain for Specimens R8 and R15 0.. o. 0 •
Page.
77
78
79
80
81
82
83
84
85
86
87
88
89
90
91
92
93
Figure No.
5.4
505
5.6
5~7
5~8
509
5010
50 13
5. 15
-v iii-
LIST OF FIGURES .(Continued)
Measured Relationships Between Load and Stirrup Force:fQr Specimens R8 and R15~. 0 '00 ~
Measured Relationships Between Load and Stirrup Strain for Specimens R7 and R90 •••• " 0 ~ •
Development of Cracks in Specimens Rll, R12~ R14 and R17 " l' 0 q 0 0 0 0 9 0 q 0 Q 0 0 fI 0 •
Developmen~ of Cracks in Specimens R8 and R15 "
Measured Relationships Between Load and Crack Length for Rectangular Spec.imens •• 0 ••
Measured Crack Width at Points Along Beam for Rectangular Specimens 0 C?OOOO.Q.g
Variation of the Ratio of Measured Crack Width to Measured Crack Length with App] ied Load in Rectangular Spe~imens 0 • " , • " "
Measured Relationships Between Load and Stirrup Strain for Specimens T13, T14, T16 and Tl8 •••
Measured Relationships Between Load and Stirrup Force for Specimens T13, T14, T16 and T18 , • ~
Measured Relationships Between Load and .Stirrup Force for Specimen T15 •• " • 0 • 0 •• 0 •
Measured Relationships Between Load and Stirrup Force for Specimens T10 and T12 0 •
Development of Cracks in Specimens T14~ T16 and T18
Measured Crack Width at Points Along !l-Beams~ 0
Measured Relationships Between Load and Crack Length for !-Beams~ " " • ~ . ~ ~ •
Variation of the Rat!o of Measured Crack Width to Measured Crack Length with the App1 ied Load in
94
95
96
97
98
99
100
1 01
1 02
1 03
104
105
106
107
I -Beams ~ 9 !O • ~ 'I • • " .. • • • • 0 • • 0 " • ." 1 08
Measured Relationships Between Stirrup Force and Crack Width for Specimens Reinforced with One No.. 2 Bar ~ • • 0 '/ • " " " • " '/ " " 0 • • • • • 0 1 09
~ .. '."\
.. ~":\
',.~ -;,.'
Figure No.
5.20
5.21
5.22
5.24
5.26
A.2
A03
Ao4
AoS
Ao7
A,8
A.9
-IX.';'
M eC3 sur ed' ReI a t 1 on s h r p s Be twe enS t i r r u p For c e and Crack Width for Specimens Reinforced with One No. 7 US SWG 0 '. • • '0 • 0 0 .~ 0'.' .':. • • • • '. • •
Measured Relationships Between Stirrup Force and Crack Width for Specimens ,Reinforced with Two N o' • 2 B a 'r s '. 0 0 • 0 '0 '. • • 0 • • • • ..'. 0 • • • •
Measured Relationships Between Bar 'Force and SI ip in Bond Tests for Noo 2 Bars •• 0 0 ••••••••
Measured Relationships Between Bar Force and SI ip in Bond Tests for No.', 7 USSWG • 0 • • • • ••
R~lationships Between Sti~r~p Fo~c~' and C~ack Width Based on Uniform Unit Bondo 0 •• 0 0 •
Comparison of the Measured vs. Calculated Variation of the Load, Stirrup Force and Crack Width for Specimens Reinforced With Bars.
Com~arison of the Measured vSo Calculated Variation of the Load, Stirrup Force and Crack Width for Specimens Reinforced with Wires. 0 •
Cross Sections of Beams Used in Design Examples
Maximum Transverse Stress 0 0 0
Comparison of Transverse Stress Distribution by Iyengar, Guyon and Bleich 0 o. 0 •
Effect of Load Distribution - Goodier
Transverse Stresses by Ziel inski and Rowe
Effect of Loading Plate on Transverse Stresses (Z i eli ns k ian d Rowe). • • • • • 0 • 0 0 • • • 0
Influence of the Size of the Loading Plate - Guyon.
Force on Sections Parallel to Axial Section
Transverse Stresses by Hiltscher and Florin 0 o • v
Typical Variation of Stirrup Strains Along Beam by Marshall and Mattock ••• Q •• 0 ••• 0 •• , • ,
11'0
111
112
113
114
115
116
117
140
141
142
143
144
145
146
147
148
Figure No.
B. 1
B .. 2
B'I3
B~4
8 .. 5
8.6
c. 1
C.2
C.3
N
-x-
LIST OF FIGURES (Continued)
Nominal Dimensions of Test Specimens.
Detai 1s of Reinforcement.
Twin Pull-Out Specimen.
Typical Gage Pattern •••
Photographs of Beam and Twin Pul I-Out Specimens
Test Setup ... O~.'f1.'."
Superposition of Loadings for Numerical Solutions.
Biharmonic Finite Difference Operator.
Flow Diagram .•.
Page
158
159
i60
16.1
162-
163
168
169
170
-1-
1 0 I NTRODUCT ! ON
1 .. 1 Introductory Remarks
Considerable attention has been paid to the problem of anchorage
zone stresses in recent years.. Surveys have reported that more than half of
the prestressed concrete girders inspected had visible longitudinal cracks
in the end blocks. The majority of the authors concerned with the question~
h~s treated the problem in terms of elastic stresses in homogeneous bodieso
There has not been a general des~gn method of transverse reinforcement, satis-
factory for the use in the design office or for the inclusion in a code. A
review of the relevant references constitutes Appendix A of this studyo
The analytical and experimental investigation~ reported in this
work, resulted in a simple design procedure that bypasses the use ofa hypo-
thetical elastic stress distribution.
The anchorage zone (or lead-in zone) of a prestressed concrete beam
is the portion of the beam where the prestressing forces disperse into the
beam to a section where the stresses are linear. Due to the curvature of the
flow of the prestressing forces into the beam~ there are transverse tensile
stresses of considerable magnitude,,'Without reinforcement 9 .these stresses
induce large cracks in the beam and may thus be detrimental to the ~erformance
of the beam ..
1.2 Object and Scope
The main object of this study was the investigation of the
behavior of the anchorage zones of prestressed concrete beams after the first
crack has formed.
The first part of the work centered around the problem of crack
initiation" A series of tests (three rectangular and seven I-beams) was I
-2-
conducted to study the strain distribution and the propagation of cracks in
specimens without reinforcement. A finite difference solution was made to
obtaIn the elastic stress distribution in a specific case.
The second part of the work was concerned with the arrest of the
longitudinal crack with the purpose of developing a procedure for the design
of transverse reinforcemento A series of tests (14 rectangular and 11 I-beams)
was conducted to study the effect of reinforcement on the propagatIon of cracks
and to corroborate the analytical method. The basic differences between the
behavior of anchorage zones of rectangular and I-shaped sections was examine~o
A few bond tests were also made to obtain force-sl ip relationships for the
reinforcement used in the beams.
A large part of the previous experimental work had been done on
concentrically loaded specimens, in which case the highest transverse stresses
occur along the 1 ine of the load .. In the present investigation 9 high
eccentricity was employed to study the critical zone away from the load.
The design specifications developed in this investigation are
presented in Chapter 6~ including some illustrative design examples 0
1.3 Acknowledgments
This study was carried out as a part of the research under the
Illinois Cooperative Highway Research Program Project IHR-l0, !!Investigation
of Prestressed Reinforced Concrete for Highway Bridges pll The work on the
project was conducted by the Department of Civil Engineering of the University
of III inois in cooperation with the Division of Highways9 State of li1 ino!s~
and the U. So Department of Commerce, Bureau of Pub1 ic Roads.
On the part of the UniversitY9 the work covered by this report
was carried out under the general administrative supervision of W. L. Everitt~
---A;
-3-
Dean of the Col lege of Engineering~ Ross J. Martin, Director of the
Engineering Experiment Station, N. fit. Nev"mark, Head of the Department of
Civil Engineering, and Ellis Danner~ Director of the Illinois Cooperative
Highw~y Research Program and Professor of Highway Engineering.
On the part of the Division of Highways of the State of Illinois,
the work was under the administrative direction of R. R. Bartelsmeyer, Chief
Highway Engineer~ Theodore Fo MorT, Engineer of Research and Planning, and
W. Eo Chastain= Sr., Engineer of PhysIcal Research.
The program of investigation has been guided by a Project Advisory
Committee consisting of the foilowfng:
Representing the I Ii inois Div!slon of Highways
w~ Eo Chastain, Sr., Engineering of Physical Research,
III inois Division of Highways
w. J. Mackay, Bridge Section, Bureau of Design, 111 inois
Division of HIghways
Ce E. Thunman, Jr., Bridge Section, Bureau of Design,
111 inois Divis ion of Highways
Repre~enting the Bureau of Publ ic Roads
Harold Al len, Chief, Division of Physical Research,
Bureau of Publ ic Roads
E. L. Erickson~ Chief, Bridge Djv[s!on~ Bureau of
Pub 1 i c Roads
Representing the University of III inois
C. Ee Kesler, Professor of Theoretical and App1 ied Mechanics
Narbey Khachaturian, Professor of Civil Engineering
Fred Kellam, Bridge Engineer, Bureau of Publ ic Roads and George S.
Vincent, Chief, Bridge Research Branch, Bureau of Pub] ic Roads, also
,~ '. ~
- ~ ,~
• • 1 ,: ~ ~
-4~
participated in the meetings of the Advisory Committee and contributed
mater~al ly to the guidance of the program.
The investigation was directed by Dr. C. P. Siess, Professor of
Civil Engineering, as Project Supervisor and as ex-officio' chairman of the
Project Advisory Committee. Immediate supervision of the investigation was
provided by Dr. M. A. Sozen, Professor of Civil Engineering, as Project
Investigator.
Acknowledgment is due to W. A. Welsh for his invaluable assistance
in the conducting of the experiments.
This report was written as a thesis under the direction of Profess
M. A. Sozen.
1.4 Notation
a = height of the loading plate
A cross-sectional area of rectangular beams
A = cross-sectional area of one reinforcing bar s
b width of rectangular cross section
c = distance between longitudinal section and the bottom of
the beam
e distance between the resultant prestressing force and the
et
E
f I
C
f s
F
bottom of the beam
= eccentricity of the total prestraining force
= modu1us of elasticity of the stirrups
= compressive strength of concrete determined from 6 by 12
control cyl inders
steel stress in stirrups
force in stirrup
-5-
F = two dimensional Airy stress function
FT total stirrup force
g unit bond defined as force per unit length
h height of beam
T = designation of beams with I-shaped cross section
m
crack length
ratio of g and ~fl c
M = moment induced by prestressing forces on transverse sections
M the maximum unbalanced moment caused by forces acting on a m
free body bounded by a transverse section and a longitudinal
section
P resultant of a group of prestressing forces immediately
after release
r :;:: -radius of gyration for the gross plain section
R designation of rectangular beams
s = slip of bars in pull-out tests
w crack width
x transverse coordinate axis
y longitudinal coordinate axis
z = distance between the e~d of the beam and the centroid of
the areas of the stirrups that are within h/2 from the end
1 = shear stress in an6horage zone xy
rr :;:: normal stress on longitudinal planes x
rr y
normal stress on transverse planes
:;:: Poisson's ratio
-6-
2. ANALYSIS OF ANCHORAGE ZONE STRESSES
2.1 Introductory Remarks
The computed elastic stress distribution in an end block is presented
in this chapter. There are numerous solutions available but the agreement
among them is not very good. Different authors have used different approxi-
mat ions and assumptions. A finite difference solution was made in this
investigation to attempt to establ Ish the correct stress distribution.
The elastic stress distribution is affected by the eccentricity of
the loads the distribution of the appl ied forces in the three principal
directions with respect to the axis of the end block~ and the geometry and
material properties of the end block.
When the load is concentric, the tensile stresses along the 1 ine of
the load dominate. As the eccentricity increases, the stresses away from the
1 ine of the load and near the end face increase. In this investigation~
solutions were obtained for large eccentricities to explore the latter case.
202 Analysis of Stresses
The analytical investigation that was carried out to determine the
stresses in a specific case is described in this section. The results wil1
be compared with those obtained by others in Section 2.4.
The region considered had ~ width of 12 inches. A single eccentric
load was appl ied at 4,,5 in. from the center 1 ine. It was spread over a
d i ~ tance of 105 in 0 The] oad was cons i dered to be a 11 ne ·1 oad norma 1 to the
plane of the r~gion, that is, the prob.lem was treated as two-dimensiona1.
Homogeneity, isotropy and 1 inear elasticity were assumed for this solution.
The consequences of these assumptions are discussed in Chapter 4 and in
Append ix A 9
-7-
The solution was based on the two-dimensional Airy stress function
method. The stress function has to satisfy the biharmonic differential
equation v4F o throughout the region~ The stresses are given by the second
derivatives of the stress functiono
The region can be seen in FIgo 20 I where the boundary conditions are
also shown~
All existing solutions indicate that St. Venant1s principle holds~
that is, the stress distribution reaches the one predicted by conventional
methods at a distance equal to the depth of the section v or sometimes less.
In this investigation a larger region was considered to confirm the principle.
The width of the region was 12 in. and the length was 20 in. At this distance
from the end face the longitudinal stresses were taken to be equal to the
1 inear stress distribution obtained from elementary methods and the shear
stresses were put equal to zeroo Hence,
and
F xx ~ y
F xy ~ xy
4.5 1 2 ~ x + 0 5
o
where the subscripts on F indicate derivativeso
The two integration constants were ignored since they do not
influence the second derivatives of the stress function. 'Thus~
F
where P = A = 72 has been used for simpl icity~
On the longitudinal boundaries of the region F = ~ = 0 and yy x
F T = o. Also the general boundary conditions of the theciry of xy xy
-8-
two-dimensional elasticity require that on a side paral leI to the -,-
x -ax is ( 1 ) ~ "
j r'.-r ds xy
F" 'y and J cry ds F
x
Therefore? on free boundaries F and F are constant. At the x y
corners the values, as calculated on the two sides~ must agree. This yields
relations to evaluate the integration constants.
The boundary values of the stress function and its normal derivatives
are· show n i n Fig. 2. 1. Wit h the s e val u e s know n ~ the s t res s e sin sid e the
region can be computed by one of several methods.
In .the present investigation 9 the biharmonic differential operator
was replaced by the corresponding finite difference operato~. The region was
divided Into 1/2 by 1/2 inc grid systems, Yielding 897 internal grid points.
The value of the stress function at grid points on the boundary is calculated
from the functions shown on Figo 2.10 The normal derivatives give the
necessary relationships between the imaginary grId points !mmediately outside
the boundary and grid points immediately inside ito The resulting system
was solved by iteratlono The computation and the computer program are
described in Appendix Co
2.3 Results of Analysis
The computer calculated and printed the transverse~ longitudinal and
shearing stresses and the transverse strains for a Poisson!s ratio of 0.100
The YoungUs modulus was taken as 3~9009000 psi 0 For some points in the
critical parts of the region, the principal stresses were calculated to
Numbers in parentheses refer to entries in the List of References.
1 ·l
-9-
obtain a quantitative idea of their variation from the longitudinal and
transverse stresseso Solutions were also obtained at points of maximum
stress in the critical regions for values of Poissongs ratio equal to 0015
and 0.20.
Contours of equal transverse stress are plotted in Fig. 2.2. The
tension and the compression zones are indicated. The tensile stresses under
the load occur at a distance from the end face and are called bursting stresses
while the tensile stresses at the top of the region are called spall ing
stresses.
In the case considered in the present investigation, the spall ing
stresses are higher than the bursting stresses and the first crack is expected
correspondingly at the surface near the centerl ineo When the eccentricity
decreases, the bursting stresses become relatively more importanto
The longitudinal stresses on transverse sections and the transverse
stresses on longitudinal sections wil 1 be presented in the next section.
The total tensi 1e forces on longitudinal sections are plotted in
Fig. 203 separately for the bursting and spall ingstresses o it can be seen
that the maxim~m values of these forces due to the two kinds of stresses are
about equal. However, the spall ing stresses are more concentrated as shown
in Fig. 2.2.
The centers of gravity of the tensi le stresses on longitudinal
sections are also shown in Figo 203. The forces are close to the end face
in the spall ing zone while they are at a distance from the edge in the bursting
zone 0
The study of the effect of the variation of PoissonDs ratio showed
that it has considerable influence on the transverse strains on1y close
under the load where the longitudinal stresses are high. The maximum bursting
-10-
stresses, about one inch under the load, are changed by about 20 per cent
due t 0 a v a r ~ a t ion 1 nth e Poi s son ! s f' a t 1 0 f r 011 0 0 ! 0 toO 0 1 5 ( see Fig 0 2 0 4) •
This difference is larger where the transverse stresses are small and, hence,
(he effect of the longitudinal stresses become more importanto The conse-
quence of the alteration of Poissonijs ratio fs neg) igible in the spall ing zone
where the longitudinal s(resses are small.
The principal stresses differ appreciably fro11 the transverse and
longitudinal stresses only in reglons where the latter stresses are about
equal (and small) and opposite in sign~ and the shearing stresses are large.
This can be seen from the Mohr!s circle of stresseso These conditions exist
near the top of the region, about one inch away from the I ine of the load.
The principal tensile stress 1s substantia] ~y larger than the transverse
stress at few points onlyo The increase is 100 per cent half an inch from
the edge, between the load and the cen te r 1 i ne. Howeve r, the s t res s es are
small there, hence the Increase js not sjgn!ficanto At points of large
stress, the difference is less than 2 per cent.
More informat!on w~l 1 be given about the stress distribution in
the follovJing sectJon and in the next chapter.
2.4 Comparison with Results Obtained by Var!ous ~nvestigatots
The most comprehensive sets of curves and tab]es were g[ven by
Guyon (2)0 His results are used by most des~gners but so;ne researchers have
questioned his approach. Recently, Gerstner and Zienkiewicz verified GuyonDs
calculations by using a different method of calculation (3) and iyengar
c6nfirmed his results at least for the symmetric case using different
boundary corrections (4).
i
.1 j
~.;.;J
-11 -
The longitudinal stress distribution from the finite difference
solution is compa~ed with Guyon's results in Fig. 2050 The agreement is
good. The stresses close to the unloaded corner of the region are smal I, and,
therefore, the solutions are probably less accurate ther~. T~e ~rinciple of
St. Venant 1s demonstrated.
The transverse stresses are shown in Fig. 2.6. The stresses cal
culated by Guyon are smaller than those resulting from the finite difference
solution. Part of this' difference is due to the fact that the plots of
Guyon in Fig. 206 are for a concentrated load while' the finite difference
method considered distributed load~ The shape of Guyon's stress curve under
the load is not known with good accuracy since interpolation does not yield
the maximum values that occur between publ ished values. Also, the maximum
compressive stress at the end face (under the load) is not given.
Most other 'solutions differ considerably from the above results."
Bleich1s boundary corrections were not as good as Guyo~!s and hence Bleichus
stresses are not correct. 'Th'emethod by Magnel'gives reasonable stress
distribution only along the line of the load' (F:ig. 2.7). Along other lines
the stress distribution does ~ot resemble a tubic parabola'that'Magne)
assumed. It can' be seen that the length of the "lead-in; zone" in his
analysis must be assumed 60rrectly. At L/4from the 16ad~d end, the stresses
are z e r 0 • The t ran sf e r 1 eng t h s h ou 1 d be at 1 e a s t 8 i now hie h' w ou 1 d put the
point of zero stress at a distance of 2~5 in. from the loaded end; The
computer solution indicated 0.7 in. for this distance~ Al~o, the position
of maximum tensil~' stress, (fixed at L/2 in Magnel Dsa~proa~h) is m~~h iho~ter
in the finite differenc~ solution and in other, solutions mentici~ed above.
To get a,stress distributio~, similar to those given by the Ilexactil methods,
Magnel1s'method requires a lead-in length that is unreasoriabfyshort~'
-12-
The principle of partitionlng (symmetrical prism method), advanced
by Guyon, results in very good approximations to the bursting stresses. This
method considers an imaginary prism llcut" from the eccentrically loaded block
in such a way that the load acts concentrically on the prism. The widths of
the prisms are determined by the distances to the nearest boundaries or by
the distance to the neighborIng prIsm. There are many solutions aval!able for
the axially symmetric case and the agreement among them is good. The stress
distribution calculated by the symmetrical prism me.thod is canpared with the
finite-difference solution in Fig. 2.8. It can be seen that in the case where
the actual distribution of the load is taken into account, it gives a good
approximation. However~ this method does not offer any information about
the spa 11 i ng stresses.
Most authors emphasize the importance of the size of the loading
plate. This is especially justified in the case of a concentric load. The
spall ing stresses (primarily when caused by eccentric loads) are not as much
affected by the relative size of the loading plate~ !n this investigation
the eccentrici ty was large and the spall ing stresses controlled. Hencel)
the size of the loading plate was not considered to be a.major variableo
There are significant differences between the magnitude and
distribution or transverse tensile stresses along the 1 ine of the load for
concentric and eccentric loads. A specific comparison is shown in Fig. 2.9.
The distribution of transverse stresses for concentric loading is taken from
Reference 4. The distribution for an eccentricity of O.375h is obtained
from the finite difference solution. The curves in Fig. 2.9 show that the
depth of the tensi le zone for eccentric loading is sma1 ler than that for
concentric loading while the maximum stress is larger for eccentric loading.
The total tensile force acting on the 1 ine of the load is O.12P for eccentric
loading and O.23P for concentric loading.
-13-
3. RESULTS OF TESTS ON SPECiMENS WITHOUT REiNFORCEMENT
3.1 Introductory Remarks
In methods of design based on elastic conditions~ the tensi 1e
forces in end blocks are calculated from a theoretical stress distribution
and reinforcement is provided to res 1st all or part of this force. There are
three drawbacks to this approach:
(a) There is no rIgorous solution for stresses in the anchorage
zone. !n relation to design, this is a minor disadvantage, since the
differences in the magnitudes of the tensi 1e force based on different solutions
are small compared with other uncertaintie~ involved.
(b) There is inelastic actron in the end block almost immediately
upon appl ication of the load and certainly in advance of cracking.
(c) The reinforcement cannot act effectively befbre cracking.
After cracking, the force distributions based on elastic analysis of a
continuous medium are inval id~
The tests presented in this chapter were 6arried out to serve two
purposes: to compare the,strain di~tribution in a concrete e~d block with'
distributions based on elastic analyses and to study the conditions following
the initiation of the crack.
Two kinds of specimens were tested: rectangular beams and I-beams.
The dimensions of the specimens are,given in Appendix B and are shown in
Fig. B 0 1 0 The ave ra'ge concrete s t'reng th was ab ou t 5 OOOps i ~ The ' load i rig
, i arrangement is sketched in Fig. B.60 The ~pecimens we~e tested to failu~e
or up to 50 kips of 1oad 9 whichever came first.
Three rectangular and seven I-beams were tested without reinforce-
menta One of the beams (17) cons isted of the bottom hal{ of the regular
section (inverted T-section).
-14-
In all tests the cracks were observed using a magnifying glass.
Gages were mounted on the sides s along longitudinal lines, on three rectan-
gular and three I-beams. A typica1 gage pattern on a rectangular beam is
shown in Fig. 8.4. The lIne of gages at 3.5 in. from the center-l ine was
not employed on I-beams. The gages were on the ~!test end" of the beams, that
1s, where the height of the bearing area was 105 in.
The behavior of the specimens without reinforcement is discussed in
the next section in terms of load-strain curves, strain distributions and
cracking. There were no visible cracks at 20 kips~ hence the strains will
be studied at 10 and 2~ kips. The measured strains will be compared with the
computed values in Section 3.3.
3.2 Behavior of Specimens without Reinforcement
(a) Rectangular Beams
The transverse stresses in the spall ing and bursting zones were
studied by strains measured along longitudinal 1 ines~ In part!cular3 the
1 ines along the axis of the load and along the center 1 ine were used to
compare some aspects of the behavior of the two zoneS4
The study of the change of strains at certain points with the
applied load discloses the initiation of inelastic action. Figure 3.1 shows
the variation of strains with load at points 005, 100, L5~ 200 and 300 in.
under the center of the loading plate in Specimen, Rl. it can be seen that
nonl inear response started at a load of about 15 kips. The first visible
crack occurred at about 24 kips. Probably there were microcracks at lower
loads as indicated by the high tensile strains,measured. It should be
noted that '~strainJl refers to the unit deformation measured over the length
of the strain gage which was 0075 in~ Measured strains of 0.0006 do not
:; ,j
,j
, J

-15-
necessari 1y indicate strains in the intact concrete 9 which must have
cracked at a strain less than 0.0002. This was 'reached at ab6ut 17 kips
of load. No cracking was noticed at this load under examination with a
magnifying glass.
The curves in FIg. 3.1 are representative for rectangular beams 9
Simi lar plots for Beams R2 and R3 are shown in Figs. 3.2a and 3.3a.
Figure 3.2b s'hows load-strain curves at points O.'S, 1.0~ 1.5 and
200 in. from the edge, along the center I ine of Specimen R20 The reversal of
strain must indicate cracking elsewhere in the specimen. First, the gage
nearest the edge reversed at about 14 kips, followed by the other gages in
turn, evincing the progress of cracking. The crack became visible about
005 in\' below th~ center line at a load of about 24 kips. Thus~ the gages
were near the crack on the top half of the specimen. The contr~ction indi
cated is attributable to transverse shrinkage stresses that are relea~ed when
the crack forms near the gage. The shrinkage stresses' are largest near the
surface of the beam~ hence the gage nearest 'the surface shows the largest
contraction. Similar curves for Specimen R3 are shown ih Fig~ 303b q
The comparison of Figs. 3.2a and 3.2b indicates 'that the cracking
in the spall ing zone had 1 ittle effect on the load-strain curves at points
in the bursting zone. This fact substantiates the principle of partitioning
given by Guyon (Sectio~ 2~4)o Since the bursting stres~es are not sen~itive
to the behavior of the spali ing zone~ the bursting zone can weI I be ~pproxi~
mated by cohditions in a symmetric~rismo
Representative load-strain curves at points alorig the 1 ines 100 in.
from the I ine of the load and along aline 1.5 in. fro~the center Tine are
shown in Fig. 3.2co The strains off but near the 1 ine of the load are small
and show no definite trend. The gages off the I ine of the center line
-16-
registered a sudden increase of strain at about 16 kips when a crack mus.t
have formed ac ros s the gages"
The distribution of strains along longitudinal 1 ines will be
stu d ! ed 1 ate r i nth i s c hap t e r 0 Rep res en tat i ve c u rv e sin Fig. 3. 4 show t hat
the transverse strains along the i ine of the load are distrIbuted in the
manner of bursting strains. A maximum value is reached at about one inch
from the end and the strains decrease toward the end of the specimen. The
strains along the center 1 ine are typicai of spalling strains. The transverse
strains increase steadily toward the end of the beam. These curves were
measured in Specimen R2. Similar curves will be shown at the end of this
section and in the next section.
The development of cracks was careful1y observed in all testso
There were three types of cracks: those in the spall ing zone started at
about mid-height at the end face of the specimeno The second kInd of cracks
initiated under the load at a distance of one to two inches from the loaded
edge. The third group of cracks were flexural cracks at the top of the beam
and were of no interest in this investigation. They were controlled by a
Noo 3 bar placed near the top of the specimenso
In Specimen R3 (as in Specimens Rl and R2) the first crack appeared
505 in" from the bottom starting at both ends and extending 3 in. (Figo 305)0
This occurred at a load of 24 kipso One flexural crack also started near the
center of the beam at the top. The progress of the cracks is shown in this
figure. The failure was due to a wedge type of bearing fai1ure under the
1.5 in. bearing blocko There was no observable crack under the loading
plate before this occurred. The measured strains were the highest in this
region. It is probable that the gl~e and the strain gages prevented the
vision of cracks.
-17-
It can be seen that there is symmetrical behavior. On the left
end of the beam (as shown in Fig. 3.5) the loading block was 1.5 in. high
(iltest end ll) and 3.0 in. on the right end. The size of the loading plate
influences the stresses under the load but has little effect away from the
load. The bearing failure is induced under the smaller loading block ..
(b) I -Beams
The s t ra ins were measu red in two I -s haped beams. I n order to chec k
the participation of the top part of the beam, a half 'I'-beam (inverted T-shape)
was also tested.
The load-strain curves for I-beams give information simi lar to that
of rectangular beams, as discussed above. The load-strain curves shown in
Figs. 3.6a and 3.6b for Specimen T2 are representative for I-beams. In
Fig. 3 .. 6a the load-strain curves are plotted for points along the line of the
load •. Nonlinear respons'e started about 7 kips. Similar curves for points
along the center,,1 ine and along aline 1.5 in. from the center' 1 ine are
plotted in Fig~ 3.6b. There is no reversal of the strains along the center
1 ine'shown in Fig. 3.6b, implying that there was no longitudinal cracking in
the specimen up to a load of 20 kips~ The first visible crack occurred at
about 30 kips. The corresponding sets of curves ,for Specimen T3 are
plotted in Figs. 3.7a and 3.7b. The observations made above hold in general
with the exception that in this beam the crack became visible at 15 kips
that corr~sponds to the early reversal of strains alon~ the center 1 ine as
can be noted in Fig. 3.7b. (The difference in cracking load was caused by a
manufacturing defect discussed later in this section). Since the strains
were very small at points 1.5 in~' below the center· 1 ine, the values along
t his ,1 i n e i n Fig.. 3" 7b are err a tic.
-18-
Specimen TO was a half I-beam or an inverted T-beam. The strains
were measured along the 1 ine of the load. The load-strain curves are shown
in Fig. 3.8. In this case the largest strains were measured at the gage
0.5 in. from the edge whi le in the regular I-beams the largest strains were
measured farther from the end. There is non1 inear action starting at ab~ut
10 kips. This can not be due to cracks in the web, since in this specimen
there was no active web.
The transverse strains along the center line of Specimen T2 are
shown in Fig. 3.9. The distribution resembled the spal ling stress distri-
bution. The strains along the line of the load (shown in Fig. 3.10) followed
the typical distribution of bursting strains.
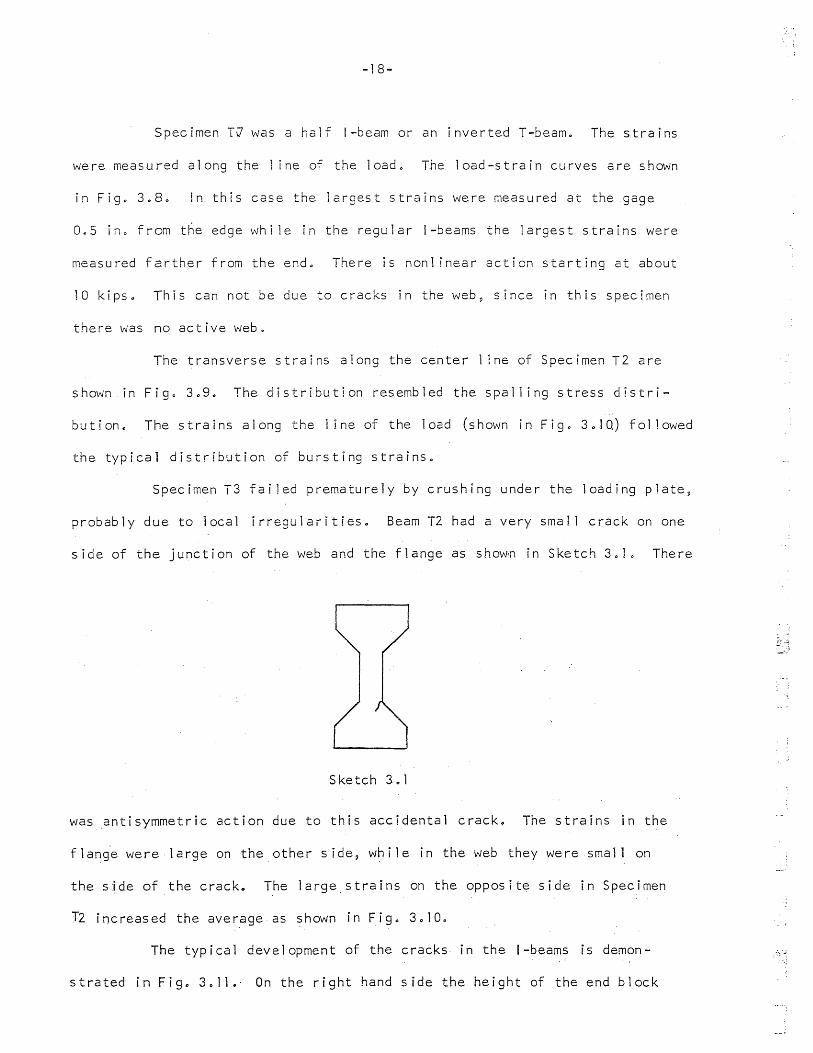
Specimen T3 failed prematurely by crushing under the loading plate~
probably due to local irregularities. Beam T2 had a very small crack on one
side of the junction of the web and the flange as shown In Sketch 3.1. There
Sketch 3. 1
was anti symmetric action due to this accidental crack. The strains in the
fla~~e were large on the other side, while in the web they were small on
the side of the cracko The largestrains on the opposite side in Specimen
T2 increased the average as shown in Fig. 3.10.
The typical development of the cracks in the i-beams is demon-
strated in Fig. 3.11.- On the right hand side the height of the end block
-19-
was 3 in. and, therefore, it covered half of the tapered part of the flange.
This caused the longer cracks in the right-hand end of the beam. The crack
occurred at 505 in. from the bottom In Beams T3, T4, T5 and T6 and at
4.5 in. in Specimens Tl and T2.
At high loads the crack progressed. 15 to· 20. in. from the ends. To
get an idea of the participation of the top part .of the beam, Specimen T7 was
tes ted. It was a half I-beam (inverted T-shape) with strain gages placed
along the 1 ine of the load. The strains are plotted in Fig. 3.12. Again,
there was considerable nonlinear behavior. The distribution of strains
resembles that for spalling strains s incethere is no measurable decrease in
the tensile strains near the end face. The compression zone was evidently
. smal 1 enough not to be detected by the first gage that was 0.5 in. from the
edge.
(c) Comparison of the Behavior of the Specimens
Some important conclusions, val id for single loads acting ih the
flange, can be drawn from the comparison of the behavior of the above
specimens~ The main question is the difference between the behavior of the
rectangular and I-beams. Is the I-beam much weaker than the rectangular
beam because of the smaller section of the web that may fail sooner under
the spall ing stresses? The comparison of the transverse strains and the
crack patterns for the rectangular. and I.,.beams is discussed in the following
paragraphs~
The measured transverse strains along the 1 ine of the load for
the rectangular beam R3 and the I-beam T3 are compared in Fig. 3.13. The
difference in the strains is small, especially at· higher loads. The larger
increase of transverse strains in the I-beam is due to the nonl inear response
-20-
that started earl ier in the i-beam than in the rectangular beam (as it was
seen in Figs. 3.1~ 3,.2a~ 3.3a, 3.6a and 3.7a)0 The faster increase of
strains in I-beams cause the diminishing of the difference that can be
observed in Fig.~3013. The explanation of the earl ier nonl inear resporse
of the I-beam as compared with the response of the rectangular beam will be
given later in this section.
The measured transverse strains along the center 1 ine for Specimens
R3 and T2 are shown in Fig. 3.14. The strains in the rectangular beam are
somewhat higher, but the difference is small. The strains did not increase
at the end of Beam T2 at about 20 kips of load. This indicates cracking
near the gages as it was discussed earlier in this section in connection with
the consideration of Figs. 3.2b and 3.3b.
The development of cracks was different in the rectangular and
I-beams (Figs. 3.5 and 3011) .. There were more flexural cracks. in the
rectangular beam than in the I-beam. The tensi Ie b~nding stresses on the
top surface are smaller in an I-beam. The lengt~ of the cracks in the web
were of similar magnitude, except that at the right-hand end of the I-beam,
where the loading plate covered part of the tapered part of the flange, the ".}
cracks· were longer. This shows that if part of the loading acts in theweb~
there is greater participation of the web in carrying the load.
The comparison of transverse strains and the crack patterns in
rectangular and I-beams has shown that the pres~nce of the web does not . !
weaken the I-beam if the load acts in the flange. The smaller forces in the '". [
web of an I-beam as compared with the web portion of a rectangular beam can
be ~xplained by the diffe~ent manner in which the load disperses into the '. "
main part of the beam. In a rectangular beam the stresses flO\tJ at a rapid
-21-
pace into the Ilweb il portion of the specimeno The upmost of these stress
flow trajectories becomes almost vertical at a point close to the edge of
the end block. This results in larger stresses in the area around the
mid-beight of the rectangular beam than in the'web portion of the I-shaped
block. In an I-beam most of the force is confined to the flange. As a
result of this concentration~ the web portion of the end block close to
the end face is stressed less than the corresponding area of the rectangular
beam. The curvature of the trajectories is small~ hence the transverse
stresses are expected to be smaller in I-beamso
This diffecence in response explains the small difference between
the transverse strains in rectangular and I-beams (Figs. 30i3 and 3.14)0
The strains in the I-beam were smal1er~ except at higher loads when~ due to
cracks in the spall ing zone, the web portion of the rectangular beam
(without reinforcement) could not carry the extra force that caused the
differenc~ in strains at smaller loadso Thus, in the cracked state the
responses of the two kinds of beams become similar and 9 correspondinglY9 the
strains in the cracked beams were almost equal.
The longer cracks on the end of I-beams where the loading plate
was larger are due to the fact that greater part of the load goes into the
web. Thus; C~ this end the behavior is between that of rectangular and
I-beams.
The approximately equal strains in the web portion of the rectan-
gular and I-beams correspond to the smaller forces in the web of i-beams.
The comparison of forces will be given i~ Chapter 5 in connection with the
discussion of the tests on beams with reinforcement.
Comparison:,of::the strains in Specimens T3 and T7 (half beam)
shows that the distributions of transverse strains along the 1 ine of the
-22-
load are similar in the two beams~ Hence~ the flange can be considered to
act independently from the web for the purpose of analyzing bursting
stresseso The behavior of the flange is not influenced much by the presence
of the web if the load acts in the flange. This suggests that the symmetrical
p r ism met h adi s f e a sib Ie.
3.3 Comparison of Analytical and Experimental Results
The measured strains follow the theoretical distribution of bursting
and spall ing strains in generaL The strains along the 1 ine of the load
(bursting zone) reach the maximum at a distance of one to two inches from
the end and indicate that there is a compression zone under the load. The
measured strains along the center ·1 ine increase toward the end face, agreeing
with the theoretical distribution of spa] ling stresses.
The measured strains along the 1 ine of the load are compared with
the results of the finite difference solution in Fig. 3015. The two bands
for the finite difference solution represent strains calculated using two
sets of values of the modulus of elasticity and Poissonis ratioo I f Poi s s on IS
rat io is changed from 0.10 to 0.20, the maximum strain (47 x 10-6 ) will
increase about 34 per cent (to 63 x 10 -6) 0 The actual val ue of Poissonss
ratio is between the above values, hence the va ria t i on of this parameter
may cause about 15 per cent change in the strains.
One of the curves in Fig .. 3.15 represents the results of the
finite difference solution using 3,800,000 psi for the modulus of elasticity.
This is about the value estimated for compressive stresses. In tension,
however, the modulus of elasticity becomes considerably smaller with
increasing stresses~ The maximum transverse tensile stress at 10 kips of
load is about 100 psi. At this stress the modulus could reduce by as much
-23-
as 50 per cent. Using this value as a conceivable I imit9 the strains are
plotted for a modulus of elasticity of 1,900~000 psi in Fig. 3.15. ·The
combined effects of the changes of the modulus of elasticity and Poissonis
ratio may change the maximum strain from 47 x 10-6 to 126 x 10-6 •
The measured transverse strains fail between the two sets of values
obtained from the finite differe.nce sOlution. SInce the two sets represent
probable extreme values, the me.asured strains agree reasonably well with
the results of the finite difference solution. More information is needed
about the basic behavior of concrete in tension~ especially under sustained
loads~ to permit good estimation of the modulus of elasticity.
Measured transverse strains along the center, line of the beam are
compared with the resuits of the finite difference solution (for a Poisson1s
ratio of 0 .. 10 and a modulus of elasticity of 3,800,OOOpsi) in Figo 3.16.
The measured strains fol low the calculated ones but are somewhat largero A
small decrease of the modulus· of elasticity would bring the calculated
strains to close agreement with the measured values. Since the compress.ion
in the longitudinal direction is small , the effect of Poissonis ratio on
the strains is small in the spall ing zone.
It was found in these experiments that minute initial I,rregularities
(cracks 1 voids) may have substantial effect on the strain distribution in
the hig~ly stressed regions.
The microcracks in the bursting zone are distributed and cause
general increase of strains. ~n the spal ling zone 9 due to the concentration
of stresses~ one large crack forms.
-24-
40 ANALYSIS OF END BLOCKS W~TH TRANSVERSE REINFORCEMENT
401 introductory Remarks
The object of this chapter Is to analyze the forc~s and the
extent of cracking in reinforced end blocks in order to develop a method of
arresting cracks due to transverse stresseso The presence of the crack has
to be admitted a priori when the action of reinfor6ement is investigatedo
A common method of designing reinforcement for end blocks is to
compute the tensile stresses and forces accordi.rig to some elastic solution
and then to provide steel at an arbitrary working stress to carry the total
tensile force or part of ito This approach ignores some important aspects of
the behavior of end blockso There is inelastic action at relatively low
loads that changes the stress distributiono The concrete must be cracked
before the relnforcement comes into actiono The formation of a crack
invalidates the elastic stress distributiono An initial crack (for example~
at the junction of the web and the flange, as found in Beam T2 of the
present investigation) also modifies the elastic condi~ionso Even for an
assumed elastic case~ there is no general 1y accepted solution~ as it was
mentioned in Chapter 20 In addition~ the tensile strength of the concrete
under complex condi tlons is not known su'fficientlyo
The analysis presented in this chapter inve~tigates the conditions
!n a cracked end block in order to limit the length and width of the cracko
A method is presented that estimates the position of the first cracko The
equil ibrium of the free body bounded by the crack IS investigated in order
to estimate the internal forceso The ·relationship between the width and'
length of the crack and the stirrup is also examinedo
-25-
4.2 Equilibrium Conditions in the End Block
The equi 1 ibrium of a cracked end block:wi'th,.rectangular cross
section is considered. The admitted longitudInal crack and the inside end
face of the lead-in zone cut out the free body. The following quantities
enter the analysis: appl ied force, stirrup force, the length and width of
the crack and the dimensions of the end block.
The forces acting on the free body are shown in Fig. 4. 1 ~ The
c rac k and the app 1 i ed load a re at dis tances of "Cl! and 'Ie" f rom the bot tom of
the end block, respectively. The sketch on the top part of the figure
illustrates the beam with the free body marked in full 1 ines. The prism is
shown enlarged in the bottom part of the figure.
The appl ied force P produces a 1 inear stress distribution at a
distance L from the end. To maintain equil ibriu~,~there must be a moment M
and a shearing force acting on the top part of the prism. The moment is to be
suppl led by the tensile force T in the reinforcement and by the compression
C in the concrete. The height of the free body (that is the position of the
crack) will be determined from the cond~tion that on that longitudinal
section the moment will be the largest.
The moment on the longitudinal section is:
M if c > e
This moment (and, hence? T and C) 'changes with the height of the
free body (c). The moment takes extreme vaiues for the following two values
of c:
c 1 ;:: 3 (h - 2e) and for 3e < h
-26-
The first of these gives the maximum moment 3 the second gives
the zero moment on the top surface. The magnitude of the former is:
M = P ~ [
2
max "27
4h - ge 2
(h - 2e)
if 3e ~ h, the maximum moment occurs along the line of the load.
This moment can be obtained from the general expression of the moment by
setting e = c~ This yields
2 M = 2P e (h _ e)2
e h3 for c = e
Knowing the moment 9 the forces can be calculated if the distance
between the forces can be estimated. The position of the tensile force is
given by the center of gravity of the stirrup forces. The positron of the
compress lve force is not knowno ! t is somewhere between the end of the crack
and the end of the lead-in zone. This interval is small under working
conditions. In designing reinforcement for the end block~ the lever arm must
be estimated. The length and width of the crack is 1 imited by service-
abil ity requirements. If the position of the ca~pressjve force IS assumed
to be at the end of the crack~ the design will be on the safe sideo Thus~
the length of the crack must be knowno
The direct analysis of the length of the crack is "not practical
because of the many factors that are involvedo The stress conditions are
complex at the tip of the cracko The situation is sketched in Fig. 4020 A
moment and a force act on the left end of the bottom part of the beamo The
stirrups apply tensile forces on both ha lves ,of" t.hebe"am ~:The i t9P part
offers resistance by tensile stresses at the end of th~ crack and by
compression following the tensile zone. The situation somewhat resembles a
-27-
beam (the bottom part in this case) on elastic foundation. An analysis
along this 1 ineis elaborate and can give the length of the crack only
approximately. The spring constants~ that is the elasto-plastic resistance
_suppl ied by the top part$ is not known.. The top part of the beam also bends
and, thus, comp] icates the interaction of forces. The effect of shearing
stresses can not easily be considered. The propagation·of the crack is caused
by local, time-dependent effects. For these reasons the calculation of
crack length is not attempted in this study.. The numerical procedure that
would yield an approximation is too lengthy to be worth the unrel iable
results it may give.
In addition to the relationships between the moment on the free
body, the stirrup force and the crack length, the stirrup force and the crack
width must also be connected. Force-s~ ip relations can be obtained from
bond tests. The crack width will be twice the sl ip, assuming that the bar
is anchored similarly on both sides of the crack. The elongation of the
steel between the surfaces of the crack is small compared with the sl ip~
The analysis presente~ in this chapter involves relationships
between the loading and the position of the crack, the stirrup force and the
crack length and between the stirrup force and the crack width.· In order to
qbtain quantitative information, a series of teSts was made on reinforced
end blocks.
-2S-
50 RtSULTS OF TESTS ON SPECiMENS WITH REINFORCEMENT
Sol introductory Remarks
A series of tests were made on reinforced end blocks to ~ubstantiate
the method of analysis presented in Chapter 4.
A total of 14 rectanguiar and 11 i-beams were tested. The descrIp-
tion of the specimens and the method of testing are presented in Appendix B
of this study. The end blocks can be classified into three groups according
to the information obtained. The first group of specimens yielded most of
the data used in this discussion. These specimens al I had strain gages to
measure the strain in the reinforcement and dials to determine the crack
width, (from Rll to R17 and -from T13 to T1S~ inclusive.) The specimens in
,the second group either did not have sufficient instrumentation to yield
enough numerical data or were single exploratory specimens with prope~ties
different from that of the first group of beams (R5-RI0 9 T9-T12). The
specimens in the third group did not have No.3 bars on the top of the beams.
These specimens failed in bending at early loads (R4~ TS).
The forces in the stirrups were measured in most specimens.
Strain gages were mounted on the steel at a position where the crack was to
form~ as explained in Appendix Bo The crack width was meas~red by 0.0001 ~n.
dials at points along the beamo In some beams, mechanical gages were used
to check the 1 inear stress distribution. The instrumentation for the
spec i mens is lis ted i n Tab 1 e B. I •
Sa~e bond tests were also made to obtain the force-51 ip character-
istics of the bars used as reinforcement9 ~_~Twin p.L111-out~' specimens were
designed to simulate the conditions in the end block. The measured average
bond stress was very low. In order to investigate the effect of confinement ... ~ I. ~,
:.:.'1 I. '
-29-
on the slip of the bars, companion !!single pull-out" specimens were also
tested. Both kinds of specimens are described in Appendix B.
The behavior of the specimens with reinforcement is discussed in
the next section in terms of the variation of stirrups strains with the load
and in terms of the development of the cracks.
5.2 Rectanqular Beams
The group bf spec (mens (Rl1 :'R17) ~ that wi 11 be the subject of the
main part of the discussion, had eIther one bar at 0.5 in. or two bars at
0.5 and 200 in. from the end face. No.2 deformed bars or No. 7 USSWG were
used in the specimens. (Sometimes the wires will also be called "bars!', for
simp 1 i city) •
The variation of strains in the stirrups at 0.5 in. from the end
face in Specimens Rll, R12~ R14 and R17 is shown in Fig. 5.1. The relation
ship is linear up to about 16 kips of load when the wires started to y~eld.
The cracks began to open at about 10 kips (at 20 kips in Beam Rl4). The
difference between the strai"ns in the No.2 bars (having a yield force of
2.5 kips) and in the No.7 USSWG (yield force 0.80 kips) is not large.
The stirrup forces are plotte~ against the appl ied load for the
above mentioned four rectangular beams in Fig. 5.2. The wires yielded at
0080 kips~ the bars did not reach the yield stress. The forces carried by
the two kinds of reinforcement are about equal. The larger reinforcement had
the larger force. The opening of the cracks (at about 10 kips) had no
noticeable effect on the stirrup forces. The relationship between the
stirrup force and the crack width will be studied in Section 5.5. No
conclusion can be made now about the relative performance of the bars without
the consideration of the deformations.
-30-
Three rectangular specimens had reinforcement placed both at 005
and 200 ina from the end faceo The variation of stIrrup straIns with the
applied load for Specimens R8 and R15 are shown in Figo 5030: (R13 had
strains nearly equal to those in R8 and the curve for thIs beam !s therefore
om i t ted 0 ) It can be seen that the stirrups in different positions had about
equal strains. The two stirrups carried equal share of the transverse
forceo The strains in the wIres were about the same as in the barso The
for c es car r i ed by the s est 1 r r ups (i nth e s arne beam s) are show n i n F 1 g 0 5 0 40
The observations made above in connection with the discussion of the curves
in Fig. 5 p 2 also apply to this figure. The wires carried smaller forces than
the bars~ while the strains were about equal to those in the barso
The comparison of the beams with one stirrup with those with two
stirrups shows (Figs. 5.1 and 503) that the strain (before YIeld) in each of
the stirrups was about the same. The force in each of the bars or beams with
two stirrups was approximately the same as the force in single bars. This
difference must be associated with different crack lengths.
The strains and forces in the first group of rectangular specimens
(given in Section 5.1) have been presented above. Before discussing the
development of cracks in these beams~ the strains and forces will be considered
in some of the specimens of the second group. The steel strains were not
measured in the two specimens of the third groupo
The rectangular Specimen R7 had one stirrup (Noo 2 bar) at one
inch from the end. Specimen R9 had two No.2 bars at 005 and 3 ino from the
endo The variation of strains in these stirrups is shovm in Fig. 5050 The
strains in the single stirrup at 1 in. are about equal<to those in single
stirrups at 0.5 in. from the edge (see Fig. 501).
.J
-31-
The first part of this section has dealt with measured stirrup
strains in rectangular specimens. The performance of the end block is gaged
mainly by the magnitude of the crackse That will be examined in the next
paragraphs. The development of cracks and the variation of the crack width
along the beam is discussed here, while the relationship between the sti rrup
force and the crack width at the end of the beam is presented in Section 5.5.
The development of cracks in rectangular beams, representative of
the s pe c i me n s of the fir s t g r au p ~ is show n i n Fig s 0 5. 6 and 5. 7 • I t ca n be
seen that the No.2 single bars restricted the cracks more efficiently than
the No.7 USSWGo At higher loads there was about 50 per cent reduction in
the crack length. The appl ication of a second bar had a similar effect. The
same information is given in Fig. 5.8, where the crack length is plotted
versus the appl ied load. The crack length was measured with the help of a
hand magnifying glass, therefore the measurements were sQ~ewhat erratic.
The plots were smoothed out to give the relationships shown in Fig. 5.8.
The effect of the size and number of bars is clearly demonstrated. The
-influence of the reinforcement on the crack width will be discussed later in
t his sec t i on •
The variation of the crack w[dth along rectangular beams is shown
in Fig. 5.9 for a load of 20 kips. It can be seen that the effect of the
amount of reinforcement on the crack width is similar to that on the crack
length as noted aboveo
Both the crack length ];.and:.the:·cr.ackiwldth-w; .. increase with the
load •. The rate of increase depends on the amount of reinforcemento The
relative rate of increase of the crack width (one inch from the end of the
beams) and the crack length in rectangular beams is i11ustrated in Figo 5.100
it can be seen that up to a load of about 20 kips the ratio wit increases
-32-
1 inearly with the load. This means that the crack width increases faster
than the crack lengtho For the rectangular beams the ratio of crack width
-4 to crack length is O~ 11 x 10 . P + const., prov!ded that the appl led load P
is less than 20 kipso For larger loads the crack width for the smal lest
amount of reinforcement increases much faster than the crack length as the
load goes upo The rate of increase gets sma! ler as more reinforcement is
used~ With two No.2 bars the ratio d/£ remains practically constant. For
more reinforcement the trend may reverse.
5.3 I-Beams
The presentation of the tests and the description of the behavior
of I-beams will parallel that of rectangular beams. The reinforcement used
in these beams were similar to those in rectangular beams~ to permit
comparison. The comparison of the behavior of the two kinds of sections
will be made in Section 5.4.
The variation of strains in the s~i.rrups at 0.5 in. from the end
face of Specimens T13, T14, Ti6 and TI8 are shown in Figo 5.110 The wire
started to yield at a load of 35 kips in Specimen T16. The relationship is
1 inear up to this loado The strain gage in Beam T18 did not give rel iable
results above a strain of 0.0011. The stirrup forces in the same four
s pe c i me n 5 are 5 how n i n Fig. 5. 1 2 ~ w h i 1 e i n Fig 0 5 0 1 3 the s t i r r up for c es i n
the two bars of Beam T15 are plotted against the appl ied load. Similar
relationships are given in Fig. 5014 for beams T10 and T12, both having one
No.2 bar at one inch from the end. The comparison of Figs. 5011~ 5012 and
5013 shows that at low loads (before yield) the forces were about equal,
except in Specimen T15, which had two Noo 2 bars. The force in each of the
bars in Beam T15 was about 25. per cent smaller than the forces in single bars.
-33-
The development of cracks in Sp~cimens T14, 116 and T18 IS shown
in Figo 5.15. It can be seen that the No.2 bar restricted the cracks much
more efficiently than the wIres.
The variation of crack width along I-beams is shown in Fig. 5.16
for a load of 20 kips. The effect of the amount of reinforcement is reflected
in this figure.
The relationship between the appi led load, the crack length and the
crack width is of special interest in this study, since the Interaction of
these quantities is the basIs of the analysis presented in Chapter 4. Curves
showing these relationships for rectangular beams were shown in Figs. 5.9
ard SolO. There is less information about the relationships among the
above quantities in I-beams. ~n Specimens T12, T13 and T14 the measurement
of crack length was not rel rabIe, and in Beam TIO the dial used to measure
the crack width had a dial division of 0.001 and did not per~it measurements
that were accurate enough. The measured crack length is plotted against the
appl ied load for Specimens T15 and T16 in Fig. 5.17, while the variation of
the ratio of the crack width to the crack length is shown in Fig. 5.18.
The observations made about the corresponding relationships.for rectangular
beams are also val id here. In. the case of single wires the crack width
developed at an increasingly faster rate than the crack length.
504 Comparison of the Behavior of Rectangular and I-Beams
The c6mparison of the behavior of specimens without reinforcement
in Chapter 3 resulted in so~e important conclusions about the basic
difference between the action of rectangular and I-beams. The behavior of
the reinforced specimens will be compared in this -section. The basic
differences will be summarized in Section 5.6. Some remarks will also be
-34-
made at the end of this section about particular problems associated with
the performance of reinforced end blocks.
The comparison of Figs. 5.2 and 5.12 shows that the stirrup forces
in single No.2 bars in rectangular beams were about 105 times as large as
those in !-beams. The same ratio was found to be 1.7 for beams with two
bars (Figs" 5.4 and 5.13)~ 1.1 for specimens with one wire (Figs. 5.2 and
5.12) and 106 for beams reinforced with one bar at one inch from the end
fact (Figs" 5.5 and 5.14). For the specimen reinforced with wire~ the
appl ied force versus stirrup force relationship became nonl inear at 13 kips.
For the other specimens~ a load of at least 28 kips was applied before non-
1 inearity was observedo
In the specimens reinforced with two bars (or wires)? the force
in each of the bars was about 3/4 of the force of the stirrup in a
companion specimen with single reinforcemento The forces In the bars of
specimens reinforced with two bars were about equalo
The development of cracks was markedly different in the two kinds
of beams (Figs. 5.6 and 5015)0 The cracks in rectangular beams were about
105 times wider than in !-beams-(at'.:a::poiht one: inch from the end -of the
beams) as would be impl led by the differences in th~ forces. The crack
lengths in rectangular specimens were about 2.2 times as large as those in
I-beams in the case of beams with single wire reinforcement~ while the
same ratio was about 205 for the other specimens. Thus~ the cracks were
wider and longer in the rectangular beams.
So far in this section the behavior of the rectangular and I-beams
has been discussed and compared in terms of the crack length~ crack width
and the stirrup force. The influence of the amount of reinforcement was
also investigated. The relationship between the stirrup force and the
-35-
crack width wi 11 be presented in Section' 5.50 In the remainder of this
section some particular observations will be made concerning the behavior
of the specimens.
The effect of a larger loading plate (3.0 in. instead of 1.5 in.)
on the stresses arid strains in the spall ing zone was very sma1 I. This was
ascertained by measuring the strains in bars at both ends of Beam R17. The
loadIng jack and the dynamometer were also reversed to see if there was
bond of the loading rod. It was found that the difference in app1 fed force
at the two ends was neg1 igible. The crack pattern was similar at the two
ends in most tests, except that the crack length was somewhat larger in
I-beams at the end with the larger loading plate. This was discussed in
Section 3.2.
In some beams mechanical gages were used to check the 1 inearity of
the stress distribution away from the end block. The accuracy of the
measurements was not sufficient to detect the distance from the end face
whe.re the distribution of long!tudinal strains began to deviate from the
straight line.
The plastic strip that was used to insure that 'the crack would
pass through the gage, influenced the behavior of the end 'blocks. The effect
of the pre-crack was that cracking and the stirrup force reached a certain
stage at a lower loado The first crack became visible much earlier~ but as
the cracking progressed~ the difference in the beha~ior became smaller,
The anchorage of the stirrups was found to be very important. On
the top part of the beams, the seven inches of cover length was sufficient
for an.chorage~ there was no s 1 i p detec ted on the top.' I n Beam R 1 the
stirrup was bent in a lo6p around the loadtng rods buts unl ike in the other
specimens 9 it was not welded together. At failure, the bent,' portion of
-36-
the bar was partially straightened out, indicating the need for good
anchorage.
The variation in concrete strength did not show any influence on
either the cracking or on the failure load. The consistency of the concrete
is more important. Careful casting of the end blocks is essential to prevent
local irregularities (voids, cracks) that are much more detrimental in an
end biock than in most other areas of concrete construction.
The principal role of the reinforcement in anchorage zones is the
arrest of cracks. In order to estimate the width of the longitudinal
crack~ a relationship is needed between the stirrup force and the crack width.
This relationship was determined in 11 of the 25 tests on reinforced specimens.
Independent pull-out tests were also carried out to study the bond-sl ip
relationships of the reinforcement under different ;conditions.
The measured relationships between the stirrup force and the crack
width are plotted in Figo 5.d.9 for specimens with single No. 2 bars~ in
Fig. 5.20 for specimens with single Noo 7 wire and in Fig. 5.21 for specimens
with two No.2 bars. The crack width was measor.ed at a point one inch from
the end of the bear<s. The comparison of these figures shows 'that 9 be1CM
yield, the crack ~;dth at a given load was approximately inversely pro-
portional to the area of the barso The crack width for two bars was less
than half of that for one bar •. There was no appreciable difference between
the measured crack width at a given stirrup force in rectangular and i-beams.
The crack w)dth is related to the stirrup force, the bond
characteristics of the bar, the qual ity of the concrete and to the stress
conditions around the baro Bond tests give relationships between the sl ip
and the force in the bar. Since results of bond tests are more readily
-37-
available than measurements of crack width, a connection is needed between
the slip of the bars in bond tests and the crack width in beams. The
extension of the stirrup bars between the surfaces of the crack is small in
relation to the crack width, hence the crack width in the beams was compared
with twice the measured sl ip in bond tests under similar conditions.
To determine the bond characteristics of the reinforcement under
conditions similar to that existing in the end block, twin pull-out tests
were made. Companion simple pull-out tests were also cast and tested to
serve for comparison. The specimens and the testing procedure areldescribed
in Appendix Bo
There were seven twin pull-out specimens and seven single pull-out
specimens tested. Three of the latter kind of tests produced erratic
results and are not reportedo The results of five twin pull-out tests and
four single pull-out tests will be discussed in the following paragraphs9
It should be noted that the sl ip-measuring system did not permit rel fable
measurements upon first appl ication of load. Hence, bond-s1 ip curves are
drawn through the origin.
The results OT bond tests on No.2 bars are shown in Fig. 5022 and
on No.7 wire in Fig. 5.23. The sl ip values were doubled to permit di.rect
comparison with the crack width. The single puli-out tests gave results
similar to the twin pul l-outtests, as it can be seen in these figures.
The comparison of the relationships between the measured force
and the crack width in the end block and twice the measured sl ip- in the bond
tests (Figs. 5~l9, 5.20, 5.22 and 5.23) shows that the results of the bond
tests on specfmens with bars (Fig. 5~22) agree wel 1 ·with the curves in Fig.
5.20. The crack width measured in specimens reinforced with wi.res was
smaller than the correspondin.g values in the bond tests (Figs. 5.20 and 5.23).
-38-
Since the anchorage length in the case of the wires was larger than in the
case ot the deformed bars~ the anchorage of the lower end of the wires
around the loading rod could reduce the amount of slip. Therefore, the
crack width is less than twice the measured sl ip in the bond tests In the
case of wi res 0
The design method developed in this investigation requires the
knowledge of a relationship between the stirrup force and the crack width.
The relationship is approximated by the force-s1 ip relation from bond testso
When no such data are avai 1able, the sl ip can be estimated from an assumed
distribution of bond stresses. For simpl icitY9 the force per unit length g
will be assumed to be constant over the anchorage length of the baro It
is usually expressed in terms of the concrete strength. If the relation
g = m.[f U is assumed~ the integration of the strains in the bar along the c
anchorage length gives: F2
s = -~--2mEA '[f! ~
C
where A is the area of the bar and F is the force in the bar. Twice this
value is plotted in Figo 5024 for fD c 4900 psi~ E = 30 x 106 psi and for
the two kinds of reinforcement used in this invest19ation~ For the wires
m = 3 and for the bars m = 4 is usedo The curves are second degree
parabolaso Since the measured relationships have a smaller curvature~. the
approximation can be good in one interval onlyo Different values for m
have to be selected according to the size of the load (or crack width) that
is to be approximated. In the analysis presented in this investigation»
the segment that is of importance centers around the crack width of 0.005
in. This requires that m should be about 4~ In other areas of appl ication
of this method of approximation, much larger forces are dealt with 9 hence,
.: ~
; i r: .;
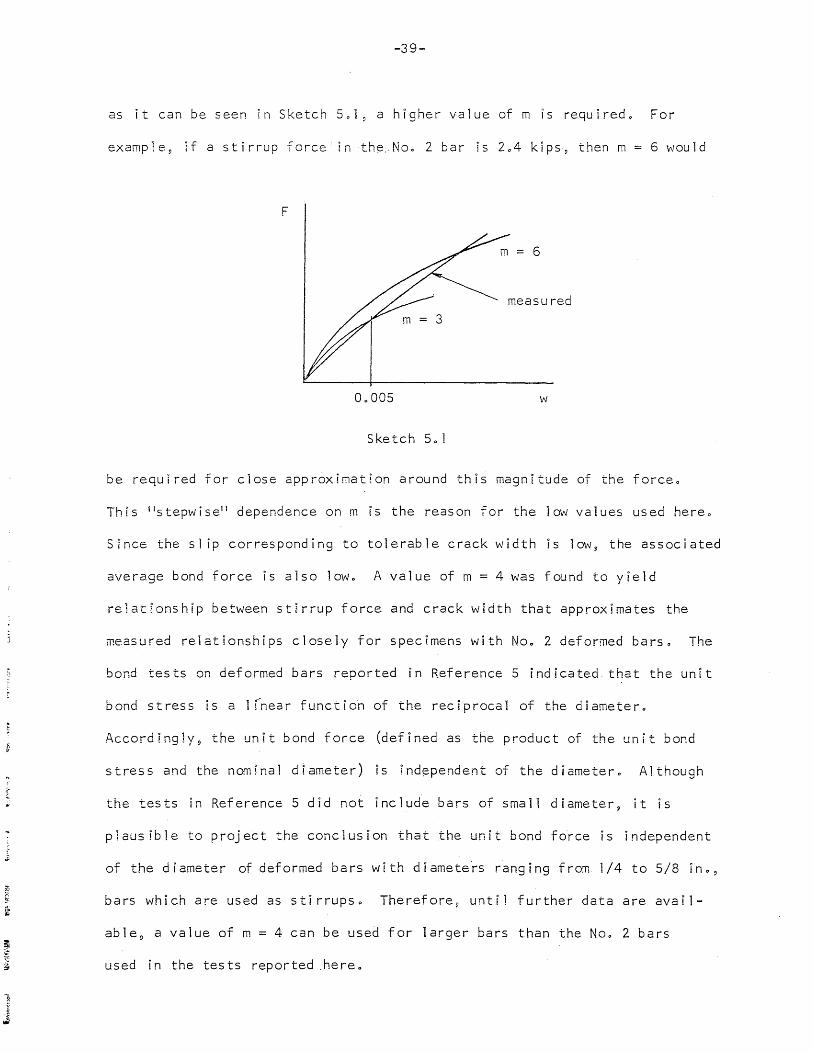
-39-
as it can be seen in Sketch 50 1 ~ a higher value of m is required. For
example.~ if a stirrup force.' lnth~,-Noo 2 bar Is 204 kips~ then m 6 wou 1 d
F
6
measured 3
00005 w
Sketch 5. 1
be required for close approximation around this magnitude of the force.
This i1stepwise ll dependence on m is the reason for the low values used hereo
Since the sl ip corresponding to tolerable crack width is low 9 the associated
average bond force is also low. A value of m = 4 was found to YIeld
re1at[onshlp between stlrrup force and crack width that approximates the
measured relationships closely for specimens with Noo 2 deformed barsa The
bond tests on deformed bars reported in Reference 5 indicated, that the unit
bond stress is a 1 rnear function of the reciprocal of the diametera
Accordingly, the unit bond force (defined as the product of the unit bond
stress and the nominal diameter) ~s ind~pendent of the diameter. Although
the tests in Reference 5 did not include bars of small diameter, it is
plausible to project the conclusion that the unit bond force is independent
of the diameter of deformed bars with d!amete'rs ranging from 1/4 to 5/8 in.,
bars which are used as stirrups. Therefore~ until further data are avail-
able~ a value of m = 4 can be used for larger bars than the Noo 2 bars
used in the tests reported .here~
-40-
506 Conclusions
The behavior of rectangular and I-beams has been described and
compared in the first four sections of this chaptero The relationship
between the stirrup force and the sl ip (or crack width) has been presented in
the previous section. The behavior of all specimens and the interaction of
the variables will be summarized in this sectiono Especially, the basic
differences between the action or the two kinds of specimens will be discussedo
The strains measured in the spall ing zones of rectangular specfmens
without reinforcement were about equal to the transverse strains in I-beams.
An explanation was given in Section 3.2 9 according to which the load is more
confined to the flange in the I-beam and 9 thus, the web portion of the
rectangular specimen carries higher loads. The test results presented in
this chapter substantiate this explanation, as it will be described in the
fol lowing paragraphs.
The ratio of measured stirrup forces in rectangular beams to that
in I-beams were the following: for two bars, 107; for one bar (at 1.0 fn.)~
1.6; for one bar (at 005 ino)~ 105; and for one wire~ 1010 For adequately
reinforced beams the force can be transmitted into the web portion of the
rectangular beams, and there is a difference between the stirrup forces in
the two kinds of beams. If the rectangular beam is under-reinforced (by
one wire, for example), the crack opens earl ier~ and the load is more
confined to the bottom part, since the top part of the beam does not bend
as much as in the case of adequately reinforced beams. Then the action of
the rectangular beam becomes similar to that of the i-beam as reflected by
the 1.1 ratio above. Therefore, if ariEjdequate. amount of reinforcement is
used~ the stirrup force is larger in the rectangular beam, and the web
part is participating in carrying the load.
:~
-41-
Corresponding to the difference in the stirrup force, the ratio
of the measured crack width in the rectangular beams to that in I-beams is
about 1.4 for equal appl ied loads. The ratio of the lengths is about 2.5
for specimens reinforced with two No.2 bars and about 2.1 for beams with
one wire. Thus, the cracks are wider and longer in the rectangular beam.
The crack length is very much affected by irregularities and its measurements
by surface conditions. In the identical Specimens R8 and R13 the crack
widths were about equal? whi le the observed crack length in Beam R13 was
about twice as large as that in Specimen R8.
The comparison of the results of single pull-out and twin pull-out
tests indicated that the lack of confinement was not the cause of the low bond
stresses. Tne force-sl ip relationships were similar in the two specimens.,
5.7 Reconcil iation of Theoretical and Experimental Results
The method of analys is of end block's (Chapter 4) was based on the
investigation of the equilibrium of forces acting on a free body formed by
a longitudinal crack in the anchorage zone (Fig. 4.1) 0 An expression was
derived to predict the position of the crack~ In this sections the equations
and the parameters of the analysis will be used to examine the interaction
of forces and deformations of the specimens used in this investigation.
The expression for the position of the crack (Chapter 4) yields
c = 5,3 in. for the dimensions used in the present investigation for
rectangular beams (e = 1.5 ino~ h = 12 ino)~ The section where the moment
reaches a maximum value has to be determined by trial and error in the case
of I-beams. For the cross section and loading used in the present investi-
gation the crack is predicted to occur at 5.5' in. from the bottom. -;',
;', As described in Section 302~ the crack was observed to occur at about 5.5 in. from the bottom in seven of the nine test specimens without reinforcement.
-42-
The maximum moment~ acting on a section at 5.3 In. from the bottom~ for
a load, say, 20 kips is 1504 k-ino For the ~-beam the corresponding
moment at 505 :n. from the botta~ is 8.6 k-in.
The ratio of the maximum moment in the rectangul~r beam to that
in the ~-beam is 1.8. For an assumed equal moment arm, this ratio r"s equal
to the ratio of the total stirrup forces. This agrees well wlth the test
results on specimens with adequate reinforcement (two Noo 2 bars), where
this ratio was 1070 For less reinforcement~ the measured ratio was less,
as discussed in the previous section.
T\1"o approaches were considered for the basis of design of reIn-
forcement in anchorage zones. One method is a successive ~pproximation
that involves the adjusting of the steel force,the stresses in the concrete,
the crack length and the crack wIdth to sat1sfy equil ibrfum and force-
deformation conditions. The other method is a simpl if~ed analysis of the
forces and the crack width for an assumed 1 im~ting length of the lead-in
zone.
The first approach approximates the crack length and the distri-
bution of the stresses in the concrete beyond the tip of the crack by trial
and error. These stresses and the crack length are related ·to the tensile
force and to the known app1 ied moment. The st!rrup force is, in turn,
related to the crack width by the bond characterist~cs of the reinforcemento
The procedure is very laborious and the accuracy of the results is uncertain
at present, because the relationship involved ~s not known in sufficient
detail. There are numerous assumptions to be made in this method regarding
the geometry of the crack and the stress-strain properties of the concrete. " ! I
This method can not yet be considered for design purposes.
-43-
The second approach is a straightforward method, suited for use
in the design office. The maximum moment acting on a longitudinal section
is calculated (Chapter 4). In order to estimate the moment arm of the
stirrup forces and the c(xnpressive force of the concrete, the crack length
has to be knowno There is no practical way of estimating this quantity.
Measurements of the crack length are erratico Since 1 inear stress distri
bution is reached at a distance of h (or less) from the end face (Chapter 2
and Appendix A), this' value is taken as the upper 1 imit for the distance
between the compressive force and the end faceo The stirrup force can be
cal cu 1 ated by d iVliddrig the known moment by th is assumed moment arm, to
obtain the total stirrup force. Bond-sl ip relationships are used to check
jf the crack width is less than a prescribed 1 imit. If the actual moment
arm is smaller than the one deflned above, the stirrups will be overstressed.
Then the 1 imitation on the crack width will modify the.designo This method
will be appl ied to the specimens of the present investigation in the
fol lowing paragraphs. It wil1 be the basis of the design specifications
presented in Chapter 6.
The selection of the reinforcement for the I-beam under a load,
say,~_.20 kIps inc'ludes the. following steps ~ The total stirrup force is
calculated from the maXimum moment, using a moment arm equal to the height
of the beam less the distance between the resultant of the stirrup forces
and the end of the beam. Hence, F = 806/1105 = 0075 kips9 if the center
of g r a v j t Y of the s t i r r u p for c e sis ass 1 g ned to a poi n tOo 5 in. from the
end faceo This force would produce a stress of 1404 ksi in one bar and
29 ks i in the case of one wi reo The corresponding crack widths are (Figso
5019 and 5020) 0.004 in. for one wire and 0.002 for one bar. The average
measured stirrup force was 0.63 kips.

-44-
If two No.2 bars are considered, placed at 0.5 in. and 2.0 in.
from the end, the moment arm is 10~25 in. Hence s the total stirrup force is
F = 8.6/10.25 = 0.84 kips and the crack width is 000011 in. The m'easured
stirrup force was 0.88 kips in this case.
For rectangular beams asimilar analysis gives a total stirrup
force of 1050 kips and, (us lng two No.2 bars) a crack width of about 0,,002
ino The measured stirrup force was 1.54 kipso
The interaction of the appl led load, the stirrup force and the
crack width is plotted for the measured values and for the values predicted
by the above analysis in Figs. 5025 and 50260 The calculated stirrup forces
(represented by the broken, I ines) are larger than the measured values. This
[ndlcates that the assumed moment arm gives conservative results. The
measured crack wIdths agree well with the values predicted by the analys~s
if a uniform bond value of 4~fo (300 lb/ln.) is used for the bars and c
3.ff u (200 lb/ino) for the wires. These approximations agree best with the c
measured values at a crack width of about 0.005 ino~ which is the 1 imiting
crack width pfopbsed in this investigation. For smaller cracks~ the pre-
dicted values are lower than,the measured crack widths, but the difference
is small. S~nce this deviation occurs at small cracks, it ~s not
consequentIal.
The above discussion illustrates the bas!c relationships that are
involved in the analysis presented in Chapter 4. This procedure is used in
the des; gn recommendat ions 9 lven' ! n the next chapter.

-45-
6. DESIGN RECOMMENDATIONS
6. 1 I ntroductory Remarks
The design method presented in this chapter is based on the
method of analysis introduced in Chapter 4 and discussed quantitatively in
Section 5.7. In essence~ it admits the presence of a longitudinal crack in
the anchorage zone and is concerned with the equil ibrium of the beam portfons
on either side of the crack. Transverse reinforcement is provided to satisfy
equ11 ibrium for any possible position of the longitudinal crack. The force
in the relnforcement is calculated from the maximum of these moments, uSing
an assumed moment arm. The steel stress is controlled by a 1 imiting crack
width through an approximate f6rce~slip relationship.
The pivotal assumption is that there is a longitudinai crack in the
anchorag~ zone. The prime role of the reinforcement is to confine the crack.
The test series presented in Chapter 5 was designed to test the basic
hypothesis and to determine the force-s1 ip relationships for the transverse
re info rcemen t.
The method is best suited for the analysis and design of anchorage
zones with loads of high eccentricity. In such cases the conditions of
anchorage do not influence the forces in the spall ing zone 9 If the load has
small eccentricity, the size of the loading plate influences the forces
along the line of the load, though the results given by this method are on
the safe side.
There are no 1 imitations to the design method, as far as its
areas of appl rcation are concerned. The lack of sufficient data on the
force-s1 ip relationship of reinforcement of different sizes prevents the
precise determination of the crack width. However~ there is neither need
nor justification for precision in predicting the crack width. I
i .!
J
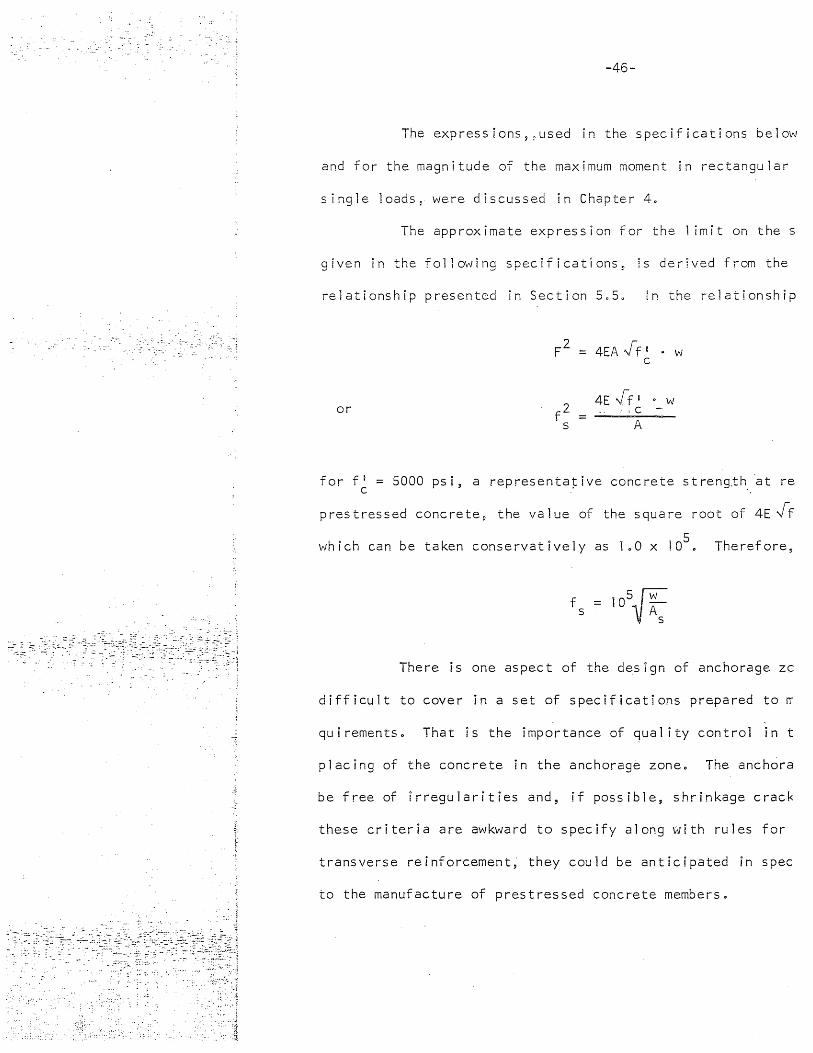
..::--~::..:. .~ -"-'~
:---::- "-=..: ~:. , -.,.
" •. p. '.,
. ,
-46-
The expressions,;.used in the specifications below
and for the magnitude of the maximum moment in rectangular
single loads~ were discussed in Chapter 40
The approximate expression for the 1 imlt on the s
given in the following specifications, lS derIved from the
relationship presented in Section 5050 !n the relationship
F2 4EA .ff I . w c
4E .ff I 0 W or f2 iC -
s A
for f' = 5000 psi, a representative concrete strength. ~t re c
prestressed concrete~ the value of the square root of 4E-ff
which can be taken conservatively as 100 x 105. Therefore,
There is one aspect of the design of anchorage zc
difficult to cover in a set of specifications prepared to ~
quirementso That is the importance of qual ity control in t
placing of the concrete in the anchorage zone. The anchora
be free of rrreguiarities and, if pass ible~ shrinkage crack
these criteria are awkward to specify along with rules for
transverse reinforcement; they could be anticipated in spec
to the manufacture of prestressed concrete members •
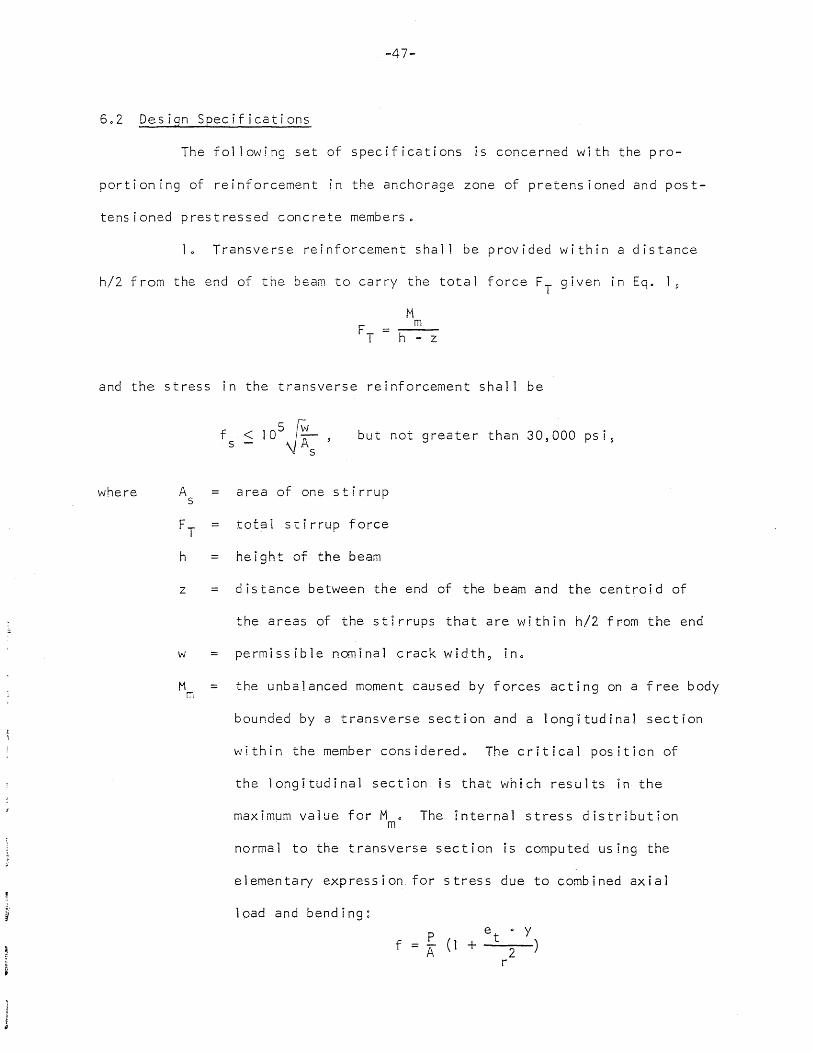
-47-
6.2 Design Specifications
The following set of specifications 1s concerned with the pro-
portioning of reinforcement in the anchorage zone of pretensioned and post-
tensioned prestressed concrete members.
1. Transverse reinforcement shall be provided within a distance
h/2 from the end of the beam to carry the total force FT given in Eq. 1 ~
M m
h-=z
and the stress in the transverse reinforcement shall be
where
but not greater than 30,000 psi~
A = area of one stirrup s
FT total stirrup force
h = height of the beam
z distance between the end of the beam and the centroid of
the areas of the stirrups that are within h/2 from the end
vJ permiss ible no.l1inal crack width~ in.
M the unbalanced moment caused by forces acting on a free body r.i
bounded by a transverse section and a longitudinal section
within the member considered. The critical position of
the longitudinal section is that which results in the
maximum value for M. The internal stress distribution m
normal to the transverse section is computed using the
e 1 emen ta ry exp ress i on for s tres s due to comb i ned ax i a 1
load and bending~
f p A (1 +
e 0 y t )
2 r
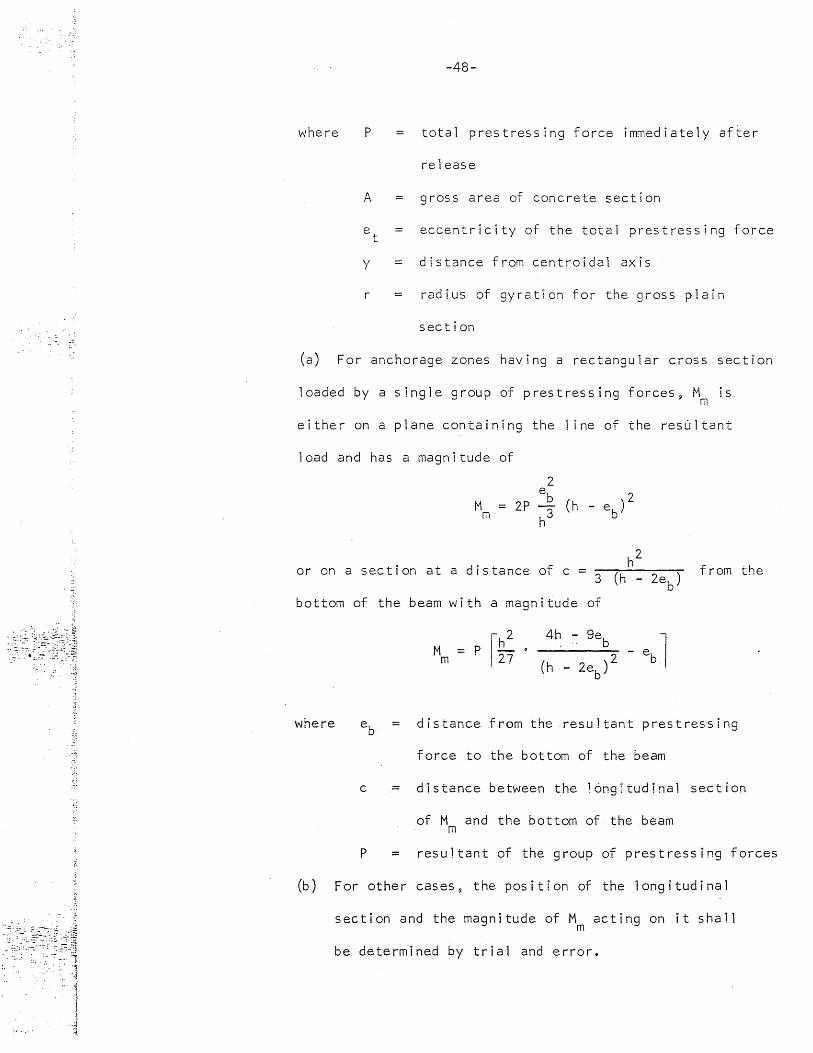
,
-48-
where p total prestressing force immediately after
release
A gross area of concrete section
e t eccentricity of the total prestressing force
y distance from centroidal axis
r radius of gyratIon for the gross plain
sec t ion
(a) For anchorage zones having a rectangular cross sectIon
loaded by a single group of prestressing forces, M is m
either on a plane containing the 1 ine of the res~ltant
load and has a magnitude of
or on a section at a distance of c = 3 from the
bottom of the beam with a magnitude of
M m
p r h 2
0 4h - geb - eb 1
I 27 (h _ 2e ) 2 b
where eb distance f rom the resultant prestressing
(b)
force to the bottom of the beam
c = distance between the i ong i tud ina 1 section
of M and the bottom of the beam m
p = resultant of the group of prestressing forces
For othe r cas es ~ the pas it i on of the .1 ong ! tud ina 1
section and the magnitude of Mm acting on it shall
be determined by trial and error.
-49-
(c) For draped pr~t~nsioned strands, the point of action
of the resuitant prestressing force shall be taken at
25 diameters along the strands from the end.
2(a). Ciosed stirrups shall be used, enclosing all the prestressing
tendons. The stirrups shall extend from the top to the bottom of the section
and satisfy the requirements for cover.
(b) 0 The amount of transverse reinforcement over:"a distance h
from the end of the beam shall not have a longitudinal spacing greater than
hiS and shall not be less than the minimum required for shear.
(c) The first stirrup shall be as close to the end of the beam
as permitted.
6.3 Illustrative Examples
(a) Post-tensioned Highway Bridge Girder
The transverse reinforcement will be designed for the AASHO standard
beam No.1. The cross section is shown in Fig. 6. iao The area and the
moment of inertia are 276 in02
and 22,740 in.4. The prestressing force is
applied by 22 strands in the bottom part of the section and by two strands at
the top of it. The center of gravity of all the forces (a total of 336 kips)
is at 6017 in. from the bottom~ while the simi lar distance for the resultant
of the bottom strands is 4.37 in. The center of gravity of the cross
section is at 12.59 in. from the bottom. The stresses due to bending are
2 .. 41 kS i compress ion and 0.24 ks i tens ion ..
The forces in the bottom part of the section excluding the web
are shown in the sketch belaw:
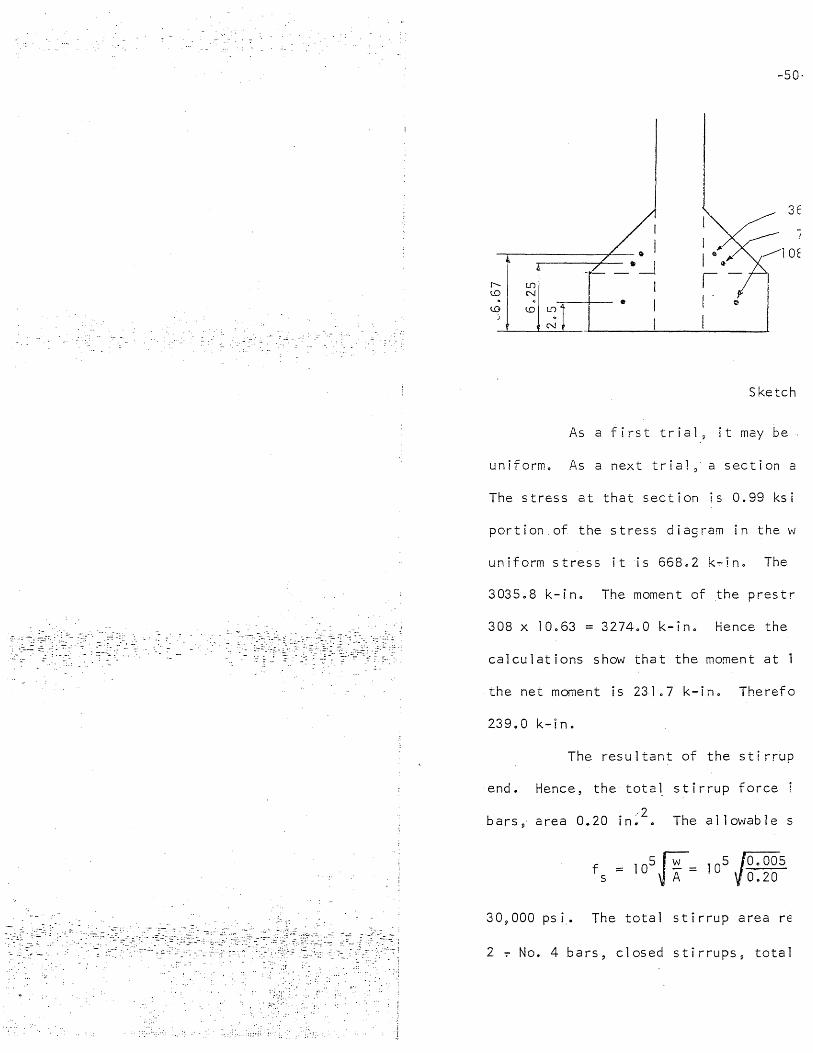
'.
:=. '~:.. -0" , -
; , ,'. "
i
I I I 0
I
-50-
Sketch
As a first trial ~ it may be
uniform. As a next trial, a section a
The stress at that section is 0.99 ks!
portion of the stress diagram in the w
uniform stress it is 66802 k~!n. The
3035.8 k-in. The moment of the prestr
308 x 10.63 = 3274.0 k-ino Hence the
calculations show that the moment at 1
the net moment is 23107 k-in. Therefo
239.0 k-ino
The resultant of the stirrup
end. Hence, the total stirrup force
bars~' area 0.20 in~2o The allowable s
30s000 psi,_ The total stirrup area re
2 ~ No.4 bars, closed stirrupss total
-51-
(b) Pretensioned Highway Bridge Beam
In the calculation of the moment on the longit~dinal section the
magnitude of the force is taken into account~ As long as all the force is
on one side of the section, it can be considered as an external force. The
effective point of action of the pretensioning forces must be estimated (the
distance between the resultant force and the bottom of the cross section).
The transvers~.reinforcement will be designed for the anchorage
zone of the standard AASHO beam Noo IVo The cross section is shawn in
Fig. 6.1bo The area and the moment of inertia of the section are 789 in. 2
and 260,700 4
in 0, • The,prestressing force is app1 ied by 48 strands, 16 of
which are draped. The center of gravity of all the forces is at 1109 in.
fram the bottom, while the corresponding distance for the loads in the
lower half of the section is 10 in. The stresses due to the total force are
3.0 ksi compression at the bottom and 0 9 24 ks! tension at the topo The force
in 46 strands (a total of 1160 kips) will be considered in the calculations~
The remaining two strands act at the top of the section. The maximum moment
is 1010 k-in. and occurs at a distance of 37 in. from the bottom of the
sec t ion 0
The center of gravity of the transverse reinforcement is assumed
to be at 5 in. from the end face. The total stirrup force is F 1010/49
20 0 6 kip s <> Try No. 4 bar s 9 are a O. 20 in. 2 f 5 = 1 5 ~ 800 p~ i ~' The" tot a 1
area required is A 20.6/15.8 = 1.31 in.2
9 use 4 - No. 4 bars~ closed re~
stirrups9 total area, A = 8 x 0.20 = 1.60 in.2
.
(c) Post-Tensioned Rectangular Beam
The transverse reinforcement will be designed for the I-section
of example (a) with rectangular end blocks. The cross section has an area
-52-
of 28 x 16 = 448 in.2
and a moment of -inertia of 29,269 in.4. Again, the
total force of 336 kips acts at a point 6.17 in. from the bottom, and the
resultant of the forces in the lower part of the cross section is 308 kips
and acts at 4.37 in. from the bottom.
The bending stresses are 2.0 ksi compression on the bottom and
0.51 ks! tension on the top. The net bending moment on a longitudinal
section at 14 in. from the bottom due to these bending stresses and the
forces acting in the lower part of the end face is 490 k-in .. The corres-
ponding moment at 1405 in. is 500 k-ino and at 15 in. the moment is 486 k-in.
Hence, the maximum moment is 500 k-jn. !t is interesting to note~ that if
the forces at the top of the section (2 x 14 = 28 kips) are ignored, the
moment is much smaller. The expression for the position of the maximum
moment gives
c =
and the maximum moment is
1282
M = 308 In
28 13.6 3 (28 - 2 x 4.37)
4 x 28 - 9 x 4.37 _ 4. 37l (28 - 2 x 4.37).2
in.
hence, the two cables on the top increased the maximum moment from 410
k-in. to 500 k-In.
There Is a large difference between the maximum moment in the
rectangular and the I-beam. in example (a) the maximum moment was 239 k-in.
compared with the 500 k-in. obtained for the rectangular section in this
example.
The selection of the relnforce~ent involves steps that are
similar to those given in examples (a) and (b) above.
~ i' i. a~..;. :t-
: !
. ~-
""Ii ;..:-'
;':.'
-53 -
7. SUMMARY
7.1 Object and Scope
The objectives of this investigation were to study the crack
initiation and the action of transverse reinforcement in arresting cracks
in the anchorage zone of prestressed concrete beams.
A detailed review of relevant references was made (Appendix A).
The majority of the consulted work~ was concerned with elastic stress
distribution in the anchorage zone. It was concluded from the study of the
references that, though some definite results could be ascertained about
the effect of certain variables~ there was not sufficient information about
the behavioL'of ;a:.cracked end block. Non-prestressed reinforcement can not
prevent cracking. Therefore~' In order to develop a direct method of
designing transverse rei~forcement with the real ization of a crack~ an
analytical and experimenta1 Investigation was undertaken.
The first part of the ,investigation was concerned with the
conditions of crack initiation. A series of tests was conducted on three
rectangular and seven I-beams to determine the transverse strain distribution
along certain longitudinal 1 ines and the development of cracks. The specimens
and the testing procedure were described in Appendix 8. A finite difference
solution was also made, based on the two-dimensional Airy stress function
method, to determine the stresses and strains in a specific case. This
solution was described in Chapter 2~ while the details of the computer
program were given in Appendix Co
In the second part of the !nvestigation~ an analytical study was
made of' the conditions of the equil ibrium on the cracked end block. To
corroborate the analysis~ 14 rectangular and i1 I-beams with transverse
reinforcement were tested. The behavior of these specimens was described
-54-
in Chapter 50 The force in the stirrups related to the crack width in
the analyslso Bond tests were made on seven simple pull-out specimens
on seven so called i'twlnil pull-out speclmenso The latter kind of tests
designed to simulate the conditions in the end block, where there is nc
conflnement of the bar.
Behavior of Specimens without Reinforcement
The measured transverse strains along the 1 ine of the load ar
along the center-l ine of the spec~mens indIcated two main tension zones
(Figs. 3.2a and 302b). There are high tensi 1e strains under the load ar
distance of about one to two lnches from the loaded end. In beams strE
by forces of small eccentricitY9 the stresses under the load (the sO-Cc
bursting stresses) are the highest. The majority of the references cor
was concerned with these stresses. ~n the case of loads with larger
eccentricities~ the other tension zone (called the spall Ing zone) has
stresses that Initiate a longitudinal crack close to the mid-height of
beam. The specimens tested in this investigation had an eccentricity (
4.5 ino with a beam height of 12 in. The measured stra~ns cQ~pared wel
with the results of the finite difference solution if a possible variai
in the modulus of elast~city of concrete in tension was allowedo The
reversal of the gages indicated minute cracks at low loadso
The strains in the two kInds of beams were s~milar. This wa~
explained by the different kinds of flow of forces in the two cases; ir
I-beams the forces are more confined to the flange.
i
1 The longitudinal cracks close to the center 1 ine of the beam
progresses deep into the beams (Figs. 3.5 and 3011). The beams failed
a spl itting wedge type of failure under the loading block.
.,:.;:
l
1
-55-
It was noted that initial irregularities (cracks and voids) lower
the strength of the anchorage zone without reinforcement.
7.3 Behavior of Specimens with Reinforcement
The strains were measured at an induced longitudinal crack in
three kinds of transverse reinforcement (one No. 7 USSWG~ one No.2 bar and
two No.2 bars). The measured forces were proportional to the appl led load
up to yield. The crack width increased at a faster rate than the crack
length with increasing app1 ied load.
The comparison of the performance of the rectangular and, I-beams
substantiated the hypothesis that the forces would be larger and the cracks
longer and wider in rectangular beams than in I-beams. This indicates that
the performance of the I-shaped beams is better if most of the prestressing
forces act in the flange.
7.4 Bond-S1 ip Relationship
Both the crack width and the stirrup force were measured in eleven
specimens. The relationship between these quantitie~ was needed in the
analytical investigation on which the design procedure was based. The
comparison of the measured relationships (Figs. 5.19 3 5.20 and 5.21) shows
that the crack width was approximately inversely proportional to the stirrup
area. There was no appreciable difference between the measured crack width
at a given stirrup force in the rectangular and I-beams.
The two kinds of bond tests gave force-51 ip curves that were
similar to those in the beams, assuming that the crack width was about twice
the s1 ip.
used,o
In the design method, a uniform unit bond (force per ,length) was
It was found to be 4~fl from the bond tests for bars~ The reason c
-56-
for this low bond value was that the sl ip for tolerable crack widths is
small.
705 .Resu1ts of Practical Siqnificance
Although the major part of this study was concerned with the
reconci 1 iation of theoretical and measured stresses in a rather ideal ized
test specimen and the experimental work was 1 imited. it was possible to
present S<Y.T1e of the results in a form suitable for immediate appl ication,
since the hypothesis developed for the action of transverse reinforcement
involves simple assumptions which can be projected on the basis of intell i
gible principles to cover practical cases.
The investigation brought out the importance of spall ing stresses,
transverse tensile stresses away from the 1 ine of the load, and showed that
for an eccentric load these stresses would be larger for a rectangular than
for an I-shaped end blocke
A new approach to the problem of transverse reinforcement predicated
on the admission of a longitudinally cracked anchorage zone was developed.
A simple design method for transverse reinforcement was based on this
approach and presented in a format which can be incorporated readily in a
b u i 1 din g cod e •
"
~ " ~i
-
i>
~" .----.-;::
~
t ]
~
~ !:!
~
e i :~ ;j ...
-57-
REFERENCES
1. Timoshenko, S., J. N. Goodier, IITheory of Elasticity,11 McGraw-Hill Book Company, Inc., 1951, pp, 483-490.
2. Guyon, Y., PF;estressed Concrete, 1st Edition, J. Wiley and Sons, Inc~~
New York, 1953.
3. Gerstner, R. W., O. C. Zienkiewicz, ilA Note on Anchorage Zone Stresses,11 Journal of the American Concrete Institute, Vol. 59, )uly 1962.
40 Iyengar, K~ T., IITwo-Dimensional Theories of Anchorage Zone Stresses in Post-Tensioned Beams,I' Proc., ACI, Vo1 1 59, 1962, p. 1443.
5. Ferguson, P. ~l., J. N. Thompson, IIDevelopment Length of High Strength Reinforcing Bars in Bond,11 Proc., ACI, Vol. 59, July 1962.
6. Douglas, D. J., N. S. Trahair, IIAn Examination of the Stresses in the Anchorage Zone of a Post-Tensioned Prestressed Concrete Beam,11 Magazine of Concrete Research, Vol. 12, No. 34, March 1960.
7.
8.
9.
1 o.
11 0
Bleich, F., IIDer gerade Stab mit Re.chteckquerschnitt als ebenes Problem,11 Der Bauingenieur, No. 10,1923 9
Sargious,M., IIBeitrag zur Ermittlung der Hauptzugspannungen am Endauflager vorgespannter Betonbalken, Thesis, Technische Hochschule Stuttgart, 1960.
Huang, To~ IIA Study of Stresses in End Blocks of Post-Tensioned Prestressed Beam," Thesis, University of Michigan, 196L
Sievers, H 0, 110 i e Be rechnu ng von Auf 1 age rban ken und Auf 1 age rquade rn von Bruckenpfeilern," Der Bauingenieur, Vol .. 27, 1962.
Sievers, H., "Uber den Spannungs~ustand im Bereich der Ankerplatten von Spanng'l iedern vorgespannter Stahlbetonkonstrucktionen,1I Der Bauingenieur, Vol. 31, 1956.
12, Morsch, E., 'IUber die Berechnung der Gelenkquader,I' Beton und Eisen, No. 12, 1924 ..
13. Magnel, G .. , I'Des ign of the Ends of Prestressed Concrete Beams,11 Concrete and Constructional Engineering, Vol 0 44~ 1949.
14" Ramaswamy, G. S., H. Gael, ilStresses in End Blocks of Prestressed Beams by Lattice Analogy,li Proc., World Conference on Prestressed Concrete,' San Francisco, 1957 ..
15. Ross, A. 0 .. , IIS ome Problems in Concrete Construction,I' Magazine of Concrete Research, Vol. 12, 1960 ..
16. Hiltscher, R., Go Florin, I'Die Spaltzugkraft in einseitig eingespannten, am gegnuberliegenden Rande belasteten rechteckigen Scheiben,11 Die Bautechnik, Heft 10, 1962.
::"t.
~ .•.. ' .
.,: ~
- ~
:~~ :;~1
.p
" .~;
1;
'~
-
.j58-
17. Christodoul ides, S. Po~ "A Two-Dhilens1onal investigation of the End Anchorages of Post-Tensioned Concrete Beams~i' The Structural Engineer, VoL 33~ 19550
180 Christodoui ides~ So Po~ lIThe Dlstribut!on of Stresses Around the End Anchorages of Prestressed Concrete.Beams,it International Association for Bridge and Structural Engineering~ Publlcat!ons~ Vol. 16, i956.
190 Chrfstodoulldes, So Po~ HThr'ee-D!mens~onal !nvest~gation of Anchorage Zone Stresses," The Structural Eng;neer, 19570
200 tvtarshal1s Wo T. ~ Ae H. Mattock, '!Control of Horizontal Cracking in the Ends of Pretensioned Prestressed Concrete Girders~" Journal of the Prestressed Concrete Institute? Volo 7, No.5, 19620
210 Zie1 inski s Jo~ ,Ro Eo Rowe, nAn investigation of the'Stress Distribution in the Anchorage Zones of Post-Tensioned Concrete Members~!I Cement and Concrete Association~ Research Report 9, 19600
22. Ban, So,;:H q Muguruma~ Zo Ogaki, HAnchorage Zone Stress Distribution in Post-Tens !oned Concrete Members?i' Proc., World Conference of Prestressed Concrete~ San Francisco, 19570
23
24
25
26
27
28
29
0
e
0
· 0
·
·
Zie1 inski, Jo, Ro Eo Rowe s i!The Stress Distribution Associated with Groups of Anchorages in Post-Tensioned Concrete Members'," Cement and Concrete Association, Research Report 13, 19620
Mahajans Ko D., "Analysis of Stresses in a Prestressed Beam Using Araldite Models," Indian Construction News s August 19~8o
Goodier, Jo N., IICompress ion of Rectangular Blocks,!' American Association of Mechanital Engineers, Tran., Volo 54, 1932.
Abeles, Po \A/o, Fe He Turners Prestressed Concrete DesignerOs Handbook," Concrete Publ ications, Ltdo~ London, 1962.
Hawkin?;;N;": Mo? Vo Srinivasagopalan~ M. Ao Sozen s "AnchorageZone Stresses in Prestressed Concrete Beamss!l Structural Research Series No. 207, University of !11 inois, 19600
Chaikes s SOs ilCalcul des Abouts des Poutres en Beton Precontraint/ ' International CongresS' of Prestressed Concrete, Ghent~ 19510
Keuning, Ro W., Me Ao Sozen, Co P. Siess s "A Study of Anchorage Bond on Prestressed Concrete,'1 Structural' Research Series Noo 251, University of Illinois, 19620
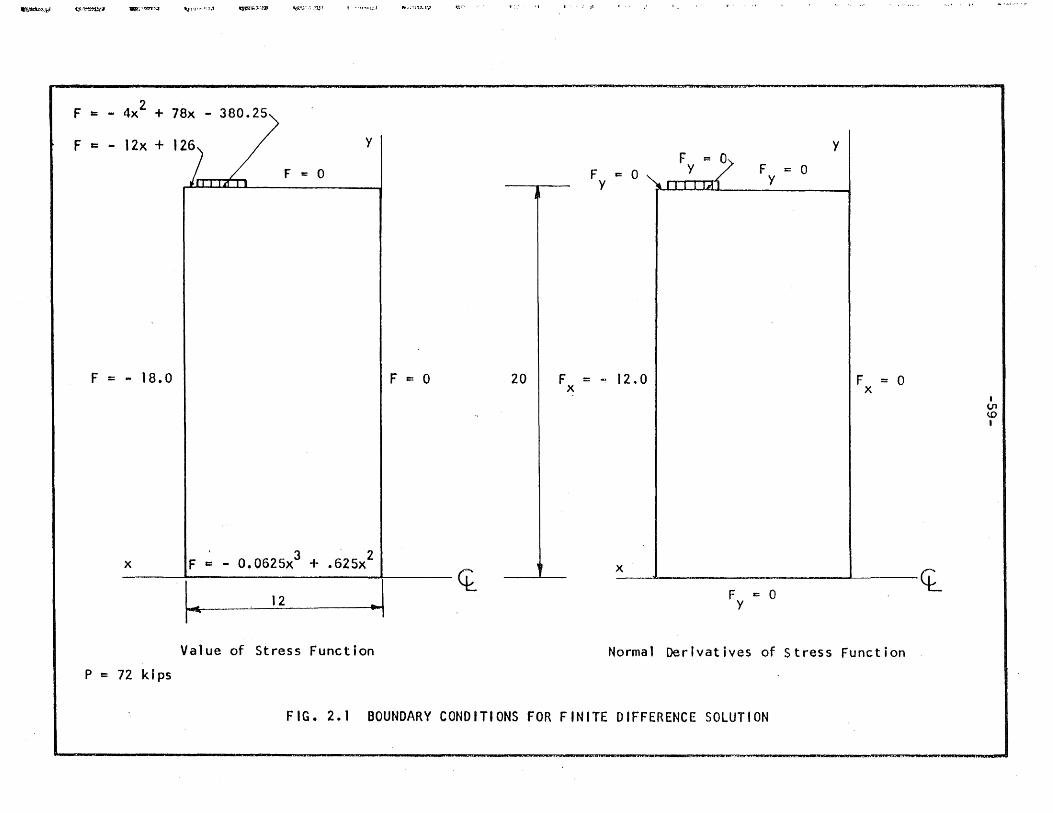
~~;.¥.' ~.~~ 1II'li."'!m"!-IJ \.tr"·'· ·;l-rf tfGi=.;i:f~ J.~~~~ . .. , .SJ.;' I ··""t!!.1 .... ;:;U.I,·'
2 . F = - 4x + 78x - 380.25
F '" - 12x + 121n / y
lLll~< t F II:: 0
F = - 18.0 F c 0
. 3' 2 x IF '" - O.0625x + .625x I ~
. ~ . 12 ~
Value of Stress Function
P c 72 kips
j
20
F c 0 y
F = ~ 12.0 x
F = 0 y
IilLLLUAI
x J
F :c: 0 y
y
F = 0 x
-----Fy ~ 0 ~
Normal DerIvatives of Stress Function
FIG. 2.1 BOUNDARY CONDITIONS FOR FINITE DIFFERENCE SOLUTION
I VI U)
I
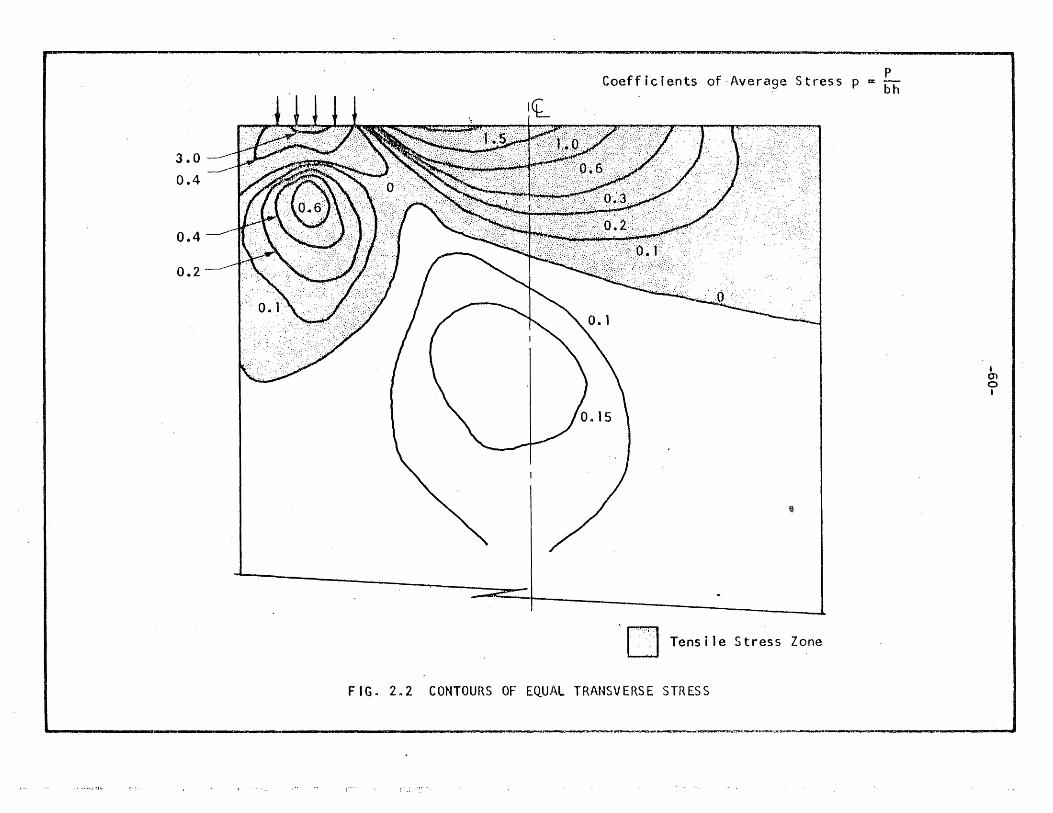
3.0
0.4
0 .. 4
0.2
Coefficients of-Average Stress p 2 ~h
D Tens i Ie Stress Zone
FIG~ 2~2 CONTOURS OF EQUAL TRANSVERSE STRESS
I en o I
L-__________________________________________ ~ ____ ~ ____ ~»_~ ___ ~~~~~~ _______ ~ __ ~ __________ ~
1:,;
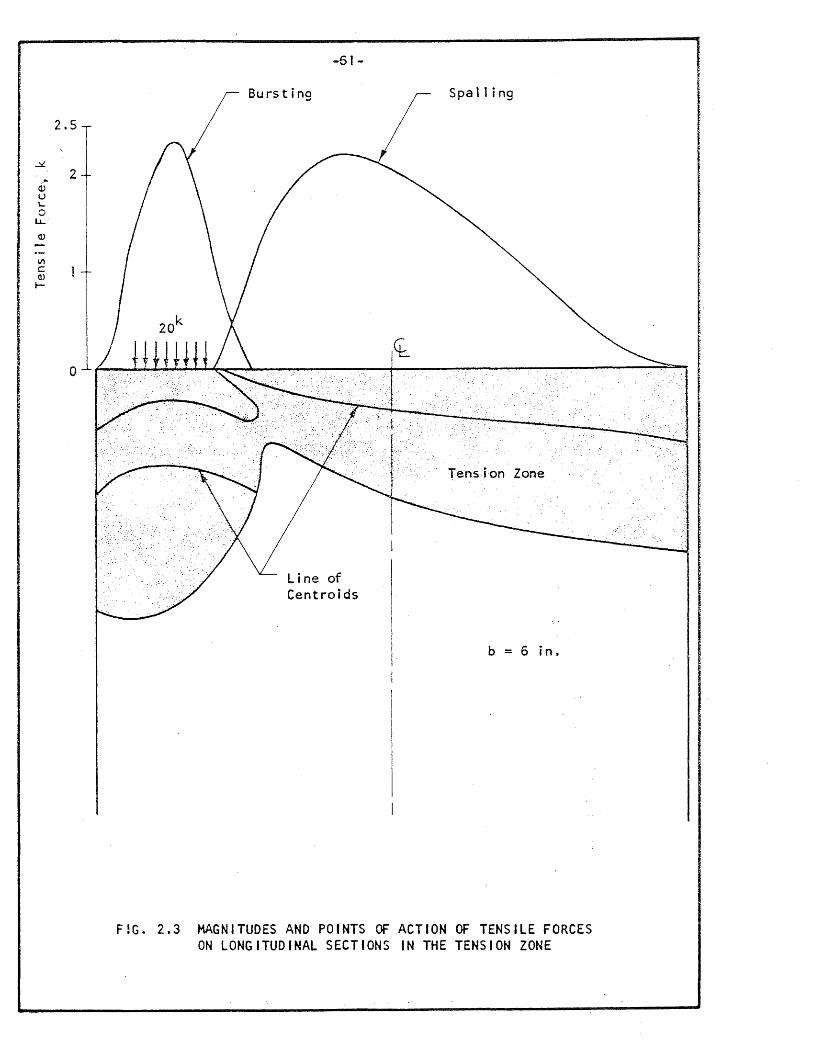
..::L.
," Q) u ~
0 I.l..
Q)
V'l C Q)
~
2.5
2
o
-5 t-
Bursting
Line of Centroids
Spa 11 i ng
b = 6 in,
F!G. 2.3 MAGNITUDES AND POi"NTS OF ACTION OF TENSILE FORCES ON LONGITUDINAL SECTIONS IN THE TENSION ZONE
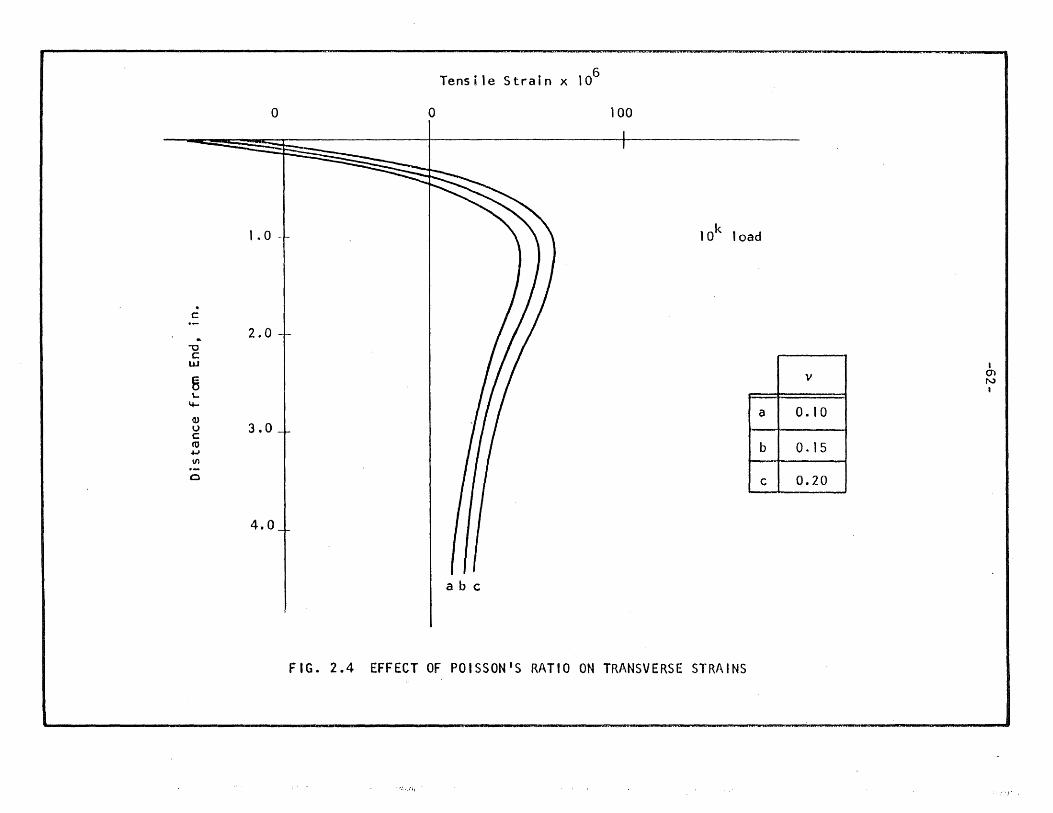
Tensile Strain x 106
o o 100
1. 0 - k 10 load
· c -2~O ..
-0 c:
UJ
III I
V m 8 N
I \...
~
II I I a o~ 10 OJ
3~0 u c: "' II I I b O~ 15 +oJ en .-
0
III ~ 0.20
4.0
abc
FIG. 2.4 EFFECT OF POISSON'S RATIO ON TRANSVERSE STRAINS
,n,
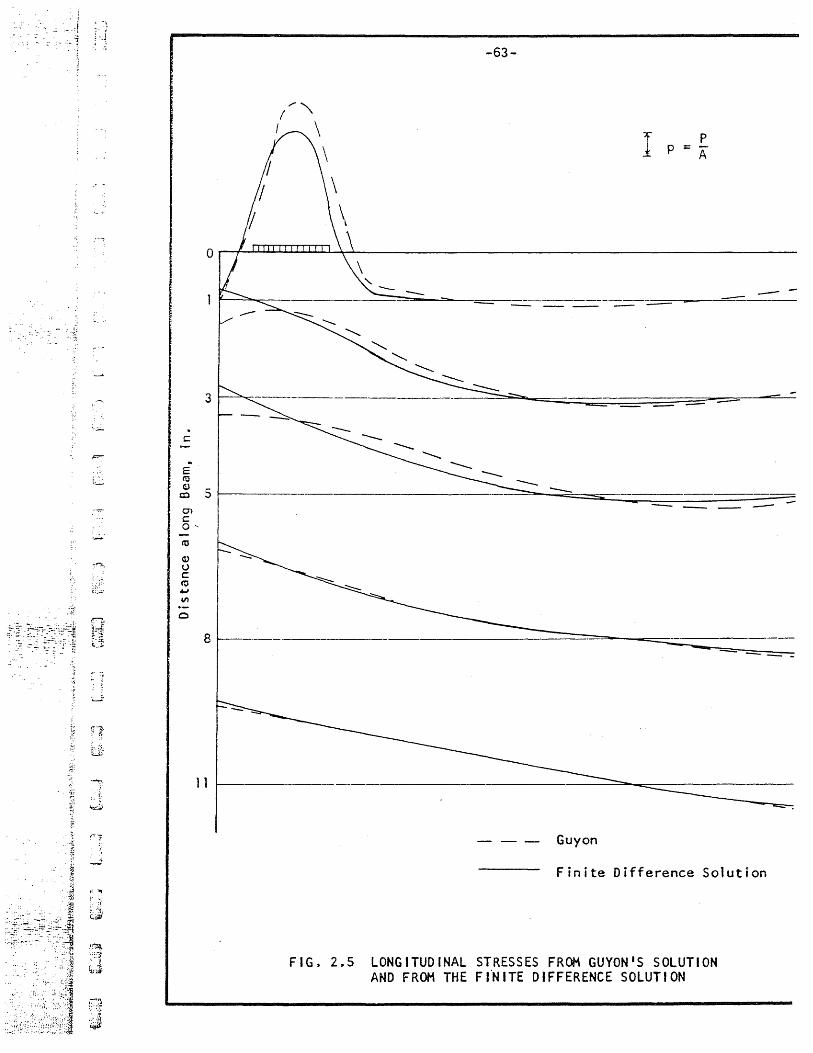
,.-'"
-63-
I .... '" I \
\
\
Or-f-~~~~~~~-------------------------------------------------------
3
c:
E to cu
5 co
O"l c: 0'
to
~ U c: to .6J CI'I
0
8
11
-- -===---==---===-==--==:-==-_._-==--- '=---..-- -
--
-- ------
._--------------
-- -
- -- - Guyon
Finite Difference Solution
FIG~ 2.5 LONGITUDINAL STRESSES FROM GUYON'S SOLUTION AND FROM THE FfNITE DIFFERENCE SOLUTION
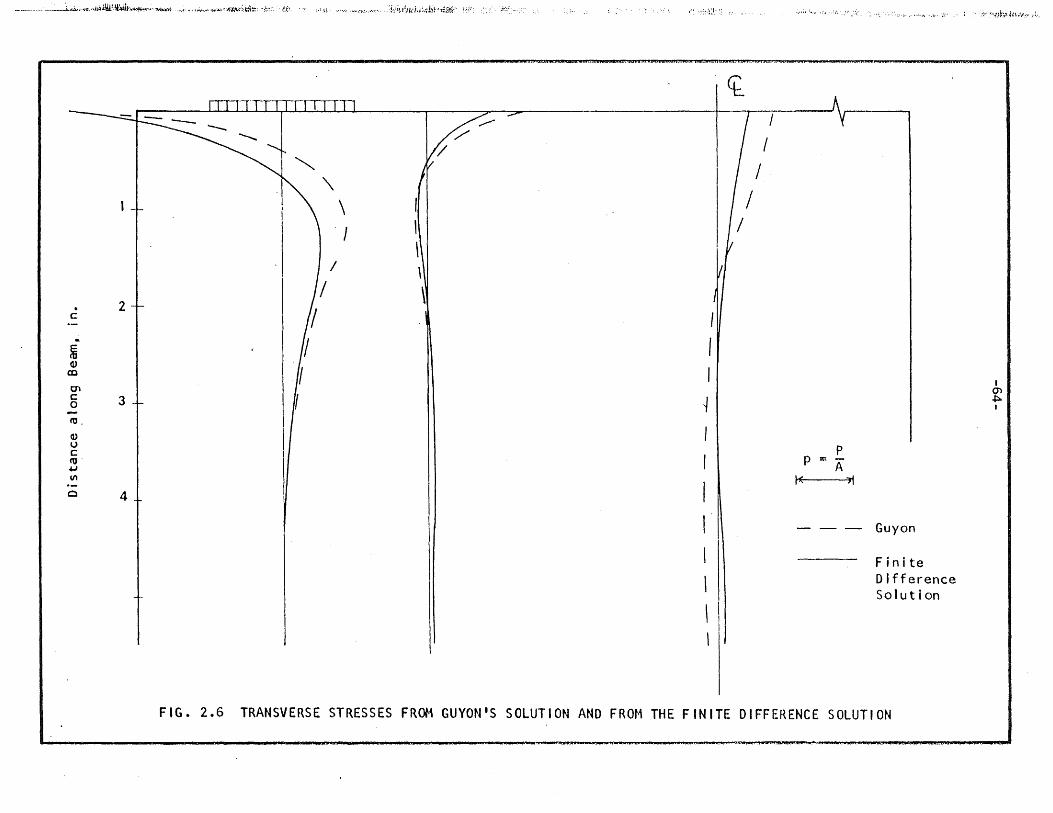
____ . ____ ~~ ... ,,:.r.j))l\U~1l~J:v+~~ .... ~ ,.,~'" .~~ ...... ~~ .. ; ~{~:;~ta~ .:~.:.,:: ,t~~ ;.-q~ ;.," ...... ~ .... ~: ............. " :·~,i;ipf}lr~k.:·~:htJ\~~~·:· ~ ... :;~: ... 1:~: .. _
c
.. ~ Q) co
Ol c o roo Q) u c ro .4J Ion
o
2
~ 3 ~
4
~ ~
/
I
/
" . ,:~:: ~I •• :
I , I
i
I I \
\
CL
/
I
/
/
~,,:. :....... ':, . '," ".:.'. "."~'.:.,., ........ ',V' ::" :~.' .;:~~ .. }t;.~4t~,\t!: ... ";".
p p ~ A
t( '1i
- - - Guyon
Finite Difference So lu t i on
I Ol ~ I
FIG. 2.6 TRANSVERSE STRESSES FROM GUYON'S SOLUTION AND FROM THE FINITE DIFFERENCE SOLUTION
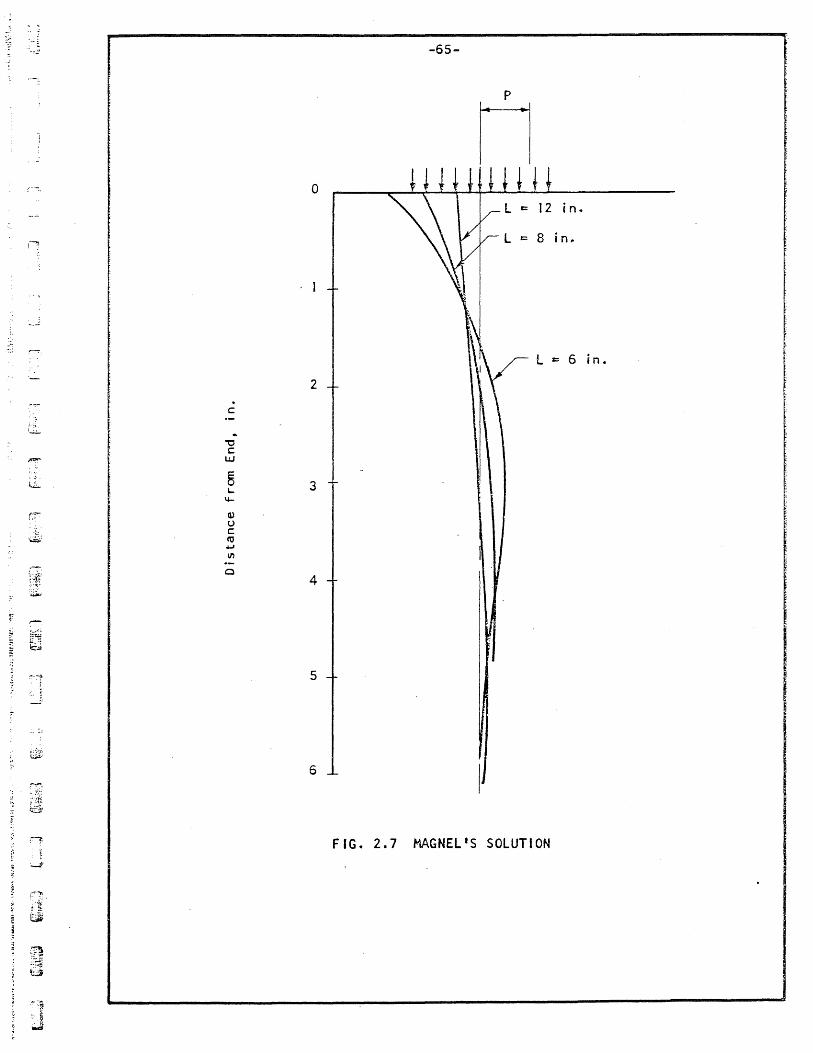
.... ~J.'
" J..
'~-:;
J.,." , '
c
""0 C
UJ
G) to) C 1'0 ...., If)
o
-65-
h o
, I
in.
2
3
4
5
6
FIG. 2.7 MAGNEl'S SOLUTION
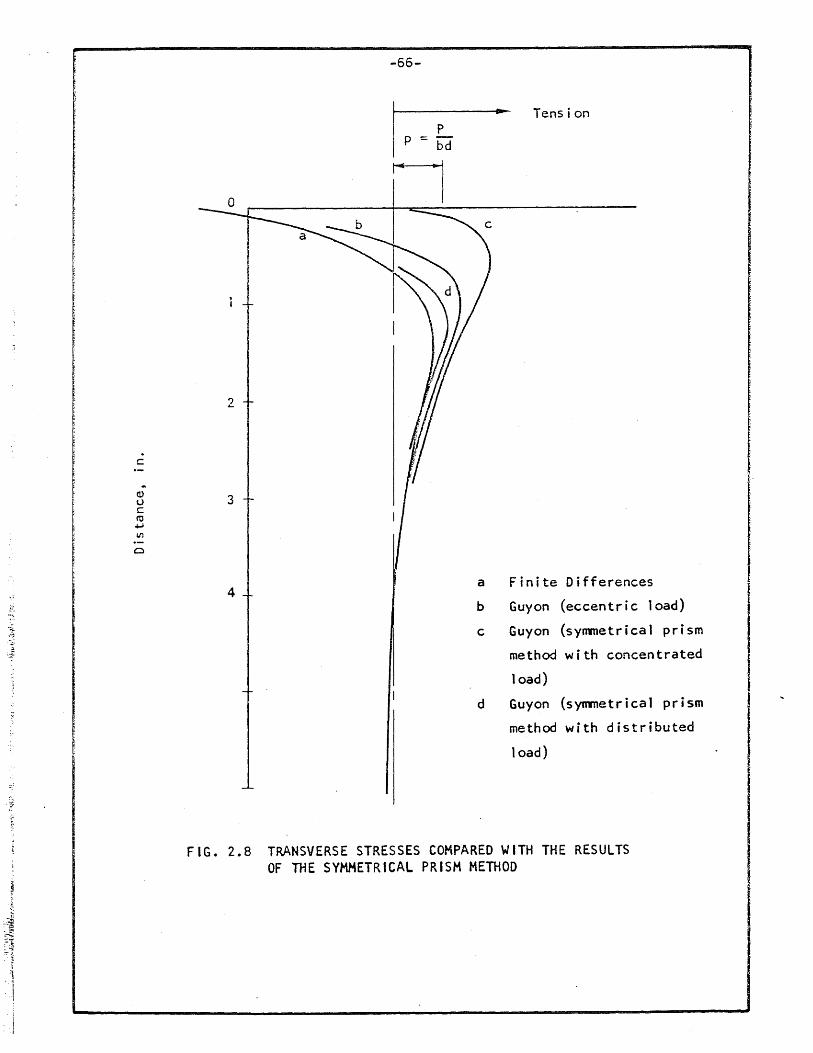
or '.'
l
. C
-66-
4
Tension
a Finite Differences
b Guyon (eccentric load)
c Guyon (symmetrical prism
method with concentrated
load)
d Guyon (symmetrical prism
method with distributed
load)
FIG. 2.8 TRANSVERSE STRESSES COMPARED WITH THE RESULTS OF THE SYMMETRICAL PRISM METHOD
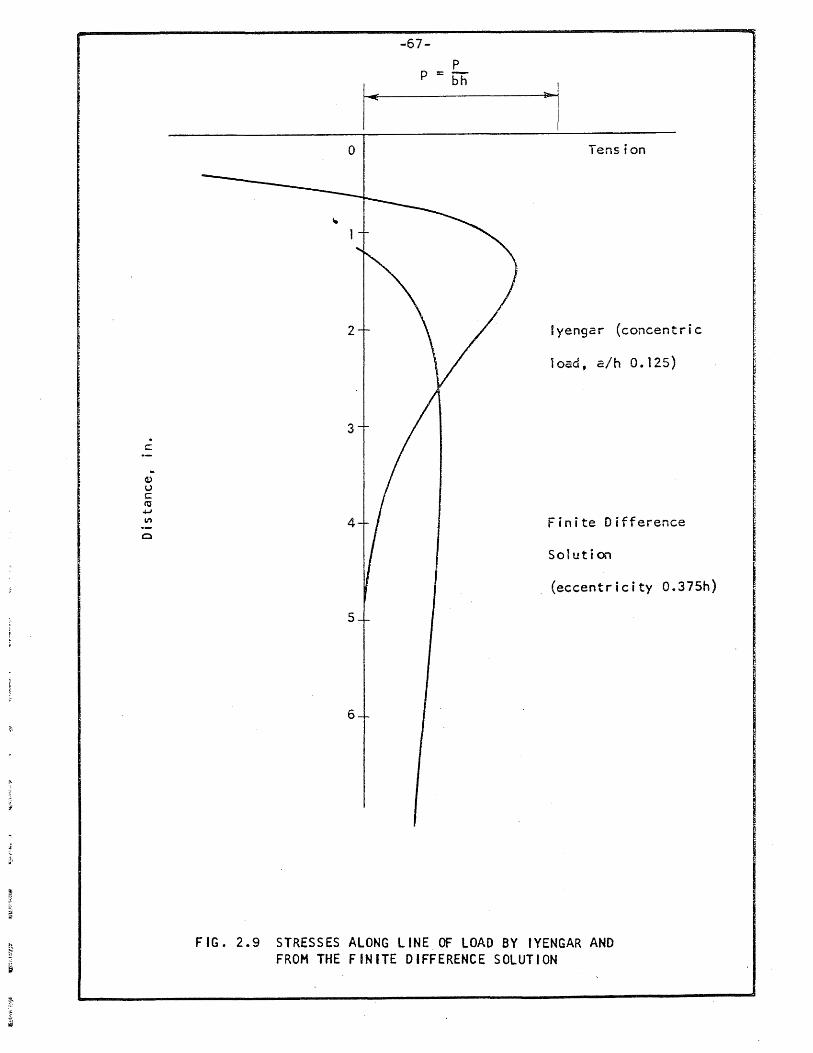
. c:
.. (I.) u c: ~ ~
If)
o
o
5
6
-67-p
P II: bh
~I Tension
Iyengar (concentric
load, a/h 0.125)
Finite Difference
Solution
(eccentricity O,375h)
FIG. 2.9 STRESSES ALONG LINE OF LOAD BY IYENGAR AND FROM THE FINITE DIFFERENCE SOLUTION
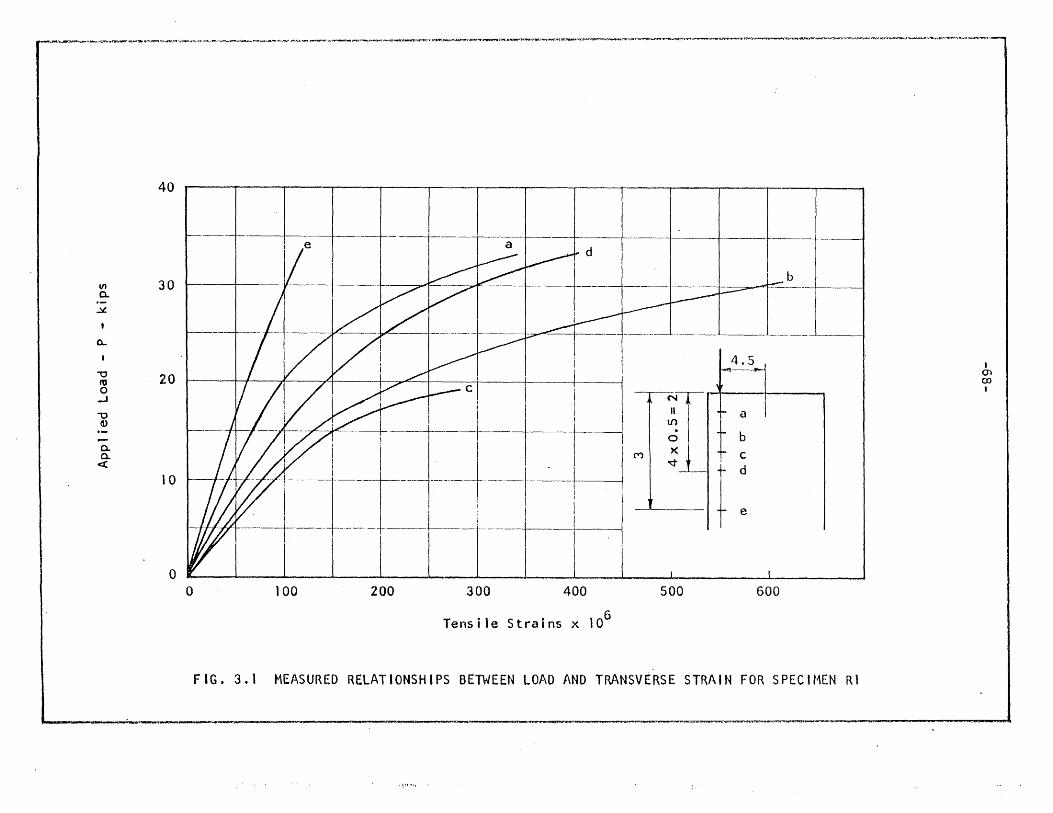
~ ... ~ ... (:;~,~~ .... ~~..-s::..""''''-''''''''M_._.-_~._ ... rr ...... ,; .... _ ... ~~ ___ ,~.......-,._~~_.~~~'#~._~~""_J.-I"~~.~,""",""'. I~'''''''''~.~. __ ..... _ ......... ~~_. _.,,-.. ,..,....~ . ..-=_. _ ..• "'. __ ....... _,,?'<";!"II~~t'rX-.-.......,._~·~_~~~ ..... ~....-,,_V.~_
If)
0-
~
0..
-0 fU o --' -0 d)
0-0-«
40
30
20
10
o o
e
b
.. __ L .. _. ___ .l-.. ____ ~ __ .
I i
I
! C 1 I I I ,! I 4.5
'=-+ ,~ I __ I I +-1 V
· .--.' ' "', , ' I -- t' I ..... ! I i ---- I I II ~ 1 I . 1 t--~ ~T I a
-t--.. _. __ 1 ' . I 1 • ltd , 1.-. _I ill 1 I
I ~' I I I I --r -----1--1 -'----I T e
100 200 300 400 500 600
Tensile Strains x 106
FIG. 3.1 MEASURED RELATIONSHIPS BETWEEN LOAD AND TRANSVERSE STRAIN FOR SPEClt1EN RI
I (j) 00 ,
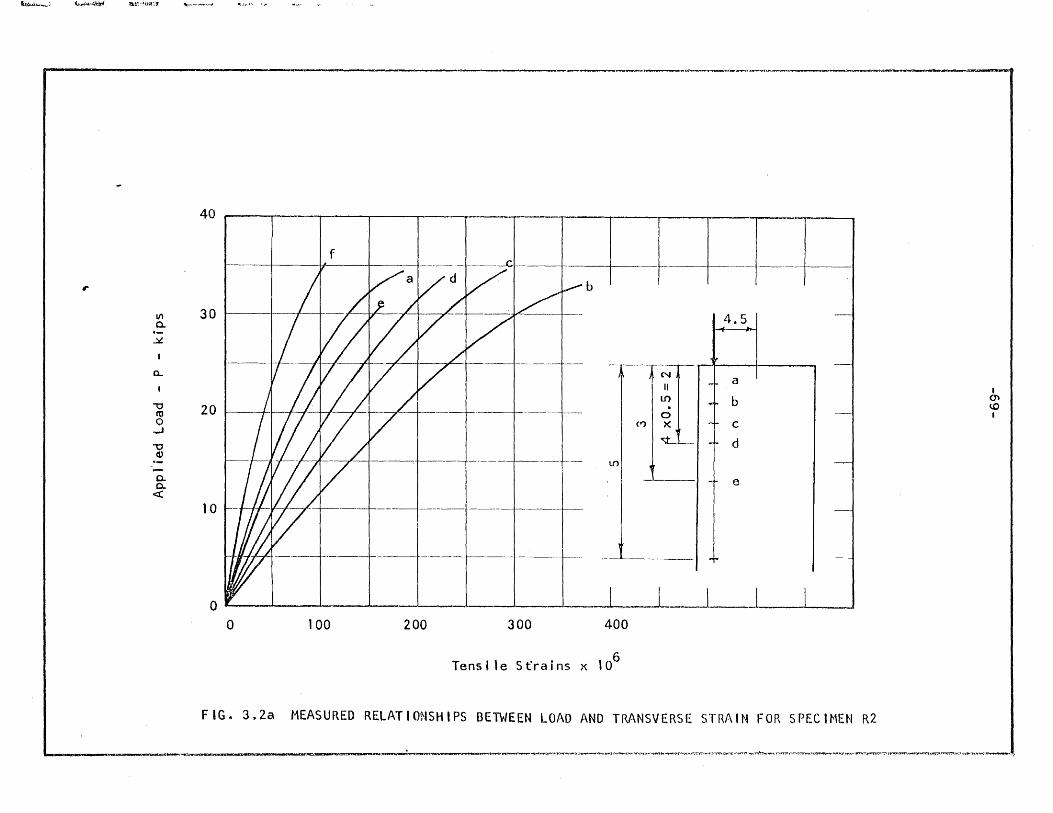
lb:;.:.,""-) ....... "'~ li;';'. ,''''''OY
40
f
,. b
Vl a..
3 0 J-.-- I I-+- 4.5 ~
l-
0... I N a II -
"'0 m 0
,..J
20 I f I I I I / / +- --.I~I:--.....J--to
"'~ b . 0
M x, ~ c
"'0 ~'-- - d (1)
If) , C-o..
<t:
j ~ e
1 0 ....... --I-H-v--F~
t-
o o too 200 300 400
Tensi le Strains x 106
FIG 4 3. 2a MEASURED RELAT I ONS~iI PS BETWEEN LOAD AND TRANSVERSE STRA I N FOR S PEe H1EN R2
Lx ........ _,....., -~~~ ,~~~~~~~~~.~.~~~.~~~
I m (,() I
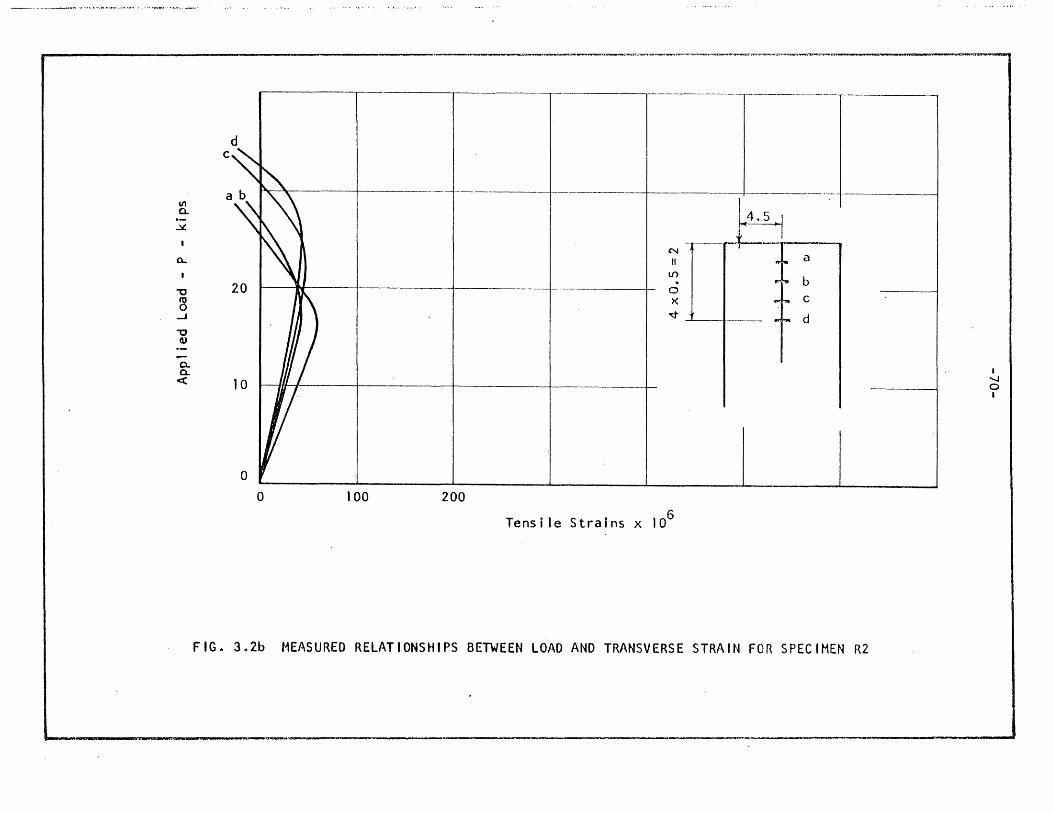
r-------------------------------------------------------------------~------~~~~--~---~. -~~-~
d c ... ' I
I
-----l----VI -~~I-~-Q. - '\~ I
.::£
0...
"'C 20
~~ N 1 a II
If) _ b N ~
~ -.J
." G,)
--0. Q. « 10
o 100 200
Tensile Strains x 106
FIG~ 382b HEASURED RELATIONSHIPS BETWEEN LOAD AND TRANSVERSE STRAIN FOR SPECIMEN R2
I --..J o I
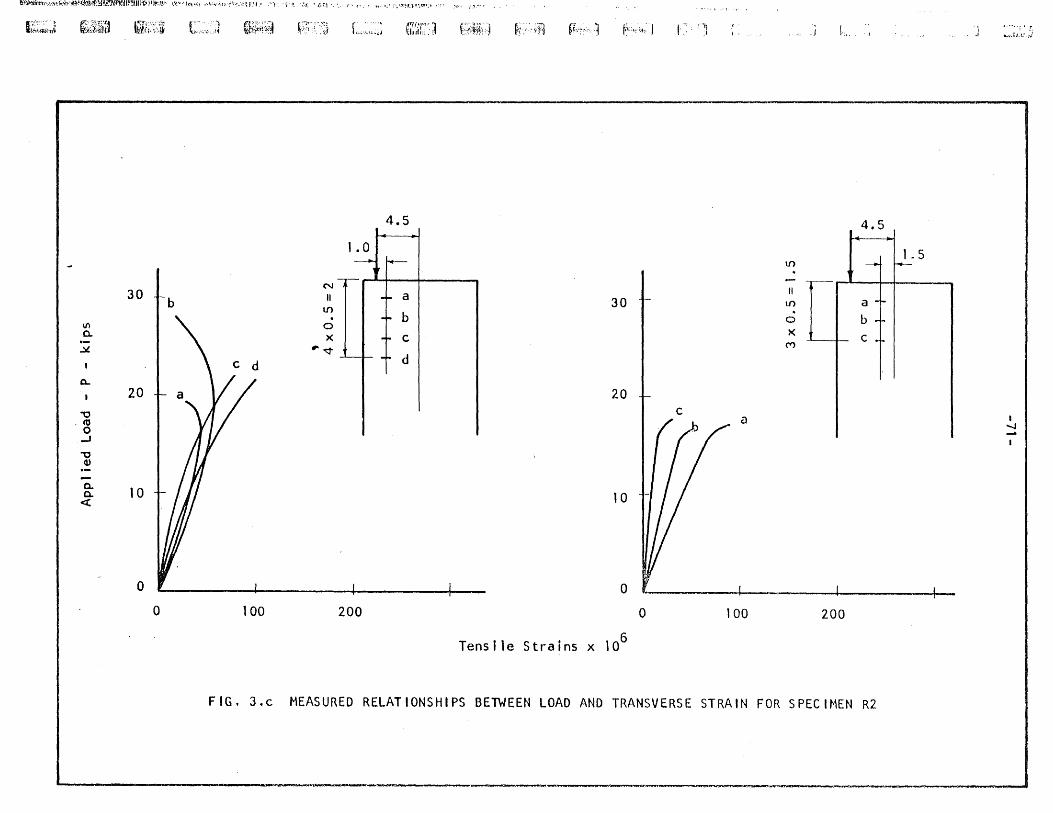
~~~~~'t~tb])1:'fto}r'·W.t~~~:Hj~P)!fU'!fIH.:c.";~;¥qJ.;·· i:I.'u·\r,\\;::t .'·F ... q.l,t~l:·,;,t~nt! .,T1 , ~'.~ '.,""I'.f "::i.~.I" \~, ,!" • '1, .. 1;' r.'.~~;,.)' .. ,tl'':' ,Or" :v. ;:c .....
H:;,;·O"·:···t II:f"",~'fij
r-: ---.. :~ ~J~l';1il(l
II)
0..
.:::J.
~
"0 .ro
0 -' "0
11> --0-0.. «
Mrf/~'~ C· .. :~J . !i .. {~. ~'~ ... --~ .l:!"'.,
30 Lb
C d
20 ;; 10 T l JI
o o 1 00
~;';'.~:'~j L,: .. ".;; ~'Jr::. a F~~i~'!:') ~;~:;:. ;'f.l fi.t~: ...... ~ t·'v::".-+·
4.5
1.0H
~T'-~ a 30 t • -t- b 0 x -t- C
,.~
20
10
o 200 o
Tensile Strains x \06
I:: ."
c / h ---
, I
a
100
.J 1:..
4.5
I. /1.5 If)
" If) . 0
x M
200
FIG. 3.e MEASURED RELATIONSHIPS BETWEEN LOAD AND TRANSVERSE STRAIN FOR SPECI~'EN R2
~--------------------------------~----.-=------------------------------~------------------~~.
. .I f·····:' r ....... L,."t,.?;:J
, '-l
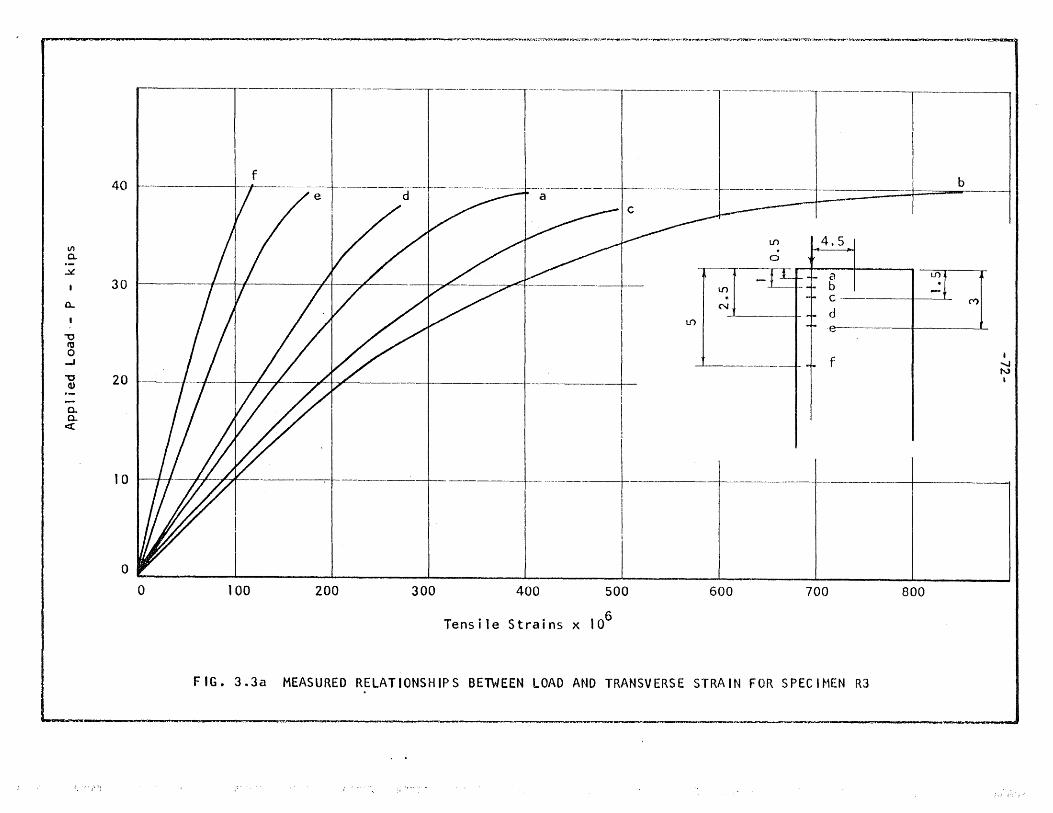
I/)
a. .::L
a..
" IV o ..... "0 Q)
0-Q.
c:x:
"=-."""""~~~"""""'_~~ __ ~~~tn'T'lD'".,.. ","~~""'I."T"!II'J~~r':r~v~!~~ :;::aU!I!L~
40
-- ----·----1 ---- -----·---l-~---~--r~·· l I
TTl I b
I f I------·-·--t·----------·l-._.---------~~-------+------=-.-±-- I t----------+r---/ei d ~ a __ I c
--------T
! ./
-----.-----LI
30 t-I---If)
IJ") I N
20 I {{ / 7' / I"
If) 14.5
a b c -d .e--
f
If)
(Y)
I -..J N I
-l I I ----. -----.-. - ---+-._--------+------+--------.,---- --+----1 -
I I 10
I I
o -r--------~--------~--------~ ________ ~ ________ ~ ____ ~ __ ~ _________ L_ ________ L_ ______ ~ a 100 200 300 400 500 600 700 800
Tensile Strains x 106
FIG. 3 .. 3a MEASURED RELATIONSHIPS BETh/EEN LOAD AND TRANSVERSE STRAIN FOR SPECIMEN R3
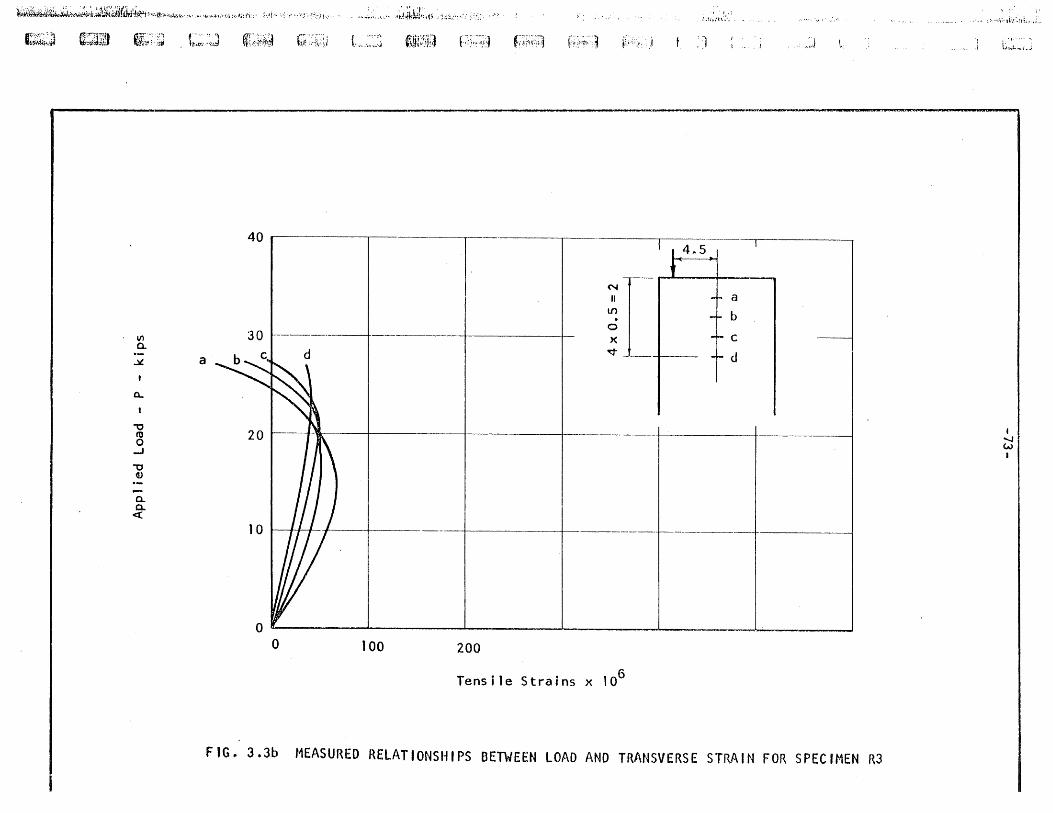
~l~~~>i<~~.~'\]i~j{Jn~r"A~",~.:li,<"'''''' O" .... ~h.'W,·:\;:f"t:· ;·'1-·,;" """""':,11,' ...~.~i~kl;,.~) . ;', " . t i : I' I T. ~: .~ :
11,'-::0:-", ~":'i~'il Wf#..~i-I tib~.:i;t;iiJ
Li:1[':o:1 ~j~~' .. ,~
Ion a. jl
n..
"'0 to 0
..J
"'0 G)
a. a.. «
t;):~d ~~i~~ G:;;·i:~1 ( ",':' ~fI"';r.'1 C:~ --'J f-~;"·'':'l • ,', ", ••• ,,j ~W~·J:':l {.;~!':':IJ r,;,;'1l::';J fi;:;~·:~:~ J . J,J
40 I --r~---- 4 .. 5
t
~ILi~ ~ - d
30
a
a too 200
Tensile Strains x 106
FIG .. 3.3b MEASURED RELATIONSHIPS BETWEEN LOAD AND TRANSVERSE STRAIN FOR SPECIMEN R3
\ i'
·.;;,,('t·.,,;', .. : ..
ti....,L.. .... ;.,.;
I "'-J W I
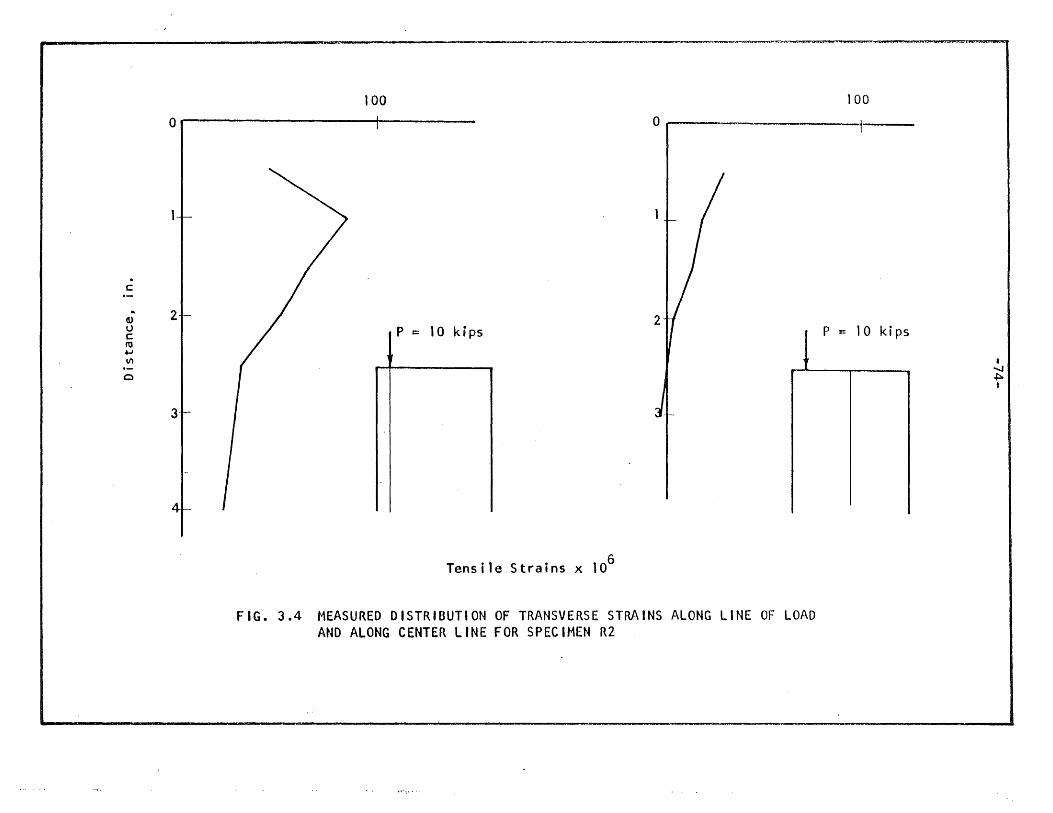
c
G) u C f'O ~ V)
o
100 a r-. --------------i------ 0..-
2
3
P = 10 kips
Tensi1e Strains x 106
FIG. 3.4 MEASURED DISTRIBUTION OF TRANSVERSE STRAINS ALONG LINE OF LOAD AND ALONG CENTER LINE FOR SPECIMEN R2
100
P %:: 10 kips
• ....... ~ I
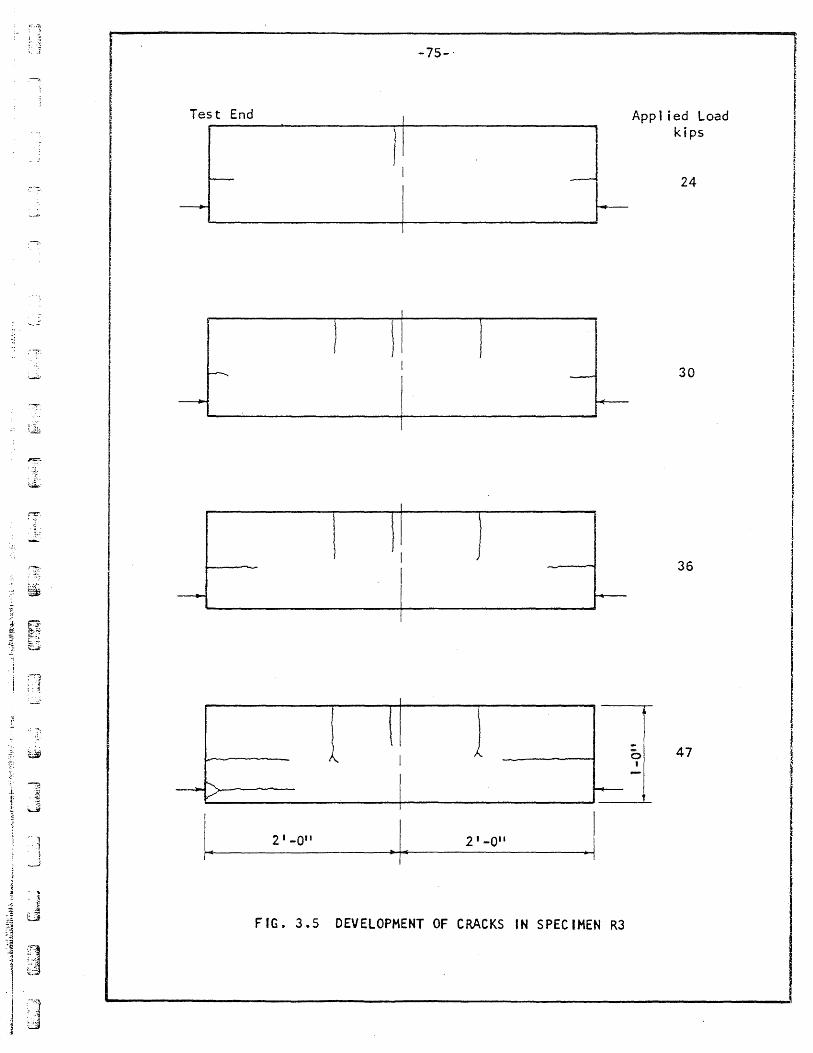
.-.T.
Test End
-
.... _.-
t7·.
~
~
~L
""7:'-
~
rr. . ..... ,:'
-. ---
r-;~
,- ~ ----~ .fi ~ !r; .;..;: ~ ~~ ~~
t
--~" , .~
i ~ -,
~ I"'--, V
l
-75--
I
I I
1 I
! I
21-0"
·1·
,
A.
2'-0"
-
~
r--
I ·1
FIG. 3.5 DEVELOPMENT OF CRACKS IN SPECIMEN R3
App tied Load kips
24
30
36
o 47 ,
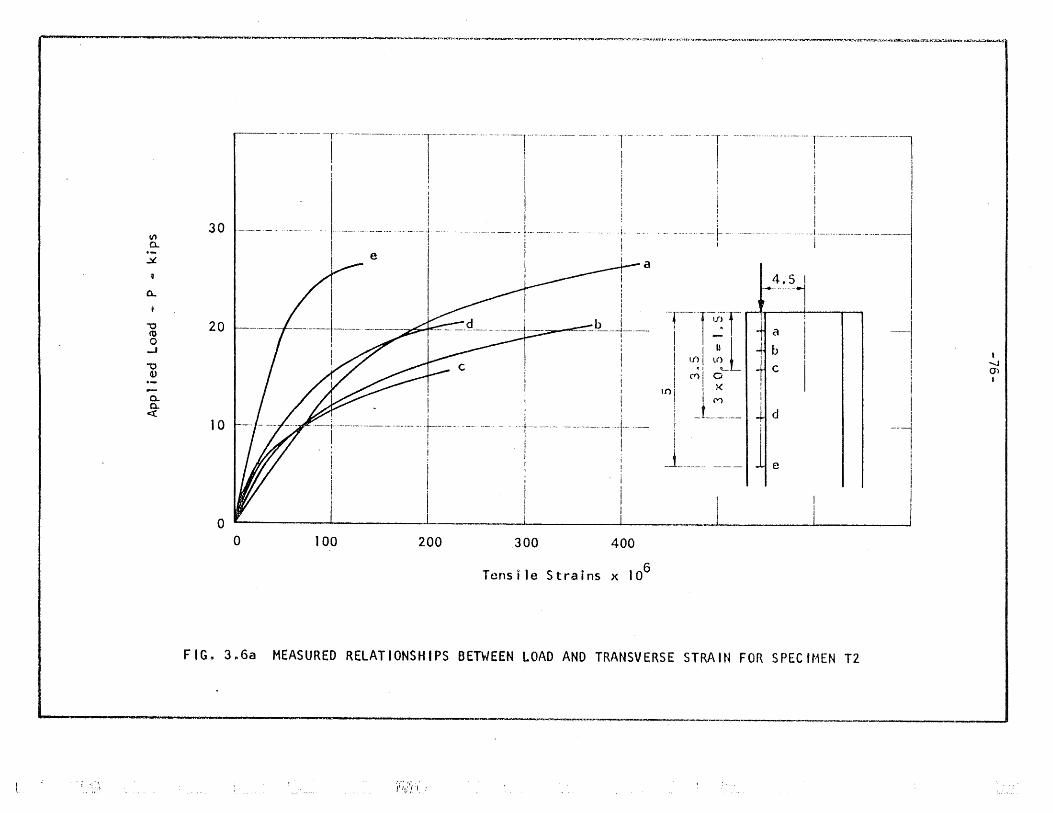
"" C-o-
.::I.
0-
"0 fU 0 -' "0
0.>
Q. 0... <!
30
20
10
o o
,..tt:n'''~.!" __ 1!:r~~.'CTM.~='''''. ~1r.Y1 .. =.~=......,.,_~.t-..r~~.C"<,", .. ~~~~-r-~:'."'':.'II;t~a::nr..o::~",,"''!;''.·..:~ • .r''''~·'''.'';3'1''~-nr::r-_'V_""""~~"""~~~U~'Io-)f~.a..~~
-- -- ------ -r-'- -----------------1----- --------- ----'----1"------ --- --.-- '.-
I I i r- ------
I I I ! , I ' j
I , i ! I
.• ~ - .• --~.---- -- - _._-'--_. -- .f.-_ .. _--_ .. ___ ..
I : : I
I !
I I
e
I
I !
i I
i i I
a
b --1----- .. - I , , , I ;
----r-
I I I ~
I
-- -- ·---------l
I I
! ;
---!--- -------- _.- .. _ .. __ 1 ___ . _________ _
I
4.5 I f..-.--·--1 I I -r----T-U!-r
I I -; I ~ b I If.,! L() L I ., L. C i Mlo
-+ta
, I
~ !
I I X I 10' I I I 1M!
i I i : i i .
---t--------- -- --- -- -- ,----- - - '--f--- ---- -- - ------.. -- .. -1.-I ii I
i I I . I '
100
I ,
200
I ,
300 400
Tensile Strains x 106
! _t_______ -u d
i I
J _______ -___ I -4 e
----1
I I i
I
I I
• -...J (J) I
FIGs 3 .. 6a MEASURED RELATIONSHIPS BETWEEN LOAD AND TRANSVERSE STRAIN FOR SPECIHEN T2
.j i',: ~/!~i: .' i ~
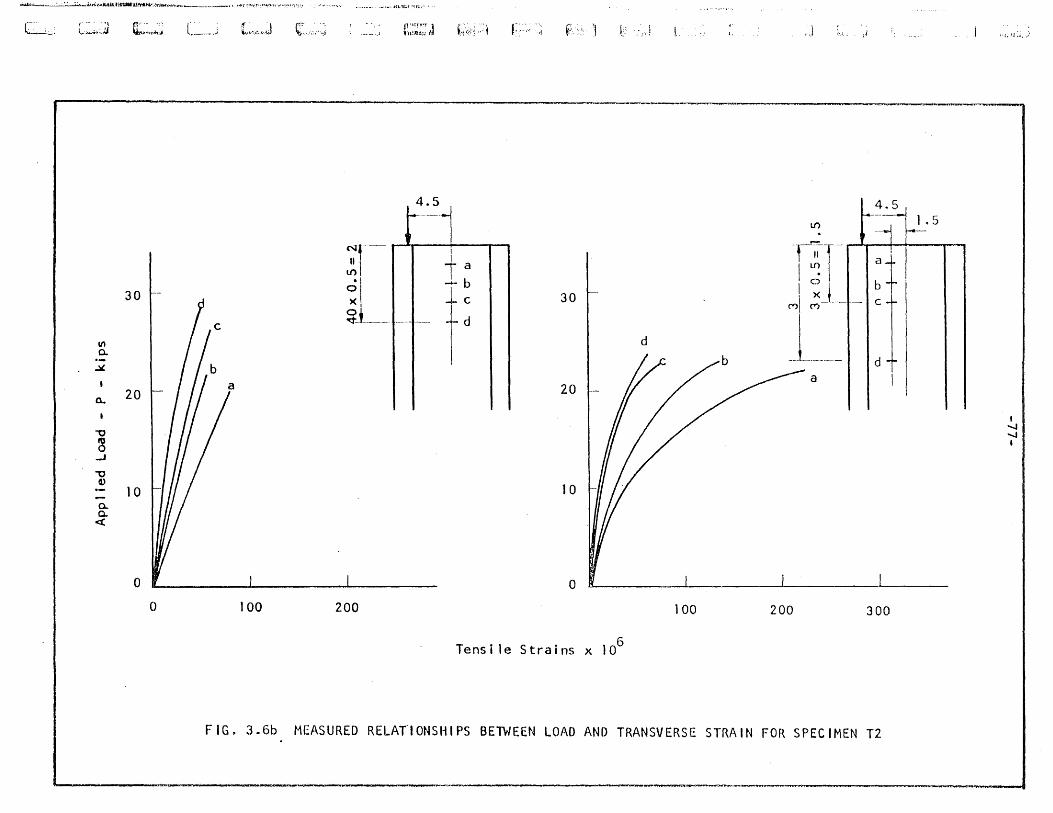
~--.._--=-":,,~_.u'<""'M!l.tittMlJ:)M""":':-t~~,,,~,o....-____ ..... _~, \ t-1"r ~.~~" .'C"'l.:.""I>' • . -r'''~!<l ~,'::.;_. .. .... __ ., .... .... . \(t,.u ... ~ .n .... "-' 0, ...
L~. I .. rJ '\
\..:,,-",~.(.( a::,,~~ L. ___ .,j It' .. ,J I- i.'~.J :i. ) L".~,·J C ... ;:, ...... f;;:~;;/l f:·~·· ~,~(h ,,'1 F '] .. __ .,J f:.: :,.)
N-- ~~I " 1 I "!
30 r ~! I: r~ r xl 1 I • 00L c 30 I a
~ I / / b <t --i-,- t d d M\ ~_L 0.. 20 r I II /_ I I // /b 1 ___ I I d I I I I 20 /' --- a
"3 1 111 / II//, -' I I I ,
." 11/// I ~ ~ = 10 Hili "j" 0-~ 10
o o o 100 200 100 200 300
Tensi Ie Strains x 106
FIG. 3.6b MEASURED RELAT'IONSHIPS BETWEEN LOAD AND TRANSVERSE STRAIN FOR SPECIMEN T2
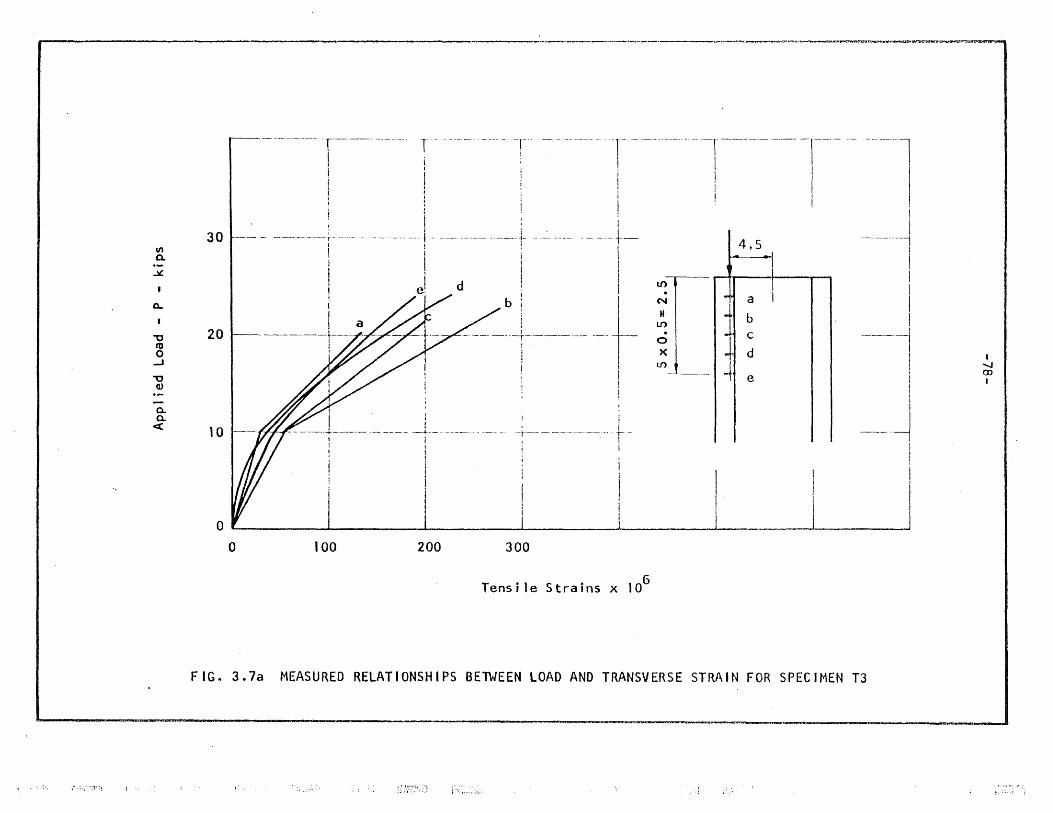
(. :; ~~1~';~
VI a.
.::L.
0..
"0 ro o -.J
"0 OJ
a. a..
<X:
r----- -------- r-- -----I \
! !
;
-r-i
-- -- ---- - -r \
j . I
30 r-- - -- -- --,---- 1- --- ----- ----+ ---- ---- -----t-
20
10
I ! I I
!
1
. I
I I i I
e~ d I b I
, I -- ---- ---l-~--- .--- ---- T-! I I I . !
!
4--i ! I 1 - ----_._;--------- -.---.- -+--.-.---~
I -j---
I i
--------l --- --l---- ------ -I-I
1 I
i I 1
I I I 1 I ! I
I ------, t 4.5 i ~--j
I I
~r I I 1 -----1 I
I ~l __ i I I I i
I -I I
!
o ,~--______ ~~ ________ ~ __________ ~ __________ ~ __________ ~ __________ ~ __________ ~
a 100 200 300
Tensi Ie Strains x 106
FIG4 3,7a MEASURED RELATIONSHIPS BETWEEN LOAD AND TRANSVERSE STRAIN FOR SPECIMEN T3
,- frn'~~::' ....
, "'-J en t
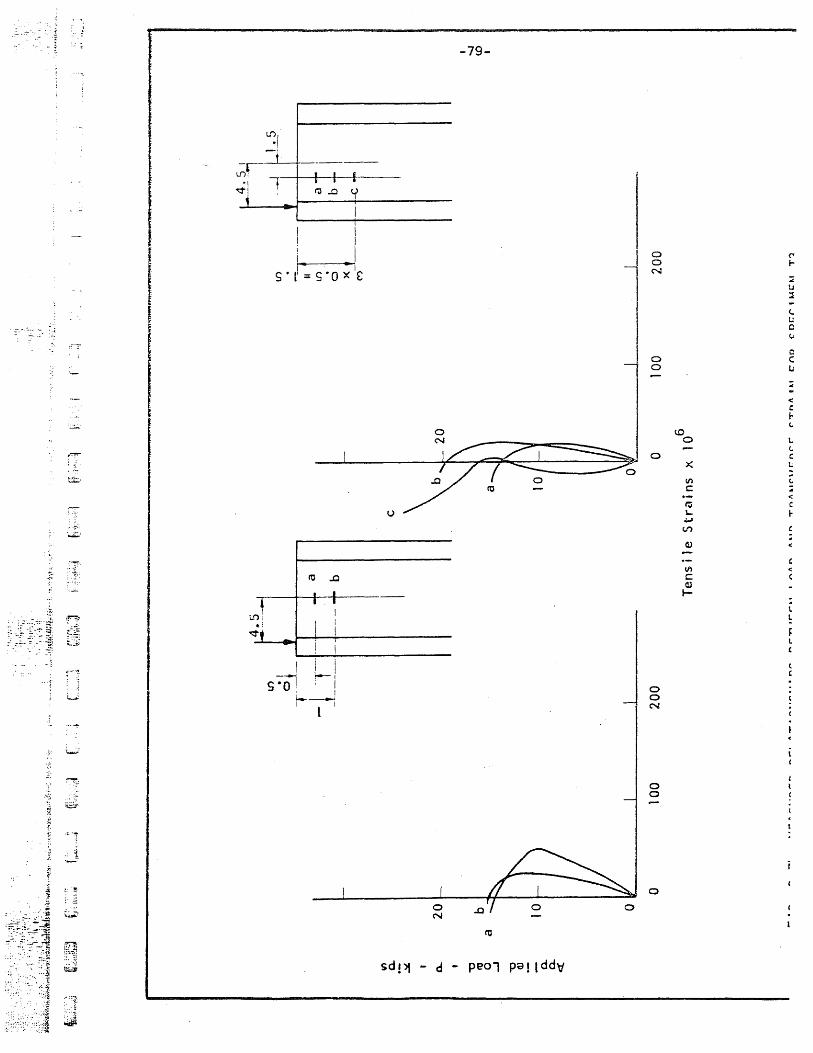
· ':"~' ... :,,,~..,, .. ;:
'"
'·'fgj
, .. :;. '~I
~:
." .~
~ .. ~
V:,
-r-~-----Lf"), , I i
·i t i.' vi CO..o y
~ i I 1--1
S·O ; I f----i
l I
o
-79-
o
o o N
o o
j77<¥~o co -
o o N
o o
o
x
1/1 c: <lJ I-
c C
'" < C ~ (,.
L <. c L
.. < c l-
e .. c
c C
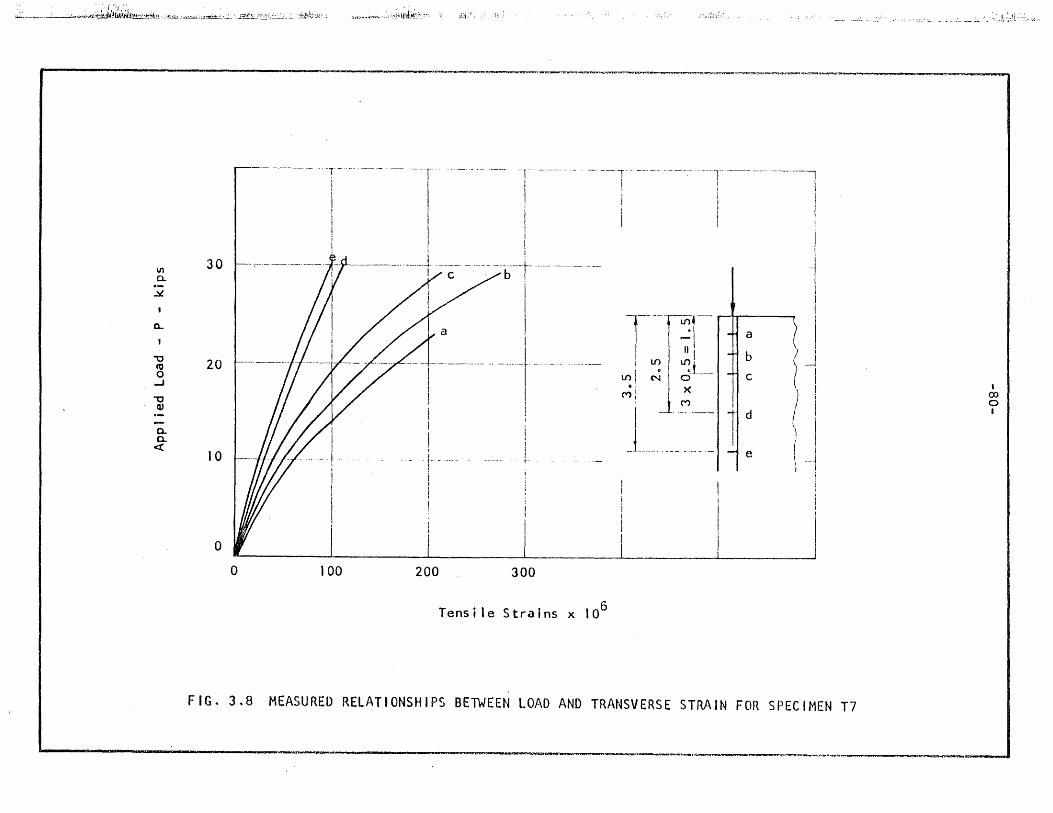
i._. ____ .--..:... __ ._-.~~..i. .. n.~,;~~~j~~t,..£~.~ .. ~;~~~.::. .. ~.'.2.'?~L_:.;":;~;·,~··.::.~~. \~~~~·;X·-: .,~;., .. ; .. l~~t~;.·:~~: ,~'i' :
III 0..
.::I.
a..
"'0 (tJ 0 -J
"'0 co -a. Q.
c:x:
30
20
10
a o
----=~~~--~~~~~~~--~~~~~~~~~~_~__.~. __ .~u~ .
. -T-··-- -.---- ··-···r-·- .-._ .. ---.. --- -T-· _ .. --..... -. -·---1--·----·-·-·--·-- ··----1-·--·-·-·-------,
i 'I ! i I I j I ! i I I I !
! I I ! i i
.-_._.--.. --.--1. .. ----- -- .----.-.-. __ ._~---I./c/b I
i I I I
i -1
I l---- ''If!4--a (I
- ---- --"--
I -. - ...... -t-. - ... - .. - ... -.-----
I I
I -;;-1 i Lf) Lf) I i • ~ I..f)\ N C)
~i ><
\ I ) I
b \ _I I
II C (I ~
I ... -.- . ~ ..
i
I
100
- - .----
200
! I
i ; I
_ .. - i-- - --
300
Tensi Ie Strains x 106
I M
I _t. __ ._. ____ . __ .. _
) i I I I d I!
\ I ) ; . I
! i e .J I I
;
I I I
I --.J
FIG. 3.8 MEASURED RELATIONSHIPS BErwEEN LOAD AND TRANSVERSE STRAIN FOR SPECH1EN T7
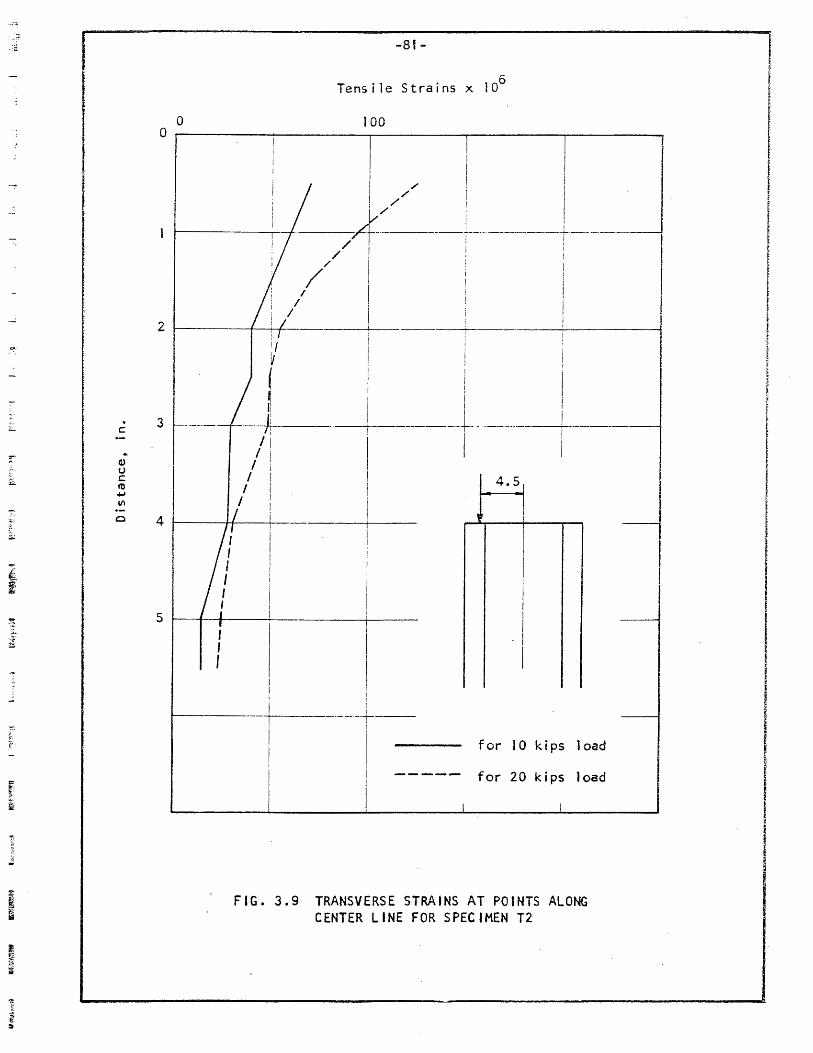
· ""- c
;- .. d)
t.:. U ~ C
." ~
VI
",. 0 ~:
&;
~. f
I J
.-
i..'" r·
f: &Ii
~ ~ ;,
~
~
~ iii
!1 ~
~
t-:t
l :lII
-81-
Tensile Strains x 106
o 100 o
I I // !
///i~_/-----f- ------t-----: I I ' I I I I
: II iii --+-+: f I ----+----.---: --------,I
; I 'I i : V
{ 1
~ ! I
:! Iii I: .---t--.-------... +-.... -·-·····----r-·-----
/1 i I I I ! I
2
3
I I I I I I 4.5
I I i 4 ~--~+---+ I
, i i 1
I i !
5 r--r-+.--~-----_+----, , I
i '--'--,---I
----_._., I
! for 10 kips load
for 20 kips load
FIG. 3.9 TRANSVERSE STRAINS AT POINTS ALONG CENTER LINE FOR SPECIMEN T2
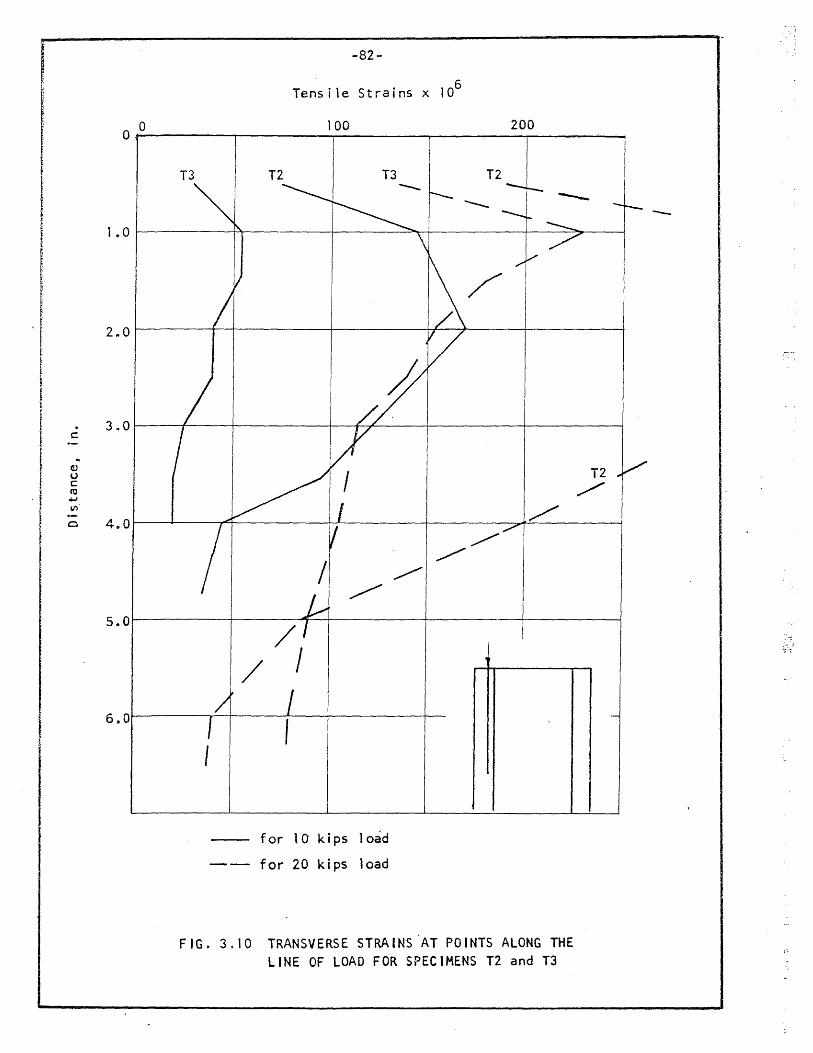
o 0
1 .0
E
~ ~
I , ~
~ 2 .. 0
~ h
~ t
3 .. 0 c
.. e.> u c C1J
J,.J
III
0 4.0
5.0
6 .. 0
-82-
Tens i le Strains x 106
100 200
T3 T2 T3 T2 ~
----
~
/ /,
for 10 kips load
for 20 kips load
~
/'
/ ~
~
FIG. 3.10 TRANSVERSE STRAINS 'AT POINTS ALONG THE LINE OF LOAD FOR SPECIMENS T2 and T3
T2
../
, ,
--
....
,',
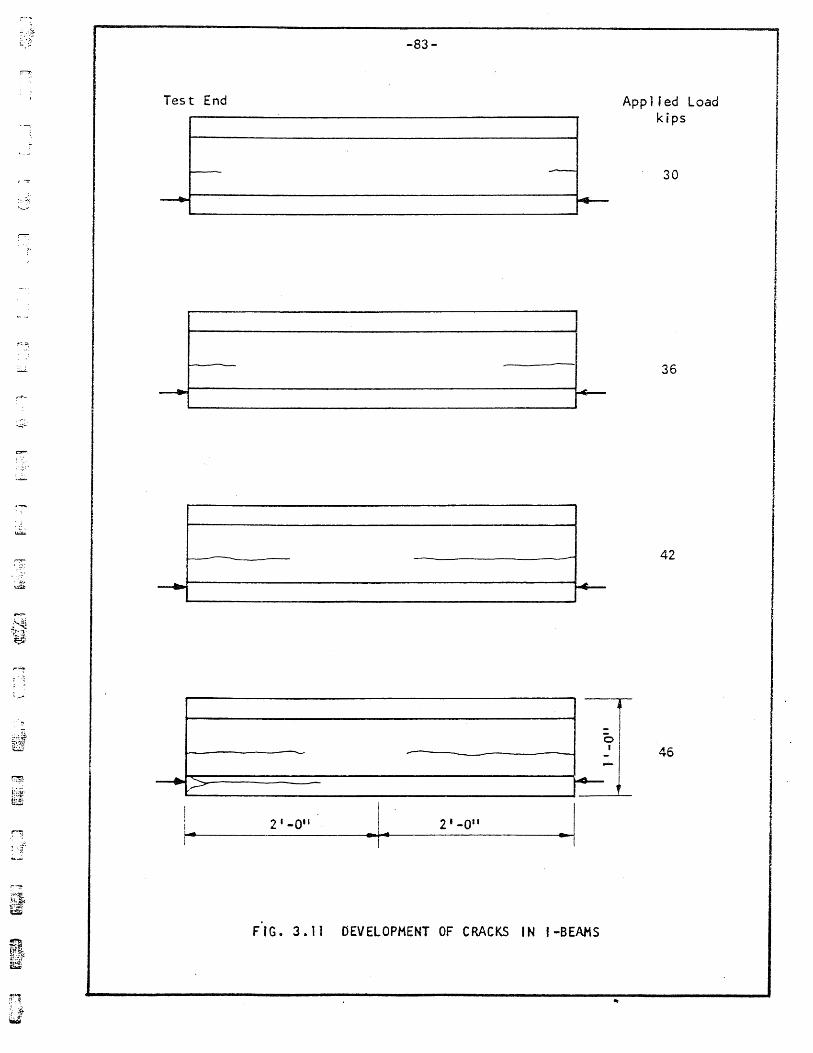
, .. :.;..",;....
: .. ~ . .....:.::
-83-
Test End
-
App 1 i ed Load kips
30
36
42
r-------------------------------------------~ -----~
o I 46
~r~~==========----------------------~~ 1
! I , .. 2'-0" ·1· 21-0" ·1
FIG. 3.11 DEVELOPMENT OF CRACKS IN I-BEAMS
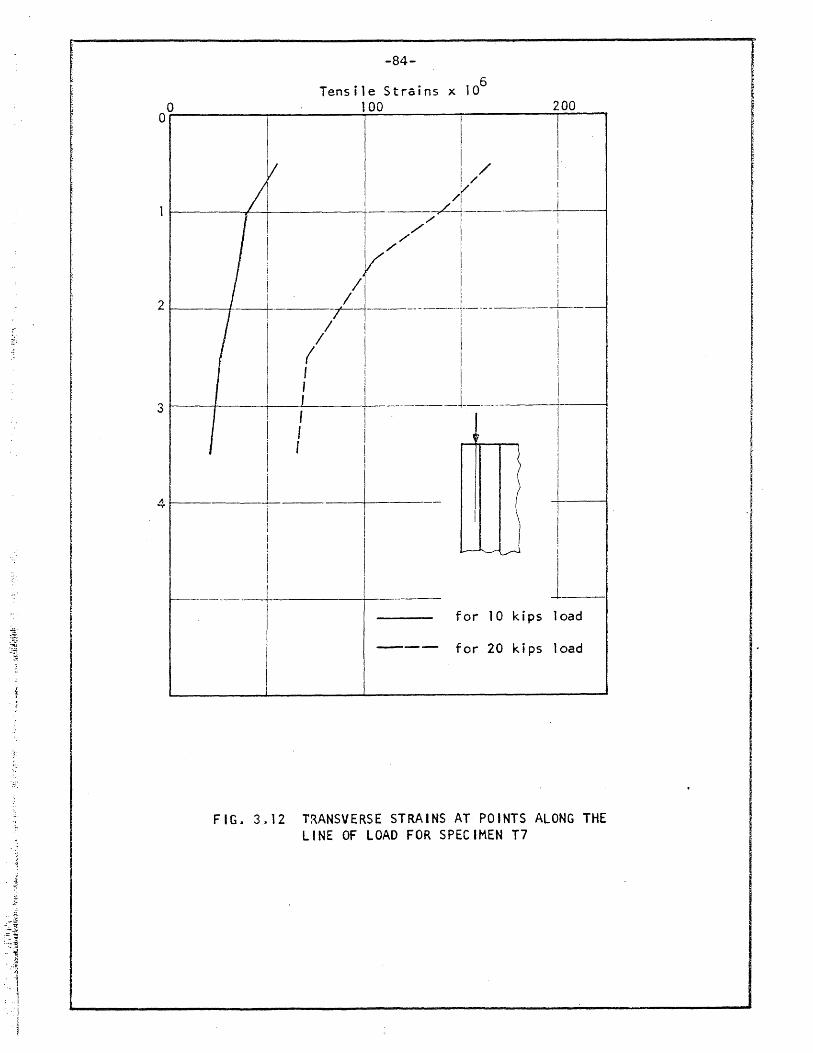
-84-
Tensile Strains x 106
00~ ______ ~ ________ ~1~O~O ______ ~ ________ ~2~OO~~
I I / I / I
1/ I / /r:
t--__ ~-+-__ --+----_/_-l---------L---/' ! !
I /" i I
i i /' 1 ! I Vi /' i I
i / I I
---+-----+~--------i---------+--/ I i I
/' I I (I I !
I I iii I I I ' I I f I _________ 1-____________ L __ _
I I I
2,.-__
, / ill
I i
4~-__ ~i ----+----i I
( )
(
I \
i I T-----l
i
I "-----------+-----\---------
/ -~L-J
I 1--1
for 10k i ps load
for 20 kips load
FIG, 3.12 TRANSVERSE STRAINS AT POINTS ALONG THE LINE OF LOAD FOR SPECIMEN T7
I
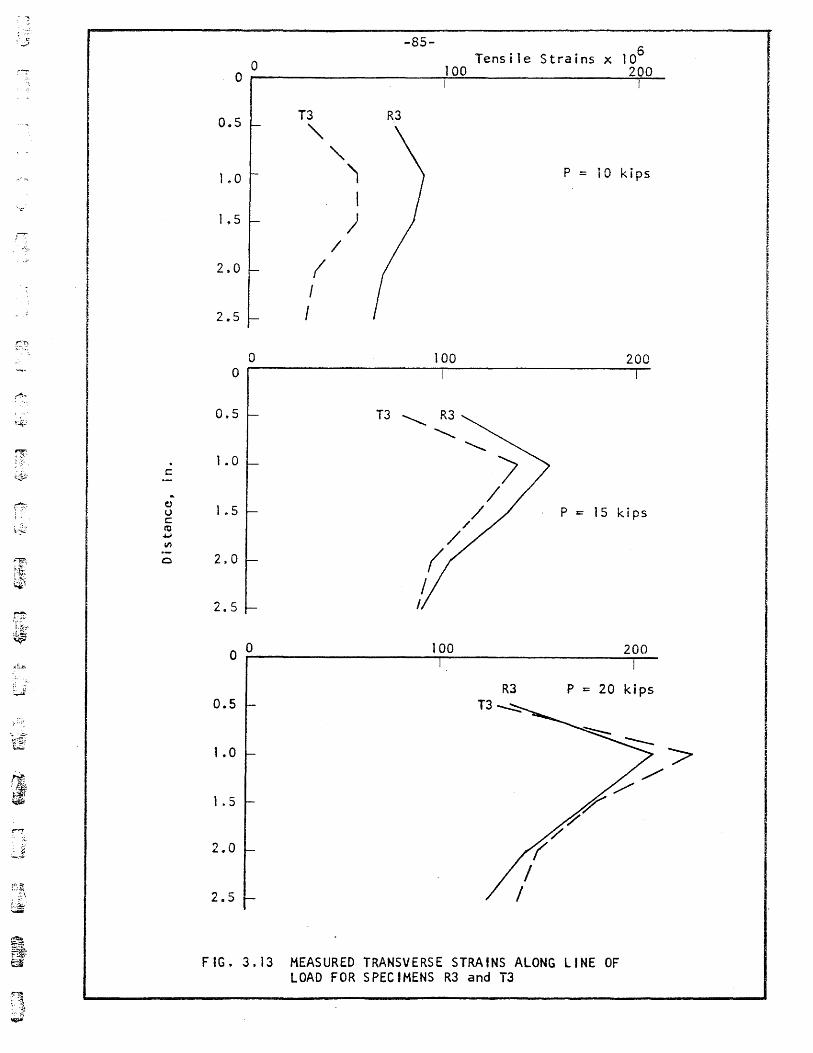
:.5
. c
.. ~ u c ttl
.4oJ I/)
0
o -85-
106 Tens i Ie Strains x
o --------------------~~--------------~~-100 2 a
0.5 T3
"-1 .0
1 .. 5
2s0 ( I
2.5 I
0 0
0.5
1 .0
1 .5
2.0
2.5
o 0
0.5
1 .0
1.5
2.0
2.5
"-'1 I
) /
R3
100
T3 ~ R3
""
100
..............
R3 T3 -..;::::
P = 10 kips
200
P :: 15 kips
200
P :: 20 kips
FIG. 3.13 MEASURED TRANSVERSE STRAINS ALONG LINE OF LOAD FOR SPECIMENS R3 and T3
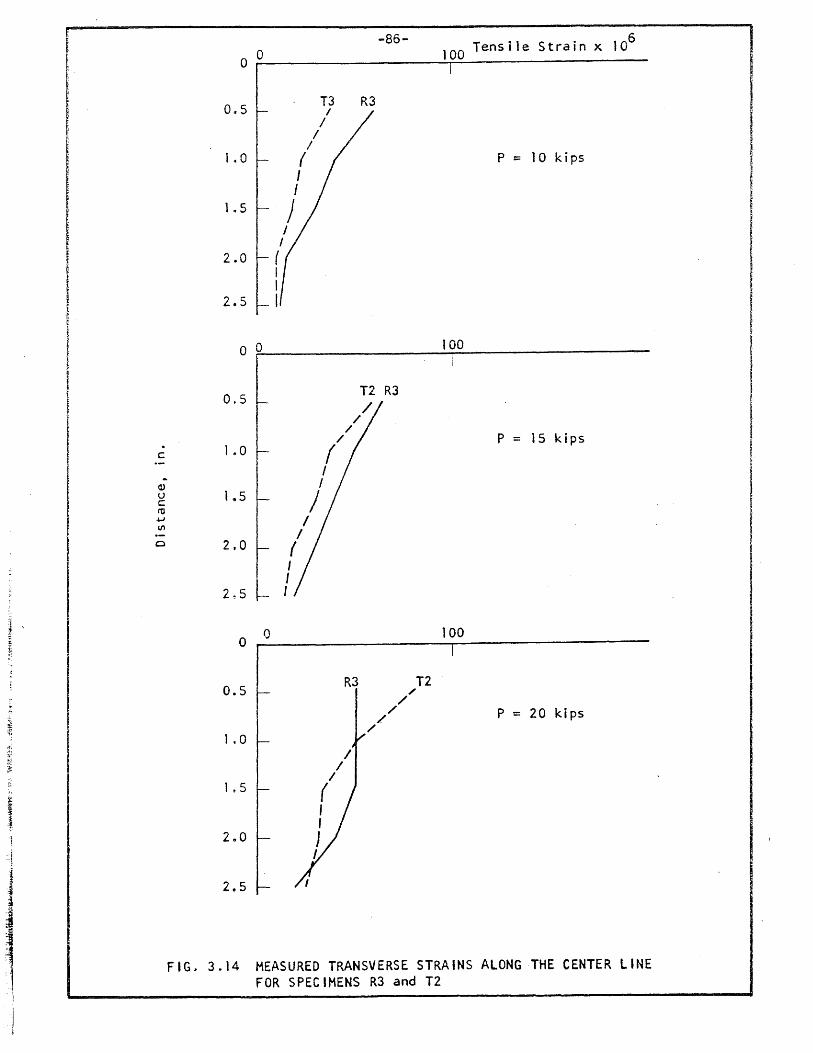
. c
.. Q.) u c:: m 4-1 VI
0
-86- 100 Tensile Strain x 106
0 0
0~5 T3 R3
/ /
/ I
1.0 { P c: 10 kips I I
1 .5 j I
I 2.0 (
I I
2.5 I
o 0 100
0.5 T2 R3 /
/ /
/ P = 15 kips 1 .0 (
I I
1 .. 5 I /
/ 2.0 {
I I
2.5 I
° Q 100
0.5 R3 T2
./ /
/ P = 20 ki ps / /
1 .0 /
/ /
1.5 ( , , 2 .. 0 J
I
2.5
FIG~ 3.14 MEASURED TRANSVERSE STRAINS ALONG THE CENTER LINE FOR SPECIMENS R3 and T2
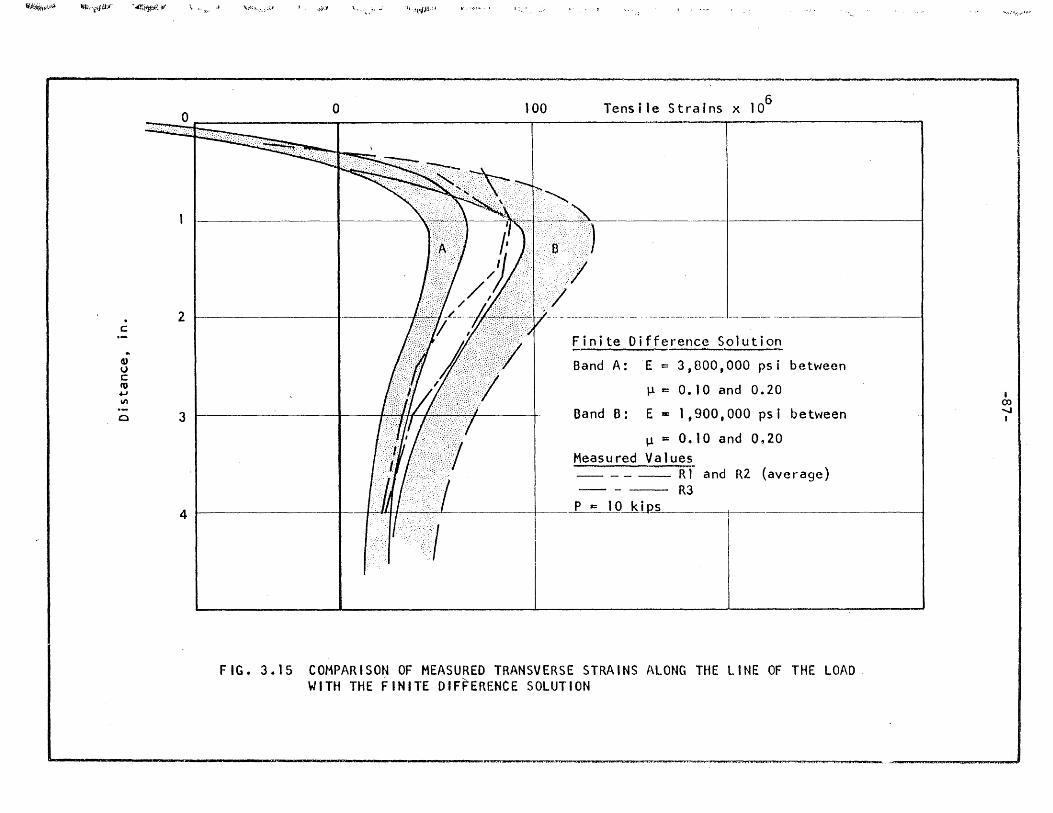
~.~~~ I$,.,,~/!.'" '~ilft*:V 1.. "'.. \;~:",.,.",J ,,:~,~ '" ;"~ ';"'I'IJ!';' l: .. ,; .:"
. c
.. G) \) c ro .., \1'1
c
o 100 6 Tensile Strains x 10
~.-:.;:::.: ... ,.~
2
3
41
_____ ~_. ______ •• _ • .,. __ ............ -'w~~ ___ .. _. __ • ____________ ••• __ ••• _. __ • - -_. ____ ••• _______
Finite Difference Solution
Band A: E = 3,800,000 psi between
~:: 0.10 and 0.20
Band B: E ~ 1,900,000 psi between
~ = 0.10 and 0120 Measured Values -- -- -- Rf and R2 (average) - - -- R3
--t- 1"11. ' P II: 10 kiP-s --1----
i
FIG. 3.15 COMPARISON OF MEASURED TRANSVERSE STRAINS ALONG THE LINE OF THE LOAD WITH THE FINITE DIFFERENCE SOLUTION
• ()') ...... I
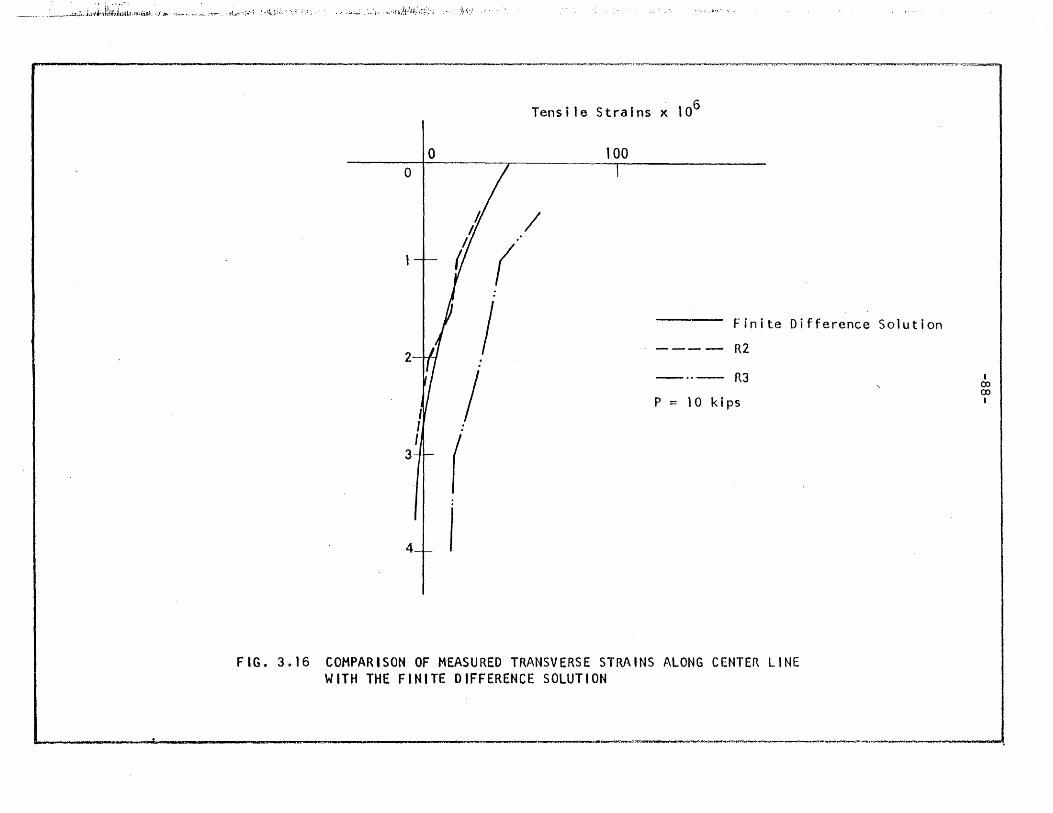
~_.--,-,;;,.L .. i-t~!~j~~I1.'~;i:i.~ . .. J»<' fl..--;;.f,·i' :·A::·; .,,/ ';'." .. ~ ~;....;..;~ ,.~"i·· •. ',flAt/u!',':, . ~}k::'
F .a:-n~. ~~.~C_1'I:':7~. ~~=, ... <.
o o
2
4
. 6 Tensi Ie Strains x 10
100
f / l (
/ ( I
:
I Finite Difference Solution
---- R2
_ .. - R3
P = 10 kips
FIG. 3~16 COMPARISON OF MEASURED TRANSVERSE STRAINS ALONG CENTER LINE WITH THE FINITE DIFFERENCE SOLUTION
, co co ,
, k ' C:S ~~.~ __ ~~~~~~~~"_~~~ __ ~~~ __ ~~~=-~ __ ~ ____ ~ ____ ~ __ ~~
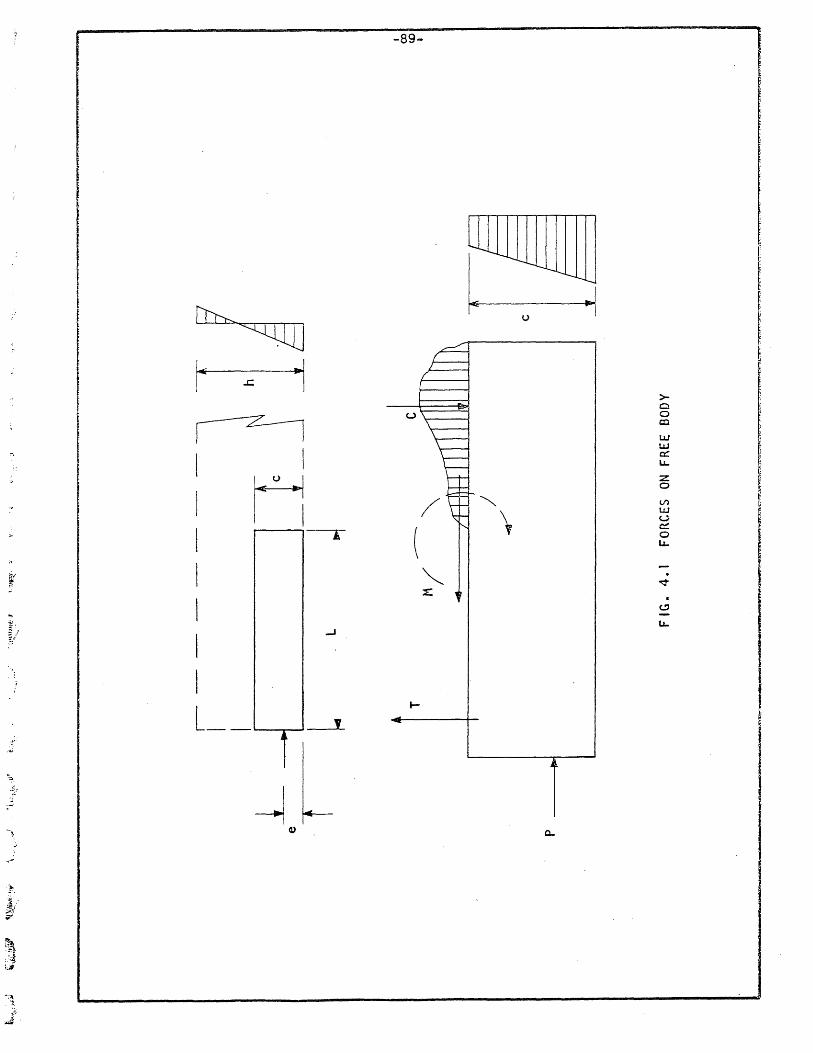
f'rb,.~
I~ ~ 1 ~
I I~ I I I I ""j-r
I
I I I L _ ---1 ---~~~
-89-
U
~
'" ~
0 1
f ~
>-0 0 al
l.lJ UJ 0::: Lr..
Z 0
l/)
l.t..! U \ c::: 0 Lr..
-. ~
c
l-'
Lt-
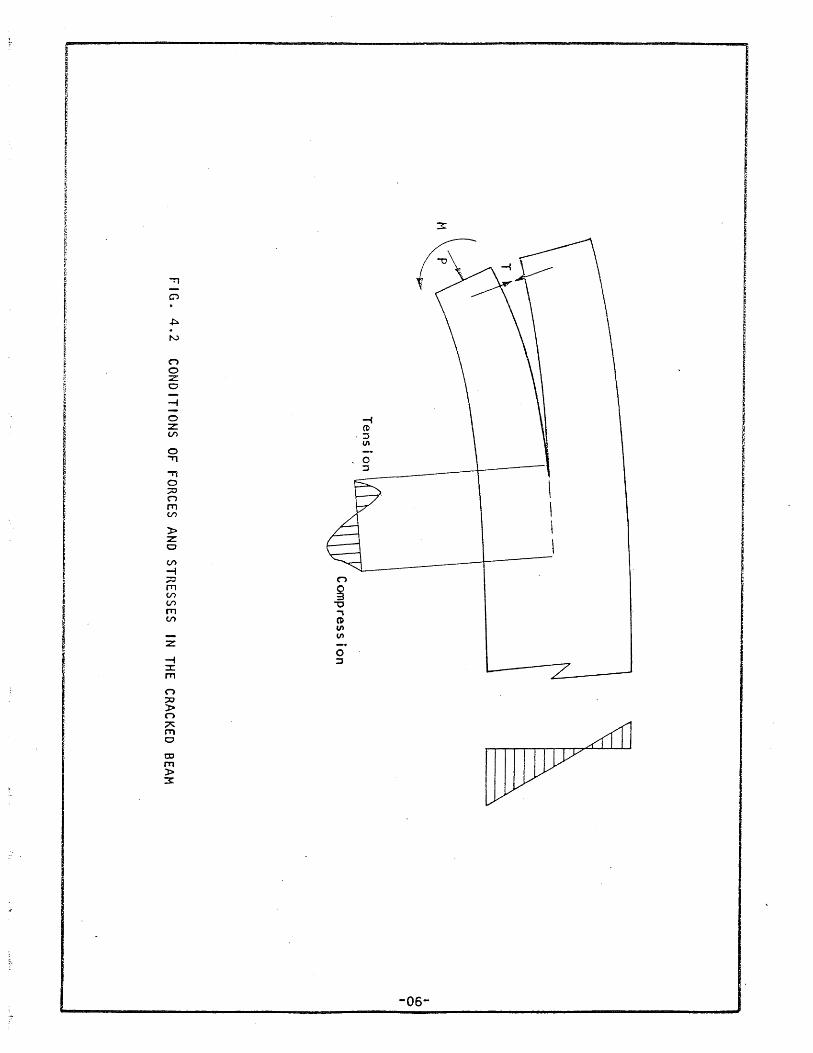
N
n o z o -f
o z: V>
o .."
.." o ::::0 n rn V>
):> z: o V> -f ;0 fTI V> V> fTI V>
Z
-f :I: ",
n ::::0 » n A CTI o CO CTI » ~
o ;:,
-f CD
,:l VI
o :l
\
I I
_____ ----+--- _I

No. 2 Bars
Rl~~111 VI 0.. -~
30
Q..
AI No. 7 USSWG1 R17
"0 to 0 .J
R14 ;7~i 20 I I t
"'0
c.o
Q) --0.. 0. «
10 ~ /~_+~~~r~ __ ----~----__ ---__ --~-
~~ o t~Z~ ______ ~~ ______ ~ __ ~ ____ ~ ________ ~ ________ ~ ______ ~
o 400 800 1200 1600 2000
Tensile Strain x 106
FIG. 5.1 MEASURED RELATIONSHIPS BETWEEN LOAD AND STIRRUP STRAIN FOR SPECIMENS RII, R12, R14 and R17
''''-rI'':'".T"L~-«TVTiF' -m-no '?CG&n·rJCt:Hi~··Q~· ... rJJA1ii""f{;t;:tG~·'-r2T·':·V~~~~~~~~., ...... 'Y" '?cmrv.-,..,q e- "-.'... ;)("-FV¥J~""""'''''_illU::rn''''''':lbII ____ -'U;Di.'''''''''H-'''~_""", __ '''',""",'''''''''''''_ .... -..,.", ___ ............ ______ ..... __ -'
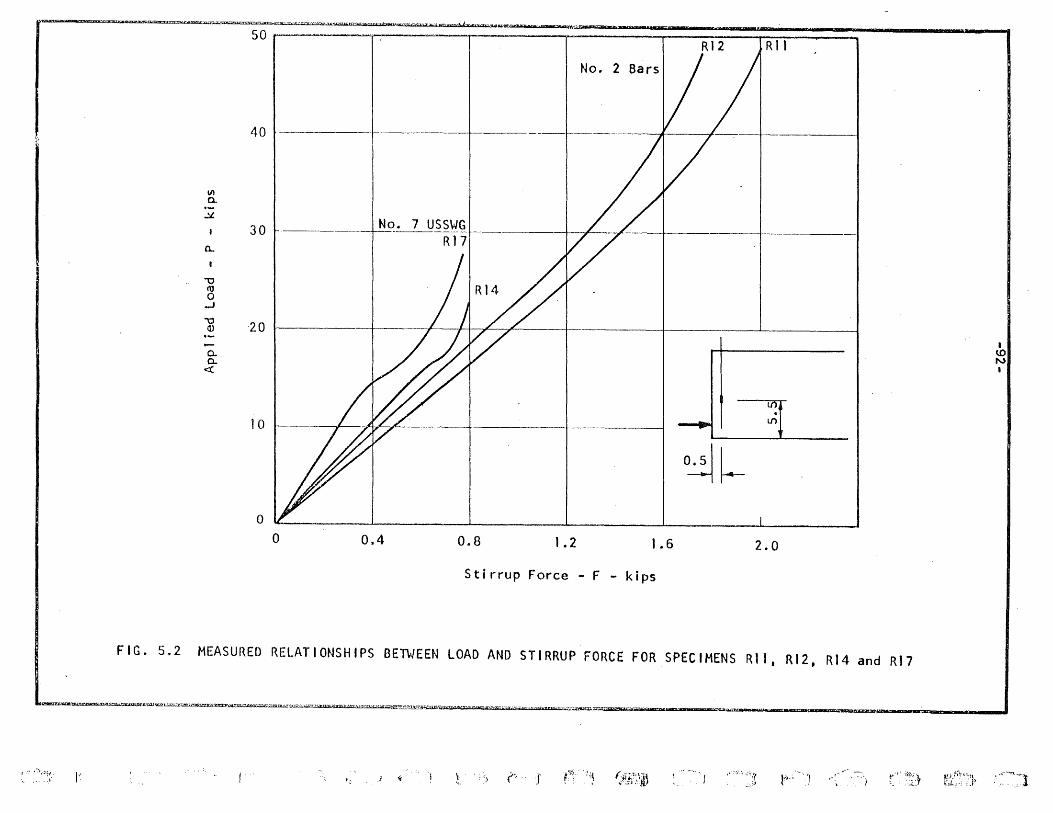
I .:: ~ ~;. ::ft
"
----===~~ ~~=*~_IT" __ M~'P_~~~_'_W '~_~m:Dm._~~ __ ~' __ : __ ~ ___ ~~ ______________________ ~ __ -~ 5°1 - I' R12 IR11
No. 2 Bars
40 I -+ t--_._. :A I
Vl Q. .-
.::L.
30 ~. -t~~~~*¥~ a..
" I'U 0
...J
" 20 d)
I l/dY II I
0- U) Q. N
<t: I
10
~~ o
o 0~4 0~8 1.2 1.6 2.0
Stirrup Force - F - kips
FIG. 5$2 MEASURED RELATIONSHIPS BETWEEN LOAD AND STIRRUP FORCE FOR SPECIMENS R1J. R12, R14 and R17
~"'!}lJ~ti·:;:~::l.;~~~~!"~~~~a:r'...!.::~ml.&d-·n"'ilif1wvr)Th-X:-·;"'?·· ... ··}r···,.-I1%'n:!·g·· ''-''jll:'IIj'£Il';q;Ij"''''UOl"'K'cr- -a=rawr-yzr»'==:rs
I" "ii t ; ~~ t·, J t~ ~ "\ ~~i/:''f, l'i,.~'~j . "') r"';iJ ~~~!':} ;' :···~"n~l
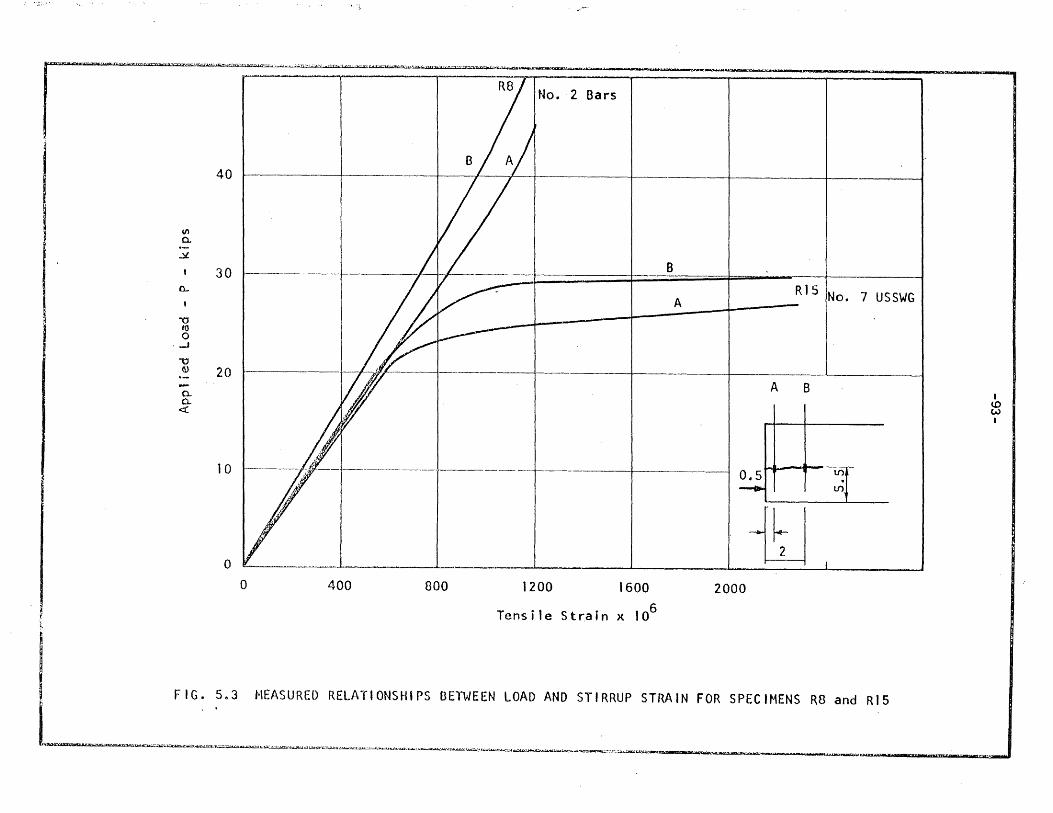
11'''''- "-0 ... Xl~-"""''"''.''=<=l~='''''~". ····C~· "V.H-" -W-·.-,O"'''''''-''''._- -:"'C:3':"'O .. '-.'::",PH'"'''' ,.
No. 2 Bars
40
I I V) ~ 0..
f ' --.::L.
I ~ 30 I~ it--- I I BA R 15 INo. 7 USSWG
"'0 to 0
- -' -0
<U 20
0.. I W I A B
I a. I I CD « w
I
10 0.5
o fJ o 400 800 1200 1600 2000
Tensile Strain x 106
~
I ~~~~-.~~.~,.-~ •• -~~---.-~~ •• ~.~.,,,""W'C~_~~~_ .............
FIG. 5e3 NEASLJRED RELATIONSHIPS OETWEEN LOAD AND STIRRUP STRAIN FOR SPECIMENS R8 and R15
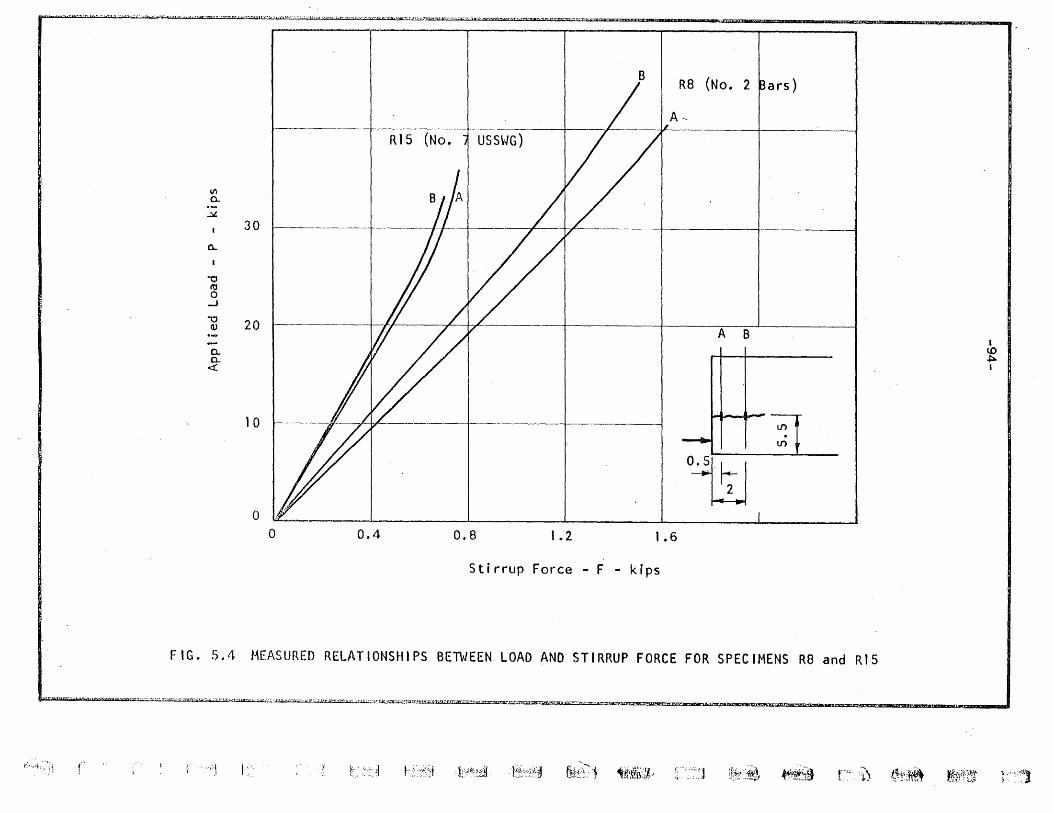
" ••. , ... , ... - ... t· ...... r •• _·· • .., ·~·-~'···-~··"'*"-·"'~,&::.:z:;'''Gt· ·~tc·-d·..-... ",-:rr,.!, i' ... ··-Jx·l'··;.:-·'? - ,.c,..·~ --. ·r ... 0Pi·C··...-·I'~··. ~Qr ·,....s '"2+' ......... :"1. ~o.;.""~r·3'";C;n..,.""·-... ""'U.&y·iJiiii':?=""'=~·..,-·r""Z>x .... c..u·n"' __ ~-"":;.5"'"' .. ""~ ..... ""-=, .. ""·~""""C'Y''''''''~oza...,.''''''''~""'-"""' __ ""'fl'l'.i=OJlIII __ =_-'''''' __ !III3l'''''''''''_'''''''''''''''_''''''' __ '''''"""",_""",,,,
B R8 (No. 2 13ars)
A~
R15 (No.
VI 0.. .-
.::.I.
30
CL.
-0 IU 0
...J
"'0 20 I Q) A B
I 0- If //1 II I c..o 0- ~
<r: I
10 LO
LO
O·~I).1 o
o 0.4 0.8 1.2 1.6
Stirrup Force - F - kips
FIG~ 5~4 MEASURED RELATIONSHIPS BETWEEN LOAD AND STIRRUP FORCE FOR SPECIMENS R8 and R15
·:"X.....,.......'"" ...... ........, .. -<t';.--··.~':2:.or::~J~~:.~·_"I~::\O-: ...... :t-:::~~':':"r'~: ..... .,i"-t4-*,·~jt"r.' ··• .. t'Wf--r::e .. ·,."C·-(!'i~·.,. ... zrn.-;y;;··.;'.--.:J(J'"..,~t'i· .. '&lj27rrn-i!t·-C"~C>F:S:t1A'f·:r"'3k"1T7~~~ ~!Jl:""""""'==""'-~"""'''''''''''''''''''''~"'''''IIlft:i''''EaDIII8IZ!!!£~ ___ ''''
r . ':j I " t.· ,"~:i ~.;~' ·lr!l),;~l ·Ef"~,~j;3 &J~:';? '} 'i',mi';[AJ ,";"] !f:~(~~ ~J.l ['"c't; tfr~,:~ ~Nr-ttt t·,;")
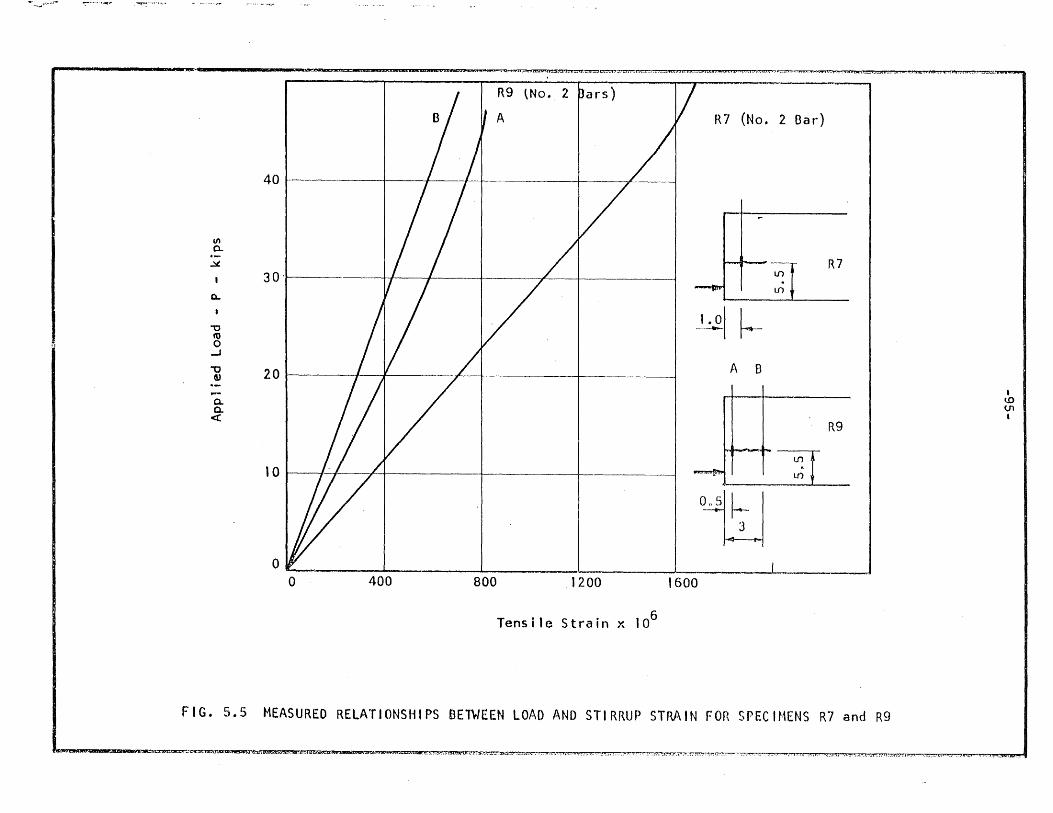
"·~J; .... ;i"" ~ •• '''' .. ;;q.=",
1Il Q.
~
0-
00 to 0
...J
'"0 OJ
a.. 0-«
R9 \No. 2 jars) V R7 (No.2 Bar) A
40 I / I 1 /
30'
20
lOt-----l{ /1 ----------l
~I f-A B
~
~~I ~
~l
R7
R9
O_r __ ~ ____ ~ __________ ~ __ ~ ____ b-____ ~ __ J-____ ~~-L~ ______ ~
400 o 800 .1200 1600
Tensile Strain x 106
FIG. 5.5 MEASURED RELATIONSHIPS BElWEEN LOAD AND STIRRUP STRAIN FOR SPECIHENS R7 and R9
L:o; &t»ClillSfLt:IitJO::2"..·",,-'£Jf~Ct!tiibIIIO»~:i3Y.!U4Q#l&ikt!3l\5UL"'"1'::o".!IN':'tD~uaw.ti!'(_I:<:~':S:!:il':<!'W"D .... 7.::;:: . .#,___ ,.~.3 .•• _~... "~~",-._. ,~.~. ~"rf.:'<:.-,::-.;r.' --,::-.;-;,\J"\'-~~,,.!-.:t::':"':i:r.'-;-:n:T:u;;,.,~-.
• «.0 (Jl
•
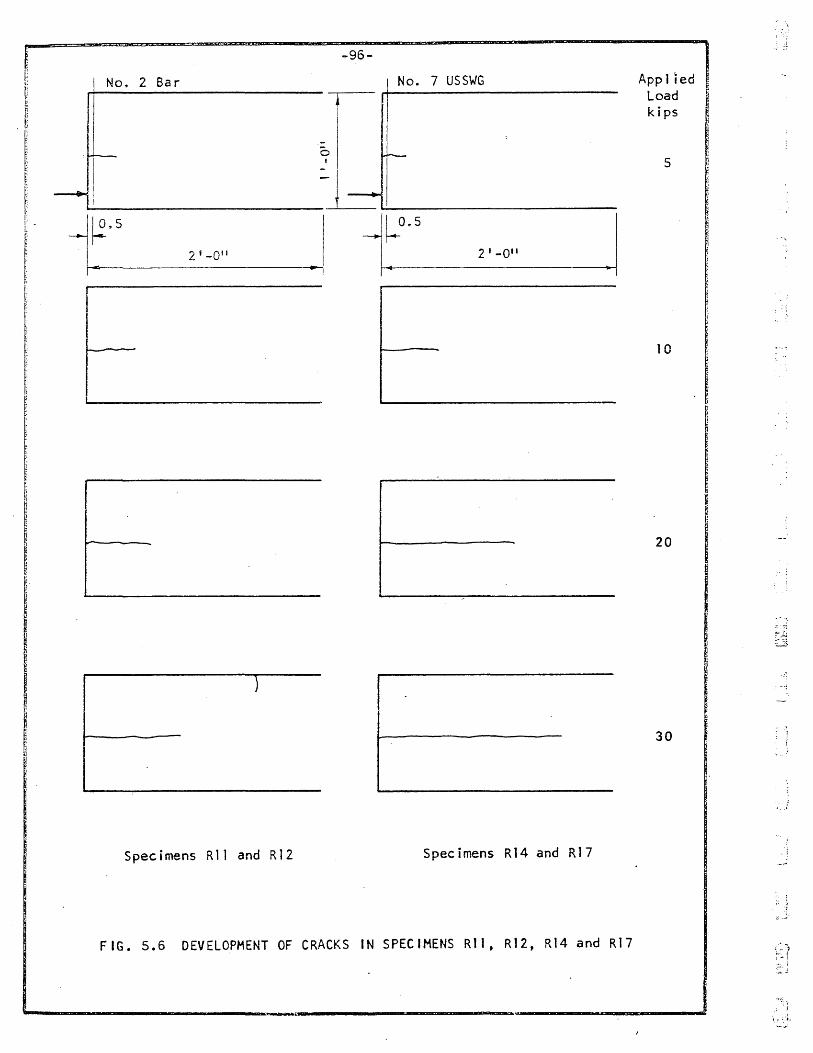
! No, 2 Sa r
! i -- f--~
--11 ~
~ 1-: _
l~'5 t:
~
! 2'-0"
tj
! -;
, i
: , ,
:
, !
{ - - -
)
Specimens R 11 and R12
FIG. 5$6 DEVELOPMENT OF
~
-96-
No. 7 USSWG
l I
, -0 f--
I
~b I l~O.5 J 2'-0"
Specimens Rt4
CRACKS IN SPEC I MENS R t ) , Rt2,
App 1 i ed Load kips
5
J 10
20
30
and R17
R14 and R17
i
!
, , )
"
!
i,
l J
: i
;
1
i
i
- ,
i ~. '. :
" .:j \ ~ ':"
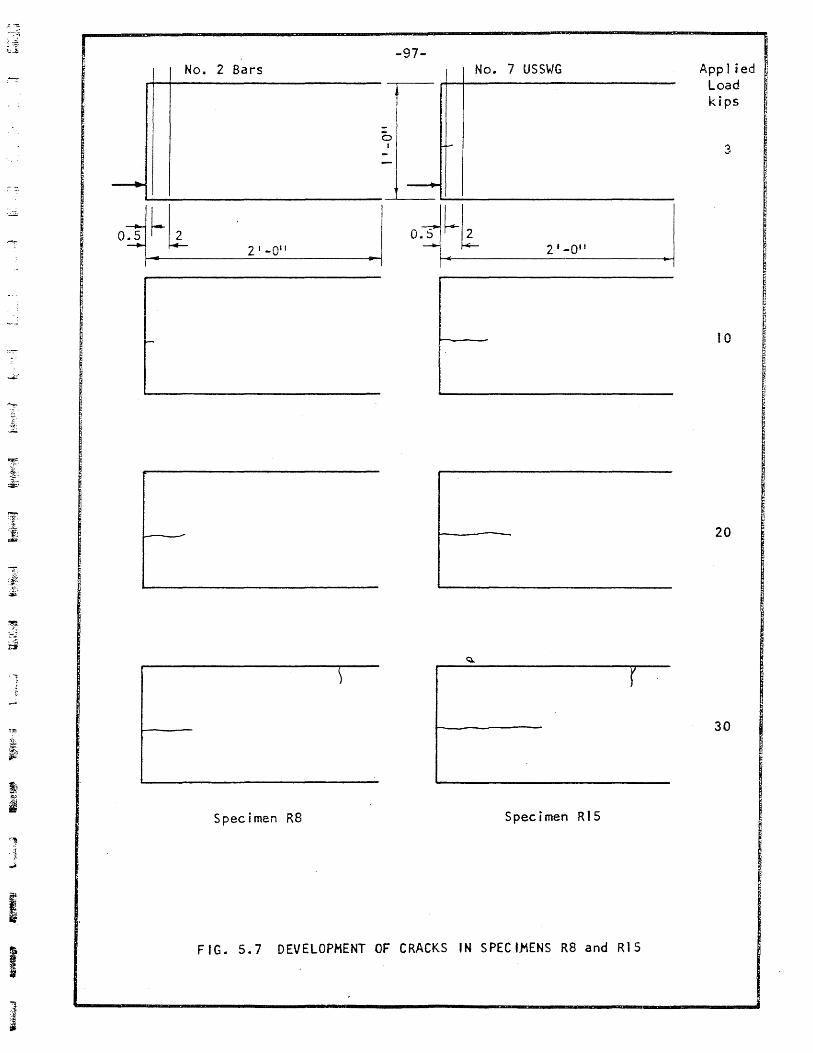
.. ..::::.
~1
.-., , 1:
-
-97-No. 2 Bars No. 7 USSWG
r
Specimen R8 Specimen RIS
FIG. 5.7 DEVELOPMENT OF CRACKS IN SPECIMENS R8 and R15
.1
Appl ied j
Load kips
3
~ ~
I ~
10
I
~
20
30
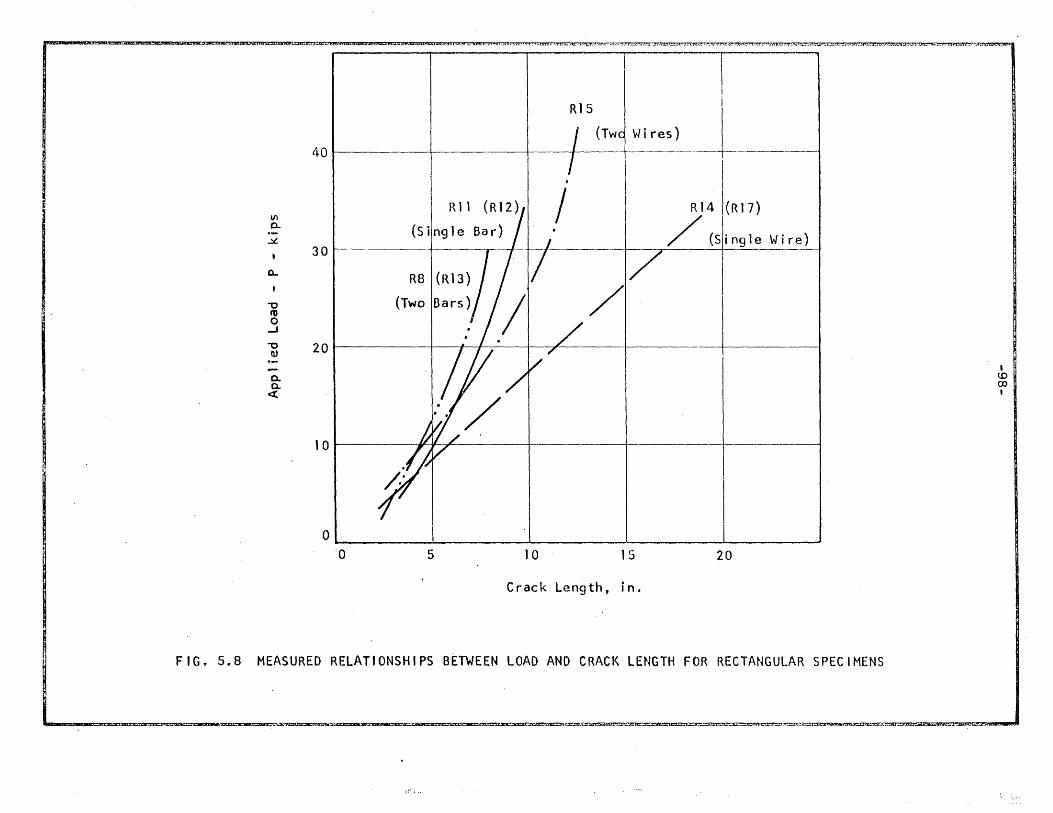
.... ___ oom,...,...,...."."""'...,.""""_",..,==""""' .... CA3"""".",,.,..."""""""',,,.u'l!'i!i&.,,.,.""""\£mn .... a::a::r:utw=_ ....... ~!!JiL. _.~ Q &SiituOZ_a::::cUILU::tPi<K1OSi!id!SJtlU .. ibl!3" ....... :s..:: .... :t£I.' ..... u.:aJ .... l! s::;' ..... IU.i( .• in ... _·~.i •• _ ...... ~.\Jb ... l_:;::.*~.iIEt!2Zt.}_ .J.U:::=r.i ..... ,1.;_zx:: ... i'~ •. 'tlf~~~;x:~/~:;lO~~"'\I:...'L.·!".: • .-.I-.{,.II'T:.~.:-;:'Y!·T.W"'l.:.:-.!'r.:.-.· • .,.l-.:-."v-:;C. ..... -,.....
VI 0-
~
0...
"'0 f'U o
...J
-0 Q)
0-0. ct
\ i I
R15 I t 1 .. 0--1--
. I
/ RI41(RI7l
301 (Silng,e B~r) I-~_ · / (Slingle Wire)
R81(RI3) I / 11~/ I
20 I I l, I / +-- I --------l
101 1''1/ -~--o ~l ______________ ~ ____________ ~ ______________ ~ ____________ ~ ____________ -J
'0 5 10 15 20
Crack Length, in.
FIG~ 5.8 MEASURED RELATIONSHIPS BETWEEN LOAD AND CRACK LENGTH FOR RECTANGULAR SPECIMENS
;!',.-
I (,0 ex> I
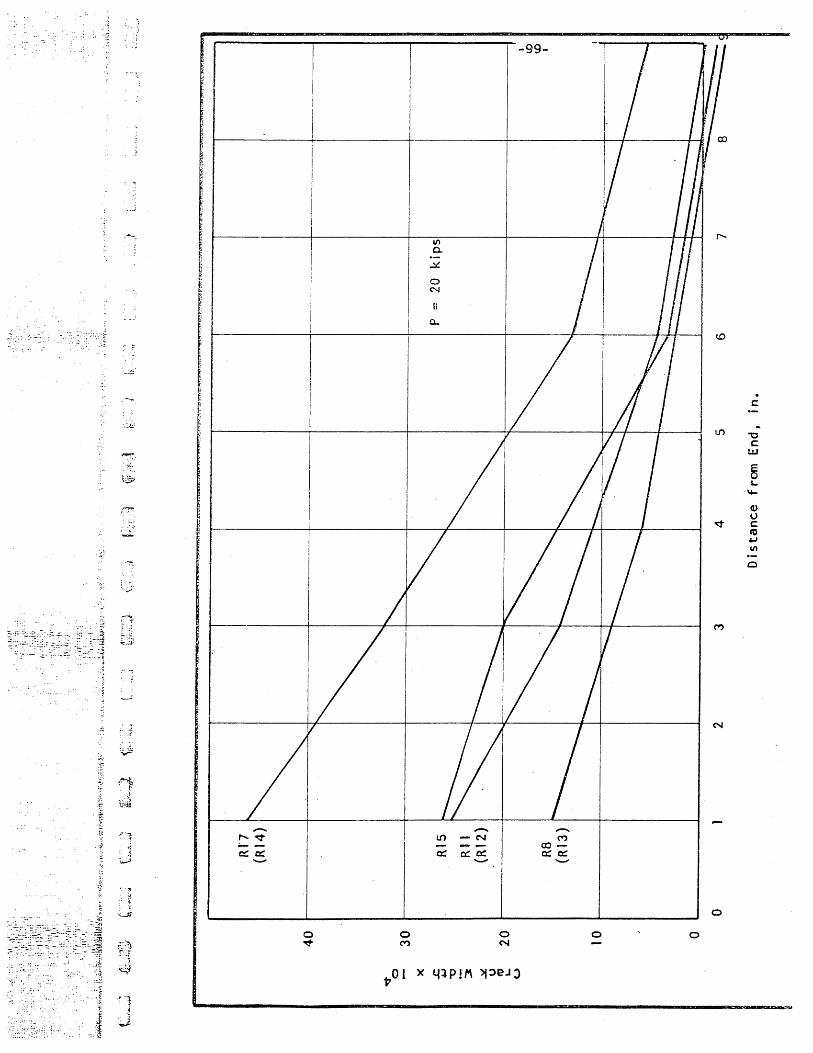
. ~.
~;
':-
~ .~
~.
.J
:i
·"""
. .:,:
% F~ J ,1
: ~
:.J
-t:! c:::a:.
-Lf) - N
a:. 0::: a:. -...
o 0 M N
o
o o
c
ij
C UJ
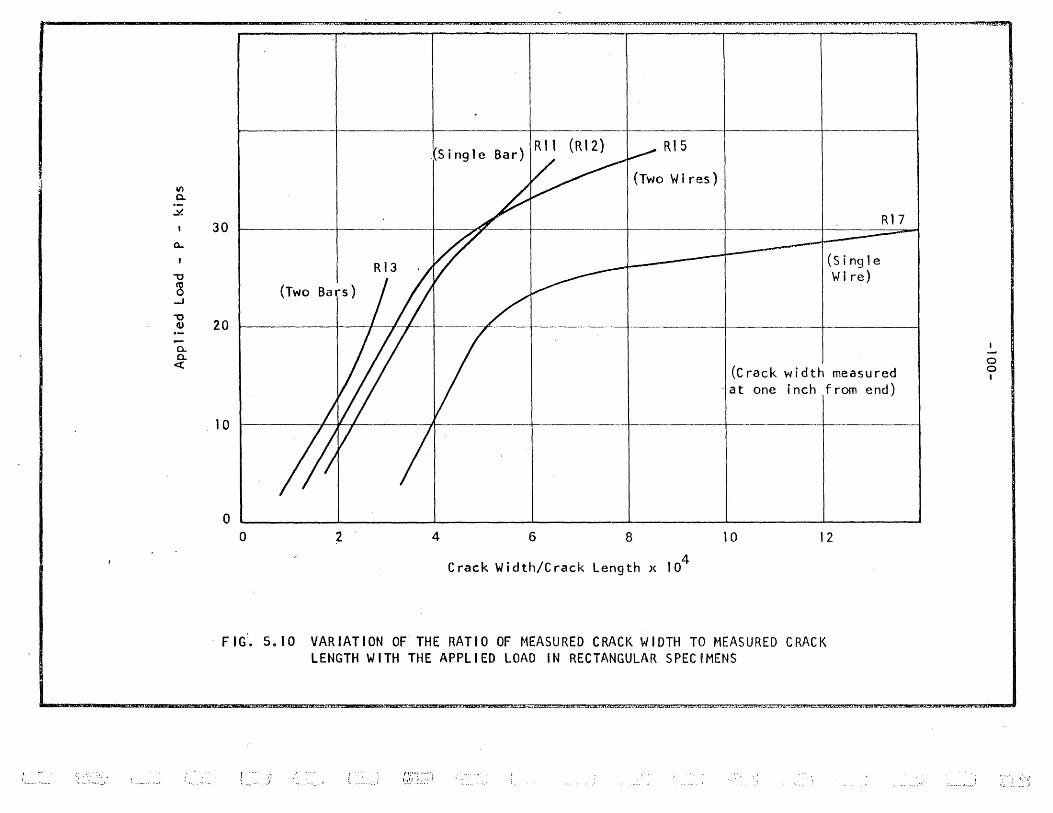
V)
~
.x
0...
"'0
~ -1
-0 Q)
a. a.
<t
"~s i ng 1 e
(Two 'W ires)
30
(Two Bars)
I / f /
10 I ; Y ; A---
o o ~ 4 6 8
Crack Width/Crack Length x 104
(Single 'W I re)
(Crack width measured "at one inch from end)
10 12
"FIG. 5el0 VARIATION OF THE RATIO OF MEASURED CRACK WIDTH TO MEASURED CRACK LENGTH WITH THE APPLIED LOAD IN RECTANGULAR SPECIMENS
o o I
, ~&:c!a ... ~ ~tltK!.tiS3S3ll6t_i!2ARii1LS5=_£4l2!L1£3U.~~:I!il!£E2!Sl'f3!i5l''''''dtU .... &j.qt:d:::re:? ·dfULt-'il1i.c!!?&L."r -.F.f._ .LXSW., . .J ... J' ........ .....o.:_.U;::&'t'$.,.32J;::;, .2Kb}9iillfLJi3li'i::!)jiild.·Uti'fS'fcl&! .¥tL!JEA__ & .• J3 ,
[ "i: ~ __ .r
t .- t'1;r ... f-....
l:.~:: . !:~ :': "' ,.- •••• ""J •. 1
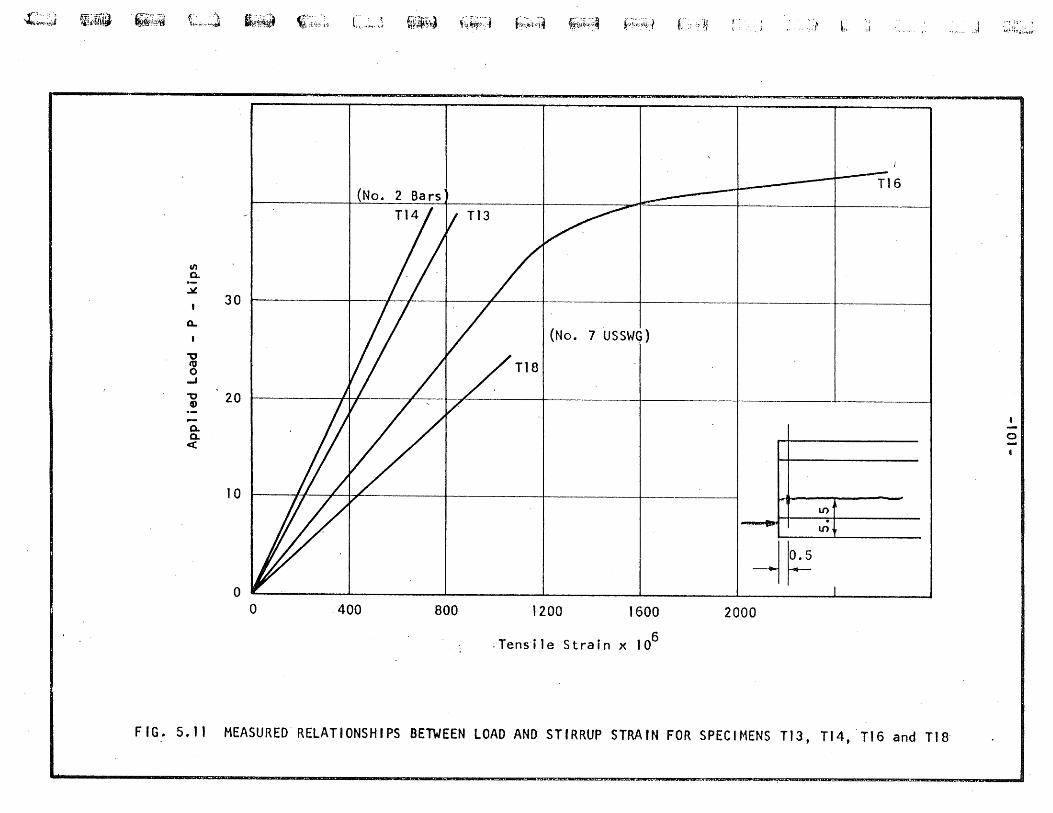
,,(::.~iJ 1l\i,911i1 ~,~~ V'\ ik~ ~",. C.~,.~ w~{rJ \~~;,] i;,:,j~ .·:ii ~~;,;~ F~:;~~·/ r.:,:'tl , ..
.\ I:: .J .-!'::" 'I ~.~" ."..,J ? ... \ .. ' ,.j '; ~ ,I '\.1!J'!{!:i.~{.i
(No.
FIG. 5.11 MEASURED RELATIONSHIPS BETWEEN LOAD AND STIRRUP STRAIN FOR SPECIMENS T13, Tt4. 'Tt6 and TtB
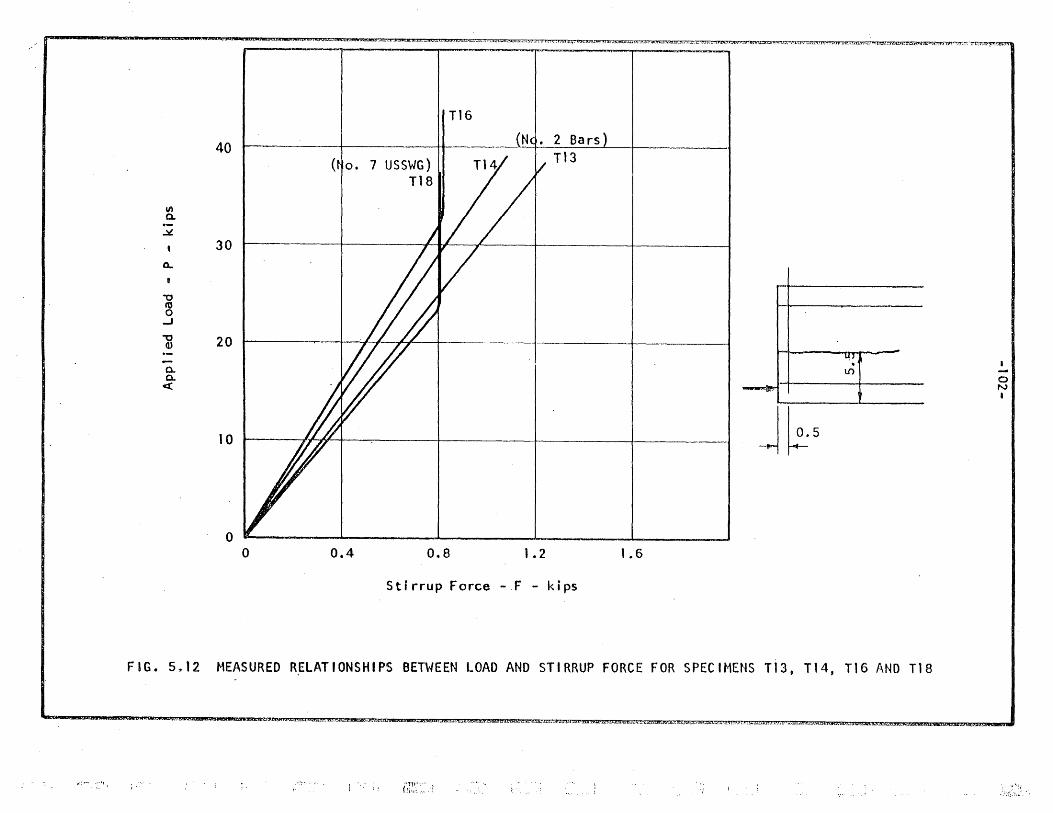
40
'" a. .::st
30 0..
"'0 cu 0
..J
"'0 20 (l) --a. Cl. «
10
o o
CLUAE&E.JCiW£ \ inStil - _1_ U.IbCMl! ..... Qli::tt!AtkJ!l!L .... £I.i .... LDEXOs:::;: -, .1.1 ... U ... '.C __ ~I_j;~ .• ,...·}_. {·d~ ... n.1.jfK'$::"·!m'!'l! .. ·!~·1~:'7~tt·_JO. 'l/CJtlZ}.":&U i~" ... _r .... 7. •. ()\bi .. , ::a~ 1!1T.'~.,!\~,;lfi Itt" .... t£J. 0 .i. ... ' .. la:::h_~i'.i!i3,n H::+"IJiI' ••. _.,,,:.t'""t".;-:~~
T16
II (~o. 7 USSWG)
T18
0.4 0.8 1 .2
Stirrup Force -F - kips
r .,
I..! , . 11)
Jks
1.6
-~---~
o N
•
FIG. 5,,12 MEASURED RELATIONSHIPS BETWEEN LOAD AND STIRRUP FORCE FOR SPECIMENS T13, T14, T16 AND T18
::" I i ~.' j : f:~!:':~~~: .
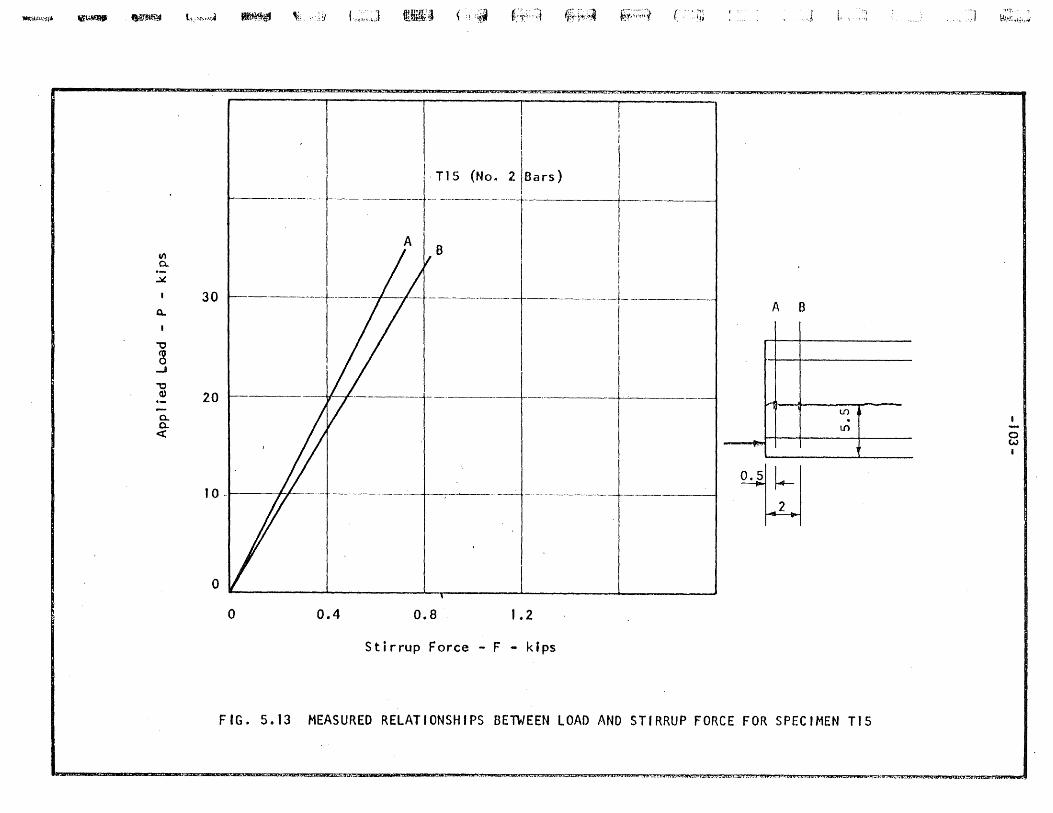
lIlttt',t"$~ ~- ,"'J>[email protected]
V)
a. ~
Q..
""0
~ ...J
"'lJ (1)
0-0-
<l:
l;,,:-"',"':4
30
~ ~: -,;':1 L<;;-,~J (UliHt:3 -.i:~ !;:;';,-=·:l
I I
I
! TIS (No. 2laars)
--------1- ---------1' -A I B
If.i-~~-'~ k-r~~;:::'-1 ( ,-- :~i
I
i
-t--I I I
-----1-77--~t-----------I-------r-----I I I
20 t-- V ,.. --f--- ---+-.. ------+--'-----
10 -I f/
o -.----------~--------~_r--------~--------~--------~ o 0.4 0.8 1.2
Stirrup Force - F - kips
-,J L, -.:::
A B
If) j . l.f)
~
FIG. 5.13 MEASURED RELATIONSHIPS BETWEEN LOAD AND STIRRUP FORCE FOR SPECIMEN TIS
:1 ~.~}: .,~~~;o~.
o W I
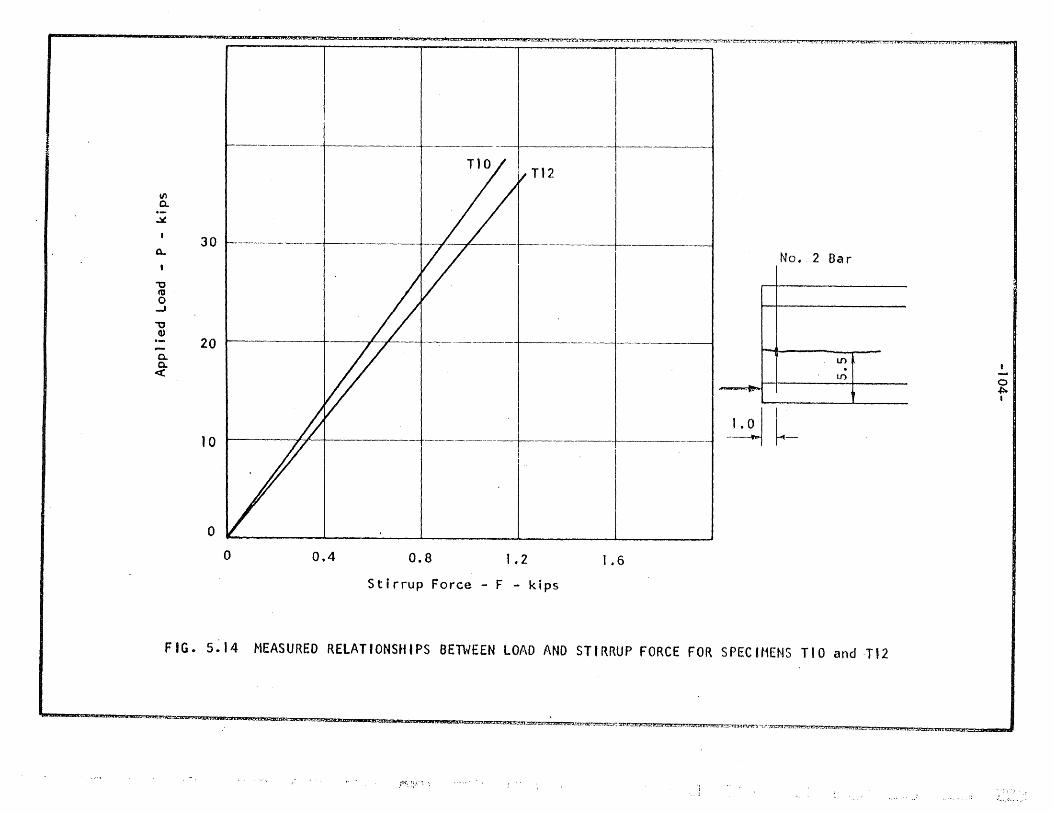
:a:ualii4ilCi&JliU&ii36tlJ:L!eilZ £CA,ze:u:::&bB>tBilG?S;:ZC::S::EA3:E .... 220C5 ... iaX! .. Ui::.k.iJL~ .. P~:!! •.• ,.(! ..... lie ...• \_ .. 10 M ... , .... _:->: .... dQ; ....... A __ ., .J.,4lfif.> ..... Bh'n.t.l .... ~ ... li~-h.'
VI 0..
0-
~
30 a..
1 I . y/ No. 2 Bar I
\J fU 0 -' -0 G)
20 1 1// 1-0 Q.
~! Q. I <t: -
0 ~ t
10 I 77< I -t-,----------t----- ~~~
o o 0$4 0.8 1.2 1.6
Stirrup Force - F - kips
FIG. 5 ~ 14 MEASURED RElAT I ONSH t PS BETWEEN LOAD AND 5T f RRUP FORCE FOR 5 PEe 1t1ENS T 10 and ·T J 2
cr .. """" =··" .......... ""'" ...... a .. z 2WL ... ~:>lKlII""".= _oa "'"",Qj'''bIt=L<i2= .... ="".-"".="a."-="",,-,,,.~, L2kf,.iU!J< ,!.'t ......... ",.;go. .L_L,· ."il·U"""'~"'.·:=. i.i.i.'-":Otc,~"'jd, .. _ilIb3:::r.J,L ... ZtA!" ,=-=" .... "'::ru; ..... = aI
,i",:1;.· ~: !.
.~~;. ,~. -- .
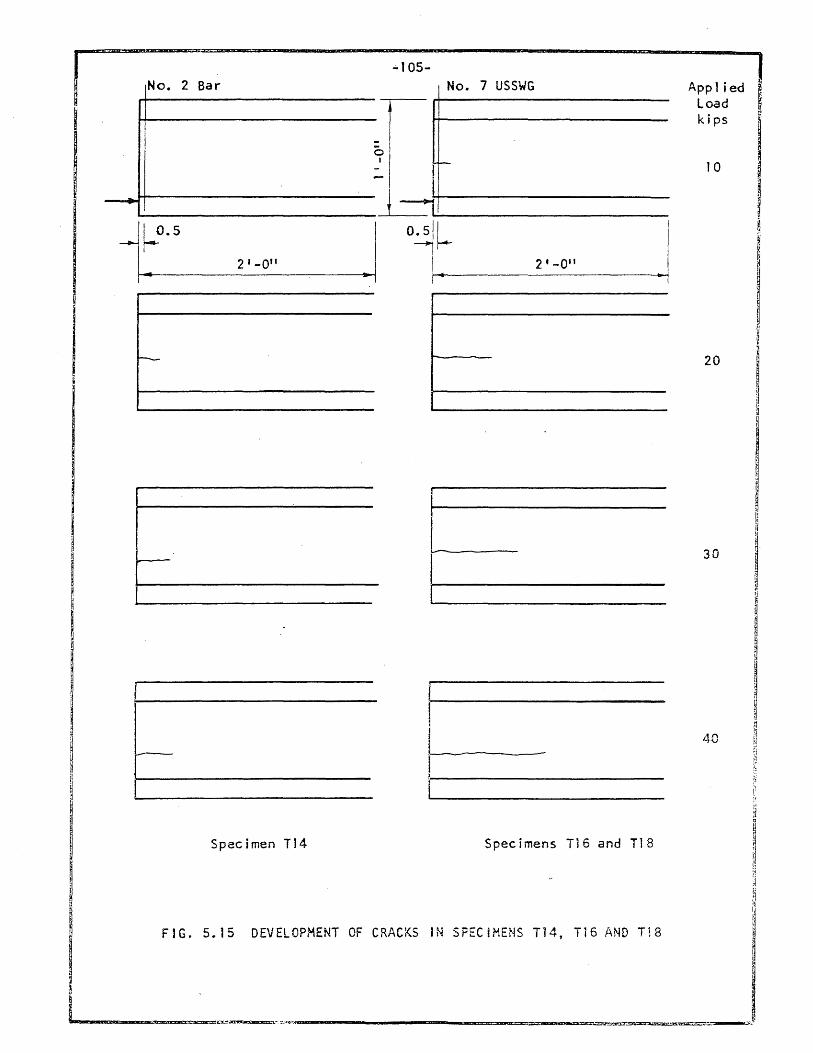
-105-No. 2 Bar No. 7 USSWG App 1 ied
Load kips
0 I f- lO --
--+- ---...
-.J~O.5
.I °4~ .I ~ ~
I. 2'-0" 2'-0" t ~
f
- 20
30 -
40
Specimen T14 Specimens T16 and T18
FIG. 5_15 DEVELOPMENT OF CRACKS IN SFECiMENS T14, T16 AND T18
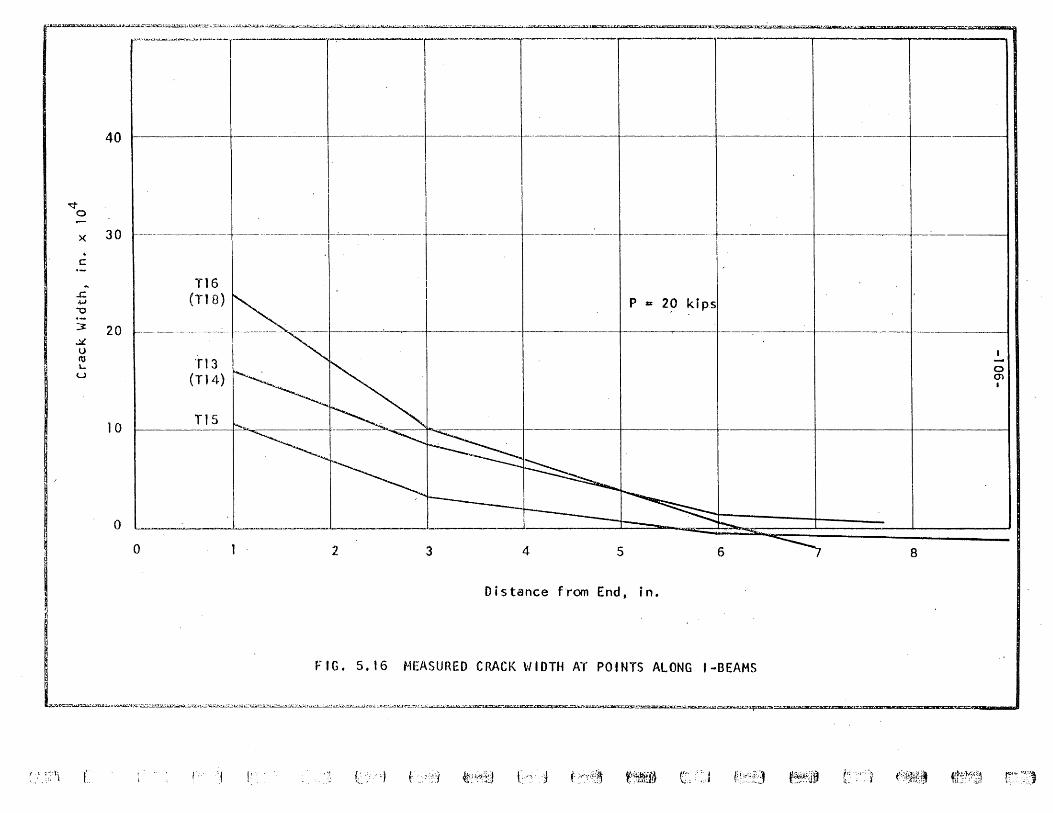
~ 0
X
c
.c ~
-0
3 .:;/. 0 ro L..
U
I ~ I ~
.l.X.~f.!P1-·d.#':'l~·,a;:::·;~:c''''·:·f·~.-_1','M.'';.~,n,:"H'''',~'·C ·i:-~J. ':"'.1,,' ... ~'-L~~'C'r·--· • • .... ~. r' . ~....&JJr;'C!"~""L·5J.·~ " .,I~ S a··'¥r?"£'·,-rC U KVIS·· ... U .. J'''t-'''r-;1liwrs;s;·'7n-VTll't - 'cJ'fmnr,.,.."u ... ,....,.s··Ulrtr ·r..,. iJJ~,?u-rr- 1rr4 iJiE:cm'C3YC7'S3i7 W- r "'-. 11
~. lu,o·. r I
40 J- --+--------t- t----------/-. -t-
30
20
10
0
0
T16 (T18 )
'f13 (T14)
T15
1--,I ,- . I ----I
p a: 20 ki ps
2 3 4 5 6 7 8
Dis tance f'rom End, in.
FIG. 5.16 MEASURED CRACK WIDTH AT POINTS ALONG I-BEAMS
o m •
L".~== .... =,,...--.-.... u_.;x.,."" .... zn.-=--==.m.:::u:..""""-~ .... - .. ,-,,·:.:J.;.(:==<=·==""'==O .... "=lQroc='=-~===.,..-=="' .. ·-··,-=· .. -··"! .... ""=:;..-:u • .-.r"'··--=rrP·""'==.,.rrrc=-"rr...,.=<>'."'~:¥Q.'''''''''-'''''''''''''''"'=f,=""-'''''T'"",C--rrT "'=-_..'
(., ,".".1, l' I; 'i "
' .. " C':: ,) t .. :Y-; @!\"',tJ f'<;' j (: :.,.:.::!~:'~ ft~~ e':,:1 t~\:~iJ ~j~J~~;l~ t,: '~-'. ~ (4~li~~ ~it i'~~;'~81 r~~~:J I \
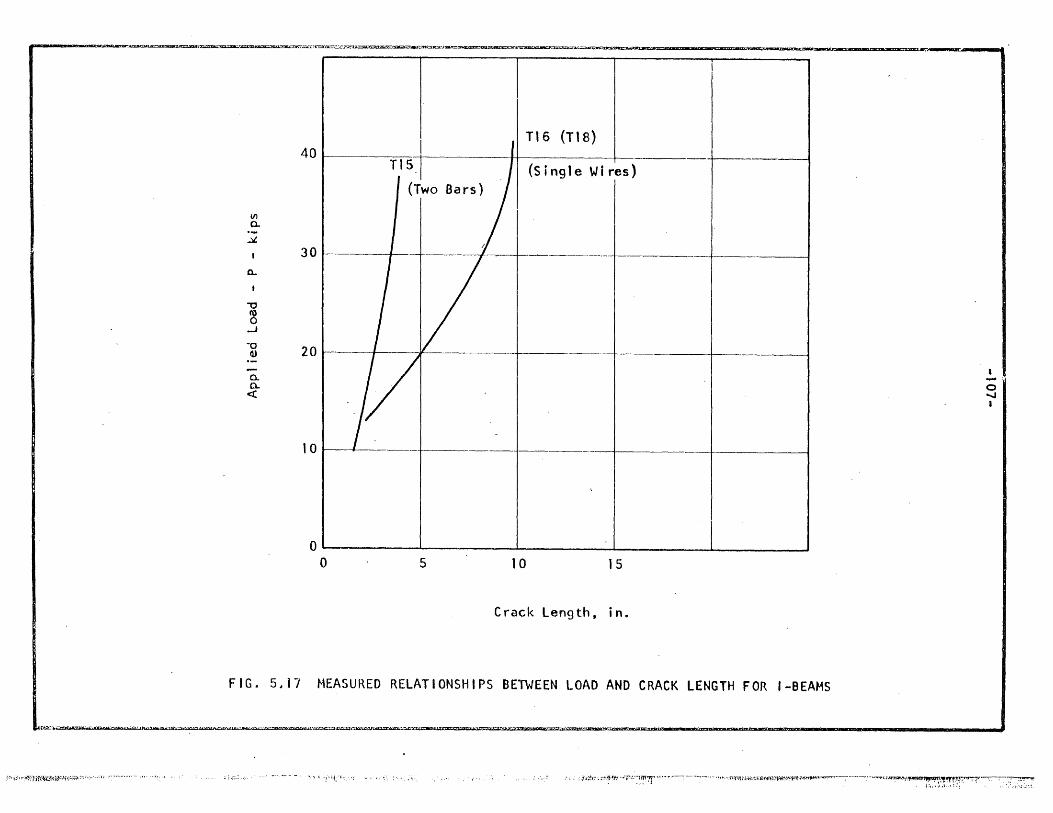
, ~Ylf!TJ¥.~""!'QJ:'!!II'!iGipntqC"g"j""'Q=--CT.I'C';;;:":'::'c:;:3a:::::~;t'n:&~ =-r"""wr-o'JI::&%:::""""""'" ~=="".· ... ->UH"""''''''''....,'''"''':aa:J..".,I'=>...." _____ '''''''mm''''''''.....,''''''''_'''''"'_",....,...mJ..".=u_...,, ..... ,..,''''''''=
40 I T16 (T18) I I I
T1Sr-- 1---1 (S i ng 1 e Wire s ) (Two Bars) I
III 0..
~
30 ---- ~---.- -----0...
"0
~ ..J
-0 20 Q) -0.. 0.. «
to . ~-
-------_.-
o o 5 10 15
Crack Length, in.
FIG. 5.17 HEASUREO RELATIONSHIPS BETWEEN LOAD AND CRACK LENGTH FOR I-BEAMS
':"'FMt$''*5!ya--k"K'S'W''''2''''"n;nt,h; -'J}At:r- ··)$$)·?'i"'cll!/Ij"PW'E'h2!l.b': "/n- • ....... ,wc·,·.,CyI="'AIJ'!sy .. i7Si:i'ac l~«r;·ti:!fB""fjl 2i:&Il ... '1",aDT",,)'§7j----lA?f<'7?E!CJf'zlJ"S'r'rn "ltl ==== rckr
o .......
•
.t .... ·.\;O:H·:~:·n'l(-w..>sw·'J.;·N}·:'": .. ·:"···'·': ., ..... -.-.. , " .. , ( ;( "1'-' ~'- .... , ., .~:. .. ~', ~ ~-{,;h.> ~ ;-:-~;ff~ '''-Y'::~~~7f' " .. ~ ... ~ ~.---:: -----.- .• ~ .tq., ~.fI=l"';~;--I~.~~/"'~~~~~~'t·~ .. ----=---·--.. ·-~(l~~~~~:r:y"'"'71'~-~<~· .. ;".:,~.~:.-.... ~
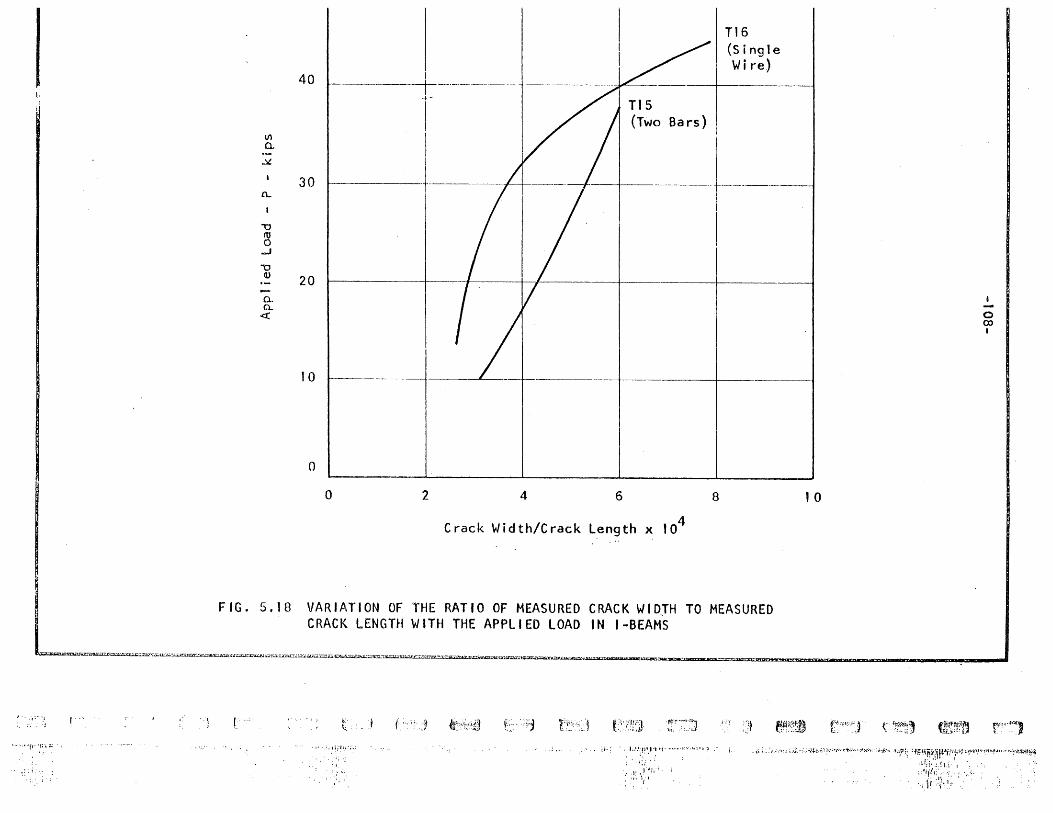
III 0-
..::,t.
0..
"U
~ ....J
"U Q)
0.. n. «
40
30
20
10
o
o
I -------r--.-.---------.j.--
I I
j~---.- J I
2 4
Tt6 (Sing1e
i Wi re)
--I- '--,--' +----I
I
6 8
Crack Width/Crack Length x 104
FIG. 5.18 VARIATION OF THE RATIO OF MEASURED CRACK WIDJH TO MEASURED CRACK LENGTH WITH THE APPLIED LOAD IN I-BEAMS
, 0
o (X) I
~~~...:-..-..:.t~~T~~~~;;~~_nu.n:a.._.:_:::'tll'I.C.:.~j~~~~~~~~~~a-?_-g· .. !Ty:;:"it~..t..~..u..~":f5.lC,""-,o"'c""rr-"" ........ 5' ... ·""""""_::r;..,_"' __ """'~_"'_"""" ......... :o::a..::=="'===Jn""g"'~~""._"""''''''''!Di1'''''''_'"'''''...., ... ''''''' __ -----I!Dl---..
f: ~ ~.~ f'" 1 L' t . - ( :.;:, J tt~,,;·i-;,:\£t L"·~; ···"fl ":;' .. ;.;' . ': .IV~<'·~~:
~}~'\.'l r"i'_!;::jl:t-;~:'J
. 1 .; : t.. . '. I. .I.'.:~ ~ '.' 'k tf' ... to,. .>:'.'.1..;:-':."1 .'
.,
.1,_,,"1,' ,,.It''
ie, :] f4r'lr~1a fj::.~~I.~ f:-.\"'~'"' ~'" r ~V1,~~ ~;ltfl:tr~
t~· -" -,I , ."k I:.:J 'Y.lf-~··.' ~.1 f¥Wof>~. ~." ... J
-,;:.: :.-:.--:: i.;J."'.;;"+1;;"";'i .. ',\,,;~. :o<,-<,~ •• '*""7':; !~~:;!;~~!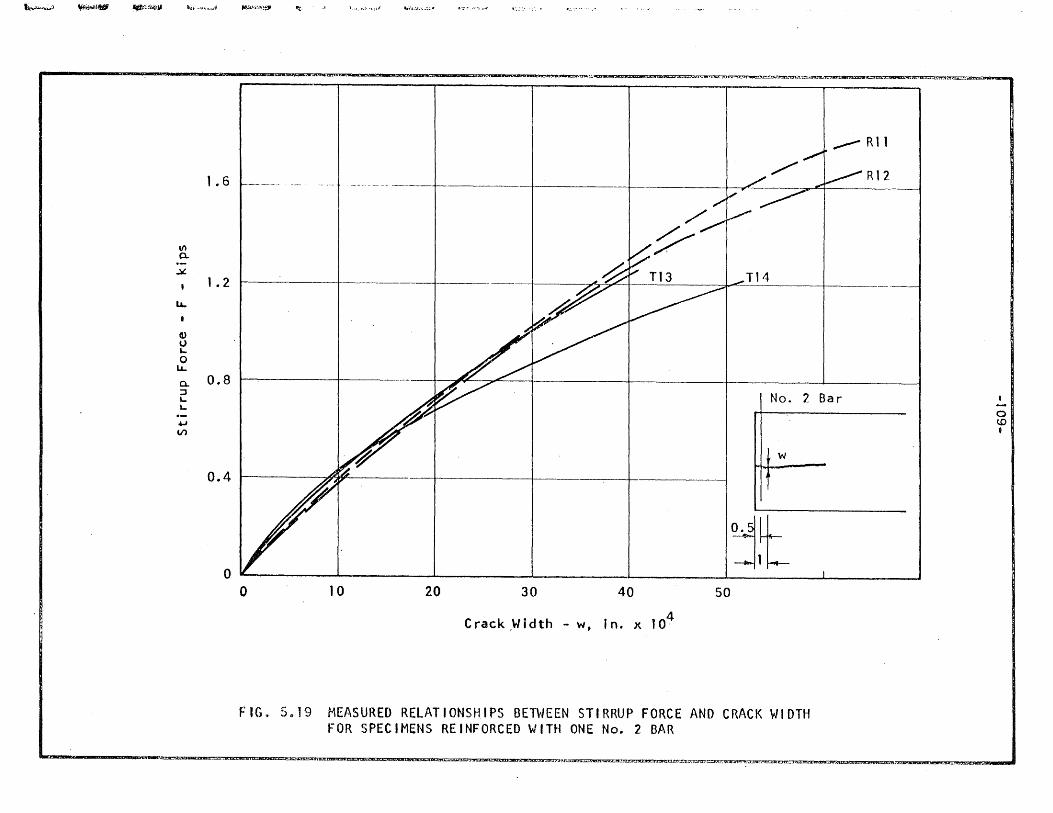
~~ ~.~ .;:!~" bot .... ","'! f4!<"!"~ <:t \.".",.,,,1
~ 0-
.;:,£
LA..
Q)
0 L. 0
LL.
a. :J L. L.
4J V')
1 .6
1 .2
0.8
0.4
=-""''''''''''''''''''-'''='''''''OO~~~~~~'JIi ... l!id'''f':i:i:2.e::aUn:;.C2 .n::c::::c:CJ.iGa::::::::::&fiP.OiUhG cea:w
.,.,-- R 11
R12 -_ .... _._- ----+- .. ~ ~ ----l
No.2 Bar
w
r-----------~~~~~~~,------- ~------------~
o 1.0 •
Jlt o K __________ ~ ______ ~ ________ ~ __________ L ________ ~ ________ ~ ________ ~
o 10 20 30 40 50
Crack ,Width - w, In. x 104
FIG, 5319 MEASURED RELATIONSHIPS BETWEEN STIRRUP FORCE AND CRACK WIDTH FOR SPECIMENS REINFORCED WITH ONE No.2 BAR
... ~~ S!!id'i,n:c::URKIL2i:2;O;l;L'f t:tw:a:us::a:a:;:zsu::;au:c::;:J.Wa::;LA!46!Al!iO:JJ:LJaZS.i&V.fJ .. *,.-... ):!1',f"..::::tLiiJ 2O:>U'I~~-==>.C._161 ... "'-t_tL-~·.:.JhiLE"!!IlJS&ilAiiQaw:: szzun.JtJiiJE&LiSJ'ti4!_uz:;::iJt!jiAi!CiAii?Z '

~;J~"·j,l.~~;'~l~~~ilt~~l",,,).Y<if" !,.· ... ";·' ... r;:·-:-<r.~~1"!';'\>i'~;:··:!-';l"i:': . .'J~"<,:,.; ·,;;!·c,·." .' .. .,. •. n,,, •. i;;:~;;~l~~i'·';. ";lH,:;l:. I" > .. t;,'f\. ,i ••
·:cl'!!1n'.!II!!!! ___ ...... ....,.""""..,..."""'''"'_''''1U£'''''''' • .,,'''''s:'U.:~r:~tr.~~U;J2 llJJI(A4XJ::Ja:!llLS[A:actt~&~~ ilZL!.Z=::tI:::LQ_:S:::C~~~-:=""~~~~n:'.~ ___ ~~~~~,;-:.-r.t:"~~~~~~..:::::r~~~ ... -:;-::t"~jL:".a:=::""Ci= ...... _'Ln:n::T __ ~":~~-~A.:
V1 0-
~
Lt-
d.) U L-a
Lt-
0-:J L L.
+-' Vl
No. 7 USSWG
'-W
~
1.2 ~-- .. --.-~------l---- --------+-------J---- ----~ I
0.8 T16
R14
0.4---
or:: o 10 20 30 40 50
Crack Width - w~ in. x 104
FIG. 5.20 MEASURED RELATIONSHIPS BETWEEN STIRRUP FORCE AND CRACK WIDTH FOR SPECIMENS REINFORCED WITH ONE NO. 7 USSWG
.... ---------"""''''''''-,...7nF.---..... --=--'''' .. :au&_a;~.jtO;;S;JJ:c.iJJ4i ...... G2 . .:.us~~!::?!Z~~.t .. "'CP ...... t.)'::;u*ii' .. m.J:L:.~~~3KLJ2::~::;:::s;z;:..t:t:::;a- .L<lnr.iH~~~~ .. L ... i4.5':ZSCi.uv&au:mi::;:x;:a:a;JP..9»Z~~~~
,. : ( ':,;; Ji .1., -~ ..
o •
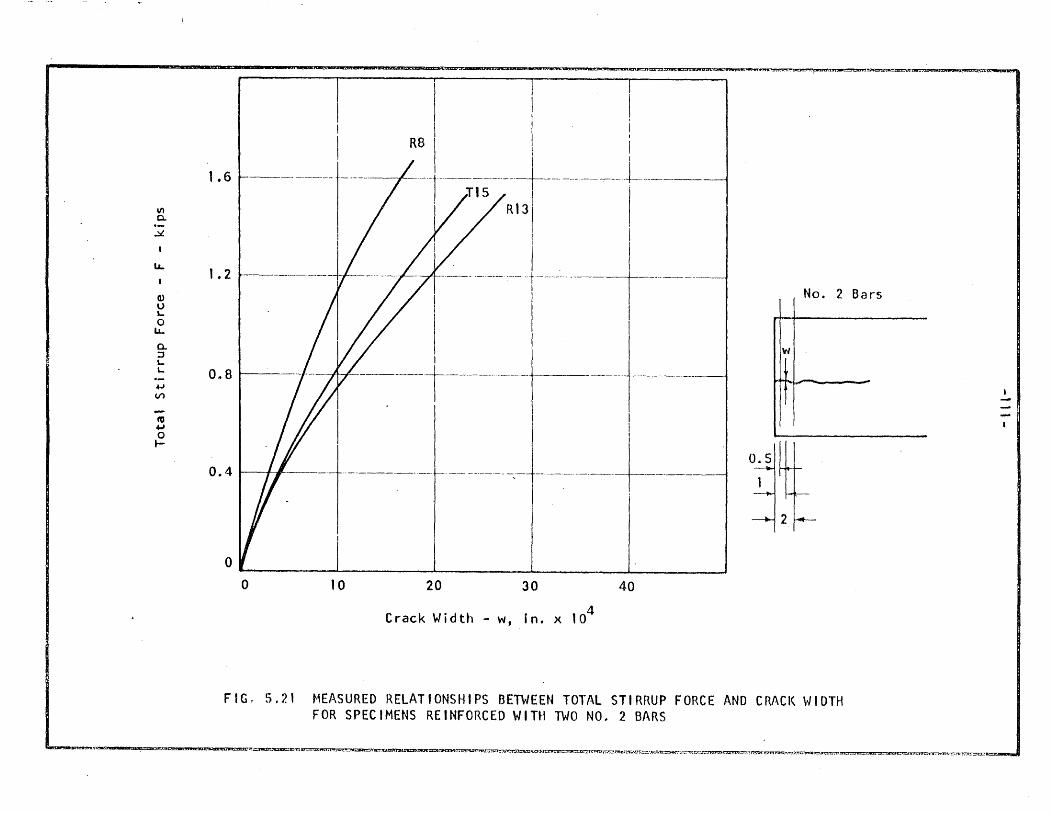
\f) a..
.::J.
.....
Q) u I-0
La...
0-::J I-I-
...., (,/)
to +J 0 I-
1 .6
1 .2
0 .. 8
0.4
I
I .
I t---~--~-I---------- ----+---------------4
t----#-! ..... I.... -+-------------1------ -------- ---
I I I
----------------+------ -o _. __________ ~ ________ ~ __________ ~ ________ ~ ________ ~
o 10 20 30 40
Crack Width - w, in. x t04
No. 2 Bars
w
FIG_ 5.21 MEASURED RELATIONSHIPS BETWEEN TOTAL STIRRUP FORCE AND CRACK WIDTH FOR SPECIMENS REINFORCED WITH TWO NO.2 BARS
"""""'WO!R'3 ___ a:W,",,,",",,,,,,,""'~lf~.E're;W ~UJ:3t .. i ...... :z.4Z£JG::aii%Sl~~~~~'I,.TI'3tI~-:l~~_n-.~:"~~Z:)T_fUiU$rt:t. .. ,."!i,:s:u.i2L"" x:s::zw:r.t~EZ:_ ...... i _i _~LI_._z=c.""!,:,,.~;.3 .• :::::L s::sI
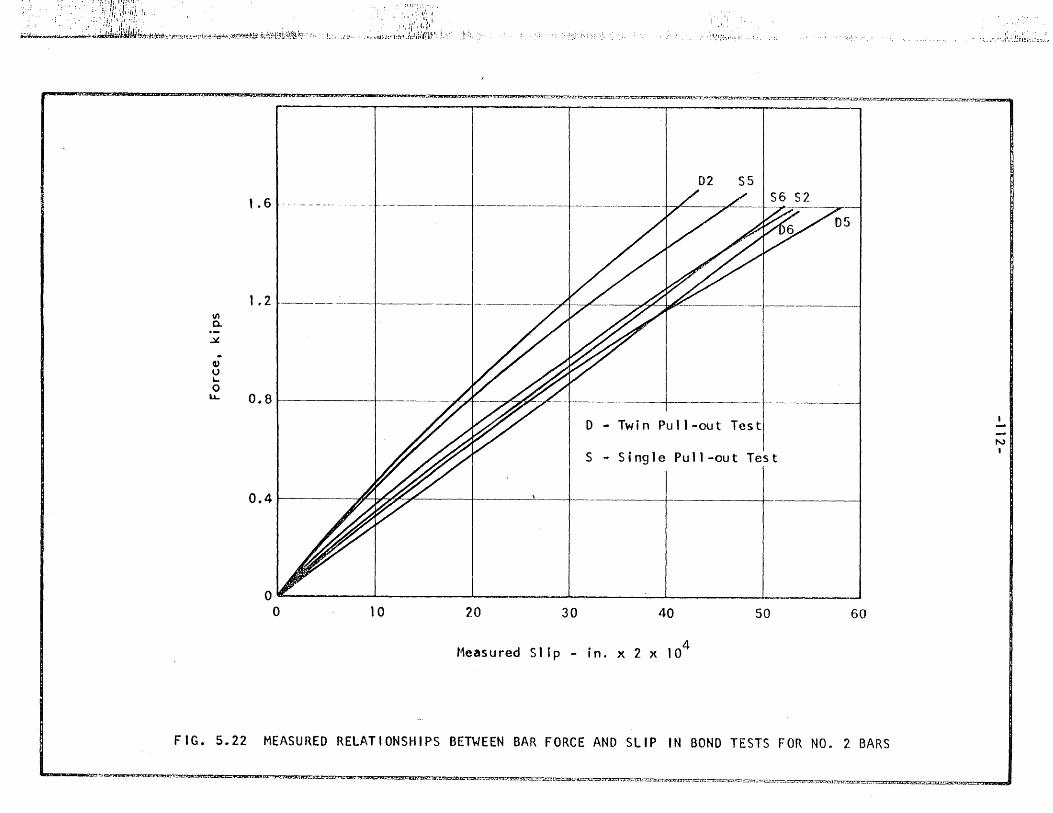
.-: ... ~.2iL~L:".""n.~",-.,-",.;_.~_,~ .. "",;,*""
: i;;j":::--
L .. :~ •..
•••• \,. f , ,~ i
<.:,:;,~;;:'EiJ(.i;;, L ,:., r :: ."C" .. . :~.! ;;;;.:~!;j;~~.:.;;:.~: ... :~ : !-: ! ! ( '; . ~ !. ,;
'T-T~UYJlhriU"P5 l)CI:;;::nc:;suz:J\iiEUL!WI.. :::aas RZiCLX:::X ~ .... m:n:_M,- z:_~ UC:::::::.>.J..JJh,..tzte:a:U!t co::::'5:Jl __ .I __ .W .. IJ., ••• £Zii3!k::;:;:S;lilXt:,::,rr."'l'!.+?--,*_ ... n.,j., .. CK:l' •.• JZJ. __ :i .JCLJ_-i.'::<::::iJ ••• Z_'C:c::;xe .... ::u ....... zu.t:::n.O:X ....... !L.--. r::~'"'mJ=._.""''''=1.5'''' __
1.6 . --~-·---l----~---- 02 S5
1.2 III Q.
..Y.
~ 0 ~
0 LL 0.8
I //1 /.#"/ o T' - Win Pull-out Test t -
N
S - Single Pull-out Test I
o.J ~ 1.-
O~-------------~----------~------------~--------~~------------~----------~ o 10 20 30 40 50 60
Measured Slip - in. x 2 x 10⁴
FIG. 5.22 MEASURED RELATIONSHIPS BETWEEN BAR FORCE AND SLIP IN BOND TESTS FOR NO.2 BARS
.. .U~.L""'!'51i:a .. WUA:Z::::¥<iJGi aHSfU'.2JCLalX§(:.FU_"'X2LLL!._LO,QfZ_ewua:;;;=m:_::!d!2ZCiSlti'b"":;·::Jl'_E.~~.::!~sr.:t~"~"~.::nam:~:;~~_""!:kl"-- :::::X:ll!.:CiXJ_· __ .·s:.:ffi.-:~~·~~~=-=r~:7.!'-:>::~;~'·~l~. "_"h::UZi!:L&i:Xl_fLJJLLt:lJj~~c.r:""'C::2 J seal
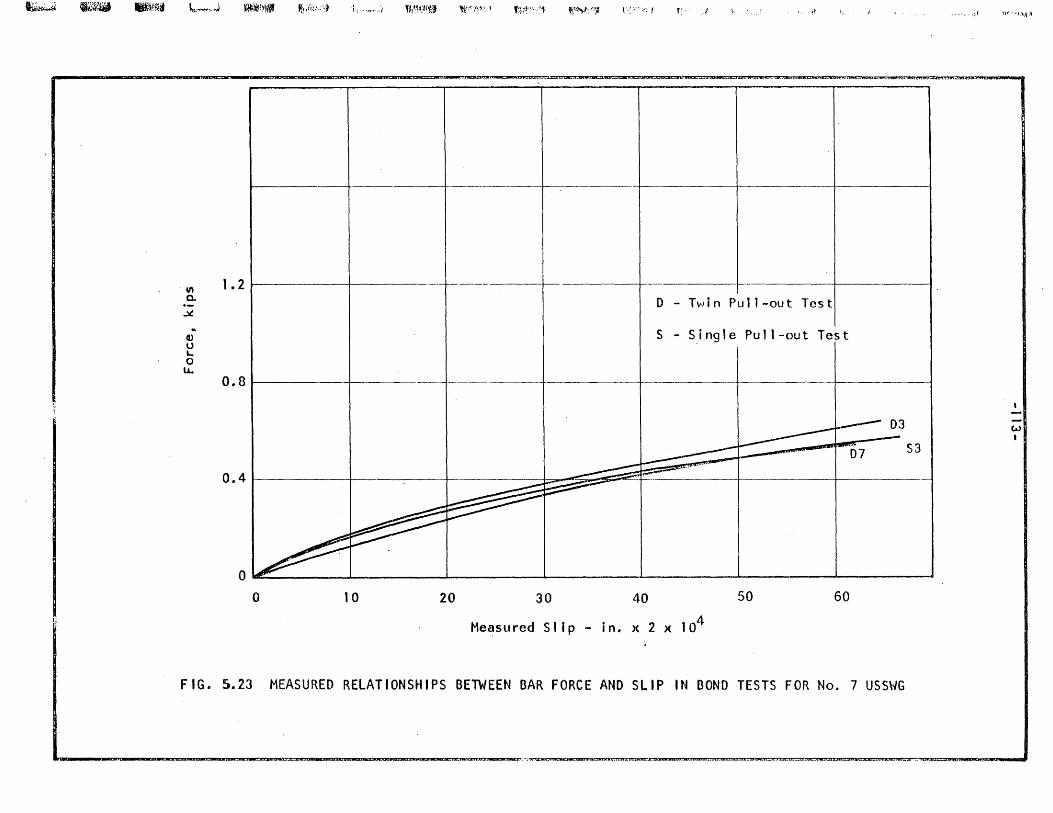
~~ .lW. ~~ t.,..":.,..,.,..,,-l N{mI ~jii1,::"~ L ·"- .. i 'f':~~(fiYfJ 'l:',,-?~~. 1 f~:i~;.'·;"~ i';'-'V':'-'1 \.,: .... ,:, r: , , ,~t I .. ,:, I \!.~. ,-- t;'il ;\
VI 1 .2 0- I o - Twin Pull-out Test --.Yo
... S - Single Pull-out Test Q) u L... 0
lL. 0.8
I I . • -
03 w • S3
I I VI
0.4
o .,..-o 10 20 30 40 50 60
Measured S 1 i p in. x 2 x 10⁴
FIG. 5.23 MEASURED RELATIONSHIPS BETWEEN BAR FORCE AND SLIP IN BOND TESTS FOR No.7 USSWG
.. _== zw6... au:z'_AI>L! ;-, K;;C . . """'"'~ ._OU."' •• U ... ihC:>U,"UU= .e:;xEKJJll«= '*CXJt>L, tJ"C.55_:Z· _ iD'= . ,
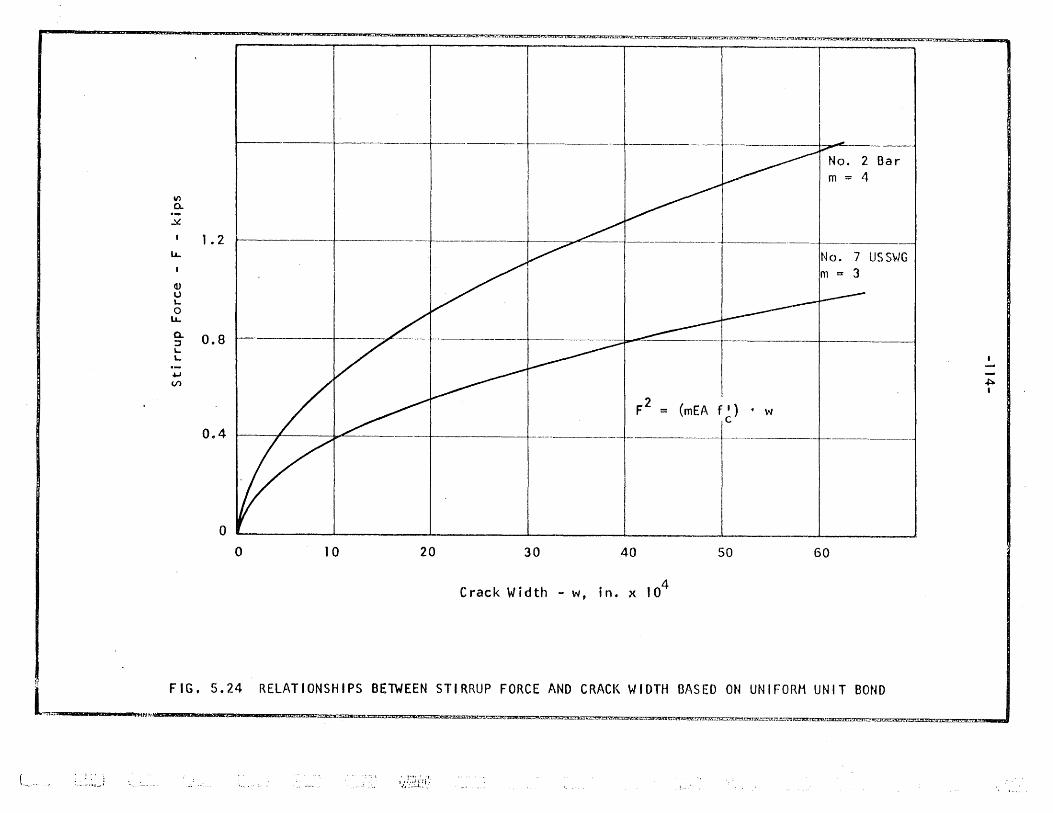
P'!--... -_::a:= ...... --"""''''''''--..... ..".:1IIOZ_ ...... ''''''''nao''"''''_A!Vl_.-''"''_--.==.,...=PE:'lill''':uC'~''''''''''''''''E ..... o:Ia"""'lSli::.~-*"""'B. :xO .• J ...... EJ sa::OJt5!t~·-~~'"-4'1..'!3nn.~ .. ~~u::::c:::"j!A!'-... l'.IU!Xf.J .. l~"",:>OT-;r;'~~J:'t7~ ... ~f;.>'!"J'.lo.~r-A.T.lt.:C1f,.Stt:c'lQILO:XS:U!iLLz:z .~.
Vl a.
.Y..
LL
Q) 0 1-0
LL
CL :J L.. 1-
.., Vl
I
I I I ~ J + -T- 11---- -- No. 2 Bar
I m = 4
1.2
0.8
0~4 I / Ji,.. ......
o o 10 20 30 40
2 F = (mEA f') ~ w c
50
Crack Width - w, in. x 104
No. 7 USSWG m ::r 3
60
tFIG. 5.24 RELATIONSHIPS BETWEEN STIRRUP FORCE AND CRACK WIDTH BASED ON UNIFORM UNIT BONO
~ +tI1r.,ts.'Ii~1IS1iI Wcu::r::::I&bX&i ... n:;::;::t.;-~~~<J1C>::a:::c:"S2R.j ... SC2'R1::e:::::at:ttris:::=s~~~~~~~~{~~~~:~CS.:.. ... '€3'.-.""<C'itj4_~~c:Q::t.L:Ll!te5Lia'
L ... , ' .. - -.&., ....... 1 1~,~ !:~~:li: i ~~
~ I
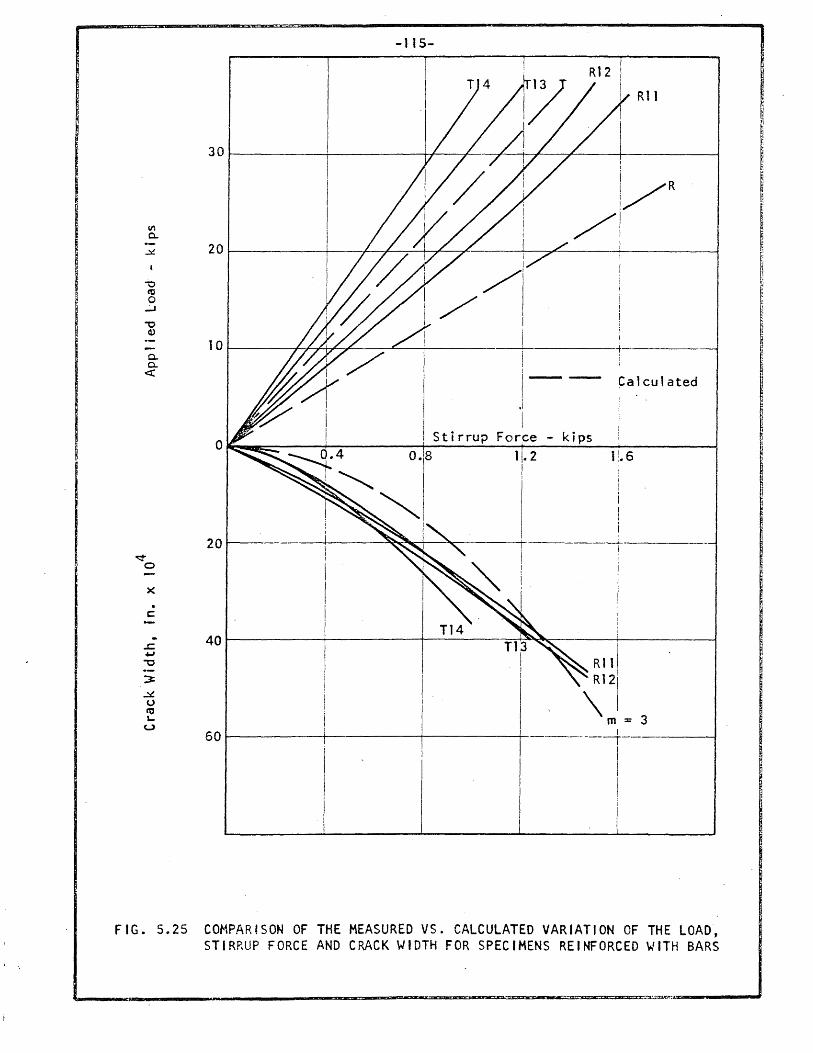
30
II')
0..
.::.! 20
'"'0 ttl 0
..J
""0 Q)
to 0.. 0..
<t:
0
,
20 --L I
~ i 0
I -
x I . I c: i .. 40 I
..c -' -0
~
..x 0 C'O '-
u 60
-115-
I
R12
R 11
I
I/R , /1 -----17 !
/i /1
I
I -t I
1-- Calculated
.1
I Force - kips
11_ 2 1:.6 I !
J
! ' I
I I I i
Rill R121
\1 m = 3 ,---------+----
I I I I I I
FIG .. 5.25 COMPARfSON OF THE MEASURED VS. CALCULATED VARIATION OF THE LOAD, STIRRUP FORCE AND CRACK WIDTH FOR SPECIMENS REINFORCED WITH BARS
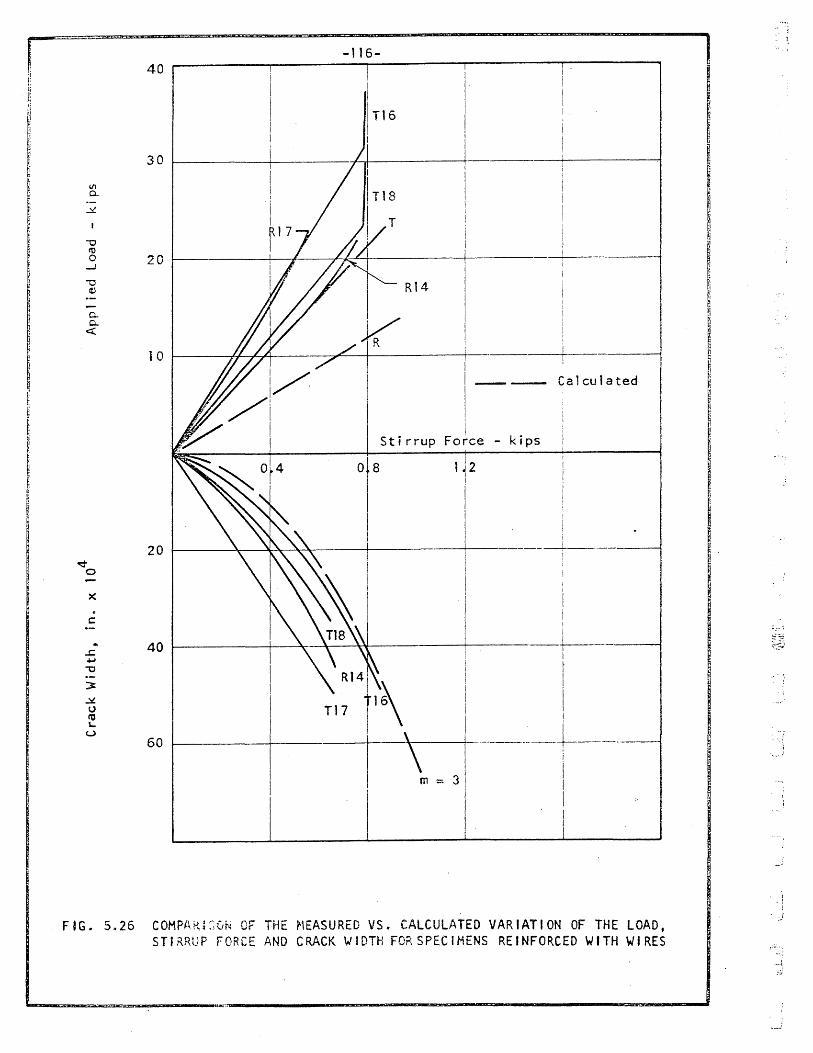
III 0...
0... 0...
<4:
<e::!-o
X
~
c::
.. ~ ~
'"0
:J: .:::£ U ro ~
u
-116-
T16
30 ~----~---.-+-.I------+
20 ~--.-----~~-~~+--------+------
R14
I 1 0 ~----#-~+----~~+-------t---------r-----
_-- Calculated
Stirrup Force - kips
20
0ta 1,2 I i
~---~---.:~~~----+I--__ -L __ -_J_-.------; J I
I 1 I
40
I : . i I
I-------+--~ '~~-"l-------4-i -----L-----I I 1
60
I f
I I I
I I I . I I
---+-... --.----1------m :; 3
FIG. 5.26 COMPIHU:~(,N OF THE ~'EASURED VS. CALCULATED VARIATION OF THE LOAD, STIRRUP FORCE AND CRACK WIDTH FORSPECIMENS REINFORCED WITH WIRES
I
. I
. (
)
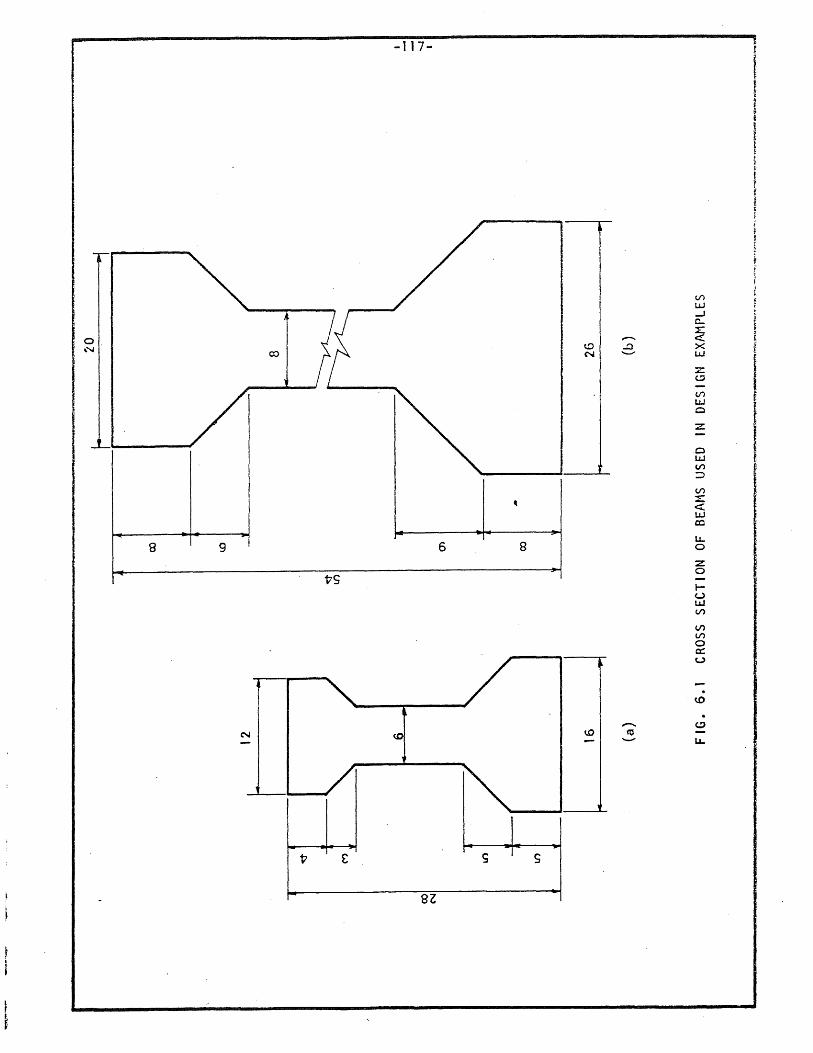
s s
8Z

-;
-118-
APPENDIX A
REVIEW OF WORK RELATED TO ANCHORAGE ZONE STRESSES
IN PRESTRESSED CONCRETE BEAMS
A.l Methods of Investigation
One of the specific problems in the analysis of anchorage zone
stresses is the stress distribution under concentrated loads. A wide .. l~
variety of methods has been used to investigate this problem. All 'procedures r:-:;. ~ ....
util ized different assumptions and approximations that had to be confirmed • ..........
~ The early relevant references treated the "concentrated load
:.:~ . . :r:
:".,#', .~ probleml' as a question in elasticity: the solutions were not intended for
err-::,.t~ , use in prestressed concrete and were 1 imited to two dimensions. In recent ":~~
t.ii years, the larger part of the work has been experimental.
0f .~i<.'. The mathematical solutions served as a good start in the early days \~
,,-
ff.' l; ,
~
of prestressed concrete. They were based on the mathematical theory of
elasticity. Later some other methods were employed, a few of them directly
G§; ~
for analyzing prestressed concrete end blocks. The analytical methods can
~ - be classified into three main groups: r--' ::- .~
·f .; (a) Most of the work done to date has util ized the two-dimensional LW
'.'
"
.;.: ,~ ~ ...
~ " ........
Ai ry stress function. The results were derived either in terms of infinite
fl· ~~
series (6,4,2,7) or were carried out using finite differences (8,3 9)q
~ I 'l>:
i ~ OJ;;
i % :"1 or:' .>;
" :J
(b) The second approach used a simple equil ibrium analysis, here
called the lIbeam method". This is a relatively recent approximate treatment
(10, 11, 12, 13).
~ (c) Lattice analogies were used by the third group of investigators
(14, 15)~ This method is considered to represent a check on other results
in specific cases rather than a general approach. Lengthy numerical ca1-
culations are needed in every case.
-119-
Of the fifteen theoretical investigations considered, ten were
strictly two-dimensional while the other five contained some kind of an
extension to three-dimensional cases. Half of the references consulted were
concerned only with axially symmetric problems.
The more detailed and popular analytical investigations belong to
the first group. Some of the authors used high-speed computers to e1 iminate
the use of assumptions made by previous investigators who did not have
access to computers.
Ten references (out of 25) contained some experiments. Five of
them were pub1 ished since 1960 and all the important ones since 1955. This
fact reflects the great interest in experimental analysis in recent years.
There have been two main types of tests: photoelastic experiments
on models and tests on concrete specimens. Photoelastic investigations
give the elastic stress distribution and, hence, are in certain respects,
simJlar to the analytical methods uSlng the theory of elasticity (8~ 16~ 179
18~ 19). The experiments with concrete models offer more useful results
because they reveal the behavior and failure patterns (209 21 ~ 8, 22~ 6 7 19 9
23). Unfortunately~ most of the research was done on axially symmetric
spec i mens on I y (21 ~ 229 16, 6 ~ 179 18).
Some of the experiments were done on concrete blocks, others on
beams q The instrumentation and the way of observation of the failure is of
importance. The instrumentation consisted ofelec~fric st"rain gages9
mechanical gages and gages on steel reinforcements. The visual observation
of the development of cracks (usually through hand magnifying glass) offered
first rate indications of the failure mechanismo This has been realized in
some recent investigations. However 7 the accuracy of these measurements • l
(width and length of cracks) must be examined and the data handled with care~ ~ .-.,f
-120-
The comparison of experimental and analytical investigations
reflects an approach that is similar to the ones in other areas in concrete
research. First theoretical solutions are attemptedq Then tests are
conducted to verify the assumptions and the theories. Usually these are
then modified and a new theory is developed which is appl ied to cases with
added variables. In some cases the experiments serve as controls, in others
as guides. This relation of experimental and analytical methods is typical
in reinforced concrete researchq Neither can stand alone.
In the investigation of end blocks of prestressed concrete,
analytical solutions were derived to determine the stress distribution. In
some cases these results were taken. over from calculations made for some
other reasons q The results differed in certain areas and this controversy
stimulated quest for further solutions. Some of the exper.imental investi
gations tried to settle the dispute and attempted to establ ish the Ilcorrect li
stress distributionq In the meantime other analytical approaches were tried
that endeavored to calculate the internal forces rather than the stress
distribution, After a while (in about 1958) it became apparent to some
researchers that the more pragmatical treatment was preferable. End blocks
of different scales were tested with or without transverse reinforcement.
With the findings of the present investigation, it has now been established
that instead of treating the problem as a stress concentration problem in a
homogeneous elastic body, it should be handled as an equil ibrrum problem of
free bodies produced by the formation of cracks. The width and length of
cracks became to be of concern. Therefore, the analytical and experimental
methods are equally important. The question is not of distribution 1 extremes
and averages of stresses under concentrated ioads, but rather it is about
the formation and extent of cracks" This also involves the study of bond
-121 -
under special conditions. In addition 9 the bearing strength under complex
stress conditions must also be investigated.
Ao2 Major Variables
In the early mathematical investigations the only variable was
the eccentricity of aline load on a semi-infinite body (7). Later, loads
acting on a finite area were introduced. The major variable was the ratio
of the loaded area to the width of the block (21, 6,4, 2). An extension to
three dimensions was presented by Sievers (10, 11) and by Douglas and Tr~hair
(6)9 though the usefulness of their results is limIted. I'n most cases the
cross section was rectangular with the height to width ratio as a variable.
The stress distribution under a tangential load can be superposed
on that due to normal loads to get the distribution under incl ined loads (2).
In the experimental investigations~ the major variab'les were the
cross section and the eccentricity of the load. Some authors tested concrete
blocks of various proportions to simu,late the conditions in end blocks (21~
227 6)0 in other instances different anchorages were employed (21, 6 9 23) 0
The amount and po~ition of the transverse reinforcement was varied in some
recent test programs (20, 21, 8, 22, 23) 0
The concrete strength and the value of Poissonls ratio were not
considered to be major variables In any of the investigations. Only a few
full-length beams were tested (20, 19, 9)~ the rest of the tests were done
on shorter models.
Ao3 Areas of Apparent Agreement in Analytical Studies
As it was mentioned in Sect~on Aol, the e9rly investi gations were
analytical. There was not much agreement among the resultso it was one
of the principal findings of later (mainly experimental) research that some
I
~." IJ
I
'J] c-~'I '~
'~
-122-
of the analytical work was concerned with problems that were too ideal ized.
The shortcomings of analytical investigations will be discussed in Section
A 050 ;
It has been found by mosi investigators that St. VenantOs principle
holds. The desi red 1 inear stress distribution is reached at a distance
equal to~ or in some cases (i5, 24) somewhat less than, the depth of the
section. At the same distance the transverse stresses become zero. In some
cas e s ~ howe v e r, t his f act was ass u med apr i 0 r i ( 8 , 1 4, 1 0 , 1 1, 1 2, 1 3) a
Nearly all investigators treated the two-dimens ional case only.
No detailed three~dimensional analysis would be practical, hence this
approximation is generally accepted. The photoelastic tests of Mahajan (24)
showed that the stresses in the third principal plane were small and occurred
only near the anchorages.
The most significant contribution of the analytical solutions was
the confirmation of Guyon's principle of partitioning (2). This approximate
procedure was described in Section 2040 Ziel inski and Rowe (21, 23) agree
with this method and recOOlmend its useo It is a very easy procedure and a
set of curves gives the transverse.stresses for various a/h values. Iyengar
(4) also agrees with Guyon. The 1 imitation of the symm~trica1 prism method
is presented in Section A.5.
(a) Magnitude and Position.of the Maximum Transverse Stress
There is some variation in the magnitude and position of the
maximum transverse stresses reported by various authors. An important
conclusion is that these stresses increase as the eccentricity of the load
increases (7, 2)0 They decrease as the size of the loading plate increases
(see later in this sectiQn). Guyon gives O.5p for the maximum transverse
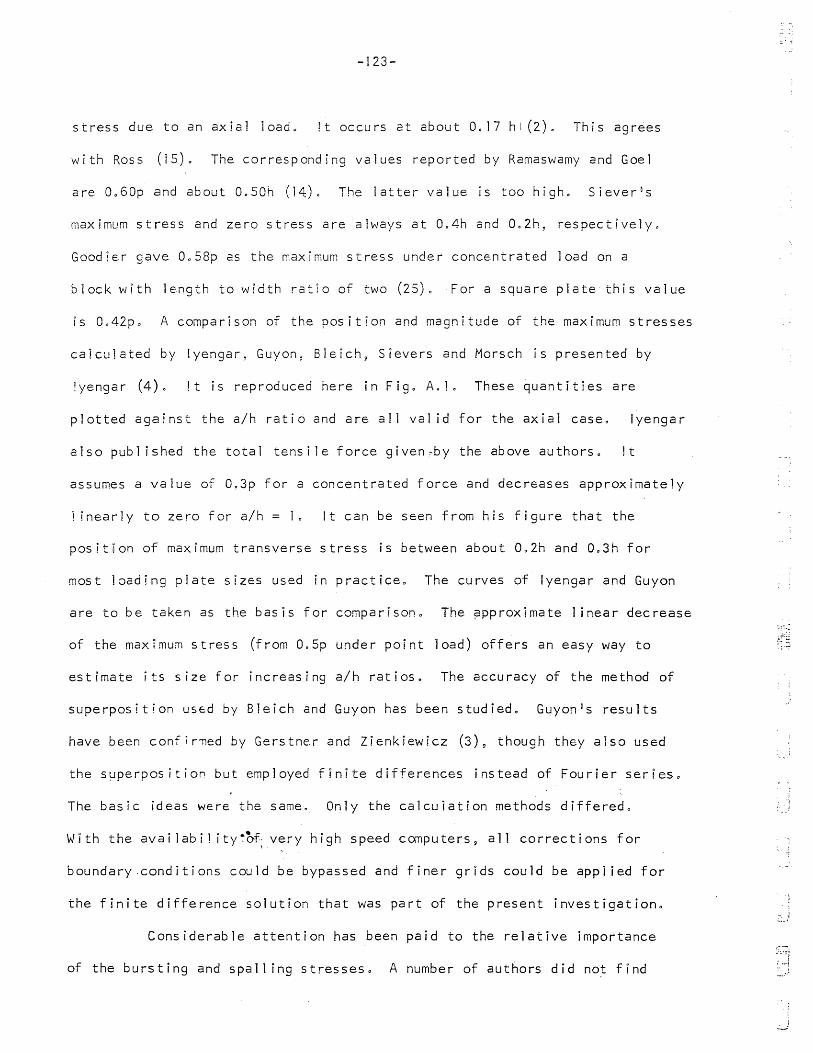
-123-
stress due to an axial load. !t occurs at about 0.17 h((2). This agrees
with Ross (is). The corresponding values reported by Ramaswamy and Goel
are 0.60p and about O.SOh (14). The latter value is too high. SieverDs
maximum stress and zero stress are aiways at 0.4h and 0.2h, respectively.
Goodier gave 0.S8p as the maximum stress under concentrated load on a
block with length to wfdth ratio of two (25). For a square plate this value
is 0.42p. A comparison of the position and magnitude of the maximum stresses
calculated by Iyengar~ Guyon, Bleich, Sievers and Morsch is presented by
~yengar (4). It IS reproduced here in Fig. A.1. These quantities are
plotted agafnst the a/h rati 0 and are all val id for the axial case. Iyengar
a i sop u b 1 ish edt he tot a 1 ten s i 1 e for c e g i ve n,.. by the a b ove aut h 0 r s • I t
assumes a. value of 0.3p for a concentrated force and decreases approximately
lin ear 1 y t 0 z e r 0 for a / h = 1. I tea n be see n from h! s fig u ret hat the
posit~on of maximum transverse stress is between about 0.2h and 0.3h for
most loadIng plate sizes used in practice. The curves of Iyengar and Guyon
are to be taken as the basis for comparison. The ppproximate linear decrease
of the max;mum stress (from O.Sp under point load) offers an easy way to
estimate its size for increasing a/h ratios. The accuracy of the method of
superpositfon used by Bleich and Guyon has been studied. GuyonU s results
have been confir~ed by Gerstner and Zienkiewicz (3)9 though they also used
the s~perpos ition but employed finite differences instead of Fourier series.
The basic ideas were the same. Only the calculation methods differed.
Wit h the a va i lab i 1 i t Y ~ of; ve r y h i g h speed COin put e r s 9 all cor r e c t ion s for
boundary.conditions could be bypassed and finer grids could be appl ied for
the finite difference solution that was part of the present investigation.
Considerable attention has been paid to the relative importance
of the bursting and spall ing stresses. A number of authors did not find
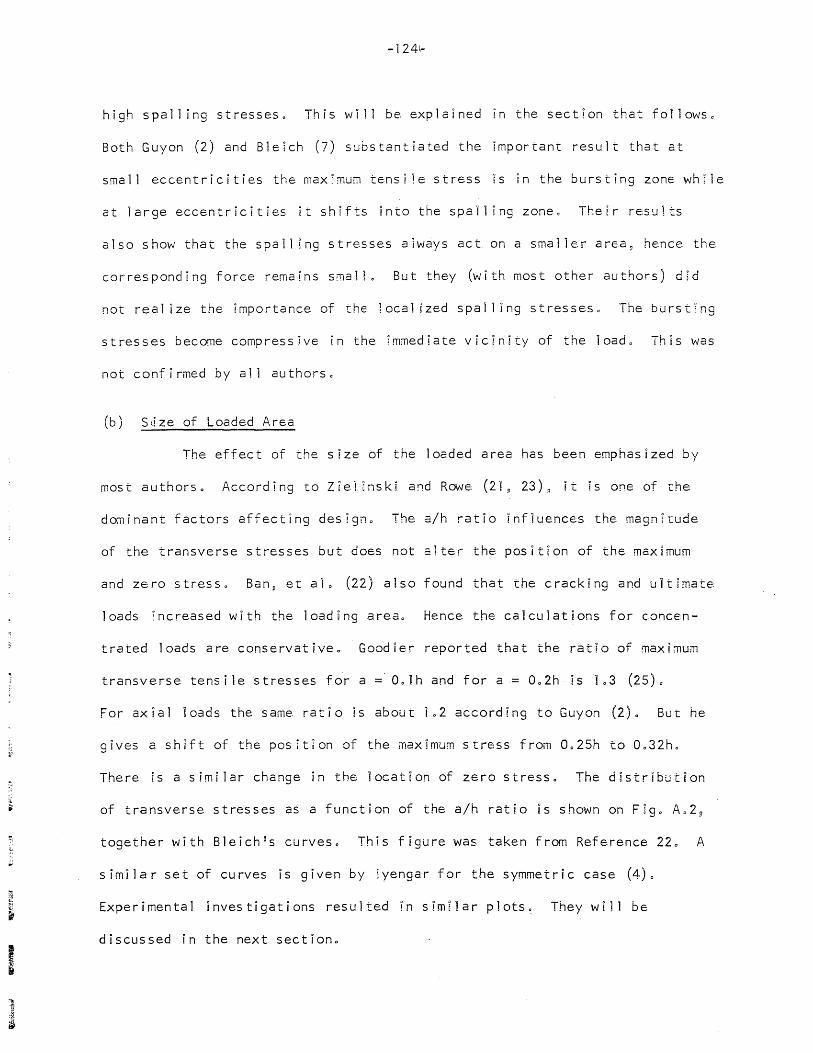
-1241-
high spall ing stresses. This will be explained in the section that fallows.
Both Guyon (2) and Bleich (7) substantiated the important result that at
small eccentricities the maximum tensile stress is in the bursting zone while
at large eccentricities it shifts into the spall ing zone. Their results
also show that the spall lng stresses always act on a smal ler area~ hence the
corresponding force remains small. But they (with most other authors) did
not real ize the importance of the local !zed spall rng stresses. The burst~ng
stresses become compressive in the immediate viCInity of the load. This was
not confirmed by all authors.
(b) SJze of Loaded Area
The effect of the size of the loaded area has been emphasized by
most authorso According to Zlel ~nskj a:ld ROVJe (219 23) ~ it is one of the
do:ninant factors affecting des !gno The. a/h ratio Influences the magnitude
of the transverse stresses but does not alter the posit~on of the. maximum
and zero stress. Ban~ et ala (22) also found that the crackling and ultl:nate
loads increased with the loading area. Hence the calculations for concen-
trated loads are conservativeo Goodier reported that the ratio of maximum
transverse tens i 1e stresses for a = o. ih and for a= 0.2h IS 1.3 (25) c
For axial loads the same ratio is about 1.2 according to Guyon (2). But he
gives a shift of the posftion of the maximum stress from O.25h to 0.32h.
There is a similar change in the location of zero stresso The distribution
of transverse stresses as a function of the a/h ratio is shown on F[go A.2 9
together with Bleich 5s curves. This figure was taken from Reference 22. A
similar set of curves is given by iyengar for the symmetric case (4).
Experimental investigations resulted in simnar plots~ They wi11 be
discussed in the next section.
I
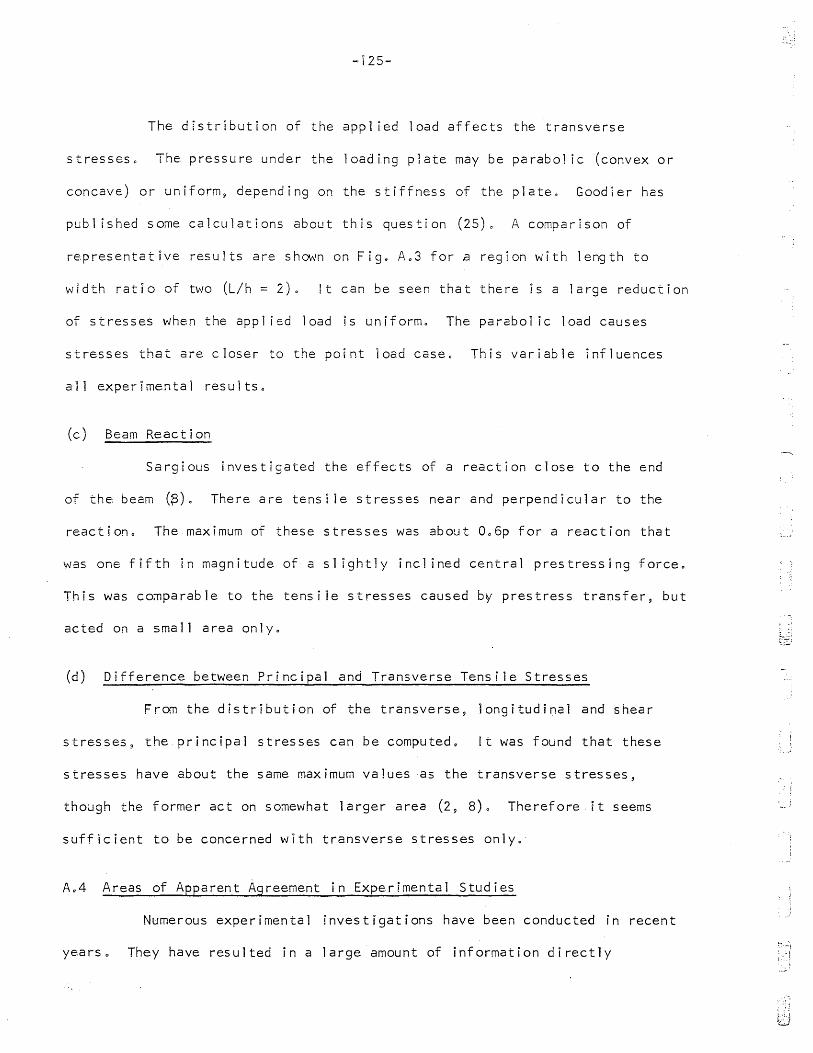
-125-
The distribution of the appl ied load affects the transverse
stresses. The pressure under the loading plate may be parabol ic (convex or
concave) or uniform 9 depending on the stiffness of the plateo Goodier has
publ ished some calculations about this question (25). A comparison of
representative results are shawn on Fig. A.3 for a region with length to
width ratio of two (L/h = 2). It can be seen that there is a large reduction
of stresses when the appl ied load is uniform. The parabol ic load causes
stresses that are closer to the point load case. This variable influences
all experimental results.
(c) Beam Reaction
Sargious investIgated the effects of a reaction close to the end
of the beam (;3). There are tensile stresses near and perpendicular to the
reaction. The maximum of these stresses was about O.6p for a reaction that
was one fifth in magnitude of a slIghtly inc11ned central prestressing force.
This was co~parable to the tensile stresses caused bV prestress transfer, but
acted on a small area only.
(d) Difference between Principal and Transverse Tensile Stresses
From the distribution of the transverse, .1ongitudil)al and shear
stresses 9 the principal stresses can be computed. ~ t was found that these
stresses have about the same maximum values as the transverse stresses,
though the former act on somewhat larger area (29 8). Therefore it seems
sufficient to be concerned with transverse stresses only.
A.4 Areas of Apparent Agreement in Experimental Studies
Numerous experimental investigations have been conducted in recent
yearso They have resulted in a large amount of information directly
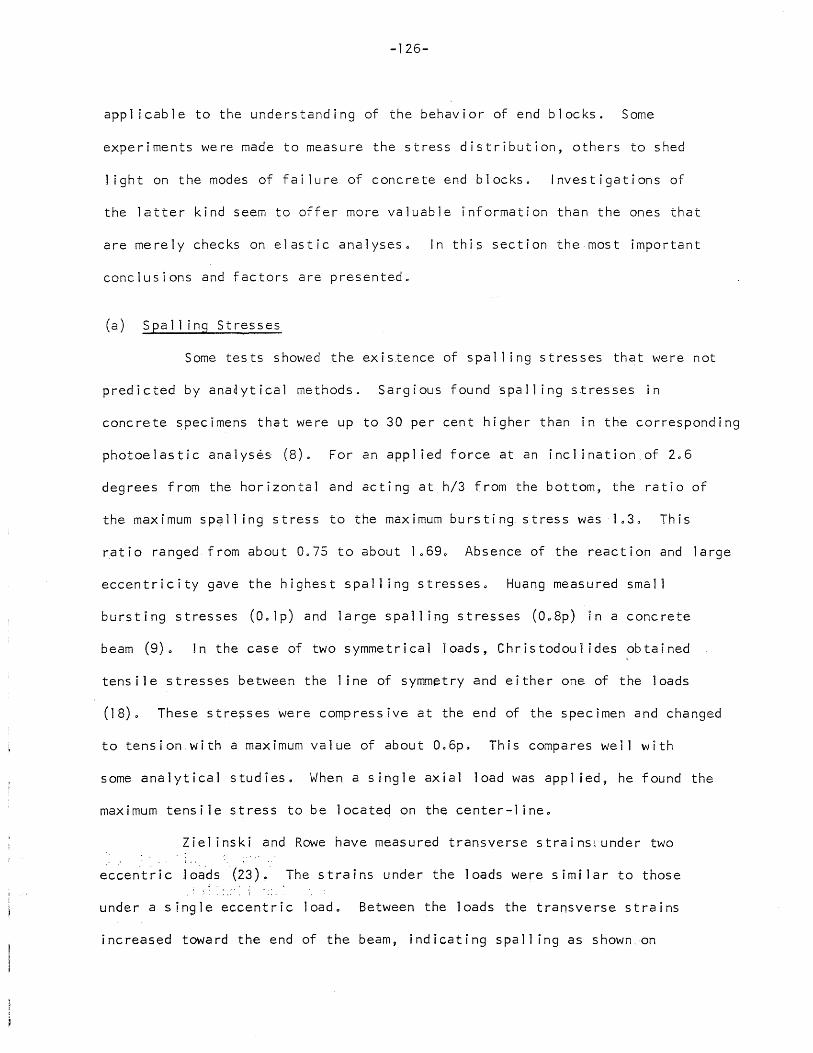
-126-
appl icable to the understanding of the behavior of end blocks. Some
experiments were made to measure the stress distribution, others to shed
1 ight on the modes of fai lure of concrete end blocks. Investigations of
the latter kind seem to offer more valuable information than the ones that
are merely checks on elastic analyses. In this section the most important
conclusions and factors are presented.
(a) Spall ing Stresses
Some tests showed the existence of spall ing stresses that were not
predicted by anadytical methods. Sargious found spall ing stresses in
concrete specimens that were up to 30 per cent higher than in the corresponding
photoelastic analys~s (8). For an appl ied force at an incl ination of 2.6
degrees from the horizontal and acting at h/3 from the bottom, the ratio of
the maximum spall ing stress to the maximum bursting. stress was 1.3. This
ratio ranged from about 0.75 to about l.69. Absence of the reaction and large
eccentricity gave the highest spall ing stresses. Huang measured small
bursting stresses (O.lp) and large spall ing stresses (0.8p) in a concrete
beam (9). In the case of two symmetrical loads, Christodoul ides obtained
tensile stresses between the line of symmetry and either one of the loads
(18). These stre~ses were compressive at the end of the specimen and changed
to tension with a maximum value of about 0.6p. This compares well with
some analytical studies. When a single axial load was appl ied, he found the
maximum tensile stress to be locateq on the center-l ine.
Zielinski and Rowe have measured transverse strainslunder two
eccentric ]o~ds (23).' The strains under the loads were similar to those
under a single eccentric load. Between the loads the transverse strains
increased toward the end of the beam, indicating spall ing as shown. on
-127-
Fig. A.4o It is to be noted that there is a relatively large compression
zone just off the line of the load. It is unfortunate that the strains
were not measured along the load acting in the fiangeo
(b) Bursting Stresses
Zie1 inski and Rowe checked the val idlty of Guyon's method of
partitioning (23). They compared the performance of symmetrical prisms
with loads on cubes and found that the surrounding concrete has some restrain-
ing effect on the symmetric prism. When there were several loads acting in
the flange~ tension occurred between these forces~ similar to spall ing
stresses. for the stresses along the load the principle of partitioning
appl ied approximately~ When the loads acted close, tensile stresses did not
develop between them. They also tested I-beams with tectangular end blocks.
In three tests single eccentric load acted (at O.224h) in the web.' The
measured transverse stresses are shown in Fig. A.5 v The strains were larger
for smaller anchorage plates. This agrees with the findings of other
authors. The so-called "l ower" tens i 1e stress zone at the junct:io'nof the
web and the end block can also be seen. It will be discussed later.
Ziel inski and Rowe have also tested concrete' blocks under axial
loads (21). The measured transverse strains were generally higher than what
al 1 the theories they used to predict those strains (Magnel ~ modified
Magnel ~ Bleich, Bleich-Sievers, Guyon). For some a/h values the Bleich-:...J
Sievers distribution came close to the experimental curves and in a few
cases exceeded them. Marshall and Mattock also concluded that analysis
underestimates the maximum stresses (20). F.or large eccentricities (or when
most strands are concentrated), ~he difference is quite large. Other
authors also inferred that Guyon1s values are low (22~ 19) and that Magnel
-128-
also underestimated the stresses (9). Ban, et al. (22) preferred Bleich's
values, but this preference is not considered to be conclusive or convincing.
Only Huang measured stresses that were sma] ler than Guyon!s values' but were
higher than those by Magnel (9).
For axial loa~ the resulting stress distribution is easily obtained
by two sets of curves. One shows the effect of a/h on the stress distri
bution along the axial load (Fig. A.6), the other gives the variation of
these stresses across a section normal to the axis as shown on Fig. A.7 (21) 0
(c) Tensile Forces
From the measured strain distribution the stresses and the resultant
forces were calculated by most authors. Sargious found in his photoe1astic
tests that the tensile force has an incl ination of about 5 degrees from the
vertical (8). This justifies the use of the transverse rather than principal
stresses. The magnitude of the force ranged between O. l5P and 0.24P depending
on the incl inatjon of the appl ied load and the size of the reaction. Similar
values were calculated by Ziel inski and Rowe from measured strains on
axially loaded blocks for a/h ratios ranging between 0.67 and Op3l(21).
They also 1 ist the corresponding values given by other theories as 1 isted
below:
Tensi 1e Force/App1 ied Force
a/h = 0.31 a/h = 0.67
Ziel inski-Rowe (measu red) 0.36 o. 19
Magnel O. 19 0.10
Bleich O. 19 0.09
Bleich-Sievers 0.27 o g ·11
Guyon O. 17 0.08
Morsch 0.17 0.10
-129-
There is relatively small scatter among the caiculated values.
The averages are o. 105P and 0.215P for the two cases considered. The values
calculated by Iyengar are 0.075P and 0.17P (4). Sargious proposed a1 inear
approximation based on Guyonfs results and on hrs photoelastic studies.
According to this method, the tensile force dlmln'ishes 9 frOll 0.30P for
a/h = O~ in proportion to the ratio of the loaded area and the area of the
end face of the block (8). This assumed linear relation would give 0.12P
and 0.22P for the above values of a/h.
The values measured by Zielinski and Rowe are considerably larger
than those based on theory. This disagreement was also observed between the
experimental and analytical results presented in this report as discussed in
Sect~on 303.
So far in this section the exper~mental stress distributions
(spa1l ing and bursting) have been examined and compared with some of the
theorieso In the remainder of thIs section some of the important influencing
factors (concrete properties~ loading p]ate~ anchorage~ shape of cross
section 9 reaction) wi 11 be d iscussed~ followed by some comments on crack
formation 9 action of reinforcement and design procedure.
(d) Concrete Qual i ty
Most researchers have agreed that reinforcement is the most
effective way of strengthening end blocks. A few of them (namely Abeles)
emphasized the need for better concrete and the importance of careful mixing
and casting (26). Due to the complex stress conditions existing in an end
block 9 the stress-strain relation of the concrete differs considerably from
that in a standard cyl inder. The strain capacity prior to cracking is
increased (23). Ziel inski and Rowe found that in a prism loaded over a
.J
-130-
small area the tensile strength may be 28 per cent higher than in the
spl itting test for a/h = 0.3. Th,i:s margin goes up to 47 per cent for
a/h = 0.7 (23). They suggest an increase in the maximum permissible strain
for strip loading.
Only a few authors registered some dependence of the ultimate load
on concrete strength (22, 6). Good compaction is thought to be more
important.
(e) :Loading Plate
There is a large amount of data on the effect of the size of the
loading plate. Most authors consider it to be the most important variable.
Perhaps only eccentricity is .~ore influential. Zie1 inski and Rowe obtained
maximum transverse stresses of 0.40p for a/h 0.7 and 0.73 p for a/h = 0.3
(21). These are 2 and 2.8 times larger than the corresponding values based
on Guyon's method. Hiltscher and Florin made photoelastic tests to study
this question (16). For h/a = I the tensile force is zero and the force
increases as h/a increases. For h/a > 30~ the force is close to the 1 imit,
about 90 per cent of the case for h/a = 00. The upper limit of the tensile
force is 0.3P. Hiltscher and Florin tested blocks that were fixed on one
side and loaded on the opposite side. The dimensions of the sections normal
to the force were not small compared with the length in the direction of
I the loads. The results were given as a set of curves that show the position
and magnitude of the resultant transverse tensile forces for various h/L
ratios. These values are of no direct interest in prestressed concrete where
this ratio is small. For a value of L = 23a the stress distribution is
shown as a function of h/a (Fig. A.8). All his results for long blocks
I (including the position of the tensile force) agree with Iyengar's results.
-131-
Sargious proposed a 1 inear correction for the size of the loading
plateo This simple procedure was discussed above.
The thickness (rigidity) of the bearing plate also has influence on
the behavior of end blocks. For stiffer plates the cracking and ultimate
loads increase (22). The variation in the rigidity of the loading plate affects
the pressure distribution over the bearing area. Hiltscher and Florin found
that the effect of this variation is usually less than 10 per cento When
the stiffness of the plate is large~ the pressure under the center of the
plate is smaller than under the edges and the transverse stresses are smaller
than in the case of uniform pressure (16). Conical action increases the
stresses and decreases the cracking load by 5 to 15 per cent (21)0 The method
of embedment and the material of the anchorage has no appreciable effect on
the stresseso
The bearing capacity of the concrete is increased due to the
confinement under the loading p1ateo Ziel inski and Rowe obtained contact
stresses that were more than three times the cube strength (21)0 The reln-
forcement has significant effect on the bearing capacity up to about 2 to 3
times the cube strength. The above mentioned authors obtained higher bearing
stresses in end blocks than in similar small cubes and hence concluded that
the remainder of the end block imposes some restraint. Also~ the bearing
capacity is larger under strip loading than under more individual loadso
Parabo1 ic pressure distribution must be assumed for larger (les~ stiff)
plates to yield the higher measured stresses (22). The difference between
~ .
the effects of cone and plate 10adin~ is smal1~ usually less than 12 per
cen t (21)·.
(f) End Blocks
One of the major results of recent experimental investigations
is that rectangular end blocks can be omitted on I-beamso Relatively few
-132-
tests were made on. this kind of specimen. There are two tension areas
present: one is the usual spall ing and bursting zones and the other is at
the change of the cross section. Huang found the latter zone at the center-
1 ine near the junction of the end block and the J-beam web. The tensile
stresses in the second area are of the same order of magnitude as the regular
spall ing stresses but act on a larger domain, hence are more critical (9).
He concluded that for the distribution of the force h is sufficient as the
length of an end block. Zie11nski and Rowe observed cracks at the junction
of the web and the end block. With eccentric loads, these cracks first
occurred due to maximum stresses at the inner edge of the end block (23)~
There is a different stress flow (spreading of forces) in I-beams
without rectangular end blocks than in beams with them~,. This·"was:. ..
explained in Section 3.2. Zielinski and Rowe measured failure loads of
I-beams about 17 per cent higher without end blocks than with endblockso
(g) Beam Reac t ion
The effect. of reactions is generally considered to be beneficial.
Only Sarglous made tests to substantiate this supposition. He foond (in
concrete beams and photoelastic tests) that the spall ing stresses were
smaller VJheil reaction was present (8). However? the reaction induced high
h 0 r l Z 0 n t a I 5 pal 1 j n 9 s t re sse sin the bot tom fib ern ear the rea c t ion. For -
tunately, ~hey act on a smal! area and hence nomInal reinforcement should
take care of them. The reaction decreases the transverse tensile stresses
and shift the resultant tensile force farther from the end. For a reaction
of 0.2P at h/6 fro~' the end, the maximum spall ing stresses are reduced by
40 per cent and the maximum bursting stresses by 37 per cent. This reduction
can not be util ized in practice, where the reaction is due to dead~load only
when the prestress is app1 ied.
-133-
(h) Cracking
Information on the development of cracks is insufficient. Marshall
and Mattock observed the cracks in the lower part of the web close to the
centroidal axis. The width of the cr~cks were from 0.001 to 0.004 in. (20)0
Zielinski and Rowe noticed the first crack under an axial load at O.lSh to
0.25h from the end (21). In some cases there was a spl itting in the flange
parallel to the axis of the beam.
(i) Reinforcement
The action of the web reinforcement has been investigated in recent
years only. The need for reinforcement is advanced by all authors. It is
generally accepted that some reinforcement should be placed close to the end
face to take care of the spal ling stresses. Guyon prescribes reinforcement
to provide for a nominal spall ing force of Oo03P which is enough for the
cases considered by some authors but insufficient in certain cases of large
eccentric~ty. The probJem is often three-dimensional and reinforcement must
be provided in the two prlncipal directions norma1 to the axis of the loads.
Reinforcement restricted the width of the cracks in bridges to
OoOi in. and 1 imited their length to a few inches (20). More stirrups take
a larger total force for a certain appl ied loado The variation of stirrup
strains along a pretensioned beam is shown on Fig. A.9 (taken from Reference
20). Ziel1nski and Rowe remarked that the amount of useful reinforcement
is limIted because of the contact stresses under the anchorage or bearing
p1ate will control the strength. The increase in bearing capacity due to
reinforcement is less than 40 per cent.
According to Sieverls analysis, the reinforcement should be
distributed over an area where x < 0.2h (11). Ziel inski and Rowe agreed
-134-
with other authors that hel ical reinforcement is more'efficient than mat
reinforcement, especially in the case of axial loadso
Some 'ref~rences contain recommendations for design and describe
how to· predict an approximate stress distribution and how to proportion
the reinforcement to take care of the tensile forceso Ziel inski and Rowe
recommend the use of the symmetrical prism method (219 23)0 They note that
the successive resultants approach may be used, but maximum stresses are
confined to 1 ines along actual loads and do not include lines of resultants
where there is no load actingo They use two figures to simpl ify the cal
culationso It is advised to continue the steel from top to bottom to take
care of the spall ing stresseso When a rectangular end block is used on an
I-beam, there is deep beam action and the lower tensile zone yields a tensile
force that is about 70 per cent of the force near the end faceo This is val id
for an end block whose length is equal to the height of the beam~ since only
this case was investigated by the authorso
Other authors follow similar procedures to des;gn the reinforcement.
They all start with picturing the result~ng elastIc stress distribution and
then give a few additional hintso
A substantial amount of information was gathered in this section.
~t resulted from experimental invest~gat~ons conducted in recent yearso
The disagreement found in the references will be discussed in Section A060
A05 Areas of Apparent Disagreement in Analytical Studies
There are a few 1 imitations common to all analytical investigations.
These will be mentioned in thrs section together with the discussion of some
points of disagreement among sa~e of the analytical methods.
Practically all investigations (with the notable exception of
that of Sievers) 1 imlted their work to two d;mensions. A three-dimensional
-135-
analytical investigation would be very compl icated even with a few variables.
The two-dimensional approximation is considered to be good if the loading ~ ~;-:'.
plate is wide (or if the individual loads are close to each other on a
horizontal 1 ine). However, this approximation is not good when the loads
are separated across the cross section and in the case of I-beams without
rectangular end blocks. In these cases experimental methods are more
convenient. The equil ibrium method advanced in Section 4.2 gives some
information also in the three-dimensional case.
As it was already discussed in Chapter 4, the analytical solutions
that treat elastic stress distributions reflect actual conditions only at
very low loads. Measured strains indicated that at some highly stressed
points inelastic action begins at low loads. Also, as soon as the first
crack forms, the elastic stress distribution changes suddenly. Forces
calculated from the elastic stress distribution .can serve as a first
es t i ma te on 1 y .
Some of the theories are based on assumptions that are not val id,
others hold in certain cases only. Thus, Magnel assumed that the transverse
stresses are distributed along a third degree parabola on longitudinal
sections (13). This is quite good along the line of a load, but is completely
wrong off :his 1 ine. Morsch's ana~ysis gIves forces that do not agree with
the resul~s of o:~er soiutions and the positions of these forces are wrong
(12). Iyengar Cr::iclzes the solution of some authors (for example, Guyon,
Bleich? Sievers) on the grounds that elther they give stresses that do
not satisfy the equil ibrium equations and the condItions of compatlbil ity
of the mathematical theory of elasticity, or that they do not give all three
kinds of stresses and, hence, such checks can not be made(4).
For a long time only Bleich's solution was known. With Guyonis
work publ ished in 1951, some controversy developed. Numerous investigators
-136-
have tried to resolve the differences (3, 4) in the stresses calculated
according to Bleich!s and GuyonSs methods. The lack of conclusive evid~nce
precluded confidence in either solution for a number of years. An account
of this was given in Chapter 2. It is now establ ished that GuyonDs solution
is better than Bleich1s (3,4).
Guyon publ ished tables of coefficients for the stresses for
certain positions of the load. However, the stress gradient near the load
is quite large and interpolation does not yield rel iable values between
points. The maximum stresses could have twice the values 1 isted in the
tables (27~,.
Many authors treated axial loads only and most of them (notably
the symmetrical prism method) did not predict spall ing stresses. Some other
methods also neglected these stresses (10, 13 1 28).
Available analytical methods do not take the problem as a whole.
The possible failure mechanisms are complex and may be due to mUltiple causes.
Cracking, bearing, high shear and Ine1astic action are all present.
The successive resultants method of Guyon gives the stresses on
resultants of groups of loads. if there is no load acting along the 11ne
of the resultant 1 then the method is not reI iable (23).
There ~s considerable disagreement between the analyticai a~
experimental results. This may be due to numerous causes. The conditions
are~ as mentioned above~ complex under the loads. There is inelastic action
and the failure may be the result of a number of contributing factorsQ
Douglas and Trahair questioned the adequacy of failure theories for these
conditions (6). They have measured strains that were much larger than the
values given by the spl it cyl inder tests. Ziel inski and Rowe also noteq
that the stress-strain relationship for the concrete under the complex
.r ..;.,'
-137-
stress conditions was quite different from the one measured in standard
specimens (23). Thus, the appl icabil ity of the calculated maximum stresses
is ques t i oned 0
The strains measured by Ziel inski and Rowe were generally higher ......
than.predicted by any of the theories (21). This was found in other
comparisons too. They have also observed that the position of the measured
maximum stresses agrees with the one given by theories, while the position
of zero transverse stress is closer to the end face in the former case.
Neither Siever's approximation 9 nor Sargious' finite difference solution
gives the compression zone under the load.
The bursting stresses based on measured strains were generally
higher than those calculated. This was found by Zielinski and Rowe (21)
and by Ban et a1. (22) and also in the present investigation.
Sargious attributed the differences between calculated and measured
stresses to various causes (inelasticity~ microcracks, etc.). Also he
found tha-t the inaccuracy of the finite difference solution accounts for .......
some of the discrepancy bs';tween his predicted and measured values. He
obtained tensile stresses and forces by the photoelastic tests that were up
to 30 per cent higher than the calculated ones. He could modify this number
by changing the grid spacing. Aside from the improvement in the mathematical
representation of the equations, a finer grid would reflect the loads under
the loading plate much better. Better results could be obtained when grid
points coincided with the edges of the 10ading plate.
There is even larger discrepancy between the results of analytical
methods and tests in the case of spal ling stresses. This indicates that
the spall ing stresses might be higher than the theories would indicate.
Large difference was noted by Sargious as mentioned above. Similar
-138-
differences between measured and calculated spall ing stresses were found in
the present investigation (Chapter 3)0
A.6 Areas of Apparent Disagreement in Experimental Studies
The number of experimental investigations has greatly increased in
recent yearso It became apparent that measurements give more trustworthy
res~lts under the complex conditions that exist in the erld block. The agree
ment among the results i? good 9 especially qualitativelyo
The photoelast ic tests can be classified with the analytical methods
in the sense that they yield elastic stresseso Sargious measured spall ing
stresses in concrete specimens that were 30 per cent higher than the corres
ponding values in the photoelastic tests (8)0 He explained the difference
by the 1nelastic action of the highly stressed concrete, and by the presence
of m i c roc r a c ks 0
In most experiments the strain gages were not close enough to the
end face to detect the compression zone (20). Also there is no good
instrumentation that would measure the action in the third dimension (across
the sect ion) 0
When axial loads were app1 ied 9 especial iy ~f spread over a
relatively large area, the spal I ing zone is smail and can not be measured (6).
While most experimental results agreed with those of GuyonDs theorY9
the tests of Ban, et aL tended to fo1low B~elchQs and Sleveros \l3]ues p that
were higher than Guyon 9 s results (22)0 They also found that the size of the
loading plate does not influence the cracking load appreciably. They also
disagree with other authors by finding a 1 inear relationship between the
concrete strength and the cracking and ultimate loads.
The three-dimensional nature of the problem is illustrated by
some test of Zie1 inski and Rowe (23). When there 1s more than one load
-139-
acting across the section, vertical cracks may occur between the loads.
This is especially important in the case of I-beams wi~h loads acting in
the flange ..
To interpret experimental results correctly, more basic research
is needed to obtain information on the behavior and failure of concrete under
complex combination of stresses.
r;-;. / ..
• :;. ,I
~ 'itt, ,~.
:orrl .• ~!i
·~I ;{.;< ..•.
,~. :~. '! ~i
:-.
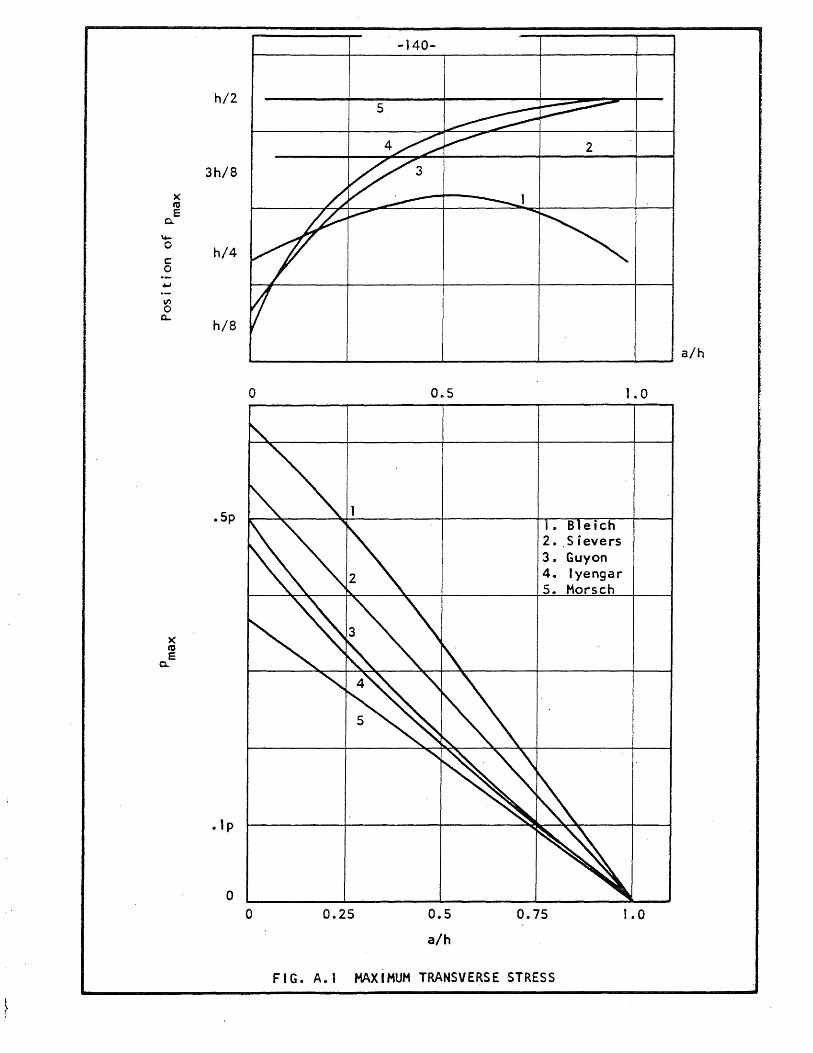
x ttl E
0..
~
0
c 0 .-~
V> 0
Q..
x co E
0..
h/2
3h/S
h/4
h/S
0
.Sp
. I p
o o 0.25
-140-
0 .. 5
0.5
a/h
, B etch 2. ,S ievers 3. Guyon 4. Iyengar 5. Morsch
0.75
FIG. A.I MAxiMUM TRANSVE~SE STRESS
a/h
1.0
1.0
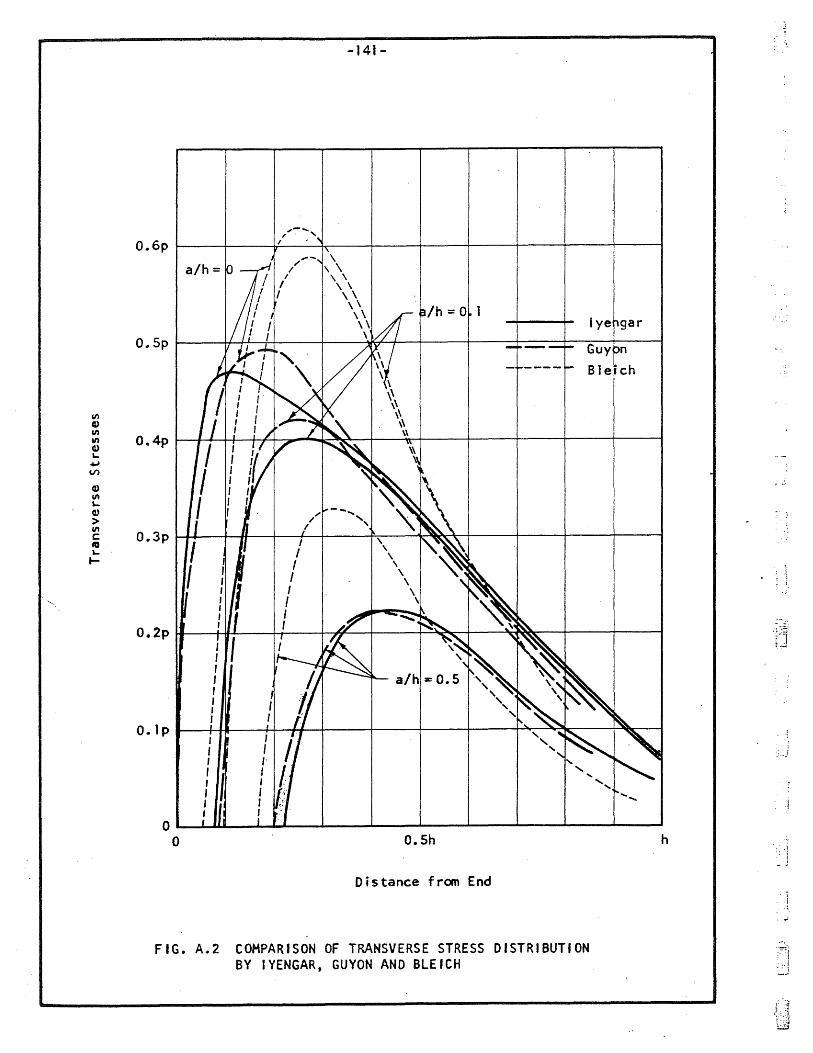
VI 4) VI I/)
4) ~
40J V")
CD II)
'-~ > II)
c:: fa '-I-
",- .... , - ,
-141-
O.6p ~ ____ ~ ____ ~/ ____ '~ ____ ~ ____ ~ ____ ~ ____ ~ ____ ~ ____ 1-__ ~
\ \ \ '\ \
\ \ \\ \\ \\ \\
\ O.Sp ~ __ -+~L-~ ____ +-__ ~~4--+ ____ ~ ____ +-__ ~ __ ~-+ ____ 4
O.4p
O.3p
O.2p
........
OL-~~--~~L---~----~--~----~----~--~----~----~ o O.Sh
Distance from End
FIG. A.2 COMPARISON OF TRANSVERSE STRESS DISTRIBUTION BY IYENGAR, GUYON AND BLEICH
h
.. -
~ 1
.--I l-~:;'
(J
-j
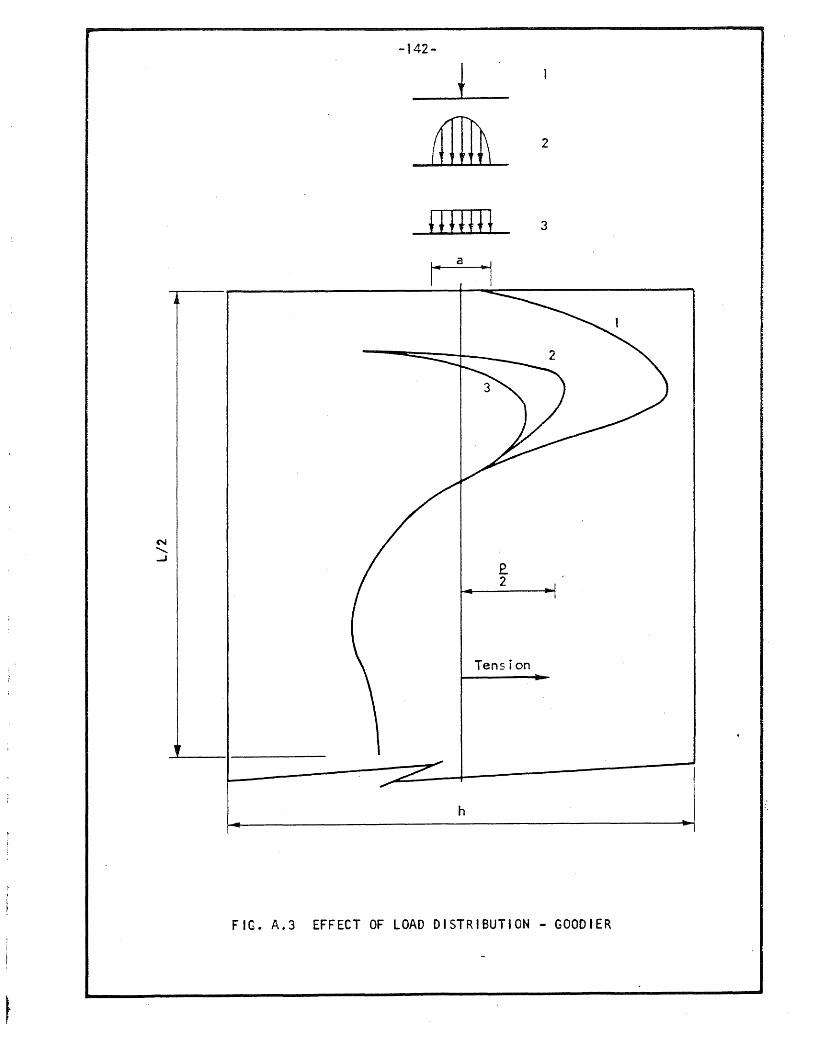
-142-
*llltil 3
I. a -I
.e. 2
Tension
h
FIG. A.3 EFFECT OF LOAD DISTRIBUTION - GOODIER
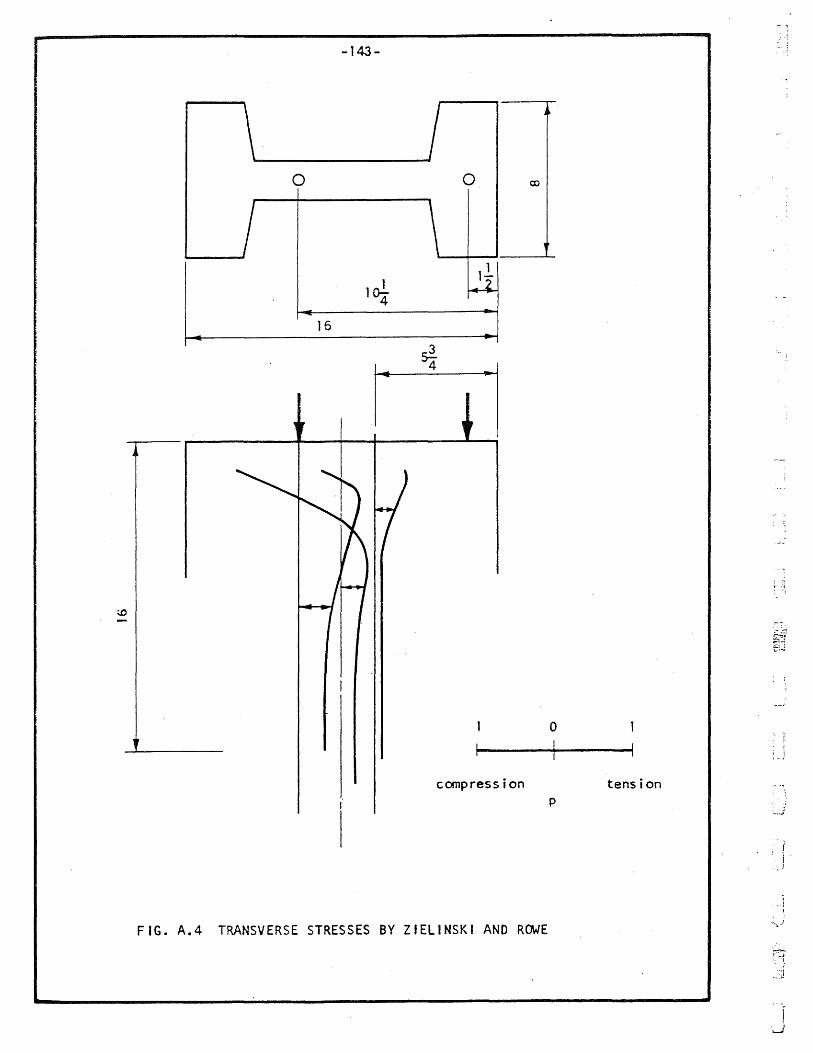
o
16
-143 -
1~ 4
o
~ 4
compression
FIG. A.4 TRANSVERSE STRESSES BY ZIELINSKI AND ROWE
o
tension p
.( j .
. i
.1
. I
<J
f 1
J
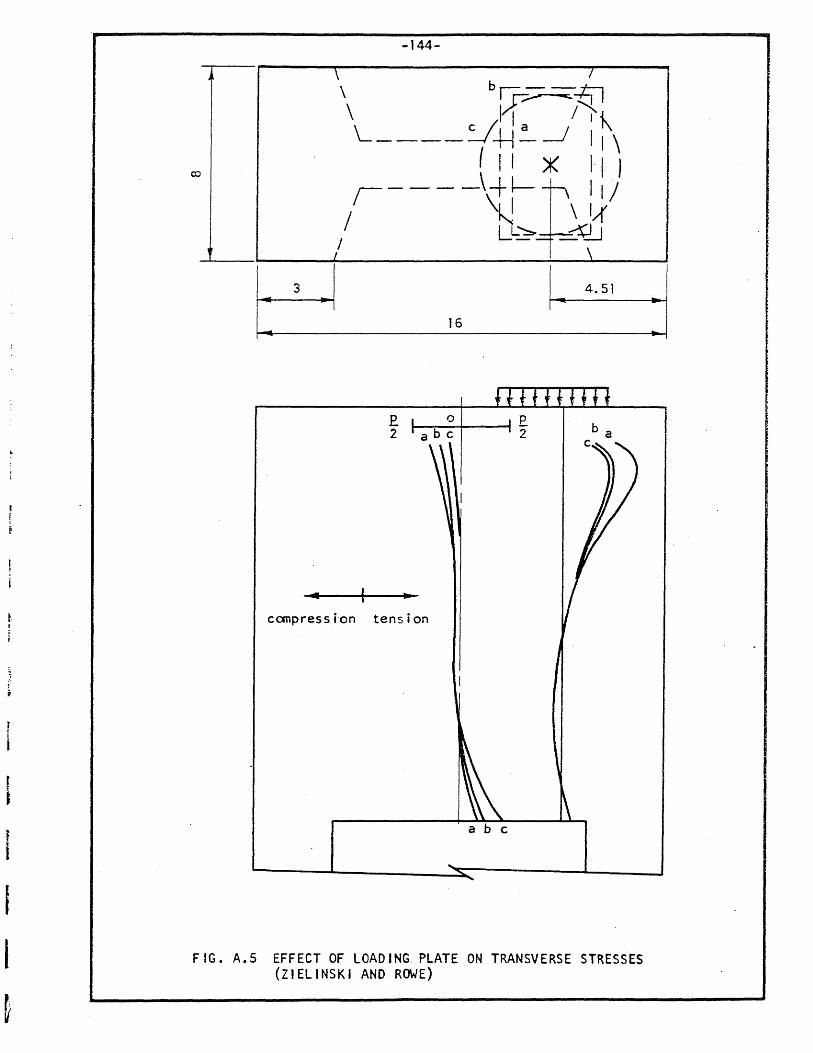
-144-
co
I: 3 .1 1_ 4.51
16
£. 0 E. 2 abc 2
canpress i'on tens ion
FIG. A.S EFFECT OF LOADING PLATE ON TRANSVERSE STRESSES (ZIELINSKI AND ROWE)
:1
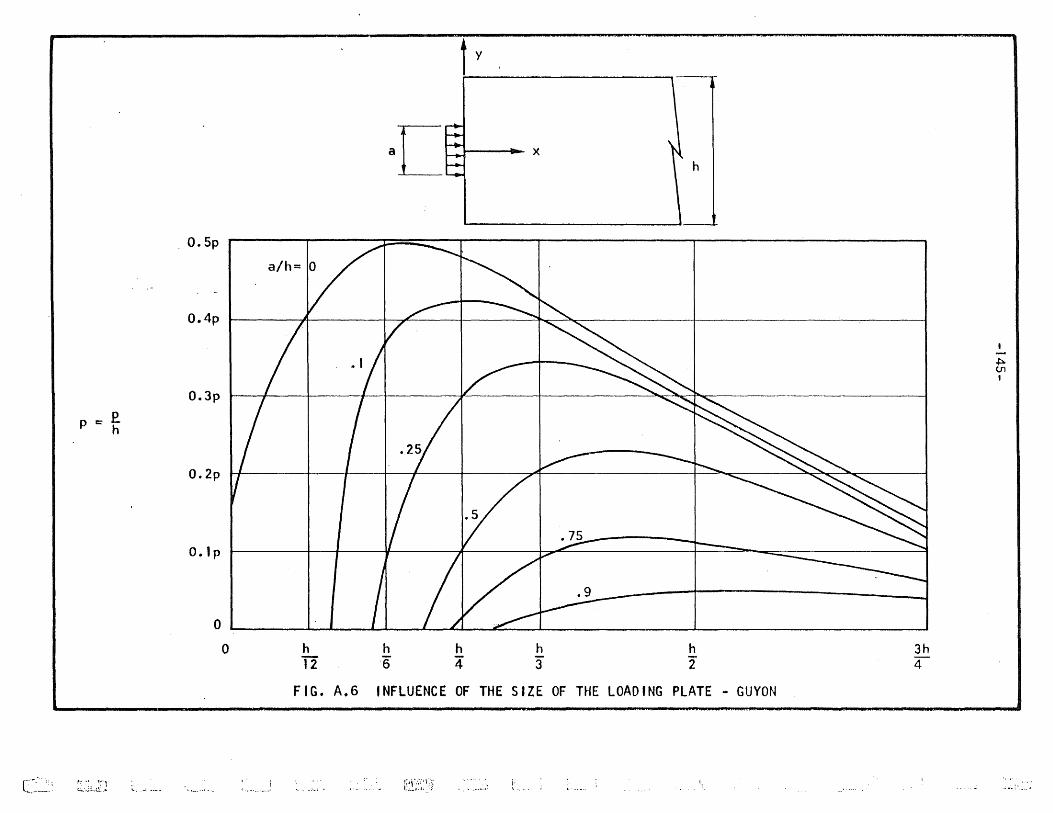
p c::: .e. h
c.-~~.; ~:~.J: .. J~l
t y
aL · O.Sp
a/h= 10
O.4p ·/1 V
I I I 1/ 0.3p
O.2p
A
o , c
o h 12
h '6
h 4
... X
I~~
h 3"
h
............ ~ ........... I
h 2"
-==
FIG. A.6 INFLUENCE OF THE SIZE OF THE LOADING PLATE - GUYON
E~l·;~~:: \ ~:)
..,
3h 4"
I -~ Ul I
; J~ ~.:.._ . .J
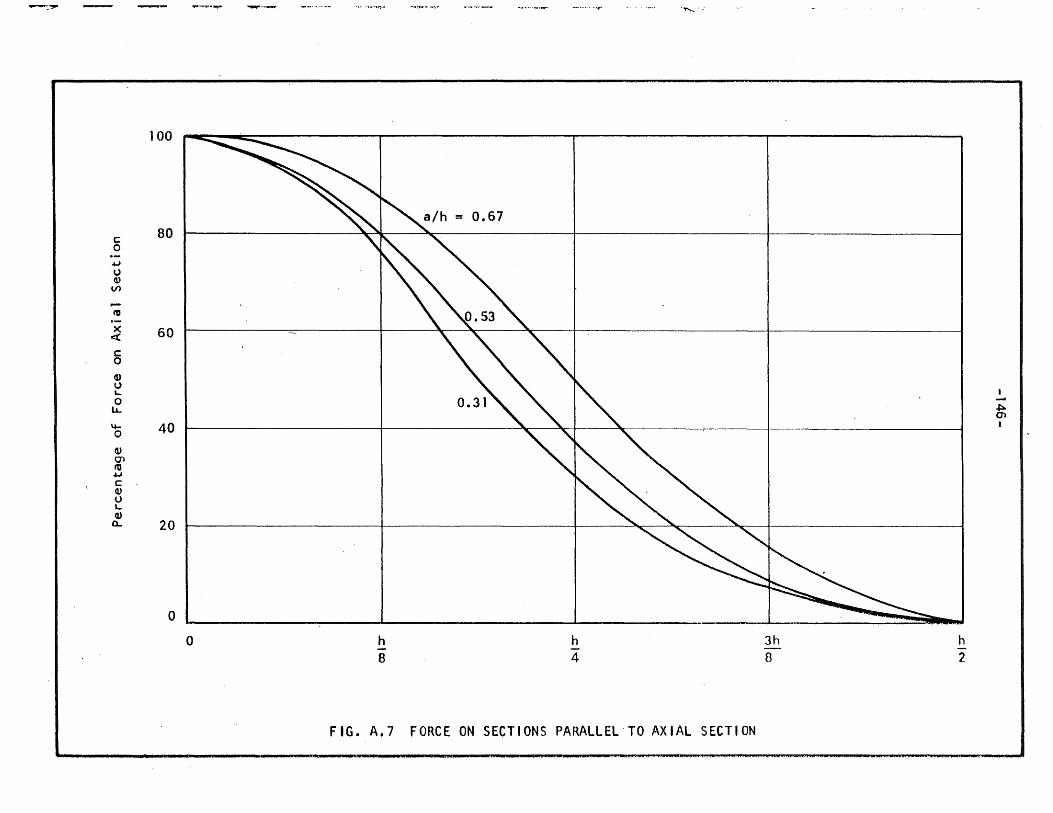
-~
c 0
.4J U OJ
V>
-cv -x « c 0
d) u '-0
1.1-
4-0
OJ O'l cv .4J C OJ U '-OJ
0...
....... """.uv-
100
80
60
40 I
20
o o h
8
0.31"" "" I ""
h 4
-.........
FIG. A,7 FORCE ON SECTIONS PARALLEL' TO AXIAL SECTION
3h 8
h 2
I -~ Ol I
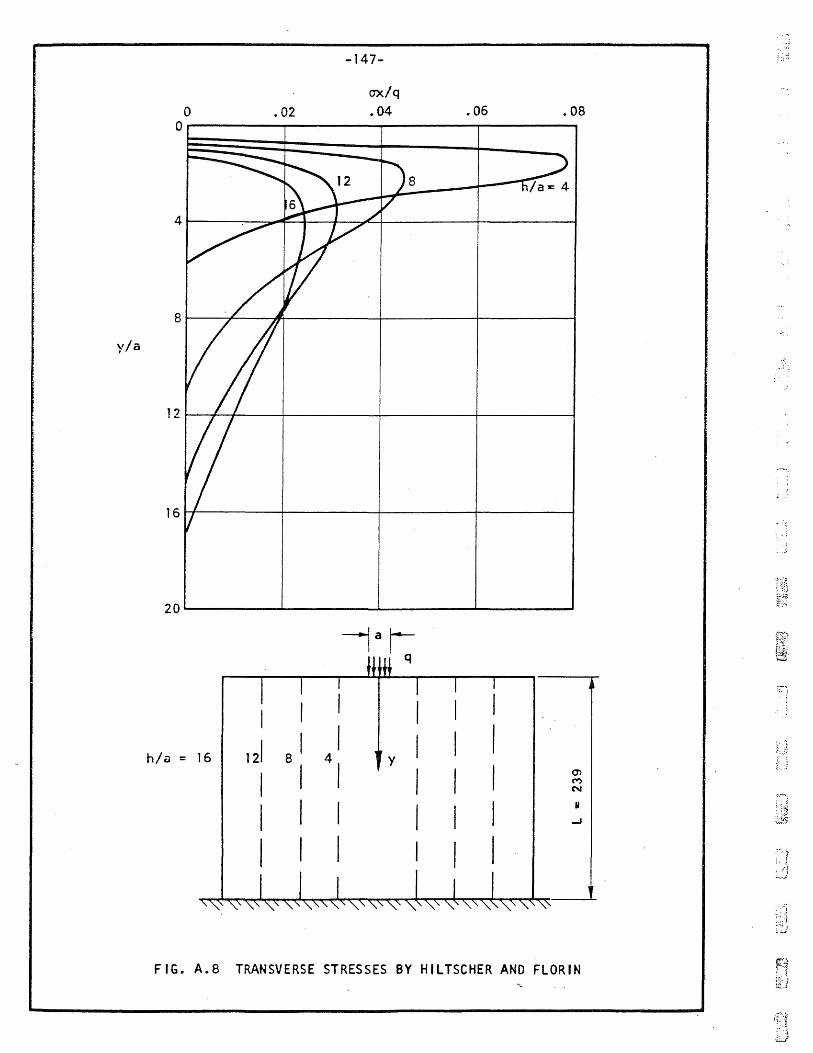
y/a
o .02
-147-
ax/q .04 .06 .08
o~------~------~------~------~
8
1 2
16~------+-------+-------~------~
20~------~------~------~------~
hIe) = 16 121 8 I I I (7)
M N
I I II
-J
I I
FIG. A.8 TRANSVERSE STRESSES BY HILTSCHER AND FLORIN
.'
, ..
': .. :
" . .:.
:;! . 1
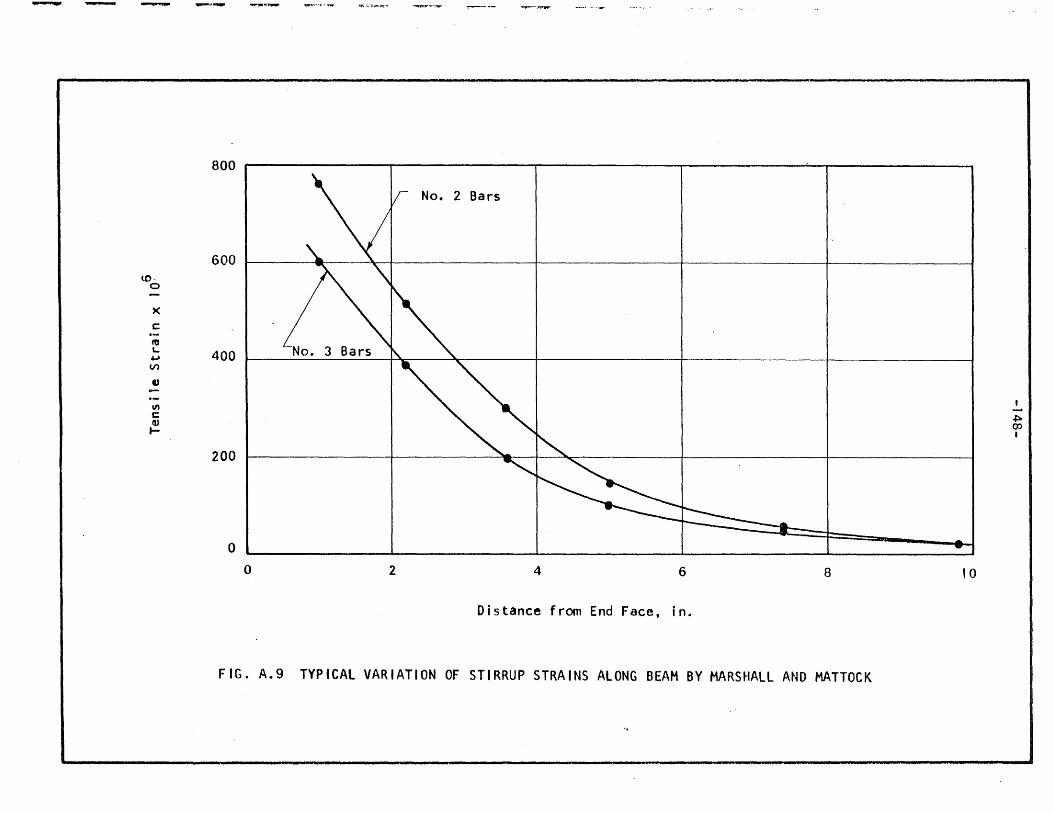
- ~~
800
No. 2 Bars
600 to·
0
)(
c: .-'" L..
""' 400 Vl ., -'" ~'l c ~ l-
I -~ 00 I
200
o o 2 4 6 8 10
Distance from End Face, in.
FIG. A.9 TYPICAL VARIATION OF STIRRUP STRAINS ALONG BEAM BY MARSHALL AND MATTOCK

, i ~
::1 : \ '",;j
B.l Materials
(a) Cement
-149-
APPENDIX B
MATERIALS, FABRICATION, AND TESTING
Marquette brand Type I i I portland cemeot was used in all specimens.
(b) Agg regates
Wabash River sand and gravel were used for all specimensc The
co~rse aggregate had a 3/8 in. maximum size. These materials have been used
in this laboratory for a number of years.
The origin of these aggregates is an outwash of the Wisconsin
glaciation. The major gravel constituents were 1 imestone and dolomite. The
sand was made up largely of quartz.
(c) Concrete
The design of the concrete mix was based on the trial-batch
method. The concrete strength ranged from 4500 psi to 5900 psi with most
of the test results grouping around 4700 psi, 5200 psi and 5700 psi. The
proportion by weight of the aggregates was about 1 :3.1 :3.4. The amount of
water was adjusted according to the moisture content of "the aggregates.
Cylinders for compression strength tests and for splitting tests
were cast, as well as beams for the determination of the modulus of rupture
in some cases. Table B.l gives the properties of the concrete in the
specimens. The values are averages of two or three tests.
The spl it cyl inder tests were done on 6 by 6-in. 6pn~rete cyl inders.
Two strips of l/8-in. fiber board were used to apply given loads on
diametrically opposite generators. The tensile spl itting strength fb is
given by the following formula:
-150-
2P fb = -rrdL
where P is the load at s~l itting and d and L are the diameter and the
length of the cyl inder~ respectively.
There was not enough spread in the concrete strength to procure
a usable relation between the spl itting strength and the compressive
strength. The length of the cyl inders varied between 5.6 and 6.7 in. The
speed of testing was 6 kips.per minute.
( d ) Rei n for c em e n t
Two kinds of reinforcing steel was used as web reinforcement:
No.2 deformed bars and No.7 USSWG wires. The bars had a nominal cross
sectional area of 0.05 in. 2 and a measured yield point of 50,000 psi. The
'cross-sectional area of the wires was 0.025 in. 2 with a measured yield
stress of 32,000 psi. The nominal yield force for the bars and the wires
were 2.5 kips and 0.8 kips, respectively.
(e) Tensioning Rod
One inch diameter STRESSTEEL rods were used to apply the external
force. They had a yield stress of 137 9 000 psi and a modulus of elasticity
of 25,800,000 psi. There were four of them in use to expe~ite the program.
Ordinary lubricant was appl ied on the rod to prevent bond. The ends of the
rods were threaded.
B~2 Description of Specimens
The principal part of the investigation involved tests on so-
called beams. A complementary program was also carried out to determine the
load-slip characteristics of the transverse reinforcement.
,)
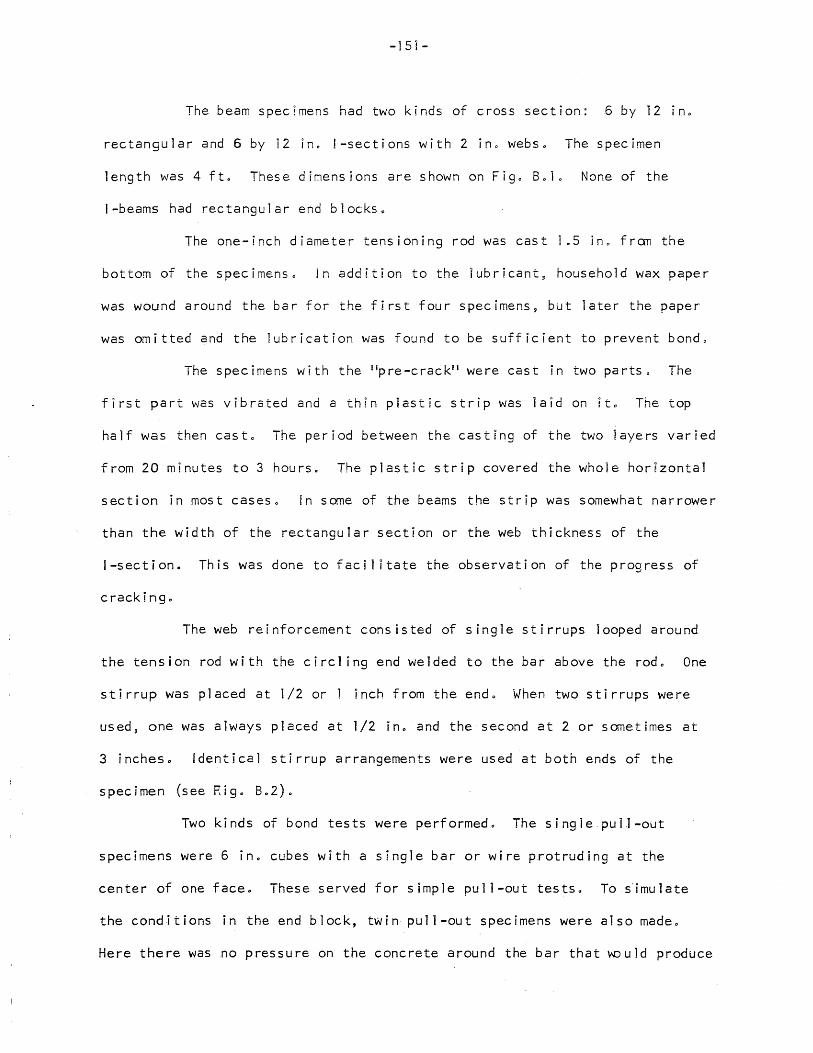
-151-
The beam specImens had two kinds of cross section: 6 by 12 in.
rectangular and 6 by 12 in. I-sections with 2 in. webs. The specimen
length was 4 ft. These dimensions are shown on Fig. B.l. None of the
I-beams had rectangular end blocks.
The one-inch diameter tensioning rod was cast 1.5 in. fram the
bottom of the specimens. In addition to the lubricant, household wax paper
was wound around the bar for the first four specimens, but later the paper
was omitted and the lubrication was found to be sufficient to prevent bond.
The specimens with the iipre-crackBl were cast in two parts. The
first part was vibrated and a thin plastic strip was laid on Ito The top
half was then cast. The period between the casting of the two layers varied
from 20 minutes to 3 hours. The plastic strip covered the whole hor!zonta1
section in most cases. !n sane of the beams the strip was somewhat narrower
than the width of the rectangular section or the web thickness of the
i-section. This was done to facil itate the observation of the progress of
cracking.
The web reinforcement consisted of single stirrups looped around
the tension rod with the circl ing end welded to the bar above the rodo One
stirrup was placed at 1/2 or 1 inch from the end. When two stirrups were
used 9 one was always placed at 1/2 in. and the second at 2 or sometimes at
3 inches. identical stirrup arrangements were used at both ends of the
specimen (see Rig. B.2).
Two kinds of bond tests were performed. The single pull-out
specimens were 6 in. cubes with a single bar or wire protruding at the
center of one face. These served for simple pull-out tests. To s'imulate
the cond1tions in the end block, twin pull-out specimens were also made.
Here there was no pressure on the concrete around the bar that \tDuld produce
-152-
confinemento Two symmetrically placed bars were pul led at the same time.
The dimens ions~f both blocks were 6 by 7 by 24 in. as shown on Fig. B.3.
A No.3 bar was placed as indicated in these blocks as wel 1 as in the beams
to prevent failure due to bending stresses.
B03 Casting and Curing
All beams were cast in steel forms. The tensioning rod was lubri-
cated and~ in so.~e cases, wrapped in wax paper.
The concrete was mixed in a drum type mixer of 6 co. ft capacity.
Usua11y two batches of concrete were required in each beam. When a pre-crack
was desired 9 the concrete from the first batch was placed In a layer to the
height where the crack was to be had and a thin strip of plastic was placed
on it just before the casting on the top[,:.malf. The top part was placed
usually 2 to 3 hours after the casting of the bottom half, although in a
few cases this period was only 20 minutes. Three compression cyl inders and
three 6 in. long spl it cyl inders were cast from each batch.
A few hours after casting, the top surface of the beam was
trowelled smooth and the cyl inders were capped with neat cement. On the
fol lowing daY9 the specimens and the cyl inders were removed from the forms
and were placed under wet burlap for about five days. Then they were set up
for instrumentation and testing. The specimens were usually seven to nine
days old at the time of testing.
8.4 Instrumentation
(a) Gages on Concrete
Various methods were tried to measure the strain distribution on
the surface of the end blocks. Electric strain gages proved to be the best
" . l :.1
:. :; . I
\ I
1
--'
-153-
Type A3 SR-4 gages were placed along 1 ines on which the strain
distribution was to be determined. A typical pattern is shown on Fig. B.4.
The gages have a nominal length of 3/4 in. and a minimum trim of 3/16 in. A
,base layer of duco cement was appl ied on the concrete that had already been
smoothed with sand paper. A second layer of cement was used to attach the
gages about ten minutes later. The lead wires were soldered one day later.
(b) Mechanical Strain Gages
On some of the end blocks mechanical gages (plugs) were glued in
order to measure the strain distribution. This was mainly done 1n order to
obtain a~ approximate idea of the extent of the 1ead~in zone and of the beam
r
action. Readings were taken with a Whittemore gage that had a gage length
of ten incheso The sensitivity of the measurement was apout 0.0002 in.
r (d) Dials
I Ames dials were used to measure the crack width in most reinforced
specimens and also to determine the amount of s1 ip of the stirrups in the
I beams and of the bars in the bond tests. The dials had a sensitivity of about
0000002 in.
t _ The gages were mounted on the concrete above the 1 ine where the
I crack was expected at 1, 3, 6 and 10 in. from the endo Aluminum angles
were glued on the concrete below the 1 ine. This can be seen on Fig. B.5ao
I In some cases similar dials were fastened to the protruding end
i of the transverse reinforcemento The plunger of the dial rested against the
top of the beam.
I In the bond tests one dial was fastened to the end face of the
concrete b10ck 9 The tip of the dial rested on the end of the bar that came
I flush to the concrete surfaceo

-154-
(d) Strain Gages on Reinforcement
The strain was measured in the transverse reinforcement at the
crack. Type A7 SR-4 electric strain gages were put on the bars and wires.
The pre-crack was made at the center of the gages. After the beam was
tested~ it was broken to check if the crack passed through the gage. This
was true in most caseso The gages were appl ied in the prescribed manner.
The bar was filed smooth and sanded with emery cloth. The gage was trimmed
and glued with Eastman 910 adhesive. Then the lead wires were soldered and a
layer of wax was put on the gage. A protective layer of Epoxy served as
the outside cover. The insulation and resistance were;rhen.;checkEid.
8.5 loading Apparatus
Various methods of loading were tried at the beginning of this
investigation. ·It was necessary to maintain symmetric behavior. This was
found to be best achieved by the arrangement finally adopted.
The one- i r7lch:.d i ame ter high strength s tee 1 tens ion i ng rod was cas t
unbonded in the concrete. On one end~ a steel bearing block with a bearing
area of 6 by 3 in. was used. A 50-ton center hole jack pressed on the steel
block with the reaction suppl ied by a nut on the end of the rod. The jack
was operated by a Blackhawk pump.
On the other end, the bearing area was 6 by 1.5 in. A dynamQ~eter
was placed between this block and the nut. It had been cal ibrated and had
a sensitivity of 310 lbs. corresponding to one dial division on the strain
i nd i cator. Th i s end of the beam has been denoted as the lites t end ll• It
can be seen in Fig. B.4. The testssetup is shown in Fig.B.6.
It was found by the reversal of the ends that the bond was
negl igible and the loads were nearly equal at the two ends.
I I r
-155-
The bond tests were carried out with two 1 ines of loading systems.
The single pull-out tests were made in the manner described in Reference 29.
The twin pUll-out specimens were loaded by a small jack pressing against
the center of the block on an area of 4 by 4 in. on one end and against a
dynamometer on its other end~ This can be seen in Fig. B.5b. On one bar
a strain gage was mounted to have a check on the distribution of the total
load between the two bars. The sl ip was measured with a travel) ing
microscope as described in Reference 29.
B.6 Test Procedure
In the beam test the applied load was measured by a dynamometer.
The strain distribution in the concrete was given by electric strain gages
and mechanical gages (whittemore plugs). Dials were used to determine the
crack width at some locations. Electric strain gages measured the stralns
in the reinforcement at the crack.
The development of the cracks was noted and the cracks were marked.
Photographs were taken at significant stages of the test. The load was
appl ied in about 15 increments to failure or to 50 kips~ whichever was
reached first. Each test took less than two hours.
in the bond tests~ the load was measured by the dynamometers. An
electric strain gage on one of the bars in the twin pull-out specimens served
as a check on the loads in the symmetrically placed bars. A travel1 ing
microscope was used to measure the amount of sl ipo The load was appl ied in
10 "-equal increments up to yielding of the bar. Each bond test took less
than 40 minutes.
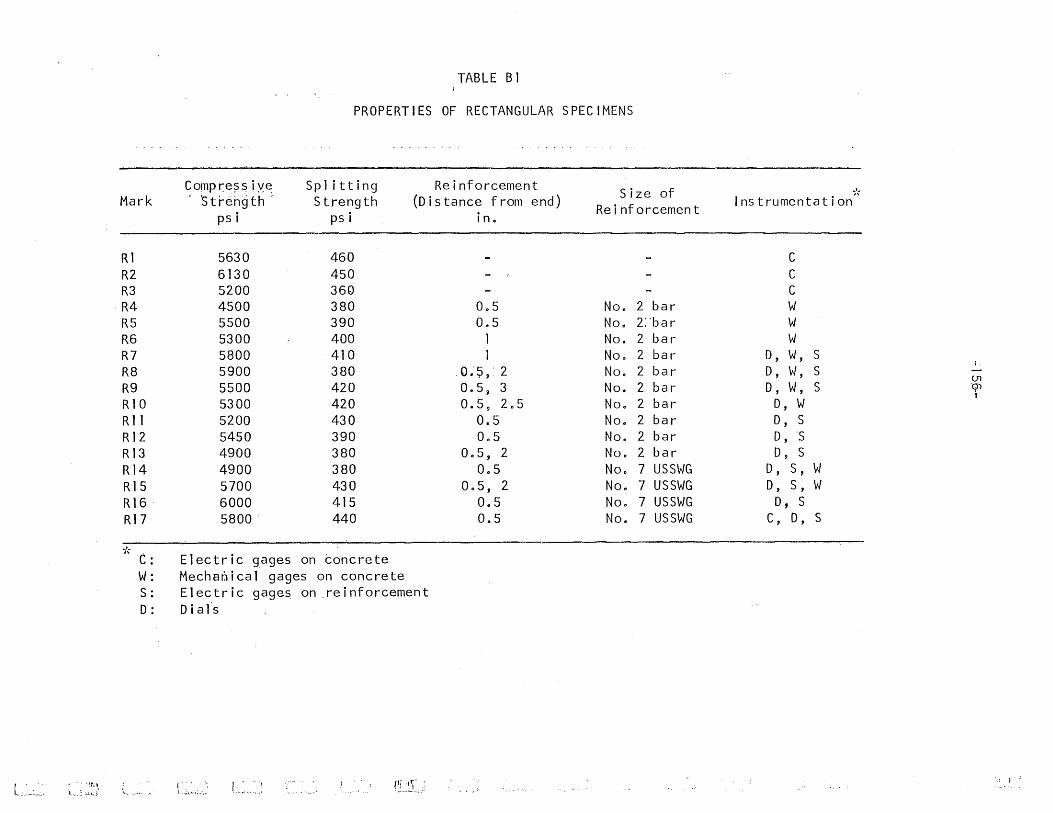
TABLE B1
PROPERTIES OF RECTANGULAR SPECIMENS
Compr:e?siy~ Spl itting Reinforcement Size of ,'< Mark . St reng th .- Strength (Distance from end) Reinforcement Ins t rumenta t i on
psi psi in.
Rl 5630 460 C R2 6130 450 C R3 5200 360 C R4 4500 380 0.5 No. 2 bar W R5 5500 390 0.5 No. 2:'bar W R6 5300 400 I No. 2 bar W R7 5800 410 1 No. 2 bar 0, W, S
j
R8 5900 380 . O'-~,·.2 No. 2 bar D, W, S ~
(J1
R9 5500 420 0.5 9 3 No. 2 bar 0, W, S '91 I
R10 5300 420 0.5 9 2.5 No. 2 bar D, W Rll 5200 430 0.5 No. 2 bar 0, S R12 5450 390 005 No. 2 bar 0, 'S RI3 4900 380 0.5, 2 No. 2 bar 0 9 S RI4 4900 380 0.5 No. 7 USSWG D, S, W RI5 5700 430 0.5, 2 No. 7 USSWG 0, S, W R16· 6000 415 0.5 No. 7 USSWG D, S R17 5800 . 440 0.5 No. 7 USSWG C, 0, S
i', c: Electric gages on toncrete W: Mech8~ical gages on concrete S: Electric gages on reinforcement 0: o i afs
L,_'-:~;~ . -.. ~ ~ r~ " t ..•. .!~!..j '- ....... . t :~>".:_,_ L.~- .. -._; t'j1r . .... -~':"':~.-'.:' .,.'
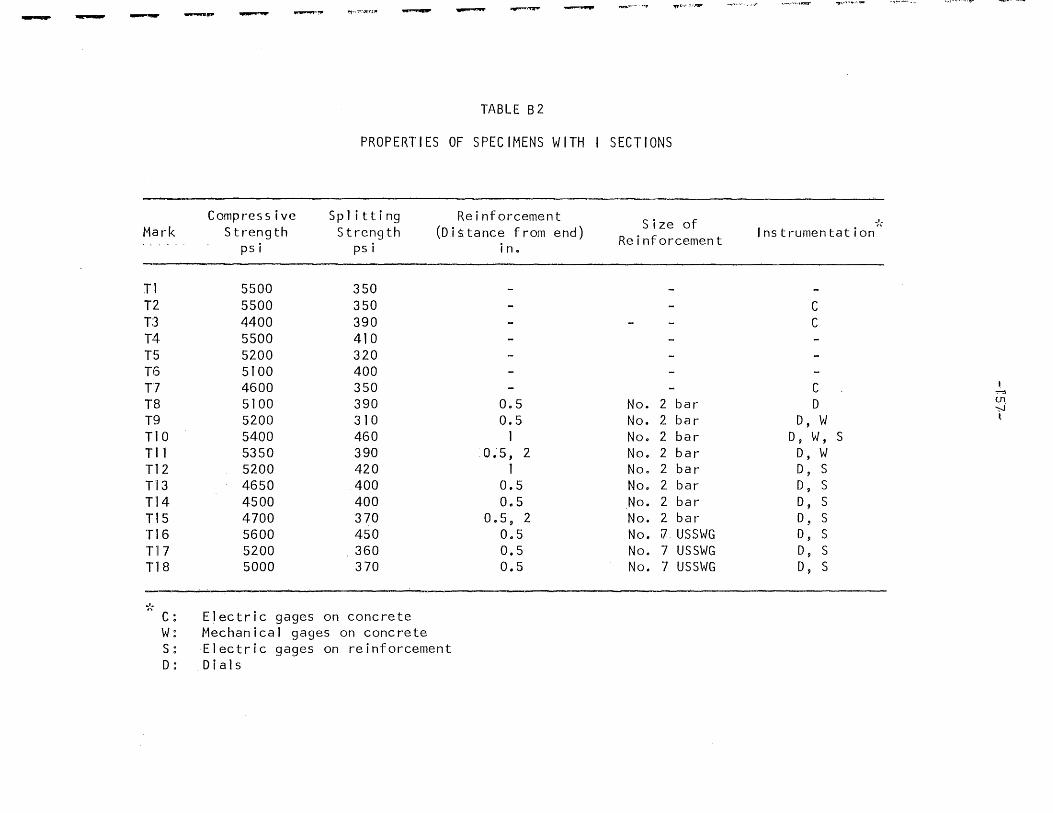
- --- -- - - ~,,~~;r:.ff - - ---'""'"'" """.,' .•.. ~
TABLE B 2
PROPERTIES OF SPECIMENS WITH I SECTIONS
Compressive Sp' itt i ng Reinforcement Size of "";',
Mark Strength Strength (DJ 5 tance f rom end) Reinforcement Instrumentation psi psi in.
II 5500 350 T2 5500 350 C T:3 4400 390 C T4 5500 410 T5 5200 320 T6 5100 400 T7 4600 350 C
, .,..-::\
T8 5100 390 0.5 No. 2 bar D Ul. ~
T9 5200 310 0.5 No. 2 bar D, W ~
TIO 5400 460 I No. 2 bar D ~ W, S Til 5350 390 0;5, 2 No.2 bar D, W ll2 5200 420 I No. 2 bar D, S T'13 4650 400 0.5 No. 2 bar D~ S T:l4 4500 400 0.5 No. 2 bar D ~ S T115 4700 370 O. 5 ~ 2 No. 2 bar D, S Tl16 5600 450 0.5 No. 'J. USSWG D~ S Tl17 5200 360 0.5 No. 7 USSWG D ~ S Tl18 5000 370 0.5 No. 7 USSWG D, S
-;', C: Electric gages on concrete W: Mechanical gages on concrete S : ·Electric gages on reinforcement D: Dials

'. I
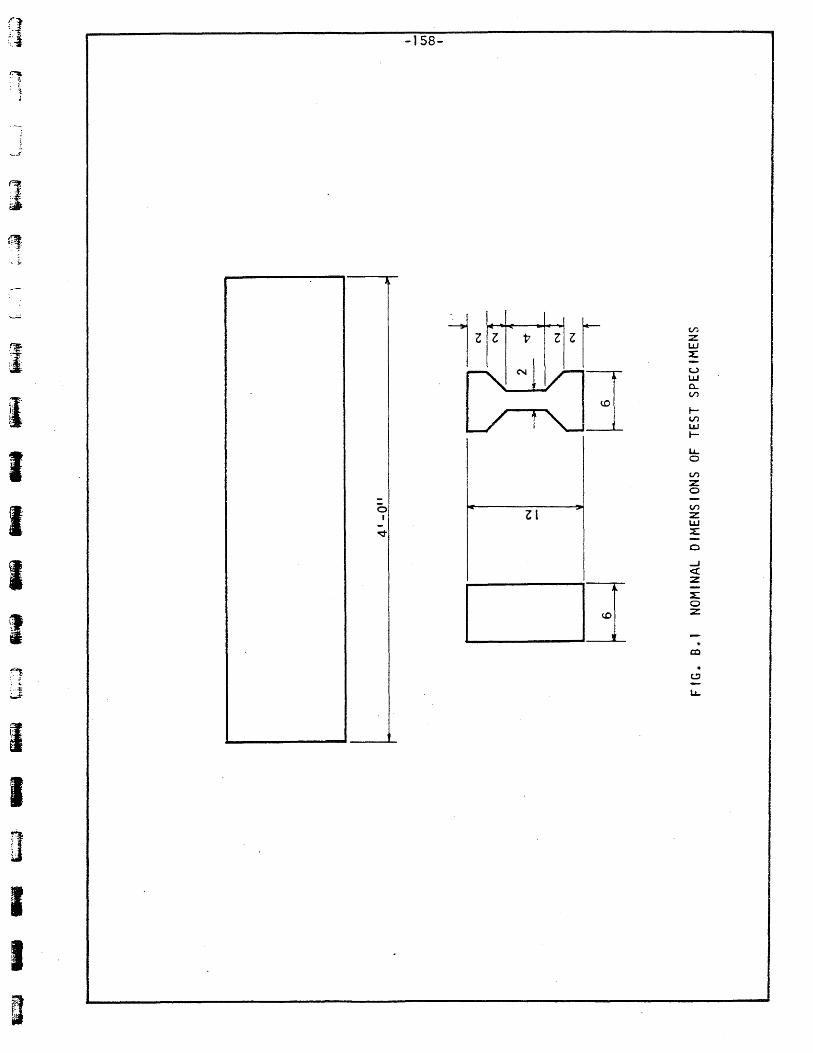
·fi!'
I
I I I I I
I I
,
0 , -~
-158-
-. Z1
J
V)
z: w 4
u Lt.J Q.. V')
~ V')
UJ t-
L&.. 0
V')
:z 0
V')
z: UJ 4
0
...J <! :z: ::£: 0 :z:
" c:t) . c.!'
L&..
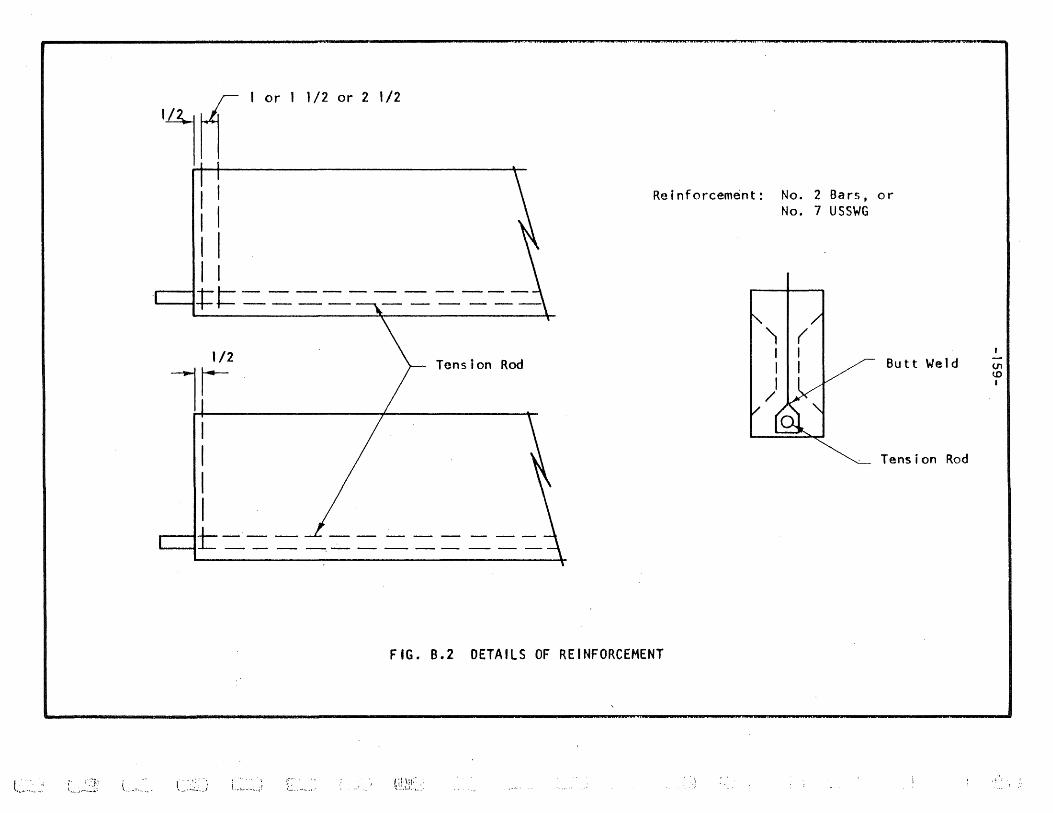
l..,.-,~ __ :' ; ,':J' \_J~":
-'
\ ... -~. .
lin ~
I I I I I I I I
1 or 1 1/2 or 2 1/2
1-.------------'----I-t- f- - - - - - - - - - - -
1/2
l[ I I I I
Tension Rod
L-------. ------_ L ___________ _
Reinforcement: No.2 Bars, or No. 7 USSWG
( I I Butt We1d
Tension Rod
FIG. B.2 DETAILS OF REINFORCEMENT
~_~.~L:~; ~i!.~:;:,.' -I
'J
(J1 t.O I

r I I I I
-160-
Sl
,----------, I I I I I I
I
ZIt I --+-
I I I I L ___ _
I I I I
___ J
. o z
~
:::J o ,
I I I I I
I I I I I
.... :::> o
I ...J ...J :::> 0-
z:
M . tIl
-~
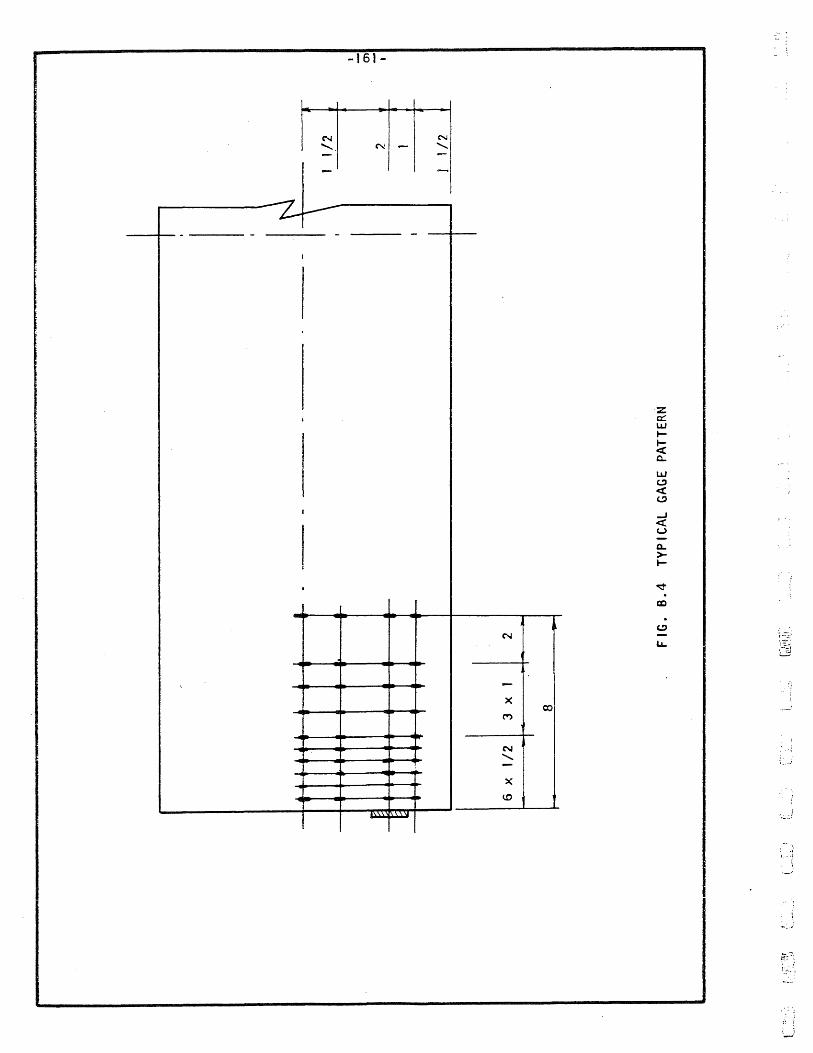
-161-
I
I N NI N ........ - ......... - I -- -...
--z-~ - - - -
I
'Z I ex:
UJ t-t-< ~
UJ (.!)
< <-?
I ....I < U -~ :> t-
I ~ . CD . <-?
N -&.I-
-X
OJ M
N
" -x
(.0
~ ~
;--.) \,.(
_ . .i
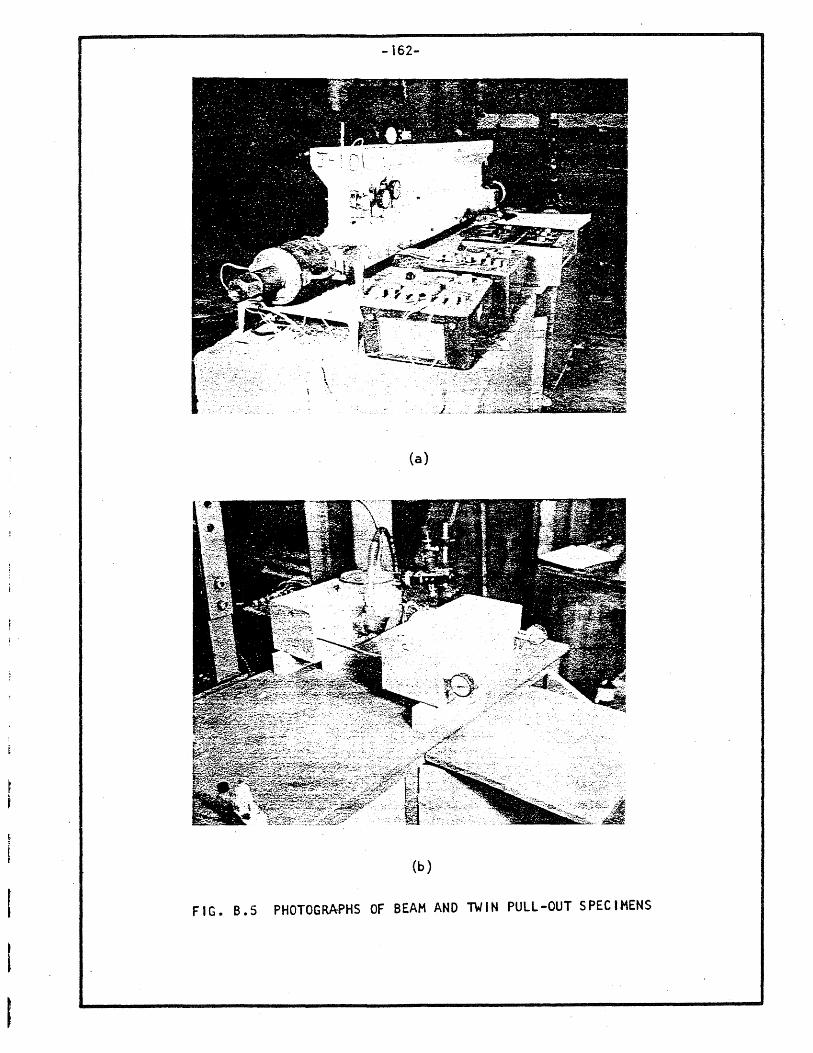
-162-
(a)
(b)
FIG. B.5 PHOTOGRAPHS OF BEAM AND TWIN PULL-OUT SPECIMENS

:.)
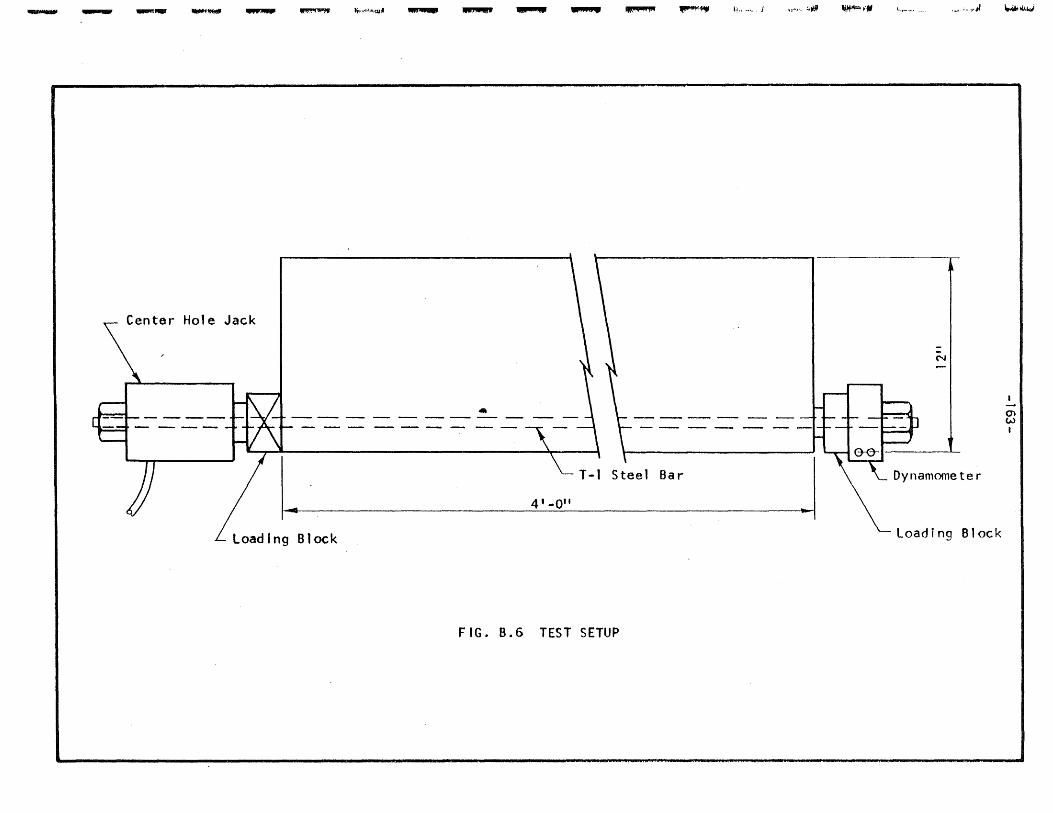
--- ,....... _tIIIIf ........ ...."..... ~ ~""""-!lI1 ...,.. .,.., ~ ......
Center Hole Jack
FIG. B.6 TEST SETUP
~ ~ ... i:.. ~'. j """ ~tHJ ~~.., '~t'-..... . ..•.• '.:r~
N
Dynamometer
loading B10ck
~1i.UJ
en w ,

-164-
APPENDIX C
DESCRIPTION OF COMPUTER PROGRAM
Introductory Remarks
A high speed computer was used to achieve higher accuracy in the
numerical procedure than other investigators obtainedc The simp1 ifying
assumptions could thus be el iminated and the number of grid points could be
increased.
A first solution was obtained using an IBM 650 computer but the
time required to obtain sufficient convergence was prohibitiveo For a
symmetrical loading this machine would have been satisfactory but in the
present investigation symmetry could not be util ized.
The final solution was done on the Control Data Corporation No.
1604 electronic digital computer.
A description of the numerical method is given in Section C.Q.
I The input data are 1 isted in Section C.3. The flow diagram is described in
Section C04. The output data and the validity of the program are presented
in Section C.S.
C.2 Details of Numerical Procedure
As it was mentioned in Section A.2, the Airy stress function
method was used in many analytical investigationso Some studies employed
I finite difference methods to execute the calculations. However~ in all known
cases some simpl ifying assumptions 1 imited the confidence in the resuitso
When no such assumptions were used, the answers were not given for the
I non-symmetric case and at a sufficient number of points. Some of these
methods were discussed in Section A.2. [he outl ine of the present procedure
I is described in Section 202 together with the assumptions and the theory
behind it.
I
-165-
4 The biharmonic differential operator ~ F = a is replaced by the
corresponding finite difference operatoro Since the stress gradient is
iarge around the load~ a f!ne grid is necessary to get satisfactory answerso
Symmetry conditions must be util !zed as fully as possible to reduce the
number of points and thus greatly facil itate the computatl0nsQ
If the singfe eccentric load is c6nsidered to be made up of two"
loadings, one symmetrical and one anti-symmetrical as shown on Fig. Col? then
the calculations are not s impl1fiedo in the syrrrnetrical case only one
quarter of the region has to be consideredo HavJever~ in the anti-symmetrical
case no such simpl ification exists and half of the region must be includedo
in the present procedure the region shown in Figo 201 was treatedo
A grid of 1/2 by 1/2fino yielded 897 grid points inside the reg/ono An
iterative method was appl ied to solve the problemo The biharmonic finite
difference operator, that is shown on Figso Co2~ was appl ied successively
to every nnside grid pointo This slow procedure could be used because of the
availabil ity of the high speedc.computero "-:1
The boundary values wece given in Section 2020 Everything was
calculated for PIA = 1~ that is~ for P = 72 kips. The corresponding boundary
values of the stress function and its normal derivatives are given in Figo 2.1.
The normal derivatives establ ished the necessary relation between the values
of the stress function immediately outside and immedtately lnside the boundaryo
The first iteration lasted 500 cycleso The shape of the stress
function was then estimated to get a better approximation for the second run. "" I
For example, 1 inear stress distribution of the longitudinal stresses was
assumed from y = a to y = 14 in. To achieve better convergence in the .-=:.-1
significant parts of the region, the iteration was modified to do more
cycles in these sub-regions for one full cycleo One cycle involved iteration , •... i
-166-
on the whole 1 the top half, the top third and the unloaded quarter corner
of the regionc In the final run all this was done 1000 times. The time
between was 48 minutes and 23 seconds. Similar calculation on the !BM 650
would require over 48 hours.
After the end of the last cycle, the transverse stresses~ the
longitudinal stresses, the transverse strains and the residuals were cal
culated and printed by the computer. The residuals and the sum of the
residuals gave an indication of the convergence of the procedure. The method
of calculation of these quantities was described in Section 2.2. In the
final run these quantities were calculated and printed after 750 cycles to
serve for comparison with the final valuesc
C.3 I nput Data
The values of the stress function on the boundaries were given by
the boundary conditions. The values at the imaginary points immediately
outside the boundaries were related to the values at the points immediately
inside the boundaries. These correlations were coded on the cards together
with the other initial values. Values were assumed for inside points as
described in Section C.2. For the final run these values were punched on
cards or were dupl icated by the computer where that was possible.
The number of cycles was changed for every run to suit convergence
and du rat i on of run:.,
The value of Poisson1s ratio was fixed for each run.
C .. 4 Flow Diagram
The flow diagram of the program is presented in Fig. C.3. The
detailed flow diagram is not much more complex than the general one~ hence
-167-
more of the detai3s are included in Figo C.30 The FORTRAN coding system
simpl ifies most of the problems involved in cycl ic computationso
The stresses~ strain~ and residuals were calculated and printed
after a certain number of cycmes as well as after the last cycle. This was
done for al 1 897 p0intso
C.S Output Data
The output consisted of the print-out of the following quantities:
transverse stresses, longitudinal stresses, transverse -strains, values of the
stress function, and residualso These were given for all 897 grid points.
Also the time required and the number of cycles were printed.
In the last run all the above was calculated and printed after the
7S0th and after the 1000tb cycle. The residual with the largest absolute
value was -000020S. The corresponding value of the stress function was
S07390 The smallest absolute value of the stress function in the critical
regions was 0.,0371 (at all other points of interest this value was considerably
larger). The residue at this point was -0.000038. These proportions
seemed to hold or were better at other points"
( .... J'
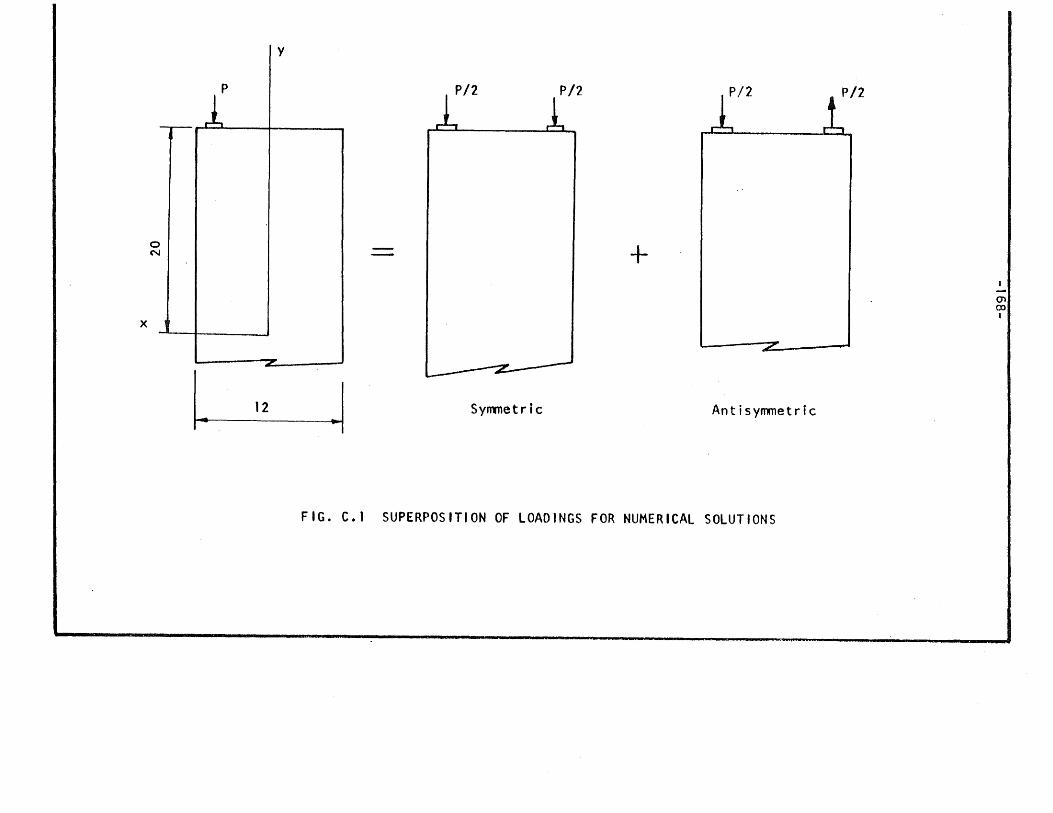
x
Y
P
--r- r-'--I-i 1 ---+--_
o ('oJ
-
I. .. 12 ~I
P/2
+
SYrmletric An tis yrrrne t ric
FIG. C.t SUPERPOSITION OF LOADINGS FOR NUMERICAL SOLUTIONS
0'1 (X) I

.... :: ~ ..
';.~:-:;-:-.:.. . . . . "
:L •. {, _
~ft·~ f$T:-!- ~1" ; -:
i j
, j
1 J
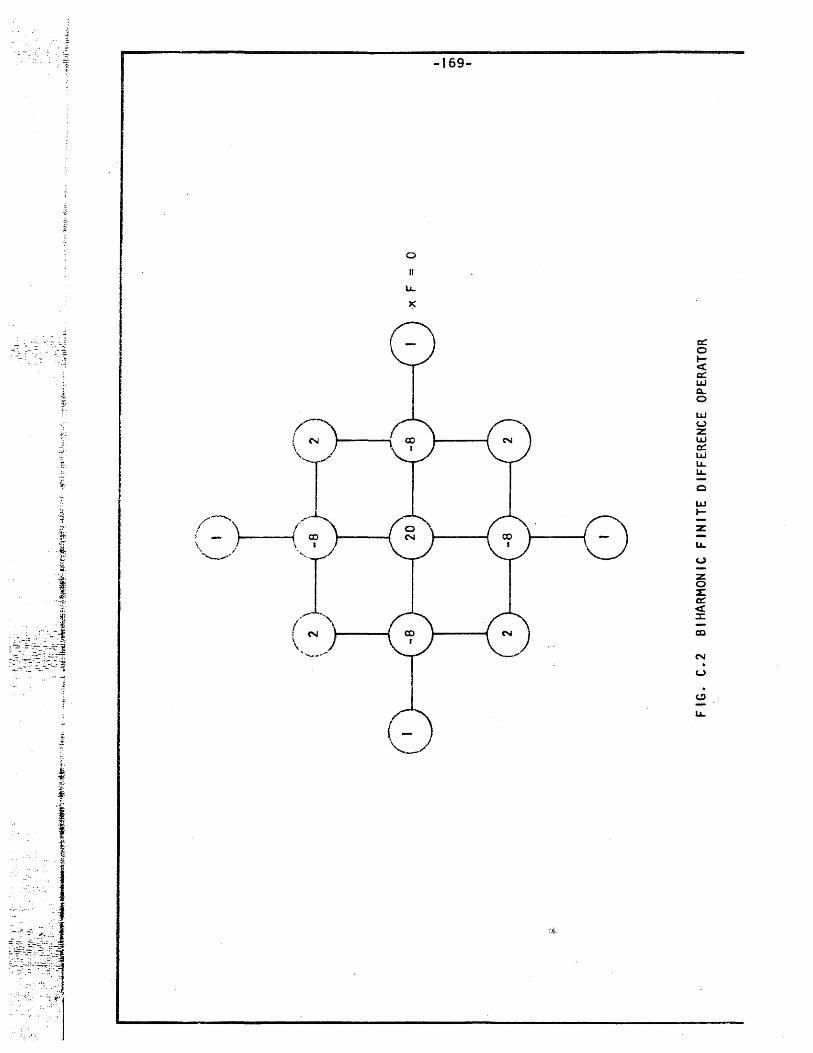
:;
~ '. ~~~wd -~
....
.~
o 1/
L&..
~
-169-
.:t. ..
a:: o t~ a:::: LLJ 0-o LLJ U :z LLJ a:: LLJ L&.. L&..
o LLJ I-
Z
L&..
U
Z o 2: a:: « :r:: CD
. u
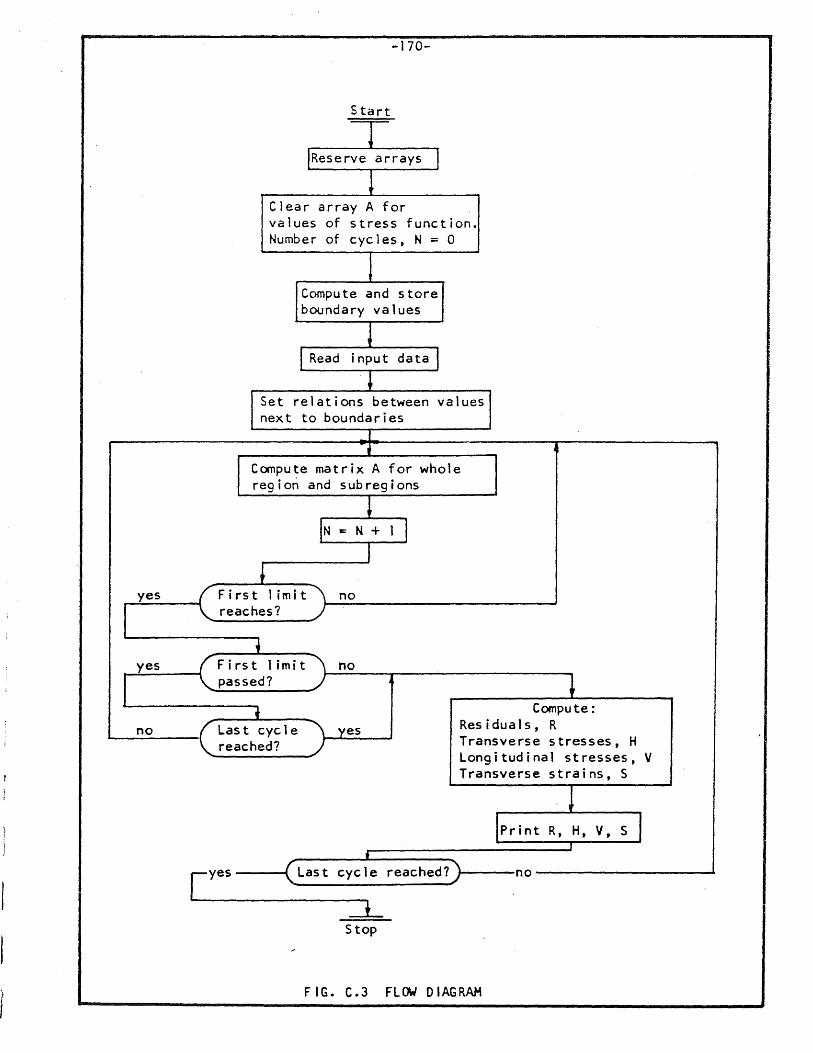
yes
I yes
I no
r-I
-170-
Start
T lReserve a rrays I
~ Clear array A for values of stress function. Number of cycles, N = 0
1 Compute and store boundary va 1 ues
J l Read input data I
. ~
Set relations between values next to boundaries
I
Compute matrix A for whole region and subregions
Firs t I im it reaches?
+ First limit passed?
1
IN z: N + 1 I I
no
no
Compute:
Last cycle yes Res i dua 1 s, R
reached?
yes t
Last cycle reached?
+ Stop
Transverse stresses, H Longitudinal stresses, V Transverse strains, S
. J
Prj n t R, H , V, -sl I
~-----no--------------------~
FIG. C.3 FLOW DIAGRAM

.. ,
Ei
~_ J
Related Documents