The Texas Medical Center Library The Texas Medical Center Library DigitalCommons@TMC DigitalCommons@TMC UT SBMI Dissertations (Open Access) School of Biomedical Informatics 5-6-2010 The Effect of Proximity, Explicitness, and Representation of Basic The Effect of Proximity, Explicitness, and Representation of Basic Science Information on Student Clinical Problem-Solving Science Information on Student Clinical Problem-Solving Kimberly Ann Smith University of Texas Health Science Center at Houston Follow this and additional works at: https://digitalcommons.library.tmc.edu/uthshis_dissertations Part of the Medical Education Commons Recommended Citation Recommended Citation Smith, Kimberly Ann, "The Effect of Proximity, Explicitness, and Representation of Basic Science Information on Student Clinical Problem-Solving" (2010). UT SBMI Dissertations (Open Access). 17. https://digitalcommons.library.tmc.edu/uthshis_dissertations/17 This is brought to you for free and open access by the School of Biomedical Informatics at DigitalCommons@TMC. It has been accepted for inclusion in UT SBMI Dissertations (Open Access) by an authorized administrator of DigitalCommons@TMC. For more information, please contact [email protected].

Welcome message from author
This document is posted to help you gain knowledge. Please leave a comment to let me know what you think about it! Share it to your friends and learn new things together.
Transcript
The Texas Medical Center Library The Texas Medical Center Library
DigitalCommons@TMC DigitalCommons@TMC
UT SBMI Dissertations (Open Access) School of Biomedical Informatics
5-6-2010
The Effect of Proximity, Explicitness, and Representation of Basic The Effect of Proximity, Explicitness, and Representation of Basic
Science Information on Student Clinical Problem-Solving Science Information on Student Clinical Problem-Solving
Kimberly Ann Smith University of Texas Health Science Center at Houston
Follow this and additional works at: https://digitalcommons.library.tmc.edu/uthshis_dissertations
Part of the Medical Education Commons
Recommended Citation Recommended Citation Smith, Kimberly Ann, "The Effect of Proximity, Explicitness, and Representation of Basic Science Information on Student Clinical Problem-Solving" (2010). UT SBMI Dissertations (Open Access). 17. https://digitalcommons.library.tmc.edu/uthshis_dissertations/17
This is brought to you for free and open access by the School of Biomedical Informatics at DigitalCommons@TMC. It has been accepted for inclusion in UT SBMI Dissertations (Open Access) by an authorized administrator of DigitalCommons@TMC. For more information, please contact [email protected].
Texas Medical Center LibraryDigitalCommons@The Texas Medical CenterUT SBMI (and UT SHIS) Dissertations (OpenAccess) School of Biomedical Informatics
5-6-2010
The Effect of Proximity, Explicitness, andRepresentation of Basic Science Information onStudent Clinical Problem-SolvingKimberly Ann SmithUniversity of Texas Health Science Center at Houston
Follow this and additional works at: http://digitalcommons.library.tmc.edu/uthshis_dissertationsPart of the Medical Education Commons
This is brought to you for free and open access by the School of BiomedicalInformatics at DigitalCommons@The Texas Medical Center. It has beenaccepted for inclusion in UT SBMI (and UT SHIS) Dissertations (OpenAccess) by an authorized administrator of DigitalCommons@The TexasMedical Center. For more information, please [email protected].
Recommended CitationSmith, Kimberly Ann, "The Effect of Proximity, Explicitness, and Representation of Basic Science Information on Student ClinicalProblem-Solving" (2010). UT SBMI (and UT SHIS) Dissertations (Open Access). Paper 17.
The Effect of Proximity, Explicitness, and Representation of Basic Science Information on Student Clinical Problem-Solving
A
DISSERTATION
Presented to the Faculty of The University of Texas
School of Health Information Sciences at Houston
in Partial Fulfillment of the Requirements
for the Degree of
Doctor of Philosophy
by
Kimberly Ann Smith, PhD, MT(ASCP)
Committee Members:
Robert W. Vogler, DSN1 Todd R. Johnson, PhD1 Craig W. Johnson, PhD1
Thomas M. Craig, DVM, PhD2
(1) School of Health Information Sciences, The University of Texas Health Science Center at Houston
(2) Department of Pathophysiology, College of Veterinary Medicine, Texas A&M University, College Station, Texas

Dedication
For my husband, Ed Akin, who always believed in me even when I did not believe in myself.
Copyright © 2010 Kimberly Ann Smith. All rights reserved.
Acknowledgements
First and foremost, my deepest appreciation goes to my committee, who I am quite certain
heard more than they ever wanted to know about the life cycles of parasites. They guided my
thought processes and helped me blend aspects of human cognition, education, taxonomy, and
biology into this research. Dr. Robert Vogler, my committee chair, guided me through the difficult
process of writing this dissertation. Dr. Craig Johnson deserves special praise for his unending
patience with my equally unending questions regarding statistics. Dr. Todd Johnson taught me
how to critically look at information and data representations; without his courses I would never
have questioned whether spatial placement of information in textbooks impacted student learning.
Dr. Tom Craig of Texas A&M provided the comment that sparked the entire dissertation topic
when I asked him, “Dr. Craig, why are nematode life cycles so hard to learn?” His unceasing
enthusiasm, support, and willingness to provide access to his students were invaluable. And
finally, thanks to Dr. Cynthia Phelps, who started me on this adventure and who steered me
through the candidacy process and data collection.
There are so many other people who provided encouragement over the years and who I
must thank. Each and every one of them taught me some piece of information that ultimately
shaped the thinking that went into this research. Veterinary pathologist Dr. Robert Tramontin, then
of the University of Kentucky Animal Disease Diagnostic Center, who would show me
Haemonchus contortus, Ostertagia, Ascaris, and Setaria adults in situ during necropsies and who
would point out the damage that different parasites caused to various organs. General practitioners
Dr. Tony Yates, Dr. Frank Morgan, Dr. Loran Wagoner, and Dr. Wade Northington, who took me
on field calls and who gave me a job doing the parasitology examinations during the field trials of
a bovine anthelmintic. My undergraduate parasitology professor, Dr. John Harley at Eastern
Kentucky University, who challenged me in both my general and medical parasitology
coursework, also deserves mention.
Special recognition goes to my ad hoc support group, also known as “The Smoothie Club”,
including Dr. James Turley, who along with my fellow students, especially Dr. Jorge Herskovic,
Dr. Adol Esquivel, Dr. Jose Florez-Arango, Dr. Sarah Edmonson, Dr. Sharon McLane, Dr. Jennifer
Rankin, and Claire Loe, provided unflagging support, advice, and guidance. Debbie Todd and
Connie Tapper deserve extra kudos for keeping me on track during this endeavor.
I must also acknowledge the contributions of my family, including my mother, who still
remembers helping me learn the Linnaean taxonomy in junior high school 35 years ago, as well as
my obsession with Latin names; my father, who calls me the “walking dictionary”, and my brother
and sister who (erroneously) seem to believe I know everything.
But in the end, it is my husband who deserves the greatest thanks. Not only did he
encourage me to apply to graduate school, but also he supported me mentally, emotionally, and
financially throughout this long process. Ed, thank you.
v
Abstract
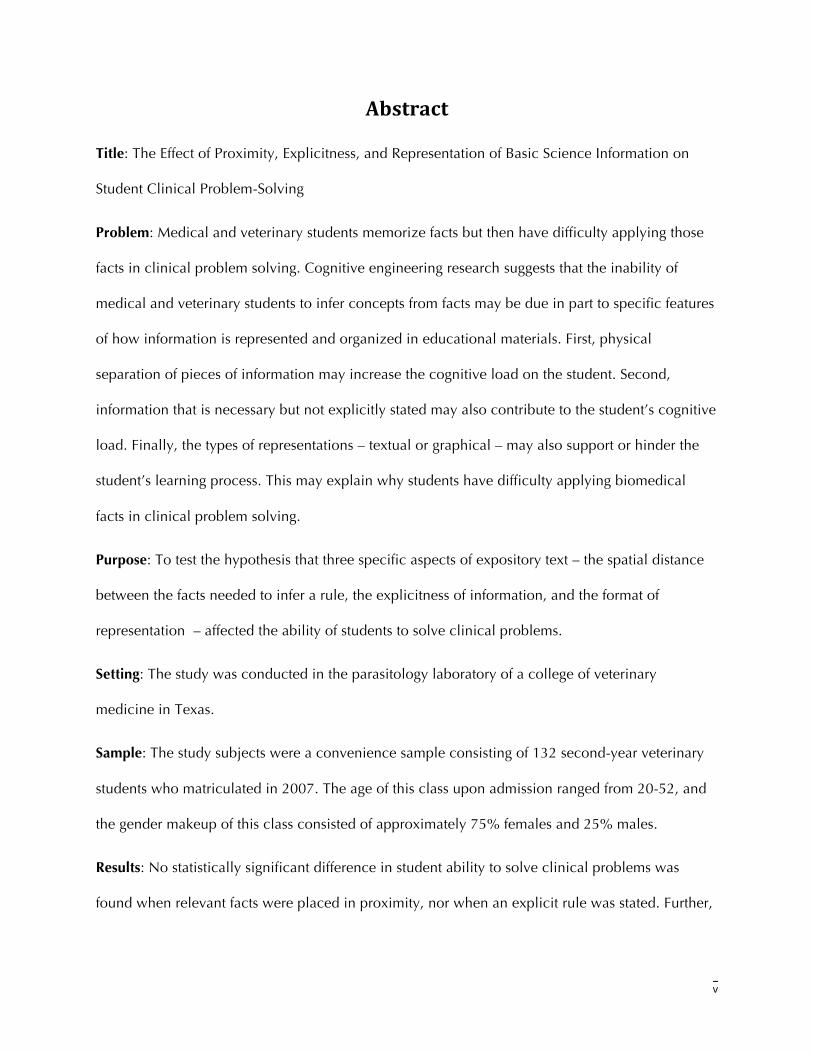
Title: The Effect of Proximity, Explicitness, and Representation of Basic Science Information on
Student Clinical Problem-Solving
Problem: Medical and veterinary students memorize facts but then have difficulty applying those
facts in clinical problem solving. Cognitive engineering research suggests that the inability of
medical and veterinary students to infer concepts from facts may be due in part to specific features
of how information is represented and organized in educational materials. First, physical
separation of pieces of information may increase the cognitive load on the student. Second,
information that is necessary but not explicitly stated may also contribute to the student’s cognitive
load. Finally, the types of representations – textual or graphical – may also support or hinder the
student’s learning process. This may explain why students have difficulty applying biomedical
facts in clinical problem solving.
Purpose: To test the hypothesis that three specific aspects of expository text – the spatial distance
between the facts needed to infer a rule, the explicitness of information, and the format of
representation – affected the ability of students to solve clinical problems.
Setting: The study was conducted in the parasitology laboratory of a college of veterinary
medicine in Texas.
Sample: The study subjects were a convenience sample consisting of 132 second-year veterinary
students who matriculated in 2007. The age of this class upon admission ranged from 20-52, and
the gender makeup of this class consisted of approximately 75% females and 25% males.
Results: No statistically significant difference in student ability to solve clinical problems was
found when relevant facts were placed in proximity, nor when an explicit rule was stated. Further,
vi
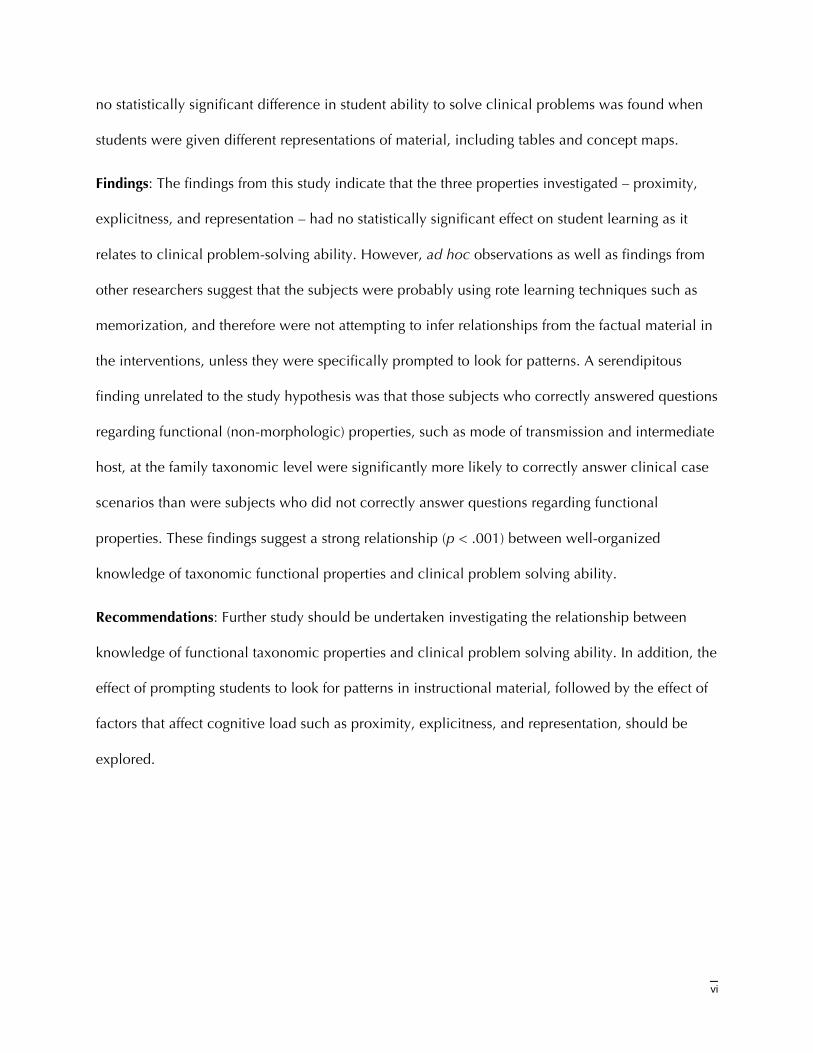
no statistically significant difference in student ability to solve clinical problems was found when
students were given different representations of material, including tables and concept maps.
Findings: The findings from this study indicate that the three properties investigated – proximity,
explicitness, and representation – had no statistically significant effect on student learning as it
relates to clinical problem-solving ability. However, ad hoc observations as well as findings from
other researchers suggest that the subjects were probably using rote learning techniques such as
memorization, and therefore were not attempting to infer relationships from the factual material in
the interventions, unless they were specifically prompted to look for patterns. A serendipitous
finding unrelated to the study hypothesis was that those subjects who correctly answered questions
regarding functional (non-morphologic) properties, such as mode of transmission and intermediate
host, at the family taxonomic level were significantly more likely to correctly answer clinical case
scenarios than were subjects who did not correctly answer questions regarding functional
properties. These findings suggest a strong relationship (p < .001) between well-organized
knowledge of taxonomic functional properties and clinical problem solving ability.
Recommendations: Further study should be undertaken investigating the relationship between
knowledge of functional taxonomic properties and clinical problem solving ability. In addition, the
effect of prompting students to look for patterns in instructional material, followed by the effect of
factors that affect cognitive load such as proximity, explicitness, and representation, should be
explored.
vii
TableofContents
DEDICATION .............................................................................................................................................. II
ACKNOWLEDGEMENTS............................................................................................................................. III
ABSTRACT ................................................................................................................................................... V
TABLE OF CONTENTS ...............................................................................................................................VII
LIST OF FIGURES........................................................................................................................................ XI
LIST OF TABLES ........................................................................................................................................XIII
CHAPTER 1 INTRODUCTION......................................................................................................................1Conceptual Framework .............................................................................................................................2Research Questions...................................................................................................................................4
Proximity and Explicitness ....................................................................................................................4Representation and Proximity ...............................................................................................................4Attitude Toward Taxonomy...................................................................................................................5
Hypotheses ...............................................................................................................................................5Proximity and Explicitness ....................................................................................................................5Representation and Proximity ...............................................................................................................6
Null Hypotheses .......................................................................................................................................7Proximity and Explicitness ....................................................................................................................7Representation and Proximity ...............................................................................................................7
Definitions of Terms ..................................................................................................................................8Assumptions and Limitations ...................................................................................................................10Summary.................................................................................................................................................10
CHAPTER II REVIEW OF THE LITERATURE ................................................................................................11Introduction ............................................................................................................................................11Textbooks, Experts, Authors, and Learners...............................................................................................11Learning Theories....................................................................................................................................17
Adult Learning Theory ........................................................................................................................18Constructivist Learning Theory............................................................................................................18Cognitive Load Theory and the Proximity Compatibility Principle.......................................................19
Graphical representation - concept maps ................................................................................................21The Study Domain and the Importance of Biological Taxonomy .............................................................23
Taxonomy and Biology .......................................................................................................................23Taxonomy and Veterinary Parasitology ...............................................................................................26
viii
Taxonomy and Veterinary Education ..................................................................................................27Data, Information, Knowledge, and Wisdom...........................................................................................30Summary.................................................................................................................................................32
CHAPTER III METHODOLOGY ..................................................................................................................33Introduction ............................................................................................................................................33Subjects ..................................................................................................................................................33Human Subjects Protection .....................................................................................................................34Setting .....................................................................................................................................................34Pilot research ..........................................................................................................................................34Experiment 1: The Effect of Proximity and Explicitness in Textual Representations ..................................36
Design for Experiment 1......................................................................................................................37Independent and Dependent Variables ...............................................................................................37Development of the Intervention Text .................................................................................................38Operationalization of the Proximity Independent Variable..................................................................40Operationalization of the Explicitness Independent Variable...............................................................42Instruments .........................................................................................................................................43
Experiment 2: Representation and Proximity ...........................................................................................47Experimental Design and Variables.....................................................................................................48Development of the Intervention Text .................................................................................................50Development of Intervention Versions ................................................................................................50Tables Without and With Detailed Information...................................................................................51Development of Pre- and Posttests ......................................................................................................53Development of Question Subscales...................................................................................................55
Attitude Toward Taxonomy Questionnaire ..............................................................................................60Data Collection Procedure ......................................................................................................................60Data Entry ...............................................................................................................................................61
Data Screening ...................................................................................................................................62Data Scoring .......................................................................................................................................62Quality Control of Data Scoring..........................................................................................................62
Data Analysis ..........................................................................................................................................63Summary.................................................................................................................................................64
CHAPTER IV DATA ANALYSIS AND FINDINGS .......................................................................................65Introduction ............................................................................................................................................65Experiment 1: Proximity and Explicitness in Textual Representation ........................................................65
Research Questions ............................................................................................................................65
ix
Pretest vs. Posttest Scores ....................................................................................................................66Pretest vs. Posttest Subscales ...............................................................................................................68Effect Size ...........................................................................................................................................74Chi-square ..........................................................................................................................................75
Experiment 2: Representation and Proximity ...........................................................................................77Research Questions ............................................................................................................................77Results for Pretest vs. Posttest Scores ...................................................................................................78Results for Tables with details vs. Tables without details (Version 1 vs. Version 2) ..............................81Results for Concept maps vs. Concept maps plus partial maps (V3 versus V4).....................................84Results for Tables without concept maps vs. Tables with concept maps (V1+V2 versus V3+V4) .........87Results for V4 versus V1 (Concept Maps, Partial Maps, Tables with Details vs. Tables without Details)...........................................................................................................................................................90
Attitude Toward Taxonomy Questionnaire ..............................................................................................93Reliability ...........................................................................................................................................93Results ................................................................................................................................................93
Summary.................................................................................................................................................97
CHAPTER V CONCLUSIONS, DISCUSSION, IMPLICATIONS, AND RECOMMENDATIONS..................100Conclusions ..........................................................................................................................................100
Proximity and Explicitness Experiment (Experiment 1).......................................................................100Representation and Proximity Experiment (Experiment 2)..................................................................101Attitude Toward Taxonomy Questionnaire........................................................................................101
Discussion ............................................................................................................................................102Proximity and Explicitness Experiment (Experiment 1).......................................................................102Representation and Proximity Experiment (Experiment 2)..................................................................104Taxonomies and Ontologies .............................................................................................................107Separation of Basic Science and Clinical Knowledge ........................................................................108
Implications ..........................................................................................................................................109Limitations of the Study .........................................................................................................................109
Study Setting and Subjects ................................................................................................................109Instrumentation.................................................................................................................................110Data Collection.................................................................................................................................110Funding ............................................................................................................................................111
Recommendations ................................................................................................................................111Terminology .....................................................................................................................................111Study Design.....................................................................................................................................112Instrumentation.................................................................................................................................112
x
Methodology ....................................................................................................................................113General Recommendations...............................................................................................................114
Summary...............................................................................................................................................115
REFERENCES .............................................................................................................................................116
APPENDIX A: VITA ...................................................................................................................................122
APPENDIX B: TEXAS A&M UNIVERSITY STUDY APPROVAL LETTER ......................................................123
APPENDIX C: THE UNIVERSITY OF TEXAS HEALTH SCIENCE CENTER STUDY APPROVAL LETTER......124
APPENDIX D: CONSENT FORM...............................................................................................................125
APPENDIX E: DATA COLLECTION SCRIPT ..............................................................................................127
APPENDIX F: ATTITUDE TOWARD TAXONOMY QUESTIONNAIRE ......................................................129
APPENDIX G: EXPERIMENT 1: INTERVENTION 1 (CONTROL) ...............................................................130
APPENDIX H: EXPERIMENT 1: INTERVENTION 2 (PROXIMITY) .............................................................138
APPENDIX I: EXPERIMENT 1: INTERVENTION 3 (EXPLICITNESS) ...........................................................148
APPENDIX J: EXPERIMENT 1: INTERVENTION 4 (PROXIMITY + EXPLICITNESS)....................................157
APPENDIX K: EXPERIMENT 1: PRETEST....................................................................................................167
APPENDIX L: EXPERIMENT 1: POSTTEST .................................................................................................170
APPENDIX M: EXPERIMENT 2: INTERVENTION 1 (CONTROL – TABLE ONLY, NO DETAILS) ...............173
APPENDIX N: EXPERIMENT 2: VARIATION 2 (TABLE WITH DETAILS) ...................................................181
APPENDIX O: EXPERIMENT 2: INTERVENTION 3 (CONCEPT MAP) .......................................................189
APPENDIX P: EXPERIMENT 2: INTERVENTION 4 (FULL + PARTIAL CONCEPT MAPS) ...........................198
APPENDIX Q: EXPERIMENT 2: PRETEST...................................................................................................208
APPENDIX R: EXPERIMENT 2: POST-TEST................................................................................................212
xi
ListofFigures
Figure 1: Conceptual Framework of Factors Affecting Student Ability to Integrate Basic Science in Clinical Problem Solving ........................................................................................................ 3
Figure 2: Analogy for coalescence of discrete knowledge ............................................................ 12Figure 3: Concept map illustrating relationship between taxon (body shape) and presence or
absence of an intermediate host............................................................................................ 22Figure 4: Classification of Nematodes Encountered in Dogs and Cats (from Ballweber, 2001, p.
62)........................................................................................................................................ 24Figure 5: Relationship between the disease rabies and the Linnaean taxonomy (drawn by Kimberly
Smith from Macdonald, 1995) .............................................................................................. 25Figure 6: Host-parasite relationships by host common name (white) and parasite genus (gray) ..... 28Figure 7: Host-parasite relationships, by host order and parasite genus. (red=carnivore;
green=herbivore; red and green=omnivore) .......................................................................... 28Figure 8: Example taxonomy with morphological descriptors (adapted from Olsen, 1986, pp. 43-
44)........................................................................................................................................ 29Figure 9: DIKW Hierarchy ........................................................................................................... 31Figure 10: Functional DIKW Model (KAS 2009) ........................................................................... 31Figure 11: Knowledge areas required for understanding nematode intermediate host requirements
............................................................................................................................................. 36Figure 12: Relationship between intermediate host, taxonomic classification, and body site ........ 37Figure 13: Organism Description Without Proximity of Body Site or Intermediate Host Information
............................................................................................................................................. 41Figure 14: Organism Description With Proximity of Body Site and Intermediate Host Information
............................................................................................................................................. 41Figure 15: Version 2 and 4: Partial Entry from Summary, Sorted By Order ................................... 41Figure 16: Version 2 and 4: Partial Entry from Summary, Sorted By Intermediate Host ................. 41Figure 17: Organism Description With Proximity of Host Information.......................................... 51Figure 18: Partial Summary Table without Details at Order and Family Levels (Used in Experiment
2, Intervention Version 1) ..................................................................................................... 51Figure 19: Partial Summary Table with Details in Proximity to Taxon at Order and Family Levels
(Used in Experiment 2, Intervention Versions 2, 3, and 4)..................................................... 51Figure 20: Concept map of class Cestoda (used in Experiment 2, intervention versions 3 and 4) ..52Figure 21: Partial concept map of class Cestoda (used in Experiment 2, intervention version 4) ... 53Figure 22: Example of factual knowledge question for Experiment 2 ............................................ 54Figure 23: Example of clinical problem solving question for Experiment 2 ................................... 54Figure 24: Data analysis plan ....................................................................................................... 63

xii
Figure 25: Profile plots of Estimated Marginal Means ................................................................... 68Figure 26: Profile plot of Estimated Marginal Means..................................................................... 79
xiii
ListofTables
Table 1: Animals and heart rates, ascending alphabetical order by animal type (from Kahn, 2005, p. 2582)................................................................................................................................ 13
Table 2: Animals and heart rates, in ascending numerical order by heart rate (from Kahn, 2005, p. 2582).................................................................................................................................... 14
Table 3: Animals and heart rates, in ascending numerical order by heart rate (from Kahn, 2005, p. 2582; mass information derived from Myers, et al., 2006 and Macdonald, 1995) ................. 16
Table 4: Design of Experiment 1 .................................................................................................. 37Table 5: Proximity and Explicitness in Intervention Versions ........................................................ 38Table 6: Comparison of Content for Experiment 1: Original Chapter vs. Control Version ............. 40Table 7: Experiment 1 Subscale Description ................................................................................ 44Table 8: Experiment 1 Pretest....................................................................................................... 44Table 9: Design of Experiment 2 .................................................................................................. 48Table 10: Representation Types, by Version................................................................................. 48Table 11: Representation Types, by Intervention .......................................................................... 49Table 12: Comparison of content for Experiment 2: Original chapter vs. Intervention version ...... 50Table 13: Subscale Operationalization for Representation Experiment ......................................... 55Table 14: Experiment 2 Pretest with Subscales and Notes ............................................................ 55Table 15: Coding of Data for Experiment 1-Proximity and Explicitness ........................................ 61Table 16: Coding of Data for Experiment 2-Representation .......................................................... 61Table 17: Descriptive Statistics, GLM Repeated Measures, Pretest Score vs. Posttest Score........... 66Table 18: Tests of Within-Subjects Effects .................................................................................... 67Table 19: Tests of Between-Subjects Effects.................................................................................. 67Table 20: Descriptive Statistics, GLM Repeated Measures for Pre- and Posttest Subscales ............ 68Table 21: Multivariate Statistics, GLM Repeated Measures for Pre- and Post-Test Subscales......... 71Table 22: Tests of Between-Subjects Effects, GLM Repeated Measures for Pre- and Post-Test
Subscales.............................................................................................................................. 72Table 23: Univariate tests (Measure= Sphericity assumed) ........................................................... 73Table 24: Standardized effect sizes, z-scores, and probabilities.................................................... 75Table 25: Chi-square results......................................................................................................... 75Table 26: Risk Estimate, explicitness x Q1 Post Organ correct ..................................................... 76Table 27: Cross Tabulations, explicitness x Q1 Post Organ correct .............................................. 76Table 28: Tests of Between-Subjects Effects.................................................................................. 78Table 29: Tests of Within-Subjects Effects .................................................................................... 78
xiv
Table 30: Descriptive statistics for tables with vs. without details (version 1 vs. version 2) ........... 81Table 31: Multivariate testsc for V1 versus V2 (tables with vs. without details).............................. 81Table 32: Tests of Between-Subjects Effects for V1 versus V2 (tables with vs. without details) ...... 82Table 33: Descriptive statistics (concept maps vs. concept maps plus partial maps) ..................... 84Table 34: Multivariate testsc (concept maps vs. concept maps plus partial maps) ......................... 84Table 35: Tests of Between-Subjects Effects (concept maps with vs. without partial maps) ........... 85Table 36: Descriptive statistics for V1+V2 vs. V3+V4 (tables without maps vs. tables with maps) 87Table 37: Multivariate testsc for V1+V2 vs. V3+V4 (tables vs. tables + maps) ............................... 87Table 38: Tests of between-subjects effects for V1+V2 versus V3+V4 (tables vs. tables + maps) ... 88Table 39: Descriptive statistics (maps, partial maps, tables with details vs. tables without details) 90Table 40: Multivariate Testsc (maps, partial maps, tables with details vs. tables without details) ... 90Table 41: Tests of Between-Subjects Effects (maps, partial maps, tables with details vs. tables w/o
details).................................................................................................................................. 91Table 42: Descriptive statistics: Attitude Toward Taxonomy Questionnaire.................................. 94
1
Chapter1Introduction
Research suggests that development of effective clinical problem solving skills depends not
only on possessing the requisite knowledge, but that the knowledge also be well-organized in
multiple representations (Norman, 2005). However, the sheer volume of material that must be
learned limits the time students can spend in learning and developing these mental representations
(Lujan & DiCarlo, 2006). Further, Patel showed that medical students do not integrate basic
science and clinical material; in fact, they perceive basic science to be a world separate from their
clinical knowledge (Patel, Groen, & Scott, 1988; Patel, Groen, & Norman, 1993; Patel, Arocha, &
Kaufman, 2001).
In addition to the constraints imposed by time and volume, the inability of medical and
veterinary students to effectively integrate and utilize information in clinical problem solving may
be due in part to specific aspects of text in educational materials. First, if students must mentally
incorporate two or more pieces of information together in order to infer certain heuristics or rules,
then physical separation or lack of spatial proximity of pieces of information increases the
cognitive load on the student. Second, information that is necessary but not explicitly stated also
contributes to the cognitive load on the student’s working memory. Finally, the types of
representations – textual or graphical – may also support or hinder the student’s learning process.
These factors may contribute to the cognitive load on the student, reducing the likelihood of the
student developing appropriate conceptual inferences.
However, little attention has been paid to the most basic form of information delivery in
education -- the printed texts used in medical or veterinary school. Therefore, the purpose of this
2
research was to investigate these three specific aspects of expository text – the spatial distance
between the facts needed to infer a rule, the explicitness of information, and the format of
representation – on the ability of students to develop knowledge necessary for effective clinical
problem solving.
ConceptualFramework
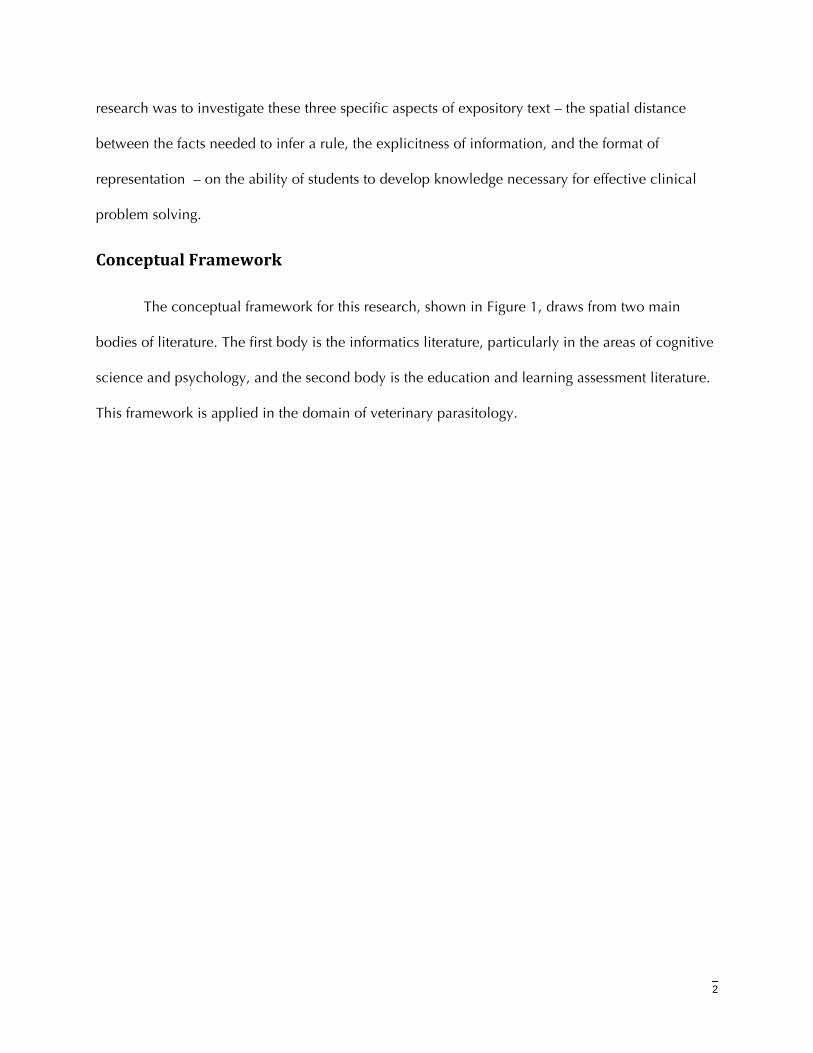
The conceptual framework for this research, shown in Figure 1, draws from two main
bodies of literature. The first body is the informatics literature, particularly in the areas of cognitive
science and psychology, and the second body is the education and learning assessment literature.
This framework is applied in the domain of veterinary parasitology.
3
Figure 1: Conceptual Framework of Factors Affecting Student Ability to Integrate Basic Science in Clinical Problem Solving
4
ResearchQuestions
This research addressed the following research questions:
ProximityandExplicitness
Q1. Do learning materials with textual representations that place appropriate information in
close spatial proximity significantly improve student learning, as measured by the
student’s ability to solve clinical case scenarios accurately, when compared to learning
materials with textual representations that do not place this information in close spatial
proximity?
Q2. Do learning materials with textual representations that provide explicit information
significantly improve student learning, as measured by the student’s ability to solve
clinical case scenarios accurately, when compared to learning materials with textual
representations that do not provide explicit information?
RepresentationandProximity
Q3. Do learning materials with tables that include detailed information in close spatial
proximity significantly improve student learning, as measured by the student’s ability to
solve clinical case scenarios accurately, compared to materials with tabular
representations that do not include detailed information?
Q4. Do learning materials with partial concept maps that place a subset of information in
proximity to the appropriate text significantly improve student learning, as measured by
the student’s ability to solve clinical case scenarios accurately, compared to materials
without partial concept maps?
5
Q5. Do learning materials with graphical representations (concept maps) that place
appropriate information in close spatial proximity significantly improve student learning,
as measured by the student’s ability to solve clinical case scenarios accurately, compared
to materials that include tabular representations?
Q6. Do learning materials with tables with detailed information, full concept maps, and
partial concept maps, significantly improve student learning, as measured by the
student’s ability to solve clinical case scenarios accurately, compared to materials that
include no concept maps and tables without detailed information?
AttitudeTowardTaxonomy
Finally, because taxonomy is integral to the particular domain used in this study, the last
question to be addressed in this research was:
Q7. What are student attitudes and preconceptions concerning taxonomy?
Hypotheses
Students may resort to rote learning because information necessary to develop appropriate
conceptual inferences is either not explicitly presented, or is too spatially separated for the student
to integrate with existing knowledge. Therefore, the research hypotheses posed in this dissertation
were as follows:
ProximityandExplicitness
H1. Learning materials that place significant information in proximity will significantly
improve student learning, as measured by the student’s ability to solve clinical case
scenarios accurately, as compared to materials that utilize a typical text representation.
6
H2. Learning materials that explicitly state relationships between information will significantly
improve student learning, as measured by the student’s ability to solve clinical case
scenarios accurately, as compared to materials that do not explicitly state these
relationships.
RepresentationandProximity
H3. Learning materials with tables that include detailed information in close spatial proximity
will significantly improve student learning, as measured by the student's ability to solve
clinical case scenarios accurately, compared to materials with tables that do not include
elaborations.
H4. When there are tables with detailed information in close spatial proximity, inclusion of
both full and partial concept maps will significantly improve student learning, as measured
by the student's ability to solve clinical case scenarios accurately, compared to materials
that include only full concept maps.
H5. Learning materials that include graphical representations (concept maps) that place
appropriate information in close spatial proximity will significantly improve student
learning, as measured by the student's ability to solve clinical case scenarios accurately,
compared to materials that include tabular representations.
H6. Learning materials that include tables with detailed information in close spatial proximity,
full concept maps, and partial concept maps will significantly improve student learning, as
measured by the student's ability to solve clinical case scenarios accurately, compared to
materials that include no concept maps and tables without detailed information in close
spatial proximity.
7
NullHypotheses
The corresponding null hypotheses for this research were as follows:
ProximityandExplicitness
H01. Learning materials that place significant information in proximity will significantly
improve student learning, as measured by the student’s ability to solve clinical case
scenarios accurately, as compared to materials that utilize a typical text representation.
H02. Learning materials that explicitly state relationships between information will significantly
improve student learning, as measured by the student’s ability to solve clinical case
scenarios accurately, as compared to materials that do not explicitly state these
relationships.
RepresentationandProximity
H03. Learning materials with tables that include detailed information in close spatial proximity
will significantly improve student learning, as measured by the student's ability to solve
clinical case scenarios accurately, compared to materials with tables that do not include
elaborations.
H04. When there are tables with detailed information in close spatial proximity, inclusion of
both full and partial concept maps will significantly improve student learning, as
measured by the student's ability to solve clinical case scenarios accurately, compared to
materials that include only full concept maps.
H05. Learning materials that include graphical representations (concept maps) that place
appropriate information in close spatial proximity will significantly improve student
8
learning, as measured by the student's ability to solve clinical case scenarios accurately,
compared to materials that include tabular representations.
H06. Learning materials that include tables with detailed information in close spatial proximity,
full concept maps, and partial concept maps will significantly improve student learning,
as measured by the student's ability to solve clinical case scenarios accurately, compared
to materials that include no concept maps and tables without detailed information in
close spatial proximity.
DefinitionsofTerms
For the purposes of this research, the following terms were defined:
Basic science: Basic sciences are defined as biology, chemistry, and physics, and
their subdomains such as anatomy, biochemistry, physiology, and
taxonomy. All of parasitology was considered to be a biology basic
science except for the clinical signs exhibited by the patient, and
the methods of treating the patient.
Clinical problem solving: Developing an appropriate diagnosis or solution for a health or
medical issue.
Concept map: Graphical representation composed of concepts linked by phrases
to form propositional statements
Cognitive load: The definition used for this research is that of Clark & Lyons, who
define cognitive load as “The amount of work imposed on working
memory.” (Clark & Lyons, 2004).
9
Explicitness: For the purposes of this research, whether or not a specific rule was
stated in the intervention.
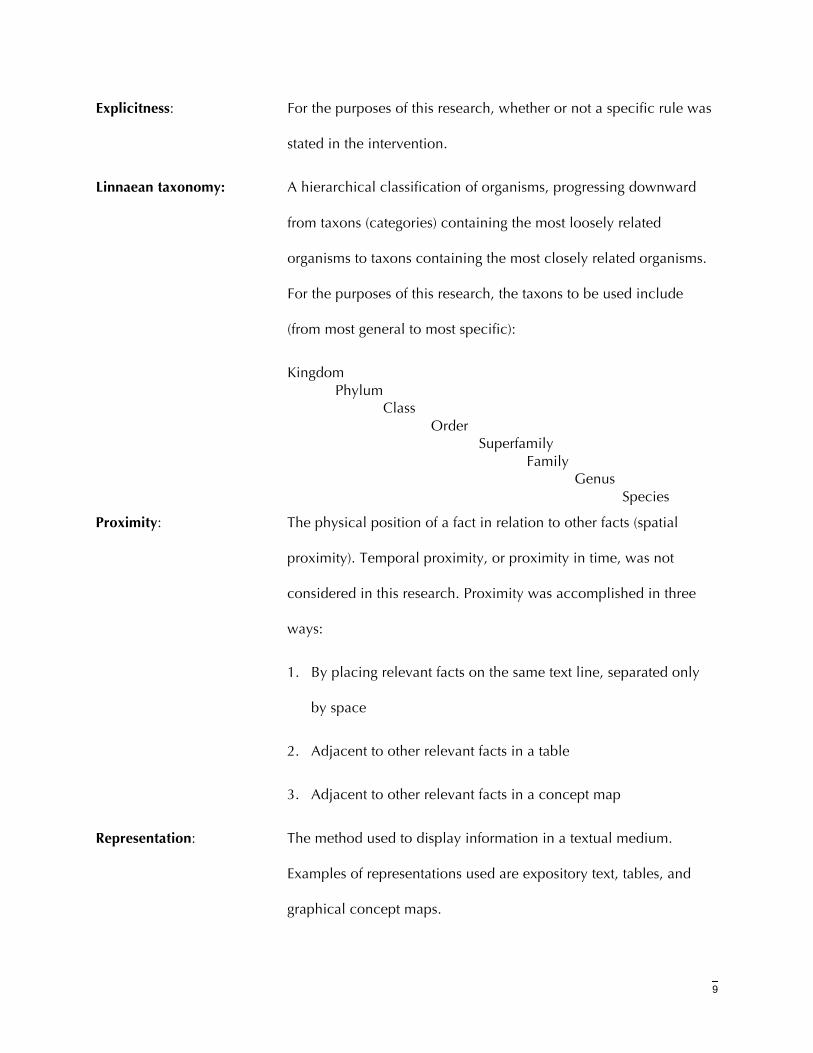
Linnaean taxonomy: A hierarchical classification of organisms, progressing downward
from taxons (categories) containing the most loosely related
organisms to taxons containing the most closely related organisms.
For the purposes of this research, the taxons to be used include
(from most general to most specific):
Kingdom Phylum
Class Order Superfamily Family Genus Species
Proximity: The physical position of a fact in relation to other facts (spatial
proximity). Temporal proximity, or proximity in time, was not
considered in this research. Proximity was accomplished in three
ways:
1. By placing relevant facts on the same text line, separated only
by space
2. Adjacent to other relevant facts in a table
3. Adjacent to other relevant facts in a concept map
Representation: The method used to display information in a textual medium.
Examples of representations used are expository text, tables, and
graphical concept maps.
10
Taxon: A category in the Linnaean taxonomy.
Taxonomy: A system of hierarchical classification. See also “Linnaean
taxonomy” on previous page.
AssumptionsandLimitations
This research assumed that the study subjects possess basic knowledge of the research
domain, veterinary parasitology, including the taxonomic structure of that domain. Because this
specific domain was used for the research, the research is not generalizable to other domains.
Although the research addressed expository text, issues such as text coherence were not
considered. The research is also limited by the availability of the student population, as there is
only one college of veterinary medicine in the state of Texas. This limitation meant that data
collection could occur only once yearly, and it also limited the sample size to the size of the
second-year class, resulting in decreased power of the statistical analyses. Finally, temporal
proximity of information presentation may have an effect, but was not considered in this research.
Summary
This chapter described how well-organized mental representations are necessary for
clinical problem solving. The chapter then described the problem of how medical and veterinary
students typically fail to integrate basic and clinical knowledge. The basic hypotheses and research
questions concerning the effect of spatial proximity, explicitness, and representation on student
learning and clinical problem solving were described. This chapter also illustrated the conceptual
framework and defined the terms used in the research, and concluded with the assumptions and
limitations of the study.
11
ChapterIIReviewoftheLiterature
Introduction
This chapter presents a review of the literature concerning topics relevant to this study. The
chapter begins with a review of data, information, knowledge, and wisdom, which is then
followed by a discussion of how novices such as students learn and experts or authors develop
and use information. Inferential learning and how information presentation can limit the ability of
students to grasp underlying concepts are then discussed. This is followed by learning theories
and cognitive issues, including limits of working memory and the impact of spatial separation of
material, including the proximity compatibility principle. Next, graphical representations,
especially concept maps, are discussed. This is followed by a summary of the importance of the
selected research domain, veterinary parasitology, and how a working grasp of taxonomy is
essential to meaningful learning in parasitology. Finally, a discussion of Ackoff’s Data-Information-
Knowledge-Wisdom model is presented. The chapter then concludes with a summary.
Textbooks,Experts,Authors,andLearners
A textbook used in medical or veterinary education can be considered to be a
cognitive artifact, containing external representations of the knowledge schemas of the
subject matter expert or experts who authored the text. Students, who by definition are
novices, then use this cognitive artifact to learn. Therefore, understanding problems that
students might have with inferring concepts from texts requires an understanding of how
novices such as students differ from experts, and as well as an understanding of how
experts think. In the book “Mind Over Machine”, the philosopher Hubert Dreyfus states
12
that the transition from novice to expert can be indicated by the progressive loss of the
ability to verbalize how to perform a particular task, as the person moves from a state of
“knowing what” to that of “knowing how” (Dreyfus, Dreyfus, & Athanasiou, 1986).
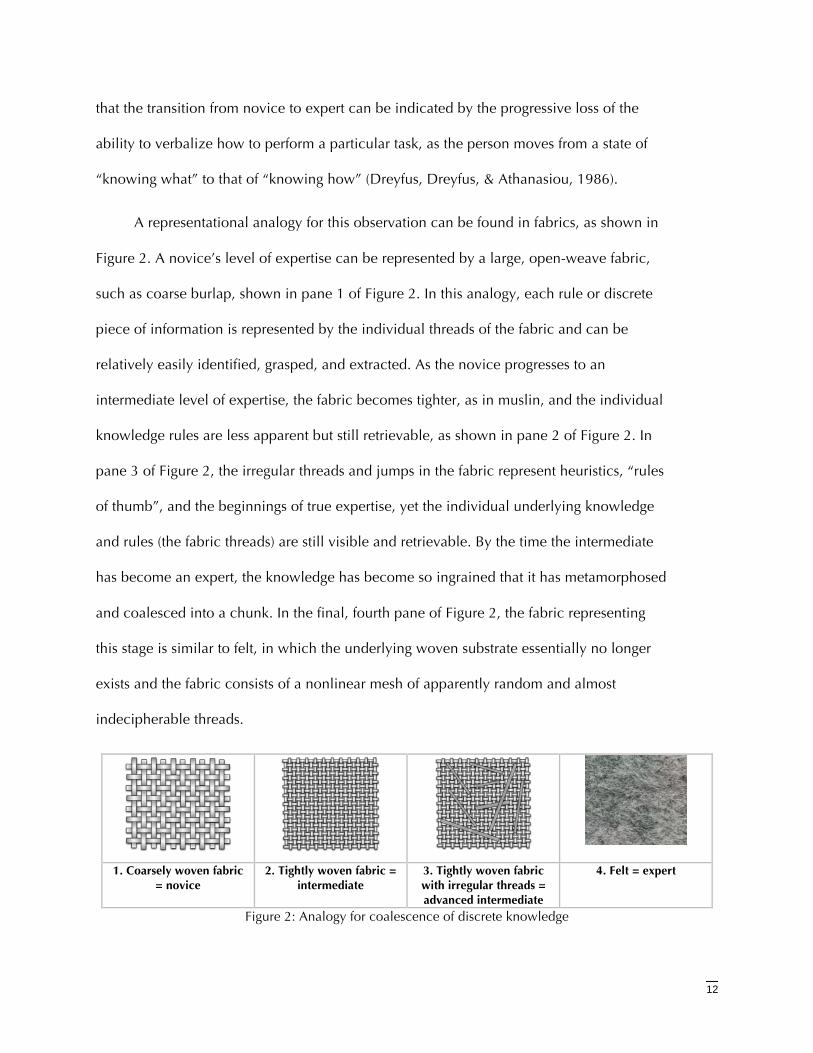
A representational analogy for this observation can be found in fabrics, as shown in
Figure 2. A novice’s level of expertise can be represented by a large, open-weave fabric,
such as coarse burlap, shown in pane 1 of Figure 2. In this analogy, each rule or discrete
piece of information is represented by the individual threads of the fabric and can be
relatively easily identified, grasped, and extracted. As the novice progresses to an
intermediate level of expertise, the fabric becomes tighter, as in muslin, and the individual
knowledge rules are less apparent but still retrievable, as shown in pane 2 of Figure 2. In
pane 3 of Figure 2, the irregular threads and jumps in the fabric represent heuristics, “rules
of thumb”, and the beginnings of true expertise, yet the individual underlying knowledge
and rules (the fabric threads) are still visible and retrievable. By the time the intermediate
has become an expert, the knowledge has become so ingrained that it has metamorphosed
and coalesced into a chunk. In the final, fourth pane of Figure 2, the fabric representing
this stage is similar to felt, in which the underlying woven substrate essentially no longer
exists and the fabric consists of a nonlinear mesh of apparently random and almost
indecipherable threads.
1. Coarsely woven fabric = novice
2. Tightly woven fabric = intermediate
3. Tightly woven fabric with irregular threads = advanced intermediate
4. Felt = expert
Figure 2: Analogy for coalescence of discrete knowledge
13
This chunked or “compiled” knowledge has become tacit knowledge in that it is used at a
subconscious level and is often referred to “procedural” knowledge; on the other hand, knowledge
available to conscious thought is termed “declarative” knowledge (Musen, 1989). A paradox then
exists in that the expert’s ability to verbalize his or her knowledge is inversely proportional to the
level of expertise (Garg-Janardan & Salvendy, 1988). This can be problematic when domain
experts – who may have little or no training in either information representation or education -- are
also authors of texts that are used by novices as textbooks. Books in particular often serve more
than one purpose – not only as a textbook to be used by a novice, but also as a reference for use
by experts.
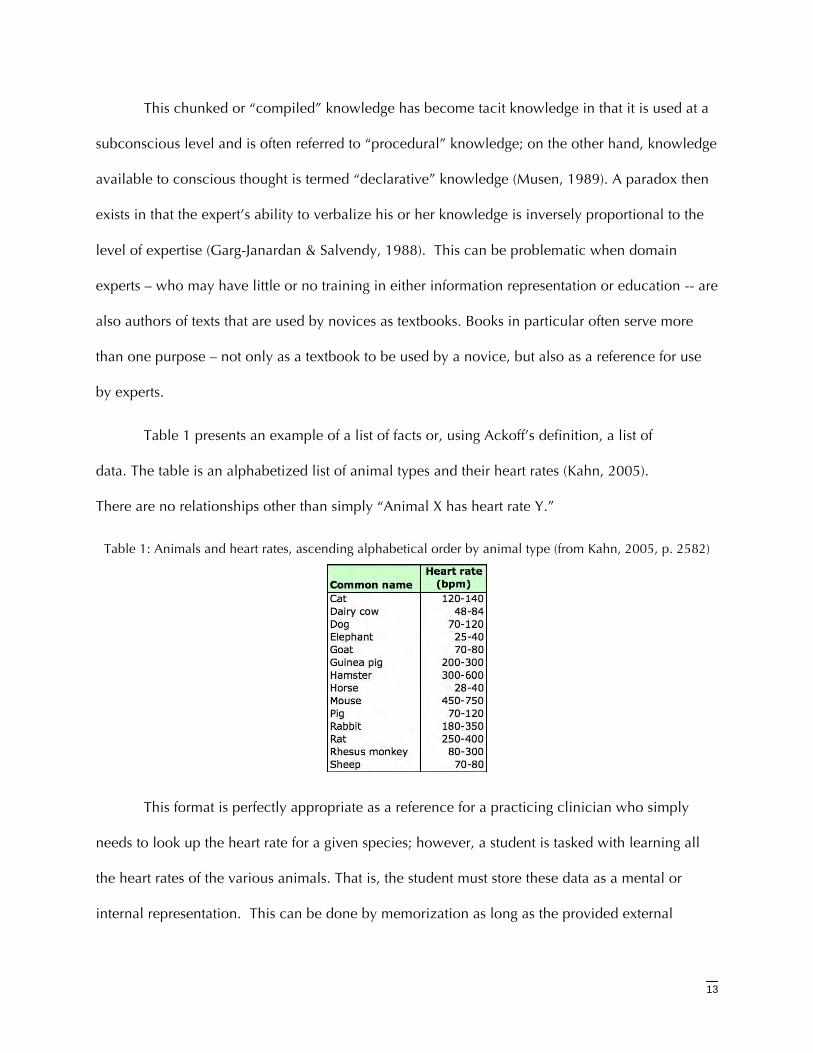
Table 1 presents an example of a list of facts or, using Ackoff’s definition, a list of
data. The table is an alphabetized list of animal types and their heart rates (Kahn, 2005).
There are no relationships other than simply “Animal X has heart rate Y.”
Table 1: Animals and heart rates, ascending alphabetical order by animal type (from Kahn, 2005, p. 2582)
This format is perfectly appropriate as a reference for a practicing clinician who simply
needs to look up the heart rate for a given species; however, a student is tasked with learning all
the heart rates of the various animals. That is, the student must store these data as a mental or
internal representation. This can be done by memorization as long as the provided external
14
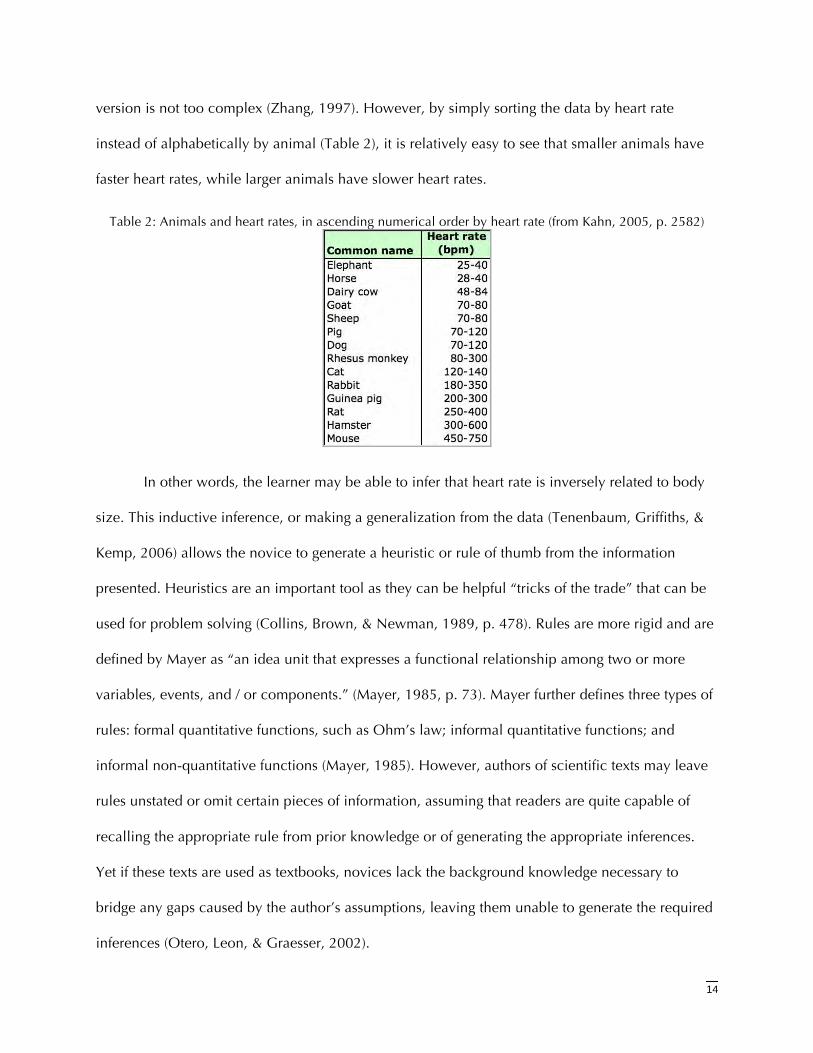
version is not too complex (Zhang, 1997). However, by simply sorting the data by heart rate
instead of alphabetically by animal (Table 2), it is relatively easy to see that smaller animals have
faster heart rates, while larger animals have slower heart rates.
Table 2: Animals and heart rates, in ascending numerical order by heart rate (from Kahn, 2005, p. 2582)
In other words, the learner may be able to infer that heart rate is inversely related to body
size. This inductive inference, or making a generalization from the data (Tenenbaum, Griffiths, &
Kemp, 2006) allows the novice to generate a heuristic or rule of thumb from the information
presented. Heuristics are an important tool as they can be helpful “tricks of the trade” that can be
used for problem solving (Collins, Brown, & Newman, 1989, p. 478). Rules are more rigid and are
defined by Mayer as “an idea unit that expresses a functional relationship among two or more
variables, events, and / or components.” (Mayer, 1985, p. 73). Mayer further defines three types of
rules: formal quantitative functions, such as Ohm’s law; informal quantitative functions; and
informal non-quantitative functions (Mayer, 1985). However, authors of scientific texts may leave
rules unstated or omit certain pieces of information, assuming that readers are quite capable of
recalling the appropriate rule from prior knowledge or of generating the appropriate inferences.
Yet if these texts are used as textbooks, novices lack the background knowledge necessary to
bridge any gaps caused by the author’s assumptions, leaving them unable to generate the required
inferences (Otero, Leon, & Graesser, 2002).
15
This example also illustrates the representational effect, which is the “…phenomenon that
different isomorphic representations of a common formal structure can cause dramatically different
cognitive behaviors.” (Zhang & Norman, 1994). Further, the representational effect can also
impact the difficulty of the task being performed (Chuah, Zhang, & Johnson, 2000). In the case of
learning, Ainsworth points out that “If a learning environment presents a choice of multiple
representations, learners can work with their preferred choice.” (Ainsworth, 1999)
There is yet another issue at work in this example, and that is the role of explicit versus
implicit information. While the species and heart rates are explicitly stated in both tables, the
typical mass of each species is not given and is therefore implied as a property of the species. A
student must be able to perform several tasks in order to generate the correct heuristic regarding
the relationship between mass and heart rate.
• First, the learner must recognize that a relationship of some type exists between the
species’ mass and its heart rate.
• Second, the learner must recognize each animal; that is, the student must have prior
knowledge already stored in long-term memory
• Third, the learner must recall each animal’s approximate mass from long-term memory
and place this information in working memory.
• Finally, the learner must then be able to conceptualize the relationship between the
implicit (mass) and the explicit (heart rate) information.
If the learner does not have this information already stored in long-term memory, then
there is the risk that they will not even realize that any sort of relationship exists between these two
sets of information and as a result, they will not develop the heuristic rule that demonstrates
conceptual understanding of this relationship. Including the mass of each species in the table, as in
16
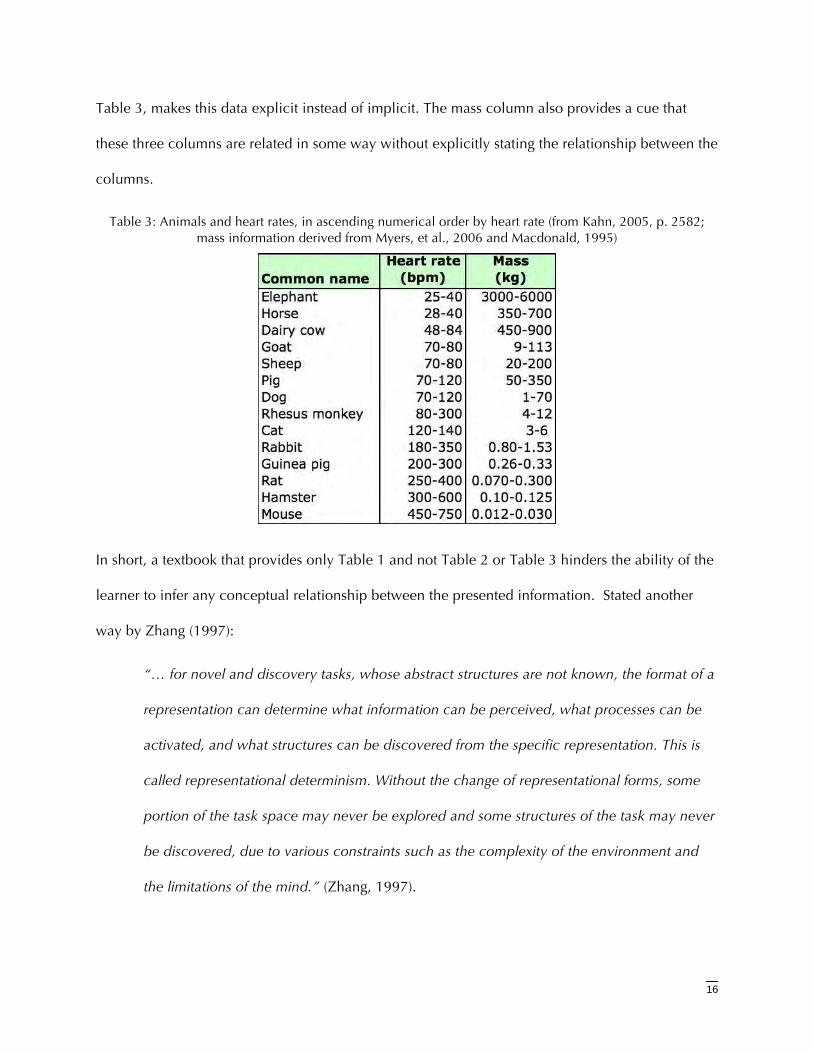
Table 3, makes this data explicit instead of implicit. The mass column also provides a cue that
these three columns are related in some way without explicitly stating the relationship between the
columns.
Table 3: Animals and heart rates, in ascending numerical order by heart rate (from Kahn, 2005, p. 2582; mass information derived from Myers, et al., 2006 and Macdonald, 1995)
In short, a textbook that provides only Table 1 and not Table 2 or Table 3 hinders the ability of the
learner to infer any conceptual relationship between the presented information. Stated another
way by Zhang (1997):
“… for novel and discovery tasks, whose abstract structures are not known, the format of a
representation can determine what information can be perceived, what processes can be
activated, and what structures can be discovered from the specific representation. This is
called representational determinism. Without the change of representational forms, some
portion of the task space may never be explored and some structures of the task may never
be discovered, due to various constraints such as the complexity of the environment and
the limitations of the mind.” (Zhang, 1997).
17
Another aspect of the relationship between heart rate and mass is “Why is there an
inverse relationship between mass and heart rate?” Deriving this answer takes effort and
thought on the part of the learner, because this requires understanding of the metabolism
of endothermic animals, heat loss, and of Surface Law (Blumberg, 2002a). In short, the
learner must be able to form new knowledge, using Ackoff’s definition, from existing
knowledge.
Note that this example used a very small set of data consisting of 14 animals and
their heart rates; in other words, the problem space was small. Sharps observed that for a
heuristic to be successful, the essential features of the problem space had to be understood
(Sharps, Hess, Price-Sharps, & Teh, 2008). Now consider a larger set of data that a
veterinary student must learn – such as all the parasites of domestic animals of a particular
geographic region. The problem space has now grown exponentially, with the number of
possible combinations of animals and parasites rapidly exceeding the capacity of human
working memory. It is clear that when this level of complexity is encountered, techniques
such as memorization and simple heuristics no longer suffice; true understanding of the
material is required. Such understanding –“meaningful learning” -- requires the student to
construct relationships between material that will allow them to gain new insights and use
the material more effectively in problem solving (Mayer, 2002). Meaningful learning as
well as specific learning theories are discussed in more detail in the following section.
LearningTheories
A variety of theories have been developed in an effort to explain how students
learn. This section will discuss the literature regarding learning theories directly related to
this dissertation, including adult learning theory, constructivist learning theory, and
18
cognitive load theory. Even the very definition of learning itself has been debated, and split
into types – “meaningful” versus “rote”. Rote learning is generally considered to be
memorization, while meaningful learning is defined by Ausubel as "…the nonarbitrary,
nonverbatim, substantive incorporation of new ideas into a learner's framework of
knowledge (or cognitive structure).” (Mintzes & Wandersee, 1998, p. 39).
AdultLearningTheory
Medical and veterinary students are considered adult learners. According to adult learning
theory (andragogy), “Adults need to know why they need to learn something before undertaking to
learn it.” (Knowles, Holton III, & Swanson, 2005, p. 64-65). Stated another way, adults are more
willing to invest effort in learning material that is directly relevant to them (MacKeracher, 2004).
This is in contrast to the traditional pedagogical model, in which the student is a passive recipient
of information that is completely controlled by the teacher. If we consider that medical and
veterinary students are also adults, then the apparent separation of the taxonomy from clinical
relevance may cause students to assume that the taxonomy has no clinical significance and is
therefore irrelevant to their learning.
ConstructivistLearningTheory
One accepted theory of learning is the constructivist learning theory, which has as its basic
premise “individuals construct meanings by forming connections between new concepts and those
that are part of an existing framework of prior knowledge.” (Mintzes & Wandersee, 1998, p. 47). In
other words, learners must fit what they are currently learning into what they already know in
order to be able to use this knowledge effectively. The process of fitting this new knowledge into
existing knowledge requires reflection and effort on the part of the learner. However, in some
circumstances, such as with learners who are anxious or who do not possess the requisite
19
foundation knowledge, rote learning such as memorization may actually be less difficult than
meaningful learning (Ausubel, 1963). With regard to medical education, Regan-Smith found that
first- and second-year medical students typically attempt to memorize information instead of trying
to understand the information. She also found that memorization without attempting to understand
is “likely to produce physicians who are 1) disinterested in science and do/can not ask why, and 2)
unable to respond to unique clinical presentations by modifying their practice.” (Regan-Smith,
1992). One can infer that, due to the similarity of the student body and the science-based
curriculum, a similar situation exists for veterinary students.
CognitiveLoadTheoryandtheProximityCompatibilityPrinciple
The cognitive load theory considers the limitations of a learner’s working memory, the
capabilities of long-term memory, and how information should be structured in order to
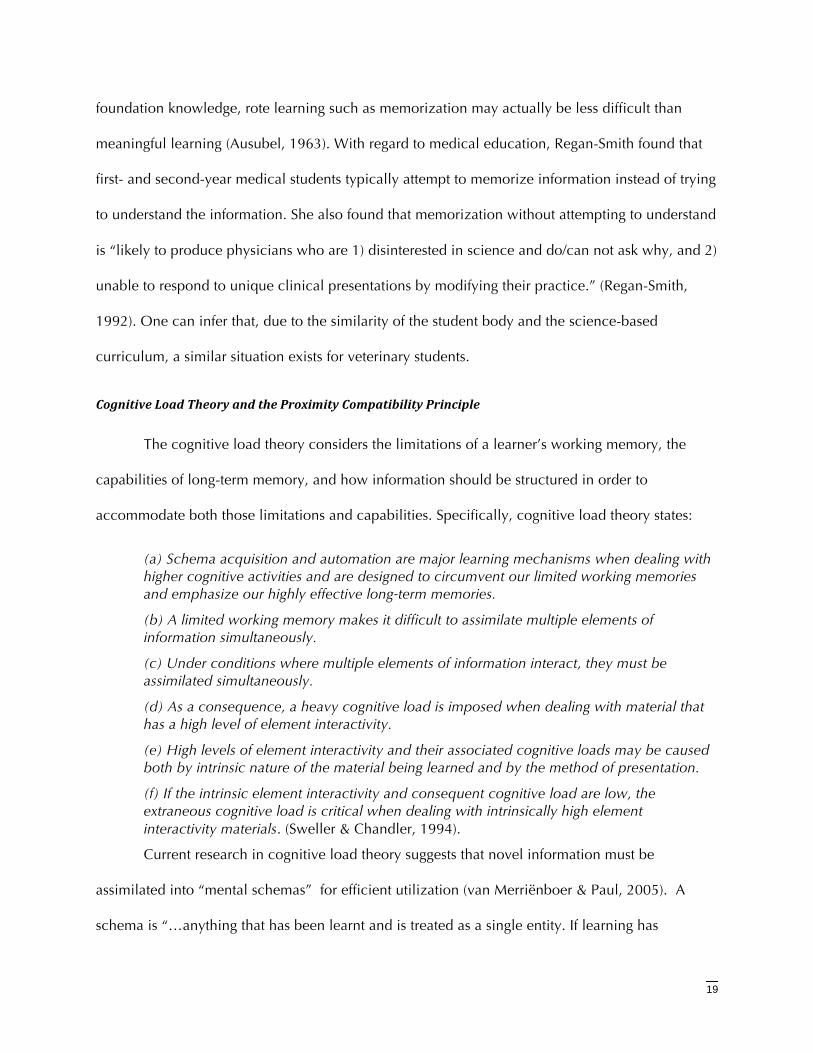
accommodate both those limitations and capabilities. Specifically, cognitive load theory states:
(a) Schema acquisition and automation are major learning mechanisms when dealing with higher cognitive activities and are designed to circumvent our limited working memories and emphasize our highly effective long-term memories.
(b) A limited working memory makes it difficult to assimilate multiple elements of information simultaneously.
(c) Under conditions where multiple elements of information interact, they must be assimilated simultaneously.
(d) As a consequence, a heavy cognitive load is imposed when dealing with material that has a high level of element interactivity.
(e) High levels of element interactivity and their associated cognitive loads may be caused both by intrinsic nature of the material being learned and by the method of presentation.
(f) If the intrinsic element interactivity and consequent cognitive load are low, the extraneous cognitive load is critical when dealing with intrinsically high element interactivity materials. (Sweller & Chandler, 1994).
Current research in cognitive load theory suggests that novel information must be
assimilated into “mental schemas” for efficient utilization (van Merriënboer & Paul, 2005). A
schema is “…anything that has been learnt and is treated as a single entity. If learning has
20
occurred over a long period of time, a schema may incorporate a huge amount of information.”
(Kirschner, 2002). This is in agreement with, and could be considered a more detailed
specification of, the constructivist school of thought regarding learning of fitting new learning into
existing knowledge.
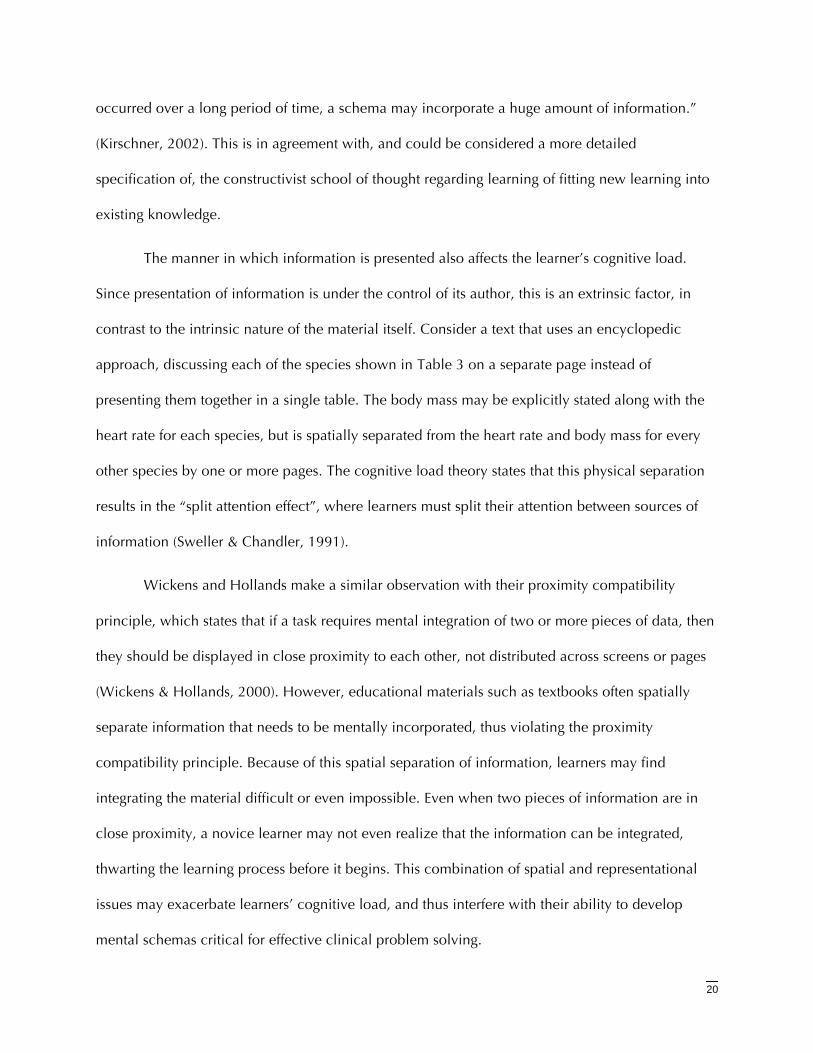
The manner in which information is presented also affects the learner’s cognitive load.
Since presentation of information is under the control of its author, this is an extrinsic factor, in
contrast to the intrinsic nature of the material itself. Consider a text that uses an encyclopedic
approach, discussing each of the species shown in Table 3 on a separate page instead of
presenting them together in a single table. The body mass may be explicitly stated along with the
heart rate for each species, but is spatially separated from the heart rate and body mass for every
other species by one or more pages. The cognitive load theory states that this physical separation
results in the “split attention effect”, where learners must split their attention between sources of
information (Sweller & Chandler, 1991).
Wickens and Hollands make a similar observation with their proximity compatibility
principle, which states that if a task requires mental integration of two or more pieces of data, then
they should be displayed in close proximity to each other, not distributed across screens or pages
(Wickens & Hollands, 2000). However, educational materials such as textbooks often spatially
separate information that needs to be mentally incorporated, thus violating the proximity
compatibility principle. Because of this spatial separation of information, learners may find
integrating the material difficult or even impossible. Even when two pieces of information are in
close proximity, a novice learner may not even realize that the information can be integrated,
thwarting the learning process before it begins. This combination of spatial and representational
issues may exacerbate learners’ cognitive load, and thus interfere with their ability to develop
mental schemas critical for effective clinical problem solving.
21
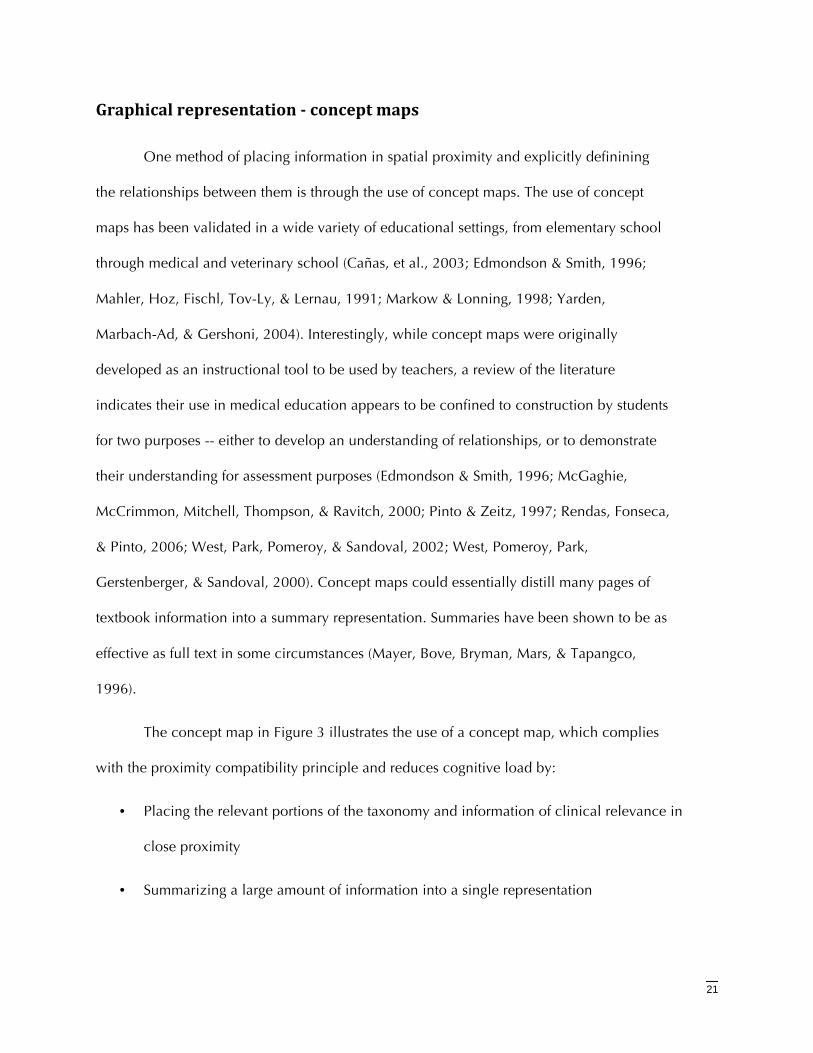
Graphicalrepresentationconceptmaps
One method of placing information in spatial proximity and explicitly definining
the relationships between them is through the use of concept maps. The use of concept
maps has been validated in a wide variety of educational settings, from elementary school
through medical and veterinary school (Cañas, et al., 2003; Edmondson & Smith, 1996;
Mahler, Hoz, Fischl, Tov-Ly, & Lernau, 1991; Markow & Lonning, 1998; Yarden,
Marbach-Ad, & Gershoni, 2004). Interestingly, while concept maps were originally
developed as an instructional tool to be used by teachers, a review of the literature
indicates their use in medical education appears to be confined to construction by students
for two purposes -- either to develop an understanding of relationships, or to demonstrate
their understanding for assessment purposes (Edmondson & Smith, 1996; McGaghie,
McCrimmon, Mitchell, Thompson, & Ravitch, 2000; Pinto & Zeitz, 1997; Rendas, Fonseca,
& Pinto, 2006; West, Park, Pomeroy, & Sandoval, 2002; West, Pomeroy, Park,
Gerstenberger, & Sandoval, 2000). Concept maps could essentially distill many pages of
textbook information into a summary representation. Summaries have been shown to be as
effective as full text in some circumstances (Mayer, Bove, Bryman, Mars, & Tapangco,
1996).
The concept map in Figure 3 illustrates the use of a concept map, which complies
with the proximity compatibility principle and reduces cognitive load by:
• Placing the relevant portions of the taxonomy and information of clinical relevance in
close proximity
• Summarizing a large amount of information into a single representation
22
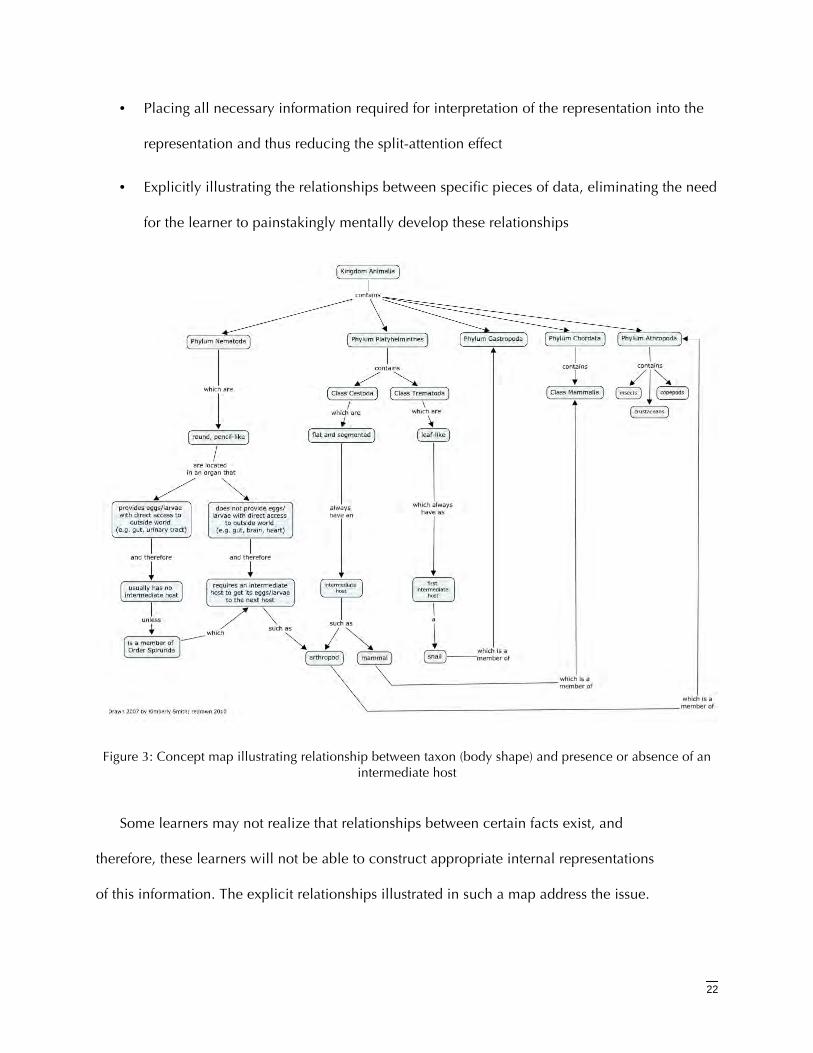
• Placing all necessary information required for interpretation of the representation into the
representation and thus reducing the split-attention effect
• Explicitly illustrating the relationships between specific pieces of data, eliminating the need
for the learner to painstakingly mentally develop these relationships
Figure 3: Concept map illustrating relationship between taxon (body shape) and presence or absence of an intermediate host
Some learners may not realize that relationships between certain facts exist, and
therefore, these learners will not be able to construct appropriate internal representations
of this information. The explicit relationships illustrated in such a map address the issue.
23
Finally, showing the relationships increases relevance to the adult learner, and reduces the
time required for construction of internal representations.
In the next section, taxonomy and the specific study domain of veterinary parasitology
are discussed.
TheStudyDomainandtheImportanceofBiologicalTaxonomy
TaxonomyandBiology
In 1735 Linnaeus published his Systema Naturae, which was the first systematic taxonomy
of plants and animals and was based on the morphology of organisms. Adaptations of the
Linnaean taxonomy are still in use today, and systematists have now expanded the taxonomy to
utilize genomic data in addition to the morphological data. Because of this systematic process,
taxonomy is a reflection of an organism’s evolutionary heritage, with organisms of similar ancestry
sharing more closely related taxons. Similar organisms grouped together based on morphology
and/or genomics will often share other characteristics as a result of evolution; therefore, their
behavior and responses to biological stimuli will often be similar (Winston, 1999). Taxonomy
provides the foundation for biological and evolutionary understanding as it supplies a model for
visualizing evolutionary relationships among organisms. In this way, taxonomy is as important to
biology as the periodic table is to chemistry. Just as Mendeleev’s periodic table groups chemical
elements together based on physical and chemical properties and can both explain and predict the
behavior of those elements, the Linnaean classification of organisms can help explain and predict
behavior and reactions of those organisms. For example, Yates, Salazar-Bravo, and Dragoo (2004)
describe how analysis of phylogenetic trees was used to theorize that New World mice, the vector
for hantaviruses, evolved concurrently with those hantaviruses, which are responsible for the
highly pathogenic Hantavirus Pulmonary Syndrome (Yates, Salazar-Bravo, & Dragoo, 2004).
24
Thus, developing an accurate understanding of the particular portion of the taxonomic tree
used in one’s studies or work is essential for deriving relationships, similarities, differences,
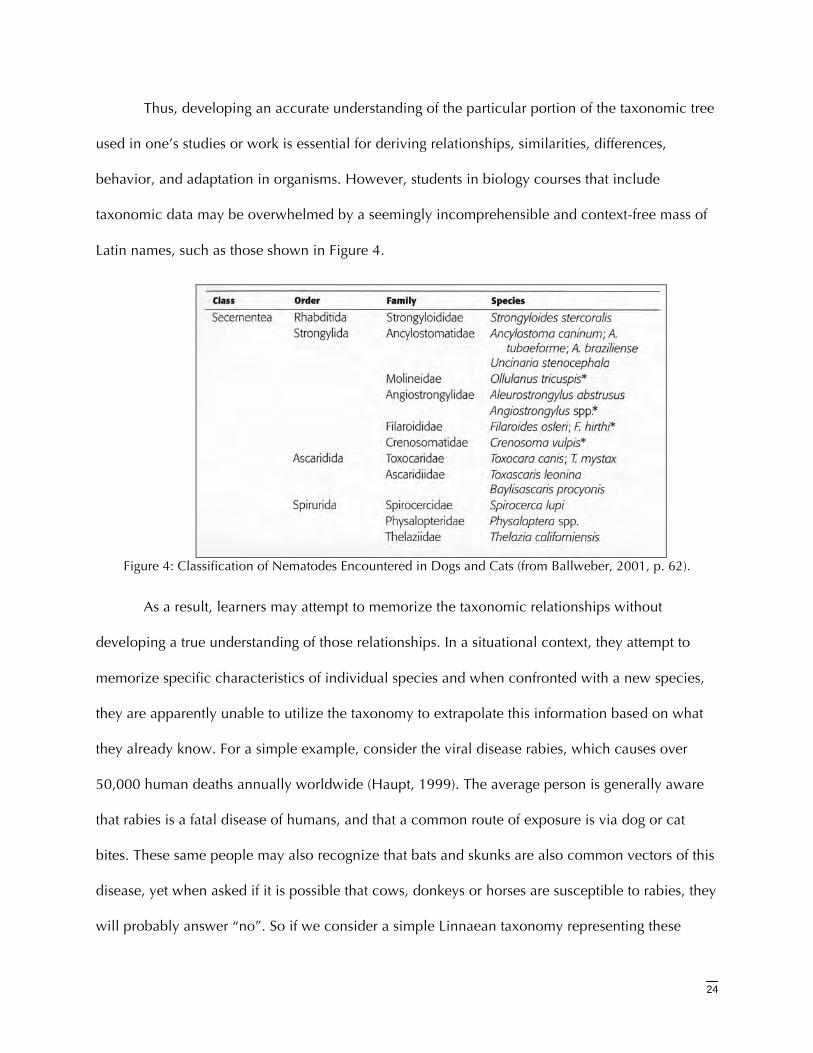
behavior, and adaptation in organisms. However, students in biology courses that include
taxonomic data may be overwhelmed by a seemingly incomprehensible and context-free mass of
Latin names, such as those shown in Figure 4.
Figure 4: Classification of Nematodes Encountered in Dogs and Cats (from Ballweber, 2001, p. 62).
As a result, learners may attempt to memorize the taxonomic relationships without
developing a true understanding of those relationships. In a situational context, they attempt to
memorize specific characteristics of individual species and when confronted with a new species,
they are apparently unable to utilize the taxonomy to extrapolate this information based on what
they already know. For a simple example, consider the viral disease rabies, which causes over
50,000 human deaths annually worldwide (Haupt, 1999). The average person is generally aware
that rabies is a fatal disease of humans, and that a common route of exposure is via dog or cat
bites. These same people may also recognize that bats and skunks are also common vectors of this
disease, yet when asked if it is possible that cows, donkeys or horses are susceptible to rabies, they
will probably answer “no”. So if we consider a simple Linnaean taxonomy representing these
25
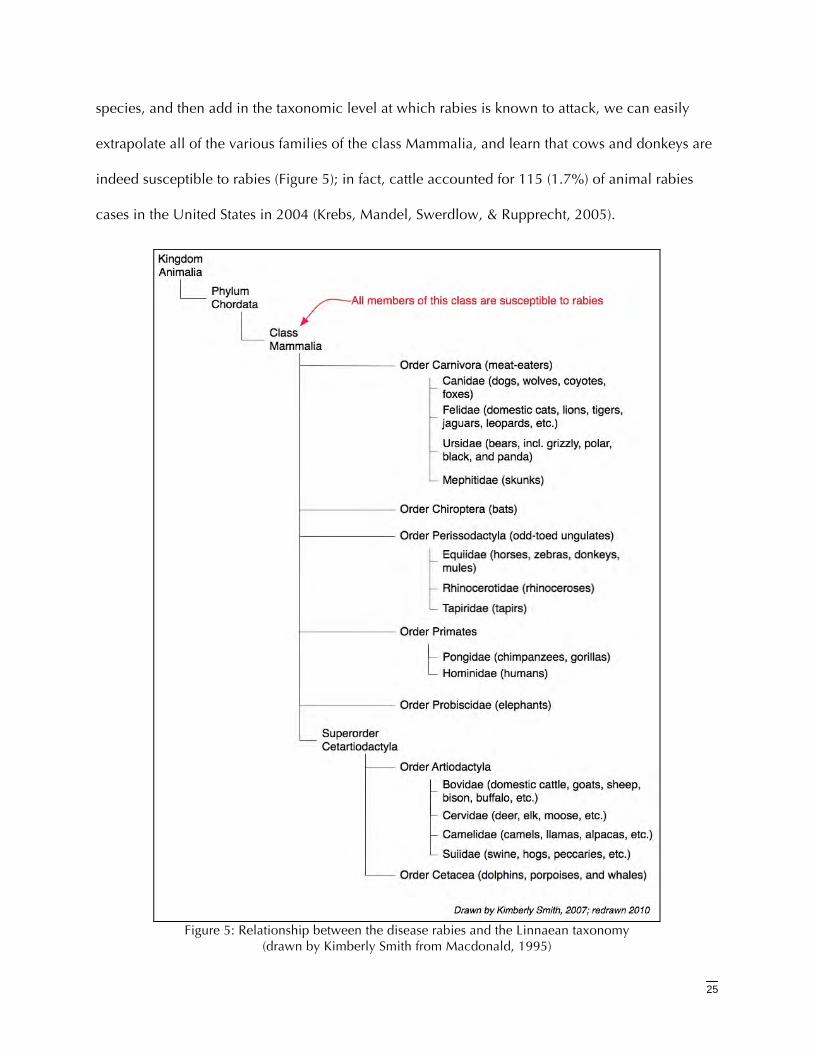
species, and then add in the taxonomic level at which rabies is known to attack, we can easily
extrapolate all of the various families of the class Mammalia, and learn that cows and donkeys are
indeed susceptible to rabies (Figure 5); in fact, cattle accounted for 115 (1.7%) of animal rabies
cases in the United States in 2004 (Krebs, Mandel, Swerdlow, & Rupprecht, 2005).
Figure 5: Relationship between the disease rabies and the Linnaean taxonomy
(drawn by Kimberly Smith from Macdonald, 1995)
26
TaxonomyandVeterinaryParasitology
In the field of parasitology, and veterinary parasitology in particular, learners must understand
the complex relationships that exist between parasites, their environment, and hosts for effective
diagnosis, treatment, and control. If the learner learns this information for one species of parasite,
and also understands how the Linnaean taxonomy indicates the evolutionary similarity (or
dissimilarity) of species, the learner can then extrapolate information about related parasites. This
end result is meaningful learning as opposed to simple memorization. However, a review of the
literature indicates that very little research has been done on human learning with respect to
taxonomic information. In fact, Brisbin observed:
“Most students are taught the existence of scientific schemes of classification. They recognize that lions, tigers, and panthers are all members of the same class that does not include wolves, dogs, and coyotes. Further, students recognize that the larger class, Mammalia, includes all of these. However, few students can provide any theoretical basis as to why these organisms are classified together….Without understanding the mechanisms that have produced the diversity of life on earth, the study of classification becomes nothing more than vocabulary memorization.” (Brisbin, 2000).
In 1979, Morton and Bradely required “…students to separate a selected number of organisms into
groups of increasing similarity and to relate these groups directly to the kingdom-species system of
classification.”(Morton & Bradely, 1979). Shortly thereafter, Core proposed a problem-solving
method for students to analyze taxonomic relationships (Core, 1982). In 1985, Adams evaluated
how very young children learned about basic animal taxonomies from their mothers (Adams,
1985). More recently, Lee and Parr have worked extensively on user interaction and taxonomic
visualization tools (Lee, Parr, Campbell, & Bederson, 2004). Yet, a review of the literature
produced no citations of studies using adult learners -- specifically, medical/veterinary students –
who are tasked not only with rapidly assimilating large quantities of taxonomic data, but also with
deriving clinical relevance from this information.
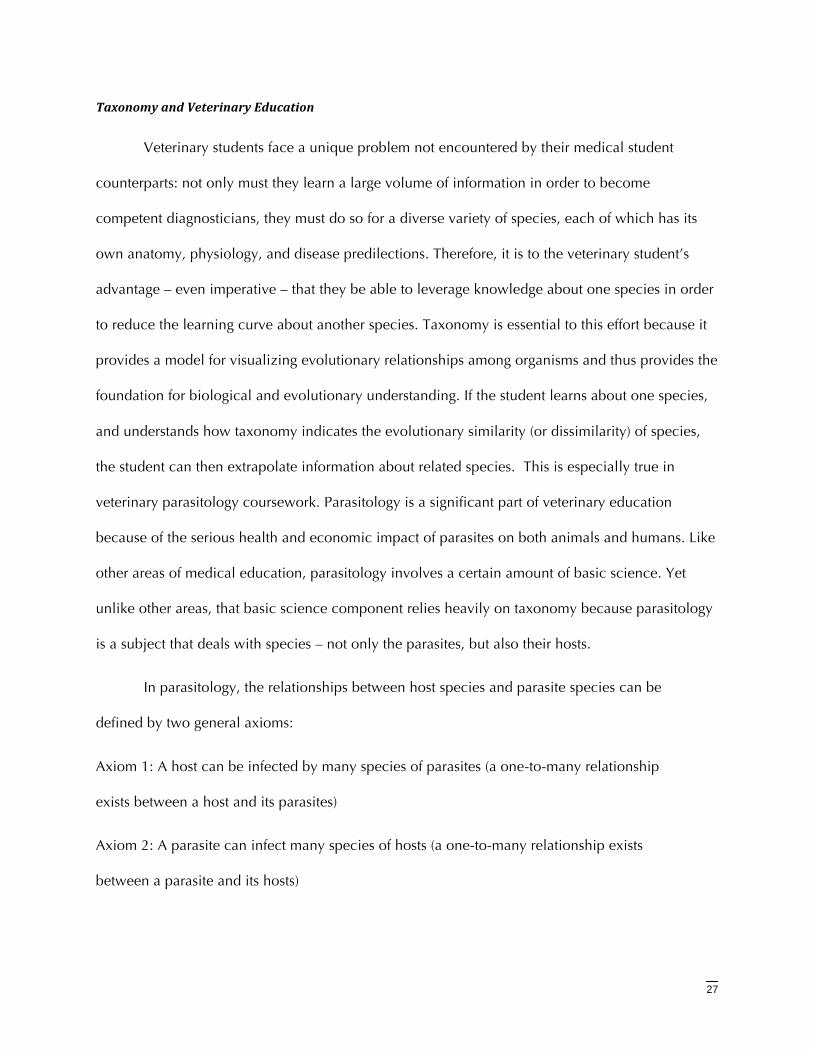
27
TaxonomyandVeterinaryEducation
Veterinary students face a unique problem not encountered by their medical student
counterparts: not only must they learn a large volume of information in order to become
competent diagnosticians, they must do so for a diverse variety of species, each of which has its
own anatomy, physiology, and disease predilections. Therefore, it is to the veterinary student’s
advantage – even imperative – that they be able to leverage knowledge about one species in order
to reduce the learning curve about another species. Taxonomy is essential to this effort because it
provides a model for visualizing evolutionary relationships among organisms and thus provides the
foundation for biological and evolutionary understanding. If the student learns about one species,
and understands how taxonomy indicates the evolutionary similarity (or dissimilarity) of species,
the student can then extrapolate information about related species. This is especially true in
veterinary parasitology coursework. Parasitology is a significant part of veterinary education
because of the serious health and economic impact of parasites on both animals and humans. Like
other areas of medical education, parasitology involves a certain amount of basic science. Yet
unlike other areas, that basic science component relies heavily on taxonomy because parasitology
is a subject that deals with species – not only the parasites, but also their hosts.
In parasitology, the relationships between host species and parasite species can be
defined by two general axioms:
Axiom 1: A host can be infected by many species of parasites (a one-to-many relationship
exists between a host and its parasites)
Axiom 2: A parasite can infect many species of hosts (a one-to-many relationship exists
between a parasite and its hosts)
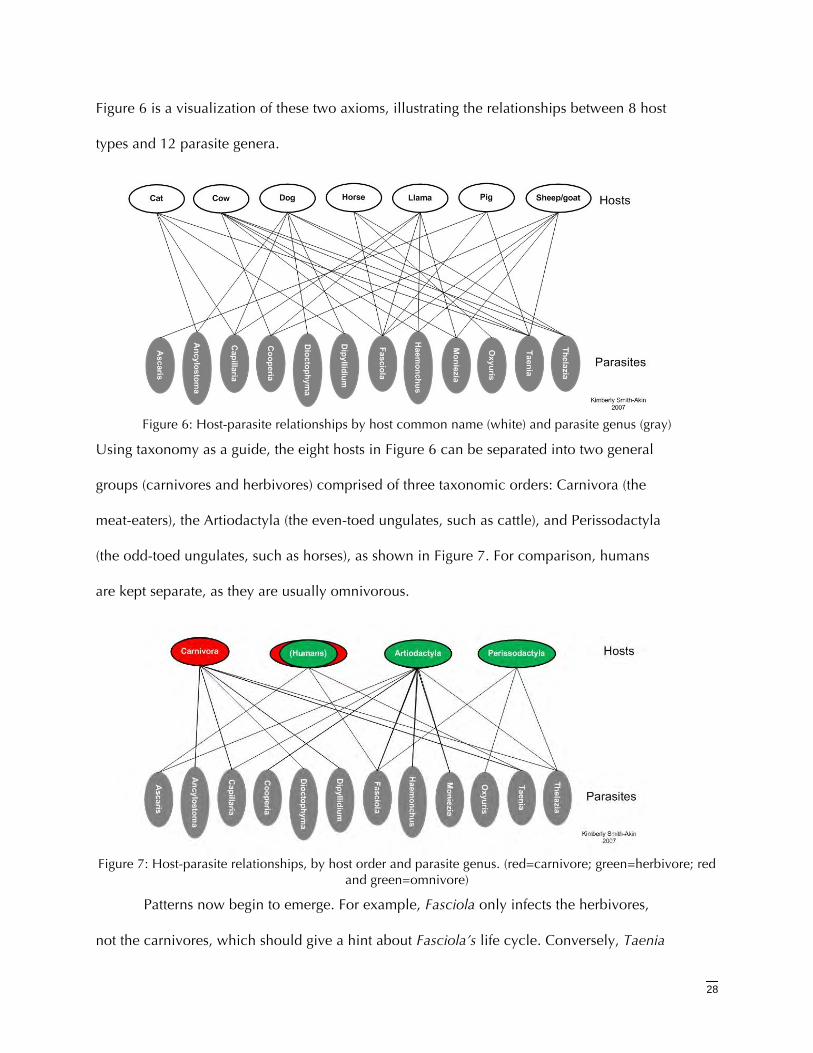
28
Figure 6 is a visualization of these two axioms, illustrating the relationships between 8 host
types and 12 parasite genera.
Figure 6: Host-parasite relationships by host common name (white) and parasite genus (gray)
Using taxonomy as a guide, the eight hosts in Figure 6 can be separated into two general
groups (carnivores and herbivores) comprised of three taxonomic orders: Carnivora (the
meat-eaters), the Artiodactyla (the even-toed ungulates, such as cattle), and Perissodactyla
(the odd-toed ungulates, such as horses), as shown in Figure 7. For comparison, humans
are kept separate, as they are usually omnivorous.
Figure 7: Host-parasite relationships, by host order and parasite genus. (red=carnivore; green=herbivore; red
and green=omnivore)
Patterns now begin to emerge. For example, Fasciola only infects the herbivores,
not the carnivores, which should give a hint about Fasciola’s life cycle. Conversely, Taenia
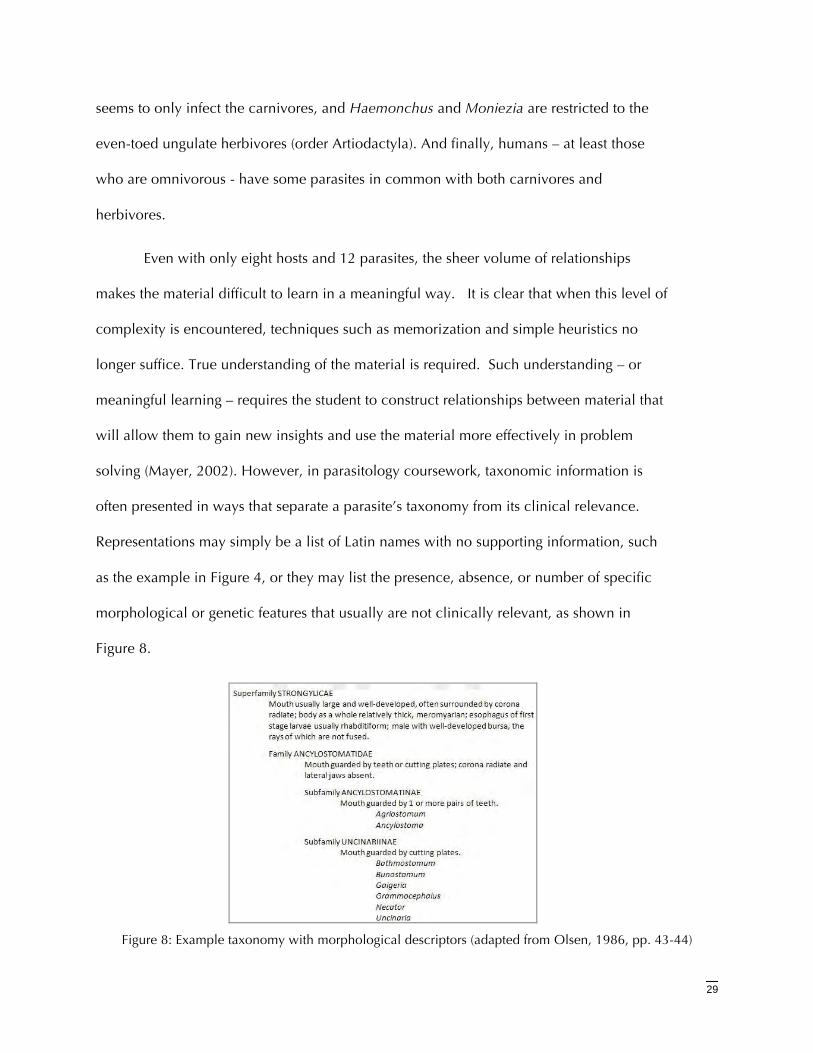
29
seems to only infect the carnivores, and Haemonchus and Moniezia are restricted to the
even-toed ungulate herbivores (order Artiodactyla). And finally, humans – at least those
who are omnivorous - have some parasites in common with both carnivores and
herbivores.
Even with only eight hosts and 12 parasites, the sheer volume of relationships
makes the material difficult to learn in a meaningful way. It is clear that when this level of
complexity is encountered, techniques such as memorization and simple heuristics no
longer suffice. True understanding of the material is required. Such understanding – or
meaningful learning – requires the student to construct relationships between material that
will allow them to gain new insights and use the material more effectively in problem
solving (Mayer, 2002). However, in parasitology coursework, taxonomic information is
often presented in ways that separate a parasite’s taxonomy from its clinical relevance.
Representations may simply be a list of Latin names with no supporting information, such
as the example in Figure 4, or they may list the presence, absence, or number of specific
morphological or genetic features that usually are not clinically relevant, as shown in
Figure 8.
Figure 8: Example taxonomy with morphological descriptors (adapted from Olsen, 1986, pp. 43-44)
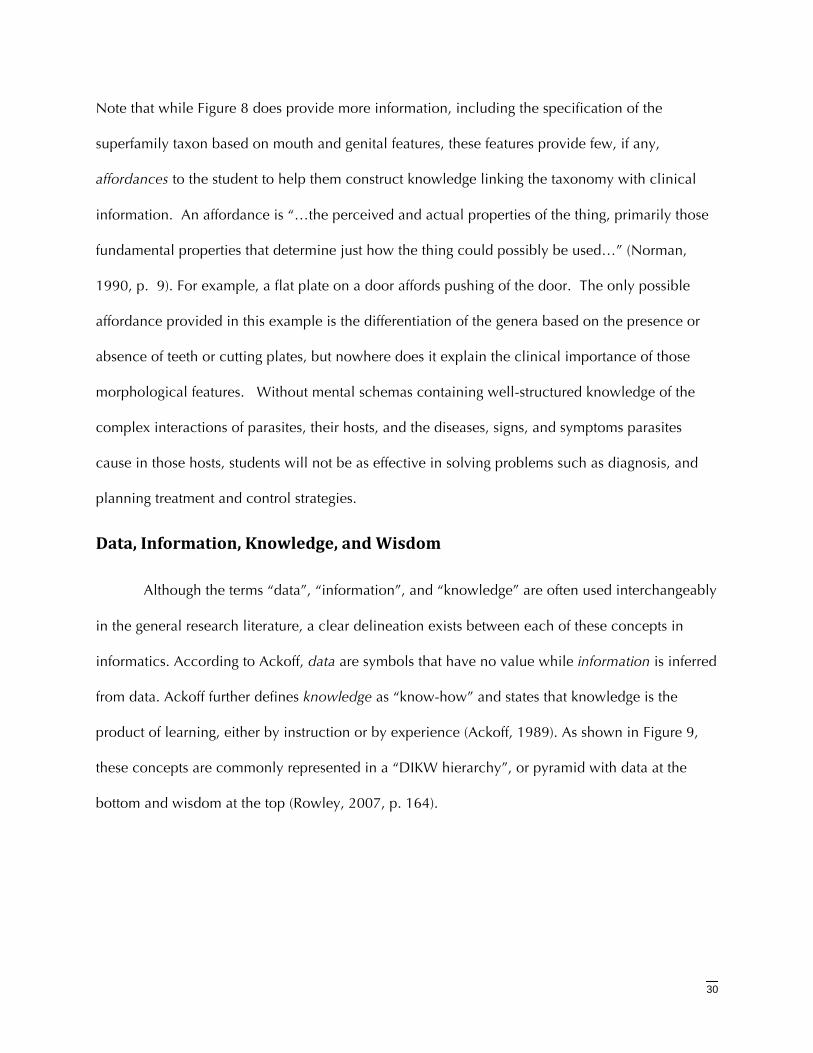
30
Note that while Figure 8 does provide more information, including the specification of the
superfamily taxon based on mouth and genital features, these features provide few, if any,
affordances to the student to help them construct knowledge linking the taxonomy with clinical
information. An affordance is “…the perceived and actual properties of the thing, primarily those
fundamental properties that determine just how the thing could possibly be used…” (Norman,
1990, p. 9). For example, a flat plate on a door affords pushing of the door. The only possible
affordance provided in this example is the differentiation of the genera based on the presence or
absence of teeth or cutting plates, but nowhere does it explain the clinical importance of those
morphological features. Without mental schemas containing well-structured knowledge of the
complex interactions of parasites, their hosts, and the diseases, signs, and symptoms parasites
cause in those hosts, students will not be as effective in solving problems such as diagnosis, and
planning treatment and control strategies.
Data,Information,Knowledge,andWisdom
Although the terms “data”, “information”, and “knowledge” are often used interchangeably
in the general research literature, a clear delineation exists between each of these concepts in
informatics. According to Ackoff, data are symbols that have no value while information is inferred
from data. Ackoff further defines knowledge as “know-how” and states that knowledge is the
product of learning, either by instruction or by experience (Ackoff, 1989). As shown in Figure 9,
these concepts are commonly represented in a “DIKW hierarchy”, or pyramid with data at the
bottom and wisdom at the top (Rowley, 2007, p. 164).
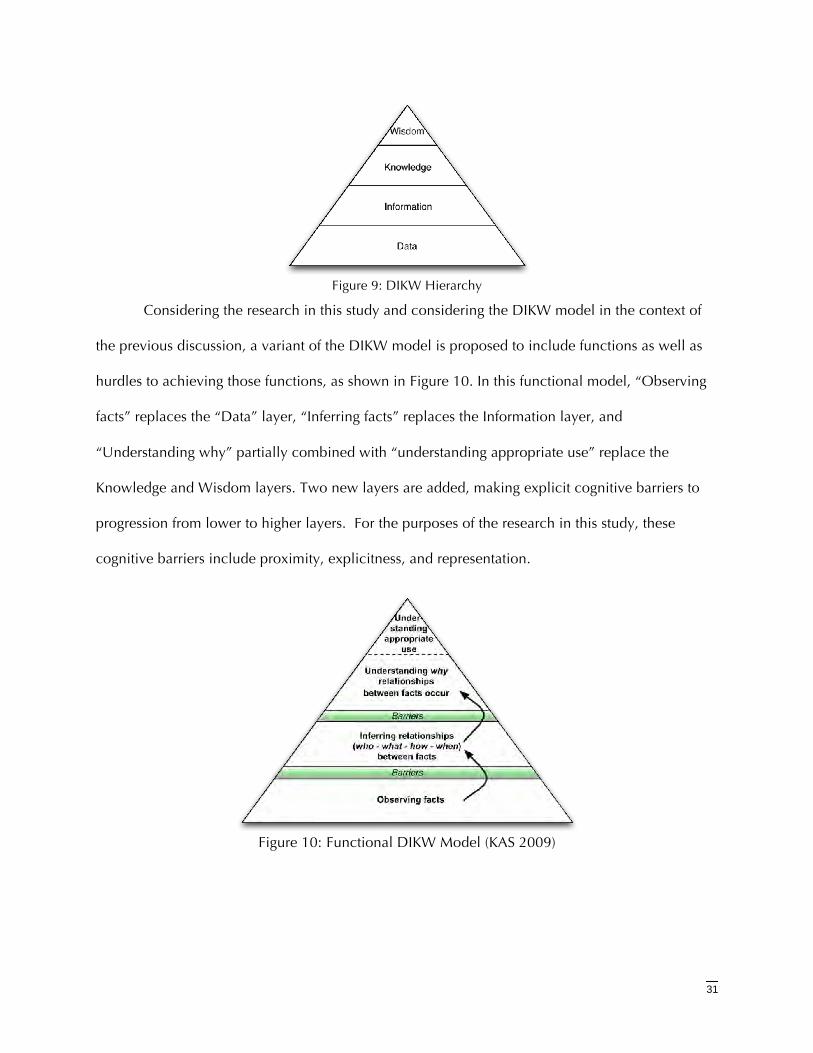
31
Figure 9: DIKW Hierarchy
Considering the research in this study and considering the DIKW model in the context of
the previous discussion, a variant of the DIKW model is proposed to include functions as well as
hurdles to achieving those functions, as shown in Figure 10. In this functional model, “Observing
facts” replaces the “Data” layer, “Inferring facts” replaces the Information layer, and
“Understanding why” partially combined with “understanding appropriate use” replace the
Knowledge and Wisdom layers. Two new layers are added, making explicit cognitive barriers to
progression from lower to higher layers. For the purposes of the research in this study, these
cognitive barriers include proximity, explicitness, and representation.
Figure 10: Functional DIKW Model (KAS 2009)
32
Summary
This chapter presented a review of the literature concerning topics relevant to this study.
The chapter began with a discussion of how novices such as learners learn and experts or authors
develop and use information and then provided a discussion of inferential learning and how
information presentation can limit the ability of students to grasp underlying concepts. This was
followed by learning theories and cognitive issues, including limits of working memory and the
impact of spatial separation of material, including the proximity compatibility principle. Next, the
importance of taxonomy in biology, and an overview of the importance of the selected research
domain, veterinary parasitology, and how a working grasp of taxonomy is essential to meaningful
learning in parasitology. The chapter concluded with a discussion of Ackoff’s Data-Information-
Knowledge-Wisdom (DIKW) model and proposed a functional model incorporating aspects of the
literature review. The next chapter discusses the methodology used in the research study.
33
ChapterIIIMethodology
Introduction
Discussed in this chapter is the methodology used for this study. This dissertation research
consisted of two experiments and an attitude questionnaire. The first experiment was designed to
assess whether explicitness and proximity in reading materials significantly affected veterinary
students’ ability to infer the rule governing the relationship between parasitic nematodes,
taxonomy, body site, and intermediate hosts. The second experiment was designed to assess the
effect of representation, by comparing a text-based version against versions that included proximal
and explicit information in the form of a graphical representation, a concept map. The attitude
questionnaire assessed the students’ attitudes toward taxonomy in parasitology as well as the
amount of rote memorization. The chapter concludes with a summary.
Subjects
The study subjects were a convenience sample consisting of the second-year class of
veterinary students in a large college of veterinary medicine in the state of Texas who matriculated
in 2007. The sole criterion for inclusion was that the subject was a second-year veterinary student
enrolled in parasitology in the fall semester of 2008. The sample consisted of 125 students, of
which 124 consented to participate in the study, for a 99% participation rate.
According to the university’s web site, 132 students enrolled in 2007. Of these, 31 were
male and 101 were female. The average age was 23 years, with a range of 20 to 52 years of age.
The average overall GPA was 3.64 on a 4.0 scale. The average GRE score (verbal, quantitative,
and analytical) was 505, 658, and 4.56, respectively (Anonymous, 2008). The highest scores
possible were 800, 800, and 6.0, respectively ("Understanding Your GRE Scores," 2009).
34
HumanSubjectsProtection
The study was reviewed and approved by the institutional review boards of both the
University of Texas Health Science Center at Houston, approval number HSC-SHIS-08-0552
(Appendix C: The University of Texas Health Science Center Study Approval Letter), and Texas
A&M University, approval number 2008-0552 (Appendix B: Texas A&M University Study
Approval Letter).
At the beginning of the session, students were given a consent form (Appendix D: Consent
Form) that explained the purpose of the study and were asked to read it. The primary investigator
gave a brief verbal overview of the study and was available to answer any questions. All students
were required to complete the study materials, but they could decline to have their results
included in the study. Students indicated their willingness to participate in the study by signing the
form, or declined to participate by not signing the form.
All students who completed the study materials received 10 extra credit class points,
whether or not they signed the study consent form. Only the primary investigator had access to the
completed consent forms, pre-tests, and post-tests. The course professor did not know which
students consented to participate in the study.
Setting
The study was conducted in the parasitology laboratory during regularly scheduled course
laboratory hours.
Pilotresearch
The two experiments required development of instructional interventions using proximity
and explicitness in texts and representations that would be compared to readings from typical
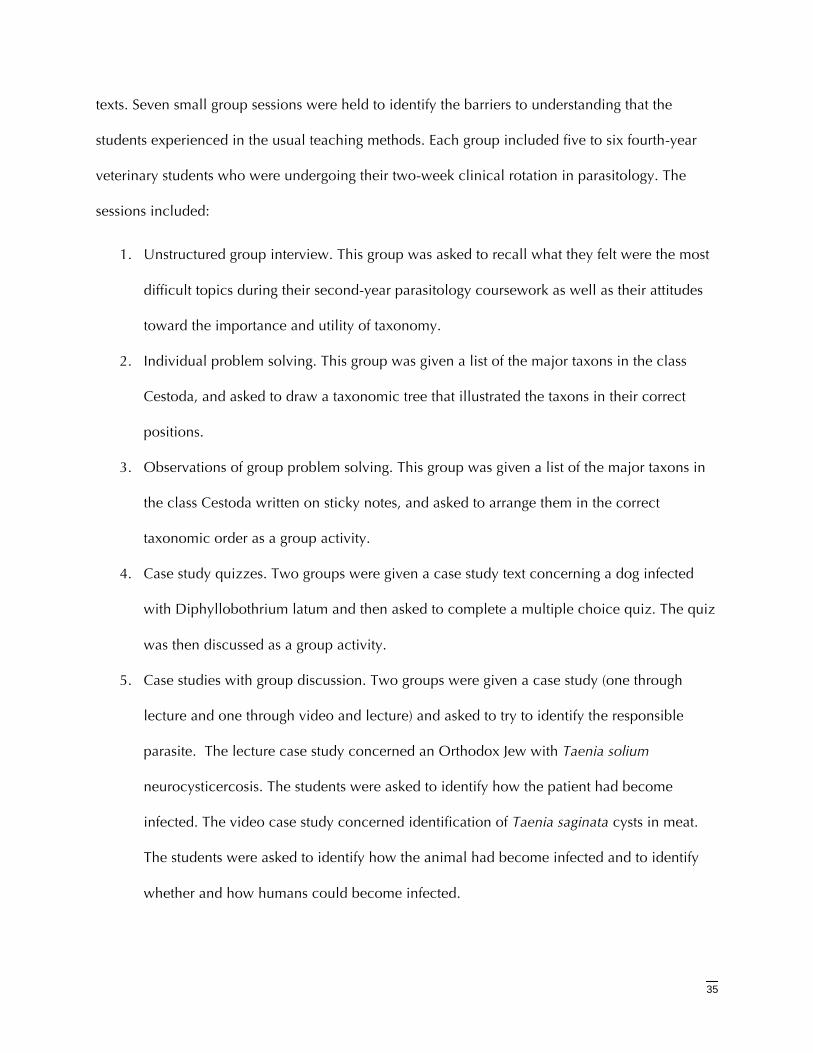
35
texts. Seven small group sessions were held to identify the barriers to understanding that the
students experienced in the usual teaching methods. Each group included five to six fourth-year
veterinary students who were undergoing their two-week clinical rotation in parasitology. The
sessions included:
1. Unstructured group interview. This group was asked to recall what they felt were the most
difficult topics during their second-year parasitology coursework as well as their attitudes
toward the importance and utility of taxonomy.
2. Individual problem solving. This group was given a list of the major taxons in the class
Cestoda, and asked to draw a taxonomic tree that illustrated the taxons in their correct
positions.
3. Observations of group problem solving. This group was given a list of the major taxons in
the class Cestoda written on sticky notes, and asked to arrange them in the correct
taxonomic order as a group activity.
4. Case study quizzes. Two groups were given a case study text concerning a dog infected
with Diphyllobothrium latum and then asked to complete a multiple choice quiz. The quiz
was then discussed as a group activity.
5. Case studies with group discussion. Two groups were given a case study (one through
lecture and one through video and lecture) and asked to try to identify the responsible
parasite. The lecture case study concerned an Orthodox Jew with Taenia solium
neurocysticercosis. The students were asked to identify how the patient had become
infected. The video case study concerned identification of Taenia saginata cysts in meat.
The students were asked to identify how the animal had become infected and to identify
whether and how humans could become infected.
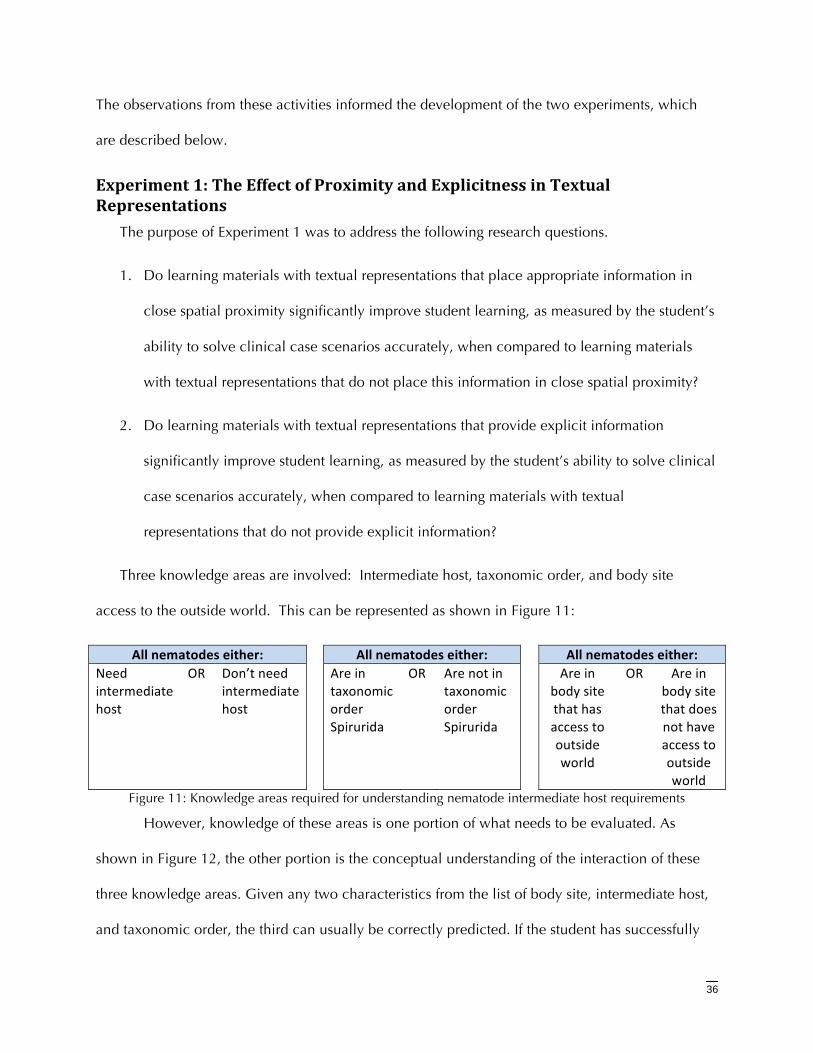
36
The observations from these activities informed the development of the two experiments, which
are described below.
Experiment1:TheEffectofProximityandExplicitnessinTextualRepresentations
The purpose of Experiment 1 was to address the following research questions.
1. Do learning materials with textual representations that place appropriate information in
close spatial proximity significantly improve student learning, as measured by the student’s
ability to solve clinical case scenarios accurately, when compared to learning materials
with textual representations that do not place this information in close spatial proximity?
2. Do learning materials with textual representations that provide explicit information
significantly improve student learning, as measured by the student’s ability to solve clinical
case scenarios accurately, when compared to learning materials with textual
representations that do not provide explicit information?
Three knowledge areas are involved: Intermediate host, taxonomic order, and body site
access to the outside world. This can be represented as shown in Figure 11:
Allnematodeseither: Allnematodeseither: Allnematodeseither:Needintermediatehost
OR Don’tneedintermediatehost
AreintaxonomicorderSpirurida
OR ArenotintaxonomicorderSpirurida
Areinbodysitethathasaccesstooutsideworld
OR Areinbodysitethatdoesnothaveaccesstooutsideworld
Figure 11: Knowledge areas required for understanding nematode intermediate host requirements
However, knowledge of these areas is one portion of what needs to be evaluated. As
shown in Figure 12, the other portion is the conceptual understanding of the interaction of these
three knowledge areas. Given any two characteristics from the list of body site, intermediate host,
and taxonomic order, the third can usually be correctly predicted. If the student has successfully
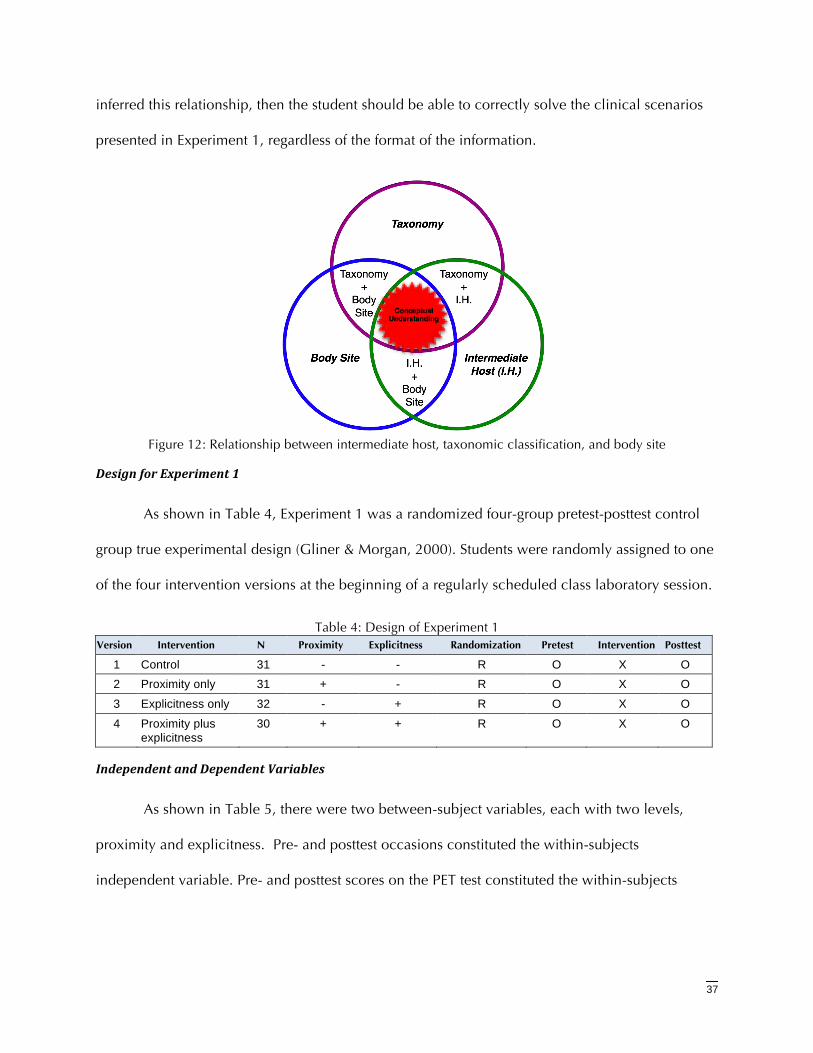
37
inferred this relationship, then the student should be able to correctly solve the clinical scenarios
presented in Experiment 1, regardless of the format of the information.
Figure 12: Relationship between intermediate host, taxonomic classification, and body site
DesignforExperiment1
As shown in Table 4, Experiment 1 was a randomized four-group pretest-posttest control
group true experimental design (Gliner & Morgan, 2000). Students were randomly assigned to one
of the four intervention versions at the beginning of a regularly scheduled class laboratory session.
Table 4: Design of Experiment 1 Version Intervention N Proximity Explicitness Randomization Pretest Intervention Posttest
1 Control 31 - - R O X O 2 Proximity only 31 + - R O X O
3 Explicitness only 32 - + R O X O
4 Proximity plus explicitness
30 + + R O X O
IndependentandDependentVariables
As shown in Table 5, there were two between-subject variables, each with two levels,
proximity and explicitness. Pre- and posttest occasions constituted the within-subjects
independent variable. Pre- and posttest scores on the PET test constituted the within-subjects
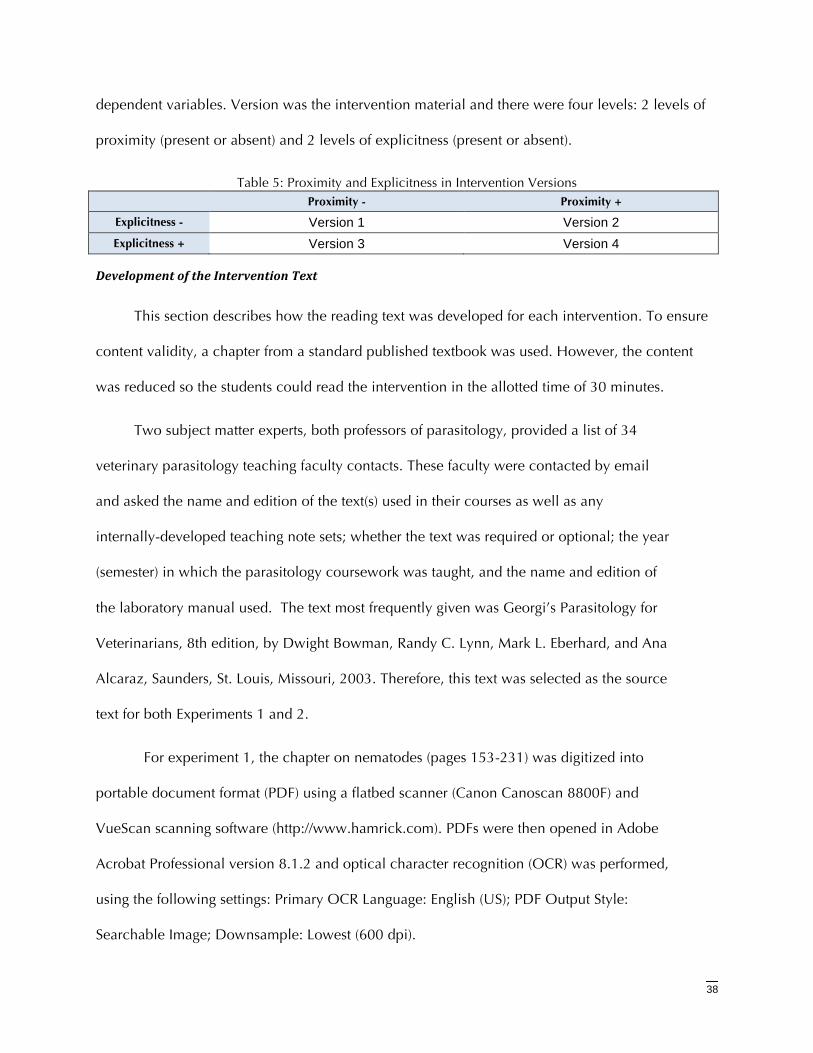
38
dependent variables. Version was the intervention material and there were four levels: 2 levels of
proximity (present or absent) and 2 levels of explicitness (present or absent).
Table 5: Proximity and Explicitness in Intervention Versions Proximity - Proximity +
Explicitness - Version 1 Version 2 Explicitness + Version 3 Version 4
DevelopmentoftheInterventionText
This section describes how the reading text was developed for each intervention. To ensure
content validity, a chapter from a standard published textbook was used. However, the content
was reduced so the students could read the intervention in the allotted time of 30 minutes.
Two subject matter experts, both professors of parasitology, provided a list of 34
veterinary parasitology teaching faculty contacts. These faculty were contacted by email
and asked the name and edition of the text(s) used in their courses as well as any
internally-developed teaching note sets; whether the text was required or optional; the year
(semester) in which the parasitology coursework was taught, and the name and edition of
the laboratory manual used. The text most frequently given was Georgi’s Parasitology for
Veterinarians, 8th edition, by Dwight Bowman, Randy C. Lynn, Mark L. Eberhard, and Ana
Alcaraz, Saunders, St. Louis, Missouri, 2003. Therefore, this text was selected as the source
text for both Experiments 1 and 2.
For experiment 1, the chapter on nematodes (pages 153-231) was digitized into
portable document format (PDF) using a flatbed scanner (Canon Canoscan 8800F) and
VueScan scanning software (http://www.hamrick.com). PDFs were then opened in Adobe
Acrobat Professional version 8.1.2 and optical character recognition (OCR) was performed,
using the following settings: Primary OCR Language: English (US); PDF Output Style:
Searchable Image; Downsample: Lowest (600 dpi).
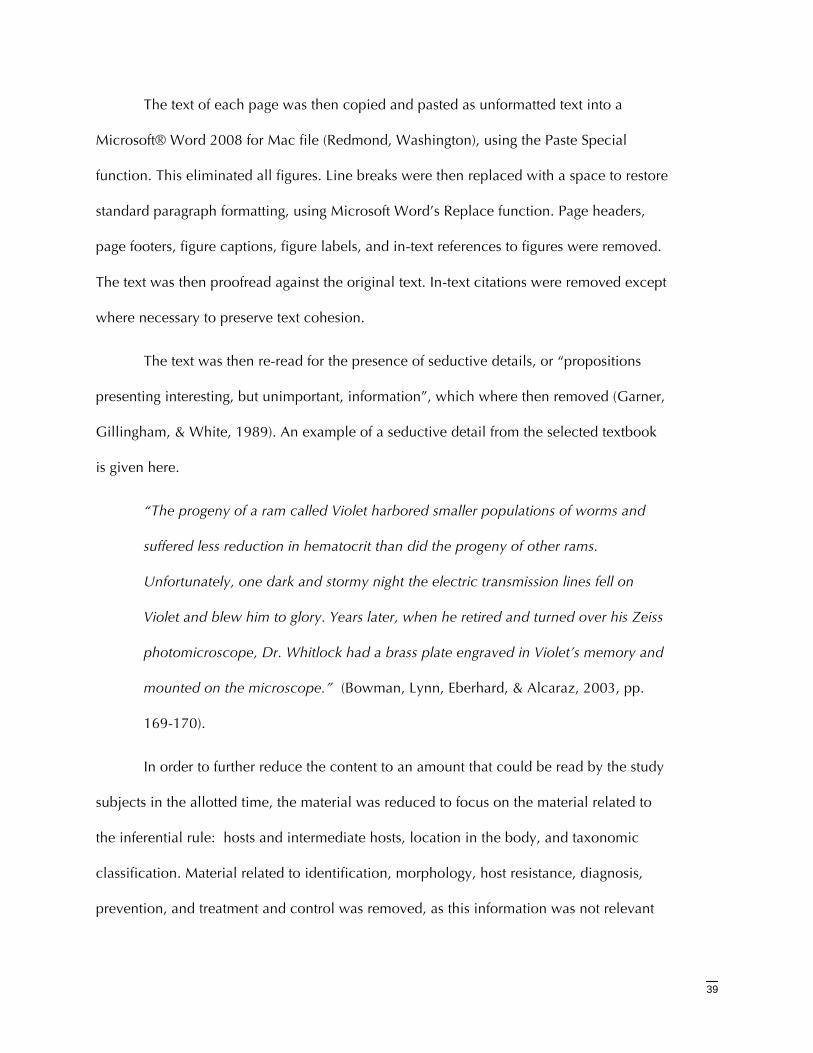
39
The text of each page was then copied and pasted as unformatted text into a
Microsoft® Word 2008 for Mac file (Redmond, Washington), using the Paste Special
function. This eliminated all figures. Line breaks were then replaced with a space to restore
standard paragraph formatting, using Microsoft Word’s Replace function. Page headers,
page footers, figure captions, figure labels, and in-text references to figures were removed.
The text was then proofread against the original text. In-text citations were removed except
where necessary to preserve text cohesion.
The text was then re-read for the presence of seductive details, or “propositions
presenting interesting, but unimportant, information”, which where then removed (Garner,
Gillingham, & White, 1989). An example of a seductive detail from the selected textbook
is given here.
“The progeny of a ram called Violet harbored smaller populations of worms and
suffered less reduction in hematocrit than did the progeny of other rams.
Unfortunately, one dark and stormy night the electric transmission lines fell on
Violet and blew him to glory. Years later, when he retired and turned over his Zeiss
photomicroscope, Dr. Whitlock had a brass plate engraved in Violet’s memory and
mounted on the microscope.” (Bowman, Lynn, Eberhard, & Alcaraz, 2003, pp.
169-170).
In order to further reduce the content to an amount that could be read by the study
subjects in the allotted time, the material was reduced to focus on the material related to
the inferential rule: hosts and intermediate hosts, location in the body, and taxonomic
classification. Material related to identification, morphology, host resistance, diagnosis,
prevention, and treatment and control was removed, as this information was not relevant
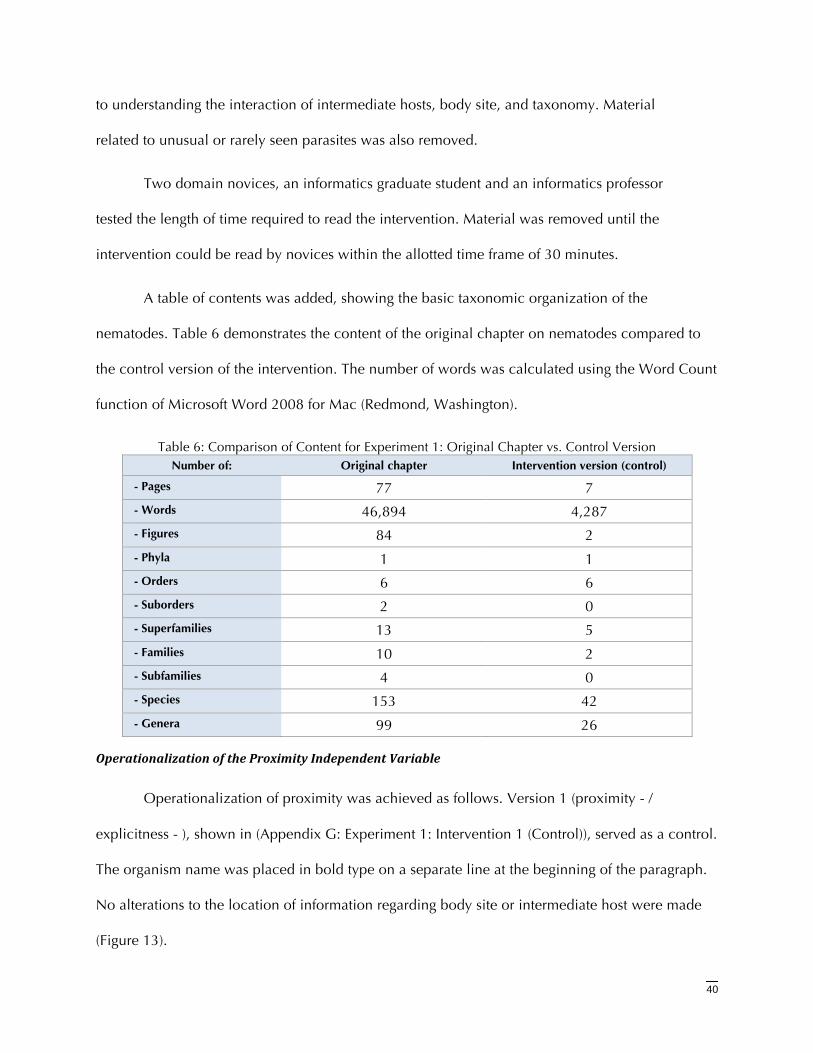
40
to understanding the interaction of intermediate hosts, body site, and taxonomy. Material
related to unusual or rarely seen parasites was also removed.
Two domain novices, an informatics graduate student and an informatics professor
tested the length of time required to read the intervention. Material was removed until the
intervention could be read by novices within the allotted time frame of 30 minutes.
A table of contents was added, showing the basic taxonomic organization of the
nematodes. Table 6 demonstrates the content of the original chapter on nematodes compared to
the control version of the intervention. The number of words was calculated using the Word Count
function of Microsoft Word 2008 for Mac (Redmond, Washington).
Table 6: Comparison of Content for Experiment 1: Original Chapter vs. Control Version Number of: Original chapter Intervention version (control)
- Pages 77 7 - Words 46,894 4,287 - Figures 84 2
- Phyla 1 1 - Orders 6 6 - Suborders 2 0 - Superfamilies 13 5
- Families 10 2 - Subfamilies 4 0 - Species 153 42
- Genera 99 26
OperationalizationoftheProximityIndependentVariable
Operationalization of proximity was achieved as follows. Version 1 (proximity - /
explicitness - ), shown in (Appendix G: Experiment 1: Intervention 1 (Control)), served as a control.
The organism name was placed in bold type on a separate line at the beginning of the paragraph.
No alterations to the location of information regarding body site or intermediate host were made
(Figure 13).
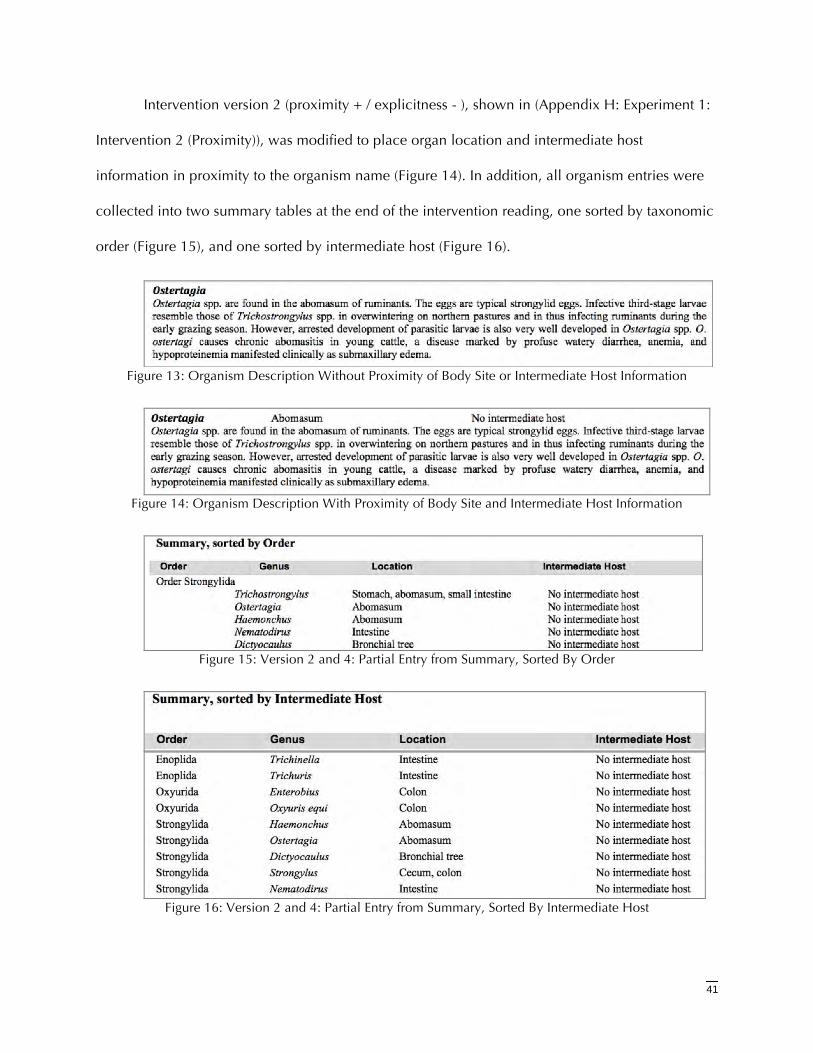
41
Intervention version 2 (proximity + / explicitness - ), shown in (Appendix H: Experiment 1:
Intervention 2 (Proximity)), was modified to place organ location and intermediate host
information in proximity to the organism name (Figure 14). In addition, all organism entries were
collected into two summary tables at the end of the intervention reading, one sorted by taxonomic
order (Figure 15), and one sorted by intermediate host (Figure 16).
Figure 13: Organism Description Without Proximity of Body Site or Intermediate Host Information
Figure 14: Organism Description With Proximity of Body Site and Intermediate Host Information
Figure 15: Version 2 and 4: Partial Entry from Summary, Sorted By Order
Figure 16: Version 2 and 4: Partial Entry from Summary, Sorted By Intermediate Host
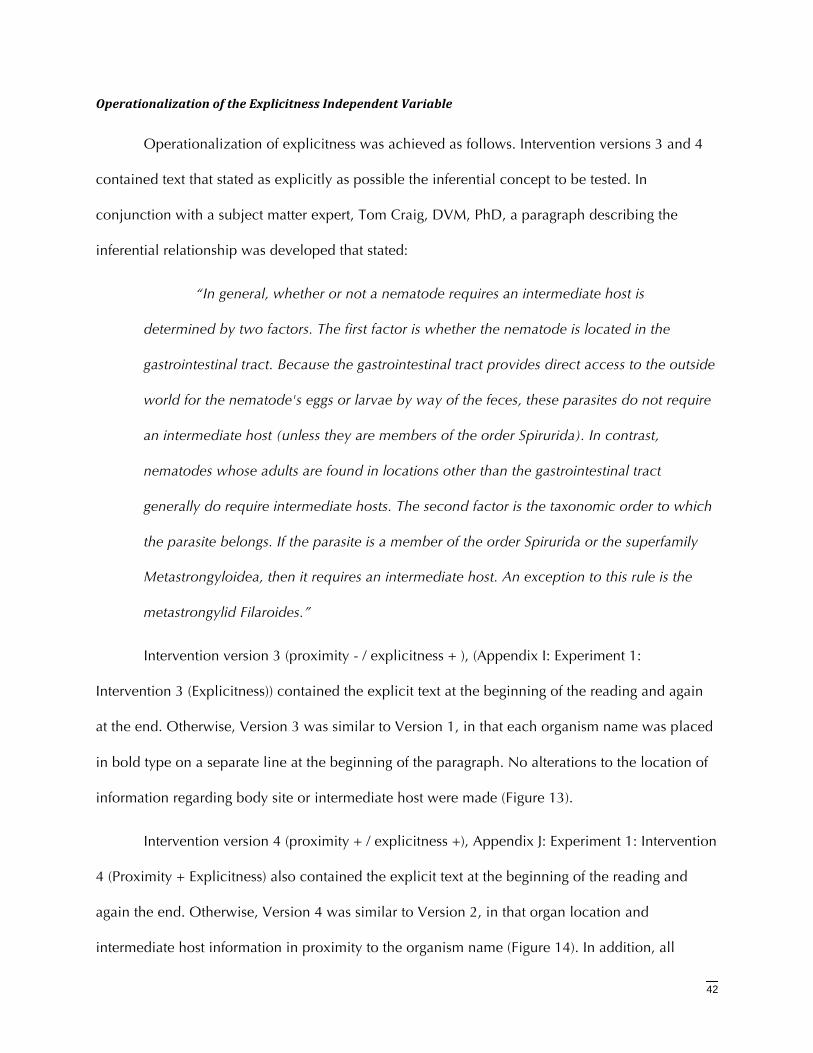
42
OperationalizationoftheExplicitnessIndependentVariable
Operationalization of explicitness was achieved as follows. Intervention versions 3 and 4
contained text that stated as explicitly as possible the inferential concept to be tested. In
conjunction with a subject matter expert, Tom Craig, DVM, PhD, a paragraph describing the
inferential relationship was developed that stated:
“In general, whether or not a nematode requires an intermediate host is
determined by two factors. The first factor is whether the nematode is located in the
gastrointestinal tract. Because the gastrointestinal tract provides direct access to the outside
world for the nematode's eggs or larvae by way of the feces, these parasites do not require
an intermediate host (unless they are members of the order Spirurida). In contrast,
nematodes whose adults are found in locations other than the gastrointestinal tract
generally do require intermediate hosts. The second factor is the taxonomic order to which
the parasite belongs. If the parasite is a member of the order Spirurida or the superfamily
Metastrongyloidea, then it requires an intermediate host. An exception to this rule is the
metastrongylid Filaroides.”
Intervention version 3 (proximity - / explicitness + ), (Appendix I: Experiment 1:
Intervention 3 (Explicitness)) contained the explicit text at the beginning of the reading and again
at the end. Otherwise, Version 3 was similar to Version 1, in that each organism name was placed
in bold type on a separate line at the beginning of the paragraph. No alterations to the location of
information regarding body site or intermediate host were made (Figure 13).
Intervention version 4 (proximity + / explicitness +), Appendix J: Experiment 1: Intervention
4 (Proximity + Explicitness) also contained the explicit text at the beginning of the reading and
again the end. Otherwise, Version 4 was similar to Version 2, in that organ location and
intermediate host information in proximity to the organism name (Figure 14). In addition, all
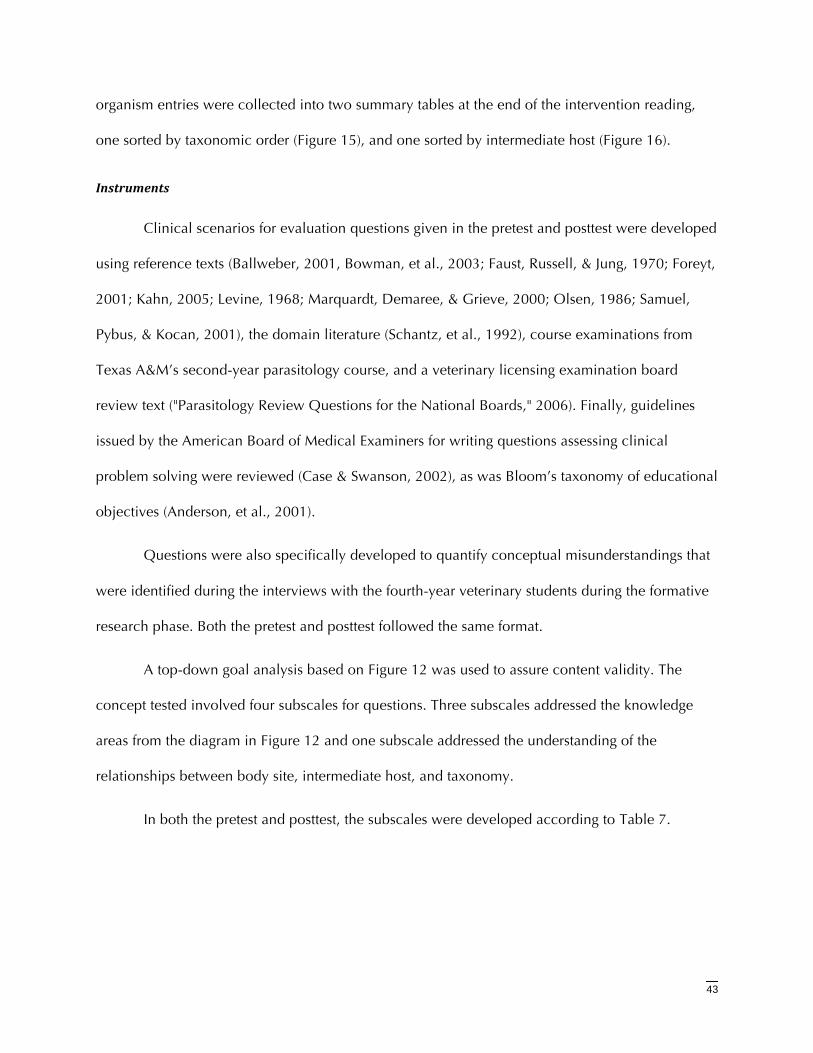
43
organism entries were collected into two summary tables at the end of the intervention reading,
one sorted by taxonomic order (Figure 15), and one sorted by intermediate host (Figure 16).
Instruments
Clinical scenarios for evaluation questions given in the pretest and posttest were developed
using reference texts (Ballweber, 2001, Bowman, et al., 2003; Faust, Russell, & Jung, 1970; Foreyt,
2001; Kahn, 2005; Levine, 1968; Marquardt, Demaree, & Grieve, 2000; Olsen, 1986; Samuel,
Pybus, & Kocan, 2001), the domain literature (Schantz, et al., 1992), course examinations from
Texas A&M’s second-year parasitology course, and a veterinary licensing examination board
review text ("Parasitology Review Questions for the National Boards," 2006). Finally, guidelines
issued by the American Board of Medical Examiners for writing questions assessing clinical
problem solving were reviewed (Case & Swanson, 2002), as was Bloom’s taxonomy of educational
objectives (Anderson, et al., 2001).
Questions were also specifically developed to quantify conceptual misunderstandings that
were identified during the interviews with the fourth-year veterinary students during the formative
research phase. Both the pretest and posttest followed the same format.
A top-down goal analysis based on Figure 12 was used to assure content validity. The
concept tested involved four subscales for questions. Three subscales addressed the knowledge
areas from the diagram in Figure 12 and one subscale addressed the understanding of the
relationships between body site, intermediate host, and taxonomy.
In both the pretest and posttest, the subscales were developed according to Table 7.
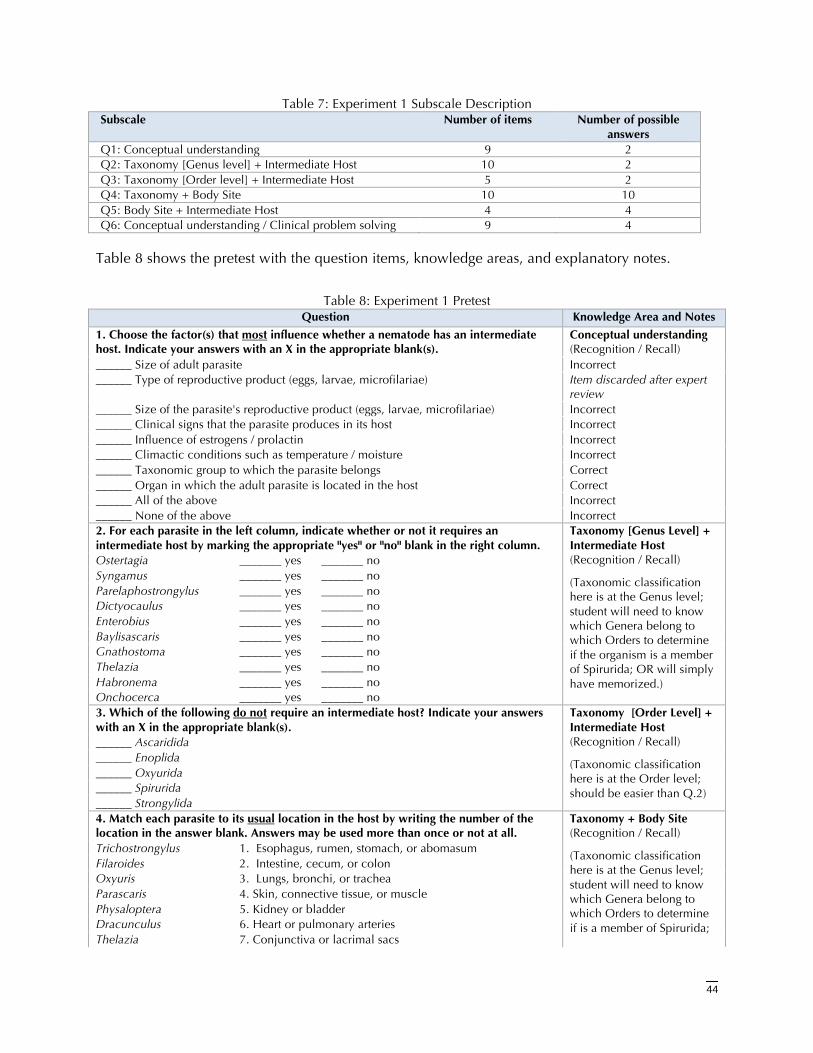
44
Table 7: Experiment 1 Subscale Description Subscale Number of items Number of possible
answers Q1: Conceptual understanding 9 2 Q2: Taxonomy [Genus level] + Intermediate Host 10 2 Q3: Taxonomy [Order level] + Intermediate Host 5 2 Q4: Taxonomy + Body Site 10 10 Q5: Body Site + Intermediate Host 4 4 Q6: Conceptual understanding / Clinical problem solving 9 4
Table 8 shows the pretest with the question items, knowledge areas, and explanatory notes.
Table 8: Experiment 1 Pretest Question Knowledge Area and Notes
1. Choose the factor(s) that most influence whether a nematode has an intermediate host. Indicate your answers with an X in the appropriate blank(s).
Conceptual understanding (Recognition / Recall)
______ Size of adult parasite Incorrect ______ Type of reproductive product (eggs, larvae, microfilariae) Item discarded after expert
review ______ Size of the parasite's reproductive product (eggs, larvae, microfilariae) Incorrect ______ Clinical signs that the parasite produces in its host Incorrect ______ Influence of estrogens / prolactin Incorrect ______ Climactic conditions such as temperature / moisture Incorrect ______ Taxonomic group to which the parasite belongs Correct ______ Organ in which the adult parasite is located in the host Correct ______ All of the above Incorrect ______ None of the above Incorrect 2. For each parasite in the left column, indicate whether or not it requires an intermediate host by marking the appropriate "yes" or "no" blank in the right column. Ostertagia _______ yes _______ no Syngamus _______ yes _______ no Parelaphostrongylus _______ yes _______ no Dictyocaulus _______ yes _______ no Enterobius _______ yes _______ no Baylisascaris _______ yes _______ no Gnathostoma _______ yes _______ no Thelazia _______ yes _______ no Habronema _______ yes _______ no Onchocerca _______ yes _______ no
Taxonomy [Genus Level] + Intermediate Host (Recognition / Recall)
(Taxonomic classification here is at the Genus level; student will need to know which Genera belong to which Orders to determine if the organism is a member of Spirurida; OR will simply have memorized.)
3. Which of the following do not require an intermediate host? Indicate your answers with an X in the appropriate blank(s). ______ Ascaridida ______ Enoplida ______ Oxyurida ______ Spirurida ______ Strongylida
Taxonomy [Order Level] + Intermediate Host (Recognition / Recall)
(Taxonomic classification here is at the Order level; should be easier than Q.2)
4. Match each parasite to its usual location in the host by writing the number of the location in the answer blank. Answers may be used more than once or not at all. Trichostrongylus 1. Esophagus, rumen, stomach, or abomasum Filaroides 2. Intestine, cecum, or colon Oxyuris 3. Lungs, bronchi, or trachea Parascaris 4. Skin, connective tissue, or muscle Physaloptera 5. Kidney or bladder Dracunculus 6. Heart or pulmonary arteries Thelazia 7. Conjunctiva or lacrimal sacs
Taxonomy + Body Site (Recognition / Recall)
(Taxonomic classification here is at the Genus level; student will need to know which Genera belong to which Orders to determine if is a member of Spirurida;
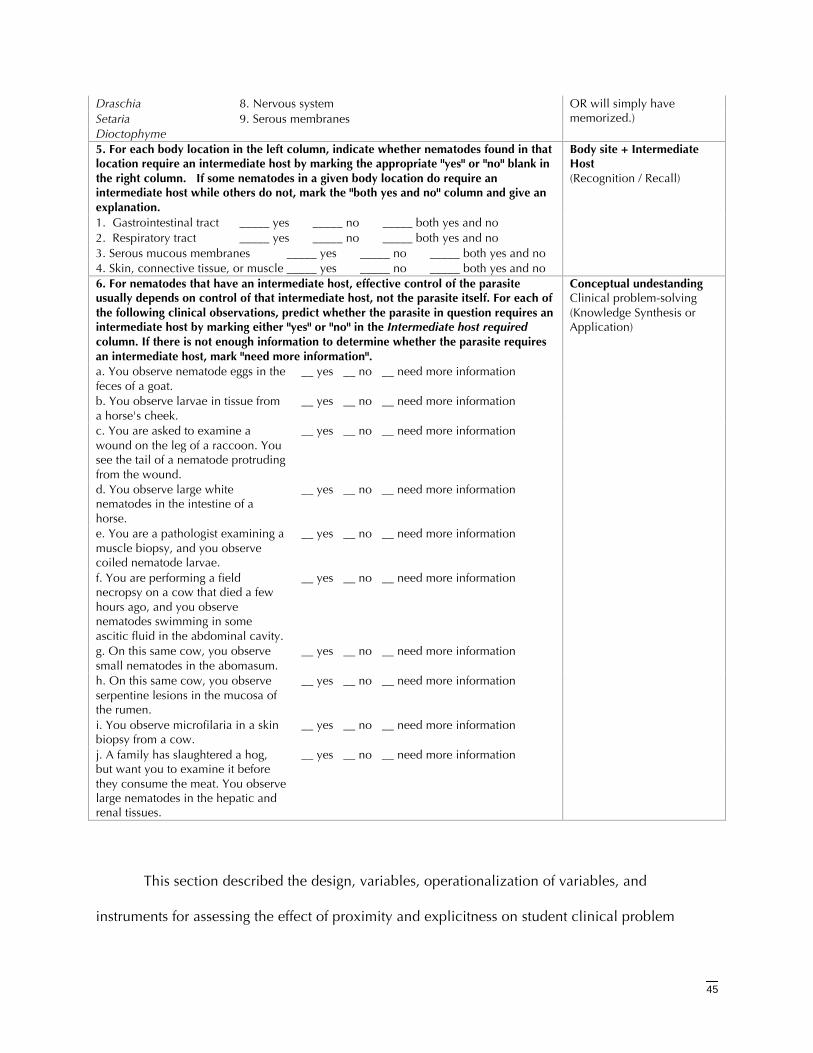
45
Draschia 8. Nervous system Setaria 9. Serous membranes Dioctophyme
OR will simply have memorized.)
5. For each body location in the left column, indicate whether nematodes found in that location require an intermediate host by marking the appropriate "yes" or "no" blank in the right column. If some nematodes in a given body location do require an intermediate host while others do not, mark the "both yes and no" column and give an explanation. 1. Gastrointestinal tract _____ yes _____ no _____ both yes and no 2. Respiratory tract _____ yes _____ no _____ both yes and no 3. Serous mucous membranes _____ yes _____ no _____ both yes and no 4. Skin, connective tissue, or muscle _____ yes _____ no _____ both yes and no
Body site + Intermediate Host (Recognition / Recall)
6. For nematodes that have an intermediate host, effective control of the parasite usually depends on control of that intermediate host, not the parasite itself. For each of the following clinical observations, predict whether the parasite in question requires an intermediate host by marking either "yes" or "no" in the Intermediate host required column. If there is not enough information to determine whether the parasite requires an intermediate host, mark "need more information". a. You observe nematode eggs in the feces of a goat.
__ yes __ no __ need more information
b. You observe larvae in tissue from a horse's cheek.
__ yes __ no __ need more information
c. You are asked to examine a wound on the leg of a raccoon. You see the tail of a nematode protruding from the wound.
__ yes __ no __ need more information
d. You observe large white nematodes in the intestine of a horse.
__ yes __ no __ need more information
e. You are a pathologist examining a muscle biopsy, and you observe coiled nematode larvae.
__ yes __ no __ need more information
f. You are performing a field necropsy on a cow that died a few hours ago, and you observe nematodes swimming in some ascitic fluid in the abdominal cavity.
__ yes __ no __ need more information
g. On this same cow, you observe small nematodes in the abomasum.
__ yes __ no __ need more information
h. On this same cow, you observe serpentine lesions in the mucosa of the rumen.
__ yes __ no __ need more information
i. You observe microfilaria in a skin biopsy from a cow.
__ yes __ no __ need more information
j. A family has slaughtered a hog, but want you to examine it before they consume the meat. You observe large nematodes in the hepatic and renal tissues.
__ yes __ no __ need more information
Conceptual undestanding Clinical problem-solving (Knowledge Synthesis or Application)
This section described the design, variables, operationalization of variables, and
instruments for assessing the effect of proximity and explicitness on student clinical problem

46
solving (experiment 1). The next section describes the design, variables, operationalization of
variables, and instruments for assessing the effect of representation and proximity on student
clinical problem solving (experiment 2).
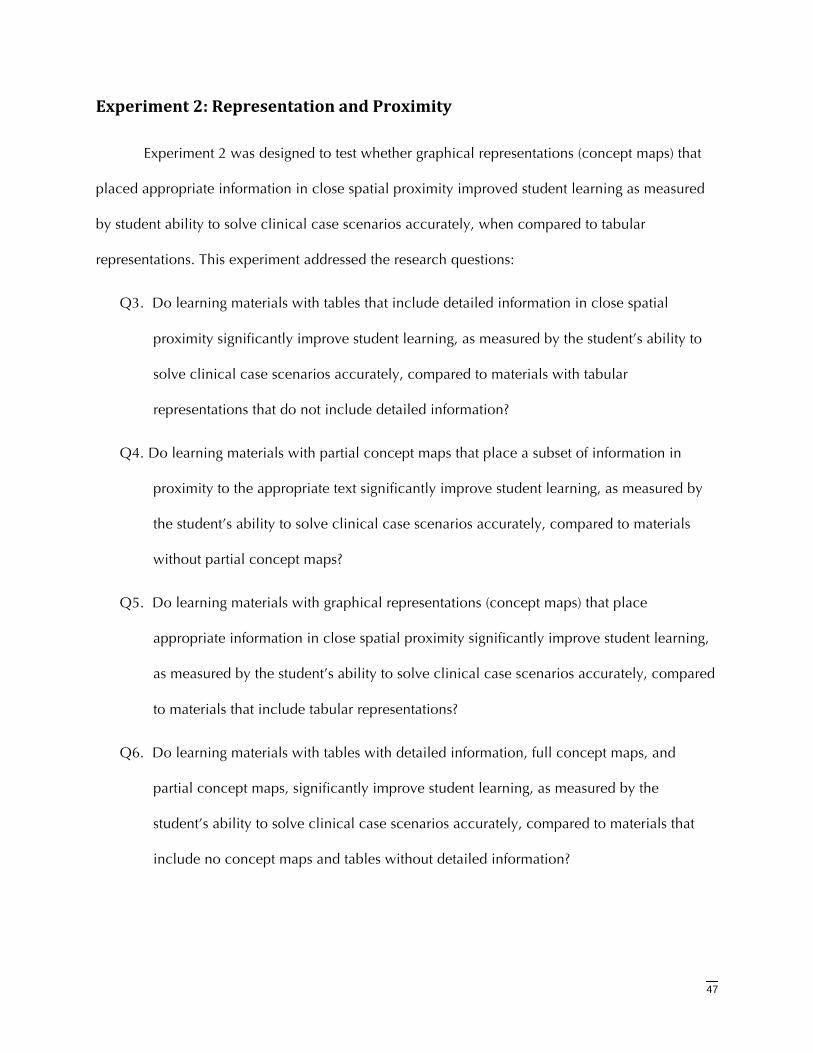
47
Experiment2:RepresentationandProximity
Experiment 2 was designed to test whether graphical representations (concept maps) that
placed appropriate information in close spatial proximity improved student learning as measured
by student ability to solve clinical case scenarios accurately, when compared to tabular
representations. This experiment addressed the research questions:
Q3. Do learning materials with tables that include detailed information in close spatial
proximity significantly improve student learning, as measured by the student’s ability to
solve clinical case scenarios accurately, compared to materials with tabular
representations that do not include detailed information?
Q4. Do learning materials with partial concept maps that place a subset of information in
proximity to the appropriate text significantly improve student learning, as measured by
the student’s ability to solve clinical case scenarios accurately, compared to materials
without partial concept maps?
Q5. Do learning materials with graphical representations (concept maps) that place
appropriate information in close spatial proximity significantly improve student learning,
as measured by the student’s ability to solve clinical case scenarios accurately, compared
to materials that include tabular representations?
Q6. Do learning materials with tables with detailed information, full concept maps, and
partial concept maps, significantly improve student learning, as measured by the
student’s ability to solve clinical case scenarios accurately, compared to materials that
include no concept maps and tables without detailed information?
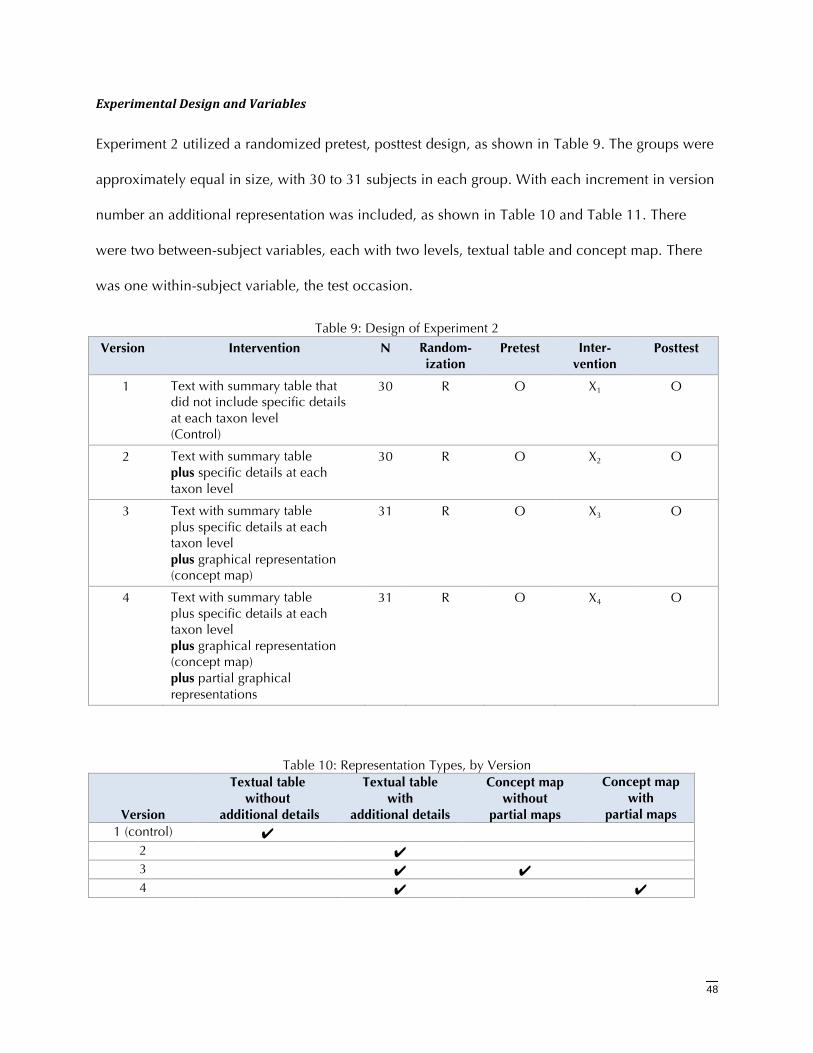
48
ExperimentalDesignandVariables
Experiment 2 utilized a randomized pretest, posttest design, as shown in Table 9. The groups were
approximately equal in size, with 30 to 31 subjects in each group. With each increment in version
number an additional representation was included, as shown in Table 10 and Table 11. There
were two between-subject variables, each with two levels, textual table and concept map. There
was one within-subject variable, the test occasion.
Table 9: Design of Experiment 2
Version Intervention N Random-ization
Pretest Inter-vention
Posttest
1 Text with summary table that did not include specific details at each taxon level (Control)
30 R O X1 O
2 Text with summary table plus specific details at each taxon level
30 R O X2 O
3 Text with summary table plus specific details at each taxon level plus graphical representation (concept map)
31 R O X3 O
4 Text with summary table plus specific details at each taxon level plus graphical representation (concept map) plus partial graphical representations
31 R O X4 O
Table 10: Representation Types, by Version
Version
Textual table without
additional details
Textual table with
additional details
Concept map without
partial maps
Concept map with
partial maps 1 (control) ✔
2 ✔ 3 ✔ ✔ 4 ✔ ✔
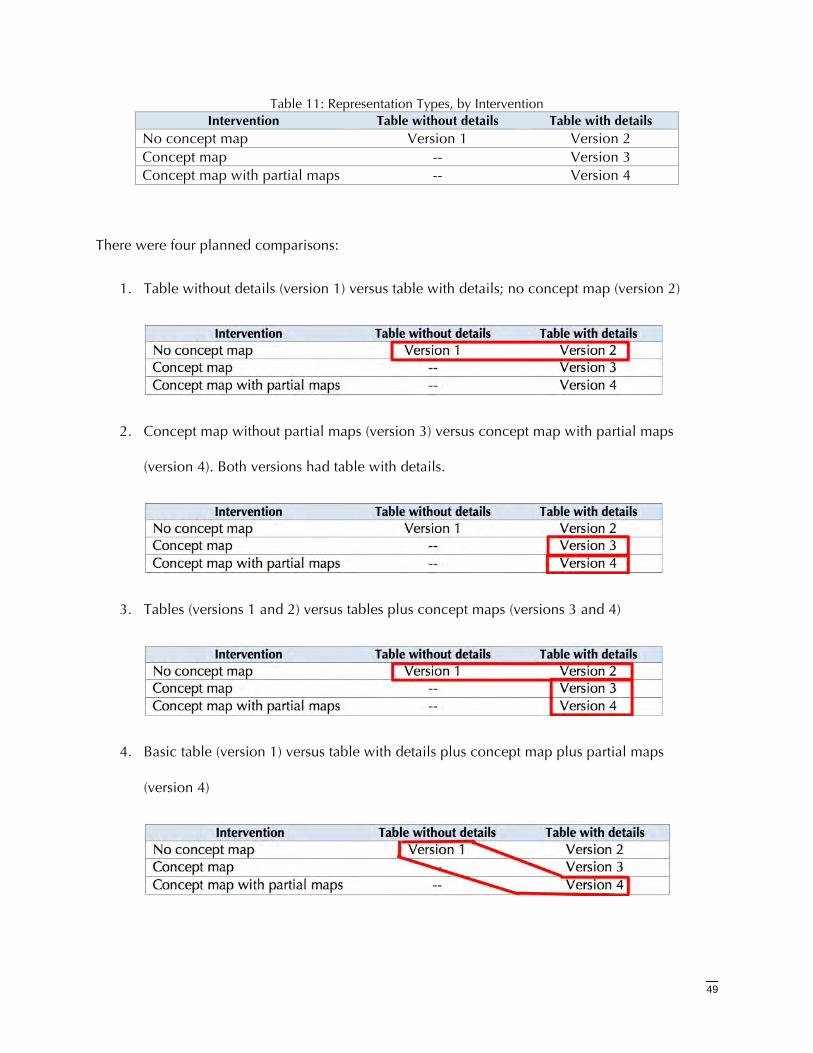
49
Table 11: Representation Types, by Intervention Intervention Table without details Table with details
No concept map Version 1 Version 2 Concept map -- Version 3 Concept map with partial maps -- Version 4
There were four planned comparisons:
1. Table without details (version 1) versus table with details; no concept map (version 2)
2. Concept map without partial maps (version 3) versus concept map with partial maps
(version 4). Both versions had table with details.
3. Tables (versions 1 and 2) versus tables plus concept maps (versions 3 and 4)
4. Basic table (version 1) versus table with details plus concept map plus partial maps
(version 4)
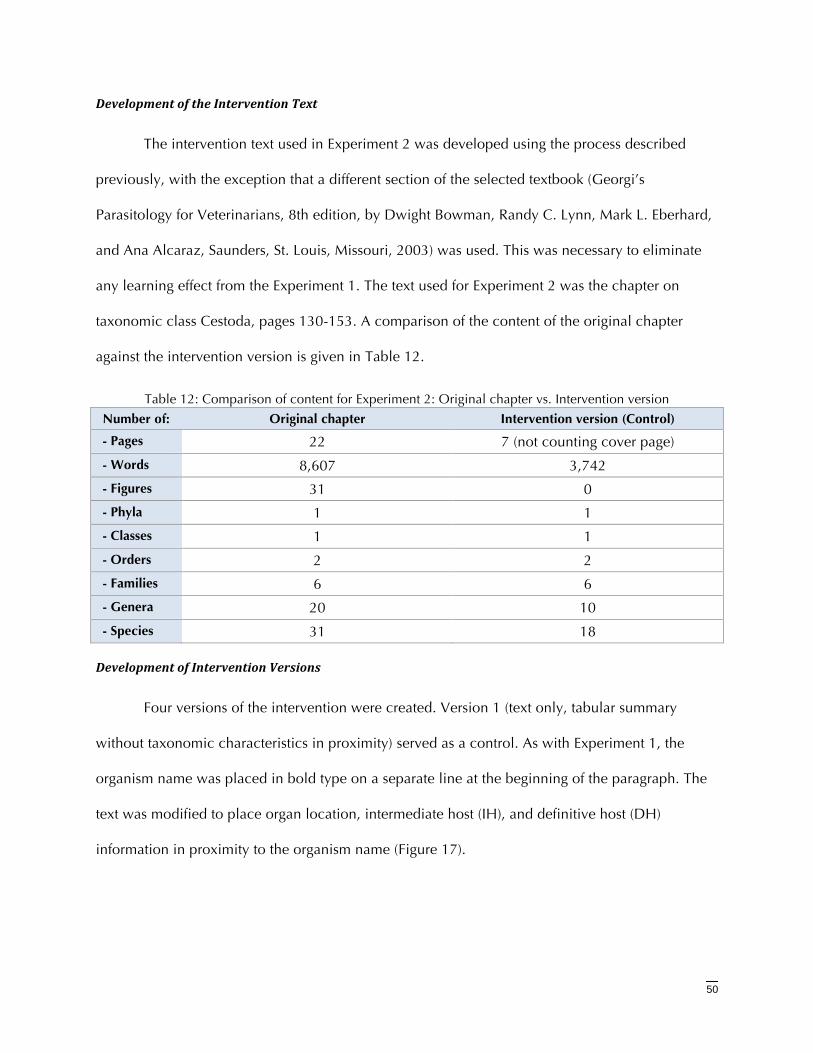
50
DevelopmentoftheInterventionText
The intervention text used in Experiment 2 was developed using the process described
previously, with the exception that a different section of the selected textbook (Georgi’s
Parasitology for Veterinarians, 8th edition, by Dwight Bowman, Randy C. Lynn, Mark L. Eberhard,
and Ana Alcaraz, Saunders, St. Louis, Missouri, 2003) was used. This was necessary to eliminate
any learning effect from the Experiment 1. The text used for Experiment 2 was the chapter on
taxonomic class Cestoda, pages 130-153. A comparison of the content of the original chapter
against the intervention version is given in Table 12.
Table 12: Comparison of content for Experiment 2: Original chapter vs. Intervention version
Number of: Original chapter Intervention version (Control)
- Pages 22 7 (not counting cover page)
- Words 8,607 3,742
- Figures 31 0
- Phyla 1 1
- Classes 1 1
- Orders 2 2
- Families 6 6
- Genera 20 10
- Species 31 18
DevelopmentofInterventionVersions
Four versions of the intervention were created. Version 1 (text only, tabular summary
without taxonomic characteristics in proximity) served as a control. As with Experiment 1, the
organism name was placed in bold type on a separate line at the beginning of the paragraph. The
text was modified to place organ location, intermediate host (IH), and definitive host (DH)
information in proximity to the organism name (Figure 17).
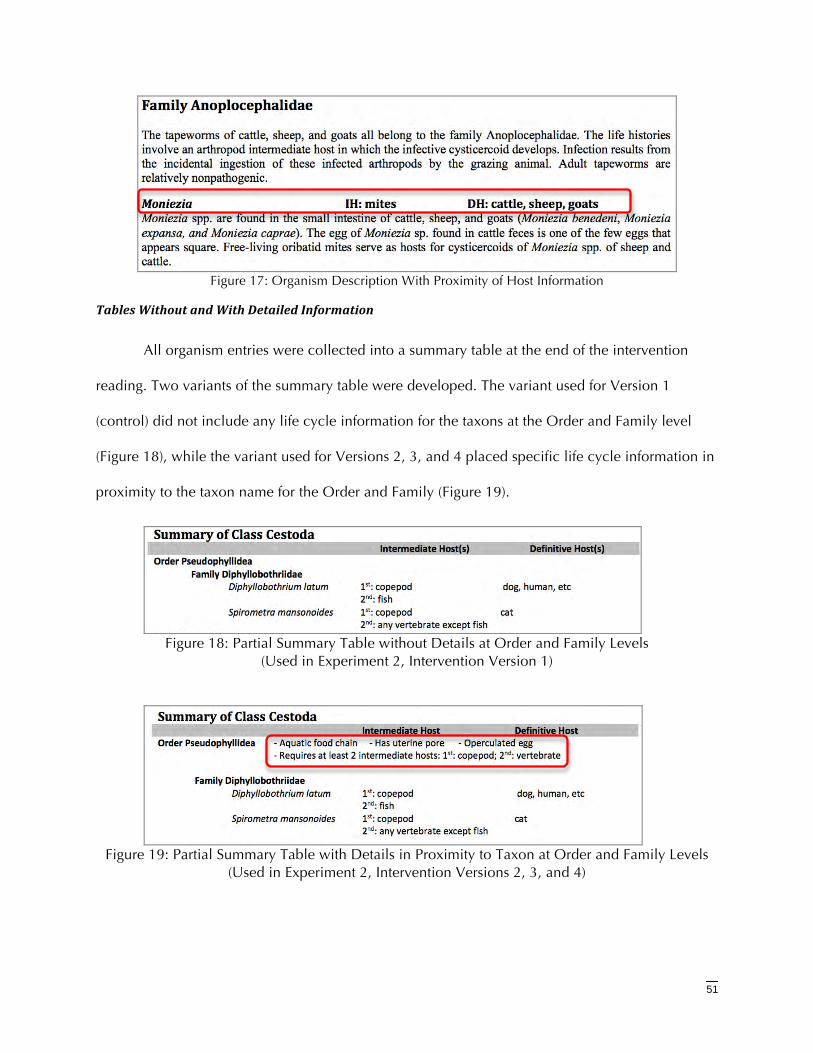
51
Figure 17: Organism Description With Proximity of Host Information
TablesWithoutandWithDetailedInformation
All organism entries were collected into a summary table at the end of the intervention
reading. Two variants of the summary table were developed. The variant used for Version 1
(control) did not include any life cycle information for the taxons at the Order and Family level
(Figure 18), while the variant used for Versions 2, 3, and 4 placed specific life cycle information in
proximity to the taxon name for the Order and Family (Figure 19).
Figure 18: Partial Summary Table without Details at Order and Family Levels
(Used in Experiment 2, Intervention Version 1)
Figure 19: Partial Summary Table with Details in Proximity to Taxon at Order and Family Levels
(Used in Experiment 2, Intervention Versions 2, 3, and 4)
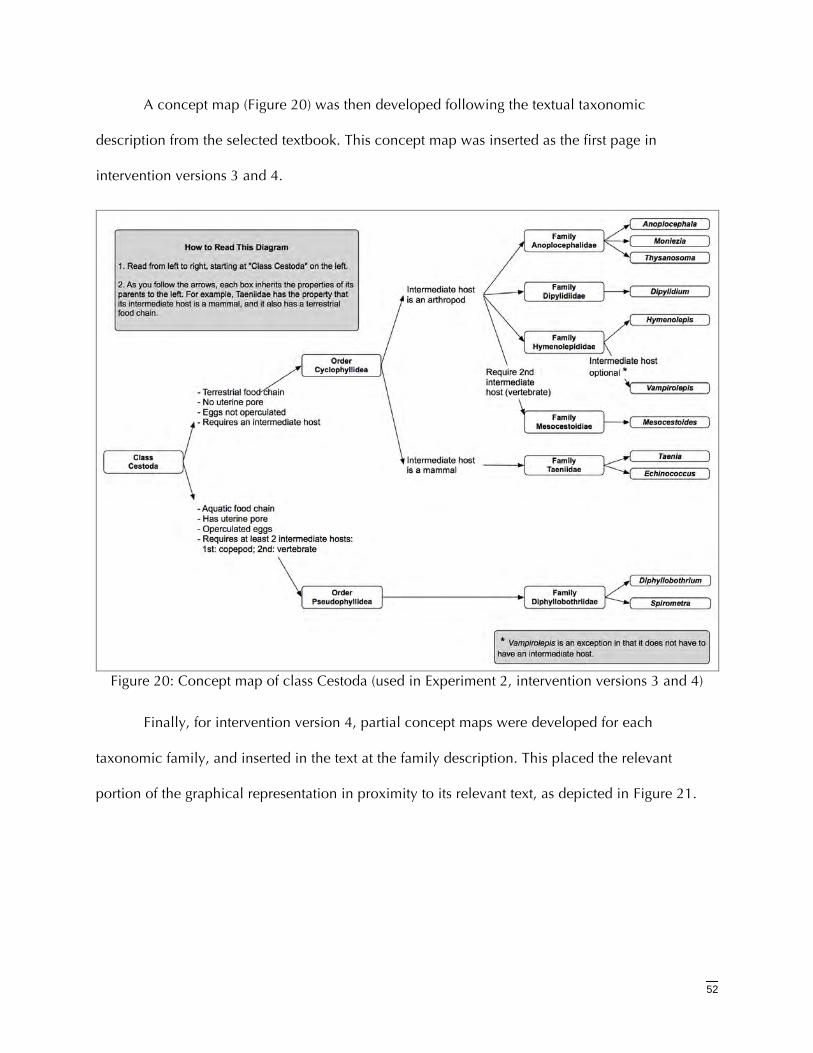
52
A concept map (Figure 20) was then developed following the textual taxonomic
description from the selected textbook. This concept map was inserted as the first page in
intervention versions 3 and 4.
Figure 20: Concept map of class Cestoda (used in Experiment 2, intervention versions 3 and 4)
Finally, for intervention version 4, partial concept maps were developed for each
taxonomic family, and inserted in the text at the family description. This placed the relevant
portion of the graphical representation in proximity to its relevant text, as depicted in Figure 21.
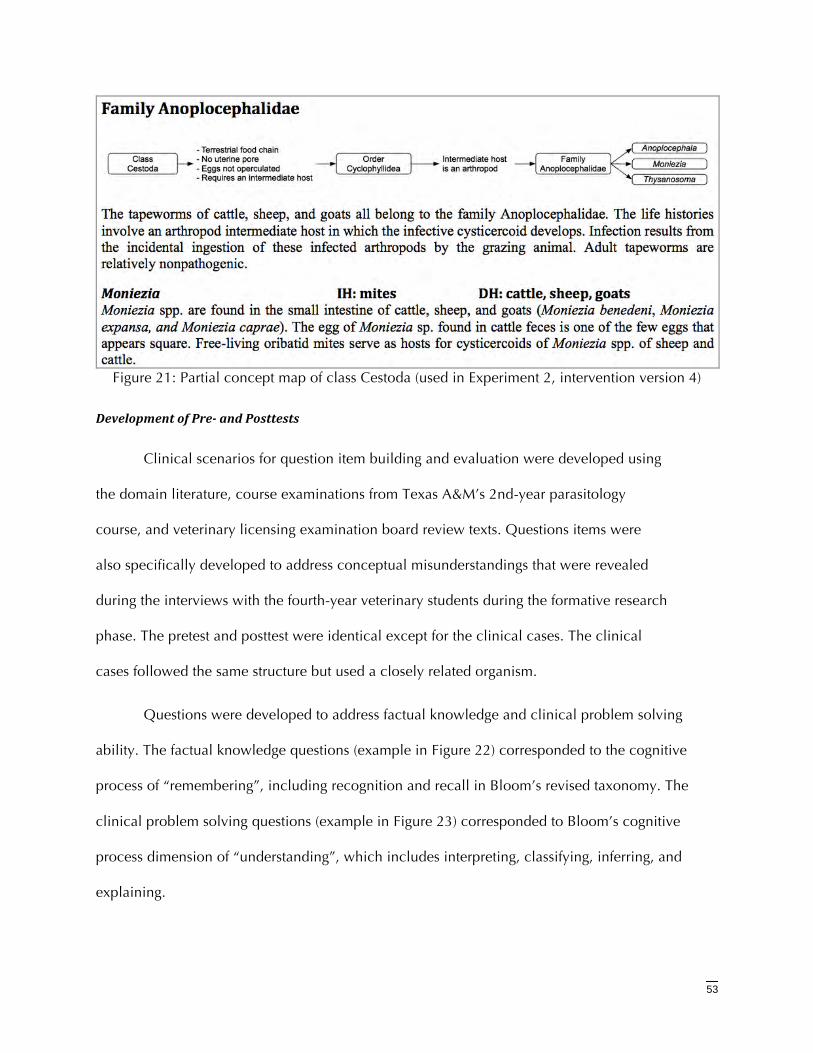
53
Figure 21: Partial concept map of class Cestoda (used in Experiment 2, intervention version 4)
DevelopmentofPreandPosttests
Clinical scenarios for question item building and evaluation were developed using
the domain literature, course examinations from Texas A&M’s 2nd-year parasitology
course, and veterinary licensing examination board review texts. Questions items were
also specifically developed to address conceptual misunderstandings that were revealed
during the interviews with the fourth-year veterinary students during the formative research
phase. The pretest and posttest were identical except for the clinical cases. The clinical
cases followed the same structure but used a closely related organism.
Questions were developed to address factual knowledge and clinical problem solving
ability. The factual knowledge questions (example in Figure 22) corresponded to the cognitive
process of “remembering”, including recognition and recall in Bloom’s revised taxonomy. The
clinical problem solving questions (example in Figure 23) corresponded to Bloom’s cognitive
process dimension of “understanding”, which includes interpreting, classifying, inferring, and
explaining.
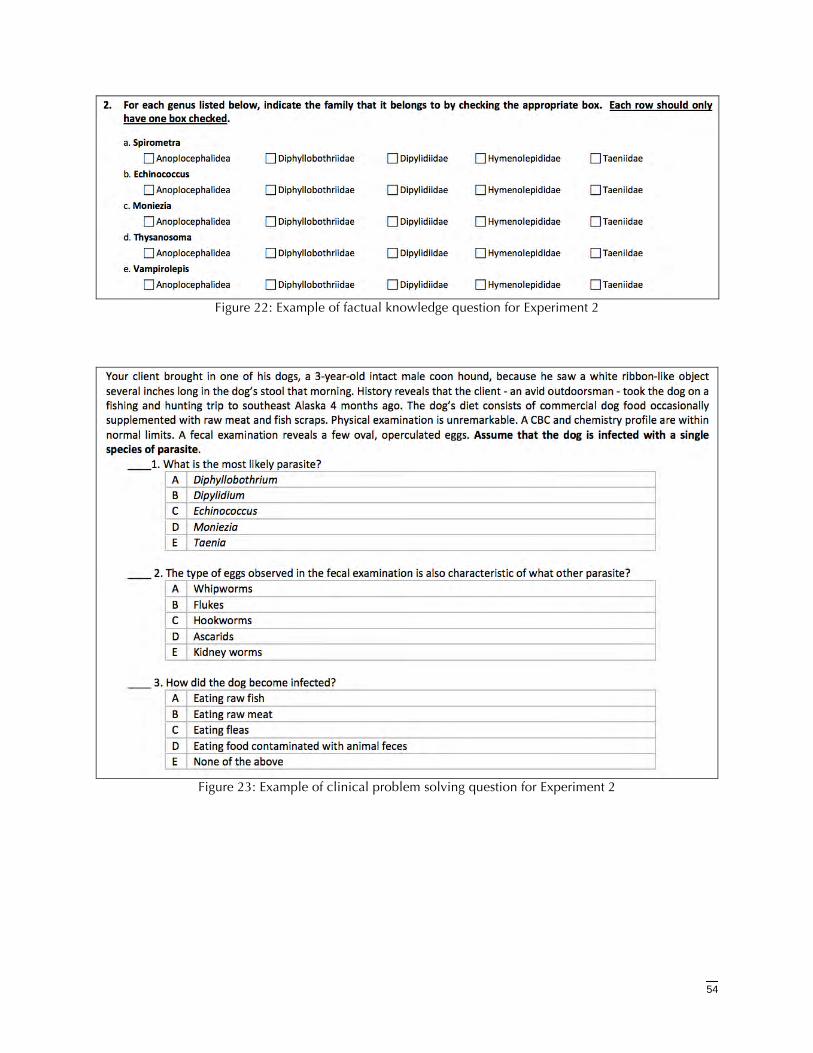
54
Figure 22: Example of factual knowledge question for Experiment 2
Figure 23: Example of clinical problem solving question for Experiment 2
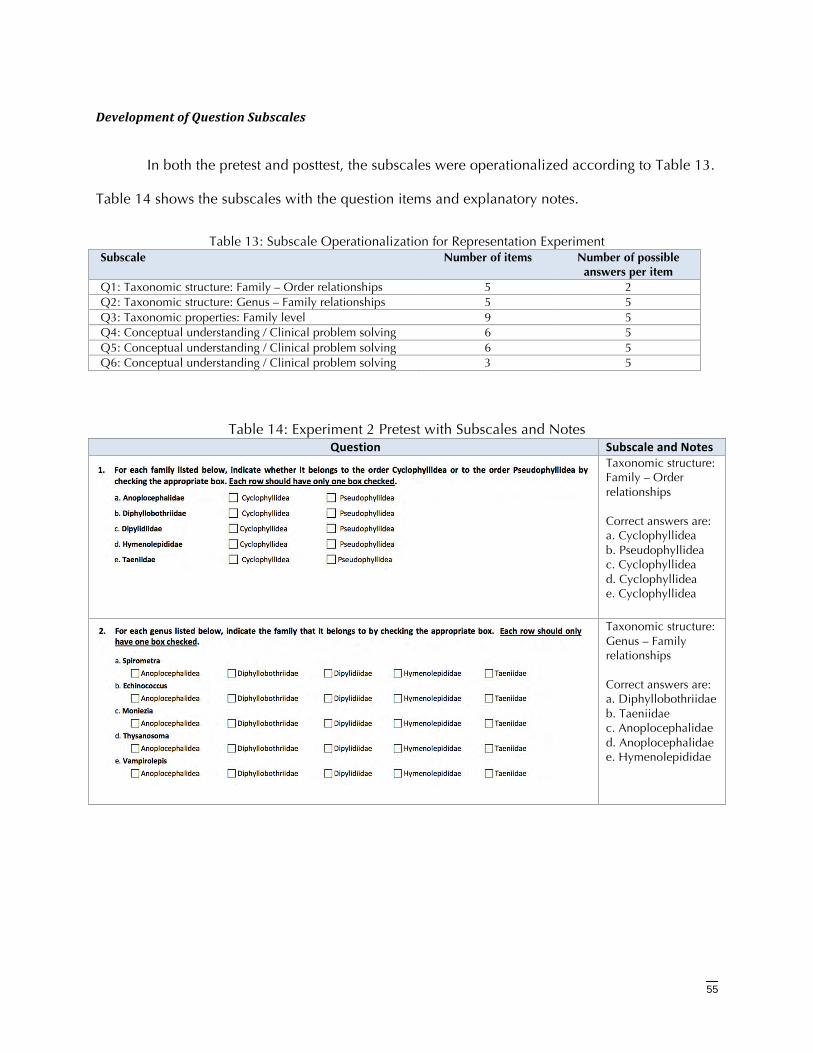
55
DevelopmentofQuestionSubscales
In both the pretest and posttest, the subscales were operationalized according to Table 13.
Table 14 shows the subscales with the question items and explanatory notes.
Table 13: Subscale Operationalization for Representation Experiment Subscale Number of items Number of possible
answers per item Q1: Taxonomic structure: Family – Order relationships 5 2 Q2: Taxonomic structure: Genus – Family relationships 5 5 Q3: Taxonomic properties: Family level 9 5 Q4: Conceptual understanding / Clinical problem solving 6 5 Q5: Conceptual understanding / Clinical problem solving 6 5 Q6: Conceptual understanding / Clinical problem solving 3 5
Table 14: Experiment 2 Pretest with Subscales and Notes Question SubscaleandNotes
Taxonomic structure: Family – Order relationships Correct answers are: a. Cyclophyllidea b. Pseudophyllidea c. Cyclophyllidea d. Cyclophyllidea e. Cyclophyllidea
Taxonomic structure: Genus – Family relationships Correct answers are: a. Diphyllobothriidae b. Taeniidae c. Anoplocephalidae d. Anoplocephalidae e. Hymenolepididae
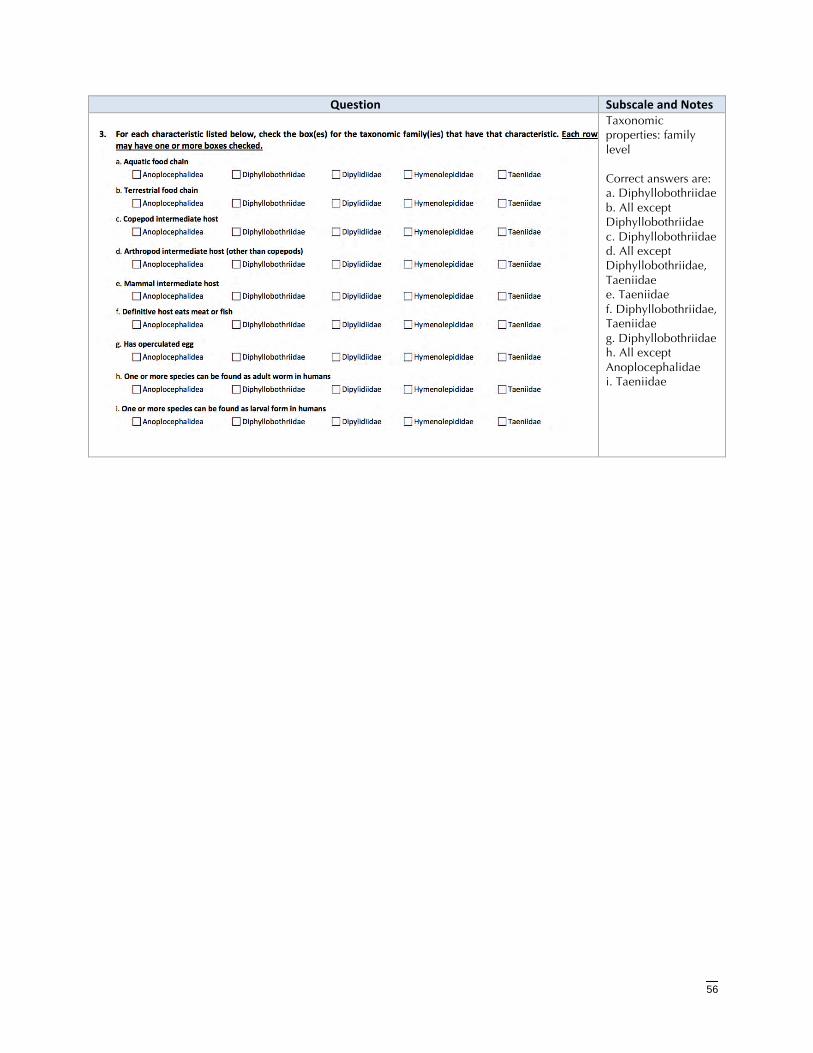
56
Question SubscaleandNotes
Taxonomic properties: family level Correct answers are: a. Diphyllobothriidae b. All except Diphyllobothriidae c. Diphyllobothriidae d. All except Diphyllobothriidae, Taeniidae e. Taeniidae f. Diphyllobothriidae, Taeniidae g. Diphyllobothriidae h. All except Anoplocephalidae i. Taeniidae
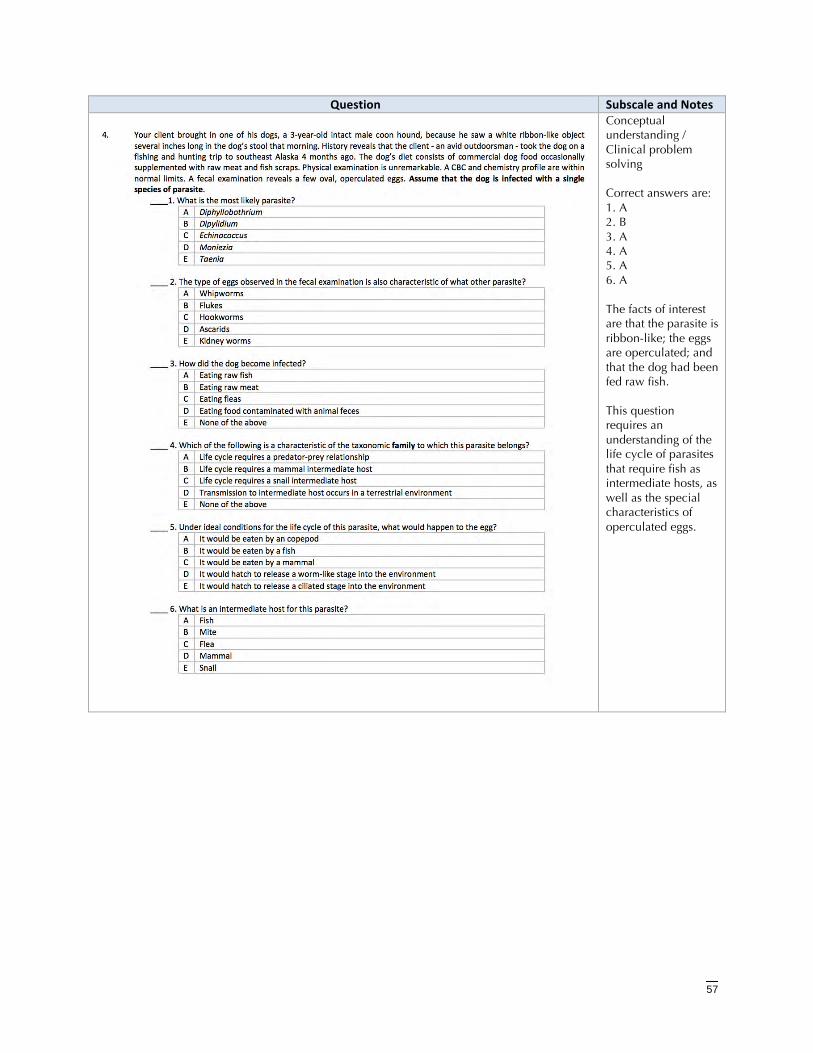
57
Question SubscaleandNotes
Conceptual understanding / Clinical problem solving Correct answers are: 1. A 2. B 3. A 4. A 5. A 6. A The facts of interest are that the parasite is ribbon-like; the eggs are operculated; and that the dog had been fed raw fish. This question requires an understanding of the life cycle of parasites that require fish as intermediate hosts, as well as the special characteristics of operculated eggs.
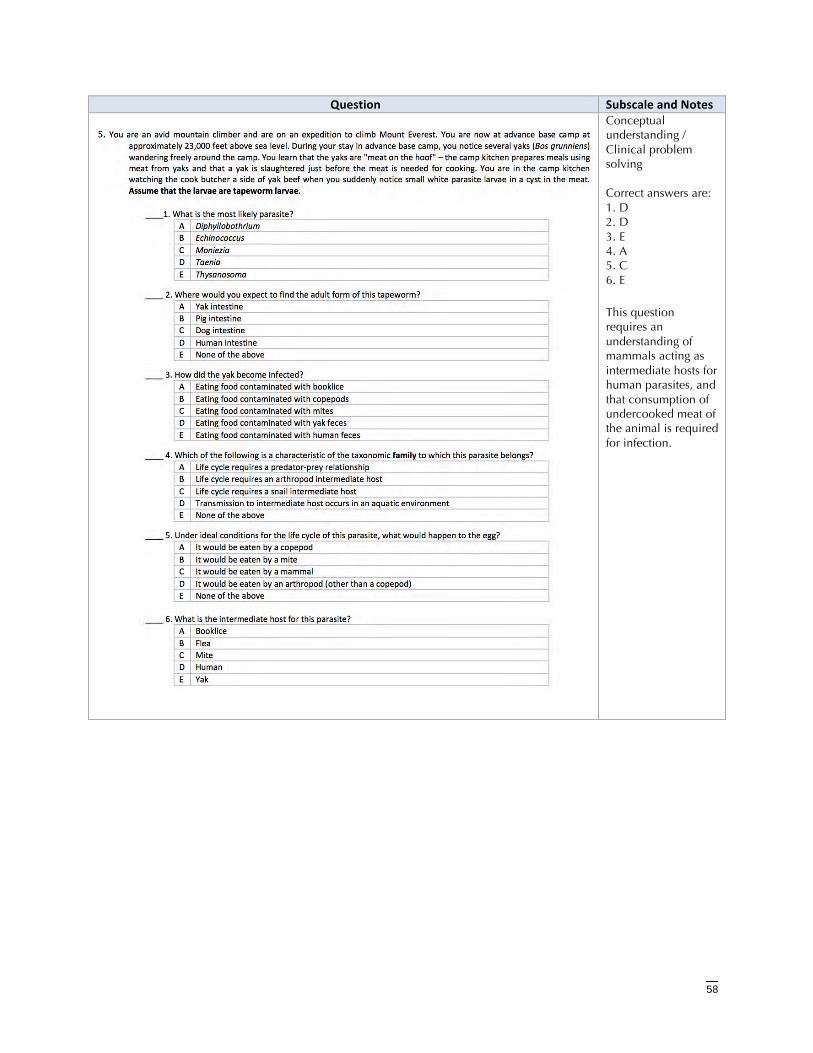
58
Question SubscaleandNotes
Conceptual understanding / Clinical problem solving Correct answers are: 1. D 2. D 3. E 4. A 5. C 6. E This question requires an understanding of mammals acting as intermediate hosts for human parasites, and that consumption of undercooked meat of the animal is required for infection.
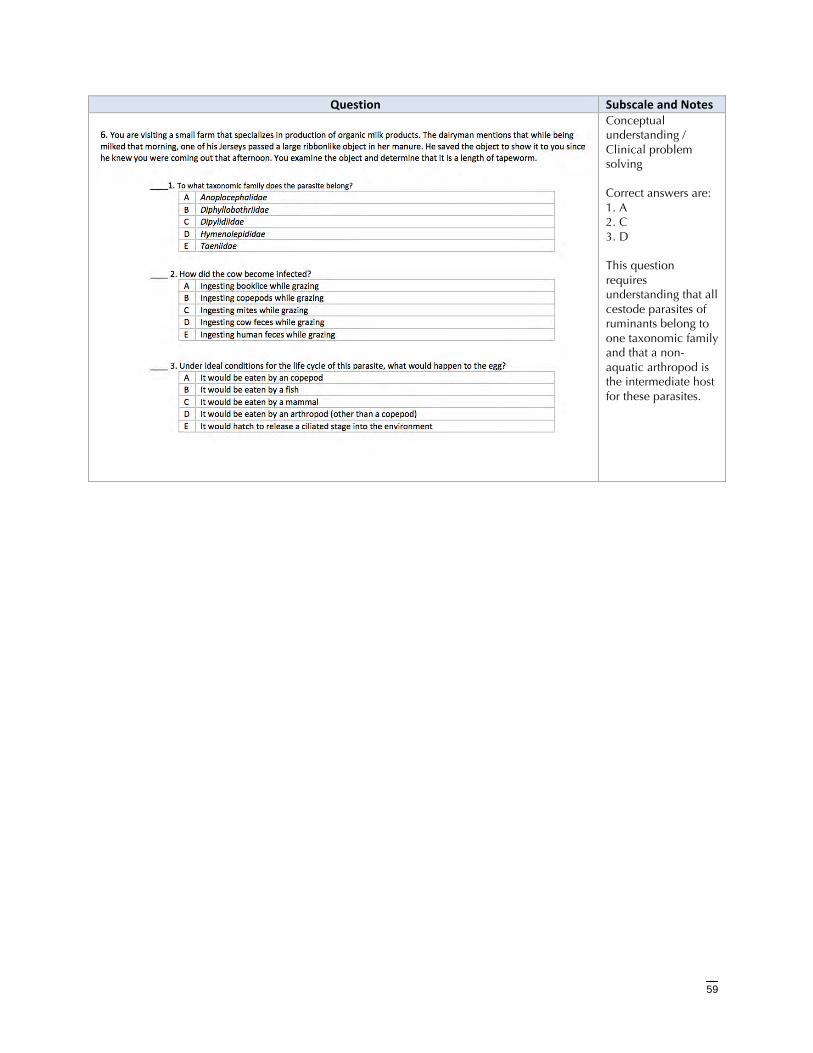
59
Question SubscaleandNotes
Conceptual understanding / Clinical problem solving Correct answers are: 1. A 2. C 3. D This question requires understanding that all cestode parasites of ruminants belong to one taxonomic family and that a non-aquatic arthropod is the intermediate host for these parasites.
60
AttitudeTowardTaxonomyQuestionnaire
The Attitude Toward Taxonomy questionnaire was intended to address the research question
“What are student attitudes and preconceptions concerning taxonomy?” The Health and
Psychosocial Instruments (HAPI) database, PubMed, and Google Scholar were searched, using the
keywords taxonomy, evolution, classification, and Linnaean, for any existing instruments that
could be used for assessing students’ attitudes toward the Linnaean taxonomy. No appropriate
instrument was found. Therefore, a semantic differential scale (Cohen, Manion, & Morrison, 2000)
consisting of eight questions regarding attitudes toward taxonomy (Appendix F: Attitude Toward
Taxonomy Questionnaire) was developed, based on the comments from the focus groups with the
fourth-year veterinary students. Two questions unrelated to taxonomy were also included.
DataCollectionProcedure
Subjects were randomly assigned to either the control group or to one of the three study
groups. Students were given the consent form to read and the primary investigator was present to
answer any questions. Upon completion of the consent process, the subjects were instructed to
place their consent forms into a 9x12 brown clasp envelope labeled with their subject number.
Subjects were then asked to complete the Attitude Toward Taxonomy Questionnaire (see
Appendix F, page 127). This was followed by the pretest (see Appendix, page 167). Subjects were
given 10 minutes to complete the pretest. The pretest consisted of recall and recognition questions
to assess factual recall, as well as short case vignettes intended to assess understanding and
knowledge synthesis.
After completing the pretest, students were instructed to place the test into their 9x12
brown envelope. They were then given the intervention study material appropriate for their
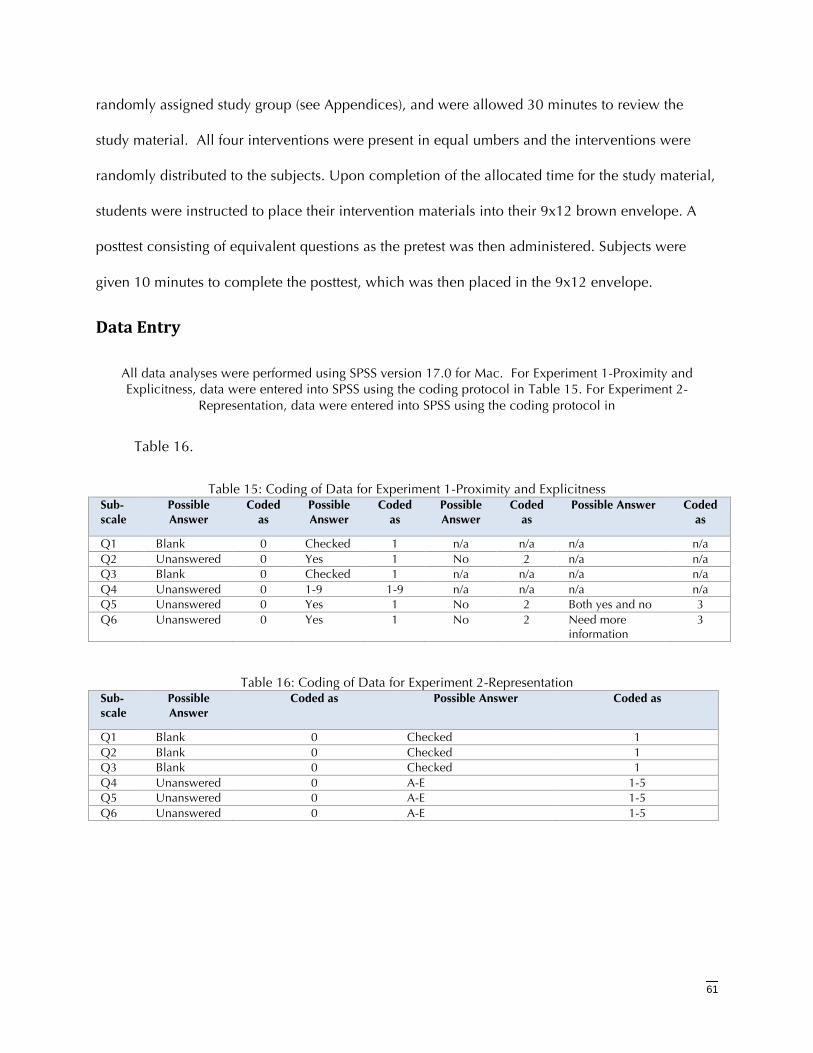
61
randomly assigned study group (see Appendices), and were allowed 30 minutes to review the
study material. All four interventions were present in equal umbers and the interventions were
randomly distributed to the subjects. Upon completion of the allocated time for the study material,
students were instructed to place their intervention materials into their 9x12 brown envelope. A
posttest consisting of equivalent questions as the pretest was then administered. Subjects were
given 10 minutes to complete the posttest, which was then placed in the 9x12 envelope.
DataEntry
All data analyses were performed using SPSS version 17.0 for Mac. For Experiment 1-Proximity and Explicitness, data were entered into SPSS using the coding protocol in Table 15. For Experiment 2-
Representation, data were entered into SPSS using the coding protocol in
Table 16.
Table 15: Coding of Data for Experiment 1-Proximity and Explicitness Sub-scale
Possible Answer
Coded as
Possible Answer
Coded as
Possible Answer
Coded as
Possible Answer Coded as
Q1 Blank 0 Checked 1 n/a n/a n/a n/a Q2 Unanswered 0 Yes 1 No 2 n/a n/a Q3 Blank 0 Checked 1 n/a n/a n/a n/a Q4 Unanswered 0 1-9 1-9 n/a n/a n/a n/a Q5 Unanswered 0 Yes 1 No 2 Both yes and no 3 Q6 Unanswered 0 Yes 1 No 2 Need more
information 3
Table 16: Coding of Data for Experiment 2-Representation Sub-scale
Possible Answer
Coded as Possible Answer Coded as
Q1 Blank 0 Checked 1 Q2 Blank 0 Checked 1 Q3 Blank 0 Checked 1 Q4 Unanswered 0 A-E 1-5 Q5 Unanswered 0 A-E 1-5 Q6 Unanswered 0 A-E 1-5
62
DataScreening
Accuracy of data entry was checked by double-checking the paper forms against the entered
data. The SPSS procedure FREQUENCIES was run to check for out of range values and that sample
sizes reported for each variable were correct.
DataScoring
An answer key for each pretest and posttest was completed by Dr. Thomas Craig of Texas
A&M University. Each result was then marked as correct or incorrect by using the SPSS command
RECODE to recode each answer into a new variable, named identically to the original variable but
with the suffix “_correct” added. Incorrect and blank or unanswered questions were coded as 0
and correct answers were coded as 1. Next, the SPSS procedure COMPUTE was used to calculate
the total score for each question; this value was stored in a new variable named according to the
following syntax: “Q#”_”Pre or Post”_Score.
Pretest or posttest questions that were left unanswered by the subject were treated in the
same manner as they would be on a regular examination; that is, they were assigned a value of 0
(zero) and counted as incorrect. For this reason, no adjustments were made to the data file for
missing data.
QualityControlofDataScoring
The large number of subjects and variables precluded manual checking after executing
RECODE and COMPUTE syntaxes. Therefore, quality control of these file manipulations was
performed by creating quality control (QC) subjects in the data file. The first QC subject contained
answers that matched the answer key. Ten additional QC subjects were added to contain
combinations of incorrect answers. The expected result after any recoding or computational
manipulation would be that QC subject one would maintain a 100% score, and that all other QC
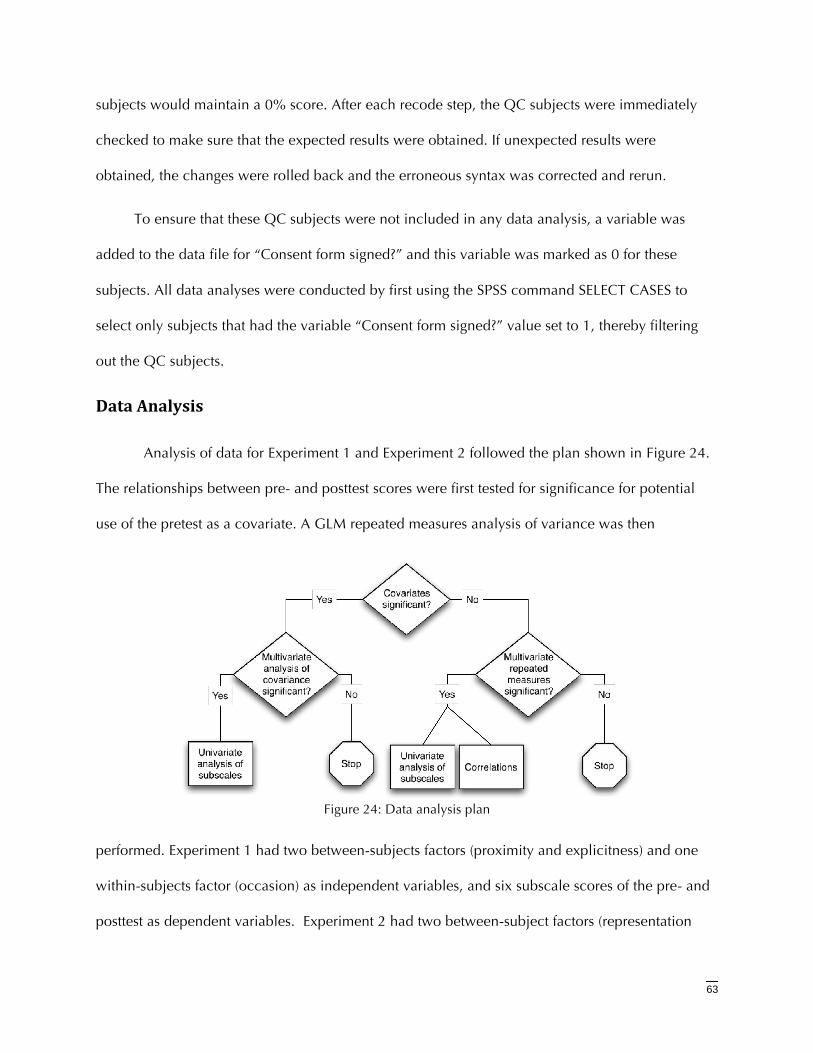
63
subjects would maintain a 0% score. After each recode step, the QC subjects were immediately
checked to make sure that the expected results were obtained. If unexpected results were
obtained, the changes were rolled back and the erroneous syntax was corrected and rerun.
To ensure that these QC subjects were not included in any data analysis, a variable was
added to the data file for “Consent form signed?” and this variable was marked as 0 for these
subjects. All data analyses were conducted by first using the SPSS command SELECT CASES to
select only subjects that had the variable “Consent form signed?” value set to 1, thereby filtering
out the QC subjects.
DataAnalysis
Analysis of data for Experiment 1 and Experiment 2 followed the plan shown in Figure 24.
The relationships between pre- and posttest scores were first tested for significance for potential
use of the pretest as a covariate. A GLM repeated measures analysis of variance was then
Figure 24: Data analysis plan
performed. Experiment 1 had two between-subjects factors (proximity and explicitness) and one
within-subjects factor (occasion) as independent variables, and six subscale scores of the pre- and
posttest as dependent variables. Experiment 2 had two between-subject factors (representation
64
and proximity) and one within-subjects factor (occasion) as independent variables, and four
subscale scores of the pre- and posttest as dependent variables. In both experiments, assessment of
correlations between subscales and univariate analysis of subscales was performed following any
statistically significant multivariate analysis result. The Fisher protected t strategy was used to
address alpha level inflation control (Carmer & Swanson, 1973).
Analysis of data from the Attitude Toward Taxonomy questionnaire was limited to
descriptive statistics. Number of subjects, mean, and standard deviation were reported along with
frequency histograms of percentage of responses.
Summary
This chapter described the design and methods for two experiments and one questionnaire
that were developed to answer research questions concerning proximity, explicitness, and
representation. This chapter also discussed the pilot research that informed the development of the
research questions and methods. The study subjects and procedures for data collection and data
entry were also described. The next chapter describes the data analysis and findings from the two
experiments and questionnaire.
65
ChapterIVDataAnalysisandFindings
Introduction
This chapter presents the data analysis and findings of Experiment 1, Experiment 2, and the
Attitude Toward Taxonomy questionnaire. The study subjects were a convenience sample of 125
second-year veterinary students in a large college of veterinary medicine in the state of Texas and
who matriculated in 2007. The study was conducted in the parasitology laboratory during
regularly scheduled course laboratory hours.
Experiment1:ProximityandExplicitnessinTextualRepresentation
ResearchQuestions
Experiment 1 was designed to address the following research questions:
Q1. Do textual representations that place appropriate information in close spatial
proximity improve student learning as measured by pretest/posttest scores when
compared to textual representations that do not place this information in close spatial
proximity?
Q2. Do textual representations that provide explicit information improve student learning
as measured by pretest/posttest scores when compared to textual representations that
do not provide explicit information?
To address these research questions, both multivariate repeated measures analysis and
multivariate analysis of covariance using pretest subscale scores as covariates were implemented.
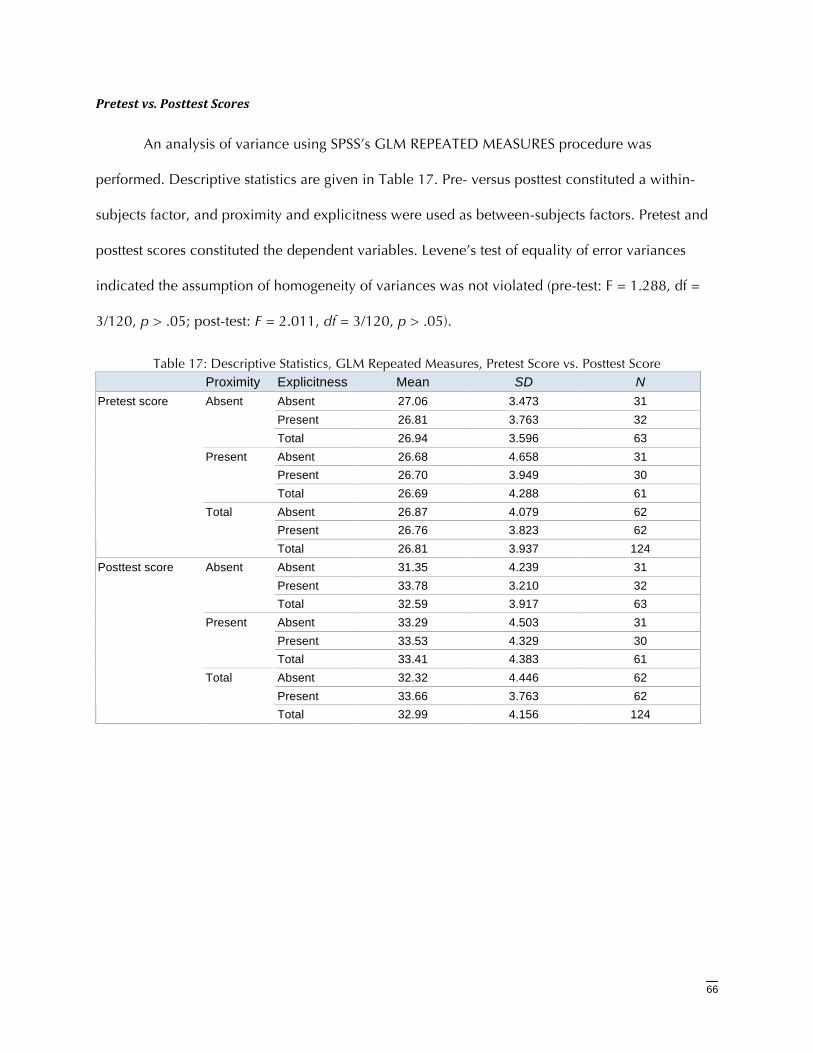
66
Pretestvs.PosttestScores
An analysis of variance using SPSS’s GLM REPEATED MEASURES procedure was
performed. Descriptive statistics are given in Table 17. Pre- versus posttest constituted a within-
subjects factor, and proximity and explicitness were used as between-subjects factors. Pretest and
posttest scores constituted the dependent variables. Levene’s test of equality of error variances
indicated the assumption of homogeneity of variances was not violated (pre-test: F = 1.288, df =
3/120, p > .05; post-test: F = 2.011, df = 3/120, p > .05).
Table 17: Descriptive Statistics, GLM Repeated Measures, Pretest Score vs. Posttest Score Proximity Explicitness Mean SD N
Absent 27.06 3.473 31 Present 26.81 3.763 32
Absent
Total 26.94 3.596 63 Absent 26.68 4.658 31 Present 26.70 3.949 30
Present
Total 26.69 4.288 61 Absent 26.87 4.079 62 Present 26.76 3.823 62
Pretest score
Total
Total 26.81 3.937 124 Absent 31.35 4.239 31 Present 33.78 3.210 32
Absent
Total 32.59 3.917 63 Absent 33.29 4.503 31 Present 33.53 4.329 30
Present
Total 33.41 4.383 61 Absent 32.32 4.446 62 Present 33.66 3.763 62
Posttest score
Total
Total 32.99 4.156 124
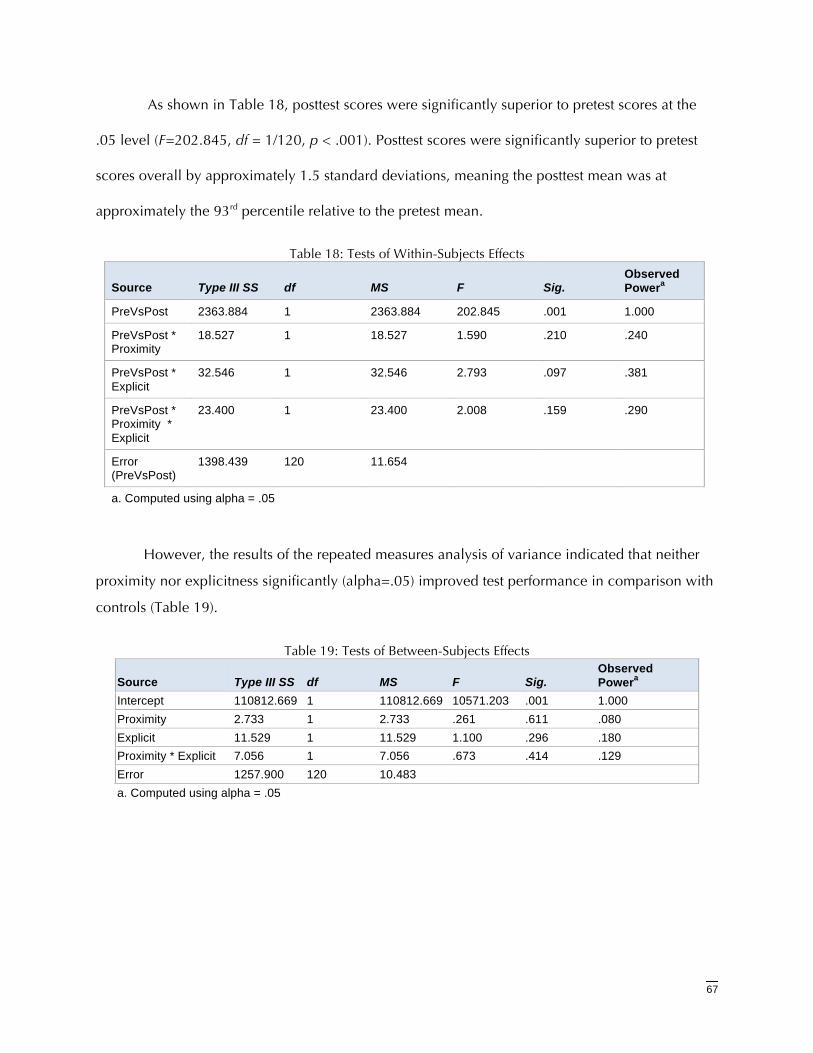
67
As shown in Table 18, posttest scores were significantly superior to pretest scores at the
.05 level (F=202.845, df = 1/120, p < .001). Posttest scores were significantly superior to pretest
scores overall by approximately 1.5 standard deviations, meaning the posttest mean was at
approximately the 93rd percentile relative to the pretest mean.
Table 18: Tests of Within-Subjects Effects
Source Type III SS df MS F Sig. Observed Powera
PreVsPost 2363.884 1 2363.884 202.845 .001 1.000
PreVsPost * Proximity
18.527 1 18.527 1.590 .210 .240
PreVsPost * Explicit
32.546 1 32.546 2.793 .097 .381
PreVsPost * Proximity * Explicit
23.400 1 23.400 2.008 .159 .290
Error (PreVsPost)
1398.439 120 11.654
a. Computed using alpha = .05
However, the results of the repeated measures analysis of variance indicated that neither
proximity nor explicitness significantly (alpha=.05) improved test performance in comparison with
controls (Table 19).
Table 19: Tests of Between-Subjects Effects
Source Type III SS df MS F Sig. Observed Powera
Intercept 110812.669 1 110812.669 10571.203 .001 1.000 Proximity 2.733 1 2.733 .261 .611 .080 Explicit 11.529 1 11.529 1.100 .296 .180 Proximity * Explicit 7.056 1 7.056 .673 .414 .129 Error 1257.900 120 10.483 a. Computed using alpha = .05
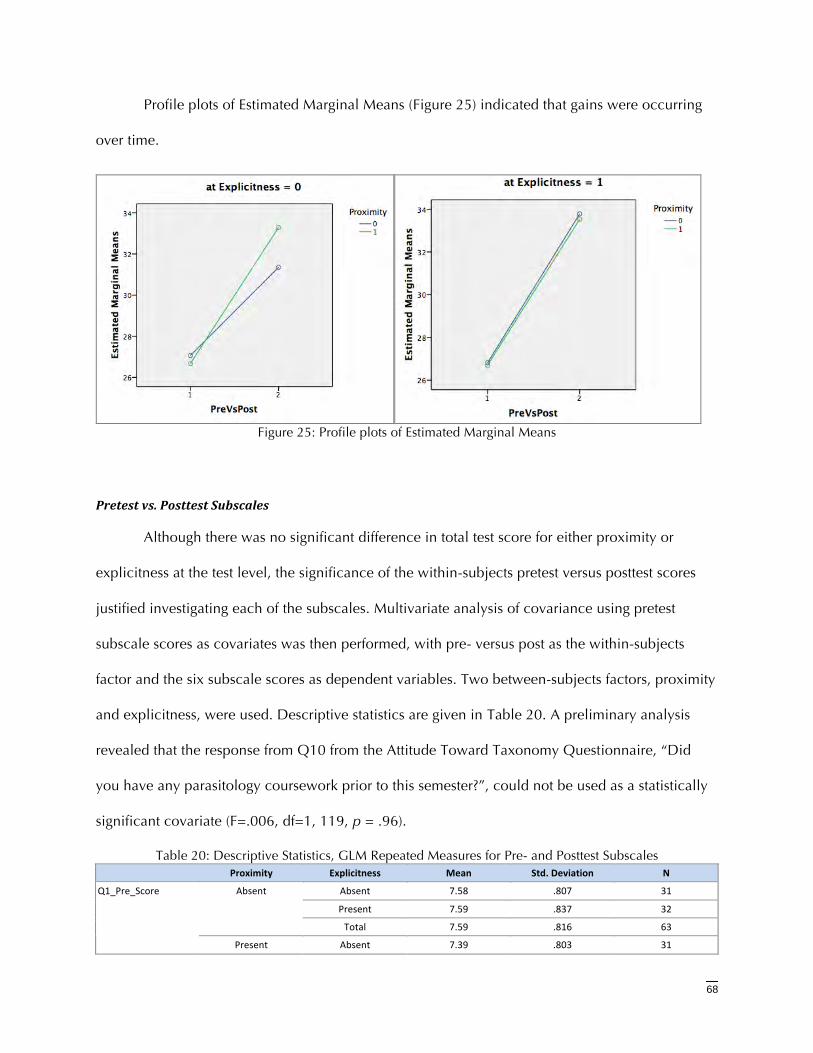
68
Profile plots of Estimated Marginal Means (Figure 25) indicated that gains were occurring
over time.
Figure 25: Profile plots of Estimated Marginal Means
Pretestvs.PosttestSubscales
Although there was no significant difference in total test score for either proximity or
explicitness at the test level, the significance of the within-subjects pretest versus posttest scores
justified investigating each of the subscales. Multivariate analysis of covariance using pretest
subscale scores as covariates was then performed, with pre- versus post as the within-subjects
factor and the six subscale scores as dependent variables. Two between-subjects factors, proximity
and explicitness, were used. Descriptive statistics are given in Table 20. A preliminary analysis
revealed that the response from Q10 from the Attitude Toward Taxonomy Questionnaire, “Did
you have any parasitology coursework prior to this semester?”, could not be used as a statistically
significant covariate (F=.006, df=1, 119, p = .96).
Table 20: Descriptive Statistics, GLM Repeated Measures for Pre- and Posttest Subscales Proximity Explicitness Mean Std.Deviation N
Absent 7.58 .807 31
Present 7.59 .837 32
Absent
Total 7.59 .816 63
Q1_Pre_Score
Present Absent 7.39 .803 31
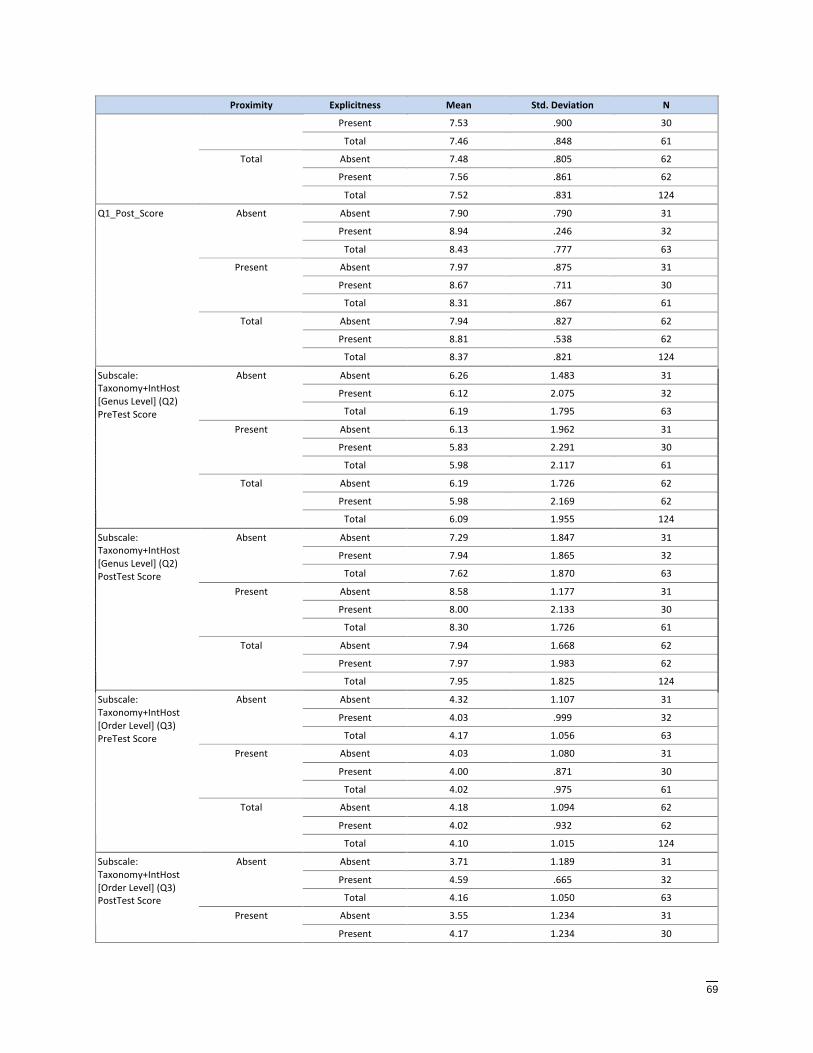
69
Proximity Explicitness Mean Std.Deviation N
Present 7.53 .900 30
Total 7.46 .848 61
Absent 7.48 .805 62
Present 7.56 .861 62
Total
Total 7.52 .831 124
Absent 7.90 .790 31
Present 8.94 .246 32
Absent
Total 8.43 .777 63
Absent 7.97 .875 31
Present 8.67 .711 30
Present
Total 8.31 .867 61
Absent 7.94 .827 62
Present 8.81 .538 62
Q1_Post_Score
Total
Total 8.37 .821 124
Absent 6.26 1.483 31
Present 6.12 2.075 32
Absent
Total 6.19 1.795 63
Absent 6.13 1.962 31
Present 5.83 2.291 30
Present
Total 5.98 2.117 61
Absent 6.19 1.726 62
Present 5.98 2.169 62
Subscale:Taxonomy+IntHost[GenusLevel](Q2)PreTestScore
Total
Total 6.09 1.955 124
Absent 7.29 1.847 31
Present 7.94 1.865 32
Absent
Total 7.62 1.870 63
Absent 8.58 1.177 31
Present 8.00 2.133 30
Present
Total 8.30 1.726 61
Absent 7.94 1.668 62
Present 7.97 1.983 62
Subscale:Taxonomy+IntHost[GenusLevel](Q2)PostTestScore
Total
Total 7.95 1.825 124
Absent 4.32 1.107 31
Present 4.03 .999 32
Absent
Total 4.17 1.056 63
Absent 4.03 1.080 31
Present 4.00 .871 30
Present
Total 4.02 .975 61
Absent 4.18 1.094 62
Present 4.02 .932 62
Subscale:Taxonomy+IntHost[OrderLevel](Q3)PreTestScore
Total
Total 4.10 1.015 124
Absent 3.71 1.189 31
Present 4.59 .665 32
Absent
Total 4.16 1.050 63
Absent 3.55 1.234 31
Subscale:Taxonomy+IntHost[OrderLevel](Q3)PostTestScore
Present
Present 4.17 1.234 30
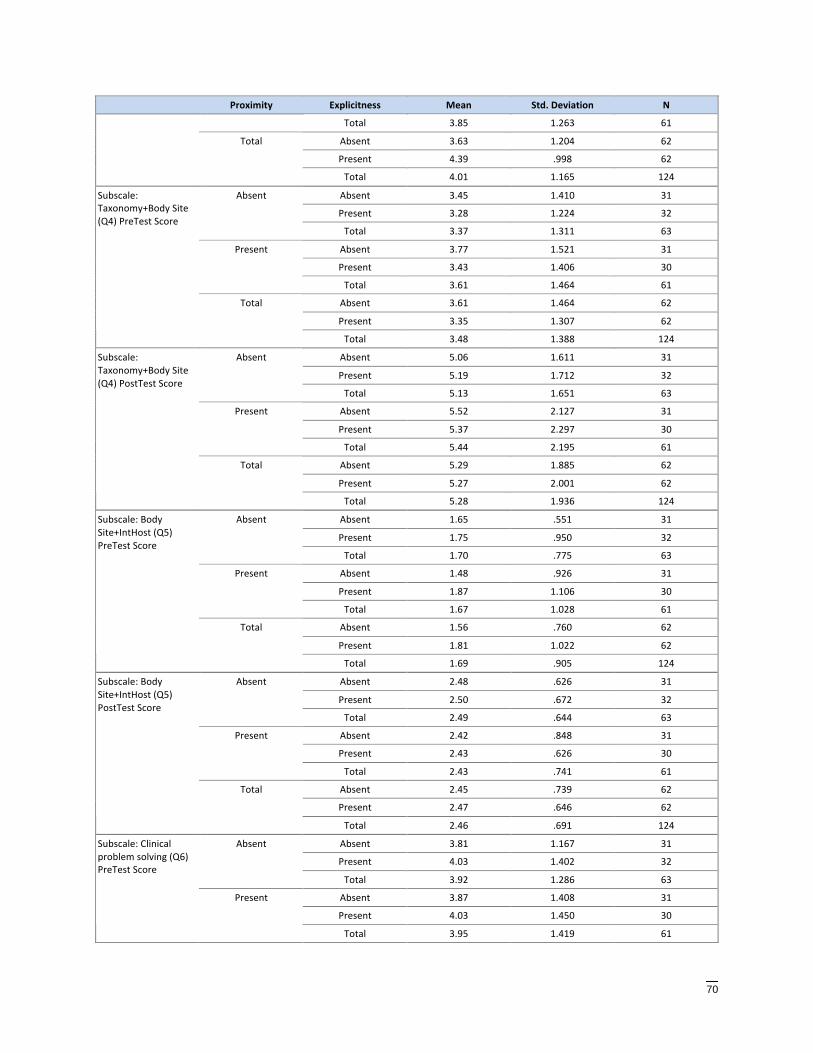
70
Proximity Explicitness Mean Std.Deviation N
Total 3.85 1.263 61
Absent 3.63 1.204 62
Present 4.39 .998 62
Total
Total 4.01 1.165 124
Absent 3.45 1.410 31
Present 3.28 1.224 32
Absent
Total 3.37 1.311 63
Absent 3.77 1.521 31
Present 3.43 1.406 30
Present
Total 3.61 1.464 61
Absent 3.61 1.464 62
Present 3.35 1.307 62
Subscale:Taxonomy+BodySite(Q4)PreTestScore
Total
Total 3.48 1.388 124
Absent 5.06 1.611 31
Present 5.19 1.712 32
Absent
Total 5.13 1.651 63
Absent 5.52 2.127 31
Present 5.37 2.297 30
Present
Total 5.44 2.195 61
Absent 5.29 1.885 62
Present 5.27 2.001 62
Subscale:Taxonomy+BodySite(Q4)PostTestScore
Total
Total 5.28 1.936 124
Absent 1.65 .551 31
Present 1.75 .950 32
Absent
Total 1.70 .775 63
Absent 1.48 .926 31
Present 1.87 1.106 30
Present
Total 1.67 1.028 61
Absent 1.56 .760 62
Present 1.81 1.022 62
Subscale:BodySite+IntHost(Q5)PreTestScore
Total
Total 1.69 .905 124
Absent 2.48 .626 31
Present 2.50 .672 32
Absent
Total 2.49 .644 63
Absent 2.42 .848 31
Present 2.43 .626 30
Present
Total 2.43 .741 61
Absent 2.45 .739 62
Present 2.47 .646 62
Subscale:BodySite+IntHost(Q5)PostTestScore
Total
Total 2.46 .691 124
Absent 3.81 1.167 31
Present 4.03 1.402 32
Absent
Total 3.92 1.286 63
Absent 3.87 1.408 31
Present 4.03 1.450 30
Subscale:Clinicalproblemsolving(Q6)PreTestScore
Present
Total 3.95 1.419 61
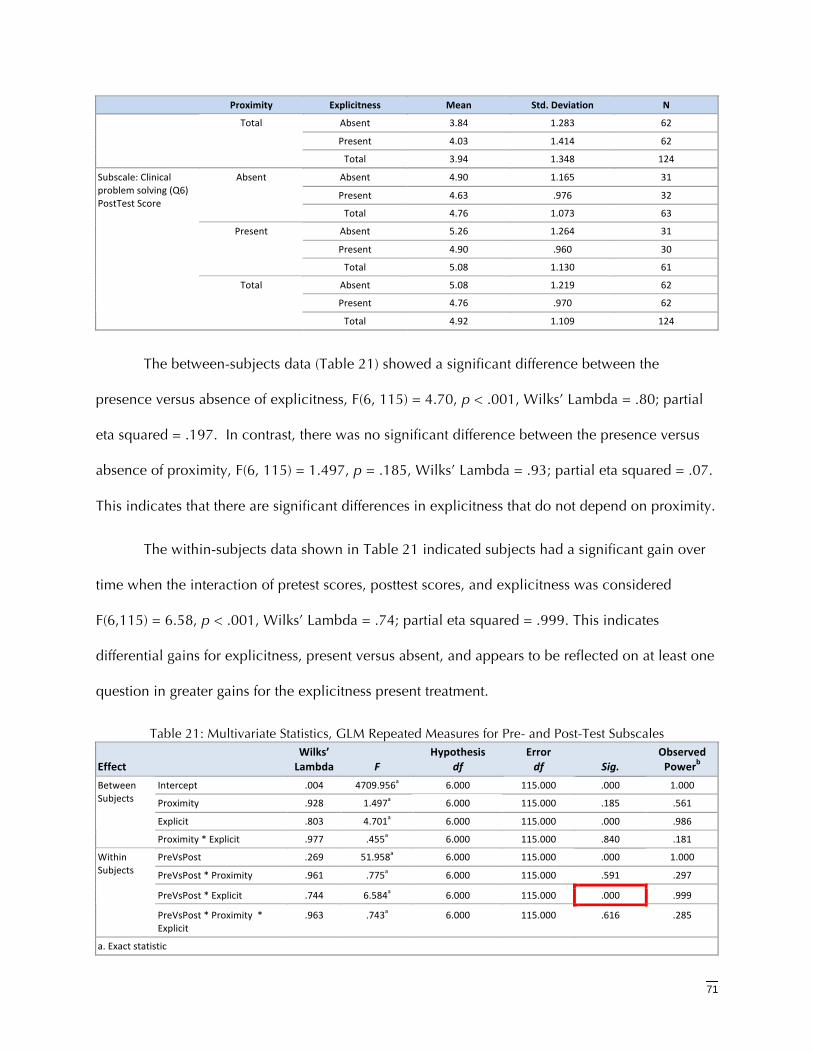
71
Proximity Explicitness Mean Std.Deviation N
Absent 3.84 1.283 62
Present 4.03 1.414 62
Total
Total 3.94 1.348 124
Absent 4.90 1.165 31
Present 4.63 .976 32
Absent
Total 4.76 1.073 63
Absent 5.26 1.264 31
Present 4.90 .960 30
Present
Total 5.08 1.130 61
Absent 5.08 1.219 62
Present 4.76 .970 62
Subscale:Clinicalproblemsolving(Q6)PostTestScore
Total
Total 4.92 1.109 124
The between-subjects data (Table 21) showed a significant difference between the
presence versus absence of explicitness, F(6, 115) = 4.70, p < .001, Wilks’ Lambda = .80; partial
eta squared = .197. In contrast, there was no significant difference between the presence versus
absence of proximity, F(6, 115) = 1.497, p = .185, Wilks’ Lambda = .93; partial eta squared = .07.
This indicates that there are significant differences in explicitness that do not depend on proximity.
The within-subjects data shown in Table 21 indicated subjects had a significant gain over
time when the interaction of pretest scores, posttest scores, and explicitness was considered
F(6,115) = 6.58, p < .001, Wilks’ Lambda = .74; partial eta squared = .999. This indicates
differential gains for explicitness, present versus absent, and appears to be reflected on at least one
question in greater gains for the explicitness present treatment.
Table 21: Multivariate Statistics, GLM Repeated Measures for Pre- and Post-Test Subscales
EffectWilks’Lambda F
Hypothesisdf
Errordf Sig.
ObservedPowerb
Intercept .004 4709.956a 6.000 115.000 .000 1.000
Proximity .928 1.497a 6.000 115.000 .185 .561
Explicit .803 4.701a 6.000 115.000 .000 .986
BetweenSubjects
Proximity*Explicit .977 .455a 6.000 115.000 .840 .181
PreVsPost .269 51.958a 6.000 115.000 .000 1.000
PreVsPost*Proximity .961 .775a 6.000 115.000 .591 .297
PreVsPost*Explicit .744 6.584a 6.000 115.000 .000 .999
WithinSubjects
PreVsPost*Proximity*Explicit
.963 .743a 6.000 115.000 .616 .285
a.Exactstatistic
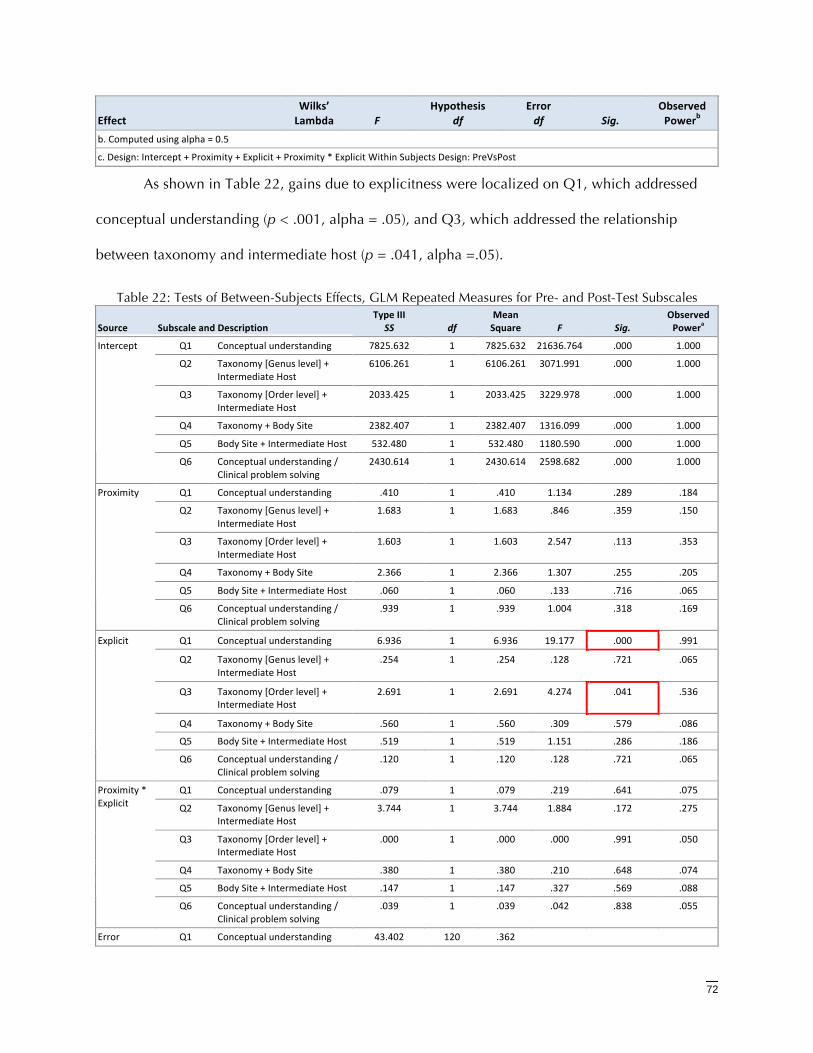
72
EffectWilks’Lambda F
Hypothesisdf
Errordf Sig.
ObservedPowerb
b.Computedusingalpha=0.5
c.Design:Intercept+Proximity+Explicit+Proximity*ExplicitWithinSubjectsDesign:PreVsPost
As shown in Table 22, gains due to explicitness were localized on Q1, which addressed
conceptual understanding (p < .001, alpha = .05), and Q3, which addressed the relationship
between taxonomy and intermediate host (p = .041, alpha =.05).
Table 22: Tests of Between-Subjects Effects, GLM Repeated Measures for Pre- and Post-Test Subscales
Source SubscaleandDescriptionTypeIII
SS dfMeanSquare F Sig.
ObservedPowera
Q1 Conceptualunderstanding 7825.632 1 7825.632 21636.764 .000 1.000
Q2 Taxonomy[Genuslevel]+IntermediateHost
6106.261 1 6106.261 3071.991 .000 1.000
Q3 Taxonomy[Orderlevel]+IntermediateHost
2033.425 1 2033.425 3229.978 .000 1.000
Q4 Taxonomy+BodySite 2382.407 1 2382.407 1316.099 .000 1.000
Q5 BodySite+IntermediateHost 532.480 1 532.480 1180.590 .000 1.000
Intercept
Q6 Conceptualunderstanding/Clinicalproblemsolving
2430.614 1 2430.614 2598.682 .000 1.000
Q1 Conceptualunderstanding .410 1 .410 1.134 .289 .184
Q2 Taxonomy[Genuslevel]+IntermediateHost
1.683 1 1.683 .846 .359 .150
Q3 Taxonomy[Orderlevel]+IntermediateHost
1.603 1 1.603 2.547 .113 .353
Q4 Taxonomy+BodySite 2.366 1 2.366 1.307 .255 .205
Q5 BodySite+IntermediateHost .060 1 .060 .133 .716 .065
Proximity
Q6 Conceptualunderstanding/Clinicalproblemsolving
.939 1 .939 1.004 .318 .169
Q1 Conceptualunderstanding 6.936 1 6.936 19.177 .000 .991
Q2 Taxonomy[Genuslevel]+IntermediateHost
.254 1 .254 .128 .721 .065
Q3 Taxonomy[Orderlevel]+IntermediateHost
2.691 1 2.691 4.274 .041 .536
Q4 Taxonomy+BodySite .560 1 .560 .309 .579 .086
Q5 BodySite+IntermediateHost .519 1 .519 1.151 .286 .186
Explicit
Q6 Conceptualunderstanding/Clinicalproblemsolving
.120 1 .120 .128 .721 .065
Q1 Conceptualunderstanding .079 1 .079 .219 .641 .075
Q2 Taxonomy[Genuslevel]+IntermediateHost
3.744 1 3.744 1.884 .172 .275
Q3 Taxonomy[Orderlevel]+IntermediateHost
.000 1 .000 .000 .991 .050
Q4 Taxonomy+BodySite .380 1 .380 .210 .648 .074
Q5 BodySite+IntermediateHost .147 1 .147 .327 .569 .088
Proximity*Explicit
Q6 Conceptualunderstanding/Clinicalproblemsolving
.039 1 .039 .042 .838 .055
Error Q1 Conceptualunderstanding 43.402 120 .362
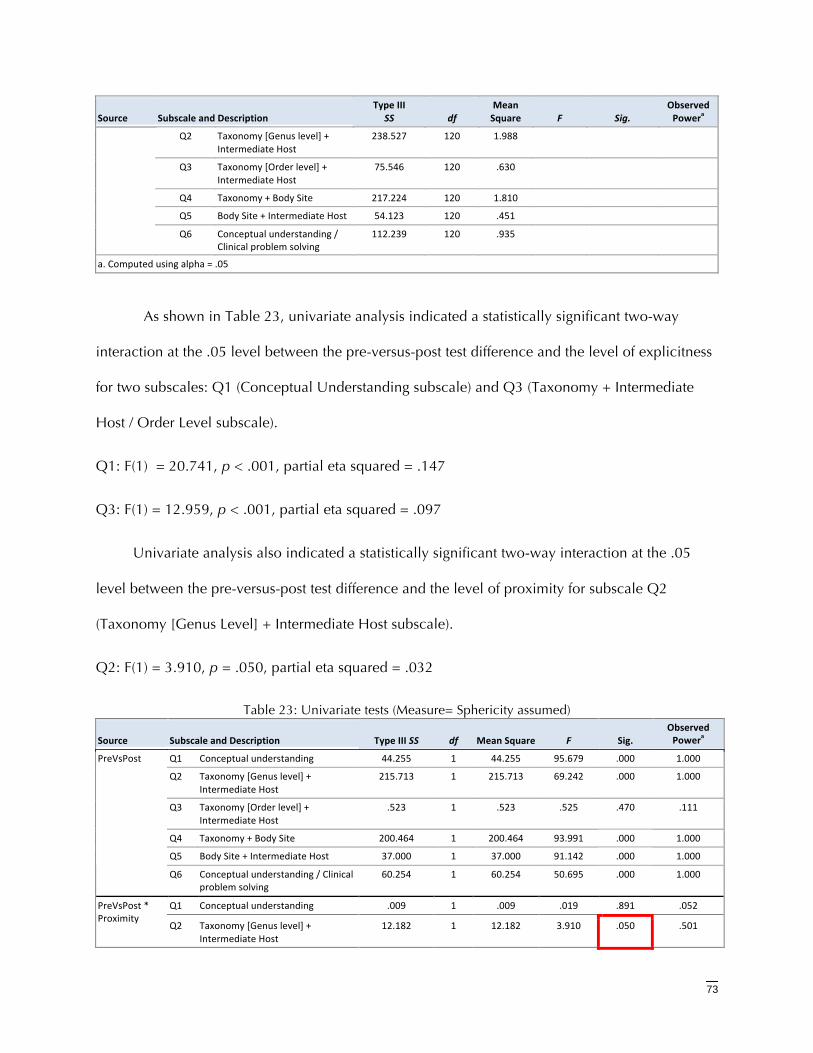
73
Source SubscaleandDescriptionTypeIII
SS dfMeanSquare F Sig.
ObservedPowera
Q2 Taxonomy[Genuslevel]+IntermediateHost
238.527 120 1.988
Q3 Taxonomy[Orderlevel]+IntermediateHost
75.546 120 .630
Q4 Taxonomy+BodySite 217.224 120 1.810
Q5 BodySite+IntermediateHost 54.123 120 .451
Q6 Conceptualunderstanding/Clinicalproblemsolving
112.239 120 .935
a.Computedusingalpha=.05
As shown in Table 23, univariate analysis indicated a statistically significant two-way
interaction at the .05 level between the pre-versus-post test difference and the level of explicitness
for two subscales: Q1 (Conceptual Understanding subscale) and Q3 (Taxonomy + Intermediate
Host / Order Level subscale).
Q1: F(1) = 20.741, p < .001, partial eta squared = .147
Q3: F(1) = 12.959, p < .001, partial eta squared = .097
Univariate analysis also indicated a statistically significant two-way interaction at the .05
level between the pre-versus-post test difference and the level of proximity for subscale Q2
(Taxonomy [Genus Level] + Intermediate Host subscale).
Q2: F(1) = 3.910, p = .050, partial eta squared = .032
Table 23: Univariate tests (Measure= Sphericity assumed)
Source SubscaleandDescription TypeIIISS df MeanSquare F Sig.ObservedPowera
Q1 Conceptualunderstanding 44.255 1 44.255 95.679 .000 1.000
Q2 Taxonomy[Genuslevel]+IntermediateHost
215.713 1 215.713 69.242 .000 1.000
Q3 Taxonomy[Orderlevel]+IntermediateHost
.523 1 .523 .525 .470 .111
Q4 Taxonomy+BodySite 200.464 1 200.464 93.991 .000 1.000
Q5 BodySite+IntermediateHost 37.000 1 37.000 91.142 .000 1.000
PreVsPost
Q6 Conceptualunderstanding/Clinicalproblemsolving
60.254 1 60.254 50.695 .000 1.000
Q1 Conceptualunderstanding .009 1 .009 .019 .891 .052PreVsPost*Proximity
Q2 Taxonomy[Genuslevel]+IntermediateHost
12.182 1 12.182 3.910 .050 .501
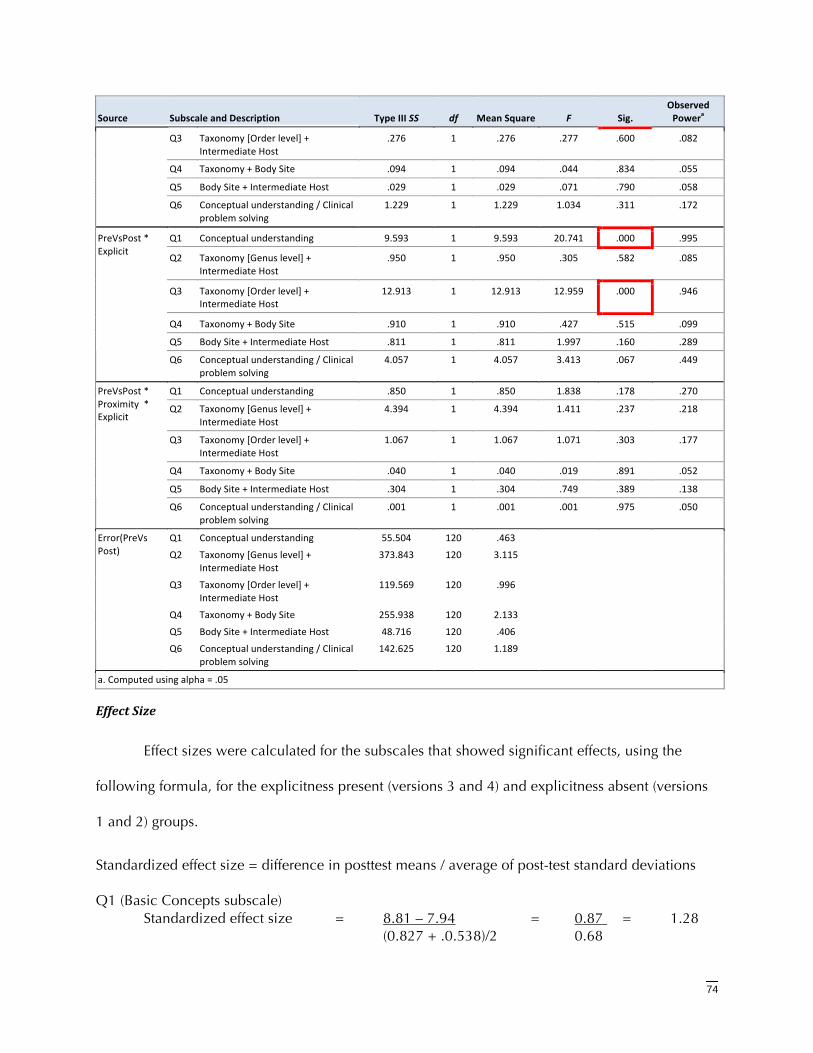
74
Source SubscaleandDescription TypeIIISS df MeanSquare F Sig.ObservedPowera
Q3 Taxonomy[Orderlevel]+IntermediateHost
.276 1 .276 .277 .600 .082
Q4 Taxonomy+BodySite .094 1 .094 .044 .834 .055
Q5 BodySite+IntermediateHost .029 1 .029 .071 .790 .058
Q6 Conceptualunderstanding/Clinicalproblemsolving
1.229 1 1.229 1.034 .311 .172
Q1 Conceptualunderstanding 9.593 1 9.593 20.741 .000 .995
Q2 Taxonomy[Genuslevel]+IntermediateHost
.950 1 .950 .305 .582 .085
Q3 Taxonomy[Orderlevel]+IntermediateHost
12.913 1 12.913 12.959 .000 .946
Q4 Taxonomy+BodySite .910 1 .910 .427 .515 .099
Q5 BodySite+IntermediateHost .811 1 .811 1.997 .160 .289
PreVsPost*Explicit
Q6 Conceptualunderstanding/Clinicalproblemsolving
4.057 1 4.057 3.413 .067 .449
Q1 Conceptualunderstanding .850 1 .850 1.838 .178 .270
Q2 Taxonomy[Genuslevel]+IntermediateHost
4.394 1 4.394 1.411 .237 .218
Q3 Taxonomy[Orderlevel]+IntermediateHost
1.067 1 1.067 1.071 .303 .177
Q4 Taxonomy+BodySite .040 1 .040 .019 .891 .052
Q5 BodySite+IntermediateHost .304 1 .304 .749 .389 .138
PreVsPost*Proximity*Explicit
Q6 Conceptualunderstanding/Clinicalproblemsolving
.001 1 .001 .001 .975 .050
Q1 Conceptualunderstanding 55.504 120 .463
Q2 Taxonomy[Genuslevel]+IntermediateHost
373.843 120 3.115
Q3 Taxonomy[Orderlevel]+IntermediateHost
119.569 120 .996
Q4 Taxonomy+BodySite 255.938 120 2.133
Q5 BodySite+IntermediateHost 48.716 120 .406
Error(PreVsPost)
Q6 Conceptualunderstanding/Clinicalproblemsolving
142.625 120 1.189
a.Computedusingalpha=.05
EffectSize
Effect sizes were calculated for the subscales that showed significant effects, using the
following formula, for the explicitness present (versions 3 and 4) and explicitness absent (versions
1 and 2) groups.
Standardized effect size = difference in posttest means / average of post-test standard deviations Q1 (Basic Concepts subscale)
Standardized effect size = 8.81 – 7.94 = 0.87 = 1.28 (0.827 + .0.538)/2 0.68
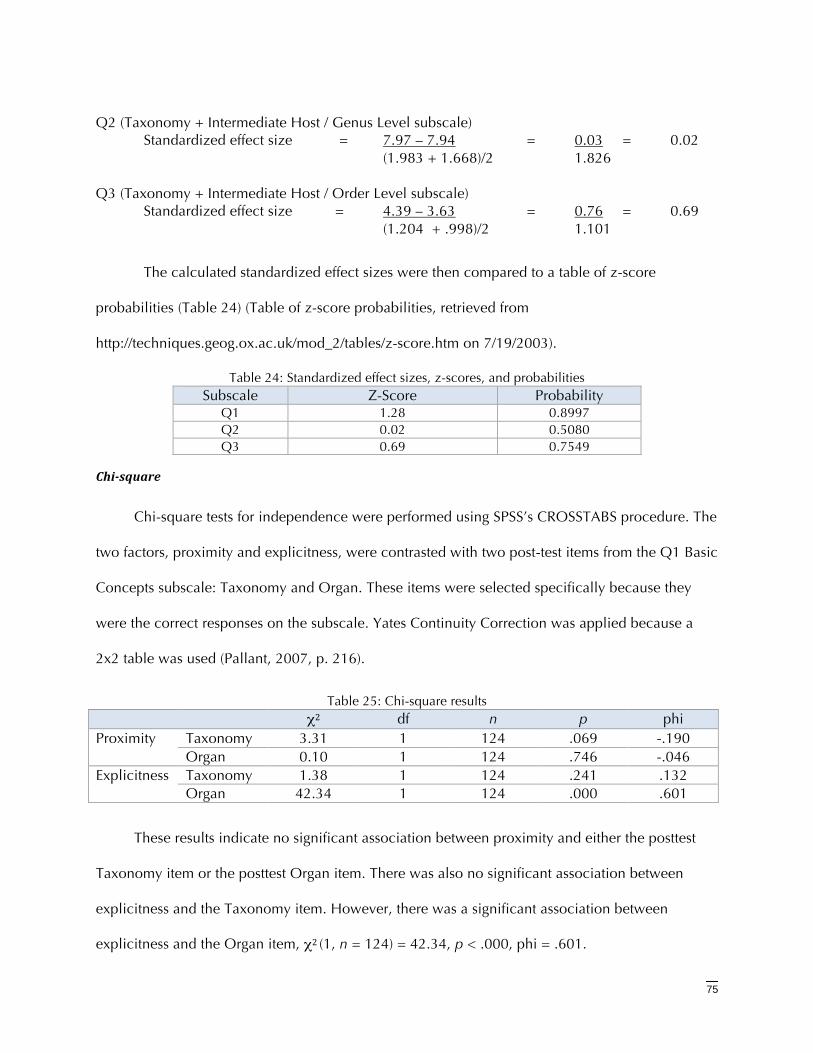
75
Q2 (Taxonomy + Intermediate Host / Genus Level subscale)
Standardized effect size = 7.97 – 7.94 = 0.03 = 0.02 (1.983 + 1.668)/2 1.826 Q3 (Taxonomy + Intermediate Host / Order Level subscale)
Standardized effect size = 4.39 – 3.63 = 0.76 = 0.69 (1.204 + .998)/2 1.101
The calculated standardized effect sizes were then compared to a table of z-score
probabilities (Table 24) (Table of z-score probabilities, retrieved from
http://techniques.geog.ox.ac.uk/mod_2/tables/z-score.htm on 7/19/2003).
Table 24: Standardized effect sizes, z-scores, and probabilities Subscale Z-Score Probability
Q1 1.28 0.8997 Q2 0.02 0.5080 Q3 0.69 0.7549
Chisquare
Chi-square tests for independence were performed using SPSS’s CROSSTABS procedure. The
two factors, proximity and explicitness, were contrasted with two post-test items from the Q1 Basic
Concepts subscale: Taxonomy and Organ. These items were selected specifically because they
were the correct responses on the subscale. Yates Continuity Correction was applied because a
2x2 table was used (Pallant, 2007, p. 216).
Table 25: Chi-square results χ2 df n p phi
Taxonomy 3.31 1 124 .069 -.190 Proximity Organ 0.10 1 124 .746 -.046 Taxonomy 1.38 1 124 .241 .132 Explicitness Organ 42.34 1 124 .000 .601
These results indicate no significant association between proximity and either the posttest
Taxonomy item or the posttest Organ item. There was also no significant association between
explicitness and the Taxonomy item. However, there was a significant association between
explicitness and the Organ item, χ2(1, n = 124) = 42.34, p < .000, phi = .601.
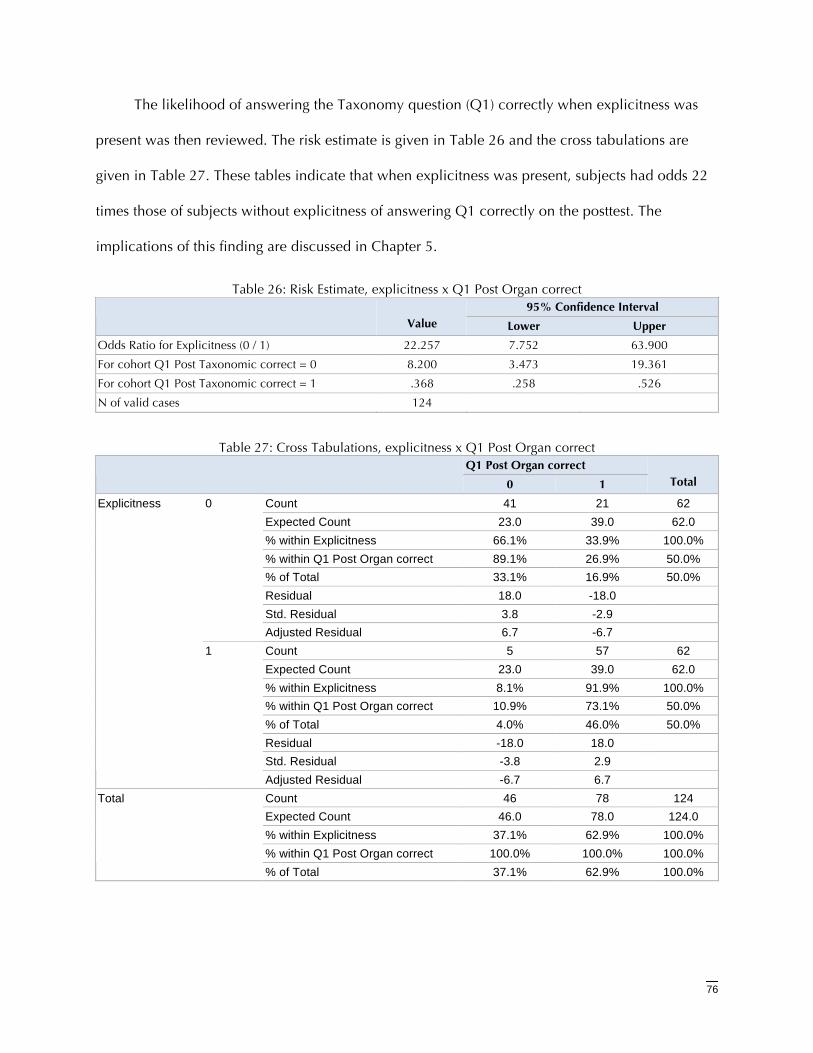
76
The likelihood of answering the Taxonomy question (Q1) correctly when explicitness was
present was then reviewed. The risk estimate is given in Table 26 and the cross tabulations are
given in Table 27. These tables indicate that when explicitness was present, subjects had odds 22
times those of subjects without explicitness of answering Q1 correctly on the posttest. The
implications of this finding are discussed in Chapter 5.
Table 26: Risk Estimate, explicitness x Q1 Post Organ correct 95% Confidence Interval
Value Lower Upper
Odds Ratio for Explicitness (0 / 1) 22.257 7.752 63.900
For cohort Q1 Post Taxonomic correct = 0 8.200 3.473 19.361
For cohort Q1 Post Taxonomic correct = 1 .368 .258 .526
N of valid cases 124
Table 27: Cross Tabulations, explicitness x Q1 Post Organ correct
Q1 Post Organ correct
0 1 Total
Count 41 21 62 Expected Count 23.0 39.0 62.0 % within Explicitness 66.1% 33.9% 100.0% % within Q1 Post Organ correct 89.1% 26.9% 50.0% % of Total 33.1% 16.9% 50.0% Residual 18.0 -18.0 Std. Residual 3.8 -2.9
0
Adjusted Residual 6.7 -6.7 Count 5 57 62 Expected Count 23.0 39.0 62.0 % within Explicitness 8.1% 91.9% 100.0% % within Q1 Post Organ correct 10.9% 73.1% 50.0% % of Total 4.0% 46.0% 50.0% Residual -18.0 18.0 Std. Residual -3.8 2.9
Explicitness
1
Adjusted Residual -6.7 6.7 Count 46 78 124 Expected Count 46.0 78.0 124.0 % within Explicitness 37.1% 62.9% 100.0% % within Q1 Post Organ correct 100.0% 100.0% 100.0%
Total
% of Total 37.1% 62.9% 100.0%
77
Experiment2:RepresentationandProximity
ResearchQuestions
Experiment 2 was designed to address the following research questions:
Q3. Do learning materials with tables that include detailed information in close spatial
proximity significantly improve student learning, as measured by the student’s ability
to solve clinical case scenarios accurately, compared to materials with tabular
representations that do not include detailed information?
Q4. Do learning materials with graphical representations (concept maps) that place
appropriate information in close spatial proximity significantly improve student
learning, as measured by the student’s ability to solve clinical case scenarios
accurately, compared to materials that include tabular representations?
Q5. Do learning materials with partial concept maps that place a subset of information in
proximity to the appropriate text significantly improve student learning, as measured
by the student’s ability to solve clinical case scenarios accurately, compared to
materials without partial concept maps?
Q6. Do learning materials with tables with detailed information, full concept maps, and
partial concept maps, significantly improve student learning, as measured by the
student’s ability to solve clinical case scenarios accurately, compared to materials that
include no concept maps and tables without detailed information?
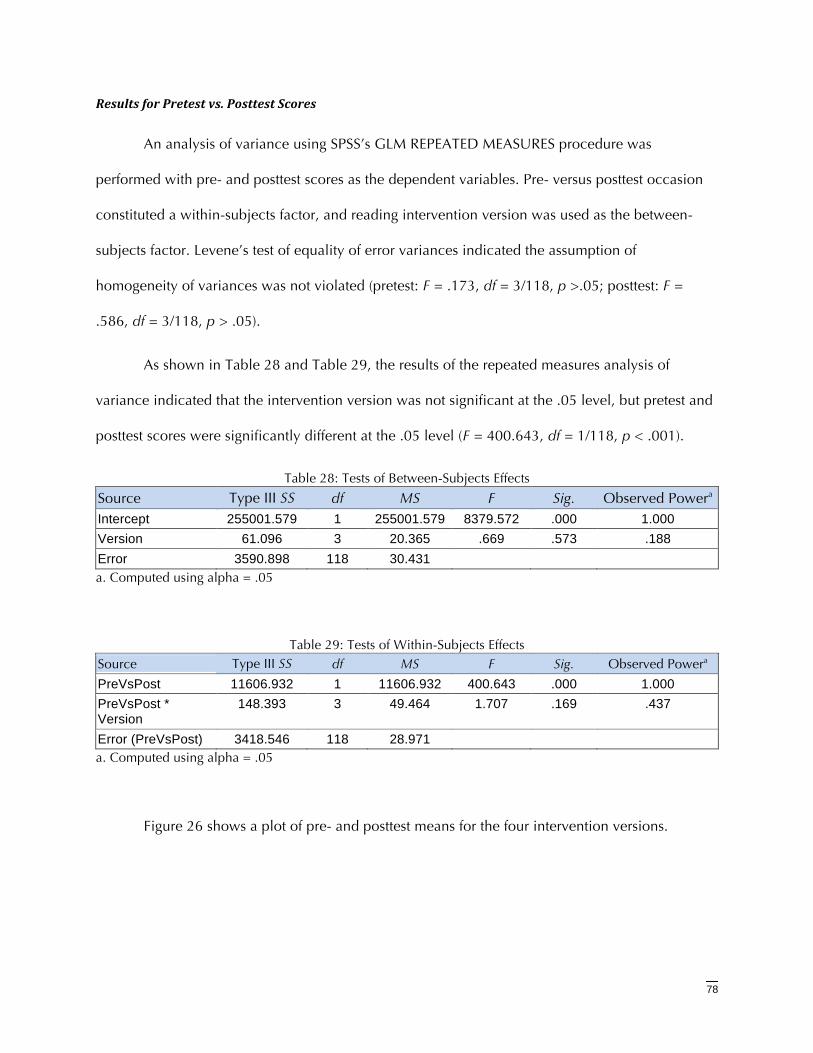
78
ResultsforPretestvs.PosttestScores
An analysis of variance using SPSS’s GLM REPEATED MEASURES procedure was
performed with pre- and posttest scores as the dependent variables. Pre- versus posttest occasion
constituted a within-subjects factor, and reading intervention version was used as the between-
subjects factor. Levene’s test of equality of error variances indicated the assumption of
homogeneity of variances was not violated (pretest: F = .173, df = 3/118, p >.05; posttest: F =
.586, df = 3/118, p > .05).
As shown in Table 28 and Table 29, the results of the repeated measures analysis of
variance indicated that the intervention version was not significant at the .05 level, but pretest and
posttest scores were significantly different at the .05 level (F = 400.643, df = 1/118, p < .001).
Table 28: Tests of Between-Subjects Effects
Source Type III SS df MS F Sig. Observed Powera Intercept 255001.579 1 255001.579 8379.572 .000 1.000 Version 61.096 3 20.365 .669 .573 .188 Error 3590.898 118 30.431 a. Computed using alpha = .05
Table 29: Tests of Within-Subjects Effects Source Type III SS df MS F Sig. Observed Powera
PreVsPost 11606.932 1 11606.932 400.643 .000 1.000 PreVsPost * Version
148.393 3 49.464 1.707 .169 .437
Error (PreVsPost) 3418.546 118 28.971 a. Computed using alpha = .05
Figure 26 shows a plot of pre- and posttest means for the four intervention versions.
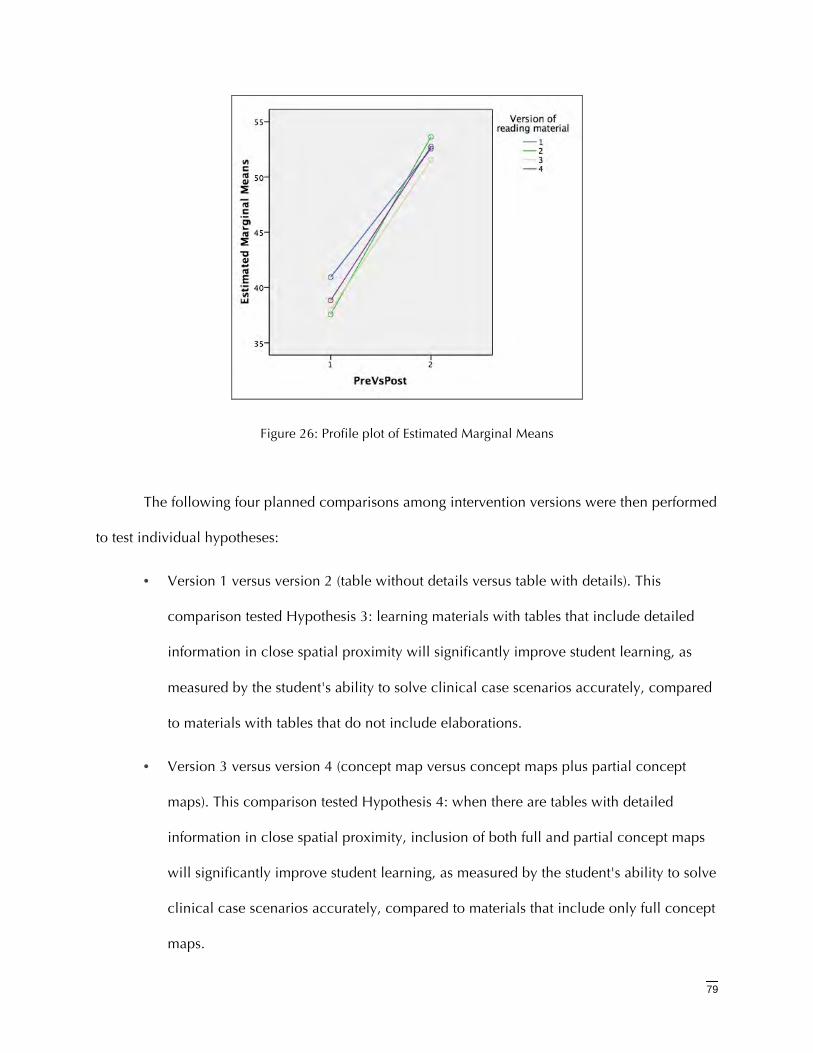
79
Figure 26: Profile plot of Estimated Marginal Means
The following four planned comparisons among intervention versions were then performed
to test individual hypotheses:
• Version 1 versus version 2 (table without details versus table with details). This
comparison tested Hypothesis 3: learning materials with tables that include detailed
information in close spatial proximity will significantly improve student learning, as
measured by the student's ability to solve clinical case scenarios accurately, compared
to materials with tables that do not include elaborations.
• Version 3 versus version 4 (concept map versus concept maps plus partial concept
maps). This comparison tested Hypothesis 4: when there are tables with detailed
information in close spatial proximity, inclusion of both full and partial concept maps
will significantly improve student learning, as measured by the student's ability to solve
clinical case scenarios accurately, compared to materials that include only full concept
maps.
80
• Version 1 combined with version 2 versus version 3 combined with version 4 (tables
without concept maps versus tables with concept maps). This comparison tested
Hypothesis 5: learning materials that include graphical representations (concept maps)
that place appropriate information in close spatial proximity will significantly improve
student learning, as measured by the student's ability to solve clinical case scenarios
accurately, compared to materials that include tabular representations.
• Version 1 versus version 4 (tables without details versus tables with details plus
concept maps plus partial concept maps). This comparison tested Hypothesis 6:
learning materials that include tables with detailed information in close spatial
proximity, full concept maps, and partial concept maps will significantly improve
student learning, as measured by the student's ability to solve clinical case scenarios
accurately, compared to materials that include no concept maps and tables without
detailed information in close spatial proximity.
Each of these comparisons is discussed in the following section. These analyses revealed a
significant relationship between Q3 (functional properties of taxonomic families) on the pretest
and Q456 (clinical problem solving) on the posttest. The importance of this serendipitous finding
is discussed in detail in Chapter 5.
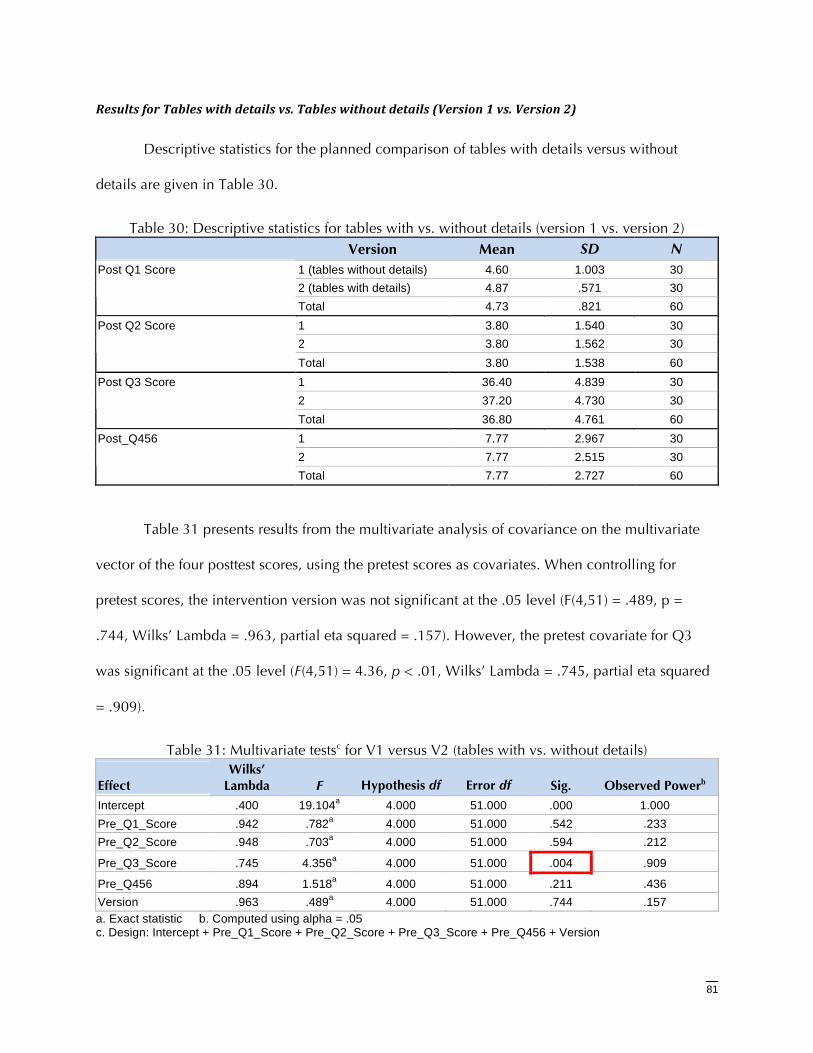
81
ResultsforTableswithdetailsvs.Tableswithoutdetails(Version1vs.Version2)
Descriptive statistics for the planned comparison of tables with details versus without
details are given in Table 30.
Table 30: Descriptive statistics for tables with vs. without details (version 1 vs. version 2) Version Mean SD N
1 (tables without details) 4.60 1.003 30 2 (tables with details) 4.87 .571 30
Post Q1 Score
Total 4.73 .821 60 1 3.80 1.540 30 2 3.80 1.562 30
Post Q2 Score
Total 3.80 1.538 60 1 36.40 4.839 30 2 37.20 4.730 30
Post Q3 Score
Total 36.80 4.761 60 1 7.77 2.967 30 2 7.77 2.515 30
Post_Q456
Total 7.77 2.727 60
Table 31 presents results from the multivariate analysis of covariance on the multivariate
vector of the four posttest scores, using the pretest scores as covariates. When controlling for
pretest scores, the intervention version was not significant at the .05 level (F(4,51) = .489, p =
.744, Wilks’ Lambda = .963, partial eta squared = .157). However, the pretest covariate for Q3
was significant at the .05 level (F(4,51) = 4.36, p < .01, Wilks’ Lambda = .745, partial eta squared
= .909).
Table 31: Multivariate testsc for V1 versus V2 (tables with vs. without details)
Effect Wilks’
Lambda F Hypothesis df Error df Sig. Observed Powerb
Intercept .400 19.104a 4.000 51.000 .000 1.000 Pre_Q1_Score .942 .782a 4.000 51.000 .542 .233 Pre_Q2_Score .948 .703a 4.000 51.000 .594 .212
Pre_Q3_Score .745 4.356a 4.000 51.000 .004 .909
Pre_Q456 .894 1.518a 4.000 51.000 .211 .436 Version .963 .489a 4.000 51.000 .744 .157 a. Exact statistic b. Computed using alpha = .05 c. Design: Intercept + Pre_Q1_Score + Pre_Q2_Score + Pre_Q3_Score + Pre_Q456 + Version
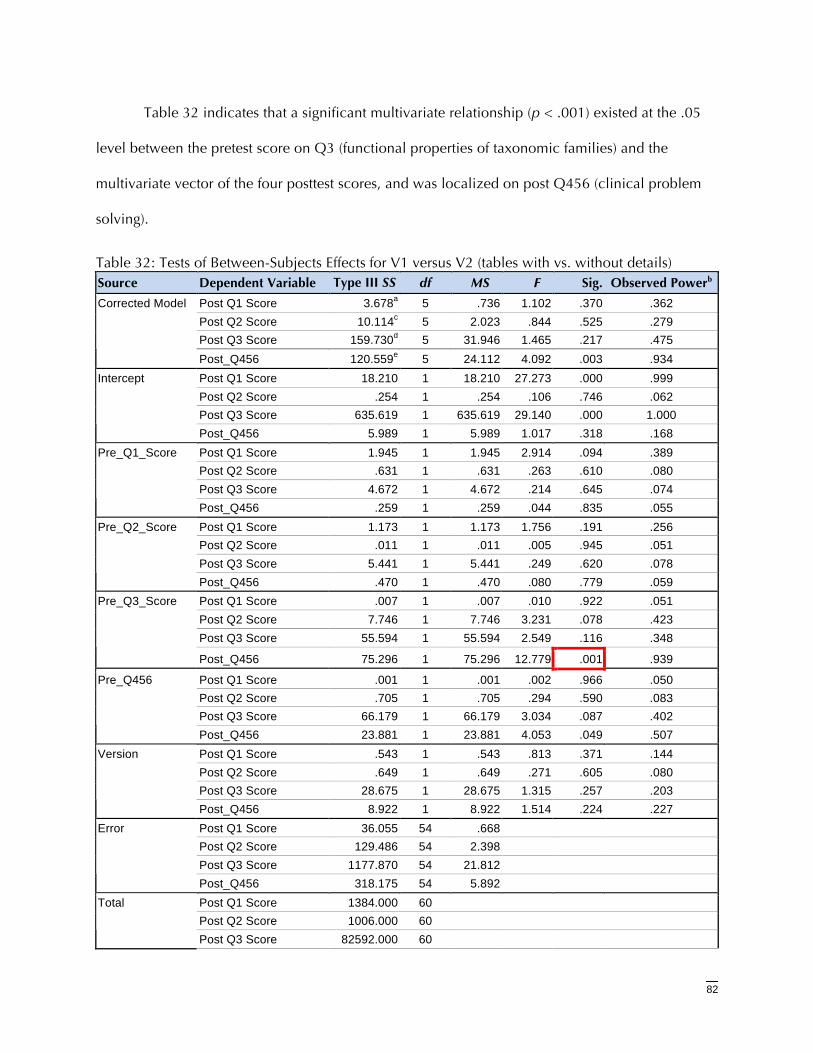
82
Table 32 indicates that a significant multivariate relationship (p < .001) existed at the .05
level between the pretest score on Q3 (functional properties of taxonomic families) and the
multivariate vector of the four posttest scores, and was localized on post Q456 (clinical problem
solving).
Table 32: Tests of Between-Subjects Effects for V1 versus V2 (tables with vs. without details) Source Dependent Variable Type III SS df MS F Sig. Observed Powerb
Post Q1 Score 3.678a 5 .736 1.102 .370 .362 Post Q2 Score 10.114c 5 2.023 .844 .525 .279 Post Q3 Score 159.730d 5 31.946 1.465 .217 .475
Corrected Model
Post_Q456 120.559e 5 24.112 4.092 .003 .934 Post Q1 Score 18.210 1 18.210 27.273 .000 .999 Post Q2 Score .254 1 .254 .106 .746 .062 Post Q3 Score 635.619 1 635.619 29.140 .000 1.000
Intercept
Post_Q456 5.989 1 5.989 1.017 .318 .168 Post Q1 Score 1.945 1 1.945 2.914 .094 .389 Post Q2 Score .631 1 .631 .263 .610 .080 Post Q3 Score 4.672 1 4.672 .214 .645 .074
Pre_Q1_Score
Post_Q456 .259 1 .259 .044 .835 .055 Post Q1 Score 1.173 1 1.173 1.756 .191 .256 Post Q2 Score .011 1 .011 .005 .945 .051 Post Q3 Score 5.441 1 5.441 .249 .620 .078
Pre_Q2_Score
Post_Q456 .470 1 .470 .080 .779 .059 Post Q1 Score .007 1 .007 .010 .922 .051 Post Q2 Score 7.746 1 7.746 3.231 .078 .423 Post Q3 Score 55.594 1 55.594 2.549 .116 .348
Pre_Q3_Score
Post_Q456 75.296 1 75.296 12.779 .001 .939
Post Q1 Score .001 1 .001 .002 .966 .050 Post Q2 Score .705 1 .705 .294 .590 .083 Post Q3 Score 66.179 1 66.179 3.034 .087 .402
Pre_Q456
Post_Q456 23.881 1 23.881 4.053 .049 .507 Post Q1 Score .543 1 .543 .813 .371 .144 Post Q2 Score .649 1 .649 .271 .605 .080 Post Q3 Score 28.675 1 28.675 1.315 .257 .203
Version
Post_Q456 8.922 1 8.922 1.514 .224 .227 Post Q1 Score 36.055 54 .668 Post Q2 Score 129.486 54 2.398 Post Q3 Score 1177.870 54 21.812
Error
Post_Q456 318.175 54 5.892 Post Q1 Score 1384.000 60 Post Q2 Score 1006.000 60
Total
Post Q3 Score 82592.000 60

83
Source Dependent Variable Type III SS df MS F Sig. Observed Powerb
Post_Q456 4058.000 60 Post Q1 Score 39.733 59 Post Q2 Score 139.600 59 Post Q3 Score 1337.600 59
Corrected Total
Post_Q456 438.733 59 a. R Squared = .093 (Adjusted R Squared = .009) b. Computed using alpha = .05 c. R Squared = .072 (Adjusted R Squared = -.013) d. R Squared = .119 (Adjusted R Squared = .038) e. R Squared = .275 (Adjusted R Squared = .208)
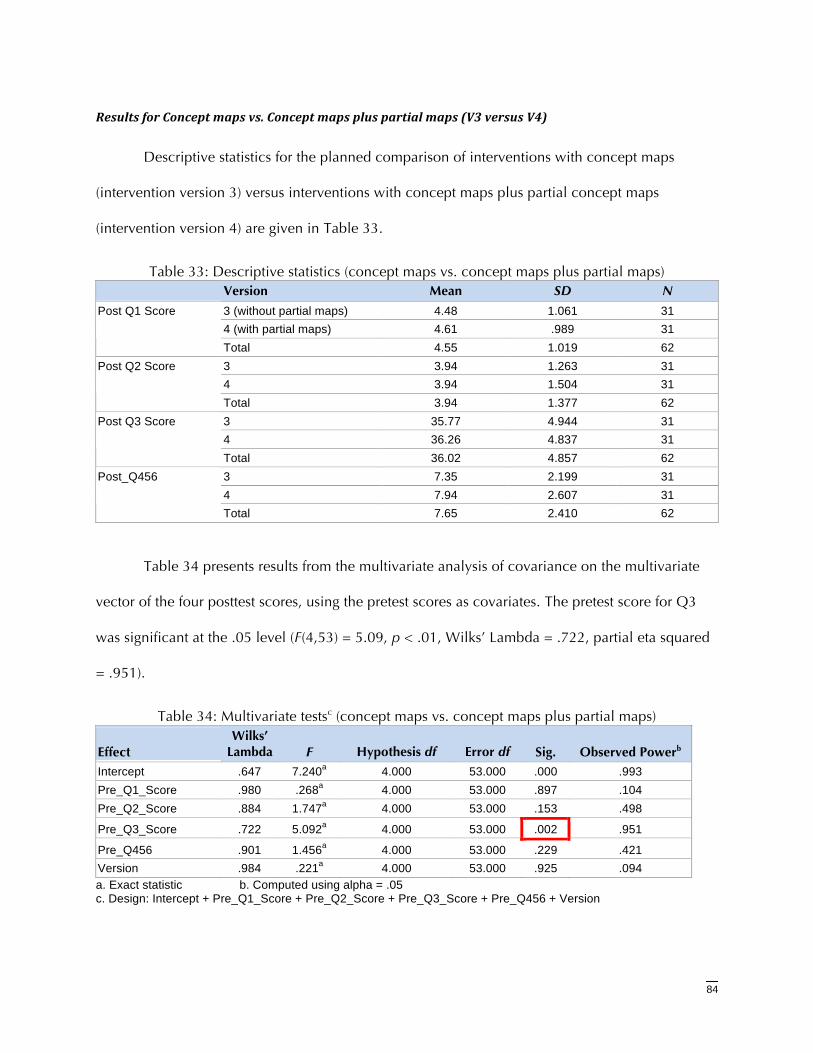
84
ResultsforConceptmapsvs.Conceptmapspluspartialmaps(V3versusV4)
Descriptive statistics for the planned comparison of interventions with concept maps
(intervention version 3) versus interventions with concept maps plus partial concept maps
(intervention version 4) are given in Table 33.
Table 33: Descriptive statistics (concept maps vs. concept maps plus partial maps) Version Mean SD N
3 (without partial maps) 4.48 1.061 31 4 (with partial maps) 4.61 .989 31
Post Q1 Score
Total 4.55 1.019 62 3 3.94 1.263 31 4 3.94 1.504 31
Post Q2 Score
Total 3.94 1.377 62 3 35.77 4.944 31 4 36.26 4.837 31
Post Q3 Score
Total 36.02 4.857 62 3 7.35 2.199 31 4 7.94 2.607 31
Post_Q456
Total 7.65 2.410 62
Table 34 presents results from the multivariate analysis of covariance on the multivariate
vector of the four posttest scores, using the pretest scores as covariates. The pretest score for Q3
was significant at the .05 level (F(4,53) = 5.09, p < .01, Wilks’ Lambda = .722, partial eta squared
= .951).
Table 34: Multivariate testsc (concept maps vs. concept maps plus partial maps)
Effect Wilks’
Lambda F Hypothesis df Error df Sig. Observed Powerb Intercept .647 7.240a 4.000 53.000 .000 .993 Pre_Q1_Score .980 .268a 4.000 53.000 .897 .104 Pre_Q2_Score .884 1.747a 4.000 53.000 .153 .498
Pre_Q3_Score .722 5.092a 4.000 53.000 .002 .951
Pre_Q456 .901 1.456a 4.000 53.000 .229 .421 Version .984 .221a 4.000 53.000 .925 .094 a. Exact statistic b. Computed using alpha = .05 c. Design: Intercept + Pre_Q1_Score + Pre_Q2_Score + Pre_Q3_Score + Pre_Q456 + Version
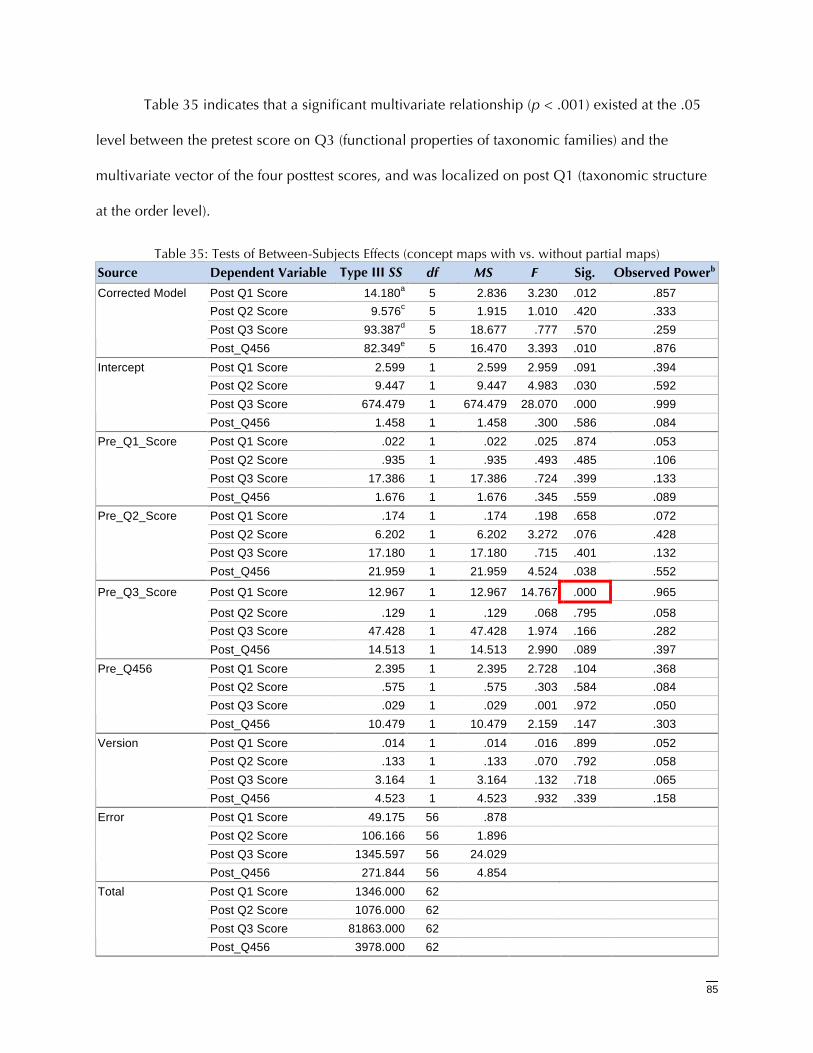
85
Table 35 indicates that a significant multivariate relationship (p < .001) existed at the .05
level between the pretest score on Q3 (functional properties of taxonomic families) and the
multivariate vector of the four posttest scores, and was localized on post Q1 (taxonomic structure
at the order level).
Table 35: Tests of Between-Subjects Effects (concept maps with vs. without partial maps) Source Dependent Variable Type III SS df MS F Sig. Observed Powerb
Post Q1 Score 14.180a 5 2.836 3.230 .012 .857 Post Q2 Score 9.576c 5 1.915 1.010 .420 .333 Post Q3 Score 93.387d 5 18.677 .777 .570 .259
Corrected Model
Post_Q456 82.349e 5 16.470 3.393 .010 .876 Post Q1 Score 2.599 1 2.599 2.959 .091 .394 Post Q2 Score 9.447 1 9.447 4.983 .030 .592 Post Q3 Score 674.479 1 674.479 28.070 .000 .999
Intercept
Post_Q456 1.458 1 1.458 .300 .586 .084 Post Q1 Score .022 1 .022 .025 .874 .053 Post Q2 Score .935 1 .935 .493 .485 .106 Post Q3 Score 17.386 1 17.386 .724 .399 .133
Pre_Q1_Score
Post_Q456 1.676 1 1.676 .345 .559 .089 Post Q1 Score .174 1 .174 .198 .658 .072 Post Q2 Score 6.202 1 6.202 3.272 .076 .428 Post Q3 Score 17.180 1 17.180 .715 .401 .132
Pre_Q2_Score
Post_Q456 21.959 1 21.959 4.524 .038 .552
Post Q1 Score 12.967 1 12.967 14.767 .000 .965
Post Q2 Score .129 1 .129 .068 .795 .058 Post Q3 Score 47.428 1 47.428 1.974 .166 .282
Pre_Q3_Score
Post_Q456 14.513 1 14.513 2.990 .089 .397 Post Q1 Score 2.395 1 2.395 2.728 .104 .368 Post Q2 Score .575 1 .575 .303 .584 .084 Post Q3 Score .029 1 .029 .001 .972 .050
Pre_Q456
Post_Q456 10.479 1 10.479 2.159 .147 .303 Post Q1 Score .014 1 .014 .016 .899 .052 Post Q2 Score .133 1 .133 .070 .792 .058 Post Q3 Score 3.164 1 3.164 .132 .718 .065
Version
Post_Q456 4.523 1 4.523 .932 .339 .158 Post Q1 Score 49.175 56 .878 Post Q2 Score 106.166 56 1.896 Post Q3 Score 1345.597 56 24.029
Error
Post_Q456 271.844 56 4.854 Post Q1 Score 1346.000 62 Post Q2 Score 1076.000 62 Post Q3 Score 81863.000 62
Total
Post_Q456 3978.000 62

86
Source Dependent Variable Type III SS df MS F Sig. Observed Powerb
Post Q1 Score 63.355 61 Post Q2 Score 115.742 61 Post Q3 Score 1438.984 61
Corrected Total
Post_Q456 354.194 61 a. R Squared = .224 (Adjusted R Squared = .155) b. Computed using alpha = .05 c. R Squared = .083 (Adjusted R Squared = .001) d. R Squared = .065 (Adjusted R Squared = -.019) e. R Squared = .232 (Adjusted R Squared = .164)
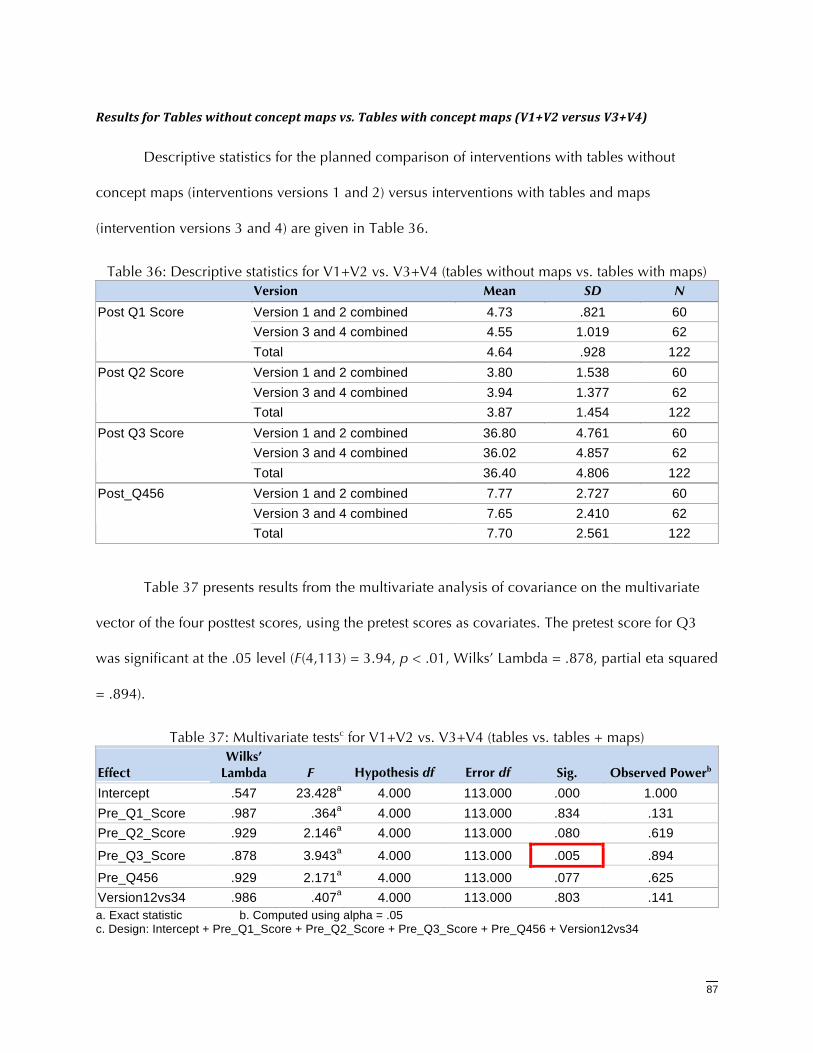
87
ResultsforTableswithoutconceptmapsvs.Tableswithconceptmaps(V1+V2versusV3+V4)
Descriptive statistics for the planned comparison of interventions with tables without
concept maps (interventions versions 1 and 2) versus interventions with tables and maps
(intervention versions 3 and 4) are given in Table 36.
Table 36: Descriptive statistics for V1+V2 vs. V3+V4 (tables without maps vs. tables with maps) Version Mean SD N
Version 1 and 2 combined 4.73 .821 60 Version 3 and 4 combined 4.55 1.019 62
Post Q1 Score
Total 4.64 .928 122 Version 1 and 2 combined 3.80 1.538 60 Version 3 and 4 combined 3.94 1.377 62
Post Q2 Score
Total 3.87 1.454 122 Version 1 and 2 combined 36.80 4.761 60 Version 3 and 4 combined 36.02 4.857 62
Post Q3 Score
Total 36.40 4.806 122 Version 1 and 2 combined 7.77 2.727 60 Version 3 and 4 combined 7.65 2.410 62
Post_Q456
Total 7.70 2.561 122
Table 37 presents results from the multivariate analysis of covariance on the multivariate
vector of the four posttest scores, using the pretest scores as covariates. The pretest score for Q3
was significant at the .05 level (F(4,113) = 3.94, p < .01, Wilks’ Lambda = .878, partial eta squared
= .894).
Table 37: Multivariate testsc for V1+V2 vs. V3+V4 (tables vs. tables + maps)
Effect Wilks’
Lambda F Hypothesis df Error df Sig. Observed Powerb
Intercept .547 23.428a 4.000 113.000 .000 1.000 Pre_Q1_Score .987 .364a 4.000 113.000 .834 .131 Pre_Q2_Score .929 2.146a 4.000 113.000 .080 .619
Pre_Q3_Score .878 3.943a 4.000 113.000 .005 .894
Pre_Q456 .929 2.171a 4.000 113.000 .077 .625 Version12vs34 .986 .407a 4.000 113.000 .803 .141 a. Exact statistic b. Computed using alpha = .05 c. Design: Intercept + Pre_Q1_Score + Pre_Q2_Score + Pre_Q3_Score + Pre_Q456 + Version12vs34
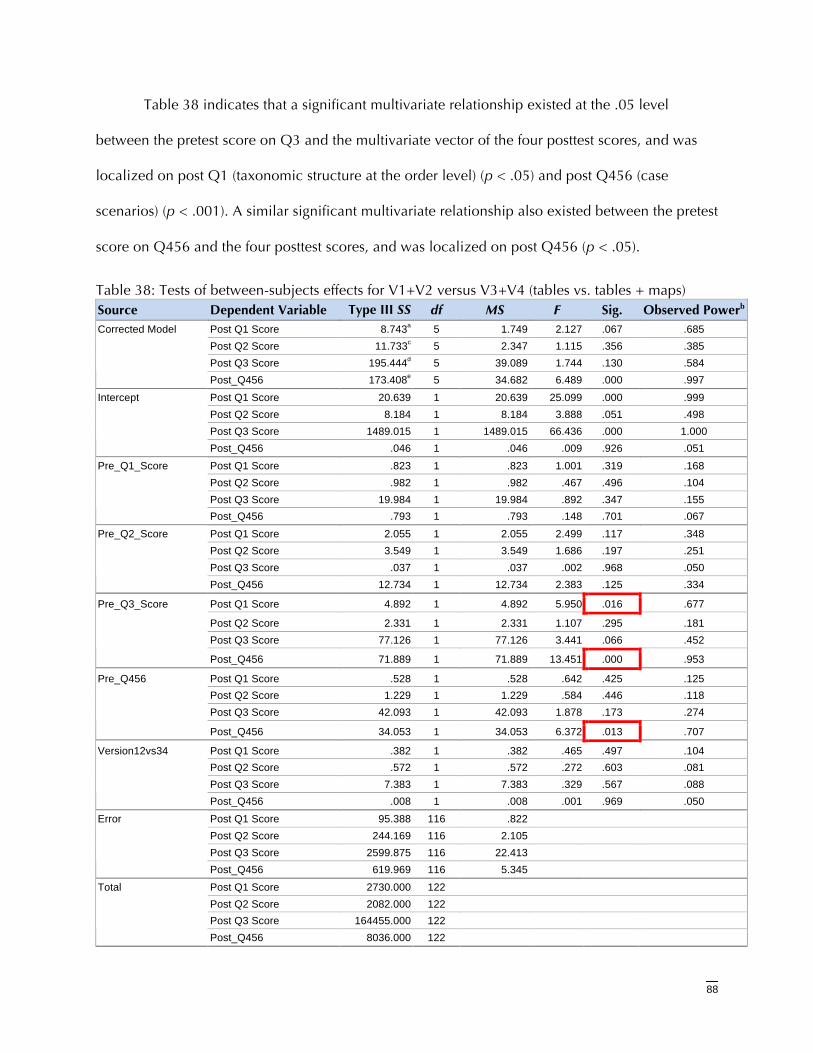
88
Table 38 indicates that a significant multivariate relationship existed at the .05 level
between the pretest score on Q3 and the multivariate vector of the four posttest scores, and was
localized on post Q1 (taxonomic structure at the order level) (p < .05) and post Q456 (case
scenarios) (p < .001). A similar significant multivariate relationship also existed between the pretest
score on Q456 and the four posttest scores, and was localized on post Q456 (p < .05).
Table 38: Tests of between-subjects effects for V1+V2 versus V3+V4 (tables vs. tables + maps) Source Dependent Variable Type III SS df MS F Sig. Observed Powerb
Post Q1 Score 8.743a 5 1.749 2.127 .067 .685 Post Q2 Score 11.733c 5 2.347 1.115 .356 .385 Post Q3 Score 195.444d 5 39.089 1.744 .130 .584
Corrected Model
Post_Q456 173.408e 5 34.682 6.489 .000 .997
Post Q1 Score 20.639 1 20.639 25.099 .000 .999 Post Q2 Score 8.184 1 8.184 3.888 .051 .498 Post Q3 Score 1489.015 1 1489.015 66.436 .000 1.000
Intercept
Post_Q456 .046 1 .046 .009 .926 .051
Post Q1 Score .823 1 .823 1.001 .319 .168 Post Q2 Score .982 1 .982 .467 .496 .104 Post Q3 Score 19.984 1 19.984 .892 .347 .155
Pre_Q1_Score
Post_Q456 .793 1 .793 .148 .701 .067
Post Q1 Score 2.055 1 2.055 2.499 .117 .348 Post Q2 Score 3.549 1 3.549 1.686 .197 .251 Post Q3 Score .037 1 .037 .002 .968 .050
Pre_Q2_Score
Post_Q456 12.734 1 12.734 2.383 .125 .334
Post Q1 Score 4.892 1 4.892 5.950 .016 .677
Post Q2 Score 2.331 1 2.331 1.107 .295 .181 Post Q3 Score 77.126 1 77.126 3.441 .066 .452
Pre_Q3_Score
Post_Q456 71.889 1 71.889 13.451 .000 .953
Post Q1 Score .528 1 .528 .642 .425 .125 Post Q2 Score 1.229 1 1.229 .584 .446 .118 Post Q3 Score 42.093 1 42.093 1.878 .173 .274
Pre_Q456
Post_Q456 34.053 1 34.053 6.372 .013 .707
Post Q1 Score .382 1 .382 .465 .497 .104 Post Q2 Score .572 1 .572 .272 .603 .081 Post Q3 Score 7.383 1 7.383 .329 .567 .088
Version12vs34
Post_Q456 .008 1 .008 .001 .969 .050
Post Q1 Score 95.388 116 .822 Post Q2 Score 244.169 116 2.105 Post Q3 Score 2599.875 116 22.413
Error
Post_Q456 619.969 116 5.345
Post Q1 Score 2730.000 122 Post Q2 Score 2082.000 122 Post Q3 Score 164455.000 122
Total
Post_Q456 8036.000 122

89
Post Q1 Score 104.131 121 Post Q2 Score 255.902 121 Post Q3 Score 2795.320 121
Corrected Total
Post_Q456 793.377 121 a. R Squared = .084 (Adjusted R Squared = .044) b. Computed using alpha = .0 c. R Squared = .046 (Adjusted R Squared = .005) d. R Squared = .070 (Adjusted R Squared = .030) e. R Squared = .219 (Adjusted R Squared = .185)
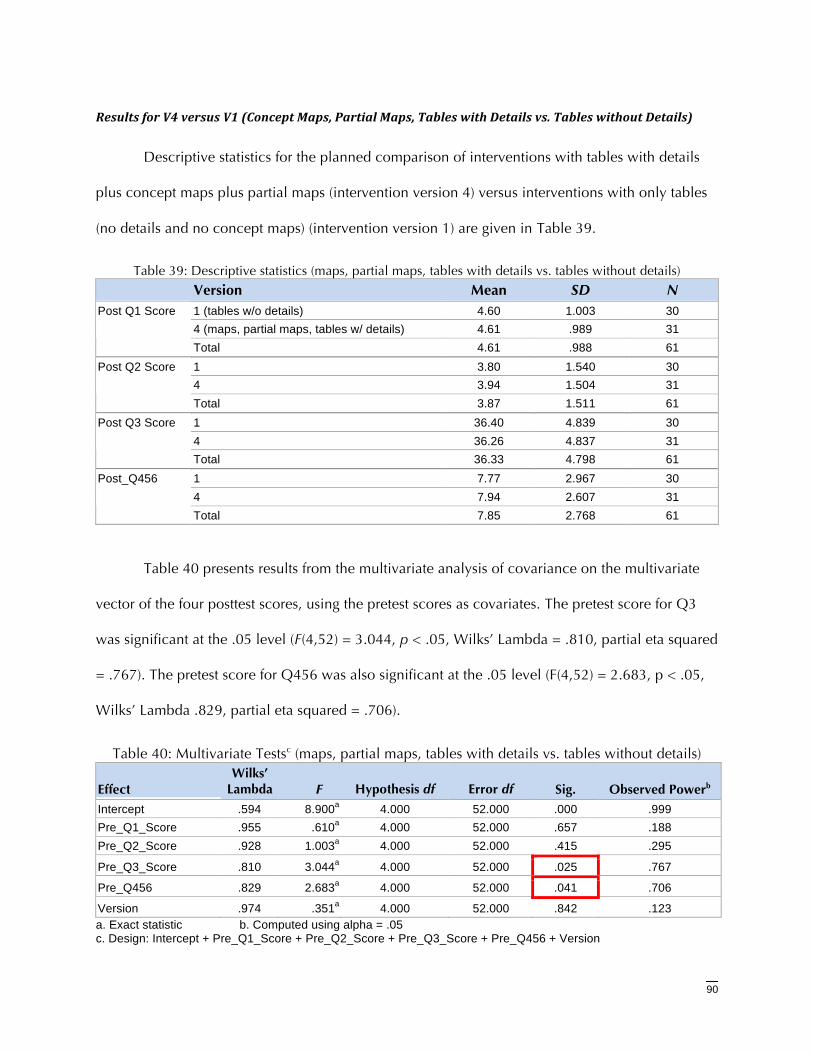
90
ResultsforV4versusV1(ConceptMaps,PartialMaps,TableswithDetailsvs.TableswithoutDetails)
Descriptive statistics for the planned comparison of interventions with tables with details
plus concept maps plus partial maps (intervention version 4) versus interventions with only tables
(no details and no concept maps) (intervention version 1) are given in Table 39.
Table 39: Descriptive statistics (maps, partial maps, tables with details vs. tables without details)
Version Mean SD N 1 (tables w/o details) 4.60 1.003 30 4 (maps, partial maps, tables w/ details) 4.61 .989 31
Post Q1 Score
Total 4.61 .988 61 1 3.80 1.540 30 4 3.94 1.504 31
Post Q2 Score
Total 3.87 1.511 61 1 36.40 4.839 30 4 36.26 4.837 31
Post Q3 Score
Total 36.33 4.798 61 1 7.77 2.967 30 4 7.94 2.607 31
Post_Q456
Total 7.85 2.768 61
Table 40 presents results from the multivariate analysis of covariance on the multivariate
vector of the four posttest scores, using the pretest scores as covariates. The pretest score for Q3
was significant at the .05 level (F(4,52) = 3.044, p < .05, Wilks’ Lambda = .810, partial eta squared
= .767). The pretest score for Q456 was also significant at the .05 level (F(4,52) = 2.683, p < .05,
Wilks’ Lambda .829, partial eta squared = .706).
Table 40: Multivariate Testsc (maps, partial maps, tables with details vs. tables without details)
Effect Wilks’
Lambda F Hypothesis df Error df Sig. Observed Powerb
Intercept .594 8.900a 4.000 52.000 .000 .999 Pre_Q1_Score .955 .610a 4.000 52.000 .657 .188 Pre_Q2_Score .928 1.003a 4.000 52.000 .415 .295
Pre_Q3_Score .810 3.044a 4.000 52.000 .025 .767
Pre_Q456 .829 2.683a 4.000 52.000 .041 .706
Version .974 .351a 4.000 52.000 .842 .123 a. Exact statistic b. Computed using alpha = .05 c. Design: Intercept + Pre_Q1_Score + Pre_Q2_Score + Pre_Q3_Score + Pre_Q456 + Version
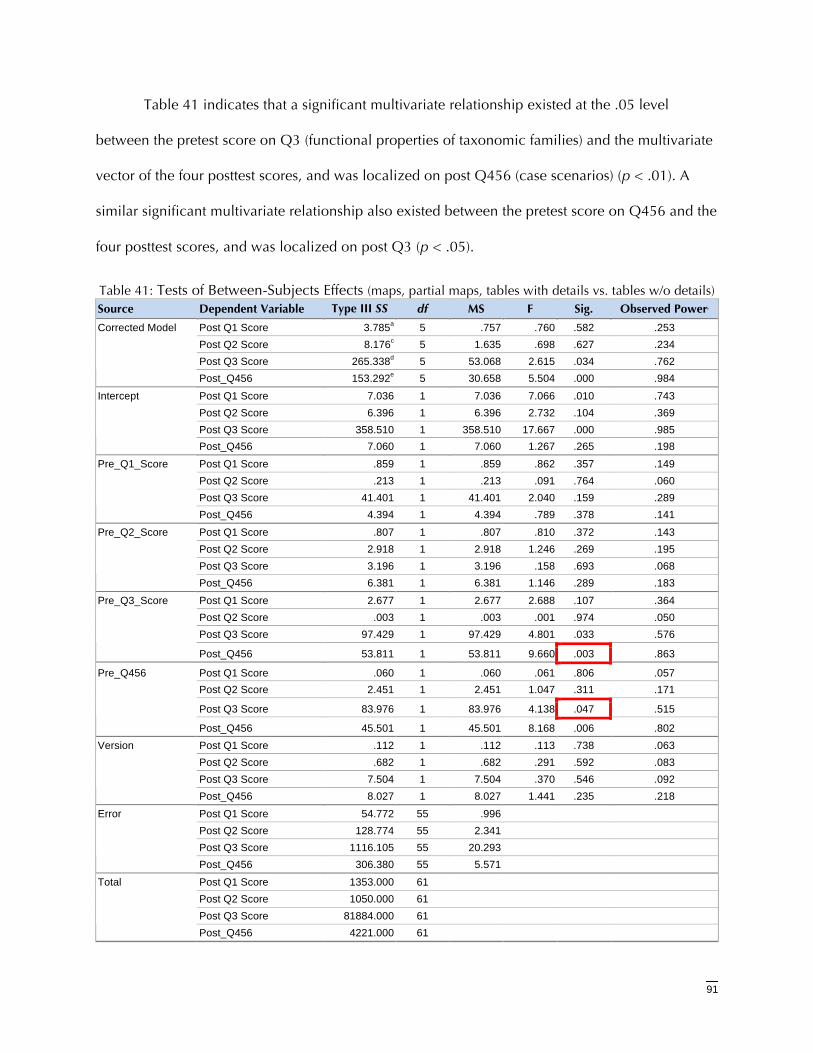
91
Table 41 indicates that a significant multivariate relationship existed at the .05 level
between the pretest score on Q3 (functional properties of taxonomic families) and the multivariate
vector of the four posttest scores, and was localized on post Q456 (case scenarios) (p < .01). A
similar significant multivariate relationship also existed between the pretest score on Q456 and the
four posttest scores, and was localized on post Q3 (p < .05).
Table 41: Tests of Between-Subjects Effects (maps, partial maps, tables with details vs. tables w/o details) Source Dependent Variable Type III SS df MS F Sig. Observed Powerb
Post Q1 Score 3.785a 5 .757 .760 .582 .253 Post Q2 Score 8.176c 5 1.635 .698 .627 .234 Post Q3 Score 265.338d 5 53.068 2.615 .034 .762
Corrected Model
Post_Q456 153.292e 5 30.658 5.504 .000 .984
Post Q1 Score 7.036 1 7.036 7.066 .010 .743 Post Q2 Score 6.396 1 6.396 2.732 .104 .369 Post Q3 Score 358.510 1 358.510 17.667 .000 .985
Intercept
Post_Q456 7.060 1 7.060 1.267 .265 .198
Post Q1 Score .859 1 .859 .862 .357 .149 Post Q2 Score .213 1 .213 .091 .764 .060 Post Q3 Score 41.401 1 41.401 2.040 .159 .289
Pre_Q1_Score
Post_Q456 4.394 1 4.394 .789 .378 .141
Post Q1 Score .807 1 .807 .810 .372 .143 Post Q2 Score 2.918 1 2.918 1.246 .269 .195 Post Q3 Score 3.196 1 3.196 .158 .693 .068
Pre_Q2_Score
Post_Q456 6.381 1 6.381 1.146 .289 .183
Post Q1 Score 2.677 1 2.677 2.688 .107 .364 Post Q2 Score .003 1 .003 .001 .974 .050 Post Q3 Score 97.429 1 97.429 4.801 .033 .576
Pre_Q3_Score
Post_Q456 53.811 1 53.811 9.660 .003 .863
Post Q1 Score .060 1 .060 .061 .806 .057 Post Q2 Score 2.451 1 2.451 1.047 .311 .171
Post Q3 Score 83.976 1 83.976 4.138 .047 .515
Pre_Q456
Post_Q456 45.501 1 45.501 8.168 .006 .802 Post Q1 Score .112 1 .112 .113 .738 .063 Post Q2 Score .682 1 .682 .291 .592 .083 Post Q3 Score 7.504 1 7.504 .370 .546 .092
Version
Post_Q456 8.027 1 8.027 1.441 .235 .218
Post Q1 Score 54.772 55 .996 Post Q2 Score 128.774 55 2.341 Post Q3 Score 1116.105 55 20.293
Error
Post_Q456 306.380 55 5.571
Post Q1 Score 1353.000 61 Post Q2 Score 1050.000 61 Post Q3 Score 81884.000 61
Total
Post_Q456 4221.000 61

92
Source Dependent Variable Type III SS df MS F Sig. Observed Powerb
Post Q1 Score 58.557 60 Post Q2 Score 136.951 60 Post Q3 Score 1381.443 60
Corrected Total
Post_Q456 459.672 60 a. R Squared = .065 (Adjusted R Squared = -.020) b. Computed using alpha = .05 c. R Squared = .060 (Adjusted R Squared = -.026) d. R Squared = .192 (Adjusted R Squared = .119) e. R Squared = .333 (Adjusted R Squared = .273)
93
AttitudeTowardTaxonomyQuestionnaire
The Attitude Toward Taxonomy questionnaire (Appendix F: Attitude Toward Taxonomy
Questionnaire, page 127) was intended to address the research question “What are student
attitudes and preconceptions concerning taxonomy?”
Reliability
Internal consistency of the Attitude Toward Taxonomy Questionnaire was evaluated using
SPSS’s Reliability Analysis procedure. Two items, “I flipped back and forth in the book and/or
notes when studying”, and “Did you have any parasitology coursework prior to this semester?”
were not considered in the reliability assessment of the Attitude Toward Taxonomy questionnaire,
as they were included on that instrument simply for ease of data collection. Reliability for the
remaining eight items on the Attitude Toward Taxonomy questionnaire showed acceptable
internal consistency, with a Cronbach alpha coefficient of .74.
Results
One hundred twenty four (124) valid responses were received. Descriptive statistics are
given in Table 42.
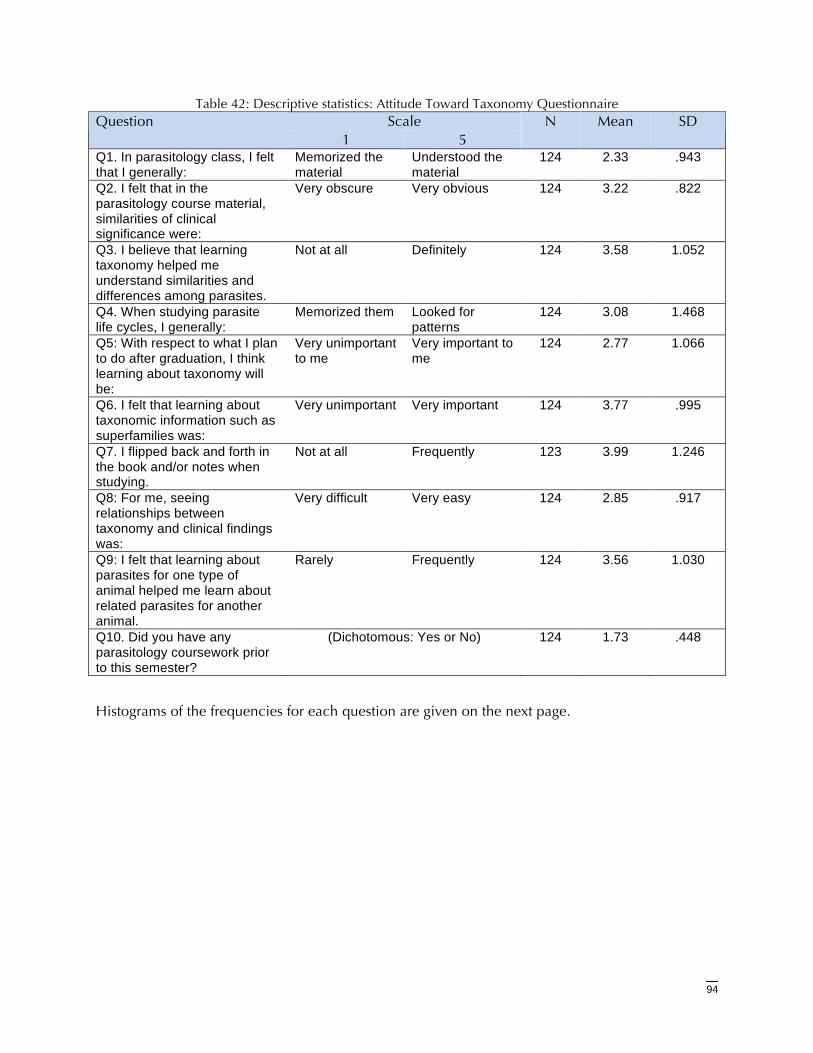
94
Table 42: Descriptive statistics: Attitude Toward Taxonomy Questionnaire Scale Question
1 5 N Mean
SD
Q1. In parasitology class, I felt that I generally:
Memorized the material
Understood the material
124 2.33 .943
Q2. I felt that in the parasitology course material, similarities of clinical significance were:
Very obscure Very obvious 124 3.22 .822
Q3. I believe that learning taxonomy helped me understand similarities and differences among parasites.
Not at all Definitely 124 3.58 1.052
Q4. When studying parasite life cycles, I generally:
Memorized them Looked for patterns
124 3.08 1.468
Q5: With respect to what I plan to do after graduation, I think learning about taxonomy will be:
Very unimportant to me
Very important to me
124 2.77 1.066
Q6. I felt that learning about taxonomic information such as superfamilies was:
Very unimportant Very important 124 3.77 .995
Q7. I flipped back and forth in the book and/or notes when studying.
Not at all Frequently 123 3.99 1.246
Q8: For me, seeing relationships between taxonomy and clinical findings was:
Very difficult Very easy 124 2.85 .917
Q9: I felt that learning about parasites for one type of animal helped me learn about related parasites for another animal.
Rarely Frequently 124 3.56 1.030
Q10. Did you have any parasitology coursework prior to this semester?
(Dichotomous: Yes or No) 124 1.73 .448
Histograms of the frequencies for each question are given on the next page.
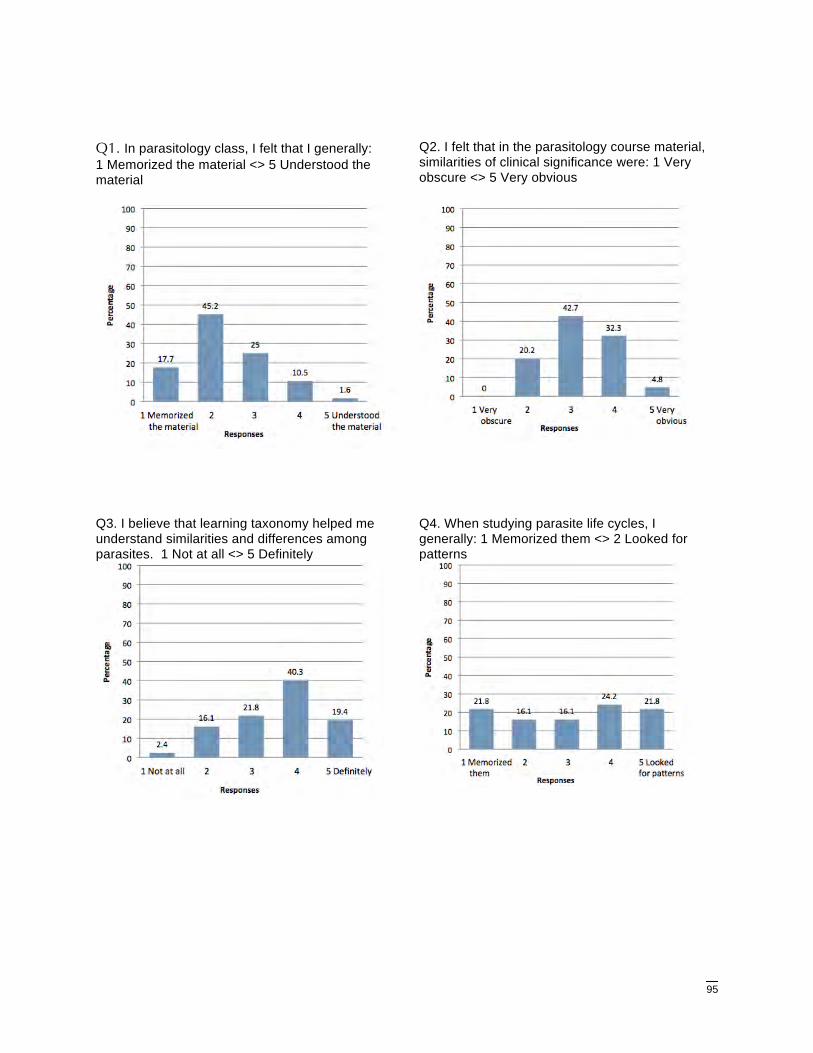
95
Q1. In parasitology class, I felt that I generally: 1 Memorized the material <> 5 Understood the material
Q2. I felt that in the parasitology course material, similarities of clinical significance were: 1 Very obscure <> 5 Very obvious
Q3. I believe that learning taxonomy helped me understand similarities and differences among parasites. 1 Not at all <> 5 Definitely
Q4. When studying parasite life cycles, I generally: 1 Memorized them <> 2 Looked for patterns
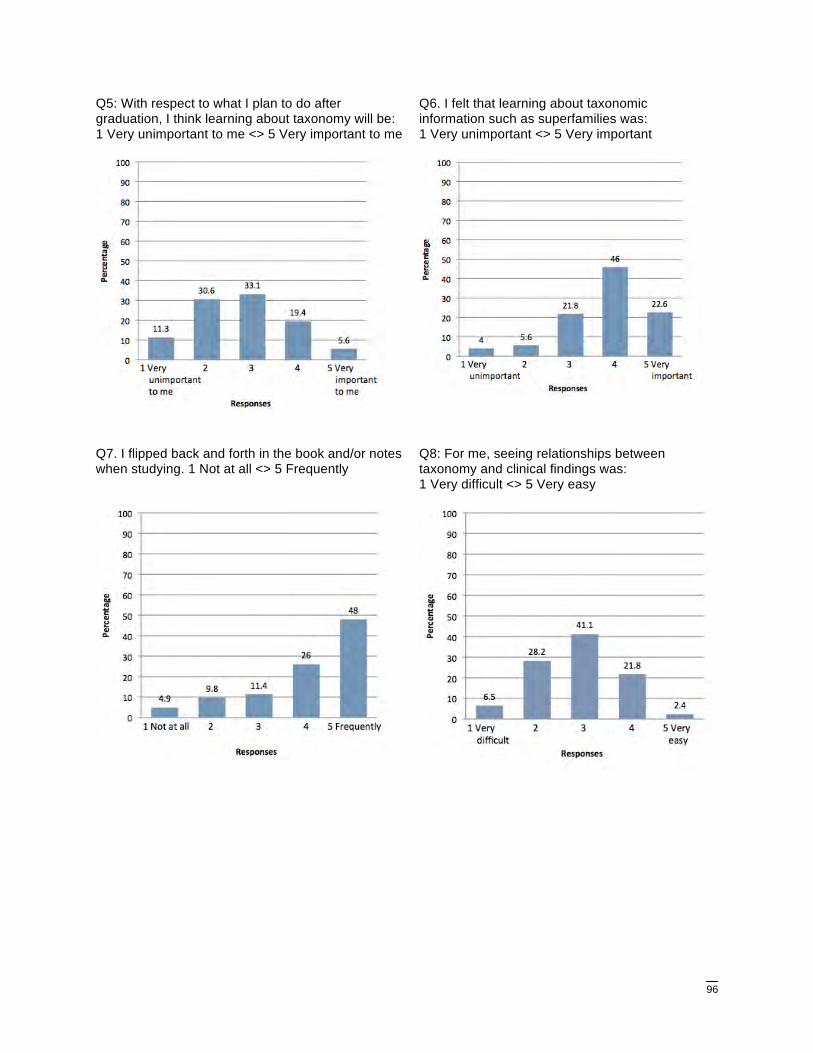
96
Q5: With respect to what I plan to do after graduation, I think learning about taxonomy will be: 1 Very unimportant to me <> 5 Very important to me
Q6. I felt that learning about taxonomic information such as superfamilies was: 1 Very unimportant <> 5 Very important
Q7. I flipped back and forth in the book and/or notes when studying. 1 Not at all <> 5 Frequently
Q8: For me, seeing relationships between taxonomy and clinical findings was: 1 Very difficult <> 5 Very easy
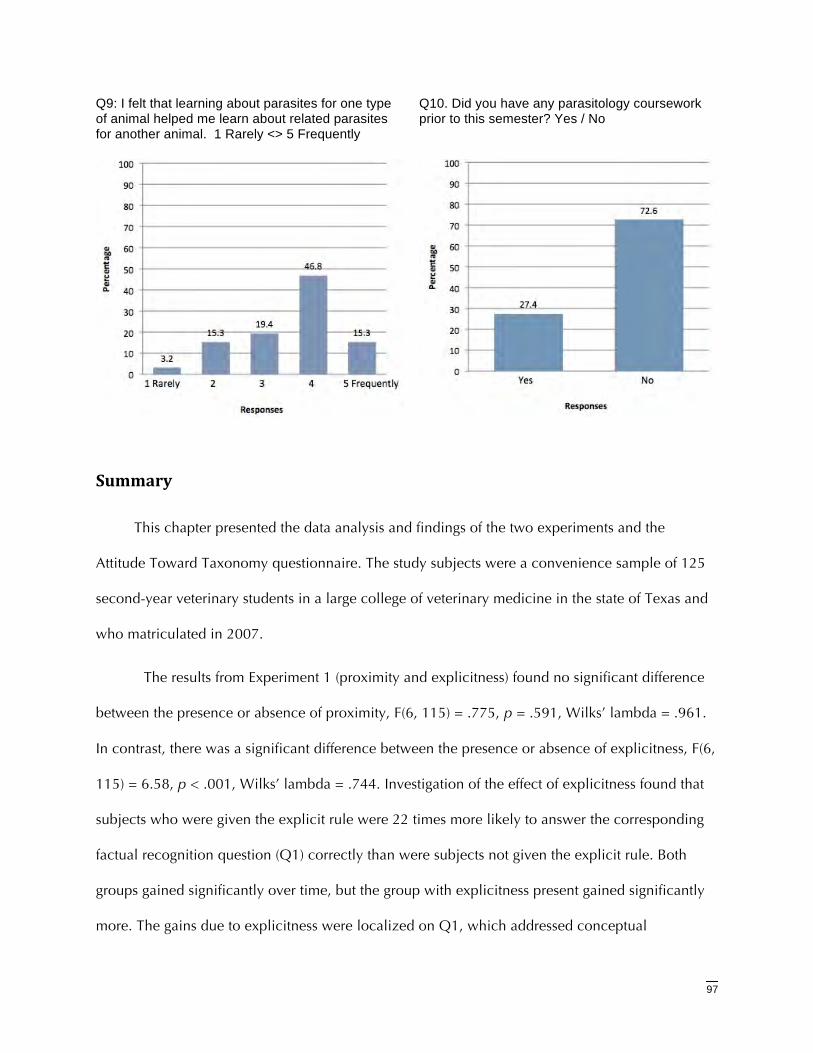
97
Q9: I felt that learning about parasites for one type of animal helped me learn about related parasites for another animal. 1 Rarely <> 5 Frequently
Q10. Did you have any parasitology coursework prior to this semester? Yes / No
Summary
This chapter presented the data analysis and findings of the two experiments and the
Attitude Toward Taxonomy questionnaire. The study subjects were a convenience sample of 125
second-year veterinary students in a large college of veterinary medicine in the state of Texas and
who matriculated in 2007.
The results from Experiment 1 (proximity and explicitness) found no significant difference
between the presence or absence of proximity, F(6, 115) = .775, p = .591, Wilks’ lambda = .961.
In contrast, there was a significant difference between the presence or absence of explicitness, F(6,
115) = 6.58, p < .001, Wilks’ lambda = .744. Investigation of the effect of explicitness found that
subjects who were given the explicit rule were 22 times more likely to answer the corresponding
factual recognition question (Q1) correctly than were subjects not given the explicit rule. Both
groups gained significantly over time, but the group with explicitness present gained significantly
more. The gains due to explicitness were localized on Q1, which addressed conceptual
98
understanding (p < .001, alpha = .05), and Q3, which addressed the relationship between
taxonomy and intermediate host (p = .041, alpha =.05). However, these gains had no significant
effect on Q6, the clinical problem solving question. The presence of an explicit rule had no
significant effect on subjects’ ability to correctly answer the clinical problems posed in Q6. In
other words, on the posttest, subjects who had been given the explicit rule were able to correctly
recognize the parts of the rule; however, they were not able to correctly implement the rule in
clinical problem solving. Even though a significant effect of explicitness was found on the ability of
subjects to identify the rule, the two null hypotheses addressed by this experiment concerned the
effect of proximity and explicitness on the ability to solve clinical problems. Therefore, these two
null hypotheses could not be rejected. Possible reasons for this finding are discussed in the next
chapter.
The results from Experiment 2 (representation and proximity) found no significant
difference in subjects’ clinical problem solving ability, regardless of the type of representation
used. Subjects performed at approximately the same level whether they were given a table with no
additional detailed information, a table with details, a table with details and a concept map, or a
table with details, a concept map, and partial concept maps placed in proximity to the relevant
text passage. Therefore, the four null hypotheses addressed by this experiment, H03, H04, H05, and
H06, could not be rejected.
However, Experiment 2 found a powerful relationship (p < .001) between the pretest
question regarding functional properties of taxonomic families (Q3) and the ability of students to
correctly solve the clinical cases (Q456). While not related to the research questions, the
significance of this serendipitous finding is discussed in depth in Chapter 5.
The Attitude Toward Taxonomy questionnaire was used to assess student attitudes toward
taxonomy. A question regarding proximity of material in their text or class notes was included for
99
convenience. This question found that using a five-point semantic differential scale of 1=Never
and 5=Frequently, a majority of students “flipped back and forth in their book or notes when
studying” (mean = 3.99, SD = 1.246). Two questions regarding memorization were also included.
While one question (Q1) indicated a tendency of students to memorize (mean=2.33, SD=.943),
another question (Q4) found a fairly even distribution of learning styles, from memorization to
looking for patterns.
The next chapter presents conclusions and discussion based on the findings of the
research, which investigated the effects of proximity, explicitness, and representation of basic
science material on student clinical problem solving. Implications and recommendations for
further study are also presented in the following chapter.
100
ChapterVConclusions,Discussion,Implications,andRecommendations
This chapter presents conclusions and discussion based on the findings of the research,
which investigated the effects of proximity, explicitness, and representations (PER) of basic science
material on student clinical problem solving. Implications and recommendations for further study
are presented. The chapter concludes with a summary.
Conclusions
ProximityandExplicitnessExperiment(Experiment1)
The first hypothesis investigated in this study was that learning materials that place
significant information in proximity will significantly improve student learning, as measured by the
student's ability to solve clinical case scenarios accurately, as compared to learning materials that
utilize a typical text representation. This study found no significant difference in total test score for
proximity at the test level. However, placing the genus and its intermediate host in proximity in
text produced a significant effect on student learning for related questions, but not for the ability to
solve clinical cases. Therefore, the null hypothesis H01 could not be rejected.
The second hypothesis investigated in this study was that learning materials that explicitly
state relationships between information will significantly improve student learning, as measured by
the student's ability to solve clinical case scenarios accurately, as compared to learning materials
that do not explicitly state these relationships. As with the first hypothesis, this study found no
significant difference in total test score for explicitness at the test level. Explicitly stating the rule
governing the relationship between taxonomy, intermediate host, and body site significantly
improved student ability to recognize those factors; however, it did not significantly improve
101
student ability to solve clinical cases. In other words, students could correctly answer questions
about the rule but could not apply the rule in clinical problem solving. The null hypothesis H02
could not be rejected.
RepresentationandProximityExperiment(Experiment2)
Neither the type of representation nor the proximity of facts in those representations
appeared to have any significant effect on clinical problem solving. There was no significant
difference in total test score whether students were given simple tables or tables with detailed
information, concept maps in addition to detailed tables, or partial concept maps in proximity to
text in addition to both concept maps and tables with detailed information. Therefore, none of the
four hypotheses regarding representation and proximity, H03 through H06, could be rejected.
However, a serendipitous finding from this study was a strong correlation (p < .001)
between students’ scores regarding functional taxonomic properties and their ability to correctly
answer questions regarding clinical cases. If the student understood the functional properties of
each taxonomic family, the student could apply this knowledge in solving the clinical cases, in
effect, bridging the divide between the basic science and clinical problem solving described by
Patel in her work with medical students (Patel, et al., 1993). This result also supports Norman’s
findings that well-structured knowledge (in this case, the structure and properties of the relevant
portion of the Linnaean taxonomy) is necessary for solving clinical problems caused by a given
parasite.
AttitudeTowardTaxonomyQuestionnaire
The results of Question 1, “In parasitology class, I felt that I generally [Memorized the
material <> Understood the material” showed that a majority of students were below the mean.
This indicates a strong tendency toward memorization. Few students responded that they felt they
102
generally understood the material. This finding correlates with Regan-Smith’s observations
concerning memorization among medical school students (Regan-Smith, 1992).
Discussion
The initial premise of this research was that three factors, proximity, representation, and
explicitness, are barriers to inferring information from facts, and that those barriers must be
overcome before students can achieve meaningful learning, measured in this study by the ability
to solve clinical problems. However, neither of the experiments indicated a statistically significant
effect on clinical problem solving ability for any of the three factors.
ProximityandExplicitnessExperiment(Experiment1)
Consider the proximity and explicitness (PET) experiment in the context of one performed
by Wason (Wason, 1960). In that experiment, subjects were given several sets of three numbers,
such as 2, 4, and 6. The subjects were then asked to derive the rule governing the sets. An
example rule might be “the next number is always 2 more than the last number in the set.” Even
with simple sets of three numbers, and being asked to find the rule governing the set, some
subjects derived incorrect rules. It is then not surprising that the subjects in the PET experiment
were unable to derive a rule from a substantial amount of text.
However, the inability to reject the null hypotheses regarding the use of data in proximity
appears to be a direct contradiction to Wickens’ proximity compatibility principle, which states in
part that if multiple data need to be considered for deriving information, then those data must be
displayed adjacent to each other (Wickens & Hollands, 2000). Therefore, one year after the initial
data collection, an informal exercise was conducted using the subsequent class of second-year
veterinary students. The exercise consisted of a discussion led by the researcher, who wrote ten
parasite names on a blackboard. The class was then asked which animal host each parasite
103
infected, as well as the location in the host’s body where the adult parasite could be found. The
students were then instructed to copy this chart to their notes and to study it. Observation of the
students during this exercise suggested to the researcher that the students were concentrating on
memorizing the rows in the chart. Not until the students were specifically asked the question, “Do
you see a pattern here?” did they notice that certain patterns existed and that they could categorize
organisms by host and body location. This anecdotal observation provides insight into the findings
from this study. In aggregate, these findings suggest that it is not enough to present the information
in proximity, but that there may need to be explicit cues to the student to look for patterns in the
presented data. These findings also indicate that the proximity compatibility principle may only
apply in an educational context when the learner is actually searching for multiple pieces of data
in order to accomplish a specific goal. If the learner does not realize that multiple pieces of data
are related, then search for those pieces of data does not occur.
The informal exercise described above also suggests that Regan-Smith’s findings regarding
memorization by medical students (Regan-Smith, 1992) may also apply to veterinary students.
Aaron and Skakun theorize that pressure and competition for high grade point averages causes
undergraduates who are planning to apply to medical school to use rote or “superficial” learning.
In other words, they study primarily for passing tests as opposed to working to understand the
relationships in material (Aaron & Skakun, 1999). This same phenomenon may also apply to
veterinary students, as evidenced by the findings of the Attitudes Toward Taxonomy questionnaire,
where the majority of students were below the mean on a question regarding memorization versus
understanding. This finding correlates with Regan-Smith’s findings concerning memorization
among medical school students (Regan-Smith, 1992). Placing data in proximity may simply have
facilitated memorization by the subjects. Further research, perhaps using think-aloud protocols,
would need to address whether that is the case.
104
This experiment also supports Mayer’s position (Mayer, 2004) that learners must be given
guidance and not be expected to discover relationships in material on their own. Mayer (2004)
summarizes findings by Shulman and Keisler, where “Apparently, some students do not learn the
rule or principle under pure discovery methods, so some appropriate amount of guidance is
required to help mentally construct the desired learning outcome.” (Mayer, 2004, p. 15).
Finally, the lack of statistically significant results for the inclusion of an explicit rule was
unexpected. Subjects given the explicit rule were able to correctly identify the parts of the rule;
however, they were unable to apply the rule in solving the clinical cases. This may be due to the
fact that correct application of the rule was dependent on the subject possessing knowledge of the
parent-child relationships of the taxonomy, specifically, the order Spirurida. Without that
knowledge they were unable to solve the clinical cases, regardless of the expression of the rule.
RepresentationandProximityExperiment(Experiment2)
The inability to reject the null hypotheses regarding the use of tables and concept maps
appears to be a direct contradiction to the representation effect, which states that the type of
representation used can have a profound effect on the information that can be derived from that
representation. However, it is important to note that the operative word in that statement is “can”.
The findings from this study lead to a variety of additional questions. When learners are given pre-
developed graphical organizers such as concept maps, do they simply memorize the graphic
without investing the effort to understand the represented relationships? Do they simply ignore the
graphic and rely on the text instead? Does a graphic organizer cause increased cognitive load if it
was not developed by the learner, perhaps due to a decrease in available working memory?
Recent research by Stull & Mayer (2007) addresses the latter question, which they termed
“learning by doing versus learning by viewing”. Using a biology text, they reported that either
author-provided or learner-developed graphical organizers such as concept maps could be equally
105
effective in supporting meaningful learning; however, “when the complexity was too high…so
much extraneous processing was required that neither of the graphic organizer treatments helped
foster deeper learning.” (Stull & Mayer, 2007).
Tracking the visual path of the study subjects may also shed light on their interaction with
the graphic representations. Thomas and Lleras found that “those who moved their eyes in a
pattern related to the problem’s solution were the most successful problem solvers.” (Thomas &
Lleras, 2007). However, in the current study, the subjects were not given a problem in advance, so
further study is needed to understand how learners interact with pre-developed graphical
representations for learning.
An additional question raised by Experiment 2 is whether the study subjects misinterpreted
or did not comprehend the concept map graphic, as graph reading and interpretation is known to
be difficult for some learners (Shah, Mayer, & Hegarty, 1999). In fact, one study subject mentioned
after the data collection process that the use of the graphic was confusing. Therefore, one year
after the initial data collection, an animated Microsoft PowerPoint (Redmond, Washington) was
used to present a lecture to the subsequent class of second-year veterinary students. The animation
showed a concept map being constructed, in stepwise fashion, to illustrate the relationships
between the taxonomic structure and properties for a specific category of parasites. Comments
from the students indicated that this method was well received. This approach is supported by
Mayer and Moreno’s cognitive theory of multimedia learning (Mayer & Moreno, 2002). This
theory has three main components:
1. That information is processed via two channels – an auditory/verbal channel and a
visual/pictorial channel; therefore, presentations should include both visual/pictorial
representations along with auditory/verbal representations.
106
2. That each of these channels can actively process a limited number of pieces of information
at a time.
3. That meaningful learning only occurs when learners actively work to fit new knowledge
into what they already know.
A multimedia approach that explains the relationships between taxonomy and clinical
findings, and that incorporates these principles, may be more effective for than a standard text.
This may be especially effective for students accustomed to memorizing text passages.
These findings also suggest that a set of cognitive hurdles, in addition to those posed by
proximity, explicitness, and representation (PER), may be present. This first set of cognitive hurdles
may in fact be encountered before any issues caused by PER, and they may be internal to the
learner. They incorporate whether the student first perceives that a pattern or relationship might
exist in the material being learned, as well as the learner’s learning style, including tendency
toward memorization. Only if the learner overcomes these issues are the hurdles imposed by PER
in the cognitive artifact (in this case, a textbook) then encountered by the learner.
The primary external factor in this second set of hurdles is the result of the representation
used for a given concept in the cognitive artifact itself (in this study, the textbook). The
representation should include all the data required for the learner to infer a pattern or relationship;
that is, the data should be in proximity. The internal factors in the second hurdle include whether
the learner believes the information is relevant; whether the learner believes the effort required to
assimilate the information is worthwhile; and whether the learner actually invests the time
required to assimilate the information. The latter two factors are affected by the representation in
the cognitive artifact, while the first two factors are derived from adult learning theory.
107
TaxonomiesandOntologies
This study produced a serendipitous finding, in that subject performance on a question
regarding properties of certain taxonomic families was a strong predictor of performance on
clinical problem solving. This finding not only illustrates the need to incorporate these aspects of
the Linnaean taxonomy in any coursework that discusses organisms, but it also supports
Wainwright’s position of the importance of “functional” taxonomy as opposed to traditional
morphological taxonomy (Wainwright, 1988). In other words, instructional materials in this
domain should include not just the morphologic features of an organism, but also the function of
those features, especially properties relevant to clinical problem-solving. For example, students
may memorize the fact that members of taxonomic order Cyclophyllidea have no uterine pores,
but fail to link that morphologic feature to the clinical observation that because of the lack of
uterine pores, these parasites shed whole proglottids, not individual eggs. Shulz, Stenzhorn, and
Boeker (2008) also point out that biological taxa comprise over 14% of MeSH descriptors (Schulz,
Stenzhorn, & Boeker, 2008). Because the Linnaean taxonomy has both structure – parent-child
relationships – as well as “is-a” and “has-a” properties, it can be considered an ontology. The
informatics literature contains references regarding the use of ontologies for machine reasoning
(e.g. Cimino & Zhu, 2006), but a review of the literature discovered few reports regarding the use
of either taxonomies or ontologies for student clinical problem solving. It also correlates to Patel,
Evans, and Kaufman’s proposal that “a sound disease classification scheme is necessary before
biomedical knowledge can facilitate both data-driven and predictive reasoning during clinical
problem-solving.” (Patel, Evans, & Kaufman, 1990).
However, the findings from the Attitude Toward Taxonomy questionnaire suggests that
even though students regarded taxonomy as important during their coursework, they performed
poorly on the questions regarding taxonomic structure and properties in both experiments. There
108
are several possible explanations for this discrepancy. The first possible explanation may be due to
the lack of preparation at the undergraduate level, in that the majority of the subjects reported
having no prior parasitology coursework. A second possible explanation for this discrepancy may
be due to how taxonomy is presented in undergraduate coursework, as a method for identifying
organisms such as plants, and not for clinical reasoning about pathogenic organisms. Finally, the
majority of subjects reported that they did not believe taxonomy would be important to them after
graduation. This supports a central tenet of adult learning theory, in that adult learners invest time
and effort in learning what they believe is important to them.
The results from this study reinforce the need for well-structured knowledge for clinical
problem solving. Students who performed well on a pretest question intended to assess their
knowledge of the taxonomic properties of specific taxonomic families also performed well on the
clinical problem solving. In other words, well-formed knowledge of taxonomy was a powerful
predictor of their performance on the clinical problem solving cases, regardless of the format of the
intervention used.
SeparationofBasicScienceandClinicalKnowledge
The results from this study also reinforce Patel's findings that students treat basic science
and clinical knowledge as two separate worlds (Patel, et al., 1993). The students performed at the
same level on the posttests regardless of the type of representation used in the interventions;
however, they were unable to transfer their knowledge to clinical problems. For example, students
who were given an explicit rule were able to identify the relevant parts of the rule on the posttest,
but were not able to apply the rule to solve clinical problems.
109
Implications
Several implications can be derived from this study. First, if relationships, patterns, or rules
exist among facts, and those relationships are important for effective clinical problem solving, then
students must be made aware of the existence of those relationships. Students should be cued in
advance if they are expected to derive a pattern from the information that is being given to them,
and they also need to be cued as to what patterns to look for. This study suggests that students do
not derive patterns or relationships regardless of the use of tables or concept maps.
Second, simply explicitly stating the relationship alone may not be effective, as students
may memorize the relationship but still not be able to apply it in a clinical situation. And finally,
prepared representations such as tables and concept maps may not be helpful for students who are
not actively looking for relationships or patterns.
LimitationsoftheStudy
StudySettingandSubjects
This research utilized a particular domain, parasitology, in which to study the problem of
spatial proximity and explicitness on inferential learning because of the researcher’s background,
knowledge, and training in the domain. However, medical school curricula do not routinely
include any in-depth coursework on parasitology, while veterinary school curricula do
(Richardson, Gauthier, & Koritko, 2004). Because this specific domain was used, the research is
not generalizable to other domains.
This also meant that the study subjects would need to be veterinary students, which led to
the next constraint: student availability. There is only one college of veterinary medicine in the
entire state of Texas, one in Louisiana, and one in Oklahoma. At the particular college used for the
research, veterinary students take one semester of parasitology in the fall of their second year.
110
Because of the structure of their coursework and because of the general complexity of the
necessary underlying knowledge, data collection for this study could only occur during the fall
semester, during the last two weeks of October when students were completing their studies of
helminths. Therefore, enlarging the study to incorporate additional students would have incurred
additional travel costs but should be considered in any future research.
The population of study subjects was not balanced with respect to gender, since
approximately 75% of the class was female. Additionally, although the research addressed
expository text, issues such as text coherence were not considered. Finally, temporal proximity of
information presentation may have an effect, but was not considered in this research.
Instrumentation
It is important to note that the instruments used in these experiments were judged by a
subject matter expert to have content validity; however, statistical reliability was assessed on only
the Attitude Toward Taxonomy questionnaire. Further, due to limitations in access to students with
the requisite domain knowledge, instruments were not tested by students prior to their use in this
study.
DataCollection
Data collection was originally planned to take place in the college’s computer laboratory;
however, the computer laboratory is used by all students and cannot be reserved for special
functions. An alternate method of data collection using researcher-provided laptops was not viable
due to funding limitations. As a result, all data collection took place using paper forms.
Time for reflection on the material was not provided due to time constraints. If time were
not an issue, the posttest would not be given on the same day as the pretest and intervention. This
would allow time for reflection on the material.
111
Funding
Finally, financial considerations imposed a limitation on this study as there was no outside
funding. The researcher paid all costs associated with this study. External funding or support could
allow the study to be conducted at multiple locations as well as remove constraints caused by
paper-based interventions and data collection. Funding could also provide compensation for
research subjects, permitting data collection to occur outside of standard class time. Funding could
permit a longitudinal study design to assess effectiveness of PER over time.
Recommendations
Terminology
In preparing for this research, it was apparent that no consensus exists regarding the
meaning of “basic science”, even though the term is widely used and is usually not defined. Along
the same lines, the concept “clinical problem solving” appears to be used in a variety of ways in
the literature. In this study, “clinical problem solving” incorporated aspects of transmission,
diagnosis, treatment, and prevention. At what point does “basic science” end and “clinical
problem solving” begin, especially when control of parasitic diseases often relies heavily on
understanding the life cycle of intermediate hosts? Conceptual analyses of the terms “basic
science” and “clinical problem solving” would clarify these for future researchers.
Likewise, the terms “implicit” and “explicit” are also widely used. However, little is
published on methodologies for identifying not only what is implicit or explicit in the context of
learning, but to what level of detail should the definition be taken. For example, the term “dog”
can convey a large quantity of implicit facts, such as the number and types of teeth it has, the type
of food it needs, that it is a mammal and therefore produces milk for its offspring, and so on.
Further, the implicit information conveyed by a term can vary based on the existing long-term
112
knowledge of the recipient. Future research should include a conceptual analysis of these terms as
well as a methodology for identifying and quantifying their properties.
StudyDesign
Recommendations for further research on the effect of proximity and representation on
clinical problem solving would first and foremost include selection of a more generalizable
domain, one that does not require specialized knowledge. For example, discovery of the
relationship between heart rate and body mass, where larger species have slower heart rates due
to heat conservation and Surface Law (Blumberg, 2002b), might be appropriate for college
undergraduates.
Selection of a less complex domain should broaden the availability of study subjects. Not
only could the larger number of subjects strengthen the statistical power of the study, but access to
local resources would reduce travel time and related expenses.
Further research assessing the impact of proximity and representation on student clinical
problem solving should also investigate the effect of first prompting students to look for specified
patterns or relationships.
Instrumentation
Validation of the instruments by a broader range of students is recommended. Addition of
more problem solving cases as well as functional taxonomic properties would also be suggested
for any further investigations regarding the relationship between those properties and clinical
problem solving.
Multimedia, animated presentations of concept maps should be explored as a way of
presenting concept maps in a stepwise fashion. This could demonstrate to students how facts are
113
incorporated into a specific reasoning process. Such a presentation could also mitigate the load on
working memory and help reduce cognitive load.
Methodology
The use of computerized data collection would eliminate many hours of manual data
entry. It could also eliminate possible errors introduced during the data entry process.
The length of time allocated for subjects to read the intervention texts compared to the
length of the intervention texts was problematic. The subjects were given thirty minutes to read
nine pages of text. Although several pages were used in the intervention text in an effort to
simulate the quantity of reading students are required to do in limited time, the study findings
suggest that no improvement in clinical problem-solving ability occurs even when facts are
adjacent on the same page. Therefore, additional research on PER could use shorter text
interventions.
The amount of time allocated for reading also had an unintended consequence, in that
students read at different speeds. Some subjects read rapidly and then became bored, as evidenced
by drawings and doodles on the study materials, while others read too slowly to complete the
reading before being given the posttest. Shorter interventions would not alleviate the problem of
boredom encountered by faster readers. Utilizing on-line data collection would allow each subject
to read completely through the intervention material and then progress to the posttest at his or her
own pace.
Investigation of the effect of pre-developed concept maps on cognitive load and working
memory, as well as the amount of time spent by subjects attending to pre-developed concept maps
compared to other representations, should also be explored. The use of a learning styles inventory,
such as that developed by Kolb (Kolb, 1981) to identify each subject’s preferred learning style
114
would allow correlation of the learning style with the clinical problem solving outcomes for each
type of representation used.
How much time subjects spend actually looking at different representations could be
answered by using an eye tracker system. This would gather data on which portions of
representations the subjects actually attended to. Similarly, online data collection would allow
tracking the amount of time spent on each screen. Audio recording of any comments made by
students while studying the materials and answering questions could also provide insight into their
thought processes.
GeneralRecommendations
The issue of reference materials versus learning materials must be addressed. Informatics
literature indicates that displays should be tailored to fit the task the user is attempting to perform
(Johnson, Johnson, & Zhang, 2005; Zhang, Patel, Smith, Johnson, & Malin, 2002). In this case, the
users are students enrolled in post-graduate coursework, and the displays are textbooks written by
experts in a specialized domain. These same textbooks may continue to serve as references even
after the students complete their academic coursework and enter practice. Does this mean that the
textbooks need to be rewritten to address learning tasks as opposed to reference tasks? If so, then
the role of the text as a reference is compromised. The more attractive solution to this paradox is
that supplemental materials incorporating principles of data display and learning theories should
be developed. Such supplemental materials should explicitly describe any rules, patterns, or
relationships between facts that students are expected to learn. Pending further research regarding
including use-case examples of these rules and relationships, this research suggests that inclusion
of use-case examples is necessary for effective application of basic science rules into clinical
problem solving.
115
Finally, this study imposed a rigid methodology on the study subjects, forcing them to
study the intervention individually and without group interaction. This approach might not reflect
their actual study habits. Kirschner et.al. (2009) state “Cognitive load theory is based on the
cognitive architecture of individual learners.” (Kirschner, Paas, & Kirschner, 2009, p. 35). In a
review of the literature, they found that when dealing with complex problem solving, groups
outperformed individuals because of the larger cognitive capacity of the group. This suggests that,
at least for the particular domain used in this research, students could be encouraged to work in
study groups.
Summary
The initial premise of this research was that three factors, proximity, representation, and
explicitness, in learning materials are barriers to inferring information from facts, and that those
barriers must be overcome before students can achieve meaningful learning. However, the
findings from this study indicate that these factors produce no significant effect on meaningful
learning as measured by student clinical problem solving ability. Further observation suggests that
students primarily memorize material, and that another barrier to inferential learning may actually
be encountered prior to any effects imposed by proximity, explicitness, or representation. This
barrier is whether the student even perceives that patterns or relationships may exist. A primary
implication of this research is that if relationships in learning material exist, then those
relationships must be stated; students do not derive the relationship regardless of the type of
representation used. Otherwise, expecting students to realize that these relationships exist,
especially given the volume of information in certain textbooks, is tantamount to expecting a
student to derive the rules of grammar by memorizing the dictionary. This research also suggests
that simply providing a rule without examples does not produce improved clinical problem
solving capability.
116
References
Aaron, S., & Skakun, E. (1999). Correlation of students' characteristics with their learning styles as they begin medical school. Academic Medicine, 74(3), 260.
Ackoff, R. (1989). From data to wisdom. Presidential address to ISGSR, June 1988. Journal of Applied Systems Analysis, 16(1), 3-9.
Adams, A. K. (1985). Learning animal taxonomies: social convergence processes in reorganizations of semantic networks (cognitive, concept). Unpublished Dissertation, University of Denver, Denver, Colorado.
Ainsworth, S. (1999). The functions of multiple representations. Computers & Education, 33(2-3), 131-152.
Anderson, L. W., Krathwohl, D. R., Airasian, P. W., Cruikshank, K. A., Mayer, R. E., Pintrich, P. R., et al. (2001). A Taxonomy for Learning, Teaching, and Assessing: A Revision of Bloom's Taxonomy of Educational Objectives (Complete edition ed.). New York: Longman.
Anonymous (2008). Texas A&M University College of Veterinary Medicine and Biomedical Sciences. DVM Admissions Statistics. Retrieved July 16, 2009, from http://www.cvm.tamu.edu/dcvm/admissions/statistics.shtml
Ausubel, D. P. (1963). The psychology of meaningful verbal learning: Grune & Stratton.
Ballweber, L. R. (2001). Veterinary Parasitology. Boston: Butterworth Heinemann.
Blumberg, M. (2002a). Body heat: temperature and life on earth. Cambridge, MA: Harvard University Press.
Blumberg, M. S. (2002b). Body heat : temperature and life on earth. Cambridge, Mass.: Harvard University Press.
Bowman, D. D., Lynn, R. C., Eberhard, M. L., & Alcaraz, A. (2003). Georgis' Parasitology for Veterinarians (8th ed.). St. Louis, MO: Saunders.
Brisbin, T. E. (2000). An account of novice phylogenetic tree construction from the problem-solving research tradition. Unpublished Ph.D., Western Michigan University, United States -- Michigan.
Cañas, A., Coffey, J., Carnot, M., Feltovich, P., Hoffman, R., Feltovich, J., et al. (2003). A Summary of Literature Pertaining to the Use of Concept Mapping Techniques and Technologies for Education and Performance Support.
Carmer, S. G., & Swanson, M. R. (1973). An Evaluation of Ten Pairwise Multiple Comparison Procedures by Monte Carlo Methods. Journal of the American Statistical Association, 68(341), 66-74.
Case, S. M., & Swanson, D. B. (2002). Constructing Written Test Questions For the Basic and Clinical Sciences, 3rd ed. (revised) Available from http://www.nbme.org/publications/item-writing-manual-download.html
Chuah, J., Zhang, J., & Johnson, T. R. (2000). The representational effect in complex systems: a distributed representation approach. Paper presented at the 22nd Annual Conference of the Cognitive Science Society.
117
Cimino, J. J., & Zhu, X. (2006). The practical impact of ontologies on biomedical informatics. Yearb Med Inform, 124-135.
Clark, R. C., & Lyons, C. (2004). Graphics for Learning. Proven Guidelines for Planning, Designing, and Evaluating Visuals in Training Materials. San Francisco: Pfeiffer.
Cohen, L., Manion, L., & Morrison, K. (2000). Research methods in education (5th ed.). London ; New York: Routledge Falmer.
Collins, A., Brown, J., & Newman, S. (1989). Cognitive apprenticeship: Teaching the crafts of reading, writing, and mathematics. Knowing, learning, and instruction: Essays in honor of Robert Glaser, 453-494.
Core, E. V. J. (1982). Teaching taxonomy--a different approach. [Journal article]. American Biology Teacher, 44(9), 547-548.
Dreyfus, H. L., Dreyfus, S. E., & Athanasiou, T. (1986). Mind Over Machine. New York: The Free Press.
Edmondson, K. M., & Smith, D. F. (1996, April 8-12, 1996). Concept mapping to facilitate veterinary students' understanding of fluid and electrolyte disorders. Paper presented at the AERA Symposium: Alternative approaches to research on the cognitive structure of concepts, New York.
Faust, E. C., Russell, P. F., & Jung, R. C. (1970). Clinical Parasitology (8th ed.). Philadelphia: Lea & Febiger.
Foreyt, W. J. (2001). Veterinary Parasitology Reference Manual (Fifth ed.). Ames: Iowa State Press.
Garg-Janardan, C., & Salvendy, G. (1988). A structured knowledge elicitation methodology for building expert systems. In J. H. Boose & B. R. Gaines (Eds.), The Foundations of Knowledge Acquisition (Vol. 4, pp. 385). London: Academic Press.
Garner, R., Gillingham, M., & White, C. (1989). Effects of "seductive details" on macroprocessing and microprocessing in adults and children. Cognition and Instruction, 6(1), 41-57.
Gliner, J. A., & Morgan, G. A. (2000). Research Methods in Applied Settings: An Integrated Approach to Design and Analysis: Lawrence Erlbaum Associates.
Haupt, W. (1999). Rabies--risk of exposure and current trends in prevention of human cases. Vaccine, 17(13-14), 1742-1749.
Johnson, C. M., Johnson, T. R., & Zhang, J. (2005). A user-centered framework for redesigning health care interfaces. Journal of Biomedical Informatics, 38(1), 75-87.
Kahn, C. M. (Ed.). (2005). The Merck Veterinary Manual (9th ed.). Whitehouse Station, N.J.: Merck & Co. Inc.
Kirschner, F., Paas, F., & Kirschner, P. (2009). Individual and group-based learning from complex cognitive tasks: Effects on retention and transfer efficiency. Computers in Human Behavior, 25(2), 306-314.
Kirschner, P. A. (2002). Cognitive load theory: implications of cognitive load theory on the design of learning. Learning and Instruction, 12(1), 1-10.
Knowles, M. S., Holton III, E. F., & Swanson, R. A. (2005). The adult learner. The definitive classic in adult education and human resource development. (6th ed.): Elsevier.
118
Kolb, D. (1981). Learning styles and disciplinary differences. In A. W. Chickering (Ed.), The Modern American College (pp. 232-255). San Francisco: Jossey-Bass.
Krebs, J. W., Mandel, E. J., Swerdlow, D. L., & Rupprecht, C. E. (2005). Rabies surveillance in the United States during 2004 (Vol. 227, pp. 1912-1925).
Lee, B., Parr, C. S., Campbell, D., & Bederson, B. B. (2004). How users interact with biodiversity information using TaxonTree. Paper presented at the Proceedings of the working conference on Advanced visual interfaces, Gallipoli, Italy.
Levine, N. D. (1968). Nematode Parasites of Domestic Animals and of Man: Burgess Pub. Co Minneapolis, Minn.
Lujan, H. L., & DiCarlo, S. E. (2006). Too much teaching, not enough learning: what is the solution? Advan. Physiol. Edu., 30(1), 17-22.
Macdonald, D. (Ed.). (1995). The Encyclopedia of Mammals. New York: Facts on File.
MacKeracher, D. (2004). Making sense of adult learning (2nd ed.). Toronto: University of Toronto Press.
Mahler, S., Hoz, R., Fischl, D., Tov-Ly, E., & Lernau, O. Z. (1991). Didactic use of concept mapping in higher education: applications in medical education. Instructional Science, 20(1), 25-47.
Markow, P. G., & Lonning, R. A. (1998). Usefulness of concept maps in college chemistry laboratories: Students' perceptions and effects on achievement. Journal of Research in Science Teaching, 35(9), 1015-1029.
Marquardt, W. C., Demaree, R. S., & Grieve, R. B. (2000). Parasitology and Vector Biology: Academic Press.
Mayer, R. E. (1985). Structural Analysis of Science Prose: Can We Increase Problem-Solving Performance? In B. K. Britton & J. B. Black (Eds.), Understanding Expository Text. A Theoretical and Practical Handbook for Analyzing Explanatory Text. (pp. 65-87). Hillsdale, NJ: Lawrence Erlbaum Associates.
Mayer, R. E. (2002). Rote Versus Meaningful Learning. Theory Into Practice, 41(4), 226-232.
Mayer, R. E. (2004). Should there be a three-strikes rule against pure discovery learning? The case for guided methods of instruction. American Psychologist, 59(1), 14-19.
Mayer, R. E., Bove, W., Bryman, A., Mars, R., & Tapangco, L. (1996). When less is more: Meaningful learning from visual and verbal summaries of science textbook lessons. Journal of Educational Psychology, 88(1), 64-73.
Mayer, R. E., & Moreno, R. (2002). Animation as an aid to multimedia learning. Educational Psychology Review, 14(1), 87-99.
McGaghie, W. C., McCrimmon, D. R., Mitchell, G., Thompson, J. A., & Ravitch, M. M. (2000). Quantitative concept mapping in pulmonary physiology: comparison of student and faculty knowledge structures. Adv Physiol Educ, 23(1), 72-81.
Mintzes, J. J., & Wandersee, J. H. (1998). Reform and Innovation in Science Teaching: A Human Constructivist View. In J. J. Mintzes, J. H. Wandersee & J. D. Novak (Eds.), Teaching Science for Understanding. San Diego: Academic Press.
119
Morton, G., & Bradely, J. (1979). A more realistic approach to teaching taxonomy. American Biology Teacher, 41(4), 230-232.
Musen, M. A. (1989). Automated Generation of Model-Based Knowledge-Acquisition Tools. San Mateo, California: Morgan Kaufman Publishers.
Myers, P., Espinosa, R., Parr, C., Jones, T., Hammond, G., & Dewey, T. (2006). The Animal Diversity Web. Retrieved August 9, 2009, from http://animaldiversity.org
Norman, D. A. (1990). The design of everyday things (First Doubleday/Currency ed. ed.). New York: Doubleday.
Norman, G. (2005). Research in clinical reasoning: past history and current trends. Medical Education, 39(4), 418.
Olsen, O. W. (1986). Animal parasites: their life cycles and ecology. New York: Dover Publications.
Otero, J., Leon, J. A., & Graesser, A. C. (2002). Introduction to the Psychology of Science Text Comprehension. In J. Otero, J. A. Leon & A. C. Graesser (Eds.), The Psychology of Science Text Comprehension (pp. 459). Mahwah, NJ: Lawrence Erlbaum Associates.
Pallant, J. (2007). SPSS survival manual: A step by step guide to data analysis using SPSS (3rd ed.). New York: McGraw-Hill.
Parasitology Review Questions for the National Boards (2006). Retrieved April 24, 2008, from www.capcvet.org/downloads/CAPC_National_Board_Review.pdf
Patel, V. L., Arocha, J. F., & Kaufman, D. R. (2001). A primer on aspects of cognition for medical informatics. J Am Med Inform Assoc, 8(4), 324-343.
Patel, V. L., Evans, D., & Kaufman, D. (1990). Reasoning strategies and the use of biomedical knowledge by medical students. Medical Education, 24(2), 129-136.
Patel, V. L., Groen, G. J., & Norman, G. R. (1993). Reasoning and instruction in medical curricula. Cognition and Instruction, 10(4), 335-378.
Patel, V. L., Groen, G. J., & Scott, H. M. (1988). Biomedical knowledge in explanations of clinical problems by medical students. Medical Education, 22(5), 398-406.
Pinto, A. J., & Zeitz, H. J. (1997). Concept mapping: a strategy for promoting meaningful learning in medical education. Medical Teacher, 19(2), 114-121.
Regan-Smith, M. G. (1992). Teaching and learning of basic science in medical school: The students' perspective. Unpublished Ed.D., Harvard University, United States -- Massachusetts.
Rendas, A. B., Fonseca, M., & Pinto, P. R. (2006). Toward meaningful learning in undergraduate medical education using concept maps in a PBL pathophysiology course. Adv Physiol Educ, 30(1), 23-29.
Richardson, D., Gauthier, J., & Koritko, J. (2004). Parasitology education 2001. Comparative Parasitology, 71(1), 13-20.
Rowley, J. (2007). The wisdom hierarchy: representations of the DIKW hierarchy. Journal of Information Science, 33(2), 163-180.
120
Samuel, W. M., Pybus, M. J., & Kocan, A. A. (Eds.). (2001). Parasitic Diseases of Wild Mammals (2 ed.). Ames: Iowa State University Press.
Schantz, P. M., Moore, A. C., Munoz, J. L., Hartman, B. J., Schaefer, J. A., Aron, A. M., et al. (1992). Neurocysticercosis in an Orthodox Jewish community in New York City. N Engl J Med, 327(10), 692-695.
Schulz, S., Stenzhorn, H., & Boeker, M. (2008). The ontology of biological taxa. Bioinformatics, 24(13), i313.
Shah, P., Mayer, R. E., & Hegarty, M. (1999). Graphs as aids to knowledge construction: Signaling techniques for guiding the process of graph comprehension. Journal of Educational Psychology, 91(4), 690-702.
Sharps, M. J., Hess, A. B., Price-Sharps, J. L., & Teh, J. (2008). Heuristic and algorithmic processing in English, mathematics, and science education. J Psychol, 142(1), 71-88.
Stull, A. T., & Mayer, R. E. (2007). Learning by doing versus learning by viewing: Three experimental comparisons of learner-generated versus author-provided graphic organizers. Journal of Educational Psychology, 99(4), 808.
Sweller, J., & Chandler, P. (1991). Evidence for Cognitive Load Theory. Cognition and Instruction, 8(4), 351-362.
Sweller, J., & Chandler, P. (1994). Why Some Material Is Difficult to Learn. Cognition and Instruction, 12(3), 185-233.
Tenenbaum, J., Griffiths, T., & Kemp, C. (2006). Theory-based Bayesian models of inductive learning and reasoning. Trends in Cognitive Sciences, 10(7), 309-318.
Thomas, L., & Lleras, A. (2007). Moving eyes and moving thought: On the spatial compatibility between eye movements and cognition. Psychonomic Bulletin and Review, 14(4), 663.
Understanding Your GRE Scores (2009). Retrieved March 5, 2010, 2010, from http://www.ets.org/Media/Tests/GRE/pdf/gre_0910_interpreting_scores.pdf
van Merriënboer, J. J. G., & Paul, A. (2005). Research on cognitive load theory and its design implications for e-learning. Educational Technology Research and Development, 53(3), 5-13.
Wainwright, S. (1988). Form and function in organisms. American Zoologist, 28(2), 671-680.
Wason, P. (1960). On the failure to eliminate hypotheses in a conceptual task. The Quarterly Journal of Experimental Psychology, 12, 129-140.
West, D. C., Park, J. K., Pomeroy, J. R., & Sandoval, J. (2002). Concept mapping assessment in medical education: a comparison of two scoring systems. Med Educ, 36(9), 820-826.
West, D. C., Pomeroy, J. R., Park, J. K., Gerstenberger, E. A., & Sandoval, J. (2000). Critical thinking in graduate medical education - a role for concept mapping assessment? JAMA, 284(9), 1105-1110.
Wickens, C. D., & Hollands, J. G. (2000). Engineering Psychology and Human Performance (3rd ed.). Upper Saddle River, NJ: Prentice Hall.
Winston, J. E. (1999). Describing Species: practical taxonomic procedure for biologists. New York: Columbia University Press.
121
Yarden, H., Marbach-Ad, G., & Gershoni, J. M. (2004). Using the Concept Map Technique in Teaching Introductory Cell Biology to College Freshmen. Bioscene: Journal of College Biology Teaching, 30(1), 3-13.
Yates, T. L., Salazar-Bravo, J., & Dragoo, J. W. (2004). The importance of the tree of life to society. In J. Cracraft & M. J. Donoghue (Eds.), Assembling the Tree of Life (pp. 7-17). New York: Oxford University Press.
Zhang, J. (1997). The nature of external representations in problem solving. Cognitive Science, 21(2), 179-217.
Zhang, J., & Norman, D. A. (1994). Representations in Distributed Cognitive Tasks. Cognitive Science, 18(1), 87-122.
Zhang, J., Patel, V. L., Smith, J. W., Johnson, K. A., & Malin, J. (2002). Designing Human-Centered Distributed Information Systems. IEEE Intelligent Systems, 42-47.
122
AppendixA:Vita
2010 PhD, Health Informatics University of Texas Health Science Center at Houston
2005 MS, Health Informatics University of Texas Health Science Center at Houston
1983 ASCP American Society for Clinical Pathology
1983 MT St. Luke’s Episcopal Hospital, Houston
1981 BS, Microbiology Eastern Kentucky University
123
AppendixB:TexasA&MUniversityStudyApprovalLetter
124
AppendixC:TheUniversityofTexasHealthScienceCenterStudyApprovalLetter
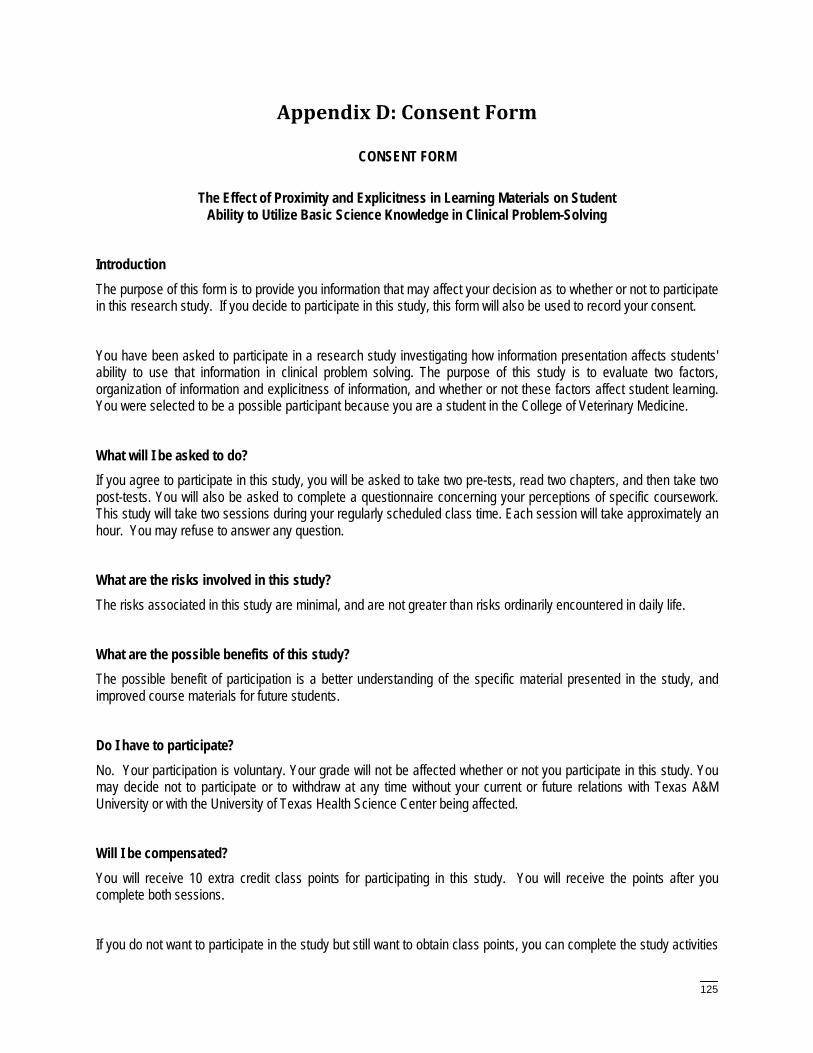
125
AppendixD:ConsentForm
CONSENT FORM
The Effect of Proximity and Explicitness in Learning Materials on Student Ability to Utilize Basic Science Knowledge in Clinical Problem-Solving
Introduction
The purpose of this form is to provide you information that may affect your decision as to whether or not to participate in this research study. If you decide to participate in this study, this form will also be used to record your consent.
You have been asked to participate in a research study investigating how information presentation affects students' ability to use that information in clinical problem solving. The purpose of this study is to evaluate two factors, organization of information and explicitness of information, and whether or not these factors affect student learning. You were selected to be a possible participant because you are a student in the College of Veterinary Medicine.
What will I be asked to do? If you agree to participate in this study, you will be asked to take two pre-tests, read two chapters, and then take two post-tests. You will also be asked to complete a questionnaire concerning your perceptions of specific coursework. This study will take two sessions during your regularly scheduled class time. Each session will take approximately an hour. You may refuse to answer any question.
What are the risks involved in this study? The risks associated in this study are minimal, and are not greater than risks ordinarily encountered in daily life.
What are the possible benefits of this study? The possible benefit of participation is a better understanding of the specific material presented in the study, and improved course materials for future students.
Do I have to participate? No. Your participation is voluntary. Your grade will not be affected whether or not you participate in this study. You may decide not to participate or to withdraw at any time without your current or future relations with Texas A&M University or with the University of Texas Health Science Center being affected.
Will I be compensated? You will receive 10 extra credit class points for participating in this study. You will receive the points after you complete both sessions.
If you do not want to participate in the study but still want to obtain class points, you can complete the study activities

Appendix D: Consent Form
126
but indicate that you do not want your materials used in the study by not signing the consent form.
Who will know about my participation in this research study? This study is confidential. Your professor will not know whether or not you participated in the study. The records of this study will be kept private. No identifiers linking you to this study will be included in any sort of report that might be published. Research records will be stored securely and only Kimberly Smith of the University of Texas will have access to the records.
Whom do I contact with questions about the research? If you have questions regarding this study, you may contact:
Thomas M. Craig, DVM, PhD, 979-845-9191, [email protected] or
Kimberly A. Smith, MS, MT(ASCP), 713-417-4151, [email protected]
Whom do I contact about my rights as a research participant? This research study has been reviewed by the Human Subjects’ Protection Program and/or the Institutional Review Board at Texas A&M University and by the Committee for the Protection of Human Subjects (CPHS) of the University of Texas Health Science Center at Houston. For research-related problems or questions regarding your rights as a research participant, you can contact these offices at (979) 458-4067 or [email protected]. You may also contact the University of Texas Health Science Center at Houston Committee for the Protection of Human Subjects at (713) 500-7943.
Signature
Please be sure you have read the above information, asked questions and received answers to your satisfaction. You will be given a copy of the consent form for your records. By signing this document, you consent to participate in this study.
Signature of Participant: __________________________________ Date and Time: ______________
Printed Name: ________________________________________________________________________ Signature of Person Obtaining Consent: _____________________________ Date: ______________
Printed Name: ________________________________________________________________________
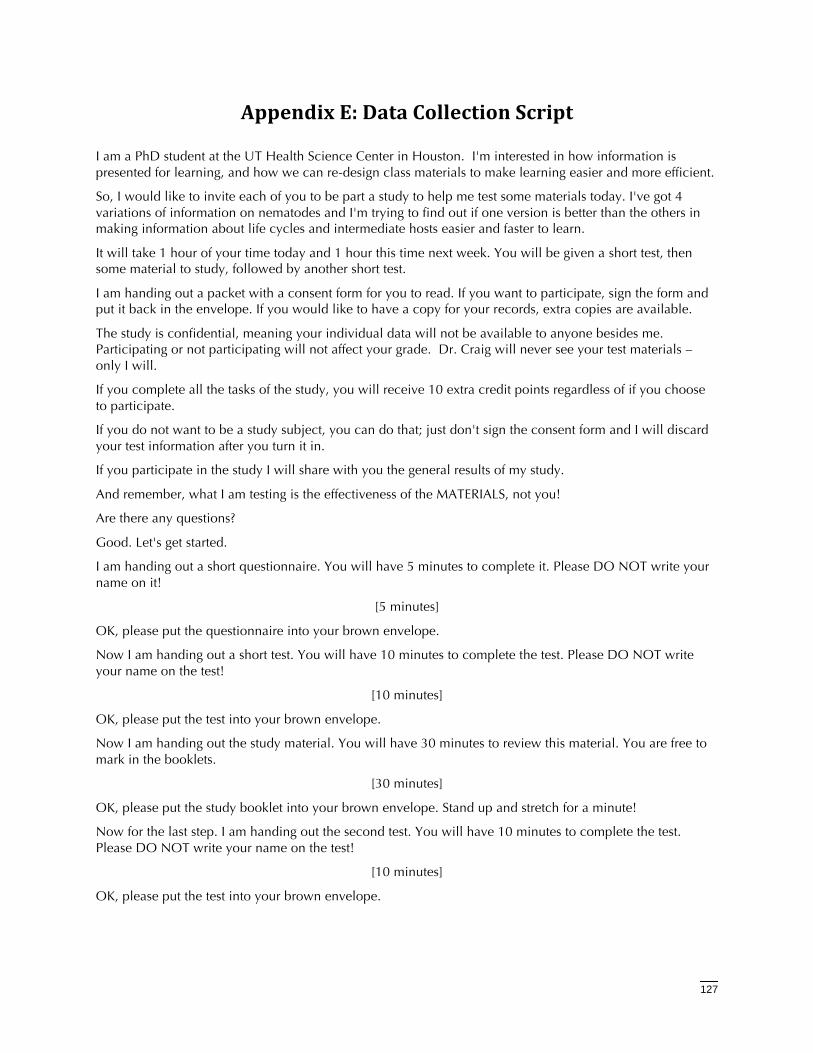
127
AppendixE:DataCollectionScript
I am a PhD student at the UT Health Science Center in Houston. I'm interested in how information is presented for learning, and how we can re-design class materials to make learning easier and more efficient.
So, I would like to invite each of you to be part a study to help me test some materials today. I've got 4 variations of information on nematodes and I'm trying to find out if one version is better than the others in making information about life cycles and intermediate hosts easier and faster to learn.
It will take 1 hour of your time today and 1 hour this time next week. You will be given a short test, then some material to study, followed by another short test.
I am handing out a packet with a consent form for you to read. If you want to participate, sign the form and put it back in the envelope. If you would like to have a copy for your records, extra copies are available.
The study is confidential, meaning your individual data will not be available to anyone besides me. Participating or not participating will not affect your grade. Dr. Craig will never see your test materials – only I will.
If you complete all the tasks of the study, you will receive 10 extra credit points regardless of if you choose to participate.
If you do not want to be a study subject, you can do that; just don't sign the consent form and I will discard your test information after you turn it in.
If you participate in the study I will share with you the general results of my study.
And remember, what I am testing is the effectiveness of the MATERIALS, not you!
Are there any questions?
Good. Let's get started.
I am handing out a short questionnaire. You will have 5 minutes to complete it. Please DO NOT write your name on it!
[5 minutes]
OK, please put the questionnaire into your brown envelope.
Now I am handing out a short test. You will have 10 minutes to complete the test. Please DO NOT write your name on the test!
[10 minutes]
OK, please put the test into your brown envelope.
Now I am handing out the study material. You will have 30 minutes to review this material. You are free to mark in the booklets.
[30 minutes]
OK, please put the study booklet into your brown envelope. Stand up and stretch for a minute!
Now for the last step. I am handing out the second test. You will have 10 minutes to complete the test. Please DO NOT write your name on the test!
[10 minutes]
OK, please put the test into your brown envelope.

Appendix E: Data Collection Script
128
If you have changed your mind regarding whether you want me to use your test data in my research study, you can revise your consent form at this point – either sign it or strike through your name. Be sure to put the form back in your brown envelope when you are done.
Thank you for your time. I'll collect the brown envelopes now, and we'll do a similar experiment this time next week.
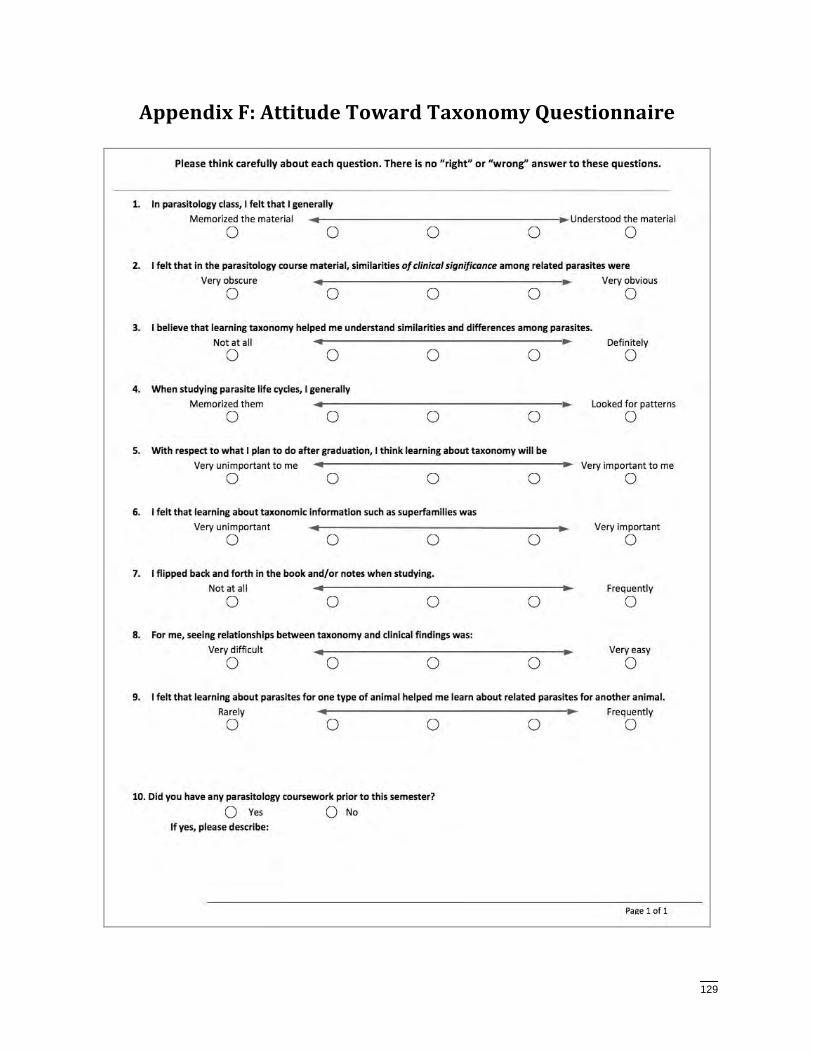
129
AppendixF:AttitudeTowardTaxonomyQuestionnaire
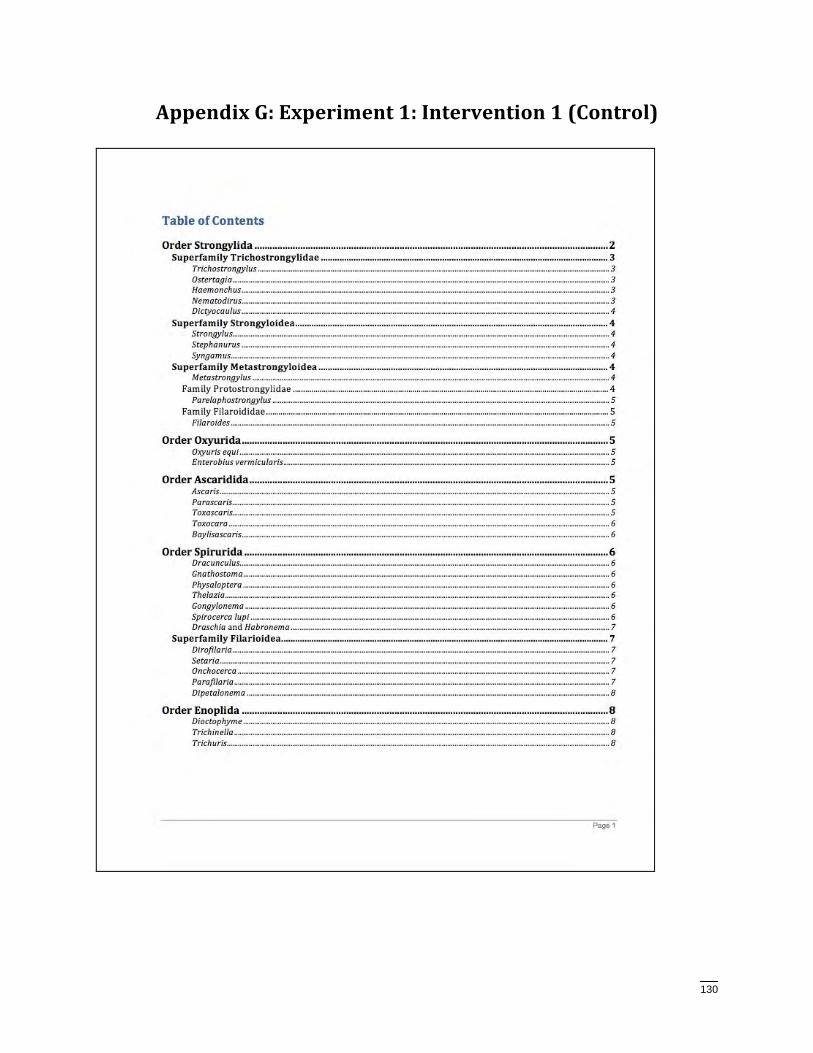
130
AppendixG:Experiment1:Intervention1(Control)
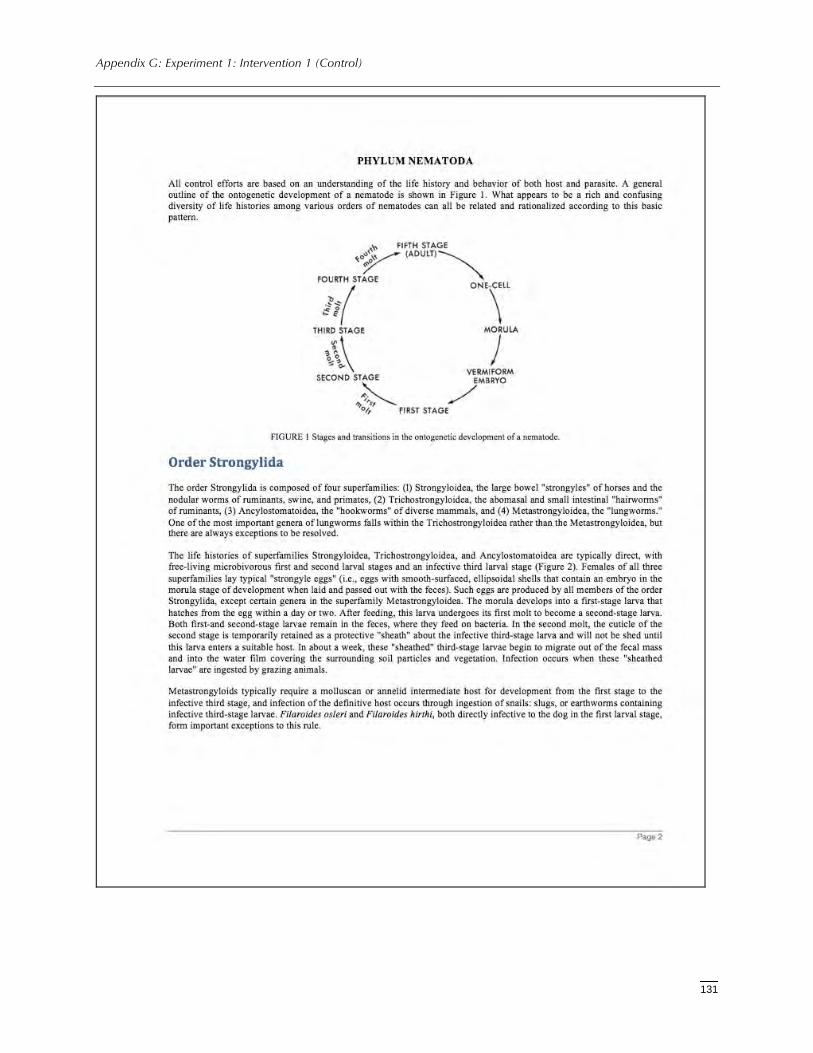
Appendix G: Experiment 1: Intervention 1 (Control)
131
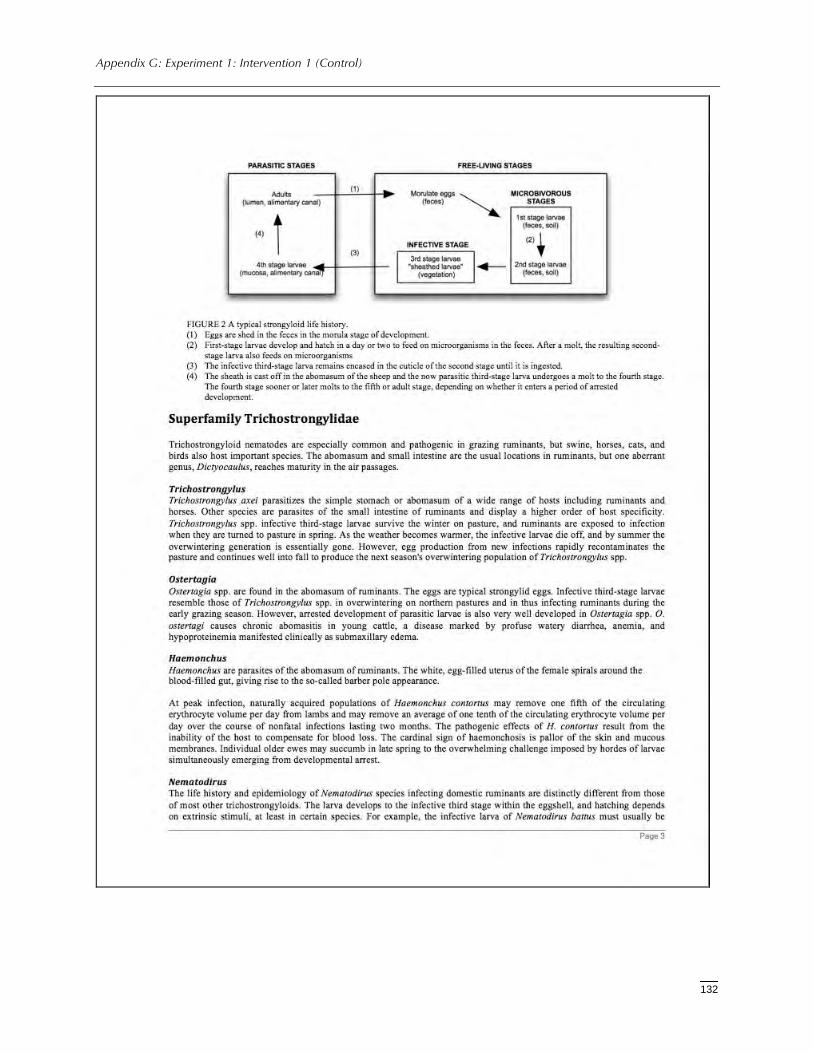
Appendix G: Experiment 1: Intervention 1 (Control)
132
Appendix G: Experiment 1: Intervention 1 (Control)
133
Appendix G: Experiment 1: Intervention 1 (Control)
134
Appendix G: Experiment 1: Intervention 1 (Control)
135
Appendix G: Experiment 1: Intervention 1 (Control)
136
Appendix G: Experiment 1: Intervention 1 (Control)
137
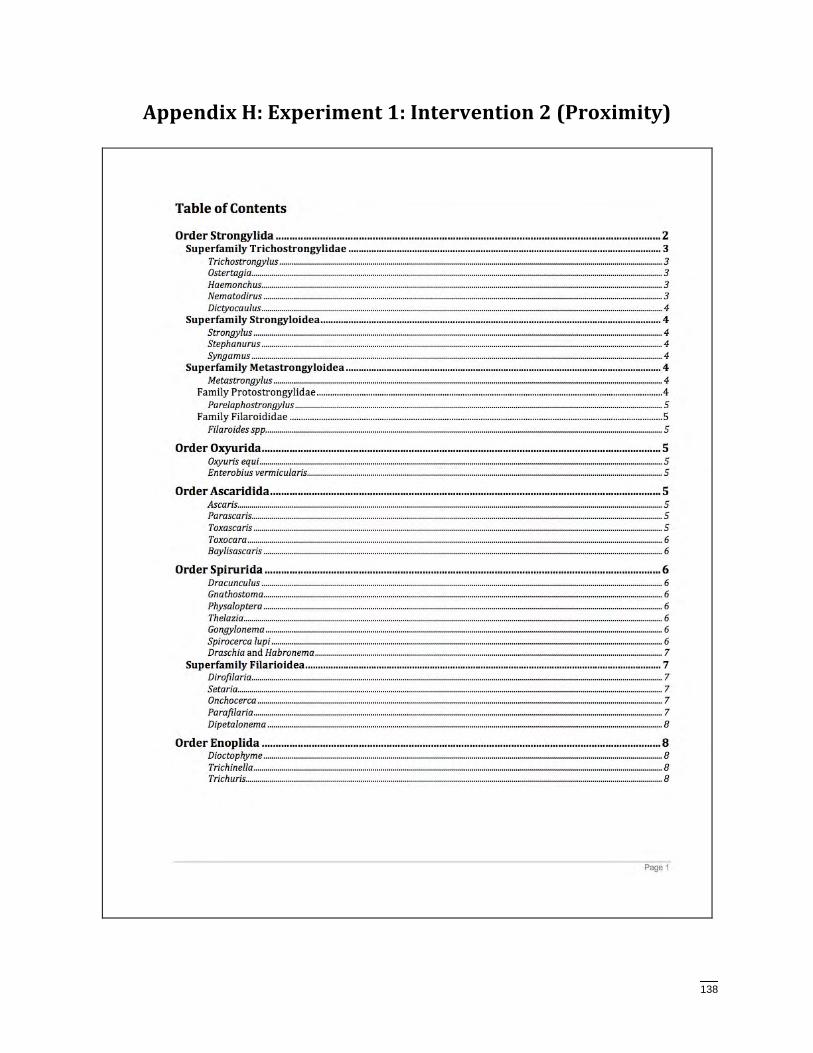
138
AppendixH:Experiment1:Intervention2(Proximity)
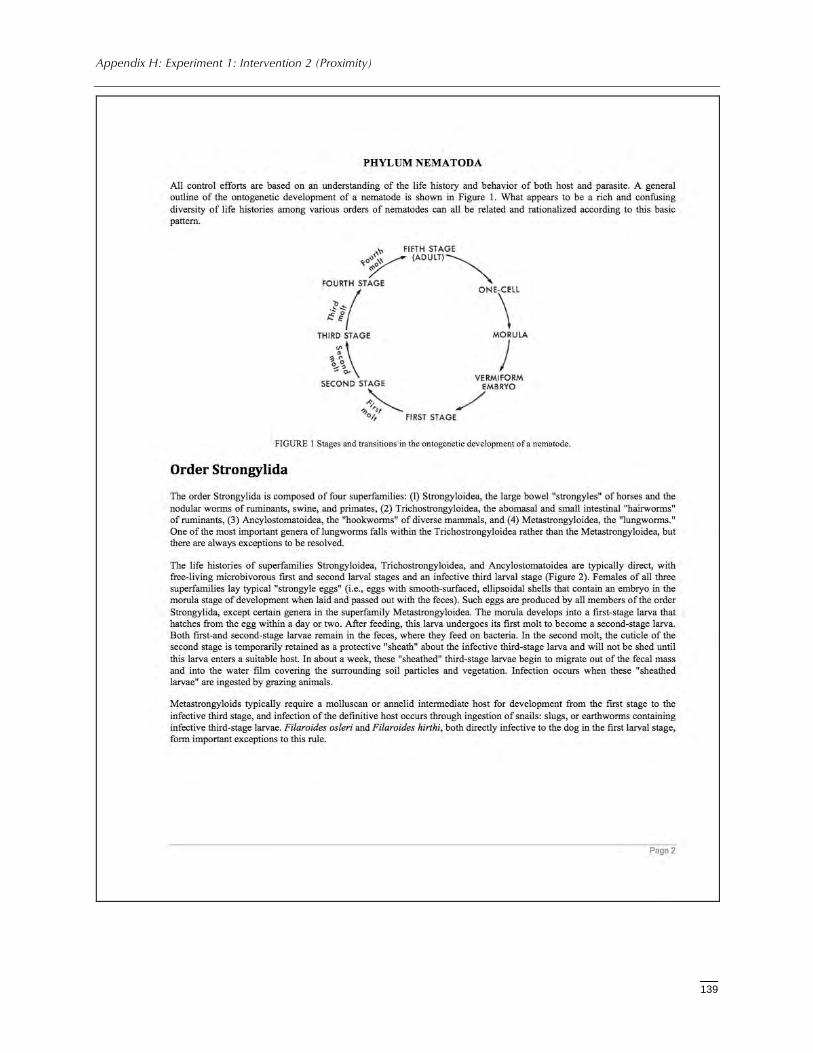
Appendix H: Experiment 1: Intervention 2 (Proximity)
139
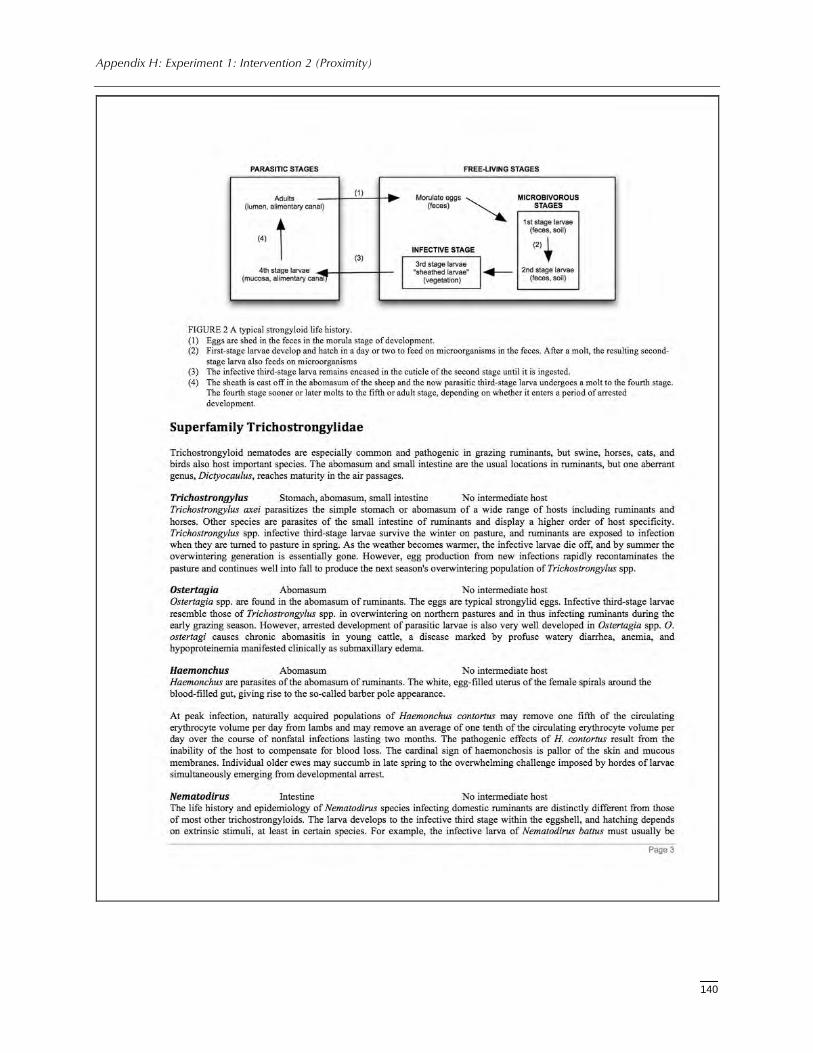
Appendix H: Experiment 1: Intervention 2 (Proximity)
140
Appendix H: Experiment 1: Intervention 2 (Proximity)
141
Appendix H: Experiment 1: Intervention 2 (Proximity)
142
Appendix H: Experiment 1: Intervention 2 (Proximity)
143
Appendix H: Experiment 1: Intervention 2 (Proximity)
144
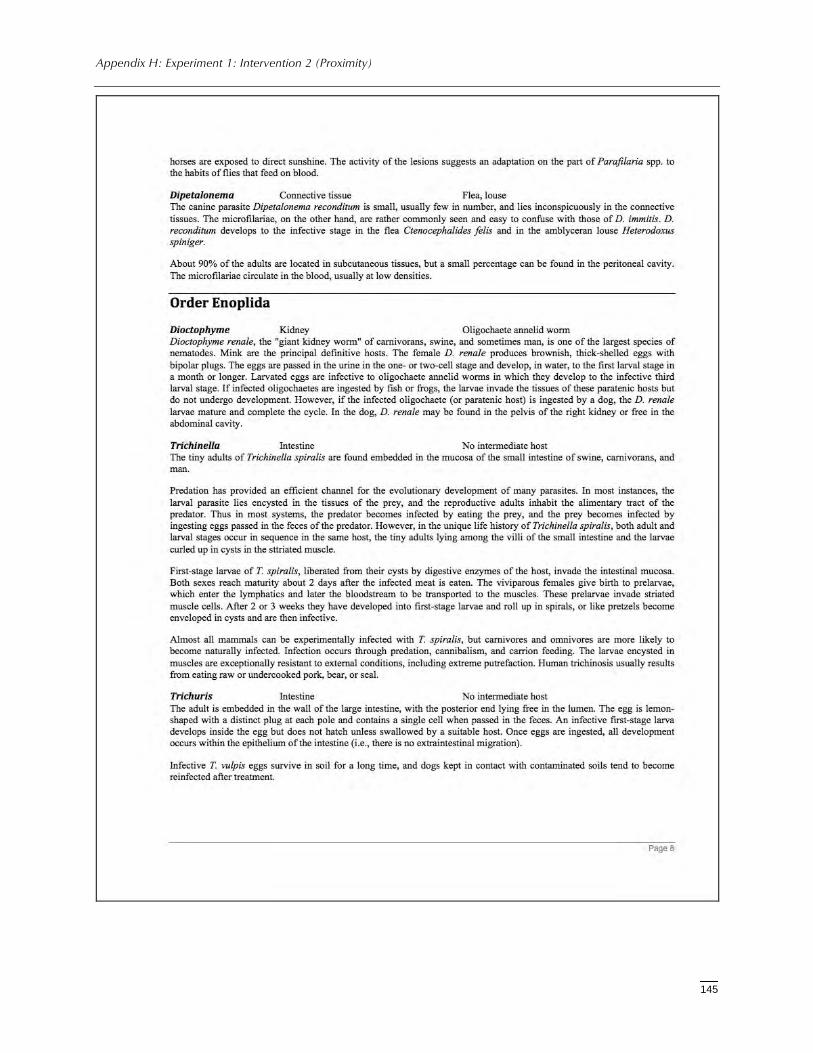
Appendix H: Experiment 1: Intervention 2 (Proximity)
145
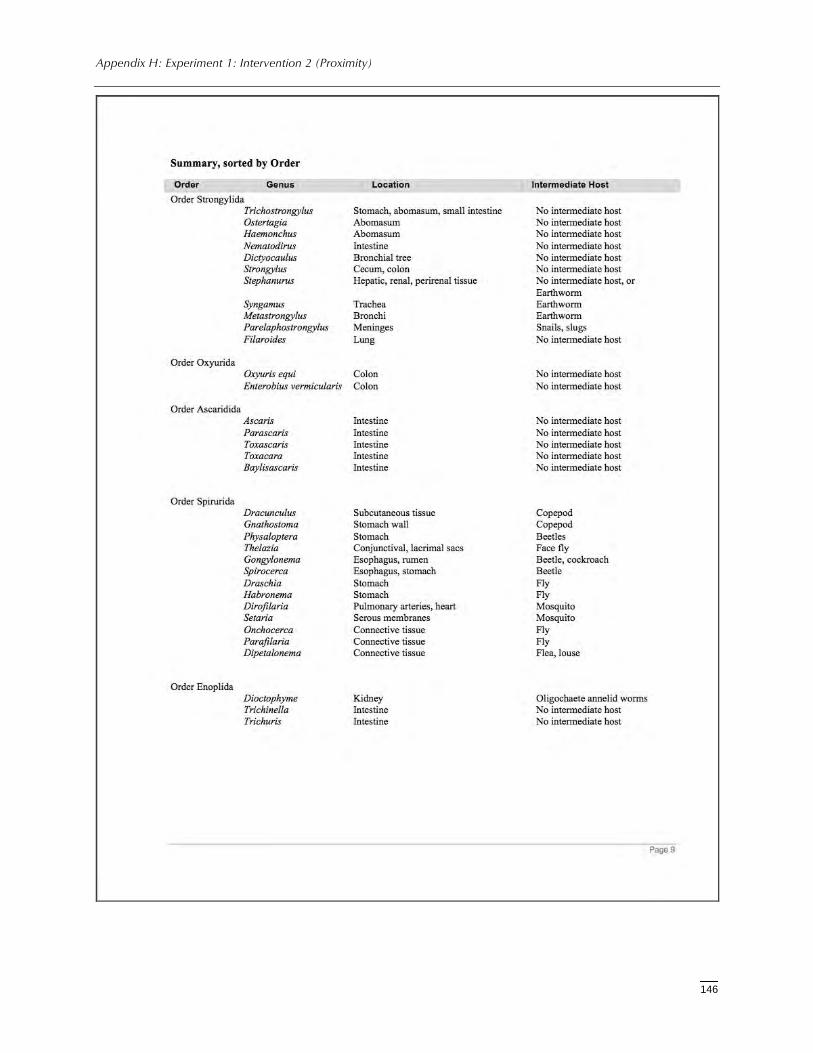
Appendix H: Experiment 1: Intervention 2 (Proximity)
146
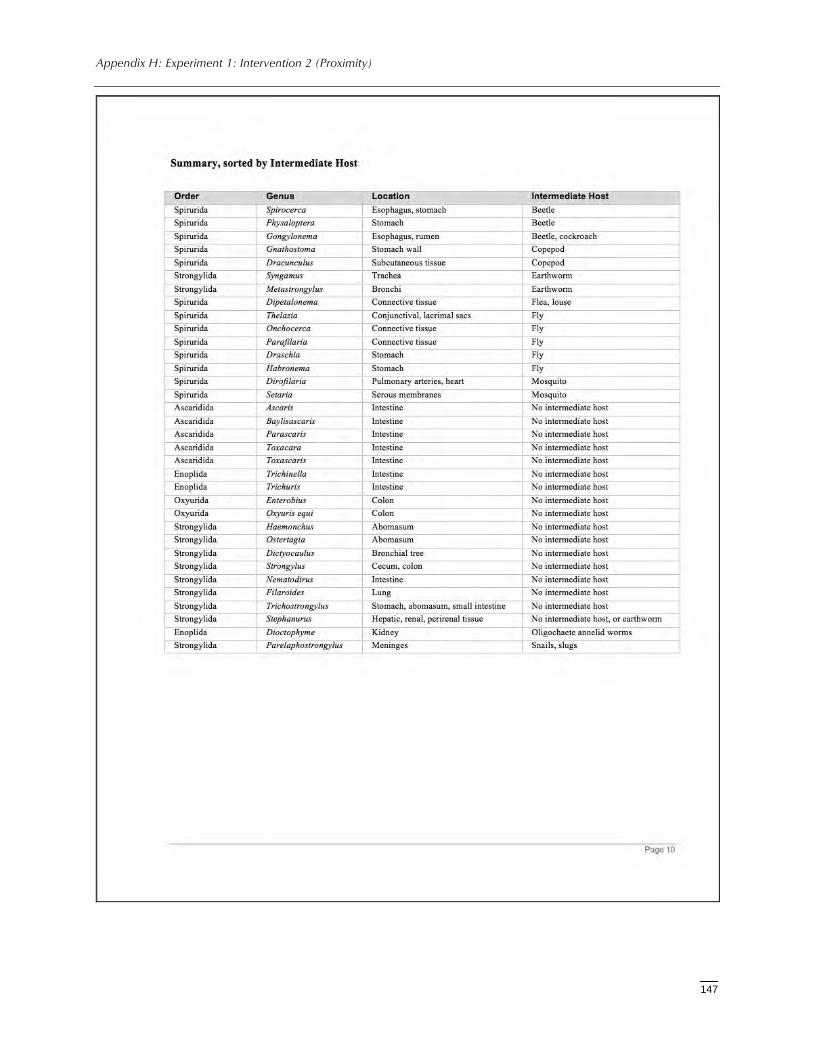
Appendix H: Experiment 1: Intervention 2 (Proximity)
147
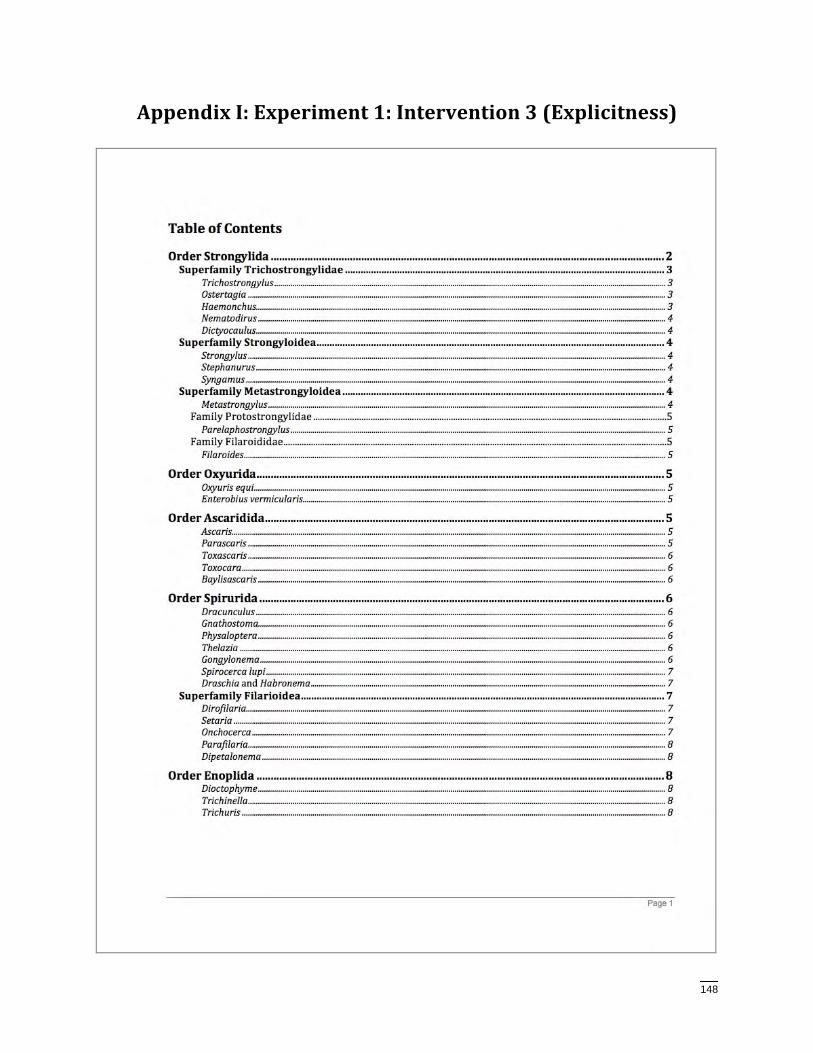
148
AppendixI:Experiment1:Intervention3(Explicitness)
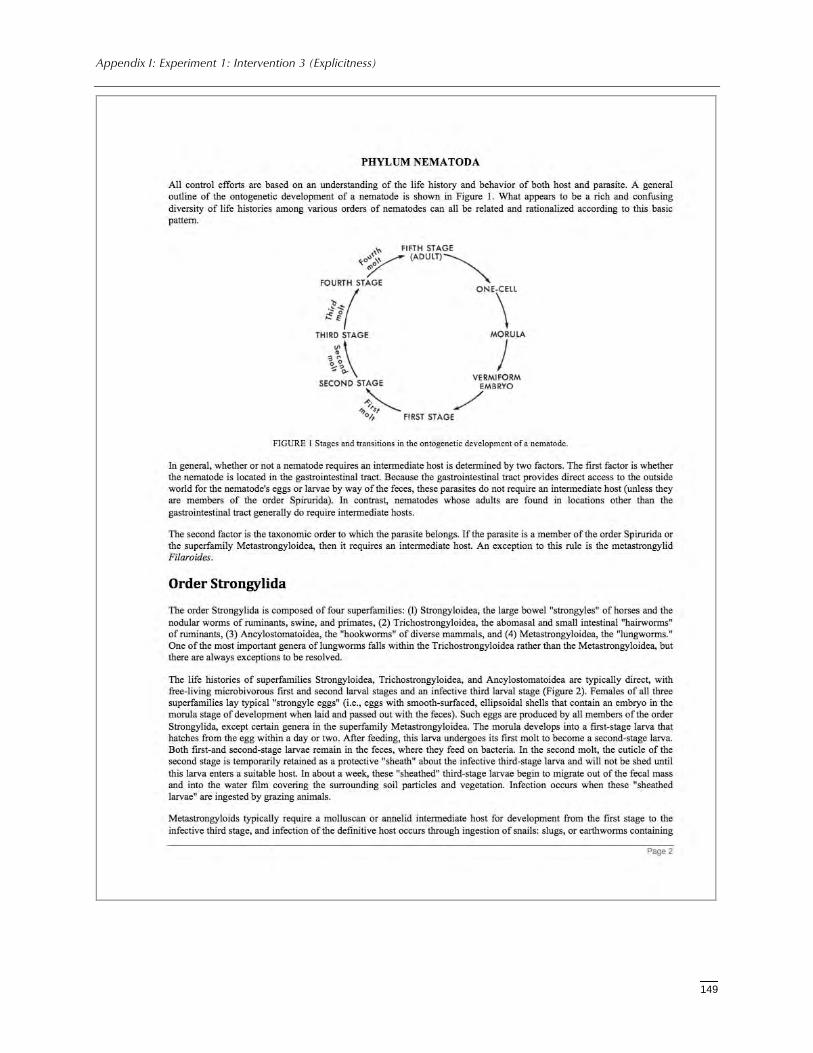
Appendix I: Experiment 1: Intervention 3 (Explicitness)
149
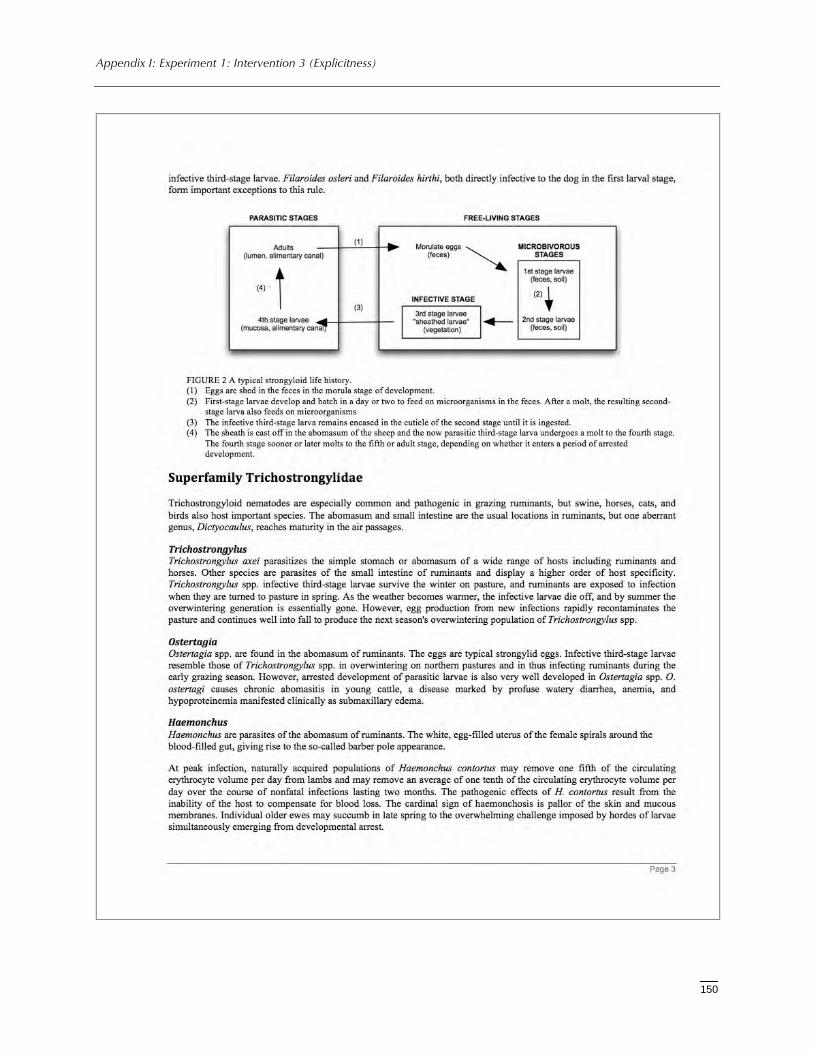
Appendix I: Experiment 1: Intervention 3 (Explicitness)
150
Appendix I: Experiment 1: Intervention 3 (Explicitness)
151
Appendix I: Experiment 1: Intervention 3 (Explicitness)
152
Appendix I: Experiment 1: Intervention 3 (Explicitness)
153
Appendix I: Experiment 1: Intervention 3 (Explicitness)
154
Appendix I: Experiment 1: Intervention 3 (Explicitness)
155
Appendix I: Experiment 1: Intervention 3 (Explicitness)
156
157
AppendixJ:Experiment1:Intervention4(Proximity+Explicitness)
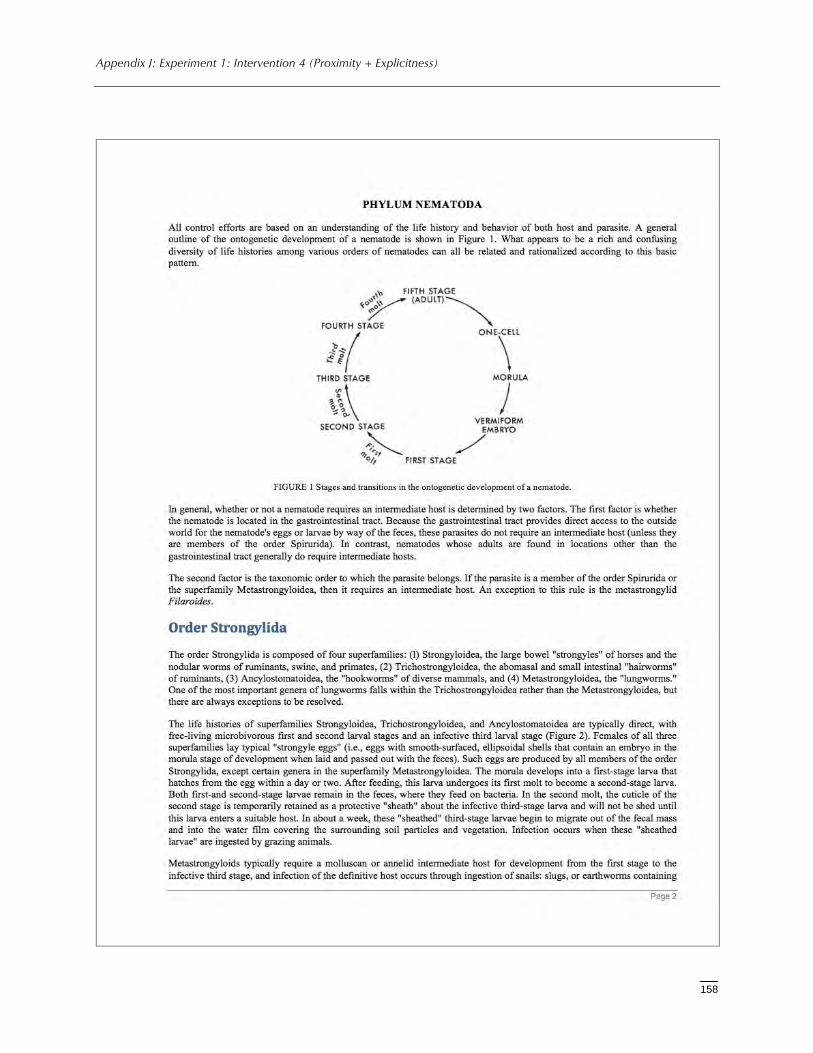
Appendix J: Experiment 1: Intervention 4 (Proximity + Explicitness)
158
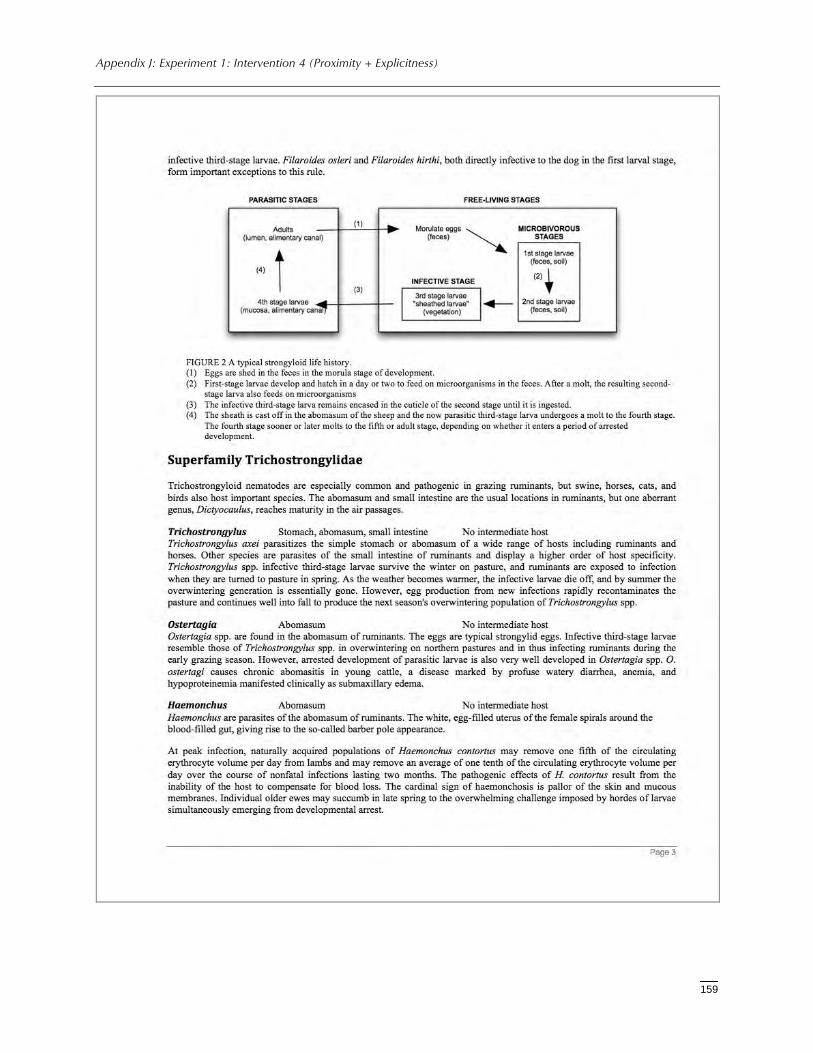
Appendix J: Experiment 1: Intervention 4 (Proximity + Explicitness)
159
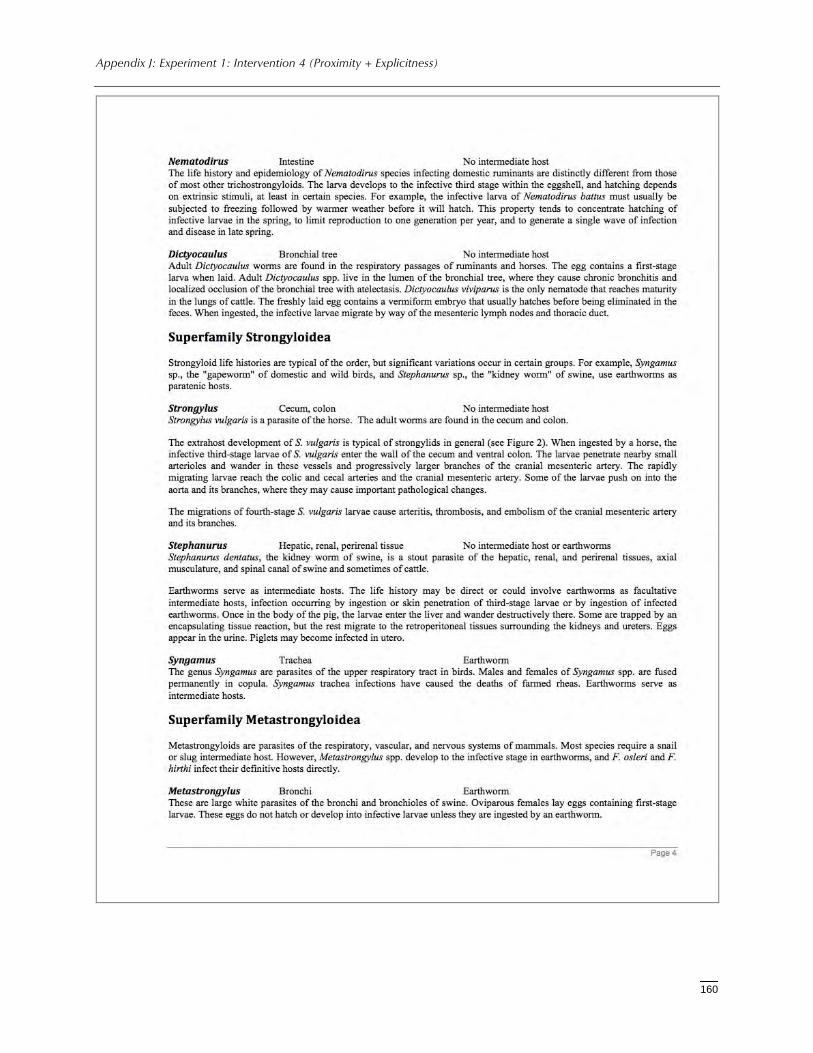
Appendix J: Experiment 1: Intervention 4 (Proximity + Explicitness)
160
Appendix J: Experiment 1: Intervention 4 (Proximity + Explicitness)
161
Appendix J: Experiment 1: Intervention 4 (Proximity + Explicitness)
162
Appendix J: Experiment 1: Intervention 4 (Proximity + Explicitness)
163
Appendix J: Experiment 1: Intervention 4 (Proximity + Explicitness)
164
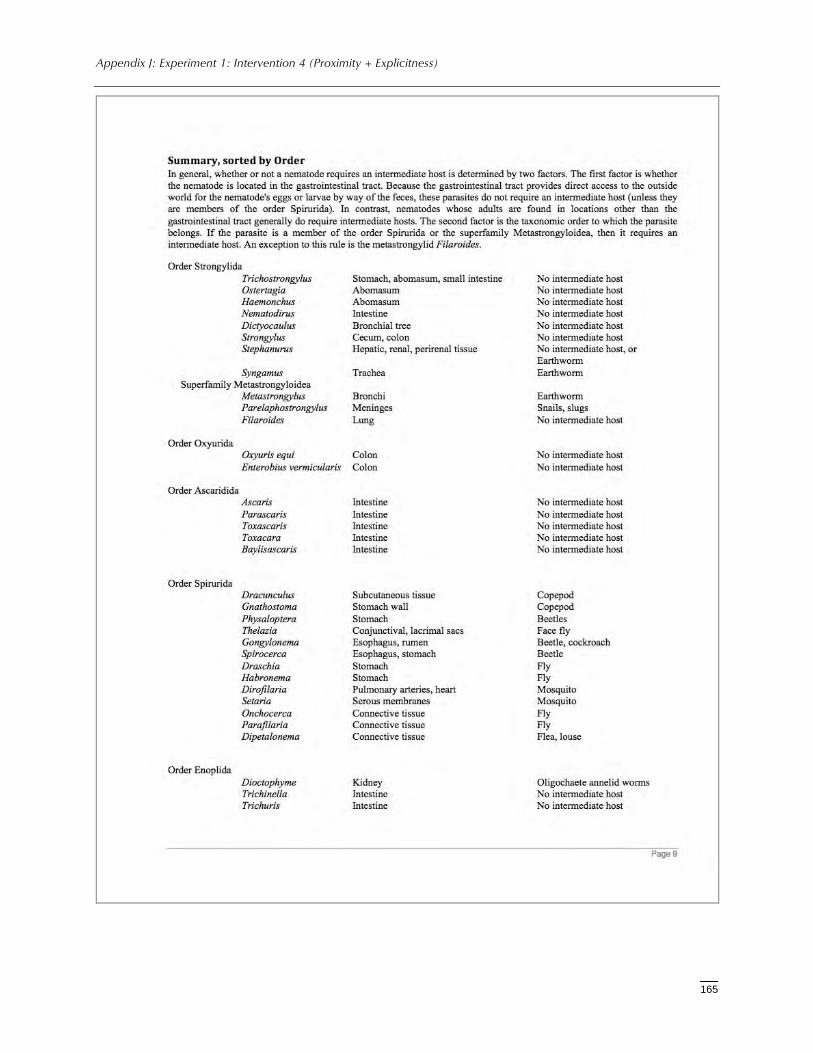
Appendix J: Experiment 1: Intervention 4 (Proximity + Explicitness)
165
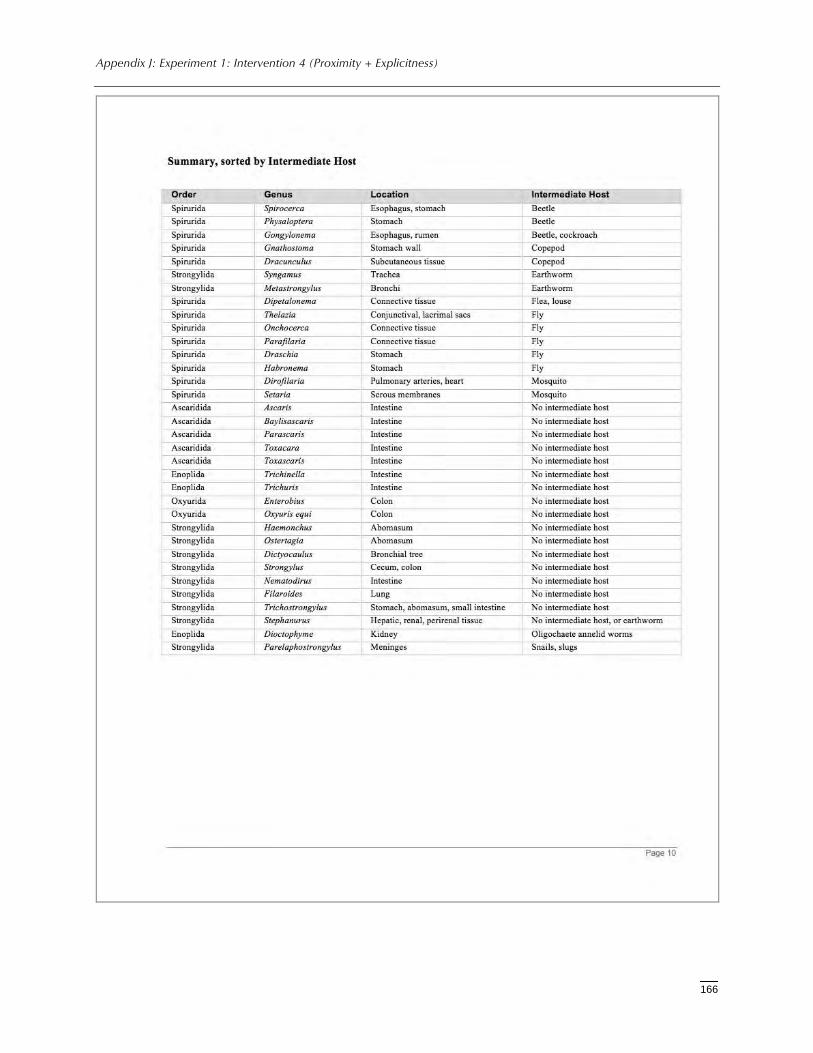
Appendix J: Experiment 1: Intervention 4 (Proximity + Explicitness)
166
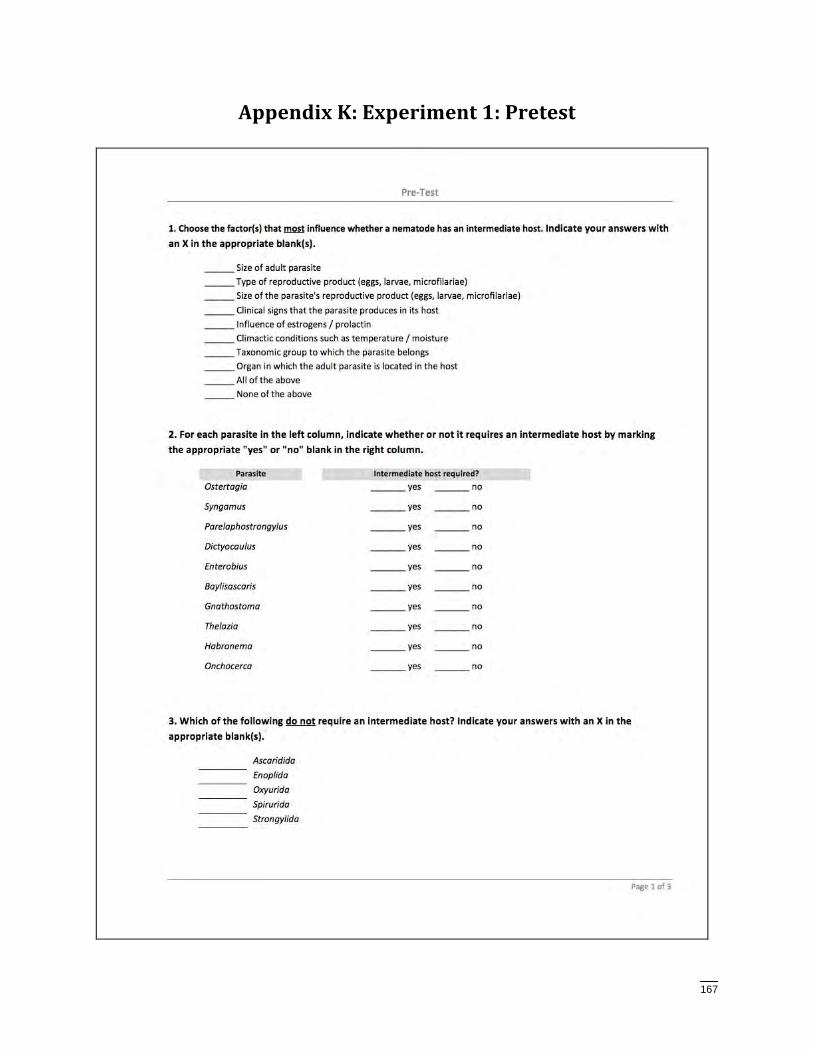
167
AppendixK:Experiment1:Pretest
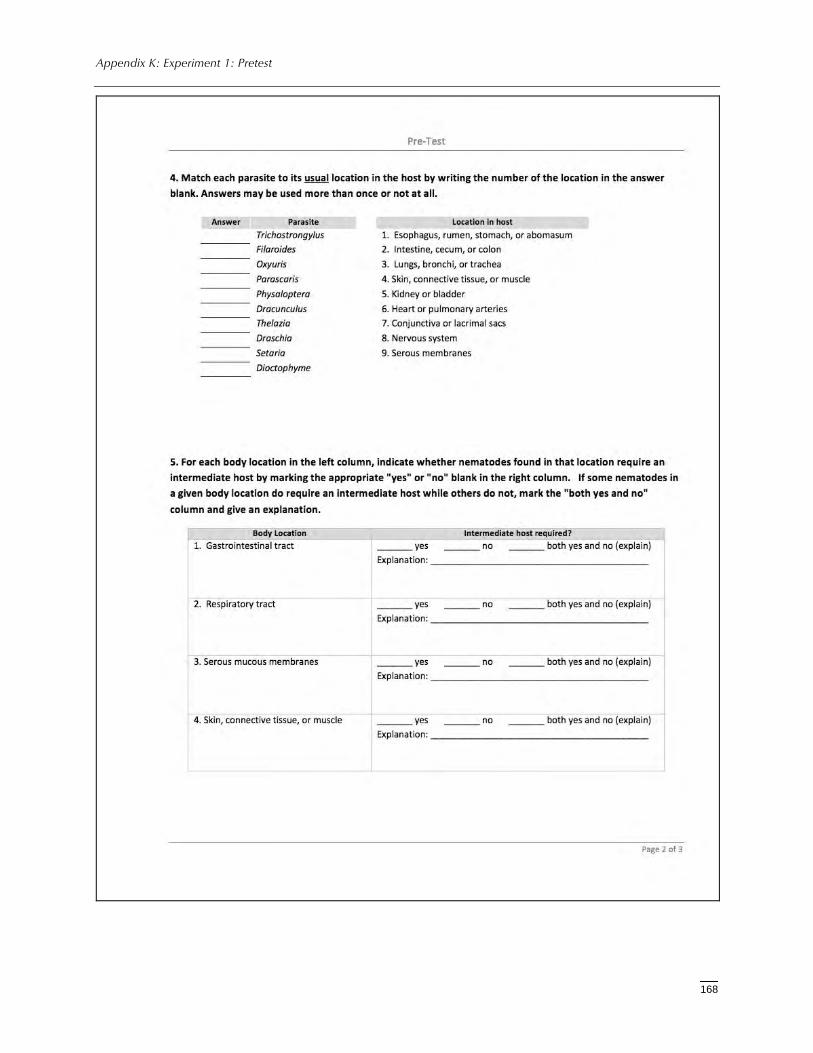
Appendix K: Experiment 1: Pretest
168
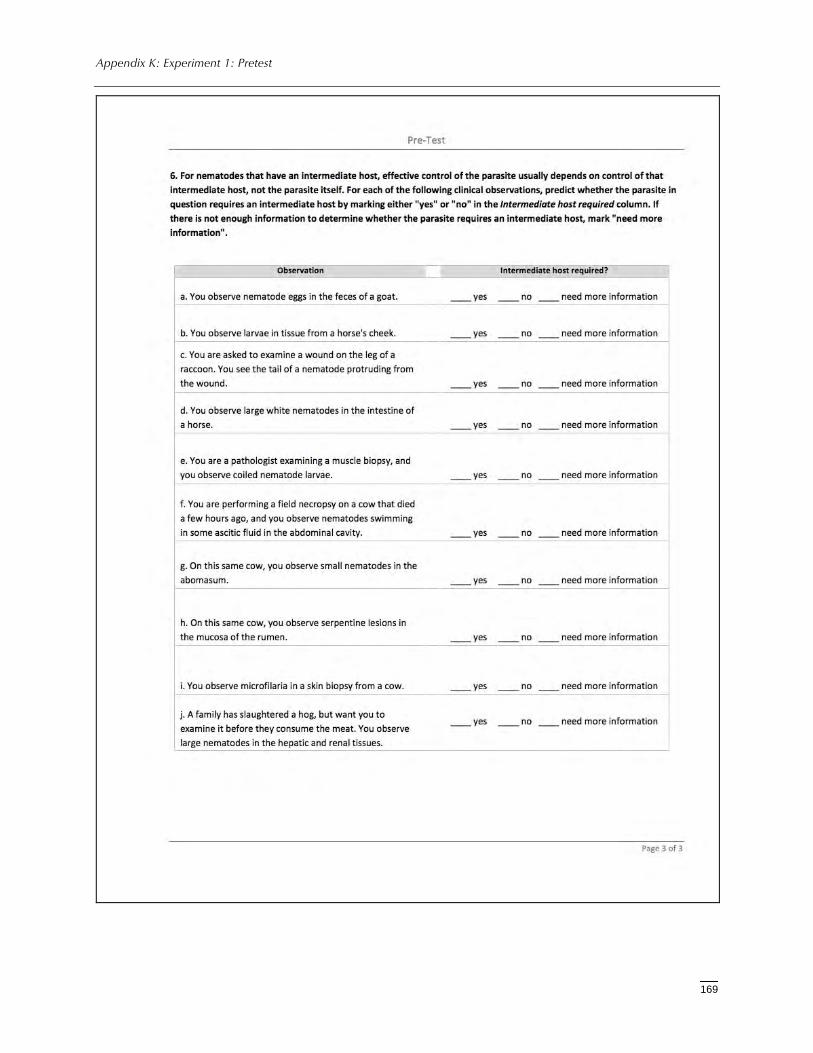
Appendix K: Experiment 1: Pretest
169
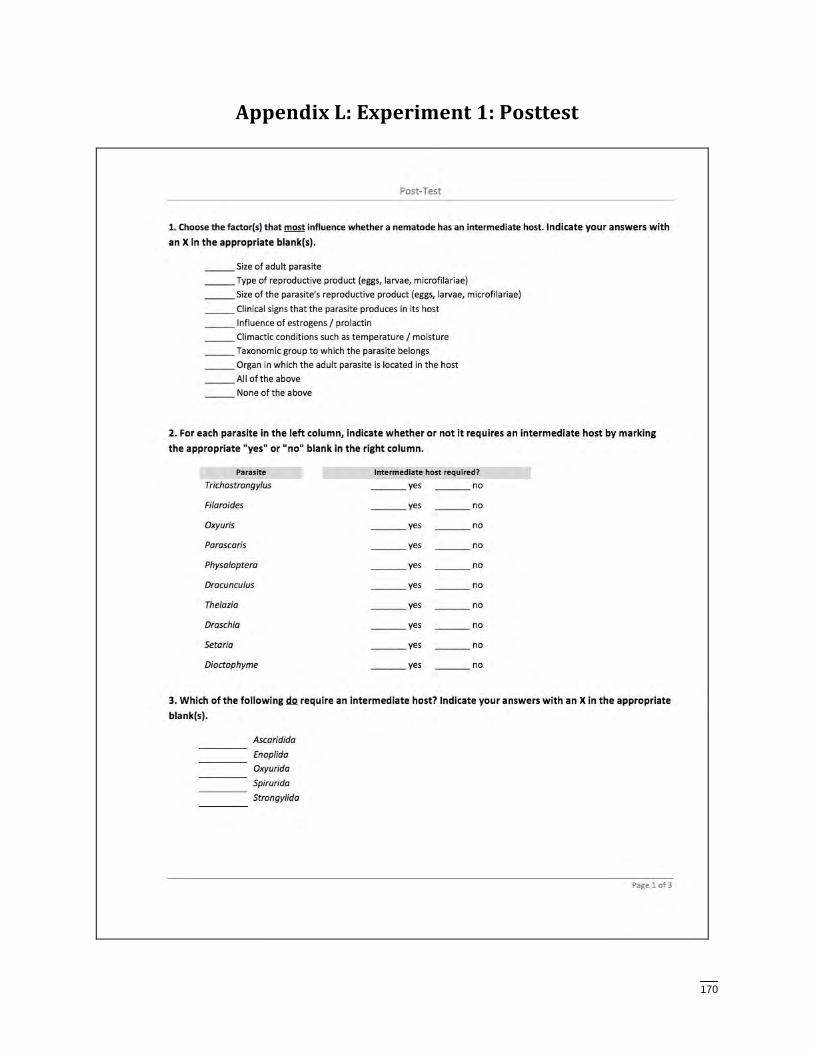
170
AppendixL:Experiment1:Posttest
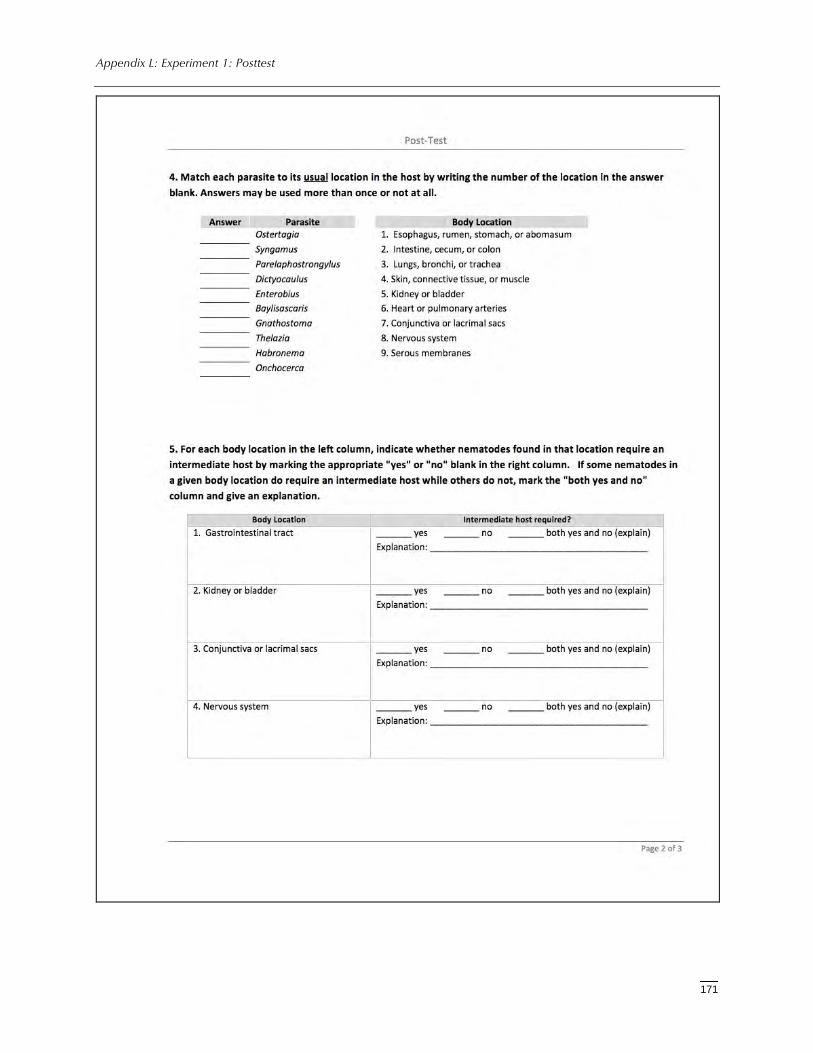
Appendix L: Experiment 1: Posttest
171
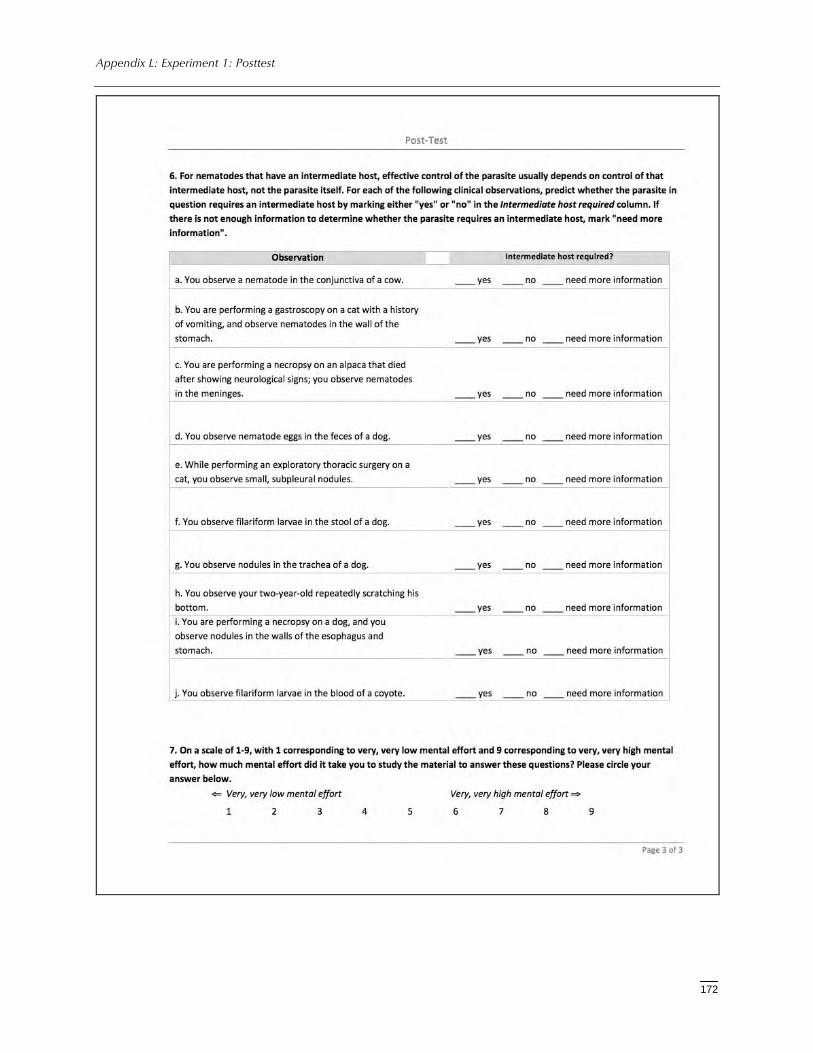
Appendix L: Experiment 1: Posttest
172

173
AppendixM:Experiment2:Intervention1(Control–Tableonly,nodetails)
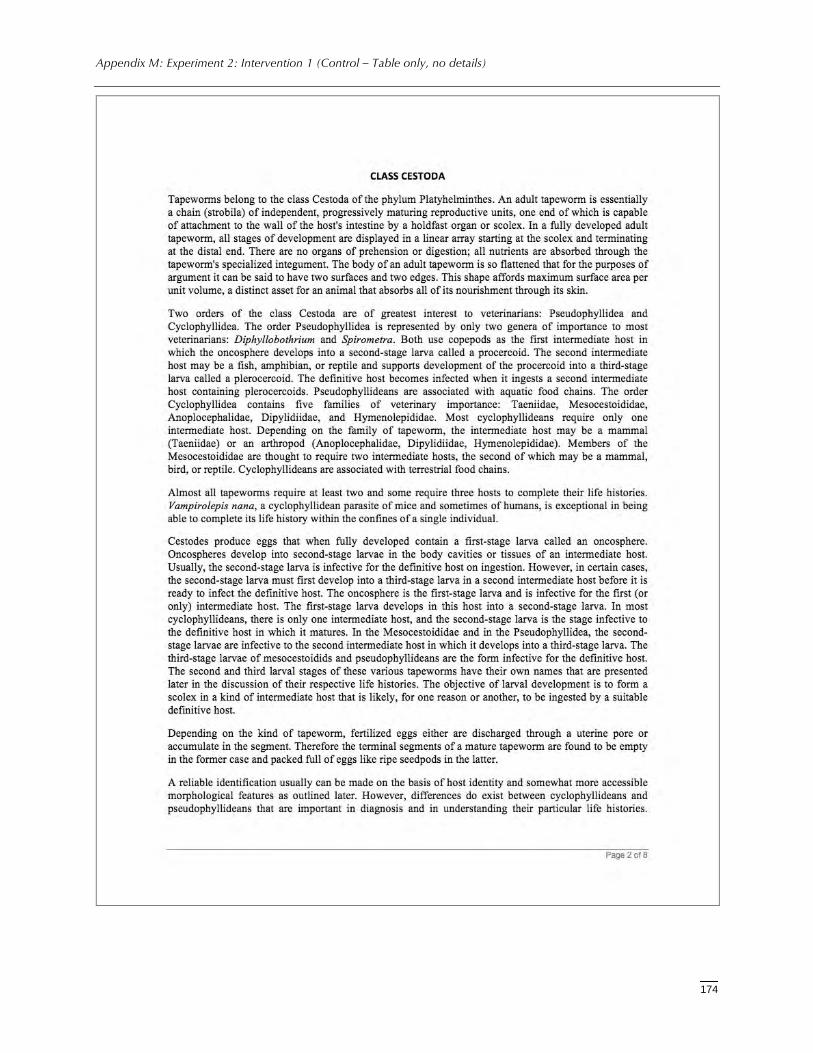
Appendix M: Experiment 2: Intervention 1 (Control – Table only, no details)
174

Appendix M: Experiment 2: Intervention 1 (Control – Table only, no details)
175
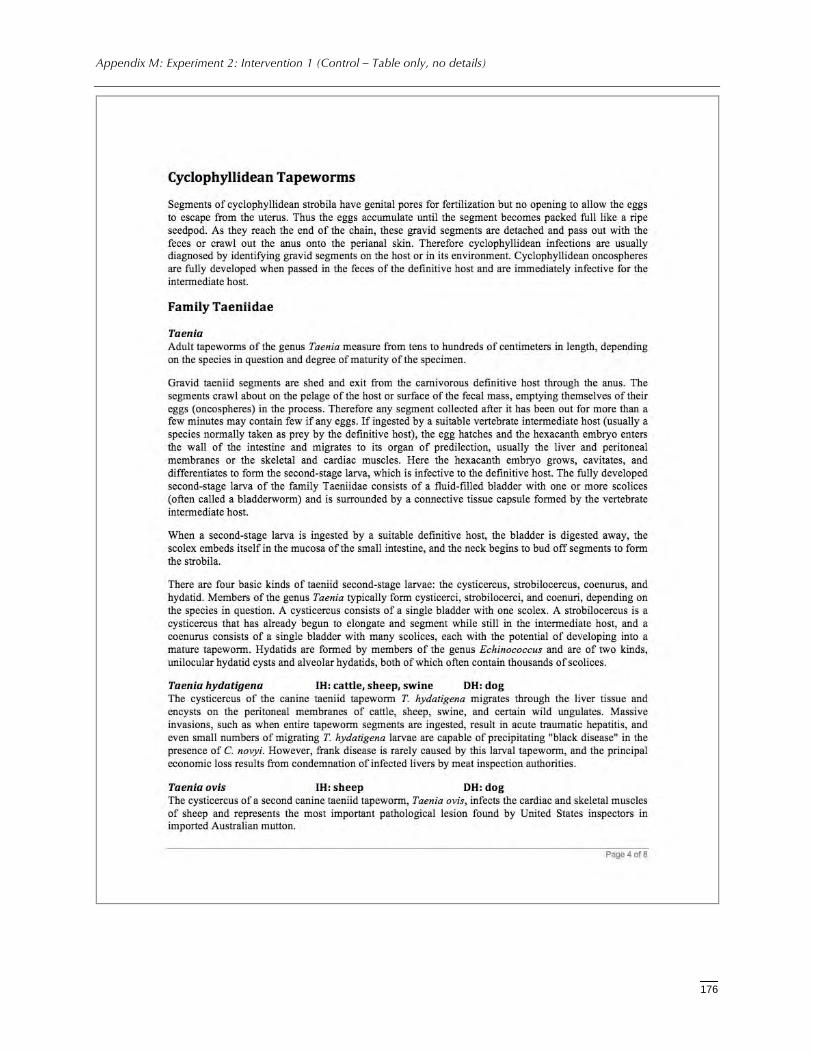
Appendix M: Experiment 2: Intervention 1 (Control – Table only, no details)
176
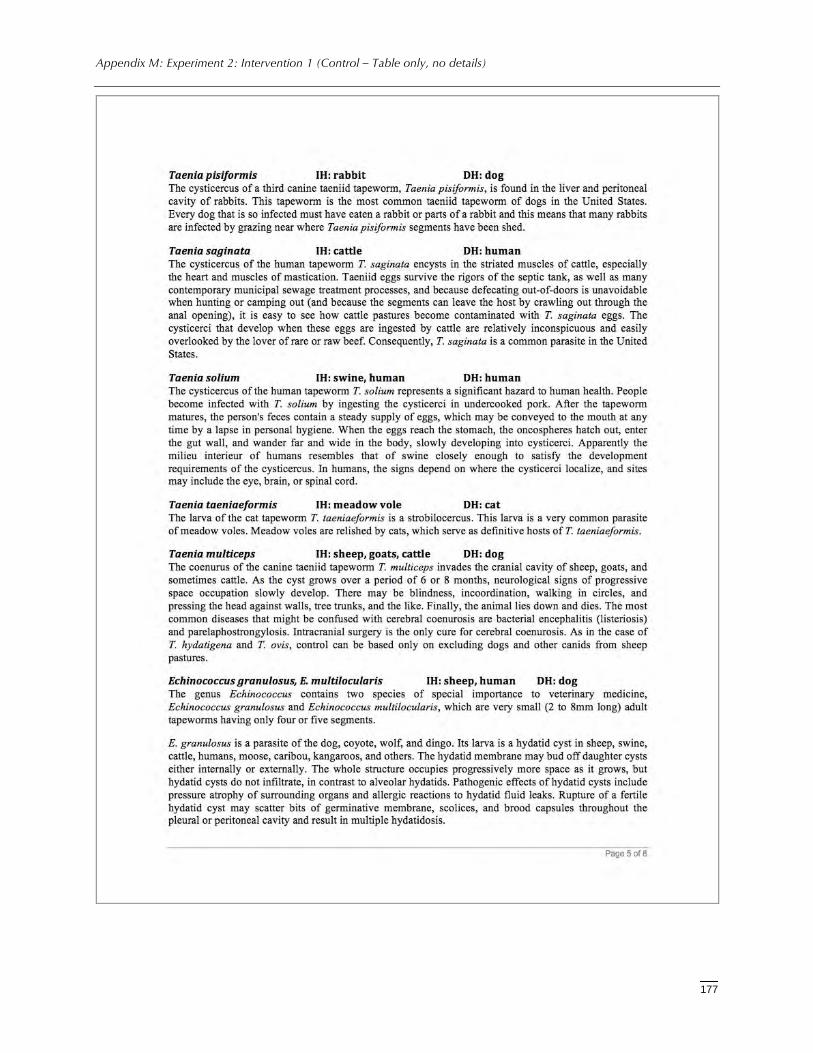
Appendix M: Experiment 2: Intervention 1 (Control – Table only, no details)
177
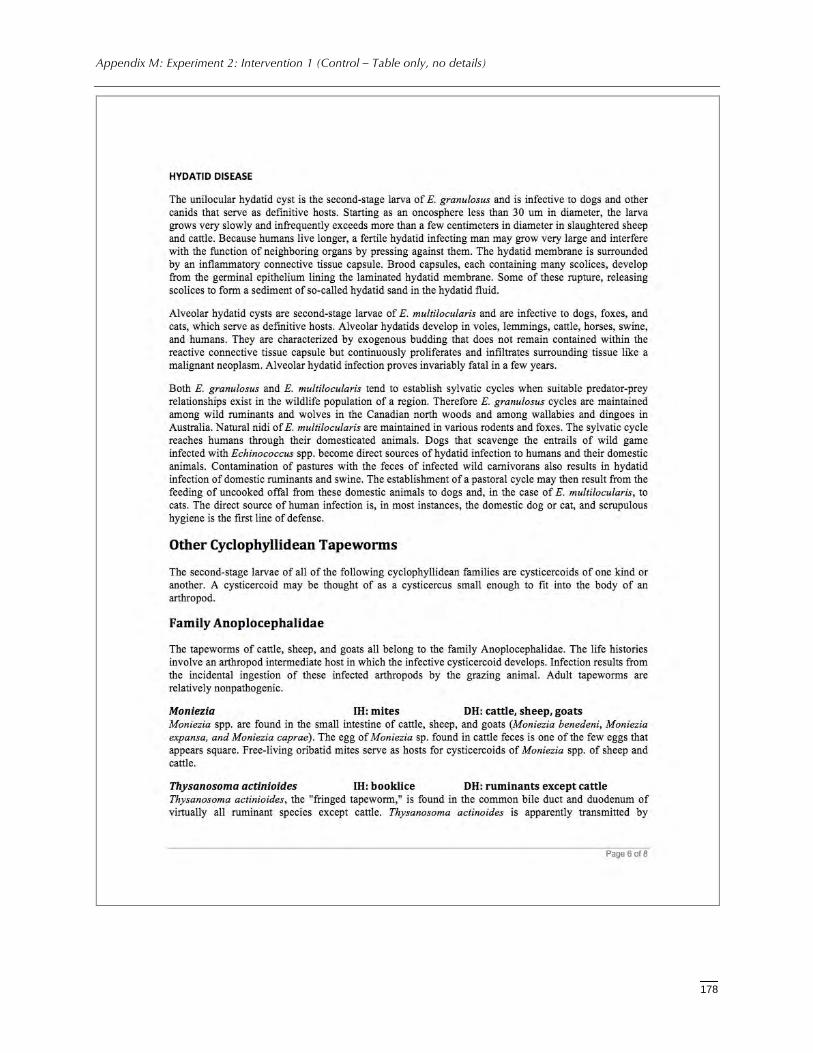
Appendix M: Experiment 2: Intervention 1 (Control – Table only, no details)
178
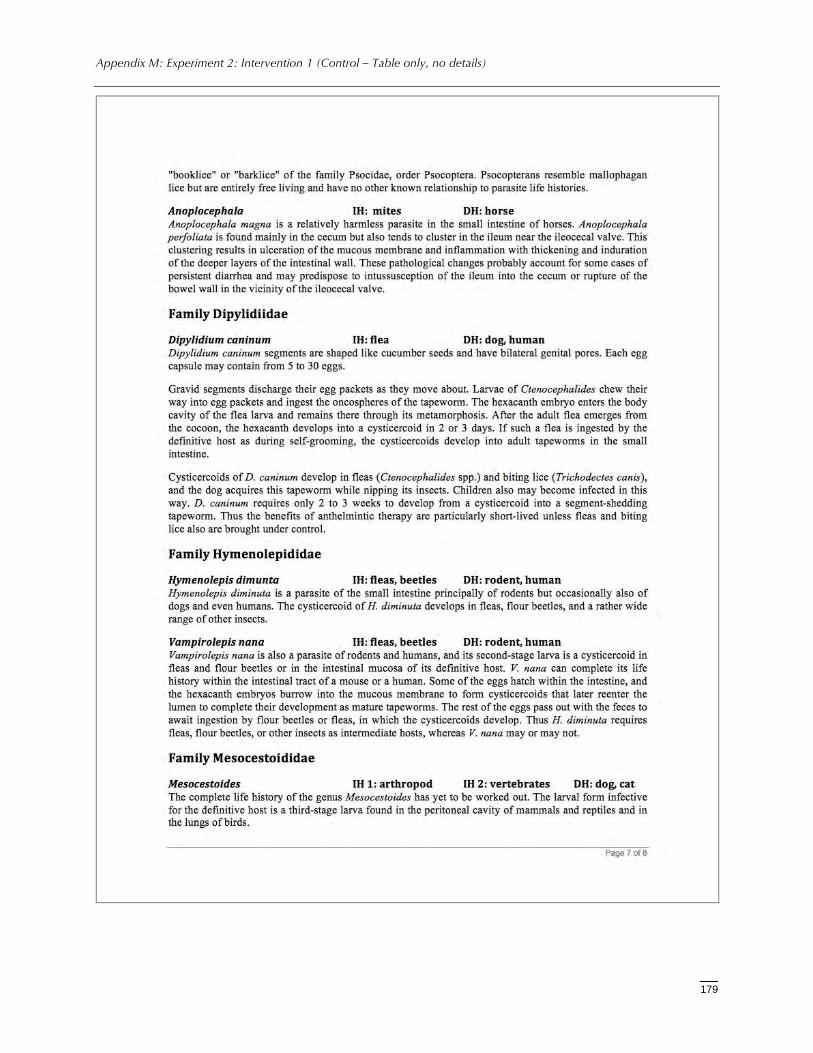
Appendix M: Experiment 2: Intervention 1 (Control – Table only, no details)
179
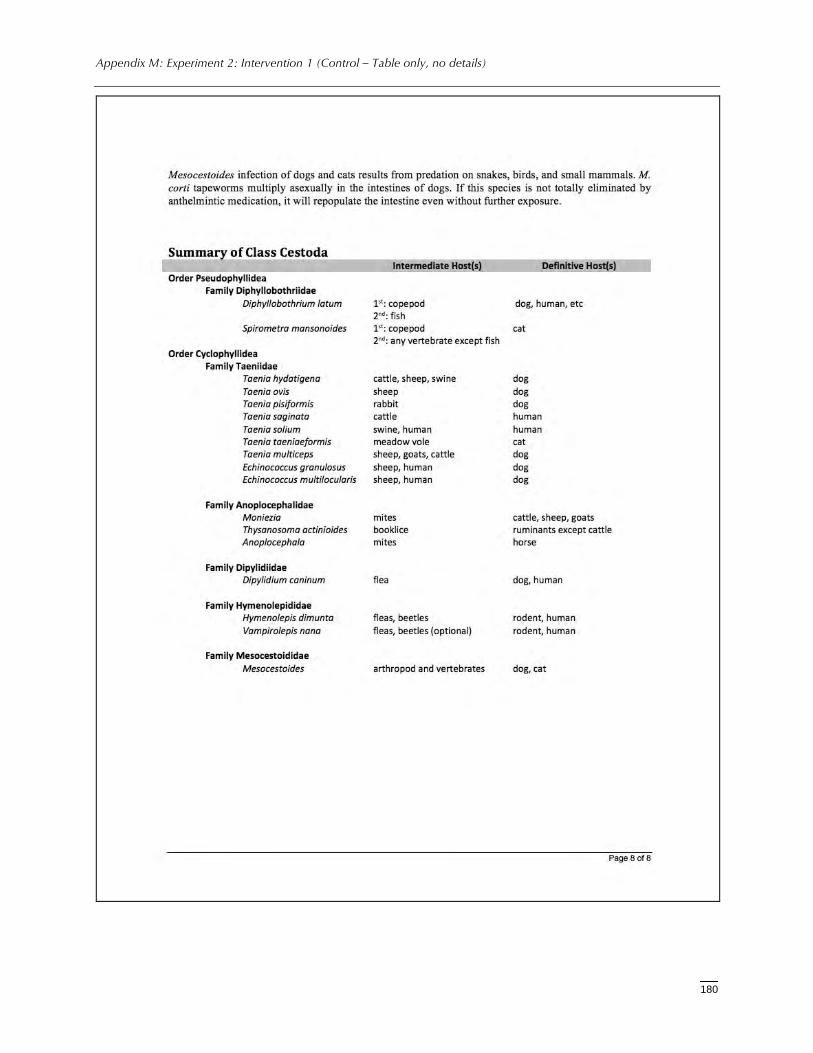
Appendix M: Experiment 2: Intervention 1 (Control – Table only, no details)
180

181
AppendixN:Experiment2:Variation2(Tablewithdetails)
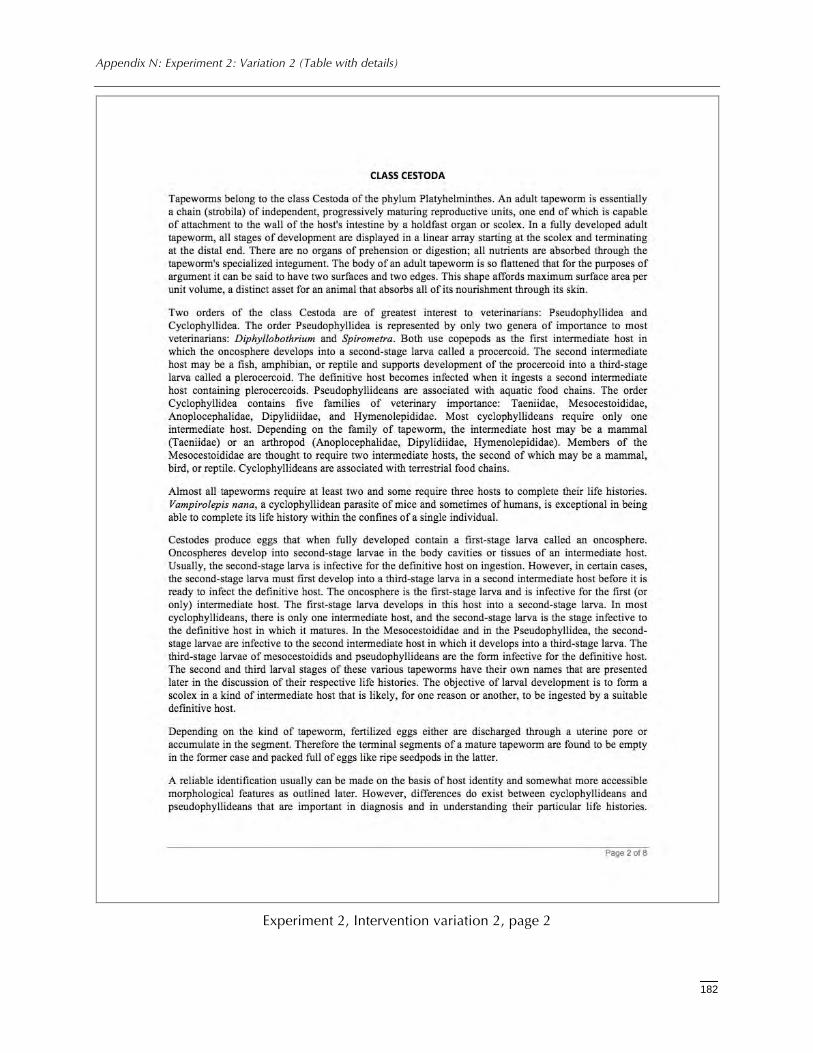
Appendix N: Experiment 2: Variation 2 (Table with details)
182
Experiment 2, Intervention variation 2, page 2
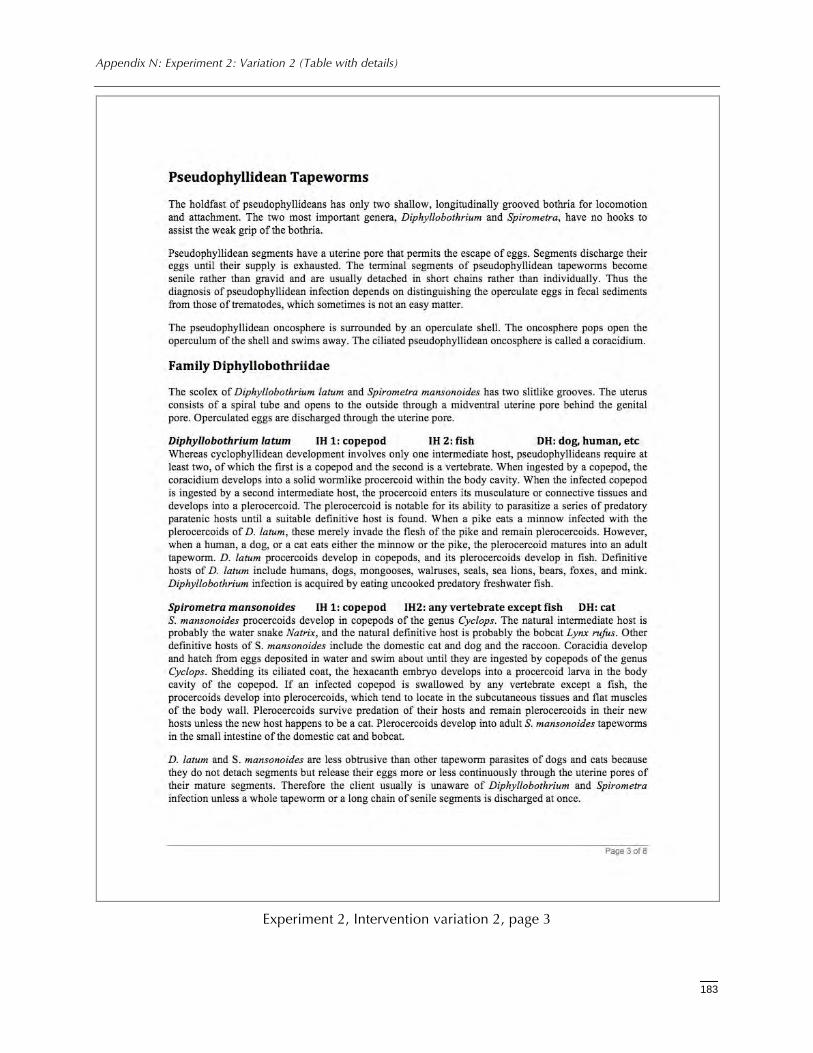
Appendix N: Experiment 2: Variation 2 (Table with details)
183
Experiment 2, Intervention variation 2, page 3
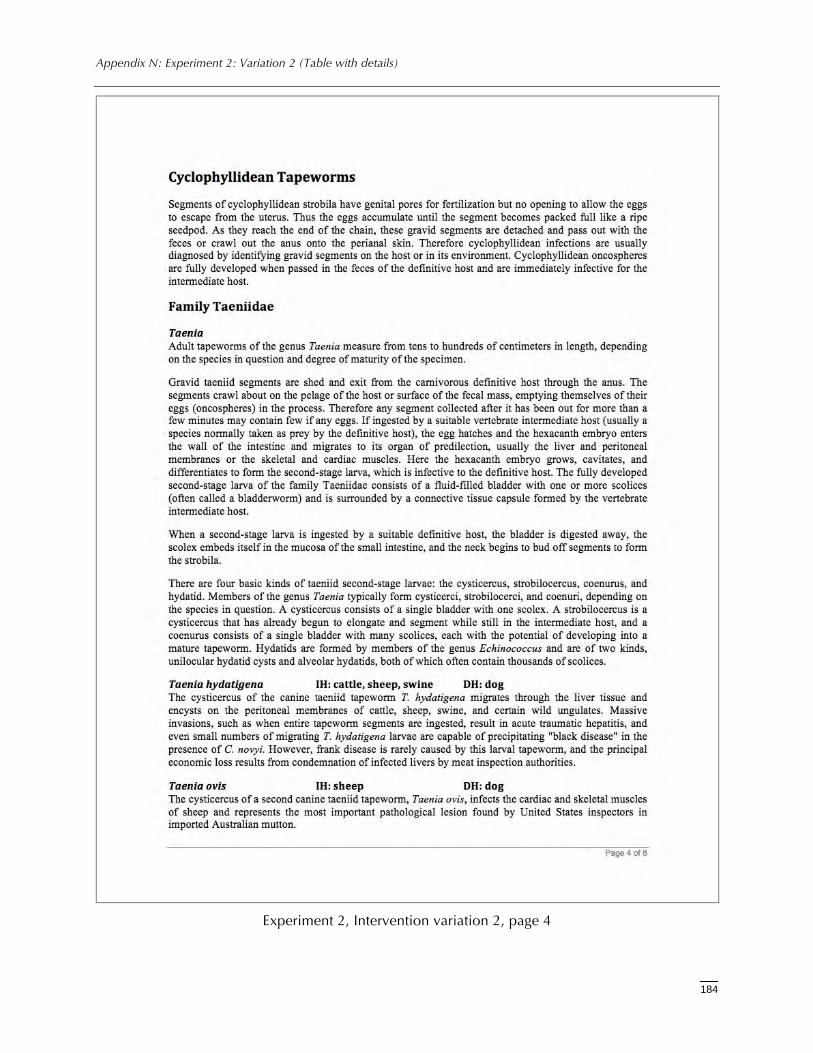
Appendix N: Experiment 2: Variation 2 (Table with details)
184
Experiment 2, Intervention variation 2, page 4
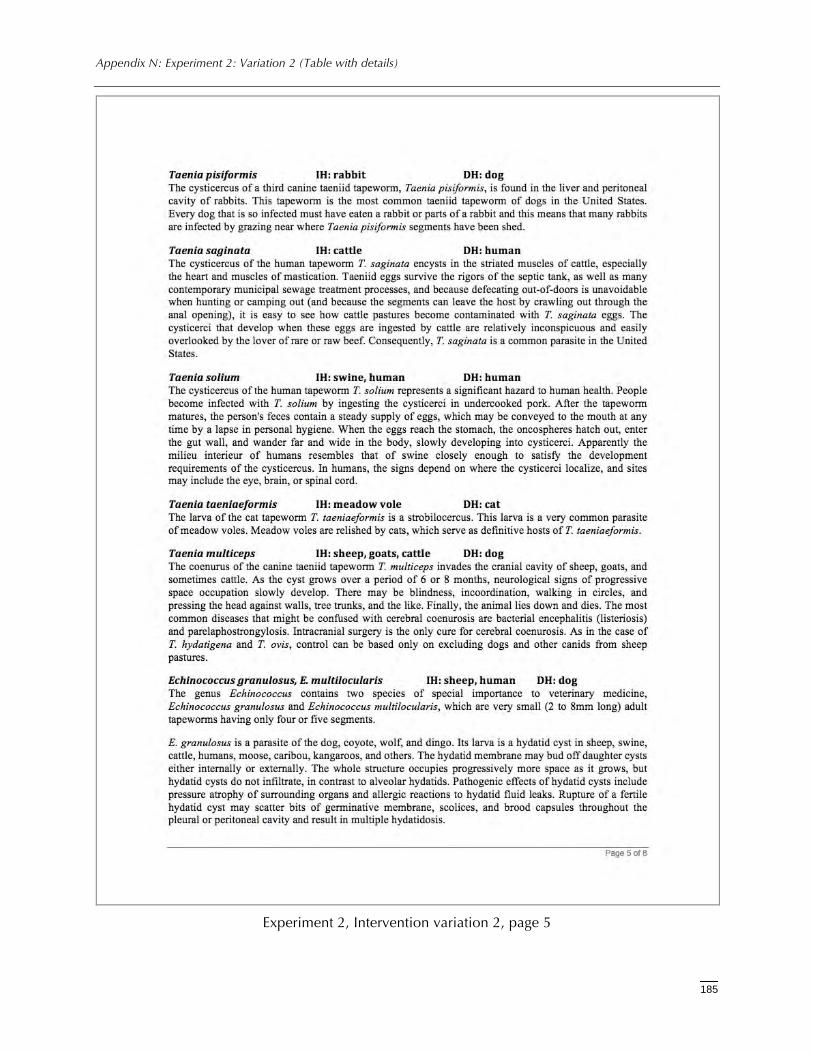
Appendix N: Experiment 2: Variation 2 (Table with details)
185
Experiment 2, Intervention variation 2, page 5
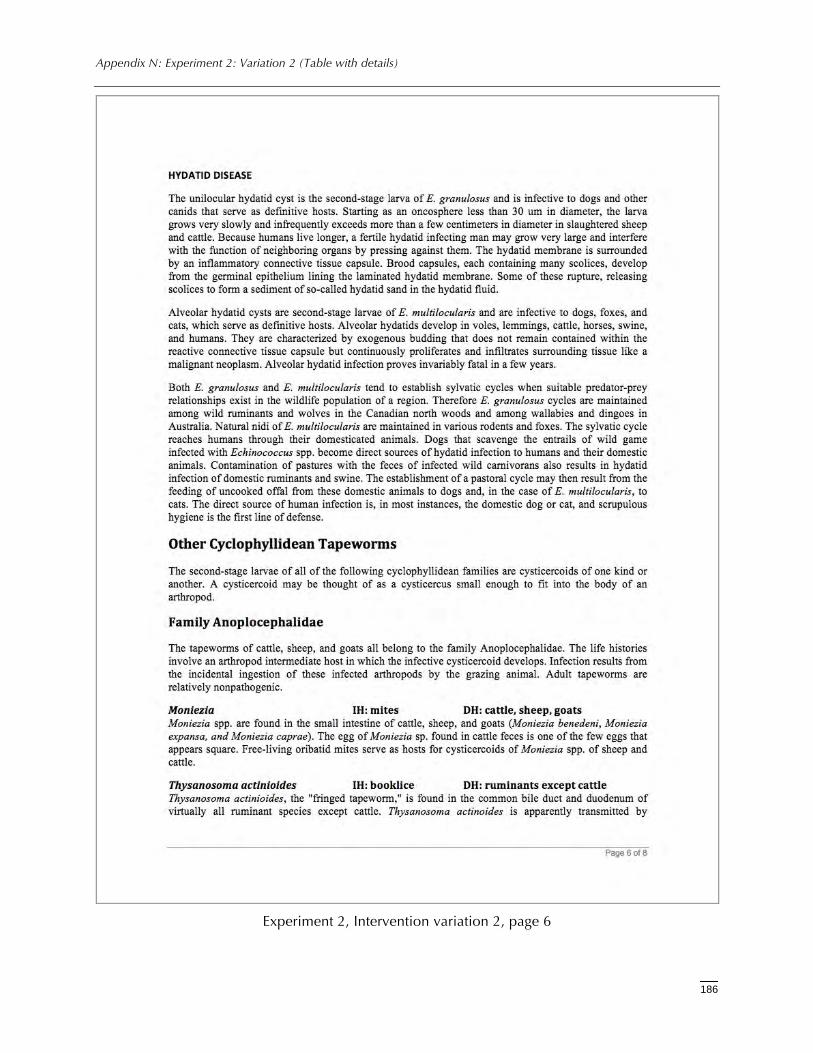
Appendix N: Experiment 2: Variation 2 (Table with details)
186
Experiment 2, Intervention variation 2, page 6
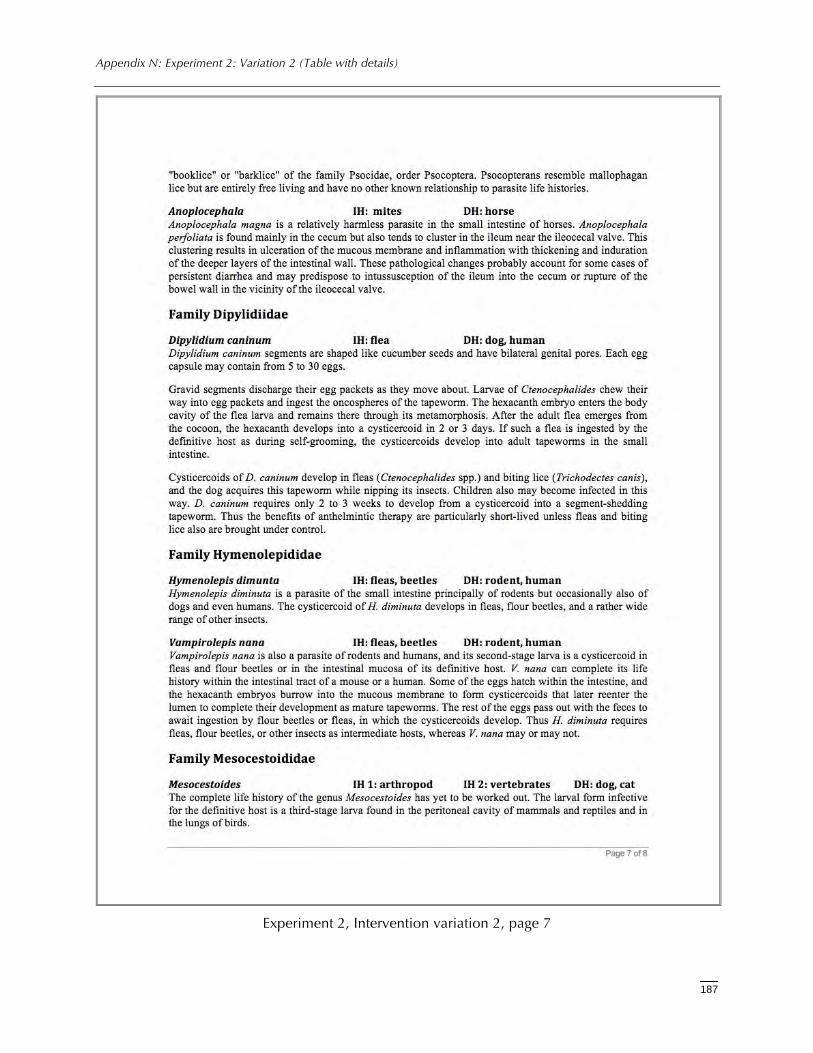
Appendix N: Experiment 2: Variation 2 (Table with details)
187
Experiment 2, Intervention variation 2, page 7

Appendix N: Experiment 2: Variation 2 (Table with details)
188
Experiment 2, Intervention variation 2, page 9
189
AppendixO:Experiment2:Intervention3(Conceptmap)
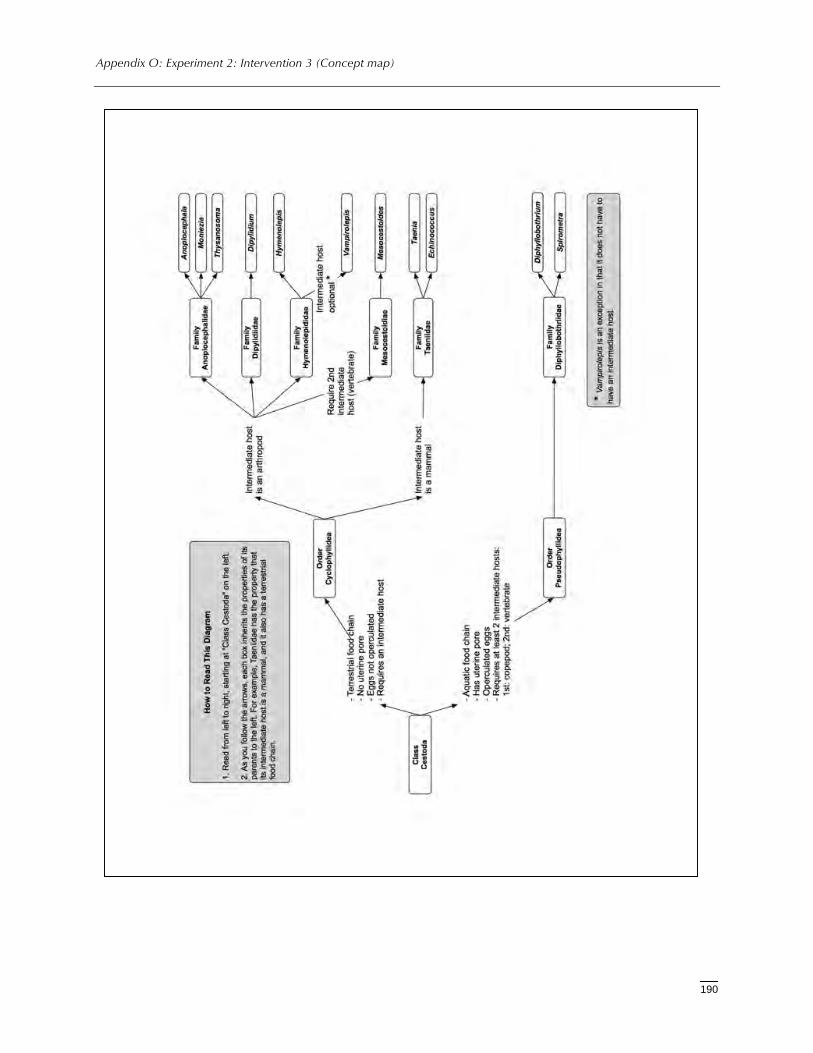
Appendix O: Experiment 2: Intervention 3 (Concept map)
190

Appendix O: Experiment 2: Intervention 3 (Concept map)
191
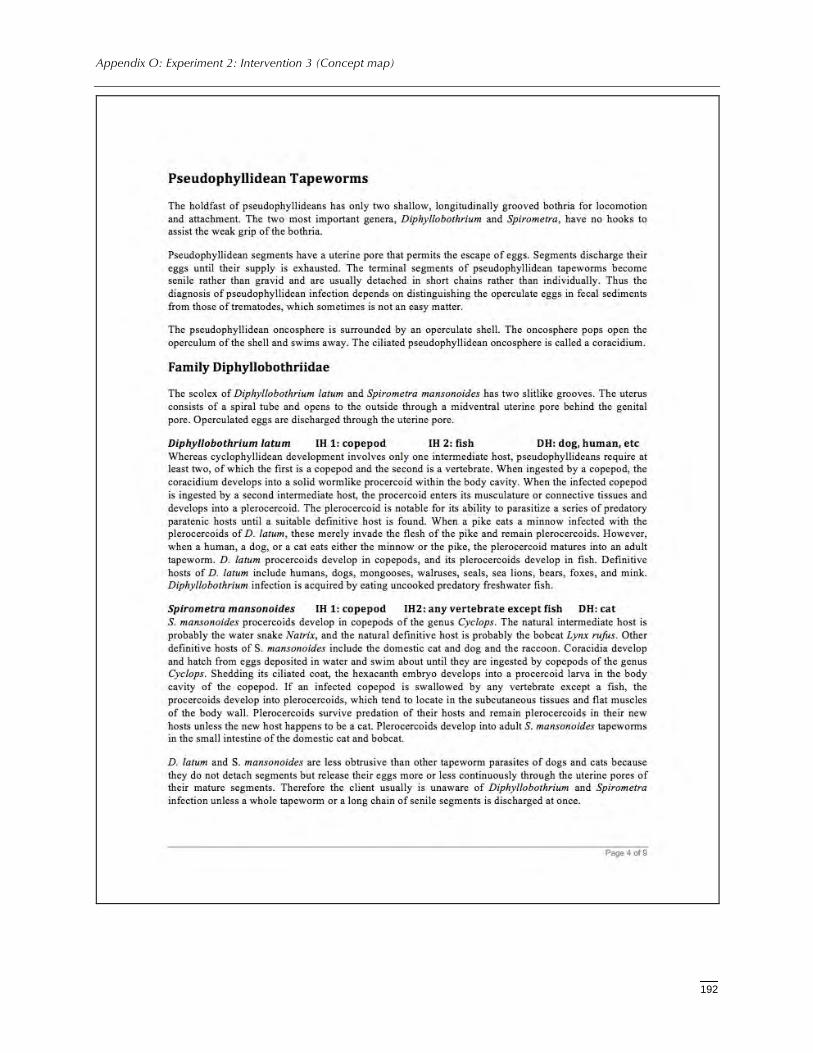
Appendix O: Experiment 2: Intervention 3 (Concept map)
192

Appendix O: Experiment 2: Intervention 3 (Concept map)
193

Appendix O: Experiment 2: Intervention 3 (Concept map)
194
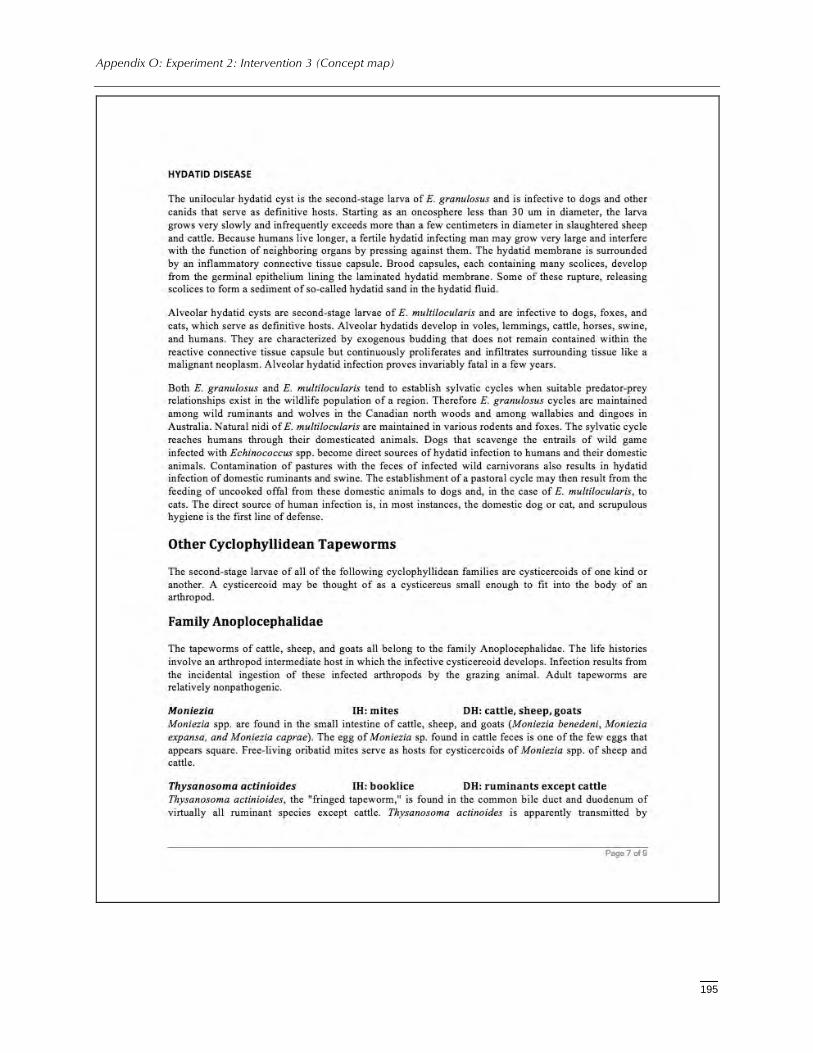
Appendix O: Experiment 2: Intervention 3 (Concept map)
195
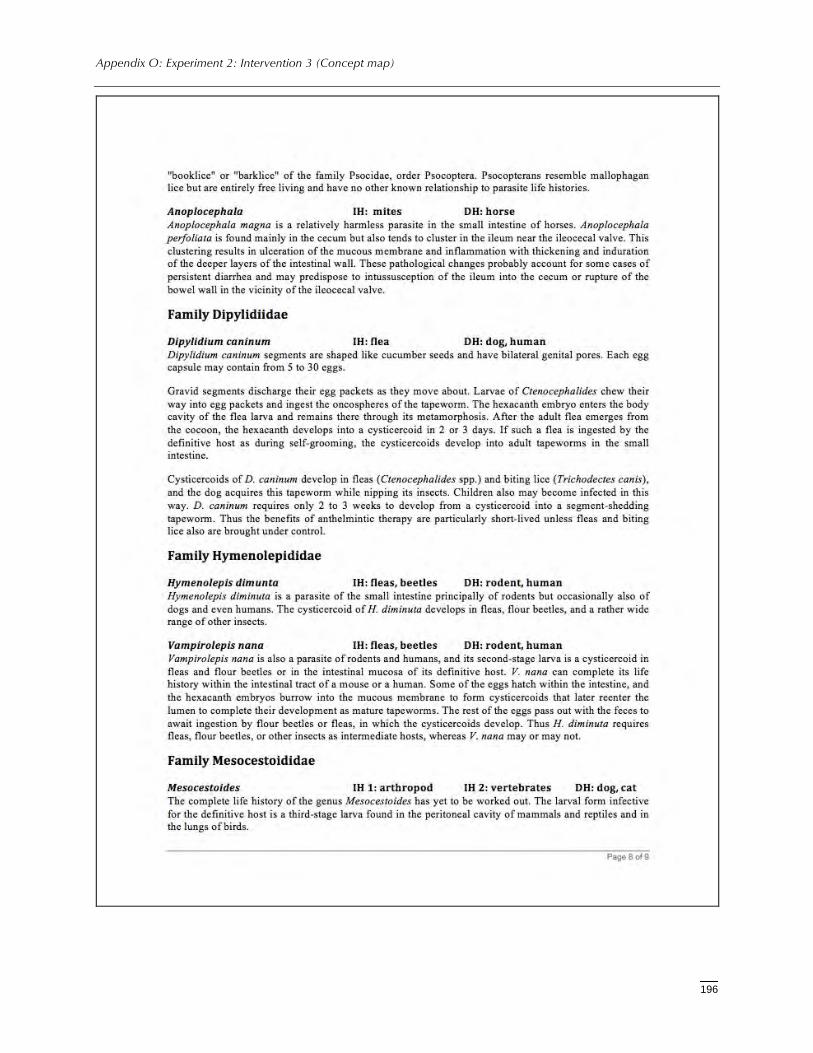
Appendix O: Experiment 2: Intervention 3 (Concept map)
196
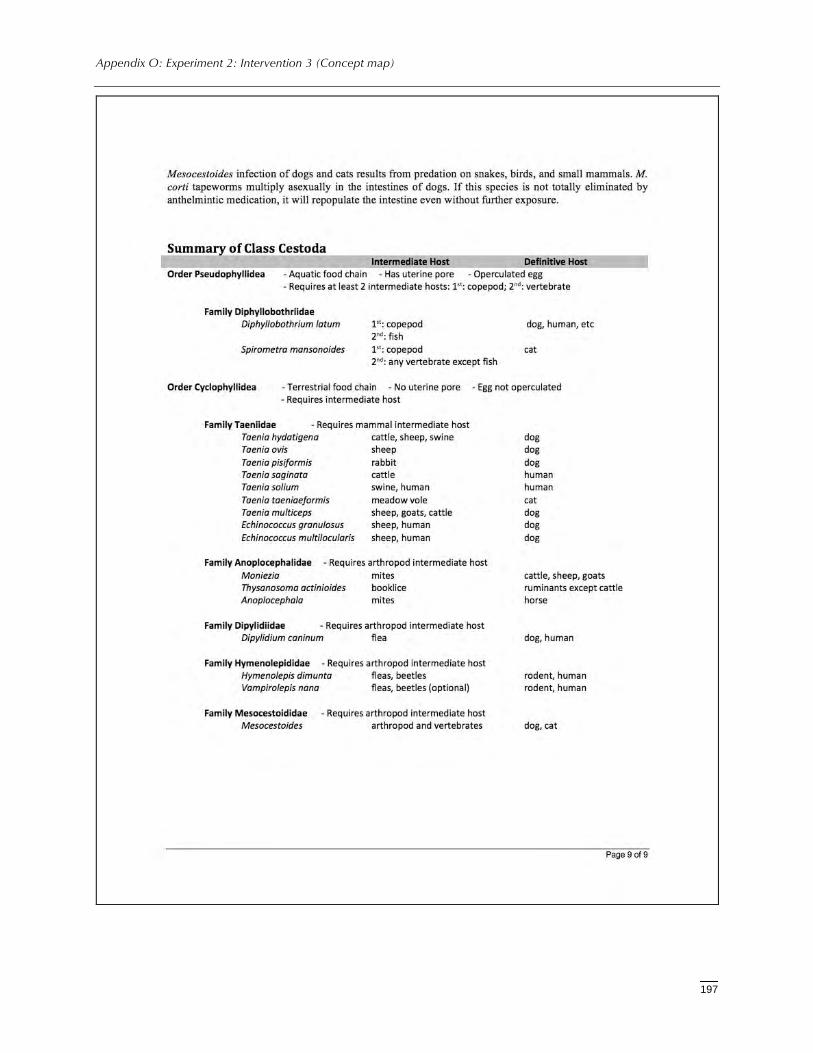
Appendix O: Experiment 2: Intervention 3 (Concept map)
197
198
AppendixP:Experiment2:Intervention4(Full+partialconceptmaps)
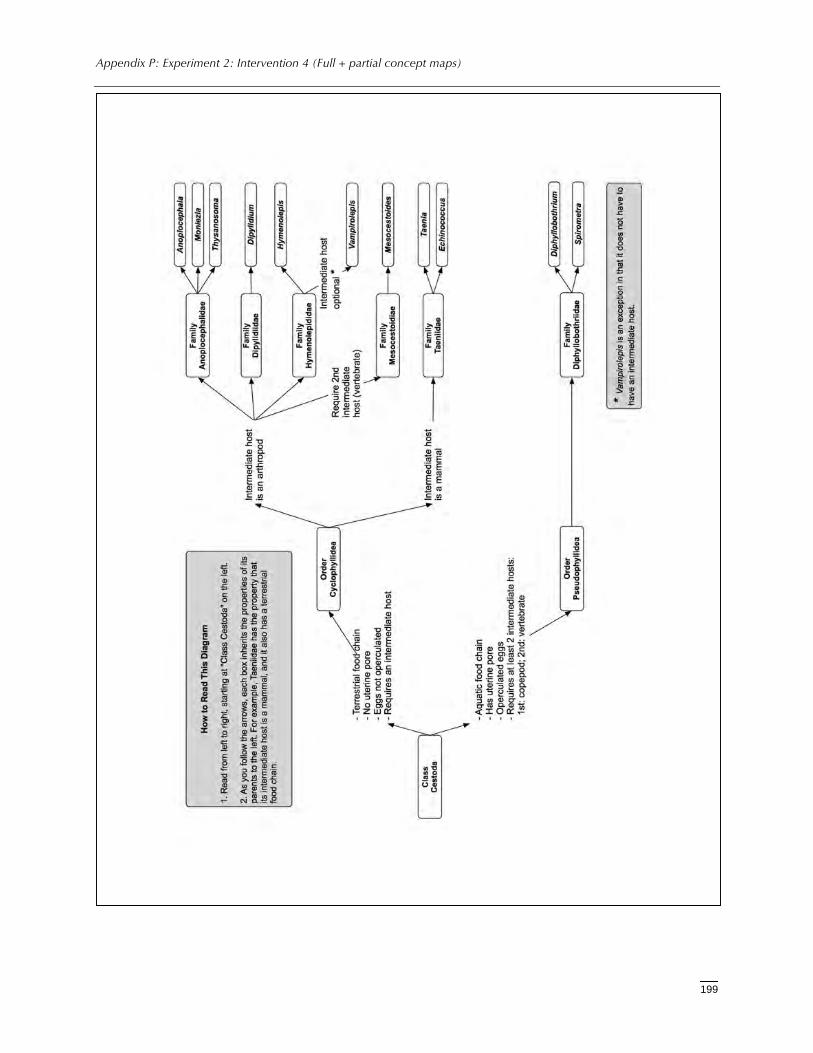
Appendix P: Experiment 2: Intervention 4 (Full + partial concept maps)
199

Appendix P: Experiment 2: Intervention 4 (Full + partial concept maps)
200
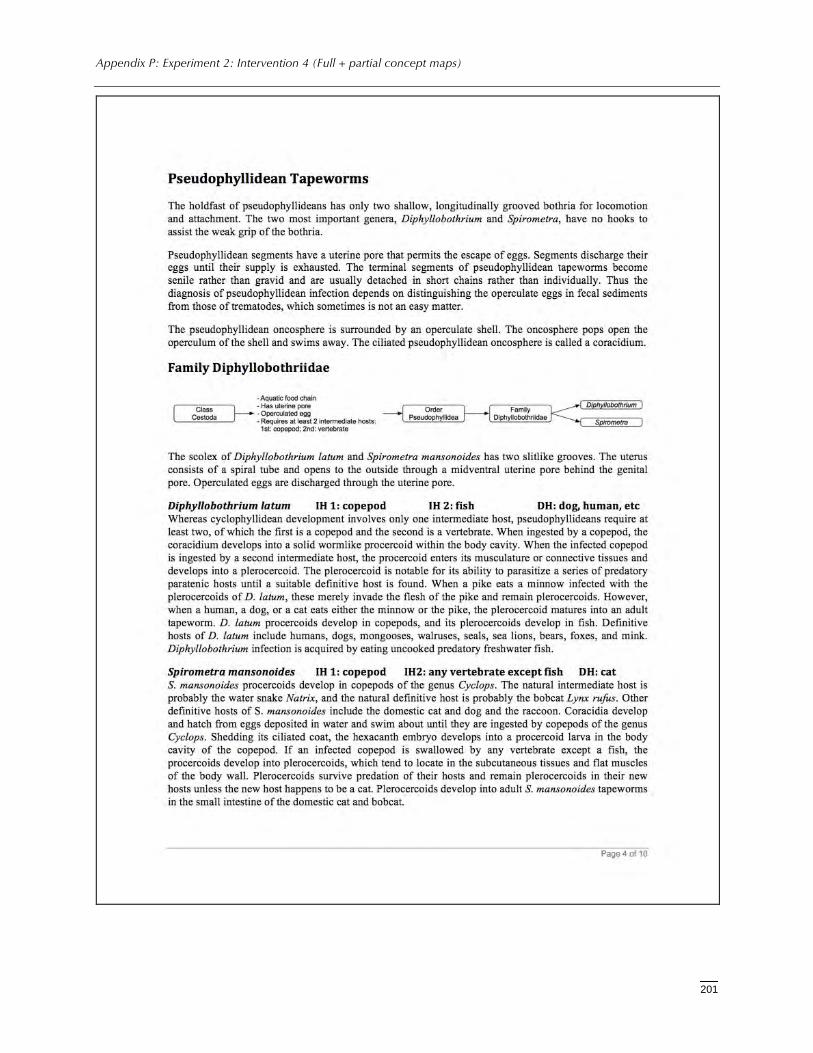
Appendix P: Experiment 2: Intervention 4 (Full + partial concept maps)
201
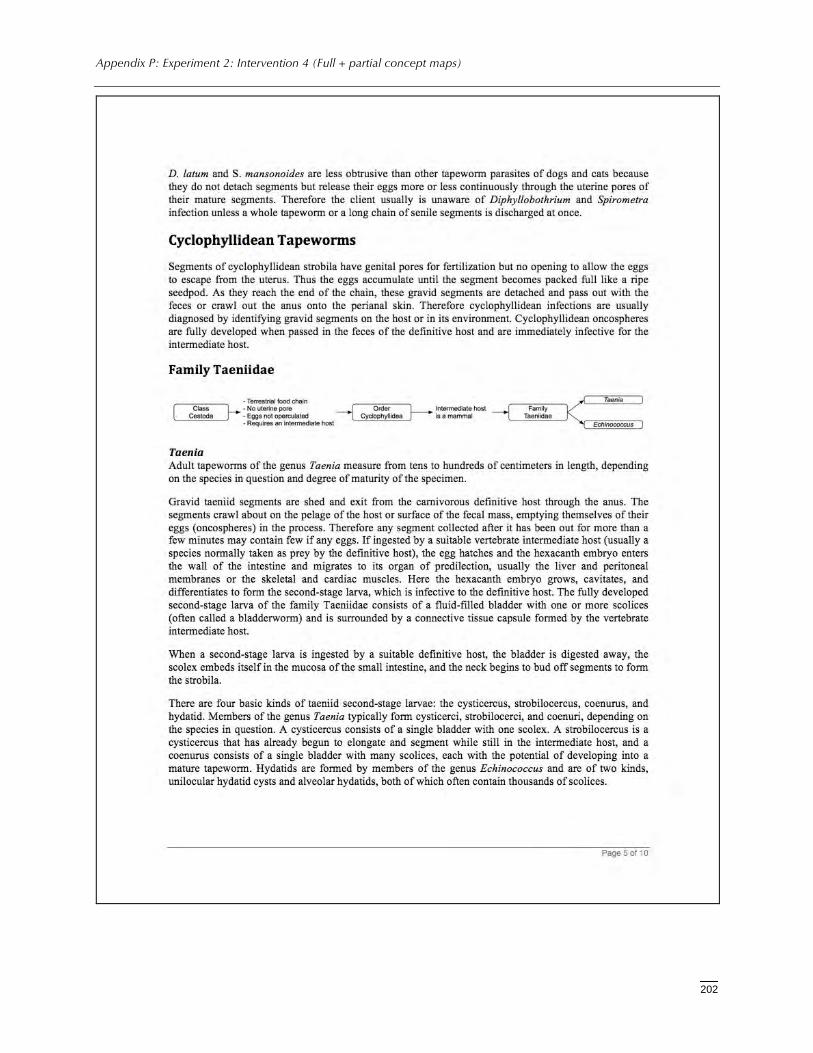
Appendix P: Experiment 2: Intervention 4 (Full + partial concept maps)
202
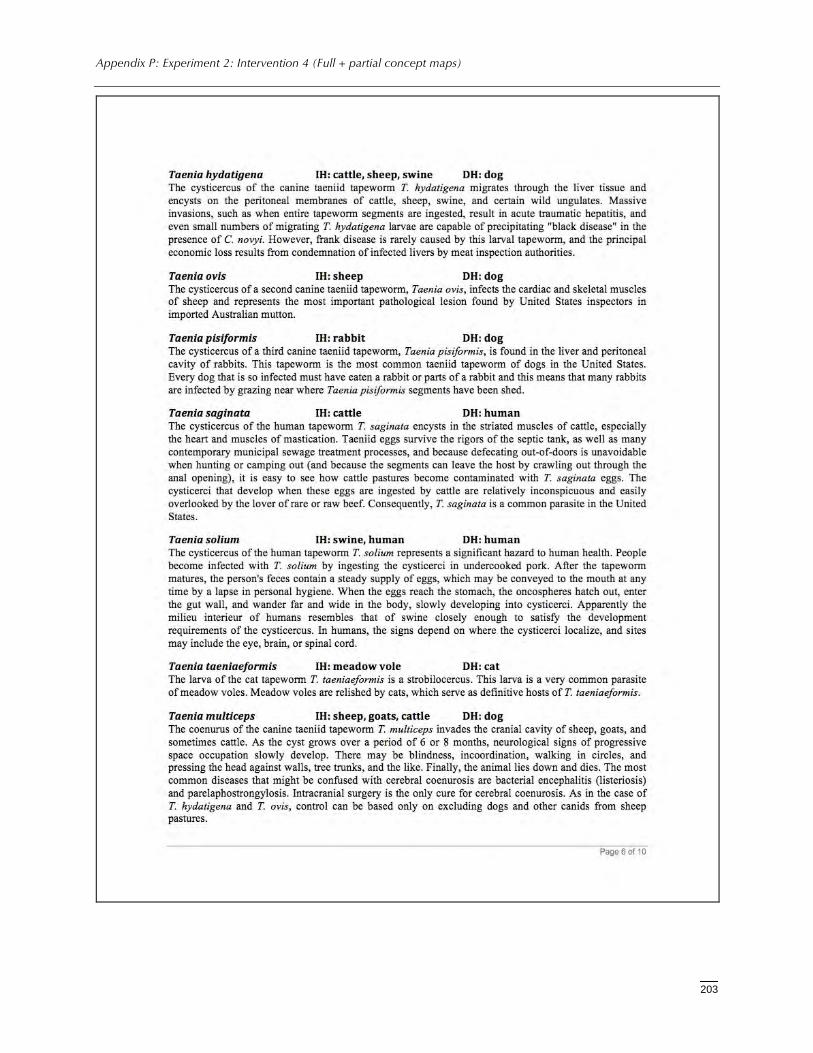
Appendix P: Experiment 2: Intervention 4 (Full + partial concept maps)
203
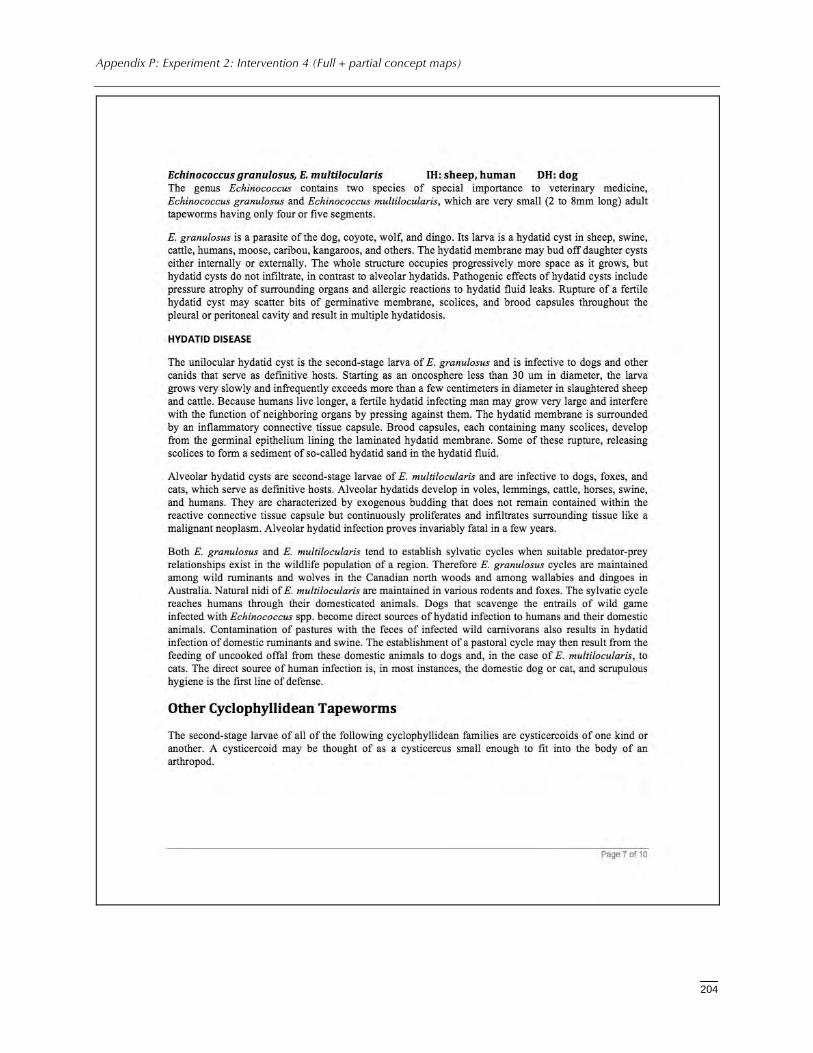
Appendix P: Experiment 2: Intervention 4 (Full + partial concept maps)
204
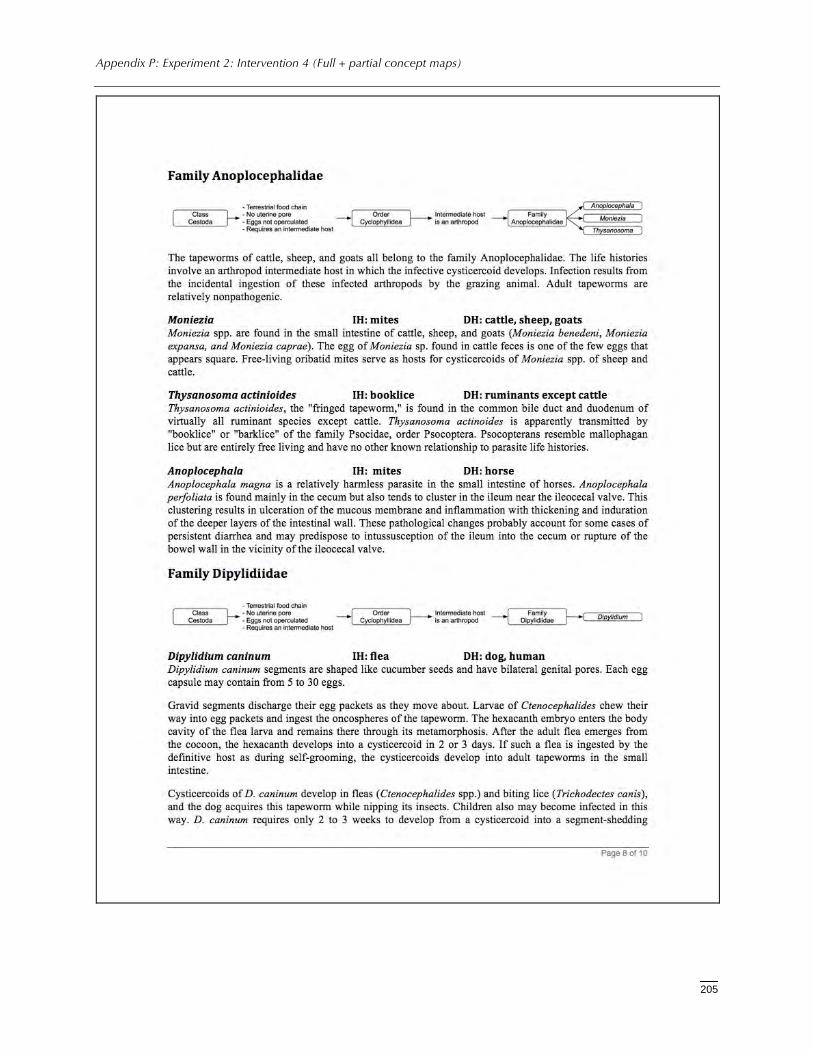
Appendix P: Experiment 2: Intervention 4 (Full + partial concept maps)
205
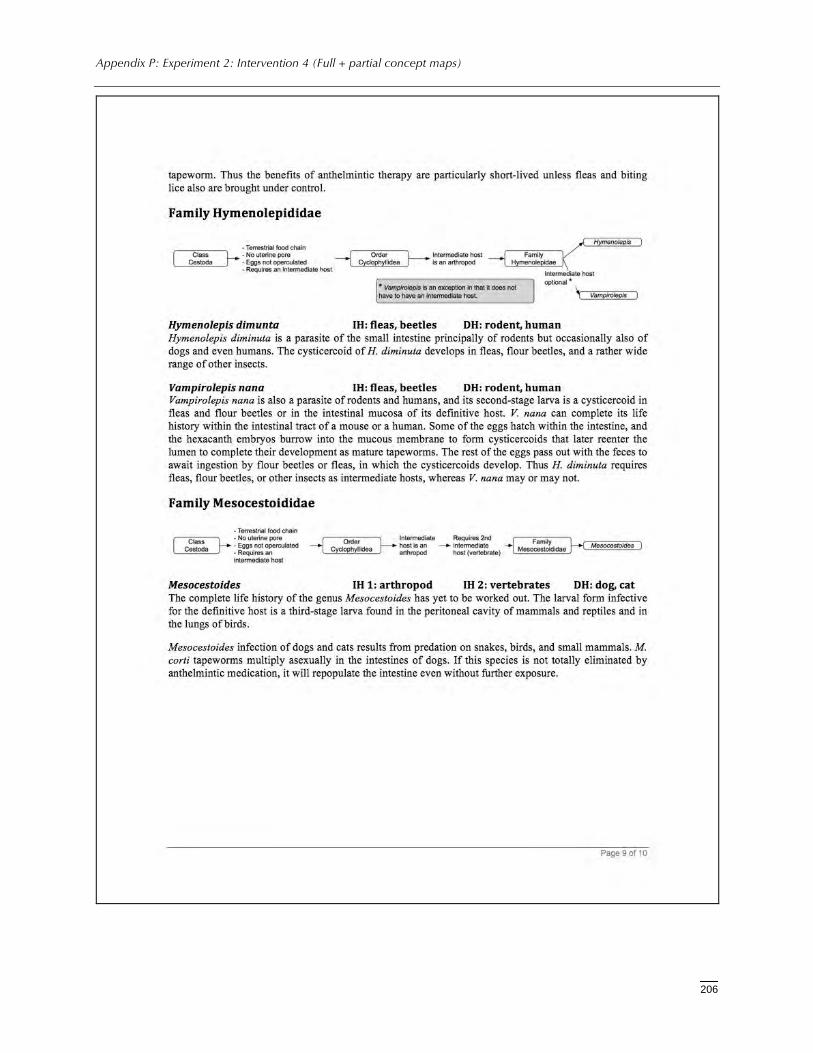
Appendix P: Experiment 2: Intervention 4 (Full + partial concept maps)
206
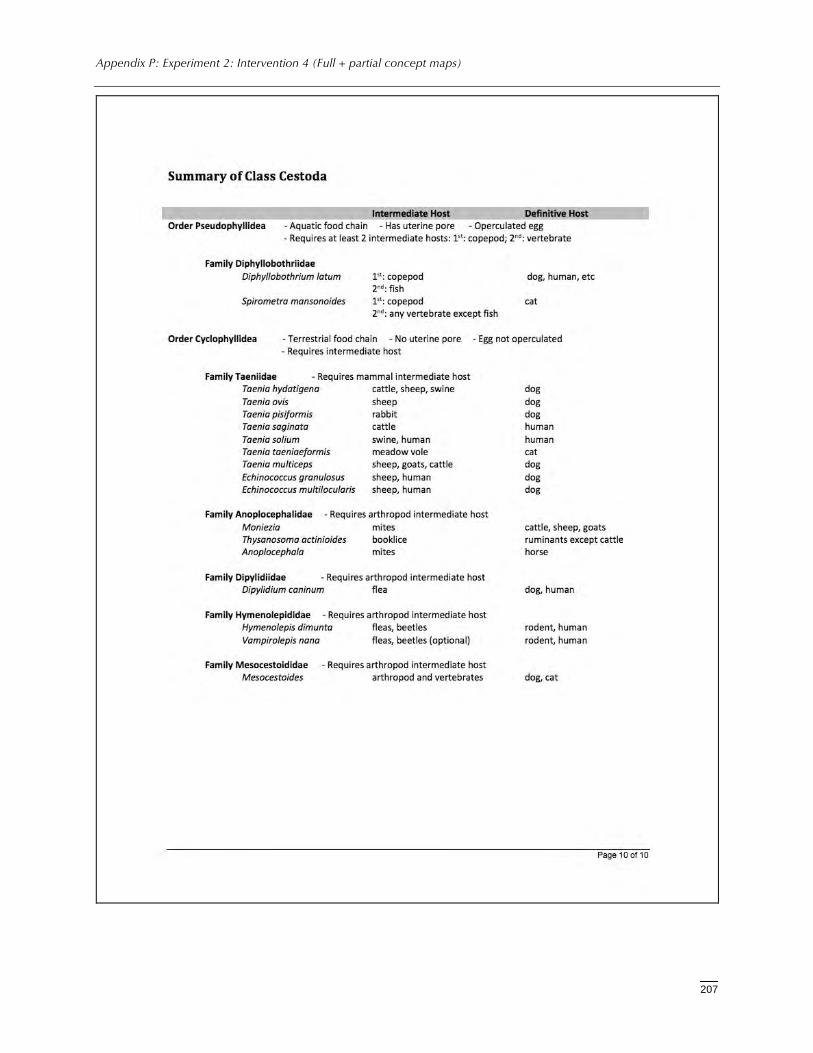
Appendix P: Experiment 2: Intervention 4 (Full + partial concept maps)
207
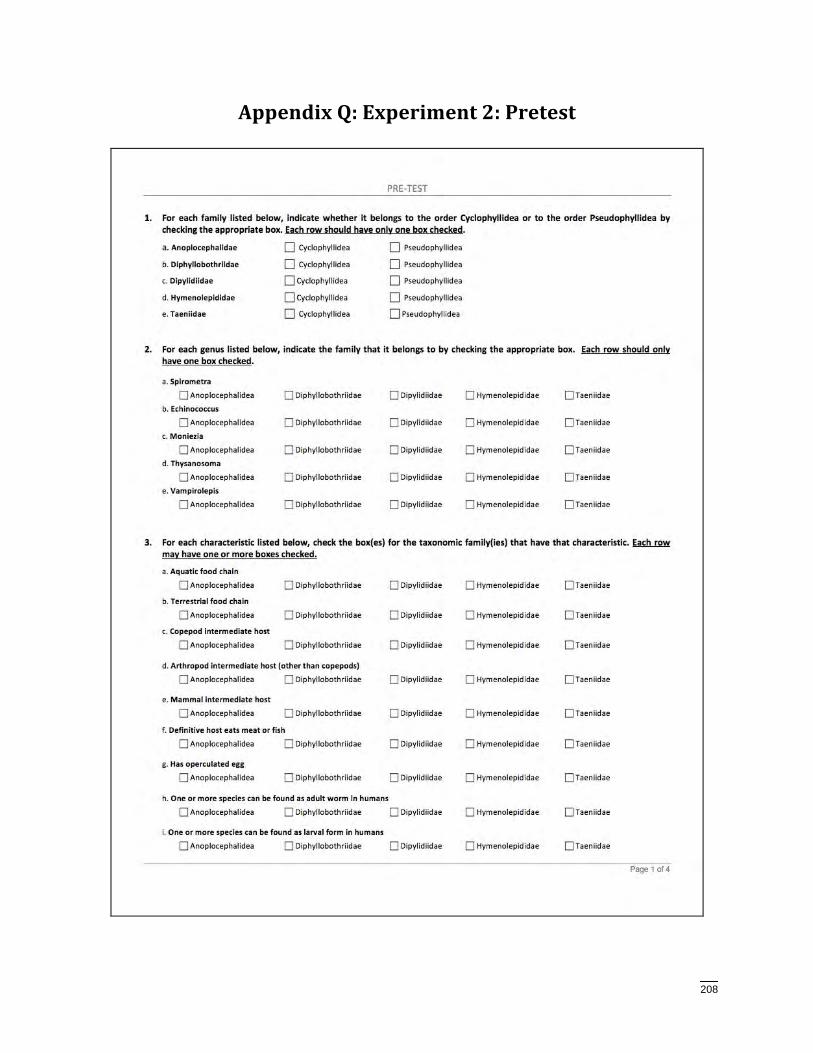
208
AppendixQ:Experiment2:Pretest
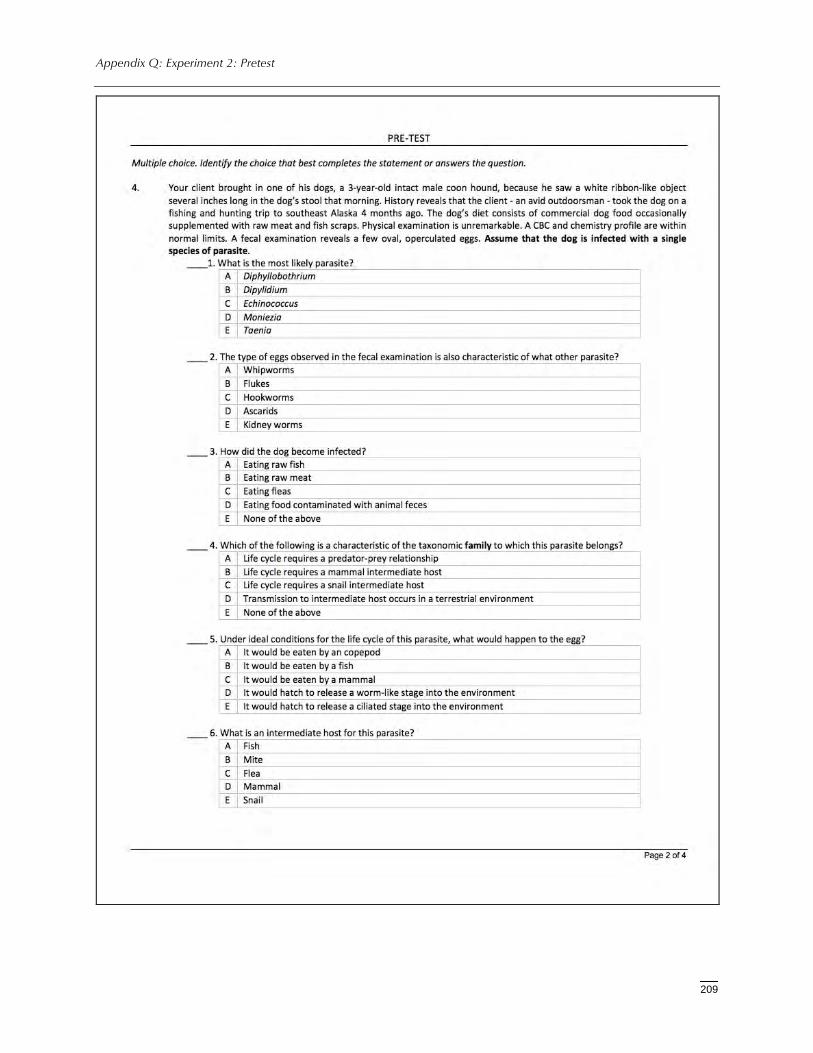
Appendix Q: Experiment 2: Pretest
209
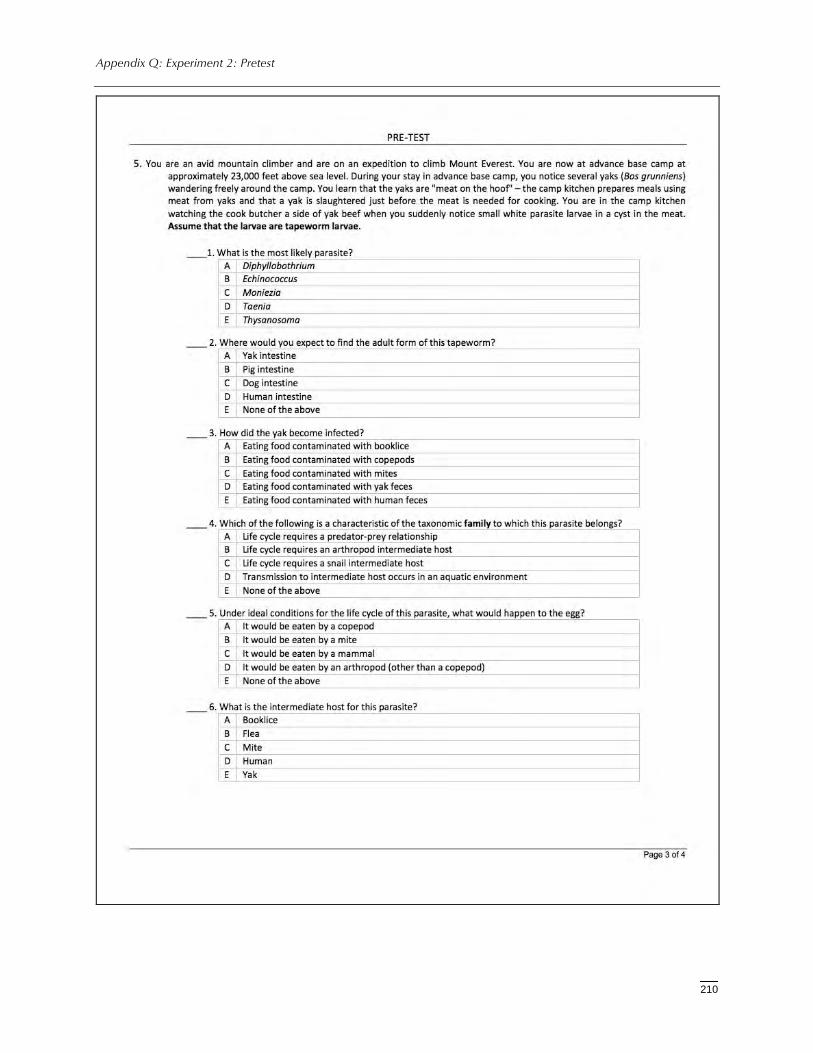
Appendix Q: Experiment 2: Pretest
210
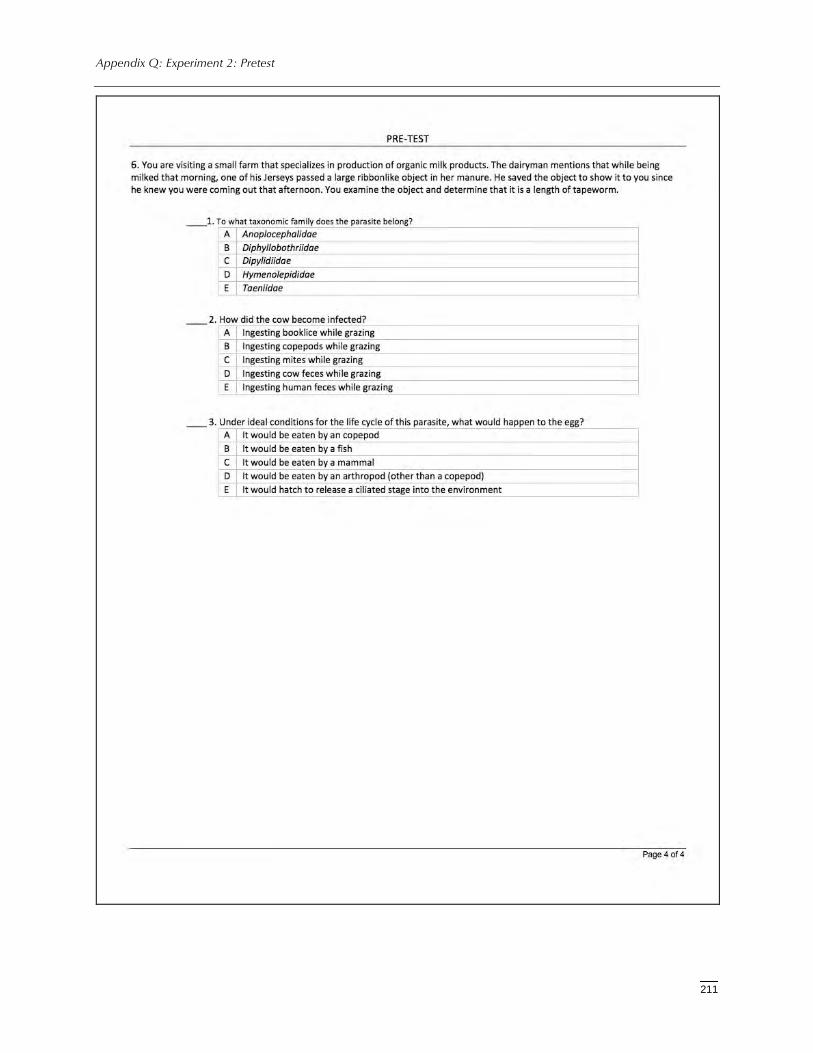
Appendix Q: Experiment 2: Pretest
211
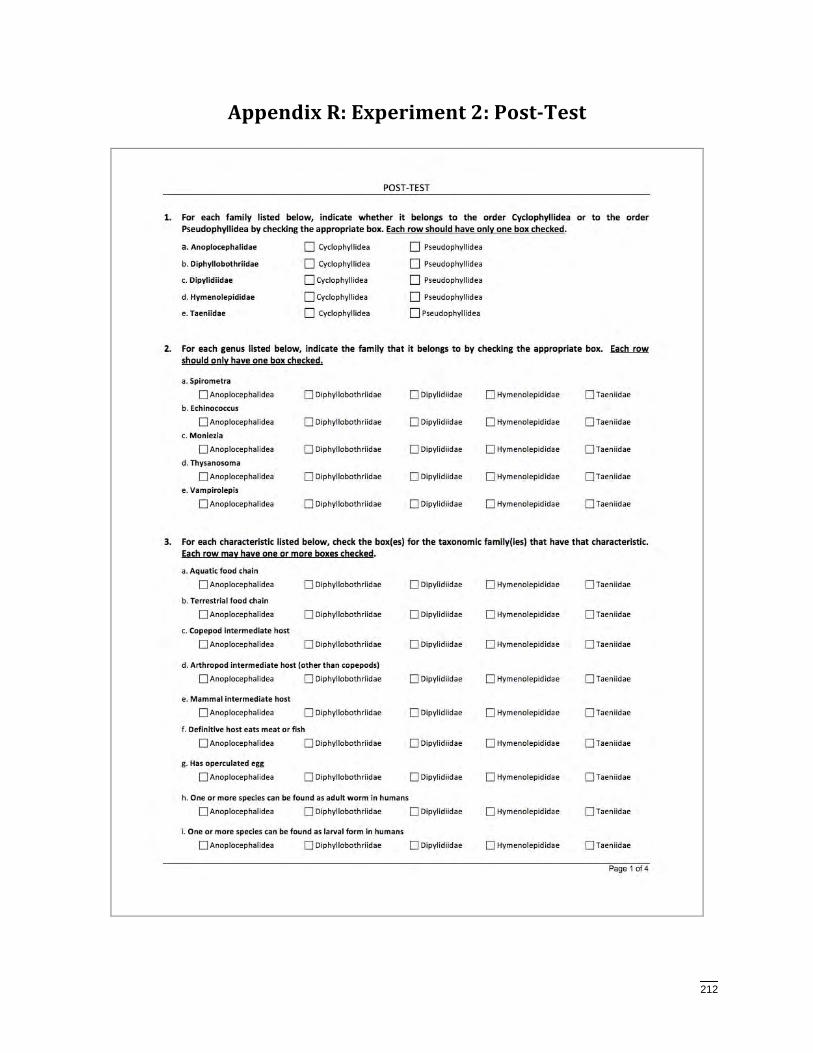
212
AppendixR:Experiment2:PostTest
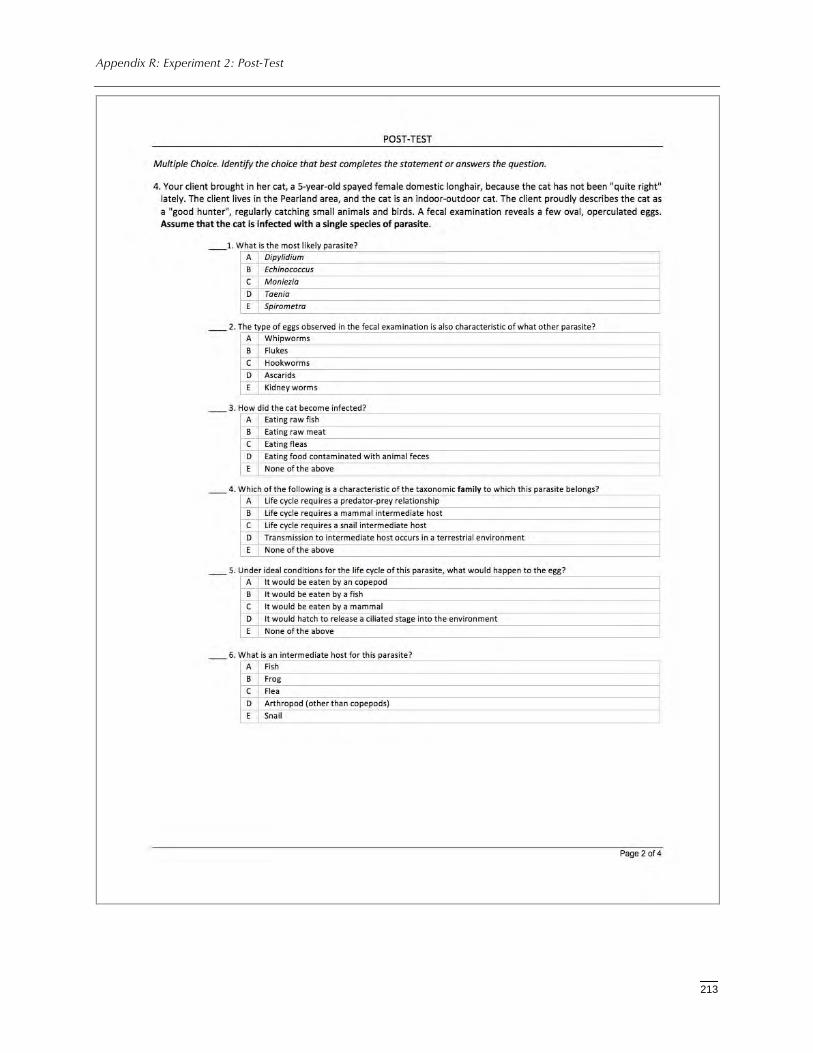
Appendix R: Experiment 2: Post-Test
213
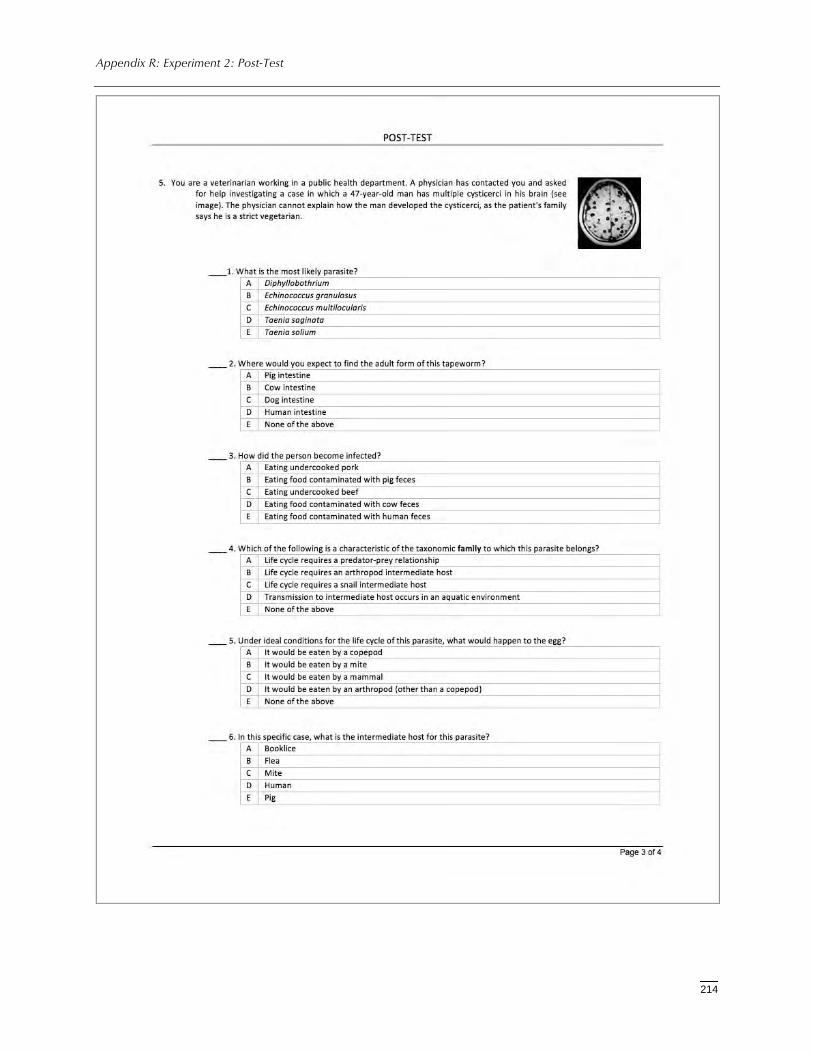
Appendix R: Experiment 2: Post-Test
214
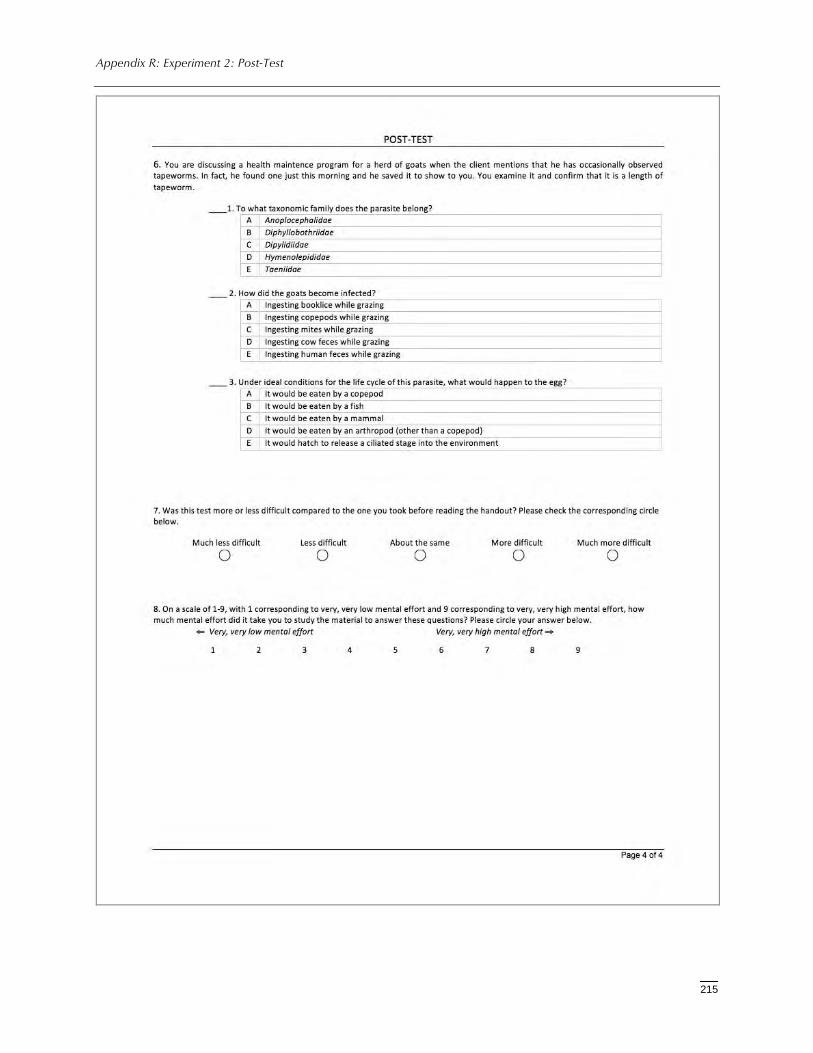
Appendix R: Experiment 2: Post-Test
215
Related Documents