Les Cahiers du GERAD ISSN: 0711–2440 The Effect of Proactive Adaptation on Green Investment O. Bahn, M. Chesney, J. Gheyssens G–2011–60 Octobre 2011 Les textes publi´ es dans la s´ erie des rapports de recherche HEC n’engagent que la responsabilit´ e de leurs auteurs. La publication de ces rapports de recherche b´ en´ eficie d’une subvention du Fonds qu´ eb´ ecois de la recherche sur la nature et les technologies.

Welcome message from author
This document is posted to help you gain knowledge. Please leave a comment to let me know what you think about it! Share it to your friends and learn new things together.
Transcript

Les Cahiers du GERAD ISSN: 0711–2440
The Effect of ProactiveAdaptation on Green Investment
O. Bahn, M. Chesney,J. Gheyssens
G–2011–60
Octobre 2011
Les textes publies dans la serie des rapports de recherche HEC n’engagent que la responsabilite de leurs auteurs. La publication
de ces rapports de recherche beneficie d’une subvention du Fonds quebecois de la recherche sur la nature et les technologies.

The Effect of Proactive
Adaptation on Green Investment
Olivier Bahn
GERAD & Department of Management ScienceHEC Montreal
Montreal (Quebec) Canada, H3T [email protected]
Marc Chesney
Institute of Banking and Finance and Swiss Finance InstituteUniversity of ZurichZurich, [email protected]
Jonathan Gheyssens
Institute of Banking and FinanceUniversity of Zurich and NADEL
ETH Zurich, [email protected]
Octobre 2011
Les Cahiers du GERAD
G–2011–60
Copyright c© 2011 GERAD

Les Cahiers du GERAD G–2011–60 v
Abstract
Climate change is one of the greatest challenges facing our planet in the foreseeable future and despitethe urgency of the situation global GHG emissions are still increasing. In this context, and since futureclimate changes appear now unavoidable to some extent, adaptation measures have recently gained anew political momentum as an important component of climate policies. Contrary to mitigation options,adaptation measures do not reduce emission levels but reduce their impacts. To assess the relationshipand effects on the global economy of both mitigation and adaptation, we use in this paper an integratedassessment model (IAM) that includes both proactive adaptation strategies and access to “green” in-vestments (clean technologies) for mitigation. We find that the relationship between adaptation andmitigation is complex and largely dependent on their respective attributes, with weakly effective adapta-tion acting as a late complement to mitigation efforts. As its effectiveness increases, adaptation becomesmore and more a substitute for mitigation. Sensitivity analysis on the potential magnitude of damagesalso indicates that scientific efforts to better describe GHG impacts will have immediate and importantconsequences on the sequence of mitigation and adaptation strategies.
Key Words: Adaptation, Climate change, Mitigation, Clean technology, Integrated assessment.
Acknowledgments: Support by the Natural Sciences and Engineering Research Council of Canada isgratefully acknowledged by the first author. The second author acknowledges support by the NationalCentre of Competence in Research “Financial Valuation and Risk Management” (NCCR FINRISK) andby the Research Priority Program “Finance and Financial Markets” of the University of Zurich. NCCRFINRISK is a research programme supported by the Swiss National Science Foundation.

Les Cahiers du GERAD G–2011–60 1
1 Introduction
Climate change is one of the greatest challenges facing our planet in the foreseeable future. It is expected,according to the Intergovernmental Panel on Climate Change (IPCC, 2007), to impact ecosystems and theenvironmental services they provide (in terms of food and water in particular) but also human societies (af-fecting human health and regional economies, for instance). Besides, the IPCC argues that human activities,through the greenhouse gases (GHG) they release in the atmosphere, are responsible for most of the observedincrease in global average temperatures up to now. Furthermore, the IPCC estimates that, in the absenceof ambitious climate policies to reduce anthropogenic GHG emissions, global warming will continue at anaccelerated pace.
Despite the urgency of the situation, global GHG emissions are still increasing, in particular because thereis not yet an overall agreement to curb world emissions. In this context, and since future climate changesappear now unavoidable to some extent, adaptation measures have recently gained a new political momentumas an important component of climate polices. Contrary to mitigation options, adaptation measures do notreduce emission levels, but provide strategies to deal effectively with climate change effects by reducing theirimpacts (Tol, 2005; Adger et al., 2007; Klein et al., 2007b). Adaptation strategies cover a large array ofsectors and options, from new agricultural crops, modified urban planning (dikes, sewerage systems), medicalpreventions against pandemic to controlled migrations of population and activity changes. Depending on thedegree of anticipation (and requirement for it), adaptation measures can be preventive or reactive: vaccinationcampaigns can be made mandatory without any materialized threat (as precautionary principle) or could beimplemented only in reaction to pandemic urgency, for instance.
Compared to mitigation strategies, adaptation measures have several strengths. On the one hand, inthe case of “reactive” adaptation, benefits should be rapidly achieved. This short lag between costs andbenefits should reduce adaptation exposure to uncertainty and discounting preferences. This should also bebeneficial for populations already vulnerable to certain impacts of climate change (Parry et al., 2009). On theother hand, “preventive” adaptation should provide long-lasting effects that may incur delays before beingeffective, a feature similar to mitigation. Moreover, adaptation measures in effect privatize policies againstclimate changes by largely limiting the benefits of adaptation to those having invested in it. Adaptationavoids the free-riding problem traditionally associated with mitigation1 and does not require concerted andsimultaneous actions, fostering the advancement of regional or local projects. As pointed by Olson (1965),“only a separate and ‘selective’ incentive will stimulate a rational individual in a latent group to act in agroup-oriented way” and to that goal, adaptation is effective. However, adaptation measures are not exemptfrom drawbacks. Since they have at best very limited impact on the causes of climate change, they mayencourage unsustainable emission trajectories. They are therefore highly vulnerable to catastrophic climatethresholds. Moreover, as pointed out by de Bruin and Dellink (2011b), uncertainty about the exact impactsof climate change may prevent optimal levels of adaptation. Finally, it seems highly questionable thatadaptation measures by themselves will be sufficient to fully protect populations from all the damages ofclimate change, and thus some levels of mitigation should also be implemented.
Both international institutions and governments have recognized these strengths and have now started toconceive and finance portfolios of adaptation projects. For instance, the World Bank has initiated a US$500million Pilot Program for Climate Resilience and prepared in 2009 a new study to assess adaptation costs,areas and applicability in developing countries (Margulis and Narain, 2009). Under the United NationsFramework Convention on Climate Change (UNFCCC), a new adaptation fund has also been launched,financed with 2% of the shares of proceeds coming from the issuances of certified emission reduction units(CERs) under the clean development mechanism (CDM). During the recent Copenhagen conference (COP15),it was also decided to create the Copenhagen Green Climate Fund (CGCF), with a first budget of US$30billion in the 2010-2012 period to invest in mitigation and adaptation projects. This fund should eventuallyreach US$100 billion by 2020 (United Nations, 2009). In addition to those dedicated projects, adaptationstrategies are now more and more blended into more traditional development projects and official development
1A country say may hesitate to pay for emission reductions that will also impact favorably those who did not participate inany mitigating efforts, thus unbalancing its competitiveness (Olson, 1965; Baumol and Oates, 1988).
2 G–2011–60 Les Cahiers du GERAD
assistances (ODA) (Klein et al., 2007a). They are also pushed forward in developed countries albeit withoutthe kind of targeted recognition used for developing countries.
Considering the simultaneous promotion of adaptation strategies and the relative weaknesses of mitigationpolicies so far, the question of their respective role should be assessed, both for policy and investment purposes.It could be that adaptation strategies become inexpensive alternatives to mitigation approaches, at least aslong as no clear international agreement forces the world’s economies to transition into an more efficienteconomy (in terms of GHG emissions). If this is the case, what would be the impact on the transition timingtowards such an economy? More importantly, what could be the long run effects, both in terms of GHGconcentrations, overall costs and damages and growth trajectories?
To answer these questions, one may use an integrated assessment, an interdisciplinary approach thatuses information from different fields of knowledge, in particular socio-economy and climatology. Integratedassessment models (IAMs) are tools for conducting an integrated assessment, as they typically combine keyelements of the economic and biophysical systems, elements that underlie the anthropogenic global climatechange phenomenon. Examples of IAMs are DICE (Nordhaus, 1994, 2008), MERGE (Manne et al., 1995;Manne and Richels, 2005), RICE (Nordhaus and Yang, 1996) and TIAM (Loulou and Labriet, 2008; Loulou,2008).
Research incorporating adaptation measures into integrated assessment models has been rare until re-cently, despite the importance of these models for current policy decisions. Hope et al. (1993) (updated inHope, 2006) were the first to integrate adaptation as a policy variable in an IAM, the PAGE model. Bosello(2008) uses a FEEM-RICE model with both adaptation and mitigation options. de Bruin et al. (2009b) haveproposed to include adaptation as an explicit strategy in the DICE model (AD-DICE). In follow-up studies,de Bruin et al. (2009a) expand this methodology to the RICE model (AD-RICE), Felgenhauer and de Bruin(2009) introduce uncertainty in the climate outcome, Hof et al. (2009) test for the effectiveness of the 2%levy proposed to finance the UNFCCC adaptation fund in a combined AD-RICE/FAIR model, de Bruinand Dellink (2011b) explore the effects of restrictions (barriers) to adaptation with AD-DICE (AD-DICE08),and de Bruin (2011a) advances further the modeling of adaptation in AD-DICE (AD-DICE09). Finally,Bosello et al. (2010) have proposed to consider adaptation within the WITCH model (AD-WITCH). Notealso that Agrawala et al. (2010) present a comprehensive “inter-model comparison of results” from AD-DICE,AD-RICE and AD-WITCH.
We use in this paper the deterministic version of a simple integrated assessment model (Bahn et al., 2008,2010, thereafter referred to as BaHaMa) enriched to consider explicitly adaptation options.2 BaHaMa is inthe spirit of the DICE model but distinguishes between two types of economy: the “carbon economy” (ourpresent economy) where a high level of fossil fuels is necessary to obtain output and a so-called “carbon-free”or “clean economy” (an hydrogen economy, for instance) that relies much less on fossil fuels to producethe economic good. In terms of energy sector representation, our model stands therefore somehow betweenDICE and WITCH, as the latter model includes a detailed bottom-up representation of the energy sectordistinguishing in particular among 7 different energy technologies. Likewise, in terms of adaptation modeling,our model stands somehow between the AD-DICE08 model (de Bruin and Dellink, 2011b) and the modelsAD-DICE09 (de Bruin, 2011a) and AD-WITCH (Bosello et al., 2010). In the former model, adaptationefforts are considered as costs (“flow”) only. In our approach, we consider adaptation efforts as investments(“stock”). As such, we emphasize the proactive component of adaptation in lieu of its reactive element(see Lecocq and Shalizi, 2007). This choice is motivated by Agrawala et al. (2010, p. 11) that claim that“... adaptation will consist predominantly of investments in adaptation stock...”.3 Note however that AD-DICE09 and AD-WITCH consider both reactive and proactive adaptation. Despite these simplifications inthe modeling of the energy sector (compared to WITCH) and in the modeling of adaptation (compared to
2Given the rather sophisticated treatment of uncertainty (through a stochastic control approach) in the original BaHaMamodel and the complexity of the numerical approach involved to solve this model, we have chosen as a first step and for simplicityto implement adaptation only in a deterministic version of BaHaMa. A more interesting and meaningful approach would be toinclude adaptation in the original BaHaMa model. We leave this for a future research.
3Agrawala et al. (2010, p. 11) add also that “This does not necessarily imply that fewer reactive or “flow” adaptation actionswill be undertaken. Rather, investments in adaptation infrastructure ... might tend to be more expensive, and would thereforetend to dominate the adaptation budget.” In that respect, our approach should be viewed as a first modeling exercise only. Weleave a more sophisticated modeling of adaptation for future research.
Les Cahiers du GERAD G–2011–60 3
AD-DICE09 and AD-WITCH), our objective is to contribute with a new IAM to an adaptation literaturethat so far relies only on a very limited number of (peer reviewed) models. Besides, compared to the differentversions of AD-DICE, our approach provides a better representation of the energy sector. We can thereforeassess the timing of adoption of clean technologies in the presence of adaptation strategies and evaluate thesensitivity of their interactions to specific parameters. This element could be of importance in the currentdebate about the required incentives to foster adequate “green” R&D investments. Moreover, our model,while being close in certain aspects to the DICE model for comparison purposes, remains largely autonomousin its calibration procedure, allowing us to test a variety of parameter’s specifications.
The paper is structured as follows. Section 2 details our IAM with explicit adaptation options, thereafterreferred to as Ada-BaHaMa. The section covers also some of the economic rationales behind the modelingchoices. Sections 3 and 4 give the model’s results and sensitivity analyses on adaptation effectiveness andclimate sensitivity. Section 5 provide a comparison of our results with the ones of the existing literature.Finally we conclude in Section 6 and propose some further improvements that provide additional directionsfor research.
2 BaHaMa with explicit adaptation
2.1 Model description
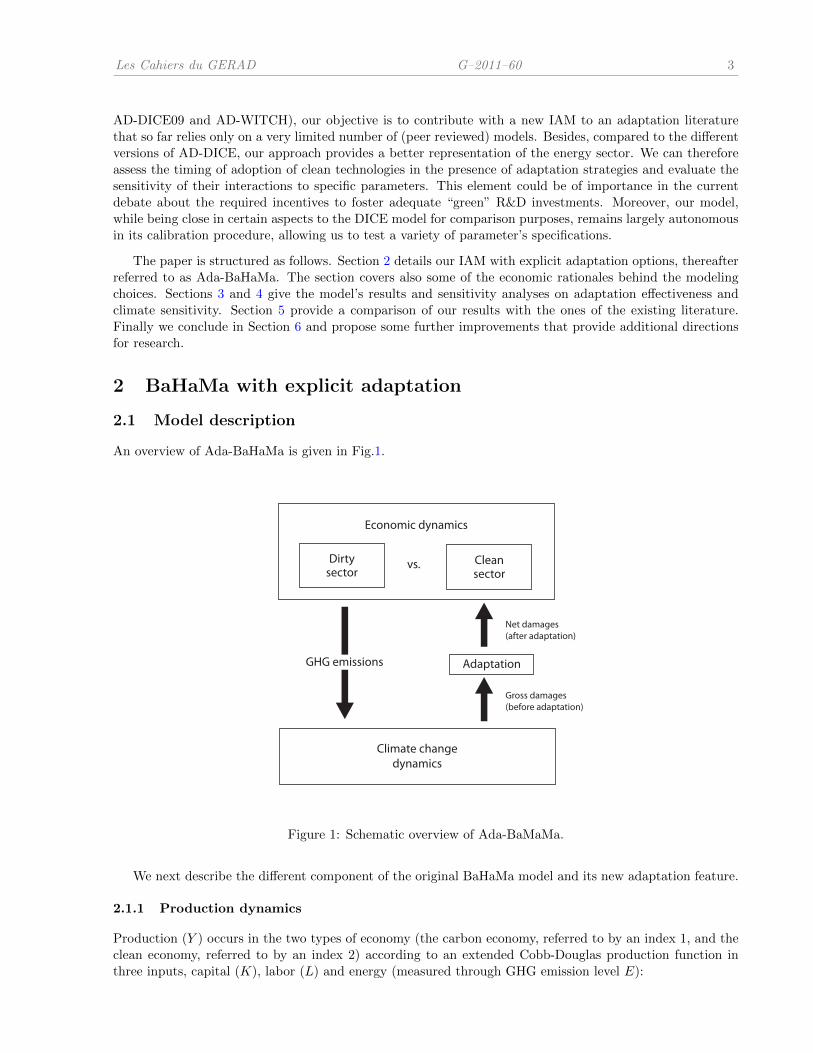
An overview of Ada-BaHaMa is given in Fig.1.
Economic dynamics
vs.Dirtysector
Cleansector
Climate changedynamics
GHG emissions Adaptation
Net damages(after adaptation)
Gross damages(before adaptation)
Figure 1: Schematic overview of Ada-BaMaMa.
We next describe the different component of the original BaHaMa model and its new adaptation feature.
2.1.1 Production dynamics
Production (Y ) occurs in the two types of economy (the carbon economy, referred to by an index 1, and theclean economy, referred to by an index 2) according to an extended Cobb-Douglas production function inthree inputs, capital (K), labor (L) and energy (measured through GHG emission level E):
4 G–2011–60 Les Cahiers du GERAD
Y (t) = A1(t)K1(t)α1(φ1(t)E1(t))θ1(t)L1(t)1−α1−θ1(t)
+A2(t)K2(t)α2(φ2(t)E2(t))θ2(t)L2(t)1−α2−θ2(t) , (1)
where for each economy i (i = 1, 2): Ai is the total factor productivity, αi the elasticity of output with respectto capital Ki, φi the energy efficiency and θi the elasticity of output with respect to emissions. Notice thatcapital stock in each economy evolves according to the choice of investment (Ii) and a depreciation rate δKi
through a standard relationship:
Ki(t+ 1) = Ii(t) + (1 − δKi)Ki(t) i = 1, 2. (2)
Besides, total labor (L) is divided between labor allocated to the carbon economy (L1) and labor allocatedto the carbon-free economy (L2):
L(t) = L1(t) + L2(t). (3)
2.1.2 Climate change dynamics
Stocks of GHGs are computed using the following dynamic equations from the DICE model (Nordhaus,2008), that distinguish between three reservoirs, an atmospheric reservoir (MAT ), a quickly mixing reservoirin the upper oceans and the biosphere (MUP ), and a slowly mixing deep-ocean reservoir (MLO) which actsas a long-term sink:
MAT (t+ 1) = (E1(t) + E2(t)) + ψ11MAT (t) + ψ21MUP (t) (4)
MUP (t+ 1) = ψ12MAT (t) + ψ22MUP (t) + ψ32MLO(t) (5)
MLO(t+ 1) = ψ23MUP (t) + ψ33MLO(t) (6)
where ψi,j are calibration parameters. Relationship between accumulation of GHGs and temperature devia-tion is also from DICE and is given by the following equations:
F (t) = ηlog2
(MAT (t)
MAT (1750)
)+ FEX(t) (7)
TAT (t+ 1) = TAT (t) + ξ1 [F (t+ 1) − ξ2TAT (t) − ξ3 (TAT (t) − TLO(t))] (8)
TLO(t+ 1) = TLO(t) + ξ4 (TAT (t) − TLO(t)) (9)
where F is the total atmospheric radiative forcing, FEX an exogenous radiative forcing term, TAT the earth’smean surface temperature, TLO the average temperature of the deep oceans, and ξi and η calibration param-eters for an assumed climate sensitivity of 3 ◦C that corresponds to the best estimate4 given by the IPCC(Meehl et al., 2007). Accumulation of GHGs increases the earth radiative forcing, warming the atmosphereand then gradually the oceans. This allows for the existence of inertia between GHG concentration andclimate change.
2.1.3 Damage and adaptation frameworks
To model climate change damages and their economic impacts, we follow an approach used in the MERGEmodel (Manne and Richels, 2005). We compute in particular an economic loss factor (ELF) due to climatechanges at time t, which is adapted to take into account the effects of adaptation AD(t) as follows:
ELF(t) = 1 − AD(t)
(TAT (t) − TdcatT − Td
)2
, (10)
where Td is the temperature deviation (from pre-industrial level) at which damages start to occur and catTis the climate sensitivity dependent “catastrophic” temperature level at which the entire production wouldbe wiped out. For the illustrative purposes of this paper and to have a comparable basis with the currentliterature on IAM with adaptation, Td and catT are calibrated in order to replicate the damage intensity of
4In Section 4, we test our model for different values of climate sensitivity, using the ‘likely’ range of 2–4.5 ◦C given by theIPCC.
Les Cahiers du GERAD G–2011–60 5
DICE; see Section 2.2. Notice further that this loss factor applies on production levels, see Section 2.1.4,
such that damages are computed as: AD(t)Y (t)(TAT (t)−Td
catT−Td
)2.
In our model, adaptation reduces the damaging effects of GHG concentration and, to simplify, has neitherimpact on the total factor productivity (no innovation breakthrough is coming from adaptation investment)nor direct correlation with GHG emissions (as in the often cited air conditioned example). Contrary tothe recent efforts by de Bruin and Dellink (2011b) that model adaptation as a cost (flow), but in a fashionsimilar to Bosello (2008), we consider adaptation as an investment (stock). To use the words of Lecocqand Shalizi (2007), we thus favour the proactive type of adaptation over the reactive one. This modelingchoice is motivated by the expectation that, for a large part, adaptation projects will be directed towardsinfrastructure and medium-to-long-term economic transformations. This view is supported by Agrawala et al.(2010) that conclude their comparison of results from AD-DICE, AD-RICE and AD-WITCH stating that,p. 11, “... adaptation will consist predominantly of investments in adaptation stock...”.5 Moreover, usingproactive instead of reactive adaptation gives us greater flexibility over the nature of adaptation policies. Bycontrolling for capital depreciation rate in the model, we can test for proactive effectiveness: if adaptationinvestments are in line with realized impacts, depreciations should be slow. On the contrary, inadequatestrategies or incapacity to predict future damages will force to reinvest frequently, imposing a high deprecationrate on the adaptation capital. At the margin, with an annual depreciation of 100%, the adaption investmentcorresponds to a cost.
The adaptation dynamics is as follows:
AD(t) = 1 − αADK3(t)
K3max(t)(11)
with αAD representing the maximal adaptation effectiveness, K3(t) the amount of adaptation capital inperiod t and K3max(t) the maximal amount of adaptation capital6 to be invested in each period to ensurethe optimal effectiveness of adaptation strategies.
In our framework, adaptation costs should increase whenever temperature (and therefore damages) broad-ens. To take this into account, we model K3max(t) as an increasing function of temperature level:
K3max(t) = βAD
(TAT (t)
Td
)γAD
, (12)
where βAD and γAD are calibration parameters. The behavior of this function is determined by the calibrationprocess. Nonetheless, we force the calibration to be bounded such that βAD ≥ 0 and γAD ≥ 1. Hence, gettingthe full offsetting potential of adaptation will require more and more investment if mitigation is not alsoconsidered jointly.
2.1.4 Welfare maximization
A social planner is assumed to maximize social welfare given by the integral over the model horizon (T ) of adiscounted utility from per capita consumption c(t) = C(t)/L(t). Pure time preference discount rate is notedρ and the welfare criterion is then given by:
W =
∫ T
0
e−ρtL(t) log[c(t)] dt. (13)
Consumption comes from an optimized share of production, the remaining being used to invest in the pro-duction capital (dirty and/or clean), in the adaptation capital and to pay for energy costs. The presence ofdamages (defined by the ELF factor) reduces the available production such that:
ELF(t)Y (t) = C(t) + I1(t) + I2(t) + I3(t) + pE1(t)φ1(t)E1(t) + pE2(t)φ2(t)E2(t), (14)
5Note that AD-DICE09 (de Bruin, 2011a) and AD-WITCH (Bosello et al., 2010) consider both reactive and proactiveadaptation. Indeed, if one should rely mostly on proactive adaptation when the effects of climate change are still relativelylimited, reactive adaptation may become important when damages increase; see for instance Agrawala et al. (2010). Reactiveadaptation shall be introduced in Ada-BaHaMa as a component of our future research.
6In other words, we impose at all time periods t that K3(t) ≤ K3max(t).
6 G–2011–60 Les Cahiers du GERAD
where I3 is the investment in the adaptation capital and pEi are energy prices. Note also that adaptationstock evolves according to a relation similar to Eq. (2):
K3(t+ 1) = I3(t) + (1 − δK3)K3(t), (15)
where δK3 is a depreciation rate.
2.2 Model calibration
The different modules of Ada-BaHaMa (adaptation, economy and climate) are basically calibrated on DICE(version 2007,7 thereafter referred to as DICE2007) and on the original AD-DICE model (de Bruin et al.,2009b).
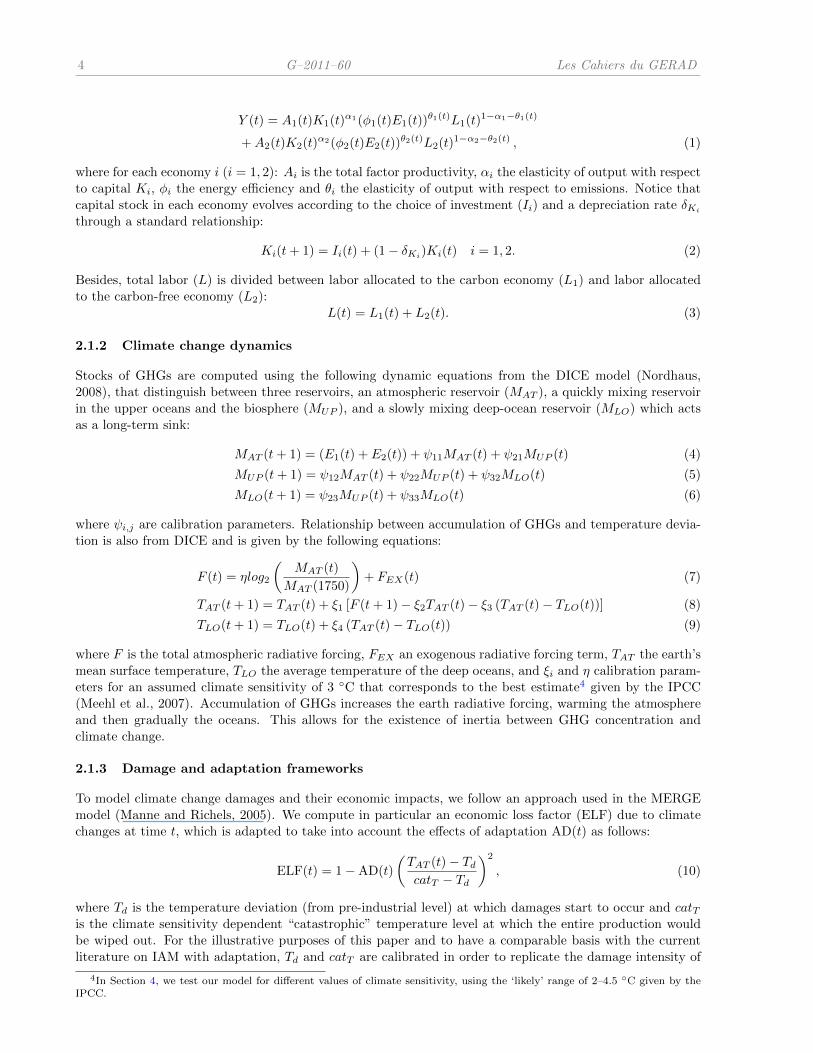
We start our calibration procedure by the adaptation component which is new the feature in the Ada-BaHaMa model. First, we calibrate ex-ante parameters defining the maximal amount of efficient adaptationcapital (K3max). We use for this a recent report that the World Bank (Margulis and Narain, 2009) issued onthe cost of adaptation in developing countries for the period 2005-2055: to fully offset8 climate change impactsin developing countries, US$ 100 billion should be spent each year until 2055. Despite representing only asmall share of the global economy, these adaptation costs, when adjusted for our model, still correspondto high values compared to the AD-DICE estimates. They are also conservatively close to the estimatesobtained in Bosello et al. (2010). Second, the maximal adaptation effectiveness (parameter αAD) is set to0.33 (at most 33% of damages are avoided)9 following results reported with AD-DICE. Third, to reproduce themagnitude of climate change damages estimated by DICE and AD-DICE, we use values of GHG concentration,temperature, gross damage and production from these models in order to calibrate parameters of our damagefunction (ELF). Consequently, our damage estimates follow rather closely those of AD-DICE as displayed inFig. 2.
0.7 0.9 1.1 1.3 1.5 1.7 1.9 2.1 2.3 2.5 2.7 2.9 3.10
0.5
1
1.5
2
2.5
3
3.5
4
Temperature deviation
%
AD−DICE
Ada−BaHaMa
Figure 2: Damage levels (in percentage of production) for different temperature increases in Ada-BaHaMaand AD-DICE (in ◦C).
The other modules of Ada-BaHaMa (economy and climate) are again basically calibrated on DICE2007.In particular, parameters in Eqs. (1), (2) and (4) to (9) are mostly from DICE2007. Moreover, we calibrateour (counterfactual) baseline, in which only the current dirty economy is producing, to match as closely as
7See: http://www.econ.yale.edu/ nordhaus/DICE2007.htm.8This view that climate change damages can be fully offset is obviously optimistic and certainly questionable. Note however
that such an “optimistic” view is somehow shared by Mendelsohn (2000) that estimates that some climate damages could bereduced by up to 80%, and thus almost fully offset. Besides, in our calibration approach, (Margulis and Narain, 2009) is onlyused as a benchmark.
9However and considering its importance in the determination of the optimal mix of strategies, we conduct in Section 4sensitivity analyses for different–lower and higher–values of αAD.
Les Cahiers du GERAD G–2011–60 7
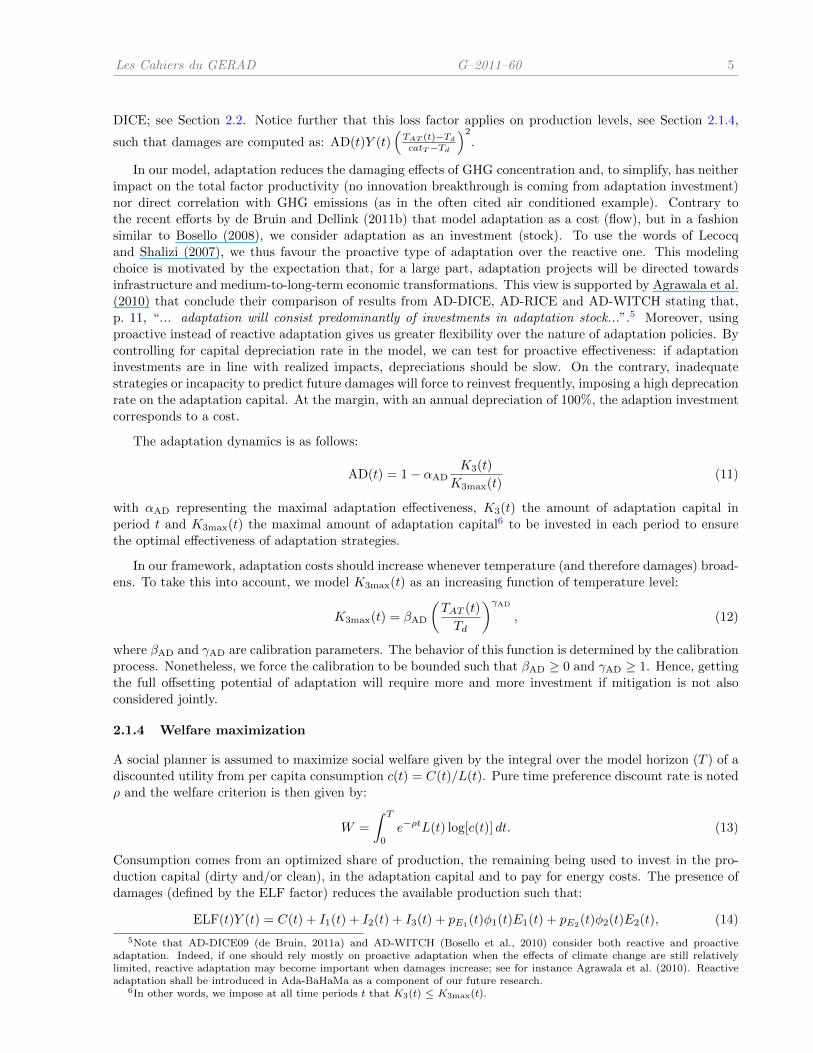
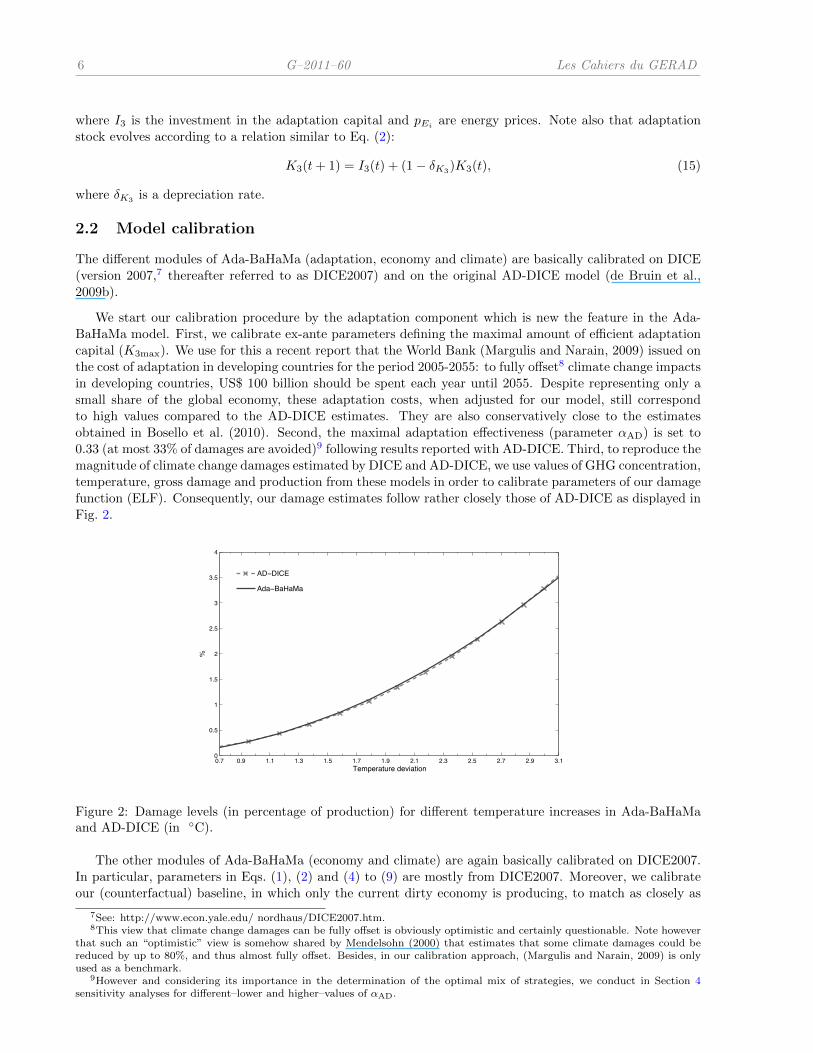
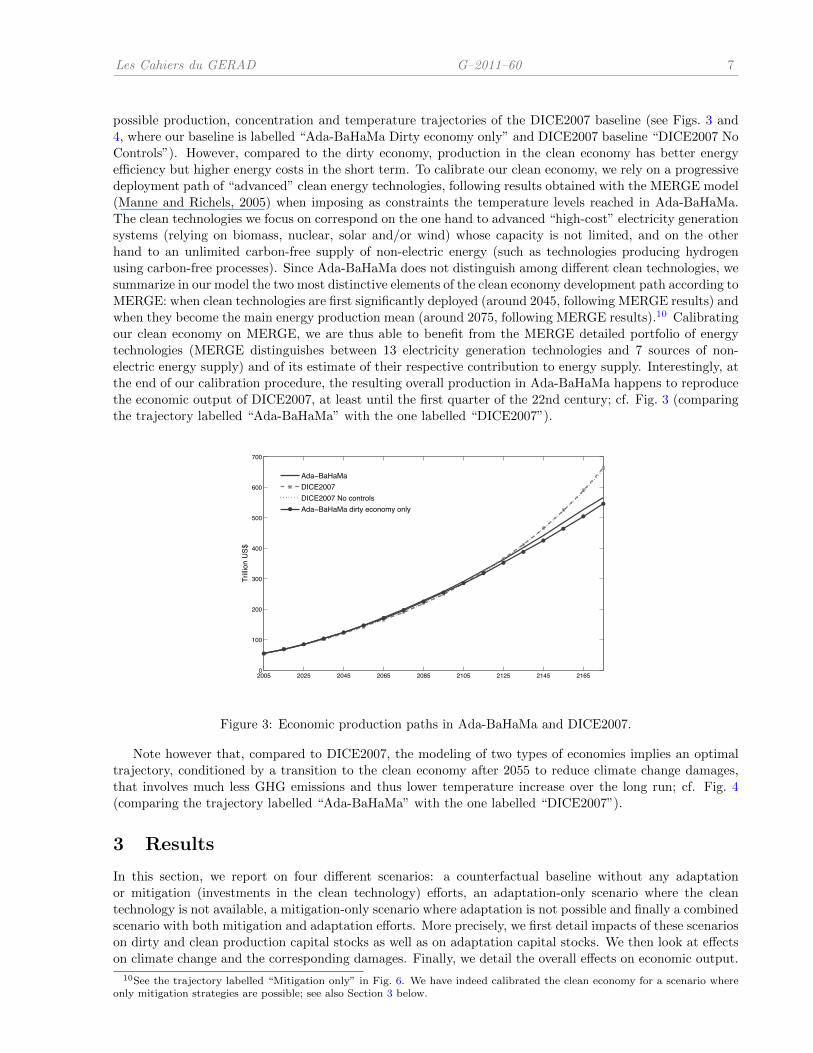
possible production, concentration and temperature trajectories of the DICE2007 baseline (see Figs. 3 and4, where our baseline is labelled “Ada-BaHaMa Dirty economy only” and DICE2007 baseline “DICE2007 NoControls”). However, compared to the dirty economy, production in the clean economy has better energyefficiency but higher energy costs in the short term. To calibrate our clean economy, we rely on a progressivedeployment path of “advanced” clean energy technologies, following results obtained with the MERGE model(Manne and Richels, 2005) when imposing as constraints the temperature levels reached in Ada-BaHaMa.The clean technologies we focus on correspond on the one hand to advanced “high-cost” electricity generationsystems (relying on biomass, nuclear, solar and/or wind) whose capacity is not limited, and on the otherhand to an unlimited carbon-free supply of non-electric energy (such as technologies producing hydrogenusing carbon-free processes). Since Ada-BaHaMa does not distinguish among different clean technologies, wesummarize in our model the two most distinctive elements of the clean economy development path according toMERGE: when clean technologies are first significantly deployed (around 2045, following MERGE results) andwhen they become the main energy production mean (around 2075, following MERGE results).10 Calibratingour clean economy on MERGE, we are thus able to benefit from the MERGE detailed portfolio of energytechnologies (MERGE distinguishes between 13 electricity generation technologies and 7 sources of non-electric energy supply) and of its estimate of their respective contribution to energy supply. Interestingly, atthe end of our calibration procedure, the resulting overall production in Ada-BaHaMa happens to reproducethe economic output of DICE2007, at least until the first quarter of the 22nd century; cf. Fig. 3 (comparingthe trajectory labelled “Ada-BaHaMa” with the one labelled “DICE2007”).
2005 2025 2045 2065 2085 2105 2125 2145 21650
100
200
300
400
500
600
700
Tril
lion
US
$
Ada−BaHaMa
DICE2007
DICE2007 No controls
Ada−BaHaMa dirty economy only
Figure 3: Economic production paths in Ada-BaHaMa and DICE2007.
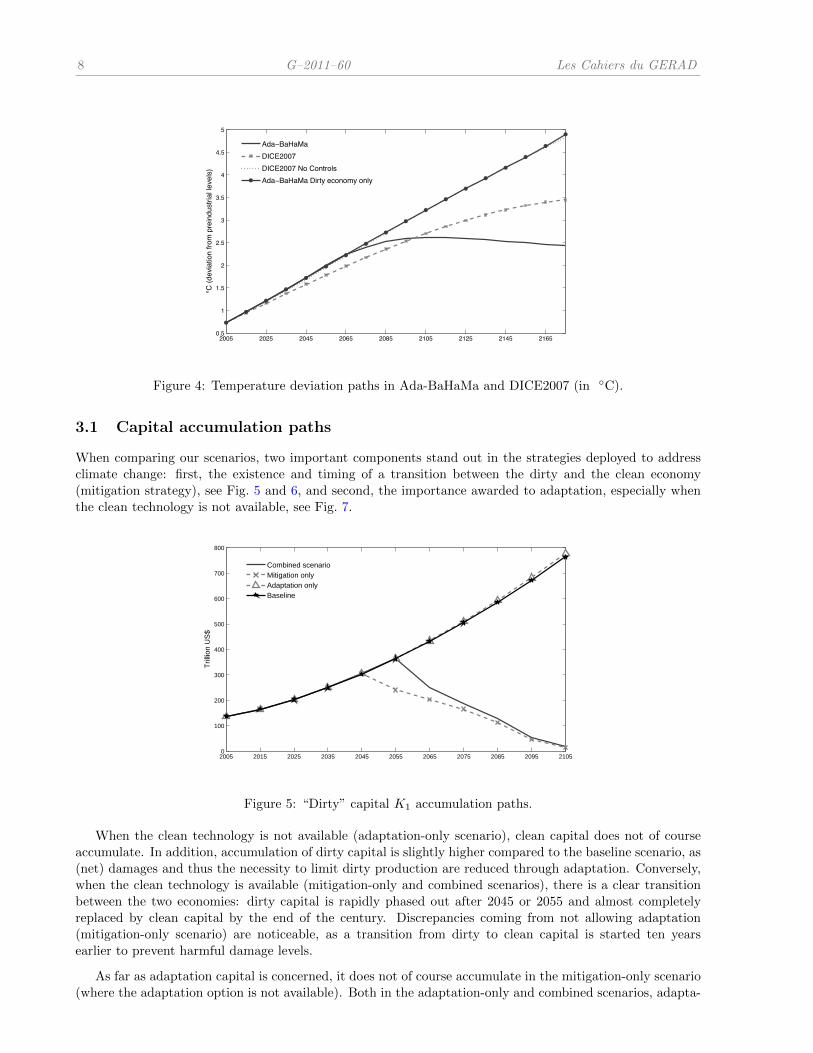
Note however that, compared to DICE2007, the modeling of two types of economies implies an optimaltrajectory, conditioned by a transition to the clean economy after 2055 to reduce climate change damages,that involves much less GHG emissions and thus lower temperature increase over the long run; cf. Fig. 4(comparing the trajectory labelled “Ada-BaHaMa” with the one labelled “DICE2007”).
3 Results
In this section, we report on four different scenarios: a counterfactual baseline without any adaptationor mitigation (investments in the clean technology) efforts, an adaptation-only scenario where the cleantechnology is not available, a mitigation-only scenario where adaptation is not possible and finally a combinedscenario with both mitigation and adaptation efforts. More precisely, we first detail impacts of these scenarioson dirty and clean production capital stocks as well as on adaptation capital stocks. We then look at effectson climate change and the corresponding damages. Finally, we detail the overall effects on economic output.
10See the trajectory labelled “Mitigation only” in Fig. 6. We have indeed calibrated the clean economy for a scenario whereonly mitigation strategies are possible; see also Section 3 below.
8 G–2011–60 Les Cahiers du GERAD
2005 2025 2045 2065 2085 2105 2125 2145 21650.5
1
1.5
2
2.5
3
3.5
4
4.5
5
°C (
devi
atio
n fr
om p
rein
dust
rial l
evel
s)
Ada−BaHaMa
DICE2007
DICE2007 No Controls
Ada−BaHaMa Dirty economy only
Figure 4: Temperature deviation paths in Ada-BaHaMa and DICE2007 (in ◦C).
3.1 Capital accumulation paths
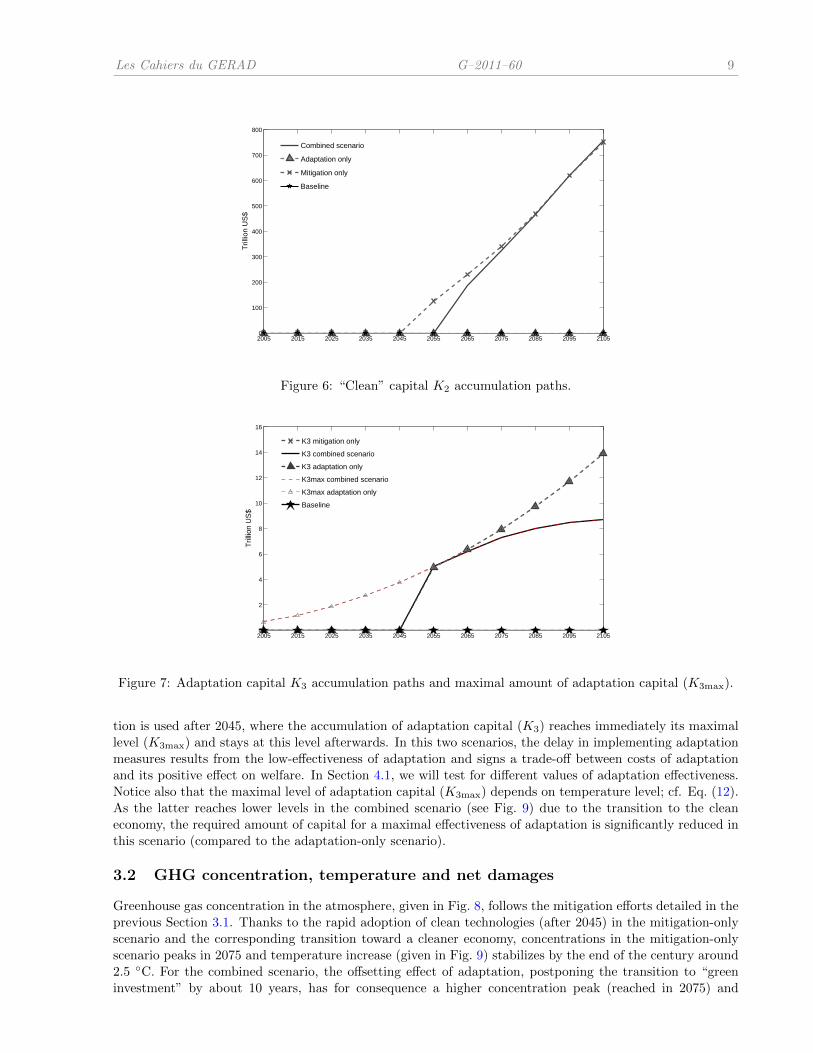
When comparing our scenarios, two important components stand out in the strategies deployed to addressclimate change: first, the existence and timing of a transition between the dirty and the clean economy(mitigation strategy), see Fig. 5 and 6, and second, the importance awarded to adaptation, especially whenthe clean technology is not available, see Fig. 7.
2005 2015 2025 2035 2045 2055 2065 2075 2085 2095 21050
100
200
300
400
500
600
700
800
Tril
lion
US
$
Combined scenarioMitigation onlyAdaptation onlyBaseline
Figure 5: “Dirty” capital K1 accumulation paths.
When the clean technology is not available (adaptation-only scenario), clean capital does not of courseaccumulate. In addition, accumulation of dirty capital is slightly higher compared to the baseline scenario, as(net) damages and thus the necessity to limit dirty production are reduced through adaptation. Conversely,when the clean technology is available (mitigation-only and combined scenarios), there is a clear transitionbetween the two economies: dirty capital is rapidly phased out after 2045 or 2055 and almost completelyreplaced by clean capital by the end of the century. Discrepancies coming from not allowing adaptation(mitigation-only scenario) are noticeable, as a transition from dirty to clean capital is started ten yearsearlier to prevent harmful damage levels.
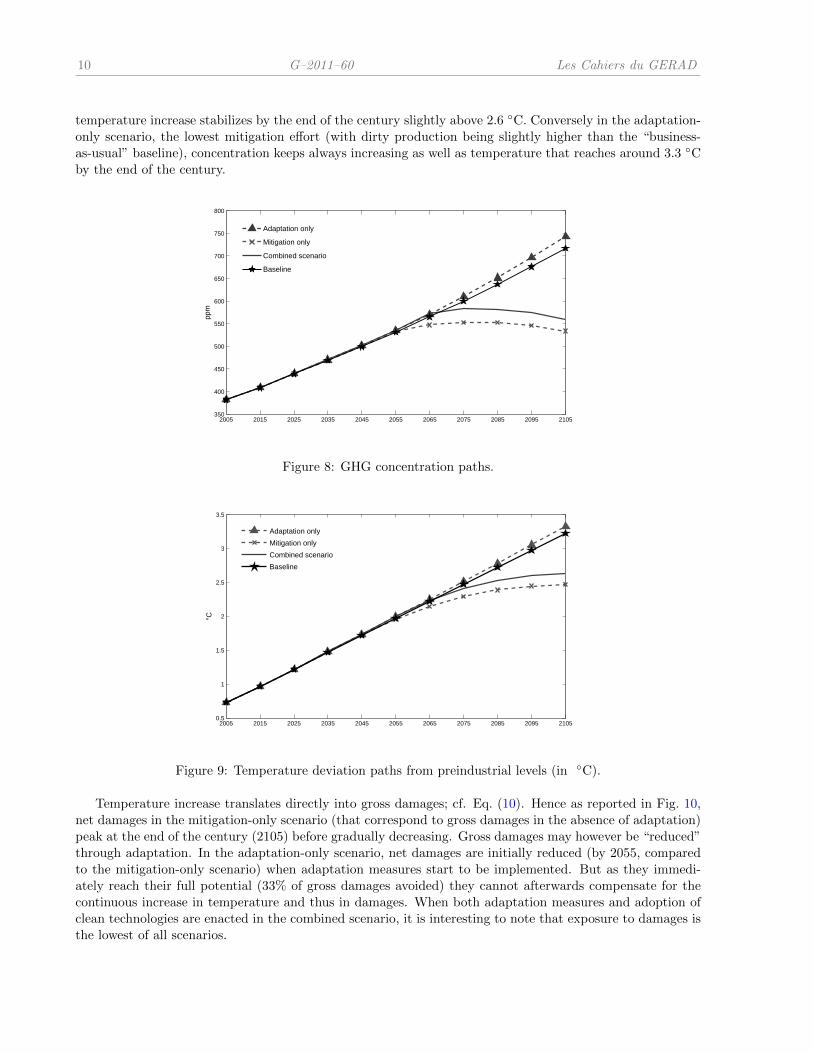
As far as adaptation capital is concerned, it does not of course accumulate in the mitigation-only scenario(where the adaptation option is not available). Both in the adaptation-only and combined scenarios, adapta-
Les Cahiers du GERAD G–2011–60 9
2005 2015 2025 2035 2045 2055 2065 2075 2085 2095 21050
100
200
300
400
500
600
700
800
Tril
lion
US
$
Combined scenario
Adaptation only
Mitigation only
Baseline
Figure 6: “Clean” capital K2 accumulation paths.
2005 2015 2025 2035 2045 2055 2065 2075 2085 2095 21050
2
4
6
8
10
12
14
16
Tril
lion
US
$
K3 mitigation only
K3 combined scenario
K3 adaptation only
K3max combined scenario
K3max adaptation only
Baseline
Figure 7: Adaptation capital K3 accumulation paths and maximal amount of adaptation capital (K3max).
tion is used after 2045, where the accumulation of adaptation capital (K3) reaches immediately its maximallevel (K3max) and stays at this level afterwards. In this two scenarios, the delay in implementing adaptationmeasures results from the low-effectiveness of adaptation and signs a trade-off between costs of adaptationand its positive effect on welfare. In Section 4.1, we will test for different values of adaptation effectiveness.Notice also that the maximal level of adaptation capital (K3max) depends on temperature level; cf. Eq. (12).As the latter reaches lower levels in the combined scenario (see Fig. 9) due to the transition to the cleaneconomy, the required amount of capital for a maximal effectiveness of adaptation is significantly reduced inthis scenario (compared to the adaptation-only scenario).
3.2 GHG concentration, temperature and net damages
Greenhouse gas concentration in the atmosphere, given in Fig. 8, follows the mitigation efforts detailed in theprevious Section 3.1. Thanks to the rapid adoption of clean technologies (after 2045) in the mitigation-onlyscenario and the corresponding transition toward a cleaner economy, concentrations in the mitigation-onlyscenario peaks in 2075 and temperature increase (given in Fig. 9) stabilizes by the end of the century around2.5 ◦C. For the combined scenario, the offsetting effect of adaptation, postponing the transition to “greeninvestment” by about 10 years, has for consequence a higher concentration peak (reached in 2075) and
10 G–2011–60 Les Cahiers du GERAD
temperature increase stabilizes by the end of the century slightly above 2.6 ◦C. Conversely in the adaptation-only scenario, the lowest mitigation effort (with dirty production being slightly higher than the “business-as-usual” baseline), concentration keeps always increasing as well as temperature that reaches around 3.3 ◦Cby the end of the century.
2005 2015 2025 2035 2045 2055 2065 2075 2085 2095 2105350
400
450
500
550
600
650
700
750
800pp
m
Adaptation only
Mitigation only
Combined scenario
Baseline
Figure 8: GHG concentration paths.
2005 2015 2025 2035 2045 2055 2065 2075 2085 2095 21050.5
1
1.5
2
2.5
3
3.5
°C
Adaptation only
Mitigation only
Combined scenario
Baseline
Figure 9: Temperature deviation paths from preindustrial levels (in ◦C).
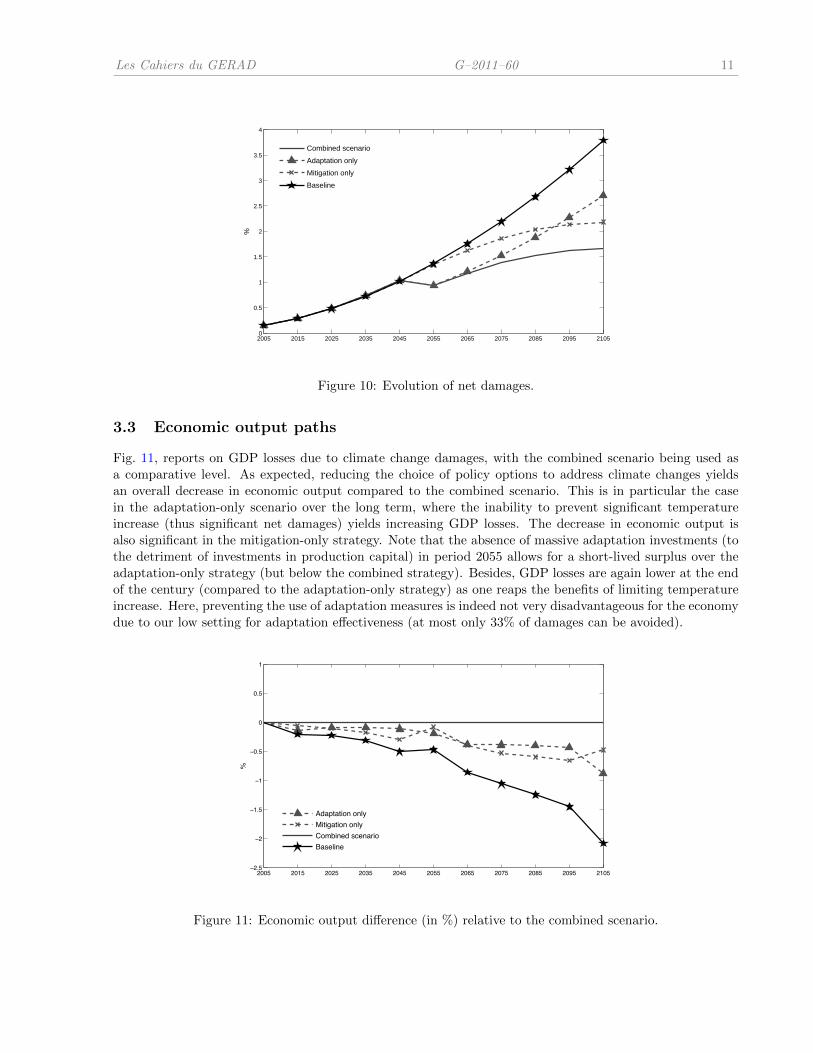
Temperature increase translates directly into gross damages; cf. Eq. (10). Hence as reported in Fig. 10,net damages in the mitigation-only scenario (that correspond to gross damages in the absence of adaptation)peak at the end of the century (2105) before gradually decreasing. Gross damages may however be “reduced”through adaptation. In the adaptation-only scenario, net damages are initially reduced (by 2055, comparedto the mitigation-only scenario) when adaptation measures start to be implemented. But as they immedi-ately reach their full potential (33% of gross damages avoided) they cannot afterwards compensate for thecontinuous increase in temperature and thus in damages. When both adaptation measures and adoption ofclean technologies are enacted in the combined scenario, it is interesting to note that exposure to damages isthe lowest of all scenarios.
Les Cahiers du GERAD G–2011–60 11
2005 2015 2025 2035 2045 2055 2065 2075 2085 2095 21050
0.5
1
1.5
2
2.5
3
3.5
4
%
Combined scenario
Adaptation only
Mitigation only
Baseline
Figure 10: Evolution of net damages.
3.3 Economic output paths
Fig. 11, reports on GDP losses due to climate change damages, with the combined scenario being used asa comparative level. As expected, reducing the choice of policy options to address climate changes yieldsan overall decrease in economic output compared to the combined scenario. This is in particular the casein the adaptation-only scenario over the long term, where the inability to prevent significant temperatureincrease (thus significant net damages) yields increasing GDP losses. The decrease in economic output isalso significant in the mitigation-only strategy. Note that the absence of massive adaptation investments (tothe detriment of investments in production capital) in period 2055 allows for a short-lived surplus over theadaptation-only strategy (but below the combined strategy). Besides, GDP losses are again lower at the endof the century (compared to the adaptation-only strategy) as one reaps the benefits of limiting temperatureincrease. Here, preventing the use of adaptation measures is indeed not very disadvantageous for the economydue to our low setting for adaptation effectiveness (at most only 33% of damages can be avoided).
2005 2015 2025 2035 2045 2055 2065 2075 2085 2095 2105−2.5
−2
−1.5
−1
−0.5
0
0.5
1
%
Adaptation only
Mitigation only
Combined scenario
Baseline
Figure 11: Economic output difference (in %) relative to the combined scenario.
12 G–2011–60 Les Cahiers du GERAD
4 Sensitivity analysis
The influence played by adaptation measures on the timing of adoption of clean technologies is largelydependent upon certain key parameters, like the degree of adaptation effectiveness or the climate sensitivityassumed in the model. In sections 4.1 and 4.2, we test for different levels for these two key parameters.
4.1 Sensitivity analysis on adaptation effectiveness
According to past and current research on adaptation policies, it seems indisputable that the effectiveness ofadaptation measures will be highly influenced by geographical, political and societal idiosyncrasies, as wellas by the quality and reliability of preventive efforts which in turns largely depend upon the accuracy ofdamage predictions. Considering the high level of uncertainty surrounding damage assessments, our basicparameter setting uses a relatively low level of effectiveness for adaptation. As such, it penalizes regions forwhich adaptation could be both inexpensive and efficient. For instance, Agrawala et al. (2010) reports thatcostal adaptation could offset up to 95% of costal damages in the case of India. At the end of the spectrum,the World Bank11 (Margulis and Narain, 2009) reports that adaptation in developing countries could becompletely effective and fully offset climate change damages in all sectors. Although likely over-optimistic,an effectiveness level of 100% (αAD = 1) can thus be also envisioned (if only to test the view of Margulis andNarain, 2009).
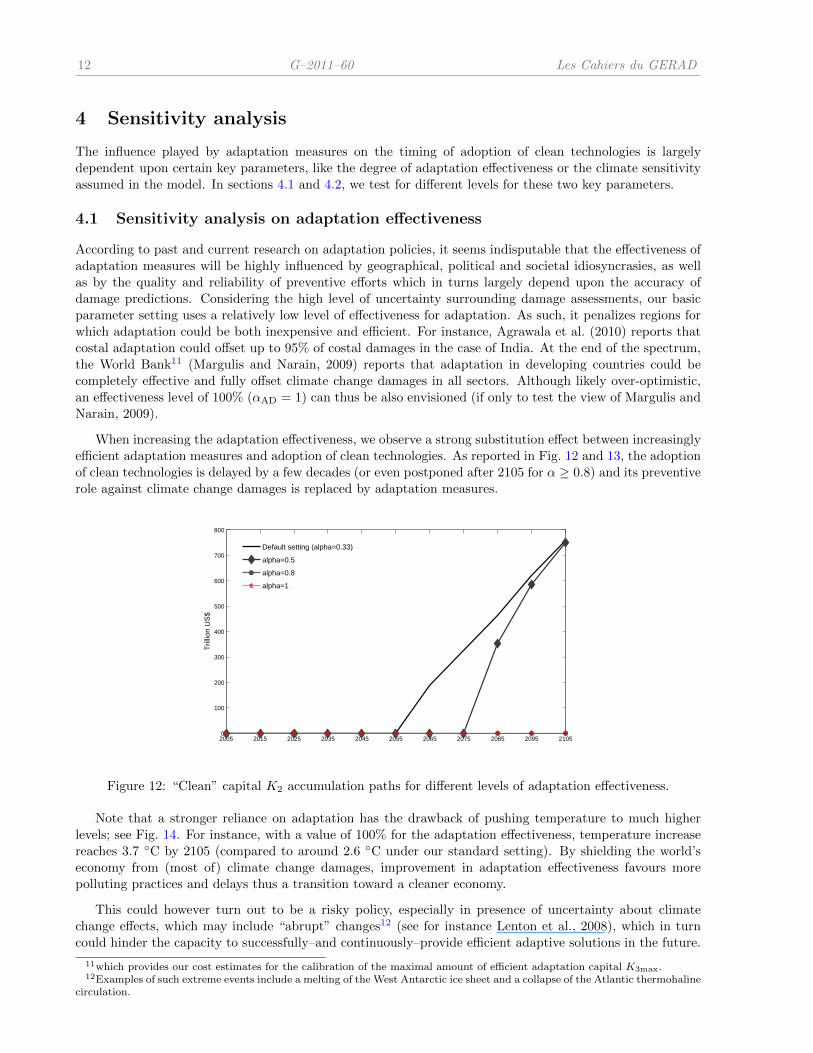
When increasing the adaptation effectiveness, we observe a strong substitution effect between increasinglyefficient adaptation measures and adoption of clean technologies. As reported in Fig. 12 and 13, the adoptionof clean technologies is delayed by a few decades (or even postponed after 2105 for α ≥ 0.8) and its preventiverole against climate change damages is replaced by adaptation measures.
2005 2015 2025 2035 2045 2055 2065 2075 2085 2095 21050
100
200
300
400
500
600
700
800
Tril
lion
US
$
Default setting (alpha=0.33)
alpha=0.5
alpha=0.8
alpha=1
Figure 12: “Clean” capital K2 accumulation paths for different levels of adaptation effectiveness.
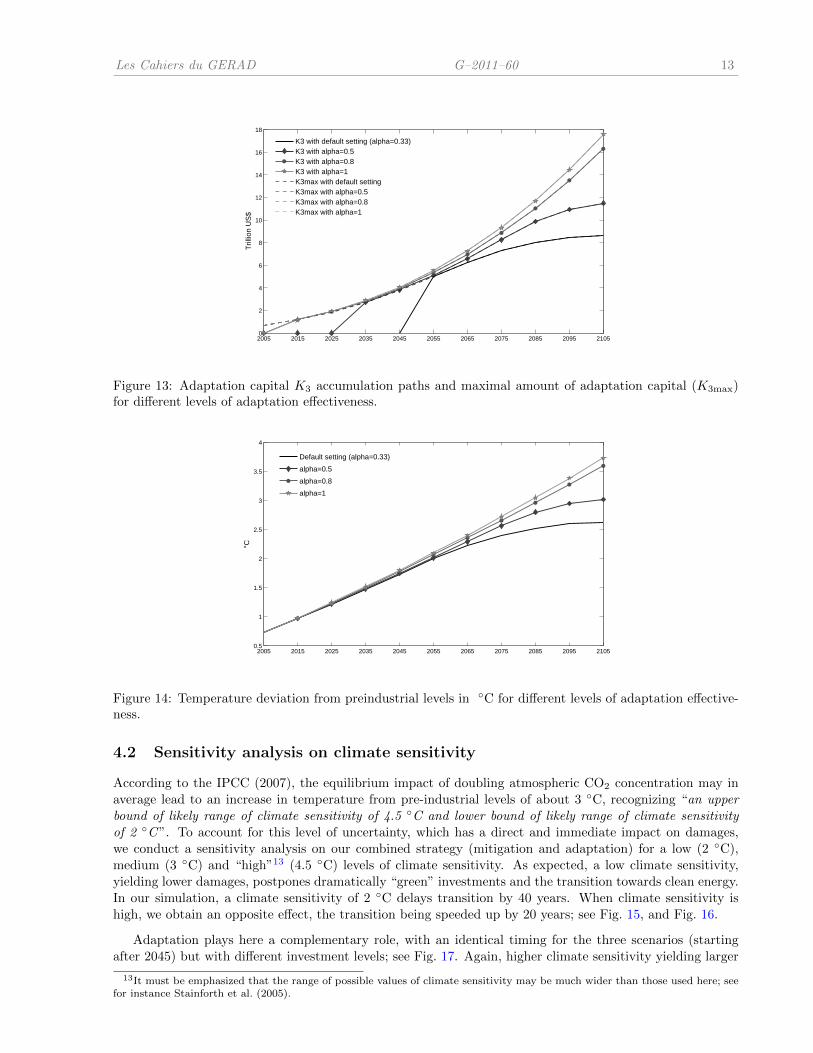
Note that a stronger reliance on adaptation has the drawback of pushing temperature to much higherlevels; see Fig. 14. For instance, with a value of 100% for the adaptation effectiveness, temperature increasereaches 3.7 ◦C by 2105 (compared to around 2.6 ◦C under our standard setting). By shielding the world’seconomy from (most of) climate change damages, improvement in adaptation effectiveness favours morepolluting practices and delays thus a transition toward a cleaner economy.
This could however turn out to be a risky policy, especially in presence of uncertainty about climatechange effects, which may include “abrupt” changes12 (see for instance Lenton et al., 2008), which in turncould hinder the capacity to successfully–and continuously–provide efficient adaptive solutions in the future.
11which provides our cost estimates for the calibration of the maximal amount of efficient adaptation capital K3max.12Examples of such extreme events include a melting of the West Antarctic ice sheet and a collapse of the Atlantic thermohaline
circulation.
Les Cahiers du GERAD G–2011–60 13
2005 2015 2025 2035 2045 2055 2065 2075 2085 2095 21050
2
4
6
8
10
12
14
16
18
Tril
lion
US
$
K3 with default setting (alpha=0.33)K3 with alpha=0.5K3 with alpha=0.8K3 with alpha=1K3max with default settingK3max with alpha=0.5K3max with alpha=0.8K3max with alpha=1
Figure 13: Adaptation capital K3 accumulation paths and maximal amount of adaptation capital (K3max)for different levels of adaptation effectiveness.
2005 2015 2025 2035 2045 2055 2065 2075 2085 2095 21050.5
1
1.5
2
2.5
3
3.5
4
°C
Default setting (alpha=0.33)
alpha=0.5
alpha=0.8
alpha=1
Figure 14: Temperature deviation from preindustrial levels in ◦C for different levels of adaptation effective-ness.
4.2 Sensitivity analysis on climate sensitivity
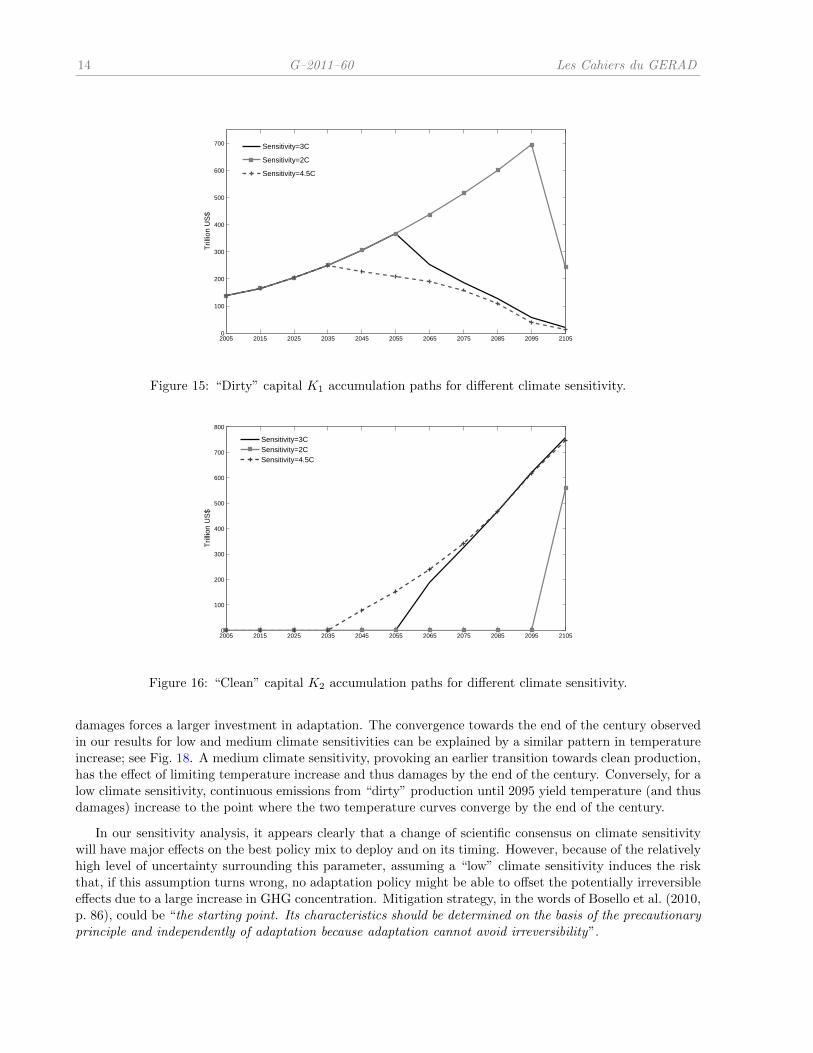
According to the IPCC (2007), the equilibrium impact of doubling atmospheric CO2 concentration may inaverage lead to an increase in temperature from pre-industrial levels of about 3 ◦C, recognizing “an upperbound of likely range of climate sensitivity of 4.5 ◦C and lower bound of likely range of climate sensitivityof 2 ◦C ”. To account for this level of uncertainty, which has a direct and immediate impact on damages,we conduct a sensitivity analysis on our combined strategy (mitigation and adaptation) for a low (2 ◦C),medium (3 ◦C) and “high”13 (4.5 ◦C) levels of climate sensitivity. As expected, a low climate sensitivity,yielding lower damages, postpones dramatically “green” investments and the transition towards clean energy.In our simulation, a climate sensitivity of 2 ◦C delays transition by 40 years. When climate sensitivity ishigh, we obtain an opposite effect, the transition being speeded up by 20 years; see Fig. 15, and Fig. 16.
Adaptation plays here a complementary role, with an identical timing for the three scenarios (startingafter 2045) but with different investment levels; see Fig. 17. Again, higher climate sensitivity yielding larger
13It must be emphasized that the range of possible values of climate sensitivity may be much wider than those used here; seefor instance Stainforth et al. (2005).
14 G–2011–60 Les Cahiers du GERAD
2005 2015 2025 2035 2045 2055 2065 2075 2085 2095 21050
100
200
300
400
500
600
700
Tril
lion
US
$
Sensitivity=3C
Sensitivity=2C
Sensitivity=4.5C
Figure 15: “Dirty” capital K1 accumulation paths for different climate sensitivity.
2005 2015 2025 2035 2045 2055 2065 2075 2085 2095 21050
100
200
300
400
500
600
700
800
Tril
lion
US
$
Sensitivity=3CSensitivity=2CSensitivity=4.5C
Figure 16: “Clean” capital K2 accumulation paths for different climate sensitivity.
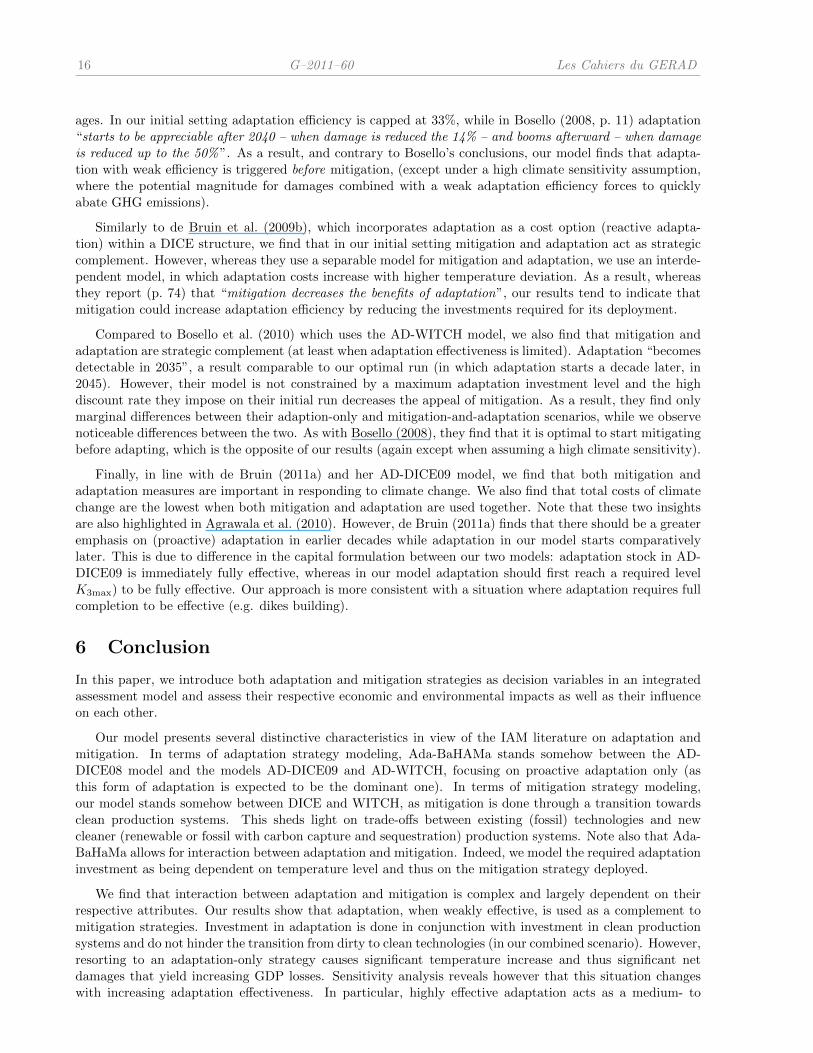
damages forces a larger investment in adaptation. The convergence towards the end of the century observedin our results for low and medium climate sensitivities can be explained by a similar pattern in temperatureincrease; see Fig. 18. A medium climate sensitivity, provoking an earlier transition towards clean production,has the effect of limiting temperature increase and thus damages by the end of the century. Conversely, for alow climate sensitivity, continuous emissions from “dirty” production until 2095 yield temperature (and thusdamages) increase to the point where the two temperature curves converge by the end of the century.
In our sensitivity analysis, it appears clearly that a change of scientific consensus on climate sensitivitywill have major effects on the best policy mix to deploy and on its timing. However, because of the relativelyhigh level of uncertainty surrounding this parameter, assuming a “low” climate sensitivity induces the riskthat, if this assumption turns wrong, no adaptation policy might be able to offset the potentially irreversibleeffects due to a large increase in GHG concentration. Mitigation strategy, in the words of Bosello et al. (2010,p. 86), could be “the starting point. Its characteristics should be determined on the basis of the precautionaryprinciple and independently of adaptation because adaptation cannot avoid irreversibility”.
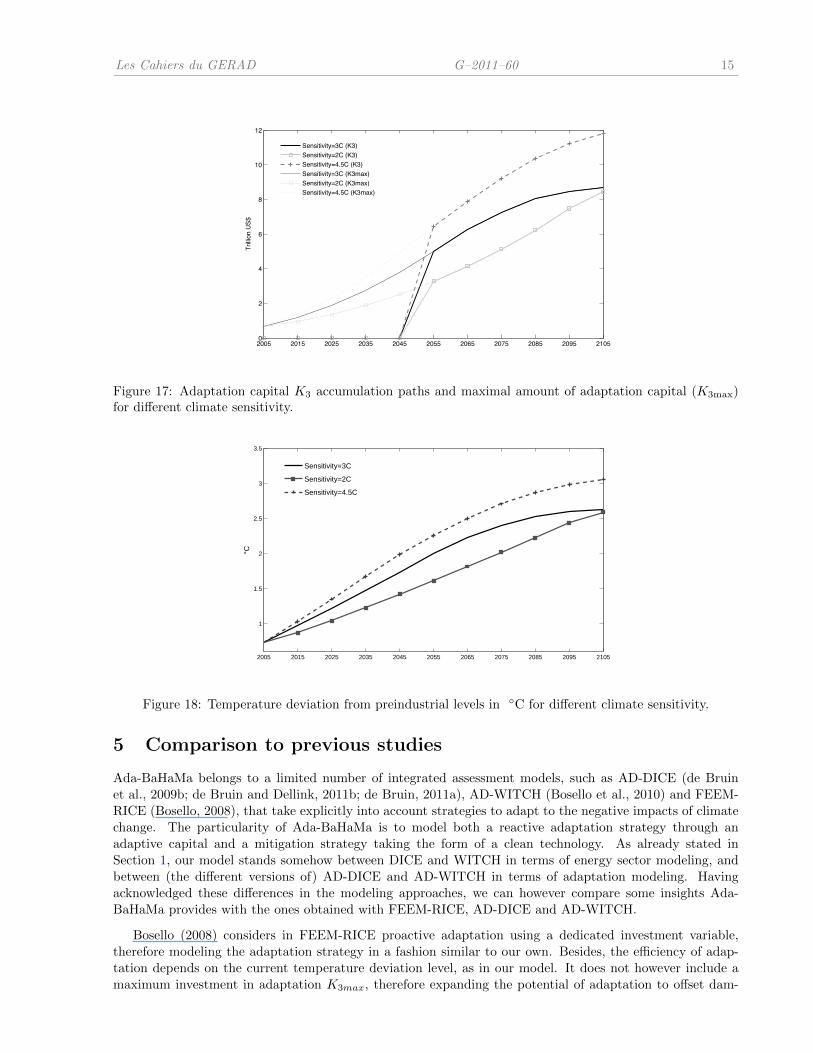
Les Cahiers du GERAD G–2011–60 15
2005 2015 2025 2035 2045 2055 2065 2075 2085 2095 21050
2
4
6
8
10
12
Trilli
on U
S$
Sensitivity=3C (K3)Sensitivity=2C (K3)Sensitivity=4.5C (K3)Sensitivity=3C (K3max)Sensitivity=2C (K3max)Sensitivity=4.5C (K3max)
Figure 17: Adaptation capital K3 accumulation paths and maximal amount of adaptation capital (K3max)for different climate sensitivity.
2005 2015 2025 2035 2045 2055 2065 2075 2085 2095 2105
1
1.5
2
2.5
3
3.5
°C
Sensitivity=3C
Sensitivity=2C
Sensitivity=4.5C
Figure 18: Temperature deviation from preindustrial levels in ◦C for different climate sensitivity.
5 Comparison to previous studies
Ada-BaHaMa belongs to a limited number of integrated assessment models, such as AD-DICE (de Bruinet al., 2009b; de Bruin and Dellink, 2011b; de Bruin, 2011a), AD-WITCH (Bosello et al., 2010) and FEEM-RICE (Bosello, 2008), that take explicitly into account strategies to adapt to the negative impacts of climatechange. The particularity of Ada-BaHaMa is to model both a reactive adaptation strategy through anadaptive capital and a mitigation strategy taking the form of a clean technology. As already stated inSection 1, our model stands somehow between DICE and WITCH in terms of energy sector modeling, andbetween (the different versions of) AD-DICE and AD-WITCH in terms of adaptation modeling. Havingacknowledged these differences in the modeling approaches, we can however compare some insights Ada-BaHaMa provides with the ones obtained with FEEM-RICE, AD-DICE and AD-WITCH.
Bosello (2008) considers in FEEM-RICE proactive adaptation using a dedicated investment variable,therefore modeling the adaptation strategy in a fashion similar to our own. Besides, the efficiency of adap-tation depends on the current temperature deviation level, as in our model. It does not however include amaximum investment in adaptation K3max, therefore expanding the potential of adaptation to offset dam-
16 G–2011–60 Les Cahiers du GERAD
ages. In our initial setting adaptation efficiency is capped at 33%, while in Bosello (2008, p. 11) adaptation“starts to be appreciable after 2040 – when damage is reduced the 14% – and booms afterward – when damageis reduced up to the 50% ”. As a result, and contrary to Bosello’s conclusions, our model finds that adapta-tion with weak efficiency is triggered before mitigation, (except under a high climate sensitivity assumption,where the potential magnitude for damages combined with a weak adaptation efficiency forces to quicklyabate GHG emissions).
Similarly to de Bruin et al. (2009b), which incorporates adaptation as a cost option (reactive adapta-tion) within a DICE structure, we find that in our initial setting mitigation and adaptation act as strategiccomplement. However, whereas they use a separable model for mitigation and adaptation, we use an interde-pendent model, in which adaptation costs increase with higher temperature deviation. As a result, whereasthey report (p. 74) that “mitigation decreases the benefits of adaptation”, our results tend to indicate thatmitigation could increase adaptation efficiency by reducing the investments required for its deployment.
Compared to Bosello et al. (2010) which uses the AD-WITCH model, we also find that mitigation andadaptation are strategic complement (at least when adaptation effectiveness is limited). Adaptation “becomesdetectable in 2035”, a result comparable to our optimal run (in which adaptation starts a decade later, in2045). However, their model is not constrained by a maximum adaptation investment level and the highdiscount rate they impose on their initial run decreases the appeal of mitigation. As a result, they find onlymarginal differences between their adaption-only and mitigation-and-adaptation scenarios, while we observenoticeable differences between the two. As with Bosello (2008), they find that it is optimal to start mitigatingbefore adapting, which is the opposite of our results (again except when assuming a high climate sensitivity).
Finally, in line with de Bruin (2011a) and her AD-DICE09 model, we find that both mitigation andadaptation measures are important in responding to climate change. We also find that total costs of climatechange are the lowest when both mitigation and adaptation are used together. Note that these two insightsare also highlighted in Agrawala et al. (2010). However, de Bruin (2011a) finds that there should be a greateremphasis on (proactive) adaptation in earlier decades while adaptation in our model starts comparativelylater. This is due to difference in the capital formulation between our two models: adaptation stock in AD-DICE09 is immediately fully effective, whereas in our model adaptation should first reach a required levelK3max) to be fully effective. Our approach is more consistent with a situation where adaptation requires fullcompletion to be effective (e.g. dikes building).
6 Conclusion
In this paper, we introduce both adaptation and mitigation strategies as decision variables in an integratedassessment model and assess their respective economic and environmental impacts as well as their influenceon each other.
Our model presents several distinctive characteristics in view of the IAM literature on adaptation andmitigation. In terms of adaptation strategy modeling, Ada-BaHAMa stands somehow between the AD-DICE08 model and the models AD-DICE09 and AD-WITCH, focusing on proactive adaptation only (asthis form of adaptation is expected to be the dominant one). In terms of mitigation strategy modeling,our model stands somehow between DICE and WITCH, as mitigation is done through a transition towardsclean production systems. This sheds light on trade-offs between existing (fossil) technologies and newcleaner (renewable or fossil with carbon capture and sequestration) production systems. Note also that Ada-BaHaMa allows for interaction between adaptation and mitigation. Indeed, we model the required adaptationinvestment as being dependent on temperature level and thus on the mitigation strategy deployed.
We find that interaction between adaptation and mitigation is complex and largely dependent on theirrespective attributes. Our results show that adaptation, when weakly effective, is used as a complement tomitigation strategies. Investment in adaptation is done in conjunction with investment in clean productionsystems and do not hinder the transition from dirty to clean technologies (in our combined scenario). However,resorting to an adaptation-only strategy causes significant temperature increase and thus significant netdamages that yield increasing GDP losses. Sensitivity analysis reveals however that this situation changeswith increasing adaptation effectiveness. In particular, highly effective adaptation acts as a medium- to
Les Cahiers du GERAD G–2011–60 17
long-term substitute to mitigation efforts, that could even prevent long-term investments in clean productionsystems (in the extreme case of perfectly efficient and certainly unrealistic adaptation measures). Analysison the climate sensitivity indicates also that the choice of a climate sensitivity parameter is certainly notinnocuous on the policy recommendations and represents a crucial element for our mitigation/adaptationmodel. In our framework, higher climate sensitivity has in particular the effect of accelerating mitigationefforts while increasing adaptation investments. On the opposite end of the sensitivity spectrum, a lowsensitivity value hinders significantly the mitigation efforts and reduces adaptation investments.
We view this paper has an essential (first) step for implementing adaptation in the BaHaMa model. Butwe do envision several other steps to enrich the modeling framework of Ada-BaHaMa, to be carried out infuture research. A first improvement will be to consider simultaneously reactive and proactive adaptationstrategies to better capture the different adaptation options. Besides, we also acknowledge that the choiceof adaptation and mitigation policies has to take into account heterogeneity in regional costs, exposuresand achievable benefits. Therefore, a second improvement of our model will be the development of a multi-regional version of Ada-BaHaMa, building on the two-region version of BaHaMa reported in Bahn et al.(2010). A third important improvement will be to introduce uncertainty, for instance on the magnitudeof climate change damages, on the adaptation effectiveness or on a technological breakthrough that wouldprovide access to the clean economy. As in Bahn et al. (2008), the resolution of uncertainty could be modeledas a stochastic control problem.
ReferencesW.N. Adger, S. Agrawala, M.M. Mirza, C. Conde, K. O’Brien, J. Pulhin, R. Pulwarty, B. Smit, and K. Takahashi.
Assessment of adaptation practices, options, constraints and capacity. In M.L. Parry, O.F. Canziani, J.P. Palutikof,P.J. van der Linden, and C.E. Hanson, editors, Climate Change 2007: Impacts, Adaptation and Vulnerability,Contribution of Working Group II to the Fourth Assessment Report of the Intergovernmental Panel on ClimateChange, pages 717–743. Cambridge University Press, Cambridge, UK, 2007.
S. Agrawala, F. Bosello, C. Carraro, K. de Bruin, E. De Cian, R. Dellink, and E. Lanzi. Plan or react? analysis ofadaptation costs and benefits using integrated assessment models. Environment Working Papers 23, OECD, Paris,France, 2010.
O. Bahn, A. Haurie, and R. Malhame. A stochastic control model for optimal timing of climate policies. Automatica,44(6):1545–1558, 2008.
O. Bahn, A. Haurie, and R. Malhame. A stochastic control/game approach to the optimal timing of climate policies.In J. Filar and A. Haurie, editors, Uncertainty and Environmental Decision Making, volume 138 of InternationalSeries in Operations Research and Management Science, pages 211–237. Springer, 2010.
W.J. Baumol and W.E. Oates. The Theory of Environmental Policy. Cambridge University Press, Cambridge, MA,1988.
B. Bosello. Adaptation, mitigation and “green” r&d to combat global climate change – insights from an empiricalintegrated assessment exercise. CMCC Research Paper 48, Centro Euro-Mediterraneo per i Cambiamenti Climatici,Lecce, Italy, 2008.
F. Bosello, C. Carraro, and E. de Cian. Climate policy and the optimal balance between mitigation, adaptation andunavoided damage. Climate Change Economics, 1(2):71–92, 2010.
K. de Bruin. Distinguishing between proactive (stock) and reactive (flow) adaptation. Working Paper 8, CERE,Umea, Sweden, 2011a.
K. de Bruin and R. Dellink. How harmful are restrictions on adapting to climate change? Global Envi-ronmental Change, 21(1):34–45, 2011b. ISSN 0959-3780. doi: 10.1016/j.gloenvcha.2010.09.008. URL http:
//www.sciencedirect.com/science/article/pii/S095937801000083X.
K. de Bruin, R. Dellink, and S. Agrawala. Economic aspects of adaptation to climate change: Integrated assessmentmodelling of adaptation costs and benefits. Environment Working Papers 6, OECD, Paris, France, March 2009a.
K.C. de Bruin, R.B. Dellink, and R.S. Tol. AD-DICE: An implementation of adaptation in the DICE model. ClimaticChange, 95(1-2):63–81, 2009b.
F. Felgenhauer and K.C. de Bruin. The optimal paths of climate change mitigation and adaptation under certaintyand uncertainty. International Journal of Global Warming, 1(1/2/3):66–88, 2009.
A.F. Hof, K.C. de Bruin, R.B. Dellink, M.G. den Elzen, and D.P. van Vuuren. The effect of different mitigationstrategies on international financing of adaptation. Environmental Science & Policy, 12(7):832–843, 2009.
18 G–2011–60 Les Cahiers du GERAD
C. Hope. The marginal impact of CO2 from PAGE2002: An integrated assessment model incorporating the IPCC’sfive reasons for concern. The Integrated Assessment Journal, 6(1):19–56, 2006.
C. Hope, J. Anderson, and P. Wenman. Policy analysis of the greenhouse effect: An application of the PAGE model.Energy Policy, 21(3):327–338, 1993.
IPCC. Climate Change 2007: Synthesis Report. Cambridge University Press, Cambridge, UK, 2007.
R.J.T. Klein, S.E.H. Eriksen, L.O. Næss, A. Hammill, T.M. Tanner, C. Robledo, and K.L. O’Brien. Portfolio screeningto support the mainstreaming of adaptation to climate change into development assistance. Climatic Change, 84(1):23–44, 2007a.
R.J.T. Klein, S. Huq, F. Denton, T.E. Downing, R.G. Richels, J.B. Robinson, and F.L. Toth. Inter-relationshipsbetween adaptation and mitigation. In M.L. Parry, O.F. Canziani, J.P. Palutikof, P.J. van der Linden, and C.E.Hanson, editors, Climate Change 2007: Impacts, Adaptation and Vulnerability, Contribution of Working Group IIto the Fourth Assessment Report of the Intergovernmental Panel on Climate Change, pages 745–777. CambridgeUniversity Press, Cambridge, UK, 2007b.
F. Lecocq and Z. Shalizi. Balancing expenditures on mitigation of and adaptation to climate change: An exploration ofissues relevant to developing countries. Policy Research Working Paper Series 4299, The World Bank, Washington,DC, August 2007.
T.M. Lenton, H. Held, E. Kriegler, J.W. Hall, W. Lucht, S. Rahmstorf, and H.J. Schellnhuber. Tipping elements inthe Earth’s climate system. Proceedings of the National Academy of Sciences, 105(6):1786–1793, 2008.
R. Loulou. ETSAP-TIAM: The TIMES integrated assessment model. Part II: Mathematical formulation. Computa-tional Management Science, 5(1-2):41–66, 2008.
R. Loulou and M. Labriet. ETSAP-TIAM: The TIMES integrated assessment model. Part I: Model structure.Computational Management Science, 5(1-2):7–40, 2008.
A. Manne, R. Mendelsohn, and R. Richels. MERGE: A model for evaluating regional and global effects of GHGreduction policies. Energy Policy, 23(1):17–34, 1995.
A.S. Manne and R.G. Richels. MERGE: An integrated assessment model for global climate change. In R. Loulou,J.-P. Waaub, and G. Zaccour, editors, Energy and Environment, volume 3 of GERAD 25th Anniversary Series,pages 175–189. Springer, 2005.
S. Margulis and U. Narain. The costs to developing countries of adapting to climate change: New methods andestimates. Global report of the economics of adaptation to climate change study, The World Bank, Washington,DC, 2009.
G.A. Meehl, T.F. Stocker, W.D. Collins, P. Friedlingstein, A.T. Gaye, J.M. Gregory, A. Kitoh, R. Knutti, J.M.Murphy, A. Noda, S.C.B. Raper, I.G. Watterson, A.J. Weaver, and Z.C. Zhao. Global climate projections. InS. Solomon, D. Qin, M. Manning, Z. Chen, M. Marquis, K.B. Averyt, M. Tignor, and H.L. Miller, editors, ClimateChange 2007: The Physical Science Basis, Contribution of Working Group I to the Fourth Assessment Reportof the Intergovernmental Panel on Climate Change, pages 747–845. Cambridge University Press, Cambridge, UK,2007.
R. Mendelsohn. Efficient adaptation to climate change. Climatic Change, 45(3-4):583–600, 2000.
W.D. Nordhaus. Managing the Global Commons. The MIT Press, Cambridge, MA, 1994.
W.D. Nordhaus. A Question of Balance. Yale University Press, New Haven, CT, 2008.
W.D. Nordhaus and Z. Yang. A regional dynamic general-equilibrium model of alternative climate-change strategies.The American Economic Review, 86(4):741–765, 1996.
M. Olson. The Logic of Collective Action: Public Goods and the Theory of Groups. Harvard University Press,Cambridge, MA, 1965.
M. Parry, N. Arnell, P. Berry, D. Dodman, S. Fankhauser, C. Hope, S. Kovats, R. Nicholls, D. Satterthwaite, R. Tiffin,and T. Wheeler. Assessing the Costs of Adaptation to Climate Change: A Review of the UNFCCC and Other RecentEstimates. International Institute for Environment and Development and Grantham Institute for Climate Change,London, UK, 2009.
D. A. Stainforth, et al., and et al. Uncertainty in predictions of the climate response to rising levels of greenhousegases. Nature, 433:403–406, 2005.
R.S. Tol. Adaptation and mitigation: Trade-offs in substance and methods. Environmental Science and Policy, 8(6):572–578, 2005.
United Nations. Copenhagen Accord. In UNFCCC, Conference of the Parties (COP-15), http://unfccc.int/
resource/docs/2009/cop15/eng/l07.pdf,accessedonOctober19,2011. December 2009.
Related Documents