International Journal of Economics, Commerce and Management United Kingdom Vol. IV, Issue 10, October 2016 Licensed under Creative Common Page 517 http://ijecm.co.uk/ ISSN 2348 0386 THE EFFECT OF PERFORMANCE BENCHMARKS ON THE RELATIONSHIP BETWEEN SERVICE QUALITY DIMENSIONS AND CUSTOMER SATISFACTION AT ELDORET LAW COURTS Fred. C. Obande Buluma Lecturer, School of Business, Department of Commerce Laikipia University, Main Campus, Nyahururu, Kenya [email protected] Thripsisa Wanjiku Cherere MBA Candidate, School of Business Laikipia University, Main Campus, Nyahururu, Kenya [email protected] Peter Mwaura Lecturer, School of Business, Department of Commerce Laikipia University, Main Campus, Nyahururu, Kenya [email protected] Abstract Kenya has undertaken a number of judicial reforms specifically to realize an effective justice system considered a fundamental right to all its citizens in addition to reinforcing confidence in the legal system. This study aimed at testing a Performance benchmarks namely performance appraisals and quality management systems if they had any significant relationship with customer performance in Eldoret law courts. The current study represents an initial effort to describe results of a performance measurement that can suggest some challenges in developing comprehensive performance measurement tools for courts. The study was based on the previous finding where the service quality dimensions could only explained 2 % of the customer satisfaction in Eldoret Law Courts. Data was collected from a stratified sample from a population of 1815 respondents composed of convicts, remandees, advocates and child

Welcome message from author
This document is posted to help you gain knowledge. Please leave a comment to let me know what you think about it! Share it to your friends and learn new things together.
Transcript
International Journal of Economics, Commerce and Management United Kingdom Vol. IV, Issue 10, October 2016
Licensed under Creative Common Page 517
http://ijecm.co.uk/ ISSN 2348 0386
THE EFFECT OF PERFORMANCE BENCHMARKS ON THE
RELATIONSHIP BETWEEN SERVICE QUALITY DIMENSIONS
AND CUSTOMER SATISFACTION AT ELDORET LAW COURTS
Fred. C. Obande Buluma
Lecturer, School of Business, Department of Commerce
Laikipia University, Main Campus, Nyahururu, Kenya
Thripsisa Wanjiku Cherere
MBA Candidate, School of Business
Laikipia University, Main Campus, Nyahururu, Kenya
Peter Mwaura
Lecturer, School of Business, Department of Commerce
Laikipia University, Main Campus, Nyahururu, Kenya
Abstract
Kenya has undertaken a number of judicial reforms specifically to realize an effective justice
system considered a fundamental right to all its citizens in addition to reinforcing confidence in
the legal system. This study aimed at testing a Performance benchmarks namely performance
appraisals and quality management systems if they had any significant relationship with
customer performance in Eldoret law courts. The current study represents an initial effort to
describe results of a performance measurement that can suggest some challenges in
developing comprehensive performance measurement tools for courts. The study was based on
the previous finding where the service quality dimensions could only explained 2 % of the
customer satisfaction in Eldoret Law Courts. Data was collected from a stratified sample from a
population of 1815 respondents composed of convicts, remandees, advocates and child

© Buluma, Cherere & Mwaura
Licensed under Creative Common Page 518
convicts. The study established that when the employee performance benchmarks were
introduced in the model, dimensions of service quality namely reliability, empathy,
responsiveness, assurance, and tangibles improved and were able to explain 4.6% from the
previous 2% of customer satisfaction at the Eldoret Law Courts. There was however, a
significant relationship between service quality dimensions and customer satisfaction as a
result. These findings provide some useful and interesting insight into the achievements of
judicial reforms and more specifically the importance of performance benchmarks (performance
measures) in the judiciary.
Keywords: Service Quality Dimensions, Customer Satisfaction, Justice, Performance Appraisal,
Rater, Quality Management Systems
INTRODUCTION
Throughout the country questions that called for judicial reforms revolved around trust in judicial
administration, quality of service, independence of courts and efficiency in the delivery of justice.
Judicial reforms experiences are an indication that more information is required to assess and
evaluate trends among the different courts in the country making judicial decisions. However, in
effect little is known about the trends in the performance of each court throughout the country.
This study therefore addressed the service quality dimensions of court performance based on
the performance measurement tools such as performance appraisal and quality management
systems in place. These measures assessed the effectiveness and efficiency of Eldoret Law
courts as critical issues in the judicial reform agenda.
Performance benchmarks are designed to measure systems service quality dimensions.
Data to be measured is defined into specific measurable elements provided by an organization
parameter to measure the quality of its service. Through performance measurement, a process
by which an organization monitors important aspects of its programs, systems, and processes in
used. In this context, performance measurement includes the operational processes used to
collect data necessary for the performance measures. Performance management is a forward-
looking process used to set goals and regularly check progress toward achieving those goals. In
practice, an organization sets goals, looks at the actual data for its performance measures, and
acts on results to improve the performance toward its goals.
The Judiciary’s performance measures and indicators are aimed at streamlining internal
processes and systems, improving efficiency and effectiveness, meeting stipulated timelines,
increasing accountability and productivity of judges and judicial officers and staff and promoting
International Journal of Economics, Commerce and Management, United Kingdom
Licensed under Creative Common Page 519
quality service. The key performance benchmarks used include the Judiciary Strategic Plans,
Annual Work Plans, Performance Management and Measurement Understanding (PMMU),
Citizens Service Delivery Charters and Standards, Quality Management Standards,
Performance Appraisals, Performance reporting performance benchmarks and court user and
employee satisfaction surveys. This study used the performance appraisal and quality
management standards because of the availability of information that is quantifiable.
Management theory and practice have long established a link between effective
performance measures and effective management (Drucker, 1995). The effectiveness of any
given performance measure in the judicial system depends on how it will be used. For
performance measures to have meaning and provide useful information, it is necessary to make
comparisons, evaluate progress in achieving given goals or targets, assess trends in
performance over time, or weigh the performance of one organization against another (Poister,
2003).
Performance benchmarks are used as a management tool and require to be broadened
to include inputs and process multiple measures of its programs from the different perspectives
of customer, employee, process, and finance (Kaplan, 1996 and Poister, 2003).
Performance Appraisals
Organizations can only compete with their rivals by being innovative and organizations can be
innovative only when they manage their human resources well. The human resource system
can become more effective when there is a valid, effective and accurate appraisal system to
rating employee performances of the employees (Yalçın, 2002).
In Kenya, performance appraisal system became a new paradigm in the public service
including the judiciary as from was introduced by the government alongside the new financial
year from 1st July 2006. The purpose was to improve performance of employees in public
sectors. This is a process requires work planning and target setting by employees and the aim
of performance appraisals is to encourage team work, better designation of responsibilities,
improved information sharing in organizations, connecting employee performance to the
organizations strategic plans, entrenching continuous assessment of performance and
motivating employees through mutual discussions, setting and reviewing of targets (Obongo,
2009)
The performance appraisal has numerous purposes, but the main objective is to get
better organizations overall performance. Fisher (1995) posited that performance appraisal is
serves an indirectly as a basis for disciplinary action on employees who do not maintain
discipline as one of the goals of a multipurpose scheme. In addition, through performance
© Buluma, Cherere & Mwaura
Licensed under Creative Common Page 520
appraisals, employees recognize their pay and chance of being promoted depending on the
outcome of the appraisal process (Rees and Porter, 2001). Finally performance appraisal
enables employees to work hard so that the employer can justify the costs of an employee’s
training and developmental needs. The study used performance appraisals to establish the
effect employee training that is undertaken by the judiciary expected to help improve the
performance of such employees.
Quality Management Systems
Quality management (QM) refers to the application of a quality management system in
managing a procedure to realize utmost customer satisfaction at the lowest overall cost to the
organization while continuing to improve the process. Nelsen and Daniels (2007) posit that a
quality management system (QMS) must be an official system with a documented
organization’s responsibilities and procedures that each employee will require to achieve
effective quality management.
Organizations use quality management programs usually instituted from the executive
management down to the lowest level employee bearing in mind that each particular task within
an organization requires quality processes modelled after its own unique requirements. The
study expects that the Kenyan courts individually have quality processes designed and
established based on the values of the overall quality management program. In management,
are different quality management programs, which include total quality management (TQM),
kaizen based programs, and Six Sigma. Beinhocker and Kaplan (2002) argue that any
organization’s quality management program acts as a chief factor in its strategic planning
practice because the executive management requires not only to achieve quality management
but also requires achieving its listed objectives, have a creative management and be innovative.
The current study investigated the quality management variable in order to establish whether
the Eldoret law courts were innovative enough to deal with the increasing complaint levels.
Customer Satisfaction in Judiciary
Kenya’s Judiciary discharges its mandate through the Judicial Service Commission with the
power and authority highly centralized. The judiciary’s complaints hinge on accountability
mechanisms considered weak, inadequate resources, diminishing public confidence, deficiency
in employee integrity, weak public support and literally incapacitated ability to deliver justice
(National Council for Law Reporting, 2016). The new 2010 Constitution decentralized judiciary
services with the Supreme Court and the Court of Appeal having their own Presidents and the
High Court now has a Principal Judge as head of the respective Institutions.

International Journal of Economics, Commerce and Management, United Kingdom
Licensed under Creative Common Page 521
The Kenyan Judiciary has institutionalized Performance Contracting (PC) by establishing a fully
fledged directorate of performance management where performance appraisals are applied.
The PC is Result-Based Management (RBM) methodology that has been implemented by the
Executive Arm of the Government. RBM is a participatory team based approach designed to
achieve defined results by improving programme and management efficiency, effectiveness,
accountability and transparency. Performance based management practices are now applicable
to both judicial and administrative staff. In order to promote sound management practices, the
judiciary has also established Transformation Steering Committee where all stakeholders in the
judicial system are represented. An Ombudsperson was appointed purposely to receive and
respond to complaints by staff and the public while the Chief of Staff was appointed to oversee
the establishment of the Executive Office of the Chief Justice and facilitate the CJ’s numerous
roles.
Kenya’s judiciary has an effective model where it envisages a vision of success through
a management approach centered on quality delivery of services where each employee is
expected to participate with one of the objective being customer satisfaction and to society by
being ISO certified entity. It is the coordination of efforts directed at improving customer
satisfaction, increasing employee participation, strengthening supplier partnerships, and
facilitating an organisational atmosphere of continuous quality improvement (Pride, Hughes, and
Kapoor, 2009)
Statement of the Problem
The new 2010 Constitution decentralized judicial services and in effect taking services closer to
the people. The Judiciary continuously monitors its service through the performance
benchmarks and the Office of the Judiciary Ombudsperson (OJO) which is an accelerated
grievance/feedback management mechanism established in August 2011 under the Office of
the Chief Justice. The Office of the Ombudsperson has registered 9,776 complaints in
2011/2012 and 9,093 complaints in 2012/2013 against the judiciary. These complaints manifest
within the realm of annual training of its employees for culture change, workshops, training on
technology and its applications purposely to eliminate or substantially reduce number of
complaints in the judicial service.
This study therefore sought to assess why the judiciary has numerous complaints of
customer dissatisfaction about the quality of services offered by the Judiciary amidst
performance benchmarks (such as performance appraisals and quality management systems in
place) and training. Hence, the study investigated the relationship between service quality

© Buluma, Cherere & Mwaura
Licensed under Creative Common Page 522
dimensions, performance benchmarks and customer satisfaction in Eldoret Law Courts in
Kenya.
THEORETICAL BACKGROUND
This study applied three theories namely the assimilation – contrast theory as proposed by
Anderson (1973) which suggested organizations should perform until its performance is deemed
as acceptable. The theory was used to explain the relationships among the service quality and
customer satisfaction dimensions (variables) in the conception model. It was also used in the
study to understand the growing public complaints and in effect to assess the theory
robustness.
Contrast Theory was also used as proposed by Hovland, C., Harvey, O., Sherif (1957).
It defines the cause of discrepancy between one’s own attitudes and the attitudes represented
by opinion statements. The theory was critical in interpreting the results on service quality
dimensions and on customer satisfaction.
Equity theory is built upon the argument by Stouffer et al.(1949) that man’s rewards in
exchange with others should be proportional to investments. This theory was used to address
the customer satisfaction variable within the context of legal reforms in the country. The major
short coming of this theory is that in the handful of studies that have examined the effect of
equity on customer satisfaction, equity appears to have a moderate effect on customer
satisfaction and post - purchase communication behaviour.
Research objectives
To investigate the moderating effects of performance benchmarks on the relationship between
service quality dimensions and customer satisfaction at Eldoret Law Courts
Research Hypotheses
H0: There are no significant moderating effects of performance benchmarks on the relationship
between service quality dimensions and customer satisfaction at Eldoret Law Courts.
Performance Benchmarks (Performance Appraisals) and Quality Management Systems
on the Relationship between Service Quality Dimensions and Customer Satisfaction
Manani et al., (2013) explored the key determinants of customer satisfaction for passenger sat
Kenya Airways. The study used a descriptive survey design. Data was collected from one
hundred (100) passengers and was analysed by use of means, frequency, percentage and
Factor Analysis. The SERVQUAL dimensions, reliability, assurance, tangibles empathy, and
International Journal of Economics, Commerce and Management, United Kingdom
Licensed under Creative Common Page 523
responsiveness were used to measure the gap between customers’ expectation for excellence
and their perception of actual service delivered.
The study findings revealed that the SERVQUAL/RATER dimensions tangibility,
reliability, responsiveness, assurance and empathy had a significant relationship with customer
satisfaction. The results also revealed that luggage security and safety, proper communication
with customers to update them on status of their flights and provision of food variety, weather
conditions prevailing at the destination and compassion by airline crew toward any disabled
persons on-board in a form of quality management system significantly increased customer
satisfaction. The study found that consumers perceive service quality and being able to
measure service quality through a quality management system can benefit management of
service organizations. The study shows that measuring service quality together a quality
management system can help management secure reliable data that can be used to monitor
and maintain improved service quality.
Martey and Frempong (2014) also conducted a study in the airline industry using the
SERVQUAL/RATER model to examine the impact of perceived service quality dimensions on
customer satisfaction in the airline industry in Ghana. Data was collected using self-
administered questionnaires and interviews on a sample of 353 of international airline
passengers. Data was analysed using descriptive analysis, correlation analysis and reliability
and validity analysis. The findings revealed that all five dimensions of perceived service quality,
namely responsiveness, reliability, empathy, assurance, and tangibles had a significant and
positive relationship with customer satisfaction. These results indicate that service quality is
indeed a significant predictor of customer satisfaction in the airline industry and that improved
airline service quality would result in higher passenger satisfaction. This study was carried out
on international airline passengers and improvement of service delivery improved aided by the
improved management quality systems in airline services. The similar results however were
found by Manani et al., (2013) that the improvements of airline service quality results were high
to airline passenger satisfaction with the help of service charter.
Mbuthia et al., (2013) used the hotel service quality to study perceptions and satisfaction
among domestic guests in Kenya. Descriptive survey design was adopted for the study and
cluster sampling was applied to select the hotels from which customers were derived.
Questionnaires were self-administered to 182 guests and 26 items were used to measure
perceived service quality using a seven-point Likert-type scale. The study established that
tangibility as a service is rated highly while confidence and communication dimensions of quality
had a low rating. The study recommended that service delivery capacity of employees be
improved in the said hotels so that customers can feel that their needs are addressed, better
© Buluma, Cherere & Mwaura
Licensed under Creative Common Page 524
communication is achieved and employees become more responsive as well as reliable. The
study also suggested that the management of hotels ought to pursue other motivating strategies
including quality management systems to improve service quality.
Okibo and Ogwe (2013) conducted an assessment of the effect of staff training,
accessible customer care centres, organisation customer care policies and guideline, agility
supply chain of products and service on quality customer care factors affecting quality customer
care services in Telkom Kenya. The questionnaire reliability was pilot - tested on 4500
respondents. Open-ended and close-ended questionnaires were administered on 9100
employees. Collected data was analysed using multiple linear regression to determine the
mean score, standard deviation, frequency and percentage of occurrences and the results were
presented on frequency distribution tables, pie charts and bar charts. The study revealed that
customer care training equips employees with customer care knowledge skills in order to boost
their customer handling ability thus attracting more customers and increased organizational
performance.
Researches carried out in the banking industry agree that service quality enhances
customer satisfaction and more particularly customer royalty. Auka (2012) investigated the
relationship between service quality, satisfaction, perceived value and loyalty among customers
in commercial banks in Nakuru Municipality, Kenya. To achieve this purpose, data were
collected using a questionnaire administered on 381 respondents who were selected through
stratified random and systematic sampling procedures. The overall reliability test using
Cronbach’s test of the questionnaire had an alpha coefficient of 0.911. Data analysis was done
through Pearson correlation and regression. The findings revealed that there was a positive and
significant relationship between the five dimensions of service quality with customer satisfaction
and customer value, and customer loyalty. This study also found that performance appraisal in
service quality enhanced customer value and satisfactions which therefore are critical success
factors that influence the competitiveness of an organization. It is therefore recommended that
banks adopt the model consisting of the three constructs to create and maintain customer
loyalty so as to improve performance and create competitive advantage.
Satır (2006) posted that character of a firm cannot be explained by only one experience
dimension by the targeted consumers rather reputation contains sub dimensions such as trust
and service quality in addition to instances of a repeat purchase. If the corporate personality of a
service firm is accepted to the customers then it can be used to build a strong corporate image.
Above and beyond, corporate identity refers the ideal self-image of a service firm where the
ideal self-image explains how customers recognize the service firm in their mind (Worcester,
1986). In view of the above, this study sought a relationship between service quality and final
International Journal of Economics, Commerce and Management, United Kingdom
Licensed under Creative Common Page 525
service delivery by the country’s justice service system unlike in the above case where a
corporate is a supplier of good.
Auka et al (2013) conducted a study in the banking industry on perceived service quality
and customer loyalty in retail banking in Kenya. Cronbach’s coefficient alpha test of reliability
and internal consistency the quality of the questionnaire returned results of 0.918 which was
higher than the recommended 0.7 threshold. The questionnaire on the five dimensions of
service delivery: tangibility, reliability, responsiveness, assurance and empathy were
administered on a sample of 384 current customers of commercial banks. The results of
Pearson’s Correlation; Multiple regression and regression coefficients analyses indicated that
the five dimensions of service quality have a positive and significant influence on customer
loyalty in retail banking. The results also revealed that customers are satisfied with the services
provided by banks and are confident that banks will fulfil the promised terms and conditions.
Another survey on the banking industry was conducted by Makori and Mwirigi (2013)
who examined the determinants of corporate customers’ loyalty to corporate banking services in
commercial banks.The study adopted the descriptive survey research design and used stratified
sampling to obtain a representative sample of 9 commercial banks from all the 43 commercial
banks in Mombasa. The research questionnaire on customer perceptions of the three
independent variables corporate banking services, corporate image, and relationship banking
were evaluated on a 7 point Likert scale. The reliability of the questionnaire items was
determined using the Cronbach alpha coefficient and pre-tested data on a sample of 10
corporate service respondents from 2 commercial banks that were not part of the actual study
sample yielded an inter-item reliability of Cronbach alpha coefficient of 0.929. One hundred and
two (102) corporate customers’ questionnaires out of the 120 that had been administered were
returned representing a response rate of 85%. Data analysis was conducted with the aid of the
Statistical Package for Social Scientists (SPSS) and the Pearson’s Product Moment Correlation
Coefficient (PPMC) was used to determine the relationships between the independent and
dependent variables of the study and the findings were presented in tables. The results evoked
by this survey indicated that there are positive correlations between customer loyalty, high
quality products and service on one hand and improved customer satisfaction on the other
hand. The reliability level in the studies by Auka (2012), Auka et al., (2013) and Makori &
Mwirigi (2013) were determined using the Cronbach test and all had an alpha coefficient of over
0.9 which was higher than the recommended 0.7 threshold. This confirms that Cronbach test is
a reliable scale of internal consistency. The three aforementioned studies used Pearson’s
Correlation and Multiple regression and returned comparable results that there is a link between
service quality and customer satisfaction in creating customer loyalty in commercial banks. The
© Buluma, Cherere & Mwaura
Licensed under Creative Common Page 526
results support the position that Pearson’s Correlation and Multiple regression analyses are
consistent tools in determining customer satisfaction.
Regan (2009) posits that clients in any legal system always match their needs with a
particular type of service provider and lawyers should consider all aspects of a corporate client’s
complex matters through quality management systems. He emphasized that even the legal staff
may not be in a position to appreciate fully the implications of their client’s needs or be in a
position to advise how to modify them if they believe such conduct does not accord with broader
societal interests, or duties to the court. This indicated the importance of a measure that can be
used to rate one’s performance.
Major law firms are placed under increasing pressure to redefine their missions, roles
and their worth to both their corporate and non corporate clients. Services to corporate clients
which is different from non corporate has witnessed cases where law firms demand lower fee
rates in addition to offering value-added services and specialist expertise from firms, to ensure
that corporate demands for greater efficiencies are met (Hughes 2010).
Chang and Yeh (2002) suggested that one way to measure service quality is to define a
number of distinctive attributes to measure based on the expected and perceived services
separately and in such a way identify the service gaps’
Studies done in the airline industry found that the way to deliver superior service quality
is by understanding customer expectations which is a key for success and survival in very hectic
and competitive environment (Gilbert and Wong, 2003; Chen and Chang, 2005). On the other
hand a high level of service quality is vital if organizations if they are to acquire and retain loyal
customers through reexamination of its benchmarks (Chang & Yeh, 2002). One way to measure
service quality is to define a number of distinctive attributes where each is assigned service
quality value that must be attained or modified based on similar attributes found in those articles
(Chen and Chang, 2005; Chang and Yeh, 2002; Park et al., 2004 and Gilbert and Wong, 2003).
Empirical literature indicates that an effective performance appraisal system brings with
it benefits to the appraisee, the appraiser and the organization (Anderson, 1993; Fisher, 1995;
Corcoran, 2006). The appraisee is likely to have such benefits as a greater understanding of the
results expected of them, a precise and constructive feedback on past performance, greater
knowledge of strengths and weaknesses, the development of plans from which future
improvement on performance can be undertaken after building on strengths and minimizing as
far as possible weaknesses, opportunities to communicate upwards views and feelings about
the job and the utilization of the appraisee‟s skills in the job and increased motivation and job
satisfaction (Fisher, 1995; Corcoran, 2006).

International Journal of Economics, Commerce and Management, United Kingdom
Licensed under Creative Common Page 527
On the other hand organizations benefir from performance appraisal through better
communication, generally increased motivation of employees, greater harmonization of
objectives and enhancement of overall corporate performance (Corcoran, 2006).
Performance Appraisal system when properly used can explain the source of problems,
objectives and plans of the organization. According to Longenecker et al (1988), posit that when
employed well and effectively PA can be a communication instrument and a vehicle to boost
top-down relationship. Fisher (1995) suggested that organizations should conduct the PA twice
in a year or at least annually and if there is any more meetings are necessary should leave it to
the manager/ rater to decide based on the performance results.
Muturi and Mbiti (2015) studied the experience and impact of implementing the Quality
Management Systems of ISO 9001: 2008 Standard at the University of Nairobi, in relation to
effectiveness on service delivery, operational performance, automation, implementation
challenges and related emerging issues. Using a case study design approach based on
qualitative analysis (of internal audit reports, internal surveys and feedback and surveillance
audits conducted by the certifying body, and rankings by external bodies, over a period of seven
years) this study found successes in quality delivery at the university. Significant achievements
have been realized at the University of Nairobi with regard to institutionalization of quality into
the university processes, work environment, documentation and record management, customer
satisfaction, infrastructure and facilities, use of ICT as a prime mover of performance
improvement, and ranking of the university.
METHODOLOGY
The study used a descriptive design and covered customers served at Eldoret Law Court within
Uasin Gishu County in the Rift Valley part of Kenya. This court serves Uasin Gishu County and
parts of Kakamega, Trans Nzoia and Elgeyo/Marakwet Counties. The study focused on
accused persons who are in prison custody, remandees; advocates and parties who have
pending children cases. The population of this study is 1815 respondents who comprise of 775
convicts 460 remandees and 450 parties with pending children cases and 130 advocates
registered and practicing in Eldoret town for the last the five years. The above population was
selected because they were easily accessible and represented a large and growing number of
convicts in prisons. In addition, they have a good understanding of service quality dimensions
provided by the judiciary. Stratified random sampling was used to select 328 respondents
ensuring that the 4 categories of respondents were adequately sampled to facilitate comparison
among the groups using the Yamane method (Yamane, 1967). Data was collected at the point
of service delivery using an on-the-spot-administered questionnaire.
© Buluma, Cherere & Mwaura
Licensed under Creative Common Page 528
A one way ANOVA was used to simultaneously test the effect of each of the service quality
dimension (independent variables), and performance measures on the dependent variable
(customer satisfaction) so as to identify any interaction effect at both 95% and 99% level of
confidence.
A correlation analysis was used in this study to identify the degree of association
between service quality dimensions and customer satisfaction. To test if service quality
dimensions still predict customer satisfaction when moderating variables are in the model a
regression was run for a final model Y = β0 + β1X + β2Z + ε. Where: X represents the service
quality dimensions, Z represents the effects of the moderating variable and Y represent
customer satisfaction.
The study used the F test to establish if independent variables assisted in predicting the
dependent variable. ANOVA R-square was used to establish measures of the proportion of the
variation in the dependent variable that was explained by variations in the independent
variables. The results are presented in tables to show the relationship between service quality
dimensions and customer satisfaction.
ANALYSIS AND FINDINGS
Based on the results of the first objective, the study introduced performance benchmarks to
namely performance appraisals and quality management systems to modify and test the form or
strength of the relationship between service quality dimensions and a customer satisfaction.
The performance benchmarks were not part of a causal sequence but were used to qualify or
not to qualify the relation between service quality dimensions and the customer satisfaction. In
general, performance benchmarks and these were critical for understanding the generalizability
of a study finding in relation to service quality dimensions.
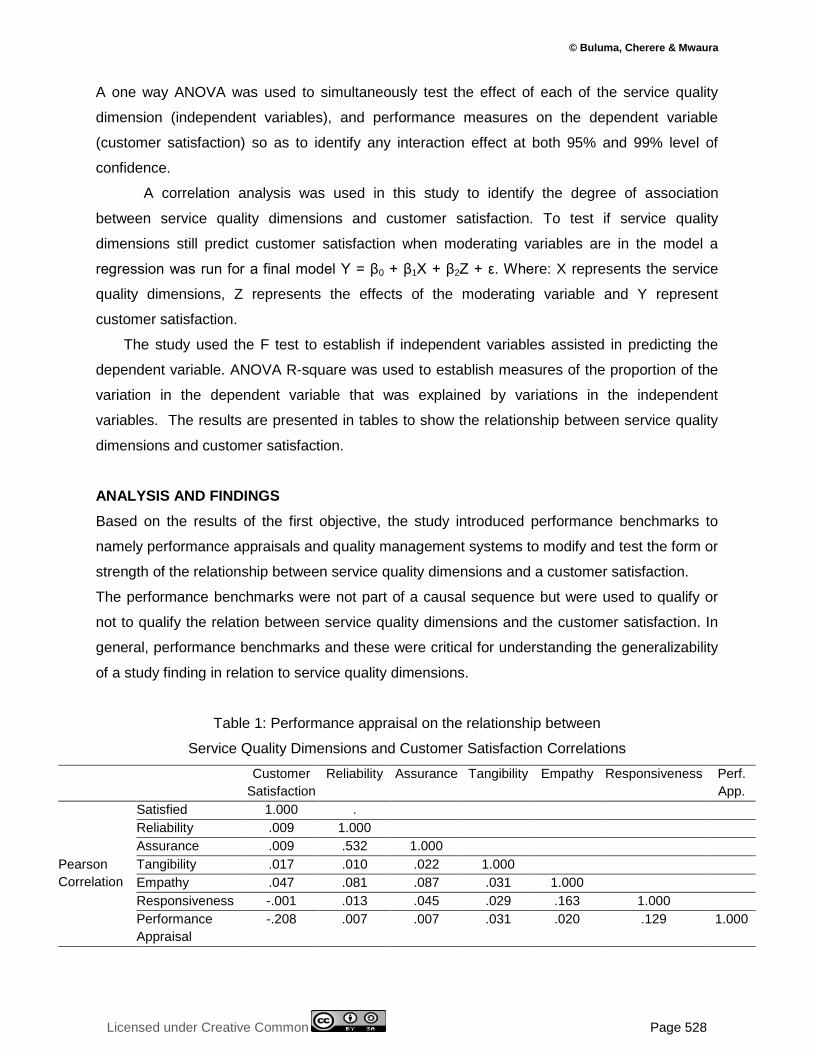
Table 1: Performance appraisal on the relationship between
Service Quality Dimensions and Customer Satisfaction Correlations
Customer
Satisfaction
Reliability Assurance Tangibility Empathy Responsiveness Perf.
App.
Pearson
Correlation
Satisfied 1.000 .
Reliability .009 1.000
Assurance .009 .532 1.000
Tangibility .017 .010 .022 1.000
Empathy .047 .081 .087 .031 1.000
Responsiveness -.001 .013 .045 .029 .163 1.000
Performance
Appraisal
-.208 .007 .007 .031 .020 .129 1.000
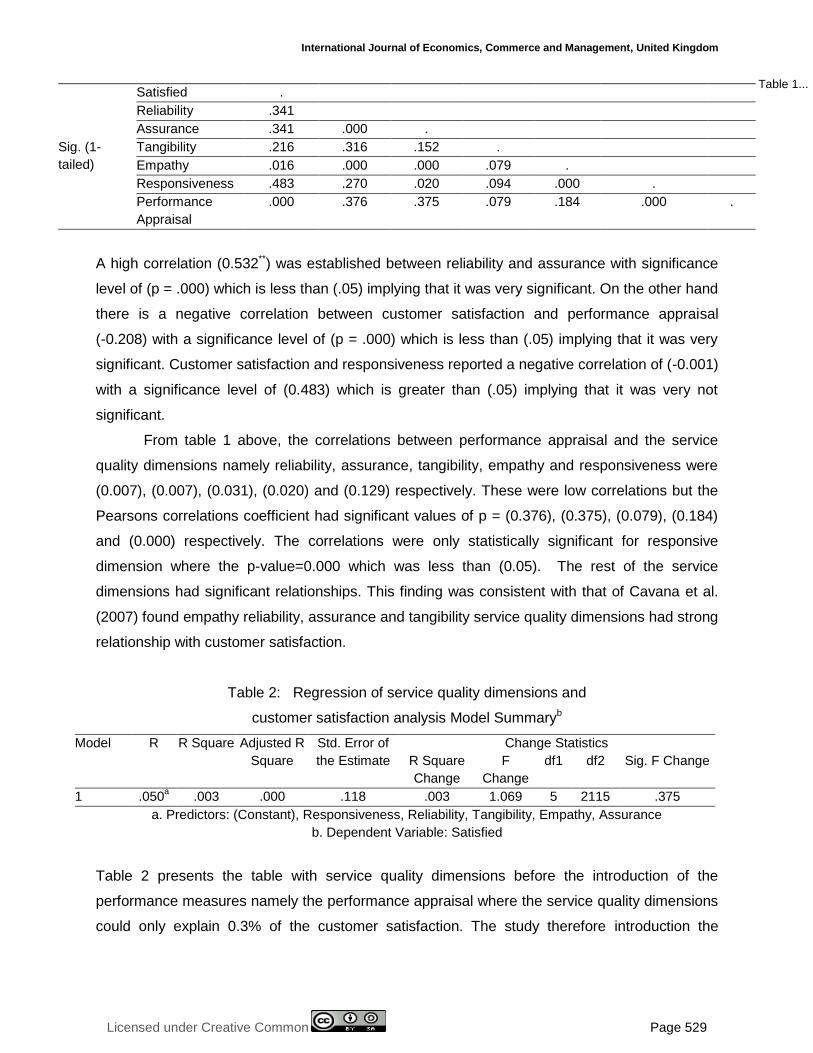
International Journal of Economics, Commerce and Management, United Kingdom
Licensed under Creative Common Page 529
Sig. (1-
tailed)
Satisfied .
Reliability .341
Assurance .341 .000 .
Tangibility .216 .316 .152 .
Empathy .016 .000 .000 .079 .
Responsiveness .483 .270 .020 .094 .000 .
Performance
Appraisal
.000 .376 .375 .079 .184 .000 .
A high correlation (0.532**) was established between reliability and assurance with significance
level of (p = .000) which is less than (.05) implying that it was very significant. On the other hand
there is a negative correlation between customer satisfaction and performance appraisal
(-0.208) with a significance level of (p = .000) which is less than (.05) implying that it was very
significant. Customer satisfaction and responsiveness reported a negative correlation of (-0.001)
with a significance level of (0.483) which is greater than (.05) implying that it was very not
significant.
From table 1 above, the correlations between performance appraisal and the service
quality dimensions namely reliability, assurance, tangibility, empathy and responsiveness were
(0.007), (0.007), (0.031), (0.020) and (0.129) respectively. These were low correlations but the
Pearsons correlations coefficient had significant values of p = (0.376), (0.375), (0.079), (0.184)
and (0.000) respectively. The correlations were only statistically significant for responsive
dimension where the p-value=0.000 which was less than (0.05). The rest of the service
dimensions had significant relationships. This finding was consistent with that of Cavana et al.
(2007) found empathy reliability, assurance and tangibility service quality dimensions had strong
relationship with customer satisfaction.
Table 2: Regression of service quality dimensions and
customer satisfaction analysis Model Summaryb
Model R R Square Adjusted R
Square
Std. Error of
the Estimate
Change Statistics
R Square
Change
F
Change
df1 df2 Sig. F Change
1 .050a .003 .000 .118 .003 1.069 5 2115 .375
a. Predictors: (Constant), Responsiveness, Reliability, Tangibility, Empathy, Assurance
b. Dependent Variable: Satisfied
Table 2 presents the table with service quality dimensions before the introduction of the
performance measures namely the performance appraisal where the service quality dimensions
could only explain 0.3% of the customer satisfaction. The study therefore introduction the
Table 1...
© Buluma, Cherere & Mwaura
Licensed under Creative Common Page 530
performance appraisal variable of performance measurement and a new regression model was
run.
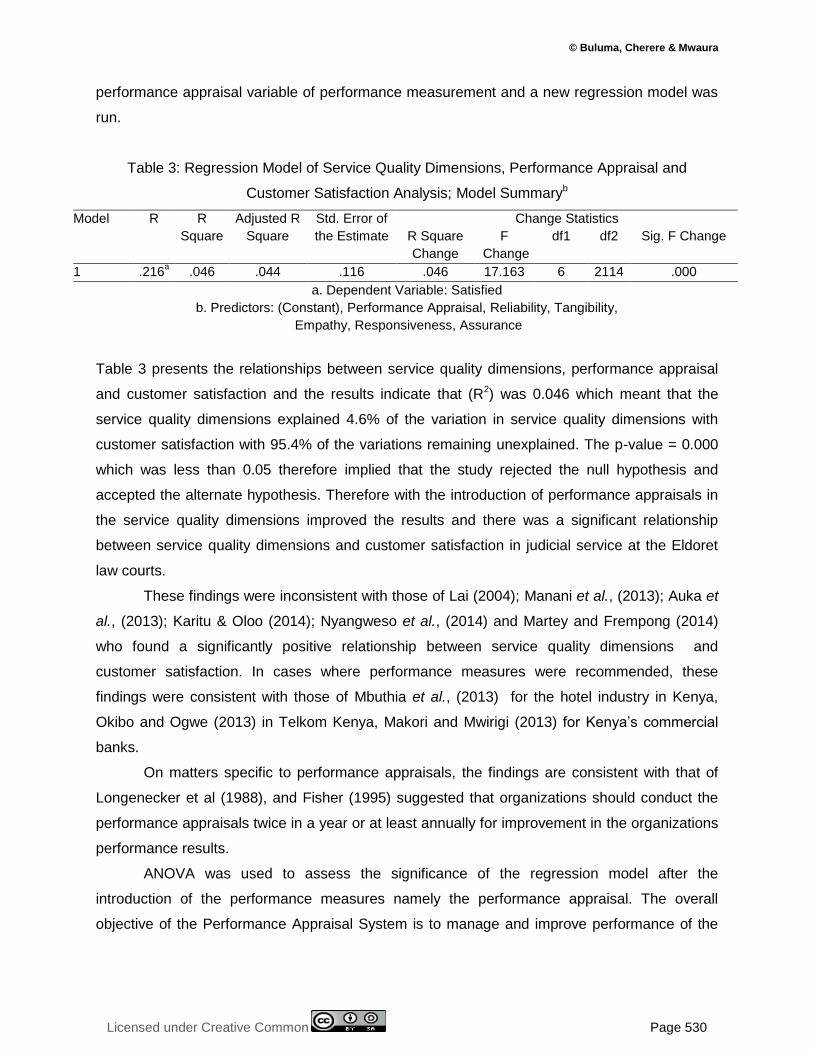
Table 3: Regression Model of Service Quality Dimensions, Performance Appraisal and
Customer Satisfaction Analysis; Model Summaryb
Model R R
Square
Adjusted R
Square
Std. Error of
the Estimate
Change Statistics
R Square
Change
F
Change
df1 df2 Sig. F Change
1 .216a .046 .044 .116 .046 17.163 6 2114 .000
a. Dependent Variable: Satisfied
b. Predictors: (Constant), Performance Appraisal, Reliability, Tangibility,
Empathy, Responsiveness, Assurance
Table 3 presents the relationships between service quality dimensions, performance appraisal
and customer satisfaction and the results indicate that (R2) was 0.046 which meant that the
service quality dimensions explained 4.6% of the variation in service quality dimensions with
customer satisfaction with 95.4% of the variations remaining unexplained. The p-value = 0.000
which was less than 0.05 therefore implied that the study rejected the null hypothesis and
accepted the alternate hypothesis. Therefore with the introduction of performance appraisals in
the service quality dimensions improved the results and there was a significant relationship
between service quality dimensions and customer satisfaction in judicial service at the Eldoret
law courts.
These findings were inconsistent with those of Lai (2004); Manani et al., (2013); Auka et
al., (2013); Karitu & Oloo (2014); Nyangweso et al., (2014) and Martey and Frempong (2014)
who found a significantly positive relationship between service quality dimensions and
customer satisfaction. In cases where performance measures were recommended, these
findings were consistent with those of Mbuthia et al., (2013) for the hotel industry in Kenya,
Okibo and Ogwe (2013) in Telkom Kenya, Makori and Mwirigi (2013) for Kenya’s commercial
banks.
On matters specific to performance appraisals, the findings are consistent with that of
Longenecker et al (1988), and Fisher (1995) suggested that organizations should conduct the
performance appraisals twice in a year or at least annually for improvement in the organizations
performance results.
ANOVA was used to assess the significance of the regression model after the
introduction of the performance measures namely the performance appraisal. The overall
objective of the Performance Appraisal System is to manage and improve performance of the

International Journal of Economics, Commerce and Management, United Kingdom
Licensed under Creative Common Page 531
Public Service by enabling a higher level of staff participation and involvement in planning,
delivery and evaluation of work performance
Table 4: ANOVAa Service Quality Dimensions, performance appraisal
and Customer Satisfaction
Model Sum of Squares df Mean Square F Sig.
1
Regression 1.376 6 .229 17.163 .000b
Residual 28.242 2114 .013
Total 29.618 2120
a. Dependent Variable: Satisfied
b. Predictors: (Constant), Performance Appraisal, Reliability, Tangibility,
Empathy, Responsiveness, Assurance
ANOVA was used to assess the significance of the regression model when performance
appraisal was introduced. In model 1 in table 4 (F = 17.163, p = .000). This implies that the
independent variables (service quality dimensions) of reliability, responsiveness, assurance,
tangibility, empathy, and moderating effects of performance appraisal had an effect on customer
satisfaction. Performance appraisal improved the results and significantly in explained customer
satisfaction as measured by the service quality dimensions. The study failed to reject the null
hypothesis and accepted the alternative hypothesis. It can therefore be concluded that there are
significant relationships between service quality dimensions, performance appraisal and
customer satisfaction at Eldoret Law Courts. These findings were consistent with those of Lai
(2004); Manani et al., (2013); Auka et al., (2013); Karitu & Oloo (2014); Nyangweso et al.,
(2014) and Martey and Frempong (2014), Mbuthia et al., (2013) for the hotel industry in Kenya,
Okibo and Ogwe (2013) in Telkom Kenya, Makori and Mwirigi (2013) for Kenya’s commercial
banks who found a significantly positive relationship between service quality dimensions and
customer satisfaction. These results are also consistent with the findings of Longenecker et al
(1988), and Fisher (1995) suggested that organizations should conduct the performance
appraisals twice in a year or at least annually for improvement in the organizations performance
results.
The study tested the Quality Management Systems Because in an organization in any
line of business requires a quality management program or some sort of quality program that is
instituted from executive management down to the lowest level employee.

© Buluma, Cherere & Mwaura
Licensed under Creative Common Page 532
Table 5: Quality management systems on the relationship between Service Quality Dimensions
and Customer Satisfaction Correlations
Satisfied Reliability Assurance Tangibility Empathy Responsiveness QMS
Pearson
Correlation
Satisfied 1.000
Reliability .009 1.000
Assurance .009 .532 1.000
Tangibility .017 .010 .022 1.000
Empathy .047 .081 .087 .031 1.000
Responsiveness -.001 .013 .045 .029 .163 1.000
QMS -.206 .009 .009 .031 .017 .126 1.000
Sig. (1-tailed)
Satisfied .
Reliability .341 .
Assurance .341 .000 .
Tangibility .216 .316 .152 .
Empathy .016 .000 .000 .079 .
Responsiveness .483 .270 .020 .094 .000 . .
QMS .000 .341 .341 .074 .211 .000 .
When the quality management systems were introduced in the study, a high correlation (0.532)
was established between reliability and assurance with significance level of (p = .000) which is
less than (.05) implying that it was very significant. On the other hand there is a negative
correlation between customer satisfaction and performance appraisal (-0.206) with a
significance level of (p = .000) which is less than (.05) implying that it was very significant.
Customer satisfaction and responsiveness reported a negative correlation of (-0.001) with a
significance level of (0.483) which is greater than (.05) implying that it was very not significant.
The same negative correlation was also established between quality management systems and
customer satisfaction as a moderating variable.
From table 5 above, the correlations between performance appraisal and the service
quality dimensions namely reliability, assurance, tangibility, empathy and responsiveness were
(0.009), (0.009), (0.031), (0.017) and (0.126) respectively. These were low correlations but the
Pearson’s correlations coefficient had significant values of p = (0.341), (0.341), (0.074), (0.211)
and (0.000) respectively. The correlations were only statistically significant for responsive
dimension where the p-value=0.000 which was less than (0.05). The rest of the service
dimensions had significant relationships. This finding was consistent with that of Cavana et al.
(2007) found empathy reliability, assurance and tangibility service quality dimensions had strong
relationship with customer satisfaction.
International Journal of Economics, Commerce and Management, United Kingdom
Licensed under Creative Common Page 533
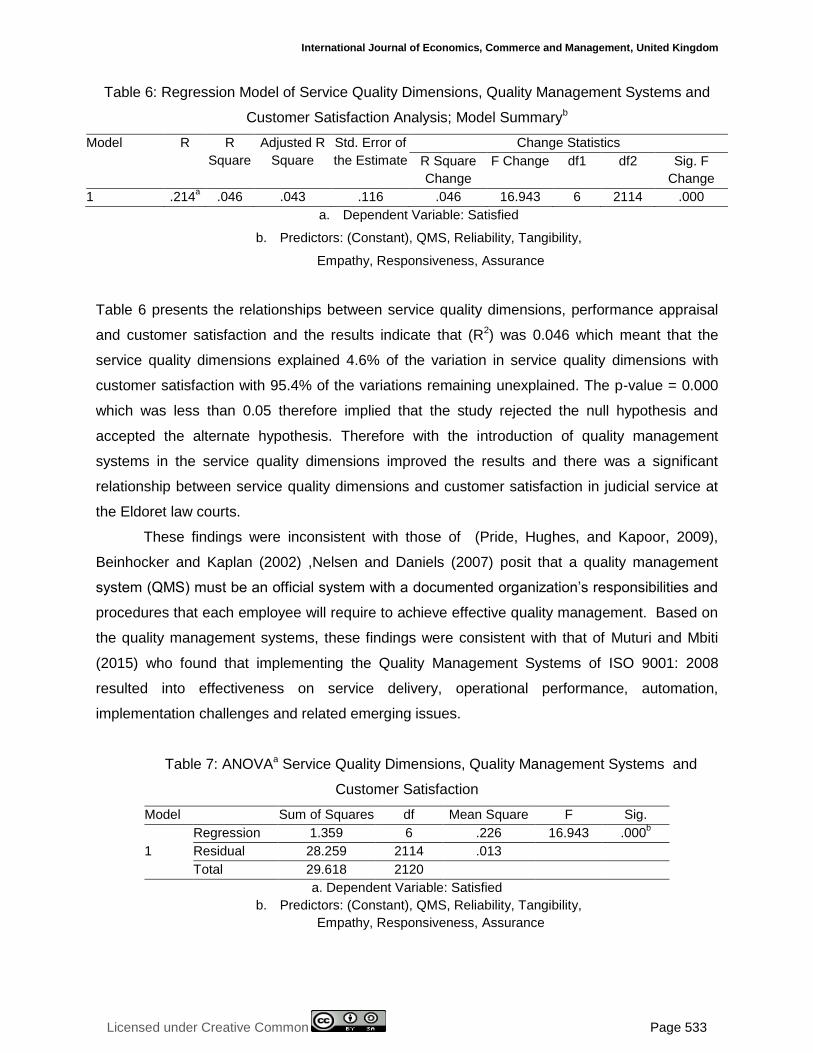
Table 6: Regression Model of Service Quality Dimensions, Quality Management Systems and
Customer Satisfaction Analysis; Model Summaryb
Model R R
Square
Adjusted R
Square
Std. Error of
the Estimate
Change Statistics
R Square
Change
F Change df1 df2 Sig. F
Change
1 .214a .046 .043 .116 .046 16.943 6 2114 .000
a. Dependent Variable: Satisfied
b. Predictors: (Constant), QMS, Reliability, Tangibility,
Empathy, Responsiveness, Assurance
Table 6 presents the relationships between service quality dimensions, performance appraisal
and customer satisfaction and the results indicate that (R2) was 0.046 which meant that the
service quality dimensions explained 4.6% of the variation in service quality dimensions with
customer satisfaction with 95.4% of the variations remaining unexplained. The p-value = 0.000
which was less than 0.05 therefore implied that the study rejected the null hypothesis and
accepted the alternate hypothesis. Therefore with the introduction of quality management
systems in the service quality dimensions improved the results and there was a significant
relationship between service quality dimensions and customer satisfaction in judicial service at
the Eldoret law courts.
These findings were inconsistent with those of (Pride, Hughes, and Kapoor, 2009),
Beinhocker and Kaplan (2002) ,Nelsen and Daniels (2007) posit that a quality management
system (QMS) must be an official system with a documented organization’s responsibilities and
procedures that each employee will require to achieve effective quality management. Based on
the quality management systems, these findings were consistent with that of Muturi and Mbiti
(2015) who found that implementing the Quality Management Systems of ISO 9001: 2008
resulted into effectiveness on service delivery, operational performance, automation,
implementation challenges and related emerging issues.
Table 7: ANOVAa Service Quality Dimensions, Quality Management Systems and
Customer Satisfaction
Model Sum of Squares df Mean Square F Sig.
1
Regression 1.359 6 .226 16.943 .000b
Residual 28.259 2114 .013
Total 29.618 2120
a. Dependent Variable: Satisfied
b. Predictors: (Constant), QMS, Reliability, Tangibility,
Empathy, Responsiveness, Assurance

© Buluma, Cherere & Mwaura
Licensed under Creative Common Page 534
ANOVA was used to assess the significance of the regression model when quality management
systems were introduced. In model 1 in table 7 (F = 16.943, p = .000). This implies that the
independent variables (service quality dimensions) of reliability, responsiveness, assurance,
tangibility, empathy, and moderating effects of quality management systems had an effect on
customer satisfaction. Performance appraisal improved the results and significantly in explained
customer satisfaction as measured by the service quality dimensions. The study failed to reject
the null hypothesis and accepted the alternative hypothesis. It can therefore be concluded that
there are significant relationships between service quality dimensions, quality management
systems and customer satisfaction at Eldoret Law Courts. These findings were consistent with
those of Lai (2004); Manani et al., (2013); Auka et al., (2013); Karitu & Oloo (2014); Nyangweso
et al., (2014) and Martey and Frempong (2014), Mbuthia et al., (2013) for the hotel industry in
Kenya, Okibo and Ogwe (2013) in Telkom Kenya, Makori and Mwirigi (2013) for Kenya’s
commercial banks who found a significantly positive relationship between service quality
dimensions and customer satisfaction. These results are also consistent with the findings of
Longenecker et al (1988), and Fisher (1995) suggested that organizations should conduct the
performance appraisals twice in a year or at least annually for improvement in the organizations
performance results. The findings are also consistent with that of Muturi and Mbiti (2015) who
found that implementing the Quality Management Systems of ISO 9001: 2008 Standard at the
University of Nairobi, improved service delivery, operational performance, automation,
implementation challenges and related emerging issues at the university.
SUMMARY OF FINDINGS
The performance benchmarks were not part of a causal sequence but were used to qualify or
not to qualify the relation between service quality dimensions and the customer satisfaction. In
general, performance benchmarks and these were critical for understanding the generalizability
of a study finding in relation to service quality dimensions
The study established that before the introduction of the performance benchmarks
namely the performance appraisal and quality management systems, the service quality
dimensions and customer satisfaction model provided the service quality dimension was able to
explain 0.3% of the variation in customer satisfaction with 99.7% remained unexplained.
However, with the introduction of performance appraisal the results improved to (R2) was 0.046
which meant that the service quality dimensions was now able to explain 4.6% of the variation in
service quality dimensions with customer satisfaction with 95.4% only unexplained. The p-value
= 0.000 which was less than 0.05 therefore the study rejected the null hypothesis and accepted
the alternate hypothesis. There was a significant relationship between service quality
International Journal of Economics, Commerce and Management, United Kingdom
Licensed under Creative Common Page 535
dimensions, performance appraisals and customer satisfaction in judicial service at the Eldoret
law courts.
When another moderating variable namely the quality management system was
introduced into the model, (R2) remained 0.046 which meant that the model explained 4.6% of
the variation in service quality dimensions with customer satisfaction with 95.4% of the
variations remaining unexplained. The p-value = 0.000 which was less than 0.05. These results
therefore rejected the null hypothesis and accepted the alternate hypothesis that there is a
significant relationship between service quality dimensions, quality management systems and
customer satisfaction in judicial service at the Eldoret law courts.
The above findings show that that Judiciary needs to enhance its tools of performance
measurement with the aim of streamlining internal processes and systems and improving
efficiency and effectiveness. This will enable the Eldoret Law court to reduce customer
complaints, meet stipulated timelines and promoting quality service.
CONCLUSION
The study assessed the moderating effects of performance measures (i.e. performance
appraisal and quality service systems) on quality of service dimensions and customer
satisfaction at Eldoret law courts. Generally, the responses to service quality dimensions as
moderated by performance measures improved performance of the court services at Eldoret law
courts. It can be concluded from the analysis that customers’ satisfaction can be improved and
complaints can be reduced significantly.
RECOMMENDATIONS
This study recommended that Eldoret law courts.should identify areas of customer
dissatisfaction and improve such area by continuous implementation of performance appraisals
and quality management systems. This will enable the Eldoret law courts to align their
practice(s) with the judicial reforms as determined by the Judicial Service and the court
administration to improve performance in addressing subjectivities in the system
This study had some limitations in that only one court that is Eldoret Law Courts was the
only court studied; secondly most of the respondents did not understand the role of performance
measures such as performance appraisal and quality management systems. Lastly, the litigants
with pending criminal cases and were either out on bond or had pending civil cases were
important respondents for this study but were not studied and their satisfaction level could not
be assessed.
© Buluma, Cherere & Mwaura
Licensed under Creative Common Page 536
REFERENCES
Agyei, P. M., & Kilika, J. M. (2013). The Relationship between Service Quality and Customer Loyalty in the Kenyan Mobile Telecommunication Service Industry. Euroean Journal of Business and Management, 5(23), 26–37.
Anderson RE. (1973). Consumer dissatisfaction: the effect of disconfirmed expectancy on perceived product performance. Journal of Marketing Research, 10(frebuary), 38–44.
Armstrong, M. (2006) Performance management, key strategies and practical guidelines. 3rd edition. Great Britain: Kogan Page Limited
Asubonteng, P., Mccleary, K. J., & Swan, J. E. (1996). SERVQUAL revisited : a critical review of service quality. The Journal of Services Marketing, 10(6), 62–81. http://doi.org/10.1108/08876049610148602
Auka, D. O. (2012). Service quality , satisfaction , perceived value and loyalty among customers in commercial banking in Nakuru Municipality , Kenya. African Journal of Marketing Management, 4(5), 185–203. http://doi.org/10.5897/AJMM12.033
Auka, D. O., Bosire, J. N., & Matern, V. (2013). Perceived Service Quality and Customer Loyalty in Retail Banking in Kenya. British Journal of Marketing Studies, 1(3), 32–61.
Bateson E.G. John (1977), "Do We Need Service Marketing?", in Marketing Consumer Services: New Insights , Marketing Science Institute, December, 77-115
Baumann C, Burton S, Elliott G, Kehr HM (2006). Prediction of attitude and behavioral intentions in retail banking. Inter. J. Bank. Mark., 25(2): 102-116.
Beinhocker, E. & Kaplan S. (2002). Tired of Strategic Planning? Many Companies Get Little Value from Their Annual Strategic-Planning Process. It Should Be Redesigned to Support Real-Time Strategy Making and to Encourage 'Creative Accidents'. The McKinsey Quarterly (2002): 49+.
Berry, L L, (1980) Services Marketing is Different,‖ Business, 30, 24 - 29
Booms, B.H & M.J. Bitner, (1981). Marketing Strategies and Organization Structure for Service
firms. In; marketing of services, Donnely, J.H and W.R. George (Eds). American Marketing Association, Chicago, IL, 47-51
Buttle, F. (1996). SERVQUAL : review , critique , research agenda. European Journal of Marketing, 30(1), 8–32.
Cavana RY, Corbett LM, Lo YL (2007). Developing zones of tolerance for managing passenger rail services quality. Inter. J. Qual. Reliability. Manage., 24(1): 7-31.
Chang, Y-H. & Yeh, C-H. (2002) A Survey analysis of service quality for domestic airlines, European Journal of Operational Research, 193, 166-177
Chen, Fang-Yuan & Chang, Yu-Hern (2005) Examining airline service quality from a process perspective, Journal of Air Transport Management, 11, 79-87
Crosby, P.B. (1979). Quality is Free: The Art of Making Quality Certain. McGraw Hill Custom Publishing, New York.
Corcoran, C (2006) Performance management: conducting appraisals. Accountancy Ireland; Dec, Vol. 38, Iss. 6, pp. 42-45.
Cronbach, L. J. (1951). Coefficient alpha and the internal structure of tests. Psychometrika, 16(3), 297–334.
Cronin Jr. JJ, Taylor SA (1992), Measuring service quality: A reexamination and extension. J. Mark., 56, 55–68.
Dawes, G. S., Fox, H. E., Leduc, B. M., Liggins, G. C., & Richards, R. T. (1972). Respiratory movements and rapid eye movement sleep in the foetal lamb. The Journal of Physiology, 220(1), 119–43. http://doi.org/10.1113/jphysiol.1972.sp009698
International Journal of Economics, Commerce and Management, United Kingdom
Licensed under Creative Common Page 537
Fisher, M. (1995) Performance appraisals. London: Kogan Page Limited
Garvin, D A (1983). “Quality on the Line,” Harvard Business Review, 61(September-October), 65-73.
Gilbert, D. & Wong, R.K.C (2003) Passenger expectations and airline services: a Hong Kong based study, Tourism Management, 24, 519-532
High Court at Nairobi (Nairobi Law Courts) Petition 93 of 2011 Paul Pkiach Anupa & Another Versus Attorney General & Another (2012). Nairobi.
Hofstee, E. (2006). Constructing a Good DissertationA Practical Guide to Finishing a Master ’ s , MBA or PhD on Schedule. Retrieved May 30, 2015, from http://www.amazon.com/Constructing-Good-Dissertation-Practical-Finishing/dp/0958500711
Hovland, C., Harvey, O., Sherif, M. (1957). Assimilation and contrast effects in reaction to communication and attitude change . Journal of Abnormal and Social Psychology, 55.
Kaplan, Robert S., and David P. Norton. 1996. The Balanced Scorecard. Boston, Mass.: Harvard Business School Press
Karitu, & Oloo. (2014). Customers ’ perceptions and expectations of service quality in hotels in western tourism circuit , Kenya. Journal of Research in Hospitality, Tourism and Culture, 2(1), 1–12. http://doi.org/DOI: http:/dx.doi.org/10.14303/jrhtc.2013.100
Kurgat, L. K., & Ombui, K. (2013). Factors Affecting Service Delivery in the Judicial System in Kenya : A Case of Makadara Law courts. International Journal of Scientific and Research, 2(10), 78–81.
Lai, T. L. (2004). Service Quality and Perceived Value's Impact on Satisfaction, Intention and Usage of Short Message Service (SMS). Information Systems Frontiers: Special Issue: Industrial Information Systems Frontiers, 6(4), 353-368.
Lehtinen, J. R., & Lehtinen, U. (1982). Service quality: a study of quality dimensions. unpublished Working Paper, Service Management Institute, Helsinki
Longenecker, C, O., Liverpool, P, R and Wilson, K, Y. (1988) An assessment of manager/subordinate perceptions of performance appraisal effectiveness. Journal of Business and Psychology. Vol. 2, Iss.4, pp. 311-322
Lovelock, C. H. (1981), Why Marketing Management Needs To Be Different for Services,‖ in Marketing of Services, J.H. Donnelley and W.R. George, eds., Chicago: American Marketing, pp. 5
Makori, W. M., & Mwirigi, F. M. (2013). The Relationship Between Corporate Clients ’ Satisfaction in Corporate Banking Services and their Loyalty to the Bank: A Study of Commercial. International Journal of Management Research and Business Strategy, 2(4).
Malhan, P. (2014). An Empirical Study of Customers Expectations and Perceptions of Service Quality ; A Case Study of Uchumi Megastores in Kenya. International Journal of Management and International Business Studies, 4(3), 275–284.
Manani, T. O., Nyaoga, R. B., Bosire, R. M., Ombati, T. O., & Kongere, T. O. (2013). Service Quality and Customer Satisfaction at Kenya Airways Ltd. Euroean Journal of Business and Management, 5(22), 170–180.
Mark Hughes. (2010). Managing change: a critical perspective. London: Chartered Institute of Personnel and Development.
Martey, E. M., & Frempong, J. (2014). The impact of perceived service quality dimensions on customer satisfaction in the airline industry in Ghana. Internaational Journal of Research, 1(10), 359–374.
Mbuthia, S., Muthoni, C., & Muchina, S. (2013). Hotel Service Quality: Perceptions and Satisfaction Among Domestic Guests in Kenya. Arabian Journal of Business and Management Review, 2(8), 22–34.
Moturi, C., & Mbithi, P. (2015) "ISO 9001: 2008 implementation and impact on the University of Nairobi: a case study", The TQM Journal, 27 (6), 752 - 760
Mugenda, O. M. and Mugenda, A. G., & Mugenda A. G., O. M. and M. (1999). Research Methods: Quantitative and Qualitative Approaches. Nairobi: Acts Press.

© Buluma, Cherere & Mwaura
Licensed under Creative Common Page 538
Mutunga, D. W. (2011). Progress report on the transformation of the Judiciary: The first hundred and twenty days. Retrieved March 20, 2015, from www.judiciary.go.ke
National Council for Law Reporting. (2016).
Nelsen D. & Daniels S.E. (2007). Quality glossary. Quality Progress 40:6 Milwaukee.
Nyangweso, Omari, & Agata. (2014). Attributes That Influence Customer Satisfaction with Service Quality at Kenya Power Company. International Journal of Innovative Research and Development, 3(4), 239–247.
Nyeck, S., Morales, M., Ladhari, R., & Pons, F. (2002). Measuring customer satisfaction with SERVQUAL for quality service, (1989).
Obong’o, S. (2009): Implementation of Performance Contracting in Kenya, International, Public Management Review, Vol. 10, issue 2.
Obulemire, King’ori, & Ondiek. (2014). Applicability of Servqual / Rater model in assessment of service quality among local authorities in Kenya. International Journal of Economics, Commerce and Management, II(12), 1–16.
Okibo, B. W., & Ogwe, S. L. (2013). An Assessment Of Factors Affecting Quality Customer Care Services In Telkom Kenya . International Journal of Scientific & Technology Research, 2(10), 103–110.
Owino, E., Kibera, P. F., Munyoki, J., & Wainaina, P. G. (2014). Service Quality in Kenyan Universities : Dimensionality and Contextual Analysis. European Journal of Business and Management, 6(11), 180–195.
Parasuraman, A., Zeithaml, V. A., & Berry, L. L. (1985). A conceptual model of service quality and its implications for future research. The Journal of Marketing, 49 (4), 41-50.
Parasuraman, Zeithaml, & Berry. (1988). SERVQUAL- A Multiple-Item Scale for Measuring Consumer Perceptions of Service Quality. Journal of Retailing, 64(1), 12–40.
Park, J-W., Robertson, R., Wu, C-L. (2004) The effect of airline service quality on passengers behavioral intentions: a Korean case study, Journal of Air Transport Management, vol. 10, pp.435-439
Poister, T. H. (2003). Measuring Performance in Public and Nonprofit Organizations. San Francisco, Calif.: Jossey-Bass.
Pride William, M., Hughes Robert, J., & Kapoor Jack, R. (2009). Business, 10th edition: Cengage Learning. 181
Rees, W, D and Porter, C. (2004) Appraisal pitfalls and the training implications - part 2. Industrial and Commercial Training. 36, (1),280-284.
Regan, M. C. (2009). Lawyers, Symbols, and Money: Outside Investment in Law Firms. Penn State International Law Review (Vol. 27).
Satır, C. (2006). The nature of corporate reputation and the measurement of reputation components an empirical study within a hospital. Corporate Communications: An International Journal, 11(1), 56-63.http://dx.doi.org/10.1108/13563280610643552
Sherif, Muzafer, & Hovland, C. I. (1961). Social Judgment: Assimilation and Contrast Effects in Communication and Attitude Change. New Haven, CT: Yale University Press. http://doi.org/10.4135/9781412959384.n349
Shostack G. Lynn (1977), "Breaking Free from Product Marketing", Journal of Marketing, April, 41, 73-80.
State of the Judiciary Report 2012/2013. (2012). Nairobi.
Stouffer, S. A., Suchman, E. A., DeVinney, L. C., Star, S. A., & Williams, R. M. (1949). The American soldier: Adjustment during Army life. (Princeton, Ed.) (Vol. 1). New Jersey: University Press.
Struwig, F. W., & Stead, G. B. (2010). Planning, designing and reporting research. Cape Town: Pearson Education South Africa.

International Journal of Economics, Commerce and Management, United Kingdom
Licensed under Creative Common Page 539
Wanjau, K. N., Muiruri, B. W., & Ayodo, E. (2012). Factors Affecting Provision of Service Quality in the Public Health Sector : A Case of Kenyatta National Hospital. International Journal of Humanities and Social Science, 2(13), 114–125.
Worcester, R. M. (1986). Corporate Image Research. Consumer Research Handbook (3rd ed.). London: McGraw Hill.
Yalçın, Azmi, “Farklı Performans Değerleme Sistemlerine İlişkin İşgören Tercihlerinin Belirlenmesi Üzerine Bir Araştırma”, Çukurova Üniversitesi Sosyal Bilimler Enstitüsü Dergisi, 2002, Cilt: 9, Sayı: 9, 3 - 17
Zeithaml, A., Berry, V. L., & Parasuraman, A. (2006). Delivering Quality Service.
Zeithaml, V. A., Parasuraman, A., & Berry, L. L. (1985). Problems and strategies in services marketing. Journal of Marketing, 49(2), 33-46. http://dx.doi.org/10.2307/1251563
Related Documents