THE EFFECT OF PALATE MORPHOLOGY ON CONSONANT ARTICULATION IN HEALTHY SPEAKERS by KRISTA RUDY A thesis submitted in conformity with the requirements for the degree of M.Sc. Graduate Department of Speech-Language Pathology University of Toronto © by Krista Rudy (2011)

Welcome message from author
This document is posted to help you gain knowledge. Please leave a comment to let me know what you think about it! Share it to your friends and learn new things together.
Transcript

THE EFFECT OF PALATE MORPHOLOGY ON CONSONANT ARTICULATION IN
HEALTHY SPEAKERS
by
KRISTA RUDY
A thesis submitted in conformity with the requirements for the degree of M.Sc.
Graduate Department of Speech-Language Pathology
University of Toronto
© by Krista Rudy (2011)

ii
ABSTRACT
The Effect of Palate Morphology on Consonant Articulation in Healthy Speakers
Krista Rudy
Masters of Science, 2011
Department of Speech-Language Pathology
University of Toronto
This study investigated the effect of palate morphology and anthropometric measures of
the head and face on lingual consonant target (positional) variability of twenty one adult speakers
(eleven male, ten female). An electromagnetic tracking system (WAVE, NDI, Canada) was used
to collect tongue movements while each speaker produced a series of VCV syllables containing a
combination of consonants /t, d, s, z, ʃ, tʃ, k, g, j/ and three corner vowel /i, ɑ, u/. Distributions of
x, y, and z coordinates representing maximum tongue elevation during the consonants were used
to represent target variability across contexts. Palate and anthropometric measures were
obtained for each participant. A correlational analysis showed that target variability of the
consonants produced in the front of the mouth (e.g. alveolar and palatal) was explained, to a
degree, by palate morphology. The variability of velar consonants was not explained by the
structural measures.

iii
“Develop a passion for learning. If you do, you will never cease to grow.”
Anthony J. D’angelo

iv
ACKNOWLEDGEMENTS
To my supervisor, Dr. Yana Yunusova: You have been an extremely influential and positive figure in my life over the last two years. Throughout this process, you have challenged me, inspired me to work hard, and provided me with the guidance and encouragement necessary to continue through times of adversity. Your mentorship has afforded me with lessons that will continue to influence my future academic, professional and personal life. For this, I am so thankful.
To the members of my supervisory committee, Dr.’s Pascal van Lieshout and John Daskalogiannakis: I sincerely thank you for your feedback, discussions, and thought-provoking questions, which challenged me to think about this research from different perspectives.
To my dearest friend, Adrienne Chan: You have always been one of my greatest supporters in all aspects of my life. I cannot thank you enough, nor find the words that would adequately convey how important your support has been to the completion of this project.
Finally, I would like to thank my parents, Robert and Deborah Rudy, and my brothers: I owe all of my achievements to you. Thank you for your unconditional love and support. Without your faith in me, and your determination to never give up on me, this would not have been possible, thank you so much.

v
TABLE OF CONTENTS
Abstract............................................................................................................................................ii
Acknowledgements.........................................................................................................................iv
Table of Contents.............................................................................................................................v
List of Tables.................................................................................................................................vii
List of Figures...............................................................................................................................viii
Introduction......................................................................................................................................1
Sources of Articulatory Variability......................................................................................2
The Hard Palate and Structures of the Head and Face….....................................................3
The Hard Palate as a Source of Articulatory Variability………………………………….5
Limitations of the Previous Research..................................................................................9
Questions and Hypotheses of the Present Study…............................................................11
Method...........................................................................................................................................12
Participants.........................................................................................................................12
Speech Sample...................................................................................................................13
Data Acquisition and Processing.......................................................................................14
Measurements....................................................................................................................15
Target Variability Measures..................................................................................17
Structural Measures: Palate Measures...................................................................18
Structural Measures: Anthropometric Measures...................................................20
Statistical Analysis.............................................................................................................23
Results............................................................................................................................................25
Structural Measures...........................................................................................................25
Anthropometric Measures......................................................................................25
Palate Measures.....................................................................................................29

vi
Correlations between Structural Measures........................................................................32
Target Variability Measures..............................................................................................33
Correlations between Structural Measures and Target Variability Measures...................35
Discussion......................................................................................................................................39
Structural Measures: Anthropometric and Palate Measures.............................................39
Target Variability Measures..............................................................................................42
Palate Measures and Target Variability.............................................................................45
Palate Measures and Spread...............................................................................................47
Anthropometric Measures and Target Variability.............................................................48
Conclusions........................................................................................................................49
Limitations.........................................................................................................................50
References......................................................................................................................................53

vii
LIST OF TABLES
Table 1 Participant demographics.......................................................................................13
Table 2 Reliability and precision of anthropometric measures...........................................23
Table 3 Descriptive statistics of anthropometric measures.................................................25
Table 4 Correlation matrix of anthropometric measures....................................................27
Table 5 Descriptive statistics of palate measures................................................................29
Table 6 Correlation matrix of palate measures...................................................................31
Table 7 Correlation matrix of structural measures..............................................................32
Table 8 Descriptive statistics of variability measures.........................................................34
Table 9 Correlation matrix of structural and tongue blade variability measures................35
Table 10 Correlation matrix of structural and tongue dorsum variability measures............36

viii
LIST OF FIGURES
Figure 1 Equipment set up....................................................................................................15
Figure 2 Kinematic and acoustic signal display...................................................................16
Figure 3 Positional data of lingual variability......................................................................18
Figure 4 Hard palate landmarks...........................................................................................19
Figure 5 Head and face landmarks.......................................................................................22
Figure 6 Box and whisker plots of anthropometric measures..............................................26
Figure 7 Anthropometric measures scatterplots...................................................................27
Figure 8 Scatterplot matrix of anthropometric measures.....................................................28
Figure 9 Box and whisker plots for palate measures............................................................30
Figure 10 Histogram of palate curvature variable..................................................................30
Figure 11 Scatterplot matrix of palate measures....................................................................31
Figure 12 Scatterplots of structural measures........................................................................33
Figure 13 Box and whisker plots of variability measures......................................................34
Figure 14 Scatterplots of palate curvature and variability measures......................................37
Figure 15 Scatterplots of palate and variability measures......................................................37
Figure 16 Barplot of 3D variability for speakers with flat and domed palates......................38

1
INTRODUCTION
Variability is a consistent feature of all motor behaviours. Motor variability provides
information about how the brain controls motor tasks. High variability might indicate that a
performed task is new to the learner (Muller & Sternad, 2004). As an individual becomes more
proficient with the motor task, variability seems to decrease and movement becomes more
consistent and stable (Fletcher, 1989; Handford, 2006; Newell, Deutsch, Sosnoff and Mayer-
Kress, 2006). Motor variability differs with age; children tend to have more variable motor
behaviours than adults (Cheng, Murdoch, Goozee and Scott, 2007; Riely & Smith, 2003). Motor
variability also conveys information about the integrity of the motor control system. For
example, motor dysfunction (e.g., in neurodegenerative diseases) is generally associated with
abnormal levels of motor variability (Anderson, Lowit and Howell, 2008; Cheng et al., 2007;
Kleinow, Smith and Ramig, 2001).
For many years, studies investigating motor control in speech production sought to
uncover invariant features in a speech signal (Fujimura, 1986). However, speech is inherently
variable. For example, articulator positions achieved for different sounds obtained using
kinematic approaches show notable variability across repetitions (Alfonso & Van Lieshout,
1997; Cheng et al., 2007; Dromey & Sanders, 2009; Kleinow et al., 2001; Perkell & Nelson,
1985).
A number of studies have investigated target (positional) variability in speech, yet not
enough is known about normal (expected) target variability during sound production (Van
Lieshout & Namasivayam, 2010). Among sound classes, motor variability during consonant
articulation is particularly understudied. For example, one of the influential models of speech

2
production, DIVA (Directions into Velocities of Articulators), models consonants as it does
vowels (Guenther, 1995); in fact, it can only effectively model a small number of consonants
consisting of mostly voiced stops. Understanding normal target variability in consonant
production is necessary to inform theories of speech motor control and to enable the
development and expansion of comprehensive speech production models which encompass
different sound classes. There are also important clinical implications for quantifying normal
consonant target variability. Normal ranges of consonant target variability may provide
clinicians with a reference with which to appropriately interpret instrumental assessment of
neurological speech disorder (Higgins, Carney and Schulte 1994; McAuliffe, Ward and
Murdoch, 2001). In addition, quantifying normal consonant target variability and identifying its
sources may provide valuable information that is applicable to the development of treatment
tools for speech therapy, focused on the use of visual information to train speech movements.
Sources of Articulatory Variability
There are a number of potential sources of articulatory variability in speech that have
been identified. These sources include neural noise (Latash, Scholz and Schoner, 2002; Manoel
& Connolly, 1995; Muller & Sternad, 2004), motor equivalence (Abbs & Gracco, 1984; Hughs
& Abbs, 1976; Lindblom, 1983; Perkell, Matthies, Svirsky and Jordan, 1993), the quantal nature
of the relationship between acoustics and kinematics (Perkell, 1997; Perkell & Nelson, 1985;
Stevens, 1980), as well as linguistic and prosodic factors (Gay, 1977; Gay, 1974; Guenther,
1995; Liberman & Mattingly, 1985; Lindblom, 1990; Perkell, Zandipour, Matthies and Lane,
2002). Anatomical differences between speakers have emerged as a source of articulatory

3
variability as well (Brunner, Fuchs and Perrier, 2005; 2009; Fitch & Giedd, 1999; Mooshammer,
Perrier, Fuchs, Geng and Pape, 2004; Perkell, 1997), in particular, palate morphology. In this
project, the effect of the hard palate on lingual target variability (a form of articulatory
variability) will be examined.
The Hard Palate and Structures of the Head and Face
The hard palate is an important structure in speech production. As the uppermost
boundary of the oral cavity, it is hypothesized that the hard palate passively influences tongue
kinematics (Bhagyalakshmi, Renukarya and Rajangam, 2007; Fuchs, Perrier, Geng and
Mooshammer, 2006; Stone, 1995). According to Stone (1995) the palate serves a variety of
important functions in speech production. These functions include providing a surface to assist
in precise positioning of the tongue during articulation and supplying tactile sensory feedback
about the position of the tongue along the palate within the vocal tract.
The integrity of the hard palate is crucial in the acquisition of spoken language and
healthy development of facial structures. Research indicates that children with Down syndrome
are often born with a very narrow and vaulted hard palate which has been said to contribute to
speech disorder in this population (Bhagyalakshmi et al., 2007; Hamilton, 1993). The hard
palate has been said to play a role in speech development of children with cleft palates. Delayed
surgical repair of the hard palate in individuals born with cleft palate often results in severely
impaired speech and optimal midfacial development (Cosman & Falk, 1980; Holland et al.,
2007; Lohmander-Agerskov, Dotevall, Lith and Soderpalm, 1996); whereas, early surgical repair
of the hard palate during infancy results in a more optimal speech outcome and abnormal

4
midfacial growth (Cosman & Falk, 1980). As a result, morphology of the palate and face may be
interrelated and both may be associated with speech production.
The size of the head and face seem to be related during development (Farkas, 1994;
Farkas, Katic, Hreczko, Deutsch, Munro, 1984). Several regions of the skull appear to influence
the growth of one another while trying to accommodate the growth of other areas both spatially
and functionally, including the face and oral cavity (Polat & Kaya, 2007). For example, the
lower facial height has been negatively associated with pharyngeal distance (Honda, Maeda,
Hashi, Dembrowski and Westbury, 1996). A variety of anthropometric measures of the head
have also been associated with palate length (Kasai, Moro, Kanazawa and Iwasawa, 1995; Polat
& Kaya, 2007), and dental arch width (Solow, 1966). However, research on the relationship
between head size and palate morphology is limited and often includes only a single measure of
the palate.
Documenting the normal relationship between head and face size and palate morphology
in healthy adults is important to better identify anatomical patterns or proportions, which could
be useful for restoration of a face to its previous appearance in areas such a reconstructive
surgery (Wuerpel, 1936). The mouth and face are highly interrelated, such that adjusting
positions of the teeth may affect the contours of the face (Stoner, 1955). In orthodontics, a better
understanding of proportions of the head and palate could influence treatment to correct
malocclusion or dentition. Moreover, the palate is a difficult structure to accurately measure
without having to make an impression or scan, due to its shape and location within the oral
cavity. Identifying the relationship between head and face size and palate measures could enable
a cost-effective and efficient method of inferring palate shape and size based on anthropometric
measures.
5
Palate morphology has been associated with healthy motor speech behaviour. In the view
that palate morphology and head size appear to be interrelated, anthropometric measures of the
head may also be related to speech motor behaviour. Few studies have investigated
anthropometric measures of the head and face and their association to speech motor behaviour.
A single study investigated the association between articulator size and measures of articulatory
velocity and displacement (Kuehn & Moll, 1976), and another examined anthropometric
measures of the head and face and their association to dynamic variability measures of the lower
lip in speech (Riely & Smith, 2003), however, none have investigated the association between
anthropometric measures of the head and face and target variability in lingual consonants.
The Hard Palate as a Source of Articulatory Variability
In one of the first studies to look at lingual articulation and its relationship to palate shape
in healthy speakers, Perkell (1979) investigated tongue adjustments in six speakers producing
vowels /i/ /ɪ/ and /ɛ/. He observed that the participant with the shallowest vault (flat palate)
appeared to have the smallest target variability of tongue position for the three vowels, while the
participant with the deepest vault (domed palate) had the largest target variability in tongue
position across multiple repetitions of the same vowel.
In a more recent study, Mooshammer et al. (2004) evaluated individual differences in
palate shape and token-to-token (repetition) target variability of the same vowel. Three German
speakers produced 14 German vowels (/i:, ɪ, y:, ʏ, e:, ɛ, ǿ:, œ, ɑ:, a, o:, ʊ, ɔ, u:/) in a carrier
phrase 10-11 times. Speech movements were recorded using electropalatography (EPG) and 2D
electromagnetic midsagittal articulography (EMMA). Individual characteristics of tongue-palate

6
contact (EPG) and target variability of the tongue (EMMA) were obtained. Palate shapes were
described for each speaker as either coronally high or flat. The authors found that the speaker
with the flattest palate exhibited the least amount of target variability. Two more studies looked
at the structure of the palate as it relates to articulatory variability (Brunner et al., 2005; 2009).
Results similar to the previous studies were observed (i.e., greater articulatory variability in
domed palates as compared to flat palates), and two different explanations for this phenomenon
were proposed.
The first explanation is the Biomechanical hypothesis, which suggests the degree of
target variability is a direct result of constraints imposed on speech movement by vocal tract
morphology. According to this hypothesis, speakers with flat palates are more likely to have
greater tongue-palate contact during articulation due to greater palate surface area available to
the tongue. This palate shape would provide increased structural support during articulation,
thus, reducing target variability. Earlier, Mooshammer et al. (2004) found that the degree of
tongue-palate contact obtained with EPG was negatively associated with target variability in
vowel production. The speaker in their sample with the flat palate displayed less target
variability and also exhibited greater tongue-palate contact.
To test the Biomechanical hypothesis, Brunner et al. (2005) investigated articulatory
variability, tongue-palate contact, and palate shape in 20 speakers of various linguistic
backgrounds. Articulatory variability and tongue-palate contact were recorded using EPG. Each
speaker produced a number of consonants and vowels (C = /s, ɕ, ј, ʃ/ and V = /i, e, u/) embedded
in carrier phrases 30 times. Articulatory variability was measured as the percent of contact
(POC), which was calculated as the number of electrodes in the EPG that were contacted by the
tongue for each EPG frame over production of the entire acoustically defined sound segment.

7
The resulting normalized mean value was used as a variability coefficient. POC provided
information about the amount of tongue-palate contact, but not about the location of the target.
Tongue-palate contact was measured using a lateral index (Li), which was calculated to illustrate
the percent of lateral linguo-palatal contact. It was hypothesized that greater lateral linguo-
palatal contact would provide more support to the tongue during articulation. Palate shape was
described using a measure of palate curvature (α). Brunner et al. (2005) found significant
negative correlations between articulatory variability (POC) and tongue-palate contact (Li) for
select vowels (/i, e, ɪ, ɛ/) and a consonant glide (/j/), whereby greater tongue-palate contact was
associated with less articulatory variability. However, a strong relationship was not reported
between tongue palate-contact (Li) and palate curvature (α), as would have been anticipated by
the Biomechanical hypothesis. Speakers with flat palates did not exhibit greater tongue-palate
contact during speech. A significant negative relationship between variability (POC) and palate
curvature (α) was found for only a vowel (/i/) and a consonant glide (/j/). However, POC is not a
measure of target variability.
The second explanation proposed to account for these findings is the Speaker-Oriented
Control hypothesis outlined by Brunner et al. (2005). This explanation is based on an
assumption that target variability is influenced by auditory feedback. The Speaker-Oriented
Control hypothesis proposes that palate shape influences the overall cross-sectional area of the
oral cavity, which in turn affects the sensitivity of speech acoustics to changes in articulator
positioning. In this view, speakers with domed palates exhibit greater target variability because
the acoustic output is less sensitive to changes in articulator positioning than it is for speakers
with flat palates. The Speaker-Oriented Control hypothesis was assessed using a 2D
biomechanical tongue model (Brunner et al., 2005), which simulated tongue movements during

8
articulation of three corner vowels (/a, i, u/) in five different palate shape conditions varying in
palate curvature (α). Tongue movements were varied identically for all five palates, and in each
condition, sounds were synthesized and formant values for F1 and F2 were obtained. Brunner et
al. (2005) found that in flat palate conditions, small changes in articulator position had a greater
effect on the cross-sectional area of the oral cavity than domed palates, and thus a greater effect
on the acoustic output. These findings were consistent with the Speaker-Oriented Control
hypothesis; however, it is unclear whether the same findings would be observed in real speech.
In a follow-up study, Brunner et al. (2009) investigated the relationship between palate
shape, articulatory variability, and acoustic variability in speakers using EPG, and found no
relationship between the target variability measure and palate curvature (α). In contrast to their
earlier study (Brunner et al., 2005), Brunner et al. (2009) employed a larger sample size (N=32)
of speakers from various linguistic backgrounds and reduced the target sounds to vowels (/i, e, ɛ,
ɪ/) and a consonant glide (/j/). Two measures of articulatory variability were added, as well as a
spectral analysis of the vowel formant frequencies.
Articulatory variability was measured in three ways: POC, number of contact (NOC), and
center of gravity (COG). In order to calculate NOC, the articulatory target was identified
acoustically. At this target, the row with the greatest number of electrodes contacted in the EPG
was used to calculate a coefficient of variation across repetitions of the sound. NOC provides
information about tongue height variation during articulation. Similarly, to calculate COG, the
articulatory target was acoustically identified, and the point of tongue-palate contact during a
single frame was recorded for each repetition and used to calculate a coefficient of variation.
The COG measure provided information about tongue location variation at the articulatory
target.

9
During vowel production, the acoustic output remained stable for speakers with domed
and flat palates despite differences in articulatory variability. Speakers with domed palates
exhibited greater articulatory variability than speakers with flat palates in the POC measure for
three vowels /ɪ, ɛ, e/ and a consonant glide /j/, but no significant correlations were found in any
other measure of articulatory variability (NOC or COG). COG and NOC would be considered
the most relevant to this study because they are considered measures of target variability. Thus,
the authors found no relationship between palate curvature (α) and their measures of target
variability (COG and NOC) of the tongue during articulation of these sounds.
It is important to note that the Biomechanical hypothesis and the Speaker-Oriented
Control hypothesis predict reduced target variability for speakers with flat palates as compared to
speakers with domed palates. As a result, interpretation of the findings with respect to either of
the hypotheses is challenging.
Limitations of the Previous Research
The existing studies remain inconclusive and contain a number of limitations, therefore,
the relationship between palate morphology and target variability remains unclear.
Sample sizes of the existing studies generally do not exceed six participants speaking the
same language and producing identical stimuli. The studies containing larger samples employ
speakers of various linguistic backgrounds. Varying linguistic backgrounds for this type of study
is problematic because target variability is influenced by phonetic inventories, phonotactic rules,
and phonetic context of different languages (Dromey & Sanders, 2009). Although controlling
for a speaker’s native language may be more crucial to the dynamic measures of speech

10
kinematics, there is not enough known about target variability in speech to understand how a
heterogeneous sample of speakers may affect target variability during consonant production.
The technology employed to measure articulatory variability in the existing studies may
interfere with normal speech kinematics and limit information collected about tongue movement.
Three of the studies used EPG to assess target variability. The 2mm thick EPG covers the entire
palate, which obstructs speech and impedes somatosensory feedback about tongue positioning to
the speaker. Due to the nature of the EPG technology, it only provides information about tongue
positioning at certain points on the palate (Fitzpatrick & Chasaide, 2002). The electrodes
embedded in the EPG are spaced a few millimetres apart resulting in limited spatial resolution.
Also, the EPG does not provide information about the portion of the tongue involved in
articulation, nor does it extend to the soft-palate, preventing collection of information about
tongue dorsum movement (Fitzpatrick & Chasaide, 2002). In comparison to EPG,
articulography provides better spatial resolution with an accuracy that is generally better than
1mm (Hoole & Nguyen, 1997; Yunusova, Green and Mefferd, 2009); however, only one study
(Mooshammer et al., 2004) of those described above also incorporated articulography to collect
information about tongue kinematics.
The speaking tasks employed in previous studies have focused mainly on articulatory
variability in vowels. Vowels involve the least amount of constriction, and in most cases,
consonant articulation requires tongue-palate contact (Fuchs et al., 2006), therefore, the influence
of palate morphology on target variability in consonant production may differ from that of
vowels. In the present study, we focused our investigation on consonants only. A relatively
large sample of speakers, all of whom are homogeneous in their language and dialect, were
recruited. Lingual function in speech was recorded with the WAVE system (NDI, Canada),

11
which operates in a similar fashion to the 3D EMA (AG500) system. One study to date suggests
that the WAVE and 3D EMA systems function with similar error and accuracy scores (Berry,
2010).
Questions and Hypotheses of the Present Study
This study sought to investigate the following main question: are measures of palate
morphology and anthropometric measures of the head associated with target (positional)
variability of the tongue during consonant production? To properly investigate this question, the
following additional questions were addressed: are anthropometric measures associated with the
measures of palate morphology, and do target variability measures differ between consonants
across speakers. It was hypothesized that flat palates would be associated with reduced target
variability in consonants as has previously been observed in vowels (Mooshammer et al., 2004;
Perkell, 1979).

12
METHOD
Participants
Participants were recruited through advertisements on the University of Toronto, St.
George Campus. 21 healthy adult speakers participated in this study (11 male, 10 female). The
balanced division of men and women was necessary because male-female differences in
anthropometric and palate measures were anticipated (Farkas et al., 1984; Farkas et al., 1994;
Ferrario, Sforza, Pizzini, Vogel and Miani, 1993; Ingerslev & Solow, 1974). The average age of
the male group was 32.3 (SD = 8.5, Range = 25-49). The average age of the female group was
28.4 (SD = 6.1, Range = 25-43). All participants were native speakers of Canadian English. All
but five speakers were from Eastern Canada. The remaining five speakers (W03, W05, W07,
W09, W12) were from various parts of Western Canada. Table 1 describes age, sex and dialect
characteristics of the sample population.
All participants passed a pure tone hearing screening and reported no history of speech
disorder, speech therapy, medical conditions or medications affecting speech, and no structural
abnormalities of the vocal tract including ankyloglossia. Participants were selected based on the
absence of any orthodontic apparatus or metal in their mouth at the time of recording. We were
not able to assess the presence of malocclusion; however, none of the participants had grossly
different dentition including significant maxillary spacing irregularities determined during a brief
oral examination.
13
Table 1: Participant ID, sex, age and self-report dialect base. ID Sex Age Dialect
W01 M 26 Ontario W02 M 30 Ontario W03 M 41 Alberta W04 F 26 Ontario W05 F 25 British Columbia W06 F 26 Ontario W07 M 26 British Columbia W08 F 43 Ontario W09 F 25 British Columbia W10 F 36 Ontario W11 M 37 Ontario W12 F 25 Alberta W13 M 49 Ontario W14 M 25 Ontario W15 F 26 Ontario W16 M 42 Ontario W17 M 25 Ontario W18 F 25 Ontario W19 M 26 Ontario W20 M 28 Ontario W21 F 27 Ontario
Speech Sample
Participants were seated in a comfortable chair and asked to repeat symmetrical Vowel –
Consonant –Vowel (VCV) syllables (e.g. ata, asa) embedded in a carrier phrase (“It’s ___
game”) ten times. Each participant was instructed to repeat the sentences at a comfortable
speaking rate and loudness. The syllables contained three corner vowels (/i, ɑ, u/) and nine
lingual consonants (/t, d, s, z, ʃ, tʃ, k, g, j/) associated with different places (alveolar, palatal and
velar) and manners of production (stops, fricatives, affricate and glide). For the purpose of this
study, consonants were classified by place of articulation as either front (alveolar and palatal) or
back (velar). Co-articulation research suggests that surrounding vowels affect the location of
articulation of a consonant (Sussman, Duder and Dalston, 1999). The chosen vowels are

14
considered to be corner vowels, and therefore, were used to provide a better assessment of target
variability for each consonant and speaker.
Data Acquisition and Processing
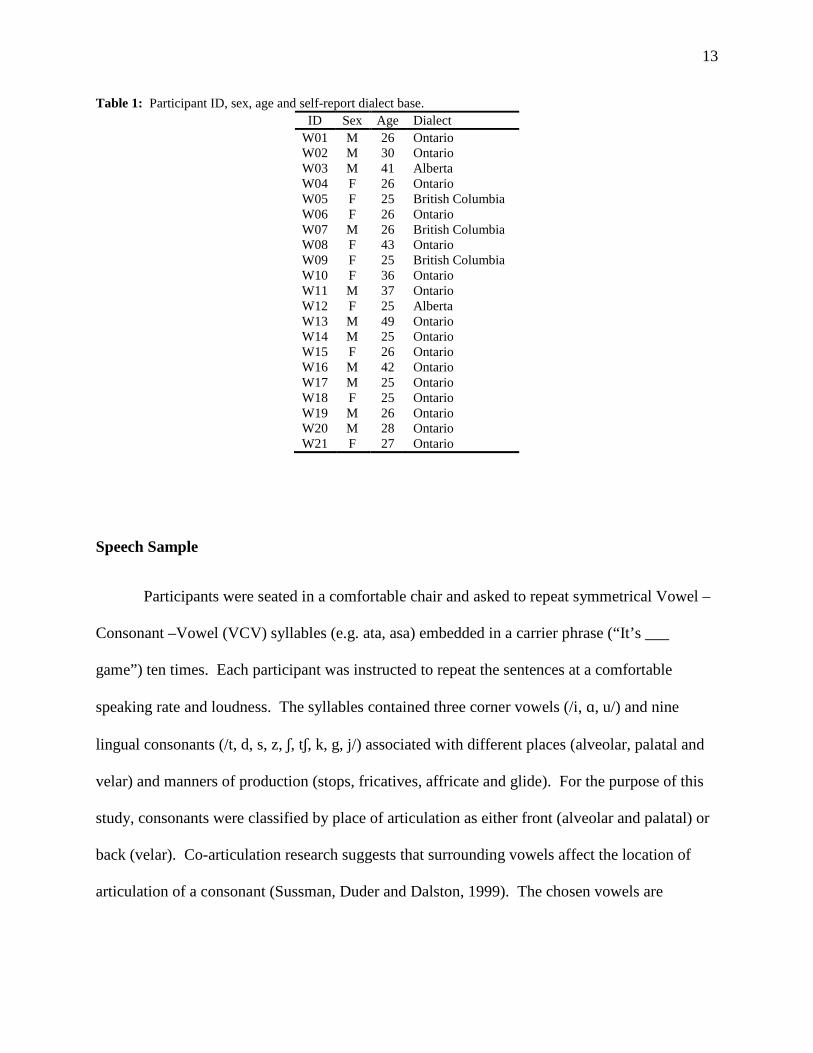
Data was acquired according to the procedures described in Berry (2010). Articulator
movement was recorded by a 3D electromagnetic tracking system, WAVE (NDI, Canada; see
Figure 1a). WAVE tracked the position of a number of 2mm diameter 5DOF sensors. Sensors
were glued using PeriAcryl Oral Tissue Adhesive, a non-toxic dental surgical glue, to several
structures within and around the oral cavity. Two 5DOF sensors were glued to the mid-sagittal
surface of the tongue blade (TB) and tongue dorsum (TD). A single 6DOF reference sensor was
attached to the bridge of the nose to collect information about head movements during the
recording. Figure 1b illustrates the approximate placement of these sensors. The TB sensor was
placed approximately 1 cm from the tip of the tongue, and the TD sensor was glued
approximately 2cm behind TB. The positions of the sensors were measured using a ruler and
recorded for each speaker. Two 5DOF sensors were glued to the lips, which were positioned at
the midline of the vermillion border of the upper and lower lip. For the purpose of this study,
only data collected with the tongue sensors (TB and TD) will be reported. Sensors were
recorded at the sampling rate of 100Hz. Acoustic signals were acquired simultaneously with
speech movements at 22KHz, using a professional lapel microphone (Countryman B3P4FF05B)
positioned approximately 15 cm away from the mouth.
During acquisition, all data was collected relative to the reference sensor attached to the
head. In an additional recording, the position of the reference sensor was recorded relative to a
15
biteplate containing a 6DOF sensor oriented in respect to the occlusal plane. The biteplate
recording enabled transformation of the original speech data during post-processing in which it
was re-expressed relative to a speaker-specific anatomically-based Cartesian coordinate system.
In this coordinate system, the abscissa is located along the maxillary occlusal plane and the
ordinate is normal to the abscissa and placed where the central maxillary incisors meet the
maxillary occlusal plane. Then, movement data was filtered at 15Hz using a zero-phase digital
filter (8-pole Butterworth).
Figure 1. a) WAVE set up. b) 5DOF sensors on a speaker’s tongue.
Measurements
Recordings were screened by a listener to ensure that only kinematic data of correctly
produced sentences were included for analysis. Target variability measures were obtained by
identifying the point of maximum vertical displacement of the tongue during consonants
embedded in VCV syllables. In the data expressed relative to the occlusal plane, the x-axis
represented vertical movement of the tongue, the y-axis represented mediolateral movement of
the tongue, and the z-axis represented anteroposterior movement of the tongue. Figure 2
illustrates x, y, and z time histories during the segment /ɑtɑ/. In consonants produced primarily
with a front (alveolar or palatal) constriction (/t/, /d/, /s/, /z/, /ʃ/, /tʃ/ /j/), the TB sensor was the
TB
TD
TB
TD

16
point of reference for obtaining the position of the tongue; in production of consonants involving
a back (velar) constriction (/k/, /g/), the TD sensor was used as the point of reference for
obtaining the position of the tongue. x, y, and z coordinates of the tongue position at this point in
time were recorded for each consonant.
Figure 2: A single sentence view of the kinematic and acoustic signal recorded using the WAVE system for the alveolar consonant /d/. The measurement for maximum tongue height during consonant production is identified by the TBx channel. The x, y, z coordinates were obtained for the tongue position at this point in time.
/ It’s ɑ ɑd g εɪme /

17
Target Variability Measures
The following measurements were derived for each consonant:
(1) 3D variability (mm3) represents target variability in 3D and is defined as the volume
contained within the 2SD ellipse fitted around the distribution of the positional
coordinates as illustrated in Figure 3.
(2) Vertical variability (mm) is defined as the x-range of the 2SD ellipse representing target
variability in the vertical dimension.
(3) Mediolateral variability (mm) is defined as the y-range of the 2SD ellipse representing
target variability in the mediolateral dimension.
(4) Anteroposterior variability (mm) is defined as the z-range of the 2SD ellipse
representing target variability in the anteroposterior dimension.
(5) Spread was determined as the distance between the centroids (x, y, z) of the target for /j/,
the most anterior consonant for all speakers, and the centroids of each front consonant
target (/t/, /d/, /s/, /z/, /ʃ/, /tʃ/).

18
Figure 3: 30 repetitions of /t/ produced by a single speaker (W15) and fit with a 2SD ellipse.
Structural Measures: Palate Measures
Palate measures were obtained from individual palate casts that were made by a local
dentist. At the dental office, maxillary impressions were made for each speaker and were poured
with a white stone. Using a pencil, landmarks were identified on each speaker’s palate cast.
These points are shown in Figure 4 and include: (1) Incisive Papilla (IP) which is the point
between the maxillary incisors, (2) Molar Right (MR) which is the point on the gingival margin
at the first permanent molar on the participant’s right side, (3) Molar Left (ML) which is the
point on the gingival margin at the first permanent molar on the participant’s left side, and (4)
Midpoint (M) which is the center point between MR and ML.
13 14 15 16 17 18 19 20 21 22 23 24
10
11
12
13
14
15
16
17
3
4
5
Anteroposterior (mm)
Vertical (mm)
Med
iola
tera
l (m
m)

19
Figure 4: Palate cast obtained from W04 illustrating the landmarks used to calculate palate measures: IP = incisive papilla, MR = molar right, ML = molar left, M = midpoint.
A 3D point digitizer (WAVE, NDI, Canada) was used to collect landmark locations on
each palate cast. 3D point digitization is deemed a more accurate method than manual
measurement (Ferrario, Sforza, Schmitz and Colombo, 1998). Palate measures that were
selected to represent the size and shape of the palate (Brunner et al, 2005; 2009; Ferrario et al.,
1998) included:
(1) Palate Height was calculated as a distance between the point M on the palate and the line
between the ML to MR.
(2) Palate Width was defined as the distance between MR and ML.
(3) Palate Length was defined as the horizontal distance between the IP and M.
(4) Palate Slope was defined as the inclination of the straight line between IP and M.
(5) Palate Curvature (α) was defined as the coronal shape of the hard palate. Palate
curvature was described by an alpha coefficient which was calculated following Brunner
et al. (2005; 2009). Using a point digitizer, a recording was made of a line tracing along
the surface of the palate cast between MR and ML from which a parabolic
IP
ML
M
MR

20
approximation with two coefficients was obtained. The palate shape was then described
by an equation:
y(x) = ax2 + b
The α was calculated using the following equation (Perrier, Boe and Sock, 1992):
Lower α-values represented domed palates, and higher α-values represented flat palates.
Structural Measures: Anthropometric Measures
Anthropometric measures were determined following procedures outlined in Reily &
Smith (2003). These specific anthropometric measures were employed because they give a
general description of head size, particularly of the lower face, which may indirectly represent
the size of the oral cavity. Landmarks were identified on each speaker’s face and marked with
an eyeliner pencil. A soft measuring tape was used for measurements of tangential linear
distances made along the surface of the face, and a spreading calliper was used to make
measurements for all projective linear distances between these landmarks. Methodology of
anthropometry is explained in more detail elsewhere (Farkas, 1994).
The landmarks are shown in Figure 5 and included (1) Tragions (t) on the right and left
sides of the face, which are defined as the notches on the upper margin of the tragus (Farkas,
1994), (2) Gonions (go), the most lateral point on the mandibular angle on the right and left side

21
of the face (Farkas, 1994), (3) Subnasale (sn) defined as the midpoint where the nasal septum
and upper lip meet (Farkas, 1994), (4) Gnathion (gn) defined as the lowest median landmark on
the lower border of the mandible (Farkas, 1994), (5) Glabella (g) defined as the most prominent
midline point between the eyebrows (Farkas, 1994) and (6) Opisthocranion (op) defined as the
point located in the occipital region of the head, which is the most distant point from the globella
(Farkas, 1994). The anthropometric measures included:
(1) Head Circumference (g-op-g) is defined as the perimeter of the head in the horizontal
plane. This measurement was taken through the eyebrow line identified by the glabella
and through the opisthocranion.
(2) Jaw Size: This oral cavity parameter was determined by measuring:
(a) Mandibular Width (go-go) is defined as the distance between the right and left
gonions and represents the width of the jaw.
(b) Lower Facial Depth (t-gn) is the distance between the tragion and gnathion on the
right and left side.
(c) Mandibular Arc (t-gn-t) is defined as the distance around the chin between the
right and left tragions and represents a perimeter of the mandible.
(d) Lower Facial Height (sn-gn) is defined as the distance between the subnasale and
the gnathion and represents the vertical length of the oral cavity.

22
Figure 5: Landmarks and measurement trajectories for anthropometric measures: t = tragions, go = gonions, sn = subnasale, gn = gnathion (gn), g = glabella, op = opisthocranion.
To estimate the precision of anthropometric measures and intra-measures reliability, all
measures were taken twice within the same session (Marks, Habicht and Mueller, 1989). Table 2
reports the precision and reliability of the anthropometric measures. To report precision, we
calculated the technical error measurement (TEM) for each anthropometric measure. TEM was
calculated according to procedures outlined in Jamison & Ward (1993), using the formula:
Where d is the difference between the first and second measurement. Test-retest reliability of the
anthropometric measures was reported as a reliability coefficient. The reliability coefficient was
calculated as the square of the correlation coefficient (r), where zero represents an unreliable
measure and one represents a reliable measure. These estimates are comparable to published
results (Jamison & Ward, 1993).
t t
gn
sn
go go
g op

23
Table 2: Reliability and precision of anthropometric measures calculated across speakers: Circ = head circumference, Arc = mandibular arc, LFH = lower facial height, LFDR = lower facial depth right, LFDL = lower facial depth left, MW = mandibular width.
Reliability and Precision of Anthropometric Measures Measure Mean TEM r Circ (mm) 582.4 0.38 0.95 Arc (mm) 320.5 0.45 0.91 LFH (mm) 63 0.27 0.75 LFDR (mm) 144.7 0.19 0.93 LFDL (mm) 144.5 0.23 0.89 MW (mm) 115 0.34 0.9
Statistical Analysis
The positional data were examined visually prior to performing calculations or any
analyses. Outliers, defined as data points greater than two standard deviations outside of the
2SD ellipse in two of the 3 dimensions, were removed which composed 4.8% of the total data
set. These outliers may have been caused by random error in the WAVE system. Variability
measures were calculated on the reduced data set.
The distribution of each variable was assessed visually in a histogram plot and tested for
normality using the Shapiro-Wilk test of normality. Both analyses showed that most of the
variables were positively skewed, with the exception of palate length, lower facial height and
mandibular arc, which were normally distributed, and palate curvature and palate slope, which
were bimodally distributed.
Descriptive statistics (medians and interquartile ranges) were calculated across speakers
for each variable. Differences between males and females were assessed using a 2-tailed
Wilcoxon Rank Sum test for all measures. A Generalized Estimating Equations (GEE) approach
was used to test between consonant differences in variability measures with structural measures

24
(palate and anthropometric measures) as covariates. GEE is a semi-parametric technique and is
an extension of the Generalized Linear Models for nested data. The GEE takes into account
interdependencies in clustered data and it is able to model data that is not normally distributed
(Zeger & Liang, 1986). As a result, this model allowed us to maintain the original values of the
data without performing transformations. When the effect of consonant was significant for the
GEE analysis (p < 0.05), a pairwise analysis between consonants was performed. Since, the
majority of the variables were not normally distributed, Spearman correlation coefficients were
computed to assess the association within and between variables.

25
RESULTS
Structural Measures
Anthropometric Measures
Summary statistics for anthropometric measures computed across speakers by sex are
reported in Table 3. A 2-tailed Wilcoxon Rank Sum test revealed that there were significant
differences between males and females for all anthropometric measures with men showing
significantly larger anthropometric measures than women (see Table 3). Box and whisker plots
are presented in Figure 6 to illustrate the distribution of these variables.
Table 3: Median (M) and interquartile ranges (IQR) of averaged anthropometric measures reported by sex: Circ = head circumference, Arc = mandibular arc, LFH = lower facial height, LFDR = lower facial depth right, LFDL = lower facial depth left, MW = mandibular width.
Anthropometric Measures Male Female Wilcoxon Rank Sum (17) Median IQR Median IQR W-value p-value Circ (mm) 604.5 11 568 14.9 -3.31 0.00 Arc (mm) 333.5 14.3 310 17.1 -3.60 0.00 LFH (mm) 66 3 60.5 7.6 -2.41 0.01 LFDR(mm) 153 6 137.8 9.9 -3.55 0.00 LFDL (mm) 150 8.3 138.3 12.9 -3.52 0.00 MW(mm) 123 12 107 17.1 -3.35 0.00

26
Figure 6: Box and whisker plots of anthropometric measures computed across speaker by sex: Circ = head circumference, Arc = mandibular arc, LFH = lower facial height, LFDR = lower facial depth right, LFDL = lower facial depth left, MW = mandibular width.
Inter-correlations between anthropometric measures were explored by gender. This
analysis indicated that there was no difference in the nature of the relationship between
anthropometric measures for males and females. Figure 7 illustrates a continuous function that
fits both male and female data. All anthropometric measures fit this profile. As a result, male
and female speakers were not separated for the correlational analysis.
300
400
500
600
Circ Arc
6080
100
120
140
160
LFH LFDR LFDL MW
(mm
)
(mm
)
MalesFemales

27
Figure 7: Scatterplots illustrating the relationship between anthropometric measures for males and females: Circ = head circumference, Arc = mandibular arc, LFH = lower facial height, LFDR = lower facial depth right, LFDL = lower facial depth left, MW = mandibular width.
Spearman correlation coefficients were computed across speakers between all
anthropometric measures and are presented in Table 4. All of the anthropometric measures were
moderately to highly correlated (r = .52-.96). A scatterplot matrix is presented in Figure 8 to
illustrate these associations.
Table 4: Spearman correlation coefficients for anthropometric measures: Circ = head circumference, Arc = mandibular arc, LFH = lower facial height, LFDR = lower facial depth right, LFDL = lower facial depth left, MW = mandibular width.
Anthropometric Measures Correlation Matrix Circ Arc LFH LFDR LFDL Arc 0.74 LFH 0.58 0.65 LFDR 0.85 0.93 0.69 LFDL 0.76 0.96 0.73 0.94 MW 0.73 0.84 0.54 0.87 0.85
540 560 580 600 620
Circ (mm)
300
320
340
Arc
(mm
)
125 130 135 140 145 150 155
LFDL (mm)
9010
011
012
013
014
0M
W (m
m)
MalesFemales
28
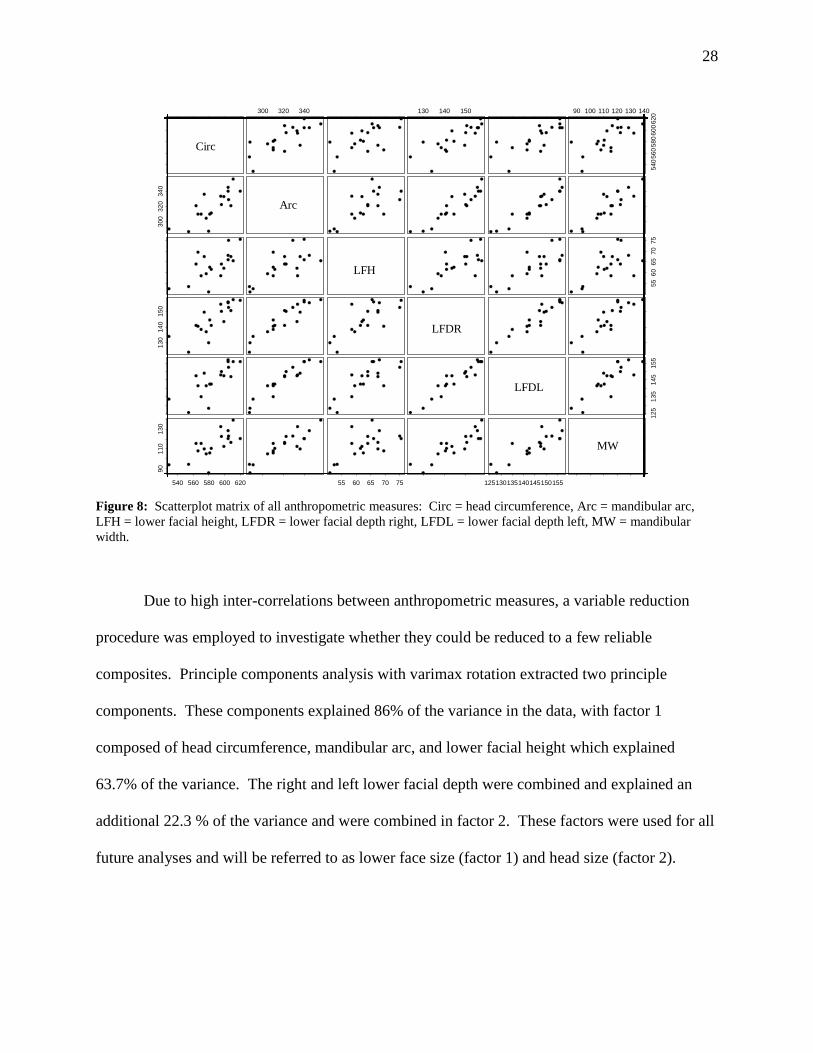
Figure 8: Scatterplot matrix of all anthropometric measures: Circ = head circumference, Arc = mandibular arc, LFH = lower facial height, LFDR = lower facial depth right, LFDL = lower facial depth left, MW = mandibular width.
Due to high inter-correlations between anthropometric measures, a variable reduction
procedure was employed to investigate whether they could be reduced to a few reliable
composites. Principle components analysis with varimax rotation extracted two principle
components. These components explained 86% of the variance in the data, with factor 1
composed of head circumference, mandibular arc, and lower facial height which explained
63.7% of the variance. The right and left lower facial depth were combined and explained an
additional 22.3 % of the variance and were combined in factor 2. These factors were used for all
future analyses and will be referred to as lower face size (factor 1) and head size (factor 2).
Circ
300 320 340 130 140 150 90 100 110 120 130 140
5405
6058
060
0620
300
320
340
Arc
LFH
5560
6570
75
130
140
150
LFDR
LFDL
125
135
145
155
540 560 580 600 620
9011
013
0
55 60 65 70 75 125130135140145150155
MW
Circ
Arc
LFH
LFDR
LFDL
MW

29
Palate Measures
A summary of palate measures computed across speakers by sex are provided in Table 5.
A 2-tailed Wilcoxon Rank Sum test revealed significant differences between males and females
in measures of palate height and length, with males showing larger values for these measures
than females (see Table 5). No male-female difference was found for palate slope, palate width
or palate curvature in this data set. Box and whisker plots are presented in Figure 9 to illustrate
the distribution of these variables.
Table 5: Median (M) and interquartile ranges (IQR) of palate measures computed across speakers reported by sex: PH = palate height, PW = palate width, PL = palate length, PS = palate slope, PC = palate curvature.
Palate Measures Male Female Wilcoxon Rank Sum (19) Median IQR Median IQR W-value p-value PH (mm) 13.9 2.7 11.2 1.3 -2.5 0.01 PW (mm) 34.7 4.4 31 4.2 -1.94 0.054 PL (mm) 34.4 2.2 29.7 7.5 -2.01 0.04 PS (m) 0.4 0.4 0.4 0.5 0.32 0.75 PC (α) 1.9 0.2 1.9 0.3 0 1

30
Figure 9: Box and whisker plots for palate measures computed across speaker by sex: PH = palate height, PW = palate width, PL = palate length, PS = palate slope, PC = palate curvature.
The histogram presented in Figure 10 shows that the palate curvature measure had a
bimodal distribution for this data set. Based on the Median (M) of the palate curvature measure,
we divided the data into two categories: domed (α < 1.89, N=10) and flat (α > 1.89, N=11)
palates.
Figure 10: Histogram illustrating the bimodal distribution of the palate curvature (PC) variable.
1020
3040
PH PW PL
(mm
)
0.0
0.2
0.4
0.6
0.8
1.0
PS 1.0
1.4
1.8
2.2
2.6
3.0
PC
(α)
(m)
MalesFemales
1.6 1.8 2.0 2.2
01
23
45
PC (α)
31
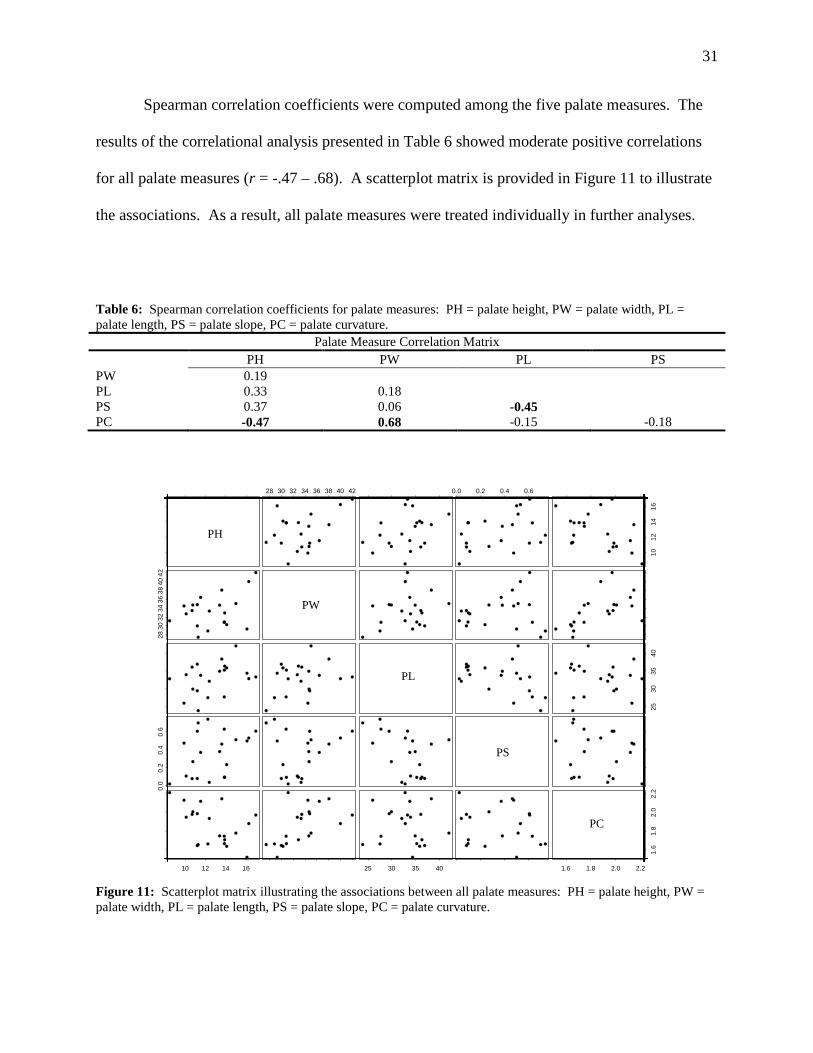
Spearman correlation coefficients were computed among the five palate measures. The
results of the correlational analysis presented in Table 6 showed moderate positive correlations
for all palate measures (r = -.47 – .68). A scatterplot matrix is provided in Figure 11 to illustrate
the associations. As a result, all palate measures were treated individually in further analyses.
Table 6: Spearman correlation coefficients for palate measures: PH = palate height, PW = palate width, PL = palate length, PS = palate slope, PC = palate curvature.
Palate Measure Correlation Matrix PH PW PL PS PW 0.19 PL 0.33 0.18 PS 0.37 0.06 -0.45 PC -0.47 0.68 -0.15 -0.18
Figure 11: Scatterplot matrix illustrating the associations between all palate measures: PH = palate height, PW = palate width, PL = palate length, PS = palate slope, PC = palate curvature.
Height
28 30 32 34 36 38 40 42 0.0 0.2 0.4 0.6
1012
1416
2830
3234
3638
4042
Width
Length
2530
3540
0.0
0.2
0.4
0.6
Slope
10 12 14 16 25 30 35 40 1.6 1.8 2.0 2.2
1.6
1.8
2.0
2.2
Curv
PH
PW
PL
PS
PC

32
Correlations between Structural Measures
To address the question of the association between structural measures, Spearman
correlation coefficients were computed among the two anthropometric factors and the five palate
measures. Table 7 indicates that the anthropometric factors are not strongly correlated with
palate measures (r = -.03 - .54). Scatterplots of the strongest associations are provided in Figure
12.
Table 7: Spearman correlation coefficients illustrate the association between the two anthropometric factors and the various palate measures: PH = palate height, PW = palate width, PL = palate length, PS = palate slope, PC = palate curvature.
Structural Measures Correlations
Lower face size Head Size
PH 0.54 0.47 PW 0.53 0.36 PL 0.39 0.51 PS -0.03 -0.18 PC 0.04 0.03

33
Figure 12: Scatterplots illustrating the associations between anthropometric and palate measures: PH = palate height, PW = palate width, PL = palate length, PS = palate slope, PC = palate curvature.
Target Variability Measures
As the first step in the analysis of consonant target variability, the GEE analyses were
conducted to perform a between-consonant comparison of target variability measures. The
results indicated significant differences only for target variability measures contrasting between
the front (/t, d, s, z, ʃ, tʃ, j/) and back (/k, g/) consonant groups with the exception of spread (see
Table 8). The variability measure, spread, was made using only data collected by TB, therefore,
a comparison could not be made for this measure. A 2-tailed Wilcoxon Rank Sum test showed
that target variability measures obtained for back consonants were significantly greater than
those for front consonants (W(40) = 3.1 - 3.6, p < 0.01). There was no significant difference for
-2 -1 0 1
Jaw Depth
1012
1416
PH (m
m)
-0.5 0.0 0.5 1.0
Head Size
1012
1416
PH (m
m)
-2 -1 0 1
Jaw Depth
2830
3234
3638
4042
PW (m
m)
-0.5 0.0 0.5 1.0
Head Size
2530
3540
PL (m
m)
r = 0.54 r = 0.53
r = 0.51r = 0.47

34
target variability measures within these groups of consonants; as a result, front and back
consonants were evaluated separately in further analyses. Summary statistics of target variability
measures computed across speakers by tongue sensor (TB and TD) are provided in Table 8. Box
and whisker plots are provided in Figure 13 to illustrate the distribution of these variables.
Table 8: Medians (M) and interquartile ranges (IQR) of target variability measures computed across speaker and consonant by sensor: 3DV = 3D variability, VV = vertical variability, MLV = mediolateral variability, APV = anteroposterior variability.
Variability Measures TB TD Median IQR Median IQR Chi-Square (8) p-value 3DV (mm3) 19.34 8.08 37.44 28.53 50.1 0.000 VV (mm) 3.8 0.65 4.68 1.97 30.76 0.000 MLV (mm) 2.6 0.58 3.1 1.22 56.52 0.000 APV (mm) 4.59 1.14 6.68 2.56 60 0.000 Spread (mm) 14.69 3.37 . . . . Note: Spread was not measured for TD consonants because individual differences would be highly dependent on sensor placement.
Figure 13: Box and whisker plots of target variability measures: 3DV = 3D variability, VV = vertical variability, MLV = mediolateral variability, APV = anteroposterior variability.
2040
6080
100
120
140
3DV
24
68
VV MLV APV Spread
(mm
3 )
(mm
)
TBTD

35
Spearman correlation coefficients were computed among all target variability measures
by sensor. The correlational analysis indicated that only five of the 10 correlations were
moderate for TB (r = .19 – .68) and only one of the 10 correlations was moderate for TD (r =
0.19 – 0.75). In general, greater target variability observed for vertical variability, mediolateral
variability and anteroposterior variability is associated with greater 3D variability.
Correlations between Structural Measures and Target Variability Measures
Spearman correlation coefficients were computed among the two anthropometric factors,
the five palate measures and the target variability measures for TB and TD. The results of the
correlational analysis presented in Table 9 indicated that a few target variability measures of TB
were moderately correlated (r = 0.1 - 0 .5) with palate measures. However, the results of the
correlational analysis shown in Table 10 revealed no such associations for any of the TD target
variability measures and structural measures.
Table 9: Spearman correlation coefficients for structural measures and target variability measures for TB: PH = palate height, PW = palate width, PL = palate length, PS = palate slope, PC = palate curvature, 3DV = 3D variability, VV = vertical variability, MLV = mediolateral variability, APV = anteroposterior variability.
Structural Measures and Variability Measures Correlations (TB) VV MLV APV 3DV Spread PH 0.4 -0.16 0.25 0.18 0.31 PW -0.23 -0.29 -0.3 -0.41 0.46 PL 0.56 -0.08 0.25 0.25 0.05 PS -0.02 0.18 -0.06 0.09 0.37 PC -0.53 -0.09 -0.51 -0.45 0.15 Lower face size -0.04 -0.34 -0.22 -0.19 0.11 Head Size 0.01 -0.25 -0.2 -0.1 0.09

36
Table 10: Spearman correlation coefficients for structural measures and target variability measures for TD: PH = palate height, PW = palate width, PL = palate length, PS = palate slope, PC = palate curvature, 3DV = 3D variability, VV = vertical variability, MLV = mediolateral variability, APV = anteroposterior variability.
Structural Measures and Variability Measures Correlations (TD) VV MLV APV 3DV PH 0.02 -0.19 0.12 -0.22 PW 0.14 -0.35 -0.18 -0.4 PL -0.1 -0.03 0.12 0 PS -0.1 0.07 -0.14 -0.03 PC 0.25 -0.19 -0.26 -0.21 JawDepth 0.29 -0.32 0.16 -0.25 Head Size 0.28 -0.3 0.21 -0.14
Spearman correlation coefficients indicated that, on average, TB 3D variability is
significantly negatively correlated with palate curvature, vertical variability is significantly
positively correlated with palate length and negatively correlated with palate curvature,
anteroposterior variability is significantly negatively correlated with palate curvature, and spread
is positively correlated with palate width. However, no significant relationship was found
between any of the anthropometric factors and target variability measures or any of the structural
measures and mediolateral variability. Figure 14 and 15 illustrate the significant associations
between the palate and target variability measures.

37
Figure 14: Scatterplots illustrating the association between palate curvature (PC) and target variability measures: 3DV = 3D variability, VV = vertical variability, APV = anteroposterior variability.
Figure 15: Scatterplots illustrating the association of palate length (PL) and palate width (PW) with target variability measures of vertical variability (VV) and spread.
1.6 1.8 2.0 2.2
PC (α)
34
56
7
VV
(mm
)
1.6 1.8 2.0 2.2
PC (α)
3.5
4.0
4.5
5.0
5.5
APV
(mm
)
1.6 1.8 2.0 2.2
PC (α)
1020
3040
50
3DV
(mm
3 )r = -0.51 r = -0.45
r = -0.53
FlatDomed
25 30 35 40
PL (mm)
34
56
7
VV
(mm
)
28 30 32 34 36 38 40 42
PW (mm)
34
56
78
Spre
ad (m
m)
r = 0.46 r = 0.56

38
Speakers with longer palates and domed palates (α < 1.89) exhibited greater vertical
variability. Speakers with domed palates also exhibited greater anteroposterior variability than
those with flat palates (α > 1.89), and speakers with wider palates had greater target spread of the
various consonants.
In addition, speakers with domed palates exhibited greater 3D variability than those with
flat palates. Figure 16 illustrates Median 3D variability of front consonants for speakers with
domed and flat palates. A 2-tailed Wilcoxon Rank Sum test revealed that speakers with domed
palates had significantly greater 3D variability than speakers with flat palates (W(19) = 2.15, p =
0.016).
Figure 16: Median 3D variability for domed and flat palates.
Dome Flat
0
5
10
15
20
25
3DV
(mm
3 )
39
DISCUSSION
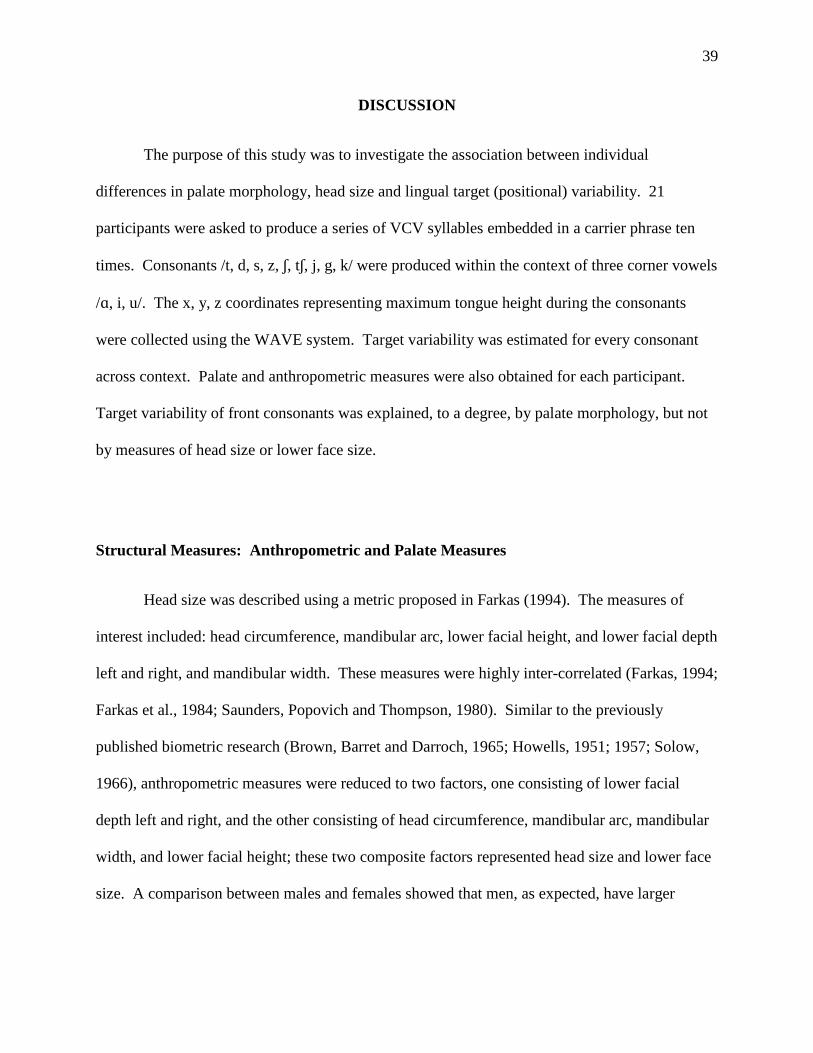
The purpose of this study was to investigate the association between individual
differences in palate morphology, head size and lingual target (positional) variability. 21
participants were asked to produce a series of VCV syllables embedded in a carrier phrase ten
times. Consonants /t, d, s, z, ʃ, tʃ, j, g, k/ were produced within the context of three corner vowels
/ɑ, i, u/. The x, y, z coordinates representing maximum tongue height during the consonants
were collected using the WAVE system. Target variability was estimated for every consonant
across context. Palate and anthropometric measures were also obtained for each participant.
Target variability of front consonants was explained, to a degree, by palate morphology, but not
by measures of head size or lower face size.
Structural Measures: Anthropometric and Palate Measures
Head size was described using a metric proposed in Farkas (1994). The measures of
interest included: head circumference, mandibular arc, lower facial height, and lower facial depth
left and right, and mandibular width. These measures were highly inter-correlated (Farkas, 1994;
Farkas et al., 1984; Saunders, Popovich and Thompson, 1980). Similar to the previously
published biometric research (Brown, Barret and Darroch, 1965; Howells, 1951; 1957; Solow,
1966), anthropometric measures were reduced to two factors, one consisting of lower facial
depth left and right, and the other consisting of head circumference, mandibular arc, mandibular
width, and lower facial height; these two composite factors represented head size and lower face
size. A comparison between males and females showed that men, as expected, have larger

40
anthropometric measures on average than women (Farkas, 1984; Farkas et al., 1994; Ferrario et
al., 1993; Ingerslev & Solow, 1975; Reily & Smith, 2003).
Anatomically, population expectations regarding the hard palate are not well defined
(Bhagyalakshmi et al., 2007). Palate morphology in this study was quantified based on upper
dental casts obtained for each participant. Palate measures represented the overall size and shape
of the hard palate and included palate length, palate width, palate height, palate slope and palate
curvature. Cross-correlations between these measures were examined for redundancies in the
data set. The examination revealed moderate correlations between select measures of the hard
palate. This finding is consistent with a previous study of healthy adult females, where measures
of palate arch, width and length were moderately inter-correlated (Buschang, Stroud and
Alexander, 1994). Because of the lack of strong associations, we opted to retain all palate
measures for subsequent analyses.
Male and female palate measures were compared, and the results indicated that male
palates were, on average, 22.4% higher and 13% longer than female palates, but were not
significantly wider. These findings are in contrast with those of Ferrario et al. (1998) who
reported similar palate sizes for 13-15 year old males and females in measures of palate length,
palate slope, palate width and palate height. In a repeated MRI study of children progressing
into adolescence, Fitch and Giedd (1999) concluded that male-female differences of vocal tract
morphology, including the hard palate, are not present in childhood and do not arise until after
puberty. In the present study, only adults above the age of 25 were recruited. Male-female
differences in palate size and shape are not present in early adolescence, but may be evident in
adulthood.

41
Hard palates are often described in speech literature in terms of their curvature and are
categorized into domed and flat palates. In earlier studies (Mooshammer et al., 2004; Perkell,
1979), palate shape was determined visually by comparing palates of a relatively small sample
and were classified as either coronally high palates (domed or vaulted palates) or coronally low
palates (flat palates). Brunner et al. (2005; 2009) employed a measure of palate curvature to
determine individual differences in palate shape more precisely. To calculate palate curvature, a
quadratic line equation was obtained from each speaker’s palate and values from this were
entered into a palate curvature equation producing an alpha coefficient which represented the
curvature of each speaker’s palate. On a continuous scale, high α-values designated flat palates
and low α -values designated domed palates. In comparison with Brunner et al. (2009), our
sample of speakers showed a smaller range of palate curvatures (α = 1.52 - 2.21) than theirs (α =
1.3 to 2.2), and a bimodal distribution of alpha-values (see Figure 10) rather than the continuous
distribution they observed. We categorized palates in one of two groups, domed palate or flat
palate, based on their alpha-value (α < 1.89 = domed; α >1.89 = flat).
Brunner et al. (2009) observed a male-female difference in measures of palate curvature
in a group of 32 speakers, with only men having flat palates. In the present study, we saw an
almost equal distribution of palate curvatures for males and females; the palates of six men and
five women were classified as flat palates, and five men and five women had domed palates.
Brunner et al. (2009) did not report on malocclusion in their study which has been shown to
affect the size and shape of the palate in measures of palate width and palate height (Buschang et
al., 1994; Kasai et al., 1995), two measures that were significantly associated with palate
curvature in the present study. Another explanation for this discrepancy between the findings of
these two studies includes the method by which the quadratic line equation was obtained.

42
Brunner et al. (2005; 2009) obtained this line using the position of the sixth row of the electrodes
in the EPG. In the present study, we obtained this line equation, relative to the teeth, between the
right and left first permanent molars. Depending on a speaker’s morphology, these two methods
of measurement may have yielded different results in the range and distribution of palate
curvature measures for the two studies.
We examined associations between anthropometric measures and palate measures,
seeking further reduction of the data. Kasai et al. (1995) showed that the palate and
anthropometric measures are related in structure size with correlations of r = 0.56 between facial
breadth and palate length. We found similar correlations between anthropometric and palate
measures in our data.
Target Variability Measures
Target variability of two sensors attached to the mid-sagittal surface of the tongue was
described using 3D variability, vertical variability, mediolateral variability, anteroposterior
variability and spread. As a first step in the analysis, the target variability measures were
compared between consonants. We found that target variability of back consonants was
significantly greater than target variability of front consonants. The finding of this study is
consistent with Recasens’ (1990) review of literature on consonant articulation, which proposes
that consonants produced with the palate (front) involve precision and fine control, but the same
conclusion was not made for consonants produced posterior to the palate (back).
According to Stevens (1989), there is a quantal relationship between speech movements
and speech acoustics. There are regions in the vocal tract in which acoustics are relatively

43
insensitive to large changes in articulator positions. Greater target variability for sounds
produced in these regions would be expected. The acoustics of sounds produced in the region of
the oral cavity posterior to the palate are relatively insensitive to changes in articulator position.
In relation to the results of the present study, back consonants may have greater target variability
than front consonants due to differences in acoustic sensitivity to changes in articulator position.
In an examination between front consonants (alveolar and palatal), no significant
difference in target variability measures was observed. It has previously been shown that
different control strategies might be employed during production of consonants involving
different manners of articulation. Fricative consonants have been said to require more precise
positioning of the tongue against the palate (Alfonso & Van Lieshout, 1997; Fuchs et al., 2006;
Mooshammer, Geumann, Hoole, Alfonso and Van Lieshout, 2003), whereas during stop
consonant production, the tongue appears to collide with the palate and does not have precise
positional specifications for production (Fuchs et al., 2006). Despite these differing control
strategies, Lofqvist (2006) found no consistent difference in target variability of tongue-palate
contact during fricatives and stops. Our findings generally agreed with Lofqvist (2006). As an
exception, we observed that mediolateral variability was significantly greater for the stop /d/ than
the fricative /z/ across speakers, and anteroposterior variability was significantly greater for the
stop /t/ than the glide /j/ across speakers.
Articulatory variability has been related to stiffness of the articulatory muscles, which is a
measure of resistance to movement (Laboissiere, Lametti and Ostry, 2009; Shiller, Baoissiere
and Ostry, 2002; Shiller, Houle and Ostry, 2005). Research suggests that articulatory variability
is less when stiffness is high and stiffness is highest at the end of the movement (Gribble, Mullin,
Cothros and Mattar, 2003; Lametti, Houle and Ostry, 2007; Shiller et al., 2002). Laboissiere et

44
al. (2009) investigated jaw stiffness and variability in speech production and found that stiffness
was the greatest in the most elevated position of the jaw and least at its lower positions. In
addition, they found that jaw target variability was reduced in the dimension that was most
important to accurate speech production, the vertical dimension. Perhaps no difference in target
variability for stops and fricatives was observed in the vertical dimension because the tongue
position at the point of articulation, or movement-end, was at its highest point and involved
similar levels of stiffness in the tongue. In addition, differences in mediolateral and
anteroposterior variability may have been observed for the two pairs of consonants (/z/ - /d/ and
/t/ - /j/) because target variability in these dimensions would not impede accurate speech
production for these consonants. In general, the results of this study indicate that, across
speakers, median anteroposterior variability was greater than vertical variability, a finding
consistent with the previous research on vowels and /r/ (Beckman et al., 1995; Nieto-Castanon,
Guenther, Perkell, and Curtin, 2005). According to previous research, constriction degree
(vertical variability) is more tightly controlled than constriction location (anteroposterior
variability) because constriction degree is more important to accurate speech production
(Beckman et al., 1995; Perkell & Nelson, 1985).
Palate Measures and Target Variability
Tongue movements are unique because they occur within an enclosed space, the oral
cavity, providing additional constraints on movement capability. The hard palate is the upper
boundary of the oral cavity, and is particularly important to consonant articulation. According to

45
Stone (1995), there are consonants that could not be produced with the tongue in a free-standing
position, for example, alveolar fricatives.
In the past, palate morphology has been implicated in articulation. It has previously been
observed, for example, that speakers with domed palates demonstrate more target variability than
speakers with flat palates (Brunner et al., 2009; Mooshammer et al., 2004; Perkell, 1997). In this
study, the associations between palate measures, anthropometric measures and target variability
measures were examined. We found that palate measures were significantly correlated with
target variability of front consonants. The findings of the present study are in agreement with
two previous studies investigating target variability in vowels using articulography. Perkell et al.
(1995) investigated target variability of /u/ in six male speakers. The authors found that the
speaker with the flattest palate had the least target variability as determined by small dispersion
ellipses. Similar findings were observed in a later study, where Mooshammer et al. (2004)
showed that in a sample of three speakers, the speaker with the flattest palate also exhibited the
least target variability in the production of 14 German vowels. Interestingly, both vowels and
consonants show greater target variability in speakers with domed palates as compared to
speakers with flat palates. Perhaps this can be explained better by the biomechanical hypothesis
such that position and variability do not influence acoustic properties of consonants, yet palate
shape influences target variability of consonants and vowels similarly.
Brunner et al. (2009) found that palate curvature was significantly associated with
articulatory variability of a few vowels and a glide /j/. Their findings were measure specific.
Domed palates tended to have greater articulatory variability as determined by the percent of
contact (POC) measure, but not for the center of gravity (COG) or number of contact (NOC)
measures. The target variability employed in this study was similar to the COG and NOC

46
measures. The results of the present study are in contrast to those of Brunner et al. (2009). We
found significant correlations between palate curvature and target variability in consonant
production, whereas they did not.
This discrepancy may be explained by differences in articulation of consonants and
vowels, and/or differences in data acquisition. Consonants and vowels are considered to be
principally different acoustically and physiologically (Browman and Goldstein, 1992; Guenther,
1995; Ohman, 1966; Stone, 1995; Stone & Lunberg, 1994). In this study, the electromagnetic
WAVE system tracked tongue movement within the oral cavity via sensors attached to the
tongue. As a result, x, y and z coordinates of maximum tongue height during articulation of
each consonant repetition was obtained, and the cluster of these points for each consonant were
fit with a 2SD ellipse from which measures were derived to represent target variability. In
contrast, Brunner et al. (2009) used EPG for data acquisition which provides information about
tongue-palate contact patterns and surface variability. Perhaps the different findings of the
present study and Brunner et al. (2009) are due to the greater involvement of the palate in
articulation of consonants than vowels and the information provided by the different
technologies employed.
Palate Measures and Spread
A long-term goal of this study is to understand the distribution of consonant targets
within the oral cavity across speakers. One of the first steps to examine the distribution of
consonant targets was to explore a measure of the spread defined as target variability “clouds”
within the mouth and its relationship to anthropometric and palate measures. As the first look at

47
the question, we defined spread as the distance between the centroids (x, y, z) of the target for /j/,
the most anterior consonant for all speakers, and the centroids of each front consonant target.
The results of this study indicated that palate width appeared to moderately correlate with the
spread of the consonant targets, such that wider palates exhibited greater spread. This is a
preliminary finding however, as the uni-dimensional measure of spread might be limited in
quantifying the overlap between consonant targets. Currently, we are exploring 3D spatial
statistics approaches to quantify the degree of positional overlap between consonant targets.
Anthropometric Measures and Target Variability
Little information is known about the relationship between anthropometric measures and
speech kinematics. In kinematic research of locomotion, a general relationship has been
described as a size-scaling principle. According to the size-scaling principle, structure size of the
limbs is directly related to kinematics, such that larger limbs exhibit greater movement distance
(Beck, Andriacchi, Kuo, Fermier and Galante, 1981). However, this is not true for all motor
control systems. For example, handwriting does not follow this size-scaling principle;
kinematics involved in handwriting decrease with age (Hamstra-Bletze & Blote, 1990). Kuehn
& Moll (1976) investigated a relationship between tongue and jaw size and speech kinematics.
The authors found that, in their sample of five adult speakers, tongue and jaw size was directly
related to articulatory velocity and displacement. Speakers with larger vocal tract sizes moved
their tongue and jaw greater distances. In a later study, Reily & Smith (2003) investigated
articulatory variability in children and adults. The authors found no relationship between
anthropometric measures and articulatory variability in labial amplitude, velocity and distance of

48
the lower lip. To our knowledge, the association between target (positional) variability and
structure size has not been previously investigated in speech literature. The findings of the
present study showed no significant relationship between anthropometric size and target
variability in consonant production, however, further investigation of this is necessary.
Conclusions
In this study, we found that palate morphology appears to explain, to some extent,
individual differences in measures of target variability. These findings have theoretical and
clinical implications.
Palate size and shape characteristics should be considered as a source of target variability
in theories of speech motor control. Larger target variability for consonants should be expected
from speakers with domed palates, whereas smaller target variability should be expected from
speakers with flat palates. For a number of reasons, consonants have been understudied in
speech research. As a result, some models are unable to account for the consonant sound class,
or do so by modeling consonants and vowels similarly.
Palate morphology may be a consideration in evaluating kinematic assessment of
neurological speech disorders and in devising a treatment plan for a patient. A target variability
measure may be used to diagnose speech impairments (Anderson et al., 2008; Cheng et al., 2007;
Kleinow et al., 2001) and can be used in the assessment of motor speech abnormalities.
However, this study showed that expectations of normal performance might differ for speakers
with different palates. Likewise, a treatment plan in which the outcome is a target variability
measure may be designed differently for speakers with different palates, whereby there may be

49
an increased emphasis on precision for speakers with flat palates. The use of a target variability
measure for assessment purposes is limited at present by the lack of commercial technologies
available to speech-language pathologists. However, this is rapidly changing due to the
development of easy-to-use and affordable technologies.
Visual biofeedback tools are currently being developed as well, and have shown some
promise in the treatment of motor speech disorders (Coventry, Clibbens, Cooper and Rood,
1997; Hardcastle, Gibbon and Jones, 1991; Howard & Varley, 1995; Katz, Bharadwaj and
Carstens, 1999). Visual biofeedback speech therapy provides a speaker with feedback about oral
speech movement and/or targets that cannot be captured through auditory perception (Howard &
Varley, 1995). As a result, this type of therapy may be beneficial for a variety of speech
disorders where auditory and somatosensory feedback is insufficient or misrepresented.
Quantification of positional targets for the tongue during speech is a necessary first step in
developing expectations regarding articulation in patient populations. Providing people with a
visual representation of tongue movement during speech relative to a target may assist in the
acquisition of compensatory mechanisms to improve motor control in speech production.
Limitations
There are several limitations of the present study. Since many sources of articulatory
variability interact to produce a speech signal, it is difficult to isolate a single source and evaluate
its influence on articulatory variability independent of all other sources.
One potential source of articulatory variability that could have influenced the results is
individual differences in speaking rate. Intentional manipulation of speaking rate has been

50
shown to influence target variability (Guenther, 1995; Perkell et al., 2002). In the present study,
speakers were instructed to produce a VCV syllable in a carrier phrase at a comfortable speaking
rate and loudness. Research also shows that there are individual differences in habitual speaking
rate (Tsao, Weismer and Iqbal, 2006). This difference could have influenced the observed target
variability for individual speakers in this study. In a post-hoc analysis, we evaluated the
association between speaking rate, measured as VCV duration, and target variability across
speaker. The results of this analysis indicated that speaking rate did not significantly influence
target variability in this sample of speakers, and therefore, is not a concern of this study.
Studies that employ 3D electromagnetic articulography track movement of fleshpoints
(sensors) and not the whole tongue. Placement of the sensors varies between individuals who
might use different regions of the tongue to produce the same sounds. In this study, we were
unable to obtain exact information about which portion of the tongue was used for production of
each consonant for each speaker. The WAVE sensors were attached at approximately the same
location on the tongue for each speaker. It is possible that misplacement of the sensors may have
added noise to the data.
Furthermore, speech production involves dynamic coordination of multiple articulators
that compose functional synergies, which makes it difficult to assess the relative contribution of
a single structure to articulation (Terband, Maassen, Van Lieshout and Nijland, 2010). Studies
have shown that the jaw plays an important role in tongue kinematics. The tongue kinematic
data of the present study were not decoupled from the jaw. Decoupling jaw movement from
tongue movement might have revealed a different pattern of target variability and influenced the
results of this study. This potential confounder will need to be explored further in research.

51
There are some limitations associated with anthropometry. First, ethnic differences
among people of all age groups have been demonstrated in anthropometry of the head and face
(Hajnis, Farkas, Ngim, Lee and Venkatadri, 1994; Kantero & Tiisala, 1971; Shuttleworth, 1939).
According to Farkas (1996), employing a representative sample in an anthropometry study in
North America is difficult. We did not control for ethnicity in the sample population, therefore,
having a multi-ethnic sample may have influenced the results of this study related to the
anthropometric measures. Second, anthropometry may be subject to inaccuracies. Three sources
of inaccuracies have been identified in the literature which includes the examiner’s skill in
anthropometry, the ability to locate craniofacial landmarks, and quality of measuring tools
(Farkas, 1996). Although we attempted to reduce the likelihood of inaccurate measurements by
addressing these sources, it is still possible that there were inaccuracies in the anthropometric
data of this study.

52
REFERENCES
Abbs, J. H., & Gracco, V. L. (1984). Control of complex motor gestures: Orofacial muscle
responses to load perturbations of lip during speech. Journal of Neurophysiology, 51(4),
705-723.
Alfonso, P.J., & Van Lieshout, P.H.H.M. (1997). Spatial and temporal variability in obstruent
gestural specification by stutterers and controls: Comparisons across sessions. In W.
Hulstijn, H.F.M. Peters, & P.H.H.M. Van Lieshout (Eds.), Speech production: Motor
control, brain research and fluency disorders (pp. 151-160). Amsterdam, The Netherlands:
Elsevier Publishers.
Anderson, A., Lowit, A., & Howell, P. (2008). Temporal and spatial variability in speakers with
parkinson’s disease and friedreich’s ataxia. Journal of Medical Speech-Language
Pathology, 16(4), 173-180.
Beck, R. J., Andriacchi, T. P., Kuo, K. N., Fermier, R. W., & Galante, J. O. (1981). Changes in
the gait patterns of growing children. Journal of Bone and Joint Surgery (British Volume),
63, 1452-1456.
Beckman, M. E., Jung, T.P., Lee, S., de Jong, K., Krishnamurthy, A. K., Ahalt, S. C., et al.
(1995). Variability in the production of quantal vowels revisited. Journal of the Acoustical
Society of America, 97, 471-490.
Berry, J. (2010). Assessment of NDI wave speech research system. Paper presented at Motor
Speech Conference. Savannah, GA.
Bhagyalakshmi G., Renukarya A. J., & Rajangam S. (2007). Metric analysis of the hard palate
in children with down syndrome - a comparative study. Down Syndrome Research and
Practice,12(1), 55-59.

53
Browman, C. P., & Goldstein, L. (1992). Articulatory phonology: An overview. Phonetica, 49,
155-180.
Brown, T., Barret, M. J., & Darroch, J. N. (1965). Craniofacial factors in two ethnic groups.
Growth, 29, 109-123.
Brunner, J., Fuchs, S., & Perrier, P. (2005). The influence of the palate shape on articulatory
token-to-token variability. ZAS Papers in Linguistics, 42, 43-67.
Brunner, J., Fuchs, S., & Perrier, P. (2009). On the relationship between palate shape and
articulatory behavior. Journal of Acoustical Society of America, 125(6), 3936-3949.
Buschang, P. H., Stroud, J., & Alexander, R. G. (1994). Differences in dental arch morphology
among adult females with untreated class I and class II malocclusion. European Journal of
Orthodontics, 16, 47-52.
Cheng, H. Y., Murdoch, B. E., Goozee, J. V., & Scott, D. (2007). Physiologic development of
tongue-jaw coordination from childhood to adulthood. Journal of Speech, Language, and
Hearing Research, 50(2), 352-360.
Cosman, M. D., & Falk, A. S. (1980). Delayed hard palate repair and speech deficiencies a
cautionary report. Cleft Palate Journal, 17(1), 27-33.
Coventry, K. R., Clibbens, J., Cooper, M., & Rood, B. (1997). Visual speech aids: A British
survey of use and evaluation by speech and language therapists. European Journal of
Disorders of Communication, 32, 203-216.
Dromey, C., & Sanders, M. (2009). Intra-speaker variability in palatometric measures of
consonant articulation. Journal of Communication Disorders, 42, 397-407.
Fant, C. G. (1960). Acoustic Theory of Speech Production, The Hague: Mouton.

54
Farkas, L. G. (1994). Examination. In L. G. Farkas (Eds.), Anthropometry of the head and face
(pp. 3-56). New York: Raven Press.
Farkas, L. G. (1996). Accuracy of anthropometric measurements: Past, present, and future.
Cleft Palate-Craniofacial Journal, 33, 10-22.
Farkas, L. G., Hreczko, T. A., & Katic, M. J. (1994). Craniofacial norms in north american
caucasians from birth (one year) to young adulthood. In L. G. Farkas (Eds.), Anthropometry
of the head and face (pp. 241-335). New York: Raven Press.
Farkas, L. G., Katic, M.J., Hreczko, T. A., Deutsch, C., & Munro, I. R. (1984). Anthropometric
proportions in the upper lip-lower lip-chin area of the lower face in young white adults.
American Journal of Orthodontics, 86(1), 52-60.
Ferrario, V. F., Sforza, C., Pizzini, G., Vogel, G., & Miani, A. (1993). Sexual dimorphism in the
human face assessed by Euclidean distance matrix analysis. Journal of Anatomy, 183, 593-
600.
Ferrario, V. F., Sforza, C., Schmitz, J. H., & Colombo, A. (1998). Quantitative descriptions of
the morphology of the human palate by a mathematical equation. Cleft Palate-Craniofacial
Journal, 35(5), 396-401.
Fitch, W. T., & Giedd, J. (1999). Morphology and development of the human vocal tract: A
study using magnetic resonance imaging. Journal of Acoustical Society of America, 106(3),
1511-1520.
Fitzpatrick, L., & Chasaide, A. N. (2002). Estimating lingual constriction location in high
vowels: a comparison of EMA- and EPG-based measures. Journal of Phonetics, 30, 397-
415.
55
Fletcher, S. G. (1989). Palatometric specification of stop, affricate, and sibilant sounds. Journal
of Speech and Hearing Research, 32, 736-748.
Fuchs, S., Perrier, P., Geng, C., & Mooshammer, C. (2006). What role does the palate play in
speech motor control? Insights from tongue kinematics for German alveolar obstruents. In J.
Harrington & M. Tabain (Eds.), Towards a better understanding of speech production
processes (pp. 149-164). New York: Psychology Press.
Fujimura, O. (1986). Relative invariance of articulatory movements: An iceberg model. In J. S.
Perkell and D. H. Klatt (Eds.), Invariance and variability in speech processes (pp. 226-242).
Hillsdale, N.J.: Lawrence Erlbaum.
Gay, T. (1974). A cinefluorographic study of vowel production. Journal of Phonetics, 2, 255-
266.
Gay, T. (1977). Articulatory movements in VCV sequences. Journal of the Acoustical Society
of America, 62(1), 183-193.
Gribble, P. L., Mullin, L. I., Cothros, N., & Mattar, A. (2003). Role of contraction in arm
movement accuracy. Journal of Neurophysiology, 89, 2396–2405.
Guenther, F. (1995). Speech sound acquisition, coarticulation, and rate effects in a neural
network model of speech production. Psychological Review, 102, 594-621.
Hajnis K., Farkas L. G., Ngim R. C. K., Lee S. T., & Venkatadri G. (1994). Racial and ethnic
morphometric differences in the craniofacial complex, In: Farkas LG (ed), Anthropometry of
the head and face. Second edition. New York:Raven Press, 201-218.
Hamilton, C. (1993). Investigation of the articulatory patterns of young adults with Down’s
syndrome using electropalatography. Down Syndrome Research and Practice, 1(1), 15-28.

56
Hamstra-Bletze, L., & Blote, A. W. (1990). Development of handwriting in primary school: A
longitudinal study. Perceptual and Motor Skills, 70, 759-770.
Handford, C. (2006). Serving up variability and stability. In K. Davids, S. Bennett & K. Newell
(Eds.), Movement system variability (pp. 73-83). Illinois: Human Kinetics.
Hardcastle, W. J., Gibbon, F. E., & Jones, W. (1991). Visual display of tongue-palate contact:
Electropalatography in the assessment and remediation of speech disorders. British Journal
of Disorders of Communication, 26, 41-74.
Higgins, M. B., Carney, A. E., & Schulte, L. (1994). Physiological assessment of speech and
voice production of adults with hearing loss. Journal of Speech, Language and Hearing
Research 37, 510-521.
Holland, S., Gabbay, J. S., Heller, J., O’Hara, C., Hurwitz, D., Ford, M., et al. (2007). Delayed
closure of the hard palate leads to speech problems and deleterious maxillary growth.
Plastic and Reconstructive Surgery, 119(4), 1302-1310.
Honda, K., Maeda, S., Hashi, M., Dembowski, J. S., & Westbury, J. R. (1996). Human palate
and related structures: their articulatory consequences. In: Proc. ICSLP. pp. 784-787.
Hoole, P., & Nguyen, N. (1997). Electromagnetic articulography in coarticulation research.
Forschungsberichte des Instituts fur Phonetik und Sprachliche Kommunikation der
Universitat Munchen, 35, 177-184.
Howard, S., & Varley, R. (1995). III: EPG in therapy using electropalatography to treat severe
acquired apraxia of speech. European Journal of Disorders of Communication, 30, 246-255.
Howells, W. W. (1957). The cranial vault: Factors of the size and shape. American Journal of
Physical Anthropology, 15, 19-48.

57
Howells, W. W. (1951). Factors of human physique. American Journal of Physical
Anthropology, 9, 159-192.
Hughes, O.M., & Abbs, J.H. (1976). Labial-mandibular coordination in the production of
speech: Implications for the operation of motor equivalence. Phonetica, 33(2), 199-221.
Ingerslev, C. H., & Solow, B. (1974). Sex differences in craniofacial morphology. Acta
Odontologica Scandanavica, 33, 85-94.
Jamison, P. L., & Ward, R. E. (1993). Measurement size, precision, and reliability in
craniofacial anthropometry: bigger is better. American Journal of Physical Anthropology,
90, 495-500.
Kasai, K., Moro, T., Kanazawa, E., & Iwasawa, T. (1995). Relationship between cranial base
and maxillofacial morphology. European Journal of Orthodontics, 17, 403-410.
Katz, W. F., Bharadwaj, S. V., & Carstens, B. (1999). Electromagnetic articulography treatment
for an adult with Broca’s Aphasia and Apraxia of Speech. Journal of Speech, Language,
and Hearing Research, 42(6), 1355-1366.
Kleinow, J., Smith, A., & Ramig, L. (2001). Speech motor stability in IDP: Effects of rate and
loudness manipulations. Journal of Speech, Language, and Hearing Research, 44, 1041-
1051.
Kuehn, D. R., & Moll, K. L. (1976). A cinradiographic study of VC and CV articulatory
velocities. Journal of Phonetics, 4, 303-320.
Laboissière, R., Lametti, D. R., & Ostry, D. J. (2009). Impedance control and its relation to
precision in orofacial movement. Journal of Neurophysiololgy, 102, 523-531.
Lametti, D. R., Houle, G., & Ostry, D. J. (2007). Control of movement variability and the
regulation of limb impedance. Journal of Neurophysiology, 98, 3516-3524.
58
Latash, M. L., Scholz, J. P., & Schoner, G. (2002). Motor control strategies revealed in the
structure of motor variability, Exercise and Sport Sciences Reviews, 30(1), 26-31.
Liberman, A. M., & Mattingly, I. G. (1985). The motor theory of speech perception revised.
Cognition, 21, 1-36.
Lindblom, B. (1990). Explaining phonetic variation: A sketch of the H&H theory. In W.
Hardcastle & A. Marchal (Eds.), Speech production and speech modeling (pp. 403-440).
Dordrecht: Kluwer Academic Publishers.
Lindblom, B. (1983). Economy of speech gestures. In P. MacNeilage (Eds.), The production of
speech (pp. 217-246). New York: Springer.
Lofqvist, A. (2006). Position variability in stop and fricative production (A). Journal of the
Acoustical Society of America, 119(5), 3393-3393.
Lohmander-Agerskov, A., Dotevall, H., Lith, A., & Soderplam, E. (1996). Speech and
velopharyngeal function in children with an open residual cleft in the hard palate, and the
influence of temporary cover. Cleft Palate-Craniofacial Journal, 33(4), 324-332.
Manoel, E., & Connolly, K. (1995). Variability and the development of skilled actions,
International. Journal of Psychophysiology, 19, 129-147.
Marks, G. C., Habicht, J., & Mueller, W. H. (1989). Reliability, dependability, and precision of
anthropometric measurements. American Journal of Epidemiology, 130(3), 578-587.
McAuliffe, M. J., Ward, E. C., & Murdoch, B. E. (2001). Tongue-to-palate contact patterns and
variability of four English consonants in an /i/ vowel environment. Logopedics, Phoniatrics,
Vocology, 26, 165-178.

59
Mooshammer, C., Geumann, A., Hoole, P., Alfonso, P., Van Lieshout, P.H.H.M., & Fuchs, S.
(2003). Coordination of lingual and mandibular gestures for different manners of
articulation. Proceedings of the 15th International Congress of Phonetic Sciences, 81-84.
Mooshammer, C., Perrier, P., Fuchs, S., Geng, C., & Pape, D. (2004). An EMMA and EPG
study on token-to-token variability. AIPUK, 36, 47-63.
Muller, H., & Sternad, D. (2004). Decomposition of variability in the execution of goal-oriented
tasks: Three components of skill improvement. Journal of Experimental Psychology, 30(1),
212-233.
Newell, K.M., Deutsch, K.M., Sosnoff, J.J., & Mayer-Kress, G. (2006). Variability in motor
output as noise: A default and erroneous proposition? In K. Davids, S. Bennett & K. Newell
(Eds.), Movement system variability (pp. 73-83). Illinois: Human Kinetics.
Nieto-Castanon, A., Guenther, F. H., Perkell, J. S., & Curtin, H. (2005). A modeling
investigation of articulatory variability and acoustic stability during American English /r/
production. Journal of the Acoustical Society of America, 117, 3196-3212.
Öhman, S. (1966). Coarticulation in VCV utterances: Spectrographic measurements. Journal
of the Acoustical society of America, 39, 151-168.
Perkell, J.S. (1997). Articulatory Processes. In W. Hardcastle & J. Laver (Eds.). The handbook
of phonetic sciences (pp. 333-370). Oxford: Blackwell Publishers.
Perkell, J.S. (1979). On the nature of distinctive features: Implications of a preliminary vowel
production study. In B. Lindblom & S. Öhman (Eds.), Frontiers of speech communication
research. London: Academic Press.

60
Perkell, J. S., Matthies, M. L., Svirsky, M. A., & Jordan, M. I. (1993). Trading relations between
tongue-body raising and lip rounding in production of the vowel /u/: A pilot “motor
equivalence” study. Journal of the Acoustical Society of America, 93(5), 2948-2961.
Perkell, J.S., Matthies, M.L., Svirsky, M.A., & Jordan, M.I. (1995). Goal-based speech motor
control: A theoretical framework and some preliminary data, Journal of Phonetics, 23, 23-
35.
Perkell, J. S., & Nelson, W. (1985). Variability in production of the vowels /i/ and /a/. Journal
of the Acoustical Society of America, 77(5), 1889-1895.
Perkell, J. S., Zandipour, M., Matthies, M. L., & Lane, H. (2002). Economy of effort in different
speaking conditions. I: A preliminary study of intersubject differences and modeling issues,
Journal of the Acoustical Society of America, 112(4), 1627-1541.
Perrier, P., Boe, L.J., & Sock, R. (1992). Vocal tract area function estimation from midsagittal
dimensions with CT scans and a vocal tract cast: Modeling the transitions with two sets of
coefficients. Journal of Speech Language and Hearing Research, 35(1), 53-67.
Polat, O., & Kaya, B. (2007). Changes in cranial base morphology in different malocclusions.
Orthodontics and Craniofacial Research, 10, 216-221.
Riely, R. R., & Smith, A. (2003). Speech movements do not scale by orofacial structure size.
Journal of Applied Physiology, 94, 2119-2126.
Saunders, S. R., Popovich, F., & Thompson, G. W. (1980). A family study of craniofacial
dimensions in the Burlington Growth Center sample. American Journal of Orthodontics, 78,
394-403.
Shiller, D. M., Houle, G., Ostry, D.J. (2005). Voluntary control of human jaw stiffness. Journal
of Neurophysiology, 94, 2207-2217.
61
Shiller, D. M., Laboissière, R., & Ostry, D. J. (2002). The relationship between jaw stiffness and
kinematic variability in speech. Journal of Neurophysiology, 88, 2329-2340.
Shuttleworth, F. K. (1939). The physical and mental growth of girls and boys age six to nineteen
in relation to age at maximum growth. Washington, D. C.: Society for Research in Child
Development, National Research Council.
Solow, B. (1966). The pattern of craniofacial associations: A morphological and
methodological correlation and factor analysis study on young male adults. Acta
Odontologica Scandinavica, 24, supplement 46.
Stevens, K. N. (1989). On the quantal nature of speech. Journal of Phonetics, 17, 3-45.
Stone, M. (1995). How the tongue takes advantage of the palate during speech. In F. Bell-Berti
& J. R. Lawrence (Eds.), Producing speech: contemporary issues for Katherine Safford
Harris (pp.143-153). New York: AIP Press.
Stone, M., & Lundberg, A. (1994). Tongue-palate interactions in consonants vs. vowels, in
Proceedings of the Third International Conference on Spoken Language Processing,
Yokohama, Japan, pp. 49–52.
Stoner, M. M. (1955). A photometric analysis of the facial profile. American Journal of
Orthodontics, 41, 453-469.
Sussman, H. M., Duder, C., & Dalston, E. (1999). An acoustic analysis of the development of
CV coarticulation. Journal of Speech Language and Hearing Research, 42, 1080-1096.
Terband, H., Maassen, B., Van Lieshout, P.H.H.M., & Nijland, L. (2010). Stability and
composition of functional synergies for speech movements in children with developmental
speech disorders. Journal of Communication Disorders, 44(1), 59-74.

62
Tsao, Y. C., Weismer, G., & Iqbal, K. (2006). The effect of intertalker speech rate variation on
acoustic vowel space. Journal of the Acoustical Society of America, 119(2), 1074-82.
Van Lieshout, P.H.H.M., & Namasivayam, A. K. (2010). Speech motor variability in people
who stutter. In B. Maasen & P.H.H.M. Van Lieshout (Eds.), Speech motor control: New
developments in basic and applied research (pp. 191-214). New York: Oxford University
Press.
Wong, M. N., Murdoch, B. E., & Whelan, B. (2010). Kinematic analysis of lingual function in
dysarthric speakers with Parkinson’s disease: An electromagnetic articulograph study.
International Journal of Speech-Language Pathology, 12(5), 414-425.
Wuerpel, E. (1936). On facial balance and harmony. The Angle Orthodontist, 7, 81-89.
Yunusova, Y., Green, J.R., & Mefferd, A. (2009). Accuracy assessment for AG500
electromagnetic articulograph. Journal of Speech, Language, and Hearing Research, 52,
547-555.
Zeger, S. L., & Liang, K. Y. (1986). Longitudinal data analysis for discrete and continuous
outcomes. Biometrics 42, 121-130.
Related Documents