1 The Effect of Organizational Life Cycle Stage on the Use of Activity-Based Costing JUHA-PEKKA KALLUNKI HANNA SILVOLA Department of Accounting and Finance, University of Oulu, PO Box 4600, FIN-90014 University of Oulu, Finland First version: 14 February 2005 Final version: 24 August 2007 Accepted for publication in Management Accounting Review Contact Address: Juha-Pekka Kallunki, Department of Accounting and Finance, University of Oulu, PO Box 4600, FIN-90014 UNIVERSITY OF OULU, Finland. Phone: (+358) 8 553 2956. Fax: (+358) 8 553 2906. E-mail: [email protected] Acknowledgements: We gratefully acknowledge the valuable comments and suggestions on the earlier versions of this paper provided by Robert H. Chenhall, Aldonio Ferreira, Petri Sahlström and Jussi Nikkinen. We also thank the seminar participants at the 2005 Annual Meeting of the European Accounting Association, the Faculty Research Workshop at the University of Oulu in 2005 and the 2006 Annual Meeting of the Finnish Graduate School of Accounting. This study was partially undertaken when Hanna Silvola was visiting Monash University.

Welcome message from author
This document is posted to help you gain knowledge. Please leave a comment to let me know what you think about it! Share it to your friends and learn new things together.
Transcript
1
The Effect of Organizational Life Cycle Stage
on the Use of Activity-Based Costing
JUHA-PEKKA KALLUNKI
HANNA SILVOLA
Department of Accounting and Finance,
University of Oulu,
PO Box 4600, FIN-90014 University of Oulu, Finland
First version: 14 February 2005
Final version: 24 August 2007
Accepted for publication in Management Accounting Review
Contact Address:
Juha-Pekka Kallunki, Department of Accounting and Finance, University of Oulu, PO
Box 4600, FIN-90014 UNIVERSITY OF OULU, Finland. Phone: (+358) 8 553 2956.
Fax: (+358) 8 553 2906. E-mail: [email protected]
Acknowledgements: We gratefully acknowledge the valuable comments and
suggestions on the earlier versions of this paper provided by Robert H. Chenhall,
Aldonio Ferreira, Petri Sahlström and Jussi Nikkinen. We also thank the seminar
participants at the 2005 Annual Meeting of the European Accounting Association, the
Faculty Research Workshop at the University of Oulu in 2005 and the 2006 Annual
Meeting of the Finnish Graduate School of Accounting. This study was partially
undertaken when Hanna Silvola was visiting Monash University.
2
The Effect of Organizational Life Cycle Stage on the Use of Activity-
Based Costing
Abstract
This paper investigates if the use of an activity-based cost accounting system
differs among firms in different organizational life cycle stages. We apply the Miller
and Friesen (1983, 1984) life cycle model according to which the internal characteristics
of firms and the external contexts in which the firms operate differ across firms
depending on their stages of development. Based on the organizational life cycle
theories we hypothesize that the use of the activity-based costing is more common
among firms in maturity and revival phases than among firms in a growth phase. Our
empirical analyses based on a questionnaire to 105 Finnish firms operating in various
industries and in different life cycle stages support our hypothesis. We conduct various
robustness checks of the results using several control variables and checking the effect
of potential non-response bias. Our results remain essentially the same.
Keywords: Activity-based costing system, organizational life cycle, management
accounting
JEL Classification: M41
1. Introduction
In a growth stage, firms are characterized by a rapid sales growth and an
expansion of activities and products (Miller and Friesen, 1984). In a maturity stage, the
sales of the firm level off, more formal and bureaucratic organization structures are
established and innovation declines. In the revival stage, firms adopt divisionalized
structures for the first time to cope with more complex and heterogeneous markets
(Miller and Friesen, 1984). These life cycle stages of the firm are described in
organizational life cycle theories according to which the internal characteristics of firms
and the external contexts in which the firms operate differ across firms depending on the
stage of development (e.g. Greiner, 1972; Miller and Friesen, 1983, 1984; Merchant,
1997).
3
A firm‟s life cycle stage is a contingency to which organizational responses have
to be matched (e.g. Miller and Friesen, 1983, 1984). This implies that the use of
management accounting systems differs across the stages of organizational life cycle as
different systems are needed in different stages. Firms‟ need for formal management
accounting and control systems is notably greater in the later life cycle stages than it is
in the early stages. However, as Md. Auzair and Langfield-Smith (2005) point out,
organizational life-cycle is a fairly recent variable in the empirical management
accounting system literature, and life cycle stage has not been linked to most of the
management control dimensions. In a few existing empirical studies, it has been
reported that the life cycle stage is an important driver of the emergence of management
control systems (Miller and Friesen, 1984; Moores and Yuen, 2001; Davila, 2005; Md.
Auzair and Langfield-Smith, 2005; Granlund and Taipaleenmäki, 2005). For instance,
Miller and Friesen (1984) report that firms in the maturity and revival phases put
significantly more emphasis on formal cost controls than do firms in the growth stage.
Md. Auzair and Langfield-Smith (2005) use a self-categorization measure based on the
firm‟s own assessment of its life cycle stage and report that organizational life cycle,
among other contingent variables, has a significant effect on the design of a firm‟s
management control systems.
In this paper, we investigate if the use of the activity-based cost accounting system
differs across life cycle stages of the firm1. The life cycle literature (e.g. Miller and
Friesen, 1983, 1984) reports that increased competition and diversification in products
and markets cause firms in the maturity and revival phases to put significantly more
1 Hilton (2005, page 786) describes activity-based cost accounting system as „a two-stage procedure used
to assign overhead costs to products and services produced. In the first stage, significant activities are
identified, and overhead costs are assigned to activity cost pools in accordance with the way the
resources are consumed by the activities. In the second stage, the overhead costs are allocated from each
activity cost pool to each product line in proportion to the amount of the cost driver consumed by the
product line‟. In addition, Bjornenak and Mitchell (2002) provide an excellent review of the activity-
based costing journal literature and Lukka and Granlund (2002) that of activity-based costing research
genres.
4
emphasis on formal cost controls and performance as opposed to firms in the growth
phase. In addition, mature and revival firms have greater resources for experimenting
with advanced management accounting systems and they have more complex, more
formal and more bureaucratic organizational structures creating a need for these systems
compared to growth firms. These differences in the internal characteristics of the firm
and the environments in which the firms operate lead to more widespread use of
advanced costing systems, such as activity-based costing, among mature and revival
firms than among growth firms. The paper contributes to the management accounting
literature by exploring if the life cycle of the firm has a role of its own apart from that of
the size of the firm in the use of activity-based costing. Although firms in the maturity
and revival phases are often larger than firms in a growth phase, not all mature or
revival firms are necessarily large in size. In other words, even small firms are likely to
use activity-based costing if they have a managerial need for an advanced cost-
accounting system due to their life cycle stage. We therefore expand the earlier studies
investigating the effect of the size of the firm on the use of activity-based costing
without considering the life cycle stage of the firm. Such earlier studies include Drury
and Tayles (1994), Innes and Mitchell (1995), Bjornenak (1997), Chenhall and
Langfield-Smith (1998), Malmi (1999) and Al-Omiri and Drury (2007).
We feel that this study has important implications for the practice of management
accounting research; it sheds light on whether the actual underlying organizational need
indicated by the life cycle stage of the firm rather than simply the size of the firm drives
the firms‟ use of an activity-based costing. In addition, although activity-based costing
has been scrutinised for almost two decades, it continues to be actively investigated
(e.g. Al-Omiri and Drury, 2007). One reason for this is that implementations of ERP
(Enterprise Resource Planning) systems allowing firms to integrate advanced cost
5
accounting such as activity-based costing software with ERP systems, have increased
remarkably in recent years (e.g. Dechow and Mouritzen, 2004; Granlund and Malmi,
2002; Granlund (2007).
Our empirical analyses based on the cross-sectional survey data of 105 firms
operating in several industries and in different life cycle stages, support our hypothesis.
The results indicate that the characteristics of the firm reported in the life cycle literature
to affect the use of advanced cost accounting systems differ across life cycle phases, i.e.
firms in the maturity and revival phases have a greater organisational size, lower
profitability, a more diversified product/service range and have more often gained a
stock market listing as opposed to firms in the growth phase. More importantly, we find
that the use of activity-based costing is significantly more common among firms in
maturity and revival phases than it is among firms in a growth phase. In addition, we
find that it is the life cycle stage rather than the size or age of the firm which is decisive
in explaining the use of the activity-based costing among firms. These results remain
essentially the same after several control variables and checking the effect of potential
non-response bias have been applied.
We divide the remainder of the body of this paper into four sections. In Section 2
we review the relevant literature and develop our hypothesis. We describe the survey
data and research method in Section 3 and report the results of preliminary data
analyses. In Section 4, we report the empirical results including the corresponding
robustness tests and present concluding remarks in Section 5.
6
2. Theory and hypothesis development
2.1. Characteristics of firms in different organizational life cycles stages
Organizational life cycle theories suggest that the characteristics of organizations
change according to the life cycle stages (e.g. Greiner, 1972; Churchill and Lewis,
1983; Miller and Friesen, 1983, 1984; Merchant, 1997; Moores and Yuen, 2001). In the
birth stage, the prime distinguishing feature of the firms is that they are young,
dominated by their owners, and have simple and informal organizational structures
(Miller and Friesen, 1984). For this reason, the birth stage is also referred to as an
„entrepreneurial stage‟. The founders of these firms are technically or entrepreneurially
oriented, preferring to keep management activities to a minimum. They prefer to devote
their efforts to developing and selling new products, and they rely on a minimal amount
of information in decision-making. The growth stage occurs once the firm has
established its distinctive competences and has achieved some initial product-market
success (Miller and Friesen, 1984). In the growth stage, firms are characterized by rapid
sales growth. Growth firms rely more on formal rules and procedures to ensure
organizational and administrative efficiency. This is due to the expansion of activities
and products and increasingly centralized structures. Some authority is delegated to
middle-managers who devote greater effort to collecting and processing information
needed in decision-making. Growth firms extend their product ranges, but this results in
a more complex array of products for a given market rather than positions on widely
differing markets (Miller and Friesen, 1984).
The maturity stage follows the growth stage as the sales levels stabilize and the
level of innovations falls (Miller and Friesen, 1984). In the maturity stage, the
administrative task of the firm becomes more complex, which in turn leads to formal
7
and bureaucratic structures. In fact, Quinn and Cameron (1983) define this stage as the
„formalization and control stage‟. Mature firms place more emphasis on efficiency and
profitability and on strategies replacing innovations. Decision-making is dominated by a
few key managers and structures remain centralized. In the revival stage, firms adopt
divisionalized structures for the first time to cope with the more complex and
heterogeneous markets (Miller and Friesen, 1984). Revival firms focus their strategies
on diversification and expansion of product-market scope to achieve turnaround and
attain new growth (e.g. Miller and Friesen, 1984; Gupta and Chin, 1990; Merchant,
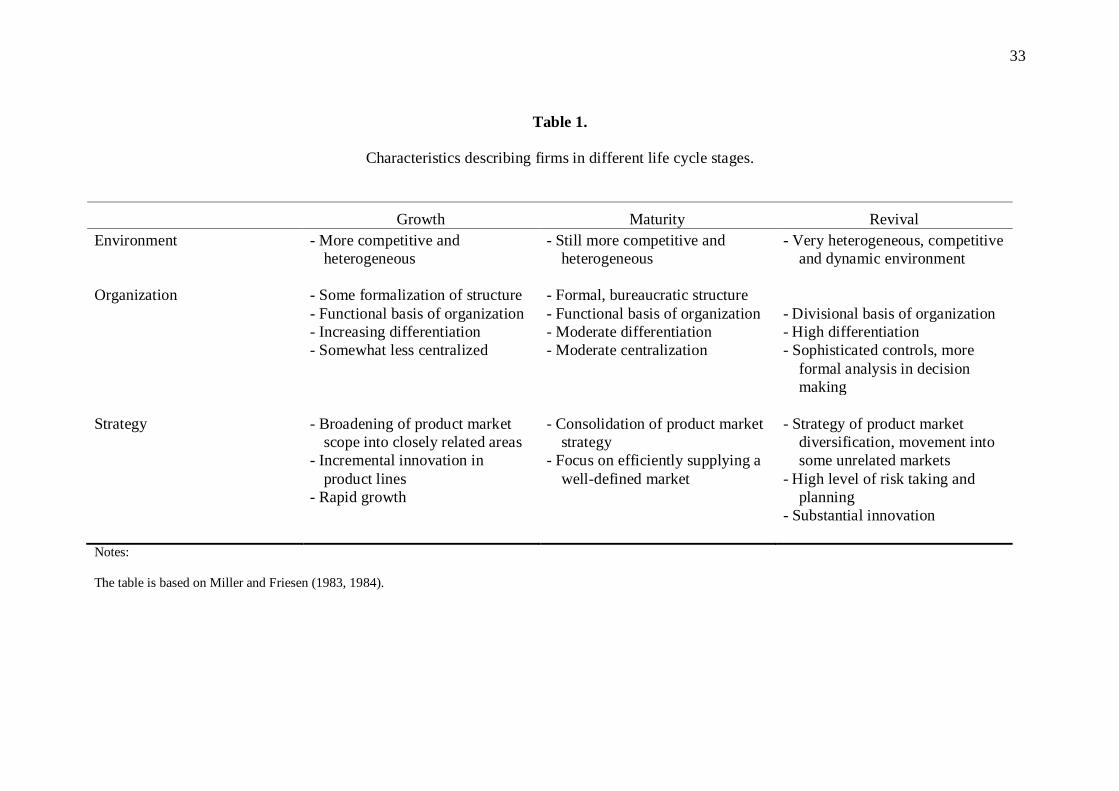
1997). They also emphasise more sophisticated control and planning systems. Table 1
summarises the characteristics of the firms in different life cycle stages.
(Insert Table 1 about here)
A few recent studies have applied the Miller and Friesen typology to the life
cycle stages of the firm in connection with management accounting. Md. Auzair and
Langfield-Smith (2005) measure the life cycle stage of the firm using a self-
categorization measure proposed by Kazanjian and Drazin (1990), and report that
organizational life cycle, among other contingent variables, has a significant effect on
the design of a firm‟s management control systems. Davila (2005) reports that the size
and age of the firm, the replacement of the founder as CEO and the existence of outside
investors are drivers of the emergence of management control systems Finally, Moores
and Yuen (2001) explore the use of management accounting systems at different life
cycle stages and find that the formality of the management accounting systems varies
across life cycle stages.
8
2.2. The use of activity-based costing in different organizational life cycle stages
The life cycle literature implies that there are several reasons why the use of
advanced management accounting systems such as activity-based costing is greater
among firms in the maturity and revival phases than among firms in the growth phase.
These reasons are due to differences in the administrative task, business environment,
strategies and organization structures between firms in different life cycle phases. First,
as a result of a more complex, more challenging and more competitive business
environment, the administrative task of mature and revival firms is more complex than
that of growth firms (Miller and Friesen, 1983; Chandler, 1962). This creates a need for
a more sophisticated decision-making approach utilizing sophisticated management
accounting systems such as activity-based costing. Second, firms in the growth phase
put emphasis on growth and on expanding their market shares, whereas firms in the
maturity and revival phases put clearly more emphasis on minimizing production costs
in mature, highly competitive markets rather than on growth. This is because increased
competition decreases the profitability of the firms in the maturity and revival stages.
Therefore, cost-effectiveness and profitability are more important in the maturity and
revival phases than they are in the growth phase. Consequently, firms in the maturity
and revival phases put more emphasis on formal controls, such as formal cost controls,
as they need to produce products efficiently and earn adequate profit margins on a more
competitive market (Miller and Friesen, 1984).
Third, maturity and revival firms experience increased diversification in their
products and markets (Miller and Friesen, 1984). Increased diversification in products
and markets together with increased competition cause firms in the maturity and revival
phases to put more emphasis on reducing, controlling and understanding factors driving
their costs as opposed to firms in a growth phase (e.g. Miller and Friesen, 1984; Gupta
9
and Chin, 1990; Merchant, 1997; Moores and Yuen, 2001; Md. Auzair and Langfield-
Smith, 2005). Therefore, mature and revival firms especially can be expected to use
activity-based costing, as activity-based costing should help managers to understand
cost hierarchies, to identify relevant revenues and costs (e.g. Jones and Dugdale, 2002),
and to achieve a better financial performance (e.g. Kennedy and Affleck-Graves, 2001).
Fourth, the life cycle literature suggests that the organizational size of the firms is
greater in maturity and revival phases than it is in the growth phase. As Chenhall and
Lanfield-Smith (1998) point out, greater organizational size leads to greater complexity
of tasks, which requires more division of labour. The specialization of tasks leads to
more extensive differentiation, i.e. similar tasks are grouped within common units
(Chenhall and Lanfield-Smith, 1998; Blau et al., 1976). As a result, it becomes more
difficult to ensure that organizational subunits are acting towards the achievement of a
common purpose (Lawrence and Lorsch, 1967). More sophisticated integrative
mechanisms such as information systems are then developed to coordinate the activities
of subunits (Chandler, 1962). Management accounting innovations such as activity-
based costing are examples of such information systems (Chenhall and Lanfield-Smith,
1998). In addition, firms in the maturity and revival stages as result of greater
organizational size have greater resources to experiment with administrative innovations
such as advanced management accounting systems. In sum, greater organizational size
and greater resources can be expected to lead to more widespread use of activity-based
costing among firms in the maturity and revival stages as opposed to firms in the growth
stage.
Fifth, the life cycle literature suggests that firms in the mature and revival stages
have more centralized, more formal and more bureaucratic organization structures as
opposed to firms in the growth stage (e.g. Miller and Friesen, 1984; Quinn and
10
Cameron, 1983; Moores and Yuen, 2001). Gosselin (1997) reports that among
organizations that adopt activity-based costing more centralized and more formal
organizations are more associated with the implementation of activity-based costing in
comparison to decentralized and less formal organizations. He also finds that
organizations that adopt and implement activity-based costing are bureaucracies. It
follows from these results that the use of the activity-based costing should also be more
common among firms in the maturity and revival phase than among firms in a growth
phase due to the more centralized, more formal and more bureaucratic organization
structures of the mature and revival firms.
The literature discussed above leads us to the following hypothesis on the use of
activity-based costing in different life cycle stages of the firm2:
Hypothesis 1: The use of activity-based costing is greater among firms in maturity and
revival phases than among firms in a growth phase.
While firms may use activity-based costing for different reasons (see Section 2.3.),
the life cycle theories imply that the life cycle stage of the firm should affect the reasons
for using activity-based costing in the same way as it affects the actual use of activity-
based costing. In other words, the reasons for using activity-based costing in different
life cycle phases should reflect the differences in the managerial need for using it in
each life cycle phase, as suggested by life cycle theories. As noted earlier, the life cycle
theories suggest that the use of activity-based costing should be more widespread
among mature and revival firms, because these firms are less profitable and they have to
put more emphasis on reducing, controlling and understanding the factors driving their
2 We emphasize that we propose a hypothesis on how widespread the use of activity-based costing is in
different life-cycle stages. We do not hypothesize when firms begin to use activity-based costing in their
life-cycle.
11
costs as opposed to firms in a growth phase. Hence, the need to reduce, control and
understand factors driving the costs should also be a more important reason for using
activity-based costing among the firms in the maturity and revival phases than among
firms a growth phase. Similarly, life cycle theories imply that the administrative task of
mature and revival firms is more complex than that of growth firms, necessitating more
sophisticated management accounting system such as activity-based costing. Therefore,
a need to improve and modernize decision-making by using activity-based costing
should be a more important reason for using activity-based costing among mature and
revival firms than among growth firms. In sum, we propose the following hypothesis on
the reasons for using of activity-based costing at different life cycle stages of the firm:
Hypothesis 2: A need to reduce and control the costs, a need to understand the factors
driving the costs and a need to improve and modernize decision-making
should be more important reasons for using an activity-based costing
among firms in maturity and revival phases than among firms in a
growth phase.
2.3. Other characteristics of the firm affecting the use of activity-based costing
There are also other characteristics of the firm that need to be controlled for when
investigating the use of the activity-based costing at different organizational life cycle
stages. Some of these characteristics and those describing the life cycle stage of the firm
are partly inter-related (e.g. the size, age, product/service diversity and stock market
listing of the firm). Earlier studies (e.g. Davila, 2005) have used the size and age of the
firm as measures of the life cycle stage. However, our aim is to isolate the role of the
life cycle of the firm from that of the other characteristics of the firm by using the self-
12
categorization measure proposed by Md. Auzair and Langfield-Smith (2005) and
Kazanjian and Drazin (1990). Therefore, in our analyses we control for the effect of the
other characteristics of the firm on the use of activity based cost accounting.
First, the earlier literature reports that the use of activity-based costing increases as
the size of the firm increases (e.g. Drury and Tayles, 1994; Moores and Chenhall, 1994;
Innes and Mitchell, 1995; Bjornenak, 1997; Chenhall and Langfield-Smith, 1998; Baird
et al., 2004). Second, the earlier literature reports that the use of formal management
control systems increases as the firm grows older (e.g. Davila, 2005). Third, the use of
activity-based costing has been reported to be more common among firms having high
product/service diversity (e.g. Bjornenak, 1997; Malmi, 1999). Fourth, as Cooper and
Kaplan (1988) points out, firms having a complex production process tend to use more
sophisticated cost accounting systems compared to other firms. Fifth, the educational
level of the CEO of the firm has been reported to be positively related the use of formal
management accounting systems (e.g. Graham and Harvey, 2001; Davila, 2005). Sixth,
as Davila (2005) and Granlund and Taipaleenmäki (2005) report, firms have to meet the
expectations of venture capital investors when developing their management control
systems. Therefore, venture capital investors may require firms to use advanced
management accounting systems such as activity-based costing. Seventh, firms listed on
a stock exchange have been reported to use advanced management accounting systems
(Granlund and Taipaleenmäki, 2005; O‟Connor et al., 2004). Finally, earlier studies
report that the use of activity based costing differs between manufacturing and service
firms, because service firms may have fewer activities for cost allocation (Lukka and
Granlund, 1996; Hussain et al., 1998). In the empirical analyses, we control for the
effect of all the above-mentioned factors on the use of activity based costing of firms.
Section 3 describes the empirical measures of these factors.
13
3. Research method
3.1. Sample and survey procedure
The data used in the study were collected by a survey questionnaire (Dillman,
1999; Van der Stede et al., 2005). The final questionnaire was mailed to 500 Finnish
firms randomly selected from a database of firms located in the Helsinki area. The
database is maintained by Statistics Finland. The firms are of different sizes and they
operate in various industries, because we want to test our hypotheses on the effect of the
life cycle stage of the firm on the use of activity-based costing such that the results can
be generalized to firms with different sizes and operating in different industries. Pilot
tests were undertaken with groups of chief accountants, financial directors and
academics to refine the design and focus the content. We received some advice on
survey design and formulation to make the survey more explicit and easier to answer. A
respondent who was typically a financial director, chief accountant, senior management
accountant or chief executive, was the most eligible person within each firm to complete
the survey. The survey package included a covering letter explaining the purpose of the
research and a link to the web site where respondents could also complete the
questionnaire. Respondents answered anonymously using the Internet questionnaire or
by mail. A reminder was mailed three weeks later which gave us 16 further responses.
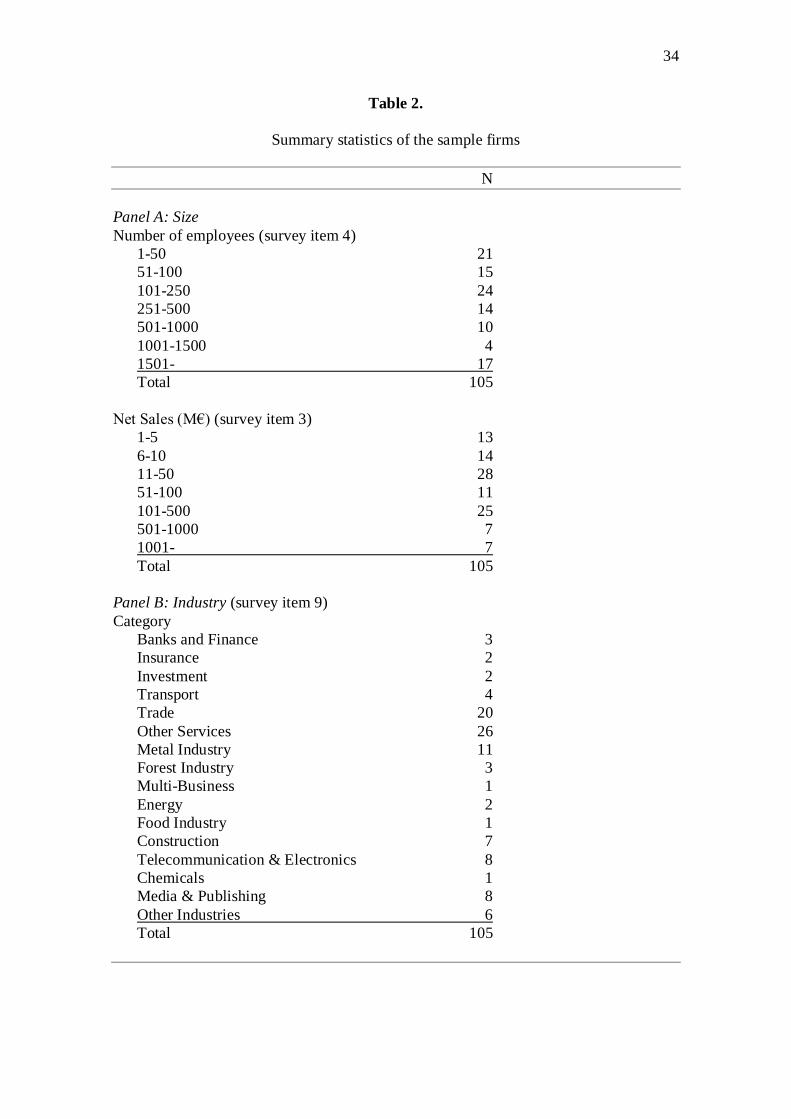
All in all, we received 105 responses out of the 500 recipients giving a response rate of
21 percent. In addition, five respondents phoned us to indicate that they did not have
enough time to participate. We received 15 responses via the Internet and 90 responses
via mail. Table 2 reports the summary statistics of the sample firms.
(Insert Table 2 about here)
14
As Van der Stede et al. (2005) suggest, non-response bias tests are needed to
ensure the representativeness of the sample. We test the potential effect of non-response
bias on our results by comparing the mean values of the survey items of the earliest 20
percent of responses received to the mean values of variables of the latest 20 percent of
responses received. In addition, we also compare the mean values of the variables of the
postal and Internet responses. There were no significant differences, which provides some
evidence for absence of response bias. In addition, a chi-square test indicates that the
respondents appeared to represent the broader sample frame with no significant
differences in industry between responding and non-responding firms.
3.2. Measures
The wording of items in the questionnaire is provided in Appendix. The
questionnaire includes items measuring the organizational life cycle stage, the use of
activity-based costing, reasons for using activity-based costing and other characteristics
of the firm that are likely to affect the use of activity-based costing. The questionnaire
was designed to use survey items used in earlier studies to reduce response error, if
respondents do not fully understand questions (e.g. Dillman, 1999; Van der Stede et al.,
2005). In this section, we describe the survey items in details.
3.2.1. Measure of the organizational life cycle stage of the firm
Our measure for the organizational life cycle stage is based on a well-known life
cycle model proposed by Miller and Friesen (1983, 1984) in which firms go through
different phases in which the strategies, organizational structures and decision-making
styles of the firm vary across life cycles. Since the Miller and Friesen life cycle model is
based on common life cycle indicators, it can be applied to firms of different sizes
15
operating in different industries. In addition, the Miller Friesen model has been tested in
many empirical studies (e.g. Friesen and Miller, 1984; Moores and Yuen, 2001; Davila,
2005). Following Kazanjian and Drazin (1990) and Md. Auzair and Langfield-Smith
(2005) we use a self-categorization measure to identify the life cycle stage of the firm,
i.e. we asked firms to define their current life cycle stage (survey item 13 in Appendix)3.
Life cycle stages are defined as in Miller and Friesen (1983), i.e. firms were asked to
state whether they were in the birth, growth, maturity, revival or decline life cycle stage.
However, only one firm chose birth stage and another one chose decline stage. We
classify the birth firm as a growth firm and the decline firm as a revival firm. In
empirical analyses, we re-estimate all the regression such that these two observations
were excluded, but the results remain the same.
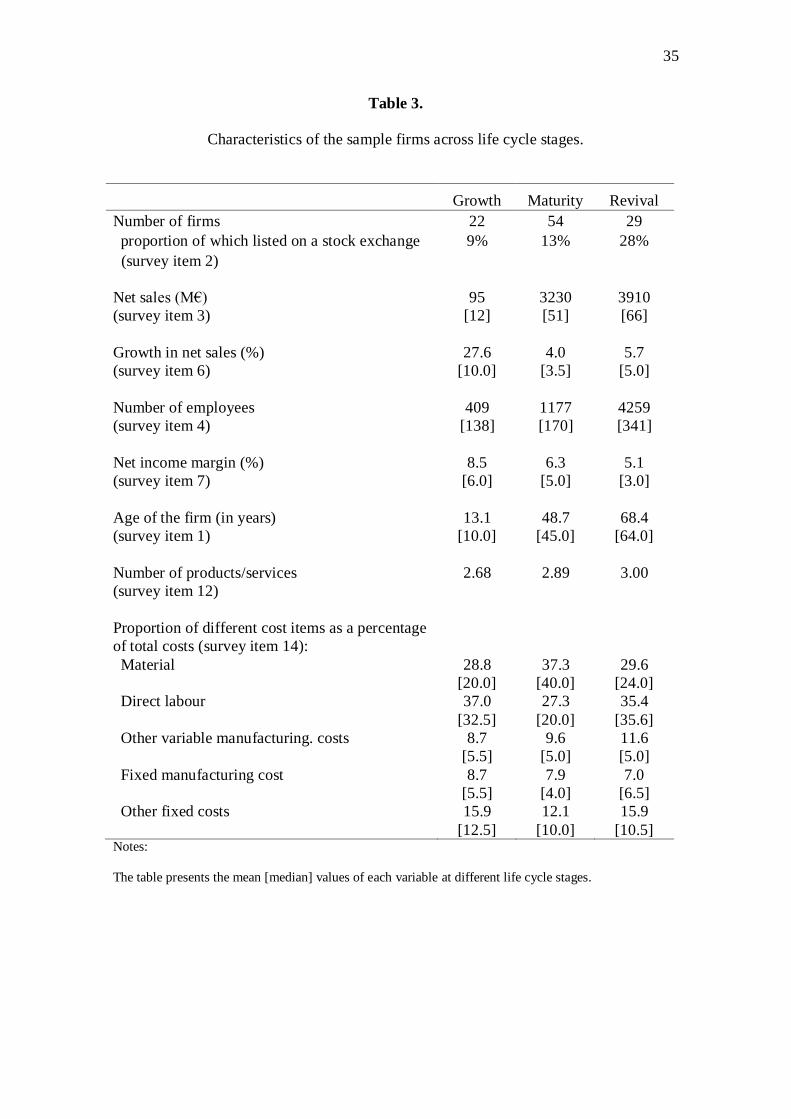
Table 3 reports summary statistics of the characteristics of the firms in different
life cycle stages based on the self-categorization measure. The results confirm that the
characteristics of the firms differ across life cycle phases as reported in the life cycle
literature (e.g. Miller and Friesen, 1983, 1984). More importantly, the characteristics of
the firm that life cycle literature has reported to affect the use of advanced cost
accounting systems differ across life cycle phases. The results reported in Table 3
indicate that, in comparison to firms in the growth phase, firms in the maturity and
revival phases have larger organisational size, lower profitability and a more diversified
product/service range. Also, the proportion of firms having stock market listing is
greater in the maturity and revival phases than it is in the growth phase. Because
gaining a stock market listing has been reported to increase the complexity of the
administrative task and the formality of the organisational structure (e.g. Granlund and
3 We emphasize that this methodology for analysing the use of a specific management accounting system
is not ours, but it is used in the life cycle literature cited in this paper. We also recognise that any research
methodology has its limitations. As we have discussed earlier, we empirically test a hypothesis on how
widespread the use of activity-based costing is in different life-cycle stages.
16
Taipaleenmäki, 2005; Megginson and Netter, 2001), this result provides some evidence
that maturity and revival firms have more complex administrative tasks and more
formal organisational structures compared to firms in the growth phase. Finally, Table 3
reports the cost structures of the sample firms across life cycle stages (survey item 14),
because differences in the cost structures of firms may explain their use of activity-
based costing (e.g. Lukka and Granlund, 1996). This measure is based on Lukka and
Granlund (1996). However, the results indicate no differences in the cost structures of
firms in the growth phase vs. the maturity and revival phases.
(Insert Table 3 about here)
3.2.2. Measure of the use activity-based costing and measures of the reasons for using
activity-based costing
Following earlier surveys on the use of activity-based costing (e.g. Chenhall and
Langfield-Smith, 1998), respondents were asked to respond „Yes‟ or „No‟ to the
question of whether their firm was using an activity-based costing system4 (survey item
15). In our sample, 28 percent of the respondents answered that they were currently
using activity-based costing method, which is a reasonably high rate if compared to that
reported in earlier studies. It also indicates that the extent of the use of activity-based
4 Although activity-based costing has been well known among practitioners for almost two decades, it is
possible that different respondents may have different views regarding the concept of activity-based
costing. For instance, earlier studies report that employees may have different views on the definition of
activity-based costing (e.g. Cobb et al., 1992; Innes and Mitchell, 1993, 1998; Malmi, 1997; Major and
Hopper, 2005). We have mitigated the influence of this potential bias in two ways. First, we have chosen
the same measure of the use of the activity-based costing that has been used in earlier studies (e.g.
Chenhall and Langfield-Smith, 1998; Gosselin, 1997; Bjornenak, 1997; Malmi, 1999) to reduce potential
response error described by Dillman (1999). Activity-based costing has been actively discussed in the
Finnish business literature and the media since it was originally suggested, and it is as commonly known
in Finland as it is in other countries, where this measure has been used. Second, our questionnaire
includes several questions on the reasons for using activity-based costing (survey item 16). These
questions also serve the purpose of validating our findings on the role of the life cycle of the firm in the
use of activity-based costing, In other words, if respondents have understood the question on the use of
activity-based costing correctly, the life cycle stage of the firm should affect the reasons for using
activity-based costing in the same way as it affects the use of activity-based costing.
17
costing among Finnish firms has increased. Earlier studies report that 6 percent of
respondents used activity-based costing in 1992 (Lukka and Granlund, 1996), 11
percent in 1993 (Laitinen, 1995) and 27 percent in 1999 (Hyvönen, 2003). The
measures of the specific reasons for using activity-based costing described in Section
2.2 were based on earlier surveys on the benefits of activity-based costing (e.g. Shields,
1995; Hussain et al., 1998). These measures reflect the following reasons for using
activity-based costing mentioned in Hypothesis 2: a need to reduce and control the costs
(survey items 16b and 16h), a need to understand factors driving the costs (survey items
16f and 16g) and a need to improve and modernise decision making (survey items 16a,
16c, 16e and 16d). For these measures, we used a five-point Likert scale ranging from
(1) „Not important‟ to (5) „Very important‟. The respondents were asked to choose the
alternative that best described the benefits of activity-based costing in their firm.
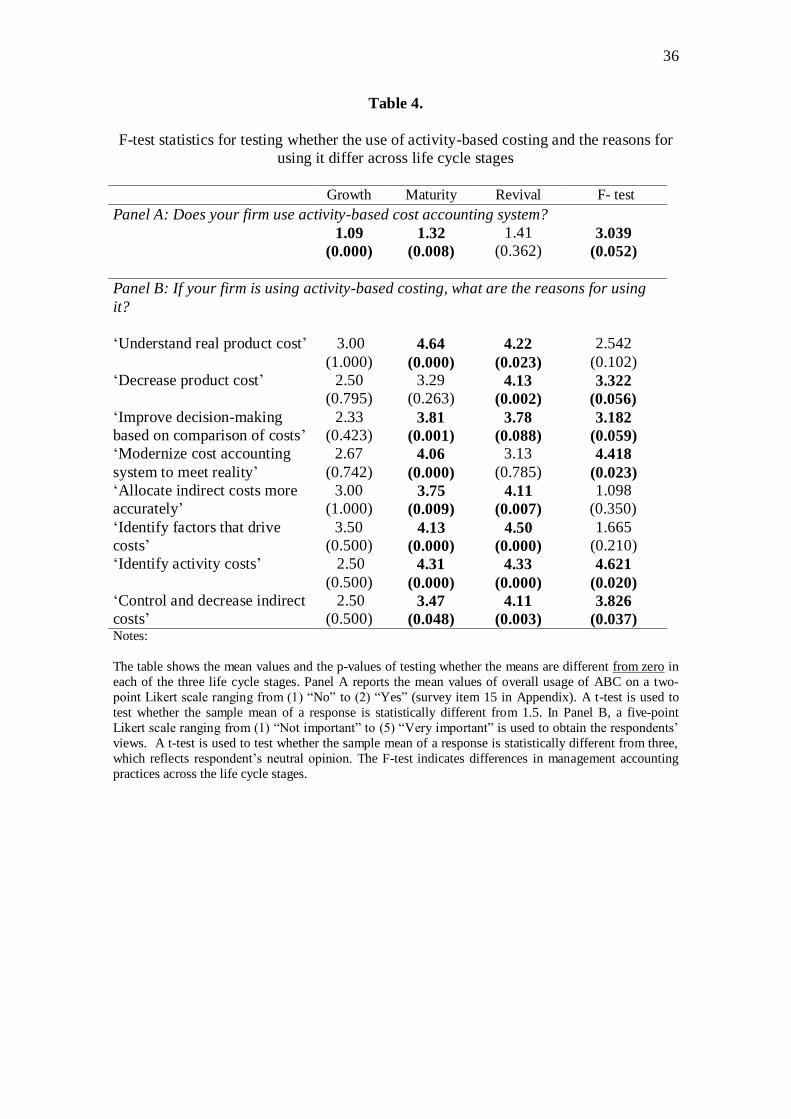
Table 4 reports the mean values of the firms‟ responses to the questions on their
use of an activity-based costing system and the reasons for using it across life cycle
stages. Table 4 also reports the p-values for testing whether the means are significantly
different from three and the F-test for testing whether the use of activity-based costing
differs across life cycle stages. The results indicate that mature firms and especially
revival firms use activity-based costing system more frequently than growth firms. The
results also indicate that growth firms do not consider any of the reasons for using
activity-based costing to be relevant for them, whereas maturity and revival firms regard
these reasons as relevant. These results are in line with those reported in earlier life
cycle studies, i.e. the use of formal cost accounting methods such as activity based
costing is more common among firms in the later life cycle stages than it is among firms
in the early life cycle stages.
18
(Insert Table 4 about here)
3.2.3. Measures of other characteristics of the firm affecting the use of activity-based
costing
As discussed in Section 2.3., there are other characteristics of the firm that are
likely to affect the use of activity-based costing. Therefore, the survey questionnaire
included several items identifying these characteristics. We construct the following
measures based on these items:
1. Sales: Size of the firm measured by logarithmic net sales (Survey item 3)
2. Employee: Size of the firm measured by the logarithmic number of employees
(Survey item 4)
3. Age: Age of the firm in years (Survey item 1)
4. Diversity: Product/service diversity (Survey item 12)
5. Standard: Complexity of the production process (Survey item 11)
6. Education: Educational level of the CEO of the firm (Survey item 8)
7. Investor: Venture capital investors (Survey item 5)
8. Public: Stock market listing (Survey item 2)
9. Manufact: Manufacturing vs. service firm (Survey item 10)
Following earlier studies (e.g. Davila, 2005; Gosselin, 1997), the size of the firm
was measured by logarithmic net sales (Sales) and by the logarithmic number of
employees (Employee). Following Malmi (1999), product/service diversity (Diversity)
was measured by asking respondents to choose a value of one if they have only one
product/service, a value of two if they have several products/services and a value of
three if they have numerous products/services. The complexity of the production
process (Standard) was measured by asking respondents to choose the value one if the
products are fully standardized, a value of two if the products are fully standardized but
specializations are available, a value of three if the products are mainly customized and
a value of four if the firm has only customized products. This survey item is partly
19
based on Malmi (1999). The measure of the education level of the CEO of the firm
(Education) was taken from Graham and Harvey (2001), i.e. respondents were asked to
choose a value of one if the CEO of the firm has completed basic compulsory
education, a value of two if the CEO of the firm has vocational qualifications
examination, a value of three if the CEO of the firm has a college-level diploma, a value
of four if the CEO of the firm has a university degree and a value of five if the CEO of
the firm has a licentiate or doctoral degree. Following Davila (2005), respondents were
asked to indicate the number of venture capital investors investing in their firm. This
survey item was used to construct a dummy variable having a value of one if the firm
has venture capital investors, otherwise zero (Investor). Respondents were also asked to
choose the value one if the firm was listed on a stock exchange, otherwise zero (Public).
Finally, the survey contained an item to identify whether the firm was a manufacturing
or service firm. Respondents were asked to choose a value of one if the firm was a
manufacturing firm, and zero if it was a service firm (Manufact).
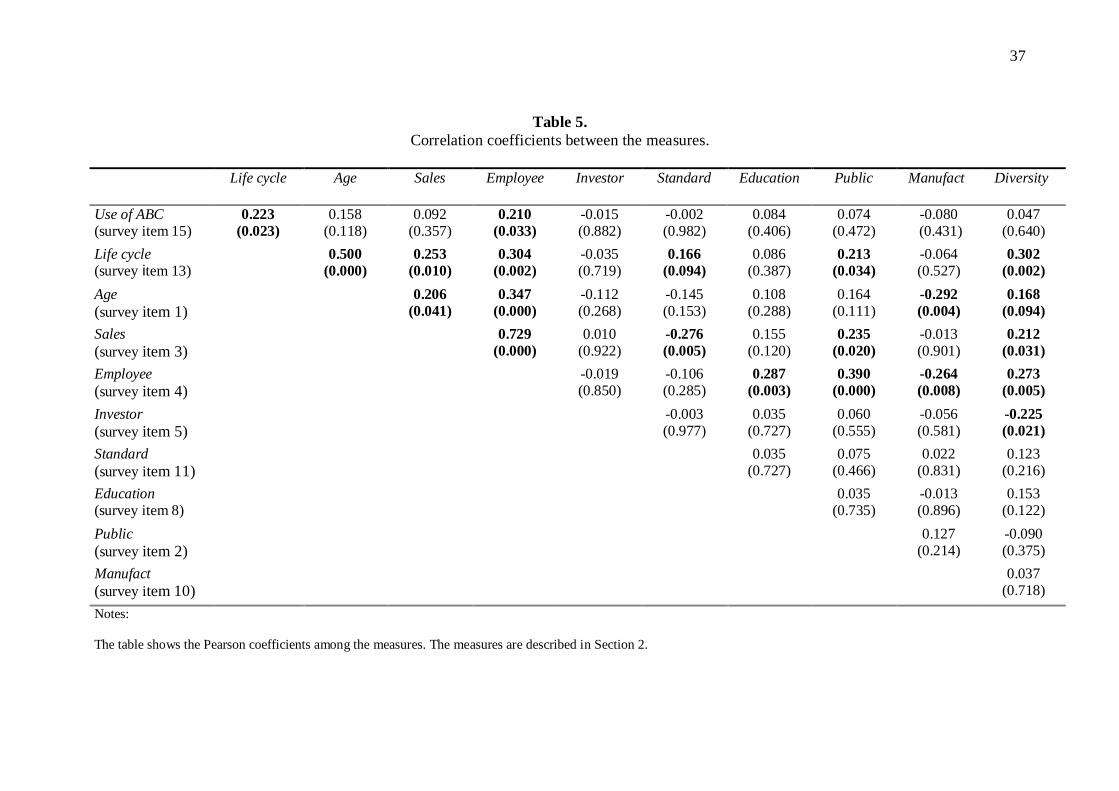
3.3. Correlations between the measures
Table 5 reports the correlation coefficients between the survey measures. Though
none of the pair-wise correlations among the measures is high enough to suggest the
existence of a multi-collinearity problem, some of them are significant. The use of
activity based costing is significantly positively correlated with the life cycle stage of
the firm, which is in accordance with the life cycle literature, i.e. the use of formal cost
accounting methods such as activity based costing is more common among firms in the
later life cycle stages than it is among firms in the early life cycle stages. The use of
activity based costing is also positively correlated with the size of the firm measured by
the number of employees. This result is in line with earlier studies (e.g. Drury and
20
Tayles, 1994; Innes and Mitchell, 1995; Bjornenak, 1997; Chenhall and Langfield-
Smith, 1998). Correlations between the self-categorized measure of the life cycle stage
of the firm and both measures of the size of the firm are significantly positive, but their
magnitudes are relatively low. This supports our view that the life cycle stage of the
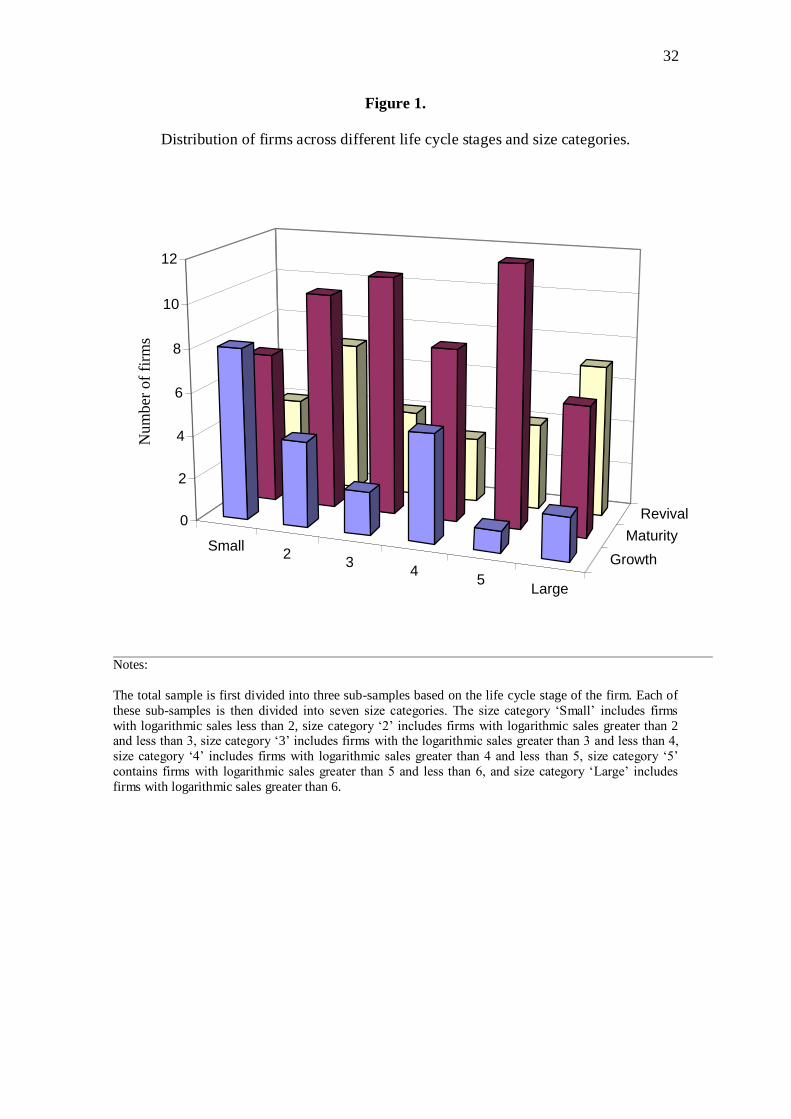
firm has its own role apart from the size of the firm5. This is also illustrated in Figure 1,
showing the number of sample firms across life cycle stages and size categories6. Each
of the three life cycle stages contains firms of all sizes.
Table 5 also reports the correlations between the other measures in the survey.
Significant correlations are reported between most of the control variables. Life cycle
stage of the firm especially is significantly positively correlated with the variables
Public and Diversity, i.e. firms in the later life cycle stages have gained stock listing and
they have a diverse product/service range. These results are in accordance with those
reported in Table 3, i.e. firms in the maturity and revival stages are large enough to
achieve stock market listing and they experience diversification in their products and
markets.
5 Statistically, the squared correlation coefficient between two variables is equal to the explanatory power
(R2) in univariate regression in which one variable is regressed on the other variable. The correlation
coefficient between the measure of the life cycle stage and the number of employees reported in Table 5 is equal to 0.304. In other words, the explanatory power of a regression model with the life cycle stage of
the firm as a dependent variable and the number of employees as an independent variable is equal to 9.2
percent (0.3040.304). This means that 9.2 percent of the information in the measure of the life cycle stage of the firm can be explained by this measure of the size of the firm, and 90.8 percent of the
information remains unexplained and is not associated with the size of the firm. The corresponding
figures for the sales of the firm are 6.4 percent (0.2530.253) and 93.6 percent. In other words, there is only a very limited amount of information that is common to the measure of the life cycle stage of the
firm and the two measures of the size of the firm.
6 The total sample is first divided into three sub-samples based on the life cycle stage of the firm. Each of
these sub-samples is then divided into seven size categories. The size category „Small‟ includes firms
with logarithmic sales less than 2, size category „2‟ includes firms with the logarithmic sales greater than
2 and less than 3, size category „3‟ includes firms with logarithmic sales greater than 3 and less than 4,
size category „4‟ includes firms with logarithmic sales greater than 4 and less than 5, size category „5‟
contains firms with logarithmic sales greater than 5 and less than 6, and size category „Large‟ includes
firms with logarithmic sales greater than 6.
21
(Insert Table 5 about here)
(Insert Figure 1 about here)
4. Empirical results and discussion
We test our hypotheses by estimating the following logistic regression model
from our data:
(1)
,1110
9876
54321
iiDiversityiManufact
iPubliciEducationiStandardiInvestor
iEmployeeiSalesiAgeiRevivaliMaturityiY
where Yi is a dummy variable having a value of one if the ith firm‟s is using
activity-based costing system, otherwise zero (survey item 15); Maturityi and Revivali
are dummy variables having a value of one if the ith firm belongs to the maturity or
revival stage of the life cycle (survey item 13)7, otherwise zero; and the other
independent variables are as described in Section 3.2.3.
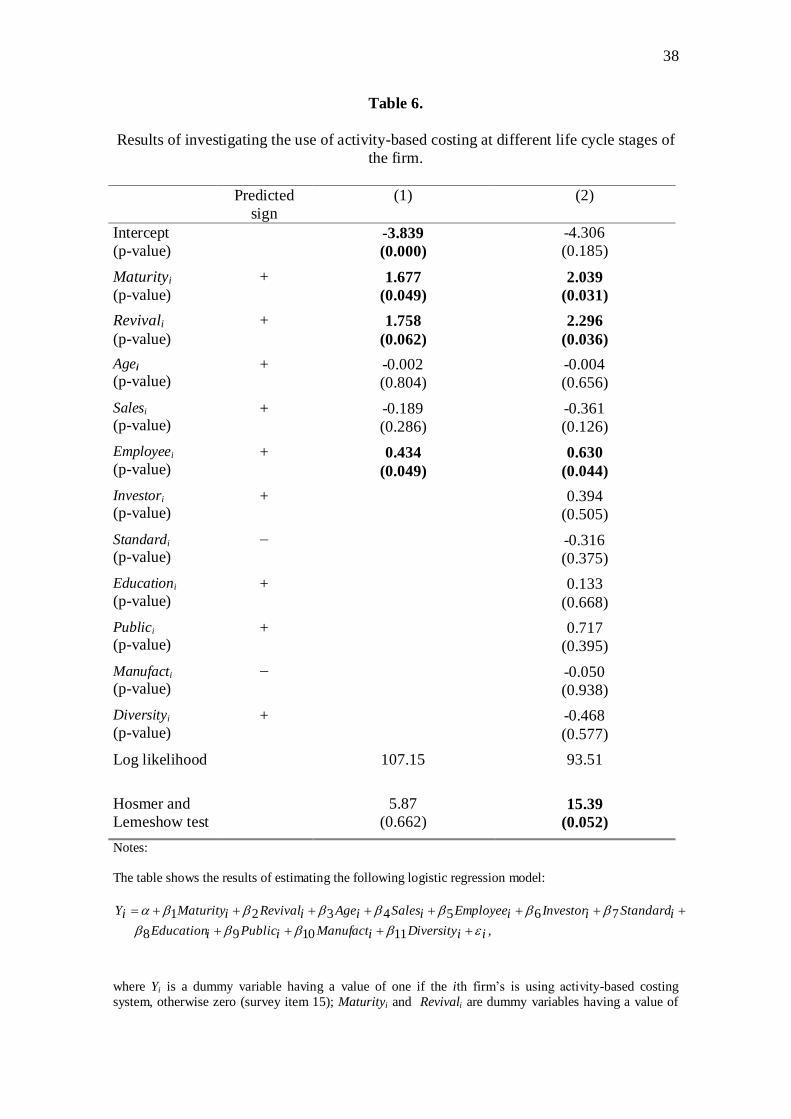
Table 6 reports the results of estimating Model (1). In column 1 of Table 6, the
estimated model includes the two dummy variables based on the self-categorization
measure of the life cycle stage of the firm and the variables measuring the age and size
of the firm. In column 2 of Table 6 we add the other control variables to the model. In
both model specifications, the estimated parameters for the variables Maturityi and
Revivali are significantly positive. The estimated parameters for the control variables
have the predicted signs, but are all insignificant except for the parameter for the
7 We use the growth stage as a base life cycle stage.
22
number of employees. In column 1 of Table 6, insignificant value of the Hosmer-
Lemeshow Goodness-of-fit test statistic indicates a good fit of the estimated model. For
the model containing the other control variables (column 2 of Table 6), the Hosmer-
Lemeshow Goodness-of-fit test indicates a weaker fit, probably because most of the
estimated parameters for the control variables are insignificant. However, the p-value of
the Hosmer-Lemeshow test is above 0.05 in column 2 of Table 6. A better fit of the
model without the control variables suggests that the life cycle stage of the firm rather
than the other characteristics of the firm is related to the use of activity-based costing.
The results reported in Table 6 support our hypothesis, i.e. the use of activity-
based costing systems is more common among firms in the mature and revival phases
than it is among firms in the growth phase. This result remains unchanged after
controlling for the effects of firm size, pressure of venture capital investors, level of
standardization of products or services, stock market listing, product/service diversity,
industry (manufacturing vs. service) and CEO‟s education. Life cycle theories suggest
that firms in the maturity and revival phases make more use of formal management
accounting systems, because, in comparison with growth firms, they have a greater
organizational size, they need to produce products/services cost-effectively to earn
adequate profit margins on highly competitive markets, they experience increased
diversification in their products and markets, their administrative task is more complex
and more formal and they have more bureaucratic organizational structures (Miller and
Friesen, 1984, 1984). In sum, our results support life cycle theories, i.e. firms in the
maturity and revival phases put more emphasis on formal management accounting
systems such as cost accounting methods as opposed to firms in the growth phase.
Earlier studies report that the use of activity based costing increases as the size
of the firms increases (e.g. Drury and Tayles, 1994; Moores and Chenhall, 1994; Innes
23
and Mitchell, 1995; Bjornenak, 1997; Gosselin, 1997; Chenhall and Langfield-Smith,
1998; Baird et al., 2004). Our results confirm this finding, but more importantly, our
results indicate that the life cycle of the firm has a role of its own apart from that of the
size and of the firm when explaining the use of activity-based costing. This supports the
view that not all mature or revival firms are necessarily large in size, but they have a
greater need for advanced management accounting systems such as activity-based
costing than many larger firms have. In addition, we report that the life cycle of the firm
has a role of its own apart from that of the age of the firm when explaining the use of
activity-based costing. These results indicate that the self-categorizing measure of the
life cycle stage used by Md. Auzair and Langfield-Smith (2005) contains incremental
information with respect to the size of the firm.8
(Insert Table 6 about here)
8 In order to verify that the effect of life cycle stage of firm on the use of activity-based costing is separate
from that of the size of the firm, we performed the following additional analyses (these results are not
shown in the tables but they are available from the authors on request). First, we estimated Model (1)
such that we used Likelihood Ratio statistics to test whether the estimated parameters for the variables
Maturity and Revival are significantly different between small and large firms. These analyses provide us
with a direct statistical test of whether our results on the use of activity-based costing in different life
cycle stages are driven by the size of the firm rather than the life cycle stage of the firm. We classified
firms in our sample into categories of small and large firms to explore if the use of activity-based costing
across life cycle stages is similar for small and large firms. We used both the sales and the number of
employees of the firm as the measures of the size of the firm (see panel A of Table 2). Specifically, if the
sales of the firm was less than or equal to 100 (greater than 100) a firm was classified as a small (large)
firm according to this measure of the size of the firm. Similarly, if the number of employees of the firm
was less than or equal to 250 (greater than 250) a firm was classified as a small (large) firm according to
this measure of the size of the firm. We obtained the following results from these analyses. When the sales of the firm was used to classify firms into small and large firms, the values of the chi-square statistic
to test whether the estimated parameters are different between small and large firms were respectively
1.34 (p=0.246) and 0.73 (p=0.392) for the variables Maturity and Revival. When the number of
employees of the firm was used to classify firms into small and large firms, the corresponding values of
the chi-square statistic were respectively 2.01 (p=0.157) and 1.02 (p=0.313) for the variables Maturity
and Revival. Therefore, these results indicate that the estimated parameters for variables Maturity and
Revival in Model (1) are not significantly different between small and large firms. In other words, our
regression results are not driven by the size of the firm. Also, the results did not change, if we divided the
sample into three categories, i.e. small, medium-size and large firms. Second, we estimated Model (1)
without the firms that belong to the two top size categories reported in panel A of Table 2. These results
would reveal if the largest firms in the sample dominate our main results. However, the results of these
regressions were similar to those reported in the paper, i.e. the estimated parameters for the variables
Maturity and Revival are significantly positive.
24
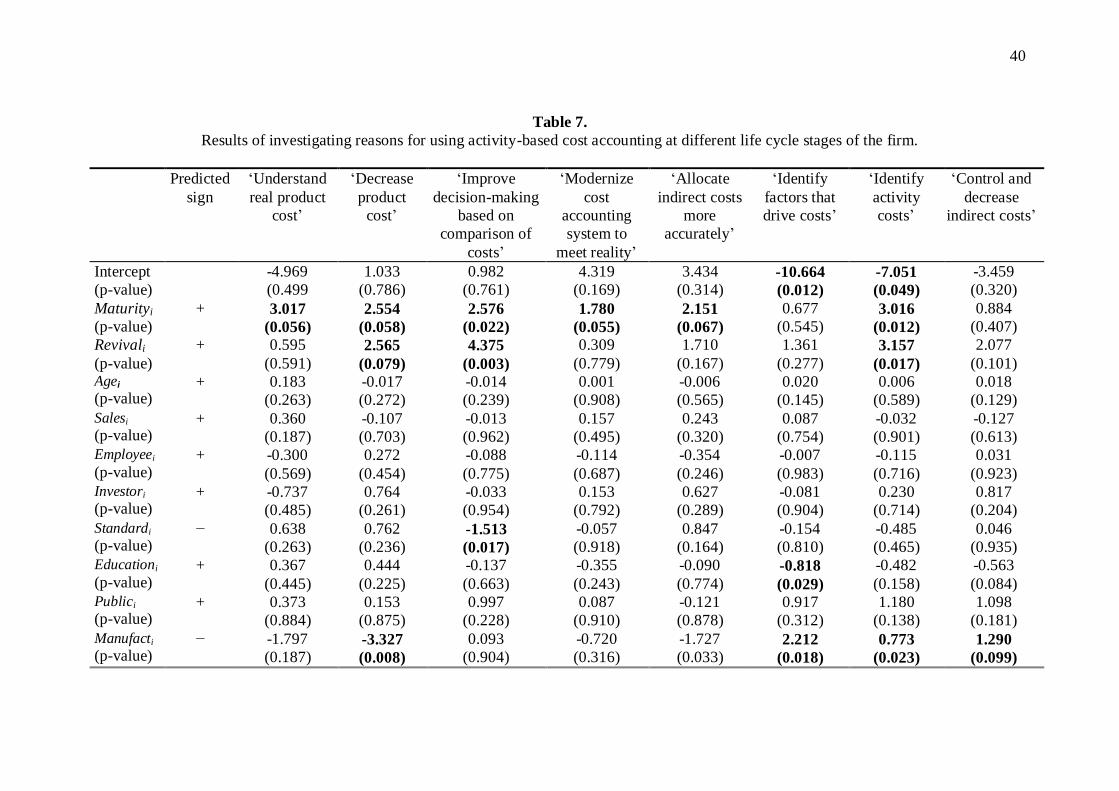
Table 7 reports the results of testing Hypothesis 2, i.e. how the firms‟ reasons for
using activity-based costing system differ across life cycle stages9. In these regressions,
we estimate Model (1) as a multinomial logistic regression such that the dependent
variable is the value of the ith firm‟s response to a given question (survey item 16). In
all cases, the estimated parameters for the variables Maturityi and Revivali are positive,
although not always significant. „Understand real product cost‟, „Decrease product
cost’, „Improve decision-making based on comparison of costs’, „Modernize cost
accounting system to meet reality’, „Allocate indirect costs more accurately‟, ‘Identify
activity costs‟, and „Control and decrease indirect costs‟ are more important reasons for
using an activity-based costing system for mature firms than they are for growth firms.
In addition, „Decrease product cost’, „Improve decision-making based on comparison of
costs’, and ‘Identify activity costs‟ are more important reasons for using activity-based
costing systems for revival firms than they are for growth firms.
The results reported in Table 7 support Hypothesis 2. Specifically, they indicate
that the firms‟ reasons for using an activity-based costing system vary across life cycle
stages, as the life cycle literature implies. Cost-effectiveness and profitability are more
important for firms in the maturity and revival phases than they are for firms in the
growth phase (e.g. Miller and Friesen, 1984). Therefore, mature and revival firms put
more emphasis especially on reducing and controlling their costs and improving their
decision-making as opposed to firms in a growth phase.
(Insert Table 7 about here)
9 Table 7 does not show the Hosmer and Lemeshow tests, because this test is available only for binary
response models and the model estimated in Table 7 is a multinomial regression, i.e. the dependent
variable can have values between 1 and 5. However, we also estimated this model as a generalized linear
model that allows us to analyze the values of deviance and the Pearson chi-square statistic to assess the
goodness of the fit of the model (details not shown in Table 7). In all columns of Table 7, the values of
deviance are close to the cut-off value of one, indicating a good fit of the model. In addition, the Pearson
chi-square statistics reject the null hypothesis of no fit in the models at any conventional level of
significance.
25
5. Conclusions
Life cycle research suggests that the use of management accounting systems
should differ across the stages of organizational life cycle as different systems are
needed in different stages (e.g. Miller and Friesen, 1984, 1984). In comparison with
growth firms, the administrative task of mature and revival firms is more complex, they
need to produce products/services cost-effectively to earn adequate profit margins on
highly competitive markets, they experience increased diversification in their products
and markets, they have greater organizational size and more formal and more
bureaucratic organizational structures (Greiner, 1972; Miller and Friesen, 1984, 1984;
Merchant, 1997). Consequently, the use of the advanced cost accounting systems such
as activity-based costing should be more common among mature and revival firms than
among growth firms. In this paper, we investigate if the use of activity-based costing
varies among firms in different life cycle stages. Following Kazanjian and Drazin
(1990) and Md. Auzair and Langfield-Smith (2005) we use a self-categorization
variable to measure the life cycle stage of the firm. The paper contributes to the
management accounting literature by exploring if the life cycle of the firm has a role of
its own apart from that of the size of the firm in the use of activity-based costing. Earlier
studies report that the use of activity based costing increases as the size of the firms
increases (e.g. Al-Omir & Drury, 2007) but, although firms in the maturity and revival
phases are often larger than firms in a growth phase, not all mature or revival firms are
necessarily large in size.
Our empirical analyses based on the questionnaire completed by 105 Finnish
firms operating in various industries and life cycle stages support our hypothesis
derived from life cycle theories. The results indicate that the characteristics of the firm
26
affecting the use of advanced cost accounting systems differ across life cycle phases as
reported in the life cycle literature, i.e. firms in the maturity and revival phases have a
greater organisational size, lower profitability, a more diversified product/service range
and have more often achieved a stock market listing as opposed to firms in the growth
phase. More importantly, we find that the use of activity-based costing is more common
among firms in maturity and revival phases than it is among firms in a growth phase,
even after controlling for the effects of size of the firm and other relevant control
variables. We also find that the firms‟ reasons for using an activity-based costing
system vary across life cycle stages as the life cycle theories predict. Cost-effectiveness
and profitability are more important for firms in the maturity and revival phases than
they are for firms in the growth phase (e.g. Miller and Friesen, 1984). Consequently,
mature and revival firms need to put more emphasis on reducing and controlling their
costs and improving their decision-making as opposed to firms in a growth phase.
Concurring with the results reported in earlier studies, we also find that the use
of activity based costing increases as the size of the firms increases (e.g. Drury and
Tayles, 1994; Innes and Mitchell, 1995; Bjornenak, 1997; Chenhall and Langfield-
Smith, 1998; Malmi, 1999; Al-Omir & Drury, 2007). More importantly, our results
indicate that the life cycle of the firm has a role of its own apart from that of the size of
the firm when explaining the use of activity-based costing. This supports the view that
not all mature or revival firms are necessarily large in size, but they have a greater need
for advanced management accounting systems such as activity-based costing than many
larger firms have.
27
REFERENCES
Al-Omir, M., Drury, C., (2007). A survey of factors influencing the choice of product
costing systems in UK organizations. Management Accounting Research (in
Press).
Md. Auzair, S., Langfield-Smith, K., 2005. The effect of service process type, business
strategy and life cycle stage on bureaucratic MCS in service organizations.
Manage. Acc. Res., 16, 399-421.
Baird, K.M., Harrison, G.L., Reeve, R.C., 2004. Adoption of activity management
practices: a note on the extent of adoption and the influence of organizational and
cultural factors. Manage. Acc. Res., 15, 383-399.
Bjornenak, T., 1997. Diffusion of Accounting: the case of ABC in Norway. Manage.
Acc. Res., 8, 3-18.
Bjornenak, T., Mitchell, F., 2002. The development of activity-based costing journal
literature, 1987-2000. Eur. Acc. Rev., 11 (3), 481-508.
Blau, P.M., Falbe, C.M. McKinley, W., Tracy, D.K., 1976. Technology and
organization in manufacturing. Admin. Sci. Quart., 21, 20-40.
Chandler, A.D., 1962. Strategy and Structure, MIT Press, Cambridge, Mass.
Chenhall, R.H., Langfield-Smith, K., 1998. Adoption and benefits of management
accounting practices: an Australian study. Manage. Acc. Res., 9, 1-19.
Churchill, N.C., Lewis, V.L., 1983. The Five Stages of Small Business Growth.
Harvard Bus. Rev., May-June, 30-50.
Cobb, I., Innes, J., Mitchell, F., 1992. Activity Based Costing; Problems in Practice.
Cartered Institute of Management Accountants, London.
28
Cooper, R., Kaplan, R.S., 1988. How cost accounting distorts products costs. Manage.
Acc. (US), 69(10), 20-27.
Dechow, N., Mouritsen, J. (2004). ERP manuscipts of accounting and information
systems and management control. In Andersen, V., & Vendelo, T., (Eds.), The
Past and Future of Information Systems.
Dillman, D., 1999. Mail and internet surveys: The tailored design method. New York:
Wiley.
Davila, T., 2005. An exploratory study on the emergence of management control
systems: formalizing human resources in small growing firms. Acc., Organ.
Society., 30(3), 223-248.
Drury, C., Tayles, M., 1994. Product costing in UK manufacturing organizations. The
Eur. Acc. Rev., (3), 443-469.
Gosselin, M., 1997. The effect of strategy and organizational structure on the adoption
and implementation of activity-based costing. Acc. Organ. Society., 22 (2), 105-
122.
Gupta, A.K., Chin, D.C.W., 1990. An empirical examination of information systems
expenditure: a stage hypothesis using the information processing and
organizational life-cycle approaches. J Inform. Science., 16, 105-117.
Graham, J.R., Harvey, C.R., 2001. The theory and practice of corporate finance:
evidence from the field. J Financial Econ., 60, 187-243.
Granlund, M. (2007). On the Interface between Management Accounting and Modern
Information Technology. Working Paper. Turku School of Economics.
Granlund, M., Malmi, T. (2002). Moderate impact of ERPS on management accounting:
A lag or permanent outcome? Manage. Acc. Res., 13(3), 299-321.
29
Granlund, M., Taipaleenmäki, J., 2005. Management Control and Controllership in New
Economy Firms – A Life Cycle Perspective. Manage. Acc. Res., 16(1), 21-57.
Greiner, L.E., 1972. Evolution and Revolution as Organizations Grow. Harvard Bus.
Rev., July-August, 37-46.
Hilton, R.W., 2005. Managerial Accounting: Creating value in dynamic business
environment. New York: McGraw-Hill Irwin.
Hussain, M.M., Gunasekaran, A., Laitinen, E.K., 1998. Management accounting
systems in Finnish service firms. Technovation., 18, 57-67.
Hyvönen, T., 2003. Management accounting and information systems: ERP versus
BoB. Eur. Acc. Rev., 12(1), 155-173.
Innes, J., Mitchell, F., 1993. Activity Based Costing. A review with Case Studies.
CIMA, London.
Innes, J., Mitchell, F., 1995. A survey of activity-based costing in the UK‟s largest
companies. Manage. Acc. Res., 6, 137-153.
Innes, J., Mitchell, F., 1998. A Practical Guide to Activity-Based Costing. Kogan Page,
London.
Jones, T.C., Dugdale, D., 2002. The ABC bandwagon and the juggernaut of modernity.
Acc. Organ. Society., 27, 121-163.
Kazanjian, R.K., Drazin, R., 1990. A stage-contingent model of design and growth for
technology-based new ventures. J Business Venturing., 5, 137-150.
Kennedy, T., Affleck-Graves, J., 2001. The Impact of Activity-Based Costing
Techniques on Firm Performance. J Manage. Acc. Res.,13, 19-45.
Laitinen, E. K., 1995. Management accounting in three types of Finnish firms:
Challenges for management accounting. Working paper. University of Vaasa.
30
Lawrence, P.R., Lorsch, J.W., 1967. Organization and Environment, Cambridge, MA,
Harvard University Press.
Lukka, K., Granlund, M., 1996. Cost accounting in Finland: current practice and trends
of development. Eur. Acc. Rev., 5(1), 1-28.
Lukka, K., Granlund, M., 2002. The fragmented communication structure within
accounting academia: the case of activity-based costing research genres. Acc.
Organ. Society., 27, 165-190.
Major, M., Hopper, T., 2005. Managers divided: Implementing ABC in a Portuguese
telecommunications company. Manage. Acc. Res., 16, 205-229.
Malmi, T., 1997. Towards explaining activity-based costing failure: accounting and
control in a decentralized organization. Manage. Acc. Res., 8, 459-480.
Malmi, T., 1999. Activity-based costing diffusion across organizations: an exploratory
empirical analysis of Finnish firms. Acc. Organ. Society., 24, 649-672.
Megginson, W.L., Netter, J.M., 2001. From State to Market: A Survey of Empirical
Studies on Privatization. J Econ. Lit., 39(2), 321-389.
Merchant, K.A., 1997. Modern management control systems: Text and cases. New
Jersey: Prentice Hall.
Miller, D., Friesen, P.H., 1983. Successful and unsuccessful phases of the corporate life
cycle. Organ. Studies., 4(3), 339-356.
Miller, D., Friesen, P.H., 1984. A longitudinal study of the corporate life cycle. Manage.
Science., 30(10), 1161-1183.
Moores, K, Chenhall, R.H., 1994. Framework and MAS evidence, in Moores, K. and
Booth, P. (Eds) Strategic Management Accounting: Australian Cases, John Wiley
and Sons, Brisbane, pp.12-26.
31
Moores, K., Yuen, S., 2001. Management accounting systems and organizational
configuration: a life cycle perspective. Acc. Organ. Society., 26, 351-389.
O‟Connor, N., Chow, C.W., Wu, A. 2004. The adoption of “Western” management
accounting controls in China‟s state-owned enterprises during economic transition.
Acc. Organ. Society., 29, 349-375.
Quinn, R., Cameron, K., 1983. Organizational life cycles and shifting criterias of
effectiveness: some preliminary evidence. Manage. Science., 29, 33-51.
Shields, M.D., 1995. An empirical analysis of firm‟s implementation experience with
activity-based costing. J Manage. Acc. Res., Fall, 148-165.
Van der Stede, W.A., Young, S. M., Chen, C.X., (2005). Assessing the quality of
evidence in empirical management accounting research: The case of survey
studies. Acc. Organ. Society., 30, 955-684.
32
Figure 1.
Distribution of firms across different life cycle stages and size categories.
Small2
34
5Large
Growth
Maturity
Revival0
2
4
6
8
10
12
Num
ber
of
firm
s
Notes:
The total sample is first divided into three sub-samples based on the life cycle stage of the firm. Each of
these sub-samples is then divided into seven size categories. The size category „Small‟ includes firms
with logarithmic sales less than 2, size category „2‟ includes firms with logarithmic sales greater than 2 and less than 3, size category „3‟ includes firms with the logarithmic sales greater than 3 and less than 4,
size category „4‟ includes firms with logarithmic sales greater than 4 and less than 5, size category „5‟
contains firms with logarithmic sales greater than 5 and less than 6, and size category „Large‟ includes
firms with logarithmic sales greater than 6.
33
Table 1.
Characteristics describing firms in different life cycle stages.
Growth Maturity Revival
Environment - More competitive and
heterogeneous
- Still more competitive and
heterogeneous
- Very heterogeneous, competitive
and dynamic environment
Organization - Some formalization of structure
- Functional basis of organization
- Increasing differentiation
- Somewhat less centralized
- Formal, bureaucratic structure
- Functional basis of organization
- Moderate differentiation
- Moderate centralization
- Divisional basis of organization
- High differentiation
- Sophisticated controls, more
formal analysis in decision
making
Strategy - Broadening of product market
scope into closely related areas
- Incremental innovation in
product lines
- Rapid growth
- Consolidation of product market
strategy
- Focus on efficiently supplying a
well-defined market
- Strategy of product market
diversification, movement into
some unrelated markets
- High level of risk taking and
planning
- Substantial innovation
Notes:
The table is based on Miller and Friesen (1983, 1984).
34
Table 2.
Summary statistics of the sample firms
N
Panel A: Size
Number of employees (survey item 4)
1-50 21
51-100 15
101-250 24
251-500 14
501-1000 10
1001-1500 4
1501- 17
Total 105
Net Sales (M€) (survey item 3)
1-5 13
6-10 14
11-50 28
51-100 11
101-500 25
501-1000 7
1001- 7
Total 105
Panel B: Industry (survey item 9)
Category
Banks and Finance 3
Insurance 2
Investment 2
Transport 4
Trade 20
Other Services 26
Metal Industry 11
Forest Industry 3
Multi-Business 1
Energy 2
Food Industry 1
Construction 7
Telecommunication & Electronics 8
Chemicals 1
Media & Publishing 8
Other Industries 6
Total 105
35
Table 3.
Characteristics of the sample firms across life cycle stages.
Growth Maturity Revival
Number of firms 22 54 29
proportion of which listed on a stock exchange
(survey item 2)
9% 13% 28%
Net sales (M€)
(survey item 3)
95
[12]
3230
[51]
3910
[66]
Growth in net sales (%)
(survey item 6)
27.6
[10.0]
4.0
[3.5]
5.7
[5.0]
Number of employees
(survey item 4)
409
[138]
1177
[170]
4259
[341]
Net income margin (%)
(survey item 7)
8.5
[6.0]
6.3
[5.0]
5.1
[3.0]
Age of the firm (in years)
(survey item 1)
13.1
[10.0]
48.7
[45.0]
68.4
[64.0]
Number of products/services
(survey item 12)
2.68
2.89 3.00
Proportion of different cost items as a percentage
of total costs (survey item 14):
Material
28.8
[20.0]
37.3
[40.0]
29.6
[24.0]
Direct labour
37.0
[32.5]
27.3
[20.0]
35.4
[35.6]
Other variable manufacturing. costs
8.7
[5.5]
9.6
[5.0]
11.6
[5.0]
Fixed manufacturing cost
8.7
[5.5]
7.9
[4.0]
7.0
[6.5]
Other fixed costs 15.9
[12.5]
12.1
[10.0]
15.9
[10.5] Notes:
The table presents the mean [median] values of each variable at different life cycle stages.
36
Table 4.
F-test statistics for testing whether the use of activity-based costing and the reasons for
using it differ across life cycle stages
Growth Maturity Revival F- test
Panel A: Does your firm use activity-based cost accounting system?
1.09
(0.000)
1.32
(0.008)
1.41
(0.362) 3.039
(0.052)
Panel B: If your firm is using activity-based costing, what are the reasons for using
it?
„Understand real product cost‟ 3.00
(1.000)
4.64
(0.000)
4.22
(0.023)
2.542
(0.102)
„Decrease product cost‟ 2.50
(0.795)
3.29
(0.263) 4.13
(0.002)
3.322
(0.056)
„Improve decision-making
based on comparison of costs‟
2.33
(0.423) 3.81
(0.001)
3.78
(0.088)
3.182
(0.059)
„Modernize cost accounting
system to meet reality‟
2.67
(0.742)
4.06
(0.000)
3.13
(0.785)
4.418
(0.023)
„Allocate indirect costs more
accurately‟
3.00
(1.000) 3.75
(0.009)
4.11
(0.007)
1.098
(0.350)
„Identify factors that drive
costs‟
3.50
(0.500) 4.13
(0.000)
4.50
(0.000)
1.665
(0.210)
„Identify activity costs‟ 2.50
(0.500)
4.31
(0.000)
4.33
(0.000)
4.621
(0.020)
„Control and decrease indirect
costs‟
2.50
(0.500) 3.47
(0.048)
4.11
(0.003)
3.826
(0.037) Notes:
The table shows the mean values and the p-values of testing whether the means are different from zero in
each of the three life cycle stages. Panel A reports the mean values of overall usage of ABC on a two-
point Likert scale ranging from (1) “No” to (2) “Yes” (survey item 15 in Appendix). A t-test is used to
test whether the sample mean of a response is statistically different from 1.5. In Panel B, a five-point
Likert scale ranging from (1) “Not important” to (5) “Very important” is used to obtain the respondents‟
views. A t-test is used to test whether the sample mean of a response is statistically different from three,
which reflects respondent‟s neutral opinion. The F-test indicates differences in management accounting
practices across the life cycle stages.
37
Table 5.
Correlation coefficients between the measures.
Life cycle
Age
Sales
Employee
Investor
Standard
Education
Public
Manufact
Diversity
Use of ABC (survey item 15)
0.223
(0.023)
0.158 (0.118)
0.092 (0.357)
0.210
(0.033)
-0.015 (0.882)
-0.002 (0.982)
0.084 (0.406)
0.074 (0.472)
-0.080 (0.431)
0.047 (0.640)
Life cycle (survey item 13)
0.500
(0.000) 0.253
(0.010)
0.304
(0.002) -0.035 (0.719)
0.166
(0.094) 0.086
(0.387) 0.213
(0.034)
-0.064 (0.527)
0.302
(0.002)
Age
(survey item 1)
0.206
(0.041)
0.347
(0.000)
-0.112 (0.268)
-0.145 (0.153)
0.108 (0.288)
0.164 (0.111)
-0.292
(0.004) 0.168
(0.094)
Sales
(survey item 3) 0.729
(0.000) 0.010
(0.922) -0.276
(0.005) 0.155
(0.120) 0.235
(0.020)
-0.013 (0.901)
0.212
(0.031)
Employee
(survey item 4)
-0.019 (0.850)
-0.106 (0.285)
0.287
(0.003)
0.390
(0.000)
-0.264
(0.008)
0.273
(0.005)
Investor
(survey item 5)
-0.003 (0.977)
0.035 (0.727)
0.060 (0.555)
-0.056 (0.581)
-0.225
(0.021)
Standard
(survey item 11) 0.035
(0.727) 0.075
(0.466) 0.022
(0.831) 0.123
(0.216)
Education (survey item 8)
0.035 (0.735)
-0.013 (0.896)
0.153 (0.122)
Public
(survey item 2)
0.127 (0.214)
-0.090 (0.375)
Manufact
(survey item 10) 0.037
(0.718)
Notes:
The table shows the Pearson coefficients among the measures. The measures are described in Section 2.
38
Table 6.
Results of investigating the use of activity-based costing at different life cycle stages of
the firm.
Predicted
sign
(1) (2)
Intercept
(p-value)
-3.839
(0.000)
-4.306
(0.185)
Maturityi
(p-value)
+ 1.677
(0.049)
2.039
(0.031)
Revivali
(p-value)
+ 1.758
(0.062)
2.296
(0.036)
Agei
(p-value) + -0.002
(0.804)
-0.004
(0.656)
Salesi
(p-value) + -0.189
(0.286)
-0.361
(0.126)
Employeei
(p-value)
+ 0.434
(0.049)
0.630
(0.044)
Investori
(p-value) + 0.394
(0.505)
Standardi
(p-value) − -0.316
(0.375)
Educationi
(p-value) + 0.133
(0.668)
Publici
(p-value) + 0.717
(0.395)
Manufacti
(p-value) − -0.050
(0.938)
Diversityi
(p-value)
+ -0.468
(0.577)
Log likelihood 107.15 93.51
Hosmer and
Lemeshow test
5.87
(0.662) 15.39
(0.052)
Notes:
The table shows the results of estimating the following logistic regression model:
,1110 98
76 54321
iiDiversityiManufactiPubliciEducation
iStandardiInvestoriEmployeeiSalesiAgeiRevivaliMaturityiY
where Yi is a dummy variable having a value of one if the ith firm‟s is using activity-based costing
system, otherwise zero (survey item 15); Maturityi and Revivali are dummy variables having a value of

39
one if the ith firm belongs the maturity or revival stage of the life cycle (survey item 13), otherwise zero;
and the other variables are as described in Section 2. P-values are reported in parentheses.
40
Table 7.
Results of investigating reasons for using activity-based cost accounting at different life cycle stages of the firm.
Predicted
sign
„Understand
real product
cost‟
„Decrease
product
cost‟
„Improve
decision-making
based on
comparison of
costs‟
„Modernize
cost
accounting
system to
meet reality‟
„Allocate
indirect costs
more
accurately‟
„Identify
factors that
drive costs‟
„Identify
activity
costs‟
„Control and
decrease
indirect costs‟
Intercept
(p-value)
-4.969
(0.499
1.033
(0.786)
0.982
(0.761)
4.319
(0.169)
3.434
(0.314) -10.664
(0.012)
-7.051
(0.049)
-3.459
(0.320)
Maturityi
(p-value)
+ 3.017
(0.056)
2.554
(0.058)
2.576
(0.022)
1.780
(0.055)
2.151
(0.067)
0.677
(0.545) 3.016
(0.012)
0.884
(0.407)
Revivali
(p-value)
+ 0.595
(0.591)
2.565
(0.079)
4.375
(0.003)
0.309
(0.779)
1.710
(0.167)
1.361
(0.277)
3.157
(0.017)
2.077
(0.101) Agei
(p-value) + 0.183
(0.263)
-0.017
(0.272)
-0.014
(0.239)
0.001
(0.908)
-0.006
(0.565)
0.020
(0.145)
0.006
(0.589)
0.018
(0.129) Salesi
(p-value) + 0.360
(0.187)
-0.107
(0.703)
-0.013
(0.962)
0.157
(0.495)
0.243
(0.320)
0.087
(0.754)
-0.032
(0.901)
-0.127
(0.613) Employeei
(p-value)
+ -0.300
(0.569)
0.272
(0.454)
-0.088
(0.775)
-0.114
(0.687)
-0.354
(0.246)
-0.007
(0.983)
-0.115
(0.716)
0.031
(0.923) Investori
(p-value) + -0.737
(0.485)
0.764
(0.261)
-0.033
(0.954)
0.153
(0.792)
0.627
(0.289)
-0.081
(0.904)
0.230
(0.714)
0.817
(0.204) Standardi
(p-value) − 0.638
(0.263)
0.762
(0.236) -1.513
(0.017)
-0.057
(0.918)
0.847
(0.164)
-0.154
(0.810)
-0.485
(0.465)
0.046
(0.935) Educationi
(p-value) + 0.367
(0.445)
0.444
(0.225)
-0.137
(0.663)
-0.355
(0.243)
-0.090
(0.774)
-0.818
(0.029)
-0.482
(0.158)
-0.563
(0.084) Publici
(p-value) + 0.373
(0.884)
0.153
(0.875)
0.997
(0.228)
0.087
(0.910)
-0.121
(0.878)
0.917
(0.312)
1.180
(0.138)
1.098
(0.181) Manufacti
(p-value) − -1.797
(0.187) -3.327
(0.008)
0.093
(0.904)
-0.720
(0.316)
-1.727
(0.033) 2.212
(0.018)
0.773
(0.023)
1.290
(0.099)
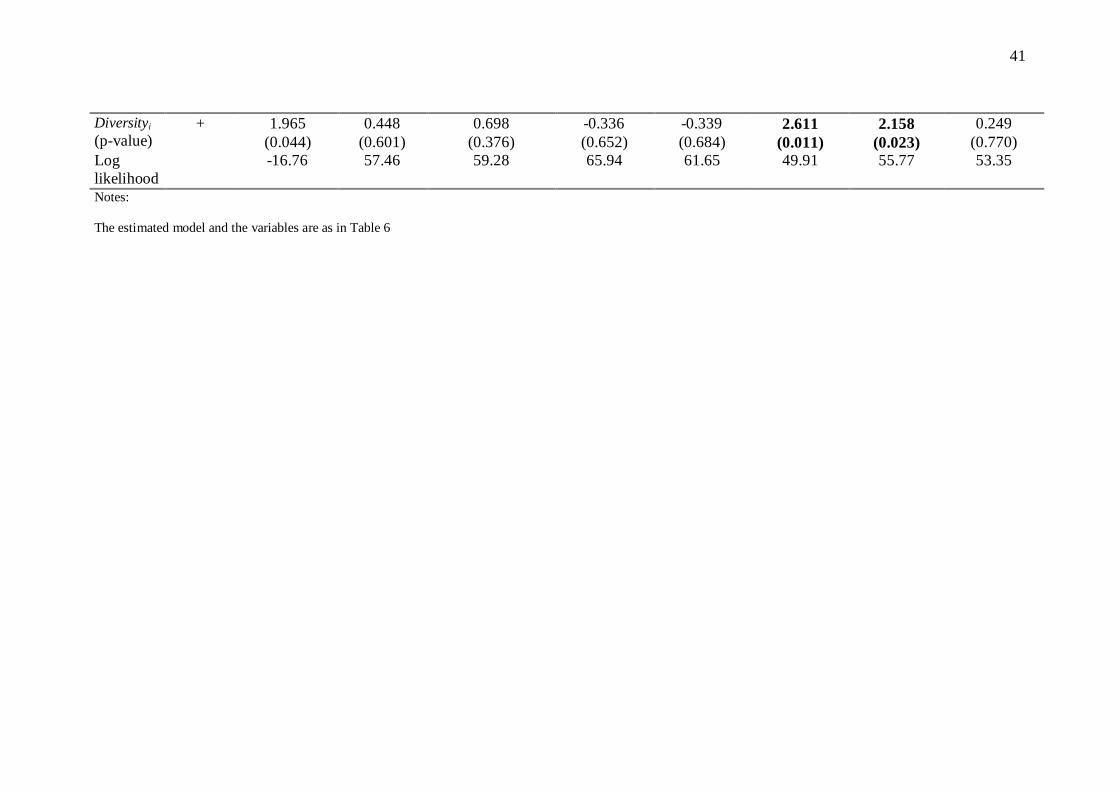
41
Diversityi
(p-value)
+ 1.965
(0.044)
0.448
(0.601)
0.698
(0.376)
-0.336
(0.652)
-0.339
(0.684)
2.611
(0.011)
2.158
(0.023)
0.249
(0.770)
Log
likelihood
-16.76 57.46 59.28 65.94 61.65 49.91 55.77 53.35
Notes:
The estimated model and the variables are as in Table 6
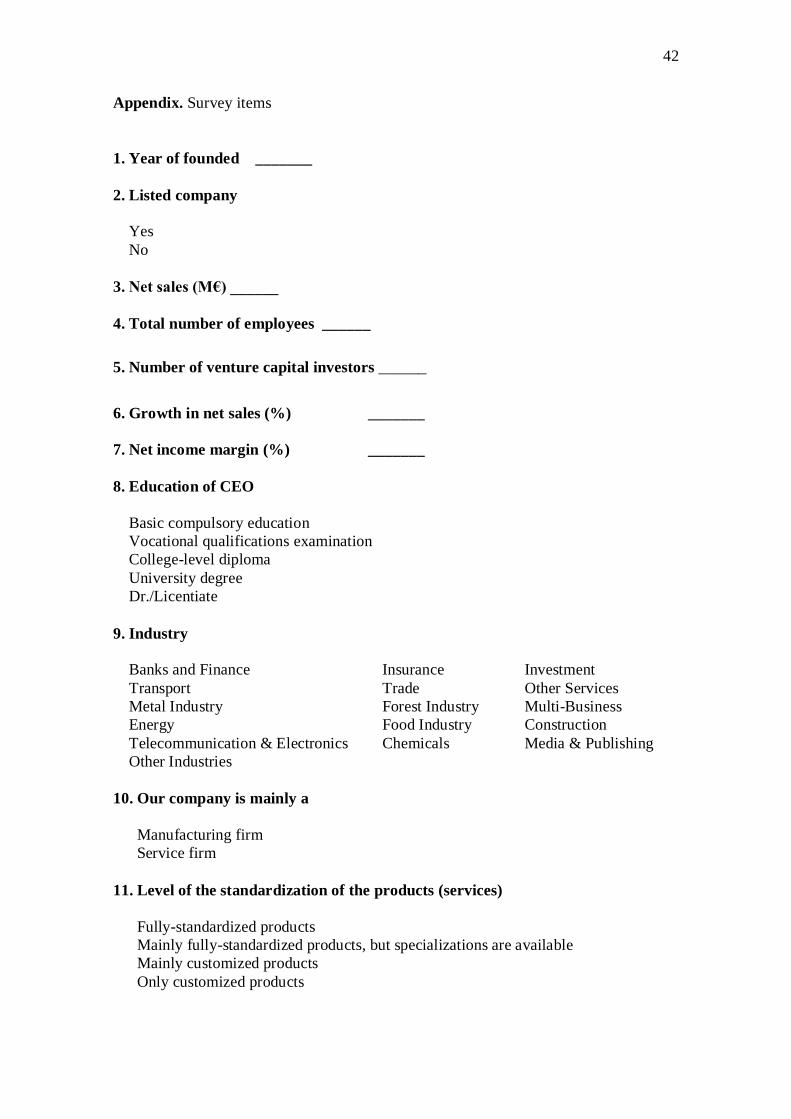
42
Appendix. Survey items
1. Year of founded _______
2. Listed company
Yes
No
3. Net sales (M€) ______
4. Total number of employees ______
5. Number of venture capital investors ______
6. Growth in net sales (%) _______
7. Net income margin (%) _______
8. Education of CEO
Basic compulsory education
Vocational qualifications examination
College-level diploma
University degree
Dr./Licentiate
9. Industry
Banks and Finance Insurance Investment
Transport Trade Other Services
Metal Industry Forest Industry Multi-Business
Energy Food Industry Construction
Telecommunication & Electronics Chemicals Media & Publishing
Other Industries
10. Our company is mainly a
Manufacturing firm
Service firm
11. Level of the standardization of the products (services)
Fully-standardized products
Mainly fully-standardized products, but specializations are available
Mainly customized products
Only customized products
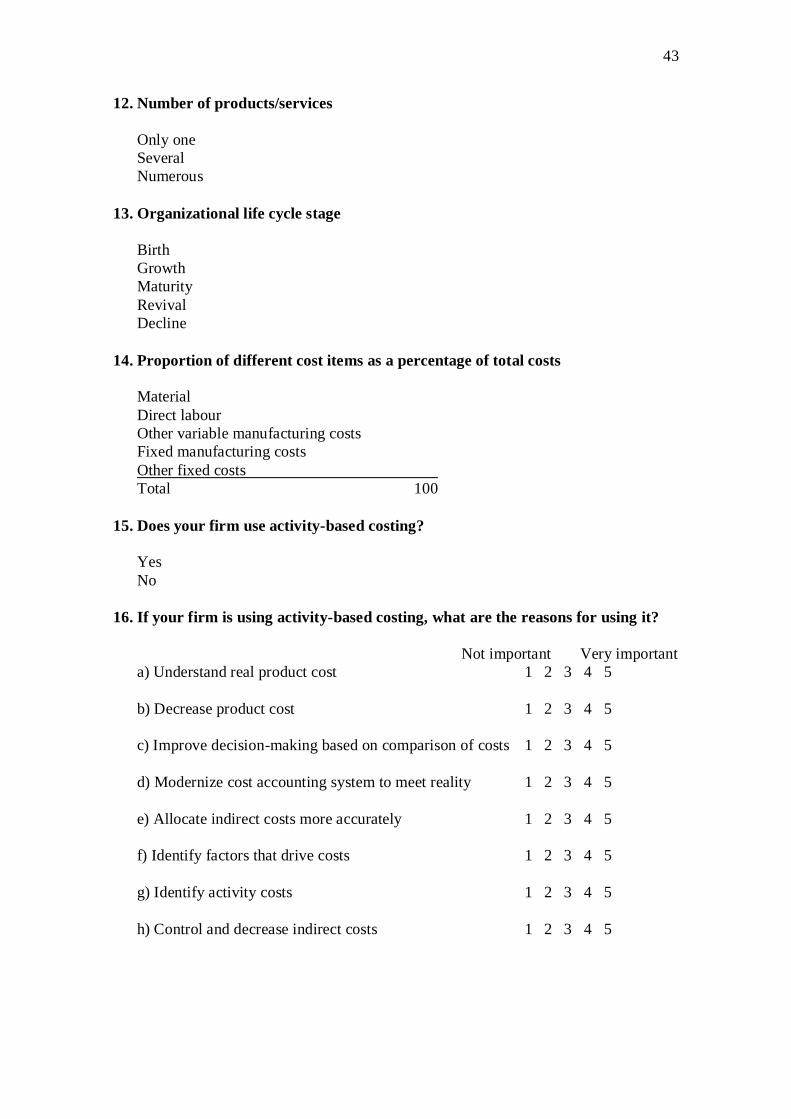
43
12. Number of products/services
Only one
Several
Numerous
13. Organizational life cycle stage
Birth
Growth
Maturity
Revival
Decline
14. Proportion of different cost items as a percentage of total costs
Material
Direct labour
Other variable manufacturing costs
Fixed manufacturing costs
Other fixed costs
Total 100
15. Does your firm use activity-based costing?
Yes
No
16. If your firm is using activity-based costing, what are the reasons for using it?
Not important Very important
a) Understand real product cost 1 2 3 4 5
b) Decrease product cost 1 2 3 4 5
c) Improve decision-making based on comparison of costs 1 2 3 4 5
d) Modernize cost accounting system to meet reality 1 2 3 4 5
e) Allocate indirect costs more accurately 1 2 3 4 5
f) Identify factors that drive costs 1 2 3 4 5
g) Identify activity costs 1 2 3 4 5
h) Control and decrease indirect costs 1 2 3 4 5
Related Documents