THE EFFECT OF ORGANIC CERTIFICATION ON FARMLAND VALUE by Munkhnasan Boldbaatar A thesis submitted in partial fulfillment of the requirements for the degree of Master of Science in Applied Economics MONTANA STATE UNIVERSITY Bozeman, Montana July, 2017

Welcome message from author
This document is posted to help you gain knowledge. Please leave a comment to let me know what you think about it! Share it to your friends and learn new things together.
Transcript

THE EFFECT OF ORGANIC CERTIFICATION ON FARMLAND VALUE
by
Munkhnasan Boldbaatar
A thesis submitted in partial fulfillmentof the requirements for the degree
of
Master of Science
in
Applied Economics
MONTANA STATE UNIVERSITYBozeman, Montana
July, 2017

c©COPYRIGHT
by
Munkhnasan Boldbaatar
2017
All Rights Reserved

ii
ACKNOWLEDGEMENTS
I would like to thank Dr. Joseph Janzen, Dr. Kate Fuller, and Dr.
Anton Bekkerman, for their guidance, insight, and expertise for completing my
thesis project. I also would like to thank Jane Boyd, Tamara Moe,and Wanda
McCarthy, for their help and enthusiastic assistance through out the master’s
program.
I am sincerely grateful to Dr. Randal Rucker and Dr. Joseph Janzen for
the funding source that allowed me to pursue my master’s degree.
Finally, I would like to thank my family for their support during my study
time in Montana. I thank my mother for her inspiration and encouragement.

iii
TABLE OF CONTENTS
1. INTRODUCTION ........................................................................................1
2. BACKGROUND...........................................................................................4
Organic Market ............................................................................................4Input Market Changes ..................................................................................5Supply Shortage ...........................................................................................5Price Premium .............................................................................................7
3. LITERATURE REVIEW ............................................................................ 12
Organic Certification and Regulation ........................................................... 12Organic Certification Decision and Motives .................................................. 13Profitability and Production Potentials of Organic Farming........................... 14Risks and Organic Certification ................................................................... 16
4. THEORY ................................................................................................... 18
Farmland Value .......................................................................................... 18Output and Input Markets .......................................................................... 20
5. DATA ........................................................................................................ 24
The ARMS Survey ..................................................................................... 24List of Variables ......................................................................................... 24Summary Statistics..................................................................................... 28
6. ECONOMETRIC MODEL.......................................................................... 42
7. RESULTS .................................................................................................. 47
8. CONCLUSION........................................................................................... 57
REFERENCES CITED.................................................................................... 59

iv
LIST OF TABLES
Table Page
5.1 Variable Definitions. .................................................................. 33
5.2 Summary Statistics of Costs and Revenue at the FarmLevel ($/acre), 2003-2011 (Untransformed).................................. 34
5.3 Summary Statistics of Cash Rents and Land Values,2003-2011 (Untransformed). ....................................................... 35
5.4 Summary Statistics of Organic Statuses, 2003-2011...................... 35
5.5 Summary Statistics of Costs and Revenue at the FarmLevel ($/acre), 2003-2011 (After excluding small farms). .............. 36
5.6 Summary Statistics of Cash Rents and Land Values,2003-2011 (After excluding small farms)...................................... 37
5.7 Summary Statistics of Costs and Revenue at the FarmLevel ($/acre), 2003-2011 (After exclusion and winsorizing).......... 38
5.8 Summary Statistics of Cash Rents and Land Values,2003-2011 (After exclusion and winsorizing). ............................... 39
5.9 Summary Statistics of Wheat Costs and Revenue ($/acre),2003-2011 (After exclusion and winsorizing). ............................... 39
5.10 Summary Statistics of Soybean Costs and Revenue($/acre), 2003-2011 (After exclusion and winsorizing). ................. 40
5.11 Summary Statistics of Fruit Costs and Revenue ($/acre),2003-2011 (After exclusion and winsorizing). ............................... 41
7.1 Effect of Organic Certification on Farmland Value(Weighted OLS) ........................................................................ 53
7.2 Effect of Organic Certification on Farmland Rental Rate(Weighted OLS) ........................................................................ 54
7.3 Effect of Organic Certification on Farmland Rental Rate(Pseudo-Panel using NASS district cohorts) ................................ 55
7.4 Effect of Organic Certification on Farmland Rental Rate(Pseudo-Panel using State Cohorts) ............................................ 56

v
LIST OF FIGURES
Figure Page
1.1 Total U.S. Organic Sales Growth, 2004-2014..................................3
2.1 Organic Sales by Commodities ($ million), 2014 ............................7
2.2 Total Acres of Certified Organic Land (1000 acres),2008-2015....................................................................................8
2.3 Dynamics of certified organic farms, 2008-2015 ..............................9
2.4 Certified Organic Production ($ billion), 2008-2015...................... 10
2.5 U.S. Organic Exports and Imports ($ million), 2011-2014............. 10
2.6 Organic and Conventional Corn Prices, 2011-2014 ....................... 11
4.1 Farmland Output And Input Markets ......................................... 23

vi
ABSTRACT
This research considers the relationship between organic certification andfarmland values. We employ the ARMS survey data from 2003 to 2011. We constructthree models with different organic status classifications. We control for differencesin farm type, NASS crop district, urbanization, and year fixed effects. We findthat organic certification has a significant (statistically and economically) effect onfarmland value. Our model suggests that a 1 percentage point increase in a farm’sorganic land would result a 0.23 percentage point increase in the farmland rental rate.
1
INTRODUCTION
Increased demand for organic food (Dimitri and Oberholtzer (2009)) and growth
in the number of organic farms in the U.S. (NASS (2012); USDA (2015); USDA
(2016b)) raise new research questions about the economics of U.S. agriculture.
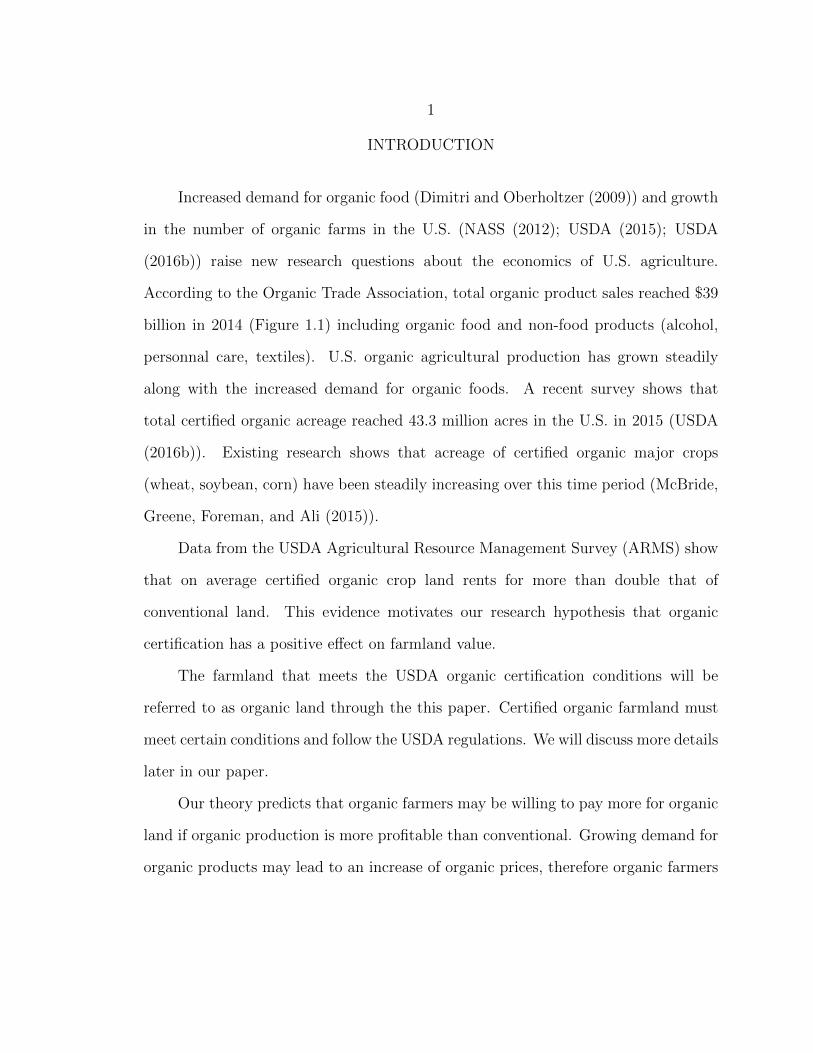
According to the Organic Trade Association, total organic product sales reached $39
billion in 2014 (Figure 1.1) including organic food and non-food products (alcohol,
personnal care, textiles). U.S. organic agricultural production has grown steadily
along with the increased demand for organic foods. A recent survey shows that
total certified organic acreage reached 43.3 million acres in the U.S. in 2015 (USDA
(2016b)). Existing research shows that acreage of certified organic major crops
(wheat, soybean, corn) have been steadily increasing over this time period (McBride,
Greene, Foreman, and Ali (2015)).
Data from the USDA Agricultural Resource Management Survey (ARMS) show
that on average certified organic crop land rents for more than double that of
conventional land. This evidence motivates our research hypothesis that organic
certification has a positive effect on farmland value.
The farmland that meets the USDA organic certification conditions will be
referred to as organic land through the this paper. Certified organic farmland must
meet certain conditions and follow the USDA regulations. We will discuss more details
later in our paper.
Our theory predicts that organic farmers may be willing to pay more for organic
land if organic production is more profitable than conventional. Growing demand for
organic products may lead to an increase of organic prices, therefore organic farmers

2
could receive higher revenues. Also we predict that costs of organic practices are may
be higher than conventional farming. The above mentioned statement is true, if the
demand shift is accompanied by fixed supply. The potential economic gain is the
main motivation to certify for organic farmers (Peterson, Barkley, Chacon-Cascante,
and Kastens (2012)).
In order to consider the effect of organic certification we employ a simple output-
input model in our research. According to the model, the demand shift for organic
products will affect organic input markets, organic lands. The differences between
conventional and organic land prices are not solely caused by the organic status. Thus
we consider in our model other factors that could affect the value of organic land.
The literature on organic farming mainly compares organic and conventional
farming in terms of profit and production potential (Richards (2011); Delbridge,
Fernholz, King, and Lazarus (2013); Crowder and Reganold (2015); McBride et al.
(2015)). Some literature analyzes economic factors and non-economic motives that
affect farmers decision to certify as organic (Sierra, Klonsky, Strochlic, Brodt, and
Molinar (2008); Veldstra, Alexander, and Marshall (2014); Trujillo-Barrera, Pennings,
and Hofenk (2016)). Researchers argue that economic motives are the main reason
driving organic farmers to certify as organic (Peterson et al. (2012); Trujillo-Barrera et
al. (2016)). It is important to examine the relationship between organic certification
and farmland value in context of organic products’ profitability. Profitability has
an impact on certification decision. We estimate the farmland value using standard
farmland valuation models (Roberts, Kirwan, and Hopkins (2003); Hendricks, Janzen,
and Dhuyvetter (2012)).
My research objective is to build a theoretical framework and econometric model
capable of estimating the effect of organic certification on farm profitability and
farmland values. The rest of my thesis is organized as follows. In the second chapter,
3
I discuss the current state of U.S. organic agriculture and its issues. To do that we
specifically focus on organic food demand and organic acreage supply. In the third
chapter, we provide a literature review. The vast majority of current literature focuses
on the financial performance of organic farming and its production efficiency. In the
fourth chapter, we provide theoretical economic background on organic output and
input markets. The effect of organic certification on the organic farmland market will
be discussed. The research employs the Agricultural Resource Management Survey
(ARMS). In the data section (chapter five), we discuss the ARMS survey features
and present summary statistics. In chapter six, we provide econometric models and
discuss regression results. The last chapter provides conclusions and a summary of
my research.
Figure 1.1: Total U.S. Organic Sales Growth, 2004-2014
Source: Organic Trade Association

4
BACKGROUND
Organic Market
The U.S. organic market has experienced a rapid growth since at least 2004.
Demand for organic food is one of main factors influencing industry growth. From $9
billion organic sales in 2002 it has increased up to $43.3 billion in 2015 (Figure 1.1;
Greene and Kremen (2002)). An increase in organic food sales was due to the growth
of retailers and wholesale markets. About 78% of organic sales go to wholesale markets
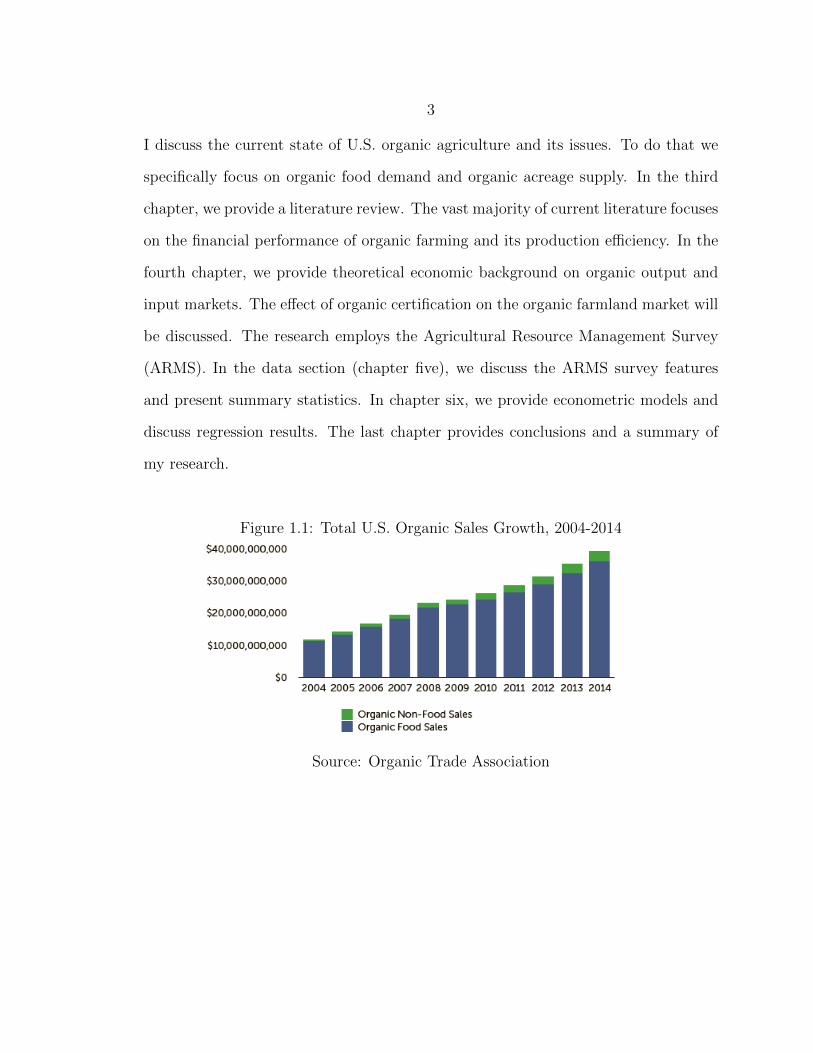
and 14% go directly to retail markets (USDA (2015)). If we break down the organic
sales by commodities, livestock and poultry products have $1.5 billion, vegetables -
$1.25 billion, fruits and nuts - $1, 032 billion, field crops - $718 million, livestock and
poultry - $660 million respectively sales in 2014 (Figure 2.1; USDA (2015)).
According to USDA research certified organic crop acres increased from 1.3
million acres in 2002 to 3.1 million acres in 2011 (Greene (2009); Dimitri and
Oberholtzer (2009); McBride et al. (2015)). The research shows that acreage of
certified organic major crops (wheat, soybean, corn) have been steadily increasing
over this time period. For example, organic wheat production has grown from 22, 5000
acres in 2002 to 345, 000 acres in 2011. Meanwhile acreage of certified organic corn
increased from 96, 000 acres in 2002 to 23, 4000 acres in 2011. Certified organic wheat
production has increased rapidly from 22, 5000 in 2002 to 34, 5000 in 2011, although
organic wheat production reached its peak in 2008 with 400, 000 acres (McBride et
al. (2015)). The recent surveys on organic certified farmland indicate growth of total
acreage from 2008 to 2015.

5
Input Market Changes
Organic farmland is an important input in the organic production process. An
increasing demand on organic productions and foods will effect organic production
input markets. In order to meet increased demand, the farmers should expand their
production capacity. This decision will change the input allocation in organic food
production. The farmers either increase organic acreages or increase production
efficiency using intensive labors, fertilizers and other inputs. In this case, the demand
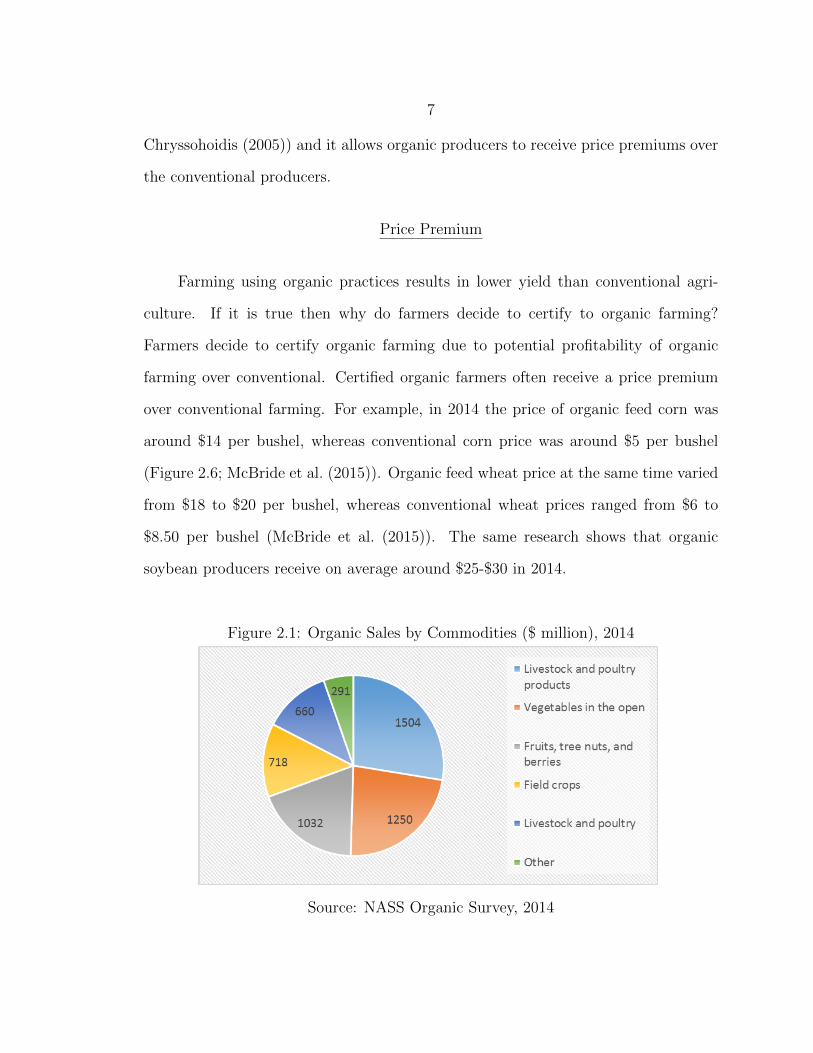
for organic farmland will increase. Figure 2.3 shows the number of organic certified
farmers over time. The number of certified organic farms has decreased from 2008 to
2011 period (Figure 2.3). We see the same decreasing trend in total organic acreage
from 2008 to 2011 (Figure 2.2). However, the total certified organic production has
increased in the same period (Figure 2.5).
Supply Shortage
Despite the fact that the organic industry has expanded over decades, the market
faces some issues and challenges. As mentioned, demand for organic foods has
increased and retail sales have expanded from 1997 to 2015 (Figure. 1.1). However,
organic growers and supply chains have difficulties meeting market demand for organic
food (Greene et al, 2009).Organic acreage has grown slower than demand for organic
food. Certified organic acreage has doubled from 1.3 million acres in 2002 to 3.1
million in 2011, and a recent NASS survey shows that total acreages reached 4.36
million acres in 2015. (McBride et al. (2015); USDA (2016b)). Even though total
certified organic crop acreage has increased, it makes up less than 1 percent of the
total U.S. crop acreage (McBride et al. (2015)).

6
In order to meet demand for organic food, the organic industry either increase
organic imports or domestic organic production (Figure 2.4; Figure 2.5). One way to
increase organic food production is to increase organic acreage. National Agricultural
Statistics Service’s (NASS)surveys show an interesting path of organic acreage growth.
The NASS surveys collect organic acreage, crops, and sales data in 2008, 2011, and
2014-2015. The NASS surveys collect certified organic cropland, rangeland, and
pastureland in every state. We will use only the cropland acreage information from
the surveys. The NASS survey is a population survey compare to the ARMS sample
survey. Total acres of organic land has reached about 4 million acres in 2008, but it
decreased in the following years. From 2014 to 2015 total acres of certified organic
farms increase up to 4.3 million acres (Figure 2.2). Despite organic acres, turbulence,
organic product sales have grown steadily in the same time period (Figure 2.4). These
figures show that organic food production can grow in both extensive and intensive
way.
The U.S. domestic organic food market experienced dramatic growth over a
decade. Demand for organic food production merely meets domestic supply for
organic foods. In order to fill the gap between demand and supply, the market
has to import organic food products into the U.S. Analysis shows that U.S. organic
imports grow from 2008 to 2014 and imports have reached over $1.2 billion dollar
value (Figure 2.5; Jaenicke and Demko (2015)).
The U.S. organic market continues to grow and could conquer own niche in U.S.
agriculture. The industry faces challenges and issues. Despite increased demand for
organic products, organic food supplies have difficulties to meet domestic organic
consumption. However, the organic industry has an advantage to maintain its
expansion. Consumers willingness to pay for organic food is higher (Krystallis and
7
Chryssohoidis (2005)) and it allows organic producers to receive price premiums over
the conventional producers.
Price Premium
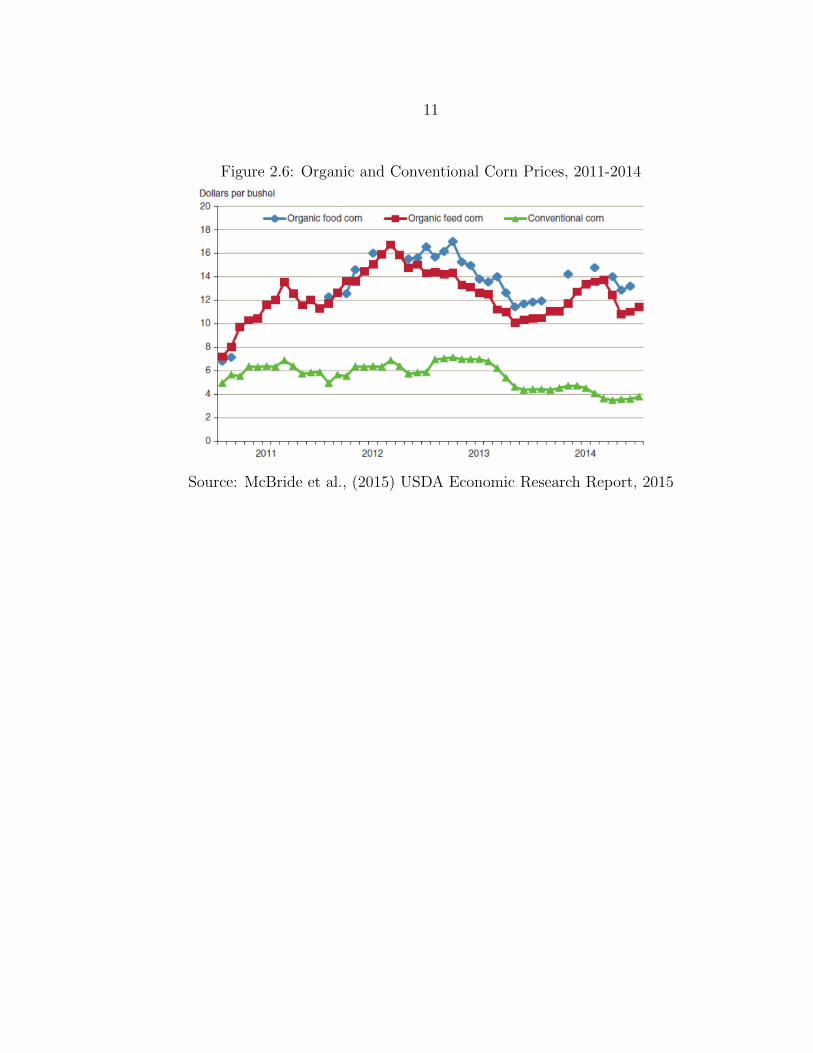
Farming using organic practices results in lower yield than conventional agri-
culture. If it is true then why do farmers decide to certify to organic farming?
Farmers decide to certify organic farming due to potential profitability of organic
farming over conventional. Certified organic farmers often receive a price premium
over conventional farming. For example, in 2014 the price of organic feed corn was
around $14 per bushel, whereas conventional corn price was around $5 per bushel
(Figure 2.6; McBride et al. (2015)). Organic feed wheat price at the same time varied
from $18 to $20 per bushel, whereas conventional wheat prices ranged from $6 to
$8.50 per bushel (McBride et al. (2015)). The same research shows that organic
soybean producers receive on average around $25-$30 in 2014.
Figure 2.1: Organic Sales by Commodities ($ million), 2014
Source: NASS Organic Survey, 2014

8
Figure 2.2: Total Acres of Certified Organic Land (1000 acres), 2008-2015
Source: NASS Organic Surveys, 2008, 2011, and 2014-2015
9
Figure 2.3: Dynamics of certified organic farms, 2008-2015
Source: NASS Organic Surveys, 2008, 2011, and 2014-2015

10
Figure 2.4: Certified Organic Production ($ billion), 2008-2015
Source: NASS Organic Surveys, 2008, 2011, and 2014-2015
Figure 2.5: U.S. Organic Exports and Imports ($ million), 2011-2014
Source: Jaenicke and Demko (2015). Preliminary Analysis of USDAs Organic TradeData: 2011 to 2014
11
Figure 2.6: Organic and Conventional Corn Prices, 2011-2014
Source: McBride et al., (2015) USDA Economic Research Report, 2015

12
LITERATURE REVIEW
The growing market for organic food has led to an enriched literature on the
economics of organic agriculture. In my literature review we cover the following
main topics in organic farming. The majority of the literature compares organic and
conventional farms’ economic and financial performance. Others examine alternative
motive for organic certification.
Organic Certification and Regulation
The National Organic Program (NOP) within the USDA Agricultural Market
Service (AMS) sets regulations, organic labeling, and national organic standards
for organic agricultural products. According to USDA organic regulations, organic
operations must maintain soil quality and water quality. Synthetic fertilizers and
genetic engineering may not be used in organic operations. The USDA standards
allow four categories of organic production: crops, livestock, processed products,
and wild crops. If an organic farm makes more than $5000 in gross annual sales,
it must be certified. If the farms receives less than $5000, it may be exempt from
organic certification. Certification allows the farms use the USDA organic seal on
their products. If they are not certified (but can sell their organic products in the
market), the farms may not use the seal.
In short the organic certification process takes the following steps. In the first
stage, farmers sent an application to certifier agents. In the application, farmers
should state their farm, farming operations, and their projected organic sales. In
the next step, the organic certifiers review a new farmers application and inspect the
farm. If the farmer meets organic operation standards, the certifier will issue the
organic certification to the farmer (Coleman (2012)).

13
The farms can be certified by certifying agents. These agents have accreditation
from the USDA to certify farms. The farmers can be certified by both government
and private certifying agents. The certifying agents play a big role in formation of
organic sectors (hotspots) in local areas (Jaenicke et al. (2015)). The hotspots are
the areas where organic agriculture has high concentration. Jaenicke et al. (2015)
find that the agents have a positive effect on local organic hotspot formation.
Once the farms choose to certify, they must go through the transition period,
which take 36 months. According to the USDA regulation, the farms cannot use
prohibited fertilizers and other substances during this period. Until the full transition
period is over, the farms cannot sell or label their products as organic. Also farms
cannot use the USDA organic seal. During transition period, the organic farms face
several challenges and issues. The farms cannot charge a higher price premium for
organic products. Organic farms will incur higher production costs than conventional
practice (Oberholtzer, Dimitri, and Greene (2005)).
The certification process will take time and farmers also incur the costs of
certification. The USDA has a cost sharing program which funds organic certified
farmers costs. The National Organic Certification Cost Sharing Program (NOCCSP)
and Agricultural Management Assistance (AMA) are available for organic farmers
and producers.
Organic Certification Decision and Motives
Researchers divide the reasons and motives for organic certification into
economic and non-economic motives. The main economic reason to certify organic
farming is relative profitability of organic farming over its conventional counterpart.
The non-economic factors could be environmental, personal, social, ideological or

14
philosophical beliefs (Sierra et al. (2008); Veldstra et al. (2014);Trujillo-Barrera et al.
(2016)) that aren’t valued in the market.
We could categorize the organic farmers based on their motives to the following
groups. There is a group of farmers who farm accroding to organic standards, but
do not intend to certify. They see organic certification as a disadvantage and tend to
be independent from organic regulations. They avoid certification because of higher
production costs, higher certification costs, and lack of information on organic price
and markets (Strochlic and Sierra (2007)). These farmers may use a combination of
both conventional and organic practices. The next groups main motivation to certify
is the economic factor. The last group see an organic farming as their environmental
and social commitment. For them economic factors are secondary compared to their
philosophy of organic farming (Darnhofer, Schneeberger, and Freyer (2005); Strochlic
and Sierra (2007)).
Farmers tend to adopt organic practice over conventional farming based on
expected economic rewards rather than social and personal rewards (Trujillo-Barrera
et al. (2016)). The expected economic reward from organic practice is predominant
among other factors. In addition the authors note that moderate risk tolerance has
a positive impact on economic rewards.
The farmers make decisions to certify to organic farming based on their economic
and non-economic motives. The literature generally finds that economic motives are
the main reason to adopt organic farming practices. Organic farmers expect to receive
higher economic profits from organic certification over conventional farming.
Profitability and Production Potentials of Organic Farming
The literature on the profitability of organic farming relative to conventional
practice finds mixed conclusions. The researchers examine financial competitiveness

15
of organic farming on a global scale. Crowder and Reganold (2015) argue that organic
agriculture is significantly more profitable than conventional agriculture, because of
organic price premiums over conventional agriculture. They state that in order to
compete with conventional farms, the organic farms should receive on average at
least 5-7% above them. The organic farms could achieve the profitability even with
lower yields between 10-18% (Crowder and Reganold (2015)).
McBride et al. (2015) using the ARMS data analyzed the profit potential of
organic farming compared to the traditional conventional practice. The research
shows that organic farms receive positive economic profit for corn and soybeans
compared to their counterparts. In addition the researchers find that the organic
profitability also varies by region.
Some authors inspect the profitability and costs of organic crops such as wheat
and soybean and other major crops (McBride and Greene (2009); Klonsky (2012);
McBride, Greene, Ali, Foreman, et al. (2012)). The findings show that organic
wheat has lower yields and has relatively lower per acre operating costs compared
to conventional wheat. However, the total economic cost per acre for organic wheat
is higher than conventional wheat. Due to higher price premiums, organic wheat
is able to cover the differences in the total cost (McBride et al. (2012)). On the
other side, organic soybean has higher per bushel operating costs than conventional
soybeans. The organic soybean can achieve profitability over conventional soybeans if
the producers receive higher price premiums. These studies show that organic crops
might have higher operating costs than conventional crops (McBride and Greene
(2009)).
Previous studies have found that organic farming receive higher revenue or at
least a positive return than the conventional farming system. The other authors
argue that organic profitability depends on farm sizes (Delbridge et al. (2013)).
16
Large organic farms tend to receive relatively higher returns than small conventional
farms. However, it is difficult for bigger farms to manage an organic cropping system.
If the farmers cannot manage accurately, the per acre profitability advantage over
conventional farming fades (Delbridge et al. (2013)).
In contrast to Crowder and Reganold (2015), Uematsu and Mishra (2012) argue
that organic profits aren’t significantly higher than conventional farms. Although
certified organic producers receive higher revenue than conventional farms, organic
farms incur higher production costs, because organic farms tend to spend more on
labor, insurance, and marketing charges. Uematsu and Mishra (2012) also compare
organic and conventional farms’ household incomes. The result suggest that organic
farms have higher household incomes compare to conventional farms.
Risks and Organic Certification
Although the goal of this study is not comparison of risk attitudes of organic and
conventional farming, we should note that risk perception and risk tolerance are one
of the factors influencing the organic certification decision. Gardebroek (2006) argue
that organic farmers are less risk averse compared to their counterparts. Again risk
tolerance is highly correlated with the expected economic returns. If the farmer is
risk averse or risk neutral, they will not adopt the new organic farming system, unless
the expected economic rewards will compensate the extra risk (Trujillo-Barrera et al.
(2016)). As we notice, for the organic farmer, the risk management is really crucial to
sustain production and keep profitability. The organic farmers could face production
risk, input risks, marketing risks, and agricultural policy risks (Hanson, Dismukes,
Chambers, Greene, and Kremen (2004)). Also the organic farmers have fewer tools
to manage pest and disease outbreaks, and there are fewer crop insurance products
available.

17
Certified organic farms use crop diversification as a risk tool in their organic
practices. Organic farms achieve crop diversity through growing different types
of crops and longer crop rotations. The crop rotation is a major strategy to
reduce production and financial risks (Moncada and Sheaffer (2010)). The crop
diversification also increases crop yields or at least reduces yield gap between
conventional and organic practices (Moncada and Sheaffer (2010); Ponisio et al.
(2015)).

18
THEORY
The previous literature suggests that organic farming may be more profitable
than conventional agriculture only if organic farming can capture price premiums.
Studies show that organic food products do capture price premiums at the retail
level (Jaenicke et al. (2015)). In addition, organic agriculture tends to incur higher
production costs than conventional agriculture. Since the organic certification process
affects farms profits and costs structure, it is worth wile to explore how organic
certification may affect farm input prices. As said earlier demand for organic foods
and crops has increased over time, which could increase prices for organic foods and
inputs such as land. In this chapter we discuss the farmland value and its features.
Second, we discuss how organic demand affect farmland values. We capture these
topics in context of a multimarket model.
Farmland Value
Farmland is a crucial asset in the agriculture sector. Farm real estate (land
and structure) accounts about 84% of the farm balance sheet in the U.S (Nickerson
et al. (2012)). Because land is a durable good, we can see farmland not just as
an agricultural input, but also a source of investment. As any other investment,
farmland generates returns to its owners. The returns on agricultural land may
include both agricultural and non-agricultural benefits. The farmland can be used in
potential urban activities. Also farmland provides natural amenities (Borchers, Ifft,
and Kuethe (2014)). A recent survey shows that the average value of farm real estate
has been increasing over time and it has reached $3, 010 per acre in 2016 (USDA
(2016a)).

19
In farmland rental discussion we should consider the relationship between
landowners and land tenants. Ultimately the landowner establishes and makes
decision to change the rental rate. The statistics of the ARMS survey shows that
on average certified organic crop land earns double the rent of conventional lands
(Table 5.7). What factors might influence landowner to raise the rental after the
farmland is organic certified ? On the other hand, why would organic farmer pay
higher rental rate for his farmland if he converts to organic agriculture ? Agricultural
land generally follows profitability of agricultural production. If organic production
gives more profits, then the certified organic land return will rise. This means that the
certified organic farmers pay higher rents for organic land due to organic product’s
profitability. On the other side, the land owners see the organic land as a source of
high future returns compared to the conventional lands.
Organic farm profitability is an important component of the relationship between
organic certification and farmland value. The land is a special input in agricultural
production. It has immobility and the lands quality changes very slowly. It is
complicated to determine the market land price. The literature provides standard
approaches to measure farmland value (Roberts et al. (2003); Hendricks et al. (2012);
Robbins, White, et al. (2014)). A standard approach to land valuation is to compute
the land value as a present discounted value of expected cash flows (or earnings)
from farms agricultural activities. Suppose the following equation (Hendricks et al.
(2012)).
Vt =T∑t=0
δtEt(πt+1) (4.1)
where Vt is a land value at time t and δt is a discount rate. We treat the land value as a
expected function (Et) of future incomes (or profits) (πt+1) at time t+1. The equation
(4.1) shows to the full stream of future cash flows from farmland use. The current

20
land price (Vt) shows the potential future profitable use of that farm land (Plantinga,
Lubowski, and Stavins (2002)). As expected returns from farmland increases the land
value also rises. However, we do not observe farmer’s expected earnings, instead we
observe the actual land values. We cannot observe the full stream of future profits
like in equation (4.1), instead we observe only per period land values. In this case,
the rental rate would be an appropriate measurement for land value. Consider next
equation.
rt = Et(πt) (4.2)
where rt is farmland rental rate at time t. Unlike equation (4.1), the rental rate is
the per period price for land. At each period, the farmer will adjust his expectation.
However, we do not observe the expected rental rate at each t time period. Instead we
observe the actual cash rents for farmlands. The difference between expected rental
rate and actual rents will lead to a measurement error (Hendricks et al. (2012);Kirwan
and Roberts (2016)). Consider the following equation.
rt = rt + εt (4.3)
where rt is actual cash rents and rt is expected rents from the model (4.2). The
measurement error (εt) will lead to biased estimations in our regressions. At this
stage, we cannot overcome the measurement error.
Output and Input Markets
To illustrate how changing demand for organic products affects land and other
farm input markets, we present a simple multimarket model in Figure 4.1. Organic
farms produce or grow an organic product (output) using multiple inputs. In the
21
farm output market, we suppose demand for organic food shifts from D0 to D1. This
demand shift represents growth in organic food consumption as seen in Figure 1.1.
As a result of the demand shift, both output price and quantities increase. The
equilibrium price rises from P0 to P1, and the equilibrium quantity of organic food
increases from Q0 to Q1 (Panel a, Figure 4.1). Supply for organic products (S) is
a derived from the production function that describes how organic inputs can be
converted to organic output.
Higher output prices (or higher organic price premiums) might increase organic
farms’ profits. A price increase of organic products (from P0 to P1) is a result of
the demand shift for organic products (Panel a, Figure 4.1). The demand shift could
affect other linked organic input markets. A higher price will increase revenue for
organic outputs.
In order to sell products with the organic label and capture any organic price
premium, the new incoming organic farmers have to certify. It would increase the
quantity of supplied organic products. The organic certification process takes time (3
years) during which yields are generally lower and farmers cannot label products as
organic. During this period farmers may incur revenue losses and household income
reduction. If the expected returns from organic farming exceed conventional farming
over a relevant time horizon that includes transition and post-certification revenues,
then farmer would consider organic certification.
The certification process also has impacts on organic farmers’ production input
allocation. In order to increase crop production farms can either increase acres of
cropland or increase per acre yields. If an organic farmer chooses to increase organic
acreage, it could affect the organic farmland market. In Figure 4.1, we show this as a
shift from D0 to D1 (Panel b), causing the organic land rental rate to increase from
r0 to r1.

22
We assume that in the short run organic land supply is relatively inelastic.
The transition period makes the land supply inelastic in the short run. However,
conventional land can transition to organic over a period of three years, so organic
land supply is more elastic over a time horizon of several years or more. If the demand
for organic land increases, the equilibrium amount of organic land acreage also goes
up (from A0 to A1) (Panel b, Figure 4.1). In our model, the shift in demand for
organic land induces a greater percentage increase in the price of organic land than the
percentage increase in quantity of that land, because organic land supply is relatively
inelastic. Also we assume that demand curve for organic land should be relatively
inelastic than land supply. Under this condition the effect of the demand shift (D0
to D1) for land will have larger impact on farmland value.
Organic farming is more labor intense relative to the conventional farming
(Crowder and Reganold (2015)). It uses less chemicals and pesticides than its
counterpart. Organic farming uses other substitutes for synthetic chemicals such
as composting and bio pest management (Oberholtzer et al. (2005)). Our data
shows that fertilizers and composts for organic farming and seed costs are higher
than conventional practices. Organic farming practices are more expensive due to
the higher price of inputs (Veldstra et al. (2014)). Organic farms spend more time
managing soil fertility, crop disease, and overall crop rotation management (Moncada
and Sheaffer (2010)).
The multimarket model suggests a hypothesis that the organic certification might
have a positive relationship with farmland value. However, we can test this hypothesis
under the following conditions. If the organic certification hasn’t have a transition
period, where the organic farms can convert their farmland immediately, we would
see a perfectly elastic supply of farmland. Without transition period and other costs
related to the conversion, farmers would not have any barriers and constraints to

23
freely convert their farmlands. Therefore, we would likely to observe a fixed rental
rate, which is not different than conventional land price. In general, the supply of
farmland would be perfectly elastic in the long run. We can test our hypothesis in
the short term, where supply of land is relatively inelastic.
(a) a
(b) b (c) c
Figure 4.1: Farmland Output And Input Markets
24
DATA
The ARMS Survey
To study the relationship between organic certification, farm profitability and
land values, we use Agriculture Resource Management Survey (ARMS) data collected
by the National Agricultural Statistics Service (NASS) of the USDA. NASS interviews
a nationally-representative sample of approximately ten thousand farms every year.
It does not follow the same farmers every year, instead it re-samples the population of
US farmers each year. Therefore, the ARMS survey is repeated cross-sectional data.
The ARMS survey records farms’ total acreages, cropland, production quantities
and prices, production costs, and records socio-economic characteristics of the farm
operator.
The ARMS data consists of several phases. In the first phase, NASS interviews
potential farms who grow specific commodities applicable in phase two. In the second
phase, NASS conducts surveys at the field level collecting data on the use of chemicals,
seeds, irrigation, and other farmland characteristics. The survey also gets information
on livestock. At phase three, the ARMS collects data at the individual farm level. At
this stage the survey observes price, costs, assets, liabilities and other financial info.
List of Variables
The ARMS survey provides data on rented acres, total operated acres, crop
acres, cash rental expenditures, estimated market value of farmland, crop production
costs, value of crop productions, government payments, and other variables at the
individual whole farm level. We define the list of variables used in our analysis
generated from the ARMS in Table 5.1.

25
We define our variables on a per acre basis. To do that we use number of the
ARMS survey’s acreage variables. We divide cash rental expenditure by acres cash
rented to calculate the per acre cash rental rate. We use total cropland acres to
calculate per acre revenue. To calculate per-acre costs we divide farm-level costs by
the total operated acres. The total operated acres considers all farm’s production
activities. According to the data, organic farms on average have less owned acres
than conventional farms. on average organic farms have 169 owned acres, whereas
the conventional farms have 245 acres (Table 5.3). Conventional farms have higher
operational and cropland acreages than organic farms. On average conventional farms
have 648 operated acres and 523 cropland acres. On the other side, organic farms on
average have 532 operated acres and 404 cropland acres. These differences in means
between organic and conventional farms are not statistically significant.
Revenue, production costs and organic status are essential variables in the
relationship between certification, profitability and land values. We construct two
different types of organic status variables. First, in the binary organic status
classification, we treat the farms with any certified organic cropland acres as certified
organic farms. If the farms do not have any organic cropland, then we treat them as
conventional farms. Second, we define organic status as a ratio of certified organic
crop acres to total cropland acres by individual farm, county and year (Eq 5.1)
Organicijt =OrganicCroplandAcres
TotalCroplandAcres(5.1)
As previously noted, profitability plays an important role in a producers’ decision
regarding organic certification. We measure per acre revenue as the ratio of the value
of crop production to total crop acres. We expect that higher farm revenue has a
positive impact on farmland value.
26
We categorize the listed farm costs in Table 5.1 as variable and fixed costs.
Costs of seeds, fertilizers, other chemicals, labor, and fuel are the main variable costs
in farm operations. Organic farms spend more on labor, seeds and fuel compared to
conventional farms. These farms spend even more on fertilizer and organic compost
(Klonsky (2012)). We expect that due to regulated limits on synthetic fertilizers, the
organic farms would spend more on organic based fertilizers than the conventional
farms. The fertilizer cost is a sum of fertilizer, lime, soil conditioner and chemicals
for crops, livestock, poultry, and general farm.
Our labor cost is a sum of cash wages, payroll taxes and benefits, and
contract labor. We would expect that organic farms might have higher labor costs
than conventional farms. Organic production is labor intense and uses specialized
equipment (Oberholtzer et al. (2005)).
Fixed costs in our model are taxes, interest, and farm insurance. The tax cost
is a sum of property taxes on real estate, livestock and machinery. We expect higher
property tax expenses would have a negative relationship with the value of land.
Interest cost is interest paid on debt secured by real estate and debts not secured by
real estate.
Government payments and subsidies play an important role in agricultural
production and farmland value. We include direct government and counter cyclical
payment and federal crop insurance as a farm income in our model. We expect that
government direct payments have a positive impact on farmland value. The literature
show that the government payments and subsidies increase the farmland rental rate
(Roberts et al. (2003); O’Donoghue and Whitaker (2010); Hendricks et al. (2012);
Kirwan and Roberts (2016)).
Previous literature suggests that higher off-farm income increases per acre
farmland value (Uematsu and Mishra (2012)). The authors argue that higher off-farm

27
incomes increase farms financial stability and ability to pay debts. Farms with higher
off-farm incomes are less dependent on incomes from farm income. We calculate
household total and off-farm incomes on per acre basses. We divide household incomes
by total operation acres.
Crop rotation and crop diversity is a major challenge in organic farming practice.
Organic farming relies heavily on soil fertility. The crop diversification provides not
only soil fertility but also receives higher price premiums (Oberholtzer et al. (2005);
Veldstra et al. (2014)). In order to estimate the crop diversity, we create a variable
which counts each unique crop. If the farmer harvests at least one acre for a certain
crop, we count it as one type of crop. For example, if the farmer harvests 3 acres of
fruits and 230 acres of wheat, then the farmer grows 2 types of crops. However, this
variable ignores relative sizes of harvested acres.
The urbanization influences both organic status and farmland value. In urban
areas, the land value tends to be higher (Kuethe, Ifft, Morehart, et al. (2011)). The
remote and rural areas are not favorable for organic farming (Kostandini, Mykerezi,
and Tanellari (2011)). Urbanization has a positive impact on farmland value. If
organic farms grow organic products near urban areas, they will receive higher rents
than conventional farms. In addition organic farms near urban areas have access to
markets, therefore, they capture higher price premiums. Also the organic lands could
be used for residential and commercial use, which increases the future returns (Kuethe
et al. (2011)). The ARMS data defines urbanization by category from rural to most
urbanized area. For example, if urbanization code equals to one, it means that farms
are located in counties in metro area more than 1 million population. If it equal to
two, the farms are located in urban area of less than 1 million population. There are
nine categories for urbanization in the ARMS survey data. In order to capture the
urban influence on farmland value, we generate dummy variables for each categories.
28
In order to measure farm product specialization, we create dummy variables
corresponding to the ARMS farm type code. The farm type is a categorical variable,
which defines farm specialization based on the farms’ crop, livestock, and other
agricultural production. There are sixteen categories of farm production in the ARMS
data.
Summary Statistics
Our sample period runs from 2003 to 2011. We use this period because the
ARMS data includes certified organic cropland acres as an only organic variable in
survey. We don’t have a consistent measurement of certified acres outside this period.
For these years, we have initially 187, 174 individual farm-year level observations after
pooling data over this period. The summary statistics use the ARMS survey sampling
weights. The ARMS weights measure how each farm is representative in a given year
(O’Donoghue and Whitaker (2010)). The sampling weights (or probability weights)
are inverse of probability. If the sampling weight for observation is 2000, means that
the farm represents 2000 U.S. farms. In other word, the probability of being selected
in the sample is 1/2000 (Cameron and Trivedi (2009)).
According to the USDA organic regulation, if the farm makes more than $5000 in
annual sales, it must be certified to sell organic products. Therefore, we exclude those
farms who make less than $5000 in value of crop production. The organic farmers
can certify not only their cropland but also pastureland and rangelands. However,
we observe only certified organic cropland in our sample. If the farmer has certified
organic cropland, we treat him as a certified farmer. Because of that we also exclude
any livestock related production activities and sales from our sample. After these
exclusions, we have 81593 total observations. Only 2177 observations have certified

29
organic cropland (Table 5.2). The proportion of observed organic farms is consistent
with other literature (e.g., Uematsu and Mishra (2012)).
In Table 5.3, we describe summary statistics for rental rates and land values at
the farm-year level. We calculate both land values and cash rents on a per acre basis.
We have a full number of observations on acreage and land value variables. After
we divide rents and land values by acres, we lose some observations, because farms
either don’t have acres for rent or they simply are not renting any acres of land. As a
result of calculation we lose about 49.5% of organic farms and 41.6% of conventional
farms. The proportion of renting organic farms (50.5 %) are lower than conventional
farms (58.4%), but the difference is not dramatic. On average, organic farms rent 576
acres, whereas conventional farms rent 235 acres. From Table 5.3 we could see that
organic farms have a higher per acre rental rate than the conventional farms. Organic
farms pay an average of $458 per acre, whereas conventional farms pay $179. This
supports our main hypothesis that organic farms tend to pay higher rental rates than
conventional farms, but we cannot conclude that certification causes this differences
before controlling for other factors.
About 2.6 % of our total sample is certified farmers (Table 5.4). The proportion
of certified farms in the total sample is similar to the U.S. organic farms’ proportions.
It means only 2.6 % our sample have any certified organic cropland. If we consider
the distribution of organic proportion status variable, then 40.5 % of organic farms
are fully converted their croplands into organic cropland. The rest 59.5 % of organic
farms partially converted their farmland. Organic farms who fully converted their
farmland tend to have on average 311 acres of cropland. The farms who partially
converted their farmland have on average 4.88 acres of organic cropland.
Both conventional and organic farms earn positive per acre revenues (Table 5.2),
but organic farms are more relatively profitable than their counterparts. If the organic
30
farms are able to receive that high revenue, then it might be worth the cost to certify.
In terms of variable costs, organic farms tend to have on average higher costs than
conventional farms (Table 5.2). Organic farms tend to have higher costs for fertilizers
and labor. Organic farms have also higher costs for fixed costs. Conventional farms
have higher government subsidies than organic farms (Table 5.2).
However, the summary statistics show that the standard deviations are enormous
for all variables. At this point we cannot see any statistically significant difference
between conventional and organic farms. The organic farms have especially large
standard deviations. Such huge standard deviations could be result of skewed
distributions. We usually observe heavy-tailed distributions due to the presence of
outliers. For our data it this be the case, where some farms have the biggest revenue
and costs. Some farms with small acres tend to have much higher costs than average
farms. If we look at scatter plot graph for cost variables within 100 acres, we could
observe there are many farms with more than $10, 000 per acre costs (Figure. 9). We
construct our variables per acre terms. In this case, farms with small acreage could
have extreme per acre costs.
One of our concerns over the data is that it has a skewed distribution. To
address the presence of outliers, we use two methods: excluding very small farms and
winzorizing. First, we drop the farms who have small acres in operations. We drop
farms who have less than or equal to 20 acres. By dropping small farms we mitigate
the effect of outliers. After the exclusion, we observe in overall 76194 individual farms,
which include 1952 certified organic farms (Table 5.5). In this subsample, about 45524
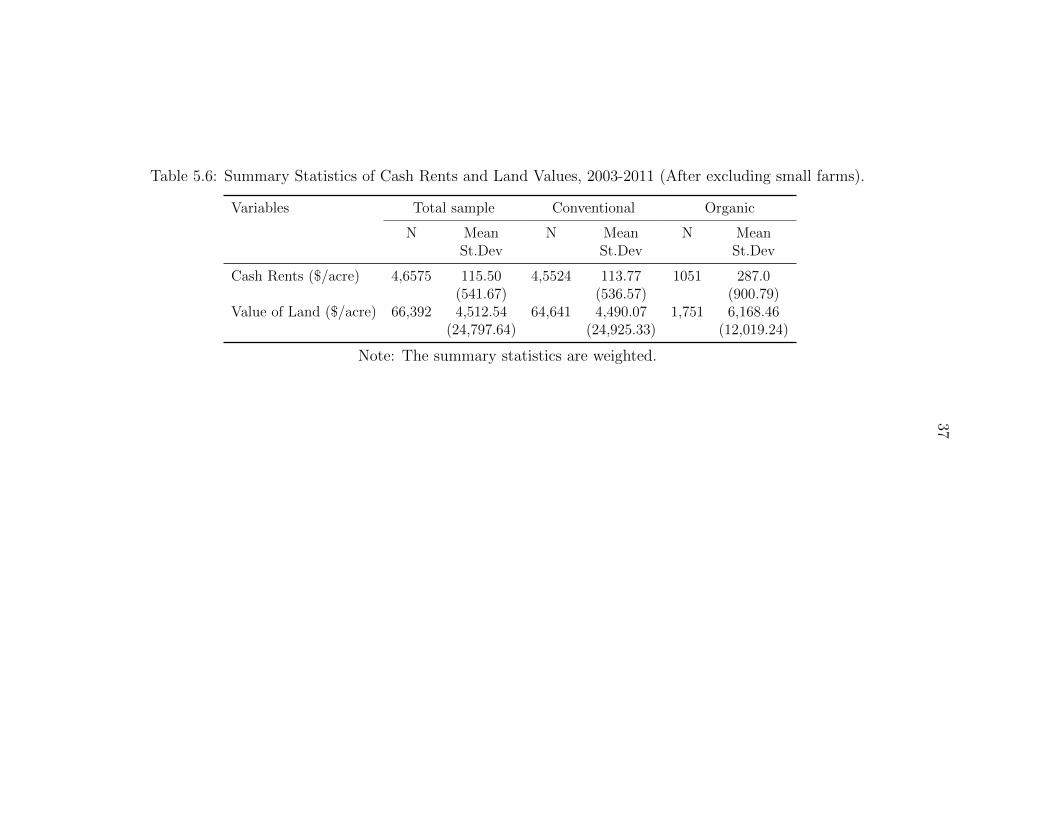
conventional and 1952 organic farms pay cash rents (Table 5.6). Organic farms still
pay higher cash rents than conventional farms. On average organic land pays $287
per acre compare to $113 for conventional lands. The difference in cash rent between
organic and conventional lands still remains. Even after excluding farms, we still get

31
huge standard deviations for revenue and costs. This indicates that the data still
suffers from outliers. In this case we decide to winsorize the data.
Winsorization is one of the methods to deal with the outliers issue. In the
previous section, we trimmed farms with small acreages. But, the difference between
trimming and winsorizing is that the last one does not exclude the outliers out of
sample . Instead winsorizing places the outliers with certain percentiles. In our
case, we winsorize all cost variables at the 99th percentile. It means all values at
the top 99th percentile will be replaced by the least value at the same percentile.
We replace all our variables including costs. We do not winsorize cost variables
at the bottom percentile. Because the minimum value for costs are zeros. We do
winsorize the income variables at the bottom 1% percentile. After we winsorize
the data we still get the same number of observations, because we do not trim the
data at the top percentiles (Table 5.7; Table 5.8). Winsorizing makes the standard
deviations lower, because outlier values have been replaced. Organic farming still
receive higher rents than conventional farms. Organic farms receive higher revenues
than conventional farms. The costs are relatively low compared to the previous
descriptive statistics (Table 5.5). Labor, seed, and fertilizer costs are highest among
variable costs. However, we cannot see a statistical difference between organic and
conventional farms in terms of revenue and costs. The organic lands still pay higher
cash rents than conventional lands (Table 5.8). On average organic land pays $220
per acre whereas the conventional land - $102 per acre.
If we describe costs by crop types, we get lower per acre variable costs than at
the farm level summary statistics. Also the standard devaitions are smaller than at
the farm level. For example, the costs for wheat are relatively similar to the soybean
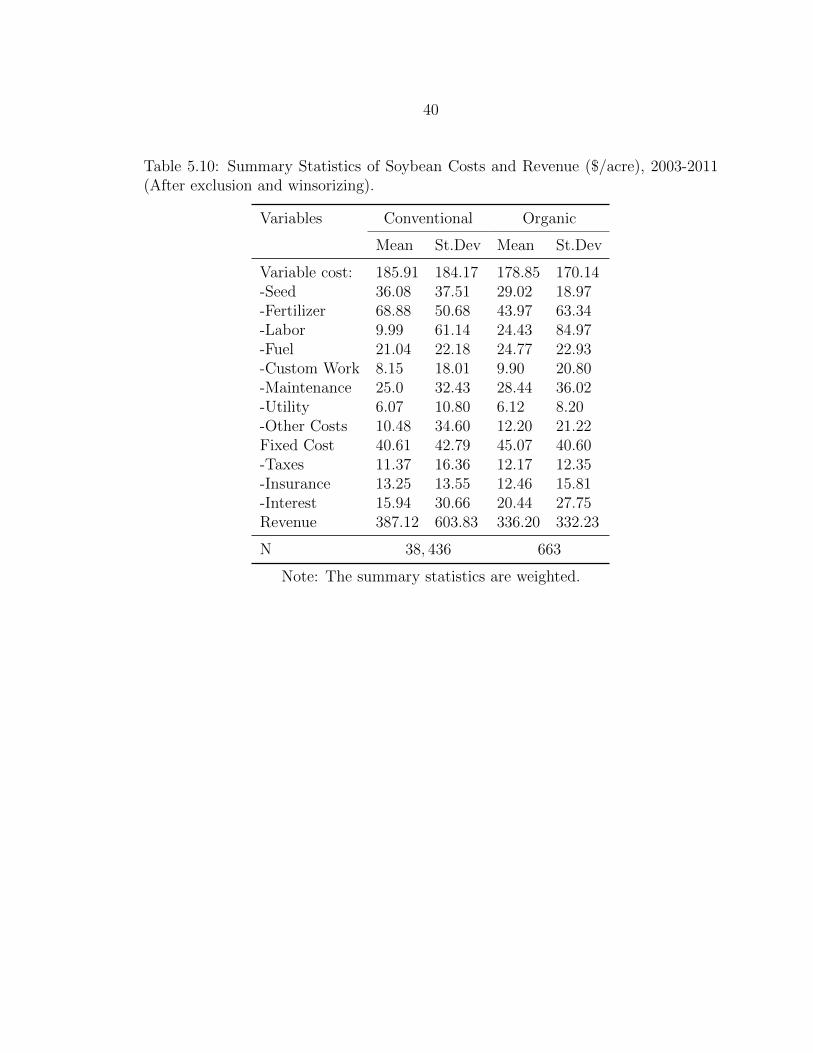
costs (Table 5.9; Table 5.10). Unlike soybeans and wheats, the fruit growers tend
to have a bit higher production costs and returns (Table 5.11). In 2006 the USDA

32
ERS conducted an organic soybean survey, and organic wheat in 2009 (McBride and
Greene (2009); McBride et al. (2012)). The authors estimate the cost and returns
for organic soybean and wheat production. They use the ARMS phase II survey
data in the analysis. Our estimated costs and revenue are similar to the previous
study. For example, organic wheat receive higher per acre revenues than conventional
wheat. Seed costs for organic wheat is higher than conventional, although the costs
on fertilizers are higher in conventional wheat. Hired labor cost for organic wheat is
higher than conventional wheat.
Prior to our econometric analysis, we make a log transformation of variables.
The log transformation makes it easier to estimate regression models. In presence of
the outliers the log transformation helps to normalize our distributions. In addition
the log-log model gives easier interpretation of estimates in our models. In some
cases we observe zero values in the data. This complicates the log transformation of
the data. To overcome this problem we add 0.0000001 to the data. In addition, all
variables are in per acre term which means they area proportion of two variables. For
example, revenue is computed by dividing value of crop production and crop acres.
If the value of a variable is between 0 and 1, the log transformation will return a
negative value in the data.

33
Table 5.1: Variable Definitions.
Variable Variable DefinitionCertified Organic = 1 if farm is certified organic, 0 otherwise.Cash rental rate $/acre yearRevenue $/acre year.Variable cost $/ acre year. Sum of the following variables:- Seed- Fertilizer- Labor- Fuel- Custom work- Maintenance- Utility- Other costsFixed costs $/ acre year. Sum of the following variables:- Taxes- Insurance- InterestMarketing charge $/ acre year.Direct payment $/acre year. Sum of direct and counter cyclical payments.Federal crop insurance $/ acre year.Total household income $/ acre year.Off-farm income $/ acre year.Crop diversification Count of harvested crops.Urbanization Min=1 (more urbanized), max=9 (less urbanized)

34
Table 5.2: Summary Statistics of Costs and Revenue at the Farm Level ($/acre), 2003-2011 (Untransformed).
Variables Total sample Conventional Organic
Mean St.Dev Mean St.Dev Mean St.Dev
Variable Cost: 1,597.56 15,487.32 1,562.68 14,266.38 3,818.16 50,483.50-Seed 351.73 4,784.96 350.86 4,742.56 407.35 6,973.64-Fertilizer 137.09 953.69 135.69 910.40 226.72 2,457.86-Labor 586.44 7,269.09 568.45 6601.47 1,731.60 25,323.71-Fuel 122.61 1,598.02 121.0 1,603.27 225.03 1,213.79-Custom Work 29.20 526.15 29.03 529.11 39.84 278.65-Maintenance 88.48 736.87 86.74 712.14 199.31 1,677.17-Utility 76.71 723.06 75.23 693.42 171.03 1,785.64-Other Costs 205.30 3,183.64 195.68 2,647.83 817.29 14,448.47Fixed Costs: 171.38 998.97 168.99 983.33 323.63 1717.30-Taxes 56.12 427.85 55.44 427.82 99.27 428.12-Insurance 51.12 369.0 50.55 365.51 88.59 546.01-Interest 64.13 541.70 63.0 532.66 135.77 952.19Marketing Expense 60.45 2,602.57 51.02 767.57 626.22 1,9430.84Revenue 4,287.92 44,596.81 4,198.81 42,785.80 9,960.24 10,9707.30Net Farm Income 597.46 9520.50 577.93 8,156.7 1,841.08 40,305.02Off-farm Income 1,540.84 8,636.45 1,519.47 8,533.51 2,933.12 13,705.98Direct Payments 11.46 23.43 11.48 22.66 10.41 52.53Federal Crop Insurance 26.01 443.78 25.57 444.8 72.52 314.51
N 81, 593 79, 416 21, 77
Note: The summary statistics are weighted.

35
Table 5.3: Summary Statistics of Cash Rents and Land Values, 2003-2011 (Untransformed).
Variables Total sample Conventional Organic
N Mean N Mean N MeanSt.Dev St.Dev St.Dev
Acres Cash Rented 8,1593 301.73 79,416 301.43 2,177 320.55(917.17) (914.31) (1083.85)
Acres Owned 81,593 244.66 79,416 245.84 2,177 169.74(726.13) (724.82) (801.78)
Cash Rent Paid 81,593 21,883.26 79,416 21,712.70 2,177 32,725.98(89,919.87) (84,949.18) (251,651.42)
Value of Land 81,593 744,421.49 79,416 738,015.70 2,177 1,152,208.75(2,753,153.73) (2,666,861.27) (6,099,305.46)
Cash Rents ($/acre) 47,444 182.12 46,364 178.90 1,098 458.52(1,556.23) (1,554.60) (1,667.44)
Value of Land ($/acre) 74,144 6,599.40 69,196 6,534.33 1,948 10,834.91(31,018.64) (31,002.54) (31,771.99)
Note: The summary statistics are weighted.
Table 5.4: Summary Statistics of Organic Statuses, 2003-2011.
Organic OrganicIndicator Proportion
Mean 0.026 0.016Percentage=0 97.4 97.4Percentage=1 2.6 1.6

36
Table 5.5: Summary Statistics of Costs and Revenue at the Farm Level ($/acre), 2003-2011 (After excluding small farms).
Variables Total sample Conventional Organic
Mean St.Dev Mean St.Dev Mean St.Dev
Variable Cost: 497.81 3,959.59 483.85 3,840.50 1,539.74 9,163.19-Seed 71.26 989.75 71.06 989.09 86.68 1037.64-Fertilizer 83.40 296.10 82.81 289.66 127.58 606.27-Labor 168.64 1,904.54 160.34 1,833.70 788.08 4,797.61-Fuel 38.02 265.58 37.33 259.87 89.05 540.26-Custom Work 17.84 158.43 17.65 156.42 32.21 268.53-Maintenance 41.04 199.02 40.25 195.15 99.94 387.13-Utility 21.95 177.84 21.22 171.85 76.57 430.24-Other Costs 55.65 852.52 53.19 803.06 239.62 2609.41Fixed Costs: 71.75 263.62 70.38 258.6 174.04 504.35-Taxes 21.61 66.61 21.23 65.29 50.52 128.67-Insurance 21.03 108.87 20.74 108.35 42.50 140.90-Interest 29.11 165.63 28.41 161.94 81.02 339.31Marketing Expense 28.33 326.61 25.90 305.89 200.65 1002.32Revenue 1,574.32 25,720.54 1,537.96 25,599.90 4,288.23 33,419.03Net Farm Income 216.39 2,150.93 212.52 2,120.23 504.95 3,786.48Off-farm Income 505.52 1,559.04 498.18 1,467.03 1070.19 4,851.52Direct Payments 12.33 19.27 12.40 19.18 7.41 24.79Federal Crop Insurance 22.48 327.84 22.11 328.32 62.20 268.44
N 76, 194 74, 242 1, 952
Note: The summary statistics are weighted.
37
Table 5.6: Summary Statistics of Cash Rents and Land Values, 2003-2011 (After excluding small farms).
Variables Total sample Conventional Organic
N Mean N Mean N MeanSt.Dev St.Dev St.Dev
Cash Rents ($/acre) 4,6575 115.50 4,5524 113.77 1051 287.0(541.67) (536.57) (900.79)
Value of Land ($/acre) 66,392 4,512.54 64,641 4,490.07 1,751 6,168.46(24,797.64) (24,925.33) (12,019.24)
Note: The summary statistics are weighted.

38
Table 5.7: Summary Statistics of Costs and Revenue at the Farm Level ($/acre),2003-2011 (After exclusion and winsorizing).
Variables Total sample Conventional Organic
Mean St.Dev Mean St.Dev Mean St.Dev
Variable Cost: 417.15 1,481.44 406.44 1,452.79 1,216.66 2,797.48-Seed 48.19 215.02 48.06 214.71 57.83 236.77-Fertilizer 78.81 127.14 78.44 125.43 106.34 218.03-Labor 129.42 758.86 123.08 739.67 602.52 1,580.30-Fuel 32.10 69.93 31.60 68.84 69.06 121.83-Custom Work 14.62 47.19 14.51 47.0 22.40 59.41-Maintenance 37.01 77.64 36.35 76.11 86.27 145.76-Utility 18.42 55.91 17.94 54.71 54.41 108.02-Other Costs 39.60 201.42 38.07 195.29 153.26 457.48Fixed Costs: 66.38 133.01 65.29 130.47 148.22 247.15-Taxes 19.84 37.73 19.53 37.21 42.78 61.75-Insurance 19.18 38.77 18.93 38.21 37.29 66.55-Interest 24.96 72.98 24.50 71.56 59.29 139.47Marketing Expense 21.20 135.80 19.81 129.03 119.80 368.17Revenue 1,038.06 4,386.43 1,011.81 4,301.70 2,997.51 8,386.72Net Farm Income 184.41 697.91 181.46 683.46 405.08 1,389.08Off-farm Income 425.74 739.66 422.16 734.41 701.40 1,032.04Direct Payments 12.05 16.49 12.13 16.49 6.44 15.32Federal Crop Insurance 13.56 42.76 13.42 42.37 28.62 71.81
N 76, 194 74, 242 1, 952
Note: The summary statistics are weighted.

39
Table 5.8: Summary Statistics of Cash Rents and Land Values, 2003-2011 (Afterexclusion and winsorizing).
Variables Total sample Conventional Organic
N Mean N Mean N MeanSt.Dev St.Dev St.Dev
Cash Rents ($/acre) 46,575 103.37 45,524 102.19 1051 220.70(140.21) (136.13) (343.52)
Value of Land ($/acre) 6,6392 3,858.17 6,4641 3,835.14 1,751 5,555.02(5,291.85) (5,246.21) (7,782.06)
Note: The summary statistics are weighted.
Table 5.9: Summary Statistics of Wheat Costs and Revenue ($/acre), 2003-2011(After exclusion and winsorizing).
Variables Conventional Organic
Mean St.Dev Mean St.Dev
Variable cost: 164.64 204.40 249.16 473.51-Seed 24.89 32.85 25.91 38.36-Fertilizer 58.96 59.55 49.45 92.59-Labor 15.03 81.59 71.78 261.96-Fuel 20.15 25.89 29.63 46.60-Custom Work 7.31 21.0 12.55 28.48-Maintenance 21.27 31.29 18.55 56.27-Utility 7.25 19.76 12.04 33.04-Other Costs 9.53 29.63 18.55 56.27Fixed Cost 30.73 36.96 39.26 43.34-Taxes 7.60 14.37 9.60 11.04-Insurance 11.33 25.14 12.97 19.47-Interest 11.74 25.14 16.69 28.47Revenue 323.29 803.84 440.93 732.92
N 24, 160 552
Note: The summary statistics are weighted.
40
Table 5.10: Summary Statistics of Soybean Costs and Revenue ($/acre), 2003-2011(After exclusion and winsorizing).
Variables Conventional Organic
Mean St.Dev Mean St.Dev
Variable cost: 185.91 184.17 178.85 170.14-Seed 36.08 37.51 29.02 18.97-Fertilizer 68.88 50.68 43.97 63.34-Labor 9.99 61.14 24.43 84.97-Fuel 21.04 22.18 24.77 22.93-Custom Work 8.15 18.01 9.90 20.80-Maintenance 25.0 32.43 28.44 36.02-Utility 6.07 10.80 6.12 8.20-Other Costs 10.48 34.60 12.20 21.22Fixed Cost 40.61 42.79 45.07 40.60-Taxes 11.37 16.36 12.17 12.35-Insurance 13.25 13.55 12.46 15.81-Interest 15.94 30.66 20.44 27.75Revenue 387.12 603.83 336.20 332.23
N 38, 436 663
Note: The summary statistics are weighted.

41
Table 5.11: Summary Statistics of Fruit Costs and Revenue ($/acre), 2003-2011 (Afterexclusion and winsorizing).
Variables Conventional Organic
Mean St.Dev Mean St.Dev
Variable cost: 1,469.92 2,253.56 2,388.88 3,663.81-Seed 51.37 227.23 61.72 230.09-Fertilizer 215.85 251.61 186.25 280.29-Labor 667.39 1315.44 1302.95 2120.06-Fuel 73.20 103.81 105.47 142.23-Custom Work 63.42 116.96 35.10 80.84-Maintenance 90.40 129.32 153.81 195.36-Utility 79.83 112.07 102.74 142.73-Other Costs 157.31 376.46 295.28 632.86Fixed Cost 214.12 263.64 263.15 323.23-Taxes 66.94 70.88 71.32 77.91-Insurance 53.78 70.90 66.77 89.24-Interest 80.28 160.35 103.58 190.55Revenue 3,058.60 4,662.43 4,294.33 6,318.37
N 9, 643 683
Note: The summary statistics are weighted.

42
ECONOMETRIC MODEL
The main objective of this research is to examine the effect of organic certification
on land values. Our hypothesis is a positive relationship between farmland values
and organic status. Organic status, which is the result of certification, may affect
land value through various channels such as profitability, government payments,
urbanization, and other unobserved factors.
To estimate the effect of organic status on farmland value, we construct three
main OLS models. The first model uses a binary classification of the farmer’s organic
status (6.1).
rijt = β0 + β1Iorg=1 + β2πijt + εijt (6.1)
where rijt is a actual cash rent for the ith farm in the jth county (state) in t period.
Iorg=1 is a dummy variable (= 1 if the ith farm in the jth county (state) in t period, 0
otherwise). In this model, the coefficient β1 measures the effect of organic certification
on land value without considering the farm’s relative organic production to its total
production. As a result the first model may underestimate the effect of certification.
The coefficient β2 in model 6.1 estimates the effect of profits on the farmland value.
To control for effect of profitability, we include revenue and cost variables in our
model.
In the second model we include the proportional organic status classification
instead of binary status (Eq 6.2).
rijt = β0 + β1Organicijt + β2πijt + εijt (6.2)
The advantage of using the proportional classification over the binary is that the
proportional status allows to estimate the effect of organic land participation in the

43
total cropland. It also includes more info than organic dummy status. In other words
the coefficient β1 estimates effect of additional organic acres in the total cropland
acres. The interpretation of coefficient β2 stays the same as in equation 6.1.
The third model includes both binary and proportional organic statuses to
estimate the certification effect on land value (6.3).
rijt = α0 + α1Iorg=1 + α2Organicijt + α3πijt + εijt (6.3)
In the third model, the binary status (Iorg=1) estimates the effect of certification on
land value whether farmer certified or not. The proportional organic status variable as
in the model 6.2 will add the effect of organic land participation in the total cropland.
The sum of these two organic classifications (sum of coefficients of α1 and α2) will
allows to estimate an overall marginal effect of full organic certification on farmland
value.
There are several downsides to models 6.1-6.3. First, the farms were not
randomly assigned as certified organic farms in this study. If so, we could use an
average treatment effect model and compare the average land values of treatment
and control groups. Instead, the farms choose to certify as organic. In other words,
certified organic farms have various reasons they self select into the treatment group.
Without controlling for these factors that lead farmers to certify as organic may cause
bias in the coefficient estimates in our models. One way to mitigate bias is to include in
our models a vector of covariates Xijt, which includes the direct government payments
variables. The covariaties Xijt controls for other factors that may potentially affect
the farmland value.
In all previous models, we estimate rental rate in time t as a function of observed
profits in time t. The landowners tend to establish the rental rate at the beginning of

44
production season, but we observe realized revenues and costs at the end of season.
The timing difference between our dependent and explanatory variables could lead to
measurement error in explanatory variable. The rental rate is set by expected revenues
and costs, but we observe the actual realized profits at the end of production season
(Hendricks et al. (2012)). The difference between expected and actual values might
cause a measurement error in explanatory variables, which leads to bias in estimated
coefficients. Under the assumptions that prices of organic outputs and inputs are
stable through out year, the difference between realized and expected values might
be small.
We also include urbanization, time trend, NASS crop districts, and farm types
as dummy variables to control for local and production differences between organic
and conventional farms in our models. Let consider our preferred model with all
control variables (6.4).
rijt = β0 + β1Organicijt + β2πijt + βXijt + t+ θij + ψijt + εijt (6.4)
where t is a time dummy, which controls for differences between organic and
conventional land prices over time. θij is NASS crop districts in jth district, ψijt
is a farm type. We argue that NASS crop district is preferable to the county control
dummy variables. The NASS crop districts are larger than counties, and it allows
to observe the regional differences in organic practices in each crop region. Also
the NASS districts have bigger sample size. Small sample size have less variation in
organic farms. It will be difficult to use the fixed effects with smaller sample size. The
crop districts are larger than counties, which allow to observe more organic farms than
in county level. The farm type variable controls for the production specialty of farms.
We include only crop farms in our data. We exclude any livestock production activities
45
from our sample. The farm type variable represents the largest portion of gross value
of sales for crops. If the farm’s largest portion of gross sales is soybean, then the
farmer’s main specialization would be soybean. The variable measures production
differences in crop types.
If we include the control variables for profit (πijt) and other factors (Xijt), these
controls will affect interpretation of the coefficient estimate (β1) in our regression
model (6.4). After we include profit variable, we control for economic motives to
certify into organic practice. The coefficient of estimate β1 shows the effect of organic
certification if the farmer converts fully into organic practice from conventional
farming. The effect will be significant if the farmer goes fully into organic farming.
These three specification models use standard OLS methods. However, the
standard OLS model equally weights each observations in the regression. It means
that the OLS model will oversample the farms with smaller acreages. As a result the
standard OLS underestimates the effect of organic certification. In our case, where we
have small farm outliers, the standard OLS model’s estimation would be biased. The
weighted OLS model will give to each observations the appropriate sampling weights
to make the sample nationally representative.
An alternative method to our previous models to estimate the effect of
certification is a pseudo-panel method. The ARMS survey collects independent cross-
sectional data in every year. The survey does not follow each farm in each year.
This means that we cannot follow an individual farmer over time and observe his
production and financial activities in previous years. Thus we cannot use the panel
data method. An alternative is to build a pseudo-panel to estimate the effect of
organic certification on farmland value. Deaton (1985) suggested to construct panel
data (both balanced and unbalanced) with cohorts (or groups) that have similar
characteristics that do not change over time. For example, observations can be

46
grouped into the cohorts by their birth date, gender, and geography etc.The pseudo-
panel allows us to estimate the fixed effects. The fixed effects allow us to measure
the unobserved characteristics of organic farms. We are concerned with whether
the farmland and farmer’s unobserved factors could potentially effect on certification
decision. If the farmers decide to certify due to his unobserved individual factors,
then the pseudo-panel method is appropriate. If in fact these factors have no effect
on farmer’s certification decision, the Model (6.3) can be used. The advantages of
pseudo-panel models are that data less suffer from sample attrition, and cover longer
times and geographical units (O’Donoghue and Whitaker (2010)).
The pseudo-panel method has advantages and disadvantages to use it. Pseudo-
panel less suffers from sample attrition, and it is more representative in terms of
time and geography (Moss, Featherstone, Park, and Weber (2012)). However, there
is a trade-off between number of cohorts and number of observations in each cohorts
(Moss et al. (2012)). As the cohorts get larger, there are smaller observations go into
each cohorts. A larger number of observations in a cohort eliminates cross sectional
variations and reduces sample size which may reduce the precision of our econometric
estimates.

47
RESULTS
In this section we present results from weighted OLS and pseudo-panel regression
models. We estimate both models using the organic proportion and organic dummy
statuses to classify farms as organic or conventional. We observe a strong relationship
between the organic certification and farmland rental rate across all farms with
different farm types in different NASS crop districts.
Table 7.1 reports the results of the weighted OLS models. All continuous
variables are expressed in logs but organic statuses (dummy and proportional) are not.
The first model (Column 1) shows the effect of certification using the proportional
organic status variable. The results suggest that a 1 percentage point increase in
a farm’s organic land would result a 0.23 percentage point increase in the farmland
rental rate. The result is obtained after we control for other potential factors that may
affect the farmland value. We also find that the variable and fixed costs have positive
effects on rental rate. A 1 percentage point increase in variable cost may associated
with an increase the land rental rate by 0.20% point, and a 1% point increase in fixed
costs would also associated with an increase of 0.02% point. There are statistically
insignificant relationships between production costs and rental rate. The positive
correlation between costs and rental rate might be caused by high farm incomes. The
farms with higher incomes pay higher rental rate. It might be case, that high income
farms also incur higher production costs, therefore they tend to pay higher rental
rates. Farms with the federal crop insurance have higher rental rate on land. On
average 1% point increase in federal crop insurance is associated with an increases
the land rental rate by 0.2%. The effect is not meaningful in magnitude. The farms
with higher off-farm income pay lower rental rate on organic land. Although the
magnitude of estimated coefficient is not meaningful, farms with more crop diversity

48
have lower rental rates. The results meet our theoretical expectations. The sign
of organic status is positive, which means the organic certification has a positive
effect on farmland value fixing other variables. Revenue has also positive effect after
controlling for other factors.
The second model (Column 2) uses the organic dummy variable to present
organic status. The dummy organic status variable measures whether farmer has
any certified organic cropland. If the farmer certifies any of his land, the model
predicts the farmer receives (or pays) on average 7.7% point higher rental rates than
conventional land. However, the effect of binary status is not statistically significant
on farmland value. We do not consider the effect of additional organic acres. Because
of that we underestimate the effect organic certification on farmland value. The effects
of other control variables stay same on farmland value (Table 7.1).
The third (Column 3) model estimates the effect of certification with both
proportion and dummy organic statuses. The sum of these coefficients shows the
relationship between fully certifying as organic and the rental rate paid by the farm.
If both coefficients are significant then there may a nonlinear relationship between
organic certification and land values. This model shows that total effect of two organic
status variables are same as the first model (Column 1). The marginal effect of
estimated coefficient on binary organic indicator is not significant. We cannot argue
that there is a direct effect of organic certification farmland value according to the
binary organic status. However, if we consider the effect of full organic certification
using proportional status, the result will be 0.37% point. A 1% point increase in
organic land is associated with an increase of farm rental rate by 0.37% point. We
obtain these result after controlling other factors. We see that revenue, costs, incomes,
subsidies, and other control variables have the same effects on farmland value as in
the model 1.

49
The weighted OLS models shows that the model 1 (Column 1) and the model
3 (Column 3) have the same results despite having different organic status variables.
Also the R-squares show the same values. We prefer the first model over the third
model. The third model allows to decompose the effect of organic certification in
general and with consideration of organic acres as a percentage of total acreage.
Table 7.2 shows results for our preferred model with the effect of including
different fixed effect variables. We estimate different models by including each control
dummies step by step. The fifth model is the preferred model. The models in Table 7.2
show proportion status as organic classification. In the first model we estimate the
certification effect without any fixed effects. The proportion organic status has no
significant effects on farmland value, although the magnitude of coefficient is negative
(-0.085%). If the farmer increases his organic acreage in the total cropland acres by
1% point, the land value lowers by 0.085% than the conventional land. If we ignore
the regional and farm production differences, we could underestimate the certification
effect on farmland value. There is a positive correlation between revenue and rental
rate. If farmer increases his revenue by 1% point, then the farmer pays 0.48 percentage
point higher rental rate.
In the second model (Column 2), we include the farm specialization dummy
variable (farm type). The effect of proportional organic status on land value is still
not statistically significant. However, the magnitude of organic status increases from
−0.08% to 0.04% points (Table 7.2). Farm type dummies allows us to capture the
differences in organic productions. For example, we can control for differences in
production between organic crop producers and fruit producers.
The third model includes the NASS crop districts dummy variables (Column 3).
After we control for the geographical differences between organic and conventional
land prices, the effect of organic certification becomes statistically significant and

50
increases in magnitude. A 1% point increase in organic acres may increase the land
value by 0.23% point if we control for regional price differences. The revenue has
still a positive correlation with the land value, although the magnitude has decreased
to 0.25% point. It might be the case that the geographical location of farms play
important role in organic decisions and the land value. Depending on regional
specifics, farmers might decide to fully certify into organic practice. Also the regions
with developed agriculture and markets have better environment for organic practice.
In the regions where organic practice is traditionally developed, the farmers may
decide to certify into organic farming. The variable and fixed costs have statistically
significant effect on the land value. The majority of variations in regression could
come from the geographical differences in organic practices.
The fourth model controls for differences in organic practices between urban and
rural areas (Column 4). The effect of proportional organic status stays statistically
significant. The magnitude of the organic effect increases to 0.249% in the model. The
result suggests that there is an effect of urbanization on farmland value. There is no
changes in magnitude between revenue, variable costs, fixed costs and land value. By
including urbanization into the model, we control for differences in organic practices
between rural and urban areas.
Finally in the fifth model we include year dummy variables to control for
unobserved factors that may lead to differences in land prices. Overall the coefficients
of interest changes in magnitude, and it is 0.23%. The revenue has increased in
magnitude to 0.26%.
The results of first model (organic proportion status) and third model (organic
and binary organic statuses) are practically identical, except the main organic
explanatory variables (Table 7.1). The R-squared for these models are also identical.
However, the estimated coefficient on binary organic status is not significant in the
51
third model. It is difficult to estimate the overall effect of organic certification in the
third model. Also the interpretation of organic statues is more complicated in the
third model. We choose the first model for the simplicity of interpretation of organic
certification.
Table 7.2 shows the results of pseudo-panel models. In these models, we use
the NASS crop districts as cohorts to build a panel. Column (1) - (3) represent the
each models with different organic statuses. The model 1 (Column 1) shows that a
1% increase in organic crop acreage participation in the total crop acres leads to 0.60
percentage point increase in the farmland rental rate. The effects is two time bigger
than the weighted OLS model results (model 1, Table 7.1). Such bigger marginal
effect on organic acres might result of adding the fixed effects. The fixed effects
deal with time invariant unobserved variables. We include time fixed effects into the
regression model. However, by aggregation to the cohort level, we lose the variation
within the cohort in our estimation. Even with fixed effect, we may overestimated
the organic effects on farmland value. The standard error relative to the organic
coefficient is big. The revenue from organic products increases the farmland rents
by 0.147 percentage point. The variable cost has a positively significant impact on
farmland value. An increase of total household income tend to decrease the farmland
rents by 0.04 percentage point.
The model 2 (Column 2) as in the previous Table 7.1, has the similar effects on
farmland value. The dummy organic status has no significant impact on farmland
rental rate. Other than that the effects of other control variables on farmland value
is same as in the model 1 (Table 7.3).
The third model (Column 3) follows the same logic as in the Table 7.1. The
sum of organic proportion and organic dummy statues give the same effect as in
the model 1. The total effect of these two organic statuses is 0.49 percentage point

52
increase on farmland value. After we include year fixed effect and time trends, we get
the above results. The revenue, costs, and other control variables as the other two
models (Column 1 and 2) have the same effects on farmland value.
In Table 7.4 we estimate the pseudo-panel models using the state cohorts.
However, the results and patterns differ from the previous models (Table 7.1;
Table 7.3). In all three models (Column 1 - 3 ) we do not see the significant effect of
organic certification on farmland value. The variable costs have positively significant
effect on farmland value. The rest of the control variables have no significant impacts
on farmland value. As the size of each cohort increases, the number of cohorts
decreases leaving fewer observations for use in our estimation.

53
Table 7.1: Effect of Organic Certification on Farmland Value (Weighted OLS)
(1) (2) (3)
Log of Organic Organic Organic ProportionProportion Indicator and Indicator
Organic 0.231** 0.371***(0.110) (0.146)
Organic Indicator 0.077 -0.118(0.074) (0.091)
Revenue 0.261*** 0.261*** 0.261***(0.031) (0.031) (0.031)
Variable Cost 0.207*** 0.208*** 0.207***(0.051) (0.051) (0.051)
Fixed Cost 0.019*** 0.019*** 0.019***(0.005) (0.005) (0.005)
Marketing Charge 0.004** 0.004** 0.004**(0.002) (0.002) (0.002)
Direct Payment 0.001 0.001 0.001(0.001) (0.001) (0.001)
Federal Crop Insurance 0.002*** 0.002*** 0.002***(0.001) (0.001) (0.001)
Total Household Income -0.002 -0.002 -0.002(0.006) (0.006) (0.006)
Off-farm Income -0.002** -0.002** -0.002**(0.001) (0.001) (0.001)
Crop Diversity -0.040*** -0.040*** -0.039***(0.006) (0.006) (0.006)
Time Trend -0.003 -0.003 -0.003(0.005) (0.005) (0.005)
Urban and Rural Yes Yes YesYear Dummy Yes Yes YesFarm Type Yes Yes YesNASS Crop Districts Yes Yes Yes
R-squared 0.599 0.598 0.599
The robust standard errors are in parentheses. ***p < 0.01 **p < 0.05 *p < 0.1.

54
Table 7.2: Effect of Organic Certification on Farmland Rental Rate (Weighted OLS)
Organic Proportion Status
Log of (1) (2) (3) (4) (5)
Organic -0.085 0.046 0.237** 0.249** 0.231**(0.132) (0.087) (0.113) (0.112) (0.110)
Revenue 0.480*** 0.544*** 0.253*** 0.253*** 0.261***(0.038) (0.043) (0.03) (0.030) (0.031)
Variable Cost 0.190*** 0.250*** 0.206*** 0.205*** 0.207***(0.050) (0.062) (0.051) (0.051) (0.051)
Fixed Cost 0.032*** 0.025*** 0.019*** 0.019*** 0.019***(0.008) (0.006) (0.005) (0.005) (0.005)
Marketing Charge 0.011*** 0.009*** 0.004** 0.004** 0.004**(0.002) (0.002) (0.002) (0.002) (0.002)
Direct Payment 0.019*** 0.007*** 0.001 0.001 0.001(0.002) (0.002) (0.001) (0.001) (0.001)
Federal Crop Insurance -0.002*** -0.002** 0.002** 0.002** 0.002***(0.001) (0.001) (0.001) (0.001) (0.001)
Total Household Income 0.025*** 0.033*** -0.001 -0.002 -0.002(0.007) (0.007) (0.006) (0.006) (0.006)
Off-farm Income 0.007*** 0.002 -0.002** -0.002** -0.002**(0.002) (0.001) (0.001) (0.001) (0.001)
Crop Diversity -0.075*** -0.071*** -0.041*** -0.014*** -0.040***(0.008) (0.007) (0.006) (0.006) (0.006)
Time Trend -0.037*** -0.055*** -0.003 -0.003 -0.003(0.004) (0.004) (0.004) (0.004) (0.005)
Farm Type No Yes Yes Yes YesNASS Crop Districts No No Yes Yes YesUrban and Rural No No No Yes YesYear Dummy No No No No Yes
R-squared 0.361 0.420 0.596 0.597 0.599
The robust standard errors are in parentheses. ***p < 0.01 **p < 0.05 *p < 0.1.

55
Table 7.3: Effect of Organic Certification on Farmland Rental Rate (Pseudo-Panelusing NASS district cohorts)
(1) (2) (3)
Log of Organic Organic Organic ProportionProportion Indicator and Indicator
Organic 0.606* 0.767*(0.346) (0.406)
Organic Indicator -0.001 -0.276(0.328) (0.372)
Revenue 0.147** 0.145** 0.147***(0.057) (0.058) (0.057)
Variable Cost 0.236*** 0.234*** 0.233***(0.053) (0.053) (0.052)
Fixed Cost 0.030 0.031 0.029(0.045) (0.046) (0.045)
Marketing Charge -0.001 -0.001 -0.001(0.003) (0.003) (0.003)
Direct Payment -0.004 -0.004 -0.004(0.006) (0.006) (0.006)
Federal Crop Insurance 0.004 0.004 0.004(0.003) (0.003) (0.003)
Total Household Income -0.041** -0.040** -0.041**(0.017) (0.017) (0.017)
Off-farm Income 0.016 0.017 0.016(0.013) (0.013) (0.013)
Crop Diversity 0.00 0.00 0.001(0.008) (0.008) (0.008)
Year FE Yes Yes YesTime Trend Yes Yes Yes
R-squared 0.159 0.157 0.159
The robust standard errors are in parentheses. ***p < 0.01 **p < 0.05 *p < 0.1. Thedata collapsed at the NASS crop districts and year levels. N = 2239
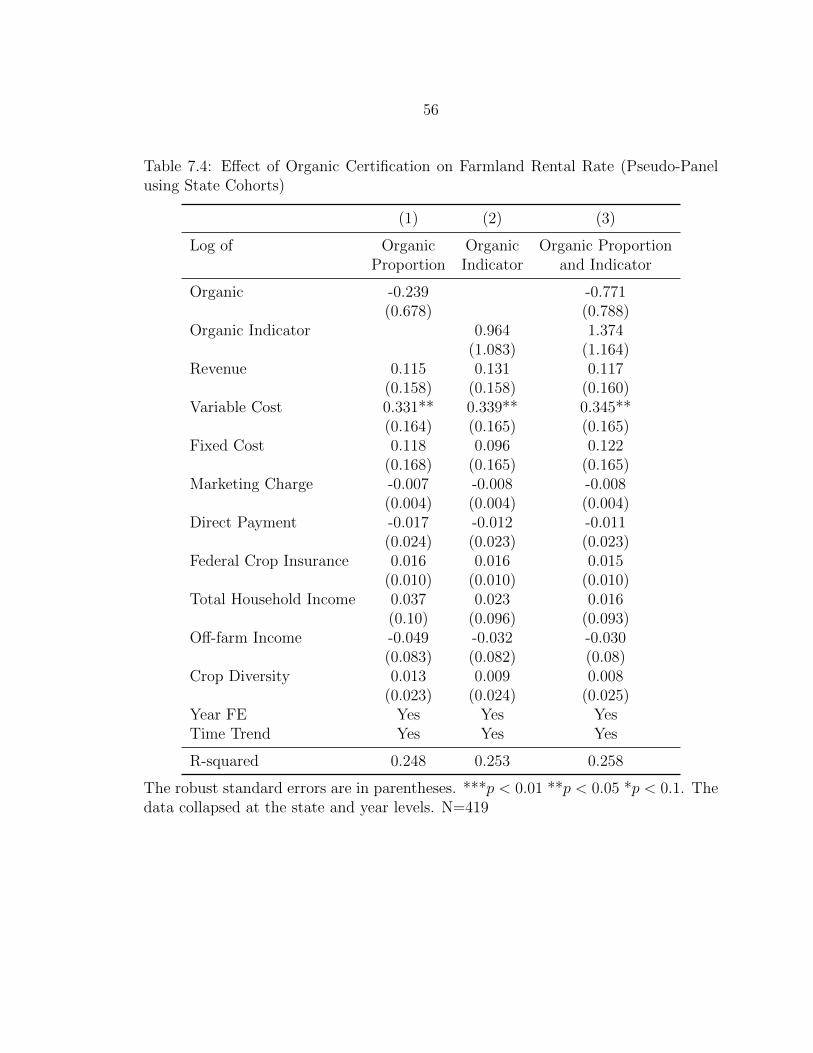
56
Table 7.4: Effect of Organic Certification on Farmland Rental Rate (Pseudo-Panelusing State Cohorts)
(1) (2) (3)
Log of Organic Organic Organic ProportionProportion Indicator and Indicator
Organic -0.239 -0.771(0.678) (0.788)
Organic Indicator 0.964 1.374(1.083) (1.164)
Revenue 0.115 0.131 0.117(0.158) (0.158) (0.160)
Variable Cost 0.331** 0.339** 0.345**(0.164) (0.165) (0.165)
Fixed Cost 0.118 0.096 0.122(0.168) (0.165) (0.165)
Marketing Charge -0.007 -0.008 -0.008(0.004) (0.004) (0.004)
Direct Payment -0.017 -0.012 -0.011(0.024) (0.023) (0.023)
Federal Crop Insurance 0.016 0.016 0.015(0.010) (0.010) (0.010)
Total Household Income 0.037 0.023 0.016(0.10) (0.096) (0.093)
Off-farm Income -0.049 -0.032 -0.030(0.083) (0.082) (0.08)
Crop Diversity 0.013 0.009 0.008(0.023) (0.024) (0.025)
Year FE Yes Yes YesTime Trend Yes Yes Yes
R-squared 0.248 0.253 0.258
The robust standard errors are in parentheses. ***p < 0.01 **p < 0.05 *p < 0.1. Thedata collapsed at the state and year levels. N=419
57
CONCLUSION
In this paper, we research the relationship between organic certification and
farmland values. The main hypothesis is that organic certification has a positive
impact on farmland value, and we confirm this hypothesis. We also find that farm
revenue has a positive effect on farmland value. We estimate regression models using
the USDA ARMS data. Our dependent variable is the cash rental rate paid by
farmers. To classify farms as organic, we generate a binary status variable if the
farm has some organic acres and measure the proportion of certified organic crop
acres. The models use binary status and proportion of acres organic statuses to an
organic classification. We estimate weighted OLS models with NASS crop districts,
farm specialization, urbanization, and year fixed effects. We use farm’s revenue and
production costs to estimate the profitability of organic farms. In addition, the
OLS models include any government direct payments, federal crop insurance, total
household income, off-farm income, and crop diversity. As an alternative model, we
estimate pseudo-panel regressions with fixed effects at the crop district or state levels.
We find a positive, statistically significant relationship between organic certi-
fication and farmland value, even after controlling for profitability, location, and
other factors. According to our preferred model, a 1 percentage point increase in
organic land in a farm’s total cropland is associated with an increase farmland rental
rate by 0.23% point after controlling other factors. The result meets our theoretical
expectations. Our model predicts that a 1 percentage point increase of revenues from
crop production is associated with an increases the farmland value by 0.26 percentage
point.
Finally, we run pseudo-panel models with same fixed effects. The results show a
statistically significant relationship between organic certification and farmland value.

58
The magnitude of organic coefficient is 0.60% point, which is three times more than
the results of weighted OLS model.
We face several limitations in our study. We are unable to control for farm level
unobservable factors such as land productivity, farmer’s skill, or experience because
our paper is based on repeated cross-sectional data. Panel data would allow us
to follow each individual farmers in each period, and observe dynamic changes in
farmland values.
Without panel data we cannot control for unobserved factors which could affect
the farmer’s certification decisions. We are unable to control for farmer’s experience
and management skill in organic agriculture. Also the land productivity might affect
the choice of organic certification and farmland rental rate. However, we are unable
to access field level data.
Second, we cannot observe dynamic changes in farmer’s production and financial
records. The ARMS data cannot track the same individual farmer over time. The
dynamics would allow us to track farmer’s pre and post organic certification changes
in rental rate and production costs. A panel data would allow to control for time-
invariant unobservable factors.
In order to separate a true exogenous effect of organic certification, we would
like to have an instrument variable in our model, to isolate exogenous shifts in organic
certification. A valid instrument would be not correlated with the farmland rental
rate or other input decisions, but correlated with organic certification. Some measure
of changing demand for organic food at the farm-level would be an ideal instrument.
To summarize, the results of our research show that the effect of organic
certification on farmland value is positive and significant, even after controlling for
profitability, location and other factors.

59
REFERENCES CITED
60
Borchers, A., Ifft, J., & Kuethe, T. (2014). Linking the price of agricultural land touse values and amenities. American journal of agricultural economics , 96 (5),1307–1320.
Cameron, A. C., & Trivedi, P. K. (2009). Microeconometrics using stata (Vol. 5).Stata press College Station, TX.
Coleman, P. (2012). Guide for organic processors. US Department of Agriculture,Economic Research Service Washington, DC.
Crowder, D. W., & Reganold, J. P. (2015). Financial competitiveness of organicagriculture on a global scale. Proceedings of the National Academy of Sciences ,112 (24), 7611–7616.
Darnhofer, I., Schneeberger, W., & Freyer, B. (2005). Converting or not convertingto organic farming in austria: Farmer types and their rationale. Agriculture andhuman values , 22 (1), 39–52.
Deaton, A. (1985). Panel data from time series of cross-sections. Journal ofeconometrics , 30 (1-2), 109–126.
Delbridge, T. A., Fernholz, C., King, R. P., & Lazarus, W. (2013). A whole-farmprofitability analysis of organic and conventional cropping systems. Agriculturalsystems , 122 , 1–10.
Dimitri, C., & Oberholtzer, L. (2009). Marketing us organic foods: Recent trendsfrom farms to consumers (No. 58). DIANE Publishing.
Gardebroek, C. (2006). Comparing risk attitudes of organic and non-organic farmerswith a bayesian random coefficient model. European Review of AgriculturalEconomics , 33 (4), 485–510.
Greene, C. (2009). Emerging issues in the us organic industry (No. 55). DIANEPublishing.

61
Greene, C., & Kremen, A. (2002). Us organic farming: A decade of expansion.Agricultural Outlook , 31–34.
Hanson, J., Dismukes, R., Chambers, W., Greene, C., & Kremen, A. (2004). Risk andrisk management in organic agriculture: Views of organic farmers. Renewableagriculture and food systems , 19 (04), 218–227.
Hendricks, N. P., Janzen, J. P., & Dhuyvetter, K. C. (2012). Subsidy incidence andinertia in farmland rental markets: Estimates from a dynamic panel. Journalof Agricultural and Resource Economics , 361–378.
Jaenicke, E. C., & Demko, I. (2015). A preliminary analysis of usdas organic tradedata: 2011 to 2014. Report to the Organic Trade Association, Washington,DC .
Jaenicke, E. C., et al. (2015). The role of us organic certifiers in organic hotspotformation (Tech. Rep.). Agricultural and Applied Economics Association.
Kirwan, B. E., & Roberts, M. J. (2016). Who really benefits from agriculturalsubsidies? evidence from field-level data. American Journal of AgriculturalEconomics , aaw022.
Klonsky, K. (2012). Comparison of production costs and resource use for organic andconventional production systems. American Journal of Agricultural Economics ,94 (2), 314–321.
Kostandini, G., Mykerezi, E., & Tanellari, E. (2011). Viability of organic productionin rural counties: County and state-level evidence from the united states.Journal of Agricultural and Applied Economics , 43 (03), 443–451.
Krystallis, A., & Chryssohoidis, G. (2005). Consumers’ willingness to pay for organicfood: Factors that affect it and variation per organic product type. British FoodJournal , 107 (5), 320–343.
Kuethe, T. H., Ifft, J., Morehart, M., et al. (2011). The influence of urban areas onfarmland values. Choices , 26 (2).

62
McBride, W. D., & Greene, C. (2009). The profitability of organic soybeanproduction. Renewable agriculture and food systems , 24 (04), 276–284.
McBride, W. D., Greene, C., Foreman, L., & Ali, M. (2015). The profit potential ofcertified organic field crop production. US Department of Agriculture, EconomicResearch Service, ERR-188, July .
McBride, W. D., Greene, C. R., Ali, M. B., Foreman, L. F., et al. (2012). Thestructure and profitability of organic field crop production: The case of wheat.In Agricultural and applied economics association, 2012 annual meeting.
Moncada, K. M., & Sheaffer, C. C. (2010). Risk management guide for organicproducers. University of Minnesota.
Moss, C. B., Featherstone, A. M., Park, T. A., & Weber, J. G. (2012). Keeping armsrelevant: extracting additional information from arms. Agricultural FinanceReview , 72 (2), 233–246.
NASS, U. (2012). Usda nass 2011 certified organic production survey. US Departmentof Agriculture, National Agricultural Statistics Service, DC.
Nickerson, C., Morehart, M., Kuethe, T., Beckman, J., Ifft, J., & Williams, R. (2012).Trends in us farmland values and ownership.
Oberholtzer, L., Dimitri, C., & Greene, C. (2005). Price premiums hold on asus organic produce market expands. US Department of Agriculture, EconomicResearch Service Washington, DC.
O’Donoghue, E. J., & Whitaker, J. B. (2010). Do direct payments distort producers’decisions? an examination of the farm security and rural investment act of 2002.Applied economic perspectives and policy , 170–193.
Peterson, H. H., Barkley, A., Chacon-Cascante, A., & Kastens, T. L. (2012). Themotivation for organic grain farming in the united states: profits, lifestyle, or theenvironment? Journal of Agricultural and Applied Economics , 44 (2), 137–155.
63
Plantinga, A. J., Lubowski, R. N., & Stavins, R. N. (2002). The effects of potentialland development on agricultural land prices. Journal of Urban Economics ,52 (3), 561–581.
Ponisio, L. C., M’Gonigle, L. K., Mace, K. C., Palomino, J., de Valpine, P., & Kremen,C. (2015). Diversification practices reduce organic to conventional yield gap.In Proc. r. soc. b (Vol. 282, p. 20141396).
Richards, T. J. (2011). The economics of the organic food system: Discussion.American Journal of Agricultural Economics , aar107.
Robbins, M. W., White, T. K., et al. (2014). Direct payments, cash rents, land values,and the effects of imputation in us farm-level data. Agricultural and ResourceEconomics Review , 43 (3), 451.
Roberts, M. J., Kirwan, B., & Hopkins, J. (2003). The incidence of governmentprogram payments on agricultural land rents: The challenges of identification.American Journal of Agricultural Economics , 85 (3), 762–769.
Sierra, L., Klonsky, K., Strochlic, R., Brodt, S., & Molinar, R. (2008). Factorsassociated with deregistration among organic farmers in california. Davis, CA:California Institute for Rural Studies .
Strochlic, R., & Sierra, L. (2007). Conventional, mixed and deregistered organicfarmers: Entry barriers and reasons for exiting organic production in california.Davis, CA: California Institute for Rural Studies. Available at: http://www.cirsinc. org/docs/organic transitions. pdf .
Trujillo-Barrera, A., Pennings, J. M., & Hofenk, D. (2016). Understanding producers’motives for adopting sustainable practices: The role of expected rewards, riskperception and risk tolerance. European Review of Agricultural Economics .
Uematsu, H., & Mishra, A. K. (2012). Organic farmers or conventional farmers:Where’s the money? Ecological Economics , 78 , 55–62.
USDA, N. (2015). Usda nass 2014 certified organic production survey. US Departmentof Agriculture, National Agricultural Statistics Service, DC.

64
USDA, N. (2016a). Land values 2016 summary. US Department of Agriculture,National Agricultural Statistics Service, DC.
USDA, N. (2016b). Usda nass 2015 certified organic survey. US Department ofAgriculture, National Agricultural Statistics Service, DC.
Veldstra, M. D., Alexander, C. E., & Marshall, M. I. (2014). To certify or not tocertify? separating the organic production and certification decisions. FoodPolicy , 49 , 429–436.
Related Documents


![Organic labels - Centre for Food Safety · • Certified organic products Products with organic label (e.g. “certified by [certification body]”) and/or organic logo of the certification](https://static.cupdf.com/doc/110x72/5f2346f2e1d7592dc20521f0/organic-labels-centre-for-food-safety-a-certified-organic-products-products.jpg)


