THE EFFECT OF NUTRITION ON PHYSIOLOGICAL RESPONSES OF RESISTANCE TRAINING IN MUSCLE AND BLOOD IN YOUNG MEN Marja Katajavuori Master’s Thesis in Exercise Physiology Spring 2014 Department of Biology of Physical Activity University of Jyväskylä Supervisors: Juha Hulmi, Antti Mero

Welcome message from author
This document is posted to help you gain knowledge. Please leave a comment to let me know what you think about it! Share it to your friends and learn new things together.
Transcript

THE EFFECT OF NUTRITION ON PHYSIOLOGICAL
RESPONSES OF RESISTANCE TRAINING IN MUSCLE AND
BLOOD IN YOUNG MEN
Marja Katajavuori
Master’s Thesis in Exercise Physiology
Spring 2014
Department of Biology of Physical Activity
University of Jyväskylä
Supervisors: Juha Hulmi, Antti Mero

ABSTRACT
Katajavuori, Marja. 2014. The effect of nutrition on physiological responses of resistance
training in muscle and blood in young men. University of Jyväskylä, Department of Biology of
Physical Activity. Master’s Thesis in Exercise Physiology. 95 pp.
Background. Exercise results in increased blood flow to the active skeletal muscles, which
have potential to enhance delivery of nutrients to target receptors. The combined effect of
muscular contraction and the increased availability of nutrients have the potential to enhance
training responses. The purpose of this study was to examine, if the nutritional variances
between individuals are associated with the responses and adaptations of heavy resistance
training (RT) in muscle and blood.
Methods. The test group consisted of 21 young men (18-30 years) who did not have a regular
RT background. They went through supervised RT program practicing two times a week for 21
weeks. Their maximum strength, muscle size, muscle fiber types, body composition and
hormonal content of the blood were measured in the beginning, in the middle and at the end of
the study. The strength test consisted of bilateral dynamic leg press in David 200-eguipment
(David Fitness and Medical, Finland). Muscle biopsies were taken before and after 21 week
training period from the vastus lateralis muscle using Bergström’s 5 mm biopsy needle
technique. The muscle fiber types were determined by histochemical ATPase colouring (Brooke
& Kaiser 1970). The sizes of the cells were determined by anti-dystrofin antibody. The muscle
cross-sectional area (CSA) of the quadriceps femoris (QF) muscle was determined before and
after 21 week training period using magnetic resonance system (MRI) (GE Signa Exite HD 1.5
T) and analyzed with OsiriX (version 2.7.5) software. Blood samples were drawn from the
antecubital vein before the muscle work, right after exercise, 15 minutes and 30 minutes after
exercise. Serum hormones were analyzed with an immunometric chemiluminescence method
with an Immulite®
1000 (DPC, Los Angeles, USA). The dietary diaries were registered during
four to five consecutive days around the other measurements. The diaries were analyzed using
the Micro Nutrica nutrient analysis software version 3.11 (The Social Insurance Institution of
Finland). The data was analyzed using IBM SPSS Statistics 19 software. Mean value, standard
deviation, Pearson’s correlation, student’s t-test, repeated measures ANOVA and regression
analysis were used.
Results. During 21 weeks of resistance training maximal strength (p<0.001), the sizes of type 1
and type 2 muscle cells (p=0.001), the surface area of QF (p<0.001), the body weight (p<0.001)
and the lean body mass increased. The consumption of protein (g/kg body mass/d) increased
(p=0.047) from the beginning to the end of the study. The consumption of monounsaturated
fatty acids (r= -0.534, p =0.018) and fat (r= -0.473, p=0.041) correlated inversely with absolute
1RM development. The water consumption (r= -0.557, p= 0.025) correlated inversely with
absolute cell type 1 and 2 size changes. Especially the amount of water (r=0.687, p=0.001) and
carbohydrates (r=0.608, p=0.006) correlated with the increase of percentage fat. Sex hormone
binding globulin (SHBG) (p<0.001) and growth hormone (GH) (p=0.049) levels rose after the
single exercise. Cortisol levels right after muscle stress correlated inversely with the amount of
cholesterol (r =- 0.747, p=0.008). Especially water (r=0.785, p<0.001) correlated with insulin
levels after exercise. The basal levels of hormones or their changes induced by training did not
correlate with any chronic training adaptations in muscle (p>0.05).
Conclusions. During the regular RT the consumption of protein increases, however if dietary
recommendations are met, the individual differences in protein or carbohydrate consumption do
not affect the chronic adaptations in the muscle. The effect of vitamin D on chronic adaptations
is interesting and has to be studied more in future. Acute hormonal elevations of testosterone,
insulin and cortisol after resistance exercise can be affected by nutrition. Also the changes in
body composition during 21 weeks of RT can be affected by nutrition.
Keywords: hormonal responses, muscle growth, nutrition, resistance training

TIIVISTELMÄ
Katajavuori, Marja. 2014. Ravinnon vaikutus voimaharjoittelun aiheuttamiin lihaksen sekä
veren fysiologisiin vasteisiin nuorilla miehillä. Jyväskylän Yliopisto, Liikuntabiologian laitos.
Liikuntafysiologian Pro gradu -tutkielma. 95 s.
Taustatieto. Harjoittelu saa aikaan lisääntyneen verenvirtauksen aktiivisissa luurankolihaksissa.
Tämä mahdollistaa ravintoaineiden paremman kulkeutumisen kohdereseptoreilleen.
Lihassupistuksen ja lisääntyneen ravintoaineiden kulkeutumismahdollisuuden yhteisvaikutus
mahdollistaa harjoitusvasteiden paranemisen. Tämän pro gradu -tutkielman tarkoitus oli
selvittää, onko yksilöiden ravitsemuksellisilla eroilla ja raskaan voimaharjoittelun aiheuttamilla
lihaksen ja veren vasteilla yhteyttä.
Menetelmät. Koehenkilöryhmässä oli 21 nuorta miestä (ikä 18 - 30 vuotta), joilla ei ollut
aiempaa kokemusta säännöllisestä kuntosaliharjoittelusta. He harjoittelivat kuntosalilla ohjatusti
kahdesti viikossa 21 viikon ajan. Tutkimuksen alussa, puolivälissä ja lopussa heiltä mitattiin
maksimivoima, lihaksen pinta-ala, lihassolutyypit, kehonkoostumus ja veren
hormonipitoisuudet. Voimatesti koostui bilateraalisesta dynaamisesta jalkaprässistä David 200-
laitteessa (David Fitness and Medical, Finland). Lihassolunäytteet otettiin nelipäisestä
reisilihaksesta Bergströmin 5 mm:n lihassolunäyteneulatekniikalla ennen ja jälkeen 21 viikon
harjoittelun. Lihassolutyypit määritettiin histokemiallisella ATPaasi värjäyksellä (Brooke &
Kaiser 1970). Lihassolujen koot määriteltiin anti-dystrofiini vasta-aineella. Ennen ja jälkeen 21
viikon harjoittelun nelipäisen reisilihaksen poikkipinta-ala määritettiin magneettikuvauksella
(GE Signa Exite HD 1.5 T) ja analysoitiin OsiriX-ohjelmalla (versio 2.7.5). Verinäytteet otettiin
kyynärtaivelaskimosta ennen lihastyötä, heti lihastyön jälkeen, 15 minuuttia ja 30 minuuttia
harjoituksen jälkeen. Seerumin hormonit analysoitiin Immulite®
1000-laitteella (DPC, Los
Angeles, USA). Ravintopäiväkirjoja täytettiin 4 - 5 päivän aikana muiden mittauspäivien
läheisyydessä. Päiväkirjat analysoitiin Micro Nutrica ravintoanalyysi -ohjelman versiolla 3.11
(The Social Insurance Institution of Finland). Materiaali analysoitiin IBM SPSS 19 tilasto-
ohjelmalla, jossa käytettiin keskiarvoa, keskihajontaa, Pearsonin korrelaatiota, Studentin t-testiä,
toistomittausten ANOVAa ja regressioanalyysia.
Tulokset. Voimaharjoittelu lisäsi maksimivoimaa (p<0,001), tyypin 1 ja 2 lihassolujen kokoa
(p<0,001), nelipäisen reisilihaksen pinta-alaa (p<0,001), kehon painoa (p<0,001) sekä
rasvattoman massan määrää (p<0,001). Proteiinin kulutus (g/kg kehon paino/vrk) kasvoi
(p=0,047) harjoittelujakson aikana. Nautittujen tyydyttyneiden rasvahappojen (r= -0,534, p
=0,018) ja rasvan määrä (r= -0,473, p=0,041) korreloivat käänteisesti maksimivoiman
absoluuttisen kehityksen kanssa. Nautitun veden määrä korreloi käänteisesti lihassolujen
absoluuttisen pinta-alan kasvun kanssa (r= -0,557, p= 0,025). Erityisesti veden (r=0,687,
p=0,001) ja hiilihydraattien (r=0,608, p=0,006) nauttiminen korreloi kehon rasvaprosentin
lisääntymisen kanssa. SHBG -hormonin (p<0,001) ja kasvuhormonin (p=0,049) tasot nousivat
yksittäisen harjoituksen jälkeen. Harjoituksen jälkeiset kortisolitasot korreloivat käänteisesti
kolesterolin määrän kanssa (r = - 0,747, p=0,008). Erityisesti vesi (r=0,785, p=0,000) korreloi
harjoituksen jälkeisen insuliinitason kanssa. Lepotilan hormonitasot tai kuormituksen jälkeiset
hormonitasojen nousut eivät korreloineet lihasten kroonisten harjoitteluvasteiden kanssa
(p>0,05).
Johtopäätökset. Säännöllisen voimaharjoittelun aikana proteiinin käyttö lisääntyy. Kun
syödään ravintosuositusten mukaisesti, ei kuitenkaan yksilöiden välisillä nautittujen proteiinien
tai hiilihydraattien määrällä tässä tutkimuksessa ole vaikutusta lihaksen kroonisiin
harjoitteluvasteisiin. D-vitamiinin osuus kroonisissa harjoitteluvasteissa on mielenkiintoinen ja
jatkossa sitä tulee tutkia enemmän. Ravinnolla voidaan vaikuttaa testosteroni-, insuliini- ja
kortisolipitoisuuksien akuuttiin nousuun voimaharjoituksen jälkeen. Myös 21 viikon
voimaharjoittelujakson aikana tapahtuviin kehon antropometrisiin muuttujiin voidaan vaikuttaa
ravinnolla.
Avainsanat: hormonivaste, lihaskasvu, ravinto, voimaharjoittelu
CONTENT
ABSTRACT .................................................................................................................................. 2
CONTENT .................................................................................................................................... 4
1 INTRODUCTION ..................................................................................................................... 7
2 SPORT NUTRITION ................................................................................................................ 9
2.1 Proteins ............................................................................................................................... 9
2.2 Carbohydrates ................................................................................................................... 10
2.3 Fats .................................................................................................................................... 11
2.4 Water ................................................................................................................................. 12
2.5 Alcohol.............................................................................................................................. 13
2.6 Protective nutrients ........................................................................................................... 13
3 SKELETAL MUSCLE ............................................................................................................ 15
3.1 Skeletal muscle structure and function ............................................................................. 15
3.2 Muscle fiber types ............................................................................................................. 16
4 PHYSIOLOGICAL CHANGES IN MUSCLE ....................................................................... 18
4.1 Protein synthesis and muscle size ..................................................................................... 18
4.1.1 Net protein balance .................................................................................................. 18
4.1.2 Nitrogen ................................................................................................................... 21
4.2 Muscle strength ................................................................................................................. 22
4.3 Body composition ............................................................................................................. 23
5 PHYSIOLOGICAL RESPONSES IN BLOOD....................................................................... 24
5.1 Insulin ............................................................................................................................... 25
5.2 Testosterone ...................................................................................................................... 26
5.3 Sex hormone binding globulin .......................................................................................... 27
5.4 Growth hormone ............................................................................................................... 27
5.5 Cortisol.............................................................................................................................. 28
6 PURPOSE, PROBLEMS AND HYPOTHESES ..................................................................... 30
7 METHODS .............................................................................................................................. 32
7.1 Subjects ............................................................................................................................. 32
7.2 Experimental design ......................................................................................................... 33
7.3 Measurements ................................................................................................................... 34
7.3.1 Morning measurement ............................................................................................. 35
7.3.2 Anthropometric measurements ................................................................................ 35
7.3.3 Strength tests ............................................................................................................ 35
7.3.4 Dietary diaries .......................................................................................................... 36
7.3.5 Muscle biopsy .......................................................................................................... 36
7.3.6 Muscle cross-sectional area ..................................................................................... 37
7.3.7 Blood sample ........................................................................................................... 37
7.4.1 Dietary diary analyze ............................................................................................... 37
7.4.2 Muscle cell sample analyze ..................................................................................... 38
7.4.4 Statistics ................................................................................................................... 39
8 RESULTS ................................................................................................................................ 40
8.1 Nutritional status ............................................................................................................... 40
8.2. Chronic reactions of resistance training ........................................................................... 44
8.2.1 Anthropometry ......................................................................................................... 44
8.2.2 One repetition maximum ......................................................................................... 46
8.2.3 Muscle fiber size ...................................................................................................... 51
8.2.4 Muscle surface area ................................................................................................. 55
8.3 Acute reactions of resistance training ............................................................................... 57
8.3.1 Testosterone ............................................................................................................. 57
8.3.2 SHBG ....................................................................................................................... 58
8.3.3 Cortisol .................................................................................................................... 59
8.3.4. Growth hormone ..................................................................................................... 60
9 DISCUSSION .......................................................................................................................... 63
10 CONCLUSIONS .................................................................................................................... 77
11 REFERENCES ...................................................................................................................... 79
12 APPENDIXES ...................................................................................................................... 95

ABBREVIATIONS
ACTH adrenocorticotropin hormone
CRH corticotropin-releasing hormone
CSA cross-sectional area
GH growth hormone
HDL high-density lipoprotein
LBM lean body mass
LDL low-density lipoprotein
MPB muscle protein breakdown
MPS muscle protein synthesis
MRI magnetic resonance imaging
NPB net protein balance
1 RM one repetition maximum
RE resistance exercise
RT resistance training
SHBG sex hormone-binding globulin
VDR vitamin D receptor

1 INTRODUCTION
Acute responses and chronic adaptations of resistance training are linked together
(figure 1). Every single exercise session causes transient changes in physiological
function. The hormonal and metabolic environment created by an acute exercise bout
modulates the magnitude and direction of adaptations. Resistance exercise (RE) invokes
a sequential casade consisting of muscle activation, signaling events, protein synthesis
and muscle fiber hypertrophy. Muscle activation means that α-motoneurons activate
muscle fibers to produce force. The neuromuscular interaction determines which muscle
fibers are activated and the amount of force exerted. Only those motor units recruited
will respond and adapt to RE. Signaling events mean contraction and stretching of
muscle fibers that stimulate various muscle signaling pathways independently of
changes in hormones and growth factors, anabolic hormonal responses and
immune/inflammatory responses. During eccentric actions, the myofibrils of the muscle
fiber stretch while producing force. Repetitive overstretching leads to sarcomere
disruption and membrane damage. It leads to muscle soreness, but also provides an
important stimulus for muscle growth: it promotes neutrophil mobilization and invasion
into the muscle tissue. Neutrophils degrade damaged muscle tissue. Also protein
synthesis increases after RE as an acute response. The nutrition consumed and the
intensity, volume and other parameters of the RE effect on the magnitude of these acute
responses. (Bird 2010; Spiering et al. 2008b)
If a single RE is heavy enough, it causes tiredness that temporarily lowers the nervous
capacity to activate muscles to their maximum. The acute effects of training are related
to the type of exercise (isometric, concentric or eccentric). Skeletal muscle can generate
about 30 % more tension during eccentric than concentric actions, which explains why
maximal eccentric actions evoke a greater signaling response in humans (Eliasson et al.
2006). The acute effects of RE are also related to the amount of load, intensity, duration,
exercise order, recovery time and the individual performance level. The elevated
hormonal levels get back to their normal levels quite soon after RE. Several weeks of
training does not necessarily affect to these normal levels. (Erola 2000, 1; Prasartwuth
et al. 2005; Spiering et al. 2008; Thalacker-Mercer 2009.)

8
FIGURE 1. The pathway of adaptation model (Bird 2010, 82).
In addition to the nervous system, muscles also get tired when energy stores finish or
when the chemical status of the muscle changes through the accumulation of the
metabolic waste. RE creates endocrine response that with nutrition enhances protein
synthesis and affects muscle hypertrophy. An exercise results in increased blood flow to
the active skeletal muscles, which has the potential to enhance the delivery of nutrients
to target receptors. The combined effect of muscular contraction and the increased
availability of nutrients have the potential to enhance the adaptations to RT. Nutritional
variances between individuals influence changes in muscle protein synthesis. (McArdle
2007, 541–543; Phillips 2004; Phillips et al. 2009; Volek 2004).
The purpose of this study was to examine, if nutrition has acute responses or chronic
adaptations in muscle and in blood following the 21 weeks RT in young non-trained
men.

9
2 SPORT NUTRITION
2.1 Proteins
The body of an average-sized adult contains between 10 and 12 kg of protein, with the
largest quantity located within the skeletal muscle mass (McArdle et al. 2007, 32).
Protein is one of the most important nutrients. During the digestion, protein hydrolyzes
to its amino acid constituents. There are 20 different amino acids and their derivatives,
which are working in the human body. Amino acids can be divided in two groups:
necessary ones and unnecessary ones. The body can synthesize unnecessary amino
acids; however necessary amino acids, the group of 9 different acids, need to be
obtained regularly from the nutrition. (Nelson & Cox 2000, 115–129.) Amino acids join
together. Two joined amino acids produce a dipeptide, three joined amino acids produce
tripeptide and so on. A combination of more than 50 amino acids is named polypeptide,
and that form is called protein. (McArdle et al. 2007, 32.)
Daily need of protein is recommended to be 10-15% of daily energy consumption. It is
more meaningful to count protein requirement relative to the body mass. In Finland that
recommendation is 0.8g/kg per day for all men and women, aged 19 years and above,
independent of physical status. It is argued for years how much exercising increases the
need of protein. Athletes might need to consume 50-100% more protein for exercise-
related energy production, post-exercise muscle damage repair, and muscle
hypertrophy. However, it is more useful to talk about the optimum of protein instead of
need of protein. The need only guarantees that the nitrogen balance does not go
negative. The optimum makes the improvement possible. An optimum needs to be
evaluated individually depending on the target. (Campbell & Leidy 2007; Hulmi 2013a;
Lemon 2000.)
There is no protein store in the human body except the structural proteins that are in use.
If energy used is higher than energy obtained from the food or the protein amount of the
food is too small, body needs to use muscles’ own protein. Also if glycogen stores
(form of custody of carbohydrates in the body) are empty, body sacrifices proteins from
the muscles to build carbohydrates. (Niemi 2006, 30.) Proteins are obtained for example
10
from eggs, milk, meat, fish and poultry (McArdle et al. 2007, 33).
2.2 Carbohydrates
Carbohydrates can be classified into monosaccharides, oligosaccharides and
polysaccharides. Monosaccharides are basic units of carbohydrates. Monosaccharides
consist of glucose, fructose and galactose. Glucose forms in the body through digestion
of more complex carbohydrates. Glucose is also synthesized in the liver from other
compounds. Fructose is the sweetest simple sugar obtained from fruits and honey.
Galactose does not exist freely. The body converts galactose to glucose.
Oligosaccharides form when 2 to 10 monosaccharides bond chemically. Sucrose,
lactose and maltose are examples of oligosaccharides. Sucrose means ordinary sugar.
Lactose is found from milk products as milk sugar. Maltose occurs in beer and cereals.
Polysaccharides describe the linkage of more than 10 monosaccharides. Polysaccharides
are divided in plant and animal polysaccharides. Starch and fiber are the common forms
of plant polysaccharides. Glycogen is the form of animal polysaccharides. Glycogen is
the storage carbohydrate. It is stored in the liver and in the muscles. During exercise
intramuscular glycogen provides the major carbohydrate energy source for active
muscles. Glycogen in the liver rapidly reconverts to glucose for release into the blood as
an extramuscular glucose supply for exercise. (McArdle et al. 2007, 7-9,13.)
It is suggested that the optimum for carbohydrate consumption would be about 5-6
g/kg/day, depending on the level of the exercise. The percentage amount of the
carbohydrates would be then about 55% from the total daily consumption. (Haff et al.
2003.) Like the optimum of proteins there are also individual differences in
carbohydrate consumption. Some top athletes for example consume much more
carbohydrates than previous recommendations say, some athletes avoid carbohydrate
consumption. In both ways it is possible to gain good results. Different practicing
methods work in different individuals. (Hulmi 2013b) Excessive carbohydrate
consumption, like every other excessive consumption as well, makes extra carbohydrate
change to body fat (Niemi 2006, 23).

11
2.3 Fats
Lipids belong to one of main groups: simple lipids, compound lipids or derived lipids.
The simple lipids are named “neutral fats” and they consist of triglycerides.
Triglycerides consist of glycerol molecule and three fatty acid chain. All lipid-
containing foods consist of a mixture of different proportions of saturated and
unsaturated fatty acid chains. Saturated fatty acids are obtained from products of animal
origin. Unsaturated fatty acids are called soft fat and they are liquid in room
temperature. Triglycerides constitute the major storage form of fat in fat cells. (McArdle
et al. 2007, 18-19; Niemi 2006, 33, 35.)
Compound lipids are triglycerides combined with other chemicals. They represent about
10% of the total fat in the body. One compound lipid is lipoprotein. Lipoproteins
provide the possibility of transporting lipids in the blood. The liver and small intestine
produces high-density lipoproteins (HDLs), which contain the highest percentage of
proteins (50%) of the lipoproteins and the least total lipid (20%) and cholesterol (20%)
of the lipoproteins. Very-low-density lipoproteins (VLDHs) and low-density
lipoproteins (LDLs) contain highest percentage of lipid and cholesterol instead.
(McArdle et al. 2007, 24.) HDLs are good form of cholesterol. HDLs transport
cholesterol away from the walls of the veins to the liver. HDLs keep veins open and
decrease the risk of coronary artery disease. LDLs are bad cholesterol. LDLs transport
cholesterol to tissues and vein walls forming nests that are the beginning for the
atherosclerosis. (Niemi 2006, 36-37.)
Simple and compound lipids form derived lipids. Cholesterol is the most known
compound lipid. It exists only in animal tissue. (McArdle et al. 2007, 26.) Cholesterol is
required for the body to function sufficiently. It is not only bad thing like believed.
Normally we just get too much cholesterol. (Niemi 2006, 36-37.) Cholesterol is needed
for hormonal production and to build cell membranes, bile acids and vitamin D.
Cholesterol is an important component of biological membranes. It increases membrane
viscosity, which increases the exposure of membrane proteins to extracellular fluids. It
is also essential for the formation of lipid rafts, which function as platforms for the
assembly of components of signaling pathways through protein sorting and construction
of signaling complexes. That is why depletion of cholesterol can induce protein
12
missorting and reduced signal transduction. (Freeman & Solomon 2004; Lucero &
Robbins 2004; Simons & Toomre 2000.) Cholesterol is built in the liver, however it is
also obtained from the food. The food consumed is the most important factor when
controlling cholesterol amount. Especially hard fat raises cholesterol levels. Genetic
factors have also some effect on levels. The recommendation of daily consumption of
cholesterol is 250-330 mg. (Niemi 2006, 36-37.)
Essential fatty acids need to be obtained from the food, because body cannot form them
from any other fatty acid. Most of these are obtained from fish. The normal limits for
the usage are 1-2g/kg/day, 25% from the daily consumption. RT does not increase the
need of fat like it increases the need of proteins and carbohydrates. Small fat
consumption should not be so harmful for improvement, but thinking from the health
point of view consuming fat is important. (Laatikainen 2011; Niemi 2006, 33,35.)
Many people believe that fat is not good for health. Especially saturated fatty acids are
said not to be good for the health. Most of the hidden fats are specifically these
saturated fatty acids. Unsaturated fatty acids have believed to have positive effects on
health. However, the newest studies say that there is no difference between low- and
high-fat diets (studied until diets consisting 45% fat) when it is considering heart and
vascular deceases. Sufficient and versatile fat intake is actually only good for health.
When fat is consumed, the need of linoleic acids and α-linoleic acids of essential amino
acids are easier to satisfy. When CHO are replaced by fat in the diet, HDL-cholesterol
increases and triglycerides decrease. If this replacement is done using fat products
versatile, LDLs will not increase at all. When fat is used in a meal at the same time with
CHO, insulin and glucose responses decrease. Additionally, when using vegetable oil
and margarines the supply of vitamin E and D may increase. (Laatikainen 2011.)
2.4 Water
Water makes up 40-70% of body weight. Nutrients travel in solution. Waste products
leave the body through the water in urine and feces. Water has heat-stabilizing qualities
as it absorbs considerable heat with changes in temperature. This quality maintains a
relatively stable body temperature during exercise. 2.5 l water is needed daily.
Exercising raises the need of consumed water. (McArdle 2007, 74-75.)
13
2.5 Alcohol
Alcohol is energy-producing, not essential nutrient. The energy amount it contains is
not nutritionally valuable, as it does not contain any important nutrients like vitamins or
minerals. Alcohol can be equated to sugar. Alcohol use effects on dehydration, slows
down recovery and lowers alertness that easily leads to injuries. (Niemi 2006, 43)
2.6 Protective nutrients
Protective nutrients mean minerals and vitamins that cannot be produced by the body, at
least not the amounts required. They need to be obtained from the food. Normally we
get enough all the other ones except iron, phosphate and vitamin D. (Niemi 2006, 45-
46.)
Minerals are important for regulating enzymes working with energy metabolism,
muscles or nerves. Minerals can be divided in two sub groups: macro minerals and trace
minerals. Macro minerals consist of calcium, chloride, magnesium, phosphorus,
potassium, sodium and sulphur. The lack of these minerals leads to a disorder in body
function. These disorders can be explained by biochemical dysfunctions. Boron, cobalt,
chromium, copper, fluoride, iodine, iron, manganese, molybdenum, selenium and zinc
are trace minerals. The need of daily consumption of trace minerals is smaller than the
need of macro nutrients. Physical stress changes the levels of minerals in blood. All
minerals except iron are obtained when following normal Finnish diet. (Rehunen &
Fogelholm 1993, 110.)
Vitamin A, D, E and K are fat-soluble. Vitamin C and B are water-soluble. Fat-soluble
vitamins are stored in the body and that is why overconsumption is unhealthy. Water-
soluble vitamins’ stores are small and extra vitamins are excreted away from the body
with urea. Body cannot form vitamins, so they need to be obtained from food. Vitamin
K and vitamin B are the only ones built also in the colon but, however, they are
absorbed poorly anyway. Three vitamins have precursors, which body can change as a
vitamin; vitamin A is formed from carotenoids obtained from vegetables, vitamin D is
formed on the skin with the effect of ultraviolet radiation and B-vitamin, niacin, is
formed from tryptophan- amino acid. The first symptoms of the lack of vitamins are

14
tiredness and touchiness. The lack of fat-soluble vitamins is seen before water-soluble
ones. The overuse is not happening if eating normally. Only vitamin supplements can
raise the amount too high. (Niemi 2006, 45-46.)
Especially about the effects of vitamin D on exercising has been studied much during
the previous years. D-vitamin can be gotten from the sun and food. Recommended
levels for vitamin D are 75nmol/l. (Visser et al. 2006.) Approximately 1700IU, 42,5µg,
daily is needed for 95% of the population to reach 75nmol/L (Vieth et al. 2007). Despite
these doses, the human body appears to be able to metabolize more than these levels and
the body tends to stop solar synthesis of vitamin D at the level equivalent to 10000IU,
250 µg that is the safe upper limit (Vieth 1999). A deficiency of vitamin D is associated
with an increase level of fat in skeletal muscle tissue and therefore it has been
hypothesized that vitamin D insufficiency is a possible contributor to obesity. (Foss
2009; Gilsanz et al. 2010.)
There may not be any detectable vitamin D receptors (VDR) on skeletal muscle tissue,
despite a series of studies suggest this. Despite the lack of vitamin D receptor
expression directly on skeletal muscle cells, there appear to be impairments to physical
function and reduced skeletal muscle hypertrophy associated with VDR knockout mice.
(Minasyan et al. 2009; Van Leeuwen et al 2001; Wang & DeLuca 2011.) Vitamin D has
been showed to be positively associated with androgen status (higher testosterone and
lower sex-hormone-binding-globulin) (Wehr et al. 2010). Supplementation of vitamin D
to correct a deficiency may improve athletic performance in athletes (Cannell et al.
2009). However, daily supplementation with 25 or 10 µg of vitamin D for 16 weeks did
not improve muscle strength or power measured by the jump test, handgrip test or chair-
rising test in the population with low baseline vitamin D status (Knutsen et al. 2014).
15
3 SKELETAL MUSCLE
3.1 Skeletal muscle structure and function
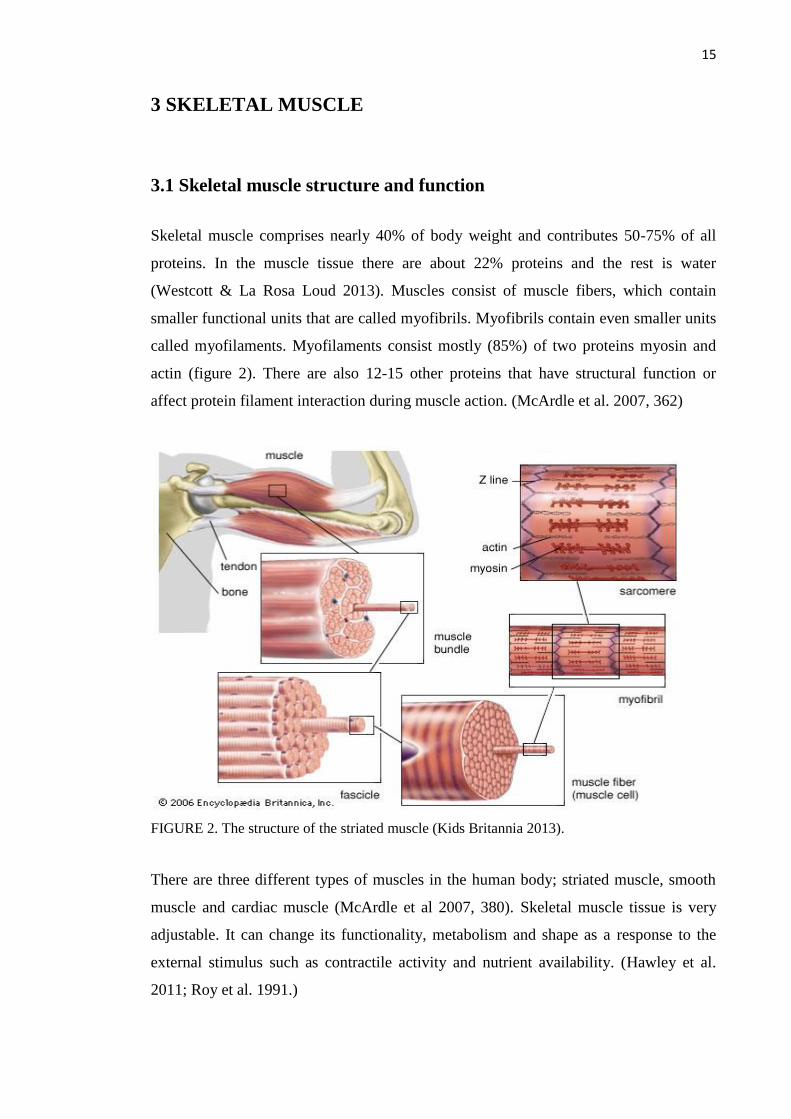
Skeletal muscle comprises nearly 40% of body weight and contributes 50-75% of all
proteins. In the muscle tissue there are about 22% proteins and the rest is water
(Westcott & La Rosa Loud 2013). Muscles consist of muscle fibers, which contain
smaller functional units that are called myofibrils. Myofibrils contain even smaller units
called myofilaments. Myofilaments consist mostly (85%) of two proteins myosin and
actin (figure 2). There are also 12-15 other proteins that have structural function or
affect protein filament interaction during muscle action. (McArdle et al. 2007, 362)
FIGURE 2. The structure of the striated muscle (Kids Britannia 2013).
There are three different types of muscles in the human body; striated muscle, smooth
muscle and cardiac muscle (McArdle et al 2007, 380). Skeletal muscle tissue is very
adjustable. It can change its functionality, metabolism and shape as a response to the
external stimulus such as contractile activity and nutrient availability. (Hawley et al.
2011; Roy et al. 1991.)
16
Skeletal muscles are important as an amino acid reservoir, for energy consumption and
for fuels for other tissues (brain, immune cells). Nevertheless, there are not many free
amino acids inside the muscle cell, as most of the amino acids will be synthesized as
proteins when they enter inside the cell (Guyton & Hall 2000, 792–795.) The number of
proteins and free amino acid changes continuously, due to protein synthesis and protein
break down happening all the time. 1-2% of proteins are synthesized and broken down
daily. (Wagenmakers 2001.)
Muscle cells function by the ability of actin and myosin filaments to overlap and slide
back with the use of ATP-energy. Calcium works as stimulator, magnesium as
regulator, sodium makes the process to go faster and potassium slows down the process.
(Marjanen & Soini 2007,35)
3.2 Muscle fiber types
Skeletal muscles consist of two different muscle fiber types that differ from each other
by metabolism and contracting abilities. Type 1 muscle cells, named slow muscle cells,
can use fat as energy source. Slow muscle cells are activated in activities long in
duration. Fast muscle cells, type 2 cells, are unable to do that and they have to store
extra fat inside the cell. Type 2 cells are activated in heavy loads, explosive exercises or
when exercise is significant fatiguing. Fast muscle cells can still be divided sub groups
depending on their fatiguing qualities - the bigger force production the faster fatigue.
(McArdle et al 2007, 380-383; Spiering et al. 2008). Relative amounts of muscle cells
vary a lot among individuals. Studies show that relative amounts of different fiber types
are affected by genotype (45%), muscle biopsy mistakes (15%) and environment (40%).
Physical activity is part of environmental factors and it explains the differences between
limbs or muscle groups. Type 2 muscle fibers have a greater capacity for hypertrophy
following RE training than type 1 fibers. (Karjalainen et al. 2006; Simoneau &
Bouchard 1995; Spiering et al. 2008.)
Muscle glycogen is shown to be depleted by 30-40% after resistance exercise,
especially in type 2 muscle fibers (Roy & Tarnopolsky 1998; Tesch et al. 1998).
Specific type 2 muscle fiber glycogen depletion may limit performance during high
volume workouts. Glycogen resynthesis is slow during the exercise, whereas
17
carbohydrate supplementation during exercise can attenuate the rate of muscle glycogen
depletion. Carbohydrate, provided after exercise, can speed the rate of glycogen
resynthesis after exercise, which may enhance performance. (Volek 2004.)
Previous studies show that nutrition, especially protein and glucose, increases muscle
fiber area. Cribb and Hayes (2006) reported greater increases in type 2 muscle fiber area
after 10 weeks of RT when subjects consumed a protein and glucose supplement
immediately before and after exercise. Another study says that type 2 muscle fiber area
of the vastus lateralis muscle increased with RT; however the increase tended to be
greater when consuming mixed-food instead of specified diet. Type 1 fiber area stayed
unchanged with RT in both all groups. (Campbell et al. 1999.)
18
4 PHYSIOLOGICAL CHANGES IN MUSCLE
4.1 Protein synthesis and muscle size
Protein synthesis is a biological process, in which a cell forms proteins from amino
acids. Progressive heavy RT provides the stimulus for muscle size development.
Training causes tissue microtraumas, which require sufficient protein to sustain the
muscle-building processes. The process leads to increased strength and size. This
growth of the muscle cell is called hypertrophy. (Hulmi et al. 2007; Häkkinen et al.
2001; Westcott & La Rosa Loud 2013.)
Feeding has been shown to be a simple and effective method to alter rates of protein
synthesis (Svanberg et al. 2000). Some amino acids also regulate protein breakdown,
however their effect is less important in magnitude than the effect of amino acids
controlling protein synthesis. (Bohe et al. 2003; Kadowaki & Kanawaza 2003).
4.1.1 Net protein balance
Adding to forming of proteins in protein synthesis, proteins are also constantly being
broken down by external cues. These processes include feeding and physical activity.
Net protein balance (NPB) is defined as muscle protein synthesis (MPS) minus muscle
protein breakdown (MPB). When net protein balance remains positive increased
skeletal muscle mass accretion can happen (Hulmi et al. 2010). Measurements of the
rates of protein synthesis and breakdown during acute experiments have established the
following knowledge:
1) At rest the rate of protein synthesis is slower, than the rate of protein breakdown,
which results in a net catabolic state, in other words the NPB is negative. (Campbell
et al. 2009; Drummond et al. 2009).
2) Protein ingestion improves protein synthesis to the positive NPB (Borsheim et al.
2002; Drummond et al. 2009; Miller et al. 2003).

19
3) After an acute session of resistance exercise body accelerates the building of new
muscle tissue proteins, though it also increases the rate of protein degradation. NPB
is improved, however if proteins are not ingested, NPB does not improve to the
point of becoming positive. Muscle cells namely take the building blocks they need
from the muscle protein break down earlier. Exercising without proper food does
not give positive results. (Ilander & Mursu 2008, 384; Phillips 2004; Phillips et al.
2005.)
4) When eating only carbohydrate after RT, NPB may slightly improve, however the
improvement is minor and delayed compared with the ingestion of amino acids.
(Bird 2006; Borsheim et al. 2004.)
5) The combination of feeding proteins or mixtures of amino acids and resistance
exercise result in the greatest net anabolic state, in other words positive NPB exists
(figure 3) (Phillips et. 2005). Protein, whey and milk proteins in particular,
stimulate the greatest rise in muscle protein synthesis, result in greater muscle cross-
sectional area and enhance exercise recovery. (Hulmi et al. 2010).
The events 1) and 2) typically balance each other over time and skeletal muscle and fat-
free mass are unchanged. Muscle hypertrophy theoretically is achieved from the
accumulated periods of positive protein balance by feeding and exercise. (Burd et al.
2009; Phillips 2004; Phillips et al. 2009.)
Improved cellular signaling might also be one possible explanation for greater skeletal
muscle hypertrophy in persons with higher dietary and serum cholesterol. Cholesterol
may also play a role as an essential building block to repair microtears that occur in the
skeletal muscle membrane with RT. This may not be the major mechanism of
cholesterol-induced muscle hypertrophy. Immediate reductions in serum cholesterol
following exercise causing muscle injury have been suggested to be the part of the
process to repair the membrane damage. (Riechman et al. 2007; Shahbazpour et al.
2004.)
Summarized, proteins affect directly being used for protein synthesis. Carbohydrates
affect indirectly being used as a fuel for the muscle to make exercising as heavy as

20
possible. Carbohydrates also decrease the breakdown of the muscle proteins. Also fat
works indirectly through the changes in hormone stages of the body. (Ilander & Mursu
2008, 379.)
FIGURE 3. Net protein balance (Campbell et al. 2012, 6).
Findings regarding the impact of dietary intake on long-term RT- mediated skeletal
muscle growth are equivocal. Some studies suggest that higher daily intakes of dietary
protein and EAAs enhance the magnitude of skeletal muscle hypertrophy during RT.
(Campbell and Leidy 2007.) Studies have reported that when amino acid availability
increases, improves the activity of anabolic reactions of skeletal muscles too. (Biolo et
al.1997). Carbohydrate (1g glucose/body mass kg) taken immediately and 1 hour after a
session of resistance exercise resulted in higher plasma glucose and insulin, decreased
myofibrillar protein breakdown and urea nitrogen excretion, and slightly increased
fractional muscle protein synthetic rate (Roy et al. 1997). Rasmussen et al. (2000)
reported that consumption of both protein and carbohydrate results in even greater
effects on protein balance. Protein synthesis was stimulated 400% above pre-exercise
values when a protein and carbohydrate supplement (6 g EAAs and 35 g sucrose) was

21
consumed 1 or 3 h after a session of resistance exercise. (Rasmussen et al. 2000.)
Panneman’s et al data showed a lower net protein synthesis for the diet high in
vegetable protein than for an equivalent amount of protein provided in a diet high in
animal protein (Campbell 1999). By contrast to the studies supporting proteins, others
report that muscle mass during long-term RT is not enhanced by higher quantities and
source of dietary protein. Thalacker-Mercer et al (2009) reported that intrinsic or
extrinsic factors other than nutrient ingestion apparently impaired the anabolic response
in non-responders. There were no associations between the magnitude of myofiber
hypertrophy and any dietary intake. (Thalacker-Mercer et al 2009.)
4.1.2 Nitrogen
Protein molecules contain about 16% nitrogen. During catabolism, protein first
degrades into its component amino acid. The amino acid molecule then loses its
nitrogen in the liver to form urea. The remaining amino acid is either converted to a new
amino acid, converted to carbohydrate or fat, or catabolized directly for energy. Urea
leaves the body in solution as urine. Excessive protein catabolism promotes fluid loss
because urea must be dissolved in water for excretion. (McArdle 2001, 32, 36.)
Nitrogen balance exists when nitrogen intake (protein) equals nitrogen excretion. The
opinions about the amount of protein required for the most positive nitrogen balance are
between this previously mentioned 0.8g/kg/day and 2.8g/kg/day. (Lemon 2000).
Campbell et al 2002 evaluated influence of RT on nitrogen balance and amino acid
utilization. During the first six weeks of intervention, urinary nitrogen excretion
decreased and nitrogen balance increased both among trained and non-trained men,
when they consumed diets that contained the recommend daily amount for protein and
sufficient energy. Campbell et al. (1995) demonstrated that the subjects of high-protein
group had greater nitrogen balance, rates of leucine turnover and uptake for protein
synthesis. The subjects of low-protein group had greater efficiencies of nitrogen
retention and utilization for protein synthesis. These findings support metabolic
adaptation to the constant protein intake and the achievement of increased efficiency of
nitrogen retention and amino acid utilization. The aim is to achieve and maintain
physiological homeostasis. (Campbell & Leidy 2007.) According to that aim resistance
exercise does not increase the need of dietary protein in fact, it improves utilization of
22
protein, which may actually lower the protein requirement during training (Thalacker-
Mercer 2009).
The positive nitrogen stage of the body is useful when trying to gain more muscles.
Positive nitrogen stage is not necessary; however when combining the large
consumption of protein with RT it is possible to gain and maintain positive energy stage
also when dietary energy consumption is small. (Demling & DeSanti 2000.)
4.2 Muscle strength
Muscle strength is determined by the ability of the nervous system to recruit motor units
in concert with the number of muscle contractile units in cross-section (Shirreffs 2005).
Muscle mass is the major determinant of physical strength, thus the loss of lean mass is
thought to be a major contributor to functional decline and disability (Janssen et al.
2004a; Janssen et al. 2004b). A large proportion of maximal strength decline is due to a
reduction in the size and number of fast twitch, type 2, muscle fibers (Nilwik et al.
2013).
Dietary and serum lipids and lipid-lowering drugs (statins) are associated with many
skeletal muscle pathologies including muscle weakness. Therefore it is hypothesized
that lower dietary cholesterol intake, serum cholesterol and statin use would be
associated with reduced skeletal muscle responses. Riechmans et al. (2007) showed in
their study that when protein consumption was standardized, there was a strong direct
association of average dietary cholesterol consumption (r= 0.448, p= 0.001) to the
magnitude of lean mass gains. The highest mean dietary cholesterol was also associated
with greater strength gains and appendicular muscle hypertrophy as compared to the
lowest dietary cholesterol. Statin users also had greater lean mass gains, independent of
dietary and serum cholesterol. The study of Riechmans et al. (2007) suggests that the
effect of blood cholesterol is greater in men than in women. The direct association
between dietary cholesterol and changes in strength supports the potential anabolic role
of cholesterol. (Riechman 2007.) Protein supplementation is superior to carbohydrate
supplementation alone in terms of muscular strength (Cermak et al. 2012).

23
4.3 Body composition
Correlation analysis support that the changes in protein metabolism, especially in
skeletal muscle are related to changes over time in body composition (Campbell &
Leidy 2007). Reduced muscle mass is largely responsible for reduced resting
metabolism, which is typically accompanied by increased fat accumulation (Phillips
2007; Wolfe 2006).
Protein or EAA supplementation in combination with RT has been shown to
significantly increase fat-free body mass, myofiber cross-sectional area and whole
muscle cross-sectional area greater than a non-energetic or carbohydrate placebo. (Bird
et al. 2006; Cribb et. al 2007; Hartman et al. 2007; Josse et al. 2010.) In addition to that
thermogenesis and satiety increase (Halton & Hu 2004). Riechman et al. (2007) showed
that cholesterol intake had an effect on the change in lean mass over 12 weeks of RT
(Riechmal et al. 2007).

24
5 PHYSIOLOGICAL RESPONSES IN BLOOD
Exercise results in increased blood flow to the active skeletal muscles, which has the
potential to enhance hormone interactions. Muscular contraction together with increased
availability of hormones promotes an anabolic environment. Resistance exercise-
induced hormones such as insulin, growth hormone, insulin-like growth factor-1,
testosterone, sex-hormone binding globulin and cortisol have major regulatory roles in
protein, carbohydrate and lipid metabolism (Volek 2004). Nutrition has also effects on
hormones (table 1) (Ilander & Mursu 2008, 380).
The amount of muscle mass recruited directly affects the metabolic and hormonal
responses to RE. RT that utilizes large muscle masses, moderate loads (10RM), short
rest periods (1 min) and high total work, maximize the hormonal response to an
exercise. Hansen et al. (2001) demonstrated the importance of exercise-induced
hormonal responses by examining two groups of subjects who performed identical
upper body RE programs for 9 weeks. One group performed additional lower-body RE
to stimulate large increases in circulating hormones. Subjects training the upper and
lower body and thus experiencing greater circulating hormonal concentrations increased
arm strength by 37% compared to 9% of the other group. These results indicate that RE-
induced hormonal responses potentiate strength gains following long-term training.
Gains in strength and hypertrophy can occur with little to no change in circulating
hormones; indicating that hormonal responses potentiate, but are not responsible for
adaptations to RT. (Hansen et al. 2001.)

25
TABLE 1. Effects of nutrients on hormones. Edited from the table of Ilander and Mursu 2008.
“+” with nutrient means huge consumption of that nutrient, “-” with nutrient means a
small consumption of that nutrient. Below GH, insulin and testosterone “+” means, that
the amount of hormone increases when consuming that nutrient,” –“ means that the
amount of hormone decreases, empty box means that there is not effect known. (Ilander
& Mursu 2008, 380.)
Nutrient Growth hormone Insulin Testosterone
Fat + + +
Fat - - -
CHO + - +
Animal protein + +
Plant protein + -
Protein + + -
The most important anabolic hormones to stimulate protein synthesis have been
suggested to be testosterone, insulin and growth hormone (Ilander & Mursu 2008, 379).
The changes in hormonal levels are associated with potential for muscle size and
strength. It is reported that individuals, who exhibit large growth hormone (GH),
testosterone and insulin like growth factor-1 (IGF-1) responses after resistance exercise
would have greater training-induced adaptations. (Beaven et al. 2008a; Beaven et al.
2008b; Hansen et al. 2001; Migiano et al. 2009; Ronnestad et al. 2011.) High levels of
hormones increase the interaction with receptors, which have hypertrophic importance
in the post-workout period when muscles are primed for anabolism. Hormonal spikes
enhance intracellular signaling so that post-exercise protein breakdown is attenuated and
anabolic processes are heightened leading to a greater super compensatory response.
(Schoenfeld 2013). This simplistic theory has been, however, criticized (West et al.
2010; West & Phillips 2012).
5.1 Insulin
Insulin plays a key role in regulating liver and muscle glycogen stores by controlling
circulating blood sugar levels. Elevated blood sugar causes secretion of additional
insulin, which facilitates cellular glucose uptake and glycogen formation and inhibits
26
further insulin secretion. (McArdle et al. 2007, 13.) Different glycemic indexes of the
food result differentially elevated insulin levels. (Van Loon et al. 2000a; Van Loon
2000b.) Insulin also activates protein synthesis by activating components. In long term,
insulin also increases the cellular content of ribosomes to augment the capacity of
protein synthesis. Because of the big size of amino acids the delivery inside the muscle
cells needs to be done by active mechanisms. (Ilander & Mursu 2008, 380; Proud 2006.)
The ability of insulin to suppress protein breakdown in human skeletal muscle is
thought to be greater after resistance exercise than at rest (Biolo et al. 1999). Current
knowledge proposes that exercising is not the reason but the explanation might be
amino acid differences. Positive effect of insulin on protein synthesis existed, when
amino acid delivery to the muscles increased. No change or a decrease in protein
synthesis existed, when amino acid concentration decreased and amino acid delivery
stayed same or decreased. Although insulin can directly stimulate initiation of
translation, its stimulatory effect on human skeletal muscle protein synthesis is
modulated by increases in muscle perfusion and amino acid delivery and availability for
the muscle tissue. When muscle perfusion increases as a consequence of
hyperinsulinemia, more tissue is exposed to the nutrients contained in the blood. (Fujita
et al. 2006.)
Because amino acids increase insulin, there has been some interest in combining protein
with carbohydrate to maximize insulin secretion. Enhanced insulin levels resulting from
carbohydrate combined with protein have a favorable effect on net protein balance
because insulin has only a modest effect on protein synthesis in the absence of amino
acids. (Drummond et al. 2009; Kimball et al. 2002; Williams et al. 2002.) Some studies
say that carbohydrate co-ingestion does not affect muscle protein synthesis rate during
recovery from resistance-type exercise under conditions where ample protein is being
ingested, so the amount of protein shows to be the main factor in insulin secretion, like
mentioned earlier. (Koopman 2007).
5.2 Testosterone
Testosterone is a steroid hormone synthesized from cholesterol (Buresh et al. 2009). It
is an androgen hormone that has anabolic effects on muscle tissue (Volek 2004).
27
Testosterone is known to have potent effects on contractile tissue accretion when
administered pharmalogically (Crewther et al. 2011; Hayes et al. 2010). Very low-fat
diets reduces testosterone levels. Very high consumption of dietary protein decreases
testosterone levels. Considering that fact, protein overconsumption is not needed.
(Ilander & Mursu 2008, 379; Sallinen ym. 2004.) Testosterone may also contribute
indirectly to muscle protein accretion by potentiating the release of other anabolic
factors such as GH and IGF-1 (Veldhuis, et al. 2005; Sculthorpe et al. 2012).
5.3 Sex hormone binding globulin
Sex hormone binding globulin (SHBG) is a protein transferring other proteins for sex
steroids, regulating circulating concentrations of unbound hormones and their transport
to target tissues. SHBG is primarily synthesized in the liver. (Avvakumov et al. 2010.)
SHBG is influenced by metabolic and hormonal factors. Genetic differences also
contribute to inter-individual variations in plasma SHBG levels. Body mass and the
relative amount of adipose tissue versus lean muscle in particular, is one of the most
important determinants of plasma SHBG levels. (Pugeat et al. 2010; Stone et al. 2009.)
5.4 Growth hormone
Growth hormone (GH) is secreted by the anterior pituitary gland and released in
pulsatile fashion mostly during sleep. The GH mediates both anabolic and catabolic
processes. (Velloso 2008.) GH induces mobilization of triglycerides and incorporates
amino acids into various proteins, including those in skeletal muscle (Vierck et al.
2000). GH increases muscle and skeletal growth, protein synthesis, lipolysis and
glucose conservation (Nakagawa et al. 2002; Van Loon et al. 2003). In the study of
West and Phillips’ (2012) it was shown GH to correlate positively both with change in
type 1 and type 2 fibers CSA (r= 0.36, p<0.01; r= 0.28, p<0,05). Growth hormone also
has a function to increase the use of fat as energy and to have a positive impact to body
composition. (Ilander & Mursu 2008, 379.)
There is a linear relationship between the magnitude of the acute increase in GH release
and exercise intensity. Because the GH response to acute resistance exercise is
dependent on the work-rest interval and the load and the frequency of the resistance

28
exercise used, the ability to equate intensity across different exercise protocols is
desirable. A high volume training regimen typically used by bodybuilders to promote
maximal muscle hypertrophy, resulted in a greater GH response compared to a high
intensity training regimen typically used by competitive weight lifters to promote
maximal muscle strength or power. (Williams et al. 2002.)
Each nutrient has independent effect on regulation of GH secretion; Glucose or
carbohydrate-rich meals decrease GH levels that may be followed by a rebound
hypoglycemia-induced rise in GH (Nakagawa et al. 2002; Van Loon et al. 2003.)
Amino acids can increase GH levels; however physical training and high-protein diets
reduce the effect (Chromiak & Antonio 2002). The amount of fat in energy increases
the amount of GH, when the lack of fat decreases it. (Ilander & Mursu 2008, 379; Volek
et al. 2001).
5.5 Cortisol
Cortisol is an adrenal steroid hormone that is regulated by pituitary adrenocorticotropin
(ACTH). ACTH is under the influence of hypothalamic corticotropin-releasing
hormone (CRH). Cortisol increases hepatic lipolysis and proteolysis to fuel hepatic
glucogeonesis. This protects blood glucose and glycogen levels (Bloomer et al. 2000;
Koch et al. 2001; Williams et al. 2002).
Cortisol is frequently elevated after resistance exercise protocols designed to elicit
hypertrophy and is considered to be catabolic and counteractive to hypertrophy
(Kraemer and Ratamess 2005; Spiering et al. 2008; Tarpenning et al. 2001). However,
this relation is probably not that simple, because in the study of West and Phillips
(2012) cortisol was positively correlated with change in whole-body LBM (r = 0.29,
P<0.05). It also correlated with increases in type 2 fiber area positively (r=0.35,
p<0.01). (West & Phillips 2012.)
Most of the studies show that carbohydrate or carbohydrate-protein before or after
exercise does not alter the cortisol response. (Bloomer et al. 2000; Koch et al. 2001;
Williams et al. 2002.) In contrast some studies demonstrate cortisol to be sensitive to
feeding. Tarpenning et al. (2001) showed that carbohydrate intake during an acute
29
session of resistance exercise significantly decreased cortisol response. The reduction in
post-resistance exercise cortisol was significantly related to increases in muscle fiber
hypertrophy (Tarpenning, et al. 2001; Volek 2004.) Independent of external thermal
stress, hypohydration potently amplifies the exercise-induced responses of cortisol
(Judelson et al. 2007; Maresh et al. 2006).

30
6 PURPOSE, PROBLEMS AND HYPOTHESES
The gym program was the same for all subjects, nutritional habits were not controlled.
The aim of the study was to find an explanatory factor from nutritional habits for
individual differences in muscle strength gain, muscle fiber size changes, body
composition changes and in acute hormonal changes following a heavy resistance
exercise.
The research problems and the hypotheses of the present study were:
1. Do nutritional habits cause differences in the subjects’ chronic adaptations in
muscle?
Hypothesis: The increased availability of nutrients has the potential to enhance the
adaptations to RT (Mc Ardle 2007, 541-543; Phillips et al. 2009). Carbohydrate
consumption is important to maximize exercise volume and results (Volek 2004).
Especially type 2 muscle fiber has in some studies correlated with maximal power,
grows greater when consuming carbohydrates and proteins (Cribb & Hayes 2006).
2. Do nutritional habits have impact on subjects’ hormonal levels?
Hypothesis: The nutrition effects on the magnitude of acute hormonal responses
(Bird 2010; Hansen et al. 2001). Different glycemic indexes of the food result
differentially elevated insulin levels (Van Loon et al. 2000a). Feeding, particularly
fat, decreases circulating testosterone; however it increases growth hormone (Volek
et al. 2001).
3. Does RT period change nutritional habits?
Hypothesis: RT increases the consumption of proteins and carbohydrates (Niemi
2006, 33, 35).
4. Does nutrition make differences between anthropology results of subjects?

31
Hypothesis: Proteins have been shown to increase fat-free body mass greater than
carbohydrates (Josse et al. 2010). Cholesterol intake has the effect on the change in
lean mass (Riechmal et al. 2007).
32
7 METHODS
7.1 Subjects
The study involved 21 young male subjects. The age of the subjects varied between 19
and 30 years. The voluntary subjects were recruited for the study by advertising in
newspapers and through email lists. They needed to be able to commit to the study for
six months that included 21 weeks of supervised RT (gym training with weights) with
two practices per week and measurements in the beginning, in the middle and in the end
of the study. The subjects were informed about the design of the study, risks and
discomfort. They also had the right to discontinue the study at any time. After this
information they signed written informed consent form to participate in the study, which
had been approved by the ethics committee of the University of Jyväskylä. The study
was conducted according to the Declaration of Helsinki.
All the subjects went through a medical examination and none of them had any
obstacles to perform heavy RT. They were moderately active; however none of them
had previous regular experience about RT. They all had normal body shape. The limit
for the subjects’ height was 165-185 cm, for the weight 60-90 kg and body mass index
(BMI) had to be less than 30. None of the subjects had regular need for nutritional
supplements or pharmacological substances that might affect the measured variables.
None of them were vegetarian what would have been an obstacle for participation.
Physical characteristics of the subjects’ are presented in the table (table 2).
TABLE 2. Physical characteristics of the subjects.
N Age (yr.) Height (cm) Body mass (kg) LBM(kg) Fat (%)
21.0 26±4 182±5.9 75.5±7.8 62.6±5.5 16.9±3.9
Subjects were randomly assigned to three groups; whey protein, placebo and control
groups. The mean age, the body weight or the 1RM-result of the leg press did not vary
among the groups. Whey protein and placebo groups practiced the same amount and
both had pre- and post-training drink to consume. They did not know whether their
drinks contained protein or not. The amount of protein content was so small that it did

33
not matter in this report. In this report only whey protein and placebo groups are
examined and they are examined as one group (n=21).
7.2 Experimental design
The study consisted of four measurements; the start measurement, the second start
measurement, the middle measurement and the end measurement (figure 4). The aim of
the first start measurement was to be a practicing possibility for the subjects - When
accomplishing the official start measurement and the two later measurements, learning
would not be affecting to the results anymore. All the measurements were carried out at
the same time of the day to exclude the effects of daily variations (Vissing et al. 2005;
Sedliak et al. 2007).
FIGURE 4. Gym program protocol.
The subjects trained with supervision in the gym two times a week for 21 weeks. The
instructor controlled techniques and motivated for the best possible result. RT was done
progressively starting with 40% and ending to 85% from the maximum loads, that were
determined individually from the measurements for every exercise throughout the study.
The aim of the first seven weeks was to make RT familiar and improve muscle strength
endurance. Next seven weeks concentrated on increasing muscle size. Adding to
muscular hypertrophy last seven weeks was used to optimize gains in maximal strength
as well. The amount of sets increased from 2-3 sets to 3-5 sets. 15-30 repetitions in the
beginning decreased to 5-6 repetitions in the end. There was 2-3 minutes break between
the sets. Between the gym days minimum two days break was required. In every
practice thigh muscles were activated by using knee extensors with two different
exercises, bilateral leg press and bilateral knee extension and one exercise, bilateral
Muscle strength
endurance
sets: 2-3
repetitions: 15-30
0 7
Muscle size=
hypertrophy
8 14
Hypertrophy and
maximal strength
3-5
5-6
15 21 time in
weeks
34
knee flexion, for the knee flexors. The training program included also exercises for the
other big muscle groups of the body (chest and shoulders, upper back, upper arms, trunk
extensors and flexors, hip abductors and adductors and ankle extensors), but the main
focus of the practice was in knee extensors. They were chosen to be the focus due to its
shape and function has been studied most and the results of this study can be compared
with the previous studies. In each workout knee extensors were the first or the second
exercise on the program. The first exercise was alternated between bench press
movement of the other large muscle group, chest and shoulders.
The measurements were done in Viveca in Jyväskylä, in the laboratory of the
Department of Biology of Physical Activity and in the magnet center of middle Finland
in Jyväskylä. The exercising was done in the gym in Jyväskylä.
7.3 Measurements
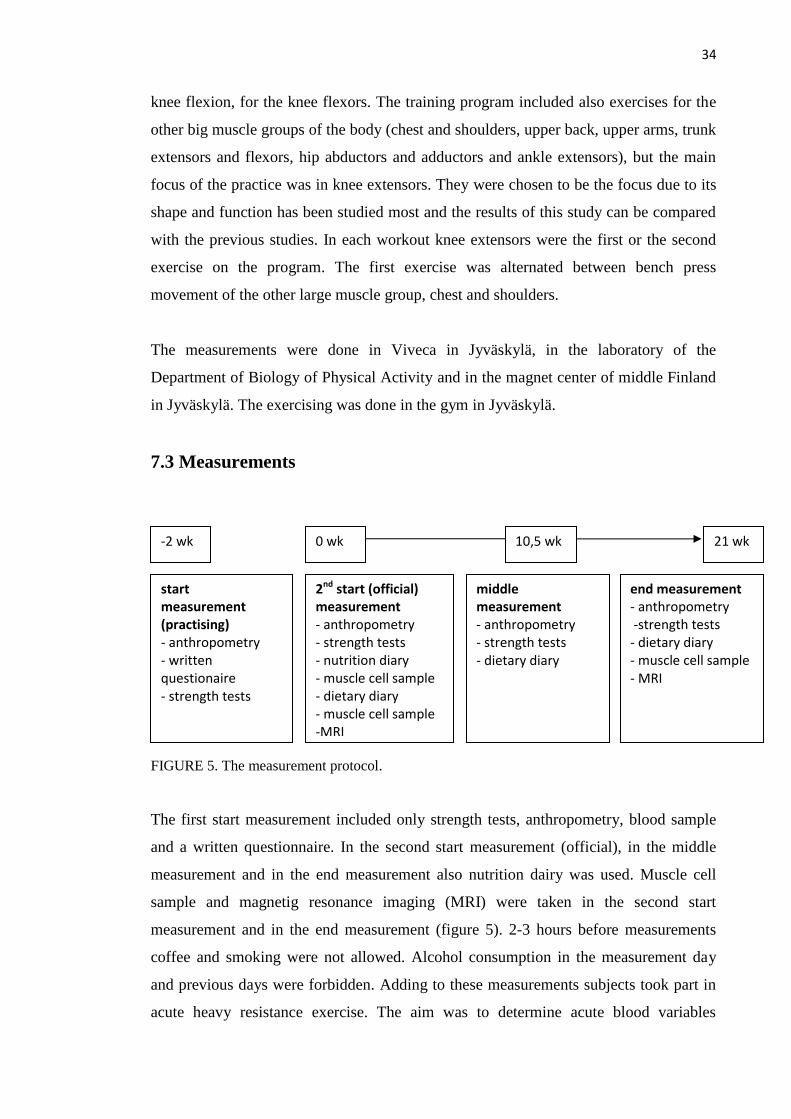
FIGURE 5. The measurement protocol.
The first start measurement included only strength tests, anthropometry, blood sample
and a written questionnaire. In the second start measurement (official), in the middle
measurement and in the end measurement also nutrition dairy was used. Muscle cell
sample and magnetig resonance imaging (MRI) were taken in the second start
measurement and in the end measurement (figure 5). 2-3 hours before measurements
coffee and smoking were not allowed. Alcohol consumption in the measurement day
and previous days were forbidden. Adding to these measurements subjects took part in
acute heavy resistance exercise. The aim was to determine acute blood variables
start measurement (practising) - anthropometry - written questionaire - strength tests
2nd start (official) measurement - anthropometry - strength tests - nutrition diary - muscle cell sample - dietary diary - muscle cell sample -MRI
middle measurement - anthropometry - strength tests - dietary diary
end measurement - anthropometry -strength tests - dietary diary - muscle cell sample - MRI
0 wk 10,5 wk 21 wk -2 wk

35
(appendix 1).
7.3.1 Morning measurement
Morning measurement is a collective term for several measurements done during the
same measurement appointment. It always included anthropometry measurements and
in the first morning measurement also written questionnaire belonged to that protocol.
Morning measurement was done without eating or smoking. The day before
measurements had to be without physical stress. If the power test was made before
morning measurement, minimum two days of rest had to follow the power test.
7.3.2 Anthropometric measurements
Anthropometry measurements were done after overnight fasting. The height was
measured with 0.1 cm accuracy by the measuring tape placed to the wall. The weight
was measured with 0.1 kg accuracy by the calibrated scale. The percentage of fat was
determined from biceps, triceps brachii, subscapular and iliac crest skinfolds with
Durnin & Womersley’s (1974) formula. Body fat percentage and amount of total body
muscle mass (kg) was measured by bioelectrical impedance using an Inbody720
machine (Seoul, Korea). The subjects were advised to come to test in normal hydration
status. Too less or much drinking, sauna and alcohol must have been avoided.
7.3.3 Strength tests
Before the test subjects warmed up for 5 minutes with a bicycle ergometer. The strength
tests consisted of two lower limb and one upper limb movements. The first lower limb
movement was maximal isometric leg press with 107º knee ankle in David 200-
eguipment (David Fitness and Medical, Finland). The aim was to produce as fast as
possible as much power as possible. The time given to produce power was three
seconds. Three trials were given. The second lower limb movement was bilateral
dynamic leg press also with David 200-equipment with the knee angle less than 70º.
The maximum power was measured from 3-5 attempts. After each attempt, the load was
increased until the subject was unable to extend his legs to full-extended 180º knee
angle position. The highest successful load was determined as 1 RM. The only upper
36
body movement in the test was maximal bench press by sitting in David 210-equipment
(David Fitness and Medical, Finland). Elbows were in 90 º angle compared to upper
arms. The aim again was to produce as much power as possible quickly.
There was always a few minutes break between the trials of the same movement.
Between the different movements the break length was the time needed for explanation
of the next technique. Every subject was cheered in every single trial to motivate in
order to make the best possible result. The best result from the trials was used in the
statistical analysis. The forces produced in isometric measurements were converted to
digital format on the computer. Signal 2.15 software (Cambridge Electronic Design
Ltd., Cambridge, UK) with a sampling frequency of 2000Hz was used to analyze
maximal power. Before the power test two exercise-free days was required. In the first
power test a small tattoo mark was drawn to subject’s leg in order to make the coming
ultratonic, MRI and biopsy measurements always from the same area.
7.3.4 Dietary diaries
In order to observe the eating habits subjects filled dietary diaries in the beginning, in
the middle (after 10.5 weeks) and in the end of the training period. The diaries were
registered on four to five consecutive days. One of these days had to be Saturday or
Sunday. It was important to write down everything very meticulously; the amount of the
food, the place where it was consumed, the time and the brand. If the food was
something rare, also content of nutrients should have been mentioned. The subjects
were given an example about registering. During this diary writing period eating habits
had to be normal.
7.3.5 Muscle biopsy
Muscle biopsies were taken before (pre) and after (post) 21 week training period. The
biopsies were taken from the vastus lateralis muscle midway between the patella and
greater trochanter about 2.5 cm depth. The sample taker was an experienced doctor. In
the first measurement ultrasonic testing was made for the sample taking place to be sure
the needle would not touch blood veins or nerves. Circumstances were sterilized. The
sample taking area was anaesthetized with Lidocain- local subcutaneous anaesthetic and
37
cleaned by amisept-disinfectant. The doctor made 1 cm cut to the skin with a surgeon
knife and took the muscle sample using Bergström’s 5 mm biopsy needle technique.
(Bergström and Hultman 1966.) The sample inside the needle was checked by size and
quality and then it was set to a cork. The muscle sample was cleaned of any visible
connective or adipose tissue and blood. The piece of muscle taken for muscle fiber size
analyze was frozen in isopentane cooled to (-160º) in liquid nitrogen and thereafter
stored in the freezer (-80º).
7.3.6 Muscle cross-sectional area
The muscle cross-sectional area (CSA) of the quadriceps femoris muscle was
determined before and after 21 week training period using MRI (GE Signa Exite HD 1.5
T). During the measurement the legs of the subject were kept parallel and strapped with
a belt and a special cast designed to standardize the measurement as well as possible.
Four axial-plane MRI scans were taken; the first image was 4 cm above the midway
between the patella and greater trochanter. The next three scans were taken at 2, 4, and
6 cm towards the patella. The MRI- images were analyzed with OsiriX (version 2.7.5)
software.
7.3.7 Blood sample
Blood samples were drawn from the antecubital vein using disposable needles. Blood
was obtained during acute heavy resistance exercise. The samples analyzed in this study
were obtained before the muscle work, right after exercise, 15 minutes and 30 minutes
after exercise. Blood was centrifuged for 10 minutes in 4 ºC 3500RPM and then stored
in -80ºC for the later hormone analysis.
7.4 Analyzes
7.4.1 Dietary diary analyze
The diaries were analyzed using the Micro Nutrica nutrient-analysis software version
3.11 (The Social Insurance Institution of Finland). The energy intake was mentioned
with total energy (1000kJ), total energy per weight (kJ/kg) and protein, carbohydrate

38
and fat intake related to the weight (g/kg). In the beginning of the study there were more
data decreasing towards the end of the study. Only eight subjects completed the diary
until the end. That is why mean value of one, two or three diaries - the beginning,
midway and end - are used. In these cases when comparing the changes in eating to the
development of some other factor, only these eight subjects are analyzed.
7.4.2 Muscle cell sample analyze
Muscle fiber types. Muscle cell samples were cut by cryostate –(20ºC) to 10 μm thick
sections cross-sectionally. Four different muscle fiber types (I, IIa, IIb ja IIc) were
determined by histochemical ATPase colouring (Brooke & Kaiser 1970). They were
separated from each other using four different preincubate-solution; pH 4.2, pH 4.6, pH
9.4 ja pH 10.3. Because there were only a small amount of each subtypes, all fast
muscle fiber types, IIa, IIb ja IIc were counted together when doing statistical analyzes.
Muscle fiber sizes. The same 10 μm thick pieces as in the muscle cell type
determination were used in the muscle fiber size determination. The borders of the
muscle cells were determined by anti-dystrophin antibody. Pictures from the muscle
cells with borders were saved and analyzed by Tema Image-Analysis System –
equipment (Scan Beam). An Olympys BX-50F light microscope (Olympus Optical,
Tokyo, Japan) with Olympus colour CCD camera (Colorview III, Olympus Optical,
Tokyo, Japan) and Analysis® Software (Version 5.0, Soft Imaging System GmbH,
Munster, Germany) were used for imaging and analyzing. The change of average sizes
of muscle fiber types during 21 weeks, were compared.
7.4.3 Blood sample
Serum insulin, testosterone and SHBG were possible to be analyzed with an
immunometric chemiluminescence method with an Immulite®
1000 (DPC, Los Angeles,
USA). Serum insulin was also analyzed by the ADVIA Centaur insulin assay (Bayer,
LTD, USA). Serum testosterone could be analyzed also with ELISA (IBL, Hamburg,
Germany). All samples of each subject were assayed in the same assay run.
39
7.4.4 Statistics
The data was analyzed using IBM SPSS Statistics 19 software. All data was checked to
be normally distributed. In every category there is shown a mean value and standard
deviation for all subjects. Pearson’s correlation was used to find dependencies between
the variables. Student’s t-test and repeated measures ANOVA were used to determine if
the results of the measurements done in the different phases of the study significantly
differed from each other. Regression analysis was used to estimate the relationships
among variables.
In all statistical tests differences were significant when p ≤ 0.05. In this study “*” means
significant (p=≤ 0.05), “**” means highly significant (p=≤ 0.01).

40
8 RESULTS
8.1 Nutritional status
Average energy intake among subjects was about 10000-11000kJ a day. That means
140-150kJ per kg of body mass. Protein levels were 1.4-1.6 g/kg, carbohydrate levels
were 3.7-4.0 g/kg, fat levels were 1.3-1.4g/kg (table 3). There were no statistical
differences (p<0.05) in total energy, energy per weight, carbohydrates and fat
consumption between the week 0, 10.5 and 21. The consumption of protein increased
significantly (p=0.047) from the beginning to the end of the study, however the
difference between weeks 0 and 10.5 or 10.5 and 21 did not exist (table 4). High
correlation between weeks 0, 10.5 and 21 in the protein amounts of the subjects shows
that the increase in protein levels occurred in every subject’s habits (table 5).
TABLE 3. Mean (±SD) nutritional intake in the beginning, in the middle and in the end of the
study.
Variable 0 wk 10,5 wk 21 wk
Energy (1000 kJ) 10.01±1.9 10.82±2.9 11.3±2.8
Energy (kJ/kg) 139.58±20.0 145.12±35.2 153.34±31.6
Protein (g/kg) 1.43±0.3 1.6±0.5 1.59±0.4
CHO (g/kg) 3.74±0.7 3.98±0.8 4.03±1.1
Fat (g/kg) 1.36±0.2 1.28±0.4 1.39±0.4

41
TABLE 4. P-value of variables between weeks 0, 10.5 and 21. E= total energy, Prot=proteins
and CHO=carbohydrates.
E (1000 kJ) E (kJ/kg) Prot (g/kg) CHO (g/kg) Fat (g/kg)
0 vs. 10.5 0.32 0.57 0.21 0.21 0.62
0 vs. 21 0.13 0.23 0.05 * 0.52 0.82
10.5 vs. 21 0.64 0.53 0.93 0.92 0.4
TABLE 5. Relationships between protein consumptions in the weeks 0, 10.5 and 21.
Prot (g/kg) p-value
0 vs. 10.5 0.82 0.014*
0 vs. 21 0.92 0.001*
10.5 vs. 21 0.91 0.002*
The percentage amounts of protein, CHO and fat stayed about the same (table 6). The
sum of these three variables may not come up to 100% due to alcohol being counted in
even if it is not shown in the table.
TABLE 6. Percentage of energy sources in different phases of the study.
Variable 0 wk (%) 10.5 wk (%) 21 wk (%)
Protein (g/kg) 17.3 18.6 18.2
CHO (g/kg) 45.5 47.33 44.33
Fat (g/kg) 37.2 33.47 34.56
Subjects’ eating habits mostly followed recommendations (table 7a, table 7b). The
consumption of vitamin D was low compared to the newest recommendations. The
amount of niacin and selenium was doubled, the amount of vitamin C a bit less than
doubled, the amount of vitamin B12 was tripled and the amount of sodium was even
15 times higher than required. (Ravitsemusneuvottelukunta 2012.)
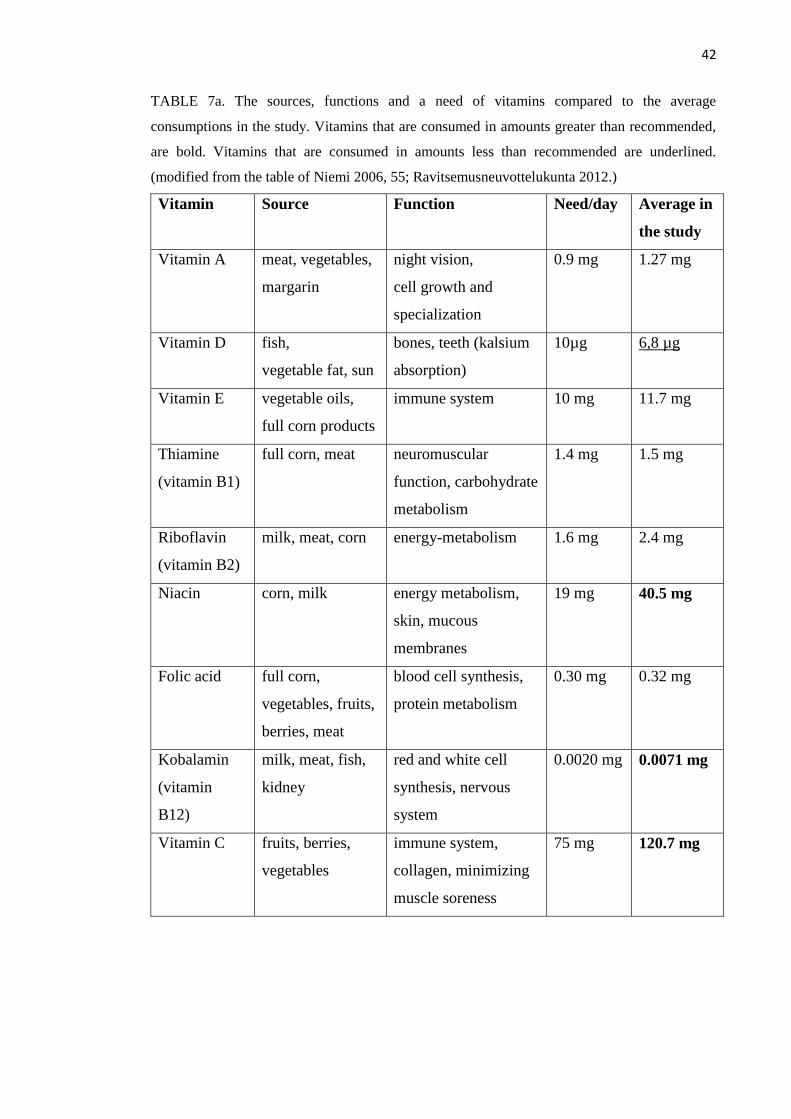
42
TABLE 7a. The sources, functions and a need of vitamins compared to the average
consumptions in the study. Vitamins that are consumed in amounts greater than recommended,
are bold. Vitamins that are consumed in amounts less than recommended are underlined.
(modified from the table of Niemi 2006, 55; Ravitsemusneuvottelukunta 2012.)
Vitamin Source Function Need/day Average in
the study
Vitamin A meat, vegetables,
margarin
night vision,
cell growth and
specialization
0.9 mg 1.27 mg
Vitamin D fish,
vegetable fat, sun
bones, teeth (kalsium
absorption)
10µg 6,8 µg
Vitamin E vegetable oils,
full corn products
immune system 10 mg 11.7 mg
Thiamine
(vitamin B1)
full corn, meat neuromuscular
function, carbohydrate
metabolism
1.4 mg 1.5 mg
Riboflavin
(vitamin B2)
milk, meat, corn energy-metabolism 1.6 mg 2.4 mg
Niacin corn, milk energy metabolism,
skin, mucous
membranes
19 mg 40.5 mg
Folic acid full corn,
vegetables, fruits,
berries, meat
blood cell synthesis,
protein metabolism
0.30 mg 0.32 mg
Kobalamin
(vitamin
B12)
milk, meat, fish,
kidney
red and white cell
synthesis, nervous
system
0.0020 mg 0.0071 mg
Vitamin C fruits, berries,
vegetables
immune system,
collagen, minimizing
muscle soreness
75 mg 120.7 mg

43
TABLE 7b. The sources, functions and a need of minerals compared to the average
consumptions in the study. Minerals that are consumed more than recommended are
bold. (modified from the table of Niemi 2006, 64; Ravitsemusneuvottelukunta 2012.)
Mineral Source Function Need/day Average
in the
study
Calsium milk products bone and teeth tissue,
muscle contraction
800-900
mg
1398 mg
Sodium salt (sodium
chloride)
fluid balance, nerve
and muscle irritability
230 mg 3051 mg
Potassium corn, milk, meat acid-base balance,
neuromuscular system
3500 mg 4667 mg
Magnesium vegetables, full
corn, coffee
enzyme activator,
neuromuscular system
350 mg 464 mg
Iron blood food,
vegetables
oxygen delivery 9 mg 13,8 mg
Zinc almost in all food energy metabolism,
antioxidant
9 mg 15,3 mg
Selenium meat, cheese, corn
products
function of liver,
improves immune
system function,
prevent inflammation
diseases
0.06 mg 0.1 mg
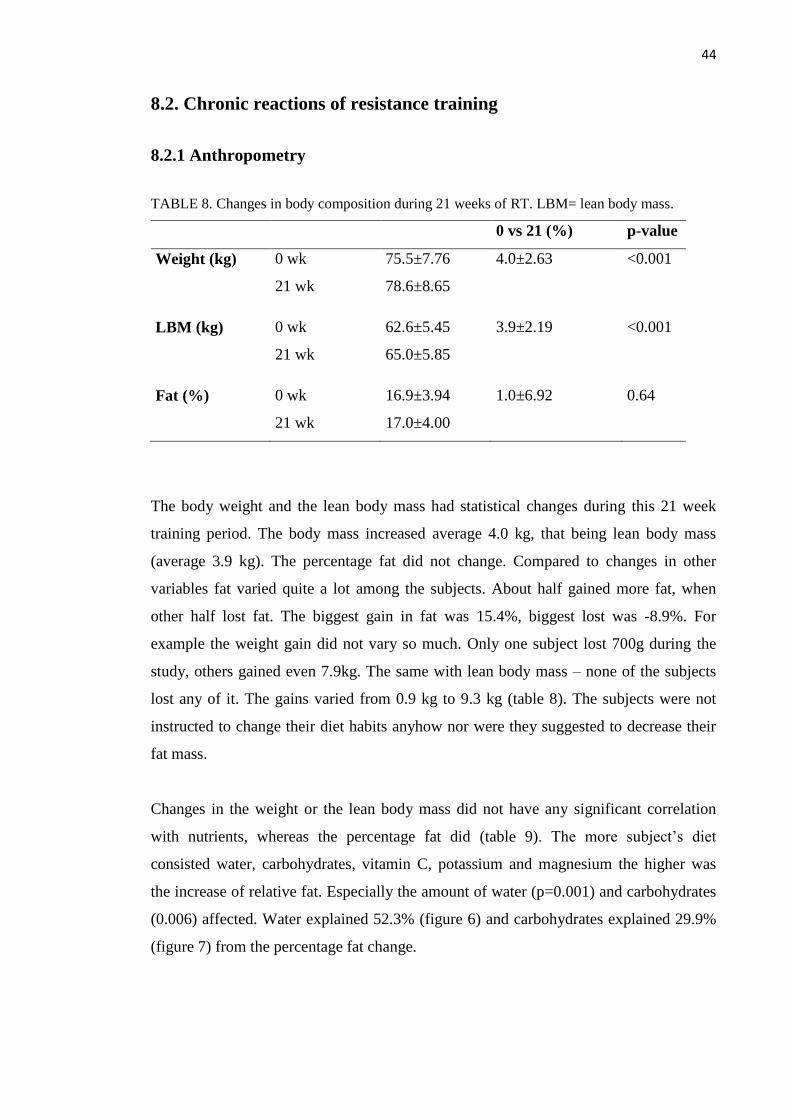
44
8.2. Chronic reactions of resistance training
8.2.1 Anthropometry
TABLE 8. Changes in body composition during 21 weeks of RT. LBM= lean body mass.
0 vs 21 (%) p-value
Weight (kg) 0 wk 75.5±7.76 4.0±2.63 <0.001
21 wk 78.6±8.65
LBM (kg) 0 wk 62.6±5.45 3.9±2.19 <0.001
21 wk 65.0±5.85
Fat (%) 0 wk 16.9±3.94 1.0±6.92 0.64
21 wk 17.0±4.00
The body weight and the lean body mass had statistical changes during this 21 week
training period. The body mass increased average 4.0 kg, that being lean body mass
(average 3.9 kg). The percentage fat did not change. Compared to changes in other
variables fat varied quite a lot among the subjects. About half gained more fat, when
other half lost fat. The biggest gain in fat was 15.4%, biggest lost was -8.9%. For
example the weight gain did not vary so much. Only one subject lost 700g during the
study, others gained even 7.9kg. The same with lean body mass – none of the subjects
lost any of it. The gains varied from 0.9 kg to 9.3 kg (table 8). The subjects were not
instructed to change their diet habits anyhow nor were they suggested to decrease their
fat mass.
Changes in the weight or the lean body mass did not have any significant correlation
with nutrients, whereas the percentage fat did (table 9). The more subject’s diet
consisted water, carbohydrates, vitamin C, potassium and magnesium the higher was
the increase of relative fat. Especially the amount of water (p=0.001) and carbohydrates
(0.006) affected. Water explained 52.3% (figure 6) and carbohydrates explained 29.9%
(figure 7) from the percentage fat change.
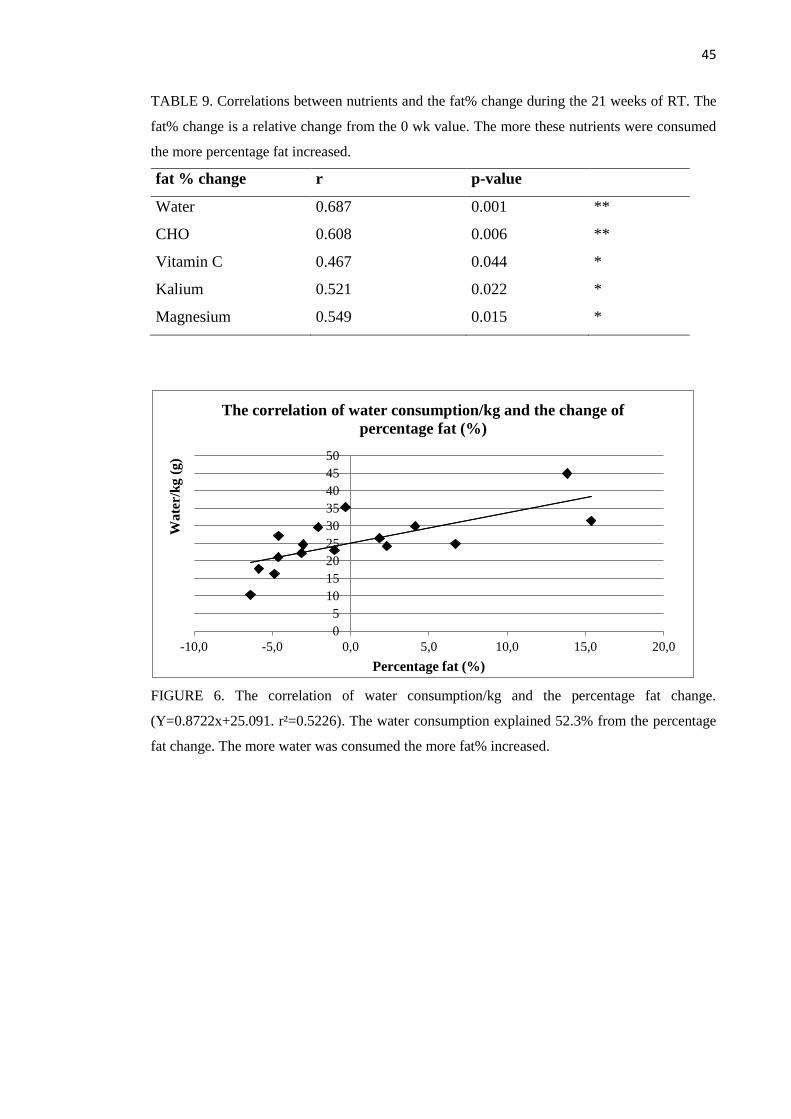
45
TABLE 9. Correlations between nutrients and the fat% change during the 21 weeks of RT. The
fat% change is a relative change from the 0 wk value. The more these nutrients were consumed
the more percentage fat increased.
fat % change r p-value
Water 0.687 0.001 **
CHO 0.608 0.006 **
Vitamin C 0.467 0.044 *
Kalium 0.521 0.022 *
Magnesium 0.549 0.015 *
FIGURE 6. The correlation of water consumption/kg and the percentage fat change.
(Y=0.8722x+25.091. r²=0.5226). The water consumption explained 52.3% from the percentage
fat change. The more water was consumed the more fat% increased.
0
5
10
15
20
25
30
35
40
45
50
-10,0 -5,0 0,0 5,0 10,0 15,0 20,0
Wate
r/k
g (
g)
Percentage fat (%)
The correlation of water consumption/kg and the change of
percentage fat (%)

46
FIGURE 7. The correlation of the change of percentage fat (%) and the consumption of CHO/kg
(Y=0.0676x+3.729. r² = 0.2991). The CHO consumption explained 29.9% from the fat%
change. The more CHO was consumed the more fat% increased.
8.2.2 One repetition maximum
Subjects’ maximal strength, one repetition maximum (1RM) in leg press, enhanced 19.6
% during the 21 week training period (table 10). This means 31.5 kilograms on average.
The relative strength gain, 1RM/kg, was 14.6 % during these 21 weeks. This means
310g/kg. The absolute strength development, 1 RM, correlated with the 1RM/kg
development significantly (r=0.813, p<0.001). This means that the same individuals
who reached the best absolute results also were in the top in the list even if compared
the result to their size (figure 8).
TABLE 10. The 1RM shown together with the 1RM/kg development in the different phases of
the study.
0 wk 21 wk 0 vs 21 wk (%)
1RM (kg) 166.4±28.5 198±29.1 19.6±7.2
1RM/kg (kg) 2.21±0.3 2.52±0.3 14.6±6.7
0
1
2
3
4
5
6
-10 -5 0 5 10 15 20
CH
O/k
g
Fat% (%)
The correlation of the change of percentage fat and the
consumption of CHO/kg
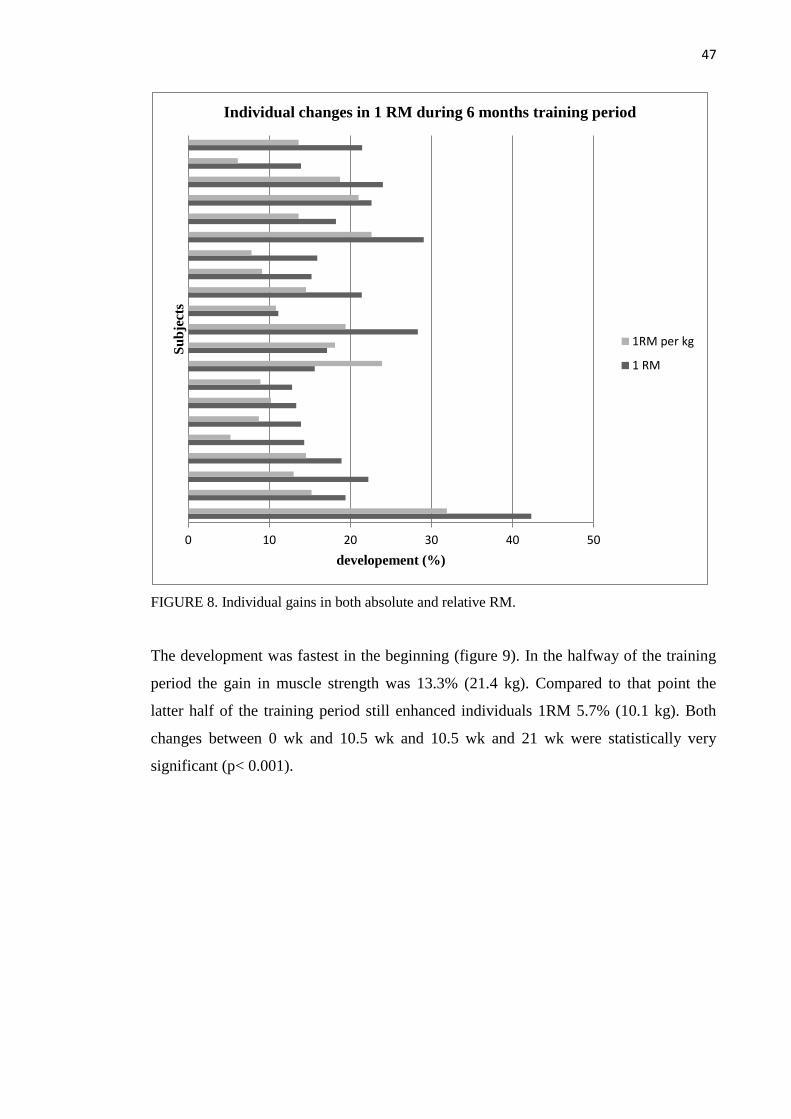
47
FIGURE 8. Individual gains in both absolute and relative RM.
The development was fastest in the beginning (figure 9). In the halfway of the training
period the gain in muscle strength was 13.3% (21.4 kg). Compared to that point the
latter half of the training period still enhanced individuals 1RM 5.7% (10.1 kg). Both
changes between 0 wk and 10.5 wk and 10.5 wk and 21 wk were statistically very
significant (p< 0.001).
0 10 20 30 40 50
developement (%)
Su
bje
cts
Individual changes in 1 RM during 6 months training period
1RM per kg
1 RM

48
FIGURE 9. 1RM development during the 21 weeks of RT.
Closer inspection of the high and low responders.
3 high- and 3 low-responders are checked more carefully. 15% (3 from 21 individuals in
this study) is a normal amount of low- and high-responders in a study and that is set as a
limit for a special attention in this study. (Hubal et al. 2005.) The biggest personal
development was 42.3% with the 55 kg difference, starting from 130 kg and ending to
185 kg. The smallest gain was 11.1% with 30 kg difference, starting from 225 kg and
ending to 250 kg. In many cases the most developed subjects were the ones who started
with the lowest results and the smallest gains were among the best 0 wk subjects (figure
10). The development is also viewed as absolute kilograms despite the relation to the
starting result. The amount of kilograms is changed relative to the body size (figure 11).
The same three individuals got the best results comparing the development to the
starting result. The results of the weakest individual are slightly different.
Subject’s eating habits followed the trend. These nutrients that contrariwise correlated
with results were exactly used like that: less by the individuals with biggest gains, most
by the ones with smallest gains (table 11a and table 11b). A few significant correlations
are vizualized more specifically (figure 12a and 12b). Both high- and low- responders
consumed vitamin D, selenium, water, lactose, dietary fibre, calcium, vitamin B2 and
vitamin C more than average values. High-responders consumed all the other nutrients
less than average. The low-responders ate over averages except vitamin A, vitamin B12,
folid acid and iron. The amounts of nutrients correlated with 1RM results are considered
166.4
187.9 (13.3%)
198.0 (5.7%)
0
50
100
150
200
250
0 wk 10,5 wk 21 wk
1R
M (
kg
)
1 RM during the 6 months training period
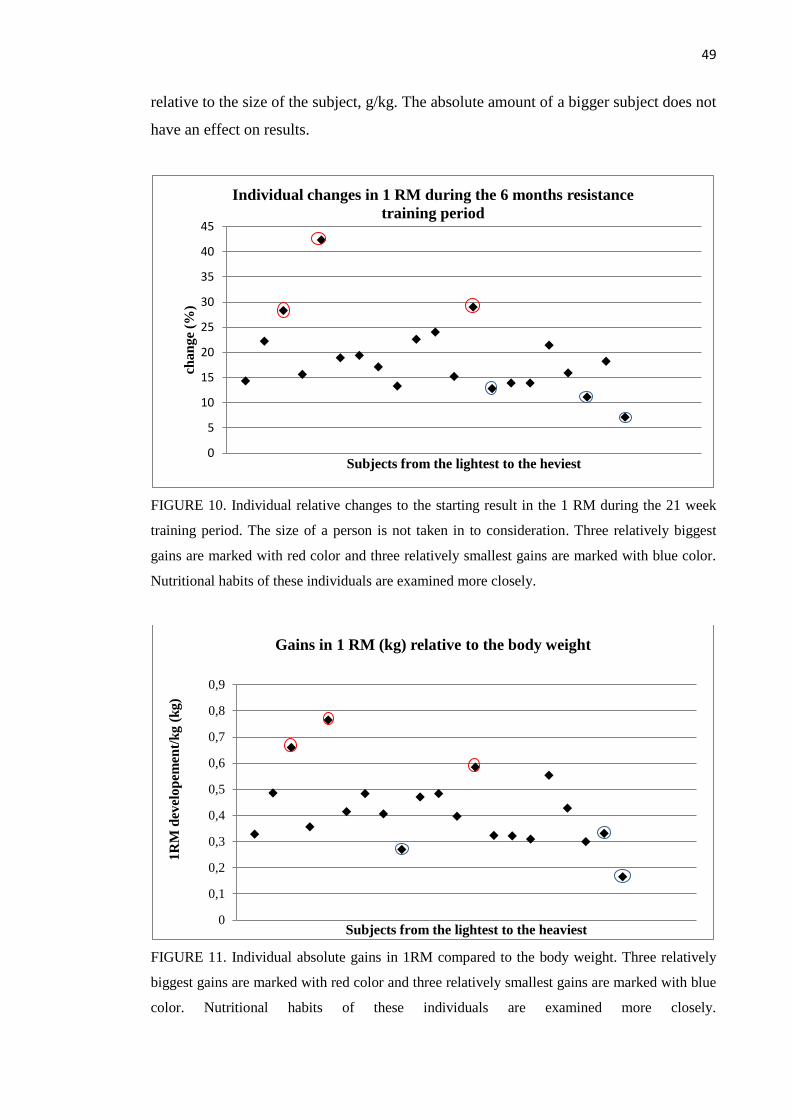
49
relative to the size of the subject, g/kg. The absolute amount of a bigger subject does not
have an effect on results.
FIGURE 10. Individual relative changes to the starting result in the 1 RM during the 21 week
training period. The size of a person is not taken in to consideration. Three relatively biggest
gains are marked with red color and three relatively smallest gains are marked with blue color.
Nutritional habits of these individuals are examined more closely.
FIGURE 11. Individual absolute gains in 1RM compared to the body weight. Three relatively
biggest gains are marked with red color and three relatively smallest gains are marked with blue
color. Nutritional habits of these individuals are examined more closely.
0
5
10
15
20
25
30
35
40
45
cha
ng
e (%
)
Subjects from the lightest to the heviest
Individual changes in 1 RM during the 6 months resistance
training period
0
0,1
0,2
0,3
0,4
0,5
0,6
0,7
0,8
0,9
1R
M d
evel
op
emen
t/k
g (
kg)
Subjects from the lightest to the heaviest
Gains in 1 RM (kg) relative to the body weight
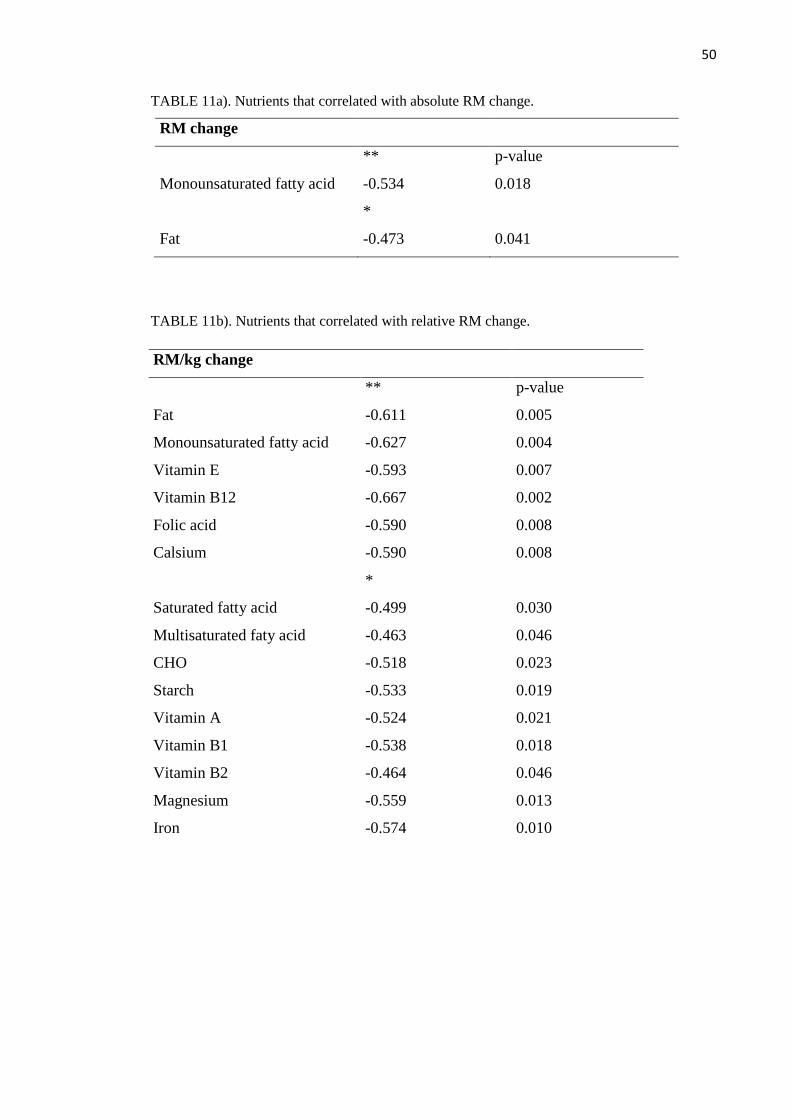
50
TABLE 11a). Nutrients that correlated with absolute RM change.
RM change
** p-value
Monounsaturated fatty acid -0.534 0.018
*
Fat -0.473 0.041
TABLE 11b). Nutrients that correlated with relative RM change.
RM/kg change
** p-value
Fat -0.611 0.005
Monounsaturated fatty acid -0.627 0.004
Vitamin E -0.593 0.007
Vitamin B12 -0.667 0.002
Folic acid -0.590 0.008
Calsium -0.590 0.008
*
Saturated fatty acid -0.499 0.030
Multisaturated faty acid -0.463 0.046
CHO -0.518 0.023
Starch -0.533 0.019
Vitamin A -0.524 0.021
Vitamin B1 -0.538 0.018
Vitamin B2 -0.464 0.046
Magnesium -0.559 0.013
Iron -0.574 0.010

51
FIGURE 12a. The relationship of the consumption of monounsaturated fatty acids and absolute
1RM in kg.
FIGURE 12b. The relationship of the consumption of monounsaturated fatty acids and
percentage amount of 1 RM change during 21 weeks.
8.2.3 Muscle fiber size
When counting all muscle fiber types together the average growth in size during the 21
week training period was 49.3%. The cell type 1, slow cell type, grew 42.8%. The cell
type 2, fast cell type, grew 55.0%. In most cases cell type 2 grew more than cell type 1.
(figure 13).
0,0
10,0
20,0
30,0
40,0
50,0
60,0
0 10 20 30 40 50 60
Mon
ou
nsa
tura
ted
fatt
y a
cid
s (m
g/k
g)
1RM change (kg)
The correlation of the consumption of monounsaturated fatty
acids and absolute 1RM change
0,0
10,0
20,0
30,0
40,0
50,0
60,0
0 10 20 30 40 50
Mon
ou
nsa
tura
ted
fatt
y a
cid
s
(mg/k
g)
The 1RM change (%)
The correlation of the consumption of monounsaturated fatty
acids and percentage amount of 1RM change during 21 weeks
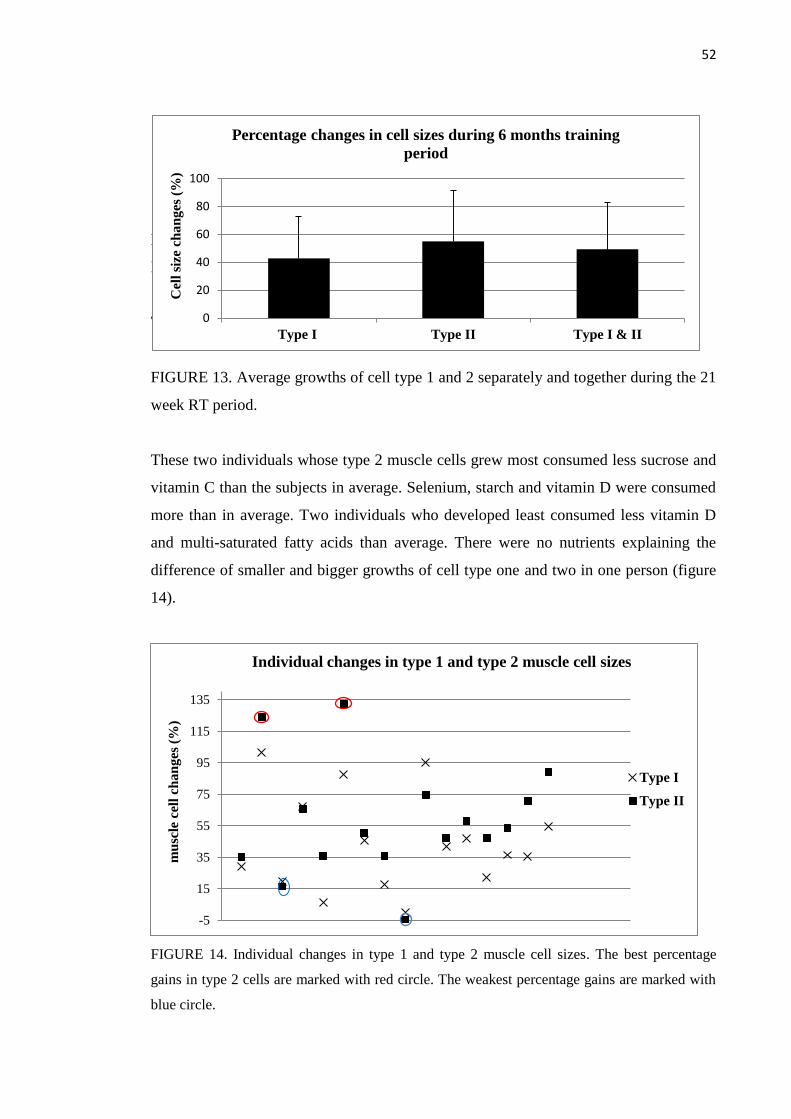
52
F
E
T
FIGURE 13. Average growths of cell type 1 and 2 separately and together during the 21
week RT period.
These two individuals whose type 2 muscle cells grew most consumed less sucrose and
vitamin C than the subjects in average. Selenium, starch and vitamin D were consumed
more than in average. Two individuals who developed least consumed less vitamin D
and multi-saturated fatty acids than average. There were no nutrients explaining the
difference of smaller and bigger growths of cell type one and two in one person (figure
14).
FIGURE 14. Individual changes in type 1 and type 2 muscle cell sizes. The best percentage
gains in type 2 cells are marked with red circle. The weakest percentage gains are marked with
blue circle.
-5
15
35
55
75
95
115
135
mu
scle
cel
l ch
an
ges
(%
)
Individual changes in type 1 and type 2 muscle cell sizes
Type I
Type II
0
20
40
60
80
100
Type I Type II Type I & II
Cel
l si
ze c
ha
ng
es (
%)
Percentage changes in cell sizes during 6 months training
period
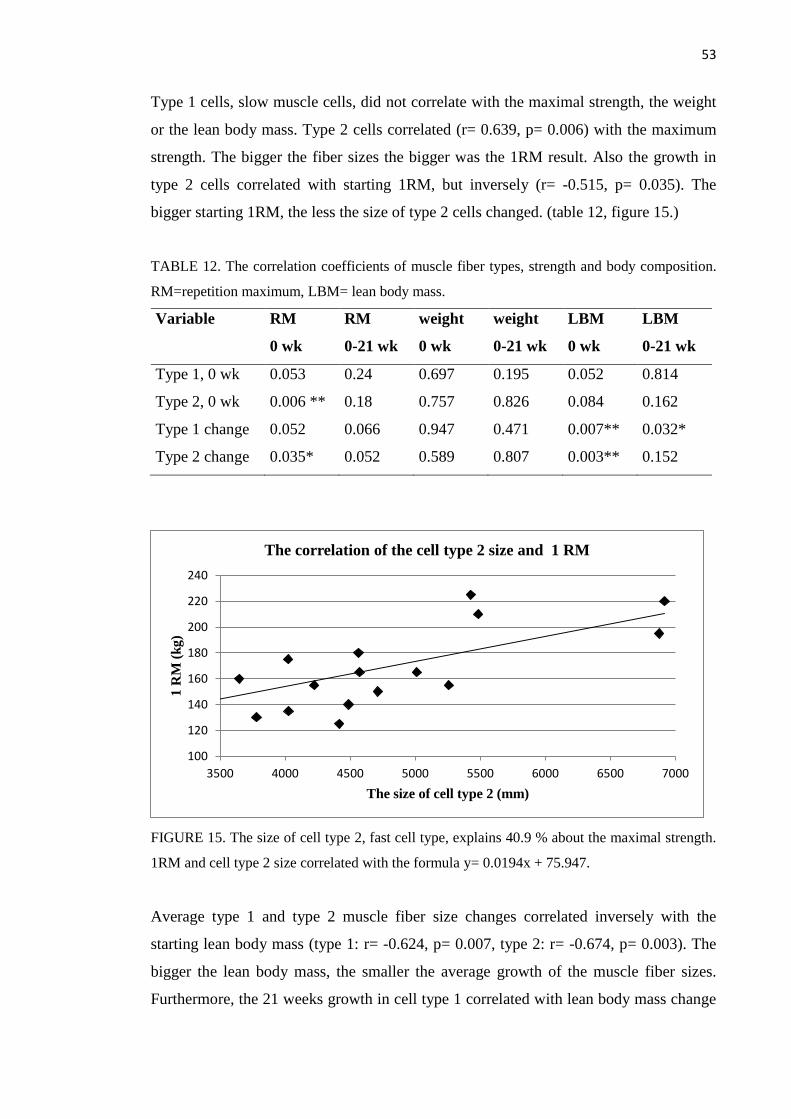
53
Type 1 cells, slow muscle cells, did not correlate with the maximal strength, the weight
or the lean body mass. Type 2 cells correlated (r= 0.639, p= 0.006) with the maximum
strength. The bigger the fiber sizes the bigger was the 1RM result. Also the growth in
type 2 cells correlated with starting 1RM, but inversely (r= -0.515, p= 0.035). The
bigger starting 1RM, the less the size of type 2 cells changed. (table 12, figure 15.)
TABLE 12. The correlation coefficients of muscle fiber types, strength and body composition.
RM=repetition maximum, LBM= lean body mass.
Variable RM RM weight weight LBM LBM
0 wk 0-21 wk 0 wk 0-21 wk 0 wk 0-21 wk
Type 1, 0 wk 0.053 0.24 0.697 0.195 0.052 0.814
Type 2, 0 wk 0.006 ** 0.18 0.757 0.826 0.084 0.162
Type 1 change 0.052 0.066 0.947 0.471 0.007** 0.032*
Type 2 change 0.035* 0.052 0.589 0.807 0.003** 0.152
FIGURE 15. The size of cell type 2, fast cell type, explains 40.9 % about the maximal strength.
1RM and cell type 2 size correlated with the formula y= 0.0194x + 75.947.
Average type 1 and type 2 muscle fiber size changes correlated inversely with the
starting lean body mass (type 1: r= -0.624, p= 0.007, type 2: r= -0.674, p= 0.003). The
bigger the lean body mass, the smaller the average growth of the muscle fiber sizes.
Furthermore, the 21 weeks growth in cell type 1 correlated with lean body mass change
100
120
140
160
180
200
220
240
3500 4000 4500 5000 5500 6000 6500 7000
1 R
M (
kg)
The size of cell type 2 (mm)
The correlation of the cell type 2 size and 1 RM

54
(r= 0.521, p= 0.032). The more lean body mass grew the bigger were the growth of the
type 1 muscle fiber sizes. (table 12, figure 16, figure 17.)
FIGURE 16. LBM (lean body mass) explains 38.8 % about the muscle fiber size growth of cell
type 1. LBM and Cell type 1 size changes correlated with the formula y=-0.183x+68.012.
FIGURE 17. LBM explains 45.1 % about the muscle fiber size growth of cell type 2. LBM and
Cell type 2 size changes correlated with the formula y=-0.0961x+68.67.
50,0
55,0
60,0
65,0
70,0
75,0
-5 15 35 55 75 95
LB
M (
kg
)
The change of the size of cell type 1 (%)
The correlation of the growth of the cell type 1 and the LBM
50,0
55,0
60,0
65,0
70,0
75,0
-5 15 35 55 75 95 115 135
LB
M (
kg)
The change of the size of the cell type 2 (%)
The correlation of the growth of the cell type 2 and the LBM
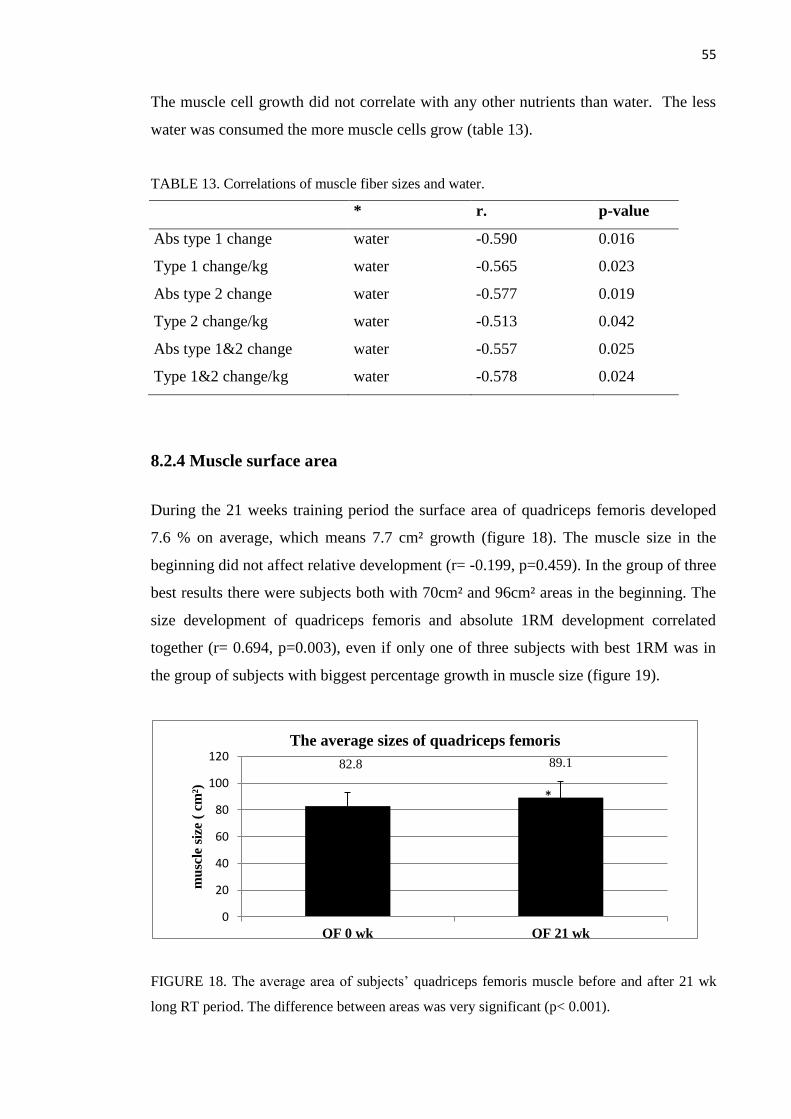
55
The muscle cell growth did not correlate with any other nutrients than water. The less
water was consumed the more muscle cells grow (table 13).
TABLE 13. Correlations of muscle fiber sizes and water.
* r. p-value
Abs type 1 change water -0.590 0.016
Type 1 change/kg water -0.565 0.023
Abs type 2 change water -0.577 0.019
Type 2 change/kg water -0.513 0.042
Abs type 1&2 change water -0.557 0.025
Type 1&2 change/kg water -0.578 0.024
8.2.4 Muscle surface area
During the 21 weeks training period the surface area of quadriceps femoris developed
7.6 % on average, which means 7.7 cm² growth (figure 18). The muscle size in the
beginning did not affect relative development (r= -0.199, p=0.459). In the group of three
best results there were subjects both with 70cm² and 96cm² areas in the beginning. The
size development of quadriceps femoris and absolute 1RM development correlated
together (r= 0.694, p=0.003), even if only one of three subjects with best 1RM was in
the group of subjects with biggest percentage growth in muscle size (figure 19).
FIGURE 18. The average area of subjects’ quadriceps femoris muscle before and after 21 wk
long RT period. The difference between areas was very significant (p< 0.001).
82.8 89.1
0
20
40
60
80
100
120
QF 0 wk QF 21 wk
mu
scle
siz
e (
cm²)
The average sizes of quadriceps femoris
*
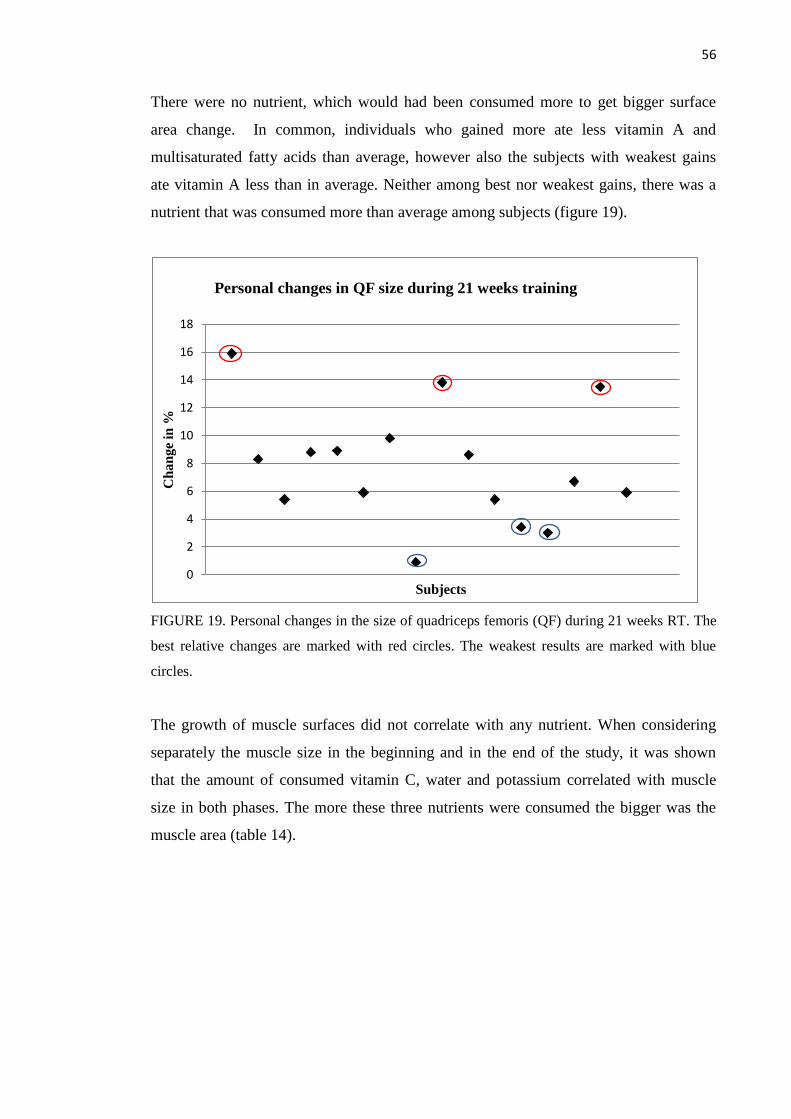
56
There were no nutrient, which would had been consumed more to get bigger surface
area change. In common, individuals who gained more ate less vitamin A and
multisaturated fatty acids than average, however also the subjects with weakest gains
ate vitamin A less than in average. Neither among best nor weakest gains, there was a
nutrient that was consumed more than average among subjects (figure 19).
FIGURE 19. Personal changes in the size of quadriceps femoris (QF) during 21 weeks RT. The
best relative changes are marked with red circles. The weakest results are marked with blue
circles.
The growth of muscle surfaces did not correlate with any nutrient. When considering
separately the muscle size in the beginning and in the end of the study, it was shown
that the amount of consumed vitamin C, water and potassium correlated with muscle
size in both phases. The more these three nutrients were consumed the bigger was the
muscle area (table 14).
0
2
4
6
8
10
12
14
16
18
Ch
an
ge
in %
Subjects
Personal changes in QF size during 21 weeks training

57
TABLE 14. The correlation of nutrients and the quadriceps femoris surface area in the
beginning and in the end of the study.
0wk
21 wk
r p-value
r p-value
** Vitamin C 0.608 p= 0.010
-
* Water 0.517 p= 0.034
Water 0.587 p=0.013
Potassium 0.532 p= 0.028
Potassium 0.597 p=0.011
Vitamin C 0.552 p=0.022
8.3 Acute reactions of resistance training
The normal circumstance levels or rises of hormones measured in this study did not
correlate with 1 RM results or muscle size.
8.3.1 Testosterone
There were no significant rise in testosterone levels after acute exercise bout (pre-post,
p=0.329). Instead the decrease of testosterone levels was significant (post 15-post 30,
p= 0.022) (figure 20). The higher the testosterone level was before muscle test the
higher the acute reactions were after exercise. The levels before and after measurement
correlated very significantly (pre-post r= 0.812, p<0.001). Immediate recovery of
testosterone levels did not follow the same trend; however levels after 15 and 30
minutes correlated again significantly (post15’-post30’ r= 0.751, p<0.001, n=22).

58
FIGURE 20. Acute testosterone levels before the exercise, right after the acute exercise bout,
after 15 minutes of rest and after 30 minutes of rest. ”*” means statistically significant change
between marked result and previous one. n= 22
Testosterone levels did not correlate with any other nutrient than vitamin D. The higher
the consumption of vitamin D was, the smaller the testosterone levels were in normal
circumstances before acute RT (r=-0.475, p= 0.026). Vitamin D did not have an effect
on testosterone levels after exercise.
8.3.2 SHBG
Sex hormone binding globulin (SHBG), levels rose very significantly after the acute
exercise bout (p<0.001). Still after 15 minutes the level of SHBG was statistically high
compared to the normal circumstances (p= 0.042). After 30 minutes no statistical
differences existed any more. The decrease of levels was constant all the way until 30
minutes. The SHBG levels decreased significantly during first 15 minutes (p<0.001)
and the decrease continued during the next 15 minutes being significant again (p=0.001)
compared to previous measurement point (figure 21).
Sex hormone binding globulin levels correlated very strongly before and after acute
exercise bout and also during recovery phase (pre-post r= 0.988, p= 0.000; post-post15’
r= 0.992, p= 0.000; post15’-post 30’ r= 0.995, p= 0.000, n=22). None of the nutrients
interrelated with SHBG levels before or after exercise.
pre post post 15' post 30'
14
15
16
17
18
19
20
nmol/l Testosterone levels after acute exercise bout
*

59
FIGURE 21. Acute SHBG levels before the exercise, right after acute exercise bout, after 15
minutes rest and after 30 minutes rest.” #” means statistically significant change between
marked result and normal circumstances (pre). ”*” means statistically significant change
between marked result and previous one. n= 22
8.3.3 Cortisol
Cortisol levels did not have a significant difference before and after acute exercise bout
(p=0.944). The levels varied a lot between the subjects. Almost all the subjects had
smaller cortisol levels after than before the exercise: Contrariwise few subjects reacted
to exercise with a very high rose in levels. 15 minutes after the exercise followed a
significant rose in cortisol levels (p= 0.047) (figure 22).
FIGURE 22. Acute cortisol levels before the exercise, right after acute exercise bout, after 15
minutes rest and after 30 minutes rest. ”*” means statistically significant change between
marked result and previous one. n= 12.
30
35
40
45
50
55
60
65
nmol/l SHBG levels after acute exercise bout
*
pre post post 15' post 30'
#
*
#
400
420
440
460
480
500
520
540
560
580
600
nmol/l
Cortisol levels after acute exercise bout
pre post post 15' post 30'
*

60
Cortisol levels of normal state did not correlate with the cortisol levels after heavy acute
exercise bout. But the rises of cortisol levels during recovery phase correlated
significantly (post-post15’ r= 0.605 p= 0.049; post15’-post30’ r=0.840 p=0.005).
Cortisol levels right after exercise bout correlated inversely with cholesterol levels. The
higher the consumption of cholesterol the smaller the increase of cortisol level (r =-
0.747, p=0.008). Also starch and monounsaturated fat correlated with cortisol levels,
and again contrariwise (r=-0.614, p= 0.045; r= -0.612, p= 0.045).
8.3.4. Growth hormone
Growth hormone levels rose significantly continuously since 30 minutes after the acute
exercise bout (figure 23). The difference between the level before and after the exercise
just exceeded the limit of significance (p=0.049). The next two phases were already
more significant (pre-post15, p= 0.005; pre-post30, p=0.01). Growth hormone levels did
not correlate with each other in any phase of measurement. None of the nutrients had
any effects on hormone levels either.
FIGURE 23. Acute growth hormone levels before the exercise, right after acute exercise bout,
after 15 minutes rest and after 30 minutes rest. .” #” means statistically significant change
between marked result and normal circumstances (pre). n= 8
GH was the only hormone that correlated with the hormone level rises of the other
hormones. The rises are calculated as percentage amount to the normal circumstances.
0
5
10
15
20
25
30
35
40
45
50
mU/l
Growth hormone levels after acute exercise bout
pre post post 15' post 30'
# #
#
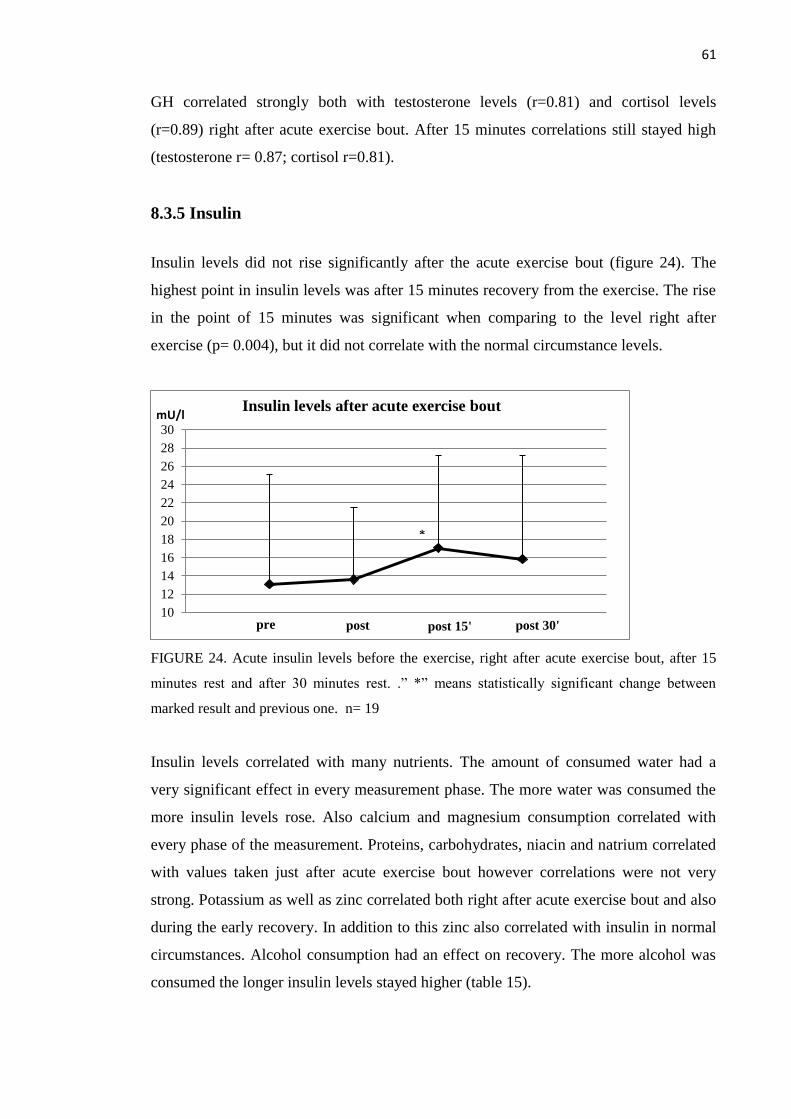
61
GH correlated strongly both with testosterone levels (r=0.81) and cortisol levels
(r=0.89) right after acute exercise bout. After 15 minutes correlations still stayed high
(testosterone r= 0.87; cortisol r=0.81).
8.3.5 Insulin
Insulin levels did not rise significantly after the acute exercise bout (figure 24). The
highest point in insulin levels was after 15 minutes recovery from the exercise. The rise
in the point of 15 minutes was significant when comparing to the level right after
exercise (p= 0.004), but it did not correlate with the normal circumstance levels.
FIGURE 24. Acute insulin levels before the exercise, right after acute exercise bout, after 15
minutes rest and after 30 minutes rest. .” *” means statistically significant change between
marked result and previous one. n= 19
Insulin levels correlated with many nutrients. The amount of consumed water had a
very significant effect in every measurement phase. The more water was consumed the
more insulin levels rose. Also calcium and magnesium consumption correlated with
every phase of the measurement. Proteins, carbohydrates, niacin and natrium correlated
with values taken just after acute exercise bout however correlations were not very
strong. Potassium as well as zinc correlated both right after acute exercise bout and also
during the early recovery. In addition to this zinc also correlated with insulin in normal
circumstances. Alcohol consumption had an effect on recovery. The more alcohol was
consumed the longer insulin levels stayed higher (table 15).
10
12
14
16
18
20
22
24
26
28
30mU/l
Insulin levels after acute exercise bout
pre post post 15' post 30'
*
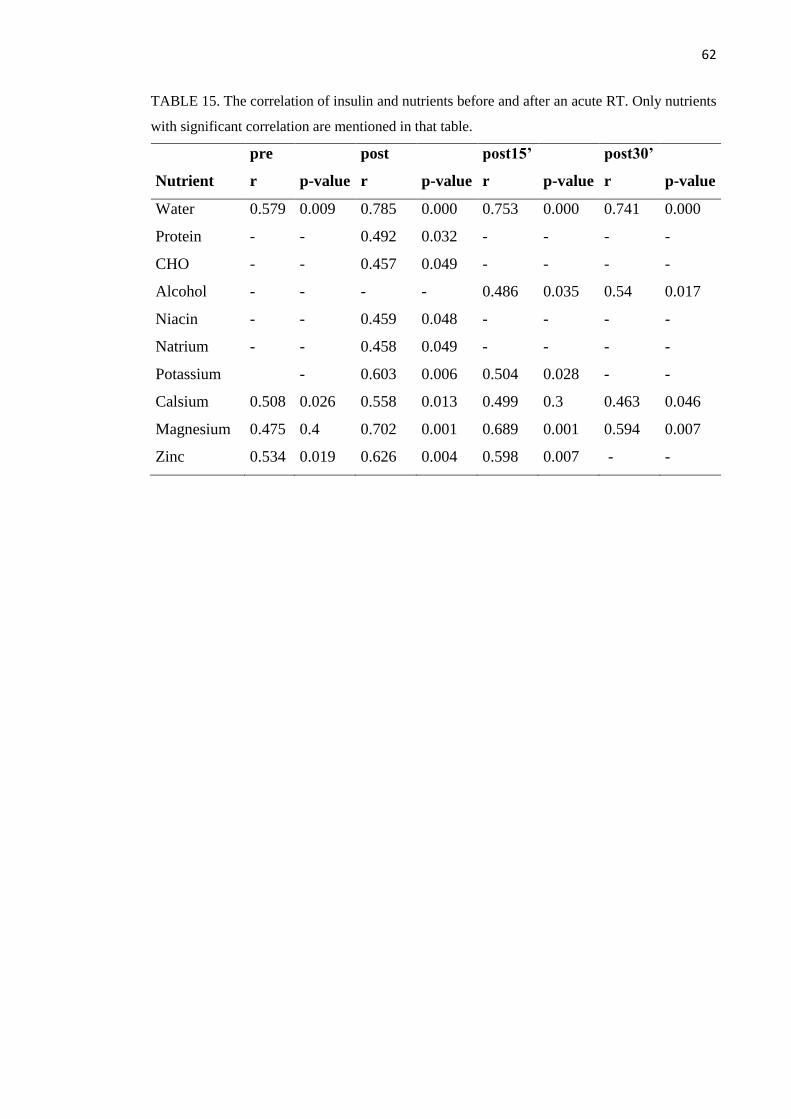
62
TABLE 15. The correlation of insulin and nutrients before and after an acute RT. Only nutrients
with significant correlation are mentioned in that table.
pre post post15’
post30’
Nutrient r p-value r p-value r p-value r p-value
Water 0.579 0.009 0.785 0.000 0.753 0.000 0.741 0.000
Protein - - 0.492 0.032 - - - -
CHO - - 0.457 0.049 - - - -
Alcohol - - - - 0.486 0.035 0.54 0.017
Niacin - - 0.459 0.048 - - - -
Natrium - - 0.458 0.049 - - - -
Potassium - 0.603 0.006 0.504 0.028 - -
Calsium 0.508 0.026 0.558 0.013 0.499 0.3 0.463 0.046
Magnesium 0.475 0.4 0.702 0.001 0.689 0.001 0.594 0.007
Zinc 0.534 0.019 0.626 0.004 0.598 0.007 - -

63
9 DISCUSSION
The strength and muscle size increased as expected during the 21 weeks training period.
The eating habits of the subjects mostly followed the general nutrition recommendations
in Finland. The consumption of protein (g/kg/d) increased significantly from the start to
the end of the study. In many categories nutrients did not have any effects on the
responses to RT. Vitamin D, water and selenium were the nutrients that most often
correlated with the RT responses. D-vitamin and selenium were the nutrients that
individuals with the best gains in one repetition maximum and muscle fiber size growth
consumed more than an average subject. The individuals with the smallest gains
consumed less vitamin D. Vitamin D also correlated positively with the testosterone
levels. The more water was consumed the more percentage fat and insulin levels
increased.
The meaning of nutritional habits in gaining results
There were no statistical changes in nutrition diaries. Therefore diaries written in any
phase of the study could be used for comparison. Protein was the only nutrient, the
amount of which (g/kg) changed during the study. Because protein consumption rose
evenly in every subject’s eating habits, it was not an obstacle to use the mean value of
one to three nutrition diaries.
The rise in protein levels might be due to awareness in healthy nutritional habits. The
subjects might have consciously changed their eating habits. They might have been
more interested in searching information about nutrients than earlier when knowing that
the aim of the 21 weeks practicing was to gain strength. About the importance of
proteins is written in media more than about the importance of other nutrients, so adding
the amount of protein is a natural choice for a beginner. Some persons have a habit to
think that eating only most important nutrients will gain the best results. With nutrition
“much is better”- phrase does not work. These wrong thoughts lead to nutrient
deficiencies: There are almost 50 essential nutrients that can be classified to protective
nutrients and energy nutrients. Protective nutrients are nutrients, lack of which causes
deficiency disease typical for them. These are proteins, vitamins and minerals. Energy
nutrients are carbohydrates, fats and proteins. Even if nutrients can partly change to
64
other nutrients or replace and supplement each other, every nutrient has its own
specialties and that is why it is important to get enough all nutrients and in good
balance. (Peltosaari et al. 2002, 9.) Protein consumption of the subjects (mean: 1.4-
1.6g/kg/day) was in normal limits, clearly more than the minimum general
recommendation 0.8g/kg/day. On the contrary, the use of carbohydrates was a bit small
vs. general recommendations (3.7-4.0g/kg/day vs. 5-6g/kg/day). Carbohydrate fuels the
body with the right kind of energy for heavy workouts and saves amino acids for muscle
building and recovery. Specific type 2 muscle fiber glycogen depletion may limit
performance during high volume workouts. The consumption of carbohydrates
increases when the duration of exercise increases. A little amount of carbohydrates
causes small muscle glycogen stores, which deteriorates strength abilities and makes
high-intensity practicing difficult to continue. A partial deficit of glycogen stores
already causes the use of amino acids for rebuilding of glucose and the use of amino
acids as energy. And even if some studies say that the meaning of carbohydrates for
strength athletes is not the biggest thing, there is no reason to limit the use, in order that
the actions mentioned before don't suffer (Haff et al. 2003). Every individual just has to
find the most suitable way to eat. (Hulmi 2013a.)
When adding the amount of proteins, should also be careful if water needs to be
consumed more. A huge consumption of protein may cause water balance problems.
For example metabolism of 400 kJ (95 kcal) of protein requires 350g water. The same
amount of fat or carbohydrates consumes only 50 grams. If the amount of protein is
more than 15 % from energy, the amount of water consumed especially needs to be
taken care. (Peltosaari et al. 2002, 83, 88.)
The smaller the amount of energy is, the higher the relative amount of protein needs to
be. The breakdown of muscle proteins and muscle damages are the higher the less
energy and carbohydrates are consumed combined in exercising. (Niemi 2006, 30.) The
breakdown of muscle protein and muscle damages are the highest when the training
program is changed harder, when new exercising methods are used, when is practiced
again after the break or when practicing is started for the first time. In these cases the
need of protein to maintain the positive nitrogen balance increases. Although, beginners
work with lower power and amounts of repetitions are quite small, so the need of
protein may not crucially differ from experienced athletes. Protein appears to have the
65
greatest effect on promoting satiety, whereas the relative satiety value of fats and
carbohydrates is less clear. The energy density of a meal or food, defined as an energy
content of a given weight of the food (kcal/g), has a strong influence on both satiation
and satiety. The lower the energy density of the meal or food, the greater the satiety that
it produces. (Gallaher 2008.)
The consumed protein supplements are in form of liquids, powders and pills of purified
protein. These supplements often contain proteins “predigested” to simple amino acids
through chemical action in laboratory. Advocates believe that simple amino acid
molecules are absorbed more readily. This does not occur. The healthy small intestine
readily absorbs amino acids when they exist in more complex di- and tripeptide forms
rather than in simple amino acid form. A concentrated amino acid solution draws water
into the intestine. This often precipitates intestinal irritation, cramping, and diarrhea.
(McArdle 2007, 35.)
In many cases also micronutrients work together. One example is that when the ratio
of micronutrients relative to each other is not in balance, it might lead for example to
cramps. In that case it would mean there is too much potassium in nutrition
compared with lime and magnesium. Also the lack of vitamins B1 and B2 can affect
cramps. (Marjanen & Soini 2007, 35). Subjects did not suffer from the lack of any of
the nutrients. In contrast the amount of niacin and selenium was double, the amount
of vitamin C a bit less than double, the amount of vitamin B12 was triple and the
amount of sodium was even 15 times higher than needed. It is said that Finnish
people use salt a lot and this research supports that claim. Sodium leads to increase in
blood pressure and further the risk of arterial disease based on some, but not all
studies (Taylor et al. 2013). Vitamin B12 is obtained from the same food that
includes a lot of protein (milk, meat, fish) so it is very natural that also the amount of
vitamin B12 was risen. (Niemi 2006, 64.)
Power lifters tend to have “overeating days”, because it is thought to be a useful method
for gaining more muscle mass. The theory is to destabilize the hormone balance by huge
amount of dietary fat. It has not been possible to give statistically significant results for
that thought. (Ilander & Mursu 2008, 379; Volek et al. 2001.) Like mentioned before,
fat consumption increases HDL amount. The limited use of saturated fatty acids

66
decreases LDL. However, the limited use of saturated fatty acids at the same time with
increased amount of CHO decreases also HDL. From the point of view if the total
cholesterol/HDL- ratio, increasing the amount of CHO causes the most unfavorable
effect, even worse than saturated fat. (Laatikainen 2011.)
Anthropometry
Like Thalacker-Mercer (2009) reported that the average body weight did not change
during the 16 week of RT and it also did not change in this study. (Thalacker-Mercer
2009). Percentage fat varied a lot instead. That might be the result of eating habits. This
study reported that the more water, carbohydrates, vitamin C, potassium and
magnesium were consumed the bigger was the increase of percentage fat. Especially the
amount of water and carbohydrates affected. Protein did not affect on the percentage fat,
however it was the only nutrient, amount of which changed statistically during the
training period. This supports the theory, that when adding the percentage amount of
protein to the diet, it does not automatically mean, that it is healthier and good-caloric
when the subjects already consume relatively large amount of protein. (Peltosaari et al.
2002, 88.)
In this study it was not separated, where in the body lean mass or fat increased or
decreased most. The development was just dealt with as whole. Thalacker-Mercer
reported that in his study most of the lean mass increases were in the thigh
compartment, because the training regimen focused on knee and hip extensor muscle
groups (Thalacker-Mercer 2009). It is natural that only these muscles develop that are
exercised, but about fat accumulation there are conflicting reports. It should be studied
more why people lose fat from totally different body parts compared to each other
despite the movements they do. In this study there were no correlation between any
nutrients and lean body mass change. In Riechman’s study there was a greater increase
in lean mass with higher dietary cholesterol intake. (Riechman et al 2007.) Maybe
protein products include cholesterol and cholesterol correlates with lean body mass
through protein or the effect of cholesterol as a precursor of testosterone, but those are
only speculations. Vitamin D that has many positive effects on health is showed to
decrease when body mass increases. For every 1kg/m2
increase in BMI, it appears that
serum vitamin D is reduced 1.15% (Vimaleswaran et al. 2013).

67
In this study other daily calorie expenditure was not asked. Activities of daily living
(everything we do that is not sleeping, eating or exercising) may help explain why some
people can maintain their body weight, while others gain weight (Monorem & Thopson
2008). Also times of protein ingestion were not reported. It is studied that
approximately 10g of EAAs during a meal stimulates muscle protein synthesis. It has
been demonstrated that a plateauing of muscle contractile protein synthesis follows
approximately these 10 grams of EAAs, meaning that intake of EAA above this
threshold does not significantly contribute to the accretion of skeletal muscle (Hulmi et
al. 2010). Instead of that the amount of times the 10 g EAA threshold is reached is
meaningful. It is inversely related to the percent central abdominal fat. (Cuthbertson et
al. 2005.) However, not all studies support the frequent eating, even in contrast (Areta et
al. 2013).
1 RM and muscle fiber size
The development in strength abilities was researched calculating the new record relative
to previous record measurement. In that calculating method it is not possible to keep
development in the same level for a long time, because the previous “zero level” is
every time higher making the relative development weaker time after time (13.3% vs.
5.7%), even if the absolute amount of gained strength were the same. Anyway in this
study also the development in absolute kilograms did change less towards to the end of
the study (21.4kg vs. 10.1 kg.) Development is faster in the beginning because even if
muscle mass does not develop any faster than in the end nervous system learns how to
recruit all the muscle cells needed for one attempt (Campbell et al. 1999).
Different starting levels in force production make it difficult to choose, how to really
compare development to get the real results. In this study the absolute 1RM
development is compared relative to starting measurement result. The problem in this
method is that if one person starts from lower level than the other one, the first person’s
relative development is automatically better than the one’s starting from the higher
level. This problem can be compared to the example mentioned above about faster
development in the beginning compared to the end; If one person starts from 130 kg
ending up to 185 kg and the other one starting from 225 kg ending up to 250 kg, the
relative development difference is 42.3% vs. 11.1%. It indicates that the first person
would have been almost four times better by developing, even if the real kilogram

68
difference is just 30 kg (55kg vs. 25kg), what means about two times better instead of
four. One could say that the best way to compare would be just the absolute kilograms
between starting and final 1 RM measurement, ignoring the starting level. This would
be possible, if the persons were the same size. 1RM goes together with the muscle size
and the smaller person has not the same possibility to gain the same size of muscles
than the bigger person, because the area for the muscles in the body is smaller. (Janssen
et al. 2004a; Janssen et al. 2004b.) That was a reason why I chose to compare absolute
kilograms compared to the body weight in kilograms. In fact two best and two worst
results were the same persons in both methods anyway.
When a person eats a lot, improvement in muscle strength relative to the body weight
may stay lower. In this study strength gain was measured both with and without body
weight relation. Persons eating less, that means in most cases also lightest persons of the
group, got better results in both measurements. This was actually not a surprise, when
comparing 1RM relative to previous result without body weight relation. It is normal
that lightest persons are the ones who start with smallest results. Like reported before, it
is for these persons easier to get higher percentage development than for the bigger
persons with heavier starting results. When 1RM gain in kilograms was divided by the
body weight, the subjects were more on the same line. In that case the same persons got
the best gains, what means that also other things than size has the effect of their good
results. Anyhow, it is difficult to find a way to evaluate strength gain results among
people with different body sizes and starting strengths. Maybe comparing the 1RM
gains to muscle mass results got from inbody-measurement would have been one
effective way for measuring.
The person who had the best gain ate more vitamin D and selenium compared to
average values. The second best consumed more lactose, dietary fiber, calcium, vitamin
B2 and vitamin C. The persons with the smallest gains ate all nutrients over averages.
Studies have both shown and not shown a correlation between D-vitamin and muscle
strength. For example Grimaldi et al. 2013 showed that vitamin D was significantly
associated with arm and leg muscle strength when controlling age and gender (Grimaldi
et al. 2013). Knutsen et al. 2014 did not find any correlation between D-vitamin and
strength gain measured by the jump test, handgrip test or chair-rising test (Knutsen et al.
2014). Protein was not in the list of most consumed nutrients. Some individuals seeking

69
hypertrophy may benefit from higher protein intake during RT whereas others may not.
Maybe each individual’s propensity for myofiber hypertrophy in the first months of
training is determined by factors independent of macronutrient intake. (Bamman et al.
2007; Kim et al. 2007).
This study gave contradictory results about water: the less water was consumed the
more muscle cells grew. The study also showed that the more water was consumed the
better was the 1RM result. The size of muscle cells and 1RM result should correlate, so
this result was against expectations.
In this study type 1 cells, slow muscle cells did not correlate with maximal strength,
type 2 cells did: The bigger the type 2 muscle fiber sizes the bigger was the 1RM result.
But the bigger starting 1RM and lean body mass, the less muscle fiber sizes changed.
This supports the theory that the less gym practicing is done, the easier it is to gain
results faster. Muscle mass growth happens fast among beginners, because of technique
learning and better innervation and partly because of muscle cell growth. The growth
can be noted both in fast and slow muscle cells, though the growth is faster in fast
muscle cells. Especially exercising affects type 2x cells. In this study any other sport
activities than supervised gym practices were not taken into consideration. Aerobic
training is said to weaken muscle development. This happens because of the change of
2a cells to type 1 cells by aerobic training instead of new born type 1 cells. That means
that fast power producing muscle cells change to aerobic endurance muscle cells.
(Ilander & Mursu 2008, 383; Prasartwuth ym. 2005.)
The more person has type 1 muscle cells the likely the person has less fat than the
person with plenty of type 2 muscle cells. It is also easier to lose weight for the person
with many type 1 cells. (Tanner et al. 2001). It could have been studied the correlation
of cell type 1 and percentage fat. This study already reported that the more lean body
mass grew the bigger were the growth of the type 1 muscle fiber sizes but because this
was not a relative number to body fat we cannot say if the difference in body shape
happened. Nutrients did not explain the difference in muscle cell growths between
subjects. Some other factors are affecting.

70
The size development of quadriceps femoris and absolute 1RM development correlated
together (r= 0.694, p=0.003), even if only one of three subjects with best 1RM was in
the group of subjects with biggest percentage growth in muscle size. There was no
nutrient that would have been affecting to the results. The muscle size in the beginning
did not affect relative development (r= -0.199, p=0.459). When considering separately
the muscle size in the beginning and in the end of the study, it was shown that the
amount of consumed vitamin C, water and potassium correlated with muscle size in
both phases. The more these three nutrients were consumed the bigger was the muscle
area.
Hormones
Subjects had different hormonal levels in normal circumstances and these levels
correlated to the levels after RT, except GH and insulin. The higher was the hormone
level before RT the higher were the acute reactions after muscle stress. It is important to
note that hormone levels measured after an acute bout of exercise do not always occur
in parallel with chronic adaptations. That is why acute hormone levels are not usually
predictive of long-term hypertrophic responses to regular RT. (Coffey et al. 2006;
Schroeder et al. 2013; West & Phillips 2012.) Gender, age and training status influence
to the release of the hormones (Kraemer & Ratamess 2005). It has been estimated that
genetic differences can account for approximately half of the variation in athletic
performance (Crewther et al. 2011). In this study hormone levels did not correlate with
each other as much as could have thought according to previous studies. Only rises in
GH correlated with testosterone and cortisol. Also none of the hormone levels in the
normal circumstances or the levels after RT correlated with 1RM or muscle size in this
study.
Testosterone. Previous studies said that testosterone correlates negatively with fat and
protein consumption but these claims could not be proved in this study. Only the
consumption of D-vitamin correlated with testosterone levels. It correlated negatively
and only in normal circumstances. D-vitamin also correlated with 1RM and muscle size,
but positively. This is a bit contradictory, because 1RM correlates with muscle mass and
muscle mass should correlate with testosterone levels, what means D-vitamin should
have correlated with all of these. Testosterone correlated with growth hormone release like
71
mentioned it literature. IGF-1 was not measured in this study, so correlation with that hormone
is not known.
Insulin. Insulin is an anabolic hormone that responded in this study to many nutrients.
The anabolic state is easy to keep high when consuming carbohydrates and proteins
regularly. On the other side that might prevent the use of fat as energy, what means that
fat is stored in the body. If the aim is to lose percentage fat of the body, the limitation of
insulin excretion might help. (Ilander & Mursu 2008, 380.) In this study insulin did not
correlate with percentage fat. Alcohol consumption had an effect on recovery levels of
insulin. The more alcohol was consumed the longer insulin levels stayed higher. The
subjects did not consume alcohol one day before measurements. The amount of
consumed water had a very significant effect in every measurement phase, what is
strange, because water has no calories to affect with insulin. Water has to have a
secondary influence through other food containing water. Insulin levels did not rise
right after exercising like other hormone levels did.
GH. Studies said that both carbohydrate-rich and fat-rich meals decrease GH levels. In
this study there were no connection between any nutrient and GH. Murine studies
indicate that the effects of GH on muscle function and mass are dependent on insulin
like growth factor 1 (IGF-1) (Kim et al. 2005). In this study IGF-1 was not measured.
As the regulation of GH becomes clearer, it is possible that a shared mechanism such as
neural drive, muscle activation or metabolic stress that could affect both GH and muscle
adaptation may explain the association of GH with hypertrophy. GH is known to have
gluconeogenic action as well as liberate substrates such as fatty acids and amino acids.
It is unknown whether exercise-induced changes in GH could also be modulating these
energy-releasing and tissue-remodelling processes leading to an improved phenotype
with training. (Inagaki et al 2011; Sakharova et al 2008; West & Phillips 2012).GH was
the only hormone, which amount in blood continued rising until 30 minutes after
exercising.
Cortisol. Even if cortisol is catabolic hormone, there is no need to be afraid of it. It has
important tasks to do during the muscle work. Furthermore, muscle work deletes
negative influences of cortisol. Hormonal environment can be manipulated toward a
profile favorable for anabolism by using post-exercise carbohydrate-protein

72
supplementation. In that way hormones have a greater effect on net protein synthesis
immediately after RT. (Biolo et al 1999.) These probably are the reasons for the
effectiveness of RT rather than an attenuation of cortisol release (Williams et al. 2002).
In rest quantity of cortisol is worth keeping an eye on by diet.
Cortisol levels varied a lot between subjects. That might be due to personal
psychological reactions and nutritional habits. Excitement and stress increase the
amount of cortisol and adrenalin as well as increasing protein breakdown. (Peltosaari,
Raukola & Partanen 2002, 85.) The higher the consumption of cholesterol the smaller
the increase of cortisol level (r=- 0.747, p=0.008). Also starch and monounsaturated
fatty acids correlated inverse with cortisol levels (r=-0.614, p= 0.045; r= -0.612, p=
0.045). Like previous studies said nutrition affect to the rise of cortisol.
Future studies
Food timing. In this study the timing of nutrition was not paid attention to. The subjects
mentioned the point of time in their diaries, but these markings were not analyzed.
Anyway the timing might be important to maximize the anabolic response (Tipton,
Rasmussen, Miller, Wolf, Owens-Stovall, Petrini & Wolfe 2001), although some have
suggested that the timing effect has been overrated (Schoenfield et al. 2013).
Numerous studies say that the best time to ingest extra protein is just before or just after
a strength training session (Cribb & Heyes 2006; Elliot et al. 2006; Josse et al. 2010;
Poole et al. 2010). One reason for the timing effect may be increased skeletal muscle
circulation. It makes maximal nutrient transport possible during and for a short period
following exercise. (Levenhagen et al. 2001; Tipton et al. 2001.) In the study of
Anderson et al. (2005) after 10 weeks of training, the study participants who took the
supplement pre- and post-workout gained significantly more lean weight than those who
ingested the supplement morning and evening (+2.8 kg vs. 1.5 kg). Also bench press
and squat strength results were better (+12.2 kg vs. 9.0 kg ; + 20.4 kg vs. 16.1 kg). Also
increases in type 2a muscle fiber cross sectional area and contractile protein content
were higher. (Anderson et al. 2005.)

73
The best effect is when consuming protein and carbohydrates both before and after the
training (Andersen ym. 2005). Ingesting carbohydrates before or during a RT session
will increase the total amount of work that is performed during the workout (Kulik et al.
2008). Skeletal muscle glycogen is depleted during RT exercise. When it is depleted,
the intensity and the total work volume are compromised. (Campbell et al.2012). Also
Volek (2004) reported that the consumption of protein and carbohydrate supplement
immediately before exercise resulted in increased amino acid delivery to muscle and
greater net muscle protein synthesis compared with consumption of the supplement at
various times after exercise. This may provide the best anabolic situation for muscle
growth (Volek 2004). About protein it should be noted, that it is recommended to consume it
through the day rather than consuming a single protein-rich meal (Westcott & La Rosa
Loud 2013).
Pre- or post-exercise ingestion of protein or EAA can increase muscle protein synthesis
and result in a positive net protein balance (Tipton et al. 2007; Tang et al. 2009;
Koopman et al. 2005). Optimal recovery includes reducing muscle soreness and muscle
damage after workout. In this context protein ingestion has been reported to have
favorably impact. (Flakoll et al. 2004.) Research also has shown that ingesting protein
before a training session elicits a greater increase in resting energy expenditure 24 hours
after the workout compared to carbohydrate (Hackney et al. 2010.)
It should be noted, that only small percentage of amino acids are oxidized for energy
during exercise. That is far below carbohydrates and fats. (Jeukendurp & Gleeson 2006,
62) Because proteins limited role in oxidation and their ability to improve acute
resistance exercise performance, amino acids should not be ingested before a resistance
exercise bout, with the belief that they will improve the performance of the following
workout. (Campbell et al. 2012). In the future the type of protein could be paid attention
to. The quality of protein consumed after resistance exercise can determine the acute
amplitude of MPS and lean mass gains (Cribb et al. 2006; Hartman et al. 2007; Tang et
al. 2009).
CHO ingestion before exercise may reduce muscle and liver glycogen loss associated
with an acute bout of resistance exercise, and this may be of importance for athletes
involved in multiple training bouts per day (Bird 2010). A single RT session can reduce

74
skeletal muscle glycogen stores from 24% to 40%, depending on the duration and
intensity (Slater & Phillips 2011). If skeletal muscle glycogen is depleted and not
purposefully replenished a subsequent resistance exercise workout will be compromised
(Campbell et al. 2012). Enhanced recovery enables greater training volume and
increased training volume increases muscle hypertrophy (Volek, 2004; Hulmi et al.
2010). CHO ingestion during the exercise bout also may shift the exercise-induced
hormonal milieu toward a profile more favorable for anabolism (Roy et. 1998;
Tarpenning et al. 2001).
Only few studies have investigated the effects of the timing of dietary fat intake. The
reason for this is that RT is an anaerobic activity, relying on the phosphagen system and
carbohydrate oxidation for ATP production. Dietary fat is not the energy to fuel a
resistance exercise bout. (Campbell et al. 2012.)
Preparing meal. The meaning of preparing meal is to grow amino acid, glucose and
insulin levels of blood and keep the level high during the whole exercising time. The
meal should be liquid to be absorbed fast, and to contain fast absorbing proteins and
mainly EAAs. Whey protein and maltodextrin are the best choices. Also carbohydrates
that are absorbed and drained well are recommended. The meal should be eaten not
earlier than 10 minutes before the training. In that way the insulin level does not raise
too high before the training and effect negatively. To maximize muscle gain both
enhancing the building and minimizing the breakdown of muscle protein should be
thought. (Ilander & Mursu 2008, 379-380.)
Recovery meal. After practicing only carbohydrates are not enough, because
carbohydrates do not enhance new proteins to be built effectively and no anabolic effect
exists (Borsheim et al. 2004). Consuming protein, especially EAAs after RT, changes
the muscle protein balance positive (Bird et al. 2006; Nosaka et al. 2006; Power et al.
2009). Added to muscle gain protein recovery drink in long term decreases overtraining
accidents, maintains resistance and decreases muscle soreness. (Flakoll et al. 2004).
EAA concentration alone cannot entirely explain the improved rate of recovery. In the
case of whey protein one explanation may be that whey provides a post-exercise insulin
response such that NPB can be slightly smaller and glycogen resynthesis occurs more
rapidly. (Nosaka et al. 2006; Bird et al. 2006; Power et al. 2009.) Whey effectively
75
stimulates the synthesis of myofibrillar and sarcoplasmic protein fractions in muscle
under resting conditions and in response to resistance exercise (Moore et al. 2009).
Enhanced exercise recovery may be partially also explained by the transcript levels. For
example gene –expression of cyclin-dependent kinase 2 (cdk2), a factor that positively
affects cell proliferation and animal size has been shown to increase in humans after
acute and chronic bouts of resistance exercise, but only when whey protein is ingested
around training times. Compared to that one week of low protein diet decreased several
transcript levels in muscle that relate positively to cell proliferation. At the same time
negatively affecting transcript levels were increased. (Hulmi et al. 2008; Hulmi et al.
2009.) If eaten the preparing meal before the training there is not so hurry to get the
recovery meal after practicing (Ilander & Mursu 2008, 380).
IGH-1. In this study IGF-1, insulin-like growth factor, was not paid attention to. It is
said that other hormones’ function is connected to IGF-1 and that is why it could be
measured in the future studies. IGF-1 is an anabolic hormone that stimulates growth in
almost all tissues. It is responsible for many anabolic effects of GH. IGF-1 is produced
under regulation by GH in the liver. During intense physical training exercised muscles
are the primary producers and majority of circulating IGF-1 is taken up by working
musculature. (Frystyck et al. 2003; Goldspink 2005; Van Loon et al. 2003.) IGF-1 is
similar to insulin. It acts to stimulate protein synthesis, suppress proteolysis and
increases the mean myotube diameter and the number of nuclei per myotube. (Harrige
2007.) The combination of testosterone and GH has been shown to confer a synergistic
effect on muscle IGF-production (Vingren et al. 2010).
The nutrition does not affect IGF-1 levels, but for binding protein 1 (IGFBP-1) it is
meaningful. IGFBP-1 is the most rapid regulator in plasma after meals and may
contribute to glucose regulation by countering the insulin-like, hypoglycemic effects of
free IGF-1. The IGF-I system does not take part in meal-related glucose regulation but
does contribute to glucose disposal during the fasted state. (Volek 2004.)
Decline of circulating IGF-1 levels has been found to correlate with losses of muscle
mass and strength (Hand et al. 2007). This may indicate that there is a threshold for
systemically produced IGF-1. Below that threshold muscle development is
compromised. This need to be researched more, because blood levels of IGF-1 do not

76
always correlate with post-exercise increases in muscle protein synthesis. (Zou et al.
2011.) The research of Spangenburg et al. (2008) indicated that a functional IGF-1 is
not obligatory for muscle growth.
There are some studies supporting that there is a significant association between IGF-1
and those individuals, who respond favorably to hypertrophy-type training (West &
Phillips 2012). It needs to be studied further weather training status influences the
morphological response to acute exercise-induced hormonal elevations. Some
researchers have proposed that post-exercise hormonal fluctuations may be permissive
for untrained individuals but follow a dose-response relationship in those with
considerable training experience. (Tremblay et al. 2004.)
Validity and reliability
First starting measurement was done to minimize variability caused by learning. Always
when possible there were the same measurers making the measurements in order to
avoid differences in the way of measuring. There was more than one attempt to find the
best result in strength measurements. In the leg there was a small tattoo as a mark to
keep the measurement point as same through the study in biopsy measurements.
The blood analysis of this study was collected in the beginning of the training period
and thus does not address how the acute hormone response may have changed during
the training period. West et al. (2009) have anyway reported acute hormone responses
and resting hormone concentrations to be similar in the beginning and at the end of 15
weeks of training. The measurements were done always at the same time of the day to
minimize error factors caused by timing.
In the nutrition diary analyses it is uncertain whether subjects answered honestly about
the amount of food consumed. In many correlations parameters between food and some
other characteristics there were many factors that could not be controlled during the
study. (West & Phillips 2012.) The main thing is that the training program was the same
for every subject, because different exercise programs can result in differential
responses of muscle protein synthesis after resistance exercise. (Burd et al. 2010; Moore
et al. 2005.)
77
10 CONCLUSIONS
The 21 weeks of RT increased 1RM, both type 1 and type 2 muscle fiber size, muscle
surface area, body weight and LBM. The regular RT increased the consumption of
protein. Chronic adaptations of resistance training correlated with some of the
nutritional habits. Many nutrients surprisingly correlated inversely with gains in 1RM.
also the water consumption correlated inversely with muscle fiber size growths. When
subjects were examined individually, the meaning of vitamin D emerged, even if it did
not meet statistical significance. Especially the amount of water and CHO correlated
with percentage fat change. The normal circumstance levels or rises of hormones did
not correlate with chronic adaptations in muscle or with anthropology variables. SHBG
and GH levels rose after the exercise. GH correlated strongly both with testosterone and
cortisol levels right after exercise. Cortisol levels after muscle stress correlated inversely
with cholesterol levels. Many nutrients, especially water, correlated with insulin levels
after exercise. Vitamin D consumption correlated inversely with testosterone levels in
normal circumstances.
In conclusion:
1) If dietary recommendations are met, the individual differences in protein or
carbohydrate consumption do not have major effect on the chronic adaptations in the
muscle. The effect of vitamin D on choric adaptations has to be studied more.
2) Hormonal elevations of insulin, cortisol and testosterone after RE can be affected by
nutrition. Only SHGB and GH levels grow right after acute RE, but they are not
affected by any nutrients. Neither the levels of hormones in normal circumstances or
after exercise do not correlate with chronic adaptations in muscle, so with nutritional
habits cannot be affected to chronic adaptations through hormonal changes.
3) The regular resistance training increases the consumption of protein however the
protein was not associated for bigger chronic developments.

78
4) Nutritional habits have effects on anthropometry. The more relative carbohydrate or
water is consumed the higher was the increase of relative fat.
79
11 REFERENCES
Anderson, L., Tufekovic, G. & Zebis, M. 2005. The effects of resistance training
combined with timed ingestion of protein on muscle fiber size and muscle
strength. Metabolism 54: 151-156.
Areta, J., Burke, L., Ross, M., Camera, D., West, D., Broad, E., Jeacocke, N., Moore,
D., Stellingwerrf, T., Phillips, S., Hawley, J. & Coffey,V. 2013. Timing and
distribution of protein ingestion during prolonged recovery from resistance
exercise alters myofibrillar protein synthesis. The Journal of Physiology 591(9):
2319-31.
Avvakumov, G., Cherkasov, A., Muller, Y. & Hammond, G. 2010. Structural analyses
of sex hormone-binding globulin reveal novel ligands and function. Molecular
and Cellular Endocrinology 316: 13-23.
Bamman, M., Petrella, J., Kim, J., Mayhew, D. & Cross, J. 2007. Cluster analysis tests
the importance of myogenic gene expression during myofiber hypertrophy in
humans. Journal of Applied Physiology 102: 2232-2239.
Beaven, C., Cook, C. & Gill, N. 2008a. Significant strength gains observed in rugby
players after specific resistance exercise protocols based on individual salivary
testosterone responses. The Journal of Strength & Condition Research 22: 419-
425.
Beaven, C., Gill, N. & Cook, C. 2008b. Salivary testosterone and cortisol responses in
professional rugby players after four resistance exercise protocols. The Journal of
Strength & Condition Research 22: 426-432.
Biolo, G., Williams, B., Fleming, R. & Wolfe, R. 1999. Insulin action on muscle protein
kinetics and amino acid transport during recovery after resistance exercise.
Diabetes 48: 949-957.
Biolo, G., Tipton, K., Klein, S. & Wolfe, R. 1997. An abudant supply of amino acids
enhances the metabolic effect of exercise on muscle protein. Endocrinology and
Metabolism – American Journal of Physiology 273: 122-129.
Bird, S. 2010. Strength nutrition: Maximizing your anabolic potential. Strength and
Conditioning Journal 32(4): 80-83.
Bird, S., Tarpenning, K. & Marino, F. 2006. Independent and combined effects of liquid
carbohydrate/essential amino acid ingestion on hormonal and muscular
80
adaptations following resistance training in untrained men. European Journal of
Applied Physiology 97: 225–238.
Bloomer, R., Sforzo, G. & Keller., B. 2000. Effects of meal form and composition on
plasma testosterone, cortisol, and insulin following resistance exercise.
International Journal of Sport Nutrition and Exercise Metabolism 10: 415-424.
Bohe, J., Low, A., Wolfe, R. & Rennie, M. 2003. Human muscle protein synthesis is
modulated by extracellular, not intramuscular amino acid availability: a dose-
response study. The Journal of Physiology 552: 315-324.
Borsheim, E., Cree, M., Tipton, K., Elliot, T., Aarsland, A. & Wolfe, R. 2004. Effect of
carbohydrate intake on net muscle protein synthesis during recovery from
resistance exercise. Journal of Applied Physiology 96: 674-678.
Borsheim, E., Tipton, K., Wolf, S. & Wolfe, R. 2002. Essential amino acids and
muscleprotein recovery from resistance exercise. Endocrinology and Metabolism
– American Journal of Physiology 283: 648-657.
Burd, N., Tang, J., Moore, D. & Phillips, S. 2009. Exercise training and protein
metabolism: influences of contraction, protein intake, and sex-based differences.
Journal of Applied Physiology 106: 1692-1701.
Burd, N., Holwerda, A., Selby, K., West, D., Staples, A., Cain, N., Cashaback, J.,
Potvin, J., Baker, S. & Phillips., S. 2010. Resistance exercise volume affects
myofibrillar protein synthesis and anabolic signaling molecule phosphorylation in
young men. The Journal of Physiology 588: 3119-3130.
Buresh, R., Berg, K. & French, J. 2009. The effect of resistive exercise rest interval on
hormonal response, strength, and hypertrophy with training. The Journal of
Strength & Conditioning Research 23: 62–71.
Campbell, W., Barton, M., Cyr-Campbell, D., Davey, S., Beard, J., Parise, G. & Evans,
W. 1999. Effects of an omnivorous diet compared with a lacto-ovovegetarian diet
on resistance-training-induced changes in body composition and skeletal muscle
in older men. The American Journal of Clinical Nutrition 70: 1032-1039.
Campbell, B., La Bounty, P., Ooetken, A., Kreider, R., Greenwood, M. & Willoughby,
D. 2009. The effects of branched chain amino acid supplementation on total lower
body workout volume. Medical & Science in Sports & Exercise 41: 422.
Campbell, W. & Leidy, H. 2007. Dietary protein and resistance training effects on
muscle and body composition in older persons. The Journal of the American
College of Nutrition 26(6): 696S-703S.
81
Campbell, B., Wilborn, C., La Bounty, P. & Wilson, J. 2012. Nutrient timing for
resistance exercise. Strength and Conditioning Journal 34(4): 1-10.
Cannell, J., Hollis, B., Sorenson, M., Taft, T. & Anderson, J. 2009. Athletic
performance and vitamin D. Medicine & Science in Sports & Medicine 41(5):
1102-1110.
Cermak, N., Res, P., de Groot, L., Saris, W. & van Loon, L. 2012. Protein
supplementation augments the adaptive response of skeletal muscle to resistance-
type exercise training: a meta-analysis. The American Journal of Clinical
Nutrition 96(6): 1454-1464.
Chromiak, J. & Antonio, J. 2002. Use of amino acids as growth hormone-releasing
agents by athletes. Nutrition 18: 657-661.
Coffey, V., Shield, A., Canny, B., Carey, K., Cameron-Smith, D. & Hawley, J. 2006.
Interaction of contractile activity and training history on mRNA abundance in
skeletal muscle from trained athletes. Endocrinology and Metabolism – American
Journal of Physiology 290: E849–E855.
Crewther, B., Cook, C., Cardinale, M., Weatherby, R., Lowe, T. 2011. Two emerging
concepts for elite athletes: the short-term effects of testosterone and cortisol on the
neuromuscular system and the dose-response training role of these endogenous
hormones. Sports Medicine 41: 103–123.
Cribb, P. & Hayes, A. 2006. Effects of supplement timing and resistance exercise on
skeletal muscle hypertrophy. Medicine & Science in Sports & Exercise 38(11):
1918-1925.
Cribb, P., Williams, A., Carey, M., Hayes, A. 2006. The effect of whey isolate and
resistance training on strength, body composition, and plasma glutamine.
International Journal of Sport Nutrition and Exercise Metabolism 16: 494–509.
Cuthbertson, D., Smith, K., Babraj, J., Leese, G., Waddell, T., Atherton, P.,
Wackerhage, H., Tayor, P. & Rennie, M. 2005. Anabolic signaling deficits
underlie amino acid resistance of wasting aging muscle. The FASEB Journal 19:
422-424.
Demling, R. & Desanti, L. 2000. Effect of a hypocaloric diet, increased protein intake
and resistance training on lean mass gains and fat mass loss in overweight police
officers. Annals of Nutrition and Metabolism 44(1):21-29

82
Drummond, M., Dreyer, H., Fry, C., Glynn, E. & Rasmussen, B. 2009. Nutritional and
contractile regulation of human skeletal muscle protein synthesis and mTORC1
signaling. Journal of Applied Physiology 106: 1374-1384.
Erola, L. 2000. Voimaharjoittelun akuutit ja pitkäaikaiset hormonaaliset ja
neuromuskulaariset vasteet nuorilla ja vanhoilla naisilla. Pro gradu-tutkielma.
Liikuntabiologian laitos. Jyväskylän Yliopisto.
Eliasson,J., Elfegoun, T., Nilsson, J. 2006. Maximal lengthening concentrations
increase p70 S6 kinase phosphorylation in human skeletal muscle in the absence
of nutritional supply. Endocrinology and Metabolism – American Journal of
Physiology 291(6): E1197-1205.
Elliot, T., Cree, M., Sanford, A., Wolfe & Tipton. 2006. Milk ingestion stimulates net
muscle protein synthesis following resistance exercise. Medicine & Science in
Sports & Exercise 38(4): 667-674.
Flakoll, P., Judy, T., Flinn, K., Carr, C. & Flinn, S. 2004. Postexercise protein
supplementation improves health and muscle soreness recruits. Journal of Applied
Physiology 96: 951-956.
Foss, Y. 2009. Vitamin D deficiency is the cause of common obesity. Medical
Hypotheses 72(3): 314-321.
Freeman, M. & Solomon, K. 2004. Cholesterol and prostate cancer. Journal of cellular
Biochemistry 91: 54-69.
Frystyck, J., Nyholm, B., Skjaerbaek, C., Baxter, R., Smitz, O. & Orskov, H. 2003. The
circulating IGF system and its relationship with 24-h glucose regulation and
insulin sensitivity in healthy subjects. Clinical Endocrinology (Oxf) 58: 777-784.
Fujita, S., Rasmussen, B., Cadenas, J., Grady, J. & Volpi, E. 2006. Effect of insulin on
human skeletal muscle protein synthesis is modulated by insulin-induced changes
in muscle blood flow and amino acid availability. Endocrinology and
Metabolism- American Journal of Physiology 291: E745-754.
Gallaher, D. 2008. Influence of dietary fiber on body weight regulation. teoksessa
Ilander, O., Borg, P., Laaksonen, M., Mursu, J., Ray, C., Pethman, K. &
Marniemi, A. 2008. Liikuntaravitsemus. VK-Kustannus Oy. Lahti. p.193-208.
Gilsanz, V., Kraemer, A., Mo, A., Wren, T. & Kraemer, R. 2010. Vitamin D status and
its relation to muscle mass and muscle fat in young women. The Journal of
Clinical Endocrinology and Metabolism 95(4): 1595-1601.

83
Goldspink, G. 2005. Mechanical signals, IGF-I gene splicing, and muscle adaptation.
Physiology (Bethesda) 20: 232–238.
Grimaldi, A., Parker, B., Capizzi, J., Clarkon, P., Pescatello, L., White, M. &
Thompson, P. 2013. 25(OH) vitamin D is associated with greater muscle strength
in healthy men and women. Medicine & Science in Sports & Exercise 45(1): 157-
162.
Guyton, A. & Hall, J. 2000. Textbook of Medical Physiology. W.B. Sounders
Company. U.S.A.
Hackney, K., Bruenger, A. & Lemmer, J. 2010. Timing protein intake increases energy
expenditure 24 h after resistance training. Medicine & Science in Sports &
Exercise 42(5): 998-1003.
Haff, G., Lehmkuhl, M., McCoy, L. & Stone, M. 2003. Carbohydrate supplementation
and resistance training. The Journal of Strength & Conditioning Research 17(1):
187-196.
Halton, T. & Hu, F. 2004. The effects of high protein diets on thermogenesis, satiety
and weight loss: a critical review. The Journal of American Coll. Nutrition 23(5):
373-385.
Hand, B., Kostek, M., Ferrell, R., Delmonico, M., Douglass, L., Roth, S., Hagberg, J. &
Hurley, B. 2007. Influence of promoter region variants of insulin-like growth
factor pathway genes on the strength-training response of muscle phenotypes in
older adults. Journal of Applied Physiology 103: 1678–1687.
Hansen, S, Kvorning, T, Kjaer, M, and Sjogaard, G. 2001.The effect of short-term
strength training on human skeletal muscle: The importance of physiologically
elevated hormone levels. Scandinavian Journal of Medicine & Science in Sports
11: 347–354.
Hartman, J., Tang, J., Wilkinson, S., Tarnopolsky, M., Lawrence, R., Fullerton, A. &.
Phillips, S. 2007. Consumption of fat-free fluid milk after resistance exercise
promotes greater lean mass accretion than does consumption of soy or
carbohydrate in young, novice, male weightlifters. The American Journal of
Clinical Nutrition 86: 373-381.
Harridge, SD. 2007. Plasticity of human skeletal muscle: Gene expression to in vivo
function. Experimental Physiology 92: 783–797.
Hawley, J., Burke, L., Phillips, S. & Spriet, L. 2011. Nutritional modulation of training-
induced skeletal muscle adaptations. Journal of Applied Physiology 110: 834-845.
84
Hayes, L., Bickerstaff, G., Baker J. 2010 Interactions of cortisol, testosterone, and
resistance training: influence of circadian rhythms. Chronobiology International
27: 675-705.
Hubal, M., Gordish-Dressman, H., Thompson, P., Price, T., Hoffman, E.,
Angelopoulos, T., Gordon, P., Moyna, N., Pescatello, L., Visich, P., Zoeller, R.,
Seip, R. & Clarkson, P. 2005. Variability in muscle size and strength gain after
unilateral resistance training. Medicine & Science in Sports & Medicine 37(6):
964-972.
Hulmi, J. 2013a. http://lihastohtori.wordpress.com/2013/05/12/tarve-vs-optimi/ read
3.1.2014.
Hulmi, J. 2013b. http://lihastohtori.wordpress.com/2013/12/16/parasta-harjoittelua-ja-
ravintoa/ read 3.1.2014.
Hulmi, J., Ahtiainen, J., Kaasalainen, T., Pöllänen, E., Häkkinen, K., Alen, M., Selänne,
H., Kovanen, V. & Mero, A. 2007. Post-exercise myostatin and activin IIb mRNA
levels: effects of strength training. Medicine & Science in Sport & Exercise 39:
289-297.
Hulmi, J., Kovanen, V., Lisko, I., Selänne, H. & Mero, A. 2008. The effects of whey
protein on myostatin and cell cycle related gene expression responses to a single
heavy resistance exercise bout in older men. European Journal of Applied
Physiology 102: 205-213.
Hulmi, J., Kovanen, V., Selänne, H., Kraemer, W., Häkkinen, K. & Mero, A. 2009.
Acute and long-term effects of resistance exercise with or without protein
ingestion on muscle hypertrophy and gene expression. Amino Acids 37: 297-308.
Hulmi, J., Lockwood, C. & Stout, J. 2010. Effect of protein/essential amino acids and
resistance training on skeletal muscle hypertrophy: A case for whey protein.
Nutrition & Metabolism 7: 51.
Häkkinen, K., Pakarinen, A., Kraemer, W.J., Häkkinen, A., Valkeinen, H. & Alen, M.
2001. Selective muscle hypertrophy, changes in EMG and force, and serum
hormones during strength training in older women. Journal of Applied Physiology
91(2): 569-580.
Ilander, O. & Mursu, J. 2008. Ravitsemus voiman ja lihasmassan hankinnassa.
Teoksessa Ilander, O., Borg, P., Laaksonen, M., Mursu, J., Ray, C., Pethman, K.
& Marniemi, A. 2008. Liikuntaravitsemus. VK-Kustannus Oy. Lahti. p. 379-404.

85
Inagaki, Y., Madarame, H., Neya, M., Ishii, N. 2011. Increase in serum growth hormone
induced by electrical stimulation of muscle combined with blood flow restriction.
European Journal of Applied Physiology 111: 2715–2721.
Janssen, I., Baumgartner, N., Ross, R., Rosenberg, I., Roubenoff, R. 2004a. Skeletal
muscle cutpoints associated with elevated physical disability risk in older men and
women. American Journal of Epidemiology 159: 412-421.
Janssen, I., Shepard D., Katzmarzyk, P., Roubenoff, R. 2004b. The healthcare costs of
sarcopenia in the United States. Journal of the American Geriatrics Society 52:
80-85.
Jeukendurp, A. & Gleeson, M. 2006. Sport nutrition: an introduction to energy
production and performance. 2nd
Edition. Champaign, IL. Human Kinetics.
Josse, A., Tang, J., Tarnopolsky, M. & Phillips, S. 2010. Body composition and strength
changes in women with milk and resistance exercise. Medicine & Science in
Sports & Exercise 42(6): 122-130.
Judelson, D., Maresh, C., Yamamoto, L., Farrell, M., Armstrong, L.,Kraemer, W.,
Volek, J., Spiering, B., Casa, D. & Anderson, J. 2008. Effect of hydration state on
resistance exercise-induced endocrine markers of anabolism, catabolism, and
metabolism. Journal of Applied Physiology 105: 816-824.
Kadowaki, M. & Kanawaza, T. 2003. Amino acids as regulators of proteolysis. Journal
of Nutrition 133: 2052S-2056S.
Karjalainen, J., Tikkanen, H., Hernelahti, M. & Kujala, U. 2006. Muscle fiber-type
distribution predicts weight gain and unfavorable left venticular geometry: a 19
year follow up study. BMC Cardiovascular Disorders 6 (2).
Kids Britannica. http://kids.britannica.com/comptons/art-90166/The-skeletal-or-striated-
muscles-of-the-human-muscular-system read 25.12.2013.
Kim, H., Barton, E., Muja, N., Yakar, S., Pennisi, P. & Leroith, D. 2005. Intact insulin
and insulin-like growth factor-I receptor signaling is required for growth hormone
effects on skeletal muscle growth and function in vivo. Endocrinology 146: 1772–
1779.
Kim, J., Petrella. J., Cross, J. & Bamman, M. 2007. Load-mediated downregulation of
myostatin mRNA is not sufficient to promote myofiber hypertrophy in humans: a
cluster analysis. Journal of Applied Physiology 103(5): 1488-1495.
86
Kimball, S., Farrell, P. & Jefferson, L. 2002. Invited review: role of insulin in
translational control of protein synthesis in skeletal muscle by amino acids or
exercise. Journal of Applied Physiology 93: 1168-1180.
Knutsen, K., Madar, A., Lagerlov, P., Brekke, M., Raastad, T., Stene, L. & Meyer, H.
2014. Does vitamin D improve muscle strength in adults? A randomized, double-
blind, placebo-controlled trial among ethnic minorities in Norway. The Journal of
Clinical Endocrinology & Metabolism 99(1): 194-202.
Koch, A., Potteider, J., Chan, M., Benedith, S. & Frey, B. 2001. Minimal influence of
carbohydrate ingestion on the immune response following acute resistance
exercise. International Journal of Sports Nutrition and Exercise Metabolism 11:
149–161.
Koopman, R., Wagenmakers, A., Manders, R., Zorenc, A., Senden, J., Gorselink, M.,
Keizer, H. & Van Loon, L. 2005. Combined ingestion of protein ans free leucine
with carbohydrate increases postexercise muscle protein synthesis in vivo in male
subjects. Endocrinology and Metabolism – American Journal of Physiology
288(4): E645-E653.
Kraemer, W.J. & Ratamess, N. 2005. Hormonal responses and adaptations to resistance
exercise and training. Sports Medicine 35: 339–361.
Kulik, J., Touchberry, C., Kawamori, N., Blumert, P., Crum, A. & Haff, G. 2008.
Supplemental carbohydrate ingestion does not improve performance of high-
intensity resistance exercise. The Journal of Strength & Conditioning Research
22(4): 1101-1107.
Laatikainen, R. 2011. http://www.pronutritionist.net/yhteenveto-ravinnon-rasvoista/
read 3.1.2014.
Lemon, P. 2000. Beyond the zone: protein needs of active individuals. The Journal of
American College of Nutrition 19: 513S-521S.
Levenhagen, D., Gresham, J., Carlson, M., Maron, D., Borel, M. & Flakoll, P. 2001.
Postexercise nutrient intake timing in humans is critical to recovery of leg glucose
and protein homeostasis. American Journal of Physiology 280: E982-E993.
Lucero, H. & Robbins, P. 2004. Lipid rafts-protein association and the regulation of
protein activity. Archieves of Biochemistry and Biophysics 426: 208-224.
Maresh, C., Whittlesey, M., Armstrong, L., Yamamoto, L., Judelson, D., Fish, K., Casa,
D., Kavouras, S. & Castracane, V. 2006. Effect of hydration state on testosterone
87
and cortisol responses to training-intensity exercise in collegiate runners.
International Journal of Sports Medicine 27: 765-770.
Manorem, M. & Thompson, J. 2008. Body weight regulation and energy needs. In the
book: Wolinsky, I. & Driskell, J.A. 2008. Sports nutrition: Energy Metabolism
and Exercise. p. 241-260.
Marjanen, H. & Soini, S. 2007. Kivennäisaineiden ja vitamiinien merkityksestä.
Suomen terveyskirjat Oy. Turku.
McArdle, W., Katch, F. & Katch, V. 2001. Exercise Physiology. Energy, Nutrition, and
Human Performance: 5th Edition. Lippincott Williams & Wilkins.
McArdle, W, Katch, F & Katch, V. 2007. Exercise Physiology. Energy, Nutrition, and
Human Performance: 5th Edition. Lippincott Williams & Wilkins.
Migiano, M., Vingren, J., Volek, J., Maresh, C., Fragala, M., Ho, J., Thomas, G.,
Hatfield, D., Hakkinen, K., Ahtiainen, J., Earp, J. & Kraemer, W. 2009. Endocrine
response patterns to acute unilateral and bilateral resistance exercise in men. The
Journal of Strength and Conditioning Research 24: 128–134.
Miller, S., Tipton, K., Chinkes, D., Wolf, S. & Wolfe, R. 2003. Independent and
combined effects of amino acids and glucose after resistance exercise. Medicine
& Science in Sports & Exercise 35: 449–455.
Minasyan, A., Keisala, T., Zou, J., Zhang, Y., Toppila, E.,Syvälä, H., Lou, Y., Kalueff,
A., Pyykkö, I. & Tuohimaa, P. 2009. Vestibular dysfunction in vitamin D receptor
mutant mice. The Journal of steroid biochemistry and molecular biology 114 (3-
5): 161-166.
Moore, D., Phillips, S., Babraj, J., Smith, K. & Rennie, M. 2005. Myofibrillar and
collagen protein synthesis in human skeletal muscle in young men after maximal
shortening and lengthening contractions. Endocrinology and Metabolism –
American Journal of Physiology 288: 1153–1159.
Moore, D., Tang, J., Burd, N., Rerecich, T. Tarnopolsky, M. & Phillips, S. 2009.
Differential stimulation of myofibrillar and sarcoplasmic protein synthesis with
protein ingestion at rest and after resistance exercise. The Journal of Physiology
587: 897-904.
Nakagawa, E., Nagaya, N. & Okumura, H. 2002. Hyperglycemia suppresses the
secretion of ghrelin, a novel growth-hormone releasing peptide: responses to the
intravenous and oral administration of glucose. Clinical Science (Lond.) 103:
325–328.

88
Nelson, D. & Cox, M. 2000. Lehinger Principles of Biochemistry. 3rd Edition. Worth
Publishers, New York.
Niemi, A. 2006. Ravitsemus kuntoon. 1st Edition. WSOYpro. Jyväskylä.
Nilwik, R., Snijders, T., Leenders, M., Groen, B., van Kranenburg, J., Verdjik, L. &
Van Loon, L. 2013. The decline in skeletal muscle mass with aging is mainly
attributed to an reduction in type II muscle fiber size. Experimental Gerontology
48(5): 492-498.
Nosaka, K., Sacco, P. & Mawatari, K. 2006. Effects of amino acid supplementation on
muscle soreness and damage. International Journal of Sport Nutrition and
Exercise Metabolism 16(6): 620-635.
Peltosaari, L., Raukola, H. & Partanen, R. 2002. Ravitsemustieto. Otavan Kirjapaino
Oy. Keuruu.
Phillips, S. 2004. Protein requirements and supplementation in strength sports. Nutrition
20: 689–695.
Phillips, S., Hartman, J. & Wilkinson, S. 2005. Dietary protein to support anabolism
with resistance exercise in young men. Journal of the American College of
Nutrition 24(2): 134S-139S.
Phillips, S. 2007. Resistance exercise good for more than just grandma and grandpa’s
muscles. Applied Physiology, Nutrition and Metabolism 32: 1198-1205.
Phillips, S., Tang, J. & Moore, D. 2009. The role of milk- and soybased protein in
support of muscle protein synthesis and muscle protein accretion in young and
elderly persons. The Journal of the Americal College of Nutrition 28: 343–354.
Poole, C., Wilborn, C., Taylor, L. & Kerksick, C. 2010. The role of post-exercise
nutrient administration on muscle protein synthesis and glycogen syntheses.
Journal of Sports Science and Medicine 9: 354-363.
Power, O., Hallihan, A. & Jakeman, P. 2009. Human insulinotropic response to oral
ingestion of native and hydrolysed whey protein. Amino Acids 37(2): 333-339.
Prasartwuth, O., Taylor, J. & Gandevia, S. 2005. Maximal force, voluntary activation
and muscle soreness after eccentric damage to human elbow flexor muscles. The
Journal of Physiology 567: 337-348.
Proud, C. 2006. Regulation of protein synthesis by insulin. Biochemical Society
Transactions 34(2): 213-216.

89
Pugeat, M., Nader, N., Hogeveen, K., Raverot, G., Dechaud, H. & Grenot, C. 2010. Sex
hormone-binding globulin gene expression in the liver: drugs and the metabolic
syndrome. Molecular and Cellular Endocrinology 316: 53-59.
Ravitsemusneuvottelukunta. 2012. Ravitsemusneuvottelukunta.fi. Luettu 14.1.2014.
Rehunen, S. & Fogelholm, M. 1993. Ravitsemus, liikunta ja terveys. Gummerus
Kirjapaino Oy. Jyväskylä.
Rasmussen, B., Tipton, K., Miller, S., Wolf, S. & Wolfe, R. 2000. An oral essential
amino acid-carbohydrate supplement enhances muscle protein anabolism after
resistance exercise. Journal of Applied Physiology 88: 386-392.
Riechman, S., Andrews, R., MacLean, D. & Sheather, S. 2007. Statins and dietary and
serum cholesterol are associated with increased lean mass following resistance
training. Journal of Gerontology: Medical Sciences 63(11): 1260-1261.
Ronnestad, B., Nygaard, H. & Raastad, T. 2011. Physiological elevation of endogenous
hormones results in superior strength training adaption. European Journal of
Applied Physiology 111: 2249-2259.
Roy, R., Baldwin, K. & Edgerton, V. 1991. The plasticity of skeletal muscle: effects of
neuromuscular activity. Exercise and Sport Sciences Reviews 19: 269-312.
Roy, B., Tarnopolsky, M., MacDougall, J., Fowles, J. & Yarasheski, K. 1997. Effect of
glucose supplement timing on protein metabolism after resistance training.
Journal of Applied Physiology 82: 1882-1888.
Roy, B. & Tarnopolsky, M. 1998. Influence of different macronutrient intakes on
muscle glycogen resynthesis after resistance exercise. Journal of Applied
Physiology 72: 1854-1859.
Sakharova, A., Horowitz, J., Surya, S. Goldenberg, N. Harber, M., Symons, K., Barkan,
A. 2008. Role of growth hormone in regulating lipolysis, proteolysis, and hepatic
glucose production during fasting. The Journal of Clinical Endocrinology &
Metabolism 93: 2755-2759.
Sallinen, J., Pakarinen, A., Ahtiainen, J. Kraemer, WJ, Volek, JS., Häkkinen, K. 2004.
Relationship between diet and serum anabolic hormone responses to heavy-
resistance exercise in men. The International Journal of Sports Medicine 25(8):
627-633.
Schoenfeld, B. 2013. Postexercise hypertrophic adaptations: A re-examination of the
hormone hypothesis and its applicability to resistance training program design.
The Journal of Strength & Conditioning Research 27(6): 1720–1730.
90
Schoenfield, B., Aragon, A. & Krieger, J. 2013. The effect of protein timing on muscle
strength and hypertrophy: a meta-analysis. Journal of International Society of
Sports Nutrition 10(1):53.
Schroeder, E., Todd, Villanueva, M., West, D. & Phillips, S. 2013. Are acute post-
resistance exercise increases in testosterone, growth hormone, and IGF-1
necessary to stimulate skeletal muscle anabolism and hypertrophy? Medicine &
Science in Sports & Exercise 45(11): 2044-2051.
Sculthorpe, N., Solomon, A., Sinanan, A., Bouloux, P., Grace, F. and Lewis, M. 2012.
Androgens affect myogenesis in vitro and increase local IGF-1 expression.
Medicin and Science in Sports Exercise 44: 610–615.
Sedliak, M., Finni, T., Cheng, S. Kraemer, W.J. & Häkkinen, K. 2007. Effect of time-
of-day-specific strength training on serum hormone concentrations and isometric
strength in men. Chronobiology International 24: 1159-1177.
Shahbazpour, N., Carroll, T., Riek, S., Carson, R. 2004. Early alternations in serum
creatine kinase and total cholesterol following high intensity eccentric muscle
actions. The Journal of Sports Medicine and Physical Fitness 44: 193-199.
Shirreffs, S. 2005. The importance of good hydration for work and exercise
performance. Nutrition Reviews 63(6): S14-S21.
Simoneau, J. & Bouchard, C. 1995. Genetic determinism of fiber type proportion in
human skeletal muscle. The FASEB Journal 9(11): 1091-1095.
Simons, K. & Toomre, D. Lipid rafts and signal transduction. 2000. Nature reviews.
Molecular Cell Biology 1: 31-39.
Slater, G. & Phillips, S. 2011. Nutrition guidelines for strength sports: Sprinting,
weightlifting, throwing events, and body building. Journal of Sports Sciences
29(1): S67-S77
Spangenburg, E., Le Roith, D., Ward, C., and Bodine, S. 2008. A functional insulin-like
growth factor receptor is not necessary for load induced skeletal muscle
hypertrophy. The Journal of Physiology 586(1): 283–291.
Spiering, B., Kraemer, W., Anderson, J., Armstrong, L., Nindl, B., Volek, J., Judelson,
D., Joseph, M., Vingren, J., Hatfield, D., Fragala, M., Ho, J. & Maresh, C. 2008a.
Effects of elevated circulating hormones on resistance exercise-induced Akt
signaling. Medicine & Science in Sports & Exercise 40: 1039-1048.
Spiering, B., Kraemer, W., Anderson, J., Armstrong, L., Nindl, B., Volek, J. & Maresh,
C. 2008b. Resistance exercise biology. Manipulation of resistance exercise

91
programme variables determines the responses of cellular and molecular signaling
pathways. Sports Medicine 38(7): 527-540.
Stone, J., Folkerd, E., Doody, D., Schroen, C., Treloar, S., Giles, G., Pike, M., English,
D., Southey, M., Hopper, J. & Dowsett, M. 2009. Familial correlations in
postmenopausal serum concentrations of sex steroid hormones and other
mitogens: a twins and sisters study. The Journal of Clinical Endocrinology &
Metabolism 94: 4793-4800.
Svanberg, E., Ennion, S., Isgaard, J. & Goldspink, G. 2000. Postprandial resynthesis of
myofibrillar proteins is translationally rather than transcriptionally regulated in
human skeletal muscle. Nutrition 16(1): 42-46.
Tang, J., Moore, D., Kujbida, G., Tarnopolsky, M. & Phillips, S. 2009. Ingestion of
whey hydrolysate, casein, or soy protein isolate: effects on mixed muscle protein
synthesis at rest and following resistance exercise in young men. Journal of
Applied Physiology 107(3): 987-992.
Tanner, C., Barakat, H., Dohm, G. Pories, W., McDonald, K., Cunnigham, P., Swanson,
M. & Houmard, J. 2001. Muscle fiber type is associated with obesity and weight
loss. Endocrinology and Metabolism – American Journal of Physiology 282:
1191-1196.
Tarpenning, K., Wiswell, R., Hawkins, S. & Marcell, T. 2001. Influence of weight
training exercise and modification of hormonal response on skeletal muscle
growth. Journal of Science and Medicine in Sport 4: 431-446.
Taylor, R., Ashton, K., Moxham,T., Hooper. L. & Ebrahim, S. 2013. Reduced dietary
salt for the prevention of cardiovascular disease. 2011. Cochrane Databases of
Systematic Reviews 7: CD009217.
Tesch,P., Ploutz-Snyder, L., Ystrom, L., Castro M. & Dudley, G. 1998. Skeletal muscle
glycogen loss evoked by resistance exercise. The Journal of Strength &
Conditioning Research 12: 67–73.
Thalacker-Mercer, A., Petrella, J. & Bamman, M. 2009. Does habitual dietary intake
influence myofiber hypertrophy in response to resistance training? A cluster
analysis. Applied Physiology, Nutrition and Metabolism 34(4): 632-639.
Tipton, K., Rasmussen, B., Miller, S.,Wolf, S., Owens-Stovall, S., Petrini, B. & Wolfe,
R. 2001. Timing of amino acid-carbohydrate ingestion alters anabolic response of
muscle to resistance exercise. Endocrinology and Metabolism - American Journal
of Physiology 281: 197-206.
92
Tipton, K., Elliott, T., Cree, M., Aarsland, A., Sanford, A. & Wolfe, R. 2007.
Stimulation of net muscle protein synthesis by whey protein ingestion before and
after exercise. American Journal of physiology 292: E71-E76.
Tremblay, M., Copeland, J. & Van H. 2004. Effect of training status and exercise mode
on endogenous steroid hormones in men. Journal of Applied Physiology 96: 531-
539.
Van Leeuwen, J., van Drier, M., van den Bemd, G. & Pols, H. 2001. Vitamin D control
of osteoblast function and bone extracellular matrix mineralization. Critical
Reviews in Eukaryotic Gene Expression 11(1-3): 199-226.
Van Loon, L., Kruijshoop, M., Menheere, P., Wagenmakers, A., Saris, W. & Keizer, H.
2003. Amino and ingestion strongly enhances insulin secretion in patients with
long-term type 2 diabetes. Diabetes Care 26: 625-630.
Van Loon, L., Saris, W., Kruijshoop, M. & Wagenmakers, J. 2000a. Maximizing
postexercise muscle glycogen synthesis: carbohydrate supplementation and the
application of amino acid or protein hydrolysate mixtures. The American Journal
of Clinical Nutrition 72: 106-111.
Van Loon, L., Saris, W., Werhagen, H. & Wagenmakers, A. 2000b. Plasma insulin
responses after ingestion of different amino acid or protein mixtures with
carbohydrate. The American Journal of Clinical Nutrition 72: 96-105.
Veldhuis, J., Keenan, D., Mielke, K., Miles, J. & Bowers, C. 2005. Testosterone
supplementation in healthy older men drives GH and IGF-I secretion without
potentiating peptidyl secretagogue efficacy. European Journal of Endocrinology
153: 577-586.
Vierck, J., O’Reilly, B., Hossner, K., Antonio, J., Byrne, K., Bucci, L. & Dodson, M.
2000. Satellite cell regulation following myotrauma caused by resistance exercise.
Cell Biology International 24: 263–272.
Vieth, R. 1999. Vitamin D supplementation, 25-hydroxyvitamin D concentrations and
safety. The American Journal of Clinical Nutrition 69(5): 842-856.
Vieth, R., Bischoff-Ferrari, H., Boucher, B., Dawson-Hughes, B., Garland, C., Heaney,
R., Holick, M., Hollis, B., Lamberg-Allardt, C., McGrath, J., Norman, A., Scragg,
R., Whiting, S., Willett, W. & Zittermann, A. 2007. The urgend need to
recommend an intake of vitamin D that is effective. The American Journal of
Clinical Nutrition 85(3): 649-650.

93
Vimalesmaran, K, Berry, D., Lu, C., Tikkanen, E., Pilz, S., Hiraki, L., Cooper, J.,
Dastani, Z., Li, R., Houston, D., Wood, A., Michaelsson, K., Vandenput, L.,
Zgaga, L., Yerges-Armstrong, L., McCarthy, M., Dupuis, J., Kaakinen, M.,
Kleber, M., Jameson, K., Arden, N., Raitakari, O., Viikari, J., Lohman, K.,
Ferrucci, L., Melhus, H., Ingelsson, E., Byberg, L., Lind, L., Lorentzon, M.,
Salomaa, V., Campbell, H., Dunlop, M., Mitchell, B., Herzig, K., Pouta, A. &
Hartikainen, A., the Genetic Investigation of Anthropometric Traits (GIANT)
consortium, Streeten, E., Theodoratou, E., Jula, A., Wareham, N., Ohlsson, C.,
Frayling, T., Kritchevsky, S., Spector, T., Richards, J., Lehtimäki, T., Ouwehand,
W., Kraft, P., Cooper, C., März, W., Power, C., Loos, R., Wang, T., Järvelin MR,
Whittaker, J., Hingorani, A. & Hyppönen, E. 2013. Causal relationship between
obesity and vitamin D status: bi-directional mendelian randomization analysis of
multiple cohorts. PLoS Medcine 10(2): e1001383.
Vingren, J., Kraemer, W., Ratamess, N., Anderson, J., Volek, J. & Maresh, C. 2010.
Testosterone physiology in resistance exercise and training: the up-stream
regulatory elements. Sports Medicine 40: 1037-1053.
Visser, M., Deeg, D., Puts, M., Seidell, J. & Lips, P. 2006. Low serum concentrations of
25-hydroxyvitamin D in older persons and the risk of nursing home admission.
The American Journal of Clinical Nutrition 84(3): 616-622.
Vissing, K. & Andersen, J & Schjerling, P. 2005. Are exercise-induced genes induced
by exercise? The FASEB Journal 19: 94-96.
Volek, J. 2004. Influence of nutrition on responses to resistance training. Medicine and
Science in Sports and Exercise 36(4): 689–696.
Volek, J., Go’Mez, A., Love, D., Avery, N., Sharman, M. & Kraemer, W. 2001. Effects
of a high-fat diet on post-absorptive and postprandial testosterone responses to a
fat-rich meal. Metabolism 50: 1351-1355.
Wagenmakers, A. 2001. Amino acid metabolism in exercise. In the book: Maughan,
R.J. 2001. Nutrition in sport: The Encyclopedia of Sports Medicine. Blackwell
sciences Ltd, 119.
Wang, Y. & DeLuca, H. 2011. Is the vitamin D receptor found in muscle?
Endocrinology 152(2): 354-363.
Wehr, E., Pilz, S. Boehm, B., März, W. & Obermayer-Pietsch, B. 2010. Association of
vitamin D status with serum androgen levels in men.Clinical Endocrinology
(Oxf.) 73(2): 243-248.
94
West, D., Burd, N., Staples, A. & Phillips, S. 2010. Human exercise-mediated skeletal
muscle hypertrophy is an intrinsic process. The International Journal of
Biochemistry and Cell Biology 42(9): 1371-1375.
West, D., Burd, N., Tang, J., Moore, D., Staples, A., Holwerda, A., Baker, S. & Phillips,
S. 2009. Elevations in ostensibly anabolic hormones with resistance exercise
enhance neither training-induced muscle hypertrophy nor strength of the elbow
flexors. Journal of Applied Physiology 108: 60-67.
West, D. & Phillips, S. 2012. Associations of exercise-induced hormone profiles and
gains in strength and hypertrophy in a large cohort after weight training. European
Journal of Applied Physiology 112: 2693-2702.
Westcott, W. & La Rosa Loud, R. 2013. Enhancing resistance training results with
protein/carbohydrate supplementation. ACSM’s Health and Fitness Journal 17(2):
10-16.
Williams, A., Ismail, A., Sharma, A. & Jones, D. 2002. Effects of resistance exercise
volume and nutritional supplementation on anabolic and catabolic hormones.
European Journal of Applied Physiology 86: 315-321.
Wolfe, R. 2006. The unappreciated role of muscle in health and desease. The American
Journal of Clinical Nutrition 84: 475-482.
Zou, K., Meador, B., Johnson, B., Huntsman, H., Mahmassani, Z., Valero, M., Huey, K.
& Boppart, M. 2011. The alpha (7) beta (1)-integrin increases muscle hypertrophy
following multiple bouts of eccentric exercise. Journal of Applied Physiology
111: 1134-1141.
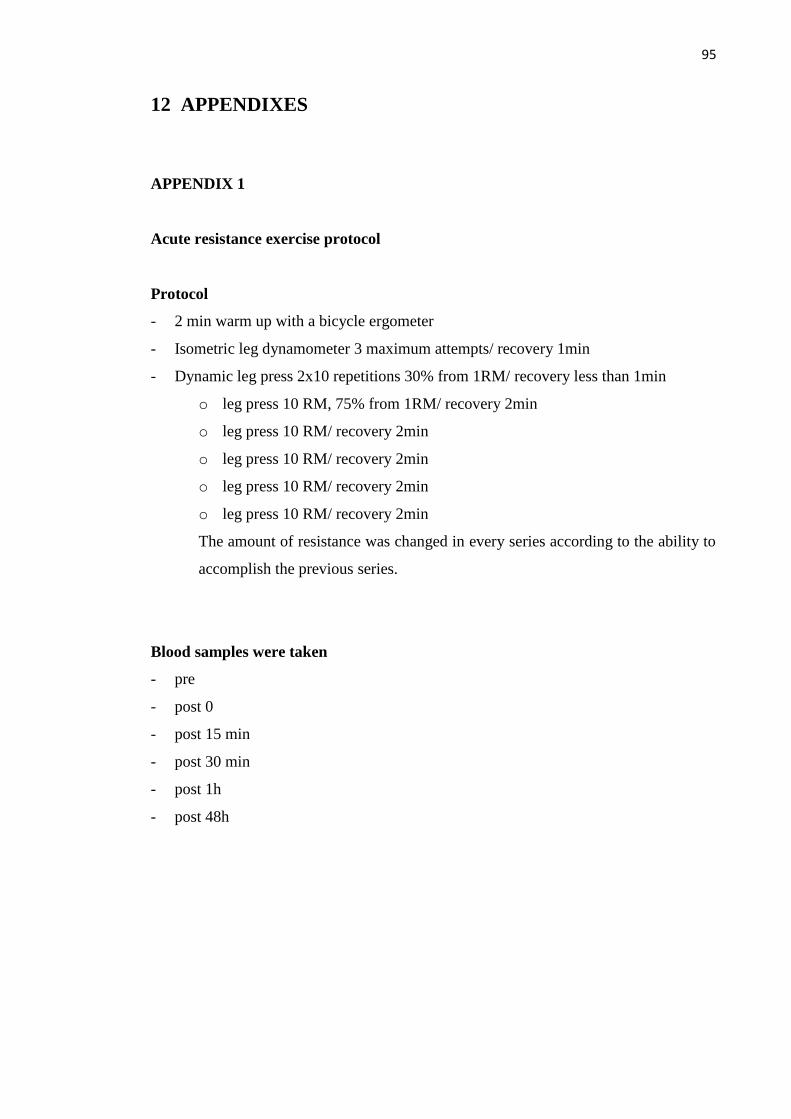
95
12 APPENDIXES
APPENDIX 1
Acute resistance exercise protocol
Protocol
- 2 min warm up with a bicycle ergometer
- Isometric leg dynamometer 3 maximum attempts/ recovery 1min
- Dynamic leg press 2x10 repetitions 30% from 1RM/ recovery less than 1min
o leg press 10 RM, 75% from 1RM/ recovery 2min
o leg press 10 RM/ recovery 2min
o leg press 10 RM/ recovery 2min
o leg press 10 RM/ recovery 2min
o leg press 10 RM/ recovery 2min
The amount of resistance was changed in every series according to the ability to
accomplish the previous series.
Blood samples were taken
- pre
- post 0
- post 15 min
- post 30 min
- post 1h
- post 48h
Related Documents