The effect of microstructure and processing variables on the yield to ultimate tensile strength ratio in a Nb–Ti and a Nb–Ti–Mo line pipe steel Zhenghua Tang a and Waldo Stumpf a a Department of Materials Science and Metallurgical Engineering, University of Pretoria, Pretoria 0002, South Africa Abstract In a hot rolled Nb–Ti and a Nb–Ti–0.09%Mo micro-alloyed steel, the ratio of yield strength to tensile strength (YS/UTS) was found to be a function of the microstructure and cooling rate in those tests where no coiling simulation and no prior deformation. The coarse bainite or acicular ferrite, which was formed at high cooling rates, raised the YS/UTS ratio under these process conditions. With coiling simulation, the ratio was not sensitive to the cooling rate or the microstructure as coiling allows the recovery of dislocations, thereby decreasing the difference in dislocation density that had arisen between a low and a high cooling rate. Deformation with a 33% reduction below the nil- recrystallisation temperature (T nr ) prior to the transformation, led to a high YS/UTS ratio that ranged from 0.81 to 0.86. The prior deformation, therefore, had a stronger effect on the YS/UTS ratio than microstructural changes through cooling rate variations. Article Outline 1. Introduction 2. Experimental procedure 3. Results 3.1. The effect of cooling rate 3.2. The effect of coiling temperature 3.3. The effect of prior deformation in the austenite 4. Discussion 5. Conclusions Acknowledgements References

Welcome message from author
This document is posted to help you gain knowledge. Please leave a comment to let me know what you think about it! Share it to your friends and learn new things together.
Transcript
The effect of microstructure and processing variables on the yield to ultimate tensile strength ratio in a Nb–Ti and a Nb–Ti–Mo line pipe steel Zhenghua Tanga and Waldo Stumpfa
a Department of Materials Science and Metallurgical Engineering, University of Pretoria, Pretoria 0002, South Africa
Abstract In a hot rolled Nb–Ti and a Nb–Ti–0.09%Mo micro-alloyed steel, the ratio of yield strength to tensile strength (YS/UTS) was found to be a function of the microstructure and cooling rate in those tests where no coiling simulation and no prior deformation. The coarse bainite or acicular ferrite, which was formed at high cooling rates, raised the YS/UTS ratio under these process conditions. With coiling simulation, the ratio was not sensitive to the cooling rate or the microstructure as coiling allows the recovery of dislocations, thereby decreasing the difference in dislocation density that had arisen between a low and a high cooling rate. Deformation with a 33% reduction below the nil-recrystallisation temperature (Tnr) prior to the transformation, led to a high YS/UTS ratio that ranged from 0.81 to 0.86. The prior deformation, therefore, had a stronger effect on the YS/UTS ratio than microstructural changes through cooling rate variations.
Article Outline 1. Introduction 2. Experimental procedure 3. Results 3.1. The effect of cooling rate 3.2. The effect of coiling temperature 3.3. The effect of prior deformation in the austenite 4. Discussion 5. Conclusions Acknowledgements References
1. Introduction The American Petroleum Institute (API) specifications for line pipe steels generally require a low YS/UTS ratio which is equivalent to a high work hardening rate. The lack of sufficient strain hardening in steels with a high YS/UTS ratio means that there is a reduced potential for strain redistribution in thinned areas (thinned by corrosion or weld dressing) during service while a high yield strength again is, of course, required for the transport of liquid or gas at higher pressures. The API specifies a YS/UTS ratio generally not greater than 0.93 for an application involving pipelines. This ratio is affected by the microstructure of the steel and an optimised microstructure (typically containing acicular ferrite [1]) is, therefore, beneficial in achieving a lower YS/UTS ratio and is achieved by carefully controlling the hot rolling, cooling and coiling schedules. This ratio is also an important parameter in the development of higher grades of line pipe steels. Pontremoli et al. [2] have shown that there is a slightly higher volume fraction (about 7%) of the martensite/austenite (M/A) constituent with a higher finish rolling temperature and this provides a more rounded stress–strain curve and a higher strain-hardening rate. For instance, in a Nb–Ti micro-alloyed steel hot rolled at a finishing temperature of 720 °C these authors also found that the YS/UTS ratio was 0.69, whereas finishing at 780 °C the ratio was lowered to 0.65 while the volume fraction of the M/A constituent increased from 4.6 (at 720 °C) to 7.0%. In a complementary study to this one being reported here [3] on a Nb–Ti and a range of Nb–Ti–Mo micro-alloyed steels, it was found that acicular ferrite formation upon cooling from 980 °C at rates up to 43 °C s−1, was only marginally promoted by molybdenum additions (up to 0.22%Mo) but was more strongly promoted by prior deformation of the austenite below the nil-recrystallisation temperature Tnr, irrespective of the molybdenum content of the steel. In this work reported here, the study on the role of acicular ferrite was carried further on a molybdenum-free and a molybdenum containing Nb–Ti line pipe steel by establishing how the YS/UTS ratio is affected by cooling rates after hot rolling, by coiling temperatures and by prior deformation of the austenite below the nil-recrystallisation temperature Tnr.
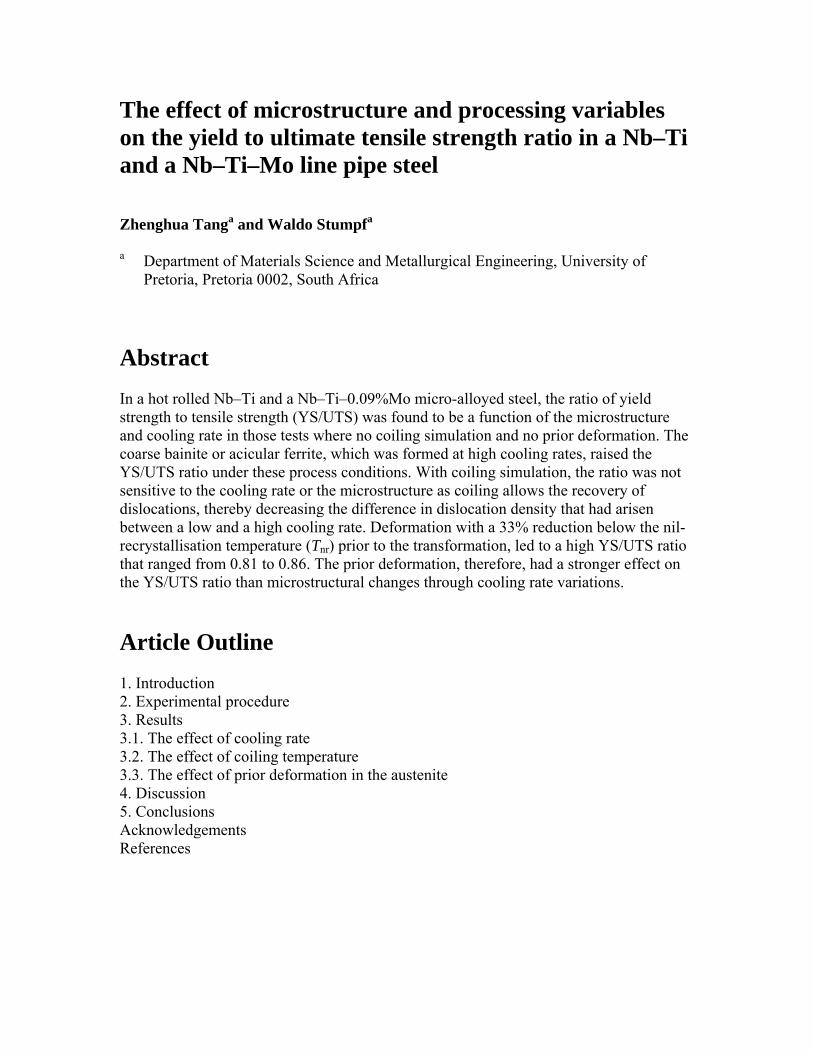
2. Experimental procedure Two vacuum induction melted 50 kg casts (see Table 1) of low carbon Nb–Ti micro-alloyed steels without and with an 0.09% molybdenum addition, were hot rolled to 6 mm × 100 mm × 300 mm plates with the schedule shown in Fig. 1. The nominal strain per pass ranged from 0.15 to 0.38 during roughing and 0.14 to 0.22 during finishing at a strain rate ranging from 1.67 to 4.07 and with interpass times of typically 16 s. The total strain was 1.97 (i.e. 86% reduction) in the hot rolling process which was carried out in a small to medium sized laboratory hot rolling mill equipped with 320 mm diameter rolls.
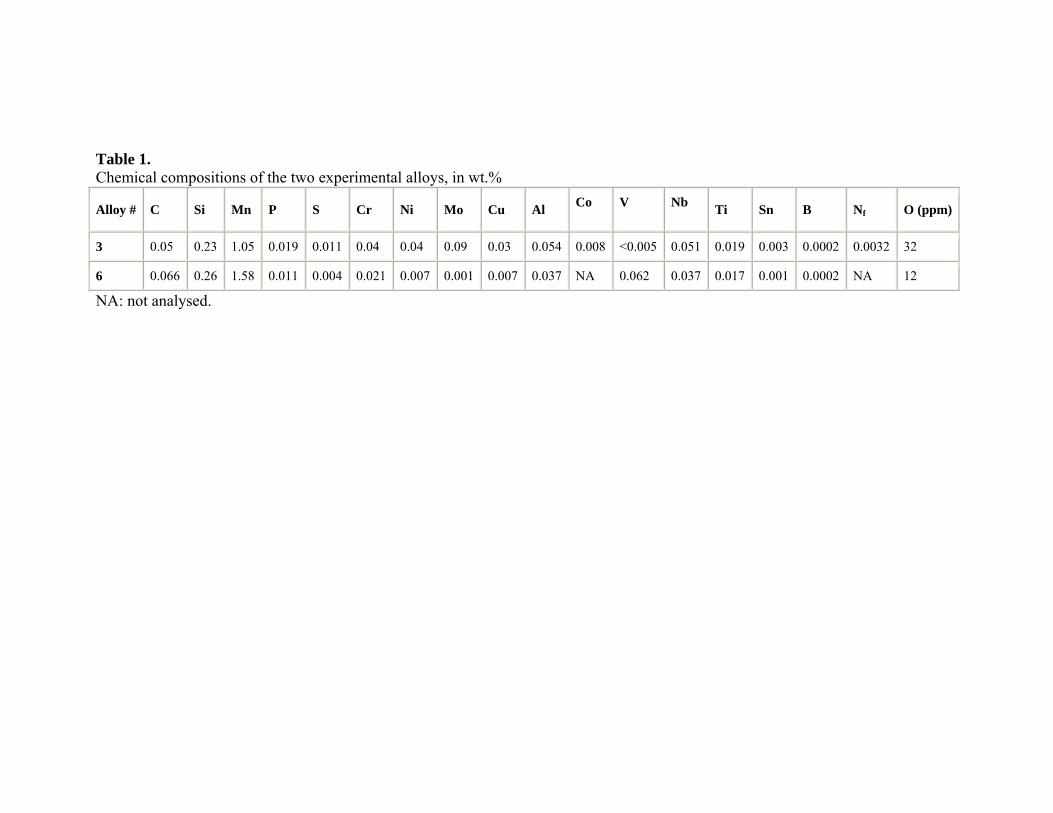
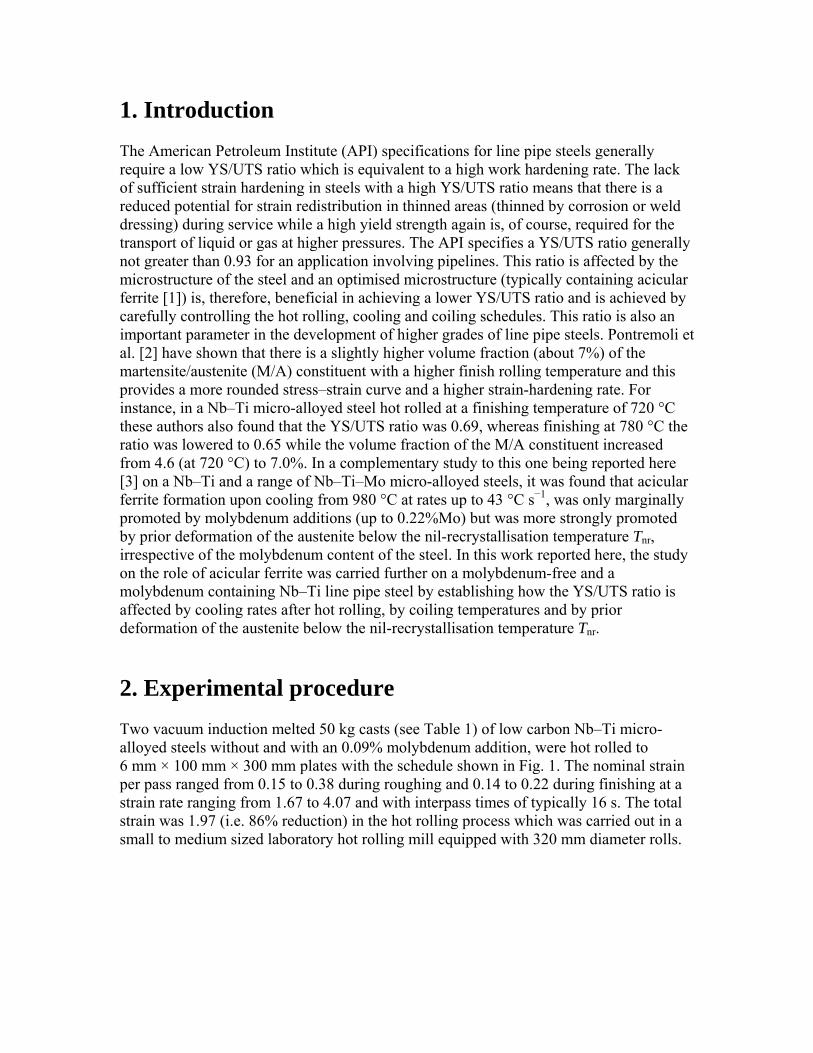
Table 1. Chemical compositions of the two experimental alloys, in wt.%
Alloy # C Si Mn P S Cr Ni Mo Cu Al Co
V
Nb
Ti Sn B Nf O (ppm)
3 0.05 0.23 1.05 0.019 0.011 0.04 0.04 0.09 0.03 0.054 0.008 <0.005 0.051 0.019 0.003 0.0002 0.0032 32
6 0.066 0.26 1.58 0.011 0.004 0.021 0.007 0.001 0.007 0.037 NA 0.062 0.037 0.017 0.001 0.0002 NA 12
NA: not analysed.
Fig. 1. Schematic temperature/time schedule of the hot rolling process. Two types of tensile test samples were machined from these hot rolled plates: the first type A was rectangular in size of 6 mm × 10 mm × 100 mm and was used to study the effect of different cooling rates from 980 °C plus two subsequent coiling treatments at 575 and 600 °C, respectively, on the YS/UTS without further prior deformation after the initial hot rolling. The other type B, shown schematically in Fig. 2, was used to study the effect of prior compression of the austenite below the Tnr in a Gleeble 1500™ before cooling, from there the shorter gauge length that was wire-cut after deformation and cooling from the compressed 6 mm × 10 mm central section.
Fig. 2. Type B samples (in mm) for the Gleeble simulation before compression. Tensile samples were electro-cut after compression with the gauge length lying within the compressed section.
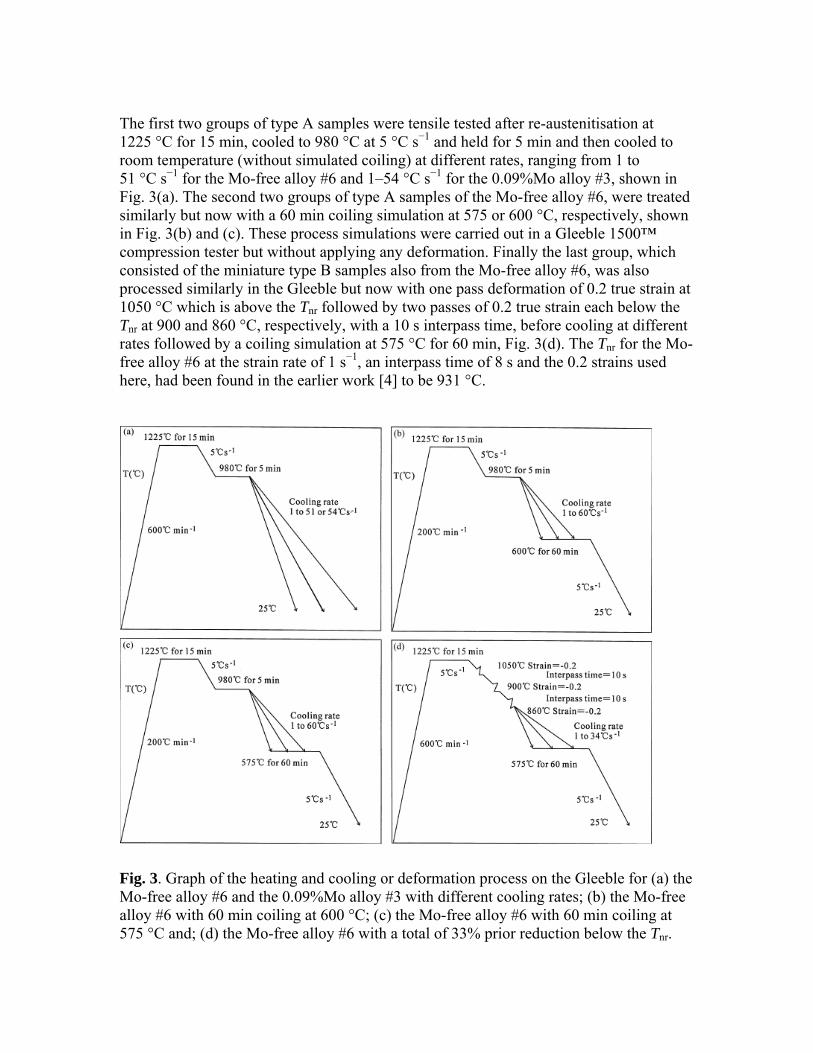
The first two groups of type A samples were tensile tested after re-austenitisation at 1225 °C for 15 min, cooled to 980 °C at 5 °C s−1 and held for 5 min and then cooled to room temperature (without simulated coiling) at different rates, ranging from 1 to 51 °C s−1 for the Mo-free alloy #6 and 1–54 °C s−1 for the 0.09%Mo alloy #3, shown in Fig. 3(a). The second two groups of type A samples of the Mo-free alloy #6, were treated similarly but now with a 60 min coiling simulation at 575 or 600 °C, respectively, shown in Fig. 3(b) and (c). These process simulations were carried out in a Gleeble 1500™ compression tester but without applying any deformation. Finally the last group, which consisted of the miniature type B samples also from the Mo-free alloy #6, was also processed similarly in the Gleeble but now with one pass deformation of 0.2 true strain at 1050 °C which is above the Tnr followed by two passes of 0.2 true strain each below the Tnr at 900 and 860 °C, respectively, with a 10 s interpass time, before cooling at different rates followed by a coiling simulation at 575 °C for 60 min, Fig. 3(d). The Tnr for the Mo-free alloy #6 at the strain rate of 1 s−1, an interpass time of 8 s and the 0.2 strains used here, had been found in the earlier work [4] to be 931 °C.
Fig. 3. Graph of the heating and cooling or deformation process on the Gleeble for (a) the Mo-free alloy #6 and the 0.09%Mo alloy #3 with different cooling rates; (b) the Mo-free alloy #6 with 60 min coiling at 600 °C; (c) the Mo-free alloy #6 with 60 min coiling at 575 °C and; (d) the Mo-free alloy #6 with a total of 33% prior reduction below the Tnr.
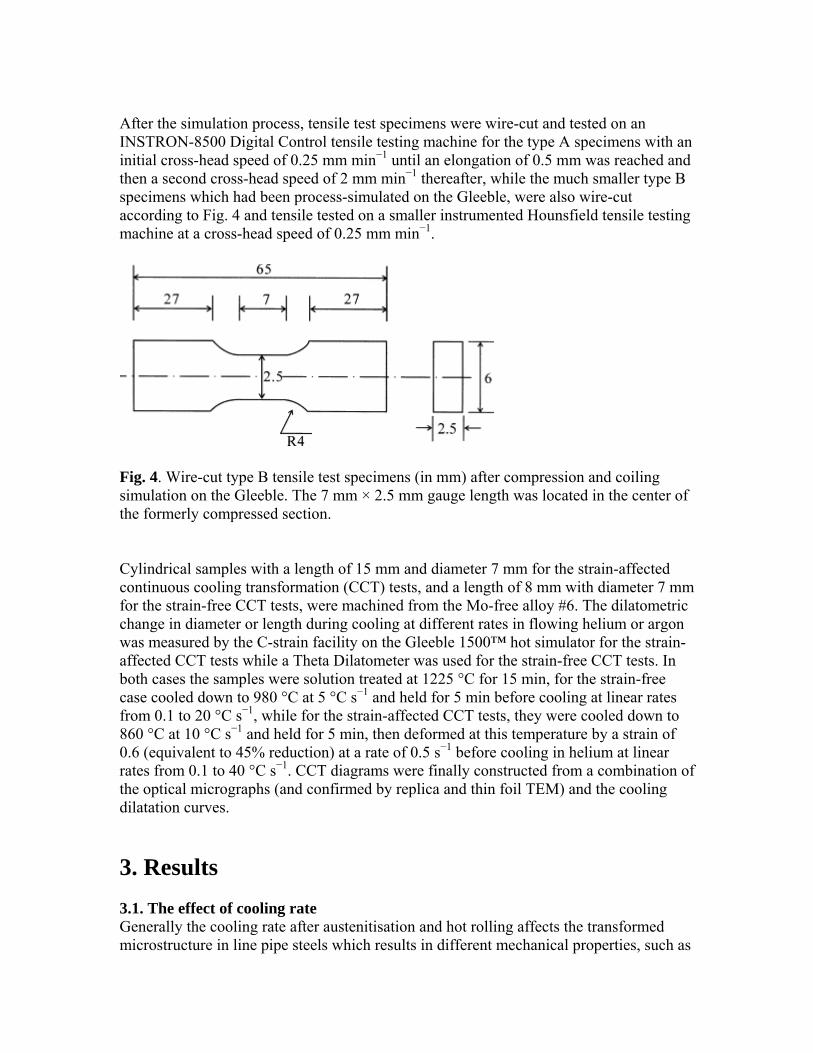
After the simulation process, tensile test specimens were wire-cut and tested on an INSTRON-8500 Digital Control tensile testing machine for the type A specimens with an initial cross-head speed of 0.25 mm min−1 until an elongation of 0.5 mm was reached and then a second cross-head speed of 2 mm min−1 thereafter, while the much smaller type B specimens which had been process-simulated on the Gleeble, were also wire-cut according to Fig. 4 and tensile tested on a smaller instrumented Hounsfield tensile testing machine at a cross-head speed of 0.25 mm min−1.
Fig. 4. Wire-cut type B tensile test specimens (in mm) after compression and coiling simulation on the Gleeble. The 7 mm × 2.5 mm gauge length was located in the center of the formerly compressed section. Cylindrical samples with a length of 15 mm and diameter 7 mm for the strain-affected continuous cooling transformation (CCT) tests, and a length of 8 mm with diameter 7 mm for the strain-free CCT tests, were machined from the Mo-free alloy #6. The dilatometric change in diameter or length during cooling at different rates in flowing helium or argon was measured by the C-strain facility on the Gleeble 1500™ hot simulator for the strain-affected CCT tests while a Theta Dilatometer was used for the strain-free CCT tests. In both cases the samples were solution treated at 1225 °C for 15 min, for the strain-free case cooled down to 980 °C at 5 °C s−1 and held for 5 min before cooling at linear rates from 0.1 to 20 °C s−1, while for the strain-affected CCT tests, they were cooled down to 860 °C at 10 °C s−1 and held for 5 min, then deformed at this temperature by a strain of 0.6 (equivalent to 45% reduction) at a rate of 0.5 s−1 before cooling in helium at linear rates from 0.1 to 40 °C s−1. CCT diagrams were finally constructed from a combination of the optical micrographs (and confirmed by replica and thin foil TEM) and the cooling dilatation curves.
3. Results 3.1. The effect of cooling rate Generally the cooling rate after austenitisation and hot rolling affects the transformed microstructure in line pipe steels which results in different mechanical properties, such as

yield strength (YS), ultimate tensile strength (UTS), elongation and impact toughness. To set a base-line, the two alloys #3 (0.09%Mo) and the Mo-free alloy #6 were selected first for studying the effect of cooling rate alone on the YS/UTS ratio. These specimens were from previously hot rolled and cooled plates which were re-austenitised at 1225 °C and cooled at different linear rates from 980 °C. The effect of cooling rate on the yield strength, the ultimate tensile strength and their ratio of the Mo-free line pipe steel is shown in Fig. 5(a). Both the yield strength and ultimate tensile strength increase with increasing cooling rate after soaking at 980 °C. The microstructures also changed with cooling rate with polygonal ferrite (PF) dominating at lower cooling rates, whereas acicular ferrite (AF) plus bainite dominated at high cooling rates (Fig. 5(b)–(e)), which increased the strength of the alloy.
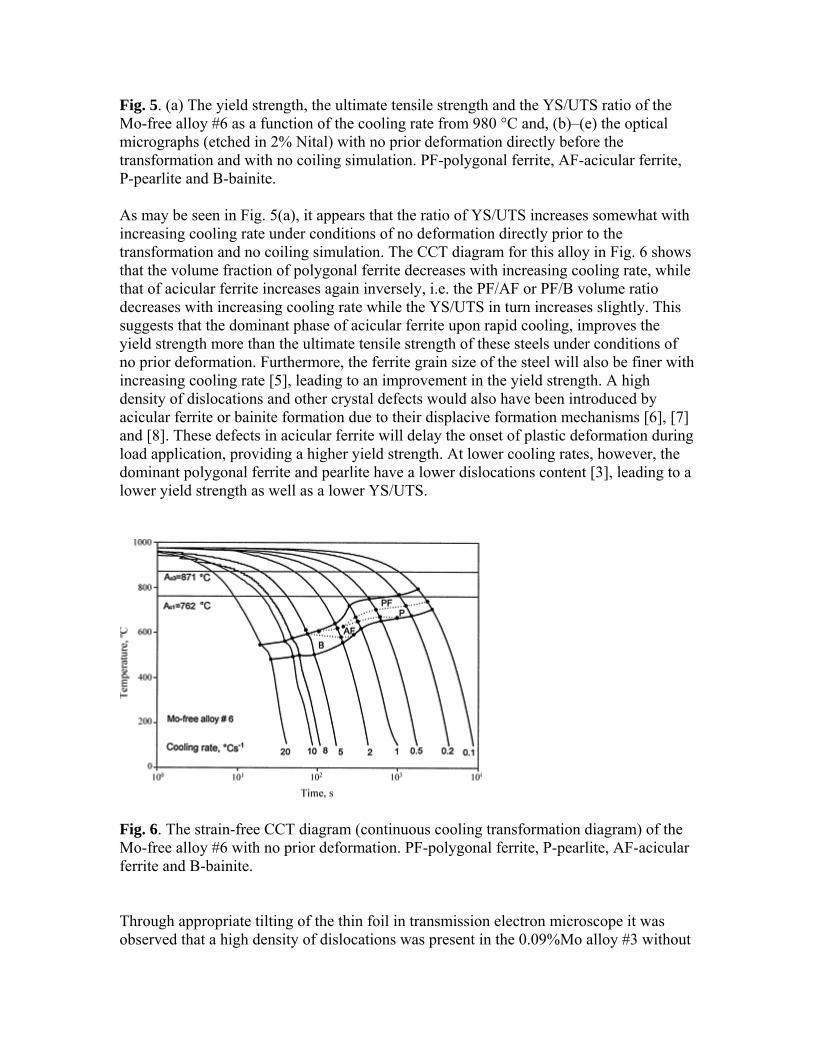
Fig. 5. (a) The yield strength, the ultimate tensile strength and the YS/UTS ratio of the Mo-free alloy #6 as a function of the cooling rate from 980 °C and, (b)–(e) the optical micrographs (etched in 2% Nital) with no prior deformation directly before the transformation and with no coiling simulation. PF-polygonal ferrite, AF-acicular ferrite, P-pearlite and B-bainite. As may be seen in Fig. 5(a), it appears that the ratio of YS/UTS increases somewhat with increasing cooling rate under conditions of no deformation directly prior to the transformation and no coiling simulation. The CCT diagram for this alloy in Fig. 6 shows that the volume fraction of polygonal ferrite decreases with increasing cooling rate, while that of acicular ferrite increases again inversely, i.e. the PF/AF or PF/B volume ratio decreases with increasing cooling rate while the YS/UTS in turn increases slightly. This suggests that the dominant phase of acicular ferrite upon rapid cooling, improves the yield strength more than the ultimate tensile strength of these steels under conditions of no prior deformation. Furthermore, the ferrite grain size of the steel will also be finer with increasing cooling rate [5], leading to an improvement in the yield strength. A high density of dislocations and other crystal defects would also have been introduced by acicular ferrite or bainite formation due to their displacive formation mechanisms [6], [7] and [8]. These defects in acicular ferrite will delay the onset of plastic deformation during load application, providing a higher yield strength. At lower cooling rates, however, the dominant polygonal ferrite and pearlite have a lower dislocations content [3], leading to a lower yield strength as well as a lower YS/UTS.
Fig. 6. The strain-free CCT diagram (continuous cooling transformation diagram) of the Mo-free alloy #6 with no prior deformation. PF-polygonal ferrite, P-pearlite, AF-acicular ferrite and B-bainite. Through appropriate tilting of the thin foil in transmission electron microscope it was observed that a high density of dislocations was present in the 0.09%Mo alloy #3 without
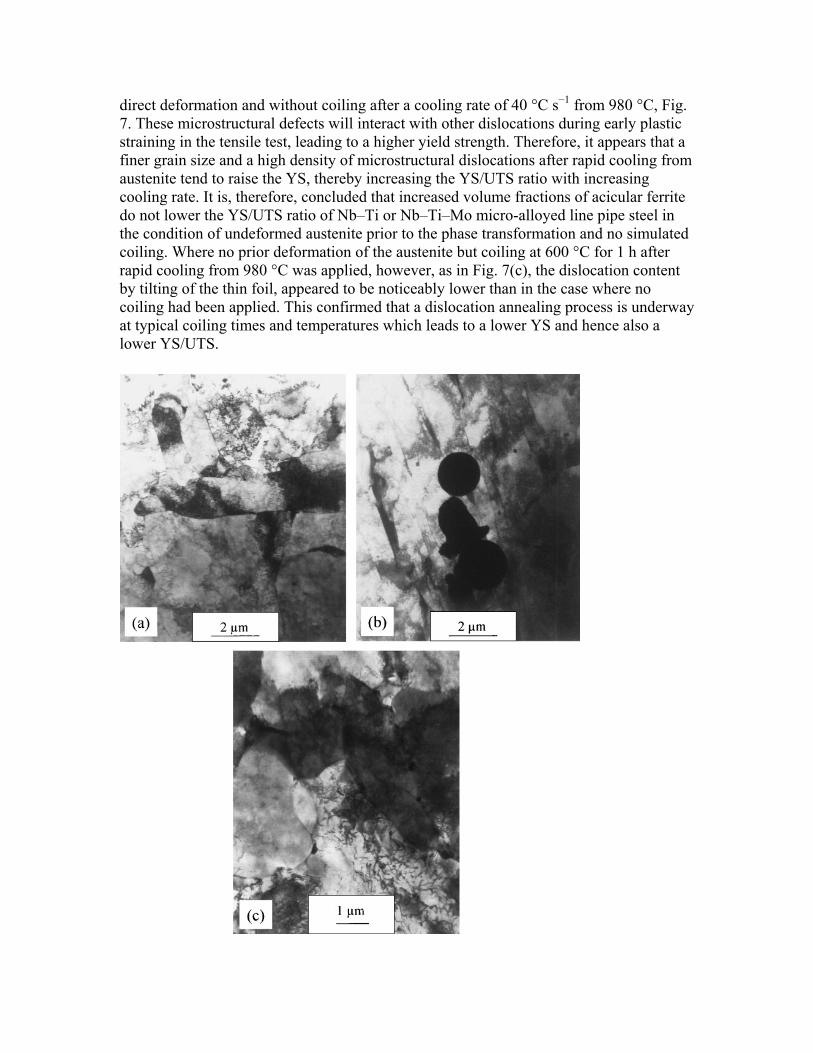
direct deformation and without coiling after a cooling rate of 40 °C s−1 from 980 °C, Fig. 7. These microstructural defects will interact with other dislocations during early plastic straining in the tensile test, leading to a higher yield strength. Therefore, it appears that a finer grain size and a high density of microstructural dislocations after rapid cooling from austenite tend to raise the YS, thereby increasing the YS/UTS ratio with increasing cooling rate. It is, therefore, concluded that increased volume fractions of acicular ferrite do not lower the YS/UTS ratio of Nb–Ti or Nb–Ti–Mo micro-alloyed line pipe steel in the condition of undeformed austenite prior to the phase transformation and no simulated coiling. Where no prior deformation of the austenite but coiling at 600 °C for 1 h after rapid cooling from 980 °C was applied, however, as in Fig. 7(c), the dislocation content by tilting of the thin foil, appeared to be noticeably lower than in the case where no coiling had been applied. This confirmed that a dislocation annealing process is underway at typical coiling times and temperatures which leads to a lower YS and hence also a lower YS/UTS.
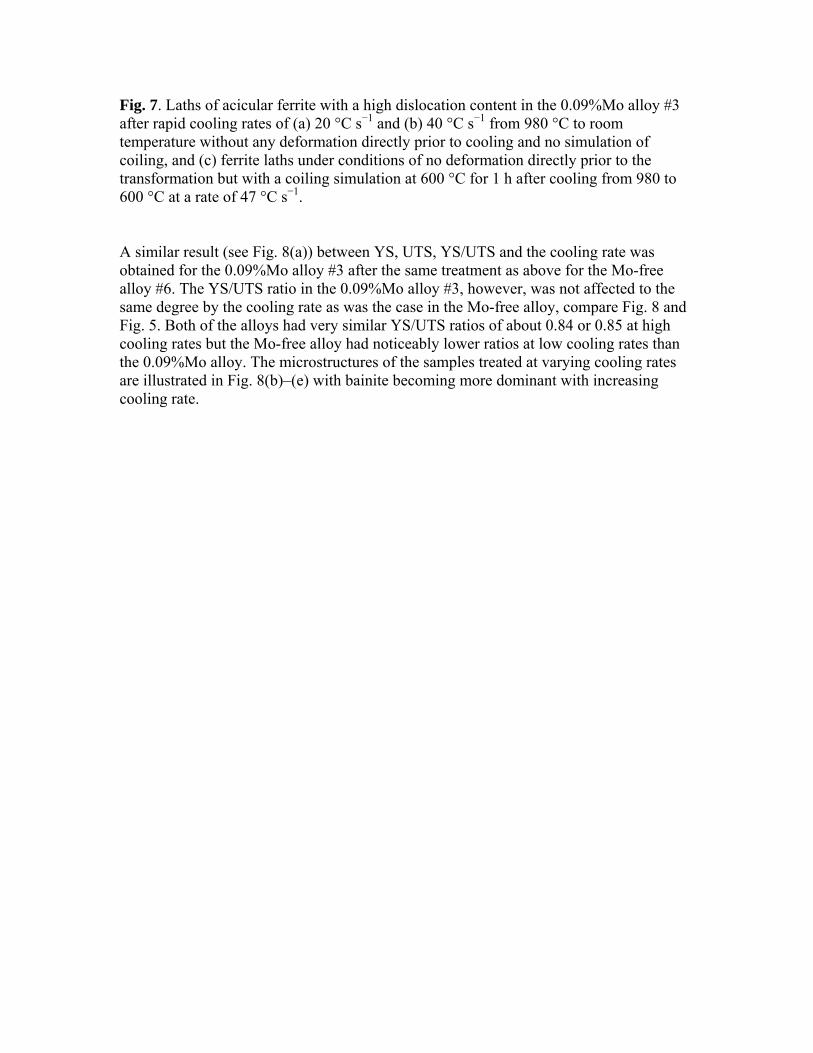
Fig. 7. Laths of acicular ferrite with a high dislocation content in the 0.09%Mo alloy #3 after rapid cooling rates of (a) 20 °C s−1 and (b) 40 °C s−1 from 980 °C to room temperature without any deformation directly prior to cooling and no simulation of coiling, and (c) ferrite laths under conditions of no deformation directly prior to the transformation but with a coiling simulation at 600 °C for 1 h after cooling from 980 to 600 °C at a rate of 47 °C s−1. A similar result (see Fig. 8(a)) between YS, UTS, YS/UTS and the cooling rate was obtained for the 0.09%Mo alloy #3 after the same treatment as above for the Mo-free alloy #6. The YS/UTS ratio in the 0.09%Mo alloy #3, however, was not affected to the same degree by the cooling rate as was the case in the Mo-free alloy, compare Fig. 8 and Fig. 5. Both of the alloys had very similar YS/UTS ratios of about 0.84 or 0.85 at high cooling rates but the Mo-free alloy had noticeably lower ratios at low cooling rates than the 0.09%Mo alloy. The microstructures of the samples treated at varying cooling rates are illustrated in Fig. 8(b)–(e) with bainite becoming more dominant with increasing cooling rate.
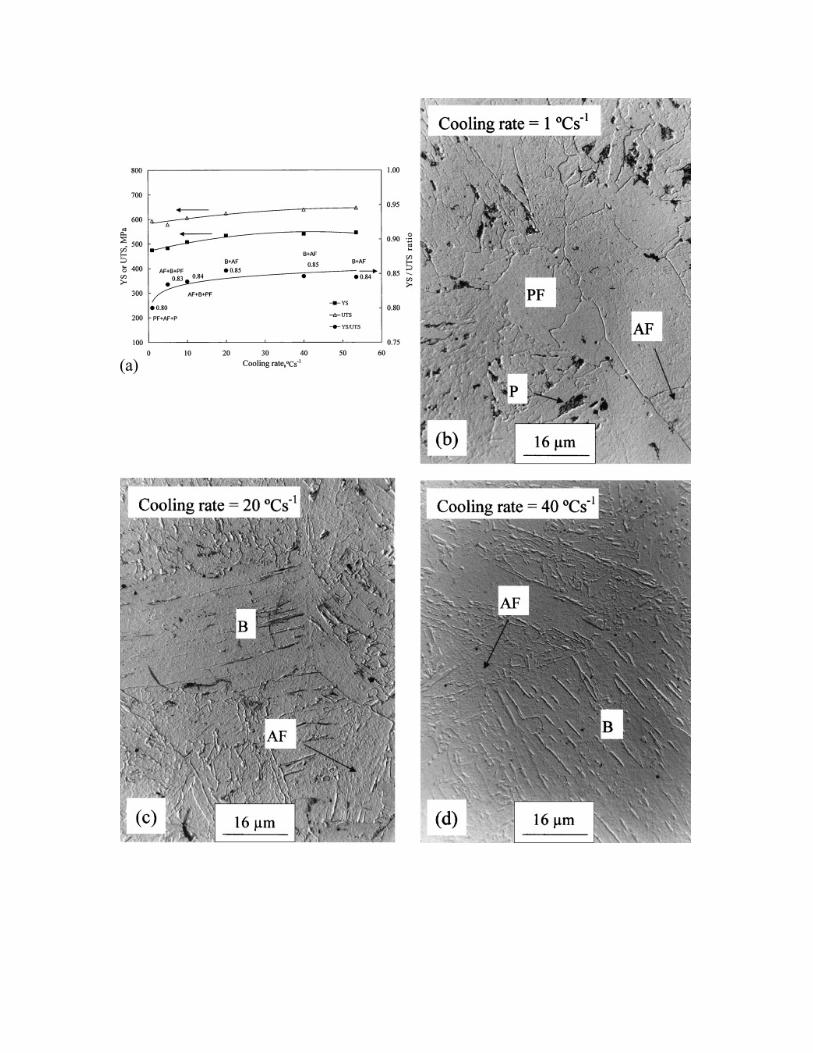
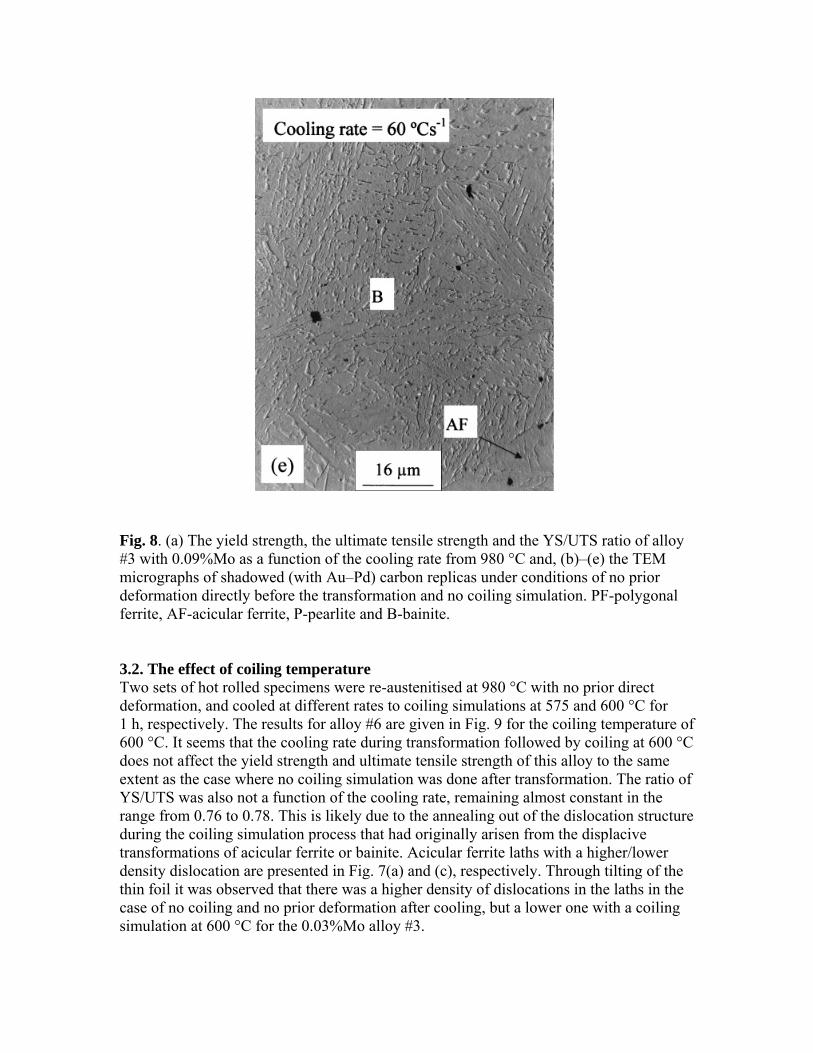
Fig. 8. (a) The yield strength, the ultimate tensile strength and the YS/UTS ratio of alloy #3 with 0.09%Mo as a function of the cooling rate from 980 °C and, (b)–(e) the TEM micrographs of shadowed (with Au–Pd) carbon replicas under conditions of no prior deformation directly before the transformation and no coiling simulation. PF-polygonal ferrite, AF-acicular ferrite, P-pearlite and B-bainite. 3.2. The effect of coiling temperature Two sets of hot rolled specimens were re-austenitised at 980 °C with no prior direct deformation, and cooled at different rates to coiling simulations at 575 and 600 °C for 1 h, respectively. The results for alloy #6 are given in Fig. 9 for the coiling temperature of 600 °C. It seems that the cooling rate during transformation followed by coiling at 600 °C does not affect the yield strength and ultimate tensile strength of this alloy to the same extent as the case where no coiling simulation was done after transformation. The ratio of YS/UTS was also not a function of the cooling rate, remaining almost constant in the range from 0.76 to 0.78. This is likely due to the annealing out of the dislocation structure during the coiling simulation process that had originally arisen from the displacive transformations of acicular ferrite or bainite. Acicular ferrite laths with a higher/lower density dislocation are presented in Fig. 7(a) and (c), respectively. Through tilting of the thin foil it was observed that there was a higher density of dislocations in the laths in the case of no coiling and no prior deformation after cooling, but a lower one with a coiling simulation at 600 °C for the 0.03%Mo alloy #3.
Fig. 9. (a) The yield strength, the ultimate tensile strength and the YS/UTS ratio of the Mo-free alloy #6 as a function of the cooling rate from 980 to 600 °C under conditions of no deformation prior to the transformation but with a subsequent coiling simulation at 600 °C for 1 h and, (b) and (c) the SEM micrographs (etched in 2% Nital). PF-polygonal ferrite, AF-acicular ferrite, P-pearlite and B-bainite. Fig. 10 shows the results of the tensile tests and the microstructures of alloy #6 for a coiling temperature of 575 °C. Similar results for this alloy were obtained than for the coiling simulation at 600 °C with the ratio of YS/UTS ranging from 0.75 to 0.80. It was concluded that varying the coiling temperature within the range of 575–600 °C did not substantially influence the ratio of YS/UTS for the entire cooling rate range of 1 to 60 °C s−1 in the Mo-free alloy #6.
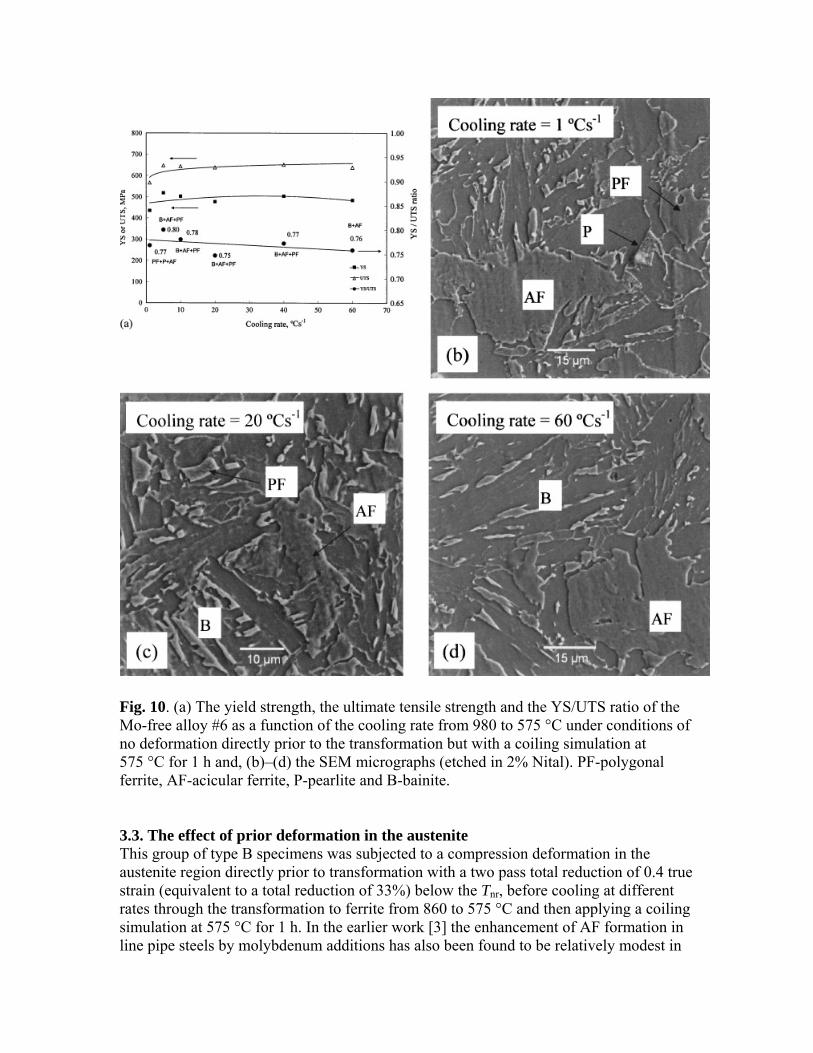
Fig. 10. (a) The yield strength, the ultimate tensile strength and the YS/UTS ratio of the Mo-free alloy #6 as a function of the cooling rate from 980 to 575 °C under conditions of no deformation directly prior to the transformation but with a coiling simulation at 575 °C for 1 h and, (b)–(d) the SEM micrographs (etched in 2% Nital). PF-polygonal ferrite, AF-acicular ferrite, P-pearlite and B-bainite. 3.3. The effect of prior deformation in the austenite This group of type B specimens was subjected to a compression deformation in the austenite region directly prior to transformation with a two pass total reduction of 0.4 true strain (equivalent to a total reduction of 33%) below the Tnr, before cooling at different rates through the transformation to ferrite from 860 to 575 °C and then applying a coiling simulation at 575 °C for 1 h. In the earlier work [3] the enhancement of AF formation in line pipe steels by molybdenum additions has also been found to be relatively modest in
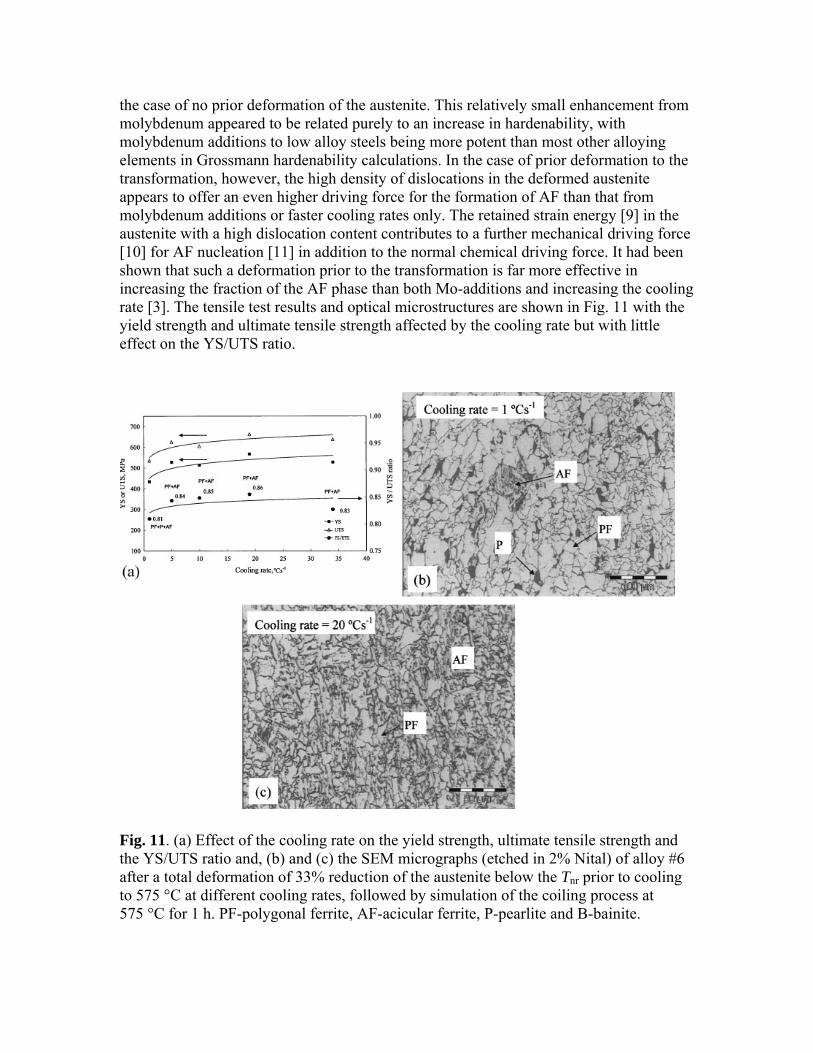
the case of no prior deformation of the austenite. This relatively small enhancement from molybdenum appeared to be related purely to an increase in hardenability, with molybdenum additions to low alloy steels being more potent than most other alloying elements in Grossmann hardenability calculations. In the case of prior deformation to the transformation, however, the high density of dislocations in the deformed austenite appears to offer an even higher driving force for the formation of AF than that from molybdenum additions or faster cooling rates only. The retained strain energy [9] in the austenite with a high dislocation content contributes to a further mechanical driving force [10] for AF nucleation [11] in addition to the normal chemical driving force. It had been shown that such a deformation prior to the transformation is far more effective in increasing the fraction of the AF phase than both Mo-additions and increasing the cooling rate [3]. The tensile test results and optical microstructures are shown in Fig. 11 with the yield strength and ultimate tensile strength affected by the cooling rate but with little effect on the YS/UTS ratio.
Fig. 11. (a) Effect of the cooling rate on the yield strength, ultimate tensile strength and the YS/UTS ratio and, (b) and (c) the SEM micrographs (etched in 2% Nital) of alloy #6 after a total deformation of 33% reduction of the austenite below the Tnr prior to cooling to 575 °C at different cooling rates, followed by simulation of the coiling process at 575 °C for 1 h. PF-polygonal ferrite, AF-acicular ferrite, P-pearlite and B-bainite.

4. Discussion Comparing the two cases, in the first case without any direct prior deformation (Fig. 10), a high cooling rate introduces a heavily dislocated microstructure from the acicular ferrite or bainite micro-constituents which undergo displacive transformations from the austenite, leading to a relatively strong effect of increasing cooling rate in raising the YS, UTS as well as the ratio YS/UTS. This microstructural effect is, however, sharply diminished thereafter during a 60 min coiling simulation at either 575 or 600 °C through a recovery process of dislocation annealing and rearrangement. This makes the tensile properties after coiling less sensitive to the cooling rate during the transformation to ferrite for a treatment with coiling than one without coiling. This may lead one to conclude that the often believed beneficial effects of bainitic and acicular ferritic micro-constituents in line-pipe steels may not necessarily lie per se in their microstructural presence but rather in their associated dislocation structures. In the case of a total prior deformation of 0.4 true strain (33% reduction) of the austenite below the Tnr directly before the transformation (Fig. 11), the dislocations introduced from the deformation do not necessarily “survive” the phase transformation to acicular ferrite [3] but the deformation does induce a finer and dislocated “pan caked” austenite grain size before transformation that will provide a high nucleation rate of the acicular ferrite during the transformation [3], leading to a finer ferrite grain size. The yield strength is sensitive to ferrite grain size [12] and [13] through the Hall-Petch relationship, whereas the ultimate tensile strength is not as sensitive to the grain size [12]. All of these can increase the obstacles for the commencement of plastic deformation and will result in a higher yield strength of the steel, thereby raising the YS/UTS ratios again to levels of 0.84–0.86 if compared to the lower levels of 0.76–0.77 where only coiling but no prior deformation had been applied. As can be seen in Fig. 12, the PF decreases while the AF increases with increasing cooling rate after a total compression strain of 0.6 below the Tnr at 860 °C at a strain rate of 0.5 s−1, i.e. the PF/AF volume ratio reduces with an increase in cooling rate, very similarly as for the case of no direct deformation prior to the transformation (see Fig. 6). The YS/UTS ratio, however, in the case of total prior deformation of 33% reduction in the austenite below the Tnr, is higher but remains level for all cooling rates (Fig. 11) if compared to the case without any prior deformation to the transformation (Fig. 10). The YS/UTS ratio, therefore, is sensitive to the PF/AF volume ratio under conditions of no prior deformation to the transformation, but not within a prior deformed austenite.
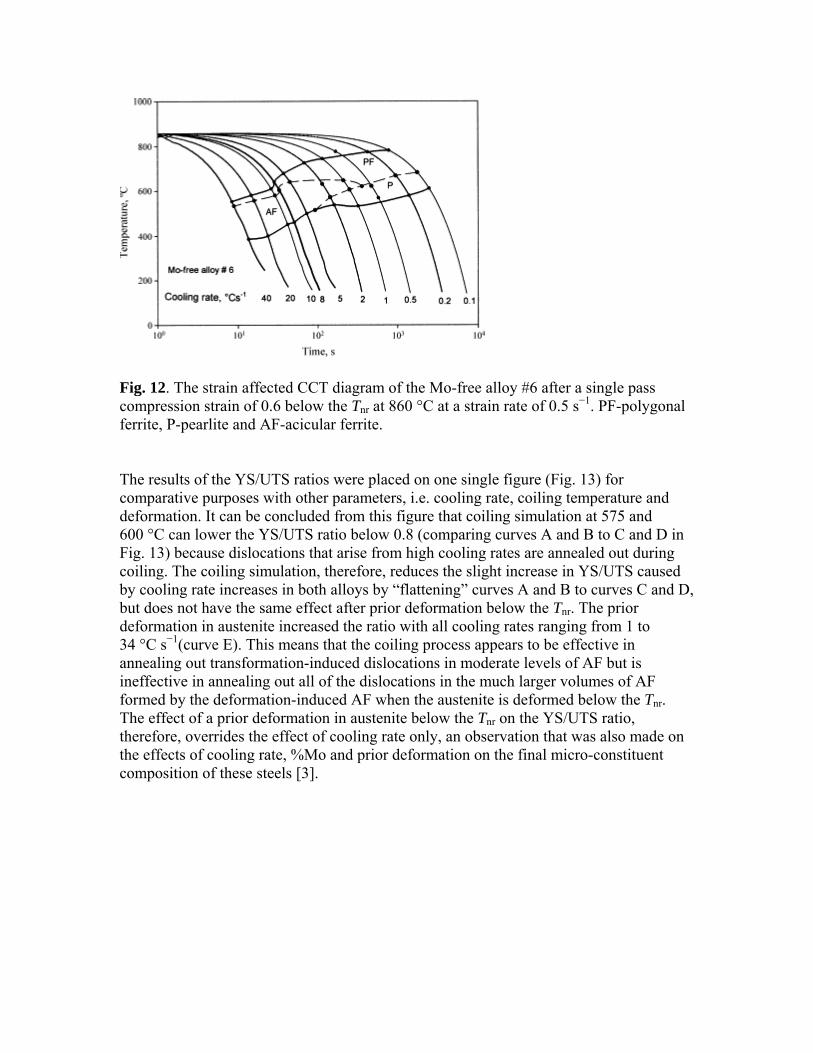
Fig. 12. The strain affected CCT diagram of the Mo-free alloy #6 after a single pass compression strain of 0.6 below the Tnr at 860 °C at a strain rate of 0.5 s−1. PF-polygonal ferrite, P-pearlite and AF-acicular ferrite. The results of the YS/UTS ratios were placed on one single figure (Fig. 13) for comparative purposes with other parameters, i.e. cooling rate, coiling temperature and deformation. It can be concluded from this figure that coiling simulation at 575 and 600 °C can lower the YS/UTS ratio below 0.8 (comparing curves A and B to C and D in Fig. 13) because dislocations that arise from high cooling rates are annealed out during coiling. The coiling simulation, therefore, reduces the slight increase in YS/UTS caused by cooling rate increases in both alloys by “flattening” curves A and B to curves C and D, but does not have the same effect after prior deformation below the Tnr. The prior deformation in austenite increased the ratio with all cooling rates ranging from 1 to 34 °C s−1(curve E). This means that the coiling process appears to be effective in annealing out transformation-induced dislocations in moderate levels of AF but is ineffective in annealing out all of the dislocations in the much larger volumes of AF formed by the deformation-induced AF when the austenite is deformed below the Tnr. The effect of a prior deformation in austenite below the Tnr on the YS/UTS ratio, therefore, overrides the effect of cooling rate only, an observation that was also made on the effects of cooling rate, %Mo and prior deformation on the final micro-constituent composition of these steels [3].

Fig. 13. Comparing the effect of the cooling rate on the YS/UTS ratio with different thermo-mechanical treatments for samples without prior deformation and coiling simulation (curves A and B for alloys #6 and #3), with coiling simulation at 600 and 575 °C and no prior deformation (curves C and D for alloy #6) and 33% reduction below the Tnr and coiling simulation at 575 °C (curve E for alloy #6).
5. Conclusions • The YS/UTS ratio in a Mo-free alloy with 0.066%C, 0.037%Nb and 0.017%Ti with no prior deformation and no simulated coiling was found to be only sensitive to cooling rate from 980 °C, i.e. to the transformed microstructures. • In the case of no prior deformation in the austenite and no coiling simulation, an 0.09%Mo addition to the Nb–Ti line pipe steel appears to increase the YS/UTS ratio above that of a Mo-free steel at low cooling rates but this effect disappears at high cooling rates where no difference between the two steels is evident. • Varying the coiling temperature between 575 and 600 °C did not affect the YS/UTS ratio but coiling in general diminishes the effect of cooling rate on this ratio, most likely through annealing of the high dislocation content of AF in the microstructure. • The often stated beneficial effect of AF in lowering the YS/UTS ratio must, therefore, be approached with some caution as these observations are invariably based on tests where no coiling had been performed. • A prior deformation of 33% below the Tnr in the austenite followed by cooling at rates between 1 and 34 °C s−1 and then coiling at 575 °C strongly increases the YS/UTS ratio to levels between 0.81 and 0.86 at all cooling rates and overshadows the effects of microstructure or cooling rate on this ratio.

References [1] K. Junhua, Z. Lin, G. Bin, L. Pinghe, W. Aihua and X. Changsheng, Mater. Des. 25 (2004), pp. 723–728. [2] M. Pontremoli, P. Bufalini, A. Aprile and C. Jannone, Met. Tech. 11 (November) (1984), pp. 504–514. [3] Z. Tang and W. Stumpf, Mater. Charact. 59 (2008), pp. 717–728. [4] Z. Tang, Optimising the transformation and yield to tensile strength ratio of Nb–Ti microalloyed low carbon line pipe steels through alloy and microstructural control, PhD Thesis, University of Pretoria, 2007, http://upetd.up.ac.za/UPeTD.htm. [5] M.-C. Zhao, K. Yang and Y.-Y. Shan, Mater. Sci. Eng. A 335 (2002), pp. 14–20. [6] M.-C. Zhao, K. Yang, F.-R. Xiao and Y.-Y. Shan, Mater. Sci. Eng. A 355 (2003), pp. 126–136. [7] N.J. Kim, J. Met. (April) (1983), pp. 21–27. [8] S.W. Thompson, D.J. Colvin and G. Krauss, Metall. Trans. A 21 (1990), pp. 1493–1507. [9] A.A.B. Sugden and H.K.D.H. Bhadeshia, Metall. Trans. A 20 (September) (1989), pp. 1811–1818. [10] S.S. Babu and H.K.D.H. Bhadeshia, Mater. Sci. Eng. A 156 (1992), pp. 1–9. [11] G.I. Rees and H.K.D.H. Bhadeshia, Mater. Sci. Technol. 10 (May) (1994), pp. 353–358. [12] S.N. Prasad and D.S. Sarma, Mater. Sci. Eng. A 408 (2005), pp. 53–63. [13] Y.M. Kim, S.K. Kim, Y.J. Lim and N.J. Kim, ISIJ Int. 42 (12) (2002), pp. 1571–1577. Corresponding author at: Department of Metal Materials, Faculty of Materials Science and Engineering, Sichuan University, #24, South Section First, First Ring Road, Chengdu 610065, PR China. Tel.: +86 138 0802 1804; fax: +86 28 85416050.
Related Documents