The Effect of Low Back Pain Status and a Volitional Preemptive Abdominal Contraction on Dynamic Balance Test Performance in People with Low Back Pain by Troy L. Hooper MPT, PT, ATC, LAT A Dissertation In REHABILITATION SCIENCES Submitted to the Graduate Faculty of Texas Tech University Health Sciences Center in Partial Fulfillment of the Requirements for the Degree of DOCTOR OF PHILOSOPHY Approved Phillip S. Sizer Chair of Committee C. Roger James Jean-Michel Brismée Toby J. Rogers Kerry K. Gilbert Robin Satterwhite Dean of the School of Allied Health Sciences May, 2015

Welcome message from author
This document is posted to help you gain knowledge. Please leave a comment to let me know what you think about it! Share it to your friends and learn new things together.
Transcript
The Effect of Low Back Pain Status and a Volitional Preemptive Abdominal Contraction on Dynamic Balance Test Performance in People with Low Back Pain
by
Troy L. Hooper MPT, PT, ATC, LAT
A Dissertation
In
REHABILITATION SCIENCES
Submitted to the Graduate Faculty of Texas Tech University Health Sciences Center in
Partial Fulfillment of the Requirements for
the Degree of
DOCTOR OF PHILOSOPHY
Approved
Phillip S. Sizer Chair of Committee
C. Roger James
Jean-Michel Brismée
Toby J. Rogers
Kerry K. Gilbert
Robin Satterwhite Dean of the School of Allied Health Sciences
May, 2015

Copyright 2015, Troy L. Hooper
Texas Tech University Health Sciences Center, Troy L. Hooper, May 2015
ii
ACKNOWLEDGMENTS My journey here has been one of excitement and exhilaration alternating with
anxiety and frustration (and many long nights!). There is no way I could have
accomplished this goal without the help and support of many people. First, I would like
to express my sincere gratitude to my advisor and dissertation committee chair, Dr. Phil
Sizer. More than simply a committee chairman, he has been a friend, mentor and
inspiration for many years. His enthusiasm for teaching, research, and helping others is
contagious. Without his mentoring and support, I would not be here today.
I must thank my other committee members. Dr. C. Roger James patiently taught
me so much about biomechanics and statistics. Dr. Jean-Michel Brismée has challenged
me and enriched my ideas. His probing questions made me reach deeper. Dr. Toby
Rogers was a mentor as a young PT student. I am grateful that he was able to help me on
this journey. Thanks as well to Dr. Kerry Gilbert for his encouragement and willingness
to step in at the end. Thanks to my colleagues in the ScD and MAT programs who have
helped me by covering classes, assisting with data collection, and encouraging me to
finish. I am also indebted to Kevin Browne, whose help with data collection was
invaluable. Special thanks to the TTU Department of Health, Exercise, and Sport
Sciences for allowing me to collect data in their laboratory.
Most importantly, I want to thank my wife, Kimberly, who has been with me
every step of this journey. Thank you for always being there for me and encouraging me.
Thanks to my children, Emily, Jason, and Cassie, for your patience. It was so hard
working when I wanted to be with you. Finally, I must thank God for giving me the mind
and strength to complete this dissertation.
Texas Tech University Health Sciences Center, Troy L. Hooper, May 2015
iii
TABLE OF CONTENTS ACKNOWLEDGMENTS ......................................................................................................... ii ABSTRACT .......................................................................................................................... vi LIST OF TABLES ................................................................................................................. ix LIST OF FIGURES ................................................................................................................ X I. INTRODUCTION ............................................................................................................... 1
Statement of the Problem ............................................................................................................ 1 Background and Theory .............................................................................................................. 2 Need for the Study ....................................................................................................................... 4 Purpose ........................................................................................................................................ 5 Research Questions ...................................................................................................................... 5 Hypotheses ................................................................................................................................... 6
II. REVIEW OF LITERATURE .............................................................................................. 9 Low Back Pain ............................................................................................................................. 9 Lumbopelvic Stability ............................................................................................................... 13
Trunk Muscle Anatomy and Classification ........................................................................... 15 Superficial Musculature ...................................................................................................................16 Segmental Musculature ....................................................................................................................17
Trunk Muscle Contributions to Lumbopelvic Stability ........................................................ 19 Hip Muscle Anatomy ............................................................................................................ 24
Trunk Muscular and Kinematic Changes with Low Back Pain ................................................ 26 Distal Consequences of LBP ..................................................................................................... 36
Balance and Low Back Pain .................................................................................................. 36 The Regional Interdependence Model .................................................................................. 41
Lower Extremity Muscle Activity and Low Back Pain ...................................................................43 Lower Extremity Kinematics and Low Back Pain ...........................................................................47
LE Injury Mechanisms .......................................................................................................... 50 Anterior Cruciate Ligament .............................................................................................................50 Patellofemoral Pain Syndrome .........................................................................................................53 Iliotibial Band Friction Syndrome ...................................................................................................54 Groin and Hamstring ........................................................................................................................56
Potential Link Between Low Back Pain and Knee Injury .................................................... 59 VPAC and Its Potential Influence ............................................................................................. 64
VPAC and Lumbopelvic Stability ......................................................................................... 64 VPAC and Lower Extremity Control Parameters ................................................................. 68 Potential VPAC Disadvantages ............................................................................................. 71
Star Excursion Balance Test ...................................................................................................... 73 III. METHODS ................................................................................................................... 83
Operational Definitions ............................................................................................................. 83 Assumptions .............................................................................................................................. 85 Design ........................................................................................................................................ 85 Subjects ...................................................................................................................................... 86 Questionnaires ........................................................................................................................... 88 Procedures ................................................................................................................................. 89
Texas Tech University Health Sciences Center, Troy L. Hooper, May 2015
iv
Study-1 Data Collection Procedures ..................................................................................... 89 Study-1 Preparatory Procedures .......................................................................................................89 Study-1 Testing Procedures .............................................................................................................89
Study-2 and Study-3 Data Collection .................................................................................... 91 Study-2 and Study-3 Preparatory Procedures ..................................................................................91 Study-2 Testing Procedures .............................................................................................................94
Submaximal Reference Contractions ..........................................................................................94 Y-Balance Testing .......................................................................................................................96
Data Reduction ...................................................................................................................... 97 Dependent Variables for Study-1 .......................................................................................... 98 Statistical Analysis for Study-1 ............................................................................................. 98 Dependent Variables for Study-2 and Study-3 ..................................................................... 99 Statistical Analysis for Study-2 ............................................................................................. 99 Statistical Analysis for Study-3 ........................................................................................... 100
IV. DYNAMIC BALANCE AS MEASURED BY THE Y-BALANCE TEST IS REDUCED IN PERSONS WITH BOTH CURRENT LOW BACK PAIN AND LOW BACK PAIN HISTORY ... 102
Abstract .................................................................................................................................... 102 Introduction ............................................................................................................................. 104 Methods ................................................................................................................................... 108
Experimental Design ........................................................................................................... 108 Subjects ............................................................................................................................... 108 Testing Procedures .............................................................................................................. 109 Statistical Analysis .............................................................................................................. 111
Results ..................................................................................................................................... 112 Discussion ................................................................................................................................ 112
Limitations .......................................................................................................................... 116 Conclusion ............................................................................................................................... 116 References ............................................................................................................................... 121
V. THE EFFECT OF LOW BACK PAIN STATUS ON BIOMECHANICAL MEASURES OF DYNAMIC BALANCE TEST PERFORMANCE IN PEOPLE WITH EXISTING AND A HISTORY OF RECURRENT LOW BACK PAIN .................................................................................. 125
Abstract .................................................................................................................................... 125 Introduction ............................................................................................................................. 127 Methods ................................................................................................................................... 129
Experimental Design ........................................................................................................... 129 Subjects ............................................................................................................................... 129
Procedures ............................................................................................................................... 130 Preparatory Procedures and Instrumentation ...................................................................... 130 Data Collection Procedures ................................................................................................. 132 Data Analysis ...................................................................................................................... 133 Statistical Analysis .............................................................................................................. 135
Results ..................................................................................................................................... 135 Anterior Reach .................................................................................................................... 136 Posterolateral Reach ............................................................................................................ 136 Posteromedial Reach ........................................................................................................... 137
Discussion ................................................................................................................................ 137 Limitations .......................................................................................................................... 140
Conclusion ............................................................................................................................... 140
Texas Tech University Health Sciences Center, Troy L. Hooper, May 2015
v
References ............................................................................................................................... 147 VI. THE EFFECT OF A VOLITIONAL PREEMPTIVE ABDOMINAL CONTRACTION ON TRUNK AND LOWER LIMB BIOMECHANICS IN PEOPLE WITH LOW BACK PAIN .......... 150
Abstract .................................................................................................................................... 150 Introduction ............................................................................................................................. 152 Methods ................................................................................................................................... 154
Experimental Design ........................................................................................................... 154 Subjects ............................................................................................................................... 154
Procedures ............................................................................................................................... 155 Data Collection Procedures ................................................................................................. 155 Data Reduction .................................................................................................................... 158 Statistical Analysis .............................................................................................................. 159
Results ..................................................................................................................................... 160 Anterior Reach .................................................................................................................... 161 Posterolateral Reach ............................................................................................................ 161 Posteromedial Reach ........................................................................................................... 162
Discussion ................................................................................................................................ 163 Limitations .......................................................................................................................... 166
Conclusion ............................................................................................................................... 167 References ............................................................................................................................... 178
VII. DISCUSSION AND CONCLUSION .............................................................................. 182 Discussion ................................................................................................................................ 182 Conclusion ............................................................................................................................... 187
Limitations of the Study ...................................................................................................... 187 Delimitations of the Study ....................................................................................................... 188 Recommendations for Future Research ................................................................................... 189
REFERENCES ................................................................................................................... 190
A. MEDICAL HISTORY QUESTIONNAIRE ....................................................................... 218 B. BAECKE PHYSICAL ACTIVITY QUESTIONNAIRE ....................................................... 220 C. ROLAND MORRIS DISABILITY QUESTIONNAIRE ...................................................... 226 D. FEAR AVOIDANCE BELIEFS QUESTIONNAIRE ........................................................... 229 E. MEANS (SD) OF STUDY-3 EMG AND KINEMATIC VARIABLES ................................ 232
Texas Tech University Health Sciences Center, Troy L. Hooper, May 2015
vi
ABSTRACT Balance disturbances and trunk muscle activity changes are commonly observed with
low back pain (LBP), and these changes often persist after the pain is resolved.
Therefore, simple clinical tests are needed to detect dynamic balance deficits in this
population. The Y-Balance Test (YBT) may detect balance deficits in people with LBP
or a LBP history. Additionally, LBP reduces lumbopelvic stability, which is necessary
for efficient lower extremity (LE) movement, so individuals with LBP may exhibit LE
biomechanical changes. Volitional preemptive abdominal contractions (VPAC), such as
the abdominal bracing maneuver (ABM), increase lumbopelvic stability and influence
lower extremity movement patterns, which may reduce injury risk. This dissertation
included three studies that examined relationships among LBP, VPAC, postural control
and Y-Balance Test performance. Study-1 examined differences in Y-Balance Test
scores among three groups: current LBP (cLBP), a LBP history with no present
symptoms (hxLBP), and a healthy control group. Study-2 examined the effects of LBP
status on trunk, pelvic, and lower extremity control variables (muscle activity and joint
angles) during the Y-Balance Test. The purpose of Study-3 was to determine whether
ABM performance changes trunk and lower extremity control variables during the Y-
Balance Test and whether these changes are different in LBP or hxLBP groups compared
to the control.
Each group consisted of fourteen subjects (8 males and 6 females) between the ages
of 18 and 50 yr (30.93 ± 7.2 yr) who were matched for age, body mass index (BMI), and
activity level. For Study-1 subjects completed three trials of the Y-Balance Test in the
anterior (ANT), posterolateral (PL), and posteromedial (PM) directions while standing on

Texas Tech University Health Sciences Center, Troy L. Hooper, May 2015
vii
their dominant (i.e., kicking) leg. For the other two studies, subjects completed three Y-
Balance Test trials in the ANT, PL, and PM directions and an additional three trials in
each direction while maintaining an ABM contraction. Electromyography (EMG) of
three stance- and moving-side trunk muscles and six stance-limb hip and thigh muscles
was collected. In addition, trunk, pelvis, and stance-limb hip, knee, and ankle 3-
dimensional kinematics were recorded.
Study-1 used three independent-samples one-way analyses of variance (ANOVAs) to
examine between-group differences and found that reach distances for the control group
were significantly longer than the cLBP and hxLBP groups in the PL (control = 105.76 ±
6.62 cm; cLBP = 94.73 ± 10.56 cm; hxLBP = 94.16 ± 9.19 cm; p = .002) and PM
(control = 109.29 ± 6.65 cm; cLBP = 100.70 ± 8.36 cm; hxLBP = 102.26 cm ± 7.63; p =
.011) directions, but no differences were found for the ANT direction (control = 66.44 ±
7.00 cm; cLBP = 66.15 ± 6.23 cm; hxLBP = 66.40 ± 3.10cm; p = .990). A significant
negative correlation was found in the cLBP group between BMI and PM reach distance (r
= -.579, p = .030). For Study-2, group EMG differences were examined using Kruskal-
Wallis tests, and group kinematics differences were tested using one-way ANOVAs.
Trunk flexion during PL reach was reduced in the two LBP groups (p = .023), and ankle
dorsiflexion was increased in the hxLBP and cLBP groups compared to the control group
(p = .040). During PM reach trunk flexion was reduced in the LBP groups (p = .043), and
a trend toward increased ankle dorsiflexion was observed (p = .061). Similarly, the LBP
groups increased ankle dorsiflexion (p = .014) with a trend toward decreased trunk
flexion (p = .054). No EMG differences were observed among the three groups. In
Study-3, kinematic and EMG data were analyzed using 3 (group) x 2 (contraction) mixed

Texas Tech University Health Sciences Center, Troy L. Hooper, May 2015
viii
repeated measures ANOVAs. The ABM did not affect Y-Balance Test performance.
Abdominal muscle activity increased with ABM performance (p < .001), and, in general,
lower extremity muscle activity decreased. Additionally, ABM resulted in several trunk
and lower extremity kinematic changes. These changes were most prominent in the ANT
direction, and overall, the changes were most prominent in the control group.
These results show that the Y-Balance Test can measure dynamic balance deficits
in cLBP and hxLBP groups. Subjects in the LBP groups attempted to compensate for
their balance deficits by adopting a more rigid, upright trunk strategy and used greater
ankle dorsiflexion on the stance limb to improve reach distance. In addition, test
performance was not affected by the ABM, which indicates that this maneuver can be
performed as a protective strategy without impairing performance. The cLBP and hxLBP
groups used greater ankle dorsiflexion during ANT and PL reach. Abdominal muscle
activity increased with ABM performance and, in general, lower extremity muscle
activity, especially the VL and VM, decreased. This may have been the result of a more
stable proximal pelvis during the ABM condition, which allowed for more efficient
transfer of forces to the lower extremities thereby lessening the need for the muscles
controlling the knee to contribute to force production. The kinematic changes observed
with ABM performance might bring these regions into more optimal alignment for lower
extremity movements. Clinically, the Y-Balance Test should be incorporated into a LBP
rehabilitation program to evaluate dynamic balance and monitor rehabilitation
progression. Improving trunk flexion during functional activities may benefit LBP
sufferers, and these individuals can incorporate the ABM to improve lumbopelvic
stability and lower quarter biomechanics without degrading performance.

Texas Tech University Health Sciences Center, Troy L. Hooper, May 2015
ix
LIST OF TABLES 4.1. Demographic Data ................................................................................................... 119 4.2. Correlation Matrix of Reach Distances and Demographic Variables ...................... 120 5.1. Electromyographic Data .......................................................................................... 143 5.2. Joint and Segment Angles (degrees) at Maximum Reach for the Anterior Direction......................................................................................................................................... 144 5.3. Joint and Segment Angles (degrees) at Maximum Reach for the Posterolateral Direction ......................................................................................................................... 145 5.4. Joint and Segment Angles (degrees) at Maximum Reach for the Posteromedial Direction ......................................................................................................................... 146 6.1. Electromyography Signals That Met Normality Assumptions ................................ 170 6.2. Mean ± SD (95% Confidence Intervals) of Normalized Reach Distances (Mean ±SD) for Each Y-Balance Test Direction with and without ABM ........................................... 171 6.3. Results of 2-Way (3 X 2) Mixed ANOVAs Comparing Muscle Activity (as Percentage of subMVC) during Anterior Reach for the Control, Current LBP, and History of LBP Groups With and Without Abdominal Bracing Contraction .............................. 172 6.4. Results of 2-Way (3 X 2) Mixed ANOVAs Comparing Joint Angles at Maximum Anterior Reach for the Control, Current LBP, and History of LBP Groups With and Without Abdominal Bracing Contraction ....................................................................... 173 6.5. Results of 2-Way (3 X 2) Mixed ANOVAs Comparing Muscle Activity (as Percentage of subMVC) during Posterolateral Reach for the Control, Current LBP, and History of LBP Groups With and Without Abdominal Bracing Contraction ................. 174 6.6. Results of 2-Way (3 X 2) Mixed ANOVAs Comparing Joint Angles at Maximum Posterolateral Reach for the Control, Current LBP, and History of LBP Groups With and Without Abdominal Bracing Contraction ....................................................................... 175 6.7. Results of 2-Way (3 X 2) Mixed ANOVAs Comparing Muscle Activity (as Percentage of subMVC) during Posteromedial Reach for the Control, Current LBP, and History of LBP Groups With and Without Abdominal Bracing Contraction ................. 176 6.8. Results of 2-Way (3 X 2) Mixed ANOVAs Comparing Joint Angles at Maximum Posteromedial Reach for the Control, Current LBP, and History of LBP Groups With and Without Abdominal Bracing Contraction ....................................................................... 177 E.1 Means (SD) of Electromyographic Data (%subMaximal Contraction) ................... 232 E.2. Means (SD) of Joint Angles (degrees) at Maximum Reach .................................... 234
Texas Tech University Health Sciences Center, Troy L. Hooper, May 2015
x
LIST OF FIGURES 2.1 Star Excursion Balance Test reaching directions. Adapted from (Gribble, Hertel, & Denegar, 2007) .................................................................................................................. 75 2.2 The Y-Balance Test Kit. Adapted from performbetter.com ...................................... 77 2.3 The Y-Balance Test reach directions. (A) anterior, (B) posterolateral, (C) posteromedial. ................................................................................................................... 78 3.1 Anterior view of the marker set .................................................................................. 93 3.2 Posterior view of the marker set ................................................................................. 94 4.1. Normalized reach distances for current LBP, LBP history, and control groups. Error bars represent 95% confidence intervals. LBP = low back pain. ................................... 118 5.1. Normalized reach distances for current LBP, LBP history, and control groups. Error bars represent 95% confidence intervals. LBP = low back pain. ................................... 142 6.1. Group x Contraction interaction for pelvic sagittal plane joint angle during posteromedial reach. The control group posterior pelvic tilt significantly decreased with ABM. .............................................................................................................................. 168 6.2. Group x Contraction interaction for hip frontal plane joint angle during posteromedial reach. The control group hip adduction significantly increased with ABM.......................................................................................................................................... 169
Texas Tech University Health Sciences Center, Troy L. Hooper, May 2015
1
CHAPTER I
INTRODUCTION
STATEMENT OF THE PROBLEM
Low back pain (LBP) is an almost universal experience, with 75-90% of the
population being affected at some point in their lives (Andersson, 1999; Walker, Muller,
& Grant, 2004). Low back injuries place a large economic burden on society. The direct
cost of LBP in the United States is $90.6 billion (Luo, Pietrobon, Sun, Liu, & Hey, 2004).
While certain individuals only experience a single episode of LBP, this injury is often
recurrent in others (Hestbaek, Leboeuf-Yde, & Manniche, 2003) and results in a series of
relapsing and remitting episodes. Moreover, pain is not the only impairment found in
people with low back injuries, and the changes are not limited to the lumbar spine. For
example, balance disturbances, which lead to increased injury risk (Plisky, Rauh,
Kaminski, & Underwood, 2006), are commonly observed in this population (Ruhe, Fejer,
& Walker, 2011). The regional interdependence model supports such findings, as it
states that injury to one part of the body can have functional consequences both proximal
and distal to the injury site (Wainner, Whitman, Cleland, & Flynn, 2007). As a result,
LBP may be related to increased lower extremity injury risk. Simple clinical tests are
needed to detect functional changes, such as impaired balance, in LBP populations.
Lower extremity injuries are another common problem accompanied by large
financial costs. For example, the national collective cost of anterior cruciate ligament
reconstruction alone is estimated to reach 1.5 billion dollars each year (Boden, Dean,
Feagin, & Garrett, 2000). More than half of all injuries in collegiate athletics involve the

Texas Tech University Health Sciences Center, Troy L. Hooper, May 2015
2
lower extremity (Hootman, Dick, & Agel, 2007). Moreover, a large number of these
injuries do not involve contact, which implies that motor control or biomechanical
impairments may play a role in their development. Trunk muscle activation increases
lumbopelvic stability and influences lower extremity movement patterns, which may
reduce lower extremity injury risk (Haddas et al., 2013). Thus, it appears that trunk
stability serves as a connecting feature and common control parameter between injuries
of the lumbosacral spine and lower extremity.
BACKGROUND AND THEORY
Low back pain leads to changes in trunk muscle activity, where all muscles in the
region are potentially impacted. One consequence of these changes is that stability of the
lumbar spine and pelvis is reduced. Here the abdominal and lumbar musculature is no
longer capable of supporting the lumbar spine and restraining lumbar motion (Cholewicki
& McGill, 1996; Panjabi, 1992b). As a result, an initial episode of LBP often initiates a
cascade of events that ultimately leads to biomechanical and neuromuscular changes and
increases the risk of recurrent LBP episodes. Moreover, these changes may lead to
increased lower extremity injury risk (Wilkerson, Giles, & Seibel, 2012; Zazulak,
Hewett, Reeves, Goldberg, & Cholewicki, 2007).
People with LBP may display increased lower extremity injury risk for at least
two reasons. First, changes in trunk neuromuscular control in this population may lead to
decreased pelvic stability. The pelvis serves as the proximal base for the lower
extremities, and it must remain stable to allow efficient force transfer proximally and
distally. Because lower extremity control is dependent upon a stable pelvic base,
Texas Tech University Health Sciences Center, Troy L. Hooper, May 2015
3
individuals with LBP may exhibit biomechanical and neuromuscular changes that are
known to increase lower extremity injury risk, including altered hip and thigh muscle
activity, hip abduction, and knee valgus (Haddas et al., 2013; Hewett et al., 2005;
Powers, 2010). Second, LBP sufferers exhibit diminished postural control (Ruhe et al.,
2011), which is an additional lower extremity injury risk factor (Hrysomallis,
McLaughlin, & Goodman, 2007; McGuine, Greene, Best, & Leverson, 2000; Plisky et
al., 2006; Vrbanić, Ravlić-Gulan, Gulan, & Matovinović, 2007). Unfortunately, many of
these deficits do not improve as LBP resolves (Bouche, Stevens, Cambier, Caemaert, &
Danneels, 2005; van Dieën, Koppes, & Twisk, 2010), so individuals with a history of
LBP but no current symptoms may still have a heightened risk for balance and
neuromuscular impairments, where they may continue to experience an elevated risk for
lower extremity injuries despite resolution of their LBP symptoms.
The current methods used to detect postural control deficits are generally difficult
to operate and expensive. Additionally, they are not capable of measuring dynamic
postural control, which infers the individual’s ability to maintain balance when moving.
A need exists for simple and inexpensive tests of dynamic postural control that are
appropriate for clinical use. The Star Excursion Balance Test (SEBT) and a simplified
version of the tool called the Y-Balance Test, are commonly used measures of dynamic
postural stability. These tests are able to detect postural deficits in people with lower
extremity injuries, such as chronic ankle instability, patellofemoral pain syndrome
(PFPS), and ACL injury (Gribble, Hertel, & Plisky, 2012). More recently, the SEBT has
been used to detect these deficits in a chronic LBP population (Ganesh, Ganesh, Chhabra,
Chhabra, & Mrityunjay, 2014). In addition to their role in quantifying postural control,

Texas Tech University Health Sciences Center, Troy L. Hooper, May 2015
4
the dynamic nature of the SEBT and Y-Balance Test render them as potentially useful
tools for measuring differences in lower quarter neuromuscular and biomechanical
patterns between LBP groups and those with no history of this injury. However, because
of time and fatigue considerations, the more limited Y-Balance Test may be more a more
appropriate testing apparatus in this population.
Finally, a common approach to LBP rehabilitation involves instruction in
techniques designed to improve trunk muscle control and improve lumbopelvic stability
(McGill & Karpowicz, 2009). Patients are instructed to preemptively contract their
abdominal and lumbar paraspinal musculature in an attempt to increase segmental
stiffness and control. While these techniques have been successfully used to decrease
LBP, they may play an additional role in improving lower extremity biomechanics and
neuromuscular responses.
NEED FOR THE STUDY
Many studies have documented abdominal and lumbar paraspinal neuromuscular
changes in individuals with recurrent LBP. These impairments lead to clinical instability
and contribute to further LBP episodes. The role these changes may play in altering
lower extremity movement patterns is less defined. Further studies are needed to
quantify how neuromuscular changes known to correspond with a LBP history affect
lower extremity muscular activity and kinematics.
Volitional preemptive abdominal contraction (VPAC) strategies are frequently
taught to LBP patients as a means of improving lumbopelvic stability. These techniques
may improve lower extremity movement patterns, as well as dynamic balance and
Texas Tech University Health Sciences Center, Troy L. Hooper, May 2015
5
postural control. Moreover, simple tests that can be easily implemented by clinicians are
needed to detect dynamic postural control changes in this population. The Y-Balance
Test can detect these changes in people with lower extremity injuries and recent evidence
supports its use in LBP populations.
PURPOSE
The purpose of this project was to determine the effect of both current LBP and a
LBP history with no present symptoms on lower extremity neuromuscular and kinematic
variables and performance scores produced during completion of the Y-Balance Test. An
additional purpose was to determine whether incorporating a VPAC changes these lower
extremity control variables. These purposes were achieved in three studies.
RESEARCH QUESTIONS
Study-1
1) What are the differences in Y-Balance Test scores among active recurrent LBP
patients (cLBP), people with a LBP history who are currently pain-free (hxLBP),
and people with no history of LBP (control)?
2) What is the relationship between Y-Balance Test scores and activity level and
body mass index?
3) What is the relationship between Y-Balance Test scores and current pain level and
disability measurements in the cLBP group and disability measures in the hxLBP?
Study-2
1) What are the effects of LBP status on trunk and lower extremity neuromuscular
and kinematic performance during the Y-Balance Test?
Texas Tech University Health Sciences Center, Troy L. Hooper, May 2015
6
Study-3
1) What are the effects of a volitional preemptive abdominal contraction (VPAC)
strategy on trunk and lower extremity neuromuscular and kinematic variables in
people with cLBP, a hxLBP, and healthy controls during the Y-Balance Test?
2) What is the effect of a VPAC strategy on Y-Balance Test performance scores in
people with cLBP, a hxLBP, and healthy controls?
3) Do the effects of a VPAC strategy differ between people with cLBP or hxLBP
and a pain-free control group?
HYPOTHESES
Study-1
1) Static postural control is diminished in people with active LBP as well as those
with a history of LBP. The Y-Balance Test is a valid tool for measuring dynamic
postural control in people with lower extremity injuries and recent evidence
supports its use in individuals with chronic LBP. Therefore, it was hypothesized
that Y-Balance Test scores would be lower in the active recurrent LBP (cLBP)
patients, as well as people with a LBP history who are currently pain-free
(hxLBP), compared to a matched sample of people with no LBP history
(controls).
2) Individuals with greater daily activity levels may have better dynamic balance
than those who are less activity. Therefore, it was hypothesized that a positive
correlation would exist between Y-Balance Test scores and activity level—
subjects with greater activity levels will have higher Y-Balance Test scores.

Texas Tech University Health Sciences Center, Troy L. Hooper, May 2015
7
3) Low back pain sufferers with higher levels of pain, disability, and fear of
movement may be more likely to experience greater balance losses. Additionally,
increased age and BMI may negatively affect balance. Therefore, it was
hypothesized that a negative correlation would exist between these variables and
Y-Balance Test scores. Specifically, individuals in the cLBP group with higher
active pain, disability, and movement fear levels and those in all three groups with
increased age and BMI would have lower Y-Balance Test scores.
Study-2
1) The presence of LBP is associated with a decreased ability to adequately stabilize
the lumbopelvic region, creating an unstable pelvis and changing lower extremity
muscular and kinematic control parameters. Therefore, it was hypothesized that
subjects in the cLBP and hxLBP groups would demonstrate diminished trunk and
lower extremity control during the Y-Balance Test.
Study-3
1) Volitional trunk muscle co-contraction improves lumbar segmental stiffness and
lumbopelvic stability. Therefore, it was hypothesized that the addition of a
volitional preemptive abdominal contraction (VPAC) strategy would improve
trunk and lower extremity control parameters in all three groups.
2) It is believed that volitional trunk muscle co-contraction improves lumbar
segmental stiffness and lumbopelvic stability without harming trunk and lower
extremity movement patterns. Therefore, it was hypothesized that Y-Balance
Test scores would remain unchanged with the addition of a VPAC strategy in all
three groups.
Texas Tech University Health Sciences Center, Troy L. Hooper, May 2015
8
3) Because VPAC performance improves lumbar segmental stiffness and
lumbopelvic stability, the benefits of this strategy should be applicable to all
individuals capable of performing the contraction. Therefore, it was hypothesized
that the effects of VPAC performance would not differ between the control and
LBP groups.
Texas Tech University Health Sciences Center, Troy L. Hooper, May 2015
9
CHAPTER II
REVIEW OF LITERATURE
LOW BACK PAIN
Low back pain (LBP) results in disturbed balance (Cavanaugh, Guskiewicz, &
Stergiou, 2005). Simple dynamic balance tests are needed to detect these deficits in a
clinical setting. In addition, lower extremity biomechanical variables may be altered in
this population, potentially increasing lower extremity injury risk (Durall et al., 2011;
Plisky et al., 2006). Volitional Preemptive Abdominal Contractions (VPACs), such as
the abdominal bracing maneuver (ABM), may improve these control variables. The
purpose of this project was to determine the effect of both current LBP and a LBP history
with no present symptoms on lower extremity neuromuscular and kinematic variables
and performance scores produced during completion of the Y-Balance Test. An
additional purpose was to determine whether incorporating a VPAC changes these lower
extremity control variables.
The purpose of this chapter is to provide a comprehensive review of the literature
necessary to establish the current state of knowledge regarding: (1) LBP presentation; (2)
lumbopelvic stability, including trunk and hip muscle anatomy; (3) trunk muscular and
kinematic changes with LBP; (4) distal consequence of LBP, including balance changes
and potential lower extremity injury risks; (5) VPAC and its potential influence on lower
extremity biomechanics; and (6) the Y-Balance Test.
Low back pain is an almost universal experience, affecting up to 75-90% of the
population (Andersson, 1999; Walker et al., 2004). In the past, LBP was considered a
Texas Tech University Health Sciences Center, Troy L. Hooper, May 2015
10
common but relatively benign, self-limiting condition (Andersson, 1999; Frymoyer,
1988; Waddell, 1987). Chronic and recurrent LBP was once thought to be relatively
uncommon. However, more recent studies have shown that LBP is more commonly a
recurring or persistent condition (Pengel, Herbert, Maher, & Refshauge, 2003; T. R.
Stanton, Latimer, Maher, & Hancock, 2009; Vasseljen, Woodhouse, Bjørngaard, &
Leivseth, 2013), and this appears to be confirmed by the tremendous financial resources
devoted to the diagnosis and treatment of this disorder. Investigators have concluded that
the direct cost of LBP in the United States is $90.6 billion (Luo et al., 2004). A recent
study in the United Kingdom found that the total healthcare costs for those with chronic
LBP were double those of matched controls (Hong, Reed, Novick, & Happich, 2013).
Low back pain has been defined various ways in the literature. In general, LBP is
considered to occur between T12 (or the 12th rib) and the gluteal folds (Frymoyer, 1988;
Hides, Gilmore, Stanton, & Bohlscheid, 2008; Macdonald, Dawson, & Hodges, 2011).
Dionee et al. (2008) conducted a Delphi study to develop a consensus definition of LBP
for epidemiological prevalence studies. They proposed that LBP should be defined as
pain in the low back area that should limit the usual activities or daily routines of the
patient for more than one day. Similarly, the definition of an episode of LBP has varied
in the literature. De Vet et al. (2002) convened a panel of experts who defined an episode
of LBP as “a period of pain in the lower back lasting for more than 24 hours, preceded
and followed by a period of at least one month without LBP.”
Additionally, LBP classification is difficult, since the majority of cases are
classified as nonspecific with no identifiable cause observed in radiographs or magnetic
resonance imaging (Cedraschi et al., 1999; Deyo & Weinstein, 2001). Low back pain has

Texas Tech University Health Sciences Center, Troy L. Hooper, May 2015
11
traditionally been classified as acute, subacute, or chronic based upon the duration of the
LBP episode (Dunn & Croft, 2006; Korff, 1994). However, these classifications are
being abandoned because they do not offer a complete picture of the cause or prognosis
of a person’s LBP experience (Cedraschi et al., 1999; Korff & Dunn, 2008; Turk &
Rudy, 1988). Instead, LBP is more commonly classified as acute, recurrent, or chronic
based upon the clinical characteristics of the disorder, rather than symptom duration.
Acute LBP describes a first-time LBP event of sudden, rapid onset that resolves quickly,
generally within four to six weeks (Hides, Jull, & Richardson, 2001). A review by Hoy,
Brooks, Blyth, and Buchbinder (2010) concluded that six to 15% of annual LBP
occurrences are attributable to acute, first-time events as described above.
While some cases of acute low back resolve without further episodes, the majority
of cases will reoccur. A systematic review by Itz, Geurts, Kleef, and Nelemns (2012)
determined that only 33% of LBP cases were pain-free within three months, and at one
year after onset, 65% continued to report pain. Over time acute LBP can develop into
chronic LBP. Von Korff (1994) defined chronic LBP as “back pain present on at least
half the days in a 12-month period in a single or in multiple episodes.” However, as
explained previously, classifications based on duration are troublesome. A more
meaningful explanation of chronic LBP involves complex central and peripheral nervous
system adaptations that result in the duration of the pain extending beyond the normal
time required for healing (O'Sullivan, 2005; Schaible & Grubb, 1993).
The most frequently occurring category of LBP is recurrent by nature (Hoy et al.,
2010). A recent Delphi study (Stanton, Latimer, Maher, & Hancock, 2011) defined
recurrent LBP as a return of LBP that lasts at least 24 hr with a pain intensity greater than
Texas Tech University Health Sciences Center, Troy L. Hooper, May 2015
12
2 cm on a 10 cm visual analog scale (VAS) following a period of at least 30 days pain-
free. Once a patient has recovered from a LBP episode, he or she has a greater risk of
future LBP episodes. Approximately 50% of people have a recurrent episode by one
year, 60% by two years and 70% by five years following the initial incident (Hestbaek et
al., 2003). Athletes with a history of LBP at the beginning of a sport season have a 6-fold
increased risk of sustaining another low back injury (Greene, Cholewicki, Galloway,
Nguyen, & Radebold, 2001). These episodes are usually longer in duration and
associated with greater disability compared to acute LBP episodes (Wasiak, Kim, &
Pransky, 2006).
In addition to an increased risk of further LBP, people who experience recurrent
LBP episodes develop postural control deficits, as well as neuromuscular and
biomechanical changes in the trunk, pelvis, and lower extremities that are sustained even
after the LBP episode resolves (Hammill, Beazell, & Hart, 2008). These alterations will
be highlighted throughout the remainder of this review. As a result of these changes,
individuals with a LBP history experience performance deficits when compared to those
without a LBP history. For example, Nadler et al. (2002b) showed that athletes with a
LBP history who were presently pain-free and had returned to unrestricted training
recorded significantly slower 20-m shuttle run times than a healthy control group.
Furthermore, such control alterations are believed to increase an individual’s risk for
lower extremity injuries (Hewett, Lindenfeld, Riccobene, & Noyes, 1999; Hides, Brown,
Penfold, & Stanton, 2011; Perrott, Pizzari, Opar, & Cook, 2012; Petersen et al., 2005;
Wilkerson et al., 2012; Zazulak et al., 2007).
Texas Tech University Health Sciences Center, Troy L. Hooper, May 2015
13
Because these changes may not be obvious to the patient or clinician, an
important research goal is to develop and validate simple clinical tests that can measure
these deficits in patients with LBP and those with a LBP history who are presently pain-
free. An additional goal is to develop rehabilitation techniques that promote a return to
the individual’s pre-injury mechanics. In order to accomplish this goal, the mechanisms
underlying the link between LBP and lower extremity injury must be determined.
Complex neuromuscular control strategies are necessary for lumbopelvic stability, and
muscle activity changes associated with LBP may lead to the lower extremity control
alterations associated with LBP.
LUMBOPELVIC STABILITY
Two important functions of the spinal column are to maintain upright posture and
to form a stable proximal base from which movements in the more distal extremities may
occur. The spinal column must be sufficiently stable to tolerate the loads placed upon it
while performing these functions. “Spine stability” can be defined in different ways.
Biomechanical and engineering definitions focus on the ability of the spinal system to
produce sufficient stiffness to maintain the intervertebral range of motion within a safe
limit while minimizing a buckling response (Bergmark, 1989; Cholewicki & McGill,
1996; McGill & Cholewicki, 2001; Panjabi, 1992b). In this view the spine is stable when
the forces acting on it and their resulting moments create a state of structural equilibrium
(Bergmark, 1989). An important concept in this description is that of the neutral zone
(Panjabi, 1992b). The neutral zone is that portion of lumbar range of motion, from the
neutral position, that is met with little internal resistance by the passive structures.
Texas Tech University Health Sciences Center, Troy L. Hooper, May 2015
14
According to this approach, spinal instability occurs when there is a decrease in the
ability of the stabilizing systems to maintain this neutral zone within physiological limits,
resulting in an excessive range of segmental motion uncontrolled by the muscular and
ligamentous systems (Panjabi, 1992b).
Others have focused on the requirements necessary for the spine to optimally
perform its role as the center of the functional kinetic chain, providing a stable proximal
base for the distal extremities during functional tasks (Kibler, Press, & Sciascia, 2006;
Leetun, Ireland, Willson, Ballantyne, & Davis, 2004). According to Kibler, Press, and
Sciascia (2006), core stability is “the ability to control the position and motion of the
trunk over the pelvis and leg to allow optimum production, transfer and control of force
and motion to the terminal segment in integrated kinetic chain activities.” This definition
requires that the trunk, pelvis, and thigh maintain correct alignment during movements
that must occur in a dynamic system. Here one must not only consider the role of the
trunk muscles in providing stability but also consider the function of the pelvic and hip
musculature. The proximal location of these muscles allows them to provide the
proximal stability necessary for movement of the more distal joints of the lower
extremities. Decreased strength and impaired neuromuscular control of these muscles
may create an unstable foundation for the lower extremities to develop or resist force
(Leetun et al., 2004).
Lumbopelvic stability is a complex and dynamic process that involves the passive
and active spinal components as well as neural control from the central nervous system
(Panjabi, 1992a). The passive subsystem includes the vertebral bodies, zygapophyseal
joints, joint capsules, intervertebral discs, and spinal ligaments. This system contributes
Texas Tech University Health Sciences Center, Troy L. Hooper, May 2015
15
the most to spinal stability at end ranges of motion. The active subsystem consists of the
muscles and tendons that attach directly or indirectly to the spine. The passive structures
are unable to provide resistance to motion when the spinal segments are near their
midrange or neutral zone (Panjabi, 1992b). As a result, the active subsystem is primarily
responsible for the control of spinal motion in this region of motion. The neural control
subsystem receives afferent feedback from the passive and active spinal structures and
uses this information to determine the appropriate motor responses required to maintain
stability of the system. Stimulation of the nociceptors and mechanoreceptors in the discs,
joint capsules, and ligaments in the lumbar spine elicit a reflexive contraction of the
longissimus and multifidus (Mf) muscles at the corresponding spinal level and even one
to two segments proximal and distal (Holm, Indahl, & Solomonow, 2002; Kang, Choi, &
Pickar, 2002; Solomonow, Zhou, Harris, Lu, & Baratta, 1998). According to this model,
an injury to the passive subsystem, such as disc degeneration or ligamentous
hypermobility, will increase the size of the neutral zone, leading to a larger range of
motion unrestricted by the passive elements. Researchers have shown that muscle
activity decreases the size of the neutral zone (Kettler, Hartwig, Schultheiss, Claes, &
Wilke, 2002; Wilke, Wolf, Claes, Arand, & Wiesend, 1995), so the neural zone
enlargement seen with lumbar pathologies may be at least partially compensated for
through increased muscle activity (Panjabi, 1992b).
Trunk Muscle Anatomy and Classification
In order to appreciate how the trunk and pelvic muscles help maintain
lumbopelvic stability, as well as contribute to instability and LBP, one must first
understand the region’s anatomy. The trunk is home to many different muscles, all of
Texas Tech University Health Sciences Center, Troy L. Hooper, May 2015
16
which play a potential role in maintaining stability of the lumbar spine. Bergmark (1989)
used a mechanical modeling approach to classify the trunk into two groups according to
each muscle’s attachments and actions: (1) superficial muscles; and (2) segmental
muscles. The superficial muscle group is comprised of the large, global muscles that
attach to the pelvis and the thorax without insertions onto the lumbar vertebrae. These
are the main torque-producing muscles of the spine that are involved in controlling
external forces acting on the trunk and the orientation of the pelvis relative to the thoracic
cage (Hodges, 2003). The local or segmental muscle group includes the deep muscles
that attach directly to the vertebrae and cross only one or a few segments. Although these
muscles do not play a large role in torque-production, they are important for controlling
inter-segmental movement and providing proprioceptive feedback to the central nervous
system (Bergmark, 1989).
Superficial Musculature
The superficial trunk muscles influence overall stability of the lumbopelvic
region. The superficial lumbar extensors include the erector spinae (ES) muscles
(iliocostalis and longissimus). The erector spinae are larger in size and lie further from
the center of rotation compared to the local paraspinal muscles. As a result, these
muscles are suited to produce gross sagittal and frontal plane motions. Anteriorly, the
external oblique (EO) and rectus abdominis (RA) are included in the superficial category.
The EO is the most superficial lateral abdominal muscle, originating from the lower eight
ribs and coursing caudal-medial to insert into the linea alba and anterior half or third of
the iliac crest (Teyhen et al., 2007). Acting bilaterally, the EO is a trunk flexor, while
unilaterally it contracts to produce contralateral trunk rotation and ipsilateral lateral
Texas Tech University Health Sciences Center, Troy L. Hooper, May 2015
17
flexion (Kendall, 2005). Additionally, the EO eccentrically controls anterior pelvic tilt
(Akuthota & Nadler, 2004). The RA is a strap-like muscle that extends the length of the
anterior abdominal wall, originating on the pubic crest and symphysis and inserting on
the costal cartilages of ribs five through seven and the xiphoid process (Kendall, 2005).
The RA is primarily a sagittal plane trunk flexor and additionally assists with controlling
anterior pelvic tilt.
Segmental Musculature
The segmental muscles influence local lumbar segments and include the Mf,
intertransversarii, interspinales, transversus abdominis (TrA), (Hodges, 1999), internal
oblique (IO), posterior fibers of the psoas (Santaguida & McGill, 1995), and medial
fibers of the quadratus lumborum (McGill, Juker, & Kropf, 1996). The Mf has received
much attention for its potential role in spinal stabilization (Bogduk, Macintosh, & Pearcy,
1992; Macdonald, Moseley, & Hodges, 2006; Moseley, Hodges, & Gandevia, 2002;
Ward, 2009). This deeply seated muscle has five fascicles that originate from the spinous
process and lamina of each lumbar vertebra and insert in a caudal-lateral direction. It is
commonly divided into superficial and deep portions. The superficial fibers travel up to
five segments and insert caudally on the ilia and sacrum. The deep fibers cross a
minimum of two segments and descend from the inferior border of a lamina to the caudal
mamillary process and zygapophyseal joint capsule (Macdonald et al., 2006).
The TrA is the deepest abdominal muscle, arising posteriorly from the
thoracolumbar fascia from the iliac crest and the twelfth rib. It interdigitates with the
diaphragm along the internal portion of the lower six costal cartilages. Inferiorly the TrA
fibers arise from the inguinal ligament and the anterior two-thirds of the inner aspect of
Texas Tech University Health Sciences Center, Troy L. Hooper, May 2015
18
the iliac crest (Richardson, Hodges, & Hides, 2004b) and course medially to merge into
the rectus sheath. The lower fibers of the TrA merge with the IO, forming the conjoint
tendon. The IO muscle is the largest muscle of the abdominal wall and is located
between the TrA and EO. It originates from the anterior two thirds of the iliac crest and
the lateral half or third of the inguinal ligament, travels proximally and laterally, and
attaches to the lower 3 or 4 costal cartilages, the linea alba, and the pubic crest. The
intermediate fibers of the IO, which course horizontally in parallel with the fibers of the
TrA and invest into the thoracolumbar fascia, may be included in the local system
(Urquhart, Hodges, Allen, & Story, 2005); therefore, the IO is often included with the
TrA in discussions of lumbopelvic stability because of its anatomical and functional
similarities with the TrA (Marshall & Murphy, 2003). The IO produces trunk flexion
when acting bilaterally, while unilateral contraction produces ipsilateral trunk rotation
and ipsilateral lateral flexion when contracting unilaterally (Kendall, 2005).
The quadratus lumborum is divided into lateral and medial portions. The lateral
fibers connect to the ilium and iliolumbar ligament and travel proximally to the twelfth
rib. The medial fibers arise from the iliac crest and insert directly onto the transverse
processes of the lumbar vertebrae (Richardson et al., 2004b). The lateral fibers are active
in producing lateral flexion of the trunk, while the medial fibers act isometrically to
segmentally stabilize the spine (McGill et al., 1996). Finally, the psoas major consists of
deep fibers that originate from the anterior surface of each lumbar vertebra and vertebral
body (Richardson, Hides, Wilson, Stanton, & Snijders, 2004a). Contraction of these
posterior fibers may increase intervertebral compression, while the anterior fibers work to
flex the hip (Bogduk, 2012).
Texas Tech University Health Sciences Center, Troy L. Hooper, May 2015
19
Trunk Muscle Contributions to Lumbopelvic Stability
Superficial and segmental trunk muscle activity is coordinated by the CNS in a
manner that provides sufficient spinal stability and stiffness while still allowing adequate
spinal control and the production of a stable proximal base. The deep segmental muscles
are activated prior to limb movements in any direction implying an important stabilizing
role for these muscles. However, the other trunk muscles provide important contributions
to lumbopelvic stability as well. The relative contribution of the superficial muscles to
stability varies depending on the direction and magnitude of the load acting on the spine.
Thus, no one muscle is considered to be the primary trunk stabilizer (Cholewicki,
Ivancic, & Radebold, 2002b; Grenier & McGill, 2007; Kavcic, Grenier, & McGill, 2004).
Rather, it appears that the superficial trunk muscles function to provide overall
lumbopelvic stability, while the segmental muscles improve intersegmental stiffness and
stability.
Even though their primary function is to produce lumbar spine movement, the
superficial trunk muscles are necessary for the production of a stable trunk and pelvis.
Their longer moment arms allow the superficial muscles to generate greater levels of
force. The antagonistic co-contraction of these muscles act similar to guy wires,
increasing compressive loads between the vertebrae and stiffening the lumbar spine to
enhance stability (Cholewicki & McGill, 1996; Gardner-Morse & Stokes, 1998; McGill,
Grenier, Kavcic, & Cholewicki, 2003; Vera-Garcia, Brown, Gray, & McGill, 2006). A
study by van Dieën, Kingma, and van der Bug (2003b) found that abdominal co-
activation was significantly higher when lifting a container partially-filled with water
(representing an unstable condition) compared to lifting an equally-weighed container of
Texas Tech University Health Sciences Center, Troy L. Hooper, May 2015
20
ice (representing a stable condition). This result suggests that activity of the superficial
trunk muscles increases when challenges to stability are increased.
Further evidence for their role in enhancing lumbopelvic stability comes from
studies quantifying the superficial trunk muscles’ activity prior to limb movement.
During movements of the spine and extremities, the superficial trunk muscles are
phasically active, where their response is determined by the force’s direction. For
example, during submaximal shoulder flexion, the lumbar extensors contract prior to the
onset of deltoid activity. Rectus abdominis (RA) activity, however, is delayed until after
the deltoid begins its contraction (Aruin & Latash, 1995; Hodges & Richardson, 1997b;
1999b). This early activation of the extensors helps control the flexion moment
generated by anterior displacement of the center of mass during shoulder flexion.
Shoulder extension produces the opposite effect: activation of the RA precedes the onset
of deltoid activity, while the erector spinae do not contract until after arm movement has
been initiated. The superficial abdominal muscles on the contralateral side, however,
remain silent prior to the movement (Aruin & Latash, 1995; Hodges & Richardson,
1997b; 1999b).
The TrA responds in a different fashion, where it is active prior to contraction of
either the trunk flexors or extensors and before the onset of deltoid activity, regardless of
the direction of arm movement (Aruin & Latash, 1995; Hodges & Richardson, 1997b;
1999b; Marshall & Murphy, 2003). These results suggest that the TrA is activated in this
feed-forward fashion by the central nervous system (CNS) prior to anticipated spinal
perturbations to control intervertebral motion, while the superficial global muscles appear
to be used to control spinal orientation. It should be noted, however, that Marshall and
Texas Tech University Health Sciences Center, Troy L. Hooper, May 2015
21
Murphy (2003) found 4 out of 20 asymptomatic subjects in their study using surface
electromyography (EMG) did not demonstrate feed-forward activation of the TrA/IO
during rapid arm movements. Therefore, this activity may not be universal in the
asymptomatic population.
Similar activation patterns for the deep and superficial abdominals have been
observed during lower limb movement (Hodges & Richardson, 1997a) and rapid forward
and backward movement while seated (Henry, Fung, & Horak, 1998). The TrA is
activated regardless of the direction of force acting on the spine, but the activation level is
dependent upon the degree of stability required for a particular activity. Hodges and
Richardson (1997c) looked at the relationship between TrA reaction time latency and
upper limb movement speed and found that anticipatory TrA contraction occurred with
rapid and natural arm movements, but not during slow arm movement. Thus, TrA onset
is more rapid during movement of the more massive lower limb than during upper limb
movements (Hodges & Richardson, 1997a).
Several mechanisms have been proposed to explain the TrA’s possible role in
lumbopelvic stabilization, including increasing segmental spinal stability via an increase
in intra-abdominal pressure (IAP) and tensioning of the thoraco-lumbar-sacral fascia
(TLSF). The IAP is increased by contraction of the TrA, IO, diaphragm, and pelvic floor
muscles. When these muscles contract, the volume of the abdominal cavity decreases,
and pressure inside the cavity rises. This rise in pressure is thought to contribute to spinal
stability through an increase in lumbar spine stiffness (Cholewicki, Juluru, & McGill,
1999a; Cholewicki, Juluru, Radebold, Panjabi, & McGill, 1999b; Hodges, Eriksson,
Shirley, & Gandevia, 2005).
Texas Tech University Health Sciences Center, Troy L. Hooper, May 2015
22
Tensioning of the TLSF is another proposed mechanism for explaining the
relationship between TrA activity and spinal stability. The TLSF is composed of three
layers that surround the muscles of the back (Bogduk, 2012). The anterior layer is
derived from the fascia covering the quadratus lumborum and attaches to the lumbar
transverse processes. Behind the quadratus lumborum is the middle layer, which attaches
to both the transverse processes and the intertransverse ligaments. It extends laterally to
form the TrA aponeurosis. The posterior layer envelops the erector spinae, attaches to
the spinous processes, and wraps around the spinal erector muscles to blend with the
other layers of the TLSF at the lateral border of the iliocostalis. The area where the three
layers blend together is called the lateral raphe.
It is the TrA and IO attachments to the TLSF that provide an indirect attachment
of these muscles to the lumbar spinous processes (Barker, Briggs, & Bogeski, 2004b;
Barker, Urquhart, Story, Fahrer, & Briggs, 2007). Tensioning of the TLSF through TrA
contraction increases resistance to lumbar flexion (Barker et al., 2006). Barker et al.
(2006) and others (Hodges, Holm, Holm, Ekström, Cresswell, et al., 2003a) studied the
influence of TLSF tensioning through TrA contraction during flexion and extension using
unembalmed cadavers. Their results showed that TLSF tensioning increased resistance to
flexion loads by 9.5 N but reduced resistance to extension loads by 6.6 N. This tension
increased initial stiffness during flexion by 44%, indicating that this action could be
beneficial in reducing inter-segmental motion during initial flexion movement through
the neutral zone (Barker et al., 2006).
In addition to its role in enhancing lumbar stability, TrA contraction increases
sacroiliac joint (SIJ) stability as well. Contraction of the lower fibers of the TrA acts like
Texas Tech University Health Sciences Center, Troy L. Hooper, May 2015
23
a corset to compress the SIJs via a force closure mechanism (Pel, Spoor, Pool-
Goudzwaard, Hoek van Dijke, & Snijders, 2008). Activation of the TrA and pelvic floor
muscles accounted for a 400% increase in the SIJ compressive force using a 3-D
simulation model (Pel et al., 2008). This compression helps increase the stability of the
lumbo-pelvic region and may play a role in SIJ injury prevention and rehabilitation.
Furthermore, the SIJ is an important component of the pelvic ring. Trunk forces are
distributed through the sacrum into the pelvis and lower extremities, and SIJ instability
potentially impairs this force transfer. TrA activation may help normalize force transfer
from the trunk to the lower extremities (Pel et al., 2008).
The Mf plays an additional key role in segmentally stabilizing the lumbar spine
(Macdonald et al., 2006; Moseley, Hodges, & Gandevia, 2003; Ward, 2009). The
superficial fibers have a larger moment arm and thus contribute to vertebral extension
and help control anterior rotation and anterior translation of the vertebral segments during
trunk flexion. When the trunk extends, the extension torque produced by the Mf
contributes to sagittal plane extension (Bogduk, 2012). Bogduk and colleagues (1992)
found that the lumbar Mf contributes 20% of the total extensor moment exerted on L4
and L5. The lumbar ES contributed 50%. The deep fibers, however, are found closer to
the axis of rotation and play only a minor role in torque production. Instead, these fibers
are ideally positioned to control inter-segmental motions created by shearing forces at the
local segmental level. Wilke, Wolf, Claes, Arand, and Wiesend (1995) studied the
influence of five lumbar muscle groups on the inter-segmental stiffness of L4-L5 during
lumbar motion and found that the Mf was the largest contributor to segmental stability,
accounting for two thirds of the increase in stiffness. Like the deep fibers of the Mf, the
Texas Tech University Health Sciences Center, Troy L. Hooper, May 2015
24
small moment arm of the rotatores and intertransversarii limits their ability to contribute
to bending torque of the lumbar spine (Bogduk, 2012). Instead, their predominant
function may be to provide proprioceptive information regarding vertebral position
(Crisco & Panjabi, 1991).
Hip Muscle Anatomy
The muscles of the pelvic and hip region can likewise be divided into two groups
(Kibler et al., 2006). The deep, primarily monoarticular muscles are important hip
stabilizers and are sometimes referred to as the “rotator cuff of the hip” (Kagan, 1999).
They include the piriformis, obturator externus, obturator internus, quadratus femoris,
inferior gemellus, and superior gemellus, which are hip external rotators originating at the
pelvis and inserting along the posterior aspect of the greater trochanter and proximal
femur. The gluteus medius (GMed) and gluteus minimus (GMin) can be included in this
group as well. For instance, the GMed is classified as a primary hip abductor; however,
it is additionally an important pelvic stabilizer (Schmitz, Riemann, & Thompson, 2002)
and dysfunction may affect joints distal or proximal to the hip. For example, weakness of
the GMed has been associated with patellofemoral pain in females (Ireland, Willson,
Ballantyne, & Davis, 2003) and LBP (Nadler, Malanga, Bartoli, et al., 2002a).
The superficial muscles are often polyarticular and function as the prime movers
of the hip and knee. At the hip, these muscles are responsible for producing six
fundamental movements: flexion, extension, abduction, adduction, internal rotation, and
external rotation (Hughes, Hsu, & Matava, 2002). The primary hip flexor is the
iliopsoas, while the rectus femoris (RF), sartorius, and TFL assist. The iliopsoas is
formed from the fusion of the psoas major and iliacus muscles and originates from the
Texas Tech University Health Sciences Center, Troy L. Hooper, May 2015
25
T12-L5 transverse processes, anterior surface of the iliac crest, and anterior sacrum and
inserts on the lesser trochanter of the femur. The sartorius originates from the anterior
superior iliac spine (ASIS) and crosses the knee to insert on the anteromedial tibial
plateau. The RF originates on the anterior inferior iliac spine and inserts on the proximal
patella, while the tensor fascia latae (TFL) originates on the ASIS and iliac crest and
inserts into the iliotibial tract (Neumann, 2010).
The primary hip extensor is the gluteus maximus (GMax), which inserts on the
posterolateral iliotibial tract and gluteal tuberosity. The three hamstring muscles assist
with hip extension. The biceps femoris (BF), semimembranosus (SM), and
semitendinosus (ST), each originate off the ischial tuberosity. The BF inserts on the
fibular head, and the SM and ST insert on the posteromedial tibial plateau (Neumann,
2010).
The primary hip abductors are the GMed, GMin, and the TFL. The GMed and
GMin both originate from the outer cortex of the ilium and insert on the greater
trochanter. The GMin lies deep to the GMed. The primary hip adductors include the
pectineus, adductor longus, adductor brevis, and adductor magnus. These muscles
originate from the superior and inferior pubic rami, ischial tuberosity, and pubis,
accompanied by insertion sites on the adductor tubercle (adductor magnus) and along the
linea aspera located on the medial aspect of the femur (Hughes et al., 2002).
In addition to their role as prime movers, the hip muscles play an important role in
the transfer of energy from the lower extremities to the pelvis and into the spine and vice
versa. An important energy transfer mechanism occurs via the fascial connections
between the GMax and the thoracolumbar fascia (Vleeming, Pool-Goudzwaard,

Texas Tech University Health Sciences Center, Troy L. Hooper, May 2015
26
Stoeckart, van Wingerden, & Snijders, 1995). Additionally, the attachment of the
hamstring muscles, particularly the BF, to the sacrotuberous ligament provides a means
for energy transfer from the trunk, through the pelvis, and into the lower extremity
(Woodley, Kennedy, & Mercer, 2005).
One should note that the pelvis must be stabilized by the trunk muscles during
activation of the hip muscles to prevent pelvic tilting (Neumann, 2010). For example,
reduced activation of the abdominal muscles during contraction of the hip flexor muscles
causes increased anterior pelvic tilt. This abnormal pelvic tilt changes the moment arm
and line of pull of the hip muscles and may alter their ability to produce force. As a
result, proper pelvic positioning is critical for optimal functioning of the hip muscles.
The following section will describe changes in trunk muscle activity in individuals with
LBP, where the role of altered pelvic positioning in changing lower extremity muscle
activity in this population will be discussed.
TRUNK MUSCULAR AND KINEMATIC CHANGES WITH LOW BACK PAIN
A normally functioning spinal system dynamically coordinates the three
components of the stabilization system to provide sufficient stability to match the
demands placed upon it at any given moment. A frequent consequence of LBP, however,
is a failure of this stabilization system, which results in an increase in the size of the
segmental neutral zone (Panjabi, 1992b). Injury or degenerative changes to the
intervertebral discs, spinal ligaments, and facet joints reduce passive stability (Adams &
Dolan, 1995), and neuromuscular dysfunctions lead to loss of active stability (Cholewicki
& McGill, 1996; Hodges & Richardson, 1998; Solomonow et al., 1998). Lumbar
Texas Tech University Health Sciences Center, Troy L. Hooper, May 2015
27
instability can be divided into two categories: (1) radiologic appreciable instability and
(2) clinical instability (Cook, Brismée, & Sizer, 2006). Radiologic appreciable instability
describes marked damage of the passive osteoligamentous structures, resulting in
increased segmental motion that is readily discernible on radiographs (Iguchi et al., 2011;
Leone, Guglielmi, Cassar-Pullicino, & Bonomo, 2007). Clinical instability, on the other
hand, occurs without appreciable radiologic evidence of instability but represents an
increase in the size of the neutral zone, leading to a reduction in the passive resistance to
segmental motion (Panjabi, 2003).
The strong association among the three stability components suggests that damage
to the passive restraints increases demands on the remaining systems to provide the same
level of stability. Muscular system activity increases in response to afferent neural
signals (Holm et al., 2002; Kang et al., 2002; Solomonow et al., 1998), potentially
leading to abnormal muscle loading and eventually fatigue, which could lead to further
injury (Holm et al., 2002; Panjabi, 2006). Thus, injury to one spinal structure may
promote a vicious cycle of further damage and instability. An important component of
surgical and conservative LBP management is to arrest this cycle of progressive
instability by enhancing structural stability and neuromuscular function.
Hodges and Tucker (2011) have developed a theory to explain motor pattern
changes in response to painful stimuli. It is helpful to examine the changes in muscle
activity and mechanical responses resulting from LBP episodes in light of this theory.
According to this theory, pain leads to a redistribution of activity within and between
muscles, potentially altering mechanical behavior. These alterations are the result of
changes at multiple levels of the motor system, including the spinal cord and higher brain

Texas Tech University Health Sciences Center, Troy L. Hooper, May 2015
28
centers. The goals of these modifications are to reduce pain, improve stability, and
protect the joint. Although these changes may create short-term benefits, they can
produce negative long-term consequences.
Activity between muscles, as well as within individual muscles, is redistributed in
an attempt to reduce pain and protect the injured part (Hodges & Tucker, 2011). The
activity of individual muscles may either increase or decrease. As discussed in the
previous section, the TrA contracts prior to movement of the upper or lower limbs to
control intersegmental motion. However, researchers have established that this feed-
forward TrA activation is impaired in subjects with LBP. Specifically, TrA activity
during rapid arm movements is delayed in these patients (Hodges & Richardson, 1996;
1998; 1999a), although it is not clear whether these changes are the result of LBP or
occur prior to the onset of pain. This finding has been replicated in normal subjects, in
whom LBP was induced via an intramuscular injection of hypertonic saline into the
longissimus muscle, indicating that changes in TrA function may be a consequence of the
pain itself (Hodges, Moseley, Gabrielsson, & Gandevia, 2003b). Delayed activity of the
TrA has been measured using ultrasound imaging. Ferreira et al. (2004) showed that TrA
contraction, measured as an increase in TrA thickness, was decreased during an isometric
knee flexion and extension in LBP patients compared to normal control subjects.
Comparison of the ultrasound data with concurrent electromyography recordings was
used to establish the validity of this ultrasound technique for measurement of TrA
activity. While older EMG studies showed that the TrA was the only abdominal muscle
active prior to movement (Hodges & Richardson, 1996), a more recent USI study using
strain rate ultrasound from tissue velocity imaging found that the deep IO fibers activated

Texas Tech University Health Sciences Center, Troy L. Hooper, May 2015
29
prior to the TrA 65% of the time and 10% of onsets began at the same time (Westad,
Mork, & Vasseljen, 2010). The authors concluded that ultrasound is a more sensitive
instrument for distinguishing between IO and TrA onset. This study indicates that IO
pre-activation may be as important as TrA activity for providing spinal stability.
In addition to diminished and delayed TrA activity, Mf activity is altered in
people with LBP (Freeman, Woodham, & Woodham, 2010). Multifidus atrophy has
been observed in individuals with acute (Hides, Richardson, & Jull, 1996; Hides, Stokes,
Saide, Jull, & Cooper, 1994) and chronic (Barker, Shamley, & Jackson, 2004a; Danneels,
Vanderstraeten, Cambier, Witvrouw, & De Cuyper, 2000; Hides et al., 2008; Kader,
Wardlaw, & Smith, 2000; Wallwork, Stanton, Freke, & Hides, 2009) LBP. Additionally,
patients with LBP have a reduced ability to voluntarily contract their Mf (Wallwork et al.,
2009). Moreover, people with recurrent LBP who are currently in remission have
increased superficial Mf activity, while deep Mf activity is reduced (Macdonald,
Moseley, & Hodges, 2009). However, another study in this population found that Mf
activity, measured as the percentage change from resting thickness, during various leg
raising tasks was greater in subjects with a history of LBP compared to healthy controls
(Macdonald et al., 2011). This may represent an increase in superficial Mf activity as a
compensation for reduced deep Mf activation. These findings provide support for
Hodges and Tucker’s (2011) pain adaptation theory, which concludes that while activity
may be reduced in some muscles, it will be increased in others.
While local trunk muscle activity is generally depressed in LBP patients,
superficial muscle activity is often elevated, perhaps as an attempt to compensate for
local muscle system dysfunction (O'Sullivan, 2000). Tsao, Tucker, and Hodges (2011)
Texas Tech University Health Sciences Center, Troy L. Hooper, May 2015
30
found that corticomotor excitability was reduced to the TrA but increased to the EO and
lumbar ES in response to pain induced by saline injection into the lumbar interspinous
ligaments. Increased co-contractile activation of the superficial trunk muscles is
commonly observed in LBP suffers (van Dieën, Selen, & Cholewicki, 2003c). This
altered muscle activity persists even after a LBP episode has ended. Cholewicki et al.
(2002a) showed that athletes who had recovered from an acute LBP episode shut-off
fewer trunk muscles when encountering sudden sagittal and frontal plane loads. Another
study (Radebold, Cholewicki, Panjabi, & Patel, 2000) observed a similar increase in co-
contraction activity in response to a sudden load release in subjects with LBP. The LBP
subjects maintained agonistic muscle contraction and concurrently activated their
antagonistic muscles. The healthy subjects did not exhibit co-contractile behavior,
switching from agonistic to antagonistic muscle activation. Numerous other studies have
found similar increased superficial muscle activation in LBP sufferers (Ahern, Follick,
Council, Laser-Wolston, & Litchman, 1988; Ferguson, Marras, Burr, Davis, & Gupta,
2004; Larivière, Gagnon, & Loisel, 2000b; Nouwen, Van Akkerveeken, & Versloot,
1987; Paquet, Malouin, & Richards, 1994; Silfies, Squillante, Maurer, Westcott, &
Karduna, 2005; Stokes, Fox, & Henry, 2006). The advantage of this strategy is that the
increased stiffness produced by the co-contractile activity can effectively increase spinal
stability (van Dieën, Cholewicki, & Radebold, 2003a).
It is important to note, however, that although a general pattern of increased
extrinsic muscle co-activation is seen in LBP populations, this finding is not universal.
Other studies have found decreased superficial muscle activity (Ahern et al., 1988;
Cassisi, Robinson, O'Conner, & MacMillan, 1993; Chen, Chiou, Lee, Lee, & Chen, 1998;
Texas Tech University Health Sciences Center, Troy L. Hooper, May 2015
31
Danneels et al., 2002; Fabian, Hesse, Grassme, Bradl, & Bernsdorf, 2005; Ng,
Richardson, Parnianpour, & Kippers, 2002). Moreover, activity is not increased in every
muscle. A study of trunk muscle activity during transverse plane isometric activities, Mf
and RA activity decreased, while EO activity was greater compared to matched, healthy
control subjects (Ng et al., 2002), which suggests that these increased activity levels do
not occur universally across all superficial muscles. The muscle response seems to vary
depending on the activity and even from person to person (Hodges, Moseley,
Gabrielsson, & Gandevia, 2003b; Radebold et al., 2000). This is in agreement with
Hodges and Tucker’s (2011) theory. They proposed that instead of a universal increase
or decrease in muscle activity, any changes that occur would vary as the body attempts to
restore stability and reduce pain. Because lumbopelvic stability can be achieved via
varying muscular responses, different strategies may be used to accomplish this goal. A
co-contraction strategy involving the trunk flexors and extensors seems to be a common
choice, but others may choose a different strategy, such as inhibition of agonist muscles
to reduce voluntary movement force and limit trunk displacement (Lund, Donga,
Widmer, & Stohler, 1991).
Certain examination findings may provide clues regarding the muscle contractile
behaviors of people with LBP. Pain-related fear of movement may be associated with
changes in lumbar spine muscle activity and movement control. Elevated pain-related
fear is associated with reduced lumbar flexion range of motion and reduced lumbar
extensor EMG activity and flexion-relaxation ratio during a forward bending episode in
people with chronic LBP (Geisser, Haig, Wallbom, & Wiggert, 2004). Furthermore, high
fear avoidance beliefs for physical activity were negatively associated with TrA slide
Texas Tech University Health Sciences Center, Troy L. Hooper, May 2015
32
following an 8-week period of supervised exercises for chronic LBP (Unsgaard-Tøndel,
Nilsen, Magnussen, & Vasseljen, 2013), which suggests that fear of movement can
inhibit deep abdominal muscle activity. It appears that impaired movement persists after
a LBP episode has resolved. Thomas, France, and Lavender (2008a) found that
individuals who had recently recovered from LBP but continued to demonstrate high
pain-related fear had smaller peak lumbar spine and hip velocities and accelerations
during a rapid reaching task.
In addition to elevated pain-related fear of movement, a LBP patient’s response to
sagittal plane motions may help predict trunk muscle contractile behaviors. Subjects with
idiopathic chronic LBP exhibit greater trunk EMG activity than control subjects, but
activity in subjects with disc herniation and sciatica did not differ (Jalovaara, Niinimäki,
& Vanharanta, 1995). A study of chronic (> 3 months) LBP patients classified subjects
into a flexion pattern (FP) group or active extension pattern (AEP) group, based on sitting
posture and pain responses, and measured trunk muscle activity during sitting (Dankaerts,
O'Sullivan, Burnett, & Straker, 2006). The FP group included subjects whose symptoms
were aggravated by positions of flexion and relieved with extension motions. The AEP
group experienced increased pain with extension activities and improvement with flexed
positions. When subjects were pooled as a group, no difference in trunk muscle activity
was observed between the LBP group and healthy controls. However, when subjects
were sub-classified into FP and AEP groups, differences emerged. The AEP group
presented with higher levels of co-contraction, while the FP group showed a trend toward
lower activation patterns.
Texas Tech University Health Sciences Center, Troy L. Hooper, May 2015
33
The authors speculated that individuals with chronic LBP meeting the FP criteria
may benefit by incorporating a low level muscular co-contraction strategy to enhance
trunk muscle activity and improve stability, while the AEP group with increased co-
contraction may benefit from an approach focusing on inhibition of this increased muscle
activity (O'Sullivan, 2005). Unfortunately, this study involved only patients with chronic
LBP, so it is not know whether similar strategies are employed in people with acute LBP
or in those with recurrent LBP who are currently symptom-free. Chronic LBP is a
complex disorder, and many physical factors, such as level of deconditioning, and
psychosocial factors, such as fear avoidance behaviors, can potentially influence EMG
parameters in this population (Geisser et al., 2005). Therefore, it is difficult for a
clinician to determine exactly which strategy a patient with lumbopelvic instability is
employing without access to specialized equipment. It may be beneficial to teach LBP
patients how to voluntarily produce co-activation of the trunk muscles prior to activities
that increase spinal loads. This VPAC strategy will be described in detail in a later
section.
Similar to the delayed TrA muscle onset times (Hodges & Richardson, 1996),
reflex latencies of the superficial trunk muscles are increased in people with LBP (Luoto
et al., 1996; Magnusson et al., 1996; Radebold, Cholewicki, Polzhofer, & Greene, 2001;
Sankara, Ramprasad, Shenoy, Singh, & Joseley, 2010; Taimela, Osterman, Alaranta,
Soukka, & Kujala, 1993). This increased response time occurs even when the load is
anticipated (Leinonen et al., 2001), and it is exacerbated by fatigue (Wilder et al., 1996).
Additionally, impaired reflex latencies have been correlated with postural control deficits
in this population (Radebold et al., 2001; Sankara et al., 2010). Moreover, muscle reflex
Texas Tech University Health Sciences Center, Troy L. Hooper, May 2015
34
latencies do not improve after the LBP episode has resolved (Cholewicki et al., 2002a).
Like increased trunk co-activation, however, this response may only occur in certain LBP
categories. Silfes, Mehta, Smith, and Karduna (2009) compared reflex latencies in
people with radiologic appreciable instability, mechanical LBP without evidence of
instability, and no LBP. They observed that activation timing of the trunk muscles was
delayed in the instability group but not in the other two groups.
So while increased co-contractility may be present, this protective muscle activity
is delayed in many LBP sufferers and may not occur in time to develop a protective
response, which could increase injury risk. Cholewicki et al. (2005) measured muscle
reflex latencies in 292 healthy collegiate athletes and followed them for up to three years,
tracking low back injuries during that time. They found that a prior history of LBP, body
weight, and latency of muscles shutting off during flexion and lateral bending loads
increased the risk of future low back injury. The odds of a future low back injury
increased 2.8-fold if a subject had a low back injury history, and each millisecond of
muscle shut-off latency resulted in a three percent increase in the odds of sustaining a
future low back injury. Fortunately, these delayed reflex response times can improve
with training (Luoto et al., 1996; Magnusson et al., 1996; Sankara et al., 2010; Wilder et
al., 1996).
Changes in muscle activity lead to altered biomechanical responses (Hodges &
Tucker, 2011). For those with LBP, this can lead to either a decrease or increase in trunk
and lower extremity muscle activation and kinematics. Changes in lower extremity
mechanics will be considered in the next section, while trunk modifications will be
described here. For example, increased co-contraction of the agonist and antagonist
Texas Tech University Health Sciences Center, Troy L. Hooper, May 2015
35
paraspinal and abdominal muscles leads to excessive stiffness and rigidity, which causes
movement restrictions in the trunk. This behavior effectively splints the spine and
decreases shearing forces and irritation of injured and sensitized structures. During
walking gait, people with LBP exhibit decreased variability of transverse plane trunk
motion as a result of increased trunk stiffness (Bruijn, van den Hoorn, Meijer, Hodges, &
van Dieën, 2012; Lamoth, Daffertshofer, Meijer, & Beek, 2006; Lamoth et al., 2004;
Lamoth, Meijer, Daffertshofer, Wuisman, & Beek, 2005; Selles, Wuisman, Wagenaar, &
Smit, 2001). Larivière, Gagnon, and Loisei (2000a) examined differences in pelvic,
lumbar, and thoracic spine kinematics between individuals with chronic LBP and healthy
controls during sagittal and frontal plane lifting tasks. They found that the LBP group
used less lumbar flexion but compensated for the loss with increased thoracic flexion.
A later study by the same authors (Larivière, Gagnon, & Loisel, 2002), however,
did not find differences in trunk and lower limb angles, trunk velocity and acceleration,
or L5/S1 loading and compression between two similar groups during the lifting and
lowering phases of two lifting tasks (to the front and turning 90° to the right). This was
despite the fact that the LBP group exhibited lower left lumbar ES activity during the
forward lifting task and greater thoracic ES activation during both tasks. In addition,
Seay, Sauer, Frykman, and Roy (2013) studied lifting kinematics in individuals with a
history of LBP who were currently pain-free. Subjects lifted an 11 kg box for 10
minutes, and differences between the LBP history group and healthy controls were
analyzed. No differences were found between the two groups until minute nine of the
task, after which the LBP history group maintained consistent mechanics, but the no LBP
group used less trunk and pelvic transverse plane rotation. Similar results were found in
Texas Tech University Health Sciences Center, Troy L. Hooper, May 2015
36
runners with a LBP history, who had greater axial range of motion (ROM) during
treadmill running than those with no LBP (Seay, Van Emmerik, & Hamill, 2011). These
results show that the rigid motion often associated with LBP does not always occur, and
these individuals may choose strategies that increase their trunk ROM, which may have
undesirable effects on lumbar spine stresses.
According to Hodges and Tucker (2011), the goal of these muscular and
kinematic adaptations is to decrease pain and stress on the injured tissues and prevent
further injury. So a co-contraction strategy, for example, does have a short-term benefit,
as greater compressive loading increases trunk stiffness and enhances intersegmental
stability. These adaptations come with a long-term cost, however, as increased
compression elevates intradiscal pressure and loading through the posterior elements of
the spine, which may lead to spinal degeneration and further pain (Gardner-Morse &
Stokes, 1998; Hodges, van den Hoorn, Dawson, & Cholewicki, 2009). Therefore, it may
be advantageous for these individuals to adopt altered mechanical behaviors as short-term
protective mechanisms, and clinicians may promote protective strategies such as trunk
muscle co-activation. However, these individuals may need to re-learn their original
motor programs once the need for protective strategies has passed.
DISTAL CONSEQUENCES OF LBP
Balance and Low Back Pain
Balance and postural equilibrium are important elements directing movement
strategies during closed kinetic chain activities (Guskiewicz, 2011). The terms balance,
equilibrium, postural control, and postural stability, are often used interchangeably but
have different meanings. The term equilibrium is derived from Newtonian mechanics
Texas Tech University Health Sciences Center, Troy L. Hooper, May 2015
37
and occurs when an object is in constant motion or at rest, and the net forces and torques
acting on it equal zero (Cavanaugh et al., 2005). The body is considered to be in
equilibrium, or balanced, when its center of gravity (COG) lies within its base of support
(BOS) (Guskiewicz, 2011). An object is considered stable when it is balanced, i.e., its
line of gravity is within its BOS (Pollock, Durward, Rowe, & Paul, 2000). According to
Cavanaugh et al. (2005), postural stability is “the ability to maintain a desired postural
orientation, either at rest or during movement, in response to perturbations generated
from either internal or external sources.” Balance is often challenged by external or
internal perturbations that force the COG outside the BOS. The human body has the
ability to react to changes in balance by activating the appropriate muscles to bring the
body back into balance.
Postural control is this ability to maintain or return the body to a state of
equilibrium or balance (Cavanaugh et al., 2005). Balance may be classified into three
groups: (a) static, (b) semi-dynamic, and (c) dynamic (Guskiewicz, 2011). Static balance
involves maintenance of the COG over a fixed BOS while standing on a stable surface.
Semi-dynamic balance occurs when a person maintains their COG over a fixed BOS
while standing on either a moving or unstable surface. Dynamic balance is maintenance
of the COG over a moving BOS.
In healthy adults, the maintenance of postural stability is accomplished via the
acquisition of inputs from the somatosensory (Bove, Nardone, & Schieppati, 2009;
Tresch, 2007), visual (Mergner, Schweigart, Maurer, & Blümle, 2005), and vestibular
systems (Bacsi & Colebatch, 2004). This afferent information is relayed to the central
nervous system, which processes it and coordinates an appropriate motor response.
Texas Tech University Health Sciences Center, Troy L. Hooper, May 2015
38
Because the body is linked in a kinetic chain, movement of any link in the chain will
create a postural perturbation. The head, arms, and trunk segment comprises around 65%
of the body’s mass (Winter, 2009), so the position of the trunk relative to the lower
extremities is an important contributor to the position of the center of mass. The muscles
of the lower extremity and trunk play a major role in counteracting perturbations and
allowing the body's COG to remain over its BOS and maintain a position of balance.
A person may choose reactive and/or predictive strategies to maintain postural
control (Pollock et al., 2000). Reactive postural strategies involve movement or muscular
actions that occur in reaction to an unpredicted disturbance, while predictive strategies
occur before the postural challenge and involve preparatory muscle activations and
movements that anticipate the challenge. Both of these strategies may be impaired in
people with LBP. For example, somatosensory deficits such as decreased trunk
proprioception (Brumagne, Cordo, & Verschueren, 2004; Lamoth et al., 2005; Leinonen
et al., 2003; O'Sullivan et al., 2003) lead to an impaired ability to sense lumbar position
changes and increased muscle reaction times (Larivière, Forget, Vadeboncoeur, Bilodeau,
& Mecheri, 2010; Luoto et al., 1996; Sankara et al., 2010; Taimela et al., 1993), which
reduce the body’s ability to engage sufficient reactive postural strategies. In addition,
feedfoward trunk neuromuscular control is diminished in this population (Hodges &
Richardson, 1996; 1998; 1999a), which reduces the body’s ability to produce sufficient
predictive strategies to maintain balance.
Changes in postural control with LBP have been well documented. Compared
with healthy controls, people with LBP demonstrate increased postural sway (Ruhe et al.,
2011) and greater difficulty adapting to changing conditions (Mientjes & Frank, 1999).

Texas Tech University Health Sciences Center, Troy L. Hooper, May 2015
39
Moreover, once they lose their balance, these individuals have more difficulty recovering
it (Brumagne et al., 2004). Furthermore, these deficits can remain even after a person’s
LBP has resolved (Bouche et al., 2005; van Dieën et al., 2010).
The balance deficits observed in people with LBP may increase lower extremity
injury risk, as diminished postural control is often cited as a risk factor for lower
extremity injuries. For instance, in a study of female Croatian handball and volleyball
players, athletes with lower balance scores were more likely to suffer an ACL injury
(Vrbanić et al., 2007). Another prospective study found that female athletes with
impaired postural control when returning to competition after an ACL repair were more
likely to sustain a second ACL tear (Paterno et al., 2010). Durall et al. (2011) examined
the association between static postural sway and lower extremity biomechanical
measurements during landing and found that subjects with decreased postural control had
higher internal knee abduction moments and less hip flexion during landing, both of
which are risk factors for ACL injury. Hrysomallis, McLaughlin, and Goodman (2007)
measured postural stability during single-leg standing in Australian Rules football players
and monitored them for injuries over the course of one season. Knee ligament injuries
were not associated with impaired balance, but ankle injuries were. Players with
impaired balance suffered twice as many ankle ligament injuries as players with average
or good balance scores. Other studies of basketball players (McGuine et al., 2000; Wang,
Chen, Shiang, Jan, & Lin, 2006) and physical education students (Willems, 2005) found
positive associations between impaired postural control and ankle ligament injury risk.
Plisky, Rauh, Kaminski, and Underwood (2006) used the SEBT, which is a clinical
measure of dynamic balance, to assess injury risk in male and female high school
Texas Tech University Health Sciences Center, Troy L. Hooper, May 2015
40
basketball players. Players with an anterior right/left reach distance difference greater
than 4 cm were 2.5 times more likely to sustain a lower extremity injury, and females
with a composite reach distance less than 94% of their limb length were 6.5 times more
likely to suffer injury to the same region. Balance deficits related to LBP may have
implications for elderly adults as well. A study of Swedish twin pairs found that among
twins with self-reported balance impairments as compared with their sibling, the odds
ratio for hip fracture was 3.88 (Wagner, Melhus, Gedeborg, Pedersen, & Michaelsson,
2008).
The association between LBP and balance impairments, and the link between
these impairments and lower extremity injury risk, provide a mechanism by which
individuals with LBP or a LBP history may increase their lower extremity injury risk.
Postural control tests typically rely on expensive laboratory equipment, such as force
plates, which are not feasible in most clinical settings. In addition, the majority of these
tests measure static or semi-dynamic balance, but they do not replicate the dynamic
balance conditions required for most athletic events and activities of daily living.
Dynamic postural control often involves completion of a functional task without
compromising one’s BOS. Assessments of dynamic postural control include tests of
proprioception, range of motion, and strength in addition to the ability to remain upright
and steady.
Clinicians treating people with low back injuries need a simple test for dynamic
balance that can reliably uncover postural control deficits in this population. Use of such
a test would allow clinicians to detect balance problems in LBP patients and design
exercise programs to correct these deficits (Filipa, Byrnes, Paterno, Myer, & Hewett,
Texas Tech University Health Sciences Center, Troy L. Hooper, May 2015
41
2010). The SEBT, and a simplified version of the test called the Y-Balance Test, may be
able to detect dynamic balance deficits in people with LBP or a LBP history.
The Regional Interdependence Model
The lower quarter, which is comprised of the trunk, pelvis, and lower extremities,
is often described as a series of rigid segments linked together by a complex system of
articular joints. This concept was popularized in 1955 by Steindler, who used the term
“kinetic chain” to describe this linkage. He defined the kinetic chain as a “combination
of several successively arranged joints constituting a complex motor unit.” (Steindler,
1955, p. 63) The majority of lower extremity movements occur in the closed kinetic
chain, where the distal end of the extremity is fixed, while the more proximal segments
move. This arrangement means that the movement of one joint directly influences the
movement of other joints proximal and distal to it. In 1977 Nicholas, Grossman, and
Hershman (1977) described their “link theory”, in which the joints of the lower quarter
act as a link system that allows force transformation from the distal lower quarter
segments into the pelvis and spine during activities such as running, jumping, and
kicking. They emphasized the role of the trunk “as the basic supporting pedestal for such
motion.” (Nicholas et al., 1977, p. 510) This coordinated kinetic chain activation places
the distal segments in the optimal position at most favorable time to produce the desired
task in an efficient manner. One consequence of this arrangement is that impairments
distant to the moving segment may affect the performance of the segment.
Nicholas and colleagues’ link theory emphasized the manner in which injury and
dysfunction of the proximal segments affects performance. Wainner (2007) expanded
this concept by introducing his “regional interdependence” model. In this model,
Texas Tech University Health Sciences Center, Troy L. Hooper, May 2015
42
impairments in a region may not simply affect the performance of proximally- or distally-
linked structures. In addition, these impairments may contribute to, or be associated
with, the patient’s primary complaint. Sueki, Cleland, and Wainner (2013) later modified
this model to highlight the role that neurophysiological and other responses may play in
contributing to musculoskeletal complaints. In their expanded definition, regional
interdependence is “the concept that a patient’s primary musculoskeletal symptom(s) may
be directly or indirectly related or influenced by impairments from various body regions
and systems regardless of proximity to the primary symptom(s)” (Sueki et al., 2013, p.
91).
Alterations in the operation of this kinetic chain linkage proximally may increase
injury risk at more distal regions. In general, muscle activation proceeds in a proximal to
distal manner during movement tasks (Borghuis, Hof, & Lemmink, 2008; Kibler et al.,
2006) Any voluntary movement will change the body’s center of mass position and
impose a perturbation on posture. If this perturbation is not compensated, proximal joint
stresses may increase, and a loss of balance may occur. Pre-programmed muscle
activations, such as the pre-emptive co-contraction of the TrA (Hodges & Richardson,
1996; 1998; 1999a) and Mf (Freeman et al., 2010) that occur prior to leg and arm
movement, help to attenuate these perturbations and stabilize the trunk in anticipation of
extremity movement. These anticipatory adjustments help create the stable proximal
base necessary for efficient distal kinetic chain mobility. This optimal kinetic linkage
reduces joint forces and can help reduce abnormal movements of the distal segments.
Moreover, the proximal initiation of movements allows for the efficient transfer of
torques and angular momentum to the extremities. As a result, small changes in trunk
Texas Tech University Health Sciences Center, Troy L. Hooper, May 2015
43
rotation lead to larger, more forceful rotatory movements at the distal end of the motion
segment (Kibler et al., 2006). In the lower quarter, this lessens the need for the muscles
controlling the knee and ankle to contribute to force production and allows them to
instead control the precision of placement of the foot (Kibler et al., 2006).
Lower Extremity Muscle Activity and Low Back Pain
An interesting application of this regional interdependence model is examining
the influence of trunk, pelvic, and hip muscle activity on lower extremity function.
Inadequate stabilization of the trunk may result in altered lower extremity muscle
activity. One way researchers have explored these adaptations is through the use of
fatigue models to simulate altered trunk muscle function. Individuals with current LBP
(Latimer, Maher, Refshauge, & Colaco, 1999) and those with a LBP history (Simmonds
et al., 1998) both exhibit reduced lumbar extension endurance, which may affect their
ability to adequately stabilize the spine during endurance activities. Because these
muscles fatigue more quickly in these populations, neuromuscular adaptations of muscles
distant to the spine may be required to maintain symmetry and balance. Creating a state
of lumbar paraspinal fatigue in the laboratory simulates this state of reduced core
stability.
Several of these studies have found an association between spinal erector
endurance and fatiguability and quadriceps inhibition. Suter and Lindsay (2001) found
that golfers with chronic LBP whose lumbar extensors fatigue quickly showed a
significantly greater amount of quadriceps muscle inhibition. This association was absent
in a healthy control group. The same finding was observed in subjects with recurrent
LBP who were currently pain-free (Hart, Fritz, et al., 2006a). Similar quadriceps activity
Texas Tech University Health Sciences Center, Troy L. Hooper, May 2015
44
changes were observed following a 15 min bout of aerobic treadmill exercise, a more
functional activity (Hart, Weltman, & Ingersoll, 2010). Quadriceps activation was
reduced 12.4% in subjects with a history of LBP, while control subjects only experienced
a 1.7% reduction. Lumbar paraspinal fatigue likely reduced the spinal erectors’ force
production capacity, and the quadriceps inhibition may be a protective mechanism
designed to maintain anterior-posterior symmetry and preserve knee function (Hart, Fritz,
et al., 2006a). Eccentric quadriceps activation plays an important role in impact
absorption during activities such as gait (Perry & Burnfield, 2010) and landing
(Blackburn & Padua, 2009); therefore, quadriceps inhibition may increase lower
extremity injury risk. Additionally, an inability to properly absorb impact forces via
quadriceps activation may result in an increase in force transmission proximally into the
lumbar spine, placing increased demand on the already impaired trunk muscles (Hamill,
Moses, & Seay, 2009).
While the quadriceps seem to be inhibited in those with LBP, activity of the hip
extensors, primarily the GMax and hamstrings, is affected as well. The GMax, through
its connections with the thoracolumbar fascia, has a direct influence on the lumbar spine
and sacroiliac joint. The diagonal linkage between it and the contralateral latissimus
dorsi allows the transfer of forces from the lower extremities, through the spine, and into
the upper extremities. Through this arrangement, GMax contraction helps to stabilize the
lumbar spine and sacroiliac joint (Vleeming et al., 1995). In addition, the GMax insertion
onto the TFL and iliotibial tract suggests that this muscle may help control motion at the
knee (Stecco, Gilliar, Hill, Fullerton, & Stecco, 2013).
Texas Tech University Health Sciences Center, Troy L. Hooper, May 2015
45
Function of the GMax appears to be impaired in individual with LBP. It is more
easily fatigued (Kankaanpää, Taimela, Laaksonen, Hänninen, & Airaksinen, 1998) and
exhibits an overall decrease in activity (Leinonen, Kankaanpää, Airaksinen, & Hänninen,
2000) during endurance tasks. Female athletes with a history of LBP had greater
differences in side-to-side GMax strength than those without a LBP history, although this
result was not found in male athletes (Nadler, Malanga, Deprince, Stitik, & Feinberg,
2000). Furthermore, the percentage of strength difference between the right and left hip
extensors was predictive of future low back injury in females (Nadler et al., 2001).
Moreover, GMax activation on the stance limb during standing hip flexion was delayed
in subjects with sacroiliac joint pain compared to a healthy control group (Hungerford,
Gilleard, & Hodges, 2003). Thus, it appears that GMax activity is diminished in LBP
sufferers.
The hamstring muscles are affected by LBP as well. Hart and colleagues (2006b)
performed a study in which subjects with a history of LBP but no current pain and
matched controls performed a fatiguing lumbar extension task. They found that fatigue
of the hamstrings, but not the quadriceps, contributed to quadriceps inhibition in the LBP
history group and suggested that because the lumbar extensors are weakened in those
with a LBP history, additional hamstring activation is required to maintain the extension
test position. Hungerford, Gilleard, and Hodges (2003) found that although GMax
activity was delayed during hip flexion in those with sacroiliac joint pain, BF activity was
elevated, and its onset occurred earlier in the activity. Furthermore, hamstring activity is
elevated in LBP subjects when performing an isometric rotation activity (Pirouzi, Hides,
Richardson, Darnell, & Toppenberg, 2006). The results of these studies suggest that
Texas Tech University Health Sciences Center, Troy L. Hooper, May 2015
46
hamstring activity may be elevated during endurance activities in those with LBP, and
this increased activity may lead to earlier fatigue of the muscle and an increased
susceptibility to injury. The abdominal and spinal erector muscles assist in controlling
motion of the lumbar spine and pelvis, creating a stable base for the thigh muscles to
contract. If this system is not working correctly, the hamstrings’ workload is increased.
Devlin (2000) reviewed the literature on hamstring injuries in rugby players and
suggested that abdominal muscle fatigue was a contributing factor to these injuries.
Hamstring activity may be impaired, however, in activities that occur in short bursts.
Haddas et al. (2013) found that semitendinosus activity was delayed in subjects with a
LBP history compared to healthy control subjects when landing from a 30 cm drop
vertical jump.
The GMed is a primary hip abductor. Although the evidence is not as strong as
that for the GMax, recent studies suggest a link between GMed impairment and LBP.
Bilateral GMed co-activation was shown to be a significant predictor of LBP
development in previously asymptomatic subjects during a two hour standing task
(Marshall, Patel, & Callaghan, 2011b; Nelson-Wong & Callaghan, 2010; Nelson-Wong,
Gregory, Winter, & Callaghan, 2008). This co-activation is thought to be an attempt to
compensate for inadequate stabilization by the trunk muscles during this activity (Nelson-
Wong & Callaghan, 2010). Marshall, Patel, and Callaghan (2011b) measured GMed
strength and endurance prior to and following a two hour bout of standing and found that
while GMed strength was not different between those who did and did not develop LBP,
GMed endurance, as measured by a side-bridge endurance test, was impaired in those
who experienced pain. Additionally, GMed activation amplitudes following a lower

Texas Tech University Health Sciences Center, Troy L. Hooper, May 2015
47
extremity perturbation were found to be reduced in subjects with chronic LBP, indicating
that LBP sufferers may exhibit an altered reflex activation of the GMed (Nötzel et al.,
2011). Finally, a pilot study found a positive correlation between GMed weakness
measured with traditional manual muscle testing and the presence of LBP in pregnant
females (Bewyer, Bewyer, Messenger, & Kennedy, 2009).
Lower Extremity Kinematics and Low Back Pain
The association between the lumbar spine and the lower limbs, through their
connections at the pelvis, suggests that individuals with LBP may experience altered
range of motion and kinematics of the lower limbs (Almeida, de Souza, Sano, Saccol, &
Cohen, 2012; Ellison, Rose, & Sahrmann, 1990; Esola, McClure, Fitzgerald, & Siegler,
1996; Mellin, 1988; 1990; Porter & Wilkinson, 1997; Shum, Crosbie, & Lee, 2005b;
2005a; 2007a; 2007b; Wong & Lee, 2004). Unfortunately, studies to date have focused
on the relationship between hip and lumbar spine movement, and the relationship
between LBP and range of motion and kinematic changes of the more distal joints is
largely unknown. These studies have generally found that lumbar and hip range of
motion is often limited in people with LBP (Almeida et al., 2012; Mellin, 1988; 1990;
Porter & Wilkinson, 1997; Wong & Lee, 2004), although this finding has not been
consistent in all studies (Esola et al., 1996).
Changes in the lumbopelvic rhythm, the relative contribution of the lumbar spine
and hip to trunk bending, are apparent as well; however, studies conflict regarding
whether the lumbar contribution decreases (Mayer, Tencer, Kristoferson, & Mooney,
1984; Paquet et al., 1994; Shum, Crosbie, & Lee, 2005a; Wong & Lee, 2004) or increases
(Esola et al., 1996; Porter & Wilkinson, 1997). Shum, Crosbie, and Lee (2007a) found

Texas Tech University Health Sciences Center, Troy L. Hooper, May 2015
48
that although sagittal plane hip and lumbar flexion decreased while picking up an object
on the floor, this loss was compensated by increasing hip and lumbar movement in the
transverse and frontal planes.
Movement control tests are frequently used clinically to detect faulty movement
patterns such as early lumbopelvic rotation during active limb movements such as prone
lateral hip rotation or knee flexion. These studies have consistently shown that
lumbopelvic movement occurs earlier in the range of motion in individuals with LBP
compared to healthy control groups (Graci, van Dillen, & Salsich, 2012; Scholtes,
Gombatto, & van Dillen, 2009; Scholtes, Norton, Lang, & van Dillen, 2010; van Dillen,
Sahrmann, Gombatto, Collins, & Engsberg, 2007). It is theorized that early motion
increases the amount of lumbopelvic motion that occurs throughout the day, which may
increase stress on the structures in the region (Scholtes et al., 2009)
The regional interdependence model predicts that injury to the lumbar spine will
affect pelvic and lower extremity function. Although the literature regarding the
musculoskeletal changes that occur at the lumbar spine, pelvis, and hip in people with
LBP is fairly extensive, many questions remain regarding the timing, extent, and cause of
these changes. Moreover, the effect of LBP on more distal structures is even more
unclear. The cross-sectional design of the large majority of studies makes it impossible
to determine whether neuromuscular and structural differences exist prior to LBP onset or
if they are a consequence of LBP. It is clear that individuals with present LBP or a
history of LBP experience altered function of several muscles in the proximal lower limb
and that this altered muscle activity changes lower extremity movement patterns and
performance. It is not clear, however, why this occurs. It is possible that the altered
Texas Tech University Health Sciences Center, Troy L. Hooper, May 2015
49
trunk muscle activity and diminished trunk stability found in these individuals plays a
role. If these muscles are unable to adequately stabilize the proximal trunk, muscles
more distal in the kinetic chain may be required to adopt a greater stabilizing role,
altering their intended role as prime movers. Additionally, because pelvic stability is
influenced by activity of the trunk muscles through their attachments to the pelvis, an
inability to properly activate the trunk muscles may create an unstable pelvic base and
contribute to altered lower extremity neuromuscular control.
It is likely that other factors contribute to this altered lower limb function as well.
Pain may limit a person’s willingness to perform a task, especially if it requires
movement of the spine. Individuals may attempt to avoid extreme ranges of lumbar and
hip motion and reduce movement velocity to limit their pain (Kusters, Vollenbroek-
Hutten, & Hermens, 2011). Muscle atrophy as a result of spinal nerve root compression
would lead to diminished muscle strength and altered limb function (JLee, An, Lee, &
Seo, 2010; Morag, Hurwitz, Andriacchi, Hickey, & Andersson, 2000). The presence of
radicular leg pain, as indicated by a positive straight leg raise test may affect lower
extremity movements, whereby subjects limit motions that increase nerve root tension
(Shum, Crosbie, & Lee, 2007a). Low back pain sufferers with a positive straight leg
raise sign move with limited lumbar and hip flexion during activities such as sit-to-stand
and stand-to-sit (Shum, Crosbie, & Lee, 2005a), dressing (Shum, Crosbie, & Lee, 2005b),
and picking up and object from the floor while seated (Shum, Crosbie, & Lee, 2007a).
Additionally, stiffness of lumbar and hip soft tissue structures may limit joint ROM
(Congdon, Bohannon, & Tiberio, 2005). Finally, individuals with LBP often experience
general muscle disuse and deconditioning, which could alter lower extremity movement
Texas Tech University Health Sciences Center, Troy L. Hooper, May 2015
50
patterns (Verbunt et al., 2003). When attempting to measure the effect of trunk muscle
dysfunction and trunk instability on lower extremity movement patterns, one must
attempt to control for these other potential causes of movement impairments.
LE Injury Mechanisms
The regional interdependence model predicts that impaired hip and trunk muscle
activity contributes to increased lower extremity injury risk, and altered hip and trunk
muscle activity has been linked to several lower extremity injuries, including ACL tears,
PFPS, and ITBFS (Chuter & de Jonge, 2012). Additional evidence has linked and groin
and hamstring injuries with trunk muscle impairments (Cowan, Crossley, & Bennell,
2009; Devlin, 2000; Hides et al., 2011). It is possible that the changes in hip muscle
function associated with LBP described in the previous section contribute to an increased
risk of developing these injuries. This section will describe these injuries and the
mechanisms that contribute to their development. The proposed mechanisms responsible
for the connection between proximal dysfunction and these distal injuries will then be
discussed.
Anterior Cruciate Ligament
Anterior cruciate ligament injuries pose significant short- and long-term
consequences, particularly for female athletes who suffer these injuries at a rate 2-8 times
greater than males (Arendt & Dick, 1995). Because the majority of these injuries are due
to noncontact mechanisms that occur during landing, deceleration, or changes of
direction (Boden et al., 2000), individuals who suffer them likely possess common
characteristics that increase their injury risk. Potentially modifiable ACL injury risk

Texas Tech University Health Sciences Center, Troy L. Hooper, May 2015
51
factors found during these activities have received considerable attention. Among the
risk factors commonly cited are knee and hip position during landing and alterations in
lower extremity neuromuscular control.
During landing, the degree of knee flexion at initial contact has been implicated as
a factor in ACL injuries. Boden et al. (2000) retrospectively found that all injuries in
their study occurred with the knee close to extension (between 0° and 30°). Similarly,
female athletes tend to land in less knee flexion compared to male athletes (Decker,
Torry, Wyland, Sterett, & Richard Steadman, 2003; Huston, Vibert, Ashton-Miller, &
Wojtys, 2001), which may help explain the increase ACL injury rate in women. Sagittal
plane stress, however, is not normally sufficient to cause an ACL tear. The ACL is most
at risk when it experiences an adverse three dimensional (3-D) load consisting of frontal
plane knee valgus combined with hip internal rotation in the transverse plane (Hewett,
Torg, & Boden, 2009; Koga et al., 2010; Olsen, Myklebust, Engebretsen, & Bahr, 2004)
Altered neuromuscular control plays a prominent role in ACL injury models. Co-
contraction of the hamstrings and quadriceps muscles provides important active stability
for the knee. Quadriceps activation generates a compressive tibiofemoral joint force and
increases anterior displacement of the tibia, thus increasing strain on the ACL
(Makinejad, Osman, Azuan, Abas, & Bakar, 2013; Withrow, Huston, Wojtys, & Ashton-
Miller, 2006). Conversely, hamstring muscle activity stabilizes the tibia, decreasing
anterior ACL shear (Makinejad et al., 2013; More et al., 1993). Differences in the
activation and timing of these two muscle groups have been suggested as possible factors
contributing to the increased ACL injury risk. For example, female athletes display a
dominance of quadriceps activity relative to the hamstrings, while male athletes

Texas Tech University Health Sciences Center, Troy L. Hooper, May 2015
52
preferentially recruit the hamstrings during dynamic tasks such as landing (Cowling &
Steele, 2001; Ebben et al., 2010; Myer, Ford, & Hewett, 2005).
Moreover, weakness and neuromuscular control impairments of the hip muscles
can lead to increased knee valgus angles and joint moments during activities such as
landing and squatting (Claiborne, Armstrong, Gandhi, & Pincivero, 2006; Hollman et al.,
2009; Jacobs, Uhl, Mattacola, Shapiro, & Rayens, 2007; Lawrence, Kernozek, Miller,
Torry, & Reuteman, 2008; Winby, Lloyd, Besier, & Kirk, 2009). These forces at the
knee are the result of excessive femoral adduction and internal rotation due to an inability
of the hip abductors and external rotators to eccentrically control these motions. This
action contributes to what Ireland (2002) termed the “position of no return”, in which an
adducted and internally rotated femur, along with decreased hip and knee flexion and a
forward trunk lean impose a 3-D torque on the tibiofemoral joint and lead to an ACL tear.
Hewett et al. (2005) has referred to this position as a “dynamic valgus”, since it is not a
static biomechanical measure but occurs during lower extremity activities. This group
collected kinematic and kinetic data during a drop vertical jump on 205 adolescent
female athletes prior to their competitive seasons (Hewett et al., 2005). They found that
athletes who suffered ACL injuries demonstrated a 2.5 fold increase in peak knee
abduction angle and increased external knee abduction moment compared to the non-
injured group. Although they did not measure hip muscle strength, the authors concluded
that poor neuromuscular control at the hip was associated with the increased dynamic
knee valgus. In addition, inadequate GMax activity during the deceleration phase of
landing can result in lower hip extension moments, less energy absorption at the hip, and
larger valgus moments at the knee, as the hip extensors are unable to adequately control
Texas Tech University Health Sciences Center, Troy L. Hooper, May 2015
53
the deceleration of the body’s center of mass (Pollard, Sigward, & Powers, 2010). As a
result, the quadriceps and knee ligaments must absorb more of the impact force.
Patellofemoral Pain Syndrome
Patellofemoral pain syndrome is the most common overuse injury of the knee
(Taunton et al., 2002). Several specific pain generators may cause pain around the
patella including acute contusions or degenerative changes of the patellar or trochlear
cartilage and ligamentous laxity leading to patellar hypermobility. It is around 2.2 times
more common in females than males (Boling et al., 2010). Traditionally, the mechanisms
of injury for PFPS were thought to be abnormal lateral tracking of the patella in the
femoral trochlear grove as a result of tight lateral retinacular structures (Farahmand,
Tahmasbi, & Amis, 1998; Fithian, Mishra, Balen, Stone, & Daniel, 1995; Z. P. Luo,
Sakai, Rand, & An, 1997), increased quadriceps (Q)-angle (Emami, Ghahramani,
Abdinejad, & Namazi, 2007), or abnormal quadriceps activity (Pal et al., 2012) creating
abnormal contact pressures on the patellar articular cartilage (Lee, Morris, & Csintalan,
2003) and possible lateral subluxation or dislocation.
More recently, researchers have investigated the role of the hip abductors and
external rotators in this and other lower extremity overuse injuries. It appears that
dysfunction of these muscles is an important contributor to these injuries, particularly in
females, who commonly share structural and neuromuscular characteristics shown to
contribute to lower extremity impairments such as PFPS. A recent systematic review
(Prins & van der Wurff, 2009) concluded that females with PFPS have weaker hip
abductors, external rotators and extensors compared to healthy control subjects.
Weakness, fatigue, or impaired neuromuscular control of these muscles may contribute to
Texas Tech University Health Sciences Center, Troy L. Hooper, May 2015
54
PFPS in several ways. First, during single leg weight bearing activities, such as the
stance phase of running, proximal stability is required to control the absorption of contact
forces. A large femoral adduction moment is produced across the hip, and the hip
abductors must counter this force (Bergmann, Graichen, & Rohlmann, 1993). Hip
abductor weakness, in particular GMed, results in an unstable pelvic base and excessive
pelvic drop, which is commonly observed in individuals with PFPS (Cichanowski,
Schmitt, Johnson, & Niemuth, 2007). This pelvic drop increases the hip abduction angle,
leading to greater femoral adduction and internal rotation and an increased “dynamic” Q-
angle (Imwalle, Myer, Ford, & Hewett, 2009) and knee valgus (Hewett et al., 2005).
During this process the patella is held in place by its attachments to the quadriceps and
patellar tendon and stays relatively fixed. The result is that the femur rotates under the
patella, and the patella becomes laterally displaced relative to the trochlear groove
(Powers, Ward, Fredericson, Guillet, & Shellock, 2003).
Another possible means by which impaired hip function may contribute to PFPS
is GMax fatigue. Willson, Petrowitz, Butler, and Kernozek (2012) compared GMax and
GMed EMG activity and lower extremity kinematics in males and females running at 3.7
m/s and found that females experienced greater GMax activity compared to males. They
theorized that this increased activity may lead to earlier GMax fatigue during running,
and the resulting GMax activity may contribute to the greater incidence of PFPS in
females.
Iliotibial Band Friction Syndrome
Iliotibial band friction syndrome is the most common overuse knee injury in
runners (Taunton et al., 2002). It is caused by friction of the iliotibial band over the

Texas Tech University Health Sciences Center, Troy L. Hooper, May 2015
55
lateral femoral condyle, particularly while the knee is flexed in a zone of impingement
around 30° during the foot strike and early stance running phases (Orchard, Fricker,
Abud, & Mason, 1996). Commonly cited causes of ITBFS include tightness of the
iliotibial band and the lateral patellar retinacular structures, poor running shoes, and
training errors (Orchard et al., 1996; van der Worp, Backx, van der Horst, de Wijer, &
Nijhuis-van der Sanden, 2012). Similar to ACL and PFPS injuries, however, recent
studies have found links between altered hip muscle function and biomechanics and this
pathology. The GMax inserts directly onto the iliotibial band (Stecco et al., 2013),
creating a direct link from the thoracolumbar fascia, through the GMax, and onto the
iliotibial band (Vleeming et al., 1995). Although it has not been studied, this connection
between the lumbar spine and the knee may provide a mechanism for trunk muscle
dysfunction to affect the knee.
Noehren, Davis, and Hamill (2007) performed a prospective study in which they
examined the biomechanics of female runners and found that those who developed
ITBFS had greater knee femoral internal rotation and hip adduction, providing evidence
that this gait pattern contributes to ITBFS. The authors suggest that internal rotation of
the femur shifts the iliotibial band medially, which increases the compression of the band
against the femoral condyle. The GMax helps eccentrically control femoral internal
rotation; therefore, dysfunction of this muscle is a possible explanation for the femoral
internal rotation found in the runners in this study. Additionally, because the TFL assists
the GMax with control of femoral internal rotation, early fatigue of the GMax, a common
finding in LBP sufferers (Kankaanpää et al., 1998), may force the TFL to increase its
activation in order to compensate for the diminished GMax activity. This action would
Texas Tech University Health Sciences Center, Troy L. Hooper, May 2015
56
increase tension in the iliotibial band. Tensor fascia latae and GMax activity is required
to control femoral internal rotation in the early part of the stance phase, which
corresponds to the time in which the knee flexes through the impingement zone (Orchard
et al., 1996). Elevated tension on the iliotibial band during this part of the running cycle
increases compression on the femoral condyle at the most inopportune time. An increase
in hip adduction along with a contralateral pelvic drop due to GMed weakness will shift
the center of mass medially, away from the stance leg, increasing the external varus
moment at the knee. This would increase the tensile strain on the iliotibial band as well
(Powers, 2010).
Because hip muscle strength was not measured in the Noehren et al. (2007) study,
it cannot be determined whether gluteal muscle weakness was the cause of the
biomechanical variations found in these runners. However, another study (Fredericson et
al., 2000) found diminished hip abductor strength in the involved limb in females with
ITBFS compared to the other limb and matched controls. In this study, subjects with
ITBFS were placed on a 6-week hip abduction strengthening program, after which 92%
of subjects were pain-free while running (Fredericson & Wolf, 2005).
Groin and Hamstring
Proper function of the hip adductors and hamstring muscles depends on a stable
lumbopelvic base. Although no studies could be found that examine the association of
LBP and these injuries, evidence does exist linking them to altered TrA and Mf activity
(Bennell et al., 2004; Devlin, 2000; Hides et al., 2011). The TrA and IO muscles are
important dynamic anterior pelvic ring stabilizers, as bilateral contraction of these
muscles approximates the pubic bones at the pubic symphysis (Bennell et al., 2004).
Texas Tech University Health Sciences Center, Troy L. Hooper, May 2015
57
Altered feed-forward activation of the TrA, which is common in LBP sufferers, can lead
to pubic symphysis instability, creating an unstable pelvic base for the hip adductors.
Evidence for this impairment was provided by Cowan et al. (2004), who found that
during the active straight leg raise test, subjects with chronic groin pain experienced a
delayed contraction of the TrA muscle compared to uninjured controls. Hides, Brown,
Penfold, and Stanton (2011) measured Mf, quadratus lumborum, and psoas major cross-
sectional area, as well as trunk cross-sectional area (CSA) with and without TrA
contraction, using magnetic resonance imaging in elite level Australian Rules Football
players prior to and following a preseason training regimen. The relationship between
these measurements and the incidence and severity of hip, groin, and thigh muscle
injuries was then examined. No relationship was found between ability to contract the
TrA or psoas major and quadratus lumborum CSA. However, a significant relationship
was found between L5 Mf CSA and preseason injury. Subjects who experienced severe
injuries had a significantly smaller L5 Mf muscle at the beginning and end of the study
period. The authors hypothesized that a smaller Mf may reduce the ability to control
lumbar lordosis either due to decreased force production or reduced afferent feedback
from the smaller muscle. The Mf is an important lumbar stabilizer and helps control
lumbar lordosis (Bogduk et al., 1992). Fatigue of the multifidus could lead to a loss of
lumbar lordosis, resulting in flexion at the lumbo-sacral junction, which the authors
suggest could lead to alterations in force transfer between the trunk and distal segments
(Hides et al., 2011). The connection between the thoracolumbar fascia and the
hamstrings via the sacrotuberous ligament provides a mechanism for force transfer
Texas Tech University Health Sciences Center, Troy L. Hooper, May 2015
58
between the lumbar spine, sacroiliac joint, and posterior thigh (Vleeming, van
Wingerden, Snijders, Stoeckart, & Stijnen, 1989).
Hamstring injuries are common in many athletic activities. For example,
hamstring strains comprise 12-16% of all injuries in elite-level soccer (Hagglund, 2006).
The GMax is a powerful hip extensor, and the hamstring muscles assist in this action.
The early fatigue and inhibition of the GMax observed with LBP (Kankaanpää et al.,
1998; Leinonen et al., 2000) could increase hamstring activation (Sahrmann, Lewis, &
Moran, 2009) and subsequent strain on the hamstring muscles, making them more
susceptible to injury (Panayi, 2010). Additionally, altered neuromuscular control of the
trunk muscles resulting from LBP may change the tilt of the pelvis and alter the length-
tension relationship of the hamstrings (Sherry & Best, 2004).
Although a mechanistic link between hamstring injury and trunk dysfunction has
not been directly tested, Devlin (2000) published a review of injuries in rugby and
theorized that impaired trunk muscle activity was a contributing factor to hamstring
injuries. Moreover, Sherry and Best (2004) performed a prospective randomized
comparison of two hamstring strain rehabilitation protocols. The traditional hamstring
strain rehabilitation group performed static stretching, isolated progressive hamstring
resistance exercises, and ice application post-activity. A second group performed
progressive agility and trunk stabilization exercises in addition to ice application. No
differences were observed in the time required to return to full sports participation;
however, within one year seven of the 10 subjects in the traditional rehabilitation group
had suffered a reinjury, whereas only one of 13 subjects in the trunk stabilization group
Texas Tech University Health Sciences Center, Troy L. Hooper, May 2015
59
had reinjured their hamstring. These studies provide indirect evidence for a link between
LBP and hamstring injury.
Potential Link Between Low Back Pain and Knee Injury
Strong evidence exists that hip muscle dysfunction contributes to each of the
lower extremity pathologies described herein. In addition to the studies cited above,
other authors have studied the association between lower extremity injuries in general
and hip muscle function (Leetun et al., 2004; Nadler et al., 2000). A study of male and
female intercollegiate athletes found that hip extension strength in subjects without a
history of lower extremity injury was symmetrical, but females with a lower extremity
injury history had decreased hip extensor strength on the injured side (Nadler et al.,
2000). The majority of such investigations have been in the form of cross-sectional
studies, which cannot provide information regarding the onset of the hip muscle
dysfunction. As a result, one cannot infer whether the hip muscle dysfunction is a cause
or a result of the knee injury. If the hip muscle dysfunction is a result of knee injury, then
the theory that LBP-induced hip muscle dysfunction results in biomechanical changes
that increase knee injury risk is diminished. In this case, the regional interdependence
model would hypothesize that hip injury could lead to LBP. Evidence exists to support
this idea. For example, Nadler, Wu, Galski, and Feinberg (1998) screened collegiate
athletes for the presence of lower extremity deformities such as muscle inflexibility, leg
length difference, knee joint line tenderness, acquired ligamentous laxity,
musculotendinous overuse injuries, and postsurgical deficits. They followed these
subjects for one year, recorded LBP occurrence, and found that subjects with acquired
Texas Tech University Health Sciences Center, Troy L. Hooper, May 2015
60
ligamentous laxity, overuse injuries, or residual postsurgical deficits experienced a
greater frequency of LBP episodes than those without these lower extremity deficits.
On the other hand, if hip muscle impairment occurs prior to the onset of knee
injury, it becomes a plausible explanation for the biomechanical changes and increased
injury risk. The hip muscle dysfunction found in LBP sufferers may be sufficient to
increase this injury risk. In addition to the ITBFS study by Noehren, Davis, and Hamill
(2007) mentioned in the previous section, other prospective studies provide evidence that
hip muscle dysfunction precedes lower extremity injury. A prospective study of military
recruits recorded baseline kinematic and kinetic variables during a jump-landing task
prior to entrance into military training and found that increased hip internal rotation
angle, decreased knee flexion angle, and decreased vertical ground reaction force were
risk factors for developing PFPS (Boling et al., 2009). An unexpected finding of this
study was that hip external rotation strength was greater in the group that developed
PFPS. The authors hypothesized that this increased strength was related to the elevated
eccentric demands placed on the external rotators in response the to greater internal
rotation in this group.
Logistic regression analysis in another prospective investigation of PFPS risk
factors in high school-age runners determined that a higher normalized hip external-to-
internal hip internal rotation torque percent ratio decreased injury risk (Finnoff et al.,
2011). They found that this ratio was significantly lower in the PFPS group. In contrast
to the previous study, these results indicate that the PFPS group had decreased hip
external rotation strength. Additionally, the logistic regression analysis determined that a
higher baseline hip abduction torque and abduction-to-adduction ratio reduced injury
Texas Tech University Health Sciences Center, Troy L. Hooper, May 2015
61
risk, indicating that this group had great hip abductor strength. The authors attempted to
explain this discrepancy with previous literature by noting that the middle and posterior
fibers of the GMed act as an external rotator (Neumann, 2010), and increased GMed
strength could compensate for the impaired external rotator strength in this group.
Furthermore, this injured group had a significantly greater weight and body mass index
(BMI), which would increase the hip adduction moment during gait, and hip abductor
strength was increased to compensate for this larger load.
Finally, Leetun, Ireland, Willson, Ballantyne, and Davis (2004) examined the role
of hip abduction and external rotation strength, along with anterior, posterior, and lateral
trunk muscle endurance on general lower extremity injury risk in intercollegiate track and
basketball athletes. A logistic regression analysis determined that hip external rotation
strength significantly predicted injury status in both males and females. Additionally, hip
abduction and external rotation strength was significantly lower in the injured group.
The previously described studies provide strong evidence that hip muscle
dysfunction precedes and contributes to lower extremity injuries. Further evidence
suggests that a similar relationship exists between LBP-induced trunk muscle
impairments and lower extremity injuries (Hewett et al., 1999; Hides et al., 2011; Perrott
et al., 2012; Petersen et al., 2005; Wilkerson et al., 2012; Zazulak et al., 2007) The
influence of the trunk muscles on lumbopelvic stability and hip muscle activation may
have implications for lower extremity injury occurrence. Dynamic activities such as
running, jumping, and kicking require a stable lumbopelvic base (Hides et al., 2011), and
lumbopelvic instability resulting from trunk muscle activity changes known to occur with
LBP may lead to altered lower extremity muscle activity and kinematics. Other
Texas Tech University Health Sciences Center, Troy L. Hooper, May 2015
62
prospective studies have found a relationship between LBP, trunk muscle dysfunction,
and lower extremity injury risk.
A history of LBP is a significant predictor of ACL injury in females and males
(Zazulak et al., 2007). One possible explanation for this finding is that the impaired
neuromuscular control of the abdominal muscles associated with LBP creates increased
lumbopelvic instability, where this unstable base impairs the ability of the hip muscles to
eccentrically control adduction and internal rotation of the femur, resulting in an
increased valgus force at the knee. The trunk position relative to the pelvis and lower
extremities influences ACL injury risk as well. Hewett and Myer (2011) note that a
common non-contact mechanism of ACL injury occurs when an individual experiences a
lateral trunk lean while the body weight is shifted over onto one leg. This position moves
the ground reaction force vector laterally, which increases the internal knee adduction
moment and leads to greater knee valgus angles. One cause of uncontrolled lateral trunk
lean may be LBP and the trunk neuromuscular control dysfunctions that accompany it
(Hewett et al., 2009). Zazulak, Hewett, Reeves, Goldberg, and Cholewicki (2007)
conducted a prospective study in which they measured coronal and sagittal plane trunk
displacement after a sudden force release in male and female collegiate athletes. They
found that trunk lateral displacement was greater in female athletes who experienced
ACL injuries; however, sagittal plane displacement was not predictive of injury. A
history of LBP and active trunk repositioning error were additional significant predictors
of ACL injury. Preventative programs that include lumbar stabilization exercises
designed to improve trunk neuromuscular control have been shown to reduce the risk of
ACL injury in female athletes (Hewett et al., 1999; Petersen et al., 2005).
Texas Tech University Health Sciences Center, Troy L. Hooper, May 2015
63
Another prospective study examined the ability of core muscle endurance, aerobic
capacity, BMI, and responses to low back, knee, and ankle disability questionnaires to
predict core and lower extremity injuries in collegiate football players (Wilkerson et al.,
2012). Trunk muscle endurance was determined using the horizontal back-extension
hold, sitting 60° trunk-flexion hold, side-bridge hold, and bilateral wall-sit hold. Logistic
regression determined that low trunk-flexion hold time, high Oswestry Disability Index
score, and low wall-sit hold times best predicted injury status at the end of an 11-game
season. Subjects with these three positive factors experienced a 3 times greater injury
risk compared to those with fewer than three risk factors. An Oswestry Disability Index
score as low as six on a 100-point scale was sufficient to increase injury risk, suggesting
that even low levels of LBP-related disability may increase core and lower extremity
injury risk. Unfortunately, the authors did not separate core and lower extremity injuries
in their analysis, so it is not possible to determine the impact low back injuries had in
their analysis. However, the majority of the injuries occurred in the lower extremities,
where subjects suffered seven low back injuries and 32 lower extremity injuries.
If trunk and hip muscle impairments increase lower extremity injury risk, it
appears reasonable that a strengthening and stabilization exercise program of the trunk
and hip would decrease injury risk. A recent systematic review and meta-analysis
(Perrott & Pizzari, 2013) examined the hypothesis that incorporating exercises designed
to improve lumbopelvic muscle function into training programs reduces the incidence of
lower limb muscle strain injuries. Their review found six studies in which lumbopelvic
stabilization exercise programs were used to prevent lower extremity injuries. A meta-
analysis of their data indicated that performing traditional exercises resulted in a two and
Texas Tech University Health Sciences Center, Troy L. Hooper, May 2015
64
a half times greater injury risk than lumbopelvic stabilization exercise performance. This
review provides strong evidence that lumbopelvic stabilization exercises decrease injury
risk.
VPAC AND ITS POTENTIAL INFLUENCE
VPAC and Lumbopelvic Stability
Neuromuscular and structural changes that occur with LBP lead to a decrease in
lumbopelvic stability (Kaigle, Holm, & Hansson, 1995; Panjabi, Abumi, Duranceau, &
Oxland, 1989). These changes lead to increased shearing forces in the lumbar spine,
placing it at risk for further injury (Kaigle et al., 1995). A previous section described
changes in trunk muscle activity that occur in people with LBP or a LBP history. The
trunk muscle activation deficits seen in people with LBP suggest that these individuals
may not be able to sufficiently co-activate their trunk muscles when faced with
unexpected perturbation challenges. These changes imply that the active stabilization
system is limited in its ability to increase spine stability at a time when the passive system
is damaged. Often, these individuals attempt to improve stability via co-contraction of
the agonist and antagonist muscles; however, this response is variable, and not all people
may select an optimal muscle contraction strategy. In addition, the reflex activation of
the trunk muscles may be delayed. Since voluntarily contracting the trunk muscles
increases lumbopelvic stability (Grenier & McGill, 2007; Pel et al., 2008; Richardson et
al., 2002; Stanton & Kawchuk, 2008; Vera-Garcia, Elvira, Brown, & McGill, 2007), it
may be advantageous for individuals to preemptively activate these muscles in an attempt
to increase overall spine stability, improve pelvic and lower extremity biomechanical
movement patterns, and reduce pain. This may be paramount to improving performance

Texas Tech University Health Sciences Center, Troy L. Hooper, May 2015
65
and reducing injury risk, considering that 90% of sports-related low back injuries are the
result of self-initiated actions such as jumping, lifting, or throwing (Greene et al., 2001).
If such individuals are unable to reflexively activate their trunk musculature in a
sufficient fashion, it may be advantageous for them to volitionally contract these muscles
prior to engaging in tasks that challenge their control, balance, and or posture. This
would effectively improve lumbopelvic stability and theoretically protect the spine from
injurious loads.
The benefits of a preemptive trunk co-contraction strategy may not be limited to
those with LBP. Granata, Orishimo, and Sanford (2001) found that in people without a
LBP history, the expectation of a sudden load does not increase preparatory muscle
activation. The authors concluded that during dynamic loading conditions, stability is
dependent upon dynamic feedback from the neuromuscular system. The neuromuscular
system may not always assess stability requirements accurately, however. For example,
trunk muscle activity is delayed when greater than expected loads are lifted (Watanabe et
al., 2013). A preemptive trunk co-activation strategy may increase lumbopelvic stability
in preparation for these sudden loads. In addition, the feed-forward TrA activation
observed to occur prior to voluntary arm and leg movements (Hodges & Richardson,
1997a; 1997b) does not always operate during reactive postural tasks. During these
activities EO, and occasionally RA, activity precedes TrA contraction (Carpenter,
Tokuno, Thorstensson, & Cresswell, 2008; Cresswell, Oddsson, & Thorstensson, 1994;
Tokuno, Cresswell, Thorstensson, & Carpenter, 2011). This lack of control requires a
volitional trunk muscle response to activate a stabilizing mechanism during challenging
perturbations.

Texas Tech University Health Sciences Center, Troy L. Hooper, May 2015
66
A VPAC is commonly used to improve lumbar spine stability and reduce pelvic
motion in individuals with spine dysfunction. In general, a VPAC involves the
intentional contraction of lumbopelvic musculature performed in anticipation of an
increased spinal load, whose purpose is to enhance lumbopelvic stability. The two most
popular VPAC methods include the abdominal drawing-in maneuver (ADIM) and
abdominal bracing maneuver (ABM). The ADIM incorporates a drawing-in of the TrA
muscle towards the spine, potentially accompanied by IO activation (Teyhen et al., 2009).
Here, the relaxation of the EO and lumbar extensors is emphasized. Conversely, the
ABM emphasizes a global contraction of all the abdominal muscles and lumbar
extensors, where no movement should occur in the abdominal wall during the activation
(Brown, Vera-Garcia, & McGill, 2006).
Studies have reported that both healthy and LBP populations can correctly
perform VPAC maneuvers. Kulas, Windley, and Schmitz (2005) studied the test-retest
reliability of two VPAC techniques during a single-leg landing from a 30 cm height.
Subjects were asked to perform no VPAC, the ADIM, or a posterior pelvic tilt during
landing. Using abdominal circumference measurements, they found moderate test-retest
reliability of ADIM performance during landing (ICC2,k= .53). The pelvic tilt used in
this study is similar to the ABM. Both the pelvic tilt and ABM techniques emphasize
activation of the global trunk muscles; however, posterior pelvic displacement is required
for the pelvic tilt, while the pelvis does not move when performing the ABM. Reliability
of the pelvic tilt was calculated using pelvic tilt joint displacement, which was measured
in the mediolateral axis aligned in the sagittal plane. Subjects were able to reproduce this
position during landing with excellent reliability (ICC2,k= .91).

Texas Tech University Health Sciences Center, Troy L. Hooper, May 2015
67
Another study (Hooper, Sizer, James, Brismée, & Haddas, 2012) measured EO
and IO activity during a landing sequence from a 30 cm height with and without a
superimposed ABM in people without LBP and found that EO activation was
significantly greater during the ABM condition compared to the no ABM condition both
before and after initial contact during the landing sequence. Successful ABM
performance requires increased EO activity, so this study provides evidence that healthy
individuals are able to voluntarily increase EO contraction levels during landing from this
height. Subjects performed additional landings from a 50 cm height, but EO activity was
not different between the ABM and no ABM conditions at this height (Hooper et al.,
2012). This may be because trunk muscle activation after landing increases to such a
degree when exposed to the increased external loads from a 50 cm height that individuals
are not able to increase the muscle activity further with a VPAC. Erector spinae activity
did not change between conditions at either height, however, possibly because the spinal
erectors are maximally active to control forward trunk flexion during the landing
sequence (Iida, Kanehisa, Inaba, & Nakazawa, 2011), and voluntarily increasing their
activation level is not possible.
Other studies have shown that individuals with current LBP are capable of
performing VPAC maneuvers during functional activities. Marshall, Desai, and Robbins
(2011a) asked people with chronic LBP and healthy control to perform a series of lumbar
stabilization exercises with and without a superimposed ABM. Although the resulting
muscle activation patterns were inconsistent, the EO most consistently increased its
activation level during the ABM in both groups. Another study used ultrasound imaging
to measure TrA muscle thickness (an indication of muscle activity) with and without

Texas Tech University Health Sciences Center, Troy L. Hooper, May 2015
68
ADIM performance in individuals with non-specific LBP and healthy controls during a
loaded forward-reaching activity in standing (Nagar, Hooper, Dedrick, Brismée, & Sizer,
2014). In both groups TrA thickness increased significantly during trials with ADIM
performance, and the LBP subjects increased TrA thickness more than the healthy group,
which suggests that the ADIM provides an enhanced protective effect in this population.
Investigators have compared the ability of ADIM and ABM to improve spinal
stability via increased spinal stiffness and found that the ABM produced greater
improvements in lumbopelvic stiffness and stability than the ADIM (Grenier & McGill,
2007; Stanton & Kawchuk, 2008; Vera-Garcia et al., 2007). Moreover, the isolated TrA
activation required during the ADIM may be difficult to achieve during dynamic
functional activities. TrA activity is isolated only at low levels of activation, as the
remaining trunk muscles quickly begin to contract as activation intensity increases
(Davidson & Hubley-Kozey, 2005; Grenier & McGill, 2007). Therefore, the ABM may
be better suited to stabilize the spine and pelvis against sudden perturbations and thus
may be optimal for examining the influence of volitional abdominal contraction on
muscle activity and lower extremity biomechanics during dynamic functional tasks.
VPAC and Lower Extremity Control Parameters
In addition to enhancing lumbopelvic stability, VPAC maneuvers may influence
lower extremity control parameters. Pelvic control is influenced by activity of the trunk
muscles through their attachments to the pelvis. Activation of the TrA via the ADIM
significantly decreases activity of the lumbar ES muscles, increases GMax and medial
hamstring muscle activity, and decreases anterior pelvic tilt during prone active hip
extension (Oh, Cynn, Won, Kwon, & Yi, 2007). Additionally, this maneuver decreases
Texas Tech University Health Sciences Center, Troy L. Hooper, May 2015
69
lateral pelvic tilt (Cynn, Oh, Kwon, & Yi, 2006), which has been shown to be
exaggerated during non-contact ACL injuries in females (Hewett et al., 2009). Similarly,
the ADIM in subjects with chronic LBP reduces ES activity and increases medial and
lateral hamstring activation during prone active knee flexion (Park et al., 2011). During
sidelying hip abduction, the ADIM decreases quadratus lumborum activity and increases
activation of the GMed and IO (Cynn et al., 2006). These studies show that while in a
recumbent position, the ADIM is able to positively influence many of the trunk and lower
extremity neuromuscular and kinematic impairments known to increase lower extremity
injury risk.
Other studies have examined the effect of VPAC on lower extremity
biomechanics during more functional activities and provide further evidence that VPAC
maneuvers may alter lower extremity motion and energetics. Shirey et al. (2012) studied
the influence of purposeful trunk muscle co-contraction on hip and knee kinematics
during a single leg squat off a six inch step. They found that VPAC decreased hip frontal
plane displacement bilaterally and increased knee flexion of the stance leg. The authors
did not attempt to quantify the ability of subjects to perform the required abdominal
contraction, however, so it is unknown whether trunk musculature activation truly
differed between the two conditions. In addition, transverse plane motion and the effect
of VPAC on lower extremity forces were not examined.
Hooper et al. (2012) asked healthy subjects to perform a 30 cm drop vertical jump
with and without a superimposed ABM and examined the ABM’s influence on lower
extremity kinematics, kinetics, and EMG activation. Landing with ABM resulted in a
significantly greater knee flexion range of motion, knee internal abduction moment, and
Texas Tech University Health Sciences Center, Troy L. Hooper, May 2015
70
knee energy absorption. Further, the ABM influenced muscle activity, with EO activity
increasing pre- and post-contact, and medial hamstring activity increasing post-contact.
The authors suggested that the ABM can increase trunk protection without deteriorating
lower extremity control, and individuals can be encouraged to perform the ABM during
jumping activities to improve lumbopelvic stability. Haddas et al. (2013) performed a
similar study in individuals with a history of recurrent LBP. They found that these
subjects had delayed semitendinosus activation compared to the control group when
landing from a 30 cm height, and this difference was exacerbated when the subjects were
fatigued. However, ABM performance resulted in significantly earlier semitendinosus
activation compared to the no-ABM condition. Considering the role of delayed
hamstring activation in ACL injury mechanisms (Cowling & Steele, 2001; Ebben et al.,
2010; Myer et al., 2005), ABM performance may provide a protective effect to the knee
during landing.
Finally, Kulas et al. (2005) compared ADIM, ABM, and no VPAC during single
leg landing. Joint powers and mechanical work were calculated for the hip, knee, and
ankle joints, and leg-spring stiffness was determined by dividing the peak vertical GRF
by the total vertical displacement of the center of mass of the eight body segments. No
differences among the three groups were found for any of these variables, but the large
effect sizes found for many of these variables suggest that a larger sample size may have
resulted in statistically significant differences. These studies provide evidence that
VPAC performance may positively influence trunk and lower extremity control
parameters, but further study is necessary to better understand the changes produced by a
VPAC maneuver. Landing activities produce large amounts of lower extremity force,
Texas Tech University Health Sciences Center, Troy L. Hooper, May 2015
71
which may limit benefits derived from VPAC use. The role of a VPAC during less
dynamic activities could provide further information regarding changes induced by these
maneuvers. Additionally, VPAC’s influence on the lower extremity control parameters
of individuals with recurrent LBP has not been studied.
Potential VPAC Disadvantages
Although VPAC performance is known to facilitate advantageous trunk and lower
extremity neuromuscular and biomechanical alterations, it has the potential to cause
potentially harmful changes as well. The primary goal of VPAC maneuvers is to increase
lumbopelvic stability, but a balance between stability and mobility must be obtained
(Borghuis et al., 2008). Too much stiffness can increase energy expenditure
unnecessarily and compromise the trunk’s ability to adapt to changing conditions (Barr,
Griggs, & Cadby, 2005). It is possible that the increased metabolic cost associated with
VPAC performance, particularly the ABM, may promote earlier fatigue if performed
continually during athletic and occupational activities. Additionally, increasing trunk
stiffness imposes a greater compressive load on the lumbar spine (Gardner-Morse &
Stokes, 1998), which may not be tolerated by individuals with discogenic LBP. It
appears, however, that the stability benefits of co-contraction outweigh the cost of any
compression increase. Granata and Marras (2000) found that co-contraction was
associated with a 12% to 18% increase in spinal compression but produced a 34% to 64%
increase in lumbar stability. Grenier and McGill (2007) likewise found that the ABM
produced minimal increases in spine compression loads, particularly at the low levels of
activation required to produce adequate trunk stiffness (Cholewicki & McGill, 1996;
Kiefer, Shirazi-Adl, & Parnianpour, 1997).

Texas Tech University Health Sciences Center, Troy L. Hooper, May 2015
72
Finally, evidence exists that VPAC performance can negatively influence postural
control, although others suggest a protective effect. Active trunk co-contraction increases
center of pressure velocity while sitting on an unstable surface (Reeves, Everding,
Cholewicki, & Morrisette, 2006), and postural control is transiently affected following
performance of common core stability exercises (Kaji, Sasagawa, Kubo, & Kanehisa,
2010). However, Nagar et al. (2013) performed static postural control tests using
computerized dynamic posturography testing with and without a superimposed ABM in
healthy subjects. They found that during the ABM condition, the motor control test
demonstrated a significant decrease in the latency score and composite amplitude score,
which suggests that subjects were able to recover their balance more quickly when
performing the ABM. In addition, vastus lateralis (VL) activity significantly increased
during the ABM condition. Moreover, the application of an external lumbar lordosis
brace designed to increase lumbar compression and stiffness resulted in 51% less
displacement and 15% less time to initiate correction of postural sway in chronic LBP
sufferers (Munoz, Salmochi, Faouën, & Rougier, 2010). If one assumes that an external
brace is analogous to an internal ABM, this finding may support the use of the ABM to
diminish postural sway.
These conflicting studies suggest that the effects of VPAC on postural control
have not been clearly defined, and further study is required to clarify what changes occur
during activities with a superimposed VPAC. If VPAC activities result in balance
degradation in individuals with a LBP history who have pre-existing balance deficits or
during athletic activities that require precise movement and postural control, this strategy
may not be beneficial, even if it leads to improved lumbopelvic stability. Conversely,
Texas Tech University Health Sciences Center, Troy L. Hooper, May 2015
73
this strategy may provide other benefits in addition to increased lumbopelvic stability, if a
VPAC enhances postural control.
These potential negative effects of VPAC performance mean that it is important
to study the control changes induced by VPAC strategies during functional activities to
insure that this commonly prescribed maneuver does not deteriorate lower quarter control
parameters. People may naturally choose the optimal trunk activation strategy without
the need to impose additional trunk co-contraction, especially if they do not a have LBP
history (Brown et al., 2006). Moreover, studies of trunk muscle activity in people with
LBP show that many of these individuals display increased co-activation (van Dieën et
al., 2003c), and imposing additional muscle activation may exacerbate the negative
effects described here. Therefore, clear evidence that the beneficial effects of a VPAC
strategy outweigh any potential negative effects is needed before clinicians can, without
reservations, recommend VPAC performance during dynamic functional activities in
healthy and LBP populations.
STAR EXCURSION BALANCE TEST
Many tools have been used to assess balance; however, most of these tests do not
assess dynamic balance or require expensive equipment to administer. The Romberg test
is a traditional balance test (Riemann, Guskiewicz, & Shields, 1999). It has been shown
to be insensitive to small balance deficits, however, so it is unlikely to detect postural
control changes in otherwise healthy adults (Jansen, Larsen, & Olesen, 1982). The
Balance Error Scoring System is a modification of the Romberg test that incorporates an
unstable foam surface and varying stance positions to increase the postural challenge,
Texas Tech University Health Sciences Center, Troy L. Hooper, May 2015
74
which makes this test more sensitive for the detection of balance deficits (Bell,
Guskiewicz, Clark, & Padua, 2011). Instrumented force plates and dedicated
instruments, such as the Neurocom Balance Master, can provide quantified assessments
of static or semi-dynamic postural control by measuring ground reaction forces, but these
devices are expensive and not portable, making them impractical to use in most clinical
settings. Additionally, these tests are performed in a static position and are thus unable to
measure the body’s ability to maintain balance while moving through a functional ROM
(Bressel, Yonker, Kras, & Heath, 2007; Sell, 2012).
The SEBT was introduced by Gary Gray in 1995 (Gray, 1995) as a screening tool
to assess dynamic postural control. The SEBT is simple to setup and administer and can
be performed in a short amount of time. The test is highly reliable and has been shown to
detect postural control deficits following a variety of lower extremity injuries. These
qualities make the SEBT and a simplified version, the Y-Balance Test, attractive
candidates for clinical tests to measure dynamic balance deficits in LBP populations.
The original SEBT was performed using eight strips of tape placed at 45° angles
to each other. The subject stands on one leg at the center of the “star” created by the
intersection of the tape pieces. This stance leg is considered the limb under evaluation
during the test. Each strip of tape is labeled according to the excursion direction relative
to the stance leg: anterolateral (AL), anterior (ANT), anteromedial (AM), medial (Med),
posteromedial (PM), posterior (Post), posterolateral (PL), and lateral (Lat) (Figure 2.1).

Texas Tech University Health Sciences Center, Troy L. Hooper, May 2015
75
Figure 2.1 Star Excursion Balance Test reaching directions. Adapted from (Gribble, Hertel, & Denegar, 2007) The subject is instructed to perform a maximum reach in each of the eight testing
directions with the opposite leg. This way, the person’s balance is challenged in the
sagittal, transverse, and frontal planes along with different combinations of each plane.
At the end of each reach, the individual is required to lightly tap the tape with the toes
without shifting weight onto the toes or coming to rest on the foot of the reaching limb.
The subject then returns to the beginning position at the center of the star and assumes a
resting, bilateral stance. Trials are discarded if: (a) the toe touches the tape too heavily,
(b) the toe stops and rests at the touchdown point, (c) touching the reaching foot to the
ground is required to maintain balance, or (d) the stance foot is lifted or shifts during the
trial (Gribble & Hertel, 2003).
Several issues need to be considered when scoring the SEBT. Taller individuals
are generally able to reach further than those who are shorter; therefore, excursion
distances should be normalized relative to leg length of the stance limb (Gribble &
Hertel, 2003). In order to reduce potential practice effects, subjects must be given ample
practice trials before data are collected. Robinson and Gribble (Robinson & Gribble,
2008b) determined that maximum excursion distances and stance leg angular
Texas Tech University Health Sciences Center, Troy L. Hooper, May 2015
76
displacement values stabilized after four practice trials and recommended that scoring
can safely begin after four practice attempts. Munro and Herrington (2010) later
supported this finding. In addition, different methods have been used to determine the
reach distance scores. A recent review of 19 studies using the SEBT found that four
reported the maximum trial distance and two reported the average of the greatest three
trials. The majority of studies, however, used the average of three trials (Gribble et al.,
2012). A final method is to calculate a composite score based on the sum of the distances
measured on one side (Filipa et al., 2010; Hale, Hertel, & Olmsted-Kramer, 2007; Plisky
et al., 2006; Sarshin, Mohammadi, Shahrabad, & Sedighi, 2011).
A potential limitation of the SEBT is the amount of time required for its
administration. A complete testing session consists of four warm-up trials and three
scored repetitions of all eight testing directions on each foot. The entire process requires
112 repetitions, which is time-consuming and may introduce fatigue effects and decrease
motivation to perform the test. In response to this issue Hertel, Braham, Hale, and
Olmsted-Kramer (2006) performed a factor analysis of the eight components of the SEBT
from subjects with and without chronic ankle instability (CAI) to determine whether the
number of components necessary to detect functional deficits in this population could be
reduced. Their results showed that considerable redundancy exists among the eight
directions in both groups, with each direction being highly correlated with all of the
others. They found that the ANT, Med, and PM reach distances were significantly less
on the injured leg of the CAI subjects compared to the opposite leg and the healthy
controls. Moreover, the PM direction most strongly represented the overall performance
of the SEBT in both groups.

Texas Tech University Health Sciences Center, Troy L. Hooper, May 2015
77
As a result of this study, Hertel (2008) recommended reducing the number of
directions tested to three. A modified version of the SEBT, incorporating the ANT, PM,
and PL directions, has since been used in several research studies (Bouillon & Baker,
2011; Coughlan, Fullam, Delahunt, Gissane, & Caulfield, 2012; Hubbard, Kramer,
Denegar, & Hertel, 2007a; 2007b; Martínez-Ramírez, Lecumberri, Gómez, & Izquierdo,
2010; Overmoyer & Reiser, 2013; Plisky et al., 2006; 2009; Sarshin et al., 2011; Sims,
Cosby, Saliba, Hertel, & Saliba, 2013). A comparison of the three reach distances
between the SEBT and the Y-Balance Test found that although the PM and PL reach
distances did not differ between the two tests, ANT reach distance was around 5% less
with the Y-Balance Test, suggesting that results from one test may not apply to the other
test (Coughlan et al., 2012). Plisky et al. (2009) developed a commercial version of this
reduced test, which they termed the “Y-Balance Test Kit” (Functionalmovement.com,
Danville, VA) (Figure 2.2).
Figure 2.2 The Y-Balance Test Kit. Adapted from performbetter.com
It is designed to improve the test’s reliability by standardizing the reach height
from the ground, creating a starting point reference, and easing measurement procedures.
The device is made of polyvinylchloride plastic and consists of a platform for the stance
leg along with three pieces of pipe, measured in five mm increments, which are inserted
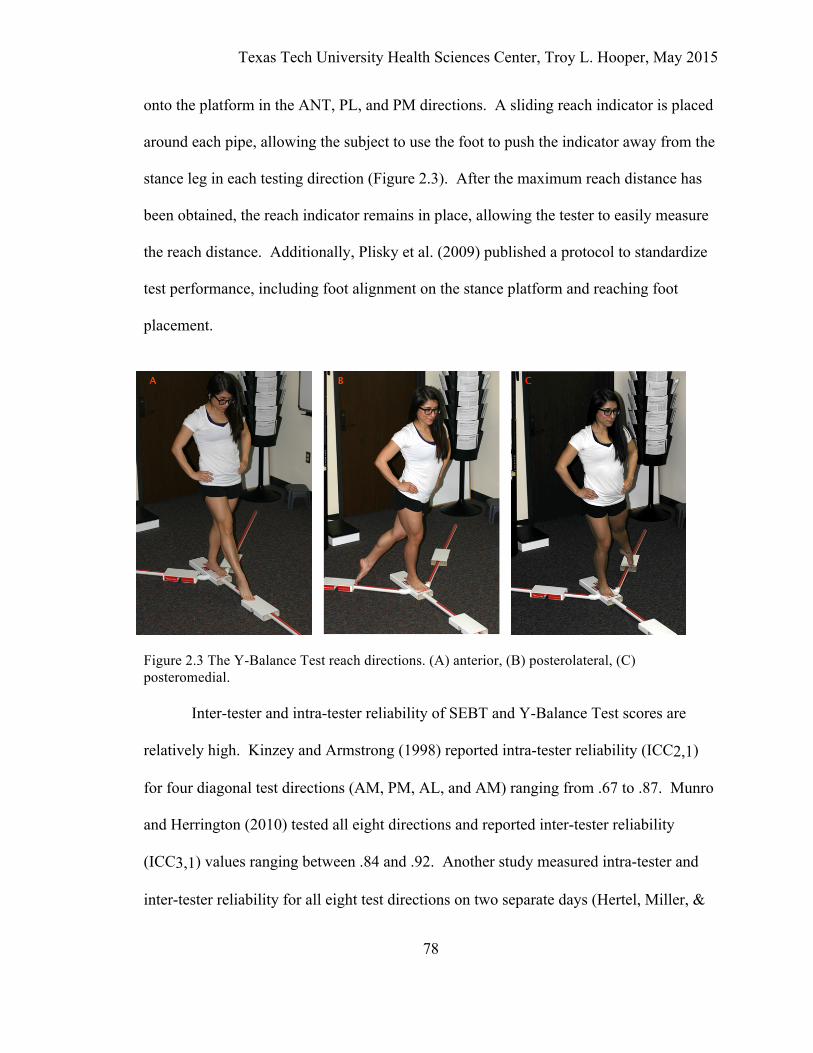
Texas Tech University Health Sciences Center, Troy L. Hooper, May 2015
78
onto the platform in the ANT, PL, and PM directions. A sliding reach indicator is placed
around each pipe, allowing the subject to use the foot to push the indicator away from the
stance leg in each testing direction (Figure 2.3). After the maximum reach distance has
been obtained, the reach indicator remains in place, allowing the tester to easily measure
the reach distance. Additionally, Plisky et al. (2009) published a protocol to standardize
test performance, including foot alignment on the stance platform and reaching foot
placement.
Figure 2.3 The Y-Balance Test reach directions. (A) anterior, (B) posterolateral, (C) posteromedial.
Inter-tester and intra-tester reliability of SEBT and Y-Balance Test scores are
relatively high. Kinzey and Armstrong (1998) reported intra-tester reliability (ICC2,1)
for four diagonal test directions (AM, PM, AL, and AM) ranging from .67 to .87. Munro
and Herrington (2010) tested all eight directions and reported inter-tester reliability
(ICC3,1) values ranging between .84 and .92. Another study measured intra-tester and
inter-tester reliability for all eight test directions on two separate days (Hertel, Miller, &
Texas Tech University Health Sciences Center, Troy L. Hooper, May 2015
79
Denegar, 2000). The intra-tester reliability (ICC2,1) ranged from .78 to .96. Inter-tester
reliability on day one was between .35 and .84 but improved on the second day, ranging
from .81 to .93. The authors attributed the poor reliability on the first day to a learning
effect, and advised that adequate practice sessions are necessary before scoring the test.
Reliability scores for tests using the Y-Balance Test kit are even better, with intra-tester
reliability ranging from .85 to .89 and inter-tester reliability between .97 and 1.00 (Plisky
et al., 2009).
While most studies have used reach distances as their dependent variables, a few
studies have measured EMG variables during the SEBT. Earl and Hertel (2001) recorded
surface EMG amplitudes of lower extremity muscles during the SEBT and found that
muscle activation varied across reaching directions. Vastus medialis (VM) activity was
greatest with ANT excursion, while the VL was least active during the Lat excursion.
Medial hamstring activity was significantly greater with AL excursions compared to
ANT, Med, and AM reaches, while BF was most active in the Lat, Post, and PL
directions. Moreover, isometric hip abduction and extension strength are correlated with
Y-Balance Test scores (Gordon, Ambegaonkar, & Caswell, 2013; Hubbard, Kramer,
Denegar, & Hertel, 2007b). Core strength measures may influence SEBT scores as well.
Female athletes who participated in an 8-week training program incorporating core
strengthening and balance exercises displayed significant improvements in SEBT scores
in the PM and PL directions and composite scores improved bilaterally compared to a
control group who did not exercise (Filipa et al., 2010). Because the intervention group
received both strengthening and balance training, it is not possible to know the relative
contribution of either intervention to the overall SEBT improvements.
Texas Tech University Health Sciences Center, Troy L. Hooper, May 2015
80
Raw reach distances during the SEBT and Y-Balance Test provide relevant
information regarding dynamic postural stability. However, these scores can be
misleading. It is important to observe the quality of the movement pattern in addition to
the quantitative test outcomes (Gribble et al., 2012). For example, a person may use a
strategy that incorporates excessive trunk lateral flexion, hip adduction, femoral internal
rotation, and tibial external rotation, a movement pattern linked to lower extremity
injuries (Hewett et al., 2009; Koga et al., 2010; Powers, 2010). Kinematically, it appears
that knee and hip flexion contribute the most to reach distances (Gribble et al., 2012),
although movement in the frontal and transverse planes is less studied. Knee flexion is
greatest during AM excursion and is less in the posterolateral and lateral directions than
all other directions except the anterolateral direction (Gribble et al., 2007). During ANT
reach excursions, hip and knee flexion angles are reduced in individuals with CAI and
PFPS (Aminaka & Gribble, 2008; Gribble et al., 2007). Hip rotation and abduction
(Robinson & Gribble, 2008a) and ankle dorsiflexion (Gribble & Hertel, 2003) ROM do
not contribute significantly to reach distances.
The SEBT and Y-Balance Test have been used to quantify dynamic postural
control deficits in various musculoskeletal pathologies, including CAI, ACL deficiency,
and PFPS. Chronic ankle instability is the most commonly studied injury (Akbari,
Karimi, Farahini, & Faghihzadeh, 2006; Gribble et al., 2007; Gribble, Hertel, Denegar, &
Buckley, 2004; Hale et al., 2007; Hubbard, Kramer, Denegar, & Hertel, 2007a; Martínez-
Ramírez et al., 2010; Sefton et al., 2009; Shultz, Olmsted, Carcia, & Hertel, 2002), and
these studies have consistently shown that the affected limb of individuals with CAI
demonstrates postural control deficiencies when compared with the unaffected limb and
Texas Tech University Health Sciences Center, Troy L. Hooper, May 2015
81
healthy control subjects. A recent systematic review of the SEBT, however, determined
that the average effect size of these studies was low (Cohen d = 0.35) (Gribble et al.,
2012). The authors stated that one reason for the low effect size was poor selection
criteria for CAI in many of the studies. One study (Herrington, Hatcher, Hatcher, &
McNicholas, 2009) examined SEBT scores in people with ACL-deficient knees and
found that scores on the involved limb were lower than both the contralateral limb and
healthy control subjects, indicating this injury affects postural control bilaterally. Finally,
Aminaka and Gribble (Aminaka & Gribble, 2008) studied the ANT reach direction in
subject with and without PFPS and found that reach distance was reduced in the PFPS
group. Overall, the results of these studies show that the SEBT is useful for detecting
postural control deficits in individual with lower extremity injuries. Static postural
control changes are well documented in individuals with LBP and a LBP history;
however, dynamic postural changes in these populations are less studied, and no studies
could be found that use the SEBT or Y-Balance Test to measure dynamic balance
changes in either group. These tools need to be studied in this population to determine
whether they are valid measures of dynamic postural control.
In conclusion, LBP is a common problem that results is diminished balance and
lumbopelvic stability. These changes may have consequences for the entire lower quarter
and potentially increase lower extremity injury risk. In addition to their role in improving
lumbopelvic stability, VPAC maneuvers may potentially influence these control
variables. A simple test capable of detecting balance deficits in this population would be
helpful to clinicians. Therefore, the ability of the Y-Balance Test to detect balance
deficits in people with cLBP and a hxLBP was investigated. In addition, this test was

Texas Tech University Health Sciences Center, Troy L. Hooper, May 2015
82
used to investigate the influence of LBP status and a VPAC maneuver on lower extremity
muscle activity and kinematics.
Texas Tech University Health Sciences Center, Troy L. Hooper, May 2015
83
CHAPTER III
METHODS Low back pain (LBP) results in disturbed balance (Cavanaugh et al., 2005).
Simple dynamic balance tests are needed to detect these deficits in a clinical setting. In
addition, lower extremity biomechanical variables may be altered in this population,
potentially increasing lower extremity injury risk (Durall et al., 2011; Plisky et al., 2006).
Volitional Preemptive Abdominal Contractions (VPACs), such as the abdominal bracing
maneuver (ABM), may improve these control variables. The purpose of this project was
to determine the effect of both current LBP and a LBP history with no present symptoms
on lower extremity neuromuscular and kinematic variables and performance scores
produced during completion of the Y-Balance Test. An additional purpose was to
determine whether incorporating a VPAC changes these lower extremity control
variables. This chapter describes in detail the methodology used for the three studies that
compromise this dissertation. Methods common to both studies are described together,
while unique aspects to each study are described separately.
OPERATIONAL DEFINITIONS
1) Core — lumbar vertebrae, the pelvis, the hip joints, and the active and passive
structures that either produce or restrict movement of these segments (Willson,
Dougherty, Dougherty, Ireland, & Davis, 2005).
2) Core Stability — ability to control the position and motion of the trunk over the
pelvis and leg to allow optimum production, transfer and control of force and
Texas Tech University Health Sciences Center, Troy L. Hooper, May 2015
84
motion to the terminal segment in integrated kinetic chain activities (Kibler et al.,
2006).
3) Dominant Leg — preferred leg used when kicking a soccer ball.
4) Leg Length — the distance from the stance-side anterior superior iliac spine to the
medial malleolus (Gribble & Hertel, 2003).
5) Low Back Pain — pain that occurs between T12 (or the 12th rib) and the gluteal
folds (Macdonald et al., 2011).
6) Lower Quarter — includes the lumbopelvic region as well as the lower
extremities.
7) Recurrent Low Back Pain — return of LBP that lasts at least 24 hr with a pain
intensity greater than 2 cm on a 10 cm visual analog scale following a period of at
least 30 days pain-free.
8) Regional Interdependence — concept that a patient’s primary musculoskeletal
symptom(s) may be directly or indirectly related or influenced by impairments
from various body regions and systems regardless of proximity to the primary
symptom(s) (Sueki et al., 2013, p. 91).
9) Spinal Instability — a decrease in the ability of the stabilizing systems to maintain
this neutral zone within physiological limits, resulting in an excessive range of
segmental motion uncontrolled by the muscular and ligamentous systems
(Panjabi, 1992b).
10) Star Excursion Balance Test — a functional, unilateral balance test that integrates
a single-leg stance of one leg with maximum reach of the opposite leg in eight
different directions.
Texas Tech University Health Sciences Center, Troy L. Hooper, May 2015
85
11) Y-Balance Test — modification of the Star Excursion Balance Test in which only
the anterior, posteromedial, and posterolateral directions are tested.
ASSUMPTIONS
1) Subjects in the cLBP and hxLBP groups gave an accurate self-report regarding
their LBP history and all subjects accurately reported their activity history.
2) The activity level of the three groups was similar and differences in the dependent
variables were solely a result of group membership.
3) The influence of practice effects on Y-Balance Test scores were eliminated by the
performance of four practice trials prior to testing.
4) Subjects fully understood the directions for the Y-Balance Test and performed the
test with maximum effort.
5) The Y-Balance Test was a reliable and valid tool for measuring dynamic postural
control.
6) The motion capture instruments used in the study were reliable and valid.
7) The motion capture instruments were accurately calibrated for each subject.
DESIGN
This dissertation consisted of three parts. All three parts incorporated the Y-
Balance Test, which is a series of lunging maneuvers performed in the anterior (ANT),
posterolateral (PL), and posteromedial (PM) directions. The Y-Balance Test was chosen
because it is a simple, clinical test purported to measure dynamic balance. Additionally,
the lunging patterns used in the test simulate movements associated with acute and
overuse lower extremity injuries. Therefore, neuromuscular and mechanical patterns
Texas Tech University Health Sciences Center, Troy L. Hooper, May 2015
86
observed during the test may provide information regarding differences in lower
extremity movement in the populations studied and the potential role of a VPAC in
changing these parameters. Study-1 involved two parts. First, a one factor between-
subjects design examined differences in Y-Balance Test scores among three groups: (a)
active recurrent LBP patients (cLBP), (b) people with a LBP history who are currently
pain-free (hxLBP), and (c) people with no history of LBP (control). The dependent
variables were the mean distance reached in the three Y-Balance Test reach directions:
(a) ANT, (b) PM, and (c) PL. Second, an exploratory analysis using correlation
determined whether there is a relationship between current pain level and/or disability
level and scores on the Y-Balance Test. Study-2 used a one factor between groups design
(control versus cLBP versus hxLBP) to examine the effects of LBP status on trunk,
pelvic, and lower extremity control variables. Study-3 employed a two factor mixed
model design to determine the effect of a preemptive ABM on these same variables in
these three groups.
SUBJECTS
Because no study has examined Y-Balance Test scores in LBP sufferers, previous
studies that established effect sizes for the differences in SEBT and Y-Balance Test
scores in subjects with knee pathologies (Aminaka & Gribble, 2008; Gribble et al., 2012;
Herrington et al., 2009) were used to establish the effect size for the present Study-1.
Large effect sizes (Cohen d = 1.30 − 2.33) were found in these studies. These scores
were converted to f scores using the formula:
f = d 2
2k
Texas Tech University Health Sciences Center, Troy L. Hooper, May 2015
87
where k = number of groups (2). The resulting f scores ranged from 0.65 to 1.17. For
Study-2, an effect size index of f = 0.50 was estimated using data from a previous study
(Hooper et al., 2012) to detect a change in the dependent variables. Since the same
subjects participated in both studies, the smaller effect size (i.e., Study-2) was used to
calculate the required sample size. With a desired power of 80% (1 - β = 0.80) and
desired α = 0.05, this effect size index requires a minimum sample size of 14 subjects per
group (Portney & Watkins, 2009). To account for attrition, a convenience sample of 18
subjects was chosen for each of the three groups in the study, thus leading to a total
sample size of 54 subjects. Subjects in all three groups were recruited from local
rehabilitation clinics and the general public.
Subjects included males and females between the ages of 18 and 50 years old.
The hxLBP group included subjects with a history of one or more episodes of recurrent
LBP over the previous 2 years. Recurrent LBP was defined as pain that is intermittent
with unilateral or bilateral symptoms between T12 and the mid-thigh. Subjects had
experienced one or more of the following: (a) a severity sufficient to require medical or
allied health intervention; and/or (b) a severity sufficient to impair the subject’s ability to
perform their normal activities of daily living. At the time of testing, subjects were in a
period of remission from their LBP symptoms (Macdonald, Moseley, & Hodges, 2010).
Criteria for inclusion in the cLBP were the same, except subjects presently reported a
pain of ≥ 2/10 cm on a 10 cm VAS. These subjects did not present with radicular leg
pain or neurological signs. Subjects in this group were recruited from local physical
therapy clinics and the general population. The control group was free of LBP in the
previous two years. Exclusion criteria for all groups included: (a) history of hip, knee, or
Texas Tech University Health Sciences Center, Troy L. Hooper, May 2015
88
ankle pain in the previous two years; (b) history of surgery to the hip, knee, ankle/foot or
lumbar spine; (c) pregnancy by self-report; (d) body mass index greater than 30; (e)
rheumatologic or neurological disorders; (f) vestibular or other balance disorders, (g)
present treatment for inner ear, sinus, or upper respiratory infection, or head cold, (h)
cerebral concussion within the previous three months, and (i) history of ABM training
within the past year.
QUESTIONNAIRES
All participants completed a medical history questionnaire to determine study
eligibility (Appendix A) and the Baecke Physical Activity Questionnaire (BPAQ)
(Baecke, Burema, & Frijters, 1982) (Appendix B), which is a self-administered
questionnaire that measures daily activity levels and has been found to be reliable in LBP
patients (Jacob, Baras, Zeev, & Epstein, 2001) and healthy individuals (Philippaerts,
Westerterp, & Lefevre, 1999). It contains 19 items divided into three indices of habitual
physical activity: work, sport, and leisure time. Each of the three indices is scored
individually, with scores ranging from 1 to 5. A total score (BPAQ total) is obtained by
summing these three scores. Subjects in the cLBP and hxLBP groups additionally
completed the Roland Morris Disability Questionnaire (RMDQ) (Appendix C) and the
Fear Avoidance Beliefs Questionnaire (FABQ) (Appendix D) and recorded their current
pain level on a 10 cm VAS (Carlsson, 1983). The RMDQ is a 24-item questionnaire used
to measure physical disability caused by LBP (Roland & Fairbank, 2000). It is most
sensitive for LBP subjects with mild to moderate disability (Roland & Fairbank, 2000).
The FABQ is a 16-item questionnaire that measures perceived fear of physical activity
Texas Tech University Health Sciences Center, Troy L. Hooper, May 2015
89
and is divided into two parts: fear avoidance beliefs about activity and fear avoidance
beliefs about work (Waddell, Newton, Henderson, Somerville, & Main, 1993). Total
scores on the RMDQ and FABQ are obtained by summing the item responses.
PROCEDURES
Study-1 Data Collection Procedures
Study-1 Preparatory Procedures
Subjects reported to the Texas Tech University Human Performance Laboratory.
Each subject read and signed the informed consent form approved by the TTUHSC
Institutional Review Board and completed a medical history questionnaire to determine
their eligibility for the study. They then watched a video presentation explaining the
purpose of the study and testing procedures. Following the video, all participants
completed the BPAQ. Subjects in the rLBP and hxLBP groups additionally completed
the RMDQ and FABQ and recorded their current and average pain level over the last
week on a 10 cm VAS. The stance limb was determined by finding the subject’s
dominant leg, defined at the limb used to kick a ball. Finally, the length of the subject’s
dominant leg was measured with the subject positioned in supine with a tape measure.
The leg length was defined as the distance from the ASIS to the medial malleolus
(Gribble & Hertel, 2003).
Study-1 Testing Procedures
Following completion of the preparatory procedures, subjects performed the Y-
Balance Test using the Y-Balance Test Kit. The testing protocol followed
recommendations made by Plisky et al. (2009) and Gribble et al. (2012). Subjects

Texas Tech University Health Sciences Center, Troy L. Hooper, May 2015
90
performed the test without shoes to control for the potential influence of varying footwear
(Gribble et al., 2012). Three directions were tested: ANT, PM, and PL. Performance of
the Y-Balance Test using the Y-Balance Test Kit is highly reliable, with intra-tester
reliability ranging from .85 to .89 and inter-tester reliability between .97 and 1.00 (Plisky
et al., 2009). In order to diminish a learning effect, four practice trials in each reach
direction were performed prior to the recorded trials (Robinson & Gribble, 2008b).
Following the practice trials, the subject performed three successful repetitions of each
testing direction. Although Plisky et al. (2009) and Gribble et al. (Gribble et al., 2012)
recommend standardizing the testing order, testing directions were randomized to prevent
an order effect. A minimum of 30 s was allowed between trials to reduce fatigue effects.
The subject stood on the dominant leg on the center footplate, placing the edge of
the toes at the marked starting line. The hands were positioned on the hips. The other leg
pushed the reach indicator as far as possible along the pipe in the direction being tested
and then returned to the starting position. In order to allow the subject to choose his or
her preferred movement strategy, no other instructions were given. An examiner
observed the subject’s movement and determined whether the trial was a success or a
failure. A trial was considered unsuccessful for the following reasons: (a) subject failed
to maintain unilateral stance on the platform by touching the reaching foot to the ground
or falling off the stance platform, (b) subject failed to keep reaching foot in contact with
the reach indicator throughout the reaching movement, (c) subject placed the reaching
foot on top of the reach indicator to improve stance support, or (d) subject failed to return
the reaching foot to the starting position in a controlled manner. Following each
successful trial, the examiner recorded the reach distance in mm. Failed trials were
Texas Tech University Health Sciences Center, Troy L. Hooper, May 2015
91
discarded, and the test was repeated. The three successful trials for each direction were
averaged for analysis.
Study-2 and Study-3 Data Collection
Study-2 and Study-3 Preparatory Procedures
Study-2 consisted of a second round of Y-balance test assessments and began
following a 10-minute rest after the completion of Study-1. All subjects watched a
second video describing Study-2’s collection procedures and explaining ABM
performance. Following the video, the investigator provided ABM training. For ABM
instruction, subjects were taught to place their first webspace of each hand over the
respective iliac crest. Once placed, the subject was asked to ‘pretend you are about to be
punched in the stomach’ while continuing with diaphragmatic respiration (McGill, 2007;
Vera-Garcia et al., 2007). When subjects were able to perform a proper ABM
contraction, they were fitted with electrodes for EMG analysis and ABM contraction was
confirmed visually by observing a qualitative increase in trunk muscle activity on the
EMG recording.
Surface electromyography data were sampled at 2000 Hz using wireless (Delsys
Trigno, Boston, MA) sensors. Rectangular electrodes (27 mm x 37 mm x 15 mm) with
four 5 mm by 1 mm silver contacts were used. The overall channel noise was less than
0.75 µV with a common-mode rejection ratio greater than 80 dB and a 3 µV peak-to-peak
baseline noise. The skin was cleaned with alcohol, shaved if necessary, and then lightly
abraded to reduce impedance. Following skin preparation, surface EMG electrodes were
attached to the trunk to assess muscle activity of the stance- and moving-side external
oblique (SEO and MEO), stance- and moving-side internal oblique (SIO and MIO), and
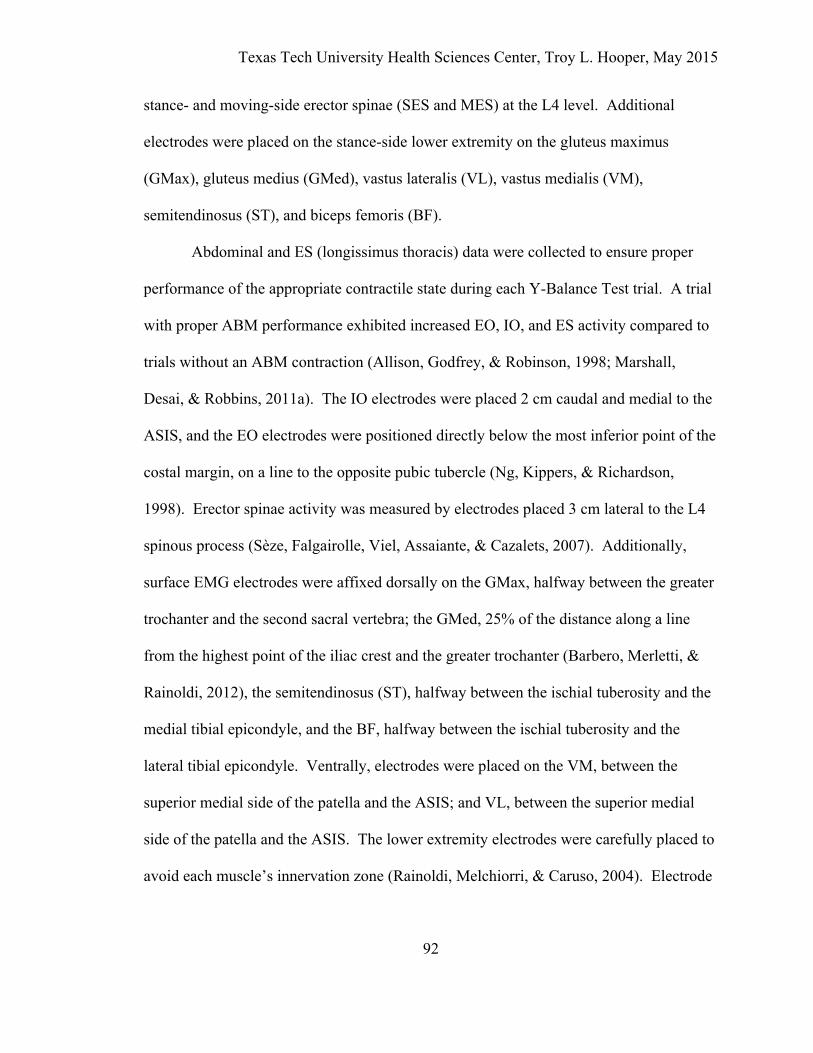
Texas Tech University Health Sciences Center, Troy L. Hooper, May 2015
92
stance- and moving-side erector spinae (SES and MES) at the L4 level. Additional
electrodes were placed on the stance-side lower extremity on the gluteus maximus
(GMax), gluteus medius (GMed), vastus lateralis (VL), vastus medialis (VM),
semitendinosus (ST), and biceps femoris (BF).
Abdominal and ES (longissimus thoracis) data were collected to ensure proper
performance of the appropriate contractile state during each Y-Balance Test trial. A trial
with proper ABM performance exhibited increased EO, IO, and ES activity compared to
trials without an ABM contraction (Allison, Godfrey, & Robinson, 1998; Marshall,
Desai, & Robbins, 2011a). The IO electrodes were placed 2 cm caudal and medial to the
ASIS, and the EO electrodes were positioned directly below the most inferior point of the
costal margin, on a line to the opposite pubic tubercle (Ng, Kippers, & Richardson,
1998). Erector spinae activity was measured by electrodes placed 3 cm lateral to the L4
spinous process (Sèze, Falgairolle, Viel, Assaiante, & Cazalets, 2007). Additionally,
surface EMG electrodes were affixed dorsally on the GMax, halfway between the greater
trochanter and the second sacral vertebra; the GMed, 25% of the distance along a line
from the highest point of the iliac crest and the greater trochanter (Barbero, Merletti, &
Rainoldi, 2012), the semitendinosus (ST), halfway between the ischial tuberosity and the
medial tibial epicondyle, and the BF, halfway between the ischial tuberosity and the
lateral tibial epicondyle. Ventrally, electrodes were placed on the VM, between the
superior medial side of the patella and the ASIS; and VL, between the superior medial
side of the patella and the ASIS. The lower extremity electrodes were carefully placed to
avoid each muscle’s innervation zone (Rainoldi, Melchiorri, & Caruso, 2004). Electrode
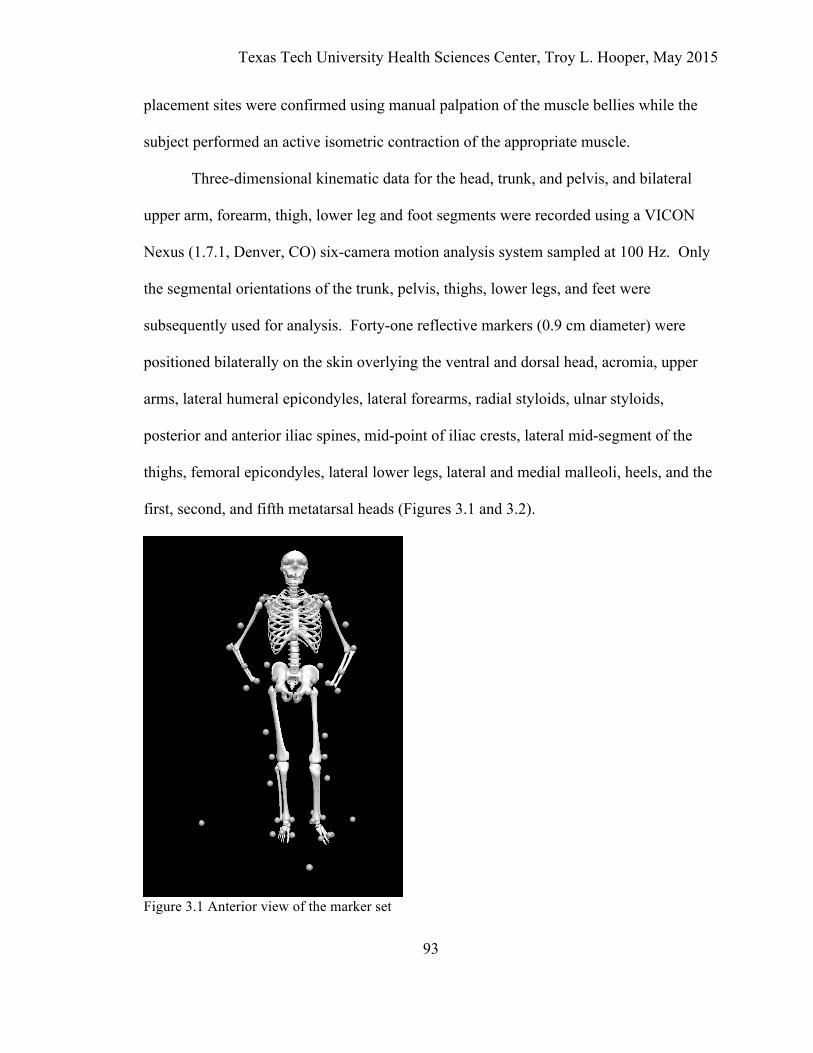
Texas Tech University Health Sciences Center, Troy L. Hooper, May 2015
93
placement sites were confirmed using manual palpation of the muscle bellies while the
subject performed an active isometric contraction of the appropriate muscle.
Three-dimensional kinematic data for the head, trunk, and pelvis, and bilateral
upper arm, forearm, thigh, lower leg and foot segments were recorded using a VICON
Nexus (1.7.1, Denver, CO) six-camera motion analysis system sampled at 100 Hz. Only
the segmental orientations of the trunk, pelvis, thighs, lower legs, and feet were
subsequently used for analysis. Forty-one reflective markers (0.9 cm diameter) were
positioned bilaterally on the skin overlying the ventral and dorsal head, acromia, upper
arms, lateral humeral epicondyles, lateral forearms, radial styloids, ulnar styloids,
posterior and anterior iliac spines, mid-point of iliac crests, lateral mid-segment of the
thighs, femoral epicondyles, lateral lower legs, lateral and medial malleoli, heels, and the
first, second, and fifth metatarsal heads (Figures 3.1 and 3.2).
Figure 3.1 Anterior view of the marker set
Texas Tech University Health Sciences Center, Troy L. Hooper, May 2015
94
Figure 3.2 Posterior view of the marker set Four single markers were placed over the C7 and T10 spinous processes posteriorly and
the jugular notch and xiphoid process anteriorly. Additional calibration markers were
placed bilaterally over the humeral and femoral medial epicondyles and were removed
following a static trial. Finally, one marker was placed on each of the three Y-balance
Test Kit reach indicators, so platform movement could be analyzed.
Study-2 Testing Procedures
Submaximal Reference Contractions
Surface EMG is a useful instrument for measuring muscle activity; however,
comparison of raw signal amplitudes between different muscles or from one individual to
another is not practical due to variations in electrode position, inter-individual
differences, and intrinsic physiological differences (De Luca, 1997). As a result, a
standard reference value is needed to normalize signal amplitudes and allow signal
comparison among different muscles and between subjects (De Luca, 1997; Lehman &
McGill, 1999). A common reference value is the maximum voluntary contraction
Texas Tech University Health Sciences Center, Troy L. Hooper, May 2015
95
(MVC) (Burden, 2010; De Luca, 1997; Fernandez-Pena, Lucertini, & Ditroilo, 2009), but
studies have shown that individuals with LBP are not able to produce a true maximal
effort due to pain or the fear of pain (Larivière, Arsenault, Gravel, Gagnon, & Loisel,
2003; Thomas, France, Sha, & Wiele, 2008b). As a result, submaximal normalization
contractions (sub-MVC) designed to minimize elevated pain responses have been
developed (Dankaerts, O'Sullivan, Burnett, Straker, & Danneels, 2004; O'Sullivan et al.,
2002). These procedures are better tolerated by subjects with LBP and are more reliable
than using a MVC (Dankaerts et al., 2004; Yang & Winter, 1984). Additionally, inter-
subject variation is greater during MVC tests compared to sub-MVC procedures (Yang &
Winter, 1984). It is not known whether lower extremity muscle MVC values are
similarly affected by LBP, but attempting these forceful contractions may increase pain
levels and result in unreliable measurements. Therefore, this study normalized EMG
values to a sub-MVC.
The trunk muscle sub-MVC normalization followed procedures developed by
Dankaerts, O’Sullivan, Burnett, Straker, and Danneels (2004) and replicated in several
studies utilizing trunk EMG in LBP subjects (Larivière, Butler, Sullivan, & Fung, 2013;
Larivière, Forget, Vadeboncoeur, Bilodeau, & Mecheri, 2010; Park et al., 2011; Sheeran,
Sparkes, Caterson, Busse-Morris, & van Deursen, 2012; Tateuchi et al., 2013). For the
trunk flexors (i.e., IO and EO), subjects were positioned on a plinth in a crook lying
position with the hips flexed to 45° and the knees flexed to 90°. They were then asked to
raise both legs 1 cm off the plinth for 5 s. The ES and GMax normalization trials were
performed with subjects in prone with a pillow placed under the hips as needed to reduce
lumbar spine hyperextension in response to inadequate hip extension. Subjects were

Texas Tech University Health Sciences Center, Troy L. Hooper, May 2015
96
asked to lift both knees 5 cm off the plinth, or as high as their available hip range allows,
for 5 s. Three trials of both procedures were performed, each separated by a 30 s rest
period.
A sub-MVC procedure used by Fong, Hong, and Li (2008) was used to normalize
activity of the VM, VL, BF, and ST. Vastus medialis and VL normalization trials
consisted of a bilateral semi-squat. Subjects began in an erect, standing position and
performed a bilateral squat to 90° of knee flexion. Rectangular blocks were placed at the
popliteal fossae and provided a tactile cue that the 90° angle was reached. Hamstring
normalization trials were performed in standing. Subjects bent the knee backwards to
90° of knee flexion. A rectangular block was again positioned behind the knee to provide
feedback that the proper knee flexion angle was reached. The same procedure was then
repeated on the opposite leg. Each test position was held for 5 s and was repeated three
times.
Y-Balance Testing
Following the normalization trials, a static trial was recorded with subjects
positioned in a static T pose to create a reference for defining neutral joint angles. All
joint angles were expressed relative to this posture. Subjects then performed the Y-
Balance Test. Procedures for the testing were similar to Study-1. The stance limb was
the dominant leg. Subjects again performed four practice trials in each direction prior to
the recorded trials to reduce leaning effects. Testing order was randomized, and subjects
performed three successful trials in each testing direction without ABM (No-ABM) and
three trials with the ABM strategy. A total of 18 trials were completed. Y-balance test
scores as well as EMG and kinematic data were collected for each trial. Proper ABM
Texas Tech University Health Sciences Center, Troy L. Hooper, May 2015
97
activation was qualitatively confirmed using EMG after the completion of the each trial,
and a minimum of 30 s was allowed between trials to reduce fatigue effects.
Data Reduction
The anatomical markers were used for construction of a 6-degrees-of-freedom
kinematic model using Visual 3D (C-Motion Inc, Rockville, MD). Raw coordinates were
smoothed using a fourth order no-phase-shift Butterworth low-pass digital filter with the
cutoff set to 6 Hz. The pelvis was defined with respect to the global coordinate system
with a CODA pelvis orientation to define the location of the hip joint center (Bell, Brand,
& Pedersen, 1989). This model calculates the origin of the pelvis segment coordinate
system as the mid-point between the ASIS markers. The knee and ankle joint centers
were calculated as the midpoint of the medial and lateral joint markers. A Cardan angle
sequence (x-y-z, which represents flexion-extension, abduction-adduction, and internal-
external rotation) was used to calculate joint angles, referencing the distal segment to the
proximal segment. The following angles were described as positive values: trunk flexion,
side bend toward stance leg, and rotation toward stance leg; pelvis posterior tilt, lateral
tilt toward stance leg, and rotation toward stance leg; hip flexion, adduction, and internal
rotation; knee extension, adduction, and internal rotation; ankle dorsiflexion, internal
rotation, and inversion. A trial was defined as the time from initial movement of the
reflective marker placed on the reach indicator to the time the reflective marker stopped,
which represented the maximum reach of the moving limb. The kinematic variables of
interest included 3-dimensional angles of the trunk and pelvis and the stance-leg hip,
knee, and ankle at the end of each trial.

Texas Tech University Health Sciences Center, Troy L. Hooper, May 2015
98
All raw EMG data were imported into a custom Matlab program (Mathworks Inc.,
v7.10.0, Natick, MA). The EMG data were band-pass filtered between 20 Hz and 400 Hz
with a fourth-order, no-pass, zero-phase-lag Butterworth filter. The root mean square
(RMS) amplitudes of the filtered EMG data for each muscle were analyzed to determine
the average muscle activity from the beginning of the trial to the point of maximum
reach.
Dependent Variables for Study-1
The first study included three dependent variables, the maximized reach distance
(%MAXD) for the ANT, PM, and PL directions. These variables represent the reach
distance as a percentage of leg length and were determined using the following formula:
%MAXD = reach distanceleg length
*100
Statistical Analysis for Study-1
Descriptive statistics (mean ± SD) were calculated for age, weight, height, BMI,
and BPAQ for all subjects and current pain VAS and questionnaire scores in the cLBP
and hxLBP groups. Independent samples one-way analyses of variance (ANOVAs) were
used to determine any differences in demographic characteristics among the three groups.
Data were tested for normality (Shapiro-Wilk test p-value > .05, and skewness and
kurtosis between -2.0 and +2.0) and homogeneity of variance (Levene’s Test). Three
independent samples one-way ANOVAs were performed to investigate significant
differences among the control, cLBP, and hxLBP groups. Tukey’s post-hoc tests were
used to identify the location of significant differences within each analysis. To estimate
Texas Tech University Health Sciences Center, Troy L. Hooper, May 2015
99
effect sizes, partial eta squared (ƞp2) was computed with ƞp2 ≥ 0.01 indicating small, ƞp2
≥ 0.06 medium, and ƞp2 ≥ 0.14 large effects (Portney & Watkins, 2009). The level of
statistical significance was set at α ≤ .05.
Additionally, bivariate Pearson product moment correlations were calculated to
determine if a relationship exists between reach distance in each direction and age, BMI,
and BPAQ scores in each of the three groups; RMDQ, and FABQ scores in the two LBP
groups; and current pain VAS in the cLBP group. The level of significance was set at α
≤ .05. All statistical analyses were performed using SPSS Statistics, Version 22.0 (IBM,
Inc, Chicago, IL).
Dependent Variables for Study-2 and Study-3
Study-2 contained 28 DVs for each reach direction: (1) Y-balance test reach
distance (1 DV); (2) 3-dimensional joint angles at the maximum reach distance for the
trunk and pelvis and the stance limb hip, knee, and ankle (15 DVs); and (3) RMS EMG
amplitudes of the trunk muscles (SEO, MEO, SIO, MIO, SES, MES) and lower extremity
muscles (GMax, GMed, VL, VM, BF, ST) during the lowering phase of the Y-Balance
Test, defined as the time from initial movement of the reflective marker placed on the
reach indicator to the time reflective marker stopped (12 DVs).
Statistical Analysis for Study-2
The average peak sub-MVCs generated from each of the EMG normalization tests
were used to normalize the EMG amplitudes for each muscle. Data were tested for
normality (Shapiro-Wilk test p-value > .05, and skewness and kurtosis between -2.0 and
+2.0) and homogeneity of variance (Levene’s Test). Separate one-factor between-groups
Texas Tech University Health Sciences Center, Troy L. Hooper, May 2015
100
(control, cLBP, and hxLBP) ANOVAs were used to determine differences between
groups for each kinematic dependent variable and reach distance. Preplanned contrasts
were used to identify the location of significant differences between control versus cLBP
and control versus hxLBP groups within each analysis. To estimate effect sizes, partial
eta squared (ƞp2) was computed with ƞp2 ≥ 0.01 indicating small, ƞp2 ≥ 0.06 medium, and
ƞp2 ≥ 0.14 large effects (Portney & Watkins, 2009). Alpha levels were set a priori at .05
for all analyses. No attempt to correct for multiple comparisons was made in order to
reduce the likelihood of a Type II error in this exploratory analysis (Perneger, 1998).
Statistical analyses were performed using SPSS Statistics, Version 22.0 (IBM, Inc,
Chicago, IL).
Statistical Analysis for Study-3
The average peak sub-MVCs generated from each of the EMG normalization tests
were used to normalize the EMG amplitudes for each muscle. Data were tested for
normality (Shapiro-Wilk test p-value > .05, and skewness and kurtosis between -2.0 and
+2.0) and homogeneity of variance (Levene’s Test). Separate 3 x 2 mixed repeated
measures ANOVAs were used to determine differences between groups and contractile
state for each dependent variable. The between-subjects factor was group (control,
cLBP, and hxLBP). The within-subjects factor was contractile state (ABM and No
ABM). In cases of a significant interaction, simple effects analyses were tested with
Bonferroni-corrected t-tests to identify specific differences. To estimate effect sizes,
partial eta squared (ƞp2) was computed with ƞp
2 ≥ 0.01 indicating small, ƞp2 ≥ 0.06
medium, and ƞp2 ≥ 0.14 large effects (Portney & Watkins, 2009). Alpha levels were set a
Texas Tech University Health Sciences Center, Troy L. Hooper, May 2015
101
priori at .05 for all analyses. No attempt to correct for multiple comparisons was made in
order to reduce the likelihood of a Type II error in this exploratory analysis (Perneger,
1998). Statistical analyses were performed using SPSS Statistics, Version 22.0 (IBM,
Inc, Chicago, IL).
Texas Tech University Health Sciences Center, Troy L. Hooper, May 2015
102
CHAPTER IV
DYNAMIC BALANCE AS MEASURED BY THE Y-BALANCE TEST IS REDUCED IN PERSONS WITH BOTH CURRENT LOW BACK PAIN AND LOW BACK PAIN
HISTORY
ABSTRACT
Objective: The purpose of this study was to determine the effect of current LBP (cLBP)
and a LBP history with no present symptoms (hxLBP) on Y-Balance Test reach
distances. An additional purpose was to determine whether age, body mass index (BMI),
activity level, current pain, disability, and fear avoidance beliefs are associated with Y-
Balance Test reach distances.
Design: Cross-sectional study
Setting: University research laboratory
Participants: Fourteen subjects (8 males and 6 females) between the ages of 18 and 50
years (30.93 ± 8.24 yr) were recruited for each of three groups: cLBP, hxLBP, and a
healthy control group. Interventions: Subjects completed three Y-Balance trials in the
anterior (ANT), posterolateral (PL), and posteromedial (PM) directions while standing on
their dominant (i.e., kicking) leg. Main Outcome Measures: One-way between subjects
analyses of variance were used to determine differences in reach distance (relative to the
subject’s leg length) among the three groups. Bivariate Pearson product moment
correlations were calculated to assess relationships between reach distance in each
direction and age, BMI, activity level, pain, disability, fear-avoidance beliefs.
Results: Reach distances for the control group were significantly longer than the cLBP
and hxLBP groups in the PL (control = 105.76 ± 6.62 cm; cLBP = 94.73 ± 10.56 cm;

Texas Tech University Health Sciences Center, Troy L. Hooper, May 2015
103
hxLBP = 94.16 ± 9.19 cm; p = .002) and PM (control = 109.29 ± 6.65 cm; cLBP =
100.70 ± 8.36 cm; hxLBP = 102.26 cm ± 7.63; p = .011) directions, but no differences
were found for the ANT direction (control = 66.44 ± 7.00 cm; cLBP = 66.15 ± 6.23 cm;
hxLBP = 66.40 ± 3.10cm; p = .990). In addition, a significant negative correlation was
found in the cLBP group between BMI and PM reach distance (r = -.579, p = .030).
Conclusion: These results show that the cLBP and hxLBP Y-Balance performance is
different compared to control subjects. Y-Balance Test scores may be related to BMI,
but further studies are needed to confirm this finding.
Texas Tech University Health Sciences Center, Troy L. Hooper, May 2015
104
INTRODUCTION
Low back pain (LBP) is an almost universal experience, with 75-90% of the
population being affected at some point in their lives (Andersson, 1999). While some
individuals only experience a single episode of LBP, this injury is often recurrent.
Recurrent LBP is defined as a return of LBP that lasts at least 24 hr with a pain intensity
greater than 2 cm on a 10 cm visual analog scale (VAS) following a period of at least 30
days pain-free (Stanton, Latimer, Maher, & Hancock, 2011). Once a person has
recovered from a LBP episode, he or she has a greater risk of future LBP episodes.
Approximately 50% of people have a recurrence by one year, 60% by two years and 70%
by five years following the initial incident (Hestbaek, Leboeuf-Yde, & Manniche, 2003).
Postural control is the ability to maintain or return the body to a state of
equilibrium or balance (Cavanaugh, Guskiewicz, & Stergiou, 2005). Balance may be
classified into three groups: (a) static, (b) semi-dynamic, and (c) dynamic (Guskiewicz,
2011). Static balance involves maintenance of the center of gravity (COG) over a fixed
base of support (BOS) while standing on a stable surface. Semi-dynamic balance occurs
when a person maintains their COG over a fixed BOS while standing on either a moving
or unstable surface, and dynamic balance is maintenance of the COG over a moving
BOS. In healthy adults, postural control is maintained via the acquisition of inputs from
the somatosensory (Bove, Nardone, & Schieppati, 2009; Tresch, 2007), visual (Mergner,
Schweigart, Maurer, & Blümle, 2005), and vestibular systems (Bacsi & Colebatch,
2004). This afferent information is relayed to the central nervous system, which
processes it and coordinates an appropriate motor response.

Texas Tech University Health Sciences Center, Troy L. Hooper, May 2015
105
In addition to an increased risk of further LBP, people who experience LBP
episodes develop postural control deficits. Compared with healthy controls, people with
LBP demonstrate increased postural sway (Ruhe, Fejer, & Walker, 2011) and greater
difficulty adapting to changing conditions (Mientjes & Frank, 1999). Moreover, once
they lose their balance, these individuals have more difficulty recovering it (Brumagne,
Cordo, & Verschueren, 2004). These deficits can remain even after a person’s LBP has
resolved (Bouche, Stevens, Cambier, Caemaert, & Danneels, 2005; van Dieën, Koppes,
& Twisk, 2010), which may contribute to these individual’s increased risk of further low
back injuries.
A person may choose reactive and/or predictive strategies to maintain postural
control (Pollock, Durward, Rowe, & Paul, 2000). Reactive postural strategies involve
movement or muscular actions that occur in reaction to an unpredicted disturbance, while
predictive strategies occur before the postural challenge and involve preparatory muscle
activations and movements that anticipate the challenge. Both of these strategies may be
impaired in people with LBP. For example, somatosensory deficits such as decreased
trunk proprioception (Lamoth, Meijer, Daffertshofer, Wuisman, & Beek, 2005; Leinonen
et al., 2003) lead to an impaired ability to sense lumbar position changes and increased
muscle reaction times (Larivière, Forget, Vadeboncoeur, Bilodeau, & Mecheri, 2010;
Taimela, Osterman, Alaranta, Soukka, & Kujala, 1993), which reduce the body’s ability
to engage sufficient reactive postural strategies. In addition, feedforward trunk
neuromuscular control is diminished in this population (Hodges & Richardson, 1998;
1999), which reduces the body’s ability to produce sufficient predictive strategies to
maintain balance.
Texas Tech University Health Sciences Center, Troy L. Hooper, May 2015
106
The current methods used to detect postural control deficits are generally difficult
to operate and expensive. Instrumented force plates and dedicated instruments such as
the Neurocom Balance Master® can provide quantified assessments of static or semi-
dynamic postural control by measuring ground reaction forces, but these devices are
expensive, complex to interpret, and require a large amount of space. These
characteristics make such devices impractical to use in most clinical settings.
Additionally, these tests are performed in a static position and are thus unable to measure
the body’s ability to maintain balance while moving through a functional ROM (Bressel,
Yonker, Kras, & Heath, 2007; Sell, 2012). A need exists for simple and inexpensive tests
of dynamic postural control that are appropriate for clinical use.
The Star Excursion Balance Test (SEBT) is commonly used to measure dynamic
postural stability. This test is simple to setup and administer and can be performed in a
short amount of time. The original SEBT is performed using eight strips of tape placed at
45° angles to each other. The subject stands on one leg at the center of the “star” created
by the intersection of the tape pieces. Each strip of tape is labeled according to the
excursion direction relative to the stance leg: anterolateral (AL), anterior (ANT),
anteromedial (AM), medial (MED), posteromedial (PM), posterior (POST), posterolateral
(PL), and lateral (LAT). The subject is instructed to perform a maximum reach in each of
the eight testing directions with the opposite leg. This way, the person’s balance is
challenged in the sagittal, transverse, and frontal planes along with different
combinations of each plane.
The SEBT is traditionally used to detect postural deficits in people with lower
extremity injuries, such as chronic ankle instability, patellofemoral pain syndrome, and
Texas Tech University Health Sciences Center, Troy L. Hooper, May 2015
107
anterior cruciate ligament (ACL) injury (Gribble, Hertel, & Plisky, 2012), but Ganesh,
Chhabra, and Mrityunjay (2014) found that individuals with chronic LBP (i.e., greater
than 6 months duration) had decreased reach distances compared to a healthy control
group in all directions except POST. However, the study did not objectify the pain,
disability, or activity levels of the LBP subjects, and while the study groups were
matched for age, other potentially important factors such as activity level and body mass
index (BMI) were not controlled between groups.
A potential limitation of the SEBT is the amount of time required for its
administration. Performing all eight directions is time-consuming and may introduce
fatigue effects and decrease motivation to perform the test, especially in injured
populations. In response to this issue Hertel, Braham, Hale, and Olmsted-Kramer (2006)
performed a factor analysis of the eight components of the SEBT in subjects with and
without chronic ankle instability to determine whether the number of components
necessary to detect functional deficits in this population could be reduced. Their results
showed that considerable redundancy exists among the eight directions in both groups,
with each direction being highly correlated with all of the others. As a result of this
study, Hertel (2008) recommended reducing the number of directions tested to three and
developed a modified version of the SEBT, incorporating only the ANT, PM, and PL
directions. This method of testing is termed the Y-Balance Test.
Preliminary evidence shows that a simple clinical test such as the SEBT is able to
detect dynamic balance deficits in a chronic LBP population (Ganesh et al., 2014), but
potential confounding factors such as activity level and BMI potentially affected these
outcomes. Additionally, it is not known whether a relationship exists between the levels
Texas Tech University Health Sciences Center, Troy L. Hooper, May 2015
108
of pain, fear-avoidance, disability or activity level and test outcomes. Finally, no study to
date has investigated the ability of this test to detect dynamic balance deficits in people
with a LBP history who are currently pain-free. The purpose of this study was to
determine whether there are differences in Y-Balance Test scores among recurrent LBP
subjects with current pain (cLBP), people with a LBP history who are currently pain-free
(hxLBP), and people with no history of LBP (control). An additional purpose was to
investigate the relationship between Y-Balance Test scores and activity level, age, and
BMI in all three groups and Y-Balance Test scores and pain, disability, and fear of
movement measurements for members of the cLBP and hxLBP groups.
METHODS
Experimental Design
A one factor between-subjects design was used to examine differences in Y-
Balance Test scores among three groups: cLBP, hxLBP, and control.
Subjects
Large effect sizes were found in prior Y-Balance Test studies in subjects with
knee and ankle disorders (Gribble et al., 2012; Herrington, Hatcher, Hatcher, &
McNicholas, 2009). Using α = 0.05 and β = 0.20, it was determined that a minimum of
nine subjects were required in each group. To account for attrition, a convenience sample
of 14 subjects was chosen for each group. Subjects were recruited from local
rehabilitation clinics and the general public and included males and females between the
ages of 18 and 50 years old.
Texas Tech University Health Sciences Center, Troy L. Hooper, May 2015
109
The hxLBP group (8 males and 6 females) included subjects with a history of one
or more episodes of recurrent LBP over the previous 18 months. Recurrent LBP was
defined as pain that is intermittent with unilateral or bilateral symptoms between T12 and
the mid-thigh. These subjects had experienced one or more of the following: (a) a
severity sufficient to require medical or allied health intervention; and/or (b) a severity
sufficient to impair the subject’s ability to perform their normal activities of daily living.
At the time of testing, subjects were in a period of remission from their LBP symptoms
(Macdonald, Moseley, & Hodges, 2010). Criteria for inclusion in the cLBP (8 males and
6 females) were the same, except subjects presently reported a pain of ≥ 2/10 cm on a 10
cm VAS or an average of ≥ 3/10 cm over the past week. These subjects did not present
with radicular low back or leg pain or neurological signs. Subjects in the control group
(8 males and 6 females) were free of LBP in the previous two years. Exclusion criteria
for all groups included: (a) history of hip, knee, or ankle pain in the previous two years;
(b) history of lower extremity or lumbar spine surgery; (c) pregnancy by self-report; (d)
rheumatologic or neurological disorders; (e) vestibular or other balance disorders, (f)
present treatment for inner ear, sinus, or upper respiratory infection, or head cold, and (g)
cerebral concussion within the previous three months. Because the current study was a
part of a study that excluded obese subjects, a BMI greater than 30 kg/m2 was an
additional exclusion criterion.
Testing Procedures
Subjects read and signed the informed consent form approved by the university’s
Institutional Review Board and completed a medical history questionnaire to determine
their eligibility for the study. They then watched a video presentation explaining the
Texas Tech University Health Sciences Center, Troy L. Hooper, May 2015
110
purpose of the study and testing procedures. Following the video, demographic data,
including the subject’s height, weight, and dominant leg, defined at the limb used to kick
a ball, were recorded. All participants completed a medical history questionnaire to
determine study eligibility and the Baecke Physical Activity Questionnaire (BPAQ)
(Baecke, Burema, & Frijters, 1982), which is a self-administered questionnaire found to
be reliable in LBP patients (Jacob, Baras, Zeev, & Epstein, 2001). The questionnaire
includes three indices that represent physical activity levels at work, sports and other
leisure-time activities. Subjects in the cLBP and hxLBP groups completed the Roland
Morris Disability Questionnaire (RMDQ) to measure disability levels caused by LBP
(Roland & Fairbank, 2000) and the Fear Avoidance Beliefs Questionnaire (FABQ) to
measure the presence of pain-related fear of movement (Waddell, Newton, Henderson,
Somerville, & Main, 1993). To record pain levels, cLBP and hxLBP subjects recorded
two 10 cm visual analog scales (VAS) (Carlsson, 1983). These scales asked for the
subjects’ current pain level and average pain level over the past week.
Subjects were next instructed on proper Y-Balance Test performance in the ANT,
PM, and PL directions and allowed four practice trials to minimize practice effects
(Robinson & Gribble, 2008). The testing protocol followed recommendations made by
Plisky et al. (2009) and Gribble et al. (2012). Subjects performed the test standing on
their dominant limb and without shoes to control for the potential influence of varying
footwear (Gribble et al., 2012). The three testing directions were randomized to prevent
an order effect, and three successful repetitions were performed in each direction. A
minimum of 30 s was allowed between trials to reduce fatigue effects. Reach distances
Texas Tech University Health Sciences Center, Troy L. Hooper, May 2015
111
were normalized to limb length by calculating the maximized reach distance (%MAXD),
which is found using the formula (Reach distance/limb length) X 100% = %MAXD.
Statistical Analysis
Descriptive statistics (mean ± SD) were calculated for age, weight, height, BMI,
and BPAQ scores for all subjects and VAS and questionnaire scores in the cLBP and
hxLBP groups. Data were tested for normality (Shapiro-Wilk) and homogeneity of
variance (Levene’s Test). Independent samples one-way analyses of variance
(ANOVAs) were used to determine any differences in demographic characteristics
among the three groups. Differences in pain, disability level, and fear-avoidance beliefs
between the two LBP groups were tested with independent t tests.
Three independent samples one-way ANOVAs were performed to investigate
significant reach distance differences among the control, the cLBP, and hxLBP groups.
Tukey’s post-hoc tests were used to identify the location of significant differences within
each analysis. Bivariate Pearson product moment correlations were calculated to
determine if a relationship exists between reach distance in each direction and VAS,
RMDQ, and FABQ scores in the cLBP and hxLBP groups and age, BMI, and BPAQ
scores in all subjects. The level of significance was set at α = .05 for all analyses. Effect
size was expressed as partial eta squared (ƞp2) with ƞp2 ≥ 0.01 indicating small, ƞp2 ≥ 0.06
medium, and ƞp2 ≥ 0.14 large effects (Portney & Watkins, 2009). All statistical analyses
were performed using SPSS Statistics, Version 22.0 (IBM, Inc, Chicago, IL).

Texas Tech University Health Sciences Center, Troy L. Hooper, May 2015
112
RESULTS
There were no significant (p > .05) differences among groups for age, height,
BMI, or BAQ scores (Table 4.1). Anterior reach distances were 66.44 ± 7.00 cm for the
control, 66.15 ± 6.23 cm for the cLBP, and 66.39 ± 3.10 cm for the hxLBP group (Figure
4.1). These distances did not significantly differ (F[2,39] = 0.10; p = .990; ƞp2 = .001;
power = .051). However a significant main effect for reach distance was found in the PL
direction (F[2,39] = 7.49; p = .002; ƞp2 = .278; power = .925). Reach distances were
significantly reduced in the cLBP (94.73 ± 10.56 cm; p = 0.006) and hxLBP (94.16 ±
9.19 cm; p = .004) groups compared to the control group (105.76 ± 6.62cm), but no
difference was found between the cLBP and hxLBP groups (p = .984). Similar results
were found for the PM direction. There was a significant main effect for reach distance
(F[2,39] = 5.11; p = .011; ƞp2 = .208; power = .792), with reach distances significantly
reduced in the cLBP (100.70 ± 8.36 cm; p = .013) and hxLBP (102.26 ± 7.63 cm; p =
.048) groups compared to the control group (109.30 ± 6.65 cm). No difference was
found between the cLBP and hxLBP groups (p = .850).
Correlation results are listed in Table 4.2. In the cLBP group a statistically
significant negative correlation was found between BMI and PM reach distance (r = -
.579, p = .030). No statistically (p > .05) correlations were observed in the control or
hxLBP groups.
DISCUSSION
This study’s primary finding is that Y-Balance Test reach distances in the PM and
PL directions were lower in the cLBP and hxLBP groups compared to a pain-free control
Texas Tech University Health Sciences Center, Troy L. Hooper, May 2015
113
group. No differences were found, however, in the ANT direction. A secondary goal
was the relationships between Y-Balance Test scores and age, activity level, and BMI in
all three groups and Y-Balance Test scores and pain, disability, and fear of movement
measurements for the cLBP and hxLBP groups. These findings were inconclusive.
This study is the first to demonstrate that the Y-Balance Test can detect dynamic
balance deficits in people with a LBP history who are currently pain-free. Previous
studies have reported that balance deficits remain in this population even after the pain
disappears; however, these studies relied on expensive laboratory equipment such as
force plates (Bouche et al., 2005; van Dieën et al., 2010). The Y-Balance Test can be
performed quickly in a clinical setting and requires little training, which makes it a good
option for testing dynamic balance in this population.
The presence of reach distance deficits during the posterior reach trials but not in
the ANT direction is not consistent with previous research in LBP subjects (Ganesh et al.,
2014), although similar findings have been observed in studies that tested individuals
with different lower limb injuries. For example, Delahunt et al. (2013) found that PM
and PL reach distances were limited in subjects who had undergone ACL reconstruction.
Ganesh et al. (2014) found that reach distances in chronic LBP subjects of a similar age
(34.30 ± 8.67 yr) to the subjects in the current study were diminished in all three
directions tested in the current study. Several differences between the two studies may
explain this difference. First, the LBP classification of subjects in the two studies is
likely different. Ganesh et al. (2014) did not report the pain levels or functional status of
subjects in their study, but the subjects’ postural control was possibly more impaired in
the previous study, as it looked at people with chronic LBP of greater than 6 months

Texas Tech University Health Sciences Center, Troy L. Hooper, May 2015
114
duration. The current LBP subjects in this study, however, were experiencing relatively
low pain levels (3.03 ± 1.40 cm) when tested. Second, the current study used the Y-
Balance Test Kit for testing, while Ganesh et al. (2014) used the traditional SEBT, in
which the reaching leg moves along a line marked on the floor. Anterior, but not PL or
PM, reach distances are less using the Y-Balance Test Kit versus testing on the floor, and
this difference was attributed to greater hip flexion during the Y-Balance Test (Fullam,
Caulfield, Coughlan, & Delahunt, 2014). This kinematic difference may be relevant in a
LBP population.
The ability to maintain postural control in dynamic situations is a complex skill
requiring the interaction of the visual, somatosensory, and vestibular systems. When one
of these systems is impaired, the body may attempt to compensate by increasing its
reliance on the remaining systems. Failure of this compensation, however, will lead to
loss of balance and diminished postural control. During the ANT reach trials, the subject
is able to see the moving limb throughout the activity; therefore, the visual system is
available to compensate for any somatosensory deficits present in the LBP groups.
During the posterior trials, however, the lower limb is placed behind the body, out of the
line of sight, which eliminates the ability to use the visual system for compensation.
Therefore, these directions may have been the only two that were sufficiently challenging
to stress the postural control system and limit the subjects’ reach distances. It may be
that postural control deficits in people with a LBP history who are currently pain-free or
people with relatively minor LBP are not great enough to be detected in the ANT
direction.
Texas Tech University Health Sciences Center, Troy L. Hooper, May 2015
115
Differences in the body’s COG position during the anterior versus posterior
reaching trials may be another explanation for the lack of a deficit in the ANT direction.
To maintain balance, the body’s COG must remain within its BOS. The COG moves
further from the stance limb during the posterior trials than in the anterior direction,
creating a greater challenge to balance during the PM and PL trials. In response, the two
LBP groups may have limited their reach distances during these trials.
Only one correlation between the variables measured and reach distance was
significant. In the cLBP group, a lower BMI was associated with greater reach distances
in the PM direction. In these trials BMI accounted for 33.5% of the variance in reach
distance. This suggests that mass may affect reach distance. While pain levels were not
correlated with reach distance, this may be due to the overall low pain levels in the cLBP
group.
One factor that potentially affects reach distance is fear of movement. This is
especially important in LBP populations, as these individuals are often apprehensive to
perform dynamic tasks due to fear of further pain and injury with movement (Rainville et
al., 2011). The low correlation between FABQ scores and reach distances indicates that
reach distances were not affected by a subject’s apprehension to perform this dynamic
test. Similarly, disability levels, as measured by the RMDQ were not correlated with
reach distances. Age was not significantly correlated with reach distance, although the
relatively young age of the majority of subjects may have affected this outcome.
Likewise, activity level did not influence reach distances, but the range of BPAQ scores
was relatively low, which may have influenced the test results. The results of these
correlation analyses provide initial data regarding these variables. Further studies using a
Texas Tech University Health Sciences Center, Troy L. Hooper, May 2015
116
larger number of subjects as well as people with a greater variety of ages and pain,
disability, and activity levels are recommended.
Limitations
The current study has several limitations. The Y-Balance Test directions were
chosen to maximize the utility of the test for detecting balance deficits in people with
chronic ankle instability (Plisky, Rauh, Kaminski, & Underwood, 2006). It is possible
that these three directions are not optimal choices for detecting dynamic balance deficits
in a LBP population. Future studies should be conducted to determine which directions
of the SEBT are most sensitive to detect balance deficits in this population.
In addition, the pain levels experienced by the cLBP group were relatively low.
Future studies with more impaired LBP subjects may find differences between hxLBP
and cLBP groups that this study was unable to detect. Moreover, this may account for
the different ANT reach outcomes observed in our study compared to Ganesh et. al.
(2014). Finally, although attempts were made to control for factors other than postural
control that may affect Y-Balance Test performance, variables not measured, such as
strength (Ambegaonkar, Mettinger, Caswell, Burtt, & Cortes, 2014; Gordon,
Ambegaonkar, & Caswell, 2013) or flexibility may have affected performance.
CONCLUSION
The Y-Balance Test is capable of detecting dynamic balance deficits in
individuals with recurrent LBP with present symptoms, as well as persons with a recent
LBP history. It is a simple test that requires little training and can be performed easily in

Texas Tech University Health Sciences Center, Troy L. Hooper, May 2015
117
a clinical setting. The Y-Balance Test scores may be affected by BMI, but further studies
are needed to confirm this finding.

Texas Tech University Health Sciences Center, Troy L. Hooper, May 2015
118
Figure 4.1. Normalized reach distances for current LBP, LBP history, and control groups. Error bars represent 95% confidence intervals. LBP = low back pain. *Indicates p < .01.
Anterior Posterolateral Posteromedial0
40
80
120No
rmal
ized
Reac
h Di
stan
ce (%
)Current LBPHistory LBPControl
**
**
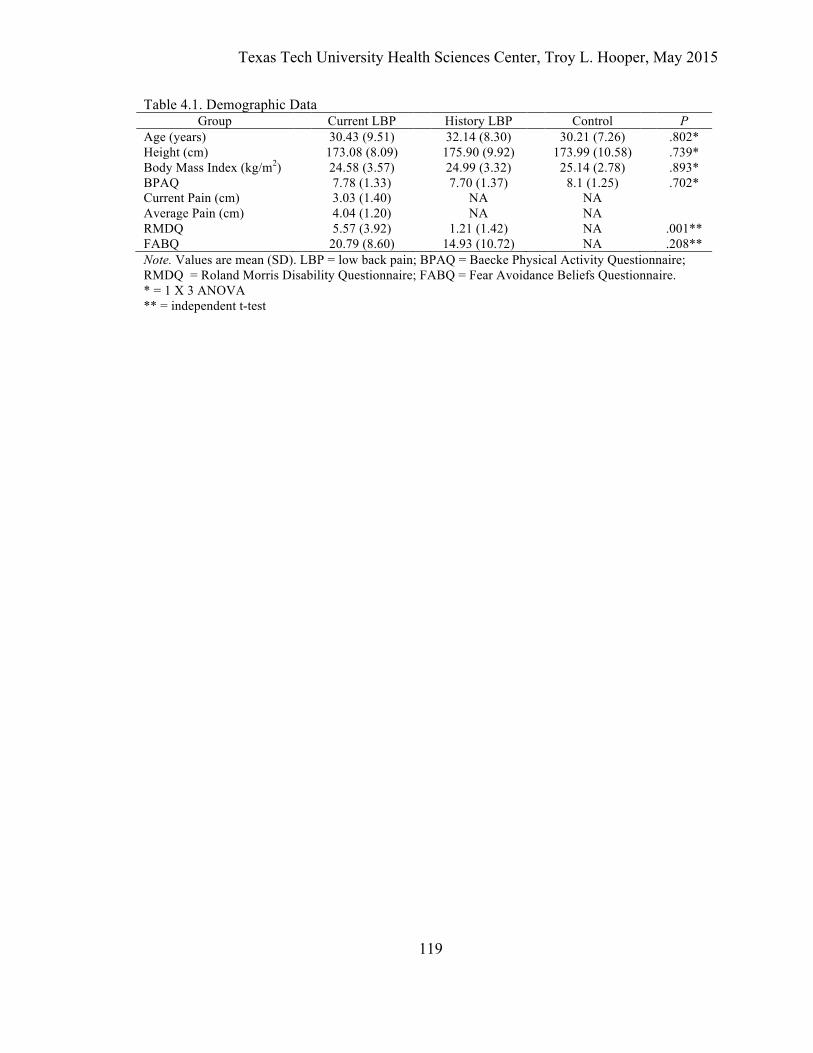
Texas Tech University Health Sciences Center, Troy L. Hooper, May 2015
119
Table 4.1. Demographic Data Group Current LBP History LBP Control P
Age (years) 30.43 (9.51) 32.14 (8.30) 30.21 (7.26) .802* Height (cm) 173.08 (8.09) 175.90 (9.92) 173.99 (10.58) .739* Body Mass Index (kg/m2) 24.58 (3.57) 24.99 (3.32) 25.14 (2.78) .893* BPAQ 7.78 (1.33) 7.70 (1.37) 8.1 (1.25) .702* Current Pain (cm) 3.03 (1.40) NA NA Average Pain (cm) 4.04 (1.20) NA NA RMDQ 5.57 (3.92) 1.21 (1.42) NA .001** FABQ 20.79 (8.60) 14.93 (10.72) NA .208** Note. Values are mean (SD). LBP = low back pain; BPAQ = Baecke Physical Activity Questionnaire; RMDQ = Roland Morris Disability Questionnaire; FABQ = Fear Avoidance Beliefs Questionnaire. * = 1 X 3 ANOVA ** = independent t-test

Texas Tech University Health Sciences Center, Troy L. Hooper, May 2015
120
Table 4.2. Correlation Matrix of Reach Distances and Demographic Variables
Age BMI BPAQ RMDQ FABQ Current
Pain Control Anterior -.39 -.51 .37 Posterolateral -.14 .32 -.08 Posteromedial -.10 .18 -.06 hxLBP Anterior -.12 -.35 -.33 -.01 .00 Posterolateral -.25 .21 .09 .13 .24 Posteromedial -.34 .27 .05 .05 .23 LBP Anterior -.32 -.37 .18 .03 -.03 .18 Posterolateral -.06 -.47 .03 -.43 -.08 .18 Posteromedial -.31 -.58* .17 -.10 -.35 .42 Note. hxLBP = low back pain history; cLBP = current low back pain; BMI = body mass index; BPAQ = Baecke Physical Activity Questionnaire; RMDQ = Roland Morris Disability Questionnaire; FABQ = Fear Avoidance Beliefs Questionnaire. * Correlation is significant at p < .05.

Texas Tech University Health Sciences Center, Troy L. Hooper, May 2015
121
REFERENCES
Ambegaonkar, J. P., Mettinger, L. M., Caswell, S. V., Burtt, A., & Cortes, N. (2014). Relationships between core endurance, hip strength, and balance in collegiate female athletes. International Journal of Sports Physical Therapy, 9(5), 604–616.
Andersson, G. B. (1999). Epidemiological features of chronic low-back pain. Lancet, 354(9178), 581–585.
Bacsi, A. M., & Colebatch, J. G. (2004). Evidence for reflex and perceptual vestibular contributions to postural control. Experimental Brain Research, 160(1), 22–28.
Baecke, J. A., Burema, J., & Frijters, J. E. (1982). A short questionnaire for the measurement of habitual physical activity in epidemiological studies. The American Journal of Clinical Nutrition, 36(5), 936–942.
Bouche, K., Stevens, V., Cambier, D., Caemaert, J., & Danneels, L. A. (2005). Comparison of postural control in unilateral stance between healthy controls and lumbar discectomy patients with and without pain. European Spine Journal, 15(4), 423–432.
Bove, M., Nardone, A., & Schieppati, M. (2009). Effects of leg muscle tendon vibration on group Ia and group II reflex responses to stance perturbation in humans. Journal of Physiology, 550(2), 617–630.
Bressel, E., Yonker, J. C., Kras, J., & Heath, E. M. (2007). Comparison of static and dynamic balance in female collegiate soccer, basketball, and gymnastics athletes. Journal of Athletic Training, 42(1), 42–46.
Brumagne, S., Cordo, P., & Verschueren, S. (2004). Proprioceptive weighting changes in persons with low back pain and elderly persons during upright standing. Neuroscience Letters, 366(1), 63–66.
Carlsson, A. M. (1983). Assessment of chronic pain. I. Aspects of the reliability and validity of the visual analogue scale. Pain, 16(1), 87–101.
Cavanaugh, J. T., Guskiewicz, K. M., & Stergiou, N. (2005). A nonlinear dynamic approach for evaluating postural control: new directions for the management of sport-related cerebral concussion. Sports Medicine, 35(11), 935–950.
Delahunt, E., Chawke, M., Kelleher, J., Murphy, K., Prendiville, A., Sweeny, L., & Patterson, M. (2013). Lower limb kinematics and dynamic postural stability in anterior cruciate ligament-reconstructed female athletes. Journal of Athletic Training, 48(2), 172–185.
Fullam, K., Caulfield, B., Coughlan, G. F., & Delahunt, E. (2014). Kinematic analysis of selected reach directions of the Star Excursion Balance Test compared with the Y-Balance Test. Journal of Sport Rehabilitation, 23(1), 27–35.
Ganesh, G. S., Ganesh, G. S., Chhabra, D., Chhabra, D., & Mrityunjay, K. (2014). Efficacy of the star excursion balance test in detecting reach deficits in subjects with chronic low back pain. Physiotherapy Research International.
Texas Tech University Health Sciences Center, Troy L. Hooper, May 2015
122
Gordon, A. T., Ambegaonkar, J. P., & Caswell, S. V. (2013). Relationships between core strength, hip external rotator muscle strength, and star excursion balance test performance in female lacrosse players. International Journal of Sports Physical Therapy, 8(2), 97–104.
Gribble, P. A., Hertel, J., & Plisky, P. (2012). Using the Star Excursion Balance Test to assess dynamic postural-control deficits and outcomes in lower extremity injury: a literature and systematic review. Journal of Athletic Training, 47(3), 339–357.
Guskiewicz, K. M. (2011). Regaining Postural Stability and Balance. In W. E. Prentice, Rehabilitation Techniques for Sports Medicine and Athletic Training (5 ed., pp. 144–174). New York: McGraw-Hill.
Herrington, L., Hatcher, J., Hatcher, A., & McNicholas, M. (2009). A comparison of star excursion balance test reach distances between acl deficient patients and asymptomatic controls. The Knee, 16(2), 149–152.
Hertel, J. (2008). Sensorimotor deficits with ankle sprains and chronic ankle instability. Clinics in Sports Medicine, 27(3), 353–370.
Hertel, J., Braham, R. A., Hale, S. A., & Olmsted-Kramer, L. C. (2006). Simplifying the star excursion balance test: analyses of subjects with and without chronic ankle instability. Journal of Orthopaedic and Sports Physical Therapy, 36(3), 131–137.
Hestbaek, L., Leboeuf-Yde, C., & Manniche, C. (2003). Low back pain: What is the long-term course? A review of studies of general patient populations. European Spine Journal, 12(2), 149–165.
Hodges, P. W., & Richardson, C. A. (1998). Delayed postural contraction of transversus abdominis in low back pain associated with movement of the lower limb. Journal of Spinal Disorders, 11(1), 46–56.
Hodges, P. W., & Richardson, C. A. (1999). Altered trunk muscle recruitment in people with low back pain with upper limb movement at different speeds. Archives of Physical Medicine and Rehabilitation, 80(9), 1005–1012.
Jacob, T., Baras, M., Zeev, A., & Epstein, L. (2001). Low back pain: Reliability of a set of pain measurement tools. Archives of Physical Medicine and Rehabilitation, 82(6), 735–742.
Lamoth, C. J., Meijer, O. G., Daffertshofer, A., Wuisman, P. I., & Beek, P. J. (2005). Effects of chronic low back pain on trunk coordination and back muscle activity during walking: changes in motor control. European Spine Journal, 15(1), 23–40.
Larivière, C., Forget, R., Vadeboncoeur, R., Bilodeau, M., & Mecheri, H. (2010). The effect of sex and chronic low back pain on back muscle reflex responses. European Journal of Applied Physiology, 109(4), 577–590.
Leinonen, V., Kankaanpää, M., Luukkonen, M., Kansanen, M., Hänninen, O., Airaksinen, O., & Taimela, S. (2003). Lumbar paraspinal muscle function, perception of lumbar position, and postural control in disc herniation-related back pain. Spine, 28, 842–848.
Texas Tech University Health Sciences Center, Troy L. Hooper, May 2015
123
Macdonald, D. A., Moseley, G. L., & Hodges, P. W. (2010). People with recurrent low back pain respond differently to trunk loading despite remission from symptoms. Spine, 35(7), 818–824.
Mergner, T., Schweigart, G., Maurer, C., & Blümle, A. (2005). Human postural responses to motion of real and virtual visual environments under different support base conditions. Experimental Brain Research, 167(4), 535–556.
Mientjes, M. I., & Frank, J. S. (1999). Balance in chronic low back pain patients compared to healthy people under various conditions in upright standing. Clinical Biomechanics, 14, 710–716.
Plisky, P. J., Gorman, P. P., Butler, R. J., Kiesel, K. B., Underwood, F. B., & Elkins, B. (2009). The reliability of an instrumented device for measuring components of the star excursion balance test. North American Journal of Sports Physical Therapy, 4(2), 92–99.
Plisky, P. J., Rauh, M. J., Kaminski, T. W., & Underwood, F. B. (2006). Star Excursion Balance Test as a predictor of lower extremity injury in high school basketball players. Journal of Orthopaedic and Sports Physical Therapy, 36(12), 911–919.
Pollock, A. S., Durward, B. R., Rowe, P. J., & Paul, J. P. (2000). What is balance? Clinical Rehabilitation, 14(4), 402–406.
Portney, L. G., & Watkins, M. P. (2009). Foundations of Clinical Research: Applications to Practice (3rd ed.). Upper Saddle River, NJ: Prentice Hall.
Rainville, J., Smeets, R. J. E. M., Bendix, T., Tveito, T. H., Poiraudeau, S., & Indahl, A. J. (2011). Fear-avoidance beliefs and pain avoidance in low back pain--translating research into clinical practice. Spine Journal, 11(9), 895–903.
Robinson, R. H., & Gribble, P. A. (2008). Support for a reduction in the number of trials needed for the star excursion balance test. Archives of Physical Medicine and Rehabilitation, 89, 364–370.
Roland, M., & Fairbank, J. (2000). The Roland-Morris Disability Questionnaire and the Oswestry Disability Questionnaire. Spine, 25(24), 3115–3124.
Ruhe, A., Fejer, R., & Walker, B. (2011). Center of pressure excursion as a measure of balance performance in patients with non-specific low back pain compared to healthy controls: A systematic review of the literature. European Spine Journal, 20(3), 358–368.
Sell, T. C. (2012). An examination, correlation, and comparison of static and dynamic measures of postural stability in healthy, physically active adults. Physical Therapy in Sport, 13, 80–6.
Stanton, T. R., Latimer, J., Maher, C. G., & Hancock, M. J. (2011). A modified Delphi approach to standardize low back pain recurrence terminology. European Spine Journal, 20(5), 744–752.
Taimela, S., Osterman, K., Alaranta, H., Soukka, A., & Kujala, U. M. (1993). Long psychomotor reaction time in patients with chronic low-back pain: preliminary
Texas Tech University Health Sciences Center, Troy L. Hooper, May 2015
124
report. Archives of Physical Medicine and Rehabilitation, 74(11), 1161–1164. Tresch, M. C. (2007). A balanced view of motor control. Nature Neuroscience, 10(10),
1227–1228. van Dieën, J. H., Koppes, L. L. J., & Twisk, J. W. R. (2010). Low-back pain history and
postural sway in unstable sitting. Spine, 35(7), 812–817. Waddell, G., Newton, M., Henderson, I., Somerville, D., & Main, C. J. (1993). A Fear-
Avoidance Beliefs Questionnaire (FABQ) and the role of fear-avoidance beliefs in chronic low back pain and disability. Pain, 52(2), 157–168.
Texas Tech University Health Sciences Center, Troy L. Hooper, May 2015
125
CHAPTER V
THE EFFECT OF LOW BACK PAIN STATUS ON BIOMECHANICAL MEASURES OF DYNAMIC BALANCE TEST PERFORMANCE IN PEOPLE WITH EXISTING
AND A HISTORY OF RECURRENT LOW BACK PAIN
ABSTRACT
Background: Balance disturbances and trunk muscle activity changes are commonly
observed with LBP, and these changes often persist after the pain is resolved. Moreover,
lumbar injuries can produce distal biomechanical changes. The purpose of this study was
to determine the effect of current LBP (cLBP) and a LBP history without present
symptoms (hxLBP) on lower extremity neuromuscular and kinematic variables during the
Y-Balance Test.
Methods: Forty-two subjects (30.93 ± 8.24 yr) were divided into control, cLBP, and
hxLBP groups. Each subject performed three trials of the Y-Balance Test in the anterior
(ANT), posterior medial (PM) and posterior lateral (PL) reach directions. Reach
distances relative to leg length were measured, and electromyography (EMG) of three
stance- and moving-side trunk muscles and six stance-limb hip and thigh muscles was
collected. In addition, trunk, pelvis, and stance-limb 3-dimensional kinematics were
recorded.
Findings: Reach distances did not differ in the ANT direction, but PL and PM distances
were shorter in the cLBP and hxLBP groups. There were no differences in EMG activity.
Trunk flexion was reduced and ankle dorsiflexion was increased in the hxLBP and cLBP
groups.

Texas Tech University Health Sciences Center, Troy L. Hooper, May 2015
126
Interpretation: People with current LBP or a LBP history experience diminished
dynamic balance when performing the posterior portions of the Y-Balance Test. They
attempted to compensate for their balance deficits by adopting a more rigid, upright trunk
strategy and used greater ankle dorsiflexion to improve reach distance. This strategy was
sufficient to permit increased reach distances in the ANT direction, but not posteriorly.
Texas Tech University Health Sciences Center, Troy L. Hooper, May 2015
127
INTRODUCTION
Low back pain is an almost universal experience, and symptoms associated with
this condition are often recurrent or persistent. Only 33% of LBP cases are pain-free
within three months, and at one year after onset, 65% continue to report pain (Itz, Geurts,
van Kleef, & Nelemans, 2012). It is therefore important to understand the mechanisms
that contribute to this recurrence in order to develop treatment programs to help reduce it.
People with LBP develop neuromuscular and biomechanical changes in the trunk,
pelvis, and lower extremities. The spine and pelvis are the center of the functional
kinetic chain, providing a stable proximal base for the distal extremities during functional
tasks (Kibler, Press, & Sciascia, 2006; Leetun, Ireland, Willson, Ballantyne, & Davis,
2004). Decreased strength and impaired neuromuscular control of the trunk muscles in
those with LBP may create an unstable foundation for the lower extremities to develop or
resist force. Activity between muscles and even within individual muscles is
redistributed in an attempt to reduce pain and protect the injured area (Hodges & Tucker,
2011). This can lead to either a decrease or increase in trunk and lower extremity muscle
activation and altered lower quarter movement patterns (O'Sullivan, 2000). Low back
pain episodes can alter pelvic and hip muscle functions, including quadriceps inhibition
(Hart, Fritz, et al., 2006a; Suter & Lindsay, 2001), delayed (Haddas, James, & Hooper,
2014) and elevated (Hart, Kerrigan, et al., 2006b; Pirouzi, Hides, Richardson, Darnell, &
Toppenberg, 2006) hamstring activity, and gluteus maximus / medius fatigue and
inhibition (Hungerford, Gilleard, & Hodges, 2003; Kankaanpää, Taimela, Laaksonen,
Hänninen, & Airaksinen, 1998; Nadler et al., 2001).
Texas Tech University Health Sciences Center, Troy L. Hooper, May 2015
128
In general, muscle activation proceeds in a proximal-to-distal manner during
movement tasks (Borghuis, Hof, & Lemmink, 2008; Kibler et al., 2006). According to
the Regional Interdependence Model (Sueki, Cleland, & Wainner, 2013), impairments in
one body region may lead to injury in proximal or distal areas. According to this model,
alterations in proximal lower quarter kinetic chain operation would increase injury risk at
more distal regions. In addition, this model suggests that any voluntary movement would
change the body’s center of mass (COM) position and result in postural perturbations. If
such perturbations are not compensated, proximal joint stresses may increase and a loss
of balance may occur.
Many studies have documented abdominal and lumbar paraspinal neuromuscular
changes in individuals with recurrent LBP (Freeman, Woodham, & Woodham, 2010;
Hodges & Richardson, 1998; Ng, Richardson, Parnianpour, & Kippers, 2002). These
impairments lead to clinical instability and contribute to further LBP episodes. The role
these changes may play in altering lower extremity movement patterns is less defined,
however, and further studies are needed to quantify how neuromuscular changes known
to correspond with a LBP history affect lower extremity muscular activity and
kinematics. Therefore, the purpose of this study was to determine the effects of both
current LBP (cLBP) and a LBP history with no present symptoms (hxLBP) on lower
extremity neuromuscular and kinematic variables and performance scores produced
during completion of the Y-Balance Test, which is a simple clinical test of dynamic
balance capable of detecting balance deficits in a LBP population (Ganesh, Ganesh,
Chhabra, Chhabra, & Mrityunjay, 2014). Low back pain is associated with a decreased
ability to adequately stabilize the lumbopelvic region, creating an unstable pelvis and
Texas Tech University Health Sciences Center, Troy L. Hooper, May 2015
129
changing lower extremity muscular and kinematic control parameters. Therefore, we
hypothesized that both cLBP and hxLBP subjects would exhibit diminished trunk and
lower extremity control during the Y-Balance Test compared to a healthy control group.
METHODS
Experimental Design
A one-way between groups design was used to examine the effects of LBP status
(control versus cLBP versus hxLBP) on reach distances, as well as trunk, pelvic, and
lower extremity control variables, produced by subjects during the Y-Balance Test.
Subjects
To determine an appropriate sample size, a power analysis was performed and
found that for a desired power of 80% (1 - β = .80) and α = 0.05, a minimum sample size
of 14 subjects per group was needed. A total of 42 subjects (24 males and 18 females)
were recruited from local rehabilitation clinics and the general public. Subjects were
between the ages of 18 and 50 years old.
The hxLBP group (8 males and 6 females) included subjects with one or more
episodes of recurrent LBP over the previous 18 months. Recurrent LBP was defined as
pain that is intermittent with unilateral or bilateral symptoms between T12 and the mid-
thigh. This pain was either: (a) a severity sufficient to require medical intervention;
and/or (b) a severity sufficient to impair the subject’s ability to perform their normal
activities of daily living. At the time of testing, subjects were in a period of remission
from their LBP (Macdonald, Moseley, & Hodges, 2010). Criteria for inclusion in the
cLBP group (8 males and 6 females) were the same, except subjects presently reported a
Texas Tech University Health Sciences Center, Troy L. Hooper, May 2015
130
pain of ≥ 2/10 cm on a 10 cm VAS or an average of ≥ 3/10 cm over the past week. These
subjects did not present with radicular low back or leg pain or neurological signs. The
control group (8 males and 6 females) was free of LBP in the previous two years.
Exclusion criteria for all groups included: (a) history of lower extremity pain in the
previous two years; (b) history of lower extremity or lumbar spine surgery; (c) pregnancy
by self-report; (d) rheumatologic or neurological disorders; (e) vestibular or other balance
disorders, (f) inner ear, sinus, or upper respiratory infection, or head cold, (g) concussion
within the previous three months, (h) history of core stabilization training within the past
year, and (i) a BMI greater than 30 kg/m2. All subjects provided written informed
consent. The university’s Institutional Review Board approved the study.
PROCEDURES
Preparatory Procedures and Instrumentation
Three-dimensional kinematic data for the head, trunk, and pelvis, and bilateral
upper arm, forearm, thigh, lower leg and foot segments were recorded using a VICON
Nexus (1.7.1, Denver, CO) six-camera motion analysis system sampled at 100 Hz. Only
the segmental orientations of the trunk, pelvis, thighs, lower legs, and feet were
subsequently used for analysis. Forty-one reflective markers (0.9 cm diameter) were
positioned bilaterally on the skin overlying the ventral and dorsal head, right scapula,
acromia, upper arms, lateral humeral epicondyles, lateral forearms, radial styloids, ulnar
styloids, posterior and anterior iliac spines, mid-point of iliac crests, lateral mid-segment
of the thighs, femoral epicondyles, lateral lower legs, lateral and medial malleoli, heels,
and the first, second, and fifth metatarsal heads. Four single markers were placed over
the C7 and T10 spinous processes posteriorly and the jugular notch and xiphoid process
Texas Tech University Health Sciences Center, Troy L. Hooper, May 2015
131
anteriorly. Additional calibration markers were placed bilaterally over the humeral and
femoral medial epicondyles and were removed following a static trial. Finally, one
marker was placed on each of the three Y-balance Test Kit reach indicators, so platform
movement could be quantified.
Surface EMG data collection was performed with wireless (Delsys Trigno,
Boston, MA) sensors sampling at a frequency of 2000 Hz. Rectangular electrodes (27
mm x 37 mm x 15 mm) with four 5 mm-by-1 mm silver contacts were used. The overall
channel noise was less than 0.75 µV with a common-mode rejection ratio greater than 80
dB, a 3 µV peak-to-peak baseline noise, and a gain of 1000. The skin was cleaned with
alcohol, shaved if necessary, and then lightly abraded to reduce impedance. Surface
EMG electrodes were attached to the trunk to assess muscle activity of the stance- and
moving-side external oblique (SEO and MEO), stance- and moving-side internal oblique
(SIO and MIO), and stance- and moving-side erector spinae (SES and MES) at the L4
level. Additional electrodes were placed on the stance-side lower extremity on the
gluteus maximus (GMax), gluteus medius (GMed), vastus lateralis (VL), vastus medialis
(VM), semitendinosus (ST), and biceps femoris (BF). Electrodes were placed on the
muscle bellies, avoiding muscle innervation zones as recommended by Barbero, Merletti,
and Rainoldi (2012).
The EMG data were normalized to a sub-maximal voluntary contraction (sub-
MVC) collected prior to Y-Balance Test performance. Submaximal testing is commonly
used for individuals with LBP, since they are not able to produce a true maximal effort
due to pain or the fear of pain (Larivière, Arsenault, Gravel, Gagnon, & Loisel, 2003;
Thomas, France, Sha, & Wiele, 2008). The sub-MVC test for the IO, EO, ES, and GMax
Texas Tech University Health Sciences Center, Troy L. Hooper, May 2015
132
followed procedures developed by Dankaerts, O’Sullivan, Burnett, Straker, and Danneels
(2004). For the trunk flexors (i.e., IO and EO), subjects were positioned on a plinth in a
crook lying position with the hips flexed to 45° and the knees flexed to 90°. They were
then asked to raise both legs 1 cm off the plinth. The ES and GMax normalization trials
were performed in prone. Subjects were asked to lift both knees 5 cm off the plinth, or as
high as their available hip range allows. The GMed subMVC contraction consisted of a
sidelying hip abduction with the knee extended and hip in neutral rotation until the lower
extremity was parallel to the table. The quadriceps muscles (VL, VM) were normalized
using a bilateral squat to 90°, while the hamstrings used a standing unilateral hamstring
curl to 90° of knee flexion (Fong, Hong, & Li, 2008). Three 5 s trials of all procedures
were performed, each separated by a 30 s rest period.
Data Collection Procedures
All subjects completed a medical history questionnaire to determine group
eligibility and collect demographic information. In addition, subjects completed the
Baecke Physical Activity Questionnaire (BPAQ) (Baecke, Burema, & Frijters, 1982),
which is a self-administered questionnaire found to be reliable in LBP patients (Jacob,
Baras, Zeev, & Epstein, 2001) and healthy individuals (Philippaerts, Westerterp, &
Lefevre, 1999). Disability level was recorded in the cLBP and hxLBP groups using the
Roland Morris Disability Questionnaire (RMDQ) (Roland & Fairbank, 2000), and the
Fear Avoidance Beliefs Questionnaire (FABQ) was used to measure pain-related fear of
movement (Waddell, Newton, Henderson, Somerville, & Main, 1993). Additionally, the
cLBP and hxLBP groups recorded their current pain level and average pain over the past
Texas Tech University Health Sciences Center, Troy L. Hooper, May 2015
133
week on a 10 cm visual analog scale (VAS). Subjects then watched a video describing
the study’s data collection procedures.
The reflective markers were attached following the EMG normalization trials and
a static trial was recorded to create a reference for defining neutral joint angles. All joint
angles were expressed relative to this posture. Subjects then practiced the Y-Balance
Test according to the recommendations of Plisky et al. (2009) and Gribble et al. (2012),
performing four practice trials in each direction to reduce leaning effects. The subject
stood on the dominant leg on the center footplate with their hands on their hips, placing
the edge of the toes at the marked starting line. The other leg pushed the reach indicator
as far as possible along the pipe in the direction being tested and then returned to the
starting position. To allow the subject to choose his or her preferred movement strategy,
no other instructions were given. Testing was performed without shoes to control for the
potential influence of varying footwear. The testing order was randomized, with subjects
performing three successful trials in the anterior (ANT), posteromedial (PM), and
posterolateral (PL) reach directions. Reach distances relative to the subject’s leg length
were recorded, and kinematic and EMG data were collected following each trial.
Data Analysis
The anatomical markers were used for construction of a 6-degrees-of-freedom
kinematic model using Visual 3D (C-Motion Inc, Rockville, MD). Raw coordinates were
smoothed using a fourth order no-phase-shift Butterworth low pass digital filter with the
cutoff set to 6 Hz. The pelvis was defined with respect to the global coordinate system
using a CODA pelvis orientation to define the location of the hip joint center (Bell,
Brand, & Pedersen, 1989). Knee and ankle joint centers were calculated as the midpoint
Texas Tech University Health Sciences Center, Troy L. Hooper, May 2015
134
of the medial and lateral joint markers. The trunk segment was defined using the
posterior superior iliac spine and acromion markers. A Cardan angle sequence (x-y-z,
which represents flexion-extension, abduction-adduction, and internal-external rotation)
was used to calculate joint angles, referencing the distal segment to the proximal
segment. The following angles were described as positive values: trunk flexion, side
bend toward stance leg, and rotation toward stance leg; pelvis posterior tilt, lateral tilt
toward stance leg, and rotation toward stance leg; hip flexion, adduction, and internal
rotation; knee extension, adduction, and internal rotation; ankle dorsiflexion, inversion,
and internal rotation. A trial was defined as the time from initial movement of the
reflective marker placed on the reach indicator to the time the reflective marker stopped,
which represented the maximum reach of the moving limb. The kinematic variables of
interest included 3-dimensional angles of the trunk and pelvis and the stance leg hip,
knee, and ankle at the end of each trial.
All EMG signals were imported into Matlab (The MathWorks, Inc) and band-pass
filtered between 20 Hz and 400 Hz with a fourth-order, no-pass, zero-phase-lag
Butterworth filter. The signals were analyzed in the frequency domain, and large 1 Hz
spikes of activity were unexpectedly observed at 100 Hz and its subsequent harmonics;
therefore, a notch filter was applied at 100 Hz and 200 Hz to eliminate this noise. For the
sub-MVC normalization trials, the average root mean square (RMS) of the final 3 s of the
three trials was calculated, and all EMG data were reported as a percentage of this value.
The EMG RMS amplitudes for each muscle over the trial period were analyzed to
determine the average muscle activity from trial initiation to the point of maximum reach.
Texas Tech University Health Sciences Center, Troy L. Hooper, May 2015
135
Statistical Analysis
Data were tested for normality (Shapiro-Wilk Test) and homogeneity of variance
(Levene’s Test). Separate one-way, between-groups ANOVAs were used to determine
group differences for reach distances and each kinematic dependent variable. Preplanned
contrasts were used to identify the location of significant differences between control
versus cLBP and control vs hxLBP groups within each analysis. To estimate effect sizes,
partial eta squared (ƞp2) values were computed with ƞp
2 ≥ 0.01 indicating small, ƞp2 ≥ 0.06
medium, and ƞp2 ≥ 0.14 large effects (Portney & Watkins, 2009).
Large standard deviation differences between groups for several trunk and ankle
kinematic angles resulted in significant Levene’s tests. In these cases, the Brown-
Forsythe test was used in place of the traditional ANOVA (Field, 2013). In addition, the
EMG data were not normally distributed, so nonparametric Kruskal-Wallis tests were
used to test group differences for the EMG variables. Alpha levels were set a priori at
.05 for all analyses. No attempt to correct for multiple comparisons was made in order to
reduce the likelihood of a Type II error in this exploratory analysis (Perneger, 1998). All
statistical analyses were performed using SPSS Statistics, Version 22.0 (IBM, Inc,
Chicago, IL).
RESULTS
Demographic results for this sample were reported in a previous study (Study-1).
No statistically significant (p > .05) differences in age (mean ± SD = 30.93 ± 8.24 yr),
height (1.74 ± 0.09 m), body mass index (24.90 ± 3.17 kg/m2), or BPAQ scores (7.86 ±
1.30) were found among the three groups. The cLBP group (5.57 ± 3.92) had
significantly greater RMDQ scores than the hxLBP group (1.21 ± 1.42). No differences
Texas Tech University Health Sciences Center, Troy L. Hooper, May 2015
136
in FABQ scores were observed between the two groups (cLBP = 20.79 ± 8.60; hxLBP =
14.93 ± 10.72). Because of equipment and technical errors, we were forced to omit EMG
data for the MIO in two subjects, the MEO in seven, the GMed in one, the VM in one,
and the VL in 11 subjects. In addition, all ankle angles and knee transverse plane
rotations for one subject were omitted because these values were over 3 SD above the
mean joint angles.
Anterior Reach
In the ANT direction no between groups differences were observed for reach
distance (Figure 5.1) or the EMG variables (Table 5.1). For the kinematic variables,
there was a significant group effect (Brown-Forsythe p = .014) at the ankle in the sagittal
plane. Preplanned comparisons showed that ankle dorsiflexion was 5.65° greater in the
cLBP group (p = .029) and 5.98° greater in the hxLBP (p = .016) group compared to the
control group. In addition, a trend with a large effect size (Table 5.2) towards decreased
trunk flexion in the cLBP (-8.28°) and hxLBP (-6.55°) groups compared to the control
group (2.30°) was observed (Brown-Forsythe p = .054).
Posterolateral Reach
For PL reach, a significant difference was found for reach distance (p = .002),
where the control group produced a significantly greater reach value (103.19 cm) versus
the cLBP group (94.62 cm, p = .011) and hxLBP group (91.64 cm, p = .001) (Figure 5.1).
No significant (p > .05) differences in muscle activity were found (Table 5.2). For the
kinematic variables, a significant group effect for trunk flexion was found (p = .023)
(Table 5.3). Follow-up analysis showed that the control group demonstrated significantly
Texas Tech University Health Sciences Center, Troy L. Hooper, May 2015
137
greater trunk flexion versus the cLBP group (mean difference = 13.84°, p = .027) and
hxLBP group (mean difference = 15.93°, p = .012). In addition, there was a significant
group difference for ankle dorsiflexion (p = .040). Preplanned contrast testing found that
ankle dorsiflexion was greater in the cLBP (mean difference = 3.31°, p = .047) and
hxLBP (mean difference = 4.02°, p = .017) groups compared to control.
Posteromedial Reach
Posteromedial reach distances were significantly different between the groups (p
= .003). The control group reach distance (107.14 cm) was greater than the cLBP (99.50
cm, p = .007) and hxLBP groups (97.91 cm, p = .001) (Figure 5.1). No differences in
EMG activity were observed for the PM direction (Table 5.2). Kinematically, there was
a significant difference in trunk flexion (p = .043), where the hxLBP group (p = .015) had
14.46° less flexion than the control group, and the cLBP group showed a trend in the
same direction (mean difference = 10.44°, p = .075). There was a trend with a large
effect size (Table 5.4) toward increased ankle dorsiflexion in the cLBP (mean difference
= 2.68°) and hxLBP (mean difference = 4.88°) groups compared to the control group (p =
.061).
DISCUSSION
The Y-Balance Test is used to detect dynamic balance deficits in individuals with
a variety of lower extremity injuries. It’s usefulness for revealing these deficits in LBP
populations is not as well understood. In addition, the lower extremity biomechanical
changes that may accompany LBP are not known. Our study examined differences in Y-
Balance Test scores in people with current LBP and a LBP history compared to a healthy
Texas Tech University Health Sciences Center, Troy L. Hooper, May 2015
138
control group. In addition, we analyzed muscle activity and 3-dimensional movement
patterns of the trunk and lower extremities during this test. The results validate Y-
Balance Test use in these populations and provide evidence that compensatory
movements may occur in these two populations.
Reach distances differed between the control and LBP groups. The cLBP and
hxLBP subjects had significantly decreased PL and PM reach distances compared to the
control group, but ANT reach distances did not differ. This finding is consistent with
earlier research in individuals with chronic LBP. However, Ganesh et al. (2014) found
that ANT reach distances are limited in subjects with LBP, while the current study did
not find a difference in the ANT direction. This is likely due to subject classification or
testing method differences (Fullam, Caulfield, Coughlan, & Delahunt, 2014).
Our hypothesis that the two LBP groups would exhibit diminished trunk and
lower extremity control during the Y-Balance Test compared to a healthy control group
was partially supported. Muscle activity did not differ between groups, but movement
patterns were affected at the trunk and ankle in the two LBP groups. The large effect
sizes and low powers observed with the nonsignificant trends suggest that the sample size
was too small to find significant differences for these variables. Increasing the sample
size may result in significant differences for these variables.
During Y-Balance Test performance, the body’s COM moves outside its base of
support, requiring greater dynamic balance to complete the test without falling. Posterior
reach is accomplished by hip extension and is increased with posterior pelvic tilt and
trunk flexion. Low back pain sufferers may attempt to avoid this trunk flexion because of
pain or balance impairment (Kaigle, Wessberg, & Hansson, 1998; Shum, Crosbie, & Lee,
Texas Tech University Health Sciences Center, Troy L. Hooper, May 2015
139
2005) and instead incorporate increased ankle dorsiflexion on the stance limb to improve
reach distances. Because posterior reach distances are not associated with pain level
(Study-1), impaired balance may be the cause of the decreased trunk flexion. During the
ANT reach trials, the COM moves anteriorly, and an individual with decreased balance
may try to compensate for this by extending the trunk and moving the COM back
posteriorly. Since forward leaning is not possible, ankle dorsiflexion may then be used to
improve reach distances. These results provide evidence that the cLBP and hxLBP
subjects suffered from impaired dynamic balance but could compensate for this
impairment during ANT reach by increasing ankle dorsiflexion. However, this strategy
was unsuccessful during the posterior trials, resulting in decreased reach distances in
these two groups.
No significant differences in muscle activity were found. This finding differs
from earlier studies that found increased or reduced trunk muscle activity in people with
LBP (Ng et al., 2002; Silfies, Squillante, Maurer, Westcott, & Karduna, 2005). The
control group likely used gravity to flex the trunk and did not require increased eccentric
activation of the SES and MES to control this motion. Comparisons of the various trunk
muscles’ relative activity were not analyzed, so we cannot determine whether the
distribution of trunk muscle activity differed between groups. The lack of lower limb
muscle differences between the control and LBP groups reflects the fact that joint angles
were similar across the groups as well. The differences in ankle dorsiflexion suggest that
lower leg activity may differ between these groups, but these muscles were not recorded.
Texas Tech University Health Sciences Center, Troy L. Hooper, May 2015
140
Limitations
There are several limitations to the current study. First, the sample size may have
limited the number of statistically significant results. This is especially true for the
kinematic variables, where differences between several variables with moderate to large
effect sizes were non-significant. Future studies should consider a smaller effect size
when performing a priori power analyses. Second, the average pain level of the cLBP
group was relatively low, and the low RMDQ and FABQ scores indicate that any
impairments resulting from their pain was minimal. Subjects with greater pain levels
may have experienced greater changes in the variables studied. Third, because of the
complications associated with using maximal contraction in LBP populations, we
normalized all EMG activity to a submaximal reference contraction. This resulted in
high variability for the normalized EMG values and a non-normal statistical distribution.
Future studies might limit this problem by using maximum voluntary contractions,
particularly for the lower limb muscles. Finally, although Y-Balance Test reach distances
provide a simple method of evaluating dynamic balance, other factors such as strength or
flexibility may have contributed to the impaired performance seen in the cLBP and
hxLBP groups. Future studies could use center of pressure measurements to better
objectify balance deficits and relate these findings to biomechanical changes in these
populations.
CONCLUSION
Compared to healthy subjects, individuals in the cLBP and hxLBP groups
experienced decreased PM and PL reach distances, reflecting dynamic balance deficits
during these movements. These subjects attempted to compensate for their balance
Texas Tech University Health Sciences Center, Troy L. Hooper, May 2015
141
deficits by adopting a more rigid, upright trunk strategy and instead relied on greater
ankle dorsiflexion on the stance limb to improve reach distance. This strategy permitted
increased reach distances in the ANT direction, but not posteriorly. These findings
provide further evidence of balance deficits and altered lower limb movement strategies
in people with LBP. Improving trunk flexion during functional activities may improve
dynamic balance in LBP sufferers.
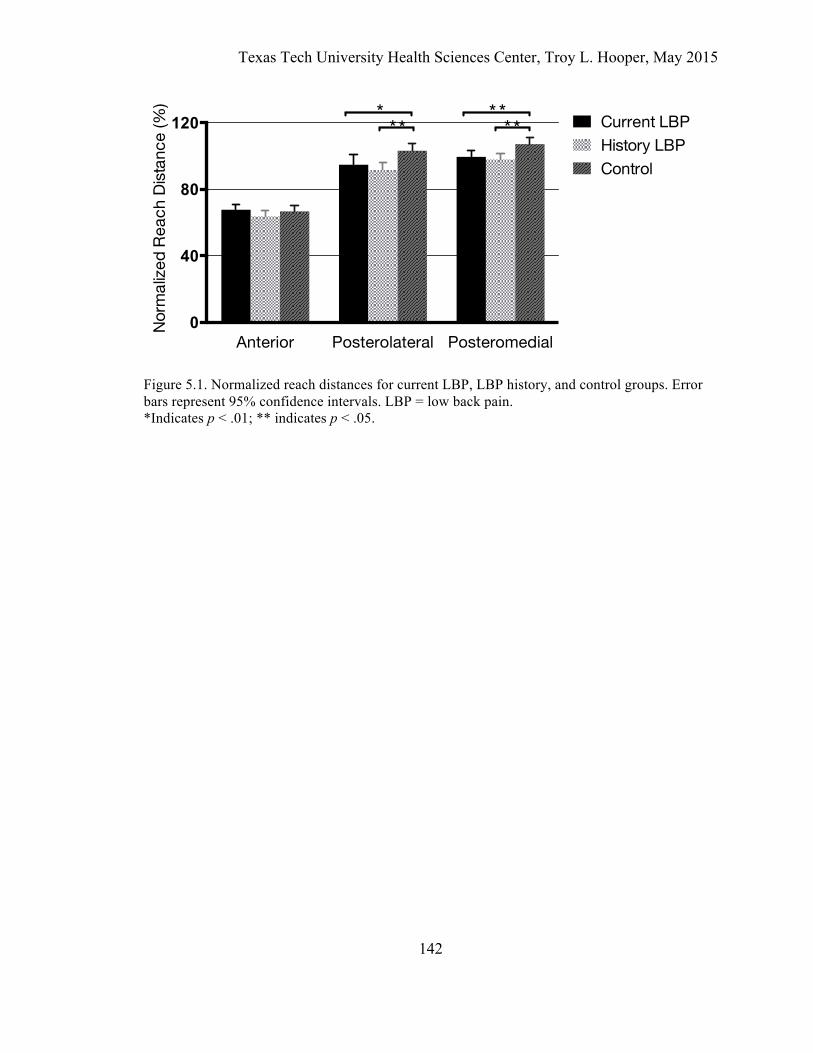
Texas Tech University Health Sciences Center, Troy L. Hooper, May 2015
142
Figure 5.1. Normalized reach distances for current LBP, LBP history, and control groups. Error bars represent 95% confidence intervals. LBP = low back pain. *Indicates p < .01; ** indicates p < .05.
Anterior Posterolateral Posteromedial0
40
80
120
Norm
alize
d Re
ach
Dist
ance
(%)
Current LBPHistory LBPControl
**
*** *
*
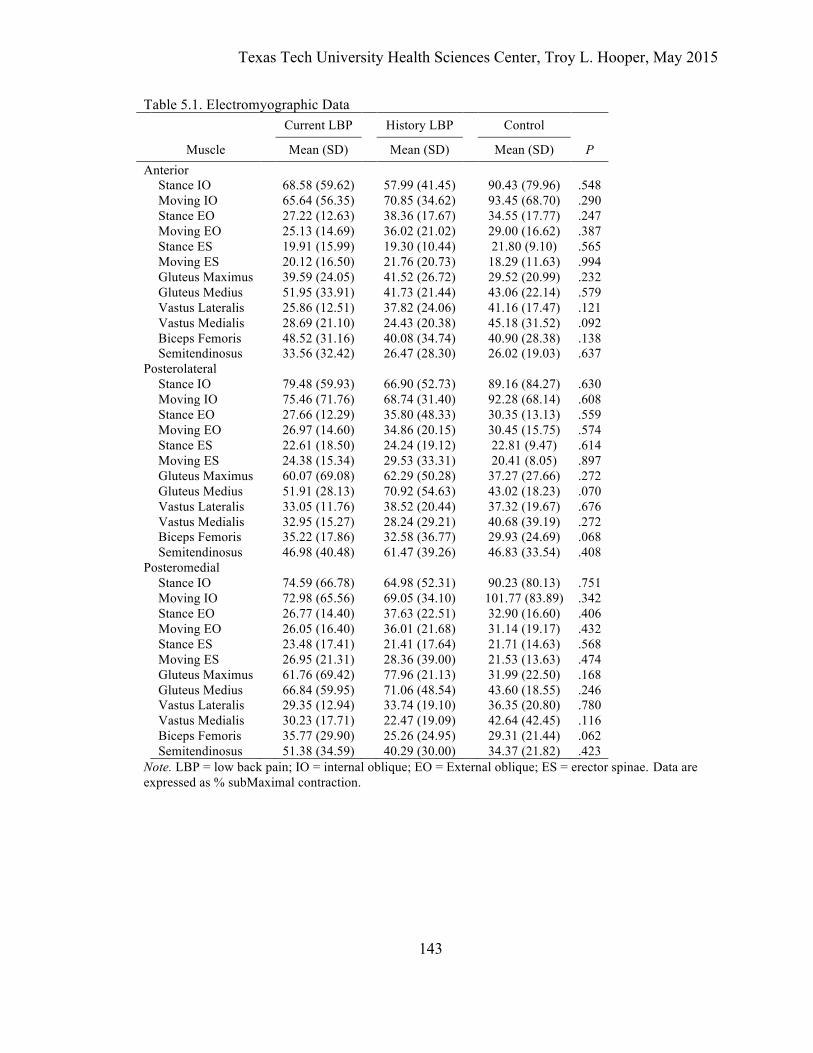
Texas Tech University Health Sciences Center, Troy L. Hooper, May 2015
143
Table 5.1. Electromyographic Data
Current LBP History LBP Control Muscle Mean (SD) Mean (SD) Mean (SD) P Anterior Stance IO 68.58 (59.62) 57.99 (41.45) 90.43 (79.96) .548 Moving IO 65.64 (56.35) 70.85 (34.62) 93.45 (68.70) .290 Stance EO 27.22 (12.63) 38.36 (17.67) 34.55 (17.77) .247 Moving EO 25.13 (14.69) 36.02 (21.02) 29.00 (16.62) .387 Stance ES 19.91 (15.99) 19.30 (10.44) 21.80 (9.10) .565 Moving ES 20.12 (16.50) 21.76 (20.73) 18.29 (11.63) .994 Gluteus Maximus 39.59 (24.05) 41.52 (26.72) 29.52 (20.99) .232 Gluteus Medius 51.95 (33.91) 41.73 (21.44) 43.06 (22.14) .579 Vastus Lateralis 25.86 (12.51) 37.82 (24.06) 41.16 (17.47) .121 Vastus Medialis 28.69 (21.10) 24.43 (20.38) 45.18 (31.52) .092 Biceps Femoris 48.52 (31.16) 40.08 (34.74) 40.90 (28.38) .138 Semitendinosus 33.56 (32.42) 26.47 (28.30) 26.02 (19.03) .637 Posterolateral Stance IO 79.48 (59.93) 66.90 (52.73) 89.16 (84.27) .630 Moving IO 75.46 (71.76) 68.74 (31.40) 92.28 (68.14) .608 Stance EO 27.66 (12.29) 35.80 (48.33) 30.35 (13.13) .559 Moving EO 26.97 (14.60) 34.86 (20.15) 30.45 (15.75) .574 Stance ES 22.61 (18.50) 24.24 (19.12) 22.81 (9.47) .614 Moving ES 24.38 (15.34) 29.53 (33.31) 20.41 (8.05) .897 Gluteus Maximus 60.07 (69.08) 62.29 (50.28) 37.27 (27.66) .272 Gluteus Medius 51.91 (28.13) 70.92 (54.63) 43.02 (18.23) .070 Vastus Lateralis 33.05 (11.76) 38.52 (20.44) 37.32 (19.67) .676 Vastus Medialis 32.95 (15.27) 28.24 (29.21) 40.68 (39.19) .272 Biceps Femoris 35.22 (17.86) 32.58 (36.77) 29.93 (24.69) .068 Semitendinosus 46.98 (40.48) 61.47 (39.26) 46.83 (33.54) .408 Posteromedial Stance IO 74.59 (66.78) 64.98 (52.31) 90.23 (80.13) .751 Moving IO 72.98 (65.56) 69.05 (34.10) 101.77 (83.89) .342 Stance EO 26.77 (14.40) 37.63 (22.51) 32.90 (16.60) .406 Moving EO 26.05 (16.40) 36.01 (21.68) 31.14 (19.17) .432 Stance ES 23.48 (17.41) 21.41 (17.64) 21.71 (14.63) .568 Moving ES 26.95 (21.31) 28.36 (39.00) 21.53 (13.63) .474 Gluteus Maximus 61.76 (69.42) 77.96 (21.13) 31.99 (22.50) .168 Gluteus Medius 66.84 (59.95) 71.06 (48.54) 43.60 (18.55) .246 Vastus Lateralis 29.35 (12.94) 33.74 (19.10) 36.35 (20.80) .780 Vastus Medialis 30.23 (17.71) 22.47 (19.09) 42.64 (42.45) .116 Biceps Femoris 35.77 (29.90) 25.26 (24.95) 29.31 (21.44) .062 Semitendinosus 51.38 (34.59) 40.29 (30.00) 34.37 (21.82) .423 Note. LBP = low back pain; IO = internal oblique; EO = External oblique; ES = erector spinae. Data are expressed as % subMaximal contraction.
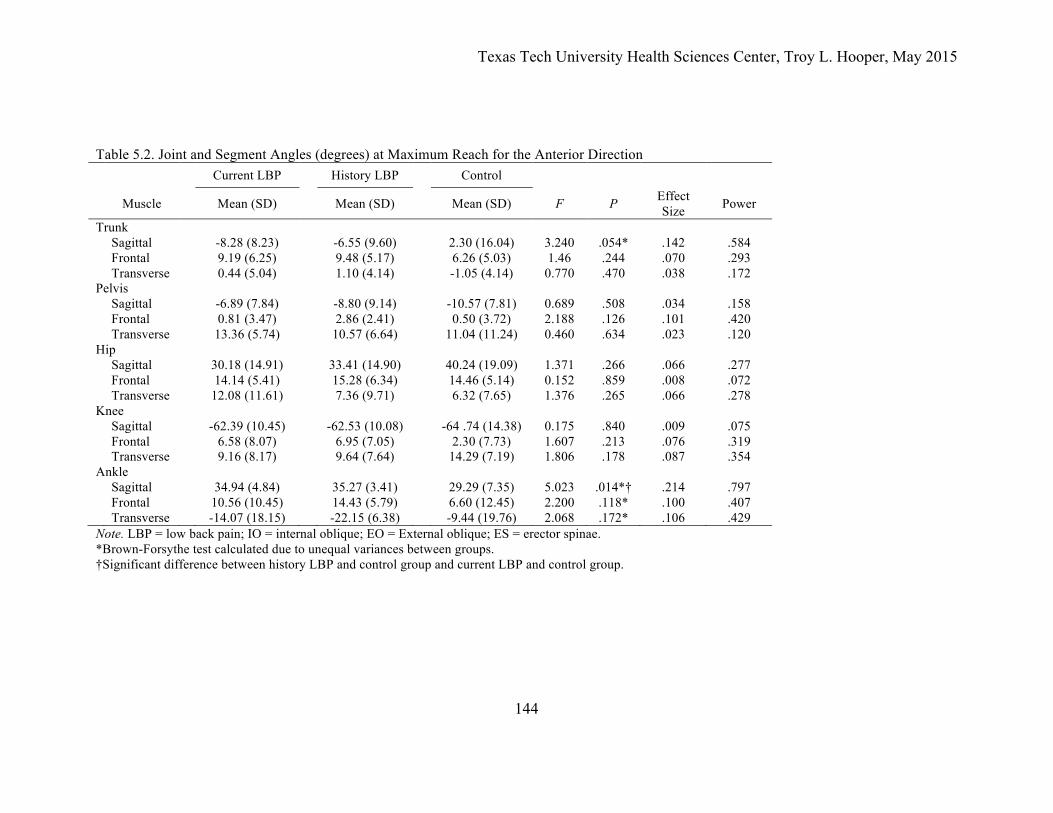
Texas Tech University Health Sciences Center, Troy L. Hooper, May 2015
144
Table 5.2. Joint and Segment Angles (degrees) at Maximum Reach for the Anterior Direction
Current LBP History LBP Control
Muscle Mean (SD) Mean (SD) Mean (SD) F P Effect Size Power
Trunk Sagittal -8.28 (8.23) -6.55 (9.60) 2.30 (16.04) 3.240 .054* .142 .584 Frontal 9.19 (6.25) 9.48 (5.17) 6.26 (5.03) 1.46 .244 .070 .293 Transverse 0.44 (5.04) 1.10 (4.14) -1.05 (4.14) 0.770 .470 .038 .172 Pelvis Sagittal -6.89 (7.84) -8.80 (9.14) -10.57 (7.81) 0.689 .508 .034 .158 Frontal 0.81 (3.47) 2.86 (2.41) 0.50 (3.72) 2.188 .126 .101 .420 Transverse 13.36 (5.74) 10.57 (6.64) 11.04 (11.24) 0.460 .634 .023 .120 Hip Sagittal 30.18 (14.91) 33.41 (14.90) 40.24 (19.09) 1.371 .266 .066 .277 Frontal 14.14 (5.41) 15.28 (6.34) 14.46 (5.14) 0.152 .859 .008 .072 Transverse 12.08 (11.61) 7.36 (9.71) 6.32 (7.65) 1.376 .265 .066 .278 Knee Sagittal -62.39 (10.45) -62.53 (10.08) -64 .74 (14.38) 0.175 .840 .009 .075 Frontal 6.58 (8.07) 6.95 (7.05) 2.30 (7.73) 1.607 .213 .076 .319 Transverse 9.16 (8.17) 9.64 (7.64) 14.29 (7.19) 1.806 .178 .087 .354 Ankle Sagittal 34.94 (4.84) 35.27 (3.41) 29.29 (7.35) 5.023 .014*† .214 .797 Frontal 10.56 (10.45) 14.43 (5.79) 6.60 (12.45) 2.200 .118* .100 .407 Transverse -14.07 (18.15) -22.15 (6.38) -9.44 (19.76) 2.068 .172* .106 .429 Note. LBP = low back pain; IO = internal oblique; EO = External oblique; ES = erector spinae. *Brown-Forsythe test calculated due to unequal variances between groups. †Significant difference between history LBP and control group and current LBP and control group.
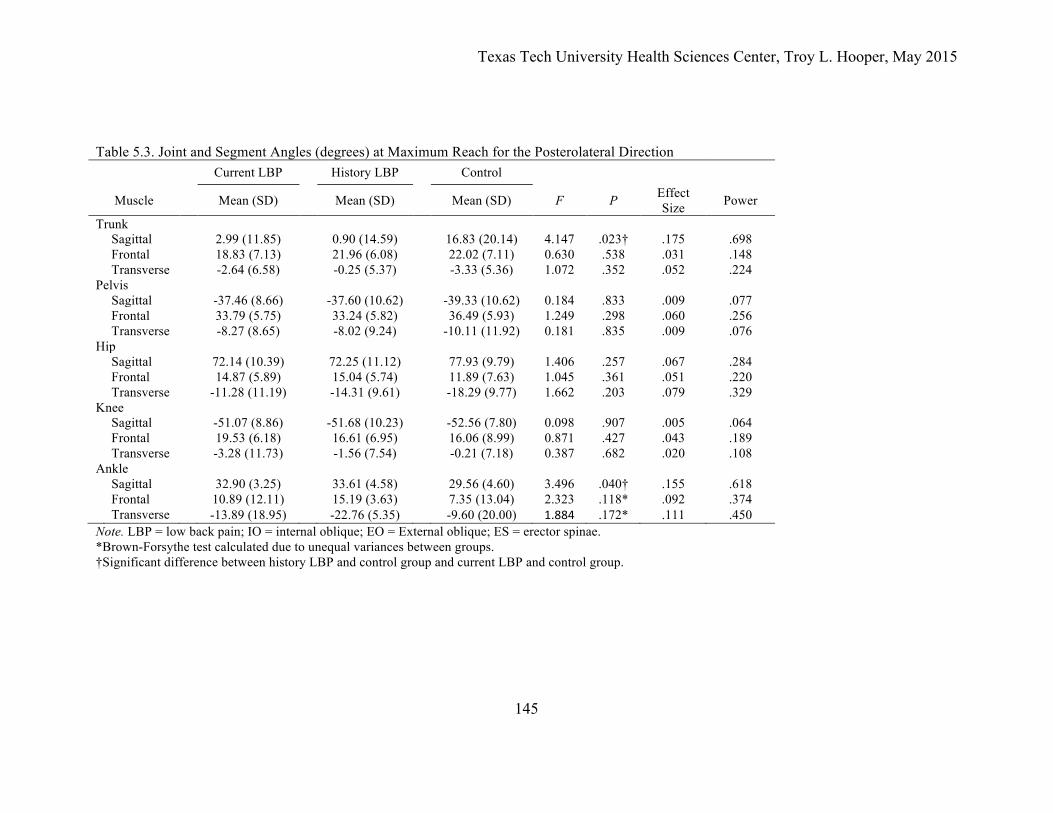
Texas Tech University Health Sciences Center, Troy L. Hooper, May 2015
145
Table 5.3. Joint and Segment Angles (degrees) at Maximum Reach for the Posterolateral Direction Current LBP History LBP Control
Muscle Mean (SD) Mean (SD) Mean (SD) F P Effect Size Power
Trunk Sagittal 2.99 (11.85) 0.90 (14.59) 16.83 (20.14) 4.147 .023† .175 .698 Frontal 18.83 (7.13) 21.96 (6.08) 22.02 (7.11) 0.630 .538 .031 .148 Transverse -2.64 (6.58) -0.25 (5.37) -3.33 (5.36) 1.072 .352 .052 .224 Pelvis Sagittal -37.46 (8.66) -37.60 (10.62) -39.33 (10.62) 0.184 .833 .009 .077 Frontal 33.79 (5.75) 33.24 (5.82) 36.49 (5.93) 1.249 .298 .060 .256 Transverse -8.27 (8.65) -8.02 (9.24) -10.11 (11.92) 0.181 .835 .009 .076 Hip Sagittal 72.14 (10.39) 72.25 (11.12) 77.93 (9.79) 1.406 .257 .067 .284 Frontal 14.87 (5.89) 15.04 (5.74) 11.89 (7.63) 1.045 .361 .051 .220 Transverse -11.28 (11.19) -14.31 (9.61) -18.29 (9.77) 1.662 .203 .079 .329 Knee Sagittal -51.07 (8.86) -51.68 (10.23) -52.56 (7.80) 0.098 .907 .005 .064 Frontal 19.53 (6.18) 16.61 (6.95) 16.06 (8.99) 0.871 .427 .043 .189 Transverse -3.28 (11.73) -1.56 (7.54) -0.21 (7.18) 0.387 .682 .020 .108 Ankle Sagittal 32.90 (3.25) 33.61 (4.58) 29.56 (4.60) 3.496 .040† .155 .618 Frontal 10.89 (12.11) 15.19 (3.63) 7.35 (13.04) 2.323 .118* .092 .374 Transverse -13.89 (18.95) -22.76 (5.35) -9.60 (20.00) 1.884 .172* .111 .450 Note. LBP = low back pain; IO = internal oblique; EO = External oblique; ES = erector spinae. *Brown-Forsythe test calculated due to unequal variances between groups. †Significant difference between history LBP and control group and current LBP and control group.
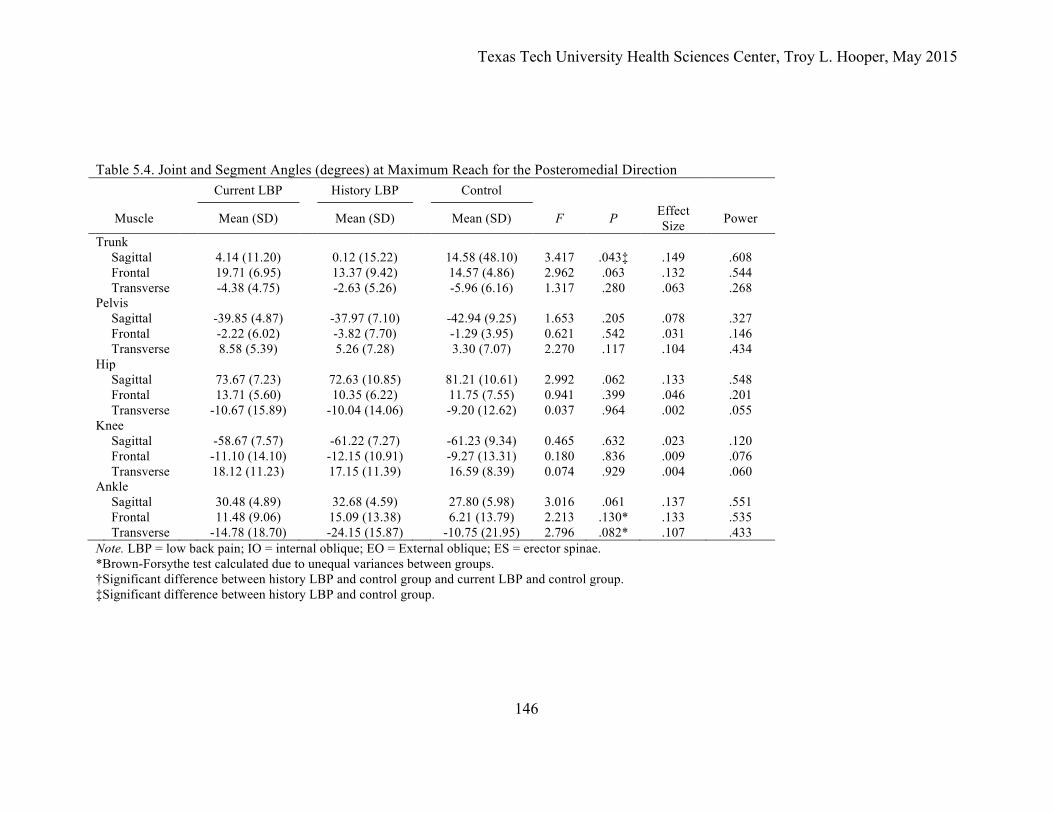
Texas Tech University Health Sciences Center, Troy L. Hooper, May 2015
146
Table 5.4. Joint and Segment Angles (degrees) at Maximum Reach for the Posteromedial Direction
Current LBP History LBP Control
Muscle Mean (SD) Mean (SD) Mean (SD) F P Effect Size Power
Trunk Sagittal 4.14 (11.20) 0.12 (15.22) 14.58 (48.10) 3.417 .043‡ .149 .608 Frontal 19.71 (6.95) 13.37 (9.42) 14.57 (4.86) 2.962 .063 .132 .544 Transverse -4.38 (4.75) -2.63 (5.26) -5.96 (6.16) 1.317 .280 .063 .268 Pelvis Sagittal -39.85 (4.87) -37.97 (7.10) -42.94 (9.25) 1.653 .205 .078 .327 Frontal -2.22 (6.02) -3.82 (7.70) -1.29 (3.95) 0.621 .542 .031 .146 Transverse 8.58 (5.39) 5.26 (7.28) 3.30 (7.07) 2.270 .117 .104 .434 Hip Sagittal 73.67 (7.23) 72.63 (10.85) 81.21 (10.61) 2.992 .062 .133 .548 Frontal 13.71 (5.60) 10.35 (6.22) 11.75 (7.55) 0.941 .399 .046 .201 Transverse -10.67 (15.89) -10.04 (14.06) -9.20 (12.62) 0.037 .964 .002 .055 Knee Sagittal -58.67 (7.57) -61.22 (7.27) -61.23 (9.34) 0.465 .632 .023 .120 Frontal -11.10 (14.10) -12.15 (10.91) -9.27 (13.31) 0.180 .836 .009 .076 Transverse 18.12 (11.23) 17.15 (11.39) 16.59 (8.39) 0.074 .929 .004 .060 Ankle Sagittal 30.48 (4.89) 32.68 (4.59) 27.80 (5.98) 3.016 .061 .137 .551 Frontal 11.48 (9.06) 15.09 (13.38) 6.21 (13.79) 2.213 .130* .133 .535 Transverse -14.78 (18.70) -24.15 (15.87) -10.75 (21.95) 2.796 .082* .107 .433 Note. LBP = low back pain; IO = internal oblique; EO = External oblique; ES = erector spinae. *Brown-Forsythe test calculated due to unequal variances between groups. †Significant difference between history LBP and control group and current LBP and control group. ‡Significant difference between history LBP and control group.
Texas Tech University Health Sciences Center, Troy L. Hooper, May 2015
147
REFERENCES
Baecke, J. A., Burema, J., & Frijters, J. E. (1982). A short questionnaire for the measurement of habitual physical activity in epidemiological studies. The American Journal of Clinical Nutrition, 36(5), 936–942.
Barbero, M., Merletti, R., & Rainoldi, A. (2012). Atlas of muscle innervation zones: understanding surface electromyography and its applications. Milan: Springer.
Bell, A. L., Brand, R. A., & Pedersen, D. R. (1989). Prediction of hip joint centre location from external landmarks. Human Movement Science, 8(1), 3–16.
Borghuis, J., Hof, A. L., & Lemmink, K. A. P. M. (2008). The importance of sensory-motor control in providing core stability: Implications for measurement and training. Sports Medicine, 38(11), 893–916.
Dankaerts, W., O'Sullivan, P. B., Burnett, A., Straker, L. M., & Danneels, L. A. (2004). Reliability of EMG measurements for trunk muscles during maximal and sub-maximal voluntary isometric contractions in healthy controls and CLBP patients. Journal of Electromyography and Kinesiology, 14(3), 333–342.
Field, A. (2013). Discovering Statistics Using IBM SPSS Statistics (4 ed.). London, England: Sage.
Fong, D. T.-P., Hong, Y., & Li, J.-X. (2008). Lower extremity preventative measures for slips - Joint moments and myoelectric analysis. Ergonomics, 51(12), 1830–1846.
Freeman, M. D., Woodham, A. W., & Woodham, M. A. (2010). The role of the lumbar multifidus in chronic low back pain: A review. PM&R, 2(2), 142–146.
Fullam, K., Caulfield, B., Coughlan, G. F., & Delahunt, E. (2014). Kinematic analysis of selected reach directions of the Star Excursion Balance Test compared with the Y-Balance Test. Journal of Sport Rehabilitation, 23(1), 27–35.
Ganesh, G. S., Ganesh, G. S., Chhabra, D., Chhabra, D., & Mrityunjay, K. (2014). Efficacy of the star excursion balance test in detecting reach deficits in subjects with chronic low back pain. Physiotherapy Research International.
Gribble, P. A., Hertel, J., & Plisky, P. (2012). Using the Star Excursion Balance Test to assess dynamic postural-control deficits and outcomes in lower extremity injury: a literature and systematic review. Journal of Athletic Training, 47(3), 339–357.
Haddas, R., James, C. R., & Hooper, T. L. (2014). Lower extremity fatigue, sex, and landing performance in a population with recurrent low back pain. Journal of Athletic Training, 50(4), 378–384.
Hart, J. M., Fritz, J. M., Kerrigan, D. C., Saliba, E. N., Gansneder, B. M., & Ingersoll, C. D. (2006a). Reduced quadriceps activation after lumbar paraspinal fatiguing exercise. Journal of Athletic Training, 41, 79–86.
Hart, J. M., Kerrigan, D. C., Fritz, J. M., Saliba, E. N., Gansneder, B. M., & Ingersoll, C. D. (2006b). Contribution of hamstring fatigue to quadriceps inhibition following
Texas Tech University Health Sciences Center, Troy L. Hooper, May 2015
148
lumbar extension exercise. Journal of Sports Science and Medicine, 5, 70–79. Hodges, P. W., & Richardson, C. A. (1998). Delayed postural contraction of transversus
abdominis in low back pain associated with movement of the lower limb. Journal of Spinal Disorders, 11(1), 46–56.
Hodges, P. W., & Tucker, K. (2011). Moving differently in pain: A new theory to explain the adaptation to pain. Pain, 152(S), S90–S98.
Hungerford, B., Gilleard, W., & Hodges, P. W. (2003). Evidence of altered lumbopelvic muscle recruitment in the presence of sacroiliac joint pain. Spine, 28(14), 1593–1600.
Itz, C. J., Geurts, J. W., van Kleef, M., & Nelemans, P. (2012). Clinical course of non-specific low back pain: A systematic review of prospective cohort studies set in primary care. European Journal of Pain, 17(1), 5–15.
Jacob, T., Baras, M., Zeev, A., & Epstein, L. (2001). Low back pain: Reliability of a set of pain measurement tools. Archives of Physical Medicine and Rehabilitation, 82(6), 735–742.
Kaigle, A. M., Wessberg, P., & Hansson, T. H. (1998). Muscular and kinematic behavior of the lumbar spine during flexion-extension. Journal of Spinal Disorders, 11(2), 163–174.
Kankaanpää, M., Taimela, S., Laaksonen, D., Hänninen, O., & Airaksinen, O. (1998). Back and hip extensor fatigability in chronic low back pain patients and controls, 79, 412–417.
Kibler, W. B., Press, J., & Sciascia, A. (2006). The role of core stability in athletic function. Sports Medicine, 36(3), 189–198.
Larivière, C., Arsenault, A. B., Gravel, D., Gagnon, D., & Loisel, P. (2003). Surface electromyography assessment of back muscle intrinsic properties. Journal of Electromyography and Kinesiology, 13, 305–318.
Leetun, D. T., Ireland, M. L., Willson, J. D., Ballantyne, B. T., & Davis, I. M. (2004). Core stability measures as risk factors for lower extremity injury in athletes. Medicine and Science in Sports and Exercise, 36, 926–934.
Macdonald, D. A., Moseley, G. L., & Hodges, P. W. (2010). People with recurrent low back pain respond differently to trunk loading despite remission from symptoms. Spine, 35(7), 818–824.
Nadler, S. F., Malanga, G. A., Feinberg, J. H., Prybicien, M., Stitik, T. P., & Deprince, M. (2001). Relationship between hip muscle imbalance and occurrence of low back pain in collegiate athletes: A prospective study. American Journal of Physical Medicine and Rehabilitation, 80, 572–577.
Ng, J. K., Richardson, C. A., Parnianpour, M., & Kippers, V. (2002). EMG activity of trunk muscles and torque output during isometric axial rotation exertion: a comparison between back pain patients and matched controls. Journal of Orthopaedic Research, 20, 112–121.
Texas Tech University Health Sciences Center, Troy L. Hooper, May 2015
149
O'Sullivan, P. B. (2000). Lumbar segmental “instability”: Clinical presentation and specific stabilizing exercise management. Manual Therapy, 5(1), 2–12.
Perneger, T. V. (1998). What's wrong with Bonferroni adjustments. Bmj, 316(7139), 1236–1238.
Philippaerts, R. M., Westerterp, K. R., & Lefevre, J. (1999). Doubly labelled water validation of three physical activity questionnaires. International Journal of Sports Medicine, 20(5), 284–289.
Pirouzi, S., Hides, J. A., Richardson, C. A., Darnell, R., & Toppenberg, R. (2006). Low back pain patients demonstrate increased hip extensor muscle activity during standardized submaximal rotation efforts. Spine, 31(26), E999–E1005.
Plisky, P. J., Gorman, P. P., Butler, R. J., Kiesel, K. B., Underwood, F. B., & Elkins, B. (2009). The reliability of an instrumented device for measuring components of the star excursion balance test. North American Journal of Sports Physical Therapy, 4(2), 92–99.
Portney, L. G., & Watkins, M. P. (2009). Foundations of Clinical Research: Applications to Practice (3rd ed.). Upper Saddle River, NJ: Prentice Hall.
Roland, M., & Fairbank, J. (2000). The Roland-Morris Disability Questionnaire and the Oswestry Disability Questionnaire. Spine, 25(24), 3115–3124.
Shum, G. L., Crosbie, J., & Lee, R. Y. (2005). Effect of low back pain on the kinematics and joint coordination of the lumbar spine and hip during sit-to-stand and stand-to-sit. Spine, 30(17), 1998–2004.
Silfies, S. P., Squillante, D., Maurer, P., Westcott, S., & Karduna, A. R. (2005). Trunk muscle recruitment patterns in specific chronic low back pain populations. Clinical Biomechanics, 20, 465–473.
Sueki, D. G., Cleland, J. A., & Wainner, R. S. (2013). A regional interdependence model of musculoskeletal dysfunction: research, mechanisms, and clinical implications. Journal of Manual and Manipulative Therapy, 21(2), 90–102.
Suter, E., & Lindsay, D. (2001). Back muscle fatigability is associated with knee extensor inhibition in subjects with low back pain. Spine, 26(16), E361–E366.
Thomas, J. S., France, C. R., Sha, D., & Wiele, N. V. (2008). The influence of pain-related fear on peak muscle activity and force generation during maximal isometric trunk exertions. Spine, 33(11), E342–E348.
Waddell, G., Newton, M., Henderson, I., Somerville, D., & Main, C. J. (1993). A Fear-Avoidance Beliefs Questionnaire (FABQ) and the role of fear-avoidance beliefs in chronic low back pain and disability. Pain, 52(2), 157–168.

Texas Tech University Health Sciences Center, Troy L. Hooper, May 2015
150
CHAPTER VI
THE EFFECT OF A VOLITIONAL PREEMPTIVE ABDOMINAL CONTRACTION ON TRUNK AND LOWER LIMB BIOMECHANICS IN PEOPLE WITH LOW BACK
PAIN
ABSTRACT
Objective: To determine whether ABM performance changes trunk and lower extremity
neuromuscular and kinematic variables during the Y-Balance Test and whether these
changes are different in individuals with current LBP (cLBP) and a LBP history (hxLBP)
compared to a healthy control group.
Design: Mixed factor, repeated measures design.
Setting: Research laboratory
Participants: Forty-two subjects (8 females and 6 males per group; age 30.93 ± 8.24 yr)
were divided into control, hxLBP, and cLBP groups.
Methods: Each subject performed three Y-Balance Test trials in an anterior (ANT),
posterior medial (PM) and posterior lateral (PL) reach direction without ABM and three
trials in each direction with ABM. Reach distances relative to leg length were recorded,
and electromyography of three stance- and moving-side trunk muscles was collected,
along with six stance-limb hip and thigh muscles. Additionally, trunk, pelvis, and stance-
limb 3-dimensional kinematics were collected.
Main Outcome Measurements: Separate 3 x 2 mixed repeated measures ANOVAs were
used to determine differences for each dependent variable.
Texas Tech University Health Sciences Center, Troy L. Hooper, May 2015
151
Results: Abdominal muscle activity increased with ABM performance, and, in general,
lower extremity muscle activity significantly decreased. Additionally, ABM resulted in
several trunk and lower extremity kinematic changes that bring these regions into more
optimal alignment and control for lower extremity movements. These changes were most
prominent in the control group. ABM performance did not change reach distances.
Conclusion: All groups maintained the ABM during the task. Decreased lower extremity
muscle activity may have been the result of a more stable proximal pelvis during the
ABM condition. The ABM can be performed without impairing postural control or
functional lower extremity performance. Individuals with LBP or a LBP history may
benefit from ABM training.
Texas Tech University Health Sciences Center, Troy L. Hooper, May 2015
152
INTRODUCTION
Low back pain is commonly a recurring or persistent condition. It is important to
understand the mechanisms that contribute to this recurrence in order to develop effective
management strategies that can address incidence, severity and consequences. People
with LBP develop neuromuscular and biomechanical changes in the trunk, pelvis, and
lower extremities. The spine and pelvis are found in the center of the functional kinetic,
providing a stable proximal base for the distal extremities during functional tasks (Kibler,
Press, & Sciascia, 2006; Leetun, Ireland, Willson, Ballantyne, & Davis, 2004). Impaired
trunk muscle neuromuscular control in those with LBP may create an unstable foundation
for the lower extremities to develop or resist force. According to the regional
interdependence model (Sueki, Cleland, & Wainner, 2013), impairments in one body
region may lead to injury in proximal or distal areas. Alterations in proximal lower
quarter kinetic chain operation may increase injury risk at more distal regions.
Pre-programmed muscle activations help create the stable proximal base
necessary for efficient distal kinetic chain mobility. This optimal kinetic linkage reduces
joint forces and can help reduce abnormal movements of the distal segments. However,
this muscle activity is delayed in those with LBP (Hodges & Richardson, 1996; Leinonen
et al., 2001) and a sufficient protective response may not occur in time to protect the
spine and control pelvic motion, thus increasing injury risk. Since voluntarily contracting
the trunk muscles increases lumbopelvic stability (Grenier & McGill, 2007; Pel, Spoor,
Pool-Goudzwaard, Hoek van Dijke, & Snijders, 2008; Stanton & Kawchuk, 2008; Vera-
Garcia, Elvira, Brown, & McGill, 2007), it may be advantageous for individuals to
perform a volitional preemptive abdominal contraction (VPAC) in an attempt to increase
Texas Tech University Health Sciences Center, Troy L. Hooper, May 2015
153
overall spine stability, improve pelvic and lower extremity biomechanical movement
patterns, and reduce pain.
The abdominal bracing maneuver (ABM) is a commonly used VPAC strategy that
can improve lumbar spine stability and reduce pelvic motion in individuals with spine
dysfunction. It is a global contraction of all the abdominal flexors and lumbar extensors,
where no appreciable movement occurs in the abdominal wall during the activation
(Grenier & McGill, 2007). In addition to enhancing lumbopelvic stability, VPAC
maneuvers such as the ABM may influence lower extremity control parameters, since
pelvic control is influenced by trunk muscle activity through their attachments to the
pelvis (Haddas et al., 2013; Shirey et al., 2012).
Abdominal and lumbar paraspinal neuromuscular changes in individuals with
recurrent LBP may lead to clinical instability and contribute to further LBP episodes.
Moreover, the effect of VPAC performance on lower limb movement patterns is not
clearly understood. Therefore, the purpose of this study was to determine the effects of
ABM performance on reach distances and neuromuscular and kinematic performance
during the Y-Balance Test, a simple clinical test of dynamic balance capable of detecting
balance deficits in a LBP population (Ganesh, Ganesh, Chhabra, Chhabra, & Mrityunjay,
2014). The ability of VPAC strategies to improve lumbar segmental stiffness and
lumbopelvic stability led us to hypothesize that the addition of an ABM strategy would
improve lower extremity control parameters without affecting reach distances.
Texas Tech University Health Sciences Center, Troy L. Hooper, May 2015
154
METHODS
Experimental Design
A two factor mixed repeated measures design was used to examine the effects of a
preemptive ABM on trunk, pelvic, and lower extremity control variables during the Y-
Balance Test and determine whether these effects differ in cLBP, hxLBP, and control
groups. Interactions and main effects for differences between subject groups (control
versus cLBP versus hxLBP) and abdominal contraction condition (ABM versus no
ABM) were examined.
Subjects
An a priori power analysis determined that for a desired power of 80% and α =
0.05, a sample size of 14 subjects per group was required. A total of 42 subjects (8 males
and 6 per group) between the ages of 18 and 50 years old were recruited from local
rehabilitation clinics and the general public. The hxLBP group included subjects with a
history of one or more episodes of intermittent LBP with unilateral or bilateral symptoms
between T12 and the mid-thigh over the previous 18 months. These subjects had
experienced one or more of the following: (a) a severity sufficient to require medical
intervention; and/or (b) a severity sufficient to impair the subject’s ability to perform
their normal activities of daily living. At the time of testing, subjects were free of LBP
(Macdonald, Moseley, & Hodges, 2010). Criteria for inclusion in the cLBP group were
the same, except subjects presently reported a pain of ≥ 2/10 cm on a 10 cm VAS or an
average of ≥ 3/10 cm over the past week. Additionally, no radicular low back or leg pain
or neurological signs were present. The control group experienced no LBP in the
previous two years. Exclusion criteria for all groups included: (a) history of lower
Texas Tech University Health Sciences Center, Troy L. Hooper, May 2015
155
extremity pain in the previous two years; (b) history of lower extremity or lumbar spine
surgery; (c) pregnancy by self-report; (d) rheumatologic or neurological disorders; (e)
vestibular or other balance disorders, (f) inner ear, sinus, or upper respiratory infection,
(g) concussion within the previous three months, (h) history of core stabilization training
within the past year, and (i) a BMI greater than 30 30 kg/m2. The university’s
Institutional Review Board approved the study, and written consent was obtained from
each subject.
PROCEDURES
Data Collection Procedures
Prior to data collection, subjects watched a video describing the study’s data
collection procedures and explaining ABM performance. They completed a
demographics and medical history questionnaire, along with the Baecke Physical Activity
Questionnaire (BPAQ) (Baecke, Burema, & Frijters, 1982), which is a self-administered
questionnaire found to be reliable in LBP patients (Jacob, Baras, Zeev, & Epstein, 2001)
and healthy individuals (Philippaerts, Westerterp, & Lefevre, 1999). The cLBP and
hxLBP subjects completed the Roland Morris Disability Questionnaire (RMDQ) (Roland
& Fairbank, 2000), the Fear Avoidance Beliefs Questionnaire (FABQ) (Waddell,
Newton, Henderson, Somerville, & Main, 1993), and a 10 cm visual analog scale (VAS)
for recording current pain level and average pain over the past week. Next an
investigator provided ABM training (McGill, 2007). When subjects were able to perform
a proper ABM contraction, they were fitted with electrodes for EMG analysis, and ABM
contractions were confirmed visually by observing a qualitative increase in trunk muscle
activity on the EMG recording.
Texas Tech University Health Sciences Center, Troy L. Hooper, May 2015
156
Surface electromyography data were sampled at 2000 Hz using wireless (Delsys
Trigno, Boston, MA) sensors. Rectangular electrodes (27 mm x 37 mm x 15 mm) with
four 5 mm by 1 mm silver contacts were used. The overall channel noise was less than
0.75 µV with a common-mode rejection ratio greater than 80 dB and a 3 µV peak-to-peak
baseline noise. The skin was cleaned with alcohol, shaved if necessary, and then lightly
abraded to reduce impedance. Following skin preparation, surface EMG electrodes were
attached to the trunk to assess muscle activity of the stance- and moving-side external
oblique (SEO and MEO), stance- and moving-side internal oblique (SIO and MIO), and
stance- and moving-side erector spinae (SES and MES) at the L4 level. Abdominal and
ES (longissimus thoracis) data were collected to ensure proper performance of the
appropriate contractile state during each Y-Balance Test trial. A trial with proper ABM
performance exhibited increased EO and IO activity compared to trials without an ABM
contraction (Allison, Godfrey, & Robinson, 1998; Marshall, Desai, & Robbins, 2011).
Additional electrodes were placed on the stance-side lower extremity on the gluteus
maximus (GMax), gluteus medius (GMed), vastus lateralis (VL), vastus medialis (VM),
semitendinosus (ST), and biceps femoris (BF). All electrodes were placed on the muscle
bellies, avoiding muscle innervation zones (Barbero, Merletti, & Rainoldi, 2012).
Three-dimensional kinematic data for the head, trunk, and pelvis, and bilateral
upper arm, forearm, thigh, lower leg and foot segments were recorded using a VICON
Nexus (1.7.1, Denver, CO) six-camera motion analysis system sampled at 100 Hz. Only
the segmental orientations of the trunk, pelvis, thighs, lower legs, and feet were
subsequently used for analysis. Forty-one reflective markers (0.9 cm diameter) were
positioned bilaterally on the skin overlying the ventral and dorsal head, acromia, upper
Texas Tech University Health Sciences Center, Troy L. Hooper, May 2015
157
arms, lateral humeral epicondyles, lateral forearms, radial styloids, ulnar styloids,
posterior and anterior iliac spines, mid-point of iliac crests, lateral mid-segment of the
thighs, femoral epicondyles, lateral lower legs, lateral and medial malleoli, heels, and the
first, second, and fifth metatarsal heads. Four single markers were placed over the C7
and T10 spinous processes posteriorly and the jugular notch and xiphoid process
anteriorly. Additional calibration markers were placed bilaterally over the humeral and
femoral medial epicondyles and were removed following a static trial. Finally, one
marker was placed on each of the three Y-balance Test Kit reach indicators, so platform
movement could be analyzed.
Submaximal testing is commonly used for individuals with LBP, as they are not
able to produce a true maximal effort due to pain or the fear of pain (Thomas, France,
Sha, & Wiele, 2008). EMG data were normalized to a sub-maximal voluntary
contraction (subMVC). The subMVC test for the IO, EO, ES, and GMax followed
previous recommendations (Dankaerts, O'Sullivan, Burnett, Straker, & Danneels, 2004).
For the IO and EO subjects performed a bilateral hip flexion in supine. The ES and
GMax normalization trials consisted of bilateral prone hip extension. The GMed
subMVC contraction consisted of a sidelying hip abduction with the knee extended and
hip in neutral rotation until the lower extremity was parallel to the table. The VL and
VM were normalized to a bilateral squat to 90°, while the hamstrings used a standing
unilateral hamstring curl to 90° of knee flexion (Fong, Hong, & Li, 2008). Three 5 s
trials of all procedures were performed, each separated by a 30 s rest period.
Following the normalization trials, a static trial was recorded with subjects
positioned in a neutral, standing posture to create a reference for defining neutral joint
Texas Tech University Health Sciences Center, Troy L. Hooper, May 2015
158
angles. Subjects then performed the Y-Balance Test. The stance limb was the dominant
leg (i.e., kicking leg), and trials were performed with the hands placed on the hips and
without shoes. Subjects performed four practice trials in each direction prior to the
recorded trials to reduce leaning effects. Testing consisted of randomly selected trials in
the anterior (ANT), posterolateral (PL), and posteromedial (PM) directions. Subjects
performed three successful trials in each testing direction without ABM and three trials
with the ABM strategy. The Y-balance test scores, along with EMG and kinematic data,
were collected for each trial. Proper ABM activation was qualitatively confirmed using
EMG after the completion of the each trial, and a minimum of 30 s was allowed between
trials to reduce fatigue effects.
Data Reduction
A 6-degrees-of-freedom kinematic model was created using Visual 3D (C-Motion
Inc, Rockville, MD). Coordinate data were smoothed with a fourth order no-phase-shift
Butterworth low pass digital filter with a 6 Hz cutoff. The pelvis was defined relative to
the laboratory coordinate system, and the CODA pelvis orientation was used to define the
hip joint center (Bell, Brand, & Pedersen, 1989). Knee and ankle joint centers were
calculated as the midpoint of the medial and lateral joint markers. The posterior superior
iliac spine and acromion markers defined the trunk segment. The Cardan sequence x-y-z
was used for the calculation of joint and segment angles, referencing the distal segment to
the proximal segment. The following angles were described as positive values: trunk
flexion, side bend toward stance leg, and rotation toward stance leg; pelvis posterior tilt,
lateral tilt toward stance leg, and rotation toward stance leg; hip flexion, adduction, and
internal rotation; knee extension, adduction, and internal rotation; and ankle dorsiflexion,

Texas Tech University Health Sciences Center, Troy L. Hooper, May 2015
159
inversion, and internal rotation. A trial was defined as the time from initial movement of
the reach indicator’s reflective marker to the time the marker stopped, which represented
the maximum reach of the moving limb. Joint angles at maximum reach were analyzed.
All EMG signals were analyzed in Matlab (The MathWorks, Inc), where they
were band-pass filtered between 20 Hz and 400 Hz with a fourth-order, no-pass, zero-
phase-lag Butterworth filter. Large 1 Hz spikes of activity were unexpectedly observed
at 100 Hz and its subsequent harmonics in the frequency domain; therefore, a notch filter
was applied at 100 Hz and 200 Hz to eliminate this noise. For the sub-MVC
normalization trials, the average root mean square (RMS) of the final 3 s of the three
trials was calculated, and all EMG data are reported as a percentage of this value. The
RMS amplitudes of the filtered EMG data for each muscle over the entire trial were
analyzed, and average muscle activity from the beginning of the trial to the point of
maximum reach was calculated.
Statistical Analysis
Independent samples one-way analyses of variance (ANOVAs) were used to
determine any differences in demographic characteristics among the three groups, and
pain, disability level, and fear-avoidance beliefs were compared in the two LBP groups
using independent t tests. Data were tested for normality (Shapiro-Wilk test p-value >
.05, and skewness and kurtosis between -2.0 and +2.0) and homogeneity of variance
(Levene’s Test). Separate 3 x 2 mixed repeated measures ANOVAs were used to
determine differences. The between-subjects factor was group (control, cLBP, and
hxLBP). The within-subjects factor was contractile state (ABM and No ABM). In cases
of a significant interaction, simple effects analyses were tested with Bonferroni-corrected
Texas Tech University Health Sciences Center, Troy L. Hooper, May 2015
160
t tests to identify specific differences. Effect sizes were estimated using partial eta
squared (ƞp2), with ƞp
2 ≥ 0.01 indicating small, ƞp2 ≥ 0.06 medium, and ƞp
2 ≥ 0.14 large
effects (Portney & Watkins, 2009). Alpha levels were set a priori at .05 for all analyses.
No attempt to correct for multiple comparisons was made to reduce the likelihood of a
Type II error in this exploratory analysis (Perneger, 1998). All statistical analyses were
performed using SPSS Statistics, Version 22.0 (IBM, Inc, Chicago, IL).
RESULTS
Demographic results were reported in a previous study (Study-1). No statistically
significant differences in age, body mass index, or BPAQ scores were found among the
three groups. The RMDQ scores were significantly greater in the cLBP group, but
FABQ scores were not different between the two LBP groups.
Because of equipment and technical errors, we omitted EMG data for the MIO in
two subjects, the MEO in seven, the GMed in one, the VM in one, and the VL in 11
subjects. In addition, all ankle angles and knee transverse plane rotations for one subject
were omitted because these values were over 3 SD above the mean joint angles.
Normality assumptions were not violated for any of the kinematic variables; however,
only 33 of the 72 total EMG variables met at least two out of three criteria for normality
(Table 6.1). Because of this lack of normality, nonparametric Wilcoxon signed rank tests
were used to assess differences between the contraction conditions. No differences were
found between the parametric results and the Wilcoxon signed rank test. These results in
conjunction with the central limit theorem (Field, 2013), led us to report the parametric
analysis results.
Texas Tech University Health Sciences Center, Troy L. Hooper, May 2015
161
Reach distances did not significantly change with ABM performance in any of the
three reach directions (Table 6.2). The mean and SD for all EMG and kinematic
variables are located in Tables 6.3 and 6.4, respectively. Appendix E records the
ANOVA results for the kinematic and EMG variables.
Anterior Reach
In the ANT direction, there was a significant main effect for contraction of the
SIO, MIO, SEO, MEO (all p < .001), and MES (p = .048), where EMG values
significantly increased with ABM (Table 6.3). Significant (p ≤ .05) contraction-by-group
interactions were found for the GMed, (p = .028), VL (p = .046), and VM (p = .021;
Table 6.3). Follow-up simple effects analysis found that the hxLBP group increased
GMed activation with ABM (mean difference = 17.62%; p = .014), while VL (mean
difference = 9.62%; p = .004) and VM (mean difference = 17.21%; p < .001) activity
decreased in the control group only. For the kinematic variables, significant (p ≤ .05)
main effects for contraction were observed for trunk extension, where the trunk was 2.00°
less extended with ABM performance and trunk side bending toward the stance leg
(2.07° difference), anterior pelvic tilt (1.22° difference), hip internal rotation (1.07°
difference), and knee adduction (0.90° difference) all decreased with ABM (Table 6.4).
Posterolateral Reach
For PL reach, there was a significant main effect for contraction of the SIO, MIO,
SEO, and MEO (all p < .001, Table 6.5), where activity significantly increased with
ABM (Table 6.5). In addition, significant (p ≤ .05) contraction main effects were found
for the GMax (mean difference = 10.36%, p = .009), VL (mean difference = 7.89%, p <
Texas Tech University Health Sciences Center, Troy L. Hooper, May 2015
162
.001), and VM (mean difference = 8.49%, p = .001), where activity decreased in these
muscles (Table 6.5). For the kinematic variables, there were significant main effects for
contraction, where pelvic tilt toward the stance leg decreased (i.e., the pelvis remained
more level) by 1.35° (p = .047), and knee varus decreased by 1.33° (p = .040) during
trials with ABM performance (Table 6.6).
Posteromedial Reach
In the PM trials, significant main effects were found for the SIO, MIO, SEO, and
MEO (all p < .001, Table 6.7). Activity increased with ABM in each of these muscles.
Additional significant (p ≤ .05) contraction main effects were observed for VL (mean
difference = 4.59%, p = .009), VM (mean difference = 8.83%, p < .001), BF (mean
difference = 4.28%, p = .012), and ST (mean difference = 4.79%, p = .045), with activity
decreasing in all groups (Table 6.7).
Kinematically, a significant (p = .36) contraction-by-group interaction was found
for sagittal pelvic tilt (Figure 6.1). The control group had 2.06° less anterior pelvic tilt
with ABM performance (p = .007), but no differences were found in the cLBP (p = .539)
or hxLBP groups (p = .785, Table 6.8). Similarly, a significant (p ≤ .05) contraction-by-
group interaction was found for hip adduction (Figure 6.2). The control group had 1.53°
of increased hip adduction with ABM performance (p = .021), but no differences were
found in the cLBP (p = .828) or hxLBP groups (p = .165). Finally, a significant (p ≤ .05)
main effect for contraction was observed for ankle flexion, where the ankle was 0.84°
more dorsiflexed during ABM trials (Table 6.8).
Texas Tech University Health Sciences Center, Troy L. Hooper, May 2015
163
DISCUSSION
The ABM is used to improve spinal stability and through its influence on the
pelvis may affect lower extremity movement patterns. We analyzed the effect of
preemptive ABM performance on trunk and lower extremity muscle activity and
kinematics during Y-Balance Test performance. The ABM resulted in trunk and lower
extremity EMG and kinematic changes that may improve postural control and movement
strategies.
Muscle activity of the stance- and moving-side abdominal muscles significantly
increased with ABM performance in all groups. With the exception of the MES during
the ANT reach, erector spinae activity did not increase. Previous studies of trunk muscle
activity during the ABM have generally found that these muscles increase activity with
ABM, but most of these studies have used less complex movements, such as lying on a
table or quiet standing (Liebenson, Karpowicz, Brown, Howarth, & McGill, 2009;
Matthijs, James, Dedrick, Brismée, & McGalliard, 2014; Suehiro et al., 2014).
Conversely, erector spinae activity does not seem to increase with ABM during more
dynamic activities such as bilateral squats (Marshall et al., 2011). These studies and the
current results, suggest that volitional ABM performance is sustainable during a
challenging lower extremity movement, even in individuals with LBP. However, lumbar
extensor activity may increase only during lower level activities. Individuals with LBP
may therefore benefit from the increased lumbopelvic stability afforded by this VPAC
maneuver (Grenier & McGill, 2007) during these more challenging activities.
During ABM trials, lower limb muscle activity generally decreased. Quadriceps
activity decreased during trials in all three directions, although only in the control group
Texas Tech University Health Sciences Center, Troy L. Hooper, May 2015
164
during ANT reach. Additionally, GMax activity decreased during PL trials, and BF and
ST activity decreased during PM reach. The only muscle to increase activity was the
GMed in the hxLBP group during the PM trials. This general decrease in muscle activity
with ABM performance may be the result of improved pelvic stability creating a more
stable proximal base and allowing more efficient distal kinetic chain mobility. This
would lessen the need for the prime movers of the knee to contribute to force production
and allow them to instead control the precision with which the foot is placed (Kibler et
al., 2006). In addition, because high quadriceps activity increases ACL strain and injury
risk (DeMorat, Weinhold, Blackburn, Chudik, & Garrett, 2004), the ABM may be a
potential mechanism for decreasing ACL load during dynamic activities.
Reach distances did not change with ABM performance in any group. The ABM
is a frequently used strategy designed to improve lumbar spine stability and reduce pelvic
motion. However, the extent to which the ABM affects lower extremity movement
strategies and performance had not been previously reported. These results show that the
ABM does not adversely affect postural control or lower quarter performance during a
dynamic activity.
Several kinematic variables changed with ABM performance, especially during
ANT reach trials. For all groups, reach with ABM performance in the ANT direction
resulted in less trunk extension, side bending toward the stance leg, anterior pelvic tilt,
hip internal rotation, and knee adduction. These motions have been implicated in various
lower extremity injuries, including ACL tears, patellofemoral pain syndrome, and
iliotibial band friction syndrome. For example, increased lateral trunk displacement
toward the stance limb (Hewett & Myer, 2011; Zazulak, Hewett, Reeves, Goldberg, &
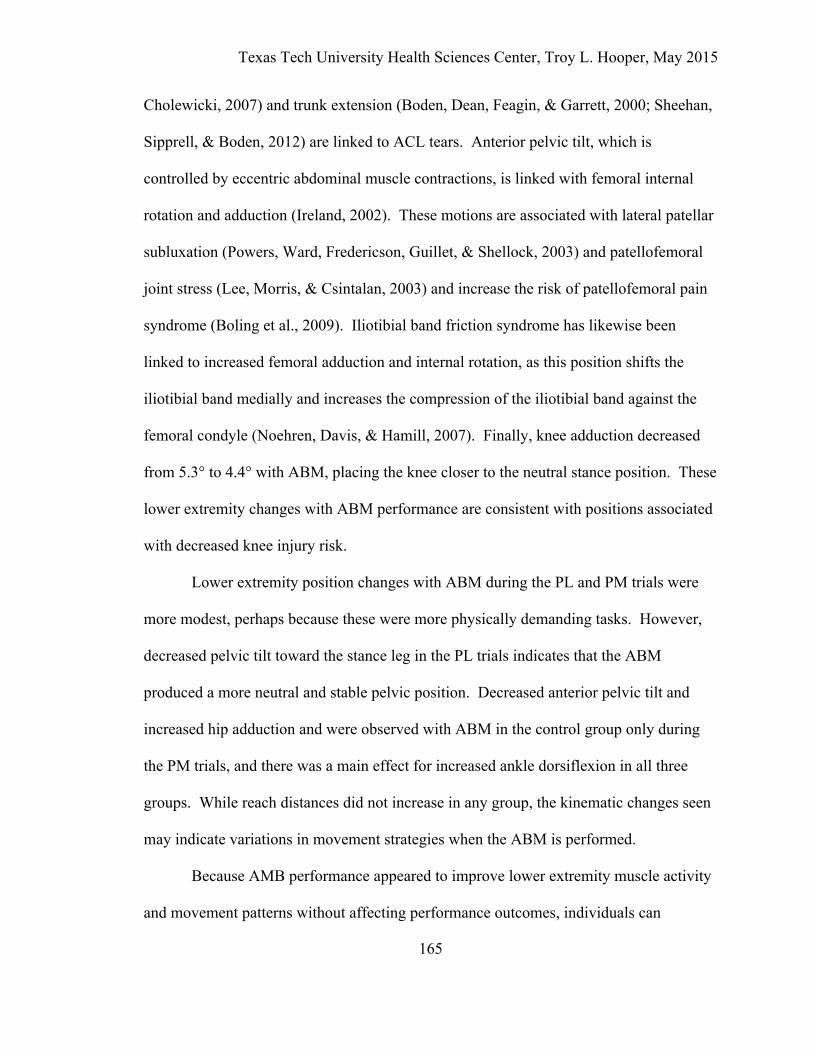
Texas Tech University Health Sciences Center, Troy L. Hooper, May 2015
165
Cholewicki, 2007) and trunk extension (Boden, Dean, Feagin, & Garrett, 2000; Sheehan,
Sipprell, & Boden, 2012) are linked to ACL tears. Anterior pelvic tilt, which is
controlled by eccentric abdominal muscle contractions, is linked with femoral internal
rotation and adduction (Ireland, 2002). These motions are associated with lateral patellar
subluxation (Powers, Ward, Fredericson, Guillet, & Shellock, 2003) and patellofemoral
joint stress (Lee, Morris, & Csintalan, 2003) and increase the risk of patellofemoral pain
syndrome (Boling et al., 2009). Iliotibial band friction syndrome has likewise been
linked to increased femoral adduction and internal rotation, as this position shifts the
iliotibial band medially and increases the compression of the iliotibial band against the
femoral condyle (Noehren, Davis, & Hamill, 2007). Finally, knee adduction decreased
from 5.3° to 4.4° with ABM, placing the knee closer to the neutral stance position. These
lower extremity changes with ABM performance are consistent with positions associated
with decreased knee injury risk.
Lower extremity position changes with ABM during the PL and PM trials were
more modest, perhaps because these were more physically demanding tasks. However,
decreased pelvic tilt toward the stance leg in the PL trials indicates that the ABM
produced a more neutral and stable pelvic position. Decreased anterior pelvic tilt and
increased hip adduction and were observed with ABM in the control group only during
the PM trials, and there was a main effect for increased ankle dorsiflexion in all three
groups. While reach distances did not increase in any group, the kinematic changes seen
may indicate variations in movement strategies when the ABM is performed.
Because AMB performance appeared to improve lower extremity muscle activity
and movement patterns without affecting performance outcomes, individuals can
Texas Tech University Health Sciences Center, Troy L. Hooper, May 2015
166
effectively incorporate this technique during functional activities. We hypothesized that
the ABM would produce similar changes in all groups. Even though AMB performance
in the two LBP groups did result in many changes equivalent to the control group, several
of the EMG and kinematic changes observed with ABM performance were limited to the
control group. This may indicate that the ABM’s effectiveness is diminished in
individuals experiencing LBP despite similar increases in trunk muscle activity.
Moreover, resolution of a LBP experience does not seem to improve these deficits.
Therefore, these individuals may benefit from ABM training to enhance the technique’s
effectiveness and future research should examine the effects of training on our selected
parameters.
Limitations
There are several limitations to the current study. First, the small sample size may
have limited the number of statistically detected differences. This is especially true for
the kinematic variables, where differences between several variables with moderate to
large effect sizes were not statistically significant. Second, the average pain level,
disability scores, and fear avoidance beliefs of the cLBP group were relatively low.
Subjects with higher scores may have experienced greater changes in the variables
studied. Third, because of the complications associated with using maximal contraction
in LBP populations, we normalized all EMG activity to a submaximal reference
contraction. This resulted in a high degree of variability for the normalized EMG values
and a non-normal statistical distribution. Although we felt that the use of parametric
statistics to analyze these variables was justified, future studies might limit this
Texas Tech University Health Sciences Center, Troy L. Hooper, May 2015
167
complication by using maximum voluntary contractions, particularly for the lower limb
muscles.
CONCLUSION
The ABM is traditionally used to improve lumbar stability in LBP patients. This
study reveals other benefits of ABM performance. We found that abdominal muscle
activity increased with ABM performance, and lower extremity muscle activity generally
decreased, especially the quadriceps muscles. This may be the result of a more stable
proximal pelvis during the ABM condition allowing more efficient force transfer to the
lower limbs, lessening the need for the muscles controlling the knee to contribute to force
production. In addition, ABM performance produced several trunk and LE kinematic
changes that brought these regions into more optimal alignment and control for lower
extremity movements. Several of these EMG and kinematic changes were only found in
the control group, indicating that individuals with current LBP or a LBP history may
benefit from ABM training to attempt to improve these variables. These changes all
occurred without affecting performance, indicating that ABM contractions may be
beneficial for LBP patients.

Texas Tech University Health Sciences Center, Troy L. Hooper, May 2015
168
Figure 6.1. Group x Contraction interaction for pelvic sagittal plane joint angle during posteromedial reach. The control group posterior pelvic tilt significantly decreased with ABM.
No ABM ABM-60
-50
-40
-30
Contraction
Join
t Ang
le (°
)
Current LBPHistory LBPControl
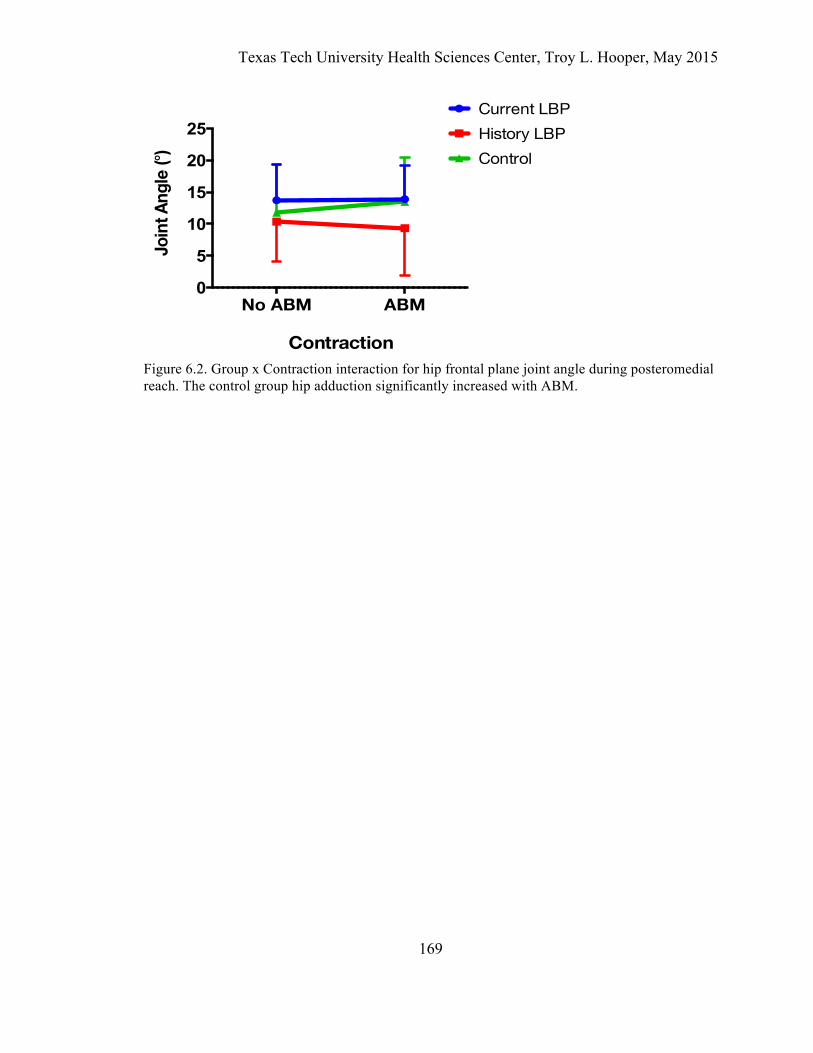
Texas Tech University Health Sciences Center, Troy L. Hooper, May 2015
169
Figure 6.2. Group x Contraction interaction for hip frontal plane joint angle during posteromedial reach. The control group hip adduction significantly increased with ABM.
No ABM ABM0
5
10
15
20
25
Contraction
Join
t Ang
le (°
)
Current LBPHistory LBPControl
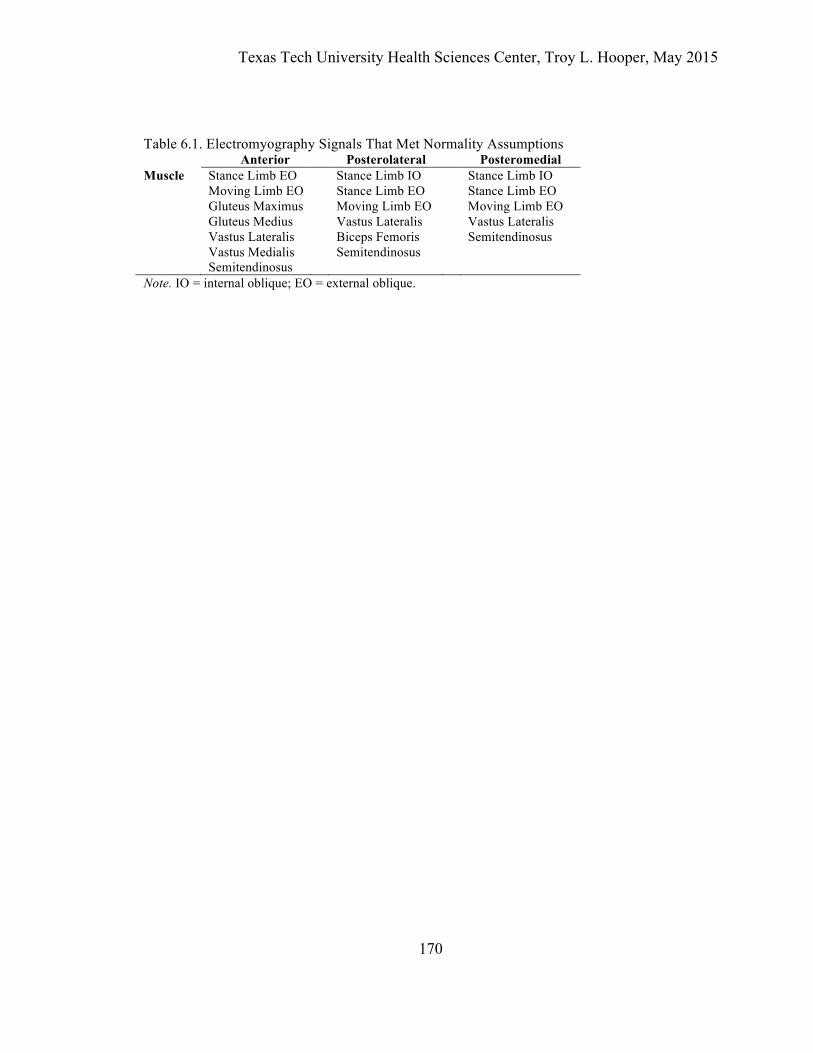
Texas Tech University Health Sciences Center, Troy L. Hooper, May 2015
170
Table 6.1. Electromyography Signals That Met Normality Assumptions Anterior Posterolateral Posteromedial Muscle Stance Limb EO Stance Limb IO Stance Limb IO Moving Limb EO Stance Limb EO Stance Limb EO Gluteus Maximus Moving Limb EO Moving Limb EO Gluteus Medius Vastus Lateralis Vastus Lateralis Vastus Lateralis Biceps Femoris Semitendinosus Vastus Medialis Semitendinosus Semitendinosus Note. IO = internal oblique; EO = external oblique.
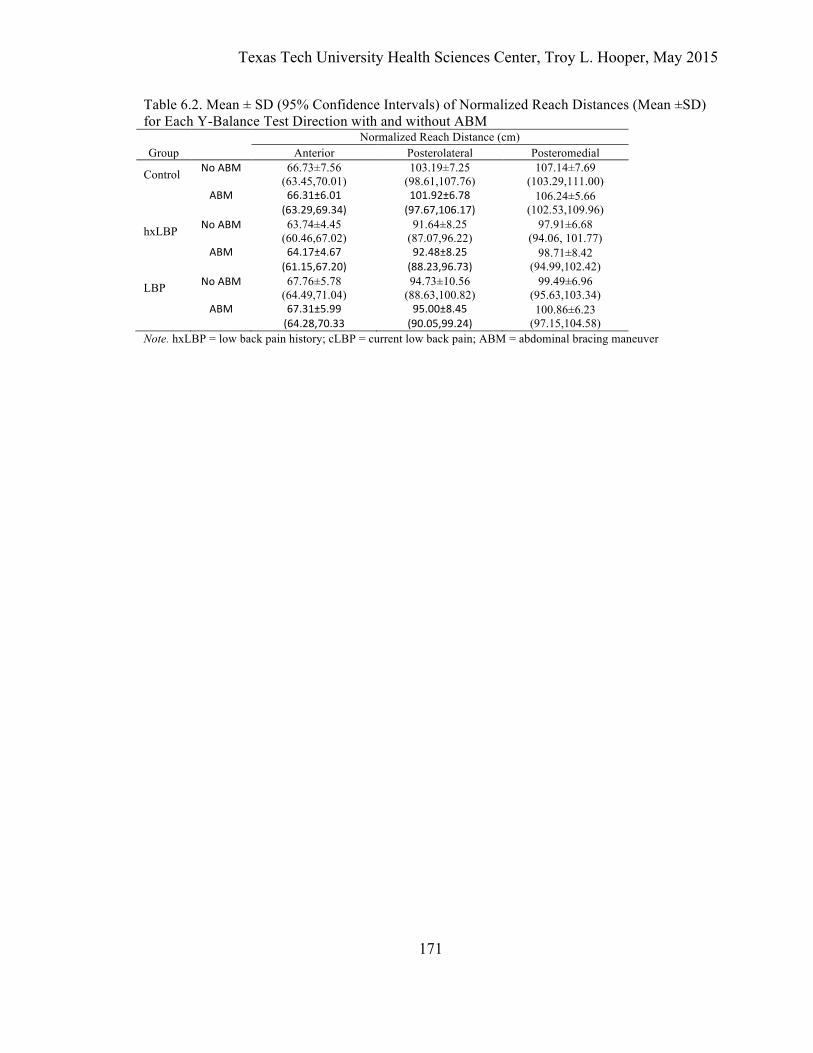
Texas Tech University Health Sciences Center, Troy L. Hooper, May 2015
171
Table 6.2. Mean ± SD (95% Confidence Intervals) of Normalized Reach Distances (Mean ±SD) for Each Y-Balance Test Direction with and without ABM Normalized Reach Distance (cm) Group Anterior Posterolateral Posteromedial
Control No ABM 66.73±7.56 (63.45,70.01)
103.19±7.25 (98.61,107.76)
107.14±7.69 (103.29,111.00)
ABM 66.31±6.01 (63.29,69.34)
101.92±6.78 (97.67,106.17)
106.24±5.66 (102.53,109.96)
hxLBP No ABM 63.74±4.45 (60.46,67.02)
91.64±8.25 (87.07,96.22)
97.91±6.68 (94.06, 101.77)
ABM 64.17±4.67 (61.15,67.20)
92.48±8.25 (88.23,96.73)
98.71±8.42 (94.99,102.42)
LBP No ABM 67.76±5.78 (64.49,71.04)
94.73±10.56 (88.63,100.82)
99.49±6.96 (95.63,103.34)
ABM 67.31±5.99 (64.28,70.33
95.00±8.45 (90.05,99.24)
100.86±6.23 (97.15,104.58)
Note. hxLBP = low back pain history; cLBP = current low back pain; ABM = abdominal bracing maneuver
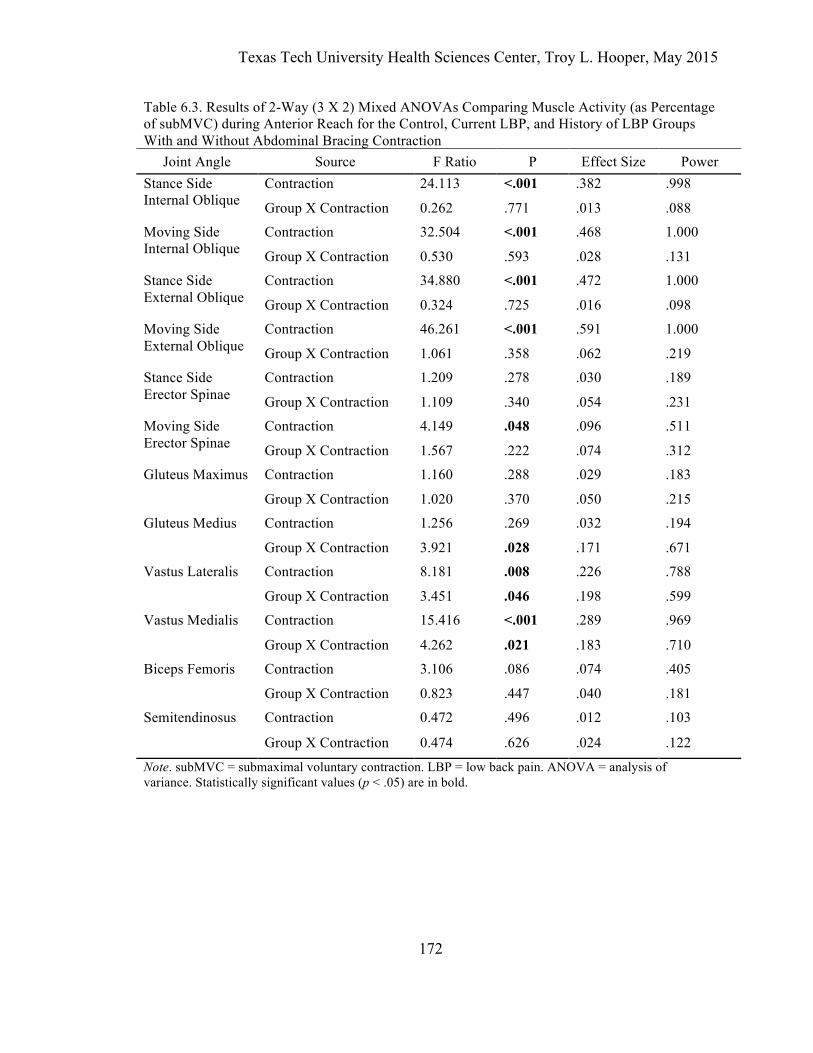
Texas Tech University Health Sciences Center, Troy L. Hooper, May 2015
172
Table 6.3. Results of 2-Way (3 X 2) Mixed ANOVAs Comparing Muscle Activity (as Percentage of subMVC) during Anterior Reach for the Control, Current LBP, and History of LBP Groups With and Without Abdominal Bracing Contraction
Joint Angle Source F Ratio P Effect Size Power Stance Side Internal Oblique
Contraction 24.113 <.001 .382 .998
Group X Contraction 0.262 .771 .013 .088
Moving Side Internal Oblique
Contraction 32.504 <.001 .468 1.000
Group X Contraction 0.530 .593 .028 .131
Stance Side External Oblique
Contraction 34.880 <.001 .472 1.000
Group X Contraction 0.324 .725 .016 .098
Moving Side External Oblique
Contraction 46.261 <.001 .591 1.000
Group X Contraction 1.061 .358 .062 .219
Stance Side Erector Spinae
Contraction 1.209 .278 .030 .189
Group X Contraction 1.109 .340 .054 .231
Moving Side Erector Spinae
Contraction 4.149 .048 .096 .511
Group X Contraction 1.567 .222 .074 .312
Gluteus Maximus
Contraction 1.160 .288 .029 .183
Group X Contraction 1.020 .370 .050 .215
Gluteus Medius Contraction 1.256 .269 .032 .194
Group X Contraction 3.921 .028 .171 .671
Vastus Lateralis Contraction 8.181 .008 .226 .788
Group X Contraction 3.451 .046 .198 .599
Vastus Medialis Contraction 15.416 <.001 .289 .969
Group X Contraction 4.262 .021 .183 .710
Biceps Femoris Contraction 3.106 .086 .074 .405
Group X Contraction 0.823 .447 .040 .181
Semitendinosus Contraction 0.472 .496 .012 .103
Group X Contraction 0.474 .626 .024 .122
Note. subMVC = submaximal voluntary contraction. LBP = low back pain. ANOVA = analysis of variance. Statistically significant values (p < .05) are in bold.
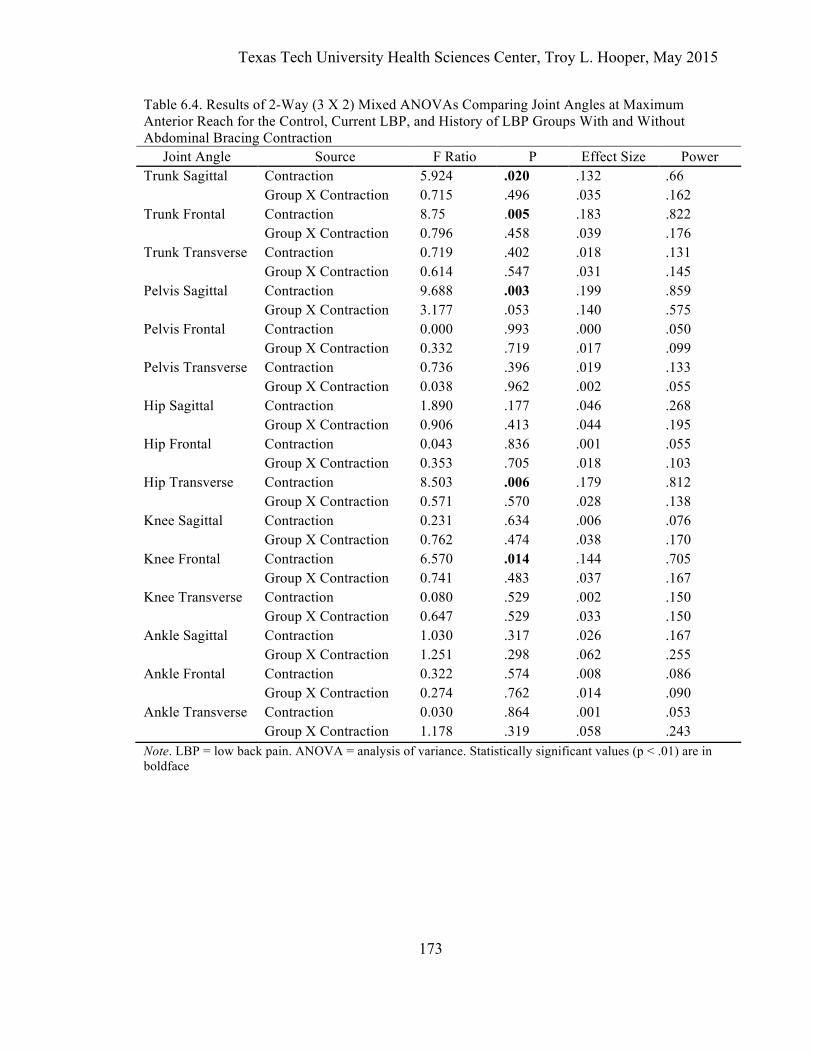
Texas Tech University Health Sciences Center, Troy L. Hooper, May 2015
173
Table 6.4. Results of 2-Way (3 X 2) Mixed ANOVAs Comparing Joint Angles at Maximum Anterior Reach for the Control, Current LBP, and History of LBP Groups With and Without Abdominal Bracing Contraction
Joint Angle Source F Ratio P Effect Size Power Trunk Sagittal Contraction 5.924 .020 .132 .66 Group X Contraction 0.715 .496 .035 .162 Trunk Frontal Contraction 8.75 .005 .183 .822 Group X Contraction 0.796 .458 .039 .176 Trunk Transverse Contraction 0.719 .402 .018 .131 Group X Contraction 0.614 .547 .031 .145 Pelvis Sagittal Contraction 9.688 .003 .199 .859 Group X Contraction 3.177 .053 .140 .575 Pelvis Frontal Contraction 0.000 .993 .000 .050 Group X Contraction 0.332 .719 .017 .099 Pelvis Transverse Contraction 0.736 .396 .019 .133 Group X Contraction 0.038 .962 .002 .055 Hip Sagittal Contraction 1.890 .177 .046 .268 Group X Contraction 0.906 .413 .044 .195 Hip Frontal Contraction 0.043 .836 .001 .055 Group X Contraction 0.353 .705 .018 .103 Hip Transverse Contraction 8.503 .006 .179 .812 Group X Contraction 0.571 .570 .028 .138 Knee Sagittal Contraction 0.231 .634 .006 .076 Group X Contraction 0.762 .474 .038 .170 Knee Frontal Contraction 6.570 .014 .144 .705 Group X Contraction 0.741 .483 .037 .167 Knee Transverse Contraction 0.080 .529 .002 .150 Group X Contraction 0.647 .529 .033 .150 Ankle Sagittal Contraction 1.030 .317 .026 .167 Group X Contraction 1.251 .298 .062 .255 Ankle Frontal Contraction 0.322 .574 .008 .086 Group X Contraction 0.274 .762 .014 .090 Ankle Transverse Contraction 0.030 .864 .001 .053 Group X Contraction 1.178 .319 .058 .243 Note. LBP = low back pain. ANOVA = analysis of variance. Statistically significant values (p < .01) are in boldface
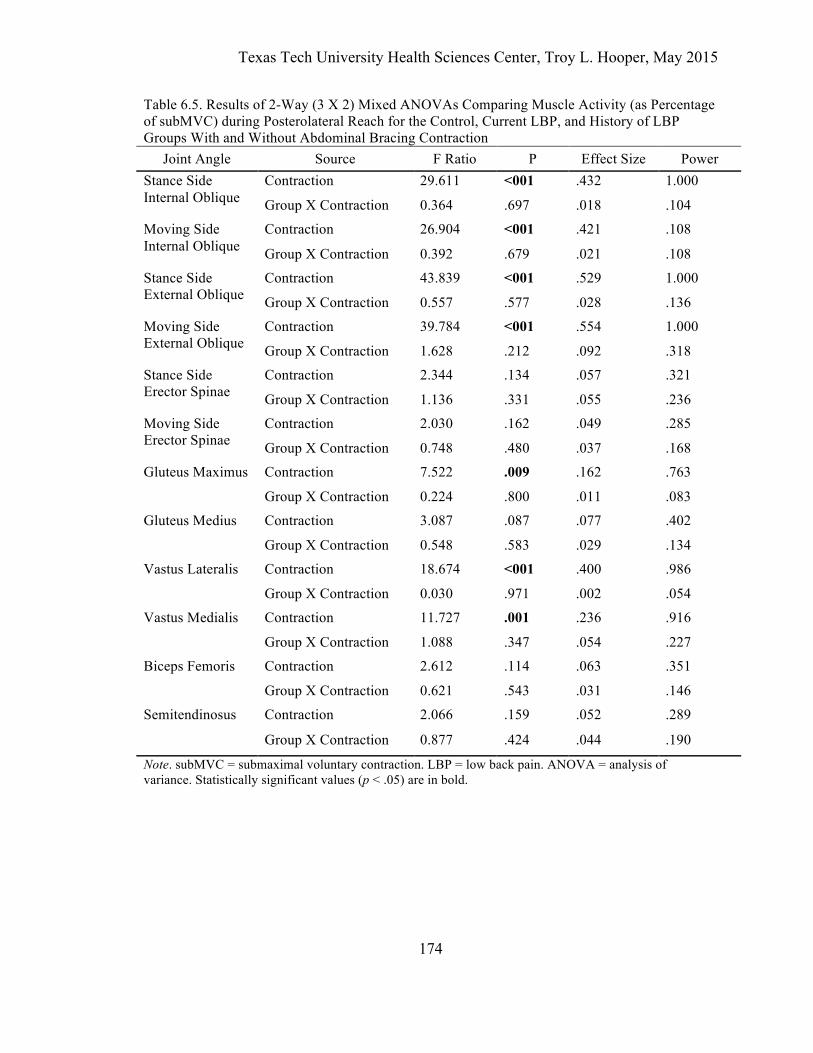
Texas Tech University Health Sciences Center, Troy L. Hooper, May 2015
174
Table 6.5. Results of 2-Way (3 X 2) Mixed ANOVAs Comparing Muscle Activity (as Percentage of subMVC) during Posterolateral Reach for the Control, Current LBP, and History of LBP Groups With and Without Abdominal Bracing Contraction
Joint Angle Source F Ratio P Effect Size Power Stance Side Internal Oblique
Contraction 29.611 <001 .432 1.000
Group X Contraction 0.364 .697 .018 .104
Moving Side Internal Oblique
Contraction 26.904 <001 .421 .108
Group X Contraction 0.392 .679 .021 .108
Stance Side External Oblique
Contraction 43.839 <001 .529 1.000
Group X Contraction 0.557 .577 .028 .136
Moving Side External Oblique
Contraction 39.784 <001 .554 1.000
Group X Contraction 1.628 .212 .092 .318
Stance Side Erector Spinae
Contraction 2.344 .134 .057 .321
Group X Contraction 1.136 .331 .055 .236
Moving Side Erector Spinae
Contraction 2.030 .162 .049 .285
Group X Contraction 0.748 .480 .037 .168
Gluteus Maximus
Contraction 7.522 .009 .162 .763
Group X Contraction 0.224 .800 .011 .083
Gluteus Medius Contraction 3.087 .087 .077 .402
Group X Contraction 0.548 .583 .029 .134
Vastus Lateralis Contraction 18.674 <001 .400 .986
Group X Contraction 0.030 .971 .002 .054
Vastus Medialis Contraction 11.727 .001 .236 .916
Group X Contraction 1.088 .347 .054 .227
Biceps Femoris Contraction 2.612 .114 .063 .351
Group X Contraction 0.621 .543 .031 .146
Semitendinosus Contraction 2.066 .159 .052 .289
Group X Contraction 0.877 .424 .044 .190
Note. subMVC = submaximal voluntary contraction. LBP = low back pain. ANOVA = analysis of variance. Statistically significant values (p < .05) are in bold.
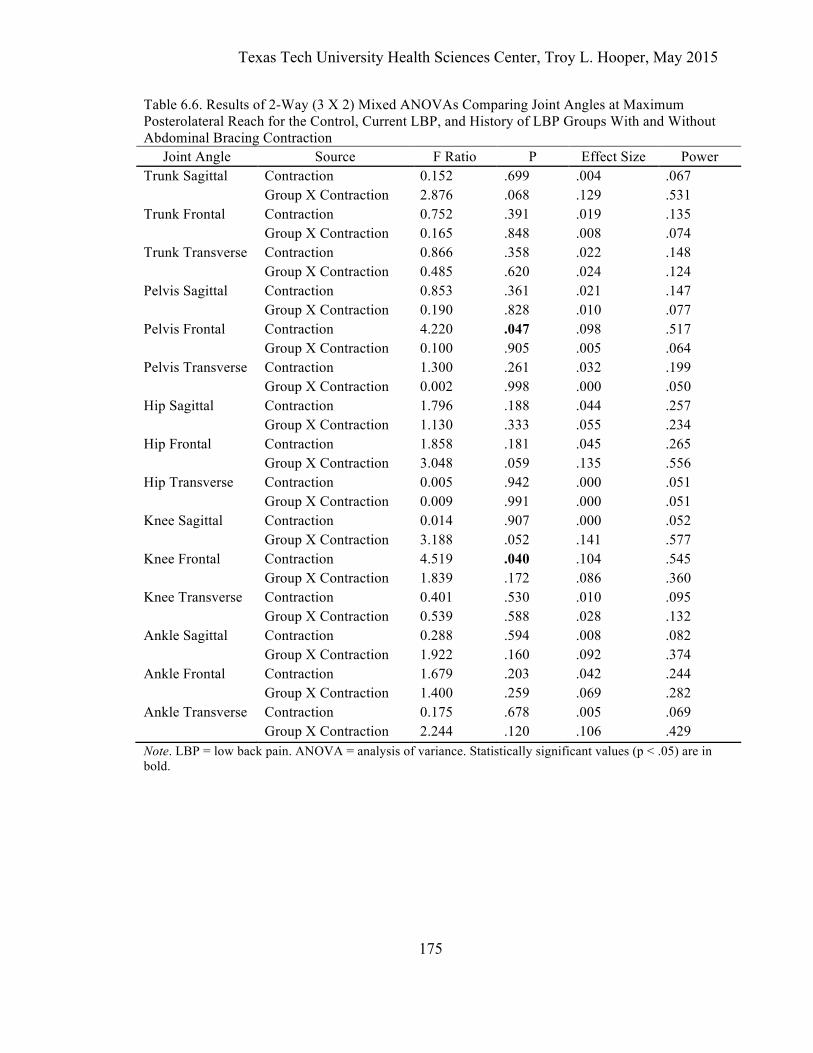
Texas Tech University Health Sciences Center, Troy L. Hooper, May 2015
175
Table 6.6. Results of 2-Way (3 X 2) Mixed ANOVAs Comparing Joint Angles at Maximum Posterolateral Reach for the Control, Current LBP, and History of LBP Groups With and Without Abdominal Bracing Contraction
Joint Angle Source F Ratio P Effect Size Power Trunk Sagittal Contraction 0.152 .699 .004 .067 Group X Contraction 2.876 .068 .129 .531 Trunk Frontal Contraction 0.752 .391 .019 .135 Group X Contraction 0.165 .848 .008 .074 Trunk Transverse Contraction 0.866 .358 .022 .148 Group X Contraction 0.485 .620 .024 .124 Pelvis Sagittal Contraction 0.853 .361 .021 .147 Group X Contraction 0.190 .828 .010 .077 Pelvis Frontal Contraction 4.220 .047 .098 .517 Group X Contraction 0.100 .905 .005 .064 Pelvis Transverse Contraction 1.300 .261 .032 .199 Group X Contraction 0.002 .998 .000 .050 Hip Sagittal Contraction 1.796 .188 .044 .257 Group X Contraction 1.130 .333 .055 .234 Hip Frontal Contraction 1.858 .181 .045 .265 Group X Contraction 3.048 .059 .135 .556 Hip Transverse Contraction 0.005 .942 .000 .051 Group X Contraction 0.009 .991 .000 .051 Knee Sagittal Contraction 0.014 .907 .000 .052 Group X Contraction 3.188 .052 .141 .577 Knee Frontal Contraction 4.519 .040 .104 .545 Group X Contraction 1.839 .172 .086 .360 Knee Transverse Contraction 0.401 .530 .010 .095 Group X Contraction 0.539 .588 .028 .132 Ankle Sagittal Contraction 0.288 .594 .008 .082 Group X Contraction 1.922 .160 .092 .374 Ankle Frontal Contraction 1.679 .203 .042 .244 Group X Contraction 1.400 .259 .069 .282 Ankle Transverse Contraction 0.175 .678 .005 .069 Group X Contraction 2.244 .120 .106 .429 Note. LBP = low back pain. ANOVA = analysis of variance. Statistically significant values (p < .05) are in bold.
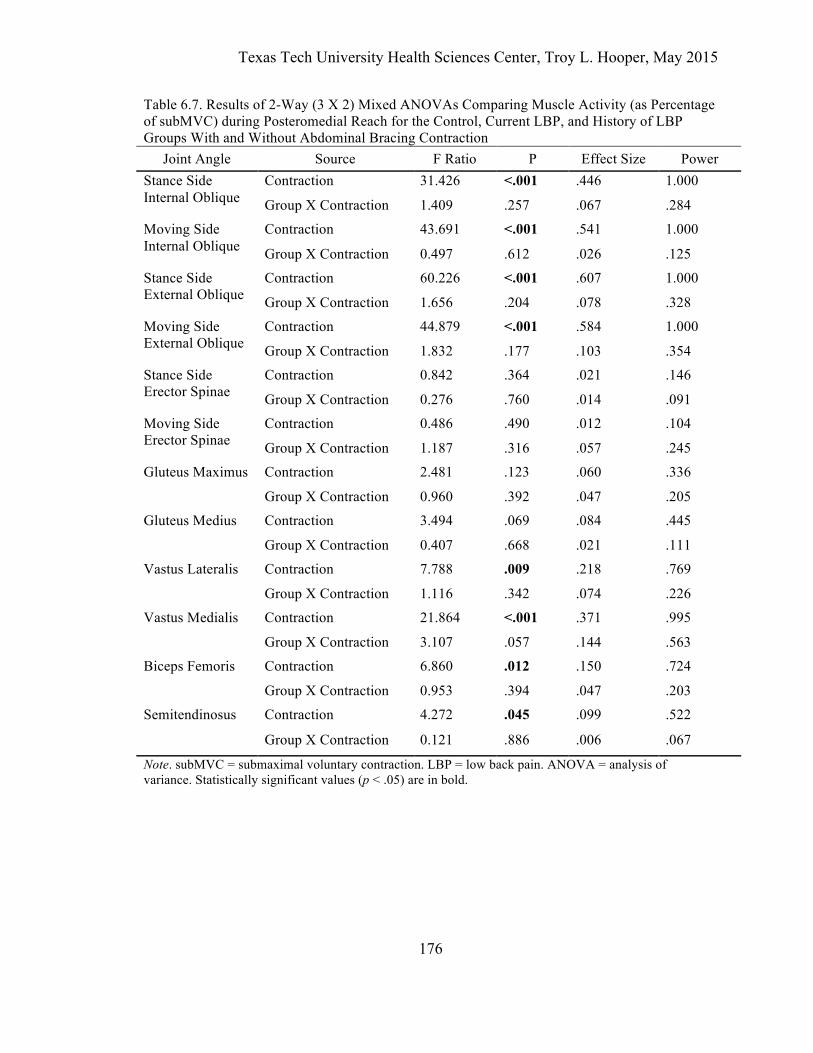
Texas Tech University Health Sciences Center, Troy L. Hooper, May 2015
176
Table 6.7. Results of 2-Way (3 X 2) Mixed ANOVAs Comparing Muscle Activity (as Percentage of subMVC) during Posteromedial Reach for the Control, Current LBP, and History of LBP Groups With and Without Abdominal Bracing Contraction
Joint Angle Source F Ratio P Effect Size Power Stance Side Internal Oblique
Contraction 31.426 <.001 .446 1.000
Group X Contraction 1.409 .257 .067 .284
Moving Side Internal Oblique
Contraction 43.691 <.001 .541 1.000
Group X Contraction 0.497 .612 .026 .125
Stance Side External Oblique
Contraction 60.226 <.001 .607 1.000
Group X Contraction 1.656 .204 .078 .328
Moving Side External Oblique
Contraction 44.879 <.001 .584 1.000
Group X Contraction 1.832 .177 .103 .354
Stance Side Erector Spinae
Contraction 0.842 .364 .021 .146
Group X Contraction 0.276 .760 .014 .091
Moving Side Erector Spinae
Contraction 0.486 .490 .012 .104
Group X Contraction 1.187 .316 .057 .245
Gluteus Maximus
Contraction 2.481 .123 .060 .336
Group X Contraction 0.960 .392 .047 .205
Gluteus Medius Contraction 3.494 .069 .084 .445
Group X Contraction 0.407 .668 .021 .111
Vastus Lateralis Contraction 7.788 .009 .218 .769
Group X Contraction 1.116 .342 .074 .226
Vastus Medialis Contraction 21.864 <.001 .371 .995
Group X Contraction 3.107 .057 .144 .563
Biceps Femoris Contraction 6.860 .012 .150 .724
Group X Contraction 0.953 .394 .047 .203
Semitendinosus Contraction 4.272 .045 .099 .522
Group X Contraction 0.121 .886 .006 .067
Note. subMVC = submaximal voluntary contraction. LBP = low back pain. ANOVA = analysis of variance. Statistically significant values (p < .05) are in bold.
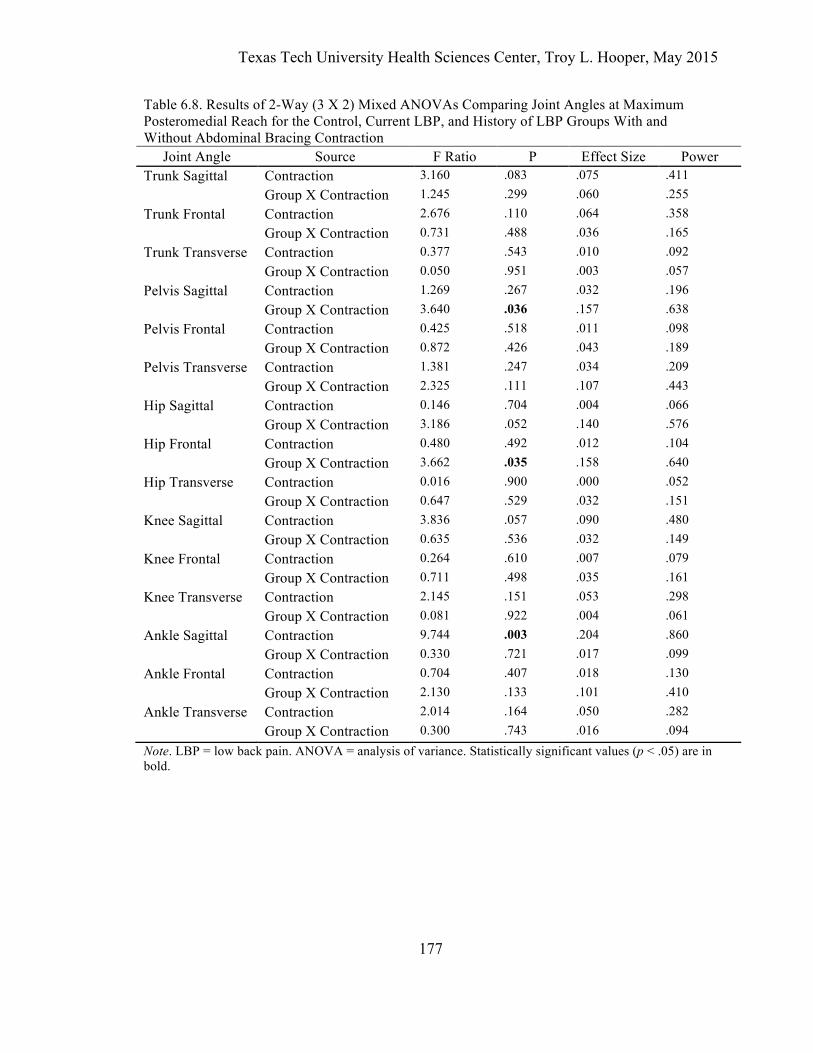
Texas Tech University Health Sciences Center, Troy L. Hooper, May 2015
177
Table 6.8. Results of 2-Way (3 X 2) Mixed ANOVAs Comparing Joint Angles at Maximum Posteromedial Reach for the Control, Current LBP, and History of LBP Groups With and Without Abdominal Bracing Contraction
Joint Angle Source F Ratio P Effect Size Power Trunk Sagittal Contraction 3.160 .083 .075 .411 Group X Contraction 1.245 .299 .060 .255 Trunk Frontal Contraction 2.676 .110 .064 .358 Group X Contraction 0.731 .488 .036 .165 Trunk Transverse Contraction 0.377 .543 .010 .092 Group X Contraction 0.050 .951 .003 .057 Pelvis Sagittal Contraction 1.269 .267 .032 .196 Group X Contraction 3.640 .036 .157 .638 Pelvis Frontal Contraction 0.425 .518 .011 .098 Group X Contraction 0.872 .426 .043 .189 Pelvis Transverse Contraction 1.381 .247 .034 .209 Group X Contraction 2.325 .111 .107 .443 Hip Sagittal Contraction 0.146 .704 .004 .066 Group X Contraction 3.186 .052 .140 .576 Hip Frontal Contraction 0.480 .492 .012 .104 Group X Contraction 3.662 .035 .158 .640 Hip Transverse Contraction 0.016 .900 .000 .052 Group X Contraction 0.647 .529 .032 .151 Knee Sagittal Contraction 3.836 .057 .090 .480 Group X Contraction 0.635 .536 .032 .149 Knee Frontal Contraction 0.264 .610 .007 .079 Group X Contraction 0.711 .498 .035 .161 Knee Transverse Contraction 2.145 .151 .053 .298 Group X Contraction 0.081 .922 .004 .061 Ankle Sagittal Contraction 9.744 .003 .204 .860 Group X Contraction 0.330 .721 .017 .099 Ankle Frontal Contraction 0.704 .407 .018 .130 Group X Contraction 2.130 .133 .101 .410 Ankle Transverse Contraction 2.014 .164 .050 .282 Group X Contraction 0.300 .743 .016 .094 Note. LBP = low back pain. ANOVA = analysis of variance. Statistically significant values (p < .05) are in bold.
Texas Tech University Health Sciences Center, Troy L. Hooper, May 2015
178
REFERENCES
Allison, G. T., Godfrey, P., & Robinson, G. (1998). EMG signal amplitude assessment during abdominal bracing and hollowing. Journal of Electromyography and Kinesiology, 8(1), 51–57.
Baecke, J. A., Burema, J., & Frijters, J. E. (1982). A short questionnaire for the measurement of habitual physical activity in epidemiological studies. The American Journal of Clinical Nutrition, 36(5), 936–942.
Barbero, M., Merletti, R., & Rainoldi, A. (2012). Atlas of muscle innervation zones: understanding surface electromyography and its applications. Milan: Springer.
Bell, A. L., Brand, R. A., & Pedersen, D. R. (1989). Prediction of hip joint centre location from external landmarks. Human Movement Science, 8(1), 3–16.
Boden, B. P., Dean, G. S., Feagin, J. A., & Garrett, W. E. (2000). Mechanisms of anterior cruciate ligament injury. Orthopedics, 23(6), 573–578.
Boling, M. C., Padua, D. A., Marshall, S. W., Guskiewicz, K. M., Pyne, S., & Beutler, A. I. (2009). A prospective investigation of biomechanical risk factors for patellofemoral pain syndrome: The Joint Undertaking to Monitor and Prevent ACL Injury (JUMP-ACL) cohort. American Journal of Sports Medicine, 37, 2108–2116.
Dankaerts, W., O'Sullivan, P. B., Burnett, A., Straker, L. M., & Danneels, L. A. (2004). Reliability of EMG measurements for trunk muscles during maximal and sub-maximal voluntary isometric contractions in healthy controls and CLBP patients. Journal of Electromyography and Kinesiology, 14(3), 333–342.
DeMorat, G., Weinhold, P., Blackburn, J. T., Chudik, S., & Garrett, W. E. (2004). Aggressive quadriceps loading can induce noncontact anterior cruciate ligament injury. American Journal of Sports Medicine, 32(2), 477–483.
Field, A. (2013). Discovering Statistics Using IBM SPSS Statistics (4 ed.). London, England: Sage.
Fong, D. T.-P., Hong, Y., & Li, J.-X. (2008). Lower extremity preventative measures for slips - Joint moments and myoelectric analysis. Ergonomics, 51(12), 1830–1846.
Ganesh, G. S., Ganesh, G. S., Chhabra, D., Chhabra, D., & Mrityunjay, K. (2014). Efficacy of the star excursion balance test in detecting reach deficits in subjects with chronic low back pain. Physiotherapy Research International.
Grenier, S. G., & McGill, S. M. (2007). Quantification of lumbar stability by using 2 different abdominal activation strategies. Archives of Physical Medicine and Rehabilitation, 88(1), 54–62.
Haddas, R., James, C. R., Sawyer, S. F., Sizer, P. S., Brooks, T., & Chyu, M. C. (2013). Effects of Volitional Spine Stabilization and Lower Extremity Fatigue on Landing Performance in a Recurrent Low Back Pain Population. Texas Tech University Health Sciences Center, Lubbock, TX.
Hewett, T. E., & Myer, G. D. (2011). The mechanistic connection between the trunk,
Texas Tech University Health Sciences Center, Troy L. Hooper, May 2015
179
knee, and ACL injury. Exercise and Sport Sciences Reviews, 39(4), 161–166. Hodges, P. W., & Richardson, C. A. (1996). Inefficient muscular stabilization of the
lumbar spine associated with low back pain. A motor control evaluation of transversus abdominis. Spine, 21, 2640–2650.
Ireland, M. L. (2002). The female ACL: Why is it more prone to injury? Orthopedic Clinics of North America, 33(4), 637–651.
Jacob, T., Baras, M., Zeev, A., & Epstein, L. (2001). Low back pain: Reliability of a set of pain measurement tools. Archives of Physical Medicine and Rehabilitation, 82(6), 735–742.
Kibler, W. B., Press, J., & Sciascia, A. (2006). The role of core stability in athletic function. Sports Medicine, 36(3), 189–198.
Lee, T. Q., Morris, G., & Csintalan, R. P. (2003). The influence of tibial and femoral rotation on patellofemoral contact area and pressure. Journal of Orthopaedic and Sports Physical Therapy, 33(11), 686–693.
Leetun, D. T., Ireland, M. L., Willson, J. D., Ballantyne, B. T., & Davis, I. M. (2004). Core stability measures as risk factors for lower extremity injury in athletes. Medicine and Science in Sports and Exercise, 36, 926–934.
Leinonen, V., Kankaanpää, M., Luukkonen, M., Hänninen, O., Airaksinen, O., & Taimela, S. (2001). Disc herniation-related back pain impairs feed-forward control of paraspinal muscles. Spine, 26(16), E367–72.
Liebenson, C., Karpowicz, A. M., Brown, S. H. M., Howarth, S. J., & McGill, S. M. (2009). The active straight leg raise test and lumbar spine stability. PM&R, 1, 530–535.
Macdonald, D. A., Moseley, G. L., & Hodges, P. W. (2010). People with recurrent low back pain respond differently to trunk loading despite remission from symptoms. Spine, 35(7), 818–824.
Marshall, P. W., Desai, I., & Robbins, D. W. (2011). Core stability exercises in individuals with and without chronic nonspecific low back pain. Journal of Strength and Conditioning Research, 25(12), 3404–3411.
Matthijs, O. C. G., James, C. R., Dedrick, G. S., Brismée, J.-M., & McGalliard, M. K. (2014). Co-contractive Activation of the Superficial Multifidus During Volitional Preemptive Abdominal Contraction. PM&R, 6(1), 13–21.
McGill, S. M. (2007). Low Back Disorders: Evidence-Based Prevention and Rehabilitation (2nd ed.). Champain, IL: Human Kinetics.
Noehren, B., Davis, I., & Hamill, J. (2007). Prospective study of the biomechanical factors associated with iliotibial band syndrome. Clinical Biomechanics, 22(9), 951–956.
Pel, J. J. M., Spoor, C. W., Pool-Goudzwaard, A. L., Hoek van Dijke, G. A., & Snijders, C. J. (2008). Biomechanical analysis of reducing sacroiliac joint shear load by

Texas Tech University Health Sciences Center, Troy L. Hooper, May 2015
180
optimization of pelvic muscle and ligament forces. Annals of Biomedical Engineering, 36(3), 415–424.
Perneger, T. V. (1998). What's wrong with Bonferroni adjustments. Bmj, 316(7139), 1236–1238.
Philippaerts, R. M., Westerterp, K. R., & Lefevre, J. (1999). Doubly labelled water validation of three physical activity questionnaires. International Journal of Sports Medicine, 20(5), 284–289.
Portney, L. G., & Watkins, M. P. (2009). Foundations of Clinical Research: Applications to Practice (3rd ed.). Upper Saddle River, NJ: Prentice Hall.
Powers, C. M., Ward, S. R., Fredericson, M., Guillet, M., & Shellock, F. G. (2003). Patellofemoral kinematics during weight-bearing and non-weight-bearing knee extension in persons with lateral subluxation of the patella: a preliminary study. Journal of Orthopaedic and Sports Physical Therapy, 33(11), 677–685.
Roland, M., & Fairbank, J. (2000). The Roland-Morris Disability Questionnaire and the Oswestry Disability Questionnaire. Spine, 25(24), 3115–3124.
Sheehan, F. T., Sipprell, W. H., & Boden, B. P. (2012). Dynamic sagittal plane trunk control during anterior cruciate ligament injury. American Journal of Sports Medicine, 40(5), 1068–1074.
Shirey, M., Hurlbutt, M., Johansen, N., King, G. W., Wilkinson, S. G., & Hoover, D. L. (2012). The influence of core musculature engagement on hip and knee kinematics in women during a single leg squat. International Journal of Sports Physical Therapy, 7(1), 1–12.
Stanton, T., & Kawchuk, G. N. (2008). The effect of abdominal stabilization contractions on posteroanterior spinal stiffness. Spine, 33(6), 694–701.
Suehiro, T., Mizutani, M., Watanabe, S., Ishida, H., Kobara, K., & Osaka, H. (2014). Comparison of spine motion and trunk muscle activity between abdominal hollowing and abdominal bracing maneuvers during prone hip extension. Journal of Bodywork and Movement Therapies, 18(3), 482–488.
Sueki, D. G., Cleland, J. A., & Wainner, R. S. (2013). A regional interdependence model of musculoskeletal dysfunction: research, mechanisms, and clinical implications. Journal of Manual and Manipulative Therapy, 21(2), 90–102.
Thomas, J. S., France, C. R., Sha, D., & Wiele, N. V. (2008). The influence of pain-related fear on peak muscle activity and force generation during maximal isometric trunk exertions. Spine, 33(11), E342–E348.
Vera-Garcia, F. J., Elvira, J. L., Brown, S. H. M., & McGill, S. M. (2007). Effects of abdominal stabilization maneuvers on the control of spine motion and stability against sudden trunk perturbations. Journal of Electromyography and Kinesiology, 17(5), 556–567.
Waddell, G., Newton, M., Henderson, I., Somerville, D., & Main, C. J. (1993). A Fear-Avoidance Beliefs Questionnaire (FABQ) and the role of fear-avoidance beliefs in

Texas Tech University Health Sciences Center, Troy L. Hooper, May 2015
181
chronic low back pain and disability. Pain, 52(2), 157–168. Zazulak, B. T., Hewett, T. E., Reeves, N. P., Goldberg, B., & Cholewicki, J. (2007).
Deficits in neuromuscular control of the trunk predict knee injury risk: A prospective biomechanical-epidemiologic study. American Journal of Sports Medicine, 35(7), 1123–1130.

Texas Tech University Health Sciences Center, Troy L. Hooper, May 2015
182
CHAPTER VII DISCUSSION AND CONCLUSION
Low back pain (LBP) results in disturbed balance (Cavanaugh et al., 2005). Simple
dynamic balance tests are needed to detect these deficits in a clinical setting. In addition, lower
extremity biomechanical variables may be altered in this population, potentially increasing lower
extremity injury risk (Durall et al., 2011; Plisky et al., 2006). Volitional Preemptive Abdominal
Contractions (VPACs), such as the abdominal bracing maneuver (ABM), may improve these
control variables. The purpose of this project was to determine the effect of both current LBP
and a LBP history with no present symptoms on lower extremity neuromuscular and kinematic
variables and performance scores produced during completion of the Y-Balance Test. An
additional purpose was to determine whether incorporating a VPAC changes these lower
extremity control variables. This chapter provides a general discussion and conclusion from the
three studies included in this dissertation.
DISCUSSION
This dissertation presents several unique contributions to the LBP and lower extremity
biomechanics literature. First, although the Y-Balance Test is frequently used to detect balance
disturbances in those with lower extremity injuries, the test has only recently been used with
LBP populations. This study was the first to examine this test in groups with recurrent LBP who
are currently experiencing pain (cLBP) and recurrent LBP who are currently pain-free (hxLBP)
and compare them to a healthy, pain-free control group with no history of LBP. In addition, the
effects of activity level, BMI, pain, and functional disability on Y-Balance Test scores were
previously unknown. Finally, despite the well-documented trunk biomechanical changes found
Texas Tech University Health Sciences Center, Troy L. Hooper, May 2015
183
in those with LBP, few studies have investigated the effects of LBP on lower extremity joint
angles and neuromuscular control while performing functional lower extremity movements, and
the potential changes in these variables from a VPAC strategy were previously unknown. This
dissertation provides answers in each of these areas.
Balance deficits are commonly found in people with LBP (Mientjes & Frank, 1999; Ruhe
et al., 2011), and these deficits remain even after a LBP episode has resolved (Bouche et al.,
2005; van Dieën et al., 2010), which may contribute to these individual’s increased risk of
further injuries. Therefore, it is important for clinicians to perform balance testing in this
population. We hypothesized that Y-Balance Test scores would be lower in the active recurrent
LBP patients, as well as people with a LBP history who are currently pain-free, compared to a
matched sample of people with no LBP history. Study-1 demonstrated that Y-Balance Test
scores in the posteromedial (PM) and posterolateral (PL), but not anterior (ANT), directions are
diminished in the two LBP groups. Balance testing with instrumented force plates or dedicated
devices such as the Neurocom Balance Master® are expensive, complex to interpret, and less
portable, making them impractical to use in most clinical settings. The Y-Balance Test is useful
because it is a simple test of dynamic balance that can be performed in a clinical environment
quickly and with minimal cost. Its ability to detect dynamic balance deficits in individuals with
LBP makes it an important component of a functional evaluation. In addition, the test can be
used to measure the effectiveness of rehabilitation exercises designed to improve balance.
Various factors could influence Y-Balance Test scores in individuals with LBP,
potentially complicating the interpretation of test scores. Study-1 additionally asked whether a
relationship exists between such variables and Y-Balance Test scores. The hypothesis was that a
Texas Tech University Health Sciences Center, Troy L. Hooper, May 2015
184
negative correlation would exist between test scores and age, disability level, fear of movement,
pain level, and body mass index (BMI) and a positive correlation would exist between activity
level and test scores. Only one correlation between the variables measured and reach distance
was significant. In the cLBP group, a lower BMI was associated with greater test scores in the
PM direction. Pain levels were not correlated with test scores. This could be due to the low
mean pain level in the cLBP group. Likewise, reach distances were not correlated with Fear
Avoidance Beliefs Questionnaire (FABQ) or Roland Morris Disability Questionnaire (RMDQ)
scores or activity level (as measured by the Baeke Physical Activity Questionnaire, BPAQ).
These findings suggest that fear of movement, disability, and activity level do not affect reach
distances for individuals with mild LBP. Finally, age was not correlated with reach distances.
However, these results should be interpreted with caution, due to the low score variability for
each of these variables.
Low back pain leads to lower extremity muscle activity changes (Hart, Kerrigan, et al.,
2006b; Leinonen et al., 2000; Pirouzi et al., 2006; Suter & Lindsay, 2001). The regional
interdependence model suggests that individuals with LBP may experience altered lower limb
range of motion and kinematics. For example, hip range of motion is limited in people with LBP
(Almeida et al., 2012; Mellin, 1988; 1990; Porter & Wilkinson, 1997; Wong & Lee, 2004).
However, the effect of LBP on more distal structures is unclear. Therefore, Study-2 asked
“What are the effects of LBP status on neuromuscular and kinematic performance during the Y-
Balance Test?” We hypothesized that subjects in the cLBP and hxLBP groups would
demonstrate diminished lower extremity control during the Y-Balance Test. Ankle dorsiflexion
in the ANT and PL directions and trunk flexion in the PL and PM directions were the only
Texas Tech University Health Sciences Center, Troy L. Hooper, May 2015
185
significant group main effects. Regarding ankle dorsiflexion, the LBP and hxLBP groups had
greater dorsiflexion than the control group. For trunk flexion, the control group had greater
trunk flexion than the cLBP and hxLBP groups. However, large effect sizes for several variables
that approached statistical significance were found, which suggests that the study was under
powered and increasing the sample size may have resulted in additional significant differences
between groups. Among these variables were trunk flexion during ANT reach and ankle
dorsiflexion during PM reach. Taken together, these results suggest that in all three reach
directions, the control group used a strategy of forward trunk flexion during reach, while the
cLBP and hxLBP groups used greater ankle dorsiflexion. This strategy may be sufficient to
permit increased reach distances in the ANT direction, but not posteriorly. This would account
for the decreased reach in the PM and PL directions but not the ANT direction in these two
groups.
Study-3 examined muscular and kinematic changes that occur as a result of ABM
performance. We hypothesized that the addition of a VPAC strategy using the ABM would
improve lower extremity control parameters in all three groups. We were able to verify that all
subjects could sustain ABM performance during the Y-Balance Test, as abdominal muscle
activity increased with ABM performance during all trials, and moving-side external oblique
(MES) activity increased during ANT reach trials. This suggests that individuals can incorporate
this protective strategy during a dynamic functional lower extremity task. This finding further
supports the functional utility of VPAC, which is consistent with previous investigators
(McGalliard et al., 2010; Nagar et al., 2014). In addition, during trials with the ABM, a general
decrease in lower limb muscle activity occurred. Quadriceps activity decreased during trials in
Texas Tech University Health Sciences Center, Troy L. Hooper, May 2015
186
all three directions, although only in the control group during ANT reach. Moreover, gluteus
maximus (GMax) activity decreased during PL trials, and biceps femoris (BF) and
semitendinosus (ST) activity decreased during PM reach. The only muscle to increase activity
was the gluteus medius (GMed) in the hxLBP group during the PM trials. This general decrease
in muscle activity with ABM performance may be the result of improved pelvic stability creating
a more stable proximal base and allowing more efficient distal kinetic chain mobility, which
would lessen the need for the prime movers of the knee to contribute to force production and
allow them to instead control the precision with which the foot is placed (Kibler et al., 2006).
Additionally, ABM performance changed several kinematic variables, especially during
ANT reach trials. For all groups, reach with ABM performance in the ANT direction resulted in
less trunk extension, side bending toward the stance leg, anterior pelvic tilt, hip internal rotation,
and knee adduction. These outcomes suggest increased trunk stability and control in response to
volitional abdominal activity. The ABM produced changes in the PL trials, where pelvic tilt
toward the stance leg decreased with ABM performance. In the PM direction, hip flexion
increased and anterior pelvic tilt decreased with ABM in the control group only. Ankle
dorsiflexion increased in all three groups, however. All of these outcomes suggest increased
trunk stability and control in response to volitional abdominal activity, which could have positive
implications for lower extremity injury prevention.
We additionally hypothesized that reach distances would not change with ABM
performance. This hypothesis was supported for all three groups in each direction. Because
AMB performance improved lower extremity muscle activity and movement patterns without
affecting performance outcomes, individuals can effectively incorporate this technique during
Texas Tech University Health Sciences Center, Troy L. Hooper, May 2015
187
functional activities. Finally, we hypothesized that the effects of VPAC performance would not
differ between the control and LBP groups. This hypothesis was partially supported, but several
of the changes produced by ABM performance were limited to the control group, suggesting that
ABM’s effectiveness may be diminished in those with current LBP or a LBP history. Therefore,
these individuals may benefit from ABM training and further research is merited for examining
such training effects.
CONCLUSION
The studies in this dissertation revealed that the Y-Balance Test detected dynamic
balance deficits in individuals with current LBP and those with a LBP history who are currently
pain-free. In addition, people in these two groups adopted a different movement strategy than
the control group, especially during ANT reach. The ABM resulted in trunk and lower limb
changes that may be beneficial for lower extremity injury prevention but did not affect reach
distances. This suggests that ABM performance may be a beneficial strategy to use during
functional movements. Clinically, the Y-Balance Test should be incorporated into a LBP
rehabilitation program to evaluate dynamic balance and monitor rehabilitation progression. In
addition, improving trunk flexion during functional activities may benefit LBP sufferers, and
these individuals can incorporate VPAC maneuvers using the ABM to improve lumbopelvic
stability and lower quarter biomechanics without degrading performance.
Limitations of the Study
Several limitations need to be recognized. The Y-Balance Test is a subset of the more
comprehensive SEBT. The PL, PM, and ANT directions used by the Y-Balance Test were
Texas Tech University Health Sciences Center, Troy L. Hooper, May 2015
188
chosen based on studies of individuals with chronic ankle instability (Plisky et al., 2006) and
may not be the optimal directions for use in LBP populations. While power calculations
revealed that the sample size was adequate for examining reach performance differences, low
power values for several kinematic variables with moderate to large effect sizes suggest that a
larger sample size would have resulted in a greater number of statistically significant results.
Regarding the EMG variables, instrumentation errors forced us to eliminate data from several
muscles in a number of subjects, and the notch filter at 100 and 200 Hz removed valid signal
along with the noise detected at those frequencies. Additionally, the submaximal reference
contraction used to normalize EMG activity resulted in a high degree of variability for the
normalized EMG values during testing, which resulted in a non-normal statistical distribution.
Nonparametric testing revealed similar results to the parametric analyses, so we chose to report
the more powerful parametric results. These issues might raise questions regarding the validity
of the EMG results. The mean current pain level for the cLBP group was 3.03±1.40. Higher
pain levels may affect performance to a greater extent than in the current study. Finally,
variables other than LBP status or the other variables assessed in the correlation analyses may
have affected Y-Balance Test performance. For example, lower limb strength or flexibility may
have an influence on test scores.
DELIMITATIONS OF THE STUDY
This study sampled a population with recurrent LBP with relatively low current pain and
disability levels. As a result, the outcomes should not be generalized to populations with higher
pain or disability levels. In addition, similar testing in individuals with chronic, neurologically
sensitized LBP may lead to results that differ from ours. Even though age was not correlated
Texas Tech University Health Sciences Center, Troy L. Hooper, May 2015
189
with reach scores, our sample was limited to subjects age 18-50 years old, and the relatively
young age of the overall sample limits the application of our results to older populations.
RECOMMENDATIONS FOR FUTURE RESEARCH
Successful Y-Balance Test performance requires the interaction of many variables and
may be limited by factors other than dynamic balance. The influence of possible confounding
factors on Y-Balance Test scores in LBP populations requires further study. In particular, future
studies should include those with greater disability and pain levels. Few correlations were found
between the variables studied and Y-Balance Test reach distances; however, the small sample
size and limited variability of most measurements limits the usefulness of these results. In
addition, other variables that were not examined, such as lower extremity strength and flexibility,
need to be assessed in order to fully understand the factors that contribute Y-Balance Test scores
in these groups. The Y-Balance Test is a subset of the more comprehensive SEBT. The optimal
reach directions to detect dynamic balance deficits in LBP groups is unknown, so future studies
are needed to determine the optimal testing directions in these individuals.
The effects of VPAC performance on trunk and lower extremity control variables require
further examination. The VPAC strategy chosen in this study was the ABM, but future studies
should explore the effects of the ADIM on these variables. In addition the effects of VPAC
performance during more dynamic activities, such as cutting and landing, or during endurance
events, such as running, could be studied. Finally, these dynamic activities are often performed
in a distracting environment, so the effects of VPAC activity in these situations need further
investigation.
Texas Tech University Health Sciences Center, Troy L. Hooper, May 2015
190
REFERENCES Adams, M. A., & Dolan, P. (1995). Recent advances in lumbar spinal mechanics and their
clinical significance. Clinical Biomechanics, 10(1), 3–19. Ahern, D. K., Follick, M. J., Council, J. R., Laser-Wolston, N., & Litchman, H. (1988).
Comparison of lumbar paravertebral EMG patterns in chronic low back pain patients and non-patient controls. Pain, 34(2), 153–160.
Akbari, M., Karimi, H., Farahini, H., & Faghihzadeh, S. (2006). Balance problems after unilateral lateral ankle sprains. Journal of Rehabilitation Research and Development, 43(7), 819–824.
Akuthota, V., & Nadler, S. F. (2004). Core strengthening. Archives of Physical Medicine and Rehabilitation, 85(Supplement 1), 86–92.
Allison, G. T., Godfrey, P., & Robinson, G. (1998). EMG signal amplitude assessment during abdominal bracing and hollowing. Journal of Electromyography and Kinesiology, 8(1), 51–57.
Almeida, G. P., de Souza, V. L., Sano, S. S., Saccol, M. F., & Cohen, M. (2012). Comparison of hip rotation range of motion in judo athletes with and without history of low back pain. Manual Therapy, 17, 231–355.
Aminaka, N., & Gribble, P. A. (2008). Patellar taping, patellofemoral pain syndrome, lower extremity kinematics, and dynamic postural control. Journal of Athletic Training, 43(1), 21–28.
Andersson, G. B. (1999). Epidemiological features of chronic low-back pain. Lancet, 354(9178), 581–585.
Arendt, E., & Dick, R. W. (1995). Knee injury patterns among men and women in collegiate basketball and soccer. NCAA data and review of literature. American Journal of Sports Medicine, 23(6), 694–701.
Aruin, A. S., & Latash, M. L. (1995). Directional specificity of postural muscles in feed-forward postural reactions during fast voluntary arm movements. Experimental Brain Research, 103, 323–332.
Bacsi, A. M., & Colebatch, J. G. (2004). Evidence for reflex and perceptual vestibular contributions to postural control. Experimental Brain Research, 160(1), 22–28.
Baecke, J. A., Burema, J., & Frijters, J. E. (1982). A short questionnaire for the measurement of habitual physical activity in epidemiological studies. The American Journal of Clinical Nutrition, 36(5), 936–942.
Barbero, M., Merletti, R., & Rainoldi, A. (2012). Atlas of muscle innervation zones: understanding surface electromyography and its applications. Milan: Springer.
Barker, K. L., Shamley, D. R., & Jackson, D. (2004a). Changes in the cross-sectional area of multifidus and psoas in patients with unilateral back pain: the relationship to pain and disability. Spine, 29(22), E515–E519.
Texas Tech University Health Sciences Center, Troy L. Hooper, May 2015
191
Barker, P. J., Briggs, C. A., & Bogeski, G. (2004b). Tensile transmission across the lumbar fasciae in unembalmed cadavers: Effects of tension to various muscular attachments. Spine, 29(2), 129–138.
Barker, P. J., Guggenheimer, K. T., Grkovic, I., Briggs, C. A., Jones, D. C., Thomas, C. D. L., & Hodges, P. W. (2006). Effects of tensioning the lumbar fasciae on segmental stiffness during flexion and extension: Young Investigator Award winner. Spine, 31(4), 397–405.
Barker, P. J., Urquhart, D. M., Story, I. H., Fahrer, M., & Briggs, C. A. (2007). The middle layer of lumbar fascia and attachments to lumbar transverse processes: implications for segmental
Barr, K. P., Griggs, M., & Cadby, T. (2005). Lumbar stabilization: core Concepts and current literature, Part 1. American Journal of Physical Medicine and Rehabilitation, 84(6), 473–480.
Bell, A. L., Brand, R. A., & Pedersen, D. R. (1989). Prediction of hip joint centre location from external landmarks. Human Movement Science, 8(1), 3–16.
Bell, D. R., Guskiewicz, K. M., Clark, M. A., & Padua, D. A. (2011). Systematic review of the balance error scoring system. Sports Health, 3(3), 287–295.
Bennell, K. L., Cowan, S. M., Schache, A., Brukner, P., Hodges, P. W., Coburn, P., & Crossley, K. M. (2004). Delayed onset of transversus abdominus in long-standing groin pain. Medicine and Science in Sports and Exercise, 36(12), 2040–2045.
Bergmann, G., Graichen, F., & Rohlmann, A. (1993). Hip joint loading during walking and running, measured in two patients. Journal of Biomechanics, 26(8), 969–990.
Bergmark, A. (1989). Stability of the lumbar spine. A study in mechanical engineering. Acta Orthopaedica Scandinavica. Supplementum, 230, 1–54.
Bewyer, K. J., Bewyer, D. C., Messenger, D., & Kennedy, C. M. (2009). Pilot data: Association between gluteus medius weakness and low back pain during pregnancy. The Iowa Orthopaedic Journal, 29, 97–99.
Blackburn, J. T., & Padua, D. A. (2009). Sagittal-plane trunk position, landing forces, and quadriceps electromyographic activity. Journal of Athletic Training, 44(2), 174–179.
Boden, B. P., Dean, G. S., Feagin, J. A., & Garrett, W. E. (2000). Mechanisms of anterior cruciate ligament injury. Orthopedics, 23(6), 573–578.
Bogduk, N. (2012). Clinical and Radiological Anatomy of the Lumbar Spine (5 ed.). Edinburgh, Scotland: Elsevier Health Sciences.
Bogduk, N., Macintosh, J. E., & Pearcy, M. J. (1992). A universal model of the lumbar back muscles in the upright position. Spine, 17(8), 897–913.
Boling, M. C., Padua, D. A., Marshall, S. W., Guskiewicz, K. M., Pyne, S., & Beutler, A. I. (2009). A prospective investigation of biomechanical risk factors for patellofemoral pain syndrome: The Joint Undertaking to Monitor and Prevent ACL Injury (JUMP-ACL) cohort. American Journal of Sports Medicine, 37, 2108–2116.
Texas Tech University Health Sciences Center, Troy L. Hooper, May 2015
192
Boling, M. C., Padua, D., Marshall, S., Guskiewicz, K. M., Pyne, S., & Beutler, A. (2010). Gender differences in the incidence and prevalence of patellofemoral pain syndrome. Scandinavian Journal of Medicine and Science in Sports, 20(5), 725–730.
Borghuis, J., Hof, A. L., & Lemmink, K. A. P. M. (2008). The importance of sensory-motor control in providing core stability: Implications for measurement and training. Sports Medicine, 38(11), 893–916.
Bouche, K., Stevens, V., Cambier, D., Caemaert, J., & Danneels, L. A. (2005). Comparison of postural control in unilateral stance between healthy controls and lumbar discectomy patients with and without pain. European Spine Journal, 15(4), 423–432.
Bouillon, L. E., & Baker, J. L. (2011). Dynamic balance differences as measured by the star excursion balance test between adult-aged and middle-aged women. Sports Health, 3(5), 466–469.
Bove, M., Nardone, A., & Schieppati, M. (2009). Effects of leg muscle tendon vibration on group Ia and group II reflex responses to stance perturbation in humans. Journal of Physiology, 550(2), 617–630.
Bressel, E., Yonker, J. C., Kras, J., & Heath, E. M. (2007). Comparison of static and dynamic balance in female collegiate soccer, basketball, and gymnastics athletes. Journal of Athletic Training, 42(1), 42–46.
Brismée, J. M., Nagar, V. R., Sawyer, S. F., James, C. R., & Hooper, T. L. (2013). The effects of volitional preemptive abdominal contraction on postural control responses. Presented at the Association of Academic Physiciatrists, New Orleans, LA.
Brown, S. H. M., Vera-Garcia, F. J., & McGill, S. M. (2006). Effects of abdominal muscle coactivation on the externally preloaded trunk: variations in motor control and its effect on spine stability. Spine, 31(13), E387–93.
Bruijn, S. M., van den Hoorn, W., Meijer, O. G., Hodges, P. W., & van Dieën, J. H. (2012). Mechanical coupling between transverse plane pelvis and thorax rotations during gait is higher in people with low back pain. Journal of Biomechanics, 45(2), 342–347.
Brumagne, S., Cordo, P., & Verschueren, S. (2004). Proprioceptive weighting changes in persons with low back pain and elderly persons during upright standing. Neuroscience Letters, 366(1), 63–66.
Burden, A. (2010). How should we normalize electromyograms obtained from healthy participants? What we have learned from over 25 years of research. Journal of Electromyography and Kinesiology, 20(6), 1023–1035.
Butler, R. J., Willson, J. D., Petrowitz, I., & Kernozek, T. W. (2012). Male and female gluteal muscle activity and lower extremity kinematics during running. Clinical Biomechanics, 27(10), 1052–1057.
Carlsson, A. M. (1983). Assessment of chronic pain. I. Aspects of the reliability and validity of the visual analogue scale. Pain, 16(1), 87–101.
Texas Tech University Health Sciences Center, Troy L. Hooper, May 2015
193
Carpenter, M. G., Tokuno, C. D., Thorstensson, A., & Cresswell, A. G. (2008). Differential control of abdominal muscles during multi-directional support-surface translations in man. Experimental Brain Research, 188(3), 445–455.
Cassisi, J. E., Robinson, M. E., O'Conner, P., & MacMillan, M. (1993). Trunk strength and lumbar paraspinal muscle activity during isometric exercise in chronic low-back pain patients and controls. Spine, 18(2), 245–251.
Cavanaugh, J. T., Guskiewicz, K. M., & Stergiou, N. (2005). A nonlinear dynamic approach for evaluating postural control: new directions for the management of sport-related cerebral concussion. Sports Medicine, 35(11), 935–950.
Cedraschi, C., Robert, J., Goerg, D., Perrin, E., Fischer, W., & Vischer, T. L. (1999). Is chronic non-specific low back pain chronic? Definitions of a problem and problems of a definition. The British Journal of General Practice, 49(442), 358–362.
Chen, W.-J., Chiou, W. K., Lee, Y.-H., Lee, M.-Y., & Chen, M.-L. (1998). Myo-electric behavior of the trunk muscles during static load holding in healthy subjects and low back pain patients. Clinical Biomechanics, 13, S9–S15.
Cholewicki, J., & McGill, S. M. (1996). Mechanical stability of the in vivo lumbar spine: implications for injury and chronic low back pain. Clinical Biomechanics, 11(1), 1–15.
Cholewicki, J., Greene, H. S., Polzhofer, G. K., Galloway, M. T., Shah, R. A., & Radebold, A. (2002a). Neuromuscular function in athletes following recovery from a recent acute low back injury. Journal of Orthopaedic and Sports Physical Therapy, 32(11), 568–575.
Cholewicki, J., Ivancic, P. C., & Radebold, A. (2002b). Can increased intra-abdominal pressure in humans be decoupled from trunk muscle co-contraction during steady state isometric exertions? European Journal of Applied Physiology, 87, 127–33.
Cholewicki, J., Juluru, K., & McGill, S. M. (1999a). Intra-abdominal pressure mechanism for stabilizing the lumbar spine. Journal of Biomechanics, 32(1), 13–17.
Cholewicki, J., Juluru, K., Radebold, A., Panjabi, M. M., & McGill, S. M. (1999b). Lumbar spine stability can be augmented with an abdominal belt and/or increased intra-abdominal pressure. European Spine Journal, 8, 388–395.
Cholewicki, J., Shah, R. A., Silfies, S. P., Greene, H. S., Reeves, N. P., Alvi, K., & Goldberg, B. (2005). Delayed trunk muscle reflex responses increase the risk of low back injuries. Spine, 30, 2614–2620.
Chuter, H. V., & de Jonge, X. A. (2012). Proximal and distal contributions to lower extremity injury: A review of the literature. Gait and Posture, 36, 7–15.
Cichanowski, H. R., Schmitt, J. S., Johnson, R. J., & Niemuth, P. E. (2007). Hip strength in collegiate female athletes with patellofemoral pain., 39(8), 1227–1232.
Claiborne, T. L., Armstrong, C. W., Gandhi, V., & Pincivero, D. M. (2006). Relationship between hip and knee strength and knee valgus during a single leg squat. Journal of Applied Biomechanics, 22(1), 41–50.
Texas Tech University Health Sciences Center, Troy L. Hooper, May 2015
194
Congdon, R., Bohannon, R., & Tiberio, D. (2005). Intrinsic and imposed hamstring length influence posterior pelvic rotation during hip flexion. Clinical Biomechanics, 20(9), 947–951.
Cook, C., Brismée, J. M., & Sizer, P. S. (2006). Subjective and objective descriptors of clinical lumbar spine instability: a Delphi study. Manual Therapy, 11(1), 11–21.
Coughlan, G. F., Fullam, K., Delahunt, E., Gissane, C., & Caulfield, B. M. (2012). A comparison between performance on selected directions of the star excursion balance test and the Y balance test. Journal of Athletic Training, 47, 366–371. http://doi.org/10.4085/1062-6050-47.4.03
Cowan, S. M., Crossley, K. M., & Bennell, K. L. (2009). Altered hip and trunk muscle function in individuals with patellofemoral pain. British Journal of Sports Medicine, 43(8), 584–588.
Cowling, E. J., & Steele, J. R. (2001). Is lower limb muscle synchrony during landing affected by gender? Implications for variations in ACL injury rates. Journal of Electromyography and Kinesiology, 11(4), 263–268.
Cresswell, A. G., Oddsson, L., & Thorstensson, A. (1994). The influence of sudden perturbations on trunk muscle activity and intra-abdominal pressure while standing. Experimental Brain Research, 98(2), 336–341.
Crisco, J. J., & Panjabi, M. M. (1991). The intersegmental and multisegmental muscles of the lumbar spine. A biomechanical model comparing lateral stabilizing potential. Spine, 16(7), 793–799.
Cynn, H.-S., Oh, J.-S., Kwon, O.-Y., & Yi, C.-H. (2006). Effects of lumbar stabilization using a pressure biofeedback unit on muscle activity and lateral pelvic tilt during hip abduction in sidelying. Archives of Physical Medicine and Rehabilitation, 87(11), 1454–1458.
Dankaerts, W., O'Sullivan, P. B., Burnett, A., Straker, L. M., & Danneels, L. A. (2004). Reliability of EMG measurements for trunk muscles during maximal and sub-maximal voluntary isometric contractions in healthy controls and CLBP patients. Journal of Electromyography and Kinesiology, 14(3), 333–342.
Dankaerts, W., O'Sullivan, P., Burnett, A., & Straker, L. (2006). Altered patterns of superficial trunk muscle activation during sitting in nonspecific chronic low back pain patients: importance of subclassification. Spine, 31(17), 2017–2023.
Danneels, L. A., Coorevits, P. L., Cools, A. M., Vanderstraeten, G. G., Cambier, D. C., Witvrouw, E. E., & De Cuyper, H. J. (2002). Differences in electromyographic activity in the multifidus muscle and the iliocostalis lumborum between healthy subjects and patients with sub-acute and chronic low back pain. European Spine Journal, 11(1), 13–19.
Danneels, L. A., Vanderstraeten, G. G., Cambier, D. C., Witvrouw, E. E., & De Cuyper, H. J. (2000). CT imaging of trunk muscles in chronic low back pain patients and healthy control subjects. European Spine Journal, 9(4), 266–272.
Davidson, K. L. C., & Hubley-Kozey, C. L. (2005). Trunk muscle responses to demands of an exercise progression to improve dynamic spinal stability. Archives of Physical Medicine and
Texas Tech University Health Sciences Center, Troy L. Hooper, May 2015
195
Rehabilitation, 86(2), 216–223. De Luca, C. J. (1997). The use of surface electromyography in biomechanics. Journal of Applied
Biomechanics, 13, 135–163. de Vet, H. C. W., Heymans, M. W., Dunn, K. M., Pope, D. P., van der Beek, A. J., Macfarlane,
G. J., et al. (2002). Episodes of low back pain: A proposal for uniform definitions to be used in research. Spine, 27(21), 2409–2416.
Decker, M. J., Torry, M. R., Wyland, D. J., Sterett, W. I., & Richard Steadman, J. (2003). Gender differences in lower extremity kinematics, kinetics and energy absorption during landing. Clinical Biomechanics, 18(7), 662–669.
Devlin, L. (2000). Recurrent posterior thigh symptoms detrimental to performance in rugby union: Predisposing factors. Sports Medicine, 29, 273–287.
Deyo, R. A., & Weinstein, J. N. (2001). Low back pain. The New England Journal of Medicine, 344(5), 363–370.
Dionne, C. E., Buchbinder, R., Dunn, K. M., Croft, P. R., Nachemson, A. L., Walker, B. F., et al. (2008). A consensus approach toward the standardization of back pain definitions for use in prevalence studies. Spine, 33(1), 95–103.
Dunn, K. M., & Croft, P. R. (2006). The importance of symptom duration in determining prognosis. Pain, 121(1), 126–132.
Durall, C. J., Kernozek, T. W., Kersten, M., Nitz, M., Setz, J., & Beck, S. (2011). Associations between single-leg postural control and drop-landing mechanics in healthy women. Journal of Sport Rehabilitation, 20(4), 406–418.
Earl, J. E., & Hertel, J. (2001). Lower-extremity muscle activation during the star excursion balance tests. Journal of Sport Rehabilitation, 10, 93–104.
Ebben, W. P., Fauth, M. L., Petushek, E. J., Garceau, L. R., Hsu, B. E., Lutsch, B. N., & Feldmann, C. R. (2010). Gender-based analysis of hamstring and quadriceps muscle activation during jump landings and cutting. Journal of Strength and Conditioning Research, 24(2), 408–415.
Ellison, J. B., Rose, S. J., & Sahrmann, S. A. (1990). Patterns of hip rotation range of motion: A comparison between healthy subjects and patients with low back pain. Physical Therapy, 70(9), 537–541.
Emami, M.-J., Ghahramani, M.-H., Abdinejad, F., & Namazi, H. (2007). Q-angle: An invaluable parameter for evaluation of anterior knee pain. Archives of Iranian Medicine, 10(1), 24–26.
Esola, M. A., McClure, P. W., Fitzgerald, G. K., & Siegler, S. (1996). Analysis of lumbar spine and hip motion during forward bending in subjects with and without a history of low back pain. Spine, 21, 71–78.
Fabian, S., Hesse, H., Grassme, R., Bradl, I., & Bernsdorf, A. (2005). Muscular activation patterns of healthy persons and low back pain patients performing a functional capacity evaluation test. Pathophysiology, 12, 281–287.
Texas Tech University Health Sciences Center, Troy L. Hooper, May 2015
196
Farahmand, F., Tahmasbi, M. N., & Amis, A. A. (1998). Lateral force-displacement behaviour of the human patella and its variation with knee flexion--a biomechanical study in vitro. Journal of Biomechanics, 31(12), 1147–1152.
Ferguson, S. A., Marras, W. S., Burr, D. L., Davis, K. G., & Gupta, P. (2004). Differences in motor recruitment and resulting kinematics between low back pain patients and asymptomatic participants during lifting exertions. Clinical Biomechanics, 19(10), 992–999.
Fernandez-Pena, E., Lucertini, F., & Ditroilo, M. (2009). A maximal isokinetic pedalling exercise for EMG normalization in cycling. Journal of Electromyography and Kinesiology, 19(3), e162–170.
Ferreira, P. H., Ferreira, M. L., & Hodges, P. W. (2004). Changes in recruitment of the abdominal muscles in people with low back pain: Ultrasound measurement of muscle activity. Spine, 29(22), 2560–2566.
Filipa, A., Byrnes, R., Paterno, M. V., Myer, G. D., & Hewett, T. E. (2010). Neuromuscular training improves performance on the star excursion balance test in young female athletes. Journal of Orthopaedic and Sports Physical Therapy, 40(9), 551–558.
Finnoff, J. T., Hall, M. M., Kyle, K., Krause, D. A., Lai, J., & Smith, J. (2011). Hip strength and knee pain in high school runners: a prospective study. Pm&R, 3(9), 792–801.
Fithian, D. C., Mishra, D. K., Balen, P. F., Stone, M. L., & Daniel, D. M. (1995). Instrumented measurement of patellar mobility. American Journal of Sports Medicine, 23(5), 607–615.
Fong, D. T.-P., Hong, Y., & Li, J.-X. (2008). Lower extremity preventative measures for slips - Joint moments and myoelectric analysis. Ergonomics, 51(12), 1830–1846.
Fredericson, M., & Wolf, C. (2005). Iliotibial band syndrome in runners: innovations in treatment. Sports Medicine, 35(5), 451–459.
Fredericson, M., Cookingham, C. L., Chaudhari, A. M., Dowdell, B. C., Oestreicher, N., & Sahrmann, S. A. (2000). Hip abductor weakness in distance runners with iliotibial band syndrome. Clin J Sport Med, 10(3), 169–175.
Freeman, M. D., Woodham, A. W., & Woodham, M. A. (2010). The role of the lumbar multifidus in chronic low back pain: A review. Pm&R, 2(2), 142–146.
Frymoyer, J. W. (1988). Back pain and sciatica. The New England Journal of Medicine, 318(5), 291–300. http://doi.org/10.1056/NEJM198802043180506
Ganesh, G. S., Ganesh, G. S., Chhabra, D., Chhabra, D., & Mrityunjay, K. (2014). Efficacy of the star excursion balance test in detecting reach deficits in subjects with chronic low back pain. Physiotherapy Research International. http://doi.org/10.1002/pri.1589
Gardner-Morse, M. G., & Stokes, I. A. (1998). The effects of abdominal muscle coactivation on lumbar spine stability. Spine, 23(1), 86–91.
Geisser, M. E., Haig, A. J., Wallbom, A. S., & Wiggert, E. A. (2004). Pain-related fear, lumbar flexion, and dynamic EMG among persons with chronic musculoskeletal low back pain. The Clinical Journal of Pain, 20(2), 61–69.
Texas Tech University Health Sciences Center, Troy L. Hooper, May 2015
197
Geisser, M. E., Ranavaya, M., Haig, A. J., Roth, R. S., Zucker, R., Ambroz, C., & Caruso, M. (2005). A meta-analytic review of surface electromyography among persons with low back pain and normal, healthy controls. Journal of Pain, 6(11), 711–726.
Gordon, A. T., Ambegaonkar, J. P., & Caswell, S. V. (2013). Relationships between core strength, hip external rotator muscle strength, and star excursion balance test performance in female lacrosse players. International Journal of Sports Physical Therapy, 8(2), 97–104.
Graci, V., van Dillen, L. R., & Salsich, G. B. (2012). Gender differences in trunk, pelvis and lower limb kinematics during a single leg squat. Gait and Posture.
Granata, K. P., & Marras, W. S. (2000). Cost-benefit of muscle cocontraction in protecting against spinal instability. Spine, 25(11), 1398–1404.
Granata, K. P., Orishimo, K. F., & Sanford, A. H. (2001). Trunk muscle coactivation in preparation for sudden load. Journal of Electromyography and Kinesiology, 11(4), 247–254.
Gray, G. W. (1995). Lower Extremity Functional Profile. Adrian, MI: Wynn Marketing. Greene, H. S., Cholewicki, J., Galloway, M. T., Nguyen, C. V., & Radebold, A. (2001). A
history of low back injury is a risk factor for recurrent back injuries in varsity athletes. American Journal of Sports Medicine, 29(6), 795–800.
Grenier, S. G., & McGill, S. M. (2007). Quantification of lumbar stability by using 2 different abdominal activation strategies. Archives of Physical Medicine and Rehabilitation, 88(1), 54–62.
Gribble, P. A., & Hertel, J. (2003). Considerations for normalizing measures of the Star Excursion Balance Test. Measurement in Physical Education and Exercise Science, 7, 89–100.
Gribble, P. A., Hertel, J., & Denegar, C. R. (2007). Chronic ankle instability and fatigue create proximal joint alterations during performance of the Star Excursion Balance Test. International Journal of Sports Medicine, 28(3), 236–242.
Gribble, P. A., Hertel, J., & Plisky, P. (2012). Using the Star Excursion Balance Test to assess dynamic postural-control deficits and outcomes in lower extremity injury: a literature and systematic review. Journal of Athletic Training, 47(3), 339–357.
Gribble, P. A., Hertel, J., Denegar, C. R., & Buckley, W. E. (2004). The effects of fatigue and chronic ankle instability on dynamic postural control. Journal of Athletic Training, 39(4), 321–329.
Guskiewicz, K. M. (2011). Regaining Postural Stability and Balance. In W. E. Prentice, Rehabilitation Techniques for Sports Medicine and Athletic Training (5 ed., pp. 144–174). New York: McGraw-Hill.
Haddas, R., James, C. R., Sawyer, S. F., Sizer, P. S., Brooks, T., & Chyu, M. C. (2013). Effects of Volitional Spine Stabilization and Lower Extremity Fatigue on Landing Performance in a Recurrent Low Back Pain Population. Texas Tech University Health Sciences Center, Lubbock, TX.
Texas Tech University Health Sciences Center, Troy L. Hooper, May 2015
198
Hagglund, M. (2006). Previous injury as a risk factor for injury in elite football: A prospective study over two consecutive seasons. British Journal of Sports Medicine, 40(9), 767–772.
Hale, S. A., Hertel, J., & Olmsted-Kramer, L. C. (2007). The effect of a 4-week comprehensive rehabilitation program on postural control and lower extremity function in individuals with chronic ankle instability. Journal of Orthopaedic and Sports Physical Therapy, 37(6), 303–311.
Hamill, J., Moses, M., & Seay, J. F. (2009). Lower extremity joint stiffness in runners with low back pain. Research in Sports Medicine, 17, 260–73.
Hammill, R. R., Beazell, J. R., & Hart, J. M. (2008). Neuromuscular consequences of low back pain and core dysfunction. Clinics in Sports Medicine, 27, 449–62, ix. http://doi.org/10.1016/j.csm.2008.02.005
Hart, J. M., Fritz, J. M., Kerrigan, D. C., Saliba, E. N., Gansneder, B. M., & Ingersoll, C. D. (2006a). Reduced quadriceps activation after lumbar paraspinal fatiguing exercise. Journal of Athletic Training, 41, 79–86.
Hart, J. M., Kerrigan, D. C., Fritz, J. M., Saliba, E. N., Gansneder, B. M., & Ingersoll, C. D. (2006b). Contribution of hamstring fatigue to quadriceps inhibition following lumbar extension exercise. Journal of Sports Science and Medicine, 5, 70–79.
Hart, J. M., Weltman, A., & Ingersoll, C. D. (2010). Quadriceps activation following aerobic exercise in persons with low back pain and healthy controls. Clinical Biomechanics, 25, 847–851.
Henry, S. M., Fung, J., & Horak, F. B. (1998). EMG responses to maintain stance during multidirectional surface translations. Journal of Neurophysiology, 80, 1939–1950.
Herrington, L., Hatcher, J., Hatcher, A., & McNicholas, M. (2009). A comparison of star excursion balance test reach distances between acl deficient patients and asymptomatic controls. The Knee, 16(2), 149–152.
Hertel, J. (2008). Sensorimotor deficits with ankle sprains and chronic ankle instability. Clinics in Sports Medicine, 27(3), 353–370.
Hertel, J., Braham, R. A., Hale, S. A., & Olmsted-Kramer, L. C. (2006). Simplifying the star excursion balance test: analyses of subjects with and without chronic ankle instability. Journal of Orthopaedic and Sports Physical Therapy, 36(3), 131–137.
Hertel, J., Miller, S. J., & Denegar, C. R. (2000). Intratester and intertester reliability during the Star Excursion Balance Tests. Journal of Sport Rehabilitation, 9, 104–116.
Hestbaek, L., Leboeuf-Yde, C., & Manniche, C. (2003). Low back pain: What is the long-term course? A review of studies of general patient populations. European Spine Journal, 12(2), 149–165.
Hewett, T. E., & Myer, G. D. (2011). The mechanistic connection between the trunk, knee, and ACL injury. Exercise and Sport Sciences Reviews, 39(4), 161–166.
Hewett, T. E., Lindenfeld, T. N., Riccobene, J. V., & Noyes, F. R. (1999). The effect of
Texas Tech University Health Sciences Center, Troy L. Hooper, May 2015
199
neuromuscular training on the incidence of knee injury in female athletes. A prospective study. American Journal of Sports Medicine, 27(6), 699–706.
Hewett, T. E., Myer, G. D., Ford, K. R., Heidt, R. S., Colosimo, A. J., McLean, S. G., et al. (2005). Biomechanical measures of neuromuscular control and valgus loading of the knee predict anterior cruciate ligament injury risk in female athletes: A prospective study. American Journal of Sports Medicine, 33(4), 492–501.
Hewett, T. E., Torg, J. S., & Boden, B. P. (2009). Video analysis of trunk and knee motion during non-contact anterior cruciate ligament injury in female athletes: Lateral trunk and knee abduction motion are combined components of the injury mechanism. British Journal of Sports Medicine, 43(6), 417–422.
Hides, J. A., Brown, C. T., Penfold, L., & Stanton, W. R. (2011). Screening the lumbopelvic muscles for a relationship to injury of the quadriceps, hamstrings, and adductor muscles among elite Australian Football League players. Journal of Orthopaedic and Sports Physical Therapy, 41(10), 767–775.
Hides, J. A., Gilmore, C., Stanton, W. R., & Bohlscheid, E. (2008). Multifidus size and symmetry among chronic LBP and healthy asymptomatic subjects. Manual Therapy, 13(1), 43–49.
Hides, J. A., Jull, G. A., & Richardson, C. A. (2001). Long-term effects of specific stabilizing exercises for first-episode low back pain. Spine, 26, E243–E248.
Hides, J. A., Richardson, C. A., & Jull, G. A. (1996). Multifidus muscle recovery is not automatic after resolution of acute, first-episode low back pain. Spine, 21(23), 2763–2769.
Hides, J. A., Stokes, M. J., Saide, M., Jull, G. A., & Cooper, D. H. (1994). Evidence of lumbar multifidus muscle wasting ipsilateral to symptoms in patients with acute/subacute low back pain. Spine, 19(2), 165–172.
Hodges, P. W. (1999). Is there a role for transversus abdominis in lumbo-pelvic stability? Manual Therapy, 4(2), 74–86.
Hodges, P. W. (2003). Core stability exercise in chronic low back pain. Orthopedic Clinics of North America, 34(2), 245–254.
Hodges, P. W., & Richardson, C. A. (1996). Inefficient muscular stabilization of the lumbar spine associated with low back pain. A motor control evaluation of transversus abdominis. Spine, 21, 2640–2650.
Hodges, P. W., & Richardson, C. A. (1997a). Contraction of the abdominal muscles associated with movement of the lower limb. Physical Therapy, 77, 132–142.
Hodges, P. W., & Richardson, C. A. (1997b). Feedforward contraction of transversus abdominis is not influenced by the direction of arm movement. Experimental Brain Research, 114(2), 362–370.
Hodges, P. W., & Richardson, C. A. (1997c). Relationship between limb movement speed and associated contraction of the trunk muscles. Ergonomics, 40, 1220–1230.
Texas Tech University Health Sciences Center, Troy L. Hooper, May 2015
200
Hodges, P. W., & Richardson, C. A. (1998). Delayed postural contraction of transversus abdominis in low back pain associated with movement of the lower limb. Journal of Spinal Disorders, 11(1), 46–56.
Hodges, P. W., & Richardson, C. A. (1999a). Altered trunk muscle recruitment in people with low back pain with upper limb movement at different speeds. Archives of Physical Medicine and Rehabilitation, 80(9), 1005–1012.
Hodges, P. W., & Richardson, C. A. (1999b). Transversus abdominis and the superficial abdominal muscles are controlled independently in a postural task. Neuroscience Letters, 265(2), 91–94.
Hodges, P. W., & Tucker, K. (2011). Moving differently in pain: A new theory to explain the adaptation to pain. Pain, 152(S), S90–S98.
Hodges, P. W., Eriksson, A., Shirley, D., & Gandevia, S. C. (2005). Intra-abdominal pressure increases stiffness of the lumbar spine. Journal of Biomechanics, 38, 1873–80.
Hodges, P. W., Holm, A. K., Holm, S., Ekström, L., Cresswell, A. G., Hansson, T., & Thorstensson, A. (2003a). Intervertebral stiffness of the spine is increased by evoked contraction of transversus abdominis and the diaphragm: In vivo porcine studies. Spine, 28, 2594–601.
Hodges, P. W., Moseley, G. L., Gabrielsson, A., & Gandevia, S. C. (2003b). Experimental muscle pain changes feedforward postural responses of the trunk muscles. Experimental Brain Research, 151, 262–71.
Hodges, P. W., van den Hoorn, W., Dawson, A., & Cholewicki, J. (2009). Changes in the mechanical properties of the trunk in low back pain may be associated with recurrence. Journal of Biomechanics, 42(1), 61–66.
Hollman, J. H., Ginos, B. E., Kozuchowski, J., Vaughn, A. S., Krause, D. A., & Youdas, J. W. (2009). Relationships between knee valgus, hip-muscle strength, and hip-muscle recruitment during a single-limb step-down. Journal of Sport Rehabilitation, 18(1), 104–117.
Holm, S., Indahl, A., & Solomonow, M. (2002). Sensorimotor control of the spine. Journal of Electromyography and Kinesiology, 12(3), 219–234.
Hong, J., Reed, C., Novick, D., & Happich, M. (2013). Costs associated with treatment of chronic low back pain. Spine, 38(1), 75–82.
Hooper, T. L., Sizer, P. S., James, C. R., Brismée, J. M., & Haddas, R. (2012). Effects of volitional preemptive abdominal contraction on trunk and lower extremity biomechanics and neuromuscular control during a drop vertical jump. Texas Tech University Health Sciences Center.
Hootman, J. M., Dick, R., & Agel, J. (2007). Epidemiology of collegiate injuries for 15 sports: Summary and recommendations for injury prevention initiatives. Journal of Athletic Training, 42(2), 311–319.
Hoy, D., Brooks, P., Blyth, F., & Buchbinder, R. (2010). The Epidemiology of low back pain.
Texas Tech University Health Sciences Center, Troy L. Hooper, May 2015
201
Best Practice and Research Clinical Rheumatology, 24(6), 769–781. Hrysomallis, C., McLaughlin, P., & Goodman, C. (2007). Balance and injury in elite australian
footballers. International Journal of Sports Medicine, 28(10), 844–847. Hubbard, T. J., Kramer, L. C., Denegar, C. R., & Hertel, J. (2007a). Contributing factors to
chronic ankle instability. Foot and Ankle International, 28(3), 343–354. Hubbard, T. J., Kramer, L. C., Denegar, C. R., & Hertel, J. (2007b). Correlations among multiple
measures of functional and mechanical instability in subjects with chronic ankle instability. Journal of Athletic Training, 42(3), 361–366.
Hughes, P. E., Hsu, J. C., & Matava, M. J. (2002). Hip anatomy and biomechanics in the athlete. Sports Medicine and Arthroscopy Review, 10(2), 103–114.
Hungerford, B., Gilleard, W., & Hodges, P. W. (2003). Evidence of altered lumbopelvic muscle recruitment in the presence of sacroiliac joint pain. Spine, 28(14), 1593–1600.
Huston, L. J., Vibert, B., Ashton-Miller, J. A., & Wojtys, E. M. (2001). Gender differences in knee angle when landing from a drop-jump. American Journal of Knee Surgery, 14(4), 215–219.
Iguchi, T., Ozaki, T., Chin, T., Tsumura, N., Kanemura, A., Kasahara, K., et al. (2011). Intimate relationship between instability and degenerative signs at L4/5 segment examined by flexion-extension radiography. European Spine Journal, 20(8), 1349–1354.
Iida, Y., Kanehisa, H., Inaba, Y., & Nakazawa, K. (2011). Activity modulations of trunk and lower limb muscles during impact-absorbing landing. Journal of Electromyography and Kinesiology, 21(4), 602–609.
Imwalle, L. E., Myer, G. D., Ford, K. R., & Hewett, T. E. (2009). Relationship between hip and knee kinematics in athletic women during cutting maneuvers: a possible link to noncontact anterior cruciate ligament injury and prevention. Journal of Strength and Conditioning Research, 23(8), 2223–2230.
Ireland, M. L. (2002). The female ACL: Why is it more prone to injury? Orthopedic Clinics of North America, 33(4), 637–651.
Ireland, M. L., Willson, J. D., Ballantyne, B. T., & Davis, I. M. (2003). Hip strength in females with and without patellofemoral pain. Journal of Orthopaedic and Sports Physical Therapy, 33(11), 671–676.
Itz, C. J., Geurts, J. W., van Kleef, M., & Nelemans, P. (2012). Clinical course of non-specific low back pain: A systematic review of prospective cohort studies set in primary care. European Journal of Pain, 17(1), 5–15.
Jacob, T., Baras, M., Zeev, A., & Epstein, L. (2001). Low back pain: Reliability of a set of pain measurement tools. Archives of Physical Medicine and Rehabilitation, 82(6), 735–742.
Jacobs, C. A., Uhl, T. L., Mattacola, C. G., Shapiro, R., & Rayens, W. S. (2007). Hip abductor function and lower extremity landing kinematics: Sex differences. Journal of Athletic Training, 42(1), 76–83.
Texas Tech University Health Sciences Center, Troy L. Hooper, May 2015
202
Jalovaara, P., Niinimäki, T., & Vanharanta, H. (1995). Pocket-size, portable surface EMG device in the differentiation of low back pain patients. European Spine Journal, 4(4), 210–212.
Jansen, E. C., Larsen, R. E., & Olesen, M. B. (1982). Quantitative Romberg's test. Measurement and computer calculation of postural stability. Acta Neurologica Scandinavica, 66(1), 93–99.
Kader, D. F., Wardlaw, D., & Smith, F. W. (2000). Correlation between the MRI changes in the lumbar multifidus muscles and leg pain. Clinical Radiology, 55(2), 145–149.
Kagan, A. (1999). Rotator cuff tears of the hip. Clinical Orthopaedics and Related Research, (368), 135–140.
Kaigle, A. M., Holm, S. H., & Hansson, T. H. (1995). Experimental instability in the lumbar spine. Spine, 20(4), 421–430.
Kaji, A., Sasagawa, S., Kubo, T., & Kanehisa, H. (2010). Transient effect of core stability exercises on postural sway during quiet standing. Journal of Strength and Conditioning Research, 24(2), 382–388.
Kang, Y.-M., Choi, W.-S., & Pickar, J. G. (2002). Electrophysiologic evidence for an intersegmental reflex pathway between lumbar paraspinal tissues. Spine, 27(3), E56–63.
Kankaanpää, M., Taimela, S., Laaksonen, D., Hänninen, O., & Airaksinen, O. (1998). Back and hip extensor fatigability in chronic low back pain patients and controls, 79, 412–417.
Kavcic, N., Grenier, S. G., & McGill, S. M. (2004). Determining the stabilizing role of individual torso muscles during rehabilitation exercises. Spine, 29, 1254–1265.
Kendall, F. P. (2005). Muscles: Testing and function with posture and pain (5 ed.). Baltimore, MD: Lippincott Williams & Wilkins.
Kettler, A., Hartwig, E., Schultheiss, M., Claes, L., & Wilke, H. J. (2002). Mechanically simulated muscle forces strongly stabilize intact and injured upper cervical spine specimens. Journal of Biomechanics, 35(3), 339–346.
Kibler, W. B., Press, J., & Sciascia, A. (2006). The role of core stability in athletic function. Sports Medicine, 36(3), 189–198.
Kiefer, A., Shirazi-Adl, A., & Parnianpour, M. (1997). Stability of the human spine in neutral postures. European Spine Journal, 6(1), 45–53.
Kinzey, S. J., & Armstrong, C. W. (1998). The reliability of the star-excursion test in assessing dynamic balance. Journal of Orthopaedic and Sports Physical Therapy, 27, 356–360.
Koga, H., Nakamae, A., Shima, Y., Iwasa, J., Myklebust, G., Engebretsen, L., et al. (2010). Mechanisms for noncontact anterior cruciate ligament injuries: Knee joint kinematics in 10 injury situations from female team handball and basketball. American Journal of Sports Medicine, 38(11), 2218–2225.
Korff, Von, M. (1994). Studying the natural history of back pain. Spine, 19(18 Suppl), 2041S–2046S.
Korff, Von, M., & Dunn, K. M. (2008). Chronic pain reconsidered. Pain, 138(2), 267–276.
Texas Tech University Health Sciences Center, Troy L. Hooper, May 2015
203
Kulas, A. S., Windley, T. C., & Schmitz, R. J. (2005). Effects of abdominal postures on lower extremity energetics during single-leg landings. Journal of Sport Rehabilitation, 14(1), 58–71.
Kusters, D., Vollenbroek-Hutten, M. M., & Hermens, H. J. (2011). Motor performance in chronic low back pain: is there an influence of pain-related cognitions? A pilot study. BMC Musculoskeletal Disorders, 12(1), 211.
Lamoth, C. J., Daffertshofer, A., Meijer, O. G., & Beek, P. J. (2006). How do persons with chronic low back pain speed up and slow down? Trunk-pelvis coordination and lumbar erector spinae activity during gait. Gait and Posture, 23(2), 230–239.
Lamoth, C. J., Daffertshofer, A., Meijer, O. G., Lorimer Moseley, G., Wuisman, P. I., & Beek, P. J. (2004). Effects of experimentally induced pain and fear of pain on trunk coordination and back muscle activity during walking. Clinical Biomechanics, 19(6), 551–563.
Lamoth, C. J., Meijer, O. G., Daffertshofer, A., Wuisman, P. I., & Beek, P. J. (2005). Effects of chronic low back pain on trunk coordination and back muscle activity during walking: changes in motor control. European Spine Journal, 15(1), 23–40.
Larivière, C., Arsenault, A. B., Gravel, D., Gagnon, D., & Loisel, P. (2003). Surface electromyography assessment of back muscle intrinsic properties. Journal of Electromyography and Kinesiology, 13, 305–318.
Larivière, C., Butler, H., Sullivan, M. J. L., & Fung, J. (2013). An exploratory study on the effect of pain interference and attentional interference on neuromuscular responses during rapid arm flexion movements. The Clinical Journal of Pain, 29(3), 265–275.
Larivière, C., Forget, R., Vadeboncoeur, R., Bilodeau, M., & Mecheri, H. (2010). The effect of sex and chronic low back pain on back muscle reflex responses. European Journal of Applied Physiology, 109(4), 577–590.
Larivière, C., Gagnon, D., & Loisel, P. (2000a). An application of pattern recognition for the comparison of trunk muscles EMG waveforms between subjects with and without chronic low back pain during flexion-extension and lateral bending tasks. Journal of Electromyography and Kinesiology, 10(4), 261–273.
Larivière, C., Gagnon, D., & Loisel, P. (2000b). The comparison of trunk muscles EMG activation between subjects with and without chronic low back pain during flexion-extension and lateral bending tasks. Journal of Electromyography and Kinesiology, 10(2), 79–91.
Larivière, C., Gagnon, D., & Loisel, P. (2002). A biomechanical comparison of lifting techniques between subjects with and without chronic low back pain during freestyle lifting and lowering tasks. Clinical Biomechanics, 17(2), 89–98.
Latimer, J., Maher, C. G., Refshauge, K. M., & Colaco, I. (1999). The reliability and validity of the Biering–Sorensen test in asymptomatic subjects and subjects reporting current or previous nonspecific low back pain. Spine, 24(20), 2085–2090.
Lawrence, R. K., Kernozek, T. W., Miller, E. J., Torry, M. R., & Reuteman, P. (2008). Influences of hip external rotation strength on knee mechanics during single-leg drop
Texas Tech University Health Sciences Center, Troy L. Hooper, May 2015
204
landings in females. Clinical Biomechanics, 23(6), 806–813. Lee, J. H., An, J. H., Lee, S. H., & Seo, I. S. (2010). Three-dimensional gait analysis of patients
with weakness of ankle dorsiflexor as a result of unilateral L5 radiculopathy. Journal of Back and Musculoskeletal Rehabilitation, 23(2), 49–54.
Lee, T. Q., Morris, G., & Csintalan, R. P. (2003). The influence of tibial and femoral rotation on patellofemoral contact area and pressure. Journal of Orthopaedic and Sports Physical Therapy, 33(11), 686–693.
Leetun, D. T., Ireland, M. L., Willson, J. D., Ballantyne, B. T., & Davis, I. M. (2004). Core stability measures as risk factors for lower extremity injury in athletes. Medicine and Science in Sports and Exercise, 36, 926–934.
Lehman, G. J., & McGill, S. M. (1999). The importance of normalization in the interpretation of surface electromyography: A proof of principle. Journal of Manipulative and Physiological Therapeutics, 22(7), 444–446.
Leinonen, V., Kankaanpää, M., Airaksinen, O., & Hänninen, O. (2000). Back and hip extensor activities during trunk flexion/extension: Effects of low back pain and rehabilitation. Archives of Physical Medicine and Rehabilitation, 81, 32–37.
Leinonen, V., Kankaanpää, M., Luukkonen, M., Hänninen, O., Airaksinen, O., & Taimela, S. (2001). Disc herniation-related back pain impairs feed-forward control of paraspinal muscles. Spine, 26(16), E367–72.
Leinonen, V., Kankaanpää, M., Luukkonen, M., Kansanen, M., Hänninen, O., Airaksinen, O., & Taimela, S. (2003). Lumbar paraspinal muscle function, perception of lumbar position, and postural control in disc herniation-related back pain. Spine, 28, 842–848.
Leone, A., Guglielmi, G., Cassar-Pullicino, V. N., & Bonomo, L. (2007). Lumbar intervertebral instability: A review. Radiology, 245(1), 62–77.
Lund, J. P., Donga, R., Widmer, C. G., & Stohler, C. S. (1991). The pain-adaptation model: A discussion of the relationship between chronic musculoskeletal pain and motor activity. Canadian Journal of Physiology and Pharmacology, 69(5), 683–694.
Luo, X., Pietrobon, R., Sun, S. X., Liu, G. G., & Hey, L. (2004). Estimates and patterns of direct health care expenditures among individuals with back pain in the United States. Spine, 29(1), 79–86.
Luo, Z. P., Sakai, N., Rand, J. A., & An, K. N. (1997). Tensile stress of the lateral patellofemoral ligament during knee motion. American Journal of Knee Surgery, 10(3), 139–144.
Luoto, S., Taimela, S., Hurri, H., Aalto, H., Pyykkö, I., & Alaranta, H. (1996). Psychomotor speed and postural control in chronic low back pain patients A controlled follow-up study. Spine, 21, 2621–2627.
Macdonald, D. A., Dawson, A. P., & Hodges, P. W. (2011). Behavior of the lumbar multifidus during lower extremity movements in people with recurrent low back pain during symptom remission. Journal of Orthopaedic and Sports Physical Therapy, 41, 155–164.
Texas Tech University Health Sciences Center, Troy L. Hooper, May 2015
205
Macdonald, D. A., Moseley, G. L., & Hodges, P. W. (2006). The lumbar multifidus: Does the evidence support clinical beliefs? Manual Therapy, 11, 254–263.
Macdonald, D. A., Moseley, G. L., & Hodges, P. W. (2009). Why do some patients keep hurting their back? Evidence of ongoing back muscle dysfunction during remission from recurrent back pain. Pain, 142(3), 183–188.
Macdonald, D. A., Moseley, G. L., & Hodges, P. W. (2010). People with recurrent low back pain respond differently to trunk loading despite remission from symptoms. Spine, 35(7), 818–824.
Magnusson, M. L., Aleksiev, A., Wilder, D. G., Pope, M. H., Spratt, K., Lee, S. H., et al. (1996). Unexpected load and asymmetric posture as etiologic factors in low back pain. European Spine Journal, 5(1), 23–35.
Makinejad, M. D., Osman, A., Azuan, N., Abas, W., & Bakar, W. A. (2013). Preliminary analysis of knee stress in Full Extension Landing. Clinics.
Marshall, P. W., Desai, I., & Robbins, D. W. (2011a). Core stability exercises in individuals with and without chronic nonspecific low back pain. Journal of Strength and Conditioning Research, 25(12), 3404–3411.
Marshall, P. W., Patel, H., & Callaghan, J. P. (2011b). Gluteus medius strength, endurance, and co-activation in the development of low back pain during prolonged standing. Human Movement Science, 30, 63–73.
Marshall, P., & Murphy, B. (2003). The validity and reliability of surface EMG to assess the neuromuscular response of the abdominal muscles to rapid limb movement. Journal of Electromyography and Kinesiology, 13(5), 477–489.
Martínez-Ramírez, A., Lecumberri, P., Gómez, M., & Izquierdo, M. (2010). Wavelet analysis based on time-frequency information discriminate chronic ankle instability. Clinical Biomechanics, 25(3), 256–264.
Mayer, T. G., Tencer, A. F., Kristoferson, S., & Mooney, V. (1984). Use of noninvasive techniques for quantification of spinal range-of-motion in normal subjects and chronic low-back dysfunction patients. Spine, 9(6), 588–595.
McGalliard, M. K., Dedrick, G. S., Brismée, J. M., Cook, C. E., Apte, G. G., & Sizer, P. S. (2010). Changes in transversus abdominis thickness with use of the abdominal drawing-in maneuver during a functional task. PM&R, 2(3), 187–94– quiz 226.
McGill, S. M. (2007). Low Back Disorders: Evidence-Based Prevention and Rehabilitation (2nd ed.). Champain, IL: Human Kinetics.
McGill, S. M., & Cholewicki, J. (2001). Biomechanical basis for stability: An explanation to enhance clinical utility. Journal of Orthopaedic and Sports Physical Therapy, 31, 96–100.
McGill, S. M., & Karpowicz, A. M. (2009). Exercises for spine stabilization: Motion/motor patterns, stability progressions, and clinical technique. Archives of Physical Medicine and Rehabilitation, 90(1), 118–126.
Texas Tech University Health Sciences Center, Troy L. Hooper, May 2015
206
McGill, S. M., Grenier, S. G., Kavcic, N., & Cholewicki, J. (2003). Coordination of muscle activity to assure stability of the lumbar spine. Journal of Electromyography and Kinesiology, 13, 353–359.
McGill, S. M., Juker, D., & Kropf, P. (1996). Appropriately placed surface EMG electrodes reflect deep muscle activity (psoas, quadratus lumborum, abdominal wall) in the lumbar spine. Journal of Biomechanics, 29, 1503–7.
McGuine, T. A., Greene, J. J., Best, T., & Leverson, G. (2000). Balance as a predictor of ankle injuries in high school basketball players. Clinical Journal of Sport Medicine, 10(4), 239–244.
Mellin, G. (1988). Correlations of hip mobility with degree of back pain and lumbar spinal mobility in chronic low-back pain patients. Spine, 13(6), 668–670.
Mellin, G. (1990). Decreased joint and spinal mobility associated with low back pain in young adults. Journal of Spinal Disorders, 3(3), 238–243.
Mergner, T., Schweigart, G., Maurer, C., & Blümle, A. (2005). Human postural responses to motion of real and virtual visual environments under different support base conditions. Experimental Brain Research, 167(4), 535–556.
Mientjes, M. I., & Frank, J. S. (1999). Balance in chronic low back pain patients compared to healthy people under various conditions in upright standing. Clinical Biomechanics, 14, 710–716.
Morag, E., Hurwitz, D. E., Andriacchi, T. P., Hickey, M., & Andersson, G. B. (2000). Abnormalities in muscle function during gait in relation to the level of lumbar disc herniation. Spine, 25(7), 829–833.
More, R. C., Karras, B. T., Neiman, R., Fritschy, D., Woo, S. L., & Daniel, D. M. (1993). Hamstrings--an anterior cruciate ligament protagonist. An in vitro study. American Journal of Sports Medicine, 21(2), 231–237.
Moseley, G. L., Hodges, P. W., & Gandevia, S. C. (2002). Deep and superficial fibers of the lumbar multifidus muscle are differentially active during voluntary arm movements. Spine, 27(2), E29–36.
Moseley, G. L., Hodges, P. W., & Gandevia, S. C. (2003). External perturbation of the trunk in standing humans differentially activates components of the medial back muscles. Journal of Physiology, 547(Pt 2), 581–587.
Munoz, F., Salmochi, J.-F., Faouën, P., & Rougier, P. (2010). Low back pain sufferers: Is standing postural balance facilitated by a lordotic lumbar brace? Orthopaedics and Traumatology, Surgery and Research, 96(4), 362–366.
Munro, A. G., & Herrington, L. C. (2010). Between-session reliability of the star excursion balance test. Physical Therapy in Sport, 11(4), 128–132.
Myer, G. D., Ford, K. R., & Hewett, T. E. (2005). The effects of gender on quadriceps muscle activation strategies during a maneuver that mimics a high ACL injury risk position. Journal
Texas Tech University Health Sciences Center, Troy L. Hooper, May 2015
207
of Electromyography and Kinesiology, 15(2), 181–189. Nadler, S. F., Malanga, G. A., Bartoli, L. A., Feinberg, J. H., Prybicien, M., & Deprince, M.
(2002a). Hip muscle imbalance and low back pain in athletes: Influence of core strengthening. Medicine and Science in Sports and Exercise, 34(1), 9–16.
Nadler, S. F., Malanga, G. A., Deprince, M., Stitik, T. P., & Feinberg, J. H. (2000). The relationship between lower extremity injury, low back pain, and hip muscle strength in male and female collegiate athletes. Clinical Journal of Sport Medicine, 10, 89–97.
Nadler, S. F., Malanga, G. A., Feinberg, J. H., Prybicien, M., Stitik, T. P., & Deprince, M. (2001). Relationship between hip muscle imbalance and occurrence of low back pain in collegiate athletes: A prospective study. American Journal of Physical Medicine and Rehabilitation, 80, 572–577.
Nadler, S. F., Malanga, G. A., Feinberg, J. H., Rubanni, M., Moley, P., & Foye, P. (2002b). Functional performance deficits in athletes with previous lower extremity injury. Clinical Journal of Sport Medicine, 12, 73–78.
Nadler, S. F., Wu, K. D., Galski, T., & Feinberg, J. H. (1998). Low back pain in college athletes. A prospective study correlating lower extremity overuse or acquired ligamentous laxity with low back pain. Spine, 23, 828–833.
Nagar, V. R., Hooper, T. L., Dedrick, G. S., Brismée, J. M., & Sizer, P. S. (2014). Effect of recurrent low back pain history on volitional pre-emptive abdominal activation during a loaded functional reach activity. Spine, 39(2), E89–96.
Nelson-Wong, E., & Callaghan, J. P. (2010). Is muscle co-activation a predisposing factor for low back pain development during standing? A multifactorial approach for early identification of at-risk individuals. Journal of Electromyography and Kinesiology, 20, 256–263.
Nelson-Wong, E., Gregory, D. E., Winter, D. A., & Callaghan, J. P. (2008). Gluteus medius muscle activation patterns as a predictor of low back pain during standing. Clinical Biomechanics, 23(5), 545–553.
Neumann, D. A. (2010). Kinesiology of the hip: a focus on muscular actions. Journal of Orthopaedic and Sports Physical Therapy, 40(2), 82–94.
Ng, J. K., Kippers, V., & Richardson, C. A. (1998). Muscle fibre orientation of abdominal muscles and suggested surface EMG electrode positions. Electromyography and Clinical Neurophysiology, 38(1), 51–58.
Ng, J. K., Richardson, C. A., Parnianpour, M., & Kippers, V. (2002). EMG activity of trunk muscles and torque output during isometric axial rotation exertion: a comparison between back pain patients and matched controls. Journal of Orthopaedic Research, 20, 112–121.
Nicholas, J. A., Grossman, R. B., & Hershman, E. B. (1977). The importance of a simplified classification of motion in sports in relation to performance. Orthopedic Clinics of North America, 8(3), 499–532.
Texas Tech University Health Sciences Center, Troy L. Hooper, May 2015
208
Noehren, B., Davis, I., & Hamill, J. (2007). Prospective study of the biomechanical factors associated with iliotibial band syndrome. Clinical Biomechanics, 22(9), 951–956.
Nouwen, A., Van Akkerveeken, P. F., & Versloot, J. M. (1987). Patterns of muscular activity during movement in patients with chronic low-back pain. Spine, 12(8), 777–782.
Nötzel, D., Puta, C., Wagner, H., Anders, C., Petrovich, A., & Gabriel, H. H. W. (2011). [Altered hip muscle activation in patients with chronic non-specific low back pain]. Der Schmerz, 25(2), 199–206.
O'Sullivan, P. (2005). Diagnosis and classification of chronic low back pain disorders: Maladaptive movement and motor control impairments as underlying mechanism. Manual Therapy, 10(4), 242–255.
O'Sullivan, P. B. (2000). Lumbar segmental “instability”: Clinical presentation and specific stabilizing exercise management. Manual Therapy, 5(1), 2–12.
O'Sullivan, P. B., Burnett, A., Floyd, A. N., Gadsdon, K., Logiudice, J., Miller, D., & Quirke, H. (2003). Lumbar repositioning deficit in a specific low back pain population. Spine, 28(10), 1074–1079.
O'Sullivan, P. B., Grahamslaw, K. M., Kendell, M., Lapenskie, S. C., Möller, N. E., & Richards, K. V. (2002). The effect of different standing and sitting postures on trunk muscle activity in a pain-free population. Spine, 27(11), 1238–1244.
Oh, J.-S., Cynn, H.-S., Won, J.-H., Kwon, O.-Y., & Yi, C.-H. (2007). Effects of performing an abdominal drawing-in maneuver during prone hip extension exercises on hip and back extensor muscle activity and amount of anterior pelvic tilt. Journal of Orthopaedic and Sports Physical Therapy, 37(6), 320–324.
Olsen, O.-E., Myklebust, G., Engebretsen, L., & Bahr, R. (2004). Injury mechanisms for anterior cruciate ligament injuries in team handball: A systematic video analysis. American Journal of Sports Medicine, 32(4), 1002–1012.
Orchard, J. W., Fricker, P. A., Abud, A. T., & Mason, B. R. (1996). Biomechanics of iliotibial band friction syndrome in runners. American Journal of Sports Medicine, 24(3), 375–379.
Overmoyer, G. V., & Reiser, R. F. (2013). Relationships between asymmetries in functional movements and the star excursion balance test. Journal of Strength and Conditioning Research, 27(7), 2013–2024.
Pal, S., Besier, T. F., Draper, C. E., Fredericson, M., Gold, G. E., Beaupre, G. S., & Delp, S. L. (2012). Patellar tilt correlates with vastus lateralis: Vastus medialis activation ratio in maltracking patellofemoral pain patients. Journal of Orthopaedic Research, 30(6), 927–933.
Panayi, S. (2010). The need for lumbarepelvic assessment in the resolution of chronic hamstring strain. Journal of Bodywork and Movement Therapies, 14(3), 294–298.
Panjabi, M. M. (1992a). The stabilizing system of the spine. Part I. Function, dysfunction, adaptation, and enhancement. Journal of Spinal Disorders, 5, 383–389.
Panjabi, M. M. (1992b). The stabilizing system of the spine. Part II. Neutral zone and instability

Texas Tech University Health Sciences Center, Troy L. Hooper, May 2015
209
hypothesis. Journal of Spinal Disorders, 5, 390–396. Panjabi, M. M. (2003). Clinical spinal instability and low back pain. Journal of
Electromyography and Kinesiology, 13(4), 371–379. Panjabi, M. M. (2006). A hypothesis of chronic back pain: Ligament subfailure injuries lead to
muscle control dysfunction. European Spine Journal, 15, 668–676. Panjabi, M., Abumi, K., Duranceau, J., & Oxland, T. (1989). Spinal stability and intersegmental
muscle forces. A biomechanical model. Spine, 14(2), 194–200. Paquet, N., Malouin, F., & Richards, C. L. (1994). Hip-spine movement interaction and muscle
activation patterns during sagittal trunk movements in low back pain patients. Spine, 19(5), 596–603.
Park, K.-N., Cynn, H.-S., Kwon, O.-Y., Lee, W.-H., Ha, S.-M., Kim, S.-J., & Weon, J.-H. (2011). Effects of the abdominal drawing-in maneuver on muscle activity, pelvic motions, and knee flexion during active prone knee flexion in patients with lumbar extension rotation syndrome. Archives of Physical Medicine and Rehabilitation, 92(9), 1477–1483.
Paterno, M. V., Schmitt, L. C., Ford, K. R., Rauh, M. J., Myer, G. D., Huang, B., & Hewett, T. E. (2010). Biomechanical measures during landing and postural stability predict second anterior cruciate ligament injury after anterior cruciate ligament reconstruction and return to sport. American Journal of Sports Medicine, 38(10), 1968–1978.
Pel, J. J. M., Spoor, C. W., Pool-Goudzwaard, A. L., Hoek van Dijke, G. A., & Snijders, C. J. (2008). Biomechanical analysis of reducing sacroiliac joint shear load by optimization of pelvic muscle and ligament forces. Annals of Biomedical Engineering, 36(3), 415–424.
Pengel, L. H. M., Herbert, R. D., Maher, C. G., & Refshauge, K. M. (2003). Acute low back pain: Systematic review of its prognosis. Bmj, 327(7410), 323.
Perneger, T. V. (1998). What's wrong with Bonferroni adjustments. Bmj, 316(7139), 1236–1238.
Perrott, M. A., & Pizzari, T. (2013). Lumbopelvic exercise reduces lower limb muscle strain injury in recreational athletes. Physical Therapy Reviews, 18, 24–33.
Perrott, M. A., Pizzari, T., Opar, M., & Cook, J. (2012). Development of clinical rating criteria for tests of lumbopelvic stability. Rehabilitation Research and Practice, 2012(2), 803637–7.
Perry, J., & Burnfield, J. M. (2010). Gait Analysis (2nd ed.). Thorofare, NJ: Slack Incorporated. Petersen, W., Braun, C., Bock, W., Schmidt, K., Weimann, A., Drescher, W., et al. (2005). A
controlled prospective case control study of a prevention training program in female team handball players: The German experience. Archives of Orthopaedic and Trauma Surgery, 125(9), 614–621.
Philippaerts, R. M., Westerterp, K. R., & Lefevre, J. (1999). Doubly labelled water validation of three physical activity questionnaires. International Journal of Sports Medicine, 20(5), 284–289.
Pirouzi, S., Hides, J. A., Richardson, C. A., Darnell, R., & Toppenberg, R. (2006). Low back
Texas Tech University Health Sciences Center, Troy L. Hooper, May 2015
210
pain patients demonstrate increased hip extensor muscle activity during standardized submaximal rotation efforts. Spine, 31(26), E999–E1005.
Plisky, P. J., Gorman, P. P., Butler, R. J., Kiesel, K. B., Underwood, F. B., & Elkins, B. (2009). The reliability of an instrumented device for measuring components of the star excursion balance test. North American Journal of Sports Physical Therapy, 4(2), 92–99.
Plisky, P. J., Rauh, M. J., Kaminski, T. W., & Underwood, F. B. (2006). Star Excursion Balance Test as a predictor of lower extremity injury in high school basketball players. Journal of Orthopaedic and Sports Physical Therapy, 36(12), 911–919.
Pollard, C. D., Sigward, S. M., & Powers, C. M. (2010). Limited hip and knee flexion during landing is associated with increased frontal plane knee motion and moments. Clinical Biomechanics, 25(2), 142–146.
Pollock, A. S., Durward, B. R., Rowe, P. J., & Paul, J. P. (2000). What is balance? Clinical Rehabilitation, 14(4), 402–406.
Porter, J. L., & Wilkinson, A. (1997). Lumbar-hip flexion motion. A comparative study between asymptomatic and chronic low back pain in 18- to 36-year-old men. Spine, 22(13), 1508–1513.
Portney, L. G., & Watkins, M. P. (2009). Foundations of Clinical Research: Applications to Practice (3rd ed.). Upper Saddle River, NJ: Prentice Hall.
Powers, C. M. (2010). The influence of abnormal hip mechanics on knee injury: a biomechanical perspective. Journal of Orthopaedic and Sports Physical Therapy, 40(2), 42–51.
Powers, C. M., Ward, S. R., Fredericson, M., Guillet, M., & Shellock, F. G. (2003). Patellofemoral kinematics during weight-bearing and non-weight-bearing knee extension in persons with lateral subluxation of the patella: a preliminary study. Journal of Orthopaedic and Sports Physical Therapy, 33(11), 677–685.
Prins, M. R., & van der Wurff, P. (2009). Females with patellofemoral pain syndrome have weak hip muscles: A systematic review. Australian Journal of Physiotherapy, 55(1), 9–15.
Radebold, A., Cholewicki, J., Panjabi, M. M., & Patel, T. C. (2000). Muscle response pattern to sudden trunk loading in healthy individuals and in patients with chronic low back pain. Spine, 25(8), 947–954.
Radebold, A., Cholewicki, J., Polzhofer, G. K., & Greene, H. S. (2001). Impaired postural control of the lumbar spine is associated with delayed muscle response times in patients with chronic idiopathic low back pain. Spine, 26, 724–730.
Rainoldi, A., Melchiorri, G., & Caruso, I. (2004). A method for positioning electrodes during surface EMG recordings in lower limb muscles. Journal of Neuroscience Methods, 134(1), 37–43.
Reeves, N. P., Everding, V. Q., Cholewicki, J., & Morrisette, D. C. (2006). The effects of trunk stiffness on postural control during unstable seated balance. Experimental Brain Research, 174(4), 694–700.
Texas Tech University Health Sciences Center, Troy L. Hooper, May 2015
211
Richardson, C. A., Hides, J. A., Wilson, S. J., Stanton, W. R., & Snijders, C. J. (2004a). Lumbo-pelvic joint protection against antigravity forces: motor control and segmental stiffness assessed with magnetic resonance imaging. Journal of Gravitational Physiology, 11, P119–122.
Richardson, C. A., Hodges, P. W., & Hides, J. A. (2004b). Therapeutic Exercise for Lumbopelvic Stabilization: A Motor Control Approach for the Treatment and Prevention of Low Back Pain. Churchill Livingstone.
Richardson, C. A., Snijders, C. J., Hides, J. A., Damen, L., Pas, M. S., & Storm, J. (2002). The relation between the transversus abdominis muscles, sacroiliac joint mechanics, and low back pain. Spine, 27(4), 399–405.
Riemann, B. L., & Lephart, S. M. (2002). The sensorimotor system, part I: The physiologic basis of functional joint stability. Journal of Athletic Training, 37(1), 71–79.
Riemann, B. L., Guskiewicz, K. M., & Shields, E. W. (1999). Relationship between clinical and forceplate measures of postural stability. Journal of Sport Rehabilitation, 8, 71–82.
Robinson, R. H., & Gribble, P. A. (2008a). Kinematic predictors of performance on the Star Excursion Balance Test. Journal of Sport Rehabilitation, 17, 347–357.
Robinson, R. H., & Gribble, P. A. (2008b). Support for a reduction in the number of trials needed for the star excursion balance test. Archives of Physical Medicine and Rehabilitation, 89, 364–370.
Roland, M., & Fairbank, J. (2000). The Roland-Morris Disability Questionnaire and the Oswestry Disability Questionnaire. Spine, 25(24), 3115–3124.
Ruhe, A., Fejer, R., & Walker, B. (2011). Center of pressure excursion as a measure of balance performance in patients with non-specific low back pain compared to healthy controls: A systematic review of the literature. European Spine Journal, 20(3), 358–368.
Sahrmann, S. A., Lewis, C. L., & Moran, D. W. (2009). Effect of position and alteration in synergist muscle force contribution on hip forces when performing hip strengthening exercises. Clinical Biomechanics, 24(1), 35–42.
Sankara, N., Ramprasad, M., Shenoy, D. S., Singh, S. J., & Joseley, S. R. P. (2010). The magnitude of pre-programmed reaction dysfunction in back pain patients: Experimental pilot electromyography study. Journal of Back and Musculoskeletal Rehabilitation, 23(2), 77–86.
Santaguida, P., & McGill, S. M. (1995). The psoas major muscle: A three-dimensional geometric study. Journal of Biomechanics, 28, 339–45.
Sarshin, A., Mohammadi, S., Shahrabad, H. B. P., & Sedighi, M. (2011). The effects of functional fatigue on dynamic postural control of badminton players. Biology of Exercise, 7(2), 25–34.
Schaible, H. G., & Grubb, B. D. (1993). Afferent and spinal mechanisms of joint pain. Pain, 55(1), 5–54.
Schmitz, R. J., Riemann, B. L., & Thompson, T. (2002). Gluteus medius activity during
Texas Tech University Health Sciences Center, Troy L. Hooper, May 2015
212
isometric closed-chain hip rotation. Journal of Sport Rehabilitation, 11, 179–188. Scholtes, S. A., Gombatto, S. P., & van Dillen, L. R. (2009). Differences in lumbopelvic motion
between people with and people without low back pain during two lower limb movement tests. Clinical Biomechanics, 24, 7–12.
Scholtes, S. A., Norton, B. J., Lang, C. E., & van Dillen, L. R. (2010). The effect of within-session instruction on lumbopelvic motion during a lower limb movement in people with and people without low back pain. Manual Therapy, 15, 496–501.
Seay, J. F., Sauer, S. G., Frykman, P. N., & Roy, T. C. (2013). A history of low back pain affects pelvis and trunk mechanics during a sustained lift/lower task. Ergonomics, 56(6), 944–953.
Seay, J. F., Van Emmerik, R. E. A., & Hamill, J. (2011). Influence of low back pain status on pelvis-trunk coordination during walking and running. Spine, 36(16), E1070–E1079.
Sefton, J. M., Hicks-Little, C. A., Hubbard, T. J., Clemens, M. G., Yengo, C. M., Koceja, D. M., & Cordova, M. L. (2009). Sensorimotor function as a predictor of chronic ankle instability. Clinical Biomechanics, 24(5), 451–458.
Sell, T. C. (2012). An examination, correlation, and comparison of static and dynamic measures of postural stability in healthy, physically active adults. Physical Therapy in Sport, 13, 80–6.
Selles, R. W., Wuisman, P. I., Wagenaar, R. C., & Smit, T. H. (2001). Disorders in trunk rotation during walking in patients with low back pain: A dynamical systems approach. Clinical Biomechanics, 16(3), 175–181.
Sèze, M., Falgairolle, M., Viel, S., Assaiante, C., & Cazalets, J.-R. (2007). Sequential activation of axial muscles during different forms of rhythmic behavior in man. Experimental Brain Research, 185(2), 237–247.
Sheeran, L., Sparkes, V., Caterson, B., Busse-Morris, M., & van Deursen, R. (2012). Spinal position sense and trunk muscle activity during sitting and standing in nonspecific chronic low back pain: Classification analysis. Spine, 37(8), E486–E495.
Sherry, M. A., & Best, T. M. (2004). A comparison of 2 rehabilitation programs in the treatment of acute hamstring strains. Journal of Orthopaedic and Sports Physical Therapy, 34(3), 116–125.
Shirey, M., Hurlbutt, M., Johansen, N., King, G. W., Wilkinson, S. G., & Hoover, D. L. (2012). The influence of core musculature engagement on hip and knee kinematics in women during a single leg squat. International Journal of Sports Physical Therapy, 7(1), 1–12.
Shultz, S., Olmsted, L. C., Carcia, C. R., & Hertel, J. (2002). Efficacy of the star excursion balance tests in detecting reach deficits in subjects with chronic ankle instability. Journal of Athletic Training, 37(4), 501–506.
Shum, G. L., Crosbie, J., & Lee, R. Y. (2005a). Effect of low back pain on the kinematics and joint coordination of the lumbar spine and hip during sit-to-stand and stand-to-sit. Spine, 30(17), 1998–2004.
Shum, G. L., Crosbie, J., & Lee, R. Y. (2005b). Symptomatic and asymptomatic movement
Texas Tech University Health Sciences Center, Troy L. Hooper, May 2015
213
coordination of the lumbar spine and hip during an everyday activity. Spine, 30, E697–702. Shum, G. L., Crosbie, J., & Lee, R. Y. (2007a). Movement coordination of the lumbar spine and
hip during a picking up activity in low back pain subjects. European Spine Journal, 16, 749–758.
Shum, G. L., Crosbie, J., & Lee, R. Y. (2007b). Three-dimensional kinetics of the lumbar spine and hips in low back pain patients during sit-to-stand and stand-to-sit. Spine, 32, E211–E219.
Silfies, S. P., Mehta, R., Smith, S. S., & Karduna, A. R. (2009). Differences in feedforward trunk muscle activity in subgroups of patients with mechanical low back pain. Archives of Physical Medicine and Rehabilitation, 90(7), 1159–1169.
Silfies, S. P., Squillante, D., Maurer, P., Westcott, S., & Karduna, A. R. (2005). Trunk muscle recruitment patterns in specific chronic low back pain populations. Clinical Biomechanics, 20, 465–473.
Simmonds, M. J., Olson, S. L., Jones, S., Hussein, T., Lee, C. E., Novy, D., & Radwan, H. (1998). Psychometric characteristics and clinical usefulness of physical performance tests in patients with low back pain. Spine, 23, 2412–2421.
Sims, J., Cosby, N. L., Saliba, E. N., Hertel, J., & Saliba, S. (2013). Exergaming and Static Postural Control in Individuals With a History of Lower Limb Injury. Journal of Athletic Training, 48(3), 314–325.
Solomonow, M., Zhou, B. H., Harris, M., Lu, Y., & Baratta, R. V. (1998). The ligamento-muscular stabilizing system of the spine. Spine, 23(23), 2552–2562.
Stanton, T. R., Latimer, J., Maher, C. G., & Hancock, M. (2009). Definitions of recurrence of an episode of low back pain: a systematic review. Spine, 34(9), E316–E322.
Stanton, T. R., Latimer, J., Maher, C. G., & Hancock, M. J. (2011). A modified Delphi approach to standardize low back pain recurrence terminology. European Spine Journal, 20(5), 744–752.
Stanton, T., & Kawchuk, G. N. (2008). The effect of abdominal stabilization contractions on posteroanterior spinal stiffness. Spine, 33(6), 694–701.
Stecco, A., Gilliar, W., Hill, R., Fullerton, B., & Stecco, C. (2013). The anatomical and functional relation between gluteus maximus and fascia lata, 17(4), 512–517.
Steindler, A. (1955). Kinesiology of the Human Body Under Normal and Pathological Conditions. Springfield, IL: Charles C Thomas.
Stokes, I. A. F., Fox, J. R., & Henry, S. M. (2006). Trunk muscular activation patterns and responses to transient force perturbation in persons with self-reported low back pain. European Spine Journal, 15(5), 658–667.
Sueki, D. G., Cleland, J. A., & Wainner, R. S. (2013). A regional interdependence model of musculoskeletal dysfunction: research, mechanisms, and clinical implications. Journal of Manual and Manipulative Therapy, 21(2), 90–102.
Texas Tech University Health Sciences Center, Troy L. Hooper, May 2015
214
Suter, E., & Lindsay, D. (2001). Back muscle fatigability is associated with knee extensor inhibition in subjects with low back pain. Spine, 26(16), E361–E366.
Taimela, S., Osterman, K., Alaranta, H., Soukka, A., & Kujala, U. M. (1993). Long psychomotor reaction time in patients with chronic low-back pain: preliminary report. Archives of Physical Medicine and Rehabilitation, 74(11), 1161–1164.
Tateuchi, H., Tsukagoshi, R., Fukumoto, Y., Akiyama, H., So, K., Kuroda, Y., & Ichihashi, N. (2013). Pelvic instability and trunk and hip muscle recruitment patterns in patients with total hip arthroplasty. Journal of Electromyography and Kinesiology, 23(1), 151–158.
Taunton, J. E., Ryan, M. B., Clement, D. B., McKenzie, D. C., Lloyd-Smith, D. R., & Zumbo, B. D. (2002). A retrospective case-control analysis of 2002 running injuries. British Journal of Sports Medicine, 36(2), 95–101.
Teyhen, D. S., Bluemle, L. N., Dolbeer, J. A., Baker, S. E., Molloy, J. M., Whittaker, J. L., & Childs, J. D. (2009). Changes in lateral abdominal muscle thickness during the abdominal drawing-in maneuver in those with lumbopelvic pain. Journal of Orthopaedic and Sports Physical Therapy, 39(11), 791–798.
Teyhen, D. S., Gill, N. W., Whittaker, J. L., Henry, S. M., Hides, J. A., & Hodges, P. W. (2007). Rehabilitative ultrasound imaging of the abdominal muscles. Journal of Orthopaedic and Sports Physical Therapy, 37, 450–66.
Thomas, J. S., France, C. R., Lavender, S. A., & Johnson, M. R. (2008a). Effects of fear of movement on spine velocity and acceleration after recovery from low back pain. Spine, 33(5), 564–570.
Thomas, J. S., France, C. R., Sha, D., & Wiele, N. V. (2008b). The influence of pain-related fear on peak muscle activity and force generation during maximal isometric trunk exertions. Spine, 33(11), E342–E348.
Tokuno, C. D., Cresswell, A. G., Thorstensson, A., & Carpenter, M. G. (2011). Recruitment order of the abdominal muscles varies with postural task. Scandinavian Journal of Medicine and Science in Sports, 23(3), 349–354.
Tresch, M. C. (2007). A balanced view of motor control. Nature Neuroscience, 10(10), 1227–1228.
Tsao, H., Tucker, K. J., & Hodges, P. W. (2011). Changes in excitability of corticomotor inputs to the trunk muscles during experimentally-induced acute low back pain. Neuroscience, 181, 127–133.
Turk, D. C., & Rudy, T. E. (1988). Toward an empirically derived taxonomy of chronic pain patients: integration of psychological assessment data. Journal of Consulting and Clinical Psychology, 56(2), 233–238.
Unsgaard-Tøndel, M., Nilsen, T. I. L., Magnussen, J., & Vasseljen, O. (2013). Are fear avoidance beliefs associated with abdominal muscle activation outcome for patients with low back pain? Physiotherapy Research International, 18(3), 131–139.
Texas Tech University Health Sciences Center, Troy L. Hooper, May 2015
215
Urquhart, D. M., Hodges, P. W., Allen, T. J., & Story, I. H. (2005). Abdominal muscle recruitment during a range of voluntary exercises. Manual Therapy, 10, 144–153.
van der Worp, M. P., Backx, F. J. G., van der Horst, N., de Wijer, A., & Nijhuis-van der Sanden, M. W. G. (2012). Iliotibial band syndrome in runners: A systematic review. Sports Medicine, 42(11), 969–992.
van Dieën, J. H., Cholewicki, J., & Radebold, A. (2003a). Trunk muscle recruitment patterns in patients with low back pain enhance the stability of the lumbar spine. Spine, 28, 834–41.
van Dieën, J. H., Kingma, I., & van der Bug, J. C. E. (2003b). Evidence for a role of antagonistic cocontraction in controlling trunk stiffness during lifting. Journal of Biomechanics, 36(12), 1829–1836.
van Dieën, J. H., Koppes, L. L. J., & Twisk, J. W. R. (2010). Low-back pain history and postural sway in unstable sitting. Spine, 35(7), 812–817.
van Dieën, J. H., Selen, L. P. J., & Cholewicki, J. (2003c). Trunk muscle activation in low-back pain patients, an analysis of the literature. Journal of Electromyography and Kinesiology, 13(4), 333–351.
van Dillen, L. R., Sahrmann, S. A., Gombatto, S. P., Collins, D. R., & Engsberg, J. R. (2007). Symmetry of timing of hip and lumbopelvic rotation motion in 2 different subgroups of people with low back pain. Archives of Physical Medicine and Rehabilitation, 88, 351–360.
Vasseljen, O., Woodhouse, A., Bjørngaard, J. H., & Leivseth, L. (2013). Natural course of acute neck and low back pain in the general population: the HUNT study. Pain, 154(8), 1237–
Vera-Garcia, F. J., Brown, S. H. M., Gray, J. R., & McGill, S. M. (2006). Effects of different levels of torso coactivation on trunk muscular and kinematic responses to posteriorly applied sudden loads. Clinical Biomechanics, 21, 443–455.
Vera-Garcia, F. J., Elvira, J. L., Brown, S. H. M., & McGill, S. M. (2007). Effects of abdominal stabilization maneuvers on the control of spine motion and stability against sudden trunk perturbations. Journal of Electromyography and Kinesiology, 17(5), 556–567.
Verbunt, J. A., Seelen, H. A., Vlaeyen, J. W., van de Heijden, G. J., Heuts, P. H., Pons, K., & Knottnerus, J. A. (2003). Disuse and deconditioning in chronic low back pain: concepts and hypotheses on contributing mechanisms. European Journal of Pain, 7(1), 9–21.
Vleeming, A., Pool-Goudzwaard, A. L., Stoeckart, R., van Wingerden, J. P., & Snijders, C. J. (1995). The posterior layer of the thoracolumbar fascia. Its function in load transfer from spine to legs. Spine, 20(7), 753–758.
Vleeming, A., van Wingerden, J. P., Snijders, C. J., Stoeckart, R., & Stijnen, T. (1989). Load application to the sacrotuberous ligament; influences on sacroiliac joint mechanics. Clinical Biomechanics, 4(4), 204–209.
Vrbanić, T. S.-L., Ravlić-Gulan, J., Gulan, G., & Matovinović, D. (2007). Balance index score as a predictive factor for lower sports results or anterior cruciate ligament knee injuries in Croatian female athletes--preliminary study. Collegium Antropologicum, 31(1), 253–258.
Texas Tech University Health Sciences Center, Troy L. Hooper, May 2015
216
Waddell, G. (1987). A new clinical model for the treatment of low-back pain. Spine, 12(7), 632–644.
Waddell, G., Newton, M., Henderson, I., Somerville, D., & Main, C. J. (1993). A Fear-Avoidance Beliefs Questionnaire (FABQ) and the role of fear-avoidance beliefs in chronic low back pain and disability. Pain, 52(2), 157–168.
Wagner, H., Melhus, H., Gedeborg, R., Pedersen, N. L., & Michaelsson, K. (2008). Simply ask them about their balance--future fracture risk in a nationwide cohort study of twins. American Journal of Epidemiology, 169(2), 143–149. http://doi.org/10.1093/aje/kwn379
Wainner, R. S., Whitman, J. M., Cleland, J. A., & Flynn, T. W. (2007). Regional interdependence: A musculoskeletal examination model whose time has come. Journal of Orthopaedic and Sports Physical Therapy, 37(11), 658–660.
Walker, B. F., Muller, R., & Grant, W. D. (2004). Low back pain in australian adults. Prevalence and associated disability. Journal of Manipulative and Physiological Therapeutics, 27(4), 238–244.
Wallwork, T. L., Stanton, W. R., Freke, M., & Hides, J. A. (2009). The effect of chronic low back pain on size and contraction of the lumbar multifidus muscle, 14(5), 496–500.
Wang, H.-K., Chen, C.-H., Shiang, T.-Y., Jan, M.-H., & Lin, K.-H. (2006). Risk-factor analysis of high school basketball–player ankle injuries: A prospective controlled cohort study evaluating postural sway, ankle strength, and flexibility. Archives of Physical Medicine and Rehabilitation, 87(6), 821–825.
Ward, S. R. (2009). Architectural analysis and intraoperative measurements demonstrate the unique design of the multifidus muscle for lumbar spine stability. The Journal of Bone and Joint Surgery. American Volume, 91(1), 176–185.
Wasiak, R., Kim, J., & Pransky, G. (2006). Work disability and costs caused by recurrence of low back pain: longer and more costly than in first episodes. Spine, 31(2), 219–225.
Watanabe, M., Kaneoka, K., Okubo, Y., Shiina, I., Tatsumura, M., & Miyakawa, S. (2013). Trunk muscle activity while lifting objects of unexpected weight. Physiotherapy, 99(1), 78–83.
Westad, C., Mork, P. J., & Vasseljen, O. (2010). Location and sequence of muscle onset in deep abdominal muscles measured by different modes of ultrasound imaging. Journal of Electromyography and Kinesiology, 20(5), 994–999.
Wilder, D. G., Aleksiev, A. R., Magnusson, M. L., Pope, M. H., Spratt, K. F., & Goel, V. K. (1996). Muscular response to sudden load. A tool to evaluate fatigue and rehabilitation. Spine, 21(22), 2628–2639.
Wilke, H. J., Wolf, S., Claes, L. E., Arand, M., & Wiesend, A. (1995). Stability increase of the lumbar spine with different muscle groups. A biomechanical in vitro study. Spine, 20(2), 192–198.
Wilkerson, G. B., Giles, J. L., & Seibel, D. K. (2012). Prediction of core and lower extremity
Texas Tech University Health Sciences Center, Troy L. Hooper, May 2015
217
strains and sprains in collegiate football players: A preliminary study. Journal of Athletic Training, 47, 264–72.
Willems, T. M. (2005). Intrinsic risk factors for inversion ankle sprains in male subjects: A prospective study. American Journal of Sports Medicine, 33(3), 415–423.
Willson, J. D., Dougherty, C. P., Dougherty, C. P., Ireland, M. L., & Davis, I. M. (2005). Core stability and its relationship to lower extremity function and injury. Journal of the American Academy of Orthopaedic Surgeons, 13(5), 316–325.
Winby, C. R., Lloyd, D. G., Besier, T. F., & Kirk, T. B. (2009). Muscle and external load contribution to knee joint contact loads during normal gait. Journal of Biomechanics, 42(14),
Winter, D. A. (2009). Biomechanics and Motor Control of Human Movement (4 ed.). Hoboken, NJ: John Wiley & Sons.
Withrow, T. J., Huston, L. J., Wojtys, E. M., & Ashton-Miller, J. A. (2006). The relationship between quadriceps muscle force, knee flexion, and anterior cruciate ligament strain in an in vitro simulated jump landing. American Journal of Sports Medicine, 34(2), 269–274.
Wong, T. K. T., & Lee, R. Y. W. (2004). Effects of low back pain on the relationship between the movements of the lumbar spine and hip. Human Movement Science, 23(1), 21–34.
Woodley, S. J., Kennedy, E., & Mercer, S. R. (2005). Anatomy in practice: The sacrotuberous ligament. New Zealand Journal of Physiotherapy, 33(3), 91–94.
Yang, J. F., & Winter, D. A. (1984). Electromyographic amplitude normalization methods: Improving their sensitivity as diagnostic tools in gait analysis. Archives of Physical Medicine and Rehabilitation, 65(9), 517–521.
Zazulak, B. T., Hewett, T. E., Reeves, N. P., Goldberg, B., & Cholewicki, J. (2007). Deficits in neuromuscular control of the trunk predict knee injury risk: A prospective biomechanical-epidemiologic study. American Journal of Sports Medicine, 35(7), 1123–1130.

Texas Tech University Health Sciences Center, Troy L. Hooper, May 2015
218
APPENDIX A MEDICAL HISTORY QUESTIONNAIRE
Medical History Questionnaire
Subject No:
In the past 2 years, have you had any of the following?
Yes No
Low Back Pain Yes No
Yes No
Have you had back, hip, knee, or ankle/foot surgery withinthe last 5 years? Yes No
Are you pregnant? Yes No
Rheumatologic Disorders Yes No
Neurological Disorders Yes No
Vestibular or other Balance Disorders Yes No
Inner ear, sinus, or upper respiratory infection? Yes No
In the past 3 months, have you had a concussion? Yes No
In the past 12 months, have you participated in coreabdominal muscle training? Yes No
This page is to be completed bythe subject.
Go To Next Page
Low Back Pain
Hip Pain in the leg you use to kick a ball (kicking leg)
Knee Pain in your kicking leg
Do you currently have any of the following?
Ankle or Foot Pain in your kicking leg
Head cold? Yes No
Yes No
Yes No

Texas Tech University Health Sciences Center, Troy L. Hooper, May 2015
219
Medical History Questionnaire Part 2
Subject No:
How often do you take pain medication for your low back pain?
How long ago was your first low back pain episode?
Never beforeLess than 1 year ago
1-5 years agoMore than 5 years ago
Not at allOccasionally (few times a month)
Frequently (few times a week)Constantly (daily)
How many times did you usually attend physical therapy when you had back pain?
For how many of the above low back pain episodes did you attend physical therapy?
0 1-2 3-4 5 or more
Go To Next Page
What is your current work status?
0 1-2 3-4 5 or more
Employed Full-TimeEmployed Part-Time
Sick Leave or Worker's CompensationNot Employed
In the past 2 years, how many episodes of low back pain have you had thatlimited your function?
For how many of the above low back pain episodes did you seek medical attention?
0 1-2 3-4 5 or more
0 1-4 5-8 9 or more
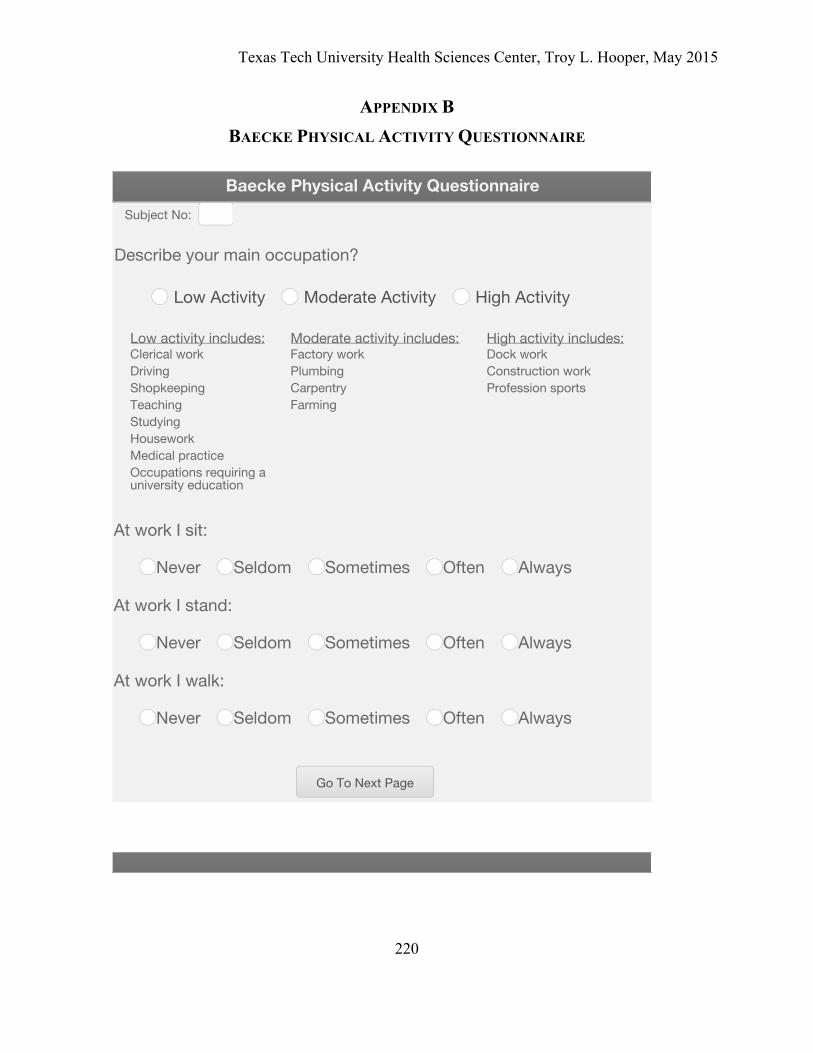
Texas Tech University Health Sciences Center, Troy L. Hooper, May 2015
220
APPENDIX B BAECKE PHYSICAL ACTIVITY QUESTIONNAIRE
Baecke Physical Activity QuestionnaireSubject No:
Describe your main occupation?
At work I sit:
High activity includes:Dock workConstruction workProfession sports
Low activity includes:Clerical workDrivingShopkeepingTeachingStudyingHouseworkMedical practiceOccupations requiring auniversity education
Moderate activity includes:Factory workPlumbingCarpentryFarming
Never Seldom Sometimes Often Always
At work I stand:
Never Seldom Sometimes Often Always
At work I walk:
Never Seldom Sometimes Often Always
Go To Next Page
Low Activity Moderate Activity High Activity
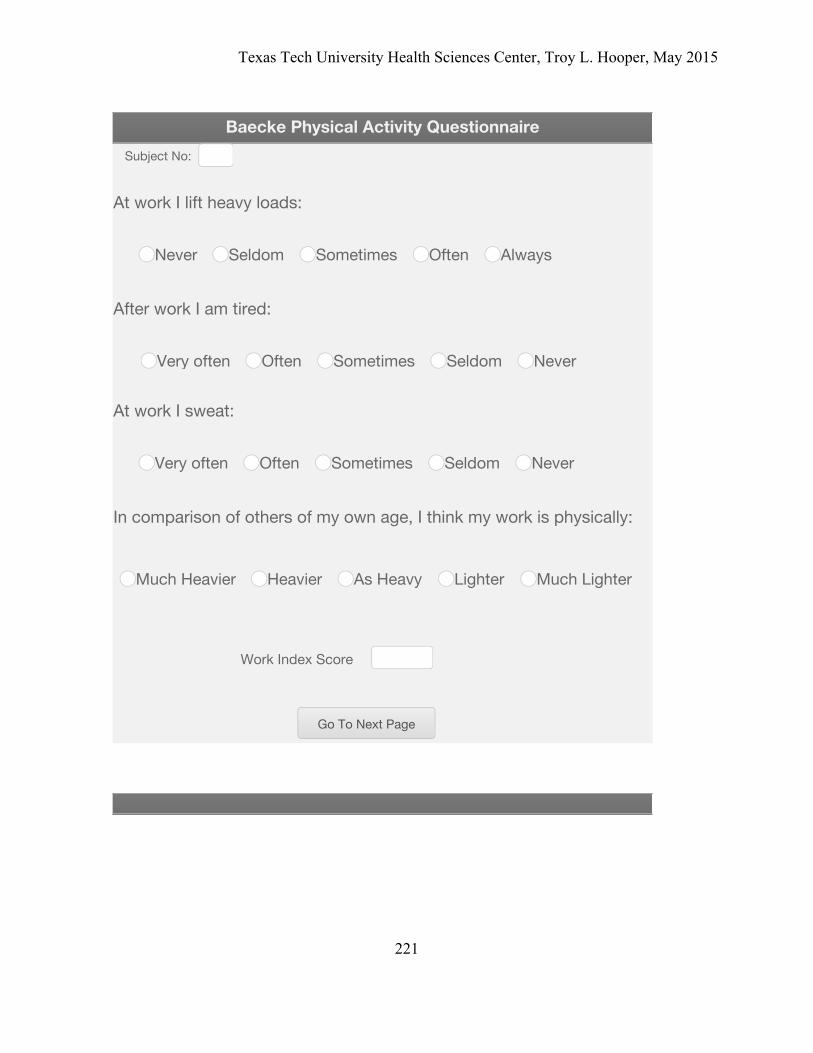
Texas Tech University Health Sciences Center, Troy L. Hooper, May 2015
221
Baecke Physical Activity QuestionnaireSubject No:
After work I am tired:
At work I sweat:
Very often Often Sometimes Seldom Never
Very often Often Sometimes Seldom Never
In comparison of others of my own age, I think my work is physically:
Much Heavier Heavier As Heavy Lighter Much Lighter
Work Index Score
Go To Next Page
At work I lift heavy loads:
Never Seldom Sometimes Often Always
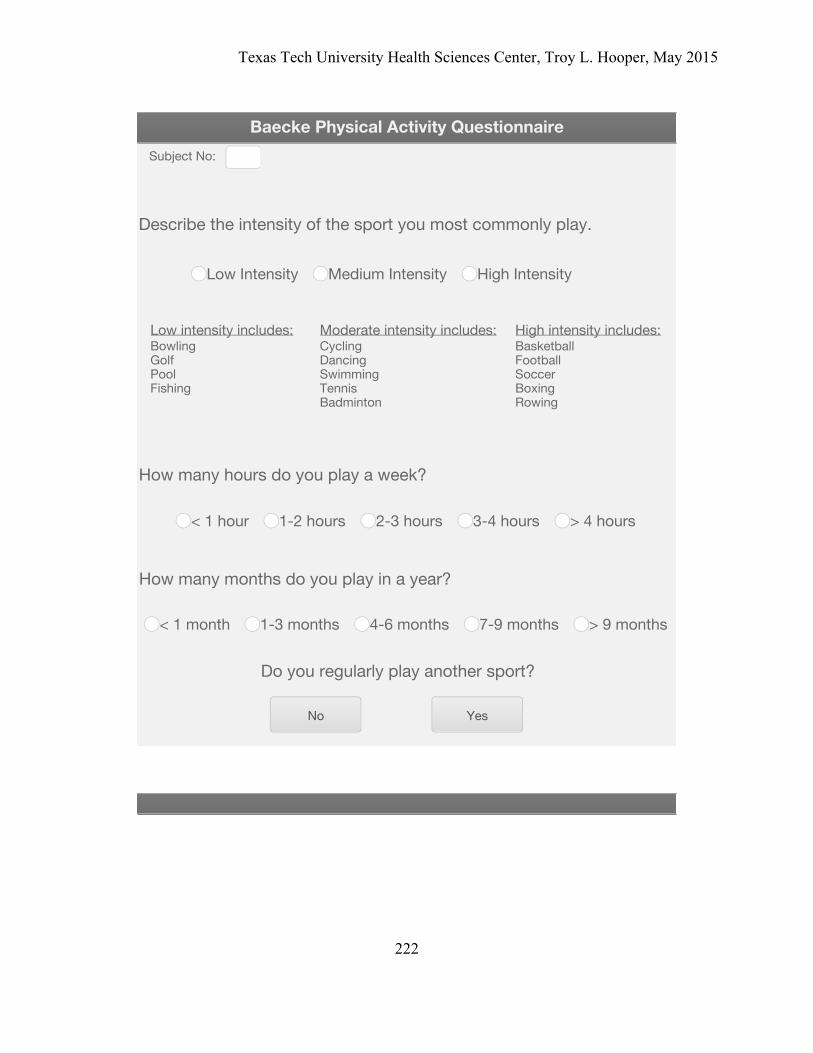
Texas Tech University Health Sciences Center, Troy L. Hooper, May 2015
222
Baecke Physical Activity QuestionnaireSubject No:
Describe the intensity of the sport you most commonly play.
How many hours do you play a week?
Low Intensity Medium Intensity High Intensity
< 1 hour 1-2 hours 2-3 hours 3-4 hours > 4 hours
How many months do you play in a year?
< 1 month 1-3 months 4-6 months 7-9 months > 9 months
High intensity includes:BasketballFootballSoccerBoxingRowing
Low intensity includes:BowlingGolfPoolFishing
Moderate intensity includes:CyclingDancingSwimmingTennisBadminton
Do you regularly play another sport?
No Yes
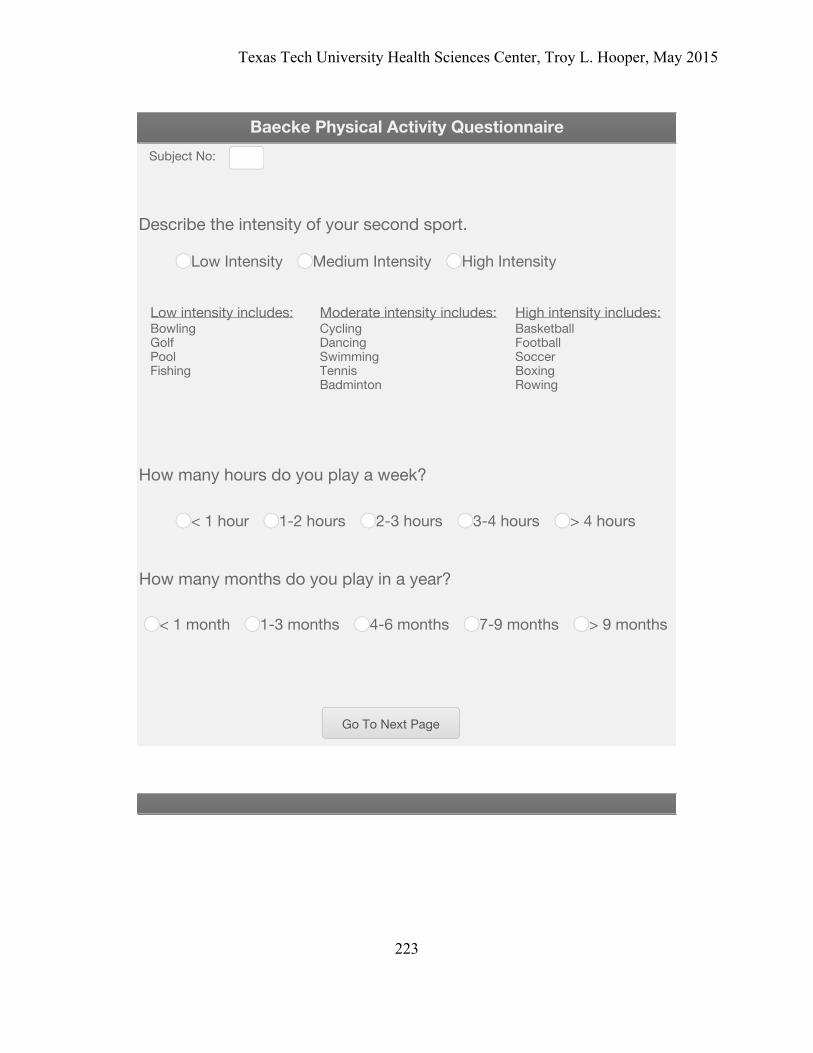
Texas Tech University Health Sciences Center, Troy L. Hooper, May 2015
223
Baecke Physical Activity QuestionnaireSubject No:
Describe the intensity of your second sport.
How many hours do you play a week?
Low Intensity Medium Intensity High Intensity
< 1 hour 1-2 hours 2-3 hours 3-4 hours > 4 hours
How many months do you play in a year?
< 1 month 1-3 months 4-6 months 7-9 months > 9 months
High intensity includes:BasketballFootballSoccerBoxingRowing
Low intensity includes:BowlingGolfPoolFishing
Moderate intensity includes:CyclingDancingSwimmingTennisBadminton
Go To Next Page
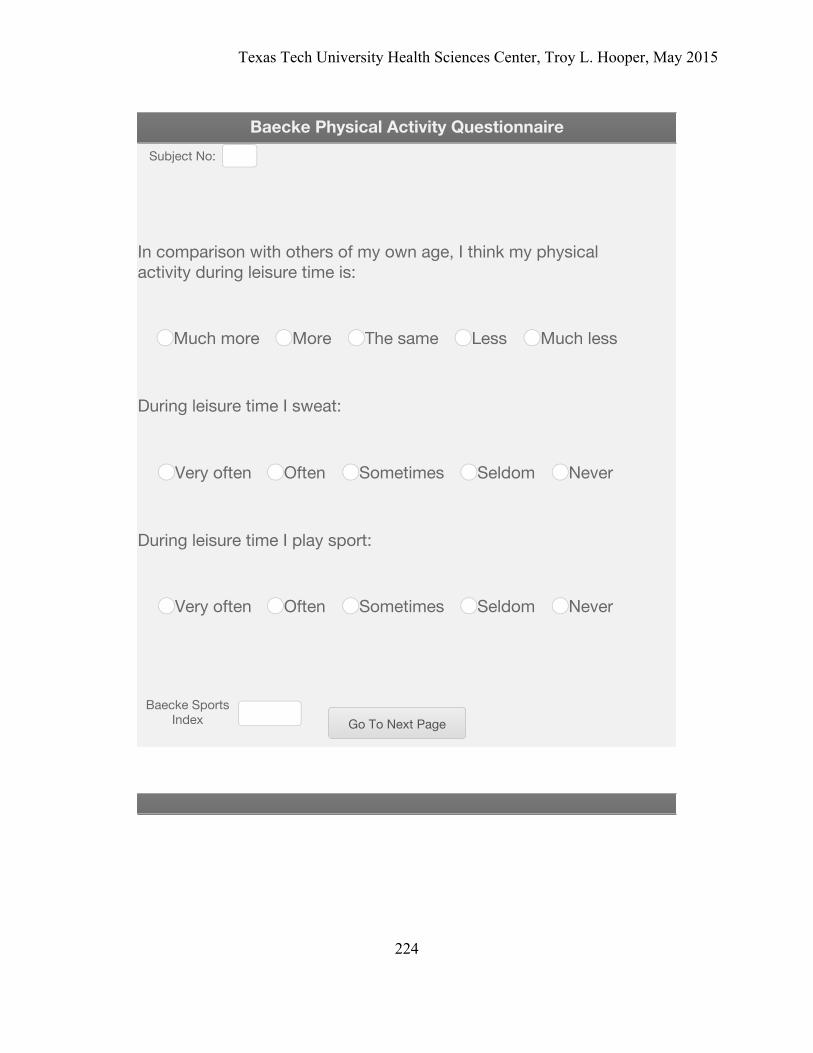
Texas Tech University Health Sciences Center, Troy L. Hooper, May 2015
224
Baecke Physical Activity QuestionnaireSubject No:
In comparison with others of my own age, I think my physicalactivity during leisure time is:
During leisure time I sweat:
Very often Often Sometimes Seldom Never
During leisure time I play sport:
Very often Often Sometimes Seldom Never
Much more More The same Less Much less
Go To Next PageBaecke Sports
Index
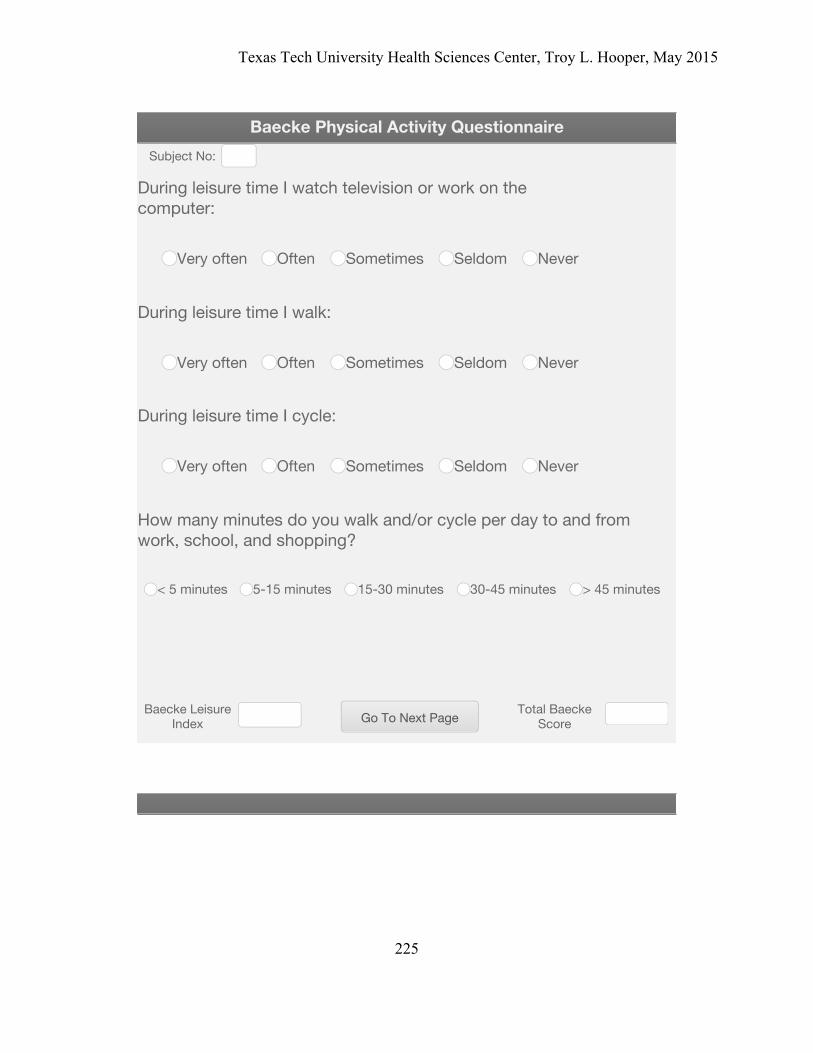
Texas Tech University Health Sciences Center, Troy L. Hooper, May 2015
225
Baecke Physical Activity QuestionnaireSubject No:
During leisure time I watch television or work on thecomputer:
During leisure time I walk:
Very often Often Sometimes Seldom Never
During leisure time I cycle:
Very often Often Sometimes Seldom Never
Very often Often Sometimes Seldom Never
How many minutes do you walk and/or cycle per day to and fromwork, school, and shopping?
< 5 minutes 5-15 minutes 15-30 minutes 30-45 minutes > 45 minutes
Total BaeckeScoreGo To Next PageBaecke Leisure
Index

Texas Tech University Health Sciences Center, Troy L. Hooper, May 2015
226
APPENDIX C ROLAND MORRIS DISABILITY QUESTIONNAIRE

Texas Tech University Health Sciences Center, Troy L. Hooper, May 2015
227
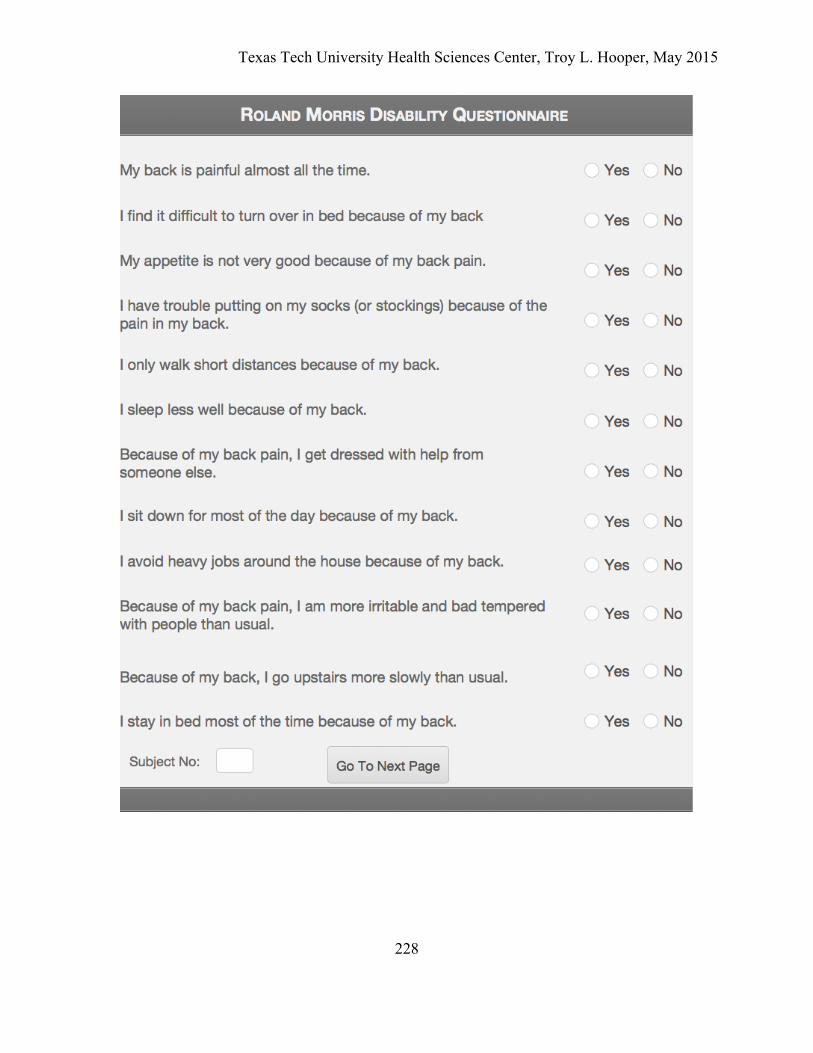
Texas Tech University Health Sciences Center, Troy L. Hooper, May 2015
228

Texas Tech University Health Sciences Center, Troy L. Hooper, May 2015
229
APPENDIX D FEAR AVOIDANCE BELIEFS QUESTIONNAIRE

Texas Tech University Health Sciences Center, Troy L. Hooper, May 2015
230

Texas Tech University Health Sciences Center, Troy L. Hooper, May 2015
231
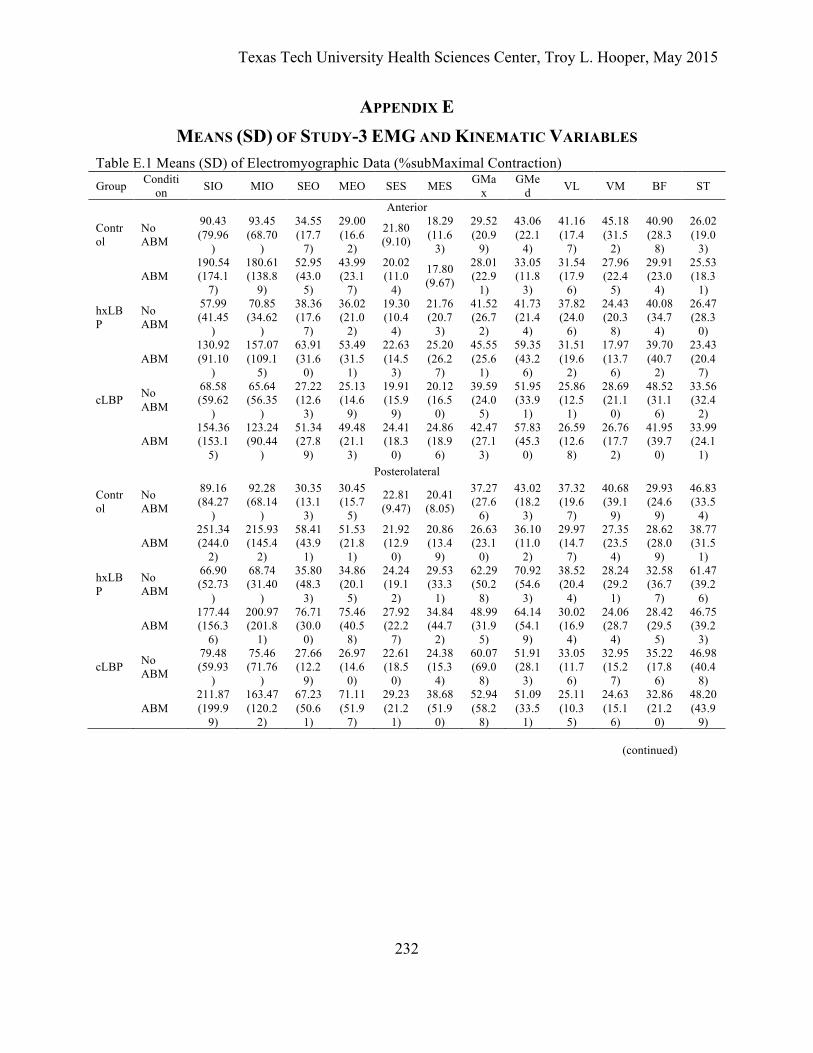
Texas Tech University Health Sciences Center, Troy L. Hooper, May 2015
232
APPENDIX E MEANS (SD) OF STUDY-3 EMG AND KINEMATIC VARIABLES
Table E.1 Means (SD) of Electromyographic Data (%subMaximal Contraction) Group Conditi
on SIO MIO SEO MEO SES MES GMax
GMed VL VM BF ST
Anterior
Control
No ABM
90.43 (79.96
)
93.45 (68.70
)
34.55 (17.7
7)
29.00 (16.6
2)
21.80 (9.10)
18.29 (11.6
3)
29.52 (20.9
9)
43.06 (22.1
4)
41.16 (17.4
7)
45.18 (31.5
2)
40.90 (28.3
8)
26.02 (19.0
3)
ABM 190.54 (174.1
7)
180.61 (138.8
9)
52.95 (43.0
5)
43.99 (23.1
7)
20.02 (11.0
4)
17.80 (9.67)
28.01 (22.9
1)
33.05 (11.8
3)
31.54 (17.9
6)
27.96 (22.4
5)
29.91 (23.0
4)
25.53 (18.3
1)
hxLBP
No ABM
57.99 (41.45
)
70.85 (34.62
)
38.36 (17.6
7)
36.02 (21.0
2)
19.30 (10.4
4)
21.76 (20.7
3)
41.52 (26.7
2)
41.73 (21.4
4)
37.82 (24.0
6)
24.43 (20.3
8)
40.08 (34.7
4)
26.47 (28.3
0)
ABM 130.92 (91.10
)
157.07 (109.1
5)
63.91 (31.6
0)
53.49 (31.5
1)
22.63 (14.5
3)
25.20 (26.2
7)
45.55 (25.6
1)
59.35 (43.2
6)
31.51 (19.6
2)
17.97 (13.7
6)
39.70 (40.7
2)
23.43 (20.4
7)
cLBP No ABM
68.58 (59.62
)
65.64 (56.35
)
27.22 (12.6
3)
25.13 (14.6
9)
19.91 (15.9
9)
20.12 (16.5
0)
39.59 (24.0
5)
51.95 (33.9
1)
25.86 (12.5
1)
28.69 (21.1
0)
48.52 (31.1
6)
33.56 (32.4
2)
ABM 154.36 (153.1
5)
123.24 (90.44
)
51.34 (27.8
9)
49.48 (21.1
3)
24.41 (18.3
0)
24.86 (18.9
6)
42.47 (27.1
3)
57.83 (45.3
0)
26.59 (12.6
8)
26.76 (17.7
2)
41.95 (39.7
0)
33.99 (24.1
1) Posterolateral
Control
No ABM
89.16 (84.27
)
92.28 (68.14
)
30.35 (13.1
3)
30.45 (15.7
5)
22.81 (9.47)
20.41 (8.05)
37.27 (27.6
6)
43.02 (18.2
3)
37.32 (19.6
7)
40.68 (39.1
9)
29.93 (24.6
9)
46.83 (33.5
4)
ABM 251.34 (244.0
2)
215.93 (145.4
2)
58.41 (43.9
1)
51.53 (21.8
1)
21.92 (12.9
0)
20.86 (13.4
9)
26.63 (23.1
0)
36.10 (11.0
2)
29.97 (14.7
7)
27.35 (23.5
4)
28.62 (28.0
9)
38.77 (31.5
1)
hxLBP
No ABM
66.90 (52.73
)
68.74 (31.40
)
35.80 (48.3
3)
34.86 (20.1
5)
24.24 (19.1
2)
29.53 (33.3
1)
62.29 (50.2
8)
70.92 (54.6
3)
38.52 (20.4
4)
28.24 (29.2
1)
32.58 (36.7
7)
61.47 (39.2
6)
ABM 177.44 (156.3
6)
200.97 (201.8
1)
76.71 (30.0
0)
75.46 (40.5
8)
27.92 (22.2
7)
34.84 (44.7
2)
48.99 (31.9
5)
64.14 (54.1
9)
30.02 (16.9
4)
24.06 (28.7
4)
28.42 (29.5
5)
46.75 (39.2
3)
cLBP No ABM
79.48 (59.93
)
75.46 (71.76
)
27.66 (12.2
9)
26.97 (14.6
0)
22.61 (18.5
0)
24.38 (15.3
4)
60.07 (69.0
8)
51.91 (28.1
3)
33.05 (11.7
6)
32.95 (15.2
7)
35.22 (17.8
6)
46.98 (40.4
8)
ABM 211.87 (199.9
9)
163.47 (120.2
2)
67.23 (50.6
1)
71.11 (51.9
7)
29.23 (21.2
1)
38.68 (51.9
0)
52.94 (58.2
8)
51.09 (33.5
1)
25.11 (10.3
5)
24.63 (15.1
6)
32.86 (21.2
0)
48.20 (43.9
9) (continued)
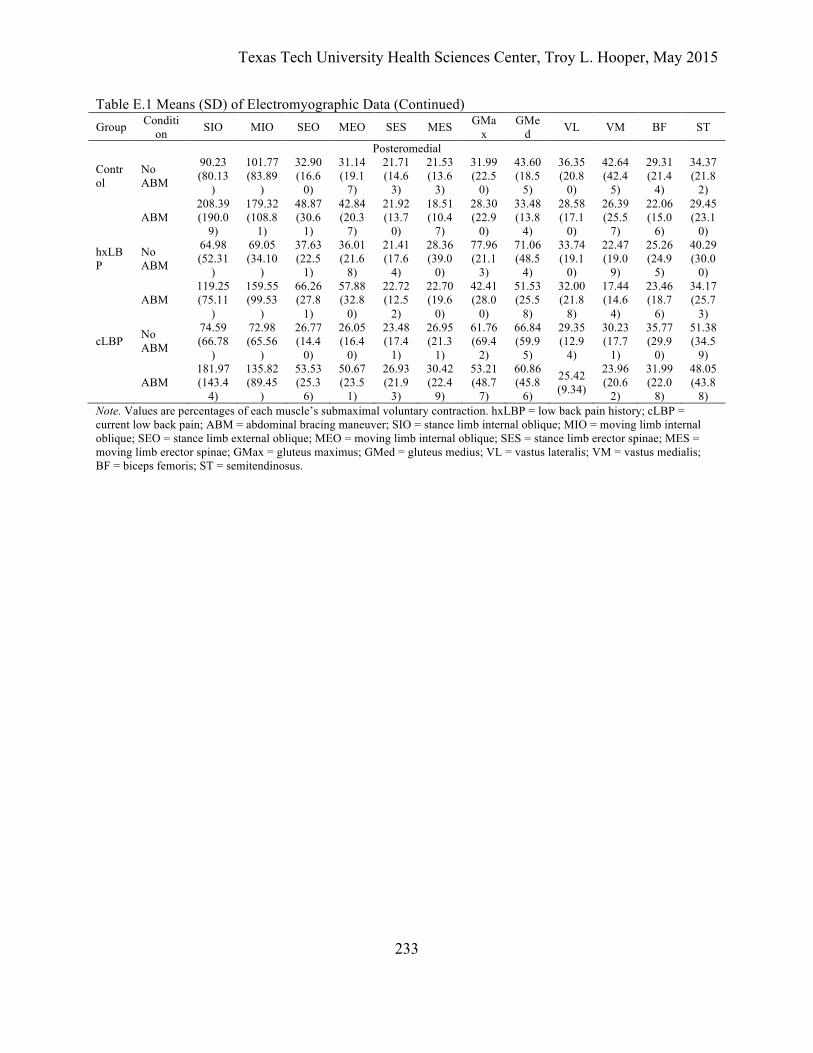
Texas Tech University Health Sciences Center, Troy L. Hooper, May 2015
233
Table E.1 Means (SD) of Electromyographic Data (Continued) Group Conditi
on SIO MIO SEO MEO SES MES GMax
GMed VL VM BF ST
Posteromedial
Control
No ABM
90.23 (80.13
)
101.77 (83.89
)
32.90 (16.6
0)
31.14 (19.1
7)
21.71 (14.6
3)
21.53 (13.6
3)
31.99 (22.5
0)
43.60 (18.5
5)
36.35 (20.8
0)
42.64 (42.4
5)
29.31 (21.4
4)
34.37 (21.8
2)
ABM 208.39 (190.0
9)
179.32 (108.8
1)
48.87 (30.6
1)
42.84 (20.3
7)
21.92 (13.7
0)
18.51 (10.4
7)
28.30 (22.9
0)
33.48 (13.8
4)
28.58 (17.1
0)
26.39 (25.5
7)
22.06 (15.0
6)
29.45 (23.1
0)
hxLBP
No ABM
64.98 (52.31
)
69.05 (34.10
)
37.63 (22.5
1)
36.01 (21.6
8)
21.41 (17.6
4)
28.36 (39.0
0)
77.96 (21.1
3)
71.06 (48.5
4)
33.74 (19.1
0)
22.47 (19.0
9)
25.26 (24.9
5)
40.29 (30.0
0)
ABM 119.25 (75.11
)
159.55 (99.53
)
66.26 (27.8
1)
57.88 (32.8
0)
22.72 (12.5
2)
22.70 (19.6
0)
42.41 (28.0
0)
51.53 (25.5
8)
32.00 (21.8
8)
17.44 (14.6
4)
23.46 (18.7
6)
34.17 (25.7
3)
cLBP No ABM
74.59 (66.78
)
72.98 (65.56
)
26.77 (14.4
0)
26.05 (16.4
0)
23.48 (17.4
1)
26.95 (21.3
1)
61.76 (69.4
2)
66.84 (59.9
5)
29.35 (12.9
4)
30.23 (17.7
1)
35.77 (29.9
0)
51.38 (34.5
9)
ABM 181.97 (143.4
4)
135.82 (89.45
)
53.53 (25.3
6)
50.67 (23.5
1)
26.93 (21.9
3)
30.42 (22.4
9)
53.21 (48.7
7)
60.86 (45.8
6)
25.42 (9.34)
23.96 (20.6
2)
31.99 (22.0
8)
48.05 (43.8
8) Note. Values are percentages of each muscle’s submaximal voluntary contraction. hxLBP = low back pain history; cLBP = current low back pain; ABM = abdominal bracing maneuver; SIO = stance limb internal oblique; MIO = moving limb internal oblique; SEO = stance limb external oblique; MEO = moving limb internal oblique; SES = stance limb erector spinae; MES = moving limb erector spinae; GMax = gluteus maximus; GMed = gluteus medius; VL = vastus lateralis; VM = vastus medialis; BF = biceps femoris; ST = semitendinosus.
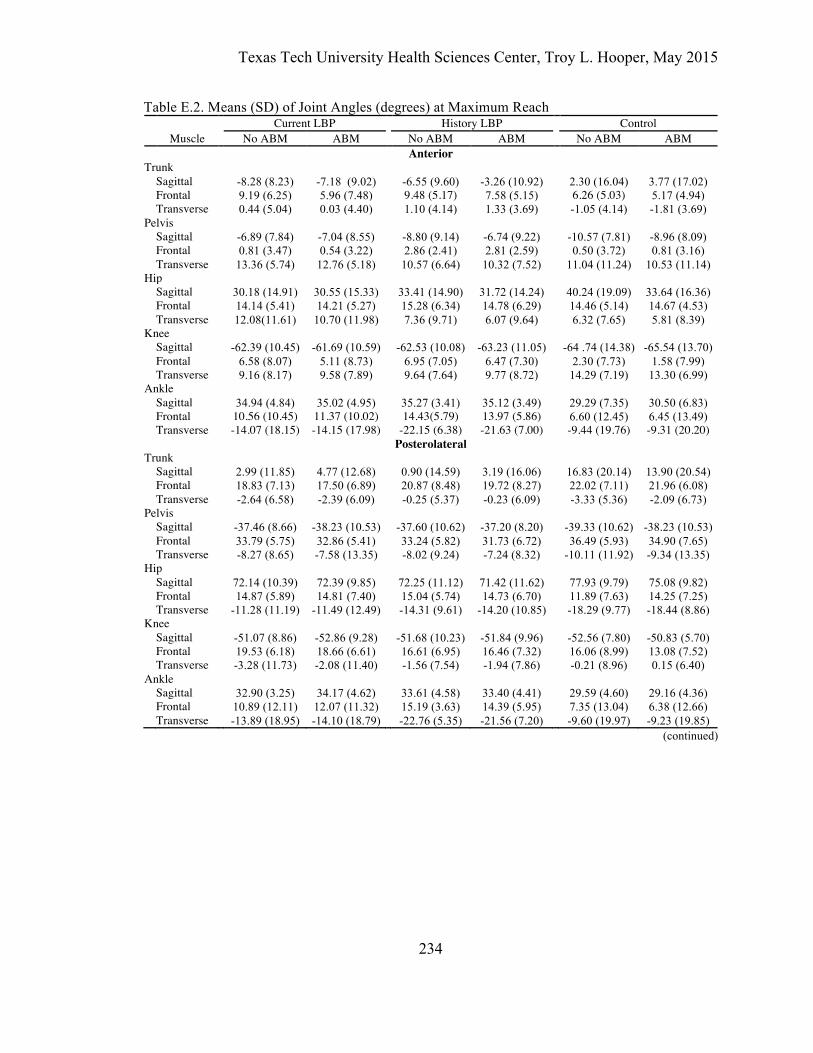
Texas Tech University Health Sciences Center, Troy L. Hooper, May 2015
234
Table E.2. Means (SD) of Joint Angles (degrees) at Maximum Reach Current LBP History LBP Control Muscle No ABM ABM No ABM ABM No ABM ABM
Anterior Trunk Sagittal -8.28 (8.23) -7.18 (9.02) -6.55 (9.60) -3.26 (10.92) 2.30 (16.04) 3.77 (17.02) Frontal 9.19 (6.25) 5.96 (7.48) 9.48 (5.17) 7.58 (5.15) 6.26 (5.03) 5.17 (4.94) Transverse 0.44 (5.04) 0.03 (4.40) 1.10 (4.14) 1.33 (3.69) -1.05 (4.14) -1.81 (3.69) Pelvis Sagittal -6.89 (7.84) -7.04 (8.55) -8.80 (9.14) -6.74 (9.22) -10.57 (7.81) -8.96 (8.09) Frontal 0.81 (3.47) 0.54 (3.22) 2.86 (2.41) 2.81 (2.59) 0.50 (3.72) 0.81 (3.16) Transverse 13.36 (5.74) 12.76 (5.18) 10.57 (6.64) 10.32 (7.52) 11.04 (11.24) 10.53 (11.14) Hip Sagittal 30.18 (14.91) 30.55 (15.33) 33.41 (14.90) 31.72 (14.24) 40.24 (19.09) 33.64 (16.36) Frontal 14.14 (5.41) 14.21 (5.27) 15.28 (6.34) 14.78 (6.29) 14.46 (5.14) 14.67 (4.53) Transverse 12.08(11.61) 10.70 (11.98) 7.36 (9.71) 6.07 (9.64) 6.32 (7.65) 5.81 (8.39) Knee Sagittal -62.39 (10.45) -61.69 (10.59) -62.53 (10.08) -63.23 (11.05) -64 .74 (14.38) -65.54 (13.70) Frontal 6.58 (8.07) 5.11 (8.73) 6.95 (7.05) 6.47 (7.30) 2.30 (7.73) 1.58 (7.99) Transverse 9.16 (8.17) 9.58 (7.89) 9.64 (7.64) 9.77 (8.72) 14.29 (7.19) 13.30 (6.99) Ankle Sagittal 34.94 (4.84) 35.02 (4.95) 35.27 (3.41) 35.12 (3.49) 29.29 (7.35) 30.50 (6.83) Frontal 10.56 (10.45) 11.37 (10.02) 14.43(5.79) 13.97 (5.86) 6.60 (12.45) 6.45 (13.49) Transverse -14.07 (18.15) -14.15 (17.98) -22.15 (6.38) -21.63 (7.00) -9.44 (19.76) -9.31 (20.20)
Posterolateral Trunk Sagittal 2.99 (11.85) 4.77 (12.68) 0.90 (14.59) 3.19 (16.06) 16.83 (20.14) 13.90 (20.54) Frontal 18.83 (7.13) 17.50 (6.89) 20.87 (8.48) 19.72 (8.27) 22.02 (7.11) 21.96 (6.08) Transverse -2.64 (6.58) -2.39 (6.09) -0.25 (5.37) -0.23 (6.09) -3.33 (5.36) -2.09 (6.73) Pelvis Sagittal -37.46 (8.66) -38.23 (10.53) -37.60 (10.62) -37.20 (8.20) -39.33 (10.62) -38.23 (10.53) Frontal 33.79 (5.75) 32.86 (5.41) 33.24 (5.82) 31.73 (6.72) 36.49 (5.93) 34.90 (7.65) Transverse -8.27 (8.65) -7.58 (13.35) -8.02 (9.24) -7.24 (8.32) -10.11 (11.92) -9.34 (13.35) Hip Sagittal 72.14 (10.39) 72.39 (9.85) 72.25 (11.12) 71.42 (11.62) 77.93 (9.79) 75.08 (9.82) Frontal 14.87 (5.89) 14.81 (7.40) 15.04 (5.74) 14.73 (6.70) 11.89 (7.63) 14.25 (7.25) Transverse -11.28 (11.19) -11.49 (12.49) -14.31 (9.61) -14.20 (10.85) -18.29 (9.77) -18.44 (8.86) Knee Sagittal -51.07 (8.86) -52.86 (9.28) -51.68 (10.23) -51.84 (9.96) -52.56 (7.80) -50.83 (5.70) Frontal 19.53 (6.18) 18.66 (6.61) 16.61 (6.95) 16.46 (7.32) 16.06 (8.99) 13.08 (7.52) Transverse -3.28 (11.73) -2.08 (11.40) -1.56 (7.54) -1.94 (7.86) -0.21 (8.96) 0.15 (6.40) Ankle Sagittal 32.90 (3.25) 34.17 (4.62) 33.61 (4.58) 33.40 (4.41) 29.59 (4.60) 29.16 (4.36) Frontal 10.89 (12.11) 12.07 (11.32) 15.19 (3.63) 14.39 (5.95) 7.35 (13.04) 6.38 (12.66) Transverse -13.89 (18.95) -14.10 (18.79) -22.76 (5.35) -21.56 (7.20) -9.60 (19.97) -9.23 (19.85)
(continued)

Texas Tech University Health Sciences Center, Troy L. Hooper, May 2015
235
Table 6.4. Joint Angles (degrees) at Maximum Reach (continued) Current LBP History LBP Control Muscle No ABM ABM No ABM ABM No ABM ABM
Posteromedial Trunk Sagittal 4.14 (11.20) 5.42 (11.80) 0.12 (15.22) 3.34 (18.24) 14.58 (48.10) 14.57 (18.71) Frontal 19.71 (6.95) 18.40 (5.94) 13.37 (9.42) 13.24 (8.16) 14.57 (4.86) 12.05 (6.45) Transverse -4.38 (4.75) -4.16 (4.75) -2.63 (5.26) -2.35 (4.78) -5.96 (6.16) -5.27 (6.35) Pelvis Sagittal -39.85 (4.87) -40.30 (5.54) -37.97 (7.10) -38.17 (8.24) -42.94 (9.25) -40.88 (7.79) Frontal -2.22 (6.02) -3.38 (5.83) -3.82 (7.70) -3.93 (7.46) -1.29 (3.95) -0.95 (4.62) Transverse 8.58 (5.39) 9.93 (5.83) 5.26 (7.28) 4.62 (6.84) 3.30 (7.07) 3.92 (6.35) Hip Sagittal 73.67 (7.23) 74.90 (9.28) 72.63 (10.85) 73.47 (12.83) 81.21 (10.61) 78.29 (10.03) Frontal 13.71 (5.60) 13.87 (5.37) 10.35 (6.22) 9.33 (7.37) 11.75 (7.55) 13.47 (6.92) Transverse -9.20 (12.62) -9.21 (16.74) -10.04 (14.06) -10.74 (13.84) -9.20 (12.62) -10.35 (13.39) Knee Sagittal 58.67 (7.57) 60.38 (9.06) 61.22 (7.27) 63.11 (9.26) 61.23 (9.34) 61.48 (7.21) Frontal -11.10 (14.10) -11.71 (13.85) -12.15 (10.91) -11.58 (11.98) -9.27 (13.31) -11.02 (11.57) Transverse 18.12 (11.23) 17.37 (10.67) 17.15 (11.39) 16.60 (13.49) 16.59 (8.39) 15.50 (7.29) Ankle Sagittal 30.48 (4.89) 31.02 (5.29) 32.68 (4.59) 33.73 (5.18) 27.80 (5.98) 28.74 (5.89) Frontal 11.48 (9.06) 12.15 (10.01) 15.09 (3.38) 15.35 (4.26) 6.21 (13.79) 6.43 (14.20) Transverse -14.78 (18.70) -15.06 (19.09) -24.15 (5.87) -23.14 (7.69) -10.75 (21.95) -10.80 (21.97) Note. LBP = low back pain; ABM = abdominal bracing maneuver.
Related Documents


